2018 economic forum - jsu.edu forum 2018 - final presentation.pdf2018 economic forum calhoun county...
TRANSCRIPT

Information provided by
School of Business and Industry
2018 Economic Forum
CALHOUN COUNTY CHAMBER OF
COMMERCE AND VISITORS CENTER

THANK YOU
to our
SPONSORS

2
Calhoun County Economy
Forum
• National Update (Slides 3-15)
• Alabama Update (Slides 16-53)
• Calhoun County Update (Slides 54-122)

GDP % Change from Preceding
Period for U.S.
1st Qtr 2015 – 4th Qtr 2017
3.2%
2.7%1.6%
0.5%
0.6%
2.2%
2.8%
1.8%
1.2%
3.1% 3.2%
2.6%
0%
1%
2%
3%
4%
15Q1 Q2 Q3 Q4 16Q1 Q2 Q3 Q4 17Q1 Q2 Q3 Q4
3Source: U.S. Bureau of Economic Analysis Real Gross Domestic Product Seasonally adjusted at annual rates
2.6% 4th Qtr 2017
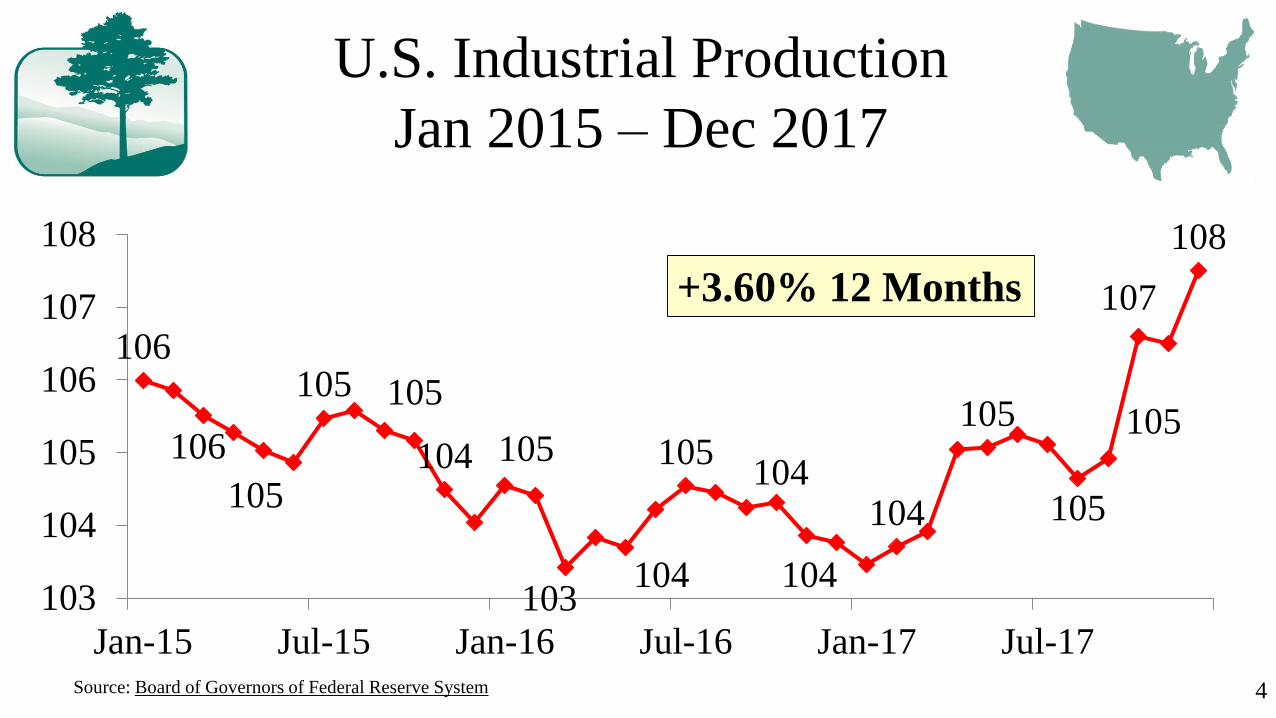
U.S. Industrial Production
Jan 2015 – Dec 2017
106
106
105
105 105
104 105
103104
105104
104
104
105
105
105
107
108
103
104
105
106
107
108
Jan-15 Jul-15 Jan-16 Jul-16 Jan-17 Jul-17
4Source: Board of Governors of Federal Reserve System
+3.60% 12 Months
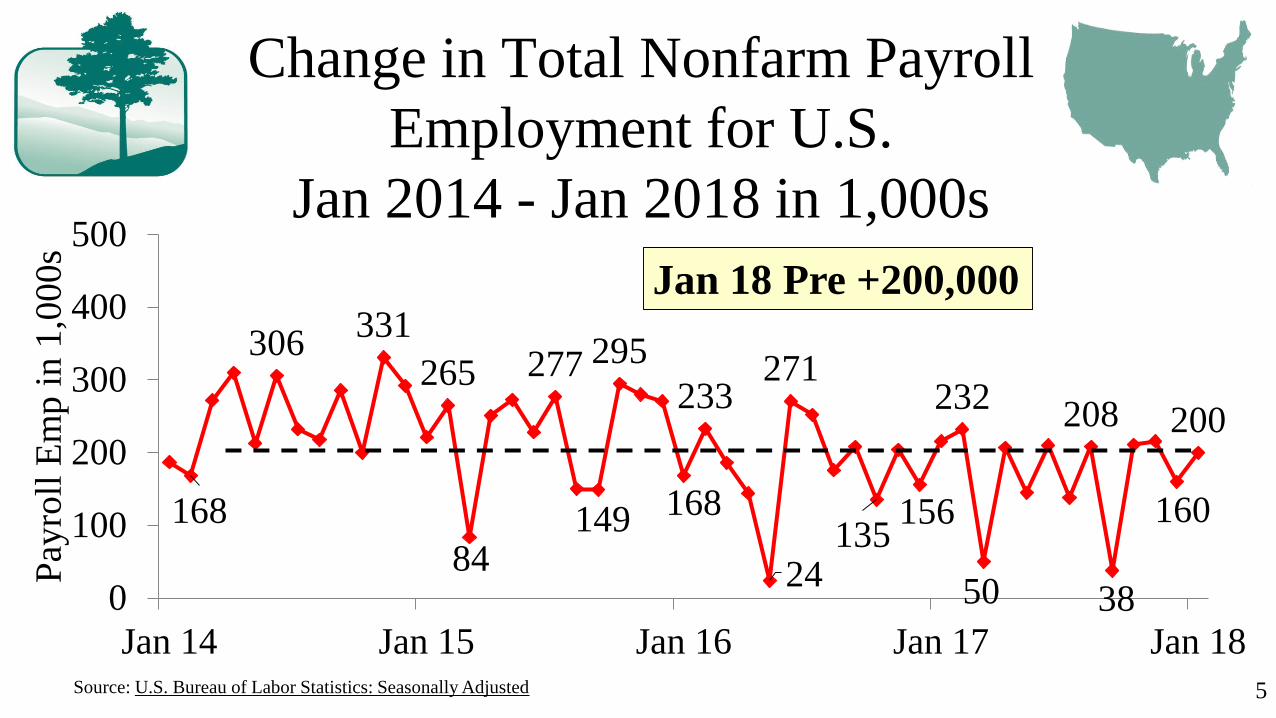
Change in Total Nonfarm Payroll
Employment for U.S.
Jan 2014 - Jan 2018 in 1,000s
168
306331
265
84
277
149
295
168
233
24
271
135156
232
50
208
38
160
200
0
100
200
300
400
500
Jan 14 Jan 15 Jan 16 Jan 17 Jan 18
Pay
roll
Em
pin
1,0
00
s
Jan 18 Pre +200,000
5Source: U.S. Bureau of Labor Statistics: Seasonally Adjusted

Dow Jones Industrial Average
(DJIA) Feb 2016–Feb 2018
17,685
18,40119,124
19,86420,941
21,830
23,837
26,617
24,191
15,000
17,000
19,000
21,000
23,000
25,000
27,000
F-16 A-16 F-17 A-17 F-18
6Source: NY Stock Exchange
+22.20% 12 Months
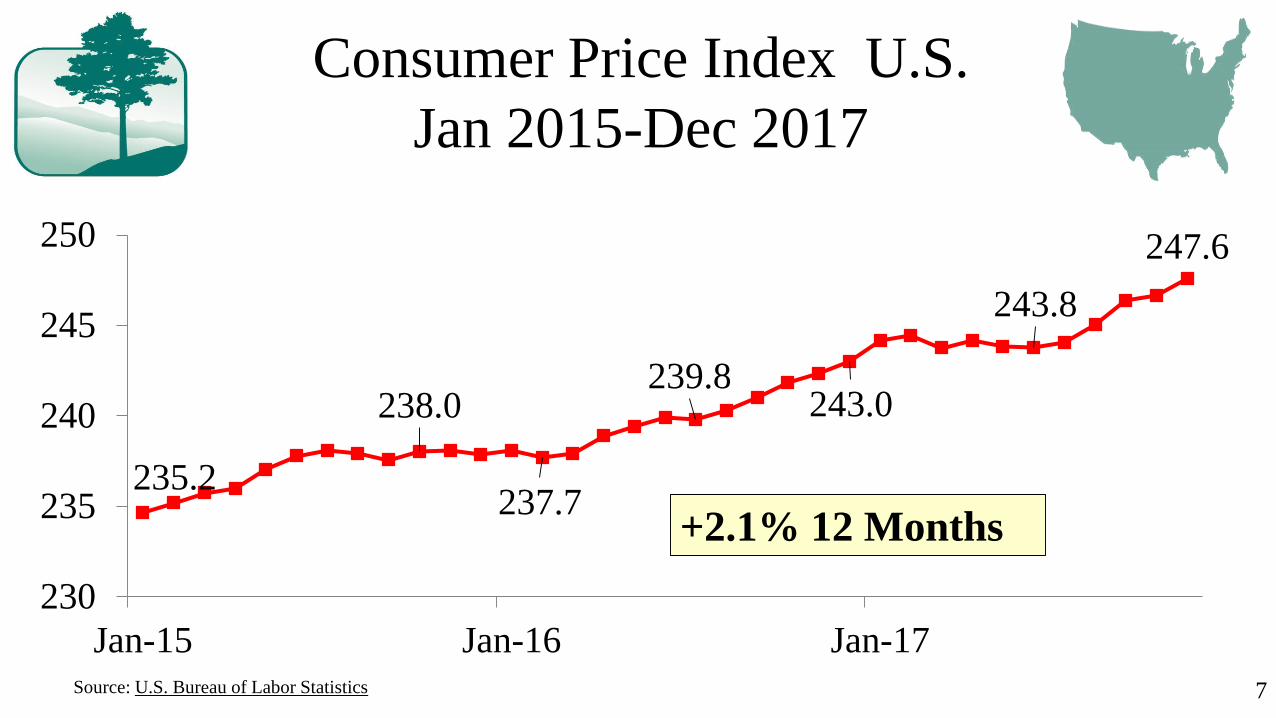
Consumer Price Index U.S.
Jan 2015-Dec 2017
235.2
238.0
237.7
239.8243.0
243.8
247.6
230
235
240
245
250
Jan-15 Jan-16 Jan-17
7
+2.1% 12 Months
Source: U.S. Bureau of Labor Statistics
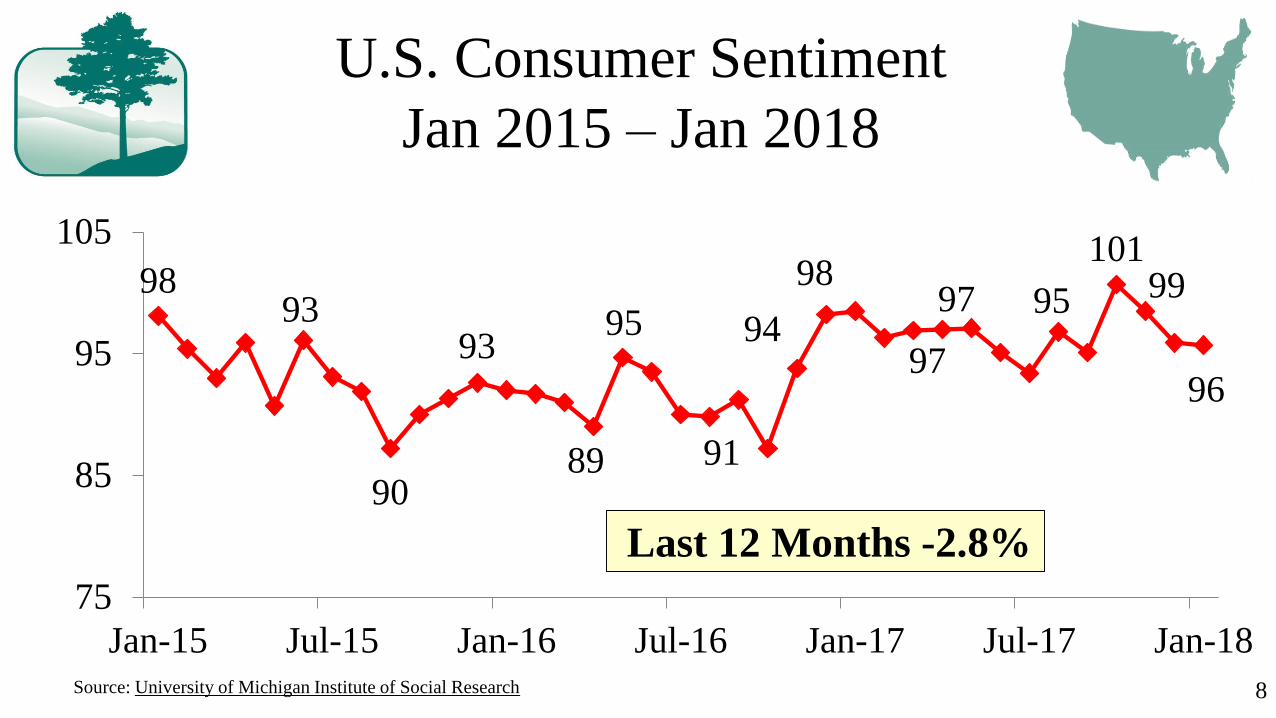
U.S. Consumer Sentiment
Jan 2015 – Jan 2018
9893
90
93
89
95
91
94
98
97
97 95
10199
96
75
85
95
105
Jan-15 Jul-15 Jan-16 Jul-16 Jan-17 Jul-17 Jan-18
8Source: University of Michigan Institute of Social Research
Last 12 Months -2.8%

Monthly Sales for Retail & Food
Services in U.S.
Jan 2015-Dec 2017 in $ Bill
$436$445
$450
$453
$458$469
$475
$477$494
$495
$410
$430
$450
$470
$490
$510
Jan-2015 Jan-2016 Jan-2017
In $
Bil
lion
s
9Source: U.S. Census Bureau
+5.60% 12 Months

Case Shiller 20-City Home Price
Index Jan 2015-Dec 2017
175178 179
181185
188 188190
194198 199
203
170
180
190
200
210
Jan-15 Jul-15 Jan-16 Jul-16 Jan-17 Jul-17
10Source: https://www.bloomberg.com/quote/SPCS20:IND
+6.60% 12 Months
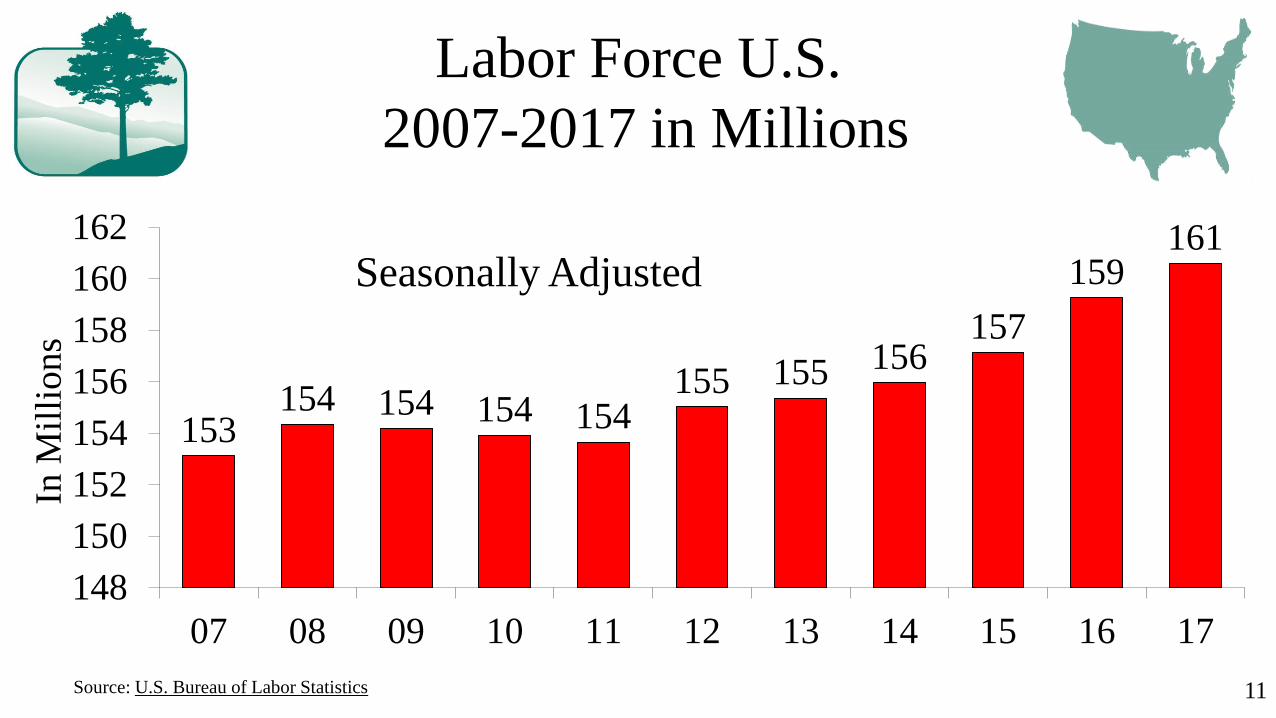
Labor Force U.S.
2007-2017 in Millions
153154 154 154 154
155 155 156157
159161
148
150
152
154
156
158
160
162
07 08 09 10 11 12 13 14 15 16 17
In M
illi
on
s
11
Seasonally Adjusted
Source: U.S. Bureau of Labor Statistics

Labor Force U.S.
Jan – Dec 2017 in Millions
159.7160.1 160.2160.2
159.8160.1
160.5 160.6
161.1
160.4 160.5 160.6
158
159
160
161
162
Jan Feb Mar Apr May Jun Jul Aug Sep Oct Nov Dec
In M
illi
on
s
12
+881,000
12 Months
Seasonally Adjusted
Source: U.S. Bureau of Labor Statistics

13
Employment U.S.
2007-2017 in Millions
138 137
131 130132
134136
139142
144
153
125
130
135
140
145
150
155
07 08 09 10 11 12 13 14 15 16 17
In M
illi
on
s
Seasonally Adjusted
Source: U.S. Bureau of Labor Statistics

Employment U.S.
Jan – Dec 2017 in Millions
152153
153 153153
153154 153
154
154 154 154
151
152
153
154
155
Jan Feb Mar Apr May Jun Jul Aug Sep Oct Nov Dec
In M
illi
on
s
14
+1,940,000
12 Months
Seasonally Adjusted
Source: U.S. Bureau of Labor Statistics
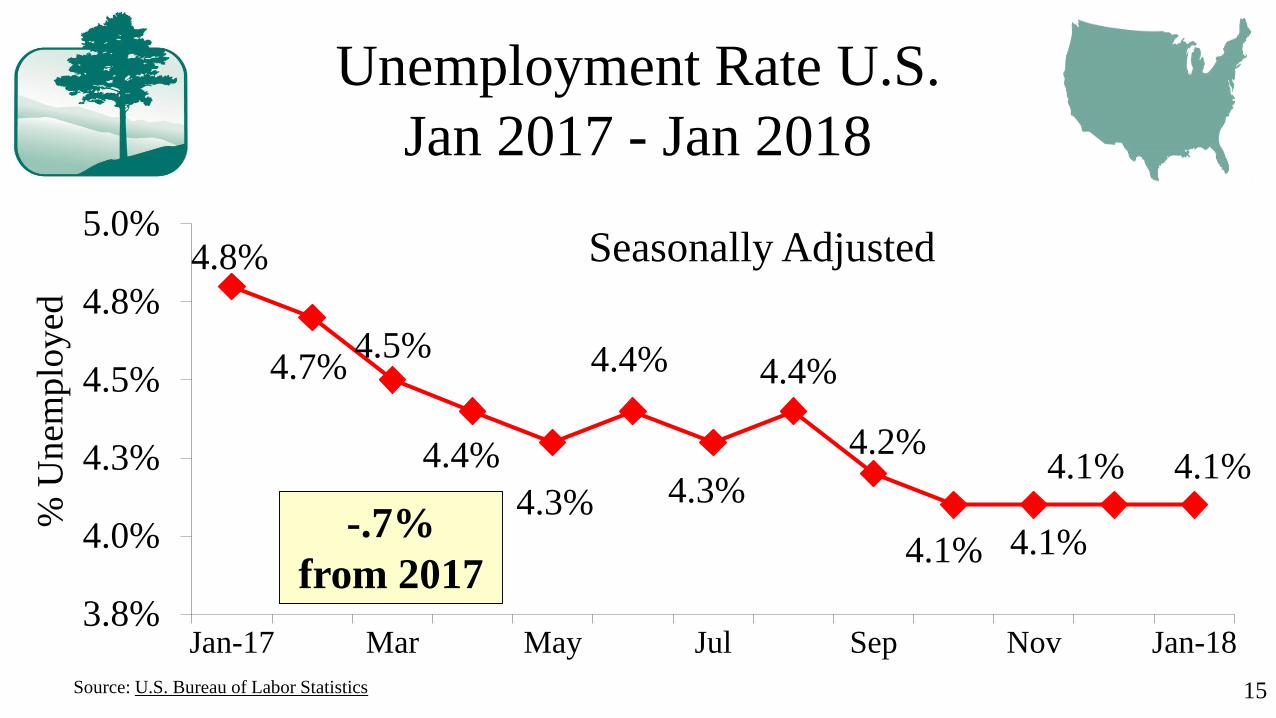
Unemployment Rate U.S.
Jan 2017 - Jan 2018
15
4.8%
4.7%4.5%
4.4%
4.3%
4.4%
4.3%
4.4%
4.2%
4.1% 4.1%
4.1% 4.1%
3.8%
4.0%
4.3%
4.5%
4.8%
5.0%
Jan-17 Mar May Jul Sep Nov Jan-18
% U
nem
plo
yed
Source: U.S. Bureau of Labor Statistics
Seasonally Adjusted
-.7%
from 2017

16
State of Alabama
Economy
• Population (17-24)
• Labor Force (27-28)
• Employment (29-30)
• Unemployment (31-35)
• Tax Revenues (36-42)

Population Estimates
State of Alabama 2007-2017
in Millions
4.67
4.72
4.764.79
4.804.82
4.834.85 4.86 4.86 4.87
4.6
4.7
4.8
4.9
07 08 09 10 11 12 13 14 15 16 17
In M
illi
on
s
17Source: U.S. Census Bureau

18
High InboundBalancedHigh Outbound
Source: United Van Lines 2016 Movers Study
Migration Patterns Based Upon
Household Moves Jan-Dec 2016
Alabama
Out - 793
In - 893

Migration Patterns Based Upon
Household Moves Jan-Dec 2017
19Source: United Van Lines Migration Study 2017
Inbound
Outbound
Balanced
Alabama
Out - 745
In - 986
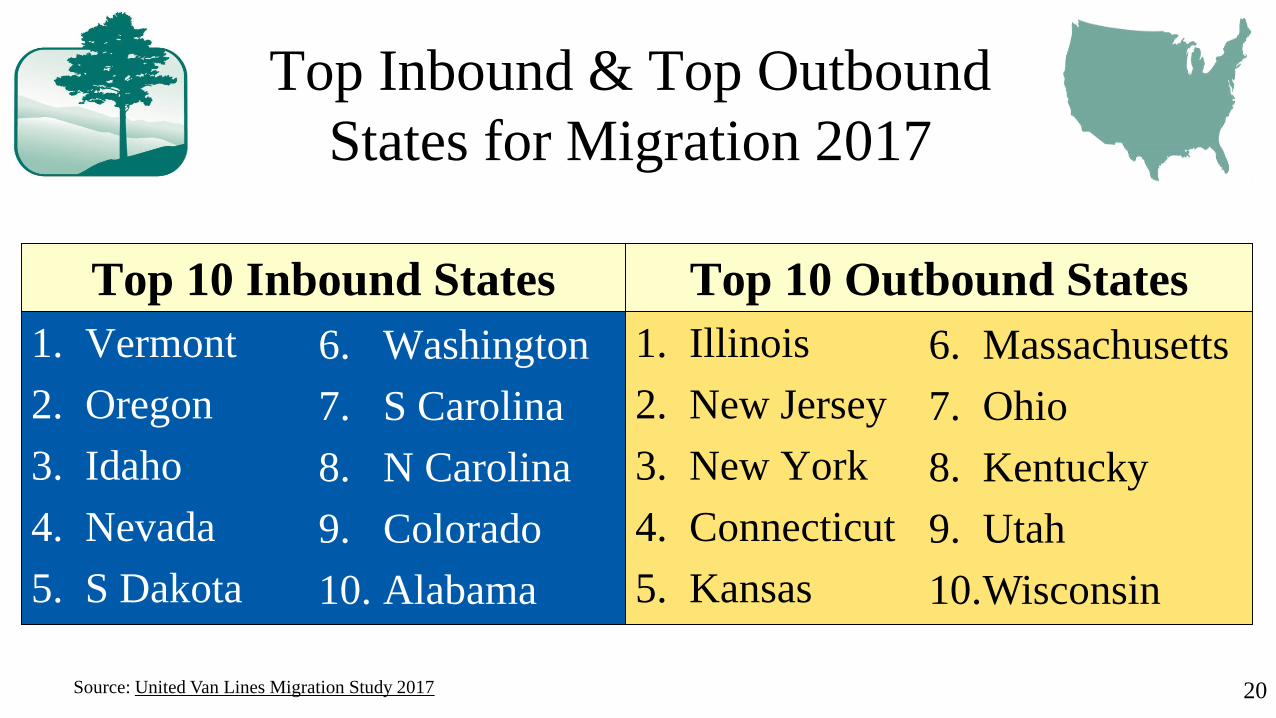
Top Inbound & Top Outbound
States for Migration 2017
Top 10 Inbound States
1. Vermont
2. Oregon
3. Idaho
4. Nevada
5. S Dakota
20
6. Washington
7. S Carolina
8. N Carolina
9. Colorado
10. Alabama
Top 10 Outbound States
1. Illinois
2. New Jersey
3. New York
4. Connecticut
5. Kansas
6. Massachusetts
7. Ohio
8. Kentucky
9. Utah
10.Wisconsin
Source: United Van Lines Migration Study 2017
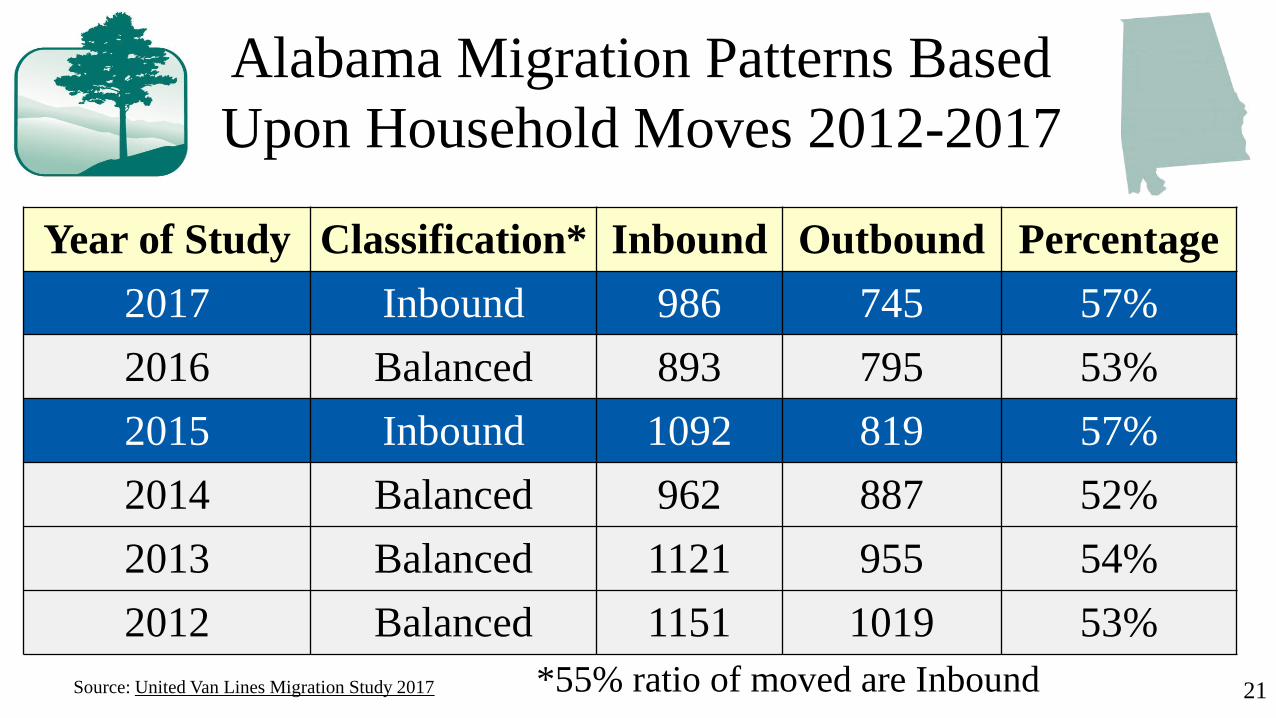
Alabama Migration Patterns Based
Upon Household Moves 2012-2017
Year of Study Classification* Inbound Outbound Percentage
2017 Inbound 986 745 57%
2016 Balanced 893 795 53%
2015 Inbound 1092 819 57%
2014 Balanced 962 887 52%
2013 Balanced 1121 955 54%
2012 Balanced 1151 1019 53%
21*55% ratio of moved are InboundSource: United Van Lines Migration Study 2017

Top Reported Reasons for Migration
In and Out of Alabama 2017
22
Inbound
Reason
Top Reasons
Reported
Outbound
Reason
14.44% Retirement 5.83%
6.67% Health 4.17%
21.67% Family 14.17%
6.11% Lifestyle 3.33%
61.11% Job* 74.17%
Source: United Van Lines Migration Study 2017

Age for Migration In and Out of
Alabama 2017
23
Inbound Age Age Categories Outbound Age
19.19% <18 to 34 27.68%*
18.02% 35-44 14.29%
16.28% 45-54 26.79%
28.49%* 55-64 14.29%
18.02% 65 and Older 16.96%
Source: United Van Lines Migration Study 2017

Income for Migration In and Out of
Alabama 2017
24
Inbound Income Income Categories Outbound Income
8.53% Less than $50,000 8.00%
27.91%* $50,000 to $74,999 16.00%
13.95% $75,000 to $99,999 14.00%
22.48% $100,000 to $149,000 23.00%
27.13%* $150,000 or More 39.00%*
Source: United Van Lines Migration Study 2017

GDP % Change from Preceding
Year for State of AL Vs U.S.
2007 - 20164.5%
1.6%
-2.1%
3.8%
3.7% 4.1%3.3%
4.4% 4.0%
2.8%
3.3%
1.6%
-2.5%
3.8%
3.4%2.9%
2.4%1.9%
3.3%2.6%
-4%
-2%
0%
2%
4%
6%
07 08 09 10 11 12 13 14 15 16
US AL
25Source: U.S. Bureau of Economic Analysis: Current $
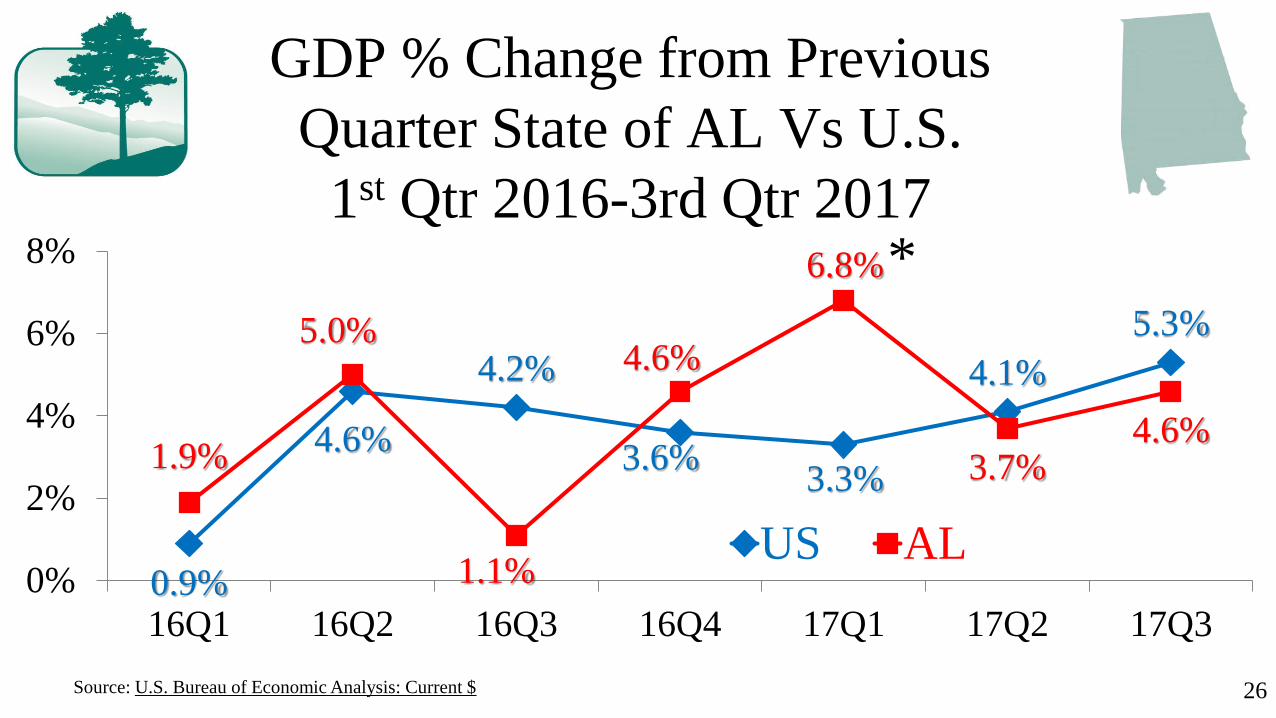
GDP % Change from Previous
Quarter State of AL Vs U.S.
1st Qtr 2016-3rd Qtr 2017
0.9%
4.6%
4.2%
3.6%3.3%
4.1%
5.3%
1.9%
5.0%
1.1%
4.6%
6.8%
3.7%4.6%
0%
2%
4%
6%
8%
16Q1 16Q2 16Q3 16Q4 17Q1 17Q2 17Q3
US AL
26Source: U.S. Bureau of Economic Analysis: Current $
*

Labor Force State of Alabama
2007-2017 in Millions
2.17 2.172.16
2.19 2.20
2.172.15
2.15 2.14
2.18 2.18
2.10
2.12
2.14
2.16
2.18
2.20
2.22
07 08 09 10 11 12 13 14 15 16 17
In M
illi
on
s
27Source: U.S. Bureau of Labor Statistics
Seasonally Adjusted

Labor Force State of Alabama
Jan – Dec 2017 in Millions
2.20
2.202.21 2.21
2.20
2.18
2.16
2.15 2.152.16
2.162.17
2.14
2.16
2.18
2.20
2.22
Jan Feb Mar Apr May Jun Jul Aug Sep Oct Nov Dec
In M
illi
on
s
28Source: U.S. Bureau of Labor Statistics
Seasonally Adjusted

29
Employment State of Alabama
2007-2017 in Millions
2.09
2.05
1.92
1.96
1.99 1.99 2.00 2.002.01
2.05
2.07
1.90
1.95
2.00
2.05
2.10
07 08 09 10 11 12 13 14 15 16 17
In M
illi
on
s
Source: U.S. Bureau of Labor Statistics
Seasonally Adjusted

Employment State of Alabama
Jan – Dec 2017 in Millions
2.05
2.07
2.08
2.09 2.09
2.08
2.062.06
2.07
2.08
2.092.09
2.04
2.05
2.06
2.07
2.08
2.09
2.10
Jan Feb Mar Apr May Jun Jul Aug Sep Oct Nov Dec
In M
illi
on
s
30Source: U.S. Bureau of Labor Statistics
+39,226 for
12 Months Seasonally Adjusted

Unemployment Rate State of AL
Jan - Dec 2016 vs 2017
31
6.2% 6.2%
6.2% 6.1% 6.0% 6.0%5.7%
5.4% 5.4%5.7%
5.9%6.2%6.4%
6.2%
5.8%5.4%
4.9%4.6% 4.5%
4.2%3.8%
3.6% 3.5% 3.5%
3%
4%
5%
6%
7%
Jan Feb Mar Apr May Jun Jul Aug Sep Oct Nov Dec
% U
nem
plo
yed
2016
2017
Source: U.S. Bureau of Labor Statistics
Seasonally Adjusted
-2.9% from 2016

Unemployment Rate
AL vs U.S. Jan - Dec 2017
32
6.4% 6.2%5.8%
5.4%4.9%
4.6% 4.5%
4.2%3.8% 3.6% 3.5% 3.5%
4.8% 4.7% 4.5% 4.4% 4.3% 4.4% 4.3%
4.4% 4.2% 4.1% 4.1% 4.1%
2%
3%
4%
5%
6%
7%
Jan Feb Mar Apr May Jun Jul Aug Sep Oct Nov Dec
% U
nem
plo
yed
AL U.S.
Source: U.S. Bureau of Labor Statistics
Seasonally Adjusted
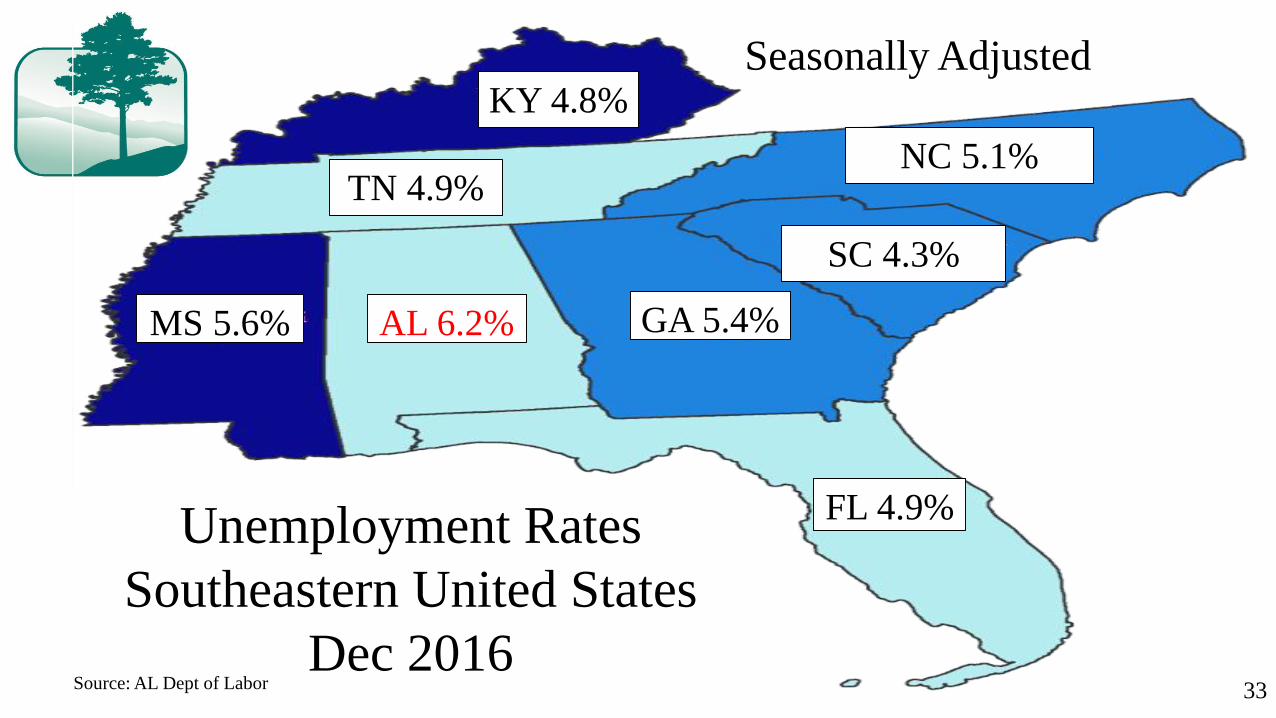
33
KY 4.8%
TN 4.9%
MS 5.6%
NC 5.1%
SC 4.3%
FL 4.9%
AL 6.2%
Unemployment Rates
Southeastern United States
Dec 2016
Seasonally Adjusted
GA 5.4%
Source: AL Dept of Labor

34
KY 4.4%
TN 3.2%
MS 4.6%
NC 4.5%
SC 4.1%
FL 3.7%
AL 3.5%
Unemployment Rates
Southeastern United States
Dec 2017
Seasonally Adjusted
GA 4.4%
Source: AL Dept of Labor

Job Quit Levels Annual Per Month Average
for U.S. South Region
2007-2017 in Thousands
1204
1027
711 743795
882961
10671154
12011286
400
600
800
1000
1200
1400
07 08 09 10 11 12 13 14 15 16 17
In T
ho
usa
nd
s
35Source: Bureau of Labor Statistics

Gross Revenue Collections State of
Alabama FY11-12 – FY16-17
in $ Billions
$8.93
$9.28$9.40
$9.78$9.90
$10.31
$8.00
$8.50
$9.00
$9.50
$10.00
$10.50
FY11-12 FY12-13 FY13-14 FY14-15 FY15-16 FY16-17
In $
Bil
lio
ns
36Source: Alabama Department of Revenue
+4.16% from FY 15-16
*
*Record High for Alabama
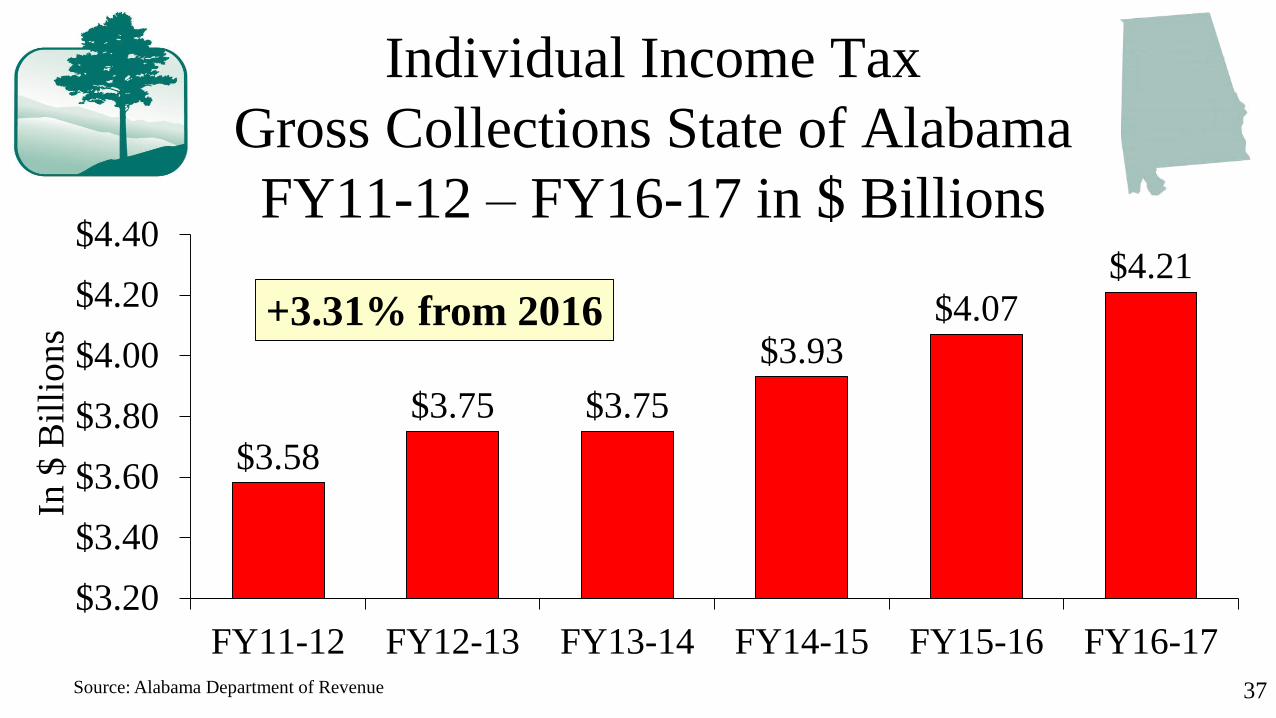
Individual Income Tax
Gross Collections State of Alabama
FY11-12 – FY16-17 in $ Billions
$3.58
$3.75 $3.75
$3.93
$4.07
$4.21
$3.20
$3.40
$3.60
$3.80
$4.00
$4.20
$4.40
FY11-12 FY12-13 FY13-14 FY14-15 FY15-16 FY16-17
In $
Bil
lio
ns
37
+3.31% from 2016
Source: Alabama Department of Revenue
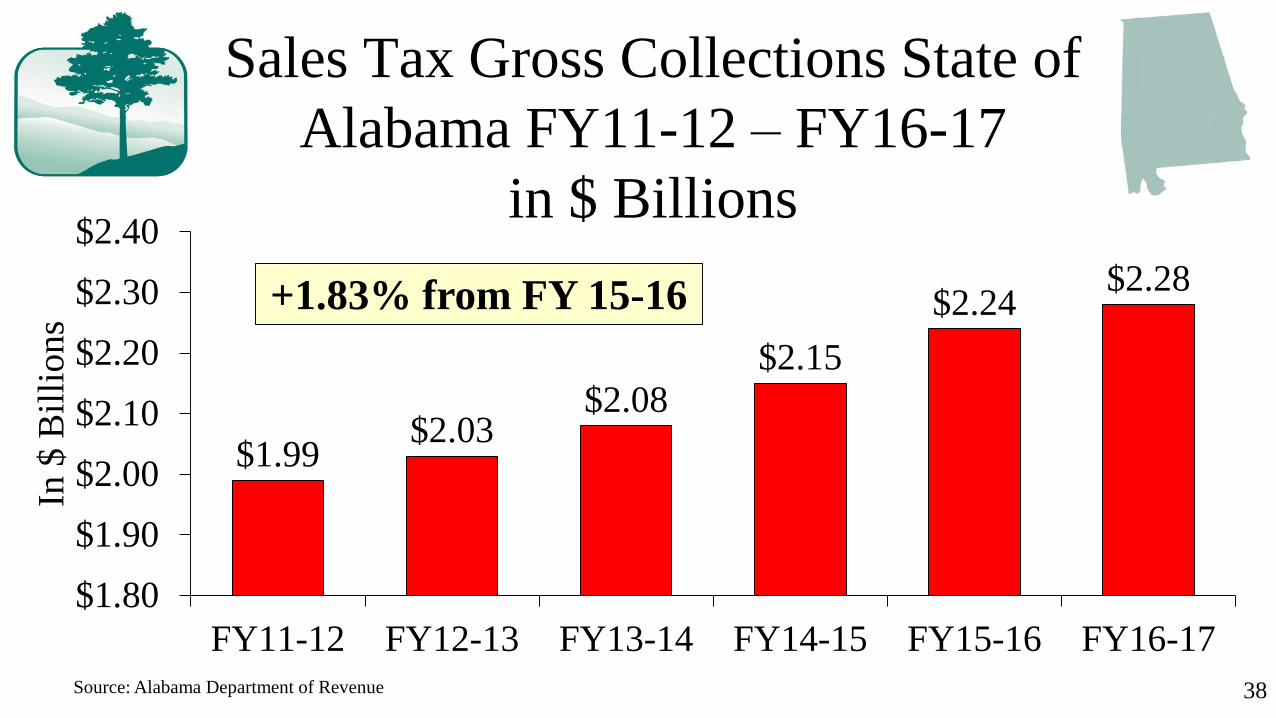
Sales Tax Gross Collections State of
Alabama FY11-12 – FY16-17
in $ Billions
$1.99$2.03
$2.08
$2.15
$2.24$2.28
$1.80
$1.90
$2.00
$2.10
$2.20
$2.30
$2.40
FY11-12 FY12-13 FY13-14 FY14-15 FY15-16 FY16-17
In $
Bil
lio
ns
38
+1.83% from FY 15-16
Source: Alabama Department of Revenue
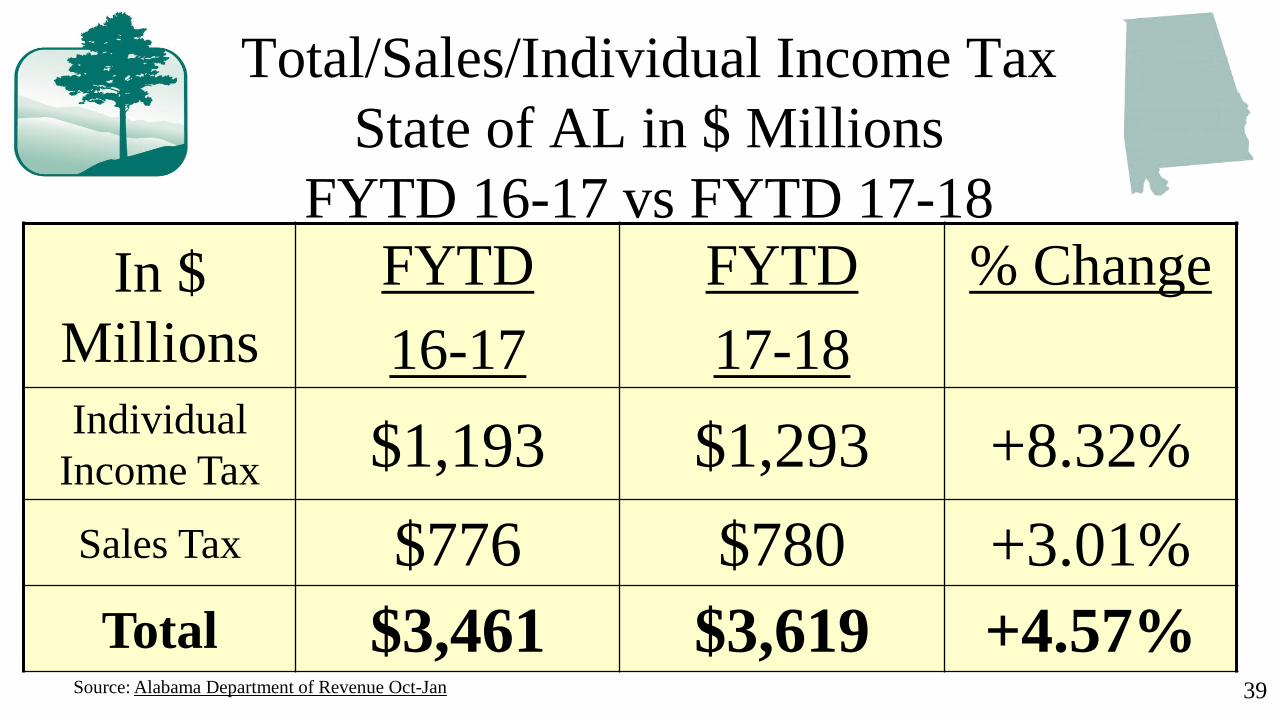
Total/Sales/Individual Income Tax
State of AL in $ Millions
FYTD 16-17 vs FYTD 17-18
39Source: Alabama Department of Revenue Oct-Jan
In $
Millions
FYTD
16-17
FYTD
17-18
% Change
Individual
Income Tax $1,193 $1,293 +8.32%
Sales Tax $776 $780 +3.01%
Total $3,461 $3,619 +4.57%

Total/Sales/Individual Income Tax
State of AL in $ Millions
Jan 2017 vs Jan 2018
40Source: Alabama Department of Revenue
In $ Millions Jan 2017 Jan 2018 % Change
Individual
Income Tax $265.99 $305.93 +15.02%
Sales Tax $205.30 $211.56 +3.05%
Total $942.68 $992.19 +5.25%
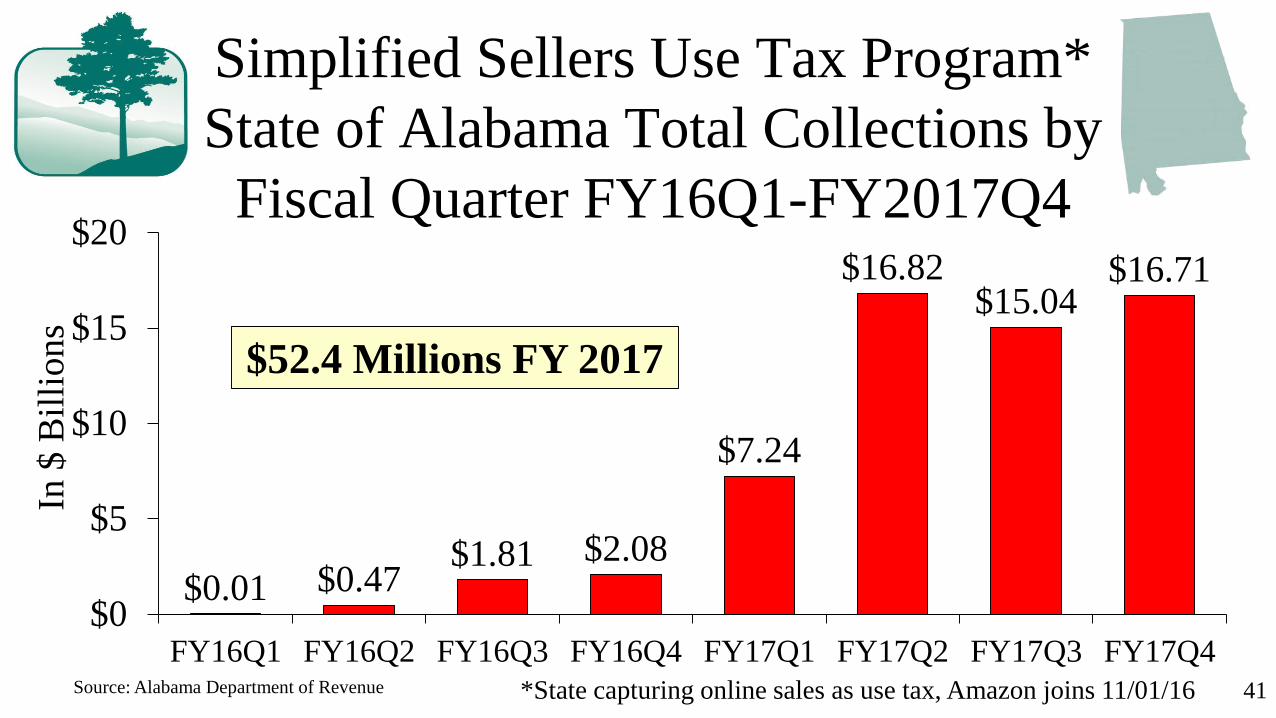
Simplified Sellers Use Tax Program*
State of Alabama Total Collections by
Fiscal Quarter FY16Q1-FY2017Q4
$0.01 $0.47$1.81 $2.08
$7.24
$16.82$15.04
$16.71
$0
$5
$10
$15
$20
FY16Q1 FY16Q2 FY16Q3 FY16Q4 FY17Q1 FY17Q2 FY17Q3 FY17Q4
In $
Bil
lio
ns
41Source: Alabama Department of Revenue
$52.4 Millions FY 2017
*State capturing online sales as use tax, Amazon joins 11/01/16

Simplified Sellers Use Tax Program
State of Alabama FY 2016-2017
General Fund
$19,635,891
38%
Counties
$13,090,594
25%
Municipalities
$13,090,594
25%
Education
$6,545,297
12%
42Source: Alabama Department of Revenue
$52.4 Millions FY 2017

43
Housing Statistics
State of AL 2016 vs 2017
2016 2017 % Change
Median Price$141,442 $148,913 +5.3%
Avg Days on
Market 142 130 -8.5%
Total Homes
Sold 53,759 57,569 +7.1%Source: Alabama Center for Real Estate

44
• State Survey – 4th Quarter 2017
• Approximately 164 respondents
• Operated by University of Alabama Center for
Business and Economic Research
• cber.cba.ua.edu
Alabama Business Confidence Index
CULVERHOUSE
College of Commerce

45
0.6%7.9%
42.4%47.3%
1.8%0%
15%
30%
45%
60%
Much Worse Worse Remain the
Same
Better Much Better
% o
f R
esp
on
den
ts
Source: Alabama Business Confidence Index
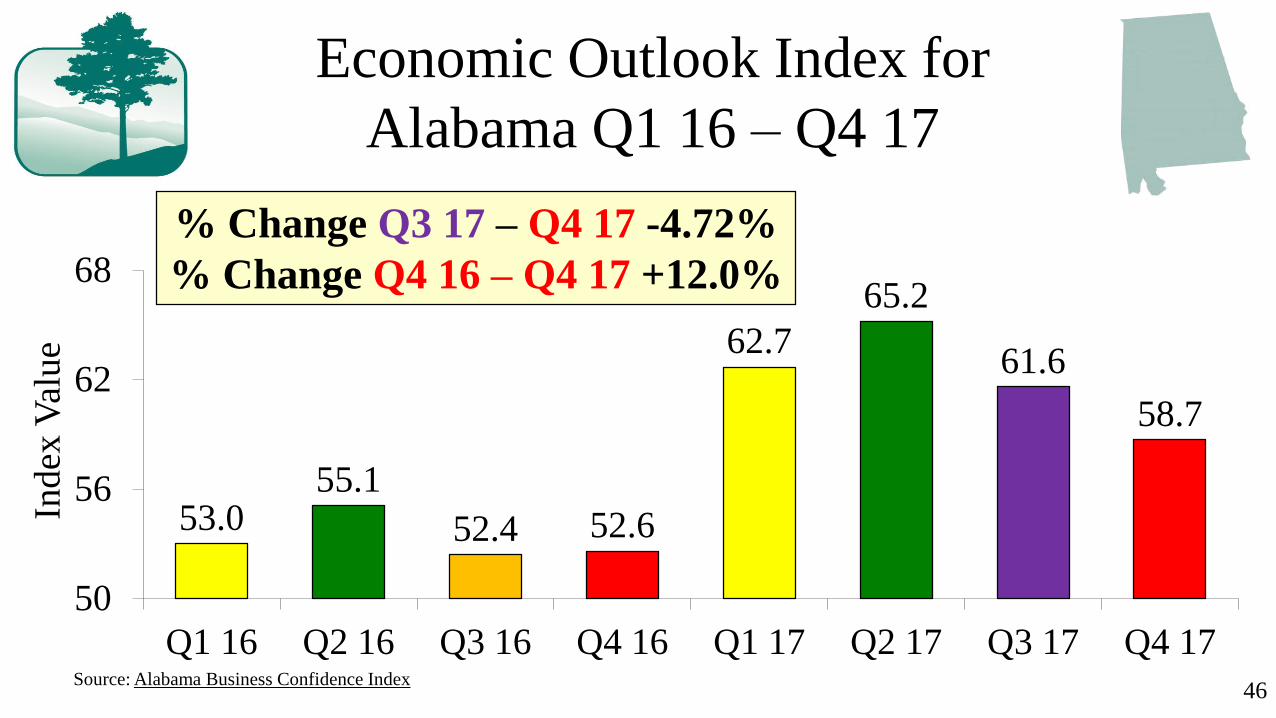
Economic Outlook for Alabama
Q4 2017 compared to Q3 2017
46
53.055.1
52.4 52.6
62.7
65.2
61.6
58.7
50
56
62
68
Q1 16 Q2 16 Q3 16 Q4 16 Q1 17 Q2 17 Q3 17 Q4 17
Index
Val
ue
Economic Outlook Index for
Alabama Q1 16 – Q4 17
% Change Q3 17 – Q4 17 -4.72%
% Change Q4 16 – Q4 17 +12.0%
Source: Alabama Business Confidence Index
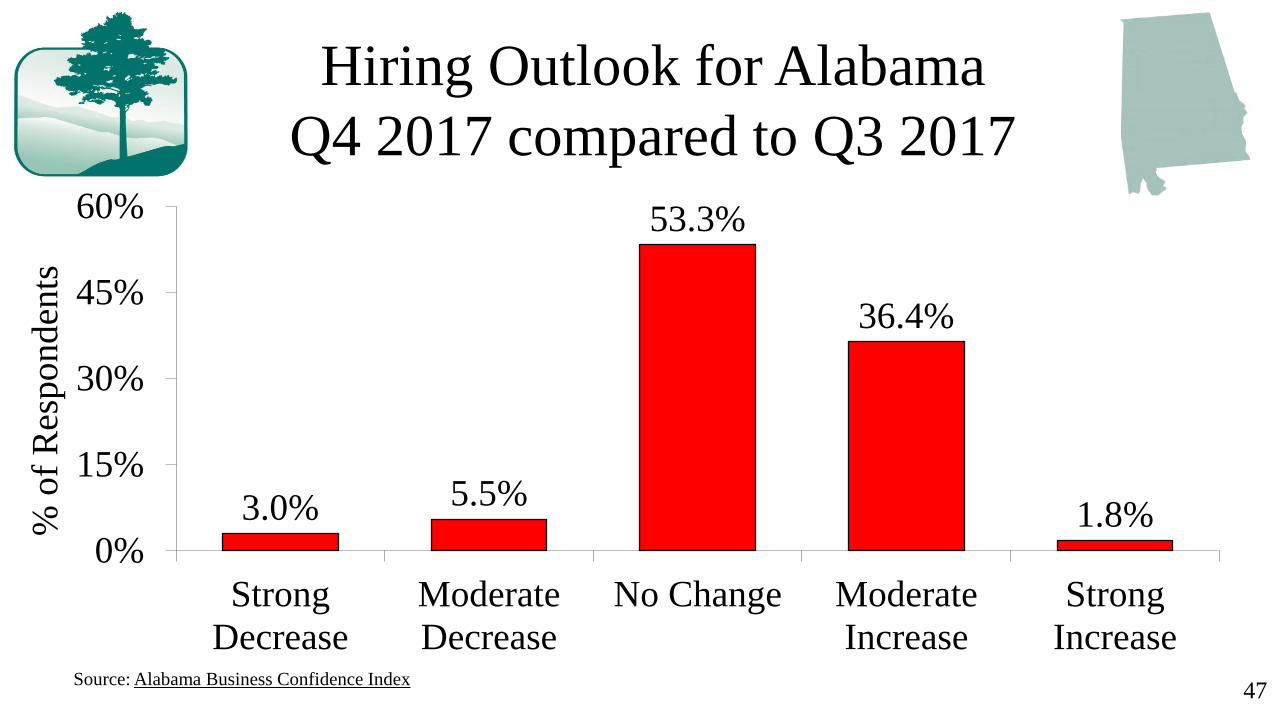
Hiring Outlook for Alabama
Q4 2017 compared to Q3 2017
3.0% 5.5%
53.3%
36.4%
1.8%0%
15%
30%
45%
60%
Strong
Decrease
Moderate
Decrease
No Change Moderate
Increase
Strong
Increase
% o
f R
espo
nd
ents
47Source: Alabama Business Confidence Index

53.954.9
49.9
51.9
57.6
60.7
58.957.4
49
53
57
61
Q1 16 Q2 16 Q3 16 Q4 16 Q1 17 Q2 17 Q3 17 Q4 17
Index
Val
ue
Hiring Outlook Index for Alabama
Q1 16 – Q4 17
48
% Change Q3 17 – Q4 17 -2.50%
% Change Q4 16 – Q4 17 +10.6%
Source: Alabama Business Confidence Index

Sales Outlook for Alabama
Q4 2017 compared to Q3 2017
0.6%7.9%
42.4%47.3%
1.8%0%
15%
30%
45%
60%
Strong
Decrease
Moderate
Decrease
No Change Moderate
Increase
Strong
Increase
% o
f R
espo
nd
ents
49Source: Alabama Business Confidence Index

55.1
57.9
54.3 54.9
63.4
67.2
62.6
58.8
52
56
60
64
68
Q1 16 Q2 16 Q3 16 Q4 16 Q1 17 Q2 17 Q3 17 Q4 17
Index
Val
ue
Sales Outlook Index for Alabama
Q1 16 – Q4 17
50
% Change Q3 17 – Q4 17 -6.0%
% Change Q4 16 – Q4 17 +7.1%
Source: Alabama Business Confidence Index
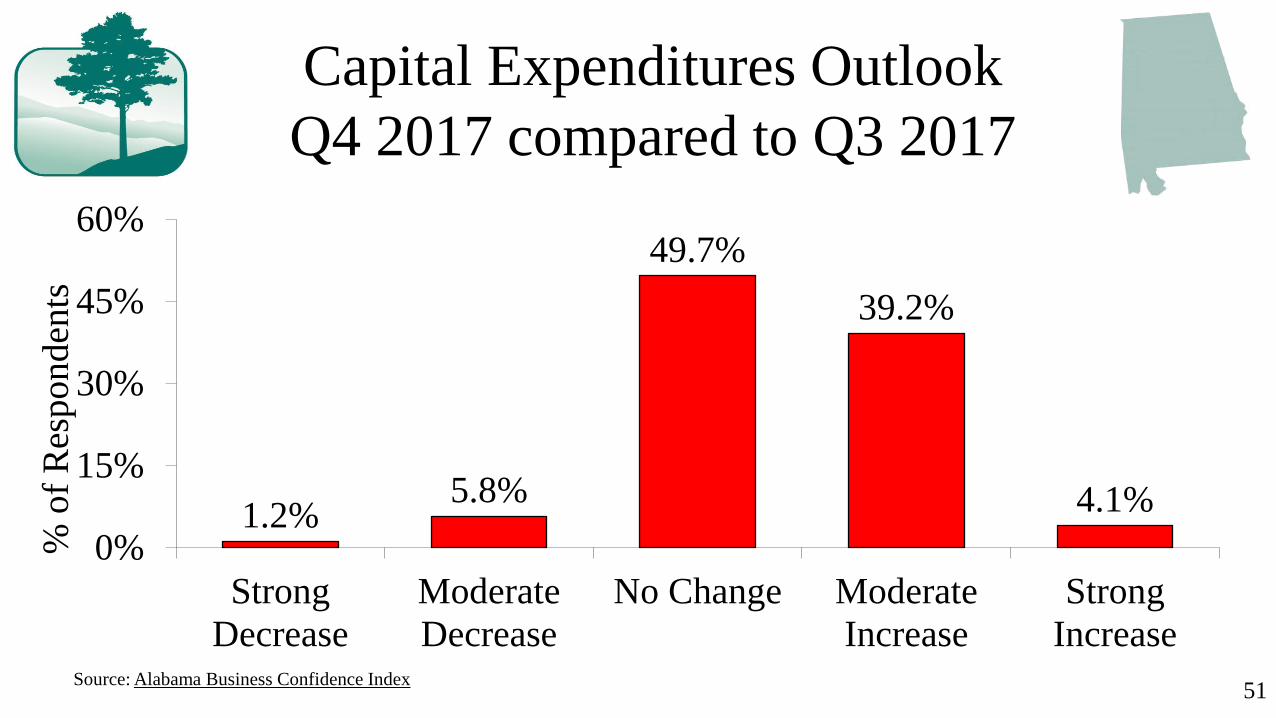
1.2%5.8%
49.7%
39.2%
4.1%
0%
15%
30%
45%
60%
Strong
Decrease
Moderate
Decrease
No Change Moderate
Increase
Strong
Increase
% o
f R
esp
on
den
ts
51
Capital Expenditures Outlook
Q4 2017 compared to Q3 2017
Source: Alabama Business Confidence Index

52.8 53.0
55.1
52.0
58.5
61.9
59.8
57.4
50
54
58
62
Q1 16 Q2 16 Q3 16 Q4 16 Q1 17 Q2 17 Q3 17 Q4 17
Index
Val
ue
52
Capital Expenditures Outlook
Alabama Q1 16 – Q4 17% Change Q3 17 - Q4 17 -4.0%
% Change Q4 16 - Q4 17 +10.8%
Source: Alabama Business Confidence Index
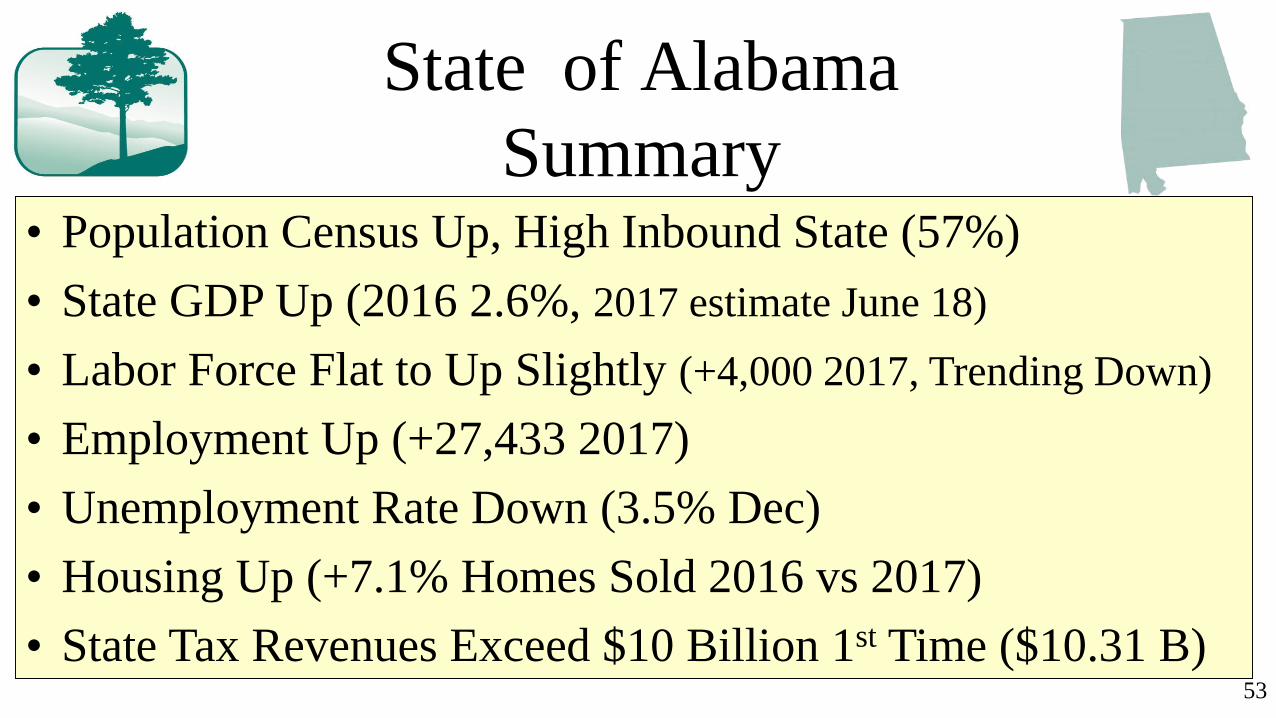
State of Alabama
Summary• Population Census Up, High Inbound State (57%)
• State GDP Up (2016 2.6%, 2017 estimate June 18)
• Labor Force Flat to Up Slightly (+4,000 2017, Trending Down)
• Employment Up (+27,433 2017)
• Unemployment Rate Down (3.5% Dec)
• Housing Up (+7.1% Homes Sold 2016 vs 2017)
• State Tax Revenues Exceed $10 Billion 1st Time ($10.31 B)53
Calhoun County Economy
54

Calhoun County Economy
55
• Membership Survey (56-78)
• Employment (81-90)
• County Tax Collections (94-96)
• Tourism & Housing (97-101)
• Municipal Tax Collections (102-113)
• Economic Development Council (115-124)
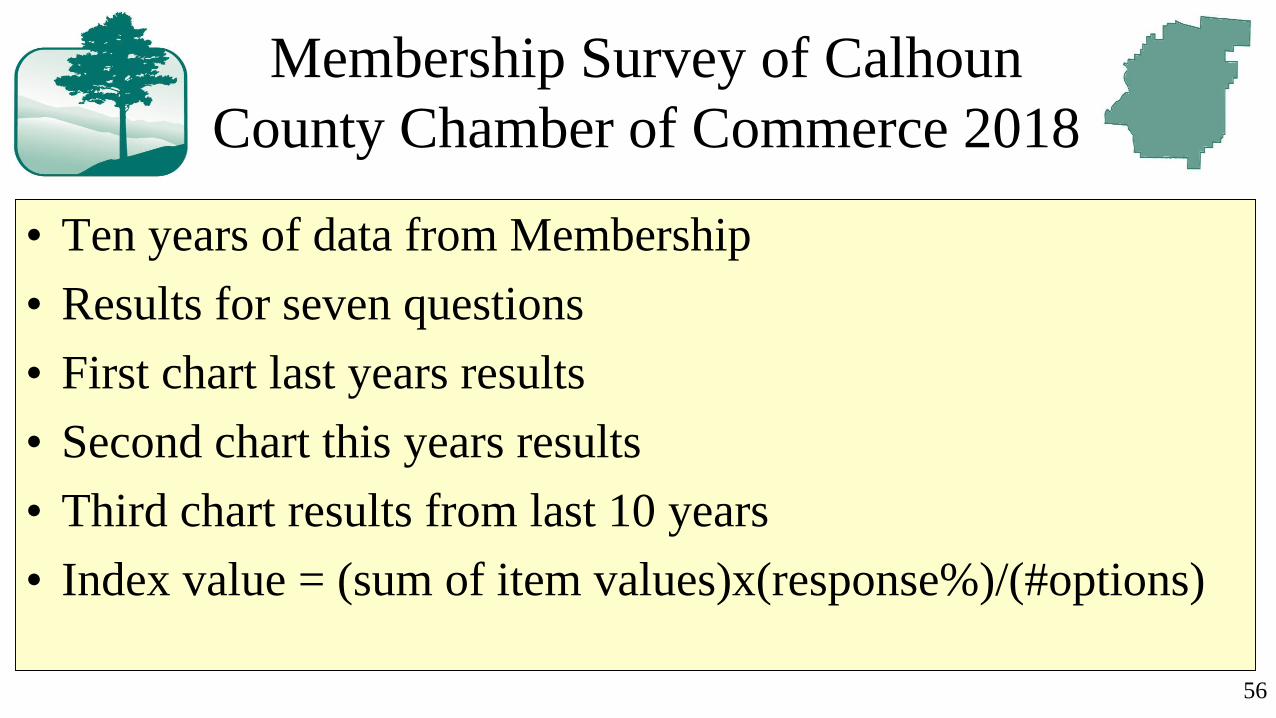
Membership Survey of Calhoun
County Chamber of Commerce 2018
• Ten years of data from Membership
• Results for seven questions
• First chart last years results
• Second chart this years results
• Third chart results from last 10 years
• Index value = (sum of item values)x(response%)/(#options)
56

57
0%
11%
22%
46%
28%
0%
10%
20%
30%
40%
50%
Much Worse Worse About Same Better Much Better
Jan 2017
Index .82
Source: 2017 Calhoun County Chamber of Commerce Membership Survey
Q#1: Overall Economic Outlook
Last Year (Jan 2017)

58
1% 1%
24%
49%
24%
0%
10%
20%
30%
40%
50%
60%
Much Worse Worse About Same Better Much Better
Jan 2018
Index .79
Source: 2018 Calhoun County Chamber of Commerce Membership Survey
Q#1: Overall Economic Outlook
This Year (Jan 2018)
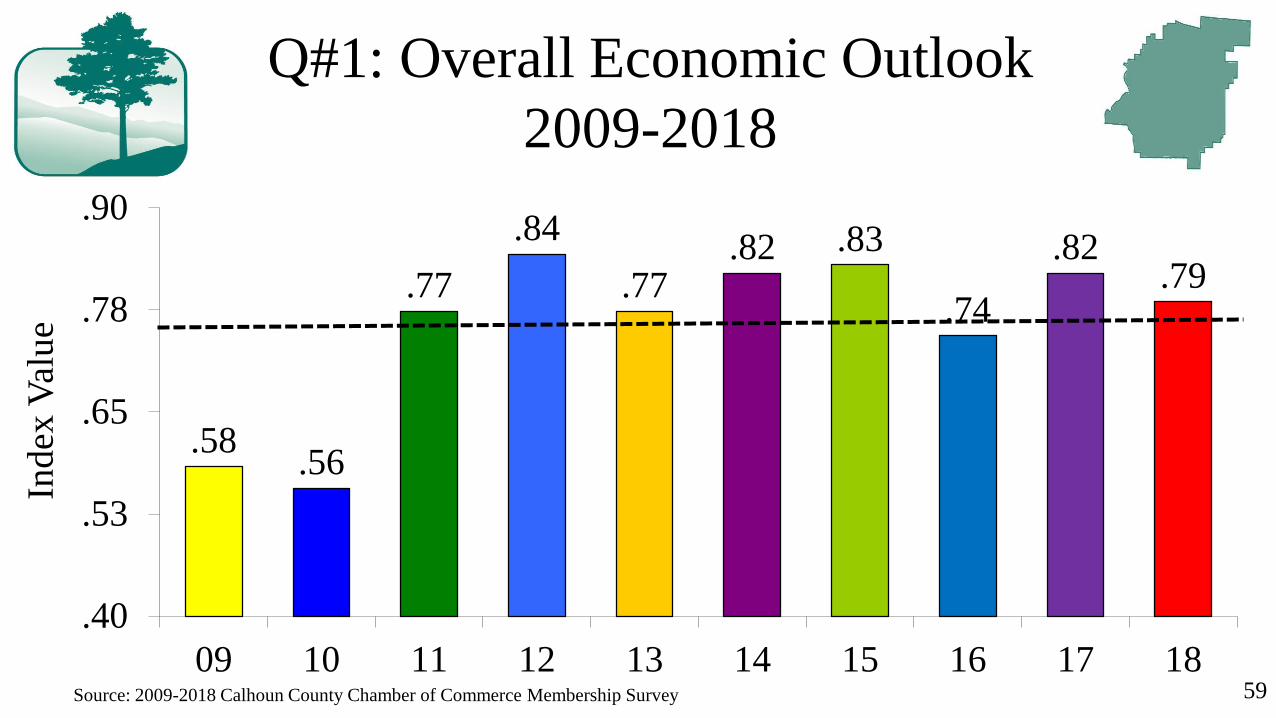
59
.58.56
.77
.84
.77.82 .83
.74
.82.79
.40
.53
.65
.78
.90
09 10 11 12 13 14 15 16 17 18
Ind
ex V
alu
eQ#1: Overall Economic Outlook
2009-2018
Source: 2009-2018 Calhoun County Chamber of Commerce Membership Survey

60
Q#2: Employment Outlook
Last Year (Jan 2017)
Source: 2017 Calhoun County Chamber of Commerce Membership Survey
0%
7%
45%41%
6%
0%
10%
20%
30%
40%
50%
Major
Cutback #
Emp
Slight
Cutback #
Emp
Remain Same Slight
Increase #
Emp
Major
Increase #
Emp
Jan 2017
Index .69

61
Q#2: Employment Outlook
This Year (Jan 2018)
Source: 2018 Calhoun County Chamber of Commerce Membership Survey
0% 3%
58%
38%
1%0%
10%
20%
30%
40%
50%
60%
70%
Major
Cutback #
Emp
Slight
Cutback #
Emp
Remain Same Slight
Increase #
Emp
Major
Increase #
Emp
Jan 2018
Index .67

62
.63.65
.70
.74.72
.75.73
.71.69
.67
.50
.60
.70
.80
09 10 11 12 13 14 15 16 17 18
Ind
ex V
alu
eQ#2: Employment Outlook
2009-2018
Source: 2009-2018 Calhoun County Chamber of Commerce Membership Survey
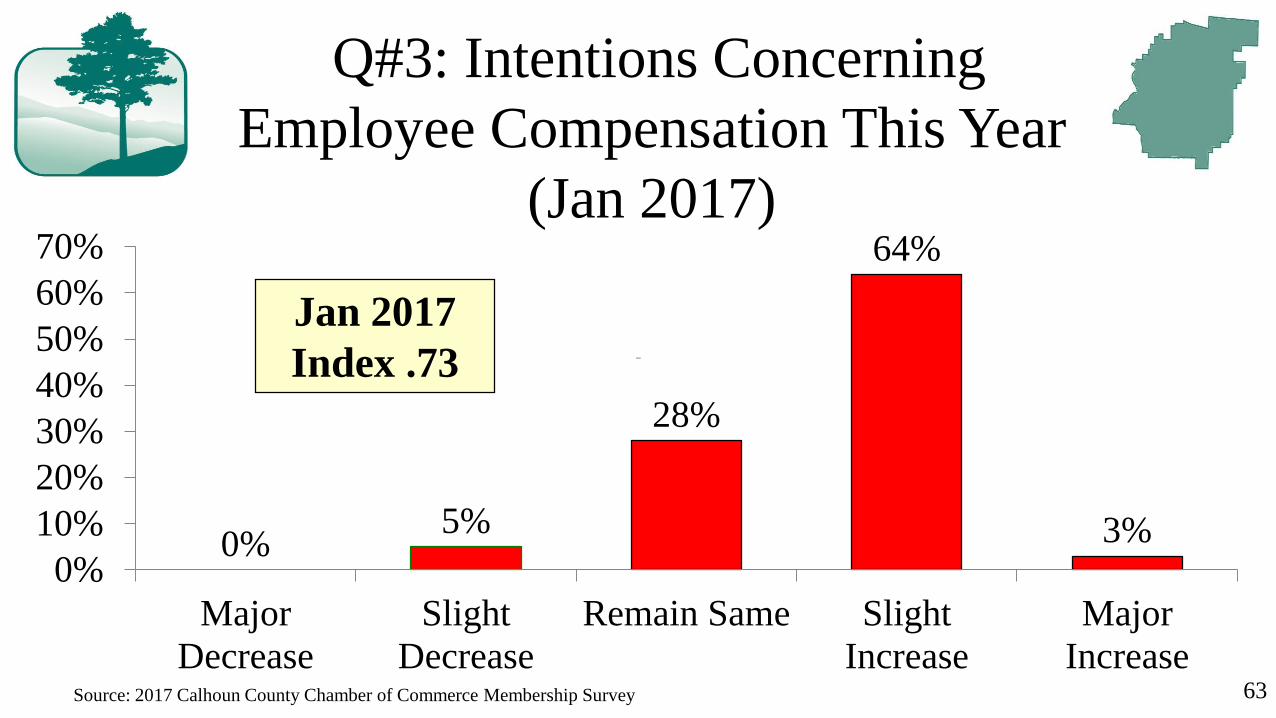
63
Remain same
75
Q#3: Intentions Concerning
Employee Compensation This Year
(Jan 2017)
Source: 2017 Calhoun County Chamber of Commerce Membership Survey
0%5%
28%
64%
3%0%
10%
20%
30%
40%
50%
60%
70%
Major
Decrease
Slight
Decrease
Remain Same Slight
Increase
Major
Increase
Jan 2017
Index .73

64
Q#3: Intentions Concerning
Employee Compensation This Year
(Jan 2018)
Source: 2018 Calhoun County Chamber of Commerce Membership Survey
0% 0%
36%
63%
1%0%
10%
20%
30%
40%
50%
60%
70%
Major
Decrease
Slight
Decrease
Remain Same Slight
Increase
Major
Increase
Jan 2018
Index .73
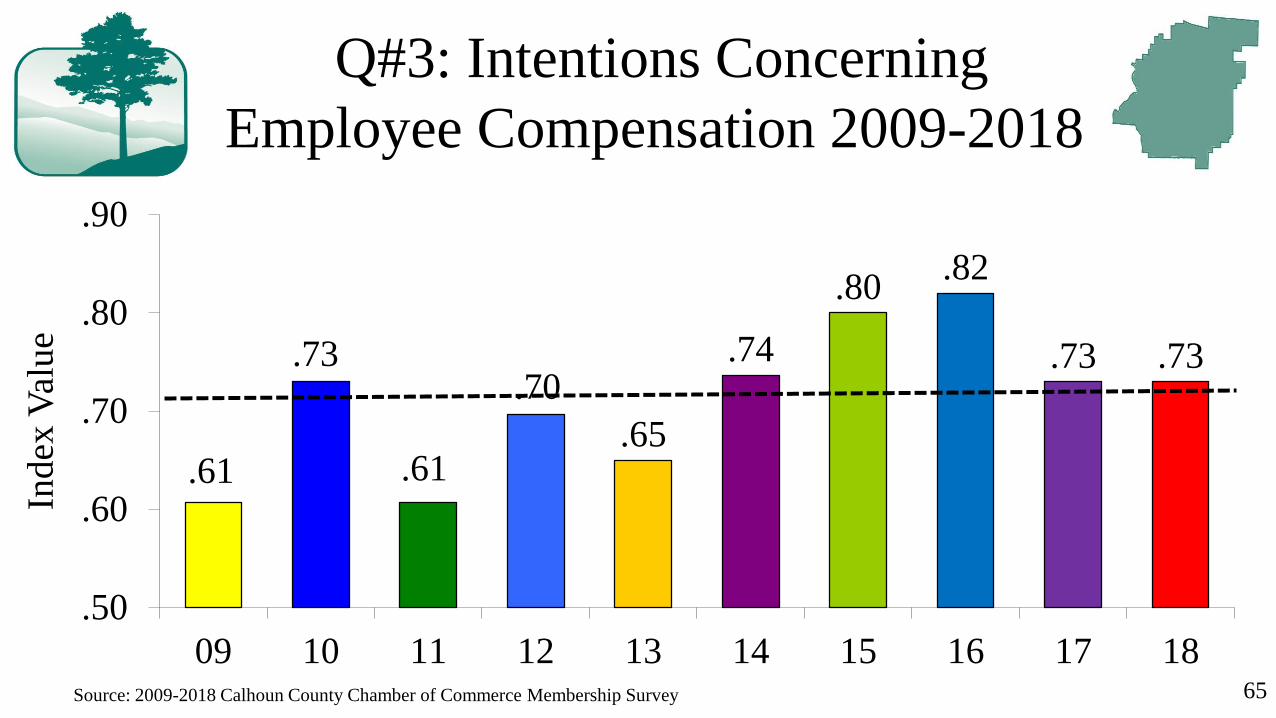
65
.61
.73
.61
.70
.65
.74
.80.82
.73 .73
.50
.60
.70
.80
.90
09 10 11 12 13 14 15 16 17 18
Index
Val
ue
Q#3: Intentions Concerning
Employee Compensation 2009-2018
Source: 2009-2018 Calhoun County Chamber of Commerce Membership Survey

0%5%
26%
55%
14%
0%
15%
30%
45%
60%
Major
Decrease
Slight
Decrease
Remain Same Slight
Increase
Major
Increase66
Q#4: Demand for Products/Services
Last Year (Jan 2017)
Source: 2017 Calhoun County Chamber of Commerce Membership Survey
Jan 2017
Index .76

67
Q#4: Demand for Products/Services
This Year (Jan 2018)
Source: 2018 Calhoun County Chamber of Commerce Membership Survey
1% 1%
34%
44%
20%
0%
15%
30%
45%
60%
Major
Decrease
Slight
Decrease
Remain Same Slight
Increase
Major
Increase
Jan 2018
Index .76

68
.83
.55
.75.78 .77
.80.83
.76 .76 .76
.45
.60
.75
.90
09 10 11 12 13 14 15 16 17 18
Index
Val
ue
Q#4: Demand for Products/Services
2009-2018
Source: 2009-2018 Calhoun County Chamber of Commerce Membership Survey
Remain same
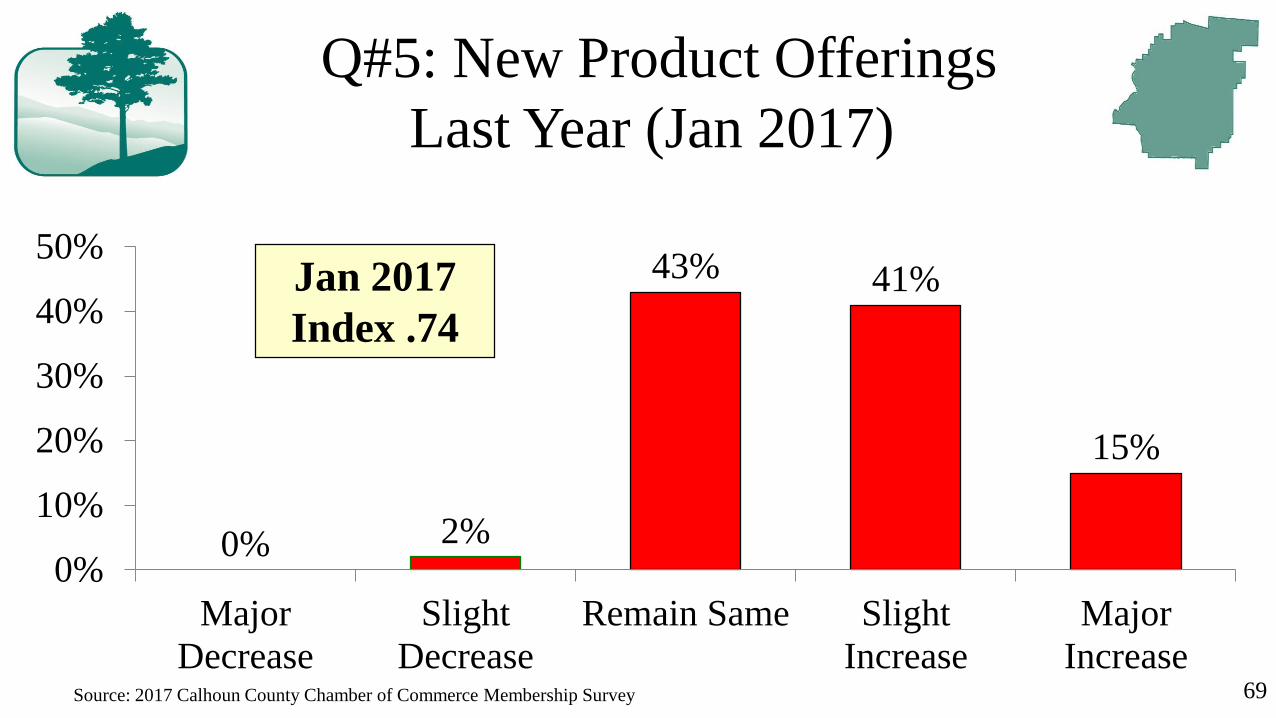
75
Q#5: New Product Offerings
Last Year (Jan 2017)
Source: 2017 Calhoun County Chamber of Commerce Membership Survey 69
0% 2%
43% 41%
15%
0%
10%
20%
30%
40%
50%
Major
Decrease
Slight
Decrease
Remain Same Slight
Increase
Major
Increase
Jan 2017
Index .74

Remain same
75
Q#5: New Product Offerings
This Year (Jan 2018)
Source: 2018 Calhoun County Chamber of Commerce Membership Survey 70
0% 1%
48%42%
8%
0%
10%
20%
30%
40%
50%
60%
Major
Decrease
Slight
Decrease
Remain Same Slight
Increase
Major
Increase
Jan 2018
Index .71

.69.65
.69 .71 .71.76
.80 .81
.74.71
.40
.53
.65
.78
.90
09 10 11 12 13 14 15 16 17 18
Index
Val
ue
Q#5: New Product Offerings
2009-2018
71Source: 2009-2018 Calhoun County Chamber of Commerce Membership Survey

Remain same
75
Q#6: Intention to Change Number of
Outlets Last Year (Jan 2017)
72Source: 2017 Calhoun County Chamber of Commerce Membership Survey
0% 1%
81%
16%
2%0%
15%
30%
45%
60%
75%
90%
Major
Decrease
Slight
Decrease
Remain Same Slight
Increase
Major
Increase
Jan 2017
Index .63

Remain same
75
Q#6: Intention to Change Number of
Outlets This Year (Jan 2018)
73Source: 2018 Calhoun County Chamber of Commerce Membership Survey
0% 1%
83%
16%
0%0%
15%
30%
45%
60%
75%
90%
Major
Decrease
Slight
Decrease
Remain Same Slight
Increase
Major
Increase
Jan 2018
Index .63
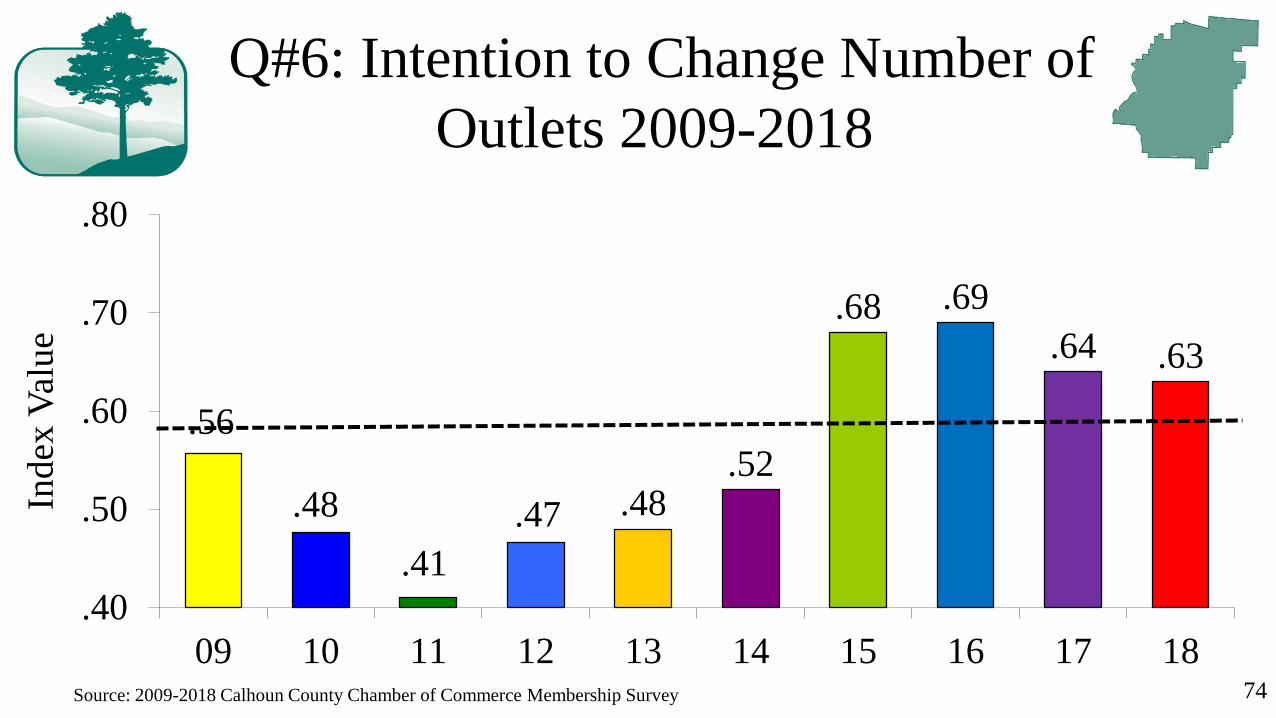
.56
.48
.41
.47 .48.52
.68 .69
.64 .63
.40
.50
.60
.70
.80
09 10 11 12 13 14 15 16 17 18
Index
Val
ue
Q#6: Intention to Change Number of
Outlets 2009-2018
74Source: 2009-2018 Calhoun County Chamber of Commerce Membership Survey

Remain same
75
Q#7: Intentions Concerning
Expenditures on Advertising Last
Year (Jan 2017)
75Source: 2017 Calhoun County Chamber of Commerce Membership Survey
1%7%
48%
36%
7%
0%
10%
20%
30%
40%
50%
60%
Major
Decrease
Slight
Decrease
Remain Same Slight
Increase
Major
Increase
Jan 2017
Index .68
Remain same
75
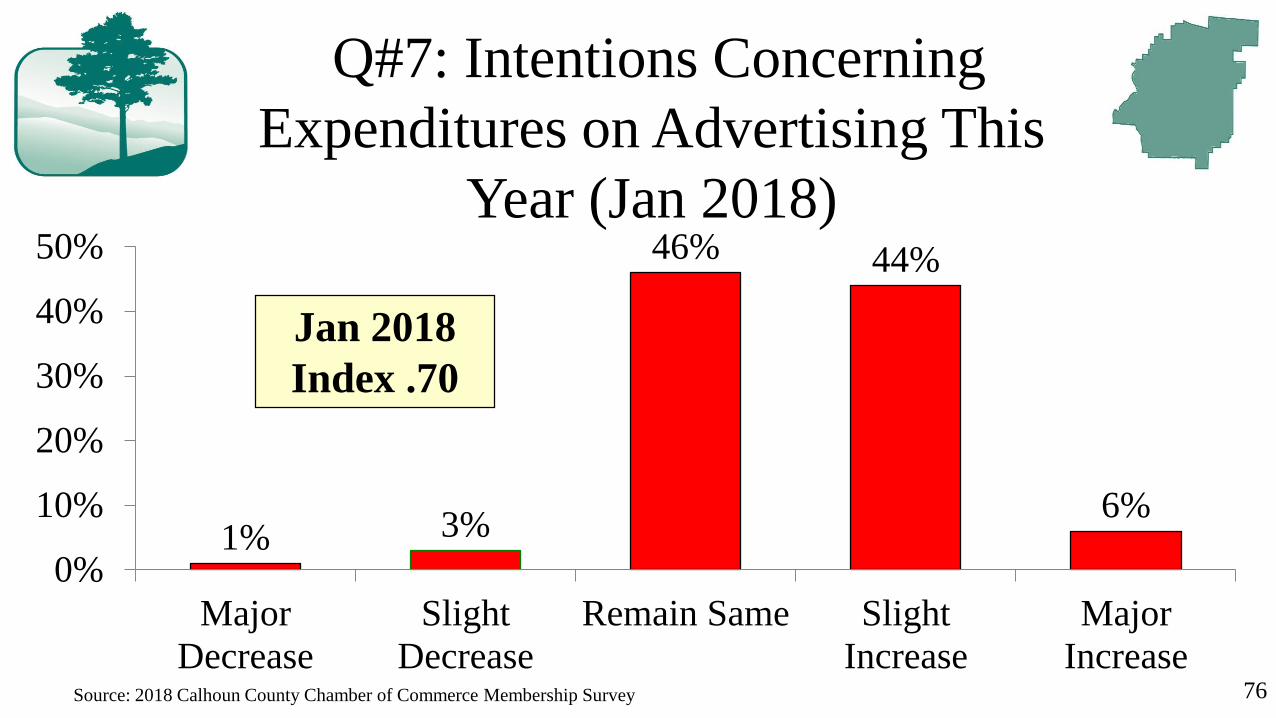
Q#7: Intentions Concerning
Expenditures on Advertising This
Year (Jan 2018)
76Source: 2018 Calhoun County Chamber of Commerce Membership Survey
1% 3%
46% 44%
6%
0%
10%
20%
30%
40%
50%
Major
Decrease
Slight
Decrease
Remain Same Slight
Increase
Major
Increase
Jan 2018
Index .70

.54.57 .58
.62 .64.61
.68 .69 .68.70
.40
.50
.60
.70
.80
09 10 11 12 13 14 15 16 17 18
Index
Val
ue
Q#7: Intentions Concerning
Expenditures on Advertising
2009-2018
77Source: 2009-2018 Calhoun County Chamber of Commerce Membership Survey

78
Membership Survey: Largest
Response Category by % 2018
• Overall Outlook– Slightly Better 49%
• Number of Employees – No Change 58%
• Employee Pay – Slight Increase 63%
• Demand for Products – Slightly Better 44%
• New Products – No Change 48%
• Number of Outlets – No Change 83%
• Advertising Spending – No Change 46%

Population Trends
Calhoun County 2005-2016
in Thousands
112113 113 113
114
119118
117 117
116 116115
110
112
114
116
118
120
05 06 07 08 09 10 11 12 13 14 15 16
In T
ho
usa
nd
s
79Source: U.S. Census Bureau
2015 - 115,620
2016 - 114,611

GDP % Change from Preceding Year
Calhoun County & State of Alabama
2007 - 20167.1%
2.5%
-3.4%
3.9%
-1.3%-1.1%
-3.5%
1.1% 0.7%2.1%
3.3%
1.6% -2.5%3.8%
3.4% 2.9% 2.4% 1.9%3.3%
2.6%
-6%
-4%
-2%
0%
2%
4%
6%
8%
07 08 09 10 11 12 13 14 15 16
Calhoun
Alabama
80Source: U.S. Bureau of Economic Analysis: Current $

Labor Force Calhoun County
2008-2017 in Thousands
51.9
49.0 49.148.0
47.5
46.246.7 46.4 46.3
45.5
45
47
49
51
53
55
08 09 10 11 12 13 14 15 16 17
In T
hou
san
ds
81Source: U.S. Bureau of Labor Statistics
-1.73% 2016-2017
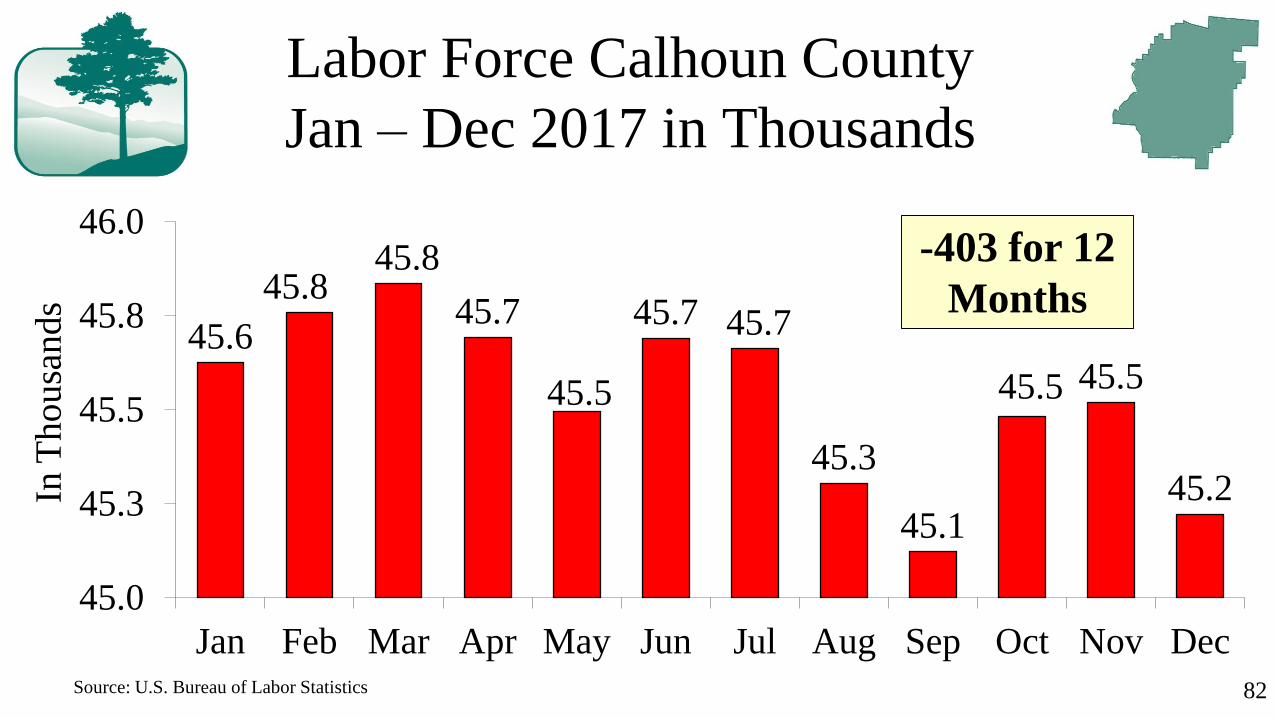
Labor Force Calhoun County
Jan – Dec 2017 in Thousands
45.6
45.845.8
45.7
45.5
45.7 45.7
45.3
45.1
45.5 45.5
45.2
45.0
45.3
45.5
45.8
46.0
Jan Feb Mar Apr May Jun Jul Aug Sep Oct Nov Dec
In T
ho
usa
nd
s
82Source: U.S. Bureau of Labor Statistics
-403 for 12
Months

83
Employment for Calhoun County
2008-2017 in Thousands
50.3
47.446.5 46.1
45.4
43.9 43.743.1 43.3 43.1
42
45
47
50
52
08 09 10 11 12 13 14 15 16 17
In T
hou
san
ds
Source: U.S. Bureau of Labor Statistics
-.46% 2016-2017
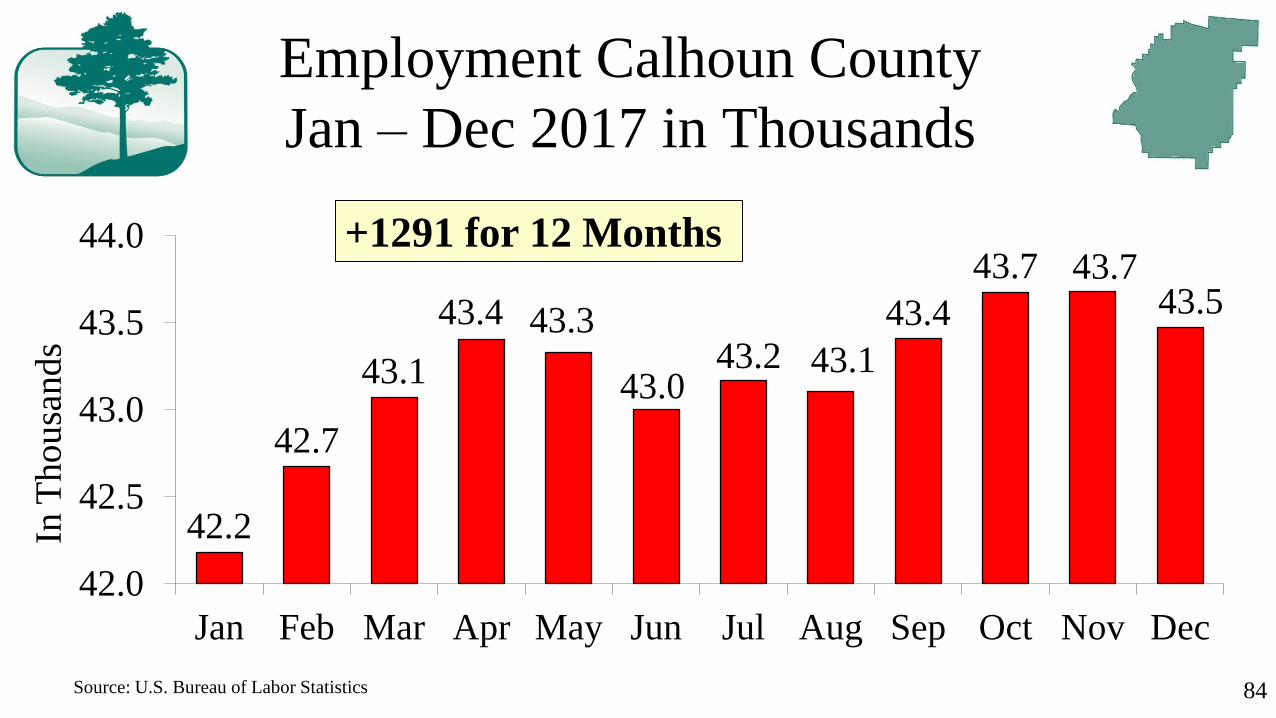
Employment Calhoun County
Jan – Dec 2017 in Thousands
42.2
42.7
43.1
43.4 43.3
43.043.2 43.1
43.4
43.7 43.743.5
42.0
42.5
43.0
43.5
44.0
Jan Feb Mar Apr May Jun Jul Aug Sep Oct Nov Dec
In T
hou
san
ds
84Source: U.S. Bureau of Labor Statistics
+1291 for 12 Months

Unemployment Rate for Calhoun
County 2008-2017
85
5.1%
9.9% 9.8%9.2%
8.0%7.2% 7.2%
6.9% 6.6%
5.2%
3%
5%
7%
9%
11%
08 09 10 11 12 13 14 15 16 17
% U
nem
plo
yed
Source: U.S. Bureau of Labor Statistics

Unemployment Rate
Calhoun County vs Alabama 2017
86Source: U.S. Bureau of Labor Statistics
7.5%
6.7%
6.0%
5.0% 4.8%
5.9%5.5%
4.8%
3.8% 4.0% 4.0% 3.9%
6.8%
6.1%
5.3%
4.4% 4.2%
5.2%4.9%
4.3%
3.3% 3.5% 3.6% 3.5%
2%
4%
6%
8%
Jan Feb Mar Apr May Jun Jul Aug Sep Oct Nov Dec
% U
nem
plo
yed
Calhoun
AL
Not Seasonally Adjusted
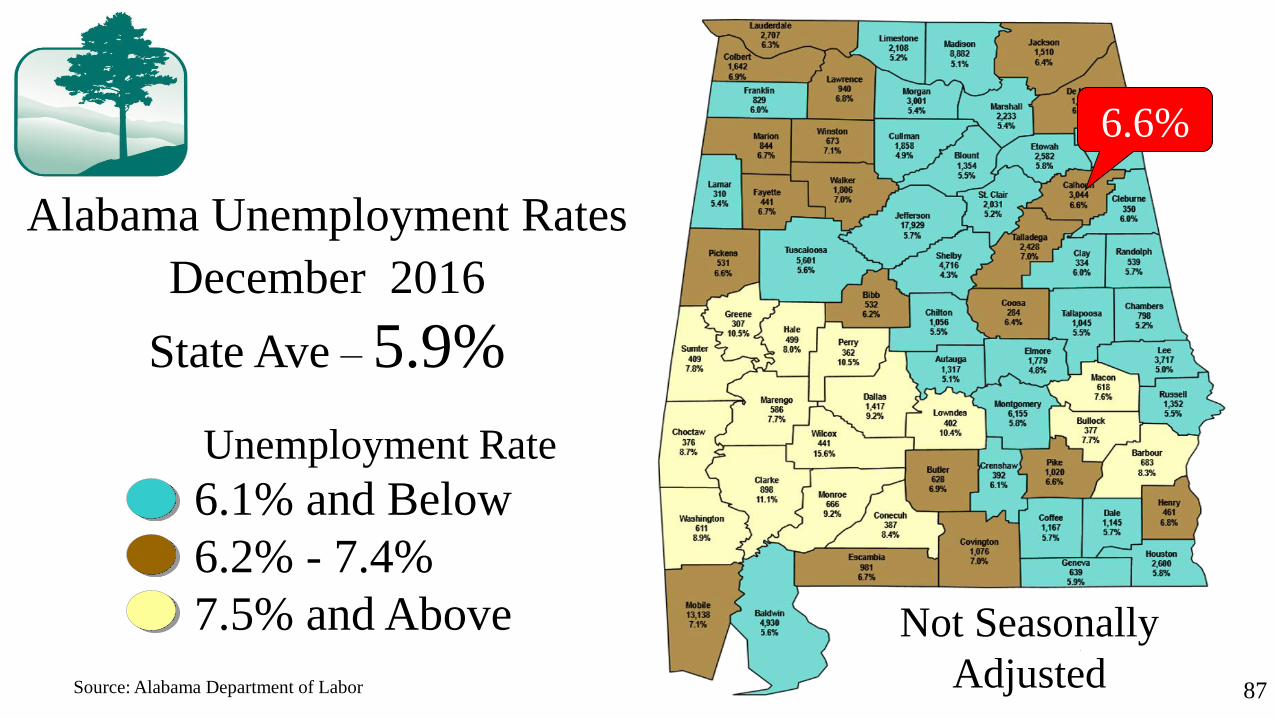
87
Unemployment Rate
6.1% and Below
6.2% - 7.4%
7.5% and Above
Source: Alabama Department of Labor
6.6%
Alabama Unemployment Rates
December 2016
State Ave – 5.9%
Not Seasonally
Adjusted
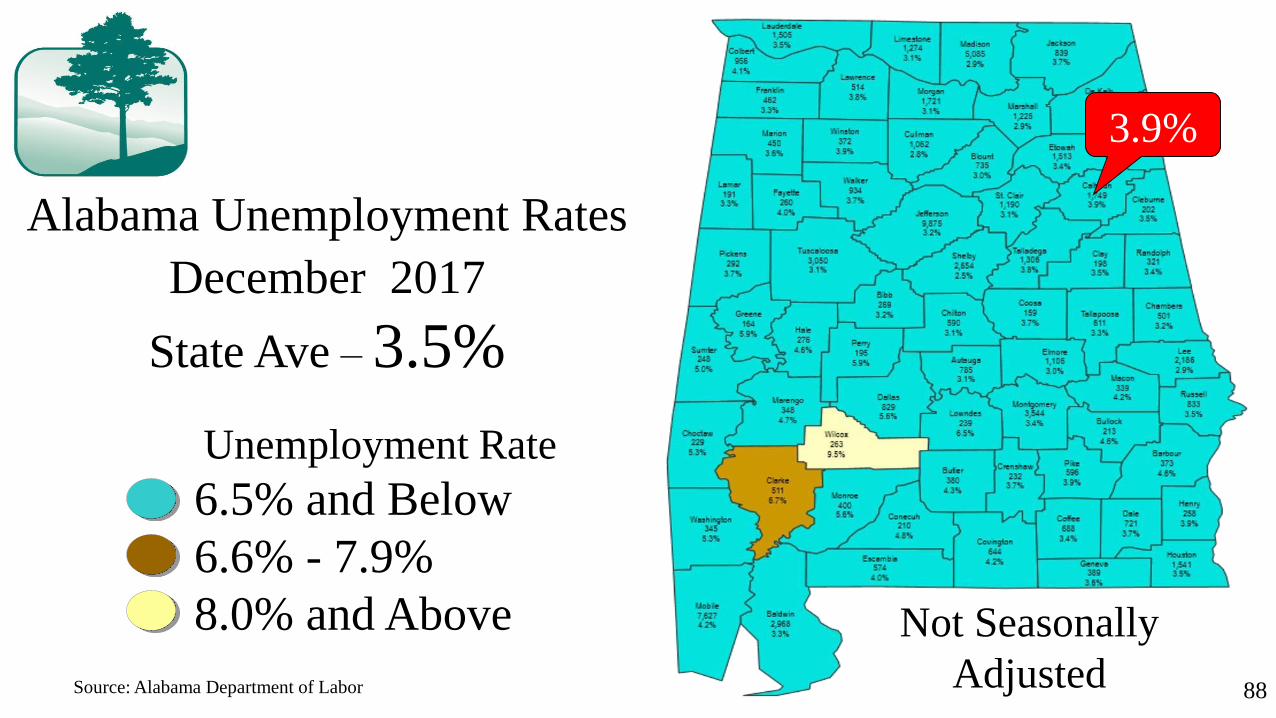
88
Unemployment Rate
6.5% and Below
6.6% - 7.9%
8.0% and Above
Source: Alabama Department of Labor
3.9%
Alabama Unemployment Rates
December 2017
State Ave – 3.5%
Not Seasonally
Adjusted

Employment State Peak to
Now % Change AL MSAs
Jan 07- Dec 17
0%
-18%
18%
-1%-4%
-8%-3%
-3%
10%
-1%
1%
14%
-20%
-10%
0%
10%
20%
AL
Ann
Aub
Bh
am
Deca
Doth
Flo
r
Gad
s
Hun
t
Mo
b
Mo
nt
Tusc
89Source: U.S. Bureau of Labor Statistics

Employment % Change AL & AL
MSAs Dec 16- Dec 17
1.8% 2.0%
4.0%
0.9%
2.6%
0.2%
1.1%
2.4%
3.3%
0.9%1.4%
2.4%
0%
3%
5%
AL
Ann
Aub
Bh
am
Deca
Doth
Flo
r
Gad
s
Hun
t
Mo
b
Mo
nt
Tu
sc
90Source: U.S. Bureau of Labor Statistics

Average Hourly Earnings Private Sector
Calhoun County & State of Alabama
2009-2017
$19.68 $19.86 $20.14 $20.21 $20.18 $20.73 $21.02$21.85
$22.56
$18.59$17.48
$16.22$15.31
$16.34
$18.23 $18.16$17.56 $17.05
$12
$15
$18
$21
$24
2009 2010 2011 2012 2013 2014 2015 2016 2017
Alabama Calhoun
91Source: U.S. Bureau of Labor Statistics
95%76%

Average Hourly Earnings Private Sector
Calhoun County & State of Alabama
Jan – Dec 2017
22.5 22.3 22.2 22.8 22.5 22.2 22.6 22.5 22.9 23.0 22.8 23.0
17.2 17.0 17.0 16.9 17.0 16.7 17.2 17.0 16.9 17.2 17.5 17.4
$13
$16
$19
$22
$25
Jan Feb Mar Apr May Jun Jul Aug Sep Oct Nov Dec
Alabama Calhoun
92Source: U.S. Bureau of Labor Statistics
76% State Average

Per Capita Personal Income
Calhoun County & State Of Alabama
2007 – 2016 in $ Thousands
93Source: U.S. Bureau of Economic Analysis
$29.9$30.7 $30.1 $30.7
$31.5 $31.7 $31.4$32.4
$33.5$34.4
$32.6$33.4
$32.7$33.7
$34.7$35.5 $35.8
$36.9$38.2 $38.9
$25
$30
$35
$40
2007 2008 2009 2010 2011 2012 2013 2014 2015 2016
Thou
san
ds
Calhoun Alabama
92%
88%

State Sales Tax Collections
Calhoun County FY 09-10 – FY 16-17
in $ Millions
$21.40
$25.24
$28.00$29.12
$31.19 $31.02 $30.50$31.34
$20
$23
$25
$28
$30
$33
09-10 10-11 11-12 12-13 13-14 14-15 15-16 16-17
In $
Mil
lio
ns
94Source: AL Dept of Revenue
+2.72% Fiscal Yr

State Use Tax Collections
Calhoun County FY 09-10 – FY 16-17
in $ Millions
$1.10 $1.08 $1.08
$0.93
$1.19$1.12
$0.84
$1.27
$0.7
$0.9
$1.1
$1.3
$1.5
09-10 10-11 11-12 12-13 13-14 14-15 15-16 16-17
In $
Mil
lio
ns
95Source: AL Dept of Revenue
+50.6% Fiscal Yr
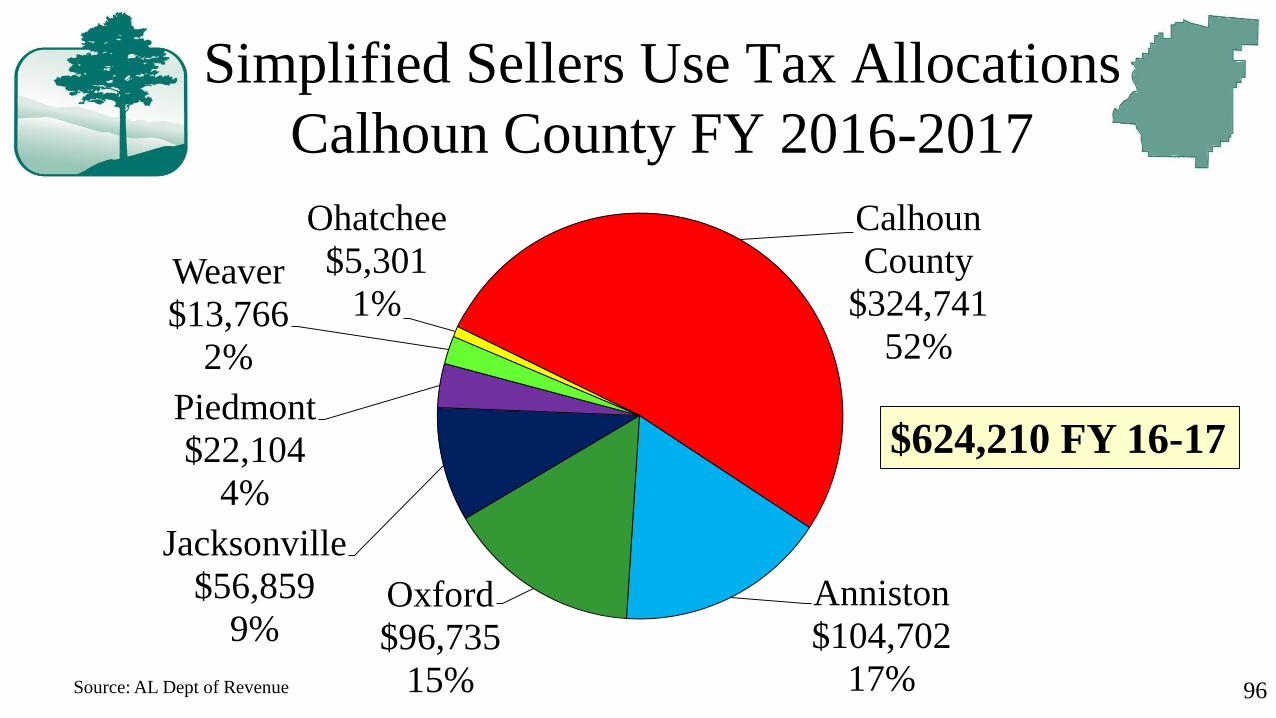
Simplified Sellers Use Tax Allocations
Calhoun County FY 2016-2017
Calhoun
County
$324,741
52%
Anniston
$104,702
17%
Oxford
$96,735
15%
Jacksonville
$56,859
9%
Piedmont
$22,104
4%
Weaver
$13,766
2%
Ohatchee
$5,301
1%
96Source: AL Dept of Revenue
$624,210 FY 16-17
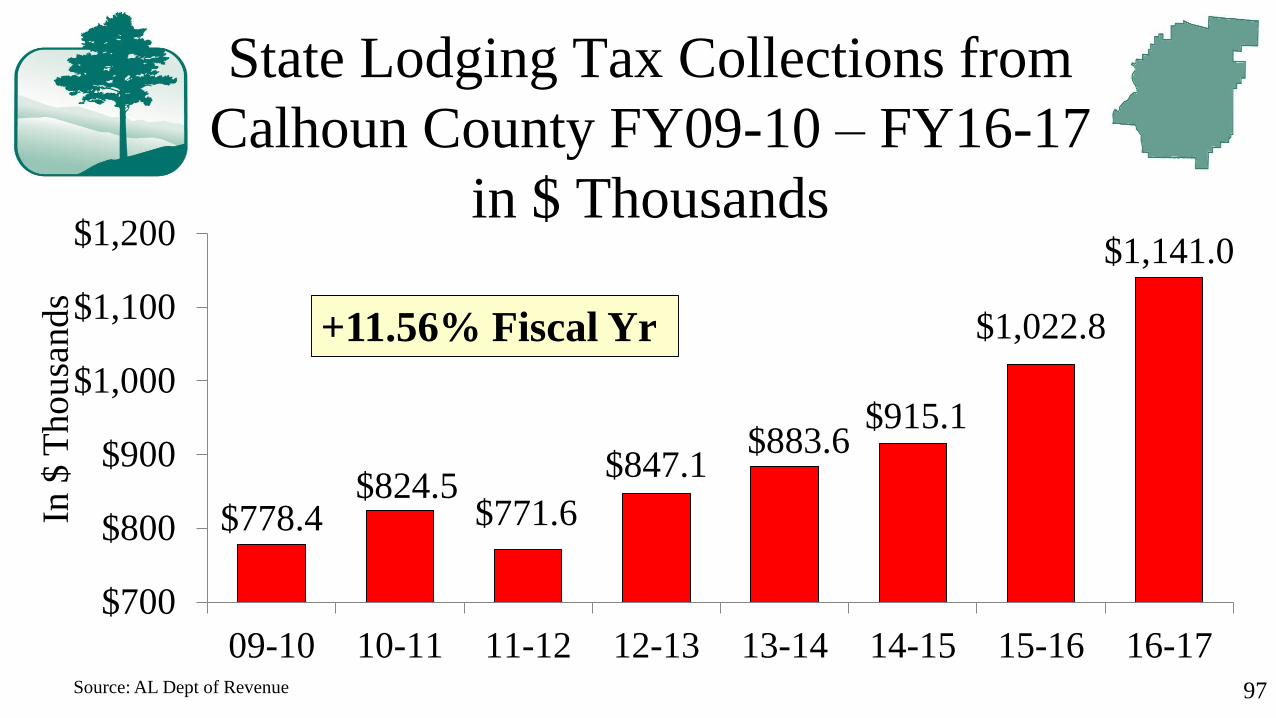
State Lodging Tax Collections from
Calhoun County FY09-10 – FY16-17
in $ Thousands
$778.4$824.5
$771.6
$847.1$883.6
$915.1
$1,022.8
$1,141.0
$700
$800
$900
$1,000
$1,100
$1,200
09-10 10-11 11-12 12-13 13-14 14-15 15-16 16-17
In $
Thou
san
ds
97Source: AL Dept of Revenue
+11.56% Fiscal Yr

Tourism Economic Impact
State of Alabama 2016
• Est over 25.8 Million visitors 2016
• Spending $13.8 Billion in 2016
• Represent 6.8% of State GDP
• Est 179,644 jobs (9.1% of non agricultural)
• Generated $836 Million State/Local Tax Revenues
98Source: Alabama Tourism Department, 2016
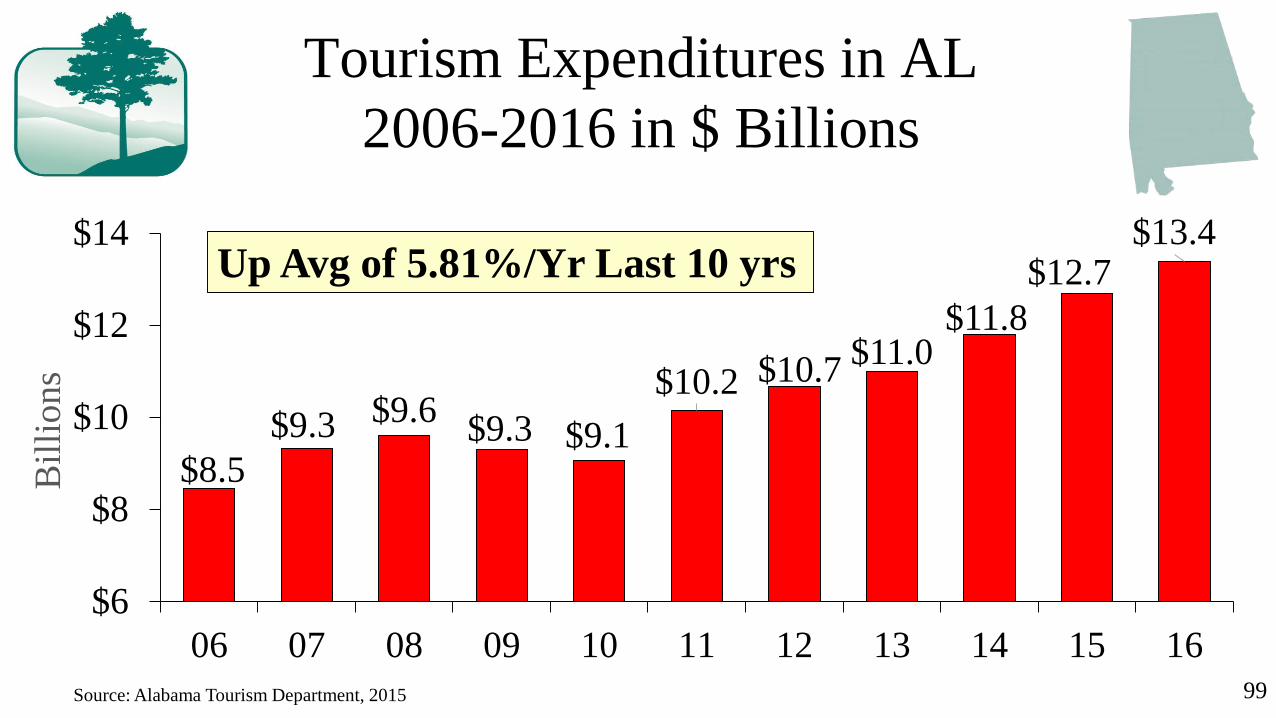
Tourism Expenditures in AL
2006-2016 in $ Billions
$8.5
$9.3 $9.6$9.3 $9.1
$10.2 $10.7$11.0
$11.8
$12.7$13.4
$6
$8
$10
$12
$14
06 07 08 09 10 11 12 13 14 15 16
Bil
lio
ns
99Source: Alabama Tourism Department, 2015
Up Avg of 5.81%/Yr Last 10 yrs

Tourism Impact in Calhoun County
Jobs & Earnings 14-16
891
933
994
800
850
900
950
1,000
14 15 16
Jobs
$21.8
$23.4
$25.1
$20
$23
$25
$28
14 15 16
Ear
nin
gs
in M
illi
on
s100Source: Alabama Tourism Department, 2015
Up 6.5% 15-16 Up 7.3% 15-16

101
Housing Statistics
Calhoun County 2016 vs 2017
2016 2017 % Change
Average
Price$134,558 $138,034 +2.6%
Avg Days on
Market 134 112 -16.3%
Total Homes
Sold 1,510 1,646 +9.00%Source: Alabama Center for Real Estate
102
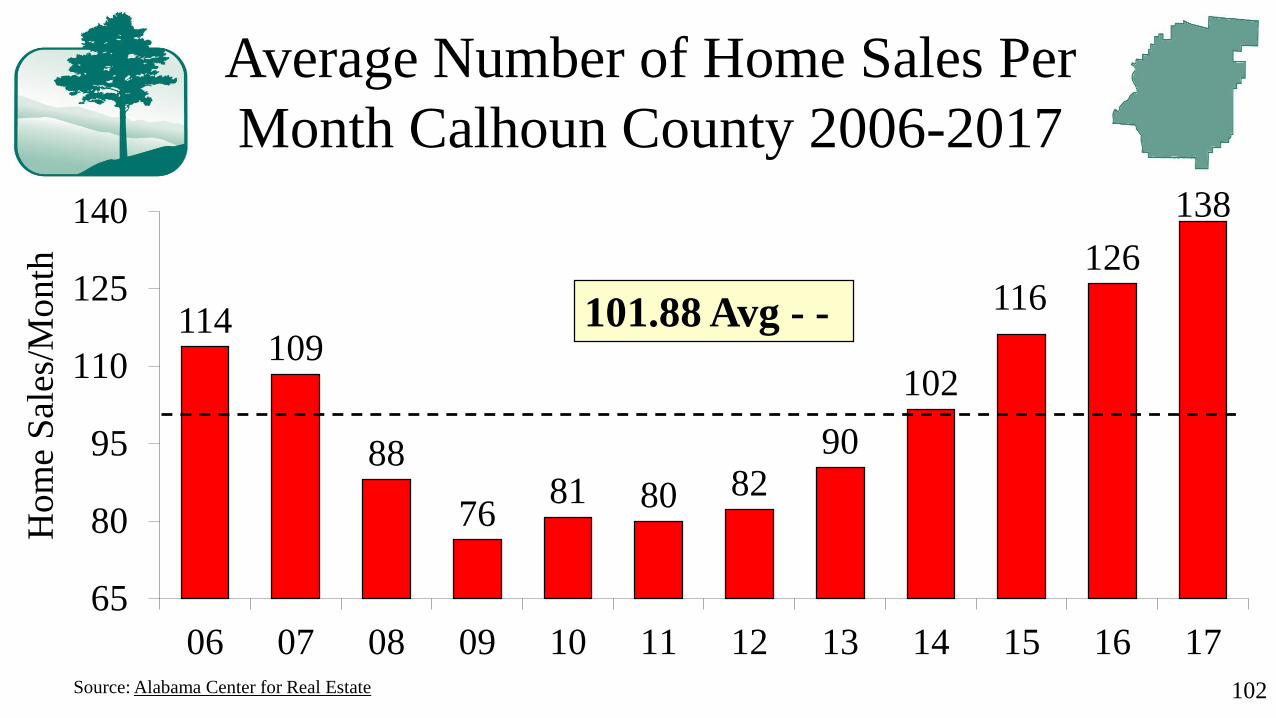
114109
88
7681 80 82
90
102
116126
138
65
80
95
110
125
140
06 07 08 09 10 11 12 13 14 15 16 17
Hom
e S
ales
/Mo
nth
Average Number of Home Sales Per
Month Calhoun County 2006-2017
Source: Alabama Center for Real Estate
101.88 Avg - -
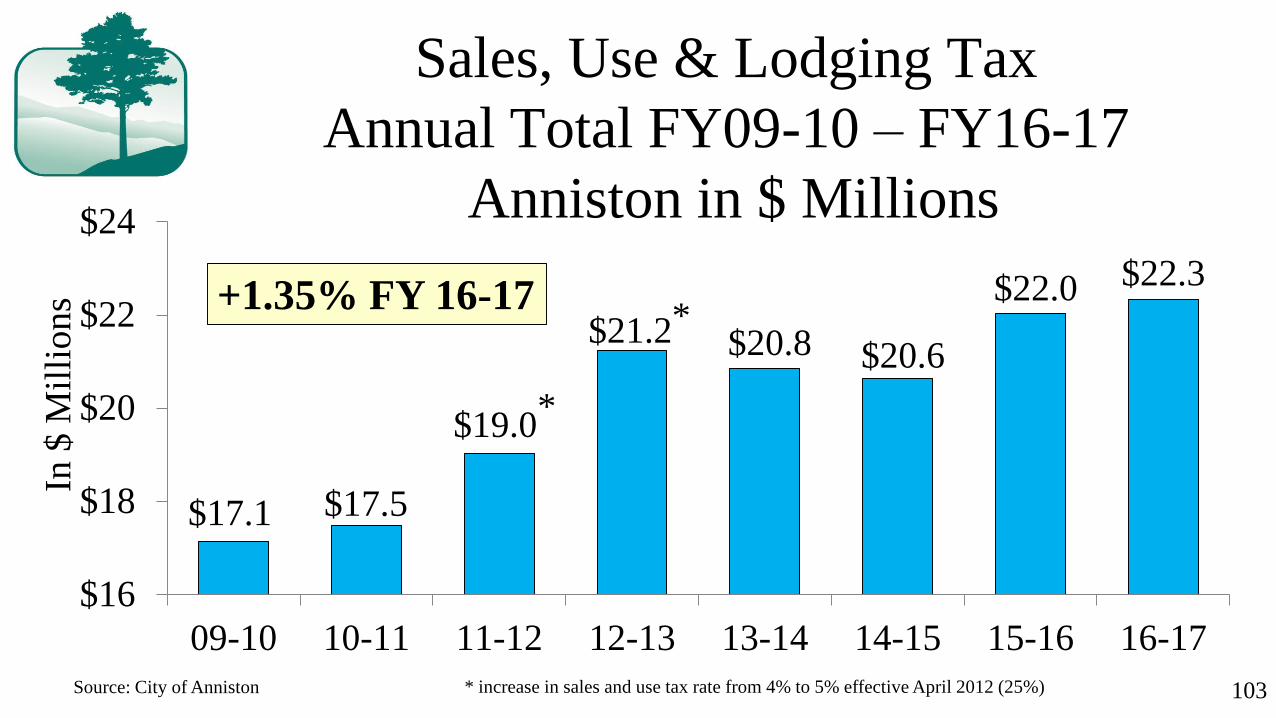
Sales, Use & Lodging Tax
Annual Total FY09-10 – FY16-17
Anniston in $ Millions
$17.1 $17.5
$19.0
$21.2 $20.8 $20.6
$22.0 $22.3
$16
$18
$20
$22
$24
09-10 10-11 11-12 12-13 13-14 14-15 15-16 16-17
In $
Mil
lio
ns
103Source: City of Anniston * increase in sales and use tax rate from 4% to 5% effective April 2012 (25%)
+1.35% FY 16-17*
*
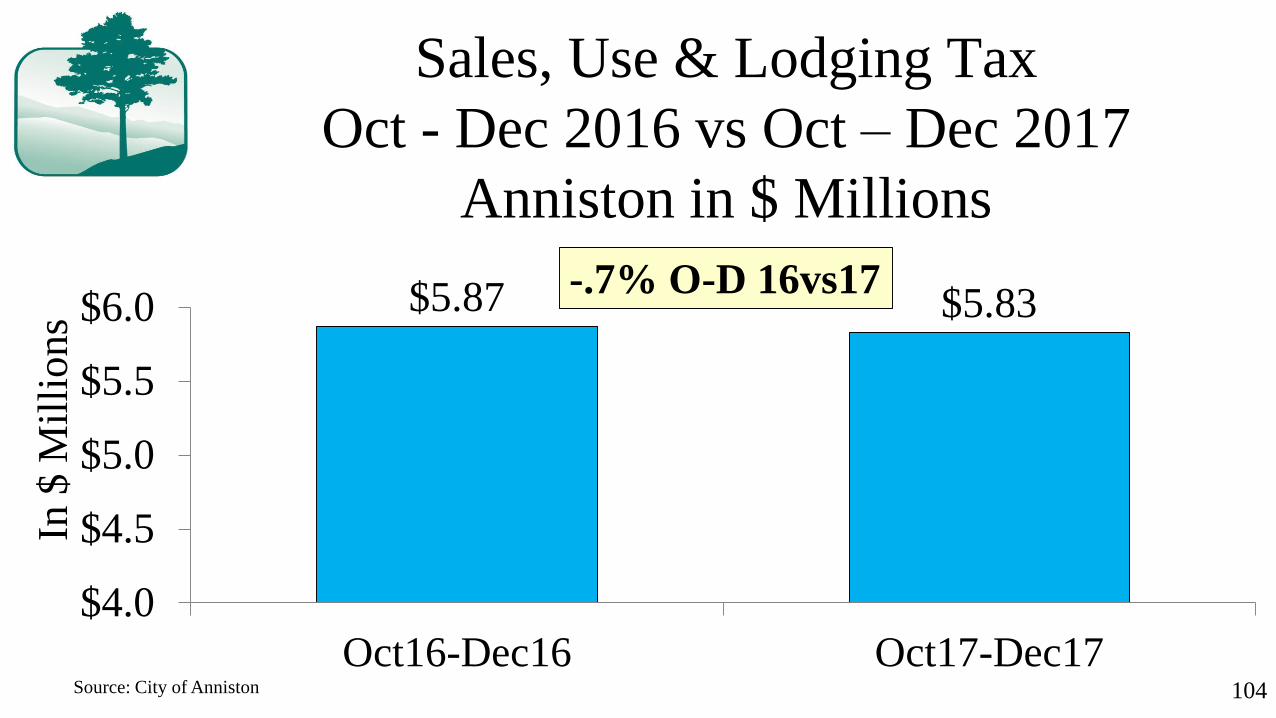
Sales, Use & Lodging Tax
Oct - Dec 2016 vs Oct – Dec 2017
Anniston in $ Millions
104Source: City of Anniston
$5.87 $5.83
$4.0
$4.5
$5.0
$5.5
$6.0
Oct16-Dec16 Oct17-Dec17
In $
Mil
lions
-.7% O-D 16vs17
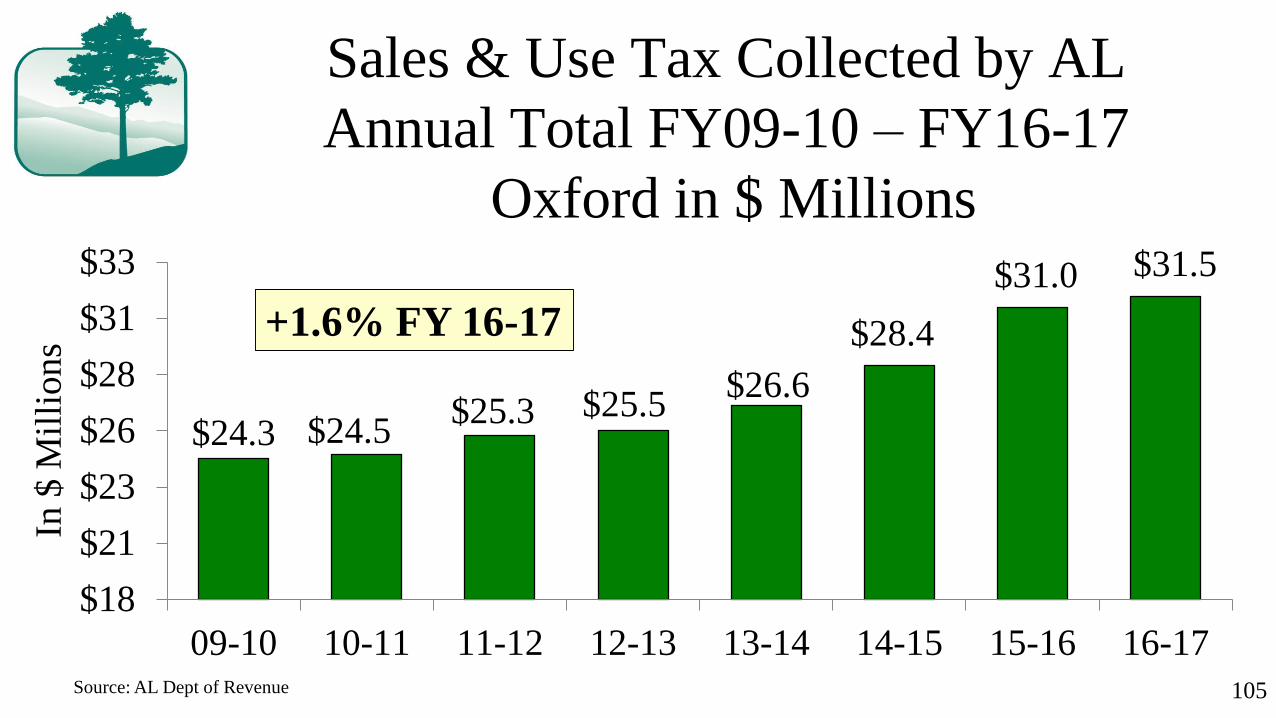
Sales & Use Tax Collected by AL
Annual Total FY09-10 – FY16-17
Oxford in $ Millions
$24.3 $24.5$25.3 $25.5
$26.6
$28.4
$31.0 $31.5
$18
$21
$23
$26
$28
$31
$33
09-10 10-11 11-12 12-13 13-14 14-15 15-16 16-17
In $
Mil
lio
ns
105
+1.6% FY 16-17
Source: AL Dept of Revenue
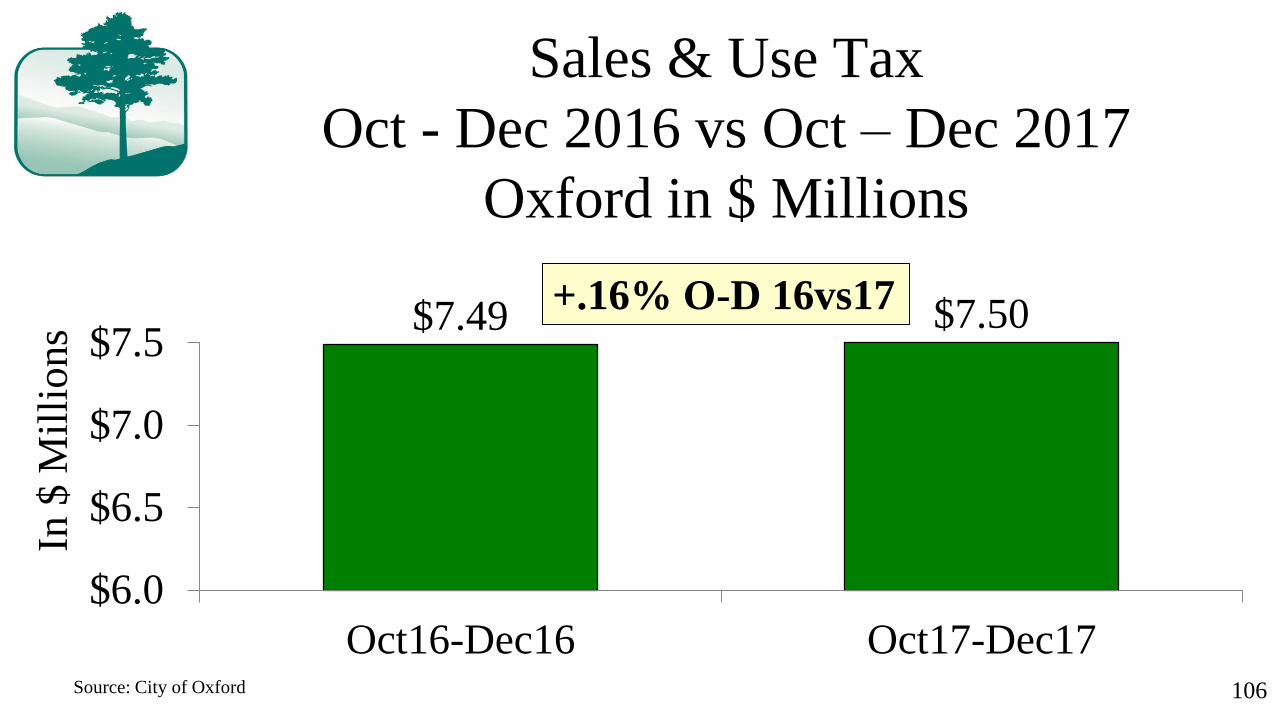
Sales & Use Tax
Oct - Dec 2016 vs Oct – Dec 2017
Oxford in $ Millions
$7.49 $7.50
$6.0
$6.5
$7.0
$7.5
Oct16-Dec16 Oct17-Dec17
In $
Mil
lions
106Source: City of Oxford
+.16% O-D 16vs17

Sales & Use Tax
Annual Total FY09-10 – FY16-17
Jacksonville in $ Millions
$5.3$5.5
$6.5$6.8
$7.0 $7.0$7.3 $7.3
$4.5
$5.5
$6.5
$7.5
09-10 10-11 11-12 12-13 13-14 14-15 15-16 16-17
In $
Mil
lio
ns
107Source: City of Jacksonville
+.46% FY 16-17

Sales & Use Tax FYTD
Oct - Dec 2016 vs 2017
Jacksonville in $ Millions
$1.919$1.937
$1.80
$1.90
$2.00
Oct16-Dec16 Oct17-Dec17
In $
Mil
lio
ns
108
+0.9% O-D 16vs17
Source: City of Jacksonville

Sales & Use Tax
Annual Total FY09-10 - FY16-17
Ohatchee in $ Thousands
$444
$534
$489
$550 $545$571
$549
$618
$400
$450
$500
$550
$600
$650
09-10 10-11 11-12 12-13 13-14 14-15 15-16 16-17
In $
Thou
san
ds
109Source: City of Ohatchee
+12.6% FY 16-17

Sales, Use & Lodging Tax
Annual Total FY09-10 – FY16-17
Piedmont in $ Millions
$1.37 $1.36$1.45 $1.46 $1.46
$1.75
$1.89 $1.91
$1.3
$1.4
$1.5
$1.6
$1.7
$1.8
$1.9
$2.0
09-10 10-11 11-12 12-13 13-14 14-15 15-16 16-17
In $
Mil
lion
s
110Source: City of Piedmont
+.97% FY 16-17
*
*1% tax increase Jan 1, 2015
*

Sales, Use & Lodging Tax
Oct - Dec 2016 vs Oct – Dec 2017
Piedmont in $ Thousands
$458
$397
$350
$400
$450
$500
Oct16-Dec16 Oct17-Dec17
In $
Th
ou
sands
111Source: City of Piedmont
-13.35% O-D 16vs17

Sales, Use Tax
Annual Total FY09-10 – FY16-17
Weaver in $ Thousands
$245 $234
$289
$343
$444
$571 $555$594
$200
$300
$400
$500
$600
09-10 10-11 11-12 12-13 13-14 14-15 15-16 16-17
In $
Thou
san
ds
112Source: City of Weaver
+7.07% FY 16-17

Sales, Use & Lodging Tax
Oct - Dec 2016 vs Oct – Dec 2017
Weaver in $ Thousands
$144.52
$175.74
$80
$100
$120
$140
$160
$180
Oct16-Dec16 Oct17-Dec17
In $
Th
ou
sands
113Source: City of Weaver
+21% O-D 16vs17
114
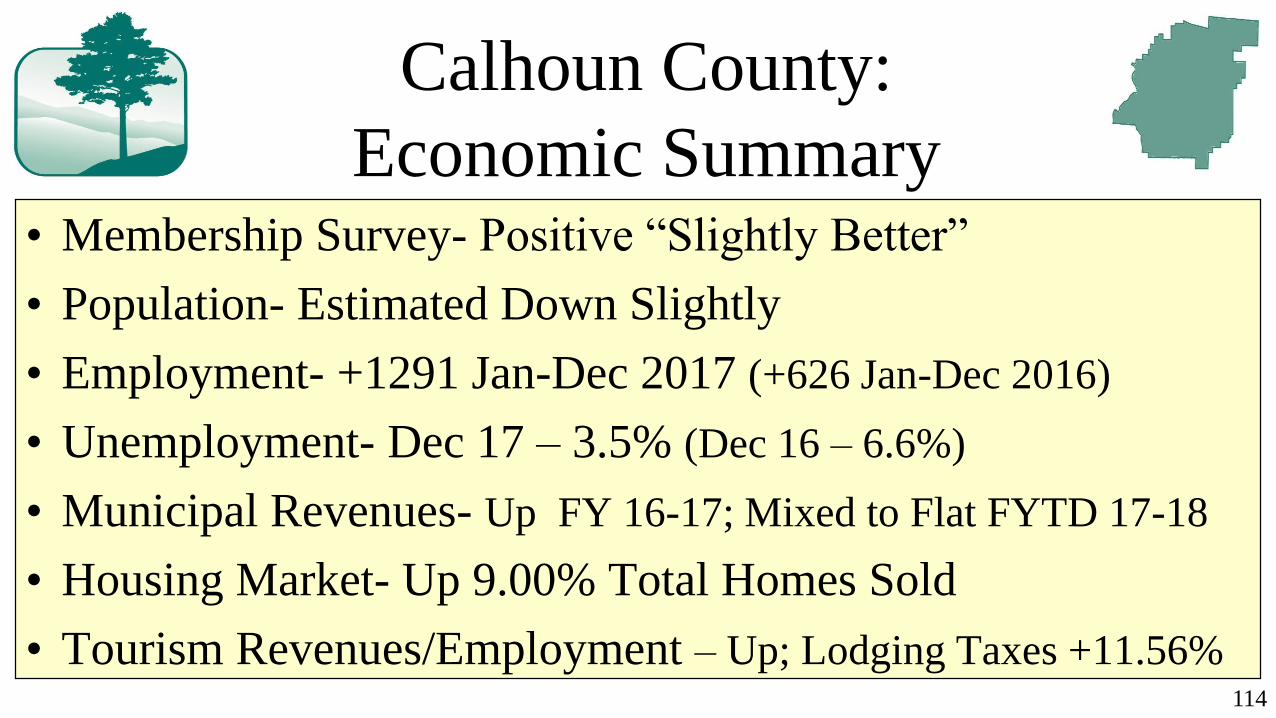
Calhoun County:
Economic Summary• Membership Survey- Positive “Slightly Better”
• Population- Estimated Down Slightly
• Employment- +1291 Jan-Dec 2017 (+626 Jan-Dec 2016)
• Unemployment- Dec 17 – 3.5% (Dec 16 – 6.6%)
• Municipal Revenues- Up FY 16-17; Mixed to Flat FYTD 17-18
• Housing Market- Up 9.00% Total Homes Sold
• Tourism Revenues/Employment – Up; Lodging Taxes +11.56%

New & Expanding
Industries 2017
Near Atlanta, Near Birmingham,
Near Perfect
Calhoun County
Economic Development Council
115

• 40 new jobs
• $4.5 million
investment
116

Vehicle Innovation Center
$25 million investment
117

• $250,000 investment
• 25 new jobs
STRYKER
118
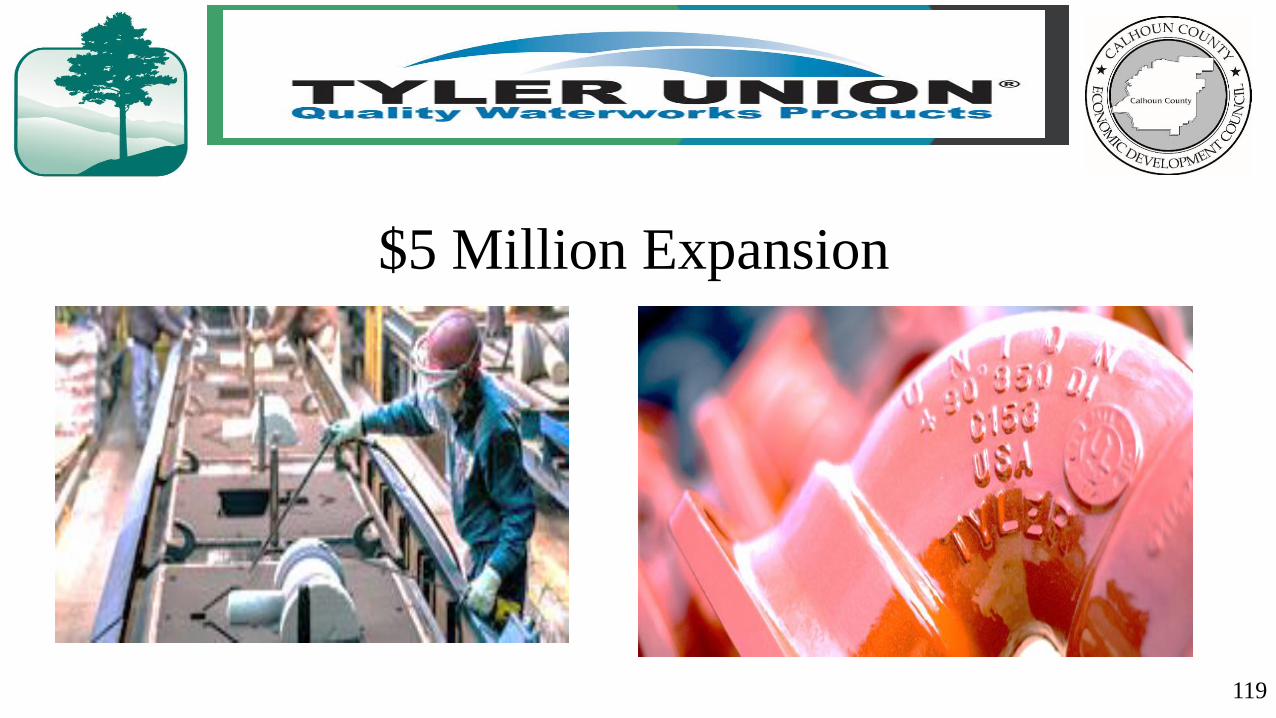
$5 Million Expansion
119

• 150 new jobs!
120

$5.4 million
Investment
121
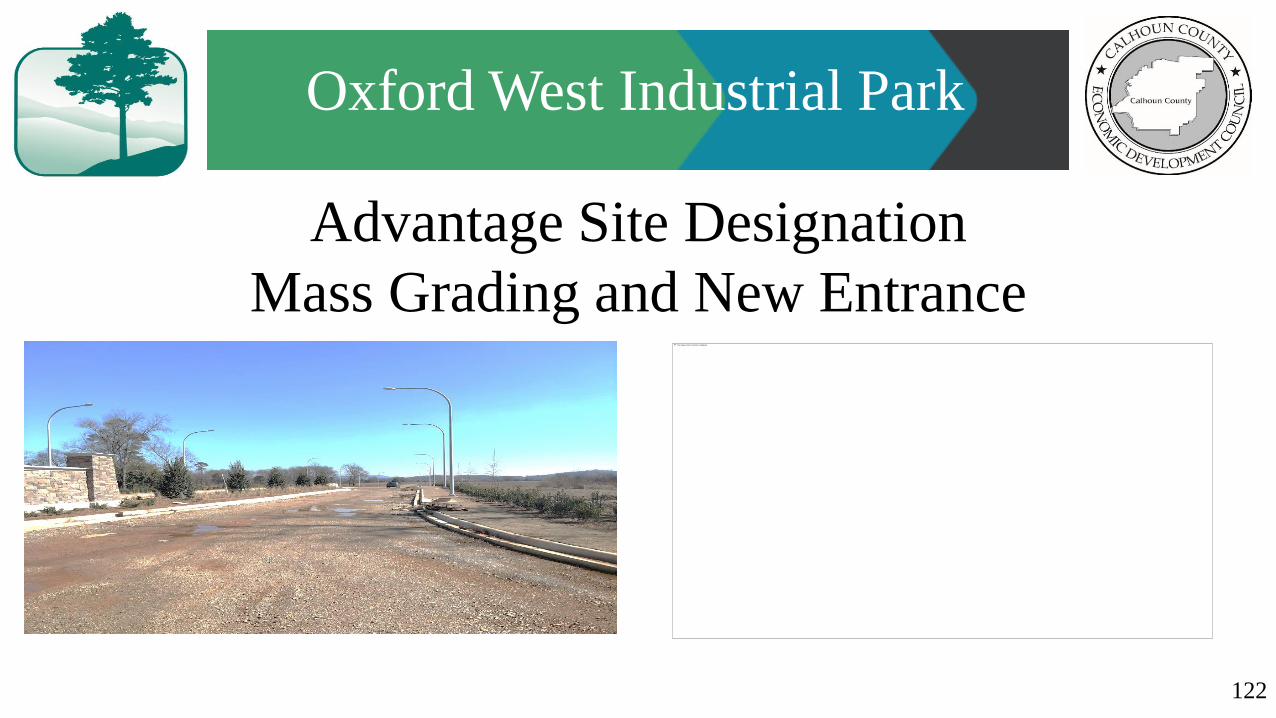
Advantage Site Designation
Mass Grading and New Entrance
Oxford West Industrial Park
122

Five Years
$610 million
in new
investment
Over 2000
new jobs!
Calhoun County
Economic Development Council
Industrial
Parks
123

Near Atlanta, Near Birmingham,
Near Perfect
Calhoun County
Economic Development Council
124

125
Calhoun County:
Economic Summary• Membership Survey- Positive “Slightly Better”
• Population- Estimated Down Slightly
• Employment- +1291 Jan-Dec 2017 (+626 Jan-Dec 2016)
• Unemployment- Dec 17 – 3.5% (Dec 16 – 6.6%)
• Municipal Revenues- Up FY 16-17; Mixed to Flat FYTD 17-18
• Housing Market- Up 9% Total Homes Sold
• Tourism Revenues/Employment – Up; Lodging Taxes +11.6%