2018 corwin - uk.sagepub.com · in the ccss-m standard 8.f.a.1, students defined a function as a...
TRANSCRIPT

Part 4
Functions
Copyri
ght C
orwin
2018

Conceptual Category Overview
Students have been working toward a conceptual understanding of function throughout their mathematics studies in previous years. Work on function concepts begins as early as kindergarten by looking at patterns and creating verbal or pictorial rules for “what comes next.” As students progress, they continue work with patterns and also explore sequences—not only writing verbal rules but also symbolic rules for missing terms. Numerical patterns and sequences allow use of multiple representations, including tables, graphs, sets of numbers, or pictures. For example, the Progressions for the Common Core State Standards in Mathematics (2013) shows examples of students generalizing arithmetic and using tables, methods that are extended when studying functions. Underlying all of this work is the concept of using an input (such as the first term or the nth term) and pairing it with an output. That is, students come to understand a function as a situation in which “one quantity determines another” (CCSS-M, 2010, p. 67). The progression nears its culmination in Grades 6 and 7, in which students consider ratio and proportions, as well as the different representations for them, linking ideas such as rate of change of dependent and independent variables and co-variation of quantities. Finally, in Grade 8, function is formally defined as a rule that assigns to each input exactly one output. In high school, students continue
to interpret functions (starting with direct variation and linear cases), build functions, and expand their known families of functions and the traits that characterize them.
In this conceptual area, the first two domains deal with the concepts of understanding and creating functions. In the domain Interpreting Functions (F.IF) students use the domain and range of a function, function notation, and different representations of functions, such as recursive definitions. For the domain Building Functions (F.BF), students model the relationship between two differing quantities and make new functions from those that are known, for example, using transformations on f(x) = x2.
In the remaining domains, students examine specific families of functions with which they continue to build understanding. The domain Linear, Quadratic, and Exponential Functions (F.LE) contains standards that distinguish among the three types of functions and that use the functions to model situations. The domain Trigonometric Functions (F.TF) requires students to build on prior work with trigonometry by extending the domain of inputs to the Real numbers (using the unit circle) by connecting to the ideas of periodic functions and by using mathematical structure to apply and use trigonometric identities.
Functions
142 The Common Core Mathematics Companion: The Standards Decoded, High School
Copyri
ght C
orwin
2018
Part 4 | Functions 143
Direct Connections to Functions in the Middle Grades
As mentioned previously, the functions conceptual category at the high school level builds on initial understandings of functions that should be built in Grade 8. The primary definition of function as a rule pairing a single independent or input value with a unique dependent or output value is still used but will now include the terminology of domain and range (8.F.A.1). Students should have gained a basic understanding of what a function is, with a primary focus on linear equations. They are able to represent and interpret linear functions in various ways (8.F.A.2 and 8.F.B.4), including using graphs, tables, and symbols, as well as verbal descriptions. They should be able to construct and
interpret a function to model a linear relationship between two functions and be able to analyze a relationship based on its graph (8.F.A.2, 8.F.A.3), as well as relate functions to contextual problems (8.F.B.5).
At the high school level, a far broader range of functional relationships beyond linear relationships is explored, including exponential, quadratic, polynomial, trigonometric, and many others. Additionally, more functions are more formally defined and used. However, the basic building blocks from Grade 8 serve as a useful foundation for the study of functions at the high school level.
SUGGESTED MATERIALS
F.IF F.BF F.LE F.TF
✓ ✓ CAS (Computer Algebra System)
✓ ✓ ✓ ✓ Dynamic graphing technology (i.e., graphing calculators and software)
✓ ✓ Spreadsheet technology
FUNCTIONS—OVERARCHING KEY VOCABULARY
F.IF F.BF F.LE F.TF
✓ ✓
End behavior – The values the dependent variable approaches as the independent variable approaches either negative or positive infinity. Graphically, end behavior refers to the values the graph is approaching, for example, a function that has a horizontal asymptote will be approaching a single y-value. A function that grows without bound can be said to be growing or moving toward infinity; as for g(x) = x2, as x approaches negative infinity, g(x) approaches positive infinity (that is where the function tends as x decreases without bound).
✓ ✓ ✓ ✓ Function notation – Use of f(x) notation to define a function.
✓ ✓ ✓Parameter – g(x) = ax2 + b is an example of a function where a and b are real numbers and are parameters. Different values of the parameters affect the behavior of the function.
✓ ✓Symmetry (odd or even functions) – A function is even symmetric about the y-axis—if f(x) = f(−x). A function is odd if f(x) = −f(−x)—that is, it is symmetric about the origin.
Copyri
ght C
orwin
2018

144 The Common Core Mathematics Companion: The Standards Decoded, High School
Interpreting Functions (F.IF)
Domain OverviewThe standards in F.IF focus on understanding the concept of function and how to use proper notation for functions, as well as understanding functions in terms of a context and analyzing functions using multiple interpretations. The terms domain and range are used to establish function notation—that is, if x is an element of the domain, or set of input values, then f(x) is the corresponding element of the range, or set of output values. When using a function in an application, students consider the key components of the function from graphs and tables, such as relative extreme values and the rate of change over given intervals. Students investigate different families of functions to determine properties, such as zeros and symmetry, using symbols, tables, and graphs for each family.
In the CCSS-M standard 8.F.A.1, students defined a function as a rule pairing exactly one input value with exactly one output value. This definition is refined by including the terminology domain and range and is expanded by using notation specific to functions (that is, f(x) notation) using new ways to consider functions (sequences and recursion). Students consider the key facets of a graph, such as average rate of change and intercepts, expanding on their studies about linear graphs from 8.F.B.4. Additionally, students continue to use multiple representations of functions as introduced in 8.F.B.4.
F.IF—KEY VOCABULARY
F.IF.A F.IF.B F.IF.C
✓Average rate of change – The rate of change (or slope) between two designated points of a function (i.e., the rate of change over an interval).
✓ ✓ Domain – The set of input values for a function.
✓
End behavior – The values a function takes on as x tends to infinity or negative infinity. For example, for g(x) = x2, as x approaches negative infinity, g(x) approaches positive infinity (that is where the function tends as x decreases without bound). A function that
has a horizontal asymptote will be approaching a single y-value, such as
2
211
= −+
y xx
, which
approaches a y-value of 1 as x tends to infinity.
✓Families of functions – A set of functions generated by changing the parameters for a particular type of function; examples include absolute value, cubic, exponential, linear, logarithmic, piecewise, polynomial, quadratic, step, and trigonometric functions.
✓Periodicity – A property of a function where the range values of a function repeat for equal-sized intervals of the domain. The length of the equal-sized intervals is the period.
✓ ✓ Range – The set of output values for a function.
✓
Recursively defined function – A function that is defined using its previous terms. To calculate the fifth term in a recursively defined function, the previous four terms must be defined. The Fibonacci sequence can be recursively defined as each term is the sum of the previous two terms. Initial values must be defined to provide a starting point for the sequence. For the Fibonacci sequence, the first two terms are generally 1.
✓Sequence – A function whose domain is a subset of the integers. 1, 4, 9, 16, . . . is an infinite sequence that can be described by an = n2.
Copyri
ght C
orwin
2018

Part 4 | Functions 145
Functions | Interpreting FunctionsF.IF.A
Cluster A
Understand the concept of a function and use function notation.
STANDARD 1 F.IF.A.1: Understand that a function from one set (called the domain) to another set (called the range) assigns to each element of the domain exactly one element of the range. If f is a function and x is an element of its domain, then f(x) denotes the output of f corresponding to the input x. The graph of f is the graph of the equation y = f(x).
STANDARD 2 F.IF.A.2: Use function notation, evaluate functions for inputs in their domains, and interpret statements that use function notation in terms of a context.
STANDARD 3 F.IF.A.3: Recognize that sequences are functions, sometimes defined recursively, whose domain is a sub-set of the integers. For example, the Fibonacci sequence is defined recursively by f(0) = f(1) = 1, f(n + 1) = f(n) + f(n − 1) for n ≥ 1.
Cluster A: Understand the concept of a function and use function notation.Past student work includes examining sets of numbers, shapes, and/or patterns; predicting values in the sets; and describing ways to define the sets. This work led to the concept of a correspondence between some input and output (e.g., the first term is a triangle, the second term is a quadrilateral, and so forth). The situations may or may not have been functions and may not have had more than one representation. With the study of lines arising from data or in graphs, students moved closer to the concept of function, though the terminology was not formalized.
Now, students understand the meaning of a function to be a correspondence between one element of the domain or set of input values and one element of the range or set of output values. Students use function notation fluidly and flexibly, including use in contexts, sequences, and recursively defined functions.
Standards for Mathematical PracticeSFMP 1. Make sense of problems and persevere in solving them.SFMP 2. Use quantitative reasoning.SFMP 3. Construct viable arguments and critique the reasoning of others.SFMP 4. Model with mathematics.SFMP 5. Use appropriate tools strategically.SFMP 6. Attend to precision.SFMP 7. Look for and make use of structure.SFMP 8. Look for and express regularity in repeated reasoning.
Students use functions in contexts, such as part of problem solving. Creating rules that describe sequences and vice versa requires quantitative reasoning. The proper use of vocabulary and symbols is a key component of the study of functions as well, such as in using function notation and describing different characteristics of graphs. In previous grades, students have used y = symbolic rule notation, making this the first experience with f(x) notation. Because there are differing equivalent forms of functions, students must not only justify their own processes when describing functions but listen carefully to how others make sense of the same function. SFMP 5 is strengthened when students use different ways to write and describe functions, such as using by-hand methods or technology to create a graph. Students have the opportunity to consider both structure, such as recogniz-ing the similarities and differences between the graphs of y = |x| and x = |y|, and repeated reasoning, such as when working with recursively defined functions or spreadsheets.
Related Content StandardsF.IF.B.5 A.REI.D.10 8.F.A.1
Copyri
ght C
orwin
2018
146 The Common Core Mathematics Companion: The Standards Decoded, High School
STANDARD 1 (F.IF.A.1)
Understand that a function from one set (called the domain) to another set (called the range) assigns to each element of the domain exactly one element of the range. If f is a function and x is an element of its domain, then f(x) denotes the output of f corresponding to the input x. The graph of f is the graph of the equation y = f(x).
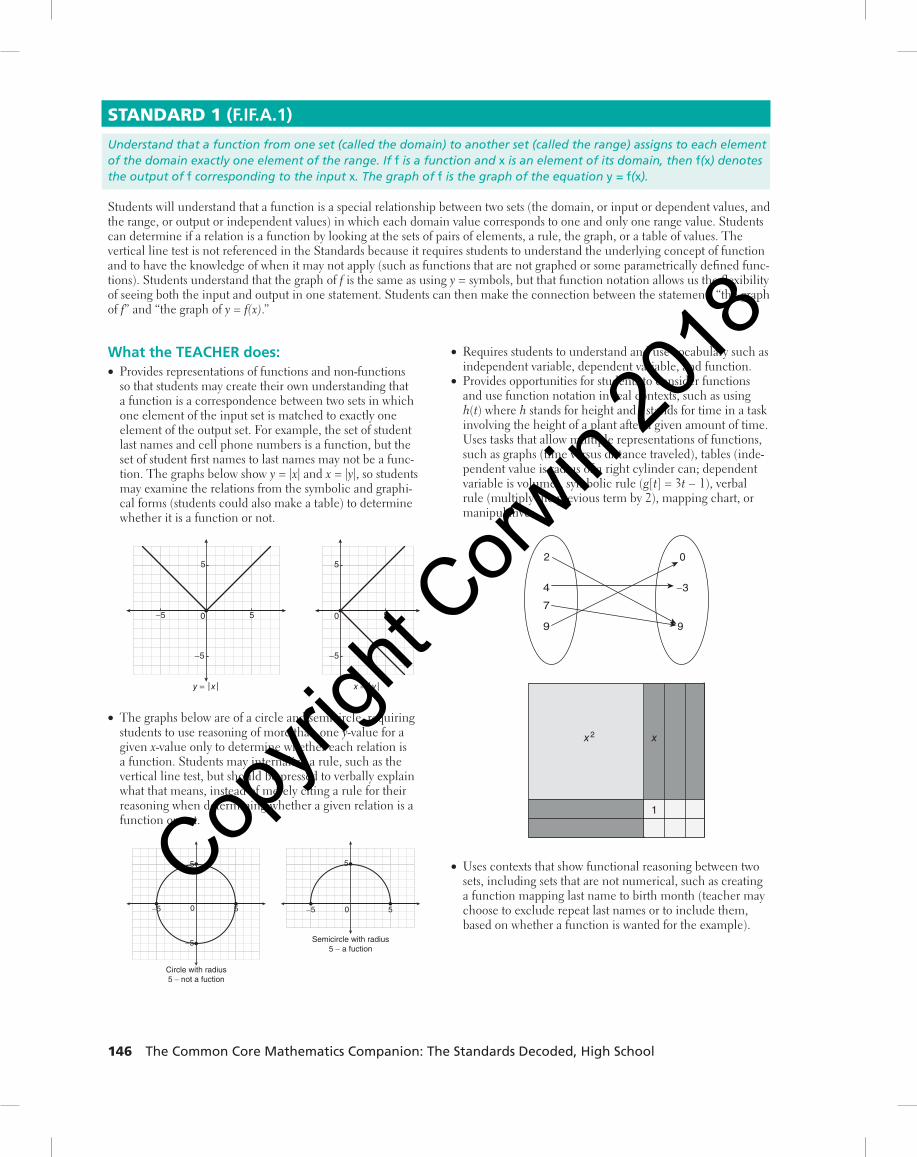
Students will understand that a function is a special relationship between two sets (the domain, or input or dependent values, and the range, or output or independent values) in which each domain value corresponds to one and only one range value. Students can determine if a relation is a function by looking at the sets of pairs of elements, a rule, the graph, or a table of values. The vertical line test is not referenced in the Standards because it requires students to understand the underlying concept of function and to have the knowledge of when it may not apply (such as functions that are not graphed or some parametrically defined func-tions). Students understand that the graph of f is the same as using y = symbols, but that function notation allows us the flexibility of seeing both the input and output in one statement. Students can then make the connection between the statements “the graph of f” and “the graph of y = f(x).”
What the TEACHER does: • Provides representations of functions and non-functions so that students may create their own understanding that a function is a correspondence between two sets in which one element of the input set is matched to exactly one element of the output set. For example, the set of student last names and cell phone numbers is a function, but the set of student first names to last names may not be a func-tion. The graphs below show y = |x| and x = |y|, so students may examine the relations from the symbolic and graphi-cal forms (students could also make a table) to determine whether it is a function or not.
5
50
y = x x = y
−5
−5
5
50
−5
• The graphs below are of a circle and semicircle, requiring students to use reasoning of more than one y-value for a given x-value only to determine whether each relation is a function. Students may internalize a rule, such as the vertical line test, but should be pressed to verbally explain what that means, instead of merely citing a rule for their reasoning when determining whether a given relation is a function or not.
5
50
Circle with radius5 − not a fuction
Semicircle with radius5 − a fuction
−5
−5
5
50−5
• Requires students to understand and use vocabulary such as independent variable, dependent variable, and function.
• Provides opportunities for students to consider functions and use function notation in real contexts, such as using h(t) where h stands for height and t stands for time in a task involving the height of a plant after a given amount of time.Uses tasks that allow multiple representations of functions, such as graphs (time versus distance traveled), tables (inde-pendent value is radius of a right cylinder can; dependent variable is volume), symbolic rule (g[t] = 3t − 1), verbal rule (multiply the previous term by 2), mapping chart, or manipulatives.
2
4
7
9
−3
9
0
1
x2 x
• Uses contexts that show functional reasoning between two sets, including sets that are not numerical, such as creating a function mapping last name to birth month (teacher may choose to exclude repeat last names or to include them, based on whether a function is wanted for the example).
Copyri
ght C
orwin
2018

Part 4 | Functions 147
What the STUDENTS do: • Recognize a function as a correspondence between one input value and one output value.
• Explain, in their own words, what a function is, using cor-rect vocabulary.
• Create examples of what is and what is not a function using different representations, including graphs, tables, symbols, and contexts.
• Make the connection between the notation f(x) and y = f(x), especially graphically.
• Use functions and function notation to describe contextual situations (numerical and non-numerical).For example, given a function, c, that models the cost in dollars of floor-ing based on the number of square feet used, explain what each of these statements means:c(100) = $430c(a) = $1,000c(650) = b
Addressing Student Misconceptions and Common Errors
Students frequently confuse the concept of each domain value being paired with one range value as also meaning each range value can only have one domain value. One way to illustrate this is to have at least 13 students match their names with their birth months. Every student will have exactly one birth month, but at least one month will be chosen twice. Students should consider if this is a function. This can also be seen in a table or in a diagram with arrows connecting the input and output. Though in-verses are not a topic here, students can then consider the relationship between birth months and students. Not only will this not be a function, but it is an example of determining if a relation is a function that does not let the students fall back on a rule, such as the vertical line test, but instead requires understanding of what a function is.
Connections to Modeling
A time plot in statistics will model a relationship and will be a function. This allows students to spot trends across time. Some scatterplots may also be functions, but not all sets of bivariate data are functions. Students can determine if data are a function and can also determine functions that model the data.
Computer coding implies use of functions within its syntax (e.g., a set of steps in a loop uses an input to produce an output and then goes back in the loop for the next input).
Related Content StandardsF.IF.A.2 F.IF.A.3 8.F.A.1
Notes
Copyri
ght C
orwin
2018

148 The Common Core Mathematics Companion: The Standards Decoded, High School
STANDARD 2 (F.IF.A.2)
Use function notation, evaluate functions for inputs in their domains, and interpret statements that use function notation in terms of a context.
Students practice with function notation so they acquire fluency with it. Using a context, such as having d stand for a distance function relating miles and time in hours lets students view d(5) = 105 as the distance traveled at time 5 hours is 105 miles. Students read this as “d of 5” and interpret d(5) to stand for the output value of the function, whether it is evaluated or not.
Students can use graphing technology to explore expressions for functions such as g(x) + 4 or h(x − 1) to gain facility with func-tion notation. This is especially helpful to build students’ understanding that function notation is not an arithmetic operation—that is, it does not indicate multiplication or the possibility of the distributive property.
What the TEACHER does: • Gives tasks that allow students to use function notation in different contexts, such as explicitly defined functions, recursively defined functions, and functions used in a modeling situation.
• Asks students to evaluate and differentiate functions using varying inputs, such as discrete sets (whole numbers), con-tinuous sets (Real numbers), or symbols and/or expressions, such as ƒ(x + 1).
• Questions students about the meaning of function notation in contextual problems.
• Provides prompts that ask students to determine f(3) using a graph, table, or symbolic form of the function y = f(x).
• Provides prompts that ask students to determine x if f(x) = 3 using a graph, table, or symbolic form of the function y = f(x).
What the STUDENTS do: • Flexibly use different ways to describe functions including y = and f(x) = notations, graphs, and tables.
• Explain how different domains are represented when evalu-ating functions (a function of number of pennies to values would be a discrete set of points while distance traveled versus time is continuous).
• Construct justifications for their uses of function notation and listen to and critique the justifications of other students.
• Determine the x when given f(x) = a specific value using multiple representations. Determine f(a given input) using multiple representations.
• Differentiate between the arithmetic of functions and trans-formations of functions. For example, f(x) = 3x + 1 and g(x) = 4x − 2 allows computation of f(x) + g(x), whereas 3 + f(x) creates a vertical translation of the graph of f.
Addressing Student Misconceptions and Common Errors
Students may interpret the notation of g(3) to mean “g times 3.” Students can work with tables and graphs to see how these differ. Quantities such as h(x − 2), h(x) − h(2), 4k(x) + 3, and the like should also be explored graphically so that students make their own correct generalizations about function notation and how it works.
Students frequently think that all functions must use the symbols ƒ, x, and y. Connecting variable and function names to dif-ferent contexts, such as d(t) = 30t to express the distance covered by a car averaging 30 mph, is one way to get students to think beyond the use of ƒ, x, and y. A graph of this function may have axes labeled as t for time in hours and d(t) (or in shorthand, d) as distance in miles. Using rates on the axis with appropriately related units, such as miles per hour on the y-axis and hours on the x-axis, may also lead to interesting contextual descriptions of area below the function and rates of change of the function. In the previously stated case, the area below the function from one given value of x to another value would represent the distance trav-eled in miles. The rate of change at a given x value would represent the acceleration at that point, miles
hour2.
Students can use technology to evaluate functions with different domains. Using a graphing calculator, students can evaluate a function with different inputs. Students who may be confused by the differences between a continuous domain or range can experiment with technology to see examples of each.
For a TI graphing calculator, it is Y1 = x + 1/(0 < x and x < 4), or for Desmos, y = x + 1{0 < x < 4} gives a continuous line segment.
Using Y1 = x + 1 and then a home screen command of Y1({1, 2, 3}) results in {2, 3, 4}. On Desmos, students can make a table of values to get a scatterplot.
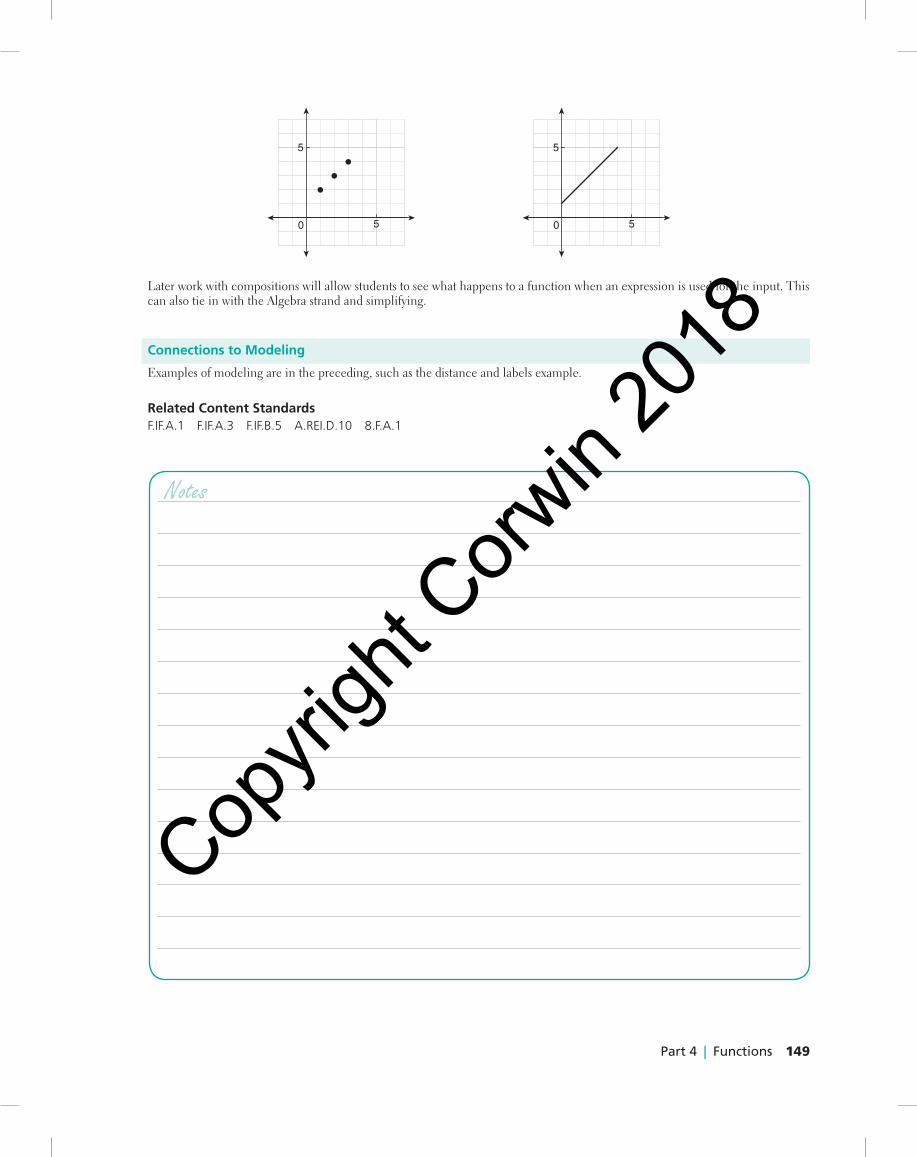
Students can “turn off” the Y1 function and then do a scatterplot of L1 = 2, 3, 4 and L2 = Y1(L1) to get a graph of the points only. By considering what each graph represents and how the different inputs and outputs relate to each other, a meaningful conversation about the commonalities and differences among the representations is possible. The first figure below represents the discrete graph of the set of points while the second figure shows the continuous graph for the same interval on the x-axis.
Copyri
ght C
orwin
2018
Part 4 | Functions 149
5
50
5
50
Later work with compositions will allow students to see what happens to a function when an expression is used for the input. This can also tie in with the Algebra strand and simplifying.
Connections to Modeling
Examples of modeling are in the preceding, such as the distance and labels example.
Related Content StandardsF.IF.A.1 F.IF.A.3 F.IF.B.5 A.REI.D.10 8.F.A.1
Notes
Copyri
ght C
orwin
2018

150 The Common Core Mathematics Companion: The Standards Decoded, High School
STANDARD 3 (F.IF.A.3)
Recognize that sequences are functions, sometimes defined recursively, whose domain is a subset of the integers. For example, the Fibonacci sequence is defined recursively by f(0) = f(1) = 1, f(n + 1) = f(n) + f(n − 1) for n ≥ 1.
Students will understand there can be special types of function notation used for sequences and recursive functions. For a geometric sequence that is defined recursively, students may see an = an − 1 r , where n is the index or term number, and an − 1 stands for the previous term of the function, as well as more standard notation such as g(n) = g(n − 1)r. It is helpful to provide examples to help students see sequences as a set of range values with an index from the integers—a first term, second term, third term, and so forth. For example, a sequence can be written as an = n + 1, so that a1 = 2, a2 = 3, . . . , a6 = 7, and so on. Tables are frequently used to investigate sequences.
What the TEACHER does: • Asks students to create explicit function rules for a se-quence, such as the set of perfect squares.
• Asks students to create recursive rules for a sequence, such as a linear set of points.
• Asks students to compare and contrast both explicit and recursive forms of a function when possible.
What the STUDENTS do: • Write the specified terms for a sequence, defined explicitly. • Write the specified terms for a recursively defined sequence.
• Compare the work for finding terms from both forms of the functions, when possible.
• Find an explicit or recursive rule for a sequence. • Explain the differences and similarities between explicitly and recursively defined functions.
Addressing Student Misconceptions and Common Errors
Students may use different notations such ƒ(n + 1) = ƒ(n) + d, Next = Now + difference, or an = an − 1 + d interchangeably. Practice with all f(n) notation, Next/Now notation, and an may be helpful in creating fluency for different contexts and for build-ing connections between the concepts of functions and sequences.
Students may have difficulty differentiating between finding a specified term for an explicitly defined function, for example, “Find the 12th term of the sequence an = a + 3(n − 1) when a = 2,” and a recursively defined function, “Find the 12th term of the sequence an = an − 1 + 3 when a1 = 2.” Students should have practice writing out sets of terms for each sequence, comparing their calculations, and then generalizing what they have done. Tables are a good way to organize their work.
Students can compare Next = Now + 3 with a first term of 0 and a(n) = 3(n − 1) for a given set of consecutive whole numbers, such as {1, 2, 3, 4, . . . }. The results are the same: the sequence {3, 6, 9, 12, . . . }. The teacher asks questions about what the strength of each representation is, how the graphs would look, and what a table shows to enable students to contrast the explicit and recursive forms. This can tie into later work differentiating between linear and exponential functions as well.
Connections to Modeling
The understanding of recursively defined functions may occur in the modeling sequence.
Related Content StandardsF.IF.A.1 F.IF.A.2 F.BF.A.3 F.LE.A.2
Notes
Copyri
ght C
orwin
2018

Part 4 | Functions 151
Functions | Interpreting FunctionsF.IF.B
Cluster B
Interpret functions that arise in applications in terms of the context.
STANDARD 4 F.IF.B.4: For a function that models a relationship between two quantities, interpret key features of graphs and tables in terms of the quantities, and sketch graphs showing key features given a verbal description of the relationship. Key features include: intercepts; intervals where the function is increasing, decreasing, positive, or negative; relative maximums and minimums; symmetries; end behavior; and periodicity.★ (The ★ denotes a standard that connects with modeling).
STANDARD 5 F.IF.B.5: Relate the domain of a function to its graph and, where applicable, to the quantitative relation-ship it describes. For example, if the function h(n) gives the number of person-hours it takes to assemble n engines in a factory, then the positive integers would be an appropriate domain for the function.★
STANDARD 6 F.IF.B.6: Calculate and interpret the average rate of change of a function (presented symbolically or as a table) over a specified interval. Estimate the rate of change from a graph.★
Cluster B: Interpret functions that arise in applications in terms of the context.In previous grades, students made connections between graphs of direct variations and the ordered pairs that described a propor-tion. Similar triangles were used as “slope triangles” to further ideas about unit rates and rates of change. Statistics work with bivariate data also connected ideas about rate of change to linear graphs. Additionally, students were able to make a graphical and/or symbolic model to describe data. In Grades 9–12, students now explore and explain the relationships defined by func-tions that arise from modeling. Using multiple representations (including graphs, tables, and symbols), students determine an appropriate domain and range and then describe important behaviors of the function in the context of the model.
For the Grade 8 Function standard 8.F.A.1, students worked with input and output, which they continue to use here with do-main and range. Additionally, with standard 8.F.B.4, students considered rate of change for linear functions and related the rate of change and initial value to contextual problems. Now, students look at average rate of change for any function and look at key values (besides the initial value) when interpreting functions.
Standards for Mathematical PracticeSFMP 1. Make sense of problems and persevere in solving them.SFMP 2. Use quantitative reasoning.SFMP 3. Construct viable arguments and critique the reasoning of others.SFMP 4. Model with mathematics.SFMP 5. Use appropriate tools strategically.SFMP 6. Attend to precision.SFMP 7. Look for and make use of structure.SFMP 8. Look for and express regularity in repeated reasoning.
Students use functions in problem-solving contexts and especially use the key features when considering such questions as average rate of change or extrema. Contextual applications connect functions and the features of their graphs with modeling and quantitative reasoning. The proper use of vocabulary and symbols is important when using function notation and describing different characteristics of graphs. SFMP 5 is applied when students use multiple representations flexibly, which includes tools such as writing values in a table by hand or using a graphing capability to investigate functions. Students use structure to general-ize about the key features of a given function and how those features relate to other functions, such as investigating extrema of quadratic functions. Repeated reasoning arises when students look at recursively defined functions and when using a process to find a rate of change over different intervals.
Related Content StandardsNQ.A.1 NQ.A.2 F.IF.A.2 F.IF.C.7 F.IF.C.8 F.IF.C.9 F.LE S.ID.C.7 8.F.A.1 8.F.B.4
Copyri
ght C
orwin
2018

152 The Common Core Mathematics Companion: The Standards Decoded, High School
STANDARD 4 (F.IF.B.4)
For a function that models a relationship between two quantities, interpret key features of graphs and tables in terms of the quantities, and sketch graphs showing key features given a verbal description of the relationship. Key features include: intercepts; intervals where the function is increasing, decreasing, positive, or negative; relative maximums and minimums; symmetries; end behavior; and periodicity.★
Students attain conceptual understanding of the key features of a function by focusing on graphs and tables of the related quantities.
What the TEACHER does: • Asks students to make and to explain connections among a table of function values, the graph of a function, a sym-bolic representation of a function, and a verbal description of the relationship between two quantities in a function. For example, for the graph of f(x) = (x − 1)2, have one stu-dent in a dyad make a graph and the other student make a table. Each student finds the extreme value, (1, 0) in this case, and the interval of increasing, that is x > 1, and the interval of decreasing, x < 1. And then, the students compare their work and explain to each other how the table and graph relate. Students can also explain the end behavior. (The function tends to positive infinity on both ends of the domain.)
• Uses tasks that ask the students to find and explain the meaning of intercepts; intervals where the function is in-creasing, decreasing, positive, or negative; relative maxi-mums and minimums; symmetries; end behavior; and/or periodicity in the context of the task. Graphs and tables may allow the exploration of non-polynomial functions and higher degree polynomial functions than a symbolic representation. Students may discuss the possible degrees of the polynomial, the zeros, and end behavior, as well as intervals of increasing and decreasing, in the following figure.
0 2−2
−2
2
• Requires students to explain their reasoning when identify-ing a key feature of a graph.
What the STUDENTS do: • Flexibly use different representations of functions, espe-cially graphs, tables, and symbols.
• Find and interpret key features of the graphs and tables of a function, such as extreme values, end behavior, and intervals of increase and decrease.
• Given a graph, describe a context that fits the graph, and explain why it does.
• Given a context, create an approximation a graph that could model the context, and explain why it does.
Addressing Student Misconceptions and Common Errors
Students may not see the connections among different representations of a function. Having tasks where the different representa-tions are compared and where each representation may be useful in answering questions about the function will be helpful, as in the following task:
A student launches a model rocket from a launch pad. Suppose the height of the rocket is modeled by
h(t) = −4.9t2 + 40t + 2 where h = height in meters, t = time in seconds.
Copyri
ght C
orwin
2018

Part 4 | Functions 153
0
t(seconds)
h(t)(meters)
12
34
5
67
8
2
37.162.4
77.983.6
79.5
65.636.3
8.4
What is the initial height of the rocket? Of the three representations, the table shows 2 m the most easily, but then, students can be asked to show how the 2 m height is depicted in the other two representations.
What is the initial speed? The symbolic form tells us it is 40 m/s.
What is the maximum height? The graph shows it is about 83.7 meters—a little bit more than the table shows. Since the maxi-mum is a bit to the right of the line x = 4, students can see that the table gives a good estimate but that the graph allows a bit more accuracy. Alternatively, they could create a new table going from 3.5 to 4.5 by tenths to better estimate the maximum.
Similar questions such as, “For what interval is the rocket above 20 m?” “How long is the rocket in the air?” and “What is the coefficient of gravity?” can show more connections among the representations and can show why all three may be used.
Students frequently view graphs, as in this example, as mapping the path of an object rather than the height of the object over time. In this case, the horizontal axis would need to be distance from the launch point to make a graph of the path. Another example of viewing the graph as a path occurs when students are asked to estimate the graph of the height of a Ferris wheel over time and then produce a circle, which is not even a function. Having students create functions for stories and stories from func-tions is an important way to get beyond misconceptions about what a graph tells. Besides the height of a Ferris wheel over time, students can make graphs of the speed of a roller coaster versus time (the increases do not pair with the height of the coaster), the distance a runner is from the starting point versus time (straight track and oval track are good options), and the distance a truck has traveled versus speed, especially if there is a length of time for which the truck is stopped. Students can use problems such as this to look at x- and y-intercepts, the axis of symmetry, intervals of increasing and decreasing height, and more to understand the different components of a function.
Connections to Modeling
Problems when finding and using maxima and minima are typical of problems that connect to modeling.
Related Content StandardsF.IF.C.7 F.IF.C.8 F.IF.C.9 F.BF.B.3 F.LE.A.3 F.TF.A.4 F.TF.B.5 A.APR.B.3 G.CO.A.3 8.F.B.4
0
20
40
60
80
1 2 3 4 5 6 7 8
Notes
Copyri
ght C
orwin
2018

154 The Common Core Mathematics Companion: The Standards Decoded, High School
STANDARD 5 (F.IF.B.5)
Relate the domain of a function to its graph and, where applicable, to the quantitative relationship it describes. For example, if the function h(n) gives the number of person-hours it takes to assemble n engines in a factory, then the positive integers would be an appropriate domain for the function.
Students consider situations that have continuous and discrete domains and/or ranges. A good starting example relates the num-ber of Reese’s cups purchased versus the number of packages at the candy counter. The domain is {1, 2, 3, . . . } while the range is {2, 4, 6, 8, . . . }. The graph is linear, has a constant rate of change of 2 cups per package, and is graphed with points (discrete). This can be compared with the distance a walker going 2 miles per hour is from a starting point versus time, which is continuous. Students need to explain why each domain and range occurs. Another example considers the number of same-size buses needed to seat students. One bus holds 34 students, then two buses hold 68 students, and so on. The domain (number of buses) is a natu-ral number. The number of students is also a natural number. If there are 38 students, two buses are still needed, so the graph is not a typical linear function that students may be used to seeing from previous experiences.
What the TEACHER does: • Gives tasks that require consideration of both the domain and range.
• Asks students to make tables and graphs to display a func-tion from a context.
• Requires students to explain why the domain and range are discrete or continuous.
• Poses problems in contextual settings to assist students in determining the appropriate range and domain themselves in terms of the relationship that is represented, such as the number of same-size paving blocks used in making a sidewalk and the area of the path.
What the STUDENTS do: • Determine what the domain for a function should be and create a graph that displays it.
• Explain why the function for a given context has a continuous or discrete domain.
• Explain why the function for a given context has a continuous or discrete range.
• Connect a function to the context it represents using quantities.
Addressing Student Misconceptions and Common Errors
Students may be confused about restricting domains or naming appropriate domains. Contextual examples are a key step in addressing any misconceptions.
Let M(p) be a function describing the money brought in from people buying tickets to attend a movie at a given theater. Ask students what domain would make sense for this. (The students may determine they need to know the maximum number of seats in the theater or if the movie will be shown if there are too few patrons.) The domain will be some subset of the nonnegative integers. A similar question may be asked about the range (and the answers will depend on how much each ticket costs).
Students may feel that all functions have either both the domain and range continuous or both discrete. Step functions are a good example to have ready. A function based on the United States postage system uses the same rate for a given subinterval of a continuous domain. For example, for all weights, w, in ounces, 0 < w ≤ 1, the price of mailing is the same. For 1 < w ≤ 2, another price is used. This function has a continuous domain but a discrete range. This connects directly with the study of piecewise functions.
Connections to Modeling
Naming an appropriate domain and range will be part of any modeling problems. Examples include the ubiquitous cutting a box of maximum size from a sheet of cardboard; finding maximum profit for producing and selling a product; finding the minimum area produced by cutting a wire and bending it into a circle and square; and determining a relationship between time and height, time and temperature, or any co-varying quantities.
Related Content StandardsF.IF.A.2 F.IF.C.7 N.Q.A.1 N.Q.A.2 8.F.A.1
Copyri
ght C
orwin
2018
Part 4 | Functions 155
STANDARD 6 (F.IF.B.6)
Calculate and interpret the average rate of change of a function (presented symbolically or as a table) over a specified interval. Estimate the rate of change from a graph.
The Progressions for the Common Core State Standards: 6–7 Ratios and Proportional Relationships (2011) gives examples of rate of change involving both ratios and proportions using similar triangles to show the additive and multiplicative conceptual underpinnings of the concepts (p. 5, 9). This idea is extended in Functions, starting in Grade 8, by examining not only direct variations but also other linear functions. For Grades 9–12, the average rate of change may begin with the concept of linear functions, but it is not limited to linear functions. The average rate of change is the ratio of the change in the dependent vari-able to the change in the independent variable for a given interval (e.g., for 1 ≤ x ≤ 4 on the function ƒ(x) = x2, the average rate
of change ( ) ( )f f4 14 1
16 13
153
5= −−
= − = = ). For students moving into STEM careers, this work links to the difference quotient
and the instantaneous rate of change (an application of the derivative in calculus).
What the TEACHER does: • Uses tabular, graphic, and symbolic forms when asking students to calculate the average rate of change.
• Gives contextual problems involving the average rate of change.For example, suppose a culture is growing in a lab. The initial size is 1 mm2. The culture doubles every hour and can be described by c(t) = 2t, where t is the number of hours and c is the size of the culture in mm2. Questions may include the following:What is the average rate of change from t = 0 to t = 1? (2 mm2 per hour)From t = 1 to t = 2? (3 mm2 per hour)From t = 0 to t = 2? (4 mm2 per hour)For what two consecutive integers from t = 0 to t = 8 is the average rate of change the fastest? Explain with numbers and graphically.
What the STUDENTS do: • Calculate and interpret the average rate of change from multiple representations (table, graph, and symbols).
• Explain what the average rate of change means in the context of a problem. The line of fit describing the number of people per television set in a country (x) and the life
expectancy in the country (y) may be . .y x0 136 72 834 = − + .
Average rate of change = . . .68 754 70 11430 20
1 36−−
= −
This means that for every 10 people more per TV, the life expectancy decreases by 1.36 years. For a line of fit, it is also appropriate to have students interpret the y-intercept.
Addressing Student Misconceptions and Common Errors
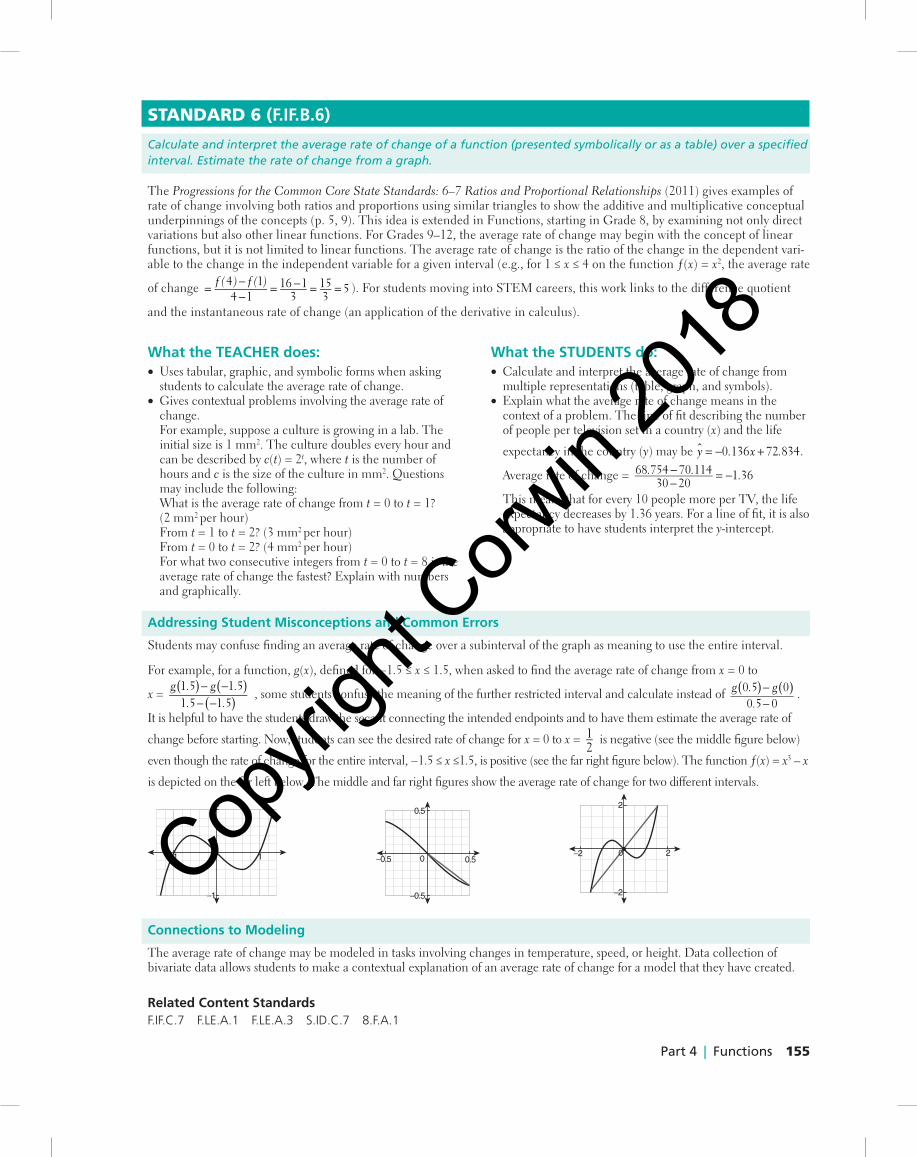
Students may confuse finding an average rate of change over a subinterval of the graph as meaning to use the entire interval.
For example, for a function, g(x), defined for −1.5 ≤ x ≤ 1.5, when asked to find the average rate of change from x = 0 to
x = . .. .
g g1 5 1 5
1 5 1 5( ) ( )
( )− −
− −, some students confuse the meaning of the further restricted interval and calculate instead of .
.g g0 5 0
0 5 0( ) ( )−
−.
It is helpful to have the students draw the secant connecting the intended endpoints and to have them estimate the average rate of
change before starting. Now, students can see the desired rate of change for x = 0 to x = 12
is negative (see the middle figure below)
even though the rate of change for the entire interval, −1.5 ≤ x ≤1.5, is positive (see the far right figure below). The function ƒ(x) = x3 – x
is depicted on the far left below. The middle and far right figures show the average rate of change for two different intervals.
0
1
−1 1
−1
Connections to Modeling
The average rate of change may be modeled in tasks involving changes in temperature, speed, or height. Data collection of bivariate data allows students to make a contextual explanation of an average rate of change for a model that they have created.
Related Content StandardsF.IF.C.7 F.LE.A.1 F.LE.A.3 S.ID.C.7 8.F.A.1
0
0.5
−0.5
−0.5 0.5
2
−2
−2 20Copyri
ght C
orwin
2018