2018 annual report v7 - moez letter and provost office graphs · for developing business...
TRANSCRIPT

DRAFT ANNUAL REPORT - NOT FINAL 1DDDRRRRRRRDRAFAFAA TTTTT AAAANANANANAA NUNUNUUUUUUNUUALALAALLA RREEEPEPOORORT -- NOT T FIF NANAL L 1
Annual Report2017-2018
DRAFT ANNUAL REPORT - NOT FINAL
DRAFT ANNUAL REPORT - NOT FINAL 2
Mission & Vision
MissionWe emphasize creativity and analytics to promote student success, produce scholarship with impact and engage with all stakeholders in a diverse global environment.
Strategic VisionWe aspire to be internationally recognized for developing business professionals who provide analytical and creative solutions in a global environment.
Transforming Minds: Transforming Business
ABOUT THE USF MUMA COLLEGE OF BUSINESSWe do more than simply disseminate information. We equip students with the skills and knowledge needed to take leading positions in business and society. The college serves 5,500 students a year with nine undergraduate programs, 11 graduate programs and two doctoral programs.
AACSB ACCREDITEDThe USF Muma College of Business and Lynn Pippenger School of Accountancy are separately accredited by AACSB International.
The hallmark of excellence in business education, AACSB-accreditation is a voluntary, nongovernmental process that includes a rigorous external review of a school’s ability to provide the highest quality programs. It includes a comprehensive review of a school’s mission, faculty qualifications and curricula, and the process includes self-evaluations, peer-reviews, committee reviews and the development of in-depth strategic plans. Accreditation ensures that students are learning material most relevant to their field of study, preparing them to be effective leaders upon graduation.

DRAFT ANNUAL REPORT - NOT FINAL 3DRAFFFT AANNNUAAL RREPPORRT - NNOTT FINALL 3
It is my privilege to present this 2017-2018 annual report. Each year we grow in prestige and accumulate more accomplishments, and this past year was no different. In fact, it stands out. The achievements and points of pride of our students, faculty, staff, alumni, donors and corporate partners are proof that their dedication, determination and hard work puts the USF Muma College of Business among the elite business colleges in Florida, in the United States and on the planet.
We delight in telling you these awesome stories. They are about people whose efforts make us strong and increase our presence on the global business-education stage. The work of our researchers is changing lives around the world. Our educators rival the best of the best and our students are eager to learn how to enter the workforce fully prepared to meet all challenges.
It Starts With StudentsAs you read through this report, you will see a theme emerge, one in which the success of our students is para-mount through the dedication of our faculty, the expertise of our staff, the largesse of our donors and the commitments of our business partners. Keeping students involved in their classwork and focused on graduation is – and always has been – a priority we all share.
We have some of the most intelligent, savvy, sophisticated and ambitious students anywhere. We had a dozen King O’Neal Scholars (a designation for those earning a bachelor’s degree with a 4.0 GPA) this year. International business major Alexis Drees was named Outstanding Graduate at the fall commencement ceremonies.
Among the many bright spots is a trend of students who are the first in their families to go to college. Those students are staying in school and graduating on time. Part of the reason is that our advisors have been taking extra steps to track these students’ progress and reach out to them when students are slow to register or display behaviors that might indicate issues.
Another resource helping to keep those students progressing is the Corporate Mentor Program, which pairs students who are the first in their family to pursue a college degree with mentors from the business community. This past year, we paired 133 students with 128 mentors.
As a result of the efforts of these programs – and others under the Collier Student Success Center umbrella – we fully expect the volume of students graduating on time, without excess credit hours and with real-world experiences, to rise.
Our 25 Under 25 program, which spotlights high-achieving business majors under the age of 25, again is a success, with the most applicants ever – 180 – seeking this recognition. Six of this year’s honorees boast 4.0 grade-point averages and all have exhibited exemplary leadership skills.
The 25 honorees – and the hundreds of other students with equally impressive stories – are among our youngest stu-dents, but at the other end of the spectrum are students in the Doctor of Business Administration program, which offers opportunities for seasoned working professionals. I was so proud when the first cohort graduated in December and when 30 students enrolled in the fourth cohort that started classes in January! DBA students are conducting relevant re-search and presenting their work worldwide. USF is building a reputation as one of the finest DBA programs in the nation.
Among the growing student-success facets of our business education, particularly at the graduate level, is a changing program model. We are offering more courses online or in a hybrid online face-to-face fashion. This means that we can offer more specialized certificate programs in response to the changing needs of employers. For example, certificate programs and online programs emphasizing anti-money-laundering, cybersecurity and business analytics are catching the attention of many employers interested in recruiting graduates who are well-versed in such topics.
Of course, what is a great education worth if it’s unattain-able? We began the year by awarding nearly $600,000 in scholarships to business students at the annual Scholar-ship Luncheon. The Lynn Pippenger School of Accountancy hosted a separate scholarship event providing $130,000 in assistance to its students; the school also awarded $21,500 in scholarships to help defray costs for review courses for certification exams such as the CPA, CMA, CIA, CFE or CISA.
The investment in student success is paying off. According to a report produced by the Florida Board of Governors in 2017, graduates from the Muma College of Business are more like-ly to land positions that pay more than $40,000 per year than graduates from any other state business school in Florida.
New Initiatives and ProgramsThe Business Workplace Skills and Best Practices course is a new required core class for all undergraduate students. A dozen colleagues were trained by the Sandler Sales Institute. Now, they teach a section of the interactive course that emphasizes collaboration, teamwork, conflict management, leadership, selling oneself, negotiation, critical thinking and communication. These all are skills that may be overlooked
Dea
n’s
Mes
sage

DRAFT ANNUAL REPORT - NOT FINAL 4
Our investment in student success is paying off. According to a report produced by the Florida Board of Governors in 2017, graduates from the Muma College of Business are more likely to land positions that pay more than $40,000 per year than
graduates from any other state business school in Florida.
in a formal education offered at other b-schools, but which are critical as students make their first forays into the business world.
We launched a new personal financial planning major this year and, thanks to Raymond James, its directorship is now named. An advisory board has been established and 42 students have declared this as their major. A new student organization has been formed and the industry support of this program is remark-able. Our partners tell us that they see, first-hand, the impor-tance of educating young people in this field, which is projecting a talent shortfall in the very near future.
The new Weekend Executive Master of Science in Business Analytics and Information Systems, an 17-month hybrid online face-to-face program, also began classes this fall with a full cohort in the inaugural class.
Noteworthy Faculty and StaffKey to our success, of course, is our faculty. Already well- known around the state, the nation and the world as impactful educators and researchers, Muma College of Business scholars
are accumulating honors and recognition at a steady pace. It seems that each and every day, our professors are published in prestigious business journals, are speaking at important con-ferences, either at an academic institution in the United States or abroad. They all are gaining international attention for their scholarly contributions, and in turn, so is our college.
The number of faculty awarded Fulbright scholarships grew by four this year, and we now have eight Muma College of Business professors and one administrator who have been recognized by the esteemed program. Faculty members Anol Bhattacherjee, Sajeev Varki and Tim Heath received Fulbright Core Scholarships, sending them overseas to guest lecture, present and network. They join five other faculty members who have received Fulbright recognition over the past three years. Recently, I myself was awarded an administrative Fulbright that will allow me to travel to Japan to forge new partnerships for our students and faculty in this country.
Finance scholar Dan Bradley received USF’s university-wide Outstanding Research Achievement Award and may be the first

business faculty to be presented this honor.
Marketing Professor Jim Stock was one of six USF professors selected as Fellows of the American Association for the Advance-ment of Science. The award is considered among the top honors in academic research.
USF Provost Ralph Wilcox names up to three USF faculty members Distinguished University Professors, and this year, ISDS Professor Alan Hevner was one of those three. We could not be prouder of Dr. Hevner and his research, which has been cited more than 14,000 times by other researchers. He is a perfect example of the impactful work being done here and a big reason the Muma College of Business broke into the top 100 in the University of Texas-Dallas list of business school research rankings, based on total contributions to faculty journals. Our researchers produce scholarship with impact. And lots of it.
The recognition results in experienced and innovative faculty want-ing to teach at our college. Since July 2017, we have hired 16 new personnel here at the Muma College of Business. Among them is a former C-Suite executive from Goodyear Tire and Rubber Com-pany who is serving as an executive-in-residence to coach MBA and Executive MBA candidates who want to secure new jobs after graduation or to guide those who want to make upward moves in their careers.
Five new instructors and professors joined the team, bringing cutting-edge curricula to our classrooms, guaranteeing, again, that students will be well prepared and ahead of their peers from other b-schools when they graduate.
National RankingsUSF’s graduate program in entrepreneurship was ranked No. 11 in the nation by the rankings compiled by Entrepreneur magazine and The Princeton Review. USF was the only Florida university to make the list.
The Vinik Sport & Entertainment Management Program, with its 98 percent job placement rate, was ranked No. 4 worldwide in a graduate programs ranking by SportBusiness International, which sifted through 1,000 survey responses to arrive at the ranking.
The part-time MBA program ranked No. 58 among public schools in the U.S. News and World Report’s Best Grad School Rankings for 2019.
While these are the more well-known rankings, other lists are taking notice, too. CEO Magazine ranked USF in its Top Tier for North American Executive MBA programs. Online MBA evaluated 470 online and hybrid MBA programs to come up with its ranking of online degrees emphasizing cybersecurity. USF was ranked No. 3. TheBestSchools.com ranked the online program at No. 28. The Master of Science in Management was ranked by Top Manage-ment Degrees (No. 18) and TFE Times (No. 24).

DRAFT ANNUAL REPORT - NOT FINAL 6 OOT T T FIF
RANKING
#4
731
308
26
2017
-18
Deg
rees
Aw
arde
d (i
ncom
plet
e ye
ar)
FINAL DRAFT ANNUAL REPORT - NOT666
9
UndergraduateMajors
2 Doctoral Programs
11 Graduate Programs
THE VINIK SPORT & ENTERTAINMENT MANAGEMENT PROGRAM WAS RANKED NO. 4 WORLDWIDE BY SPORTBUSINESS
Bachelors Masters Doctoral

DRAFT ANNUAL REPORT - NOT FINAL 7
Connecting the Classroom with the Corporate WorldConnecting our classrooms with the outside business world is a big part of our strategy to create business thinkers. Through-out this report you’ll read stories that illustrate ways corporate engagement and real-world class projects, like the new Selling with the Bulls program, the ongoing Fox Sports U project or the long-standing business case competitions, help us connect the classroom and the corporate community.
Our student internship program is robust and allows partici-pants to get a preview into the realms of marketing, finance, accounting and management. We are recruiting more compa-nies to provide course-credit internships and other immersive learning experiences to increase the availability of positions open to students. With partners like the Tampa Bay Lightning, Raymond James, Kforce, Jabil and Goldman Sachs, our grads enter seamlessly into the workforce.
A Platform for Thought LeadershipWhen these highly successful executives to hear about the ground-breaking programs at the Muma College of Business, they almost always find the time to visit. Here, they know they may happen upon that right graduate to recruit. Here, they know they may discover the future leaders of their companies. Everyone wins.
Of course, the highlight of the year was when we kicked off the Muma College of Business Thought Leader Series in Feb-ruary. Steve Wozniak, co-founder of Apple, entrepreneur and philanthropist, was the inaugural speaker for the event, which drew some 2,300 people to the Sun Dome.
Over the past year, our popular Conversation with a CEO series has featured Dave Dunkel, CEO of Kforce; Steve Griggs, CEO of the Tampa Bay Lightning, Tampa Bay Entertainment Properties and Amalie Arena; Shelley Broader, CEO of Chico’s FAS, Inc.; and Arnie Bellini, CEO of ConnectWise.
The ISDS Department brought in Mike Whitaker, the global head of ICG Operations & Technology at Citi, to speak at the fifth annual Breakfast with a CIO. The Vinik Sport & Entertain-ment Management Program brought in national leaders Tim Leiweke, who has some 30 years’ experience in global sport, Jeff Wilpon, COO of the New York Mets, and Brendan Dono-hue, managing director of the NBA 2K League. Our Executive MBA program also has hosted impressive guests in its Distin-guished Speaker Series.
Our second Florida Business Analytics Forum, which will take place in May, will feature groundbreaking research on hot topics such as blockchain, machine learning and human bias in artificial intelligence. Last year, the forum featured leaders from across the country and drew more than 250 guests.
Philanthropic SupportI would be remiss if I didn’t mention some of the donors who have given so much to the Muma College of Business this year.
The first major gift of the academic year came from Jeff Vinik, owner of the Tampa Bay Lightning, Tampa Bay Entertainment Properties and Amalie Arena and the man reimagining the Channelside area. Vinik, along with his wife, Penny, made a $5 million naming gift last fall for what is now known as the Vinik Sport & Entertainment Management Program. The Lightning and Amalie Arena are proven training grounds for interns, many of whom have taken full-time jobs there after graduation.
One of the highlights of the year was at the USF Unstoppable gala on Nov. 11. Donors Pam and Les Muma, whose 2014 gift of $25 million named our college, made a surprise $15 million gift to USF, one that includes an additional $5 million for the college! In a Tampa Bay Times article about their gift, Les Muma said, “What we’re doing is making students better, making kids’ lives better, and it just feels good.”
More recently, in April, Stuart and Tyler Lasher’s donation helped us remodel a classroom that is used by students in the Finance Department. The renovations include real-time stock tickers, a Bloomberg terminal, whiteboards and other innova-tions so that our students will get as close to the real invest-ment world as possible. The room is now the Lasher Center for Financial Markets.
Other generous donors over the past year included Raymond James, Citi, Mercury Gate International, T. Rowe Price, GTE Financial and Datex Corporation, to name just a few.
The Executive Bulls Leadership Giving Program, launched in 2015, recognizes donors who make annual unrestricted gifts of $10,000 or more to support our strategic priorities. This year, $300,000 was donated by these special friends!
We, ourselves, also give. I could not be prouder to tell you the Muma College of Business faculty and staff were among the leaders in donations, totaling more than $150,000 with gifts from 95 percent of our educators and employees.
So, as you can see, the 2017-18 year here at the Muma College of Business was marked by great accomplishments and we know that in the years to come, there is no limit to what we can achieve.
Moez Limayem, DeanMoez Limayemmm, Deean

Source
1.1 Access Office of Decision Support1.1.a. Headcount by Level Office of Decision Support1.1.b. Headcount by Residency Office of Decision Support1.1.c. Headcount International Office of Decision Support1.1.d. Enrollment (SCH/FTE) by Level Office of Decision Support1.1.e. Online Education by Level (SCH/FTE) Office of Decision Support1.1.f. Number of Fully Online Degree Programs by Level Office of Decision Support1.1.g. Undergraduate Experiential & Service Learning Office of Community Engagement and Partnerships1.1.h. Undergraduate Research Office for Undergraduate Research1.1.i. Education Abroad USF World1.2 Progression & Retention Office of Decision Support1.2.a. DFW Grade Distribution Office of Decision Support1.2.b. Second Year Retention Rate Office of Decision Support1.2.c. Student Flow Office of Decision Support1.3 Student Success Office of Decision Support1.3.a. FTIC 4 year and 6 year graduation rates Office of Decision Support1.3.b. Transfer 2 year and 4 year graduation rates Office of Decision Support1.3.c. Doctoral Program Time to Degree Office of Decision Support1.3.d. Degrees Awarded Trends by Level Office of Decision Support1.3.e. Degrees Awarded Trends in Areas of Strategic Emphasis Office of Decision Support1.3.f. Percent Undergraduates without Excess Hours Office of Decision Support1.3.g. Number of Class Sections with Undergraduates Enrolled Office of Decision Support1.4 Student Awards Office of National Scholarships1.5 Academic Program Planning & Review Institutional Effectiveness and Assessment (ODS)1.5.a. Academic Learning Compact Assessments Submitted Institutional Effectiveness and Assessment (ODS)1.5.b. New Academic Programs Proposed Institutional Effectiveness and Assessment (ODS)1.5.c. Terminated Academic Programs Institutional Effectiveness and Assessment (ODS)1.5.d. Low Productivity Academic Program Review Institutional Effectiveness and Assessment (ODS)1.5.e. Academic Program Reviews and External Accreditations Completed Institutional Effectiveness and Assessment (ODS)Section 2. Research, Innovation & Creative Activity2.1 Proposals Submitted & Sponsored Awards Research & Innovation2.2 Research Expenditures: Total and Federal Research & Innovation2.3 F&A Rates Research & Innovation2.4 Commercialization: Inventions, Patents, Licenses & Revenues Research & Innovation2.5 Citations Office of Decision Support2.6 Faculty/Student Start ups Research & Innovation2.7 Post doctoral Appointees Graduate Studies2.8 Non Faculty Researchers with PhD Graduate Studies2.9 Faculty Awards Research & InnovationSection 3. Economic Drivers3.1 Community Engagement Research & Innovation3.1.a. Community Service Proposals & Awards (in Numbers) Research & Innovation3.1.b. Community Service Proposed Amount, Awards and Expenditures (in Dollars) Research & Innovation
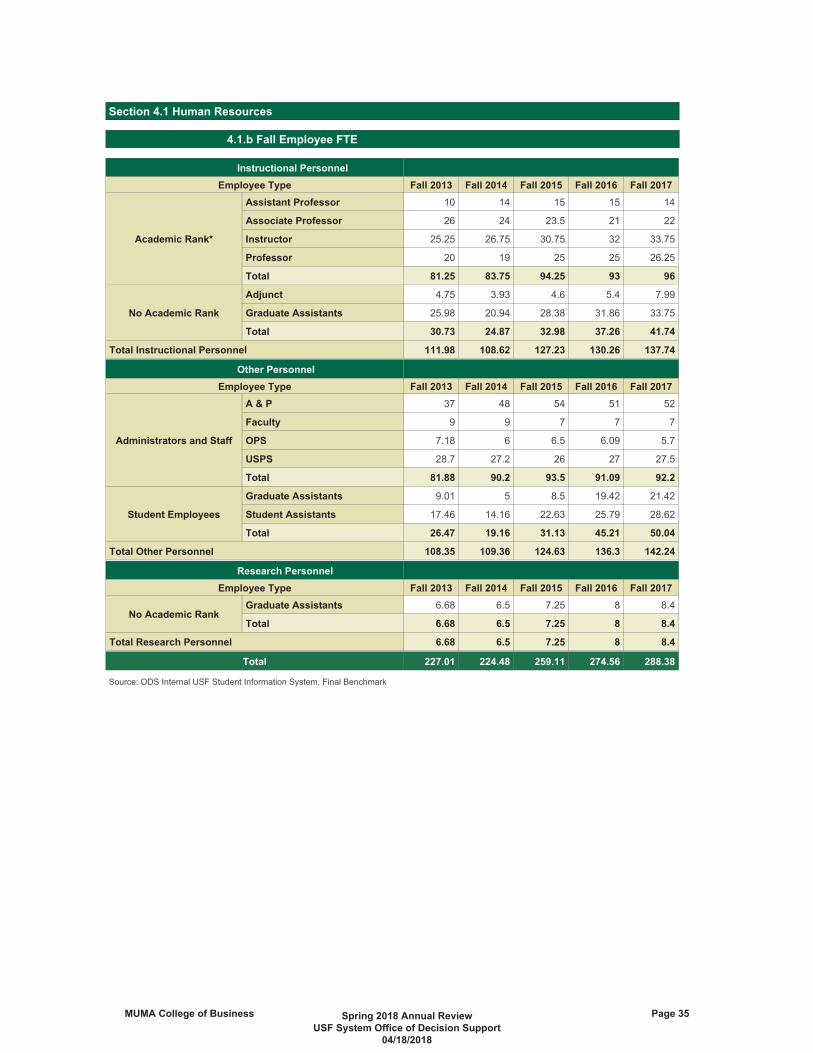
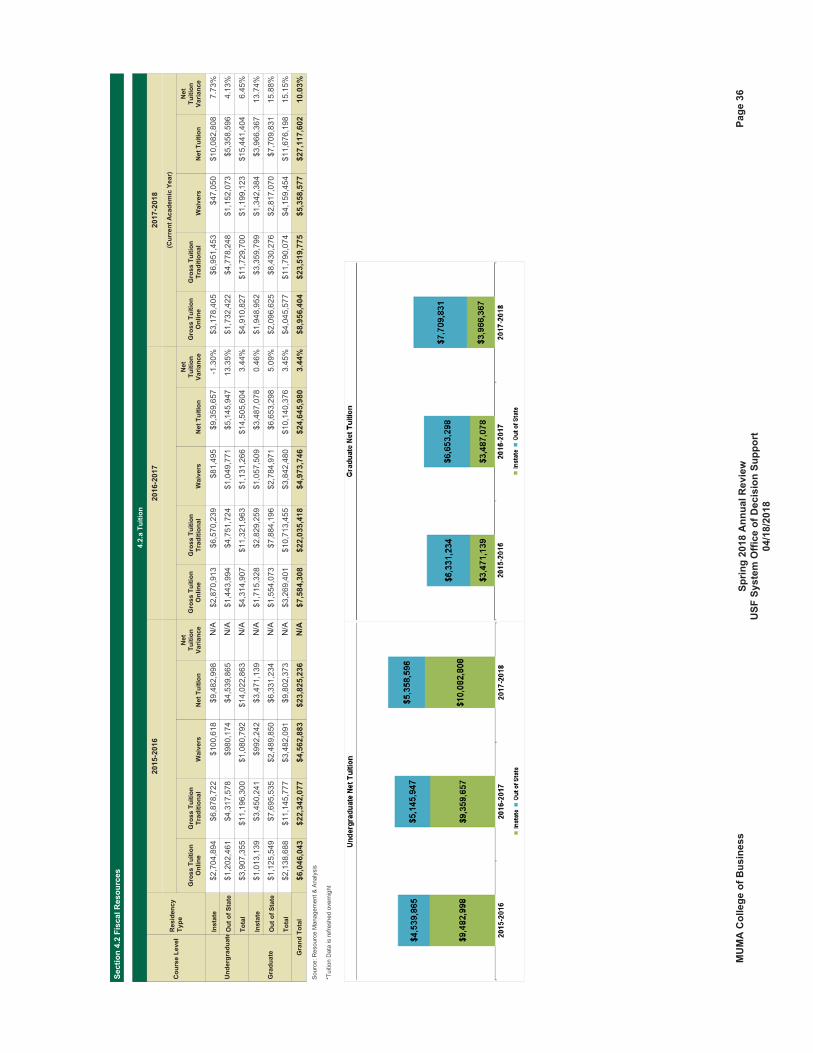
4.1 Human Resources Office of Decision Support4.1.a. Fall Employee Headcount Office of Decision Support4.1.b. Fall Employee FTE Office of Decision Support4.2 Fiscal Resources Resource Management & Analysis4.2.a. Tuition Resource Management & Analysis4.3 Philanthropy University Advancement4.3.a. Annual Fundraising University Advancement4.3.b. Endowment University Advancement
Note: Omitted sections are indicated by light gray colored font
Table of ContentsSection
Section 1. Student Access, Retention, Progression & Success
Section 4. Resources
Glossary


2016 Summer/Fall Cohort*
CAS MCOB BCS EDU ENG COTA UGS MCOM CON COPH USFT
Cohort Total by Initial College 2,034 526 136 121 637 121 143 0 262 42 4,022
Arts & Sciences (CAS) 1,704 35 13 10 34 11 66 0 40 4 1,917
Business (MCOB) 43 426 2 3 28 4 20 0 1 1 528
Behavioral & Community Sci (BCS) 17 4 106 5 3 1 9 0 5 0 150
Education (EDU) 17 1 1 89 3 3 3 0 4 0 121
Engineering (ENG) 16 2 0 0 507 1 9 0 0 0 535
The Arts (COTA) 8 3 0 1 2 87 6 0 0 0 107
Undergraduate Studies (UGS) 8 5 0 0 3 0 11 0 0 0 27
Medicine (COM) 0 0 0 0 0 0 0 0 0 0 0
College of Nursing (CON) 14 2 0 1 0 1 0 0 155 0 173
College of Public Health (COPH) 15 0 0 0 1 0 1 0 10 34 61
Cohort Total by Initial College 2,034 526 136 121 637 121 143 0 262 42 4,022
Not Retained at USFT ( ) 192 ( ) 48 ( ) 14 ( ) 12 ( ) 56 ( ) 13 ( ) 18 ( ) 0 ( ) 47 ( ) 3 ( ) 403
Retained at USFT 1,842 478 122 109 581 108 125 0 215 39 3,619
Student Outflow(Began at Initial College/Retained at Different College)
( ) 138 ( ) 52 ( ) 16 ( ) 20 ( ) 74 ( ) 21 ( ) 114 ( ) 0 ( ) 60 ( ) 5 ( ) 500
Retained (Initial College) 1,704 426 106 89 507 87 11 0 155 34 3,119
Cohort Total by Initial College 2,034 526 136 121 637 121 143 0 262 42 4,022
Student Outflow(Began at Initial College/Retained at Different College)
( ) 138 ( ) 52 ( ) 16 ( ) 20 ( ) 74 ( ) 21 ( ) 114 ( ) 0 ( ) 60 ( ) 5 ( ) 500
Student Inflow(Began at USFT/Retained at Receiving College)
(+) 213 (+) 102 (+) 44 (+) 32 (+) 28 (+) 20 (+) 16 (+) 0 (+) 18 (+) 27 (+) 500
Adjusted Cohort 2,109 576 164 133 591 120 45 0 220 64 4,022
Net Gain 75 50 28 12 46 1 98 0 42 22
1. Attrition Rate 9% 9% 10% 10% 9% 11% 13% 18% 7% 10.0%2. Retention Rate Intial College 84% 81% 78% 74% 80% 72% 8% 59% 81% 77.5%3. Retention Rate at USF 91% 91% 90% 90% 91% 89% 87% 82% 93% 90.0%4. Retention Rate of Adjusted Cohort 91% 92% 91% 91% 91% 89% 60% 79% 95% 90.0%5. Outflow Retention Rate (Retained at USF) 7% 10% 12% 17% 12% 17% 80% 23% 12% 12.4%
Adjusted Cohort is the obtained by subtracting students who leave initial college for other USF colleges (Out Flow) from Initial cohort and adding the Student Inflow fromother colleges
1.2.c Student Flow(1 Year Retention)
Initial College
Student Flow
1 Year Retention Rate (See definitions below)
* First Time In College (FTIC) are based on full time students who enter the institution in the Fall term (or Summer term and continue into the Fall term)
1. Attrition Rate is calculated by dividing the number of students who are not retained at USF by the number of students in the original cohort.
2. Retention Rate From Initial College is calculated by dividing the number of students who are retained at second Fall in their initial college by the number of students in the original cohort.
3. Retention Rate From USF is calculated by dividing the number of students who are retained at second Fall in their initial college plus those who are retained at another USF colleges by thenumber of students in the original cohort. This is the official retention rate for each college.
5. Outflow Retention Rate is calculated by dividing the number of students who are retained other colleges not their initial college (outflow) by the number of students in the original cohort.
4. Retention Rate for Adjusted Cohort is calculated by dividing the number of students who are retained in their initial college plus inflow students by the number of students in the adjustedcohort (original cohort plus inflow students minus outflow students)
Retained
College

2013 Summer/Fall Cohort*
CAS MCOB BCS EDU ENG COTA UGS MCOM CON COPH USFT
Cohort Total by Initial College 1,971 478 134 152 624 97 171 0 206 29 3,862
Arts & Sciences (CAS) 1,156 37 10 17 41 11 35 0 32 3 1,342
Business (MCOB) 47 277 1 2 16 4 21 0 1 0 369
Behavioral & Community Sci (BCS) 50 7 79 3 4 1 5 0 7 1 157
Education (EDU) 8 3 5 76 3 2 4 0 4 1 106
Engineering (ENG) 0 0 0 0 121 1 0 0 0 0 122
The Arts (COTA) 9 2 0 2 0 33 2 0 0 0 48
Undergraduate Studies (UGS) 6 0 0 0 2 2 0 0 0 0 10
Medicine (MCOM) 0 0 0 0 0 0 0 0 0 0 0
College of Nursing (CON) 12 0 0 0 0 0 1 0 63 0 76
College of Public Health (COPH) 34 0 0 1 0 0 2 0 17 16 70
Cohort Total by Initial College 1,971 478 134 152 624 97 171 0 206 29 3,862
Not Retained at USFT ( ) 406 ( ) 111 ( ) 34 ( ) 34 ( ) 159 ( ) 30 ( ) 64 ( ) 0 ( ) 71 ( ) 6 ( ) 915Student Outflow(Began at Initial College and Still Enrolled or Degreed atDifferent College)
( ) 231 ( ) 67 ( ) 18 ( ) 34 ( ) 127 ( ) 27 ( ) 106 ( ) 0 ( ) 71 ( ) 5 ( ) 686
1. Degreed at College (Started at Initial College andGraduated at the Same College)
1,156 277 79 76 121 33 0 0 63 16 1,821
2. Degreed at USFT (Started at Initial College andGraduated from USFT )
1,322 326 95 101 187 54 70 0 124 21 2,300
Still Enrolled Fall 2017 at USFT 243 41 5 17 278 13 37 0 11 2 647
Still Enrolled Fall 2017 at Initial College 178 23 3 8 217 7 1 0 1 2 440
Cohort Total by Initial College 1,971 478 134 152 624 97 171 0 206 29 3,862Student Outflow(Began at Initial College and Still Enrolled or Degreed atDifferent College)
( ) 231 ( ) 67 ( ) 18 ( ) 34 ( ) 127 ( ) 27 ( ) 106 ( ) 0 ( ) 71 ( ) 5 ( ) 686
Student Inflow(Began at USFT and Still Enrolled or Degreed atReceiving College)
(+) 264 (+) 123 (+) 93 (+) 47 (+) 39 (+) 21 (+) 20 (+) 0 (+) 15 (+) 64 (+) 686
4. Adjusted Cohort 2,004 534 209 165 536 91 85 0 150 88 3,862
Net Gain 33 56 75 13 88 6 86 0 56 59
1. Graduation Rate From Initial College 59% 58% 59% 50% 19% 34% 0% 31% 55% 47.2%2. Graduation Rate from USF Tampa 67% 68% 71% 66% 30% 56% 41% 60% 72% 59.6%3. Success Rate at USF Tampa 79% 77% 75% 78% 75% 69% 63% 66% 79% 76.3%4. Graduation Rate for Adjusted Cohort 67% 69% 75% 64% 23% 53% 12% 0% 51% 80%5. Outflow Graduation Rate 8% 10% 12% 16% 11% 22% 41% 0% 30% 17% 12.4%
Adjusted Cohort is the obtained by subtracting students who leave college for other USF colleges (Out Flow) from Initial cohort and adding the Student Inflow from other colleges
1.2.c Student Flow(4 Year Graduation)
Initial College
Student Flow
4 Year Graduation Rate (See definitions below)
* First Time In College (FTIC) are based on full time students who enter the institution in the Fall term (or Summer term and continue into the Fall term)
1. Graduation Rate From Initial College is calculated by dividing the number of students who graduated from their initial college by the number of students in the original cohort.Degrees granted in Initial College for students with multiple degrees are captured based on first baccalaureate degree granted within 6 years.2. Graduation Rate From USF is calculated by dividing the number of students who graduated from their initial college plus from other USF colleges by the number of students inthe original cohort. This is the official graduate rate for each college.3. Success Rate at USF is calculated by adding the number who graduated from initial college, Student Outflow and those who are still Enrolled at following Fall, and dividing by thenumber in the originial cohort4. Graduation Rate for Adjusted Cohort is calculated by dividing the number of students who graduated from their initial college plus inflow students by the number of students inthe adjusted cohort (original cohort plus inflow students minus outflow students)5. Outflow Graduation Rate is calculated by dividing the number of students who graduated from other colleges not their initial college (outflow) by the number of students in theoriginal cohort.
DegreedCo
llege

2011 Summer/Fall Cohort*
CAS MCOB BCS EDU ENG COTA UGS MCOM CON COPH USFT
Cohort Total by Initial College 1,648 381 147 133 496 143 234 50 199 18 3,449
Arts & Sciences (CAS) 984 51 27 28 55 20 72 15 47 3 1,302
Business (MCOB) 52 214 4 1 28 4 30 1 0 0 334
Behavioral & Community Sci (BCS) 65 6 75 2 10 5 8 0 9 4 184
Education (EDU) 18 2 2 63 7 4 8 6 2 0 112
Engineering (ENG) 19 2 0 2 208 0 9 0 0 0 240
The Arts (COTA) 3 0 1 0 3 40 2 0 1 0 50
Undergraduate Studies (UGS) 4 3 0 4 1 0 3 0 0 0 15
Medicine (MCOM) 0 0 0 0 0 0 0 10 0 0 10
College of Nursing (CON) 15 0 0 0 1 0 2 0 41 0 59
College of Public Health (COPH) 63 3 2 0 7 0 10 4 27 9 125
Cohort Total by Initial College 1,648 381 147 133 496 143 234 50 199 18 3,449
Not Retained at USFT ( ) 415 ( ) 98 ( ) 35 ( ) 33 ( ) 165 ( ) 67 ( ) 87 ( ) 14 ( ) 72 ( ) 2 ( ) 988Student Outflow(Began at Initial College and Still Enrolled or Degreedat Different College)
( ) 244 ( ) 69 ( ) 37 ( ) 37 ( ) 115 ( ) 35 ( ) 144 ( ) 26 ( ) 86 ( ) 7 ( ) 800
1. Degreed at College (Started at Initial College andGraduated at the Same College)
984 214 75 63 208 40 3 10 41 9 1,647
2. Degreed at USFT (Started at Initial College andGraduated from USFT )
1,223 281 111 100 320 73 144 36 127 16 2,431
Still Enrolled Fall 2016 at USFT 10 2 1 0 11 3 3 0 0 0 30
Still Enrolled Fall 2016 at Initial College 5 0 0 0 8 1 0 0 0 0 14
Cohort Total by Initial College 1,648 381 147 133 496 143 234 50 199 18 3,449Student Outflow(Began at Initial College and Still Enrolled or Degreedat Different College)
( ) 244 ( ) 69 ( ) 37 ( ) 37 ( ) 115 ( ) 35 ( ) 144 ( ) 26 ( ) 86 ( ) 7 ( ) 800
Student Inflow(Began at USFT and Still Enrolled or Degreed atReceiving College )
(+) 323 (+) 122 (+) 109 (+) 49 (+) 41 (+) 10 (+) 12 (+) 0 (+) 18 (+) 116 ( ) 800
Adjusted Cohort 1,727 434 219 145 422 118 102 24 131 127 3,449
Net Gain 79 53 72 12 74 25 132 26 68 109
1. Graduation Rate From Initial College 60% 56% 51% 47% 42% 28% 1% 20% 21% 50% 47.8%2. Graduation Rate from USF Tampa 74% 74% 76% 75% 65% 51% 62% 72% 64% 89% 70.5%3. Success Rate at USF Tampa 75% 74% 76% 75% 67% 53% 63% 72% 64% 89% 71.4%4. Graduation Rate for Adjusted Cohort 75% 77% 84% 77% 57% 42% 15% 0% 45% 98%5. Outflow Graduation Rate 15% 18% 24% 28% 63% 48% 58% 60% 63% 89% 23.1%
Adjusted Cohort is the obtained by subtracting students who leave college for other USF colleges (Out Flow) from Initial cohort and adding the Student Inflow from other colleges
1.2.c Student Flow(6 Year Graduation)
Initial College
Student Flow
6 Year Graduation Rate (See definitions below)
* First Time In College (FTIC) are based on full time students who enter the institution in the Fall term (or Summer term and continue into the Fall term)
1. Graduation Rate From Initial College is calculated by dividing the number of students who graduated from their initial college by the number of students in the original cohort.Degrees granted in Initial College for students with multiple degrees are captured based on first baccalaureate degree granted within 6 years.2. Graduation Rate From USF is calculated by dividing the number of students who graduated from their initial college plus from other USF colleges by the number of students inthe original cohort. This is the official graduate rate for each college.3. Success Rate at USF is calculated by adding the number who graduated from initial college, Student Outflow and those who are still Enrolled at following Fall, and dividing by thenumber in the originial cohort4. Graduation Rate for Adjusted Cohort is calculated by dividing the number of students who graduated from their initial college plus inflow students by the number of students inthe adjusted cohort (original cohort plus inflow students minus outflow students)5. Outflow Graduation Rate is calculated by dividing the number of students who graduated from other colleges not their initial college (outflow) by the number of students in theoriginal cohort.
DegreedCo
llege


Proposal Type Degree CIPImplementation
Date
Pre-Proposal B.S. 52.0203 AY 19/20
Pre-Proposal M.S. 52.0203 AY 19/20
Pre-Proposal B.S. 52.0804 AY 19/20
Accountability Report Date
CIP Level BOT Action BOG Termination
Logistics, Materials and Supply Chain Management
(USF's Program Title: Supply Chain Management)
Pre-proposal in APPRiSe System until 3/25/18
Logistics, Materials and Supply Chain Management
(USF's Program Title: Supply Chain Management)
Pre-proposal waiting for additional to Work
Plan/Accountability Plan
1.5.b New Academic Programs Proposed
Title Status
No Terminated Programs for AY 2017-18
Program
1.5.c Terminated Academic Programs
Financial Planning and Services (USF's Program Title: Personal Finance)
Pre-proposal on 3/22/18 APAC Agenda

AYs(2011-12) - (2015-16)
AYs(2012-13) - (2016-17)
Calendar Years 2013 -
2017
52.1499 Advertising B 37 36 35
52.1501 Real Estate M 3 2 1
Red Below BOG productivity thresholdYellow Below USF productivity threshold
This program was redesigned into the Zimmerman Advertising Program (ZAP). There has been a significant increase in enrollment for 2015 and 2016. With the first ZAP graduates just completing the program, it is well on it way to increasing numbers of graduates.
This program was inactivated approximately two years ago due to the economic downturn and depressed real estate market. With the turn-around in real estate, we will be reviewing the market in the coming year to determine if there has been a sufficient buildup in demand to warrant activating the program. If it is determined the demand is not present the program will be terminated or redesigned as a concentration under the finance program.
1.5.d Low Productivity Academic Program Review
Number of Degrees Awarded Over 5 YearsBOG Performance Threshold: Baccalaureate = 30; Masters = 20; Doctoral = 10USF Performance Threshold: Baccalaureate = 45; Masters = 30; Doctoral = 15
CIP Title Level
Total Degrees Over Five Years
College Response Summary from Fall 2016 Review

CIP CIP Title Degree LevelStatus Report
Submitted
CIP Degree Level
CIP Degree Level11.0501 Masters31.0504 Masters52.0101 Bachelors52.0101 Masters52.0201 Bachelors52.0201 Masters
52.0201Research Doctorate
52.0301 Bachelors52.0301 Masters52.0701 Masters52.0801 Bachelors52.0801 Masters52.1101 Bachelors52.1201 Bachelors52.1401 Bachelors52.1401 Masters52.1499 Bachelors52.1501 Masters
CIP Degree Level
Source: ODS-IE&P 3/12/2018
2017-2018 (In Progress)CIP Title
1.5.e Academic Program Reviews and External Accreditations
2015-2016 (Status Report on Implementation of Recommendations)
2016-2017 (Completed)CIP Title
AccountingAccountingEntrepreneurship/Entrepreneurial Studies
Computer Systems Analysis/AnalystSport and Fitness Administration/ManagementBusiness/Commerce, GeneralBusiness/Commerce, General
-
-
-
2018-2019 (Planned)CIP Title
Marketing, OtherReal Estate (suspended)
Finance, GeneralFinance, GeneralInternational Business/Trade/CommerceManagement Information Systems, GeneralMarketing/Marketing Management, GeneralMarketing/Marketing Management, General
Business Administration and Management, GeneralBusiness Administration and Management, General
Business Administration and Management, General

Section 2. Research, Innovation & Creative Activity
Fiscal Year Requested AmountRequested Amount %
ChangeAwards
Awards % Change
2013 $4,351,500 54% $2,785,864 -4%2014 $3,324,338 -24% $4,851,776 74%2015 $2,594,200 -22% $3,267,880 -33%2016 $7,297,484 181% $3,600,455 10%2017 $7,642,663 5% $2,435,459 -14%
2018* $5,125,560 -31% $2,140,091 4%5-Year Average
(2013-2017) $5,042,037 39% $3,388,287 7%
Source: Research & Innovation*FY2018 data through 8 months
Fiscal Year Federal ExpendituresFederal Flow Through
ExpendituresNon-Federal Expenditures
Total Sponsored Research
Expenditures
2013 $291,059 $1,529,014 $106,626 $1,926,6982014 $852,609 $1,365,108 $702,160 $2,919,8782015 $538,690 $1,399,727 $697,352 $2,635,7692016 $266,708 $1,251,663 $1,170,613 $2,688,9842017 $254,432 $1,388,826 $817,427 $2,460,686
2018* $106,939 $848,749 $714,884 $1,670,5735-Year Average
(2013-2017) $440,700 $1,386,868 $698,836 $2,526,403
Source: Research & Innovation*FY2018 data through 8 months
Goal 2. USF will generate new knowledge and solve problems through high-quality research & innovation to change lives, improve health, and foster positive societal change.
Section 2.1 Proposals Submitted & Sponsored Awards
Proposals Submitted & Sponsored Awards (in Dollars)
Section 2.2 Research Expenditures: Total and Federal
Sponsored Research Expenditures: Total and Federal
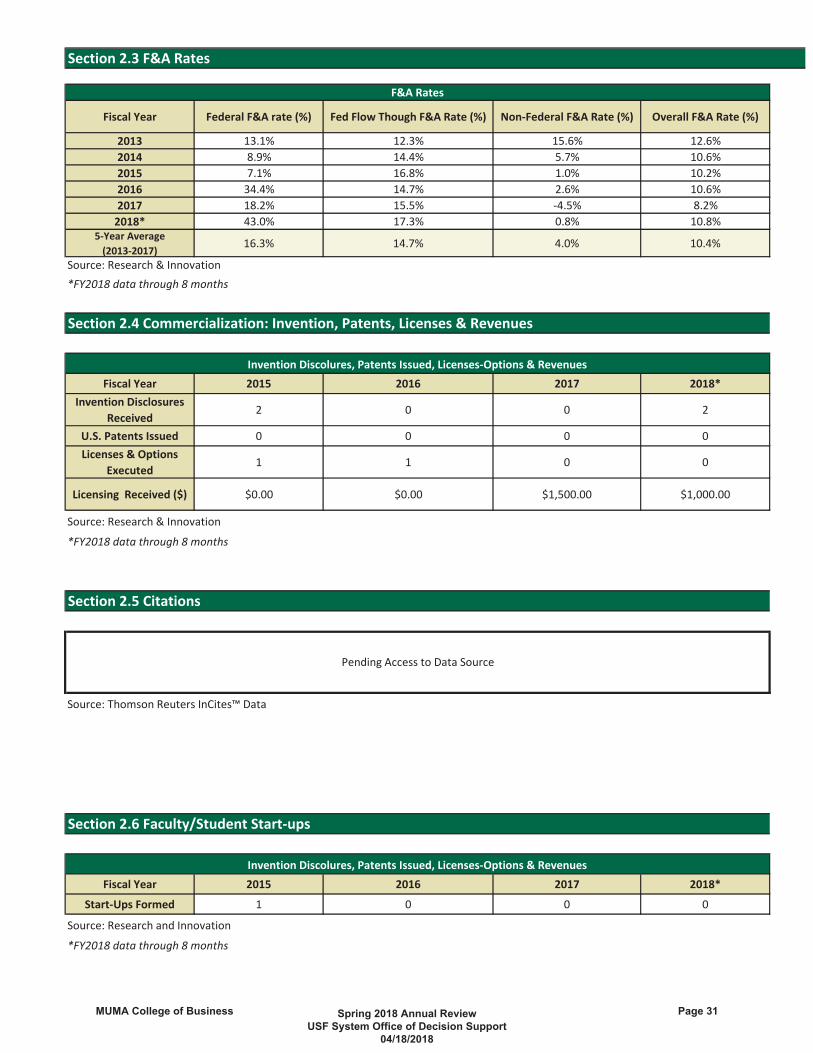
Fiscal Year Federal F&A rate (%) Fed Flow Though F&A Rate (%) Non-Federal F&A Rate (%) Overall F&A Rate (%)
2013 13.1% 12.3% 15.6% 12.6%2014 8.9% 14.4% 5.7% 10.6%2015 7.1% 16.8% 1.0% 10.2%2016 34.4% 14.7% 2.6% 10.6%2017 18.2% 15.5% -4.5% 8.2%
2018* 43.0% 17.3% 0.8% 10.8%5-Year Average
(2013-2017)16.3% 14.7% 4.0% 10.4%
Source: Research & Innovation*FY2018 data through 8 months
Fiscal Year 2015 2016 2017 2018*Invention Disclosures
Received2 0 0 2
U.S. Patents Issued 0 0 0 0Licenses & Options
Executed1 1 0 0
Licensing Received ($) $0.00 $0.00 $1,500.00 $1,000.00
Source: Research & Innovation
*FY2018 data through 8 months
Source: Thomson Reuters InCites™ Data
Fiscal Year 2015 2016 2017 2018*
Start-Ups Formed 1 0 0 0
Source: Research and Innovation
*FY2018 data through 8 months
Section 2.6 Faculty/Student Start-ups
Invention Discolures, Patents Issued, Licenses-Options & Revenues
Section 2.3 F&A Rates
F&A Rates
Section 2.4 Commercialization: Invention, Patents, Licenses & Revenues
Invention Discolures, Patents Issued, Licenses-Options & Revenues
Section 2.5 Citations
Pending Access to Data Source


Section 3. Economic Drivers
Fiscal Year Community Service Proposals Community Service Awards % of Hits
2013 7 5 71%2014 19 14 74%2015 12 17 142%2016 31 26 84%2017 30 19 63%
2018* 29 22 76%5-Year Average
(2013-2017) 21 17 87%
Source: Research & Innovation*FY2018 data through 8 months
Fiscal YearCommunity Service Proposed
AmountCommunity Service Awards
AmountCommunity Service
Expenditures2013 $1,647,462 $1,208,109 $1,428,1992014 $2,077,661 $2,182,318 $2,303,3982015 $963,316 $1,161,746 $1,521,4312016 $6,331,026 $2,266,737 $1,571,8062017 $6,137,803 $2,241,518 $2,113,888
2018* $4,347,260 $2,133,137 $1,564,5225-Year Average
(2013-2017) $3,431,454 $1,812,086 $1,787,745
Source: Research & Innovation*FY2018 data through 8 monthsFor details about internship sections by college, see Appendix 3.1
Goal 3. USF will provide a first class, higher educational institution that drives the economic engine of Tampa Bay.
Section 3.1 Community Engagement
3.1.a. Community Service Proposals & Awards (in Numbers)
3.1.b. Community Service Proposed Amount, Awards and Expenditures (in Dollars)


Sections
Enrollm
ent
SCH
Sections
Enrollm
ent
SCH
Sections
Enrollm
ent
SCH
Und
ergrad
uate
2327
475
428
282
725
1929
679
4Grad
uate
2475
180
2286
206
2283
209
Total
4734
993
450
368
931
4137
91,00
3Und
ergrad
uate
1321
293
613
232
966
1421
198
1Grad
uate
5942
01,40
760
510
1,62
671
608
2,00
5To
tal
7263
22,34
373
742
2,59
285
819
2,98
6Und
ergrad
uate
595
285
510
732
15
112
336
Grad
uate
126
781
2472
122
66To
tal
612
136
36
131
393
613
440
2Und
ergrad
uate
844
011
290
924
9To
tal
844
011
290
924
9Und
ergrad
uate
5957
44,18
452
532
3,34
856
554
3,56
6Grad
uate
2923
476
926
136
496
2413
547
7To
tal
8880
84,95
378
668
3,84
480
689
4,04
3Und
ergrad
uate
1263
106
1365
105
1666
129
Grad
uate
24
122
59
318
36To
tal
1467
118
1570
114
1984
165
Grad
uate
12
126
1696
1027
162
Total
12
126
1696
1027
162
Und
ergrad
uate
120
600
00
00
0Grad
uate
22
71
39
27
25To
tal
322
671
39
27
25Und
ergrad
uate
00
01
15
00
0Grad
uate
2116
334
823
187
388
2423
955
7To
tal
2116
334
824
188
393
2423
955
7Grad
uate
4377
220
3976
190
3566
175
Total
4377
220
3976
190
3566
175
Und
ergrad
uate
825
109
921
109
924
93Grad
uate
11
40
00
00
0To
tal
926
113
921
109
924
93Und
ergrad
uate
827
159
8093
674
104
Total
827
159
8093
674
104
320
2,33
89,48
632
12,39
28,76
432
62,56
69,72
4Source:O
DSInternalUSF
Stud
entInformationSystem
(Banne
r )Note:Sections
fund
edby
USF
Health,Tam
paandLakeland
have
been
presen
ted
Engine
ering
Appe
ndix3.1Co
mmun
ityEn
gagemen
t
InternshipSections
byCo
llege
College
Level
Sprin
g20
16Sprin
g20
17Sprin
g20
18
Artsan
dSciences
Beha
vioralan
dCo
mmun
itySciences
Busine
ss
Coop
erative
Education
Education Gran
dTo
tal
Glob
alSustaina
bility
PublicHe
alth
TheArts
Und
ergrad
uate
Stud
ies
Nursing
Med
icine

Table Metric Definitions
1.1.a. Headcount by Level
This variable reflects percent of students at different levels of the total studentenrollment (headcount); based on fall enrollment. The level is the categorization ofthe student's progress at the beginning of the term toward a specific degree orcertificate as it applies to allocation of resources within the State UniversitySystem.(BOG)
1.1.a., 1.1.d., 1.1.e. Lower LevelA student who has earned less than 60 credit hours, or a student who has not beenadmitted to the upper division. (BOG)
1.1.a., 1.1.d., 1.1.e. Upper LevelA student who has earned 60 or more credit hours or has an associate of arts degreeand has completed requirements in English and Mathematics as prescribed by FAC 6A10.030 or is working toward an additional baccalaureate degree.(BOG)
1.1.a., 1.1.d., 1.1.e. Grad Level IA graduate student who has been formally admitted to a graduate degree programand is not an advanced graduate student.(BOG)
1.1.a., 1.1.d., 1.1.e. Grad Level IIA graduate student who has been formally admitted to a recognized Doctoral or PostMasters's degree program.(BOG)
1.1.b. Headcount by Residency
Reflects percent of in state and out of state students of the total student enrollment(headcount); based on fall enrollment. Residency of a student, within or outside ofthe State of Florida is identified for the purpose of assessing fees at the institution. Astudent shall be classified as Florida or Non Florida as of the first day of classes.(BOG)
1.1.c. Headcount International
Reflects percent of international students (i.e., non resident aliens) of the totalstudent enrollment (headcount); based on fall enrollment. International student is aperson who is not a citizen national of the United States and who is in this country ona visa or temporary basis and does not have the right to remain indefinitely.(BOG)
1.1.d. Enrollment (SCH)
Student Credit Hours (SCH) for a course section is the total number of gross studentcredit hours (SCHs) generated (to the nearest tenth) for the course section based onthe actual enrollment. (BOG)SCH is attributed to a course and in turn to the corresponding college which thecourse is attributed to.
1.1.d. Enrollment (FTE)
Full time Equivalent (FTE) student is a measure of instructional effort (and studentactivity) that is based on the number of credit hours that students enroll by courselevel. Recently,FTE was revised by BOG based on the US definition, which dividesundergraduate credit hours by 30 and graduate credit hours by 24. (BOG)
1.1.d., 1.1.e., 1.1.g.,1.1.i., 1.2.c., 1.3.d.,1.3.e., 1.3.f., 1.5.a.,1.5.d., 1.5.e., 4.2.a.
Academic YearAn academic year consists of Summer and Fall semesters of the given calendar yearand Spring semester of the following calendar year.
1.1.e. Online EducationOnline course is a course in which at least 80 percent of the direct instruction of thecourse is delivered using some form of technology when the student and instructorare separated by time or space, or both (per 1009.24(17), F.S.).(BOG)
1.1.f. Fully Online Program
A fully online program is for which 100% of the direct instruction of the program isavailable using some form of technology when the student and instructor areseparated by time, space or both. All program requirements that cannot becompleted online can be completed off campus.(BOG)Online Degree Programs are updated once a year by the Associate Deans or designeein each college. The fully online programs are those that require an AA or AS foradmission into the program.
Glossary

1.1.g.Undergraduate Experiential& Service Learning
Service learning is a form of community engaged learning that explicitly connectsacademic courses with civic engagement, which includes individual and collectiveactions designed to identify and address issues of public concern, and to make adifference in the civic life of our communities. The key components of service learningare: (1) that it enhances the understanding of course content and is tied to specificlearning goals through consciously designed reflection, (2) that one of the learninggoals is civic engagement, intended to enhance students' sense of personalresponsibility to participate in the public realm to address current pressing socialproblems, and thus going beyond the academic or skill based goals of the course, and(3) that it develops a reciprocal relationship through which the experiential activitiesare planned and implemented through a collaboration with a community partner sothat they meet needs specifically identified by that partner.
The data resource is Banner designated service learning courses and coursesforwarded from each of the schedulers that should have beendesignated in banner as service learning.(Office of Community Engagement and Partnerships)
1.1.h. Undergraduate Research
The data represents the headcounts for the level of undergraduate researchengagement for the academic year as monitored by the Office of UndergraduateResearch (OUR) using specific courses to capture research activity. (OUR, BannerData)
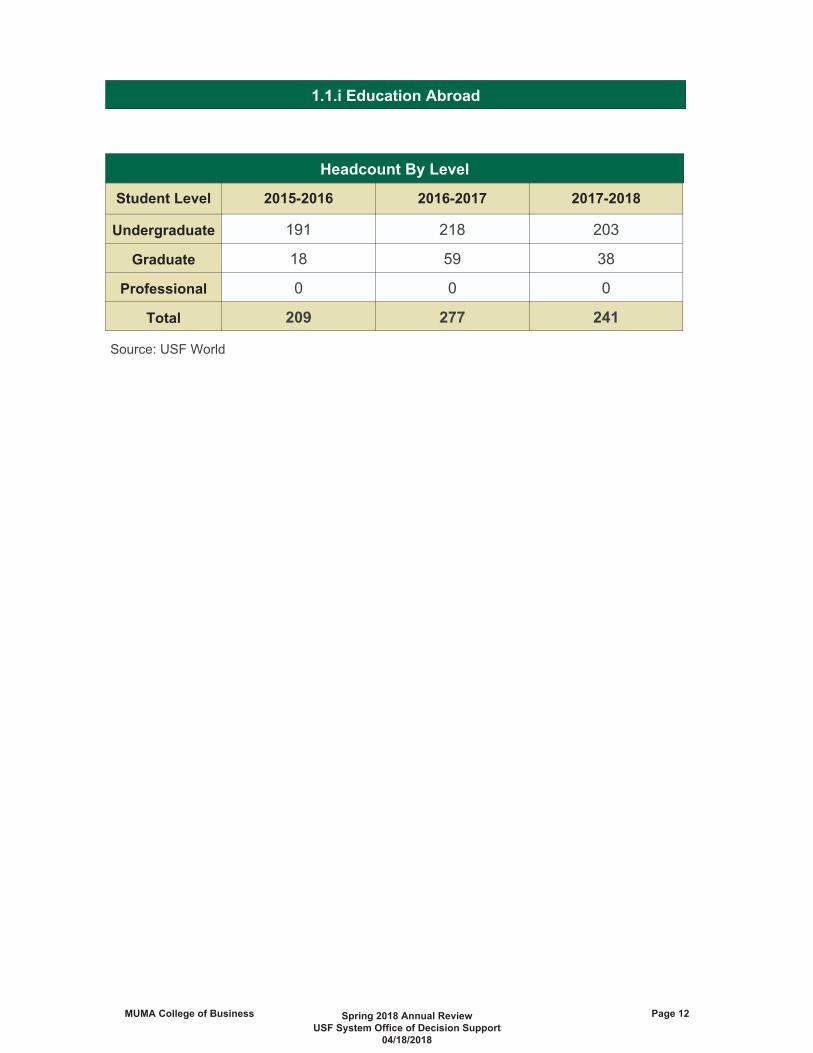
1.1.i. Education Abroad
Unduplicated number of degree and non degree seeking USF students(undergraduate and graduate) by 'home' college, engaging in any international creditbearing and (a small number of) non credit bearing experiences. These internationalexperiences include participation in University sponsored exchanges, faculty ledprograms, international internships, and service learning programs as well asinternational experiences sponsored by another university or third party entity. Thisexcludes independent study.
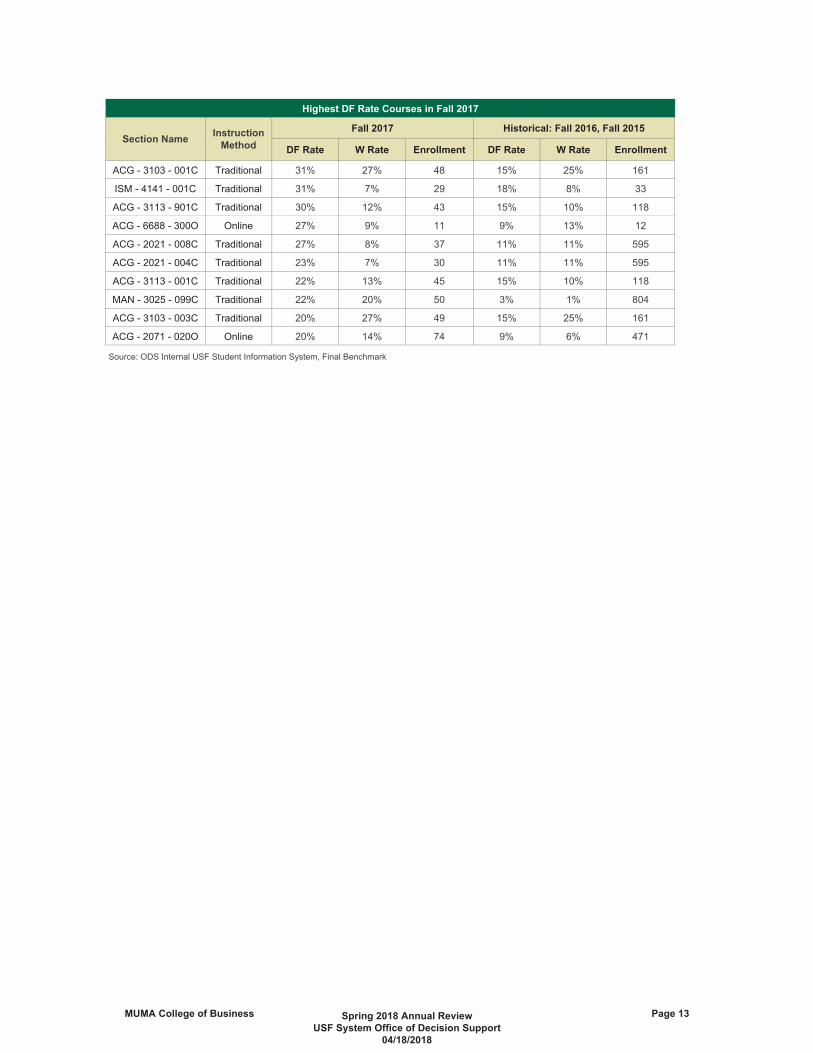
1.2.a. DFW Grade Distribution
Reflects DF and W Rates for courses with enrollment greater than or eqaul to 5. Allgrades were included in the denominator. DF threshold of 10% is based on the meanof DF Rates for courses throughout USF. Grades of ''D', 'D+', 'D ', 'F', 'FF' weregrouped as 'DF' and grades of 'W','W#','W*' were grouped as 'W'. Incompletes 'I'were not included in DF or W.
1.2.b., 1.3.a., 1.3.f.First Time In College Student(FTIC)
FTIC undergraduate students who enter the institution in the Fall term (or Summerterm and continue into the Fall term). (BOG)Cohort Build Methodology has changed from last year to exclude Dually EnrolledHigh School students and to include Former Returning Students.
1.2.b. Second Year Retention Rate
Cohorts are based on undergraduate students who enter the institution in the Fallterm (or Summer term and continue into the Fall term).Percent Retained with Any GPA is based on student enrollment in the Fall termfollowing their first year.Percent Retained with GPA Above 2.0 is based on student enrollment in the Fall termfollowing their first years for those students with a GPA of 2.0 or higher at the end oftheir first year (Fall, Spring, Summer). The most recent year of Retention data is basedon preliminary data (SIFP file) that is comparable to the final data (SIF file) but may berevised in the following years based on changes in student cohorts. (BOG)
1.2.c. Student Flow
This metric depicts how students' flow through a given college toward graduation andrefers to a college's enrollment and annual progression of students. For a givencollege, student flow illustrates student retention (i.e., year to year continuation),attrition (i.e., enrollment reduction due to withdrawals or students changingcolleges), and graduation (i.e., completion of degree).

1.3.a.4 year graduation rate forFTICs
This metric complies with the requirements of the federal Student Right to Know Actthat requires institutions to report the completion status at 200% of normal time (orfour years).This metric does not include students who enrolled as part time students(in their first year), or who transfer into the institution. Percent Graduated reportsthe percent of FTICs who graduated from the same institution within fouryears.(IPEDS)
1.3.a.4 year graduation rate forFTICs (full and part timecohort)
This metric complies with the requirements of the federal Student Right to Know Actthat requires institutions to report the completion status at 200% of normal time (orfour years).This metric does include students who enrolled as part time students (intheir first year).This metric does not include student transfers into the institution.Percent Graduated reports the percent of FTICs who graduated from the sameinstitution within four years.(BOG)
1.3.a.6 year graduation rate forFTICs (IPEDS cohort year)
This metric complies with the requirements of the federal Student Right to Know Actthat requires institutions to report the completion status at 150% of normal time (orsix years).This metric does not include students who enrolled as part time students (intheir first year), or who transfer into the institution. Percent Graduated reports thepercent of FTICs who graduated from the same institution within six years.(IPEDS)
1.3.a.6 year graduation rate forFTICs (full and part timecohort)
This metric complies with the requirements of the federal Student Right to Know Actthat requires institutions to report the completion status at 150% of normal time (orsix years).This metric does include students who enrolled as part time students (intheir first year).This metric does not include student transfers into the institution.Percent Graduated reports the percent of FTICs who graduated from the sameinstitution within six years.(BOG)
1.3.b.2 year graduation rate for AATransfer students (cohortyear)
AA Transfer cohort is defined as undergraduates entering in the fall term (or summercontinuing to fall) and having earned an AA degree from an institution in the FloridaCollege System. For comparability with FTIC cohorts, AA Transfer cohorts are based onundergraduate students who enter the institution in the Fall term (or Summer termand continue into the Fall term) and graduate from the same institution within twoyears.(BOG)
1.3.b.4 year graduation rates forAA Transfer students (cohortyear)
AA Transfer cohort is defined as undergraduates entering in the fall term (or summercontinuing to fall) and having earned an AA degree from an institution in the FloridaCollege System. For comparability with FTIC cohorts, AA Transfer cohorts are based onundergraduate students who enter the institution in the Fall term (or Summer termand continue into the Fall term) and graduate from the same institution within fouryears. (BOG)
1.3.b.2 year graduation rate forOther Transfer students(cohort year)
Other Transfer cohort is defined as undergraduates entering in the fall term (orsummer continuing to fall) and not having earned an AA degree from an institution inthe Florida College System. For comparability with FTIC cohorts, Other Transfercohorts are based on undergraduate students who enter the institution in the Fallterm (or Summer term and continue into the Fall term) and graduate from the sameinstitution within two years.(BOG)
1.3.b.4 year graduation rates forOther Transfer students(cohort year)
Other Transfer cohort is defined as undergraduates entering in the fall term (orsummer continuing to fall) and not having earned an AA degree from an institution inthe Florida College System. For comparability with FTIC cohorts, Other Transfercohorts are based on undergraduate students who enter the institution in the Fallterm (or Summer term and continue into the Fall term) and graduate from the sameinstitution within four years. (BOG)
1.3.c. Time to DegreeThis metric is the number of years between the start date (using date of most recentadmission) and the end date (using the last month in the term degree was granted)for a graduating class within a (Summer,Fall,Spring) year. (Work Plans)

1.3.c., 1.3.d., 1.3.e.,1.5.d.
Degrees Awarded
The number of Undergraduate or Graduate degrees awarded is a count of graduateswith certain skill sets (not an unduplicated count of degrees), so we include all of thedisciplines/CIP codes that a student completes – this includes first majors, secondmajors, and dual degrees. (BOG)
1.3.e.Degrees Awarded Trends inAreas of Strategic Emphasis
This metric is based on the number of Undergraduate or Graduate degrees awardedwithin the programs designated by the Board of Governors as ‘Programs of StrategicEmphasis’. A student who has multiple majors in the subset of targeted Classificationof Instruction Program codes will be counted twice (i.e., double majors are included).(BOG)
1.3.f.Percent Undergraduateswithout Excess Hours byMajor
This metric is based on the percentage of baccalaureate degrees awarded within110% of the credit hours required for a degree based on the Board of GovernorsAcademic Program Inventory. (Work Plans)
1.3.g.Number of Class Sectionswith UndergraduatesEnrolled Number
Definition aligns with that of the Common Data Set Initiative(www.commondataset.org). In sum, a class section is defined as an organizedundergraduate course offered for credit, identified by discipline and number, meetingat a stated time or times in a classroom or similar setting, and not a subsection suchas a laboratory or discussion session. Excludes distance learning classes and noncreditclasses and individual instruction such as dissertation or thesis research, musicinstruction, or one to one readings.
1.4 Student AwardsHighly competitive scholarship/fellowship awards made to USF students (USFWebsite)
1.5.a. Learning OutcomeA specific statement about what students will be able to demonstrate after a certainlevel of instruction
1.5.a. AcceptableRubric score for completed assessment is "Developed" or "Highly Developed." (Newprograms that are developing assessment plans are also graded as "Acceptable," evenif they have not yet completed an assessment report.)
1.5.a. Needs Work Rubric score for completed assessment is "Initial" or "Emerging."
1.5.a. Not Complete One or more of the required components of the assessment report are missing.
1.5.b. New Programs ProposedProposed new degree programs that proceeding through the approval process at theuniversity and, if appropriate, the Board of Governors. Does not include new majorsor concentrations added under an existing degree program CIP Code. (BOG)
1.5.c., 1.5.d. Terminated Programs
Degree programs for which the entire CIP Code at a degree level (B, M, R) is in theprocess of being removed from the BOG’s inventory of degree programs. Does notinclude majors or concentrations terminated under an existing degree program CIPCode if the code is to remain active on the BOG academic degree inventory.
1.5.d.Low Productivity ProgramReview
Degree program productivity measured against thresholds set by BOG and/or USF fornumber of program graduates over a 5 year period. (For threshold specifics refer tosection 1.5.d)
1.5.e.Academic Program Reviewsand External Accreditations
Review required by BOG Regulation 8.015, Academic Program Review. Each programis reviewed on a seven year cycle using criteria established by the BOG and USF.
2.1 Submitted Proposal
An application submitted to a grant sponsor for funding that contains all informationnecessary to describe project plans, staff capabilities, and funds requested. Formalproposals are officially approved and submitted by an organization in the name of aPI.

1.4, 2.1, 2.9, 3.1 Award
Funds that have been obligated by a funding agency for a particular project. Anyinstrument, signed by a contracting officer, providing government funds or otherresources to an offeror that permits expenditure of such government funds or use ofsuch government resources. The provision of funds by a sponsor, based on anapproved application and budget, to an organizational entity or an individual to carryout an activity or project. This includes both direct and indirect costs (F & A) unlessotherwise indicated.
2.2 Total Research ExpendituresTotal expenditures for all research activities (including non science and engineeringactivities) as reported in the National Science Foundation annual survey of HigherEducation Research and Development (HERD).
2.3 F&A Rates
Facilities and administrative cost rates are applied to a Modified Total Direct Cost(MTDC) base. MTDC consists of all salaries and wages, fringe benefits, materials andsupplies, services, travel and the first $25,000 of each subgrant and subcontractregardless of the period covered by the subgrant or subcontract. Equipment,alterations and renovations, charges for patient care and tuition remission, spacerental costs, scholarship, and fellowships, as well as the portion of each subgrant orsubcontract in excess of $25,000 are excluded from the MTDC calculation. (USF)
2.4Commercialization: Patents,Licenses & Revenues
Licenses: The number of licenses or option agreements that were executed in the yearfor all technologies as reported by the Association of University Technology Managersin the annual Licensing Survey. (AUTM)Patents Issued: The number of U.S. patents issued during the period indicated asreported by the Association of University Technology Managers in the annualLicensing Survey. (AUTM)
2.5 Citations Thomson Reuters Citations and Highly Cited Scholars Methodology
2.6 Faculty/Student Start upsNumber of Start up Companies that were dependent upon the licensing of Universitytechnology for initiation – as reported on the Association of University TechnologyManagers Annual Licensing Survey. (BOG)
2.7 Post doctoral Appointees
This metric is based on the number of post doctoral appointees at the beginning ofthe academic year. A postdoctoral researcher has recently earned a doctoral (orforeign equivalent) degree and has a temporary paid appointment to focus onspecialized research/scholarship under the supervision of a senior scholar.Source: National Science Foundation/National Institutes of Health annual Survey ofGraduate Students and Postdoctorates in Science and Engineering (GSS).(BOG)
2.8Non Faculty Researchers withPhD
This variable is the number of non faculty research staff in GSS eligible science,engineering, and health (SEH) units in the fall of the data collection year. Non facultyresearch staff include all doctoral scientists and engineers who are involved principallyin research activities but are not considered either postdoctoral appointees ormembers of the regular faculty. (NSF NIH)
2.9Faculty Awards, Fellowships,and Memberships
The number of institutional affiliated faculty members, per calendar year, receivingawards from 24 prominent grant and fellowship programs in the arts, humanities,science, engineering, and health fields as reported by The Center's Top AmericanResearch Universities (TARU). A list of these faculty awards is available in the TARU'ssource notes. The number reported is for the academic year that preceded thereporting year. The number of faculty awards is also a membership eligibilityrequirement for the Association of American Universities (AAU). A list of the 27awards considered by the AAU is available in the AAU's Membership Policy. (TARU)

3.1 Community Engagement
Community engagement as "collaboration between institutions of higher educationand their larger communities (local, regional/state, national, global) for the mutuallybeneficial exchange of knowledge and resources in a context of partnership andreciprocity. The purpose of community engagement is the partnership of college anduniversity knowledge and resources with those of the public and private sectors toenrich scholarship, research, and creative activity; enhance curriculum, teaching andlearning; prepare educated, engaged citizens; strengthen democratic values and civicresponsibility; address critical societal issues; and contribute to the public good."(Carnegie Foundation)
4.1.a., 4.1.b.
4.1.a., 4.1.b. ProfessorEmployees who are classified as Faculty by their pay plan (Faculty and OPS Phasedretiree) and classification code 9001, 9006, 9007 or 9009 and appointment type notequal to Research. (FAIR)
4.1.a., 4.1.b. Associate ProfessorEmployees who are classified as Faculty by their pay plan (Faculty and OPS Phasedretiree) and classification code 9002 and appointment type not equal to Research.(FAIR)
4.1.a., 4.1.b. Assistant ProfessorEmployees who are classified as Faculty by their pay plan (Faculty and OPS Phasedretiree) and classification code 9003 and appointment type not equal to Research.(FAIR)
4.1.a., 4.1.b. InstructorEmployees who are classified as Faculty by their pay plan (Faculty and OPS Phasedretiree) and classification code 9004, 9014, or 9015 and appointment type not equalto Research. (FAIR)
4.1.a., 4.1.b. LecturerEmployees who are classified as Faculty by their pay plan (Faculty and OPS Phasedretiree) and classification code 9005 and appointment type not equal to Research.(FAIR)
4.1.a., 4.1.b.
1.5.d., 2.6, 2.9,4.1.a., 4.1.b.
FacultyEmployees who are classified as Faculty by their pay plan (Faculty and OPS Phasedretiree) and classification code 9008 or 9177 and appointment type not equal toResearch. (FAIR)
4.1.a., 4.1.b. AdjunctEmployees who are classified as adjunct by their pay plan (OPS Faculty) andappointment type (OPS Adjunct Faculty) and appointment type not equal to Research.(FAIR)
4.1.a., 4.1.b. Graduate AssistantsStudent employees who are graduate assistants by pay plan (OPS Graduate Assistant)and appointment type (OPS Graduate Assistant) and Classification Codes 9183, 9184,or 9550. (FAIR)
4.1.a., 4.1.b.
4.1.a., 4.1.b. ProfessorEmployees who are classified as Faculty by their pay plan (Faculty and OPS Phasedretiree) and classification code 9001, 9006, 9007, or 9009 and appointment type(Research). (FAIR)
4.1.a., 4.1.b. Associate ProfessorEmployees who are classified as Faculty by their pay plan (Faculty and OPS Phasedretiree) and classification code 9002 and appointment type (Research). (FAIR)
4.1.a., 4.1.b. Assistant ProfessorEmployees who are classified as Faculty by their pay plan (Faculty and OPS Phasedretiree) and classification code 9003 and appointment type (Research).(FAIR)
4.1.a., 4.1.b. InstructorEmployees who are classified as Faculty by their pay plan (Faculty and OPS Phasedretiree) and classification code 9004, 9014, or 9015 and appointment type (Research).(FAIR)
4.1.a., 4.1.b. LecturerEmployees who are classified as Faculty by their pay plan (Faculty and OPS Phasedretiree) and classification code 9005 and appointment type (Research). (FAIR)
Instructional Personnel Academic Rank (as defined by IPEDS)
Instructional Personnel No Academic Rank
Research Personnel Academic Rank (as defined by IPEDS)

4.1.a., 4.1.b.
1.5.d., 2.6, 2.9,4.1.a., 4.1.b.
FacultyEmployees who are classified as Faculty by their pay plan (Faculty and OPS Phasedretiree) and classification code 9008, 9120, 9121, 9160, or 9166 and appointmenttype (Research). (FAIR)
4.1.a., 4.1.b. Graduate AssistantsStudent employees who are graduate assistants by pay plan (OPS Graduate Assistant)and appointment type (OPS Graduate Assistant) and classification code 9181 or 9182.(FAIR)
4.1.a., 4.1.b.Other PersonnelAdministrators and Staff
4.1.a., 4.1.b. A & PEmployees who are classified as A&P by their pay plan (A&P Regular and A&PExecutive). (FAIR)
4.1.a., 4.1.b. USPS Employees who are classified as USPS by their pay plan. (FAIR)4.1.a., 4.1.b. OPS Employees who are classified as OPS by their pay plan. (FAIR)
4.1.a., 4.1.b. AdjunctEmployees who are classified as adjunct by their pay plan (OPS Faculty) but not byappointment type (OPS Adjunct Faculty). (FAIR)
4.1.a., 4.1.b. FacultyEmployees who are classified as Faculty by their pay plan but do fit any of the otherinstructional/research faculty criteria above. (FAIR)
4.1.a., 4.1.b. Postdoc Employees who are classified as Postdoc by their pay plan. (FAIR)
4.1.a., 4.1.b.Other Personnel StudentEmployees
4.1.a., 4.1.b. Graduate AssistantsStudent employees who are graduate assistants by pay plan (OPS Graduate Assistant)and appointment type (OPS Graduate Assistant) and classification code 9185. (FAIR)
4.1.a., 4.1.b. Student AssistantsStudent employees who are student assistants by pay plan (OPS Student Assistant).(FAIR)
4.2.a. Tuition
Actual resident & non resident tuition revenues collected from students, net of feewaivers. Source: Operating Budget, Report 625 – Schedule I A. (BOG)Tuition dollars reflected exclude the portion of differential tuition that is associatedwith Financial Aid.
4.2.a. Net Tuition
The actual average of the total costs of tuition and fees (which will vary by incomegroup due to the amount of credit hours students are enrolled) minus the averageGift Aid amount.(BOG)Tuition dollars reflected exclude the portion of differential tuition that is associatedwith Financial Aid.
4.3.a. Annual Fundraising
Reflects contributions (in current dollars) given to the institution. The annual givingdata include all contributions actually received during the institution’s fiscal year inthe form of cash, securities, company products, and other property from alumni, nonalumni individuals, corporations, foundations, religious organizations, and othergroups. Not included in the totals are public funds, earnings on investments held bythe institution, and unfulfilled pledges. The amount shown is in thousands.
Research Personnel No Academic Rank

PRELIMINARY
NewMetric PBF PE AAU Metric AP CR
I. Enrollment AY ( U + F + S )
1a Undergraduate Lower Level FTE 1.1.d
1b Undergraduate Upper Level FTE 1.1.d
1c Graduate Beginner Level FTE 1.1.d
1d Graduate Advanced Level FTE 1.1.d
1 Total FTE (Gross) Pg 18 1.1.d
II. Online Enrollment AY ( U + F + S )
2 Undergraduate Distance Learning FTE (Gross) Pg 18 1.1.e
3 Graduate Distance Learning FTE (Gross) Pg 18 1.1.e
III. High Impact Practices AY ( U + F + S )Credit Non Credit Total
4 Education Abroad: No. of Unduplicated Students (Credit|Non Credit|Total) AY ( F + S + U) 238 3 241 1.1.i
5 Undergraduate Research Activities (Number of Students) 1.1.h
6 Internships (Number of Students)
7 Service Learnings (Number of Students) 1.1.g
IV. Net Tuition AY ( U + F + S )
8a Undergraduate: In state 4.2.a
8b Undergraduate: Out of state 4.2.a
8c Graduate: In state 4.2.a
8d Graduate: Out of state 4.2.a
8 Grand Total 4.2.a
V. Performance
A. Student Access
* * Average GPA and SAT Score for Incoming Freshmen (Fall) Pg 9
* Freshmen in Top 10% of High School Graduating Class for Incoming Freshmen (Fall) Pg 12
* Freshman Acceptance Rate for Incoming Freshmen (Fall)
* University Access Rate (Percent of Undergraduates with a Pell Grant) (Fall) Pg 8
* Average Cost to the Student (Net Tuition & Fees per 120 Credit Hours for Resident Undergraduates) Pg 7
B. Student Success
Academic Retention/Progress Rate (Fall) S/F 2015Cohort
n % S/F 2016Cohort
n % S/F 2016Cohort
n %
9 * * Freshman Retention Rate (Full time, FTIC): USF 520 457 87.9% 526 479 91.0% 526 478 90.9% Pg 9 1.2.b
9a Freshman Retention Rate (Full time, FTIC): SAME COLLEGE 520 413 79.4% 526 426 81.0% 1.2.b
10 * Academic Progress Rate (2nd Year Retention with GPA above 2.0): USF 520 445 85.6% 526 463 88.0% 526 460 87.5% Pg 7 1.2.b
10a Academic Progress Rate (2nd Year Retention with GPA above 2.0): SAME COLLEGE 520 406 78.1% 526 416 79.1% 1.2.b
4 year Graduation Rate (Note: Current Year Data reflects Fall only)S/F 2013Cohort n %
S/F 2014Cohort n %
S/F 2014Cohort n %
11 * 4 Year Graduation Rate (Full time, FTIC): USF 479 326 68.1% 511 349 68.2% 511 162 31.7% Pg 7 1.3.a
11a 4 year Graduation Rate (Full time, FTIC): SAME COLLEGE 479 279 58.2% 511 140 27.4% 1.3.a
6 year Graduation Rate (Note: Current Year Data reflects Fall only) S/F 2011Cohort
n % S/F 2012Cohort
n % S/F 2012Cohort
n %
12 * * 6 Year Graduation Rate (Full time, FTIC): USF 381 281 73.8% 442 345 78.0% 442 324 73.3% Pg 9 1.3.a
12a 6 year Graduation Rate (Full time, FTIC): SAME COLLEGE 381 217 57.0% 442 264 59.7% 1.3.a
13 * 6 year Graduation Rate (Full and Part time, FTIC): USF 386 283 73.3% 443 346 78.0% 443 324 73.1% 1.3.a
13a 6 year Graduation Rate (Full and Part time, FTIC): SAME COLLEGE 386 218 56.5% 443 264 59.6% 1.3.a
2 Year Graduation Rate for Transfers (Note: Current Year Data reflects Fall only) S/F 2015Cohort
n % S/F 2016Cohort
n % S/F 2016Cohort
n %
14 2 year Graduation Rate (AA Transfers): USF 357 135 37.8% 378 132 35.0% 378 22 5.8% 1.3.b
14a 2 year Graduation Rate (AA Transfers): SAME COLLEGE 357 132 37.0% 378 22 5.8% 1.3.b
4 Year Graduation Rate for Transfers (Note: Current Year Data reflects Fall only) S/F 2013Cohort
n % S/F 2014Cohort
n % S/F 2014Cohort
n %
15 4 year Graduation Rate (AA Transfers): USF 336 239 71.1% 336 232 69.0% 336 238 70.8% 1.3.b
15a 4 year Graduation Rate (AA Transfers): SAME COLLEGE 336 219 65.2% 336 221 65.8% 1.3.b
Degree Productivity AY ( U + F + S )
16 Bachelors Degrees Awarded 1.3.d
17 Masters Degrees Awarded 1.3.d
18 * * Doctoral Degrees Awarded Pg 11 1.3.d
Total n % Total n % Total n %
19 *Bachelor's Degrees Awarded in Areas of Strategic Emphasis (includes STEM)(% of total USF Tampa Bachelor's degrees in Strategic Emphasis) 5,297 714 13.5% 5,201 728 14.0% 2,623 421 16.1% Pg 8 1.3.e
19a Percent of Bachelor's Degrees Awarded in STEM and Health Pg 14
20 *Graduate Degrees Awarded in Areas of Strategic Emphasis (includes STEM)(% of total USF Tampa Graduate degrees in Strategic Emphasis) 3,076 252 8.2% 3,051 271 8.9% 1,676 200 11.9% Pg 8 1.3.e
20a Percent of Graduate Degrees Awarded in STEM and Health Pg 14
21 * Percent of Bachelors Degrees Without Excess Hours (1 year lag) 1,083 856 79.0% 1,105 851 77.0% 1,175 979 83.3% Pg 8 1.3.f
22 Student Awards (ONS) 1.4
Student to Faculty Ratio (Fall)
Undergraduate Class Sections (Fall) 2 9 1.3.g
Undergraduate Class Sections (Fall) 10 19 1.3.g
Undergraduate Class Sections (Fall) 20 29 1.3.g
Undergraduate Class Sections (Fall) 30 39 1.3.g
Undergraduate Class Sections (Fall) 40 49 1.3.g
Undergraduate Class Sections (Fall) 50 99 1.3.g
Undergraduate Class Sections (Fall) 100+ 1.3.g
Undergraduate Class Sections (Fall) Total 1.3.g
C. Faculty Excellence
23 * Faculty Awards (CY) (TARU only) Pg 14 2.9
24 * * * Number of Postdoctoral Appointees (Fall) Pg 8 2.7
25 Number of Full time Instructional Faculty (Fall) 1.3.d
D. Research: Productivity (FY)
26 Grant Proposals Submitted 2.1
26a Grant Proposals Awarded (new and continuing) 2.1
27 * Total Sponsored Research Expenditures ($M) 2.2
27a Federal Research Expenditures ($M) (Sum of Federal Expenditures + Federal Flow Through Expenditures) Pg 16
28 Overall F&A Rate (%): College 2.3
E. Research: Innovation & Commercialization
29 Invention Disclosures Received (FY) 2.4
F. Philanthropic Support
30 Gifts Received ($1000s) (total commitment) (FY) 4.3a
Legend: AP Accountability Plan CR College Reviews
AY 2015 2016 AY 2016 2017 AY 2016 2017
9 9
169 171
16
47 26
46 56
40 52
$2,804,670 $5,000,000 $3,397,646
0 TBD 0
COLLEGE OF BUSINESSPLANNING, PERFORMANCE & ACCOUNTABILITY 2017 2018
94 TBD 96
0 0 0
4 7 0
10 9 26
$2,435,459 Tracked $2,140,091
8.2% 8.3% 10.8%
$2,460,686 $2,509,899 $1,670,573
$1,643,258 Tracked $955,689
3 1 1
509 519 308
$7,642,663 $7,795,516 $5,125,560
44.68 46.14
3 2
8 10
16
1,287 1,313 731
AY 2016 17 AY 2017 18 AY 2017 18
Tracked
Tracked
Tracked
Tracked
Tracked
Tracked
Tracked
$9,359,657 Tracked $10,084,765
103 160
$5,145,947 Tracked $5,361,516
$24,645,980 $24,671,640 $27,126,167
$6,653,298 Tracked $7,712,378
$3,487,078 Tracked $3,967,508
216 183 252
704 654 771
272 274
385 435
957 Tracked
280 329
1,084
3,674 3,674 3,995
95 Tracked 115
Credit Only Credit Only
2016 2017End of Year
2017 2018Goal
2017 2018Progress to Goal #2
2,169 Tracked 2,338
452 Tracked 458
Prepared by: Office of Decision Support PRELIMINARY 4/23/2018