2018 annual report - nammo · ammunition for the f-35, or powering a new generation of space...
TRANSCRIPT

Annual Report
2018

Front page: Nammo completed the first man fire of the new M72 Fire From Enclosure at its Mesa, Arizona facility in June 2018
2
Morten BrandtzægPRESIDENT & CEO
I am pleased to present Nammo’s annual results for 2018.
I believe this might well be the year we will look back on as the one where we defined the future of our company.
We took a major step towards becoming the world leader in range extension technologies, which may lead to one of the biggest changes in the role of artillery and missiles on the battlefield in decades.
We concluded development of the M72 Fire From Enclosure, allowing soldiers and marines to fight and win with far less risk to themselves and their comrades in arms.
We launched Nucleus, powered by our new hybrid rocket engine that could propel the next generation of small satellites into orbit.
And not least, we did it all while continuing to keep our promise to our customers of delivering them a wide range of products, that, old or new, provide them with a truly reliable advantage.
OUR COMMITMENT
At a time when Western democracies are facing challenges on a scale not seen since the end of the Cold War, we are reminded of the importance of that promise.
In a world that is becoming ever more divided and more fearful of its future, we look to the dedicated individuals who, whether in our out of uniform, work to keep us safe, to help us explore, and to make us proud. Nammo’s mission is to enable these individuals to do just that. Our commitment to our customers must go beyond what can be captured by a contract.
Nammo’s 2018 results, with record sales and order books, confirm that this commitment is being both recognized and appreciated.
THE FUTURE OF NAMMO
Going forward our job is to do something even harder than simply grow: to combine increased sales with increased profitability. This is not easy, but neither is developing 150 km artillery shells, next generation ammunition for the F-35, or powering a new generation of space launchers.
We will do this by building on the strenghts that have made us what we are today.
Embodying our values of Dedication, Precision and Care, every day, in everything we do.
A flat, non-bureaucratic organization, driven by customer needs, offering a truly reliable advantage.
We will simplify, streamline and improve our organization. We will remove any obstacles that keep us from delivering our best.
And we will remain committed to pursuing niche technologies that deliver not only on the requirements of today, but help our customers take on the challenges of tomorrow.
This way, together with our customers and partners, we will do our part in securing the future.
A DEFINING YEAR FOR NAMMO

3
NO
K 4
920
mill
ion
Key figures
41% NORTH AMERICA
10% OTHER
29% REST OF EUROPE
20% NORDIC COUNTRIES
(NOK MILLION) 2018 2017 2016 2015 2014 2013
Order Stock 5 813 4 645 4 767 5 130 3 853 3 832
Revenue 4 920 4 462 4 132 3 783 3 718 3 703
Earnings Before Interest and Tax (EBIT) 362 367 384 284 286 489
Total Assets 6 083 5 632 5 050 4 641 4 011 3 666
Total Equity 2 688 2 537 2 383 2 329 2 069 1 835
Average Man Years 2 409 2 217 2 102 2 088 2 160 1 954
Return on Sales (ROS) 6.8% 7.6% 9.3% 7.2% 7.5% 13.0%
ORDER STOCK
EARNINGS BEFORE INTEREST AND TAX (EBIT)
REVENUE SALES PER REGION
600
500
400
NO
K m
illio
n
300
200
100
0
6 000
NO
K m
illio
n
NO
K m
illio
n4 000
5 000
3 000
2 000
1 000
2018 20182017 20172016 20162015 20152014 20142013 20130
2018 2017 2016 2015 2014 2013
5 000
4 000
3 000
2 000
1 000
NO
K 5
813
mill
ion
0
16 Income statement 34 Income statement
17 Balance sheet 35 Balance sheet
19 Cash flow 37 Cash flow
20 Consolidated financial statements
38 Financial statements
NAMMO GROUP NAMMO AS468
FASTER, HIGHER, LONGER
GROWING WHILE CHANGING
BOARD OF DIRECTORS’ REPORT 2018
4548
AUDITOR’S REPORT
CORPORATE GOVERNANCE
Contents

The 30 mm MK258 Mod 1 “Swimmer” has been adopted by both the US Navy and the US Army.
4
SpaceX and Blue Origin are not the only ones changing the space launch market.
This led to several generations of large and extremely robust, but also very expensive launchers and satellite designs. Once the Cold
War ended, that began to change. Though very capable, traditional space technologies simply cost too
much, and they were not able to adapt quickly enough to new
technologies, and not least to the demands of the
commercial market,” said Frank Møller,
VP of Business Development
for
A SMALL STEP FOR SPACE TRAVEL, A GIANT LEAP FOR NAMMO
SpaceX and Blue Origin are not the only ones changing the space launch market. In addition to the reusability pioneered by these companies, miniaturization has also helped bring about a different balance between cost, capability and endurance, thereby opening up the market to a large number of new players.
“Until about 20 years ago, the cost of space launches and the
design of space craft was largely been driven by
very stringent military requirements
where cost was not a major
driver.
Aerospace Propulsion in Nammo.
As an industry veteran with more than 30 years of experience within the military propulsion market, Møller believes Nammo during 2018 proved that it has something unique to offer also to the commercial market.
“Our specialty has always been as a nimble and independent provider always working to find new ways of delivering what our customers need, and with Nucleus we showed that we are also able to bring these capabilities to bear outside the military market.”
GETTING MORE FROM WHAT THEY’VE GOT
Nammo’s strategy has long been to position itself as a niche provider, relying on technology and superb quality to win business. Now, with several countries responding to changing security requirements by upgrading vehicles, ships and aircraft with improved weapon systems, that strategy is paying off.
“Replacing a large platform or weapon system continues to get more and more expensive and time consuming, and quite often it isn’t even an option. Operational needs are changing so fast that it would simply take too long to build something new. So we are seeing considerable interest in the kind of
technologies that we have been developing, and how they
could be used to help countries get more
performance from the
2018 became a year of firsts for Nammo. In addition to record high revenues, a record high order book, it was also the year when a Nammo-made rocket engine powered first space launch, with the Nucleus sounding rocket reaching an altitude of 107 km during its September mission from Andøya, Norway.
FASTER, HIGHER, LONGER

Nammo presented its concept for ramjet-powered artillery at
Eurosatory in Paris in June 2018.
5
Replacing a large platform or weapon system continues to get more and more expensive
equipment they already have in service,” said Bård Ljones Stenberg, Nammo’s VP of International Sales and Marketing.
He highlights three areas in particular which has gained considerable interest over the past year.
“The first is added armor penetration for lighter units.
The second is adding range to existing and future artillery systems. And the third is in programmable ammunition, which currently is seeing a lot of interest due to the increased threat from drones. All of these are core areas of expertise for Nammo, and where we believe we are bringing something unique to the market,” said Ljones Stenberg.
PUSHING BOUNDARIES
On the back of the success of its current technologies, Nammo is continuing to push boundaries. The latest two are ramjet propulsion and polymer cased ammunition.
“Base bleeds and rocket assisted projectiles do help in extending artillery range, but not enough. To get really revolutionary range extension we have to use air breathing projectiles, and we believe our ramjet artillery has the potential to radically change the role of artillery on the battlefield,” said Thomas Danbolt,
VP of Nammo’s Large Caliber Ammunition business unit.
Since introducing the concept at Eurosatory in June 2018, Nammo has conducted initial short range test firings of the ramjet shell in to confirm that the design survives the force of the launch. Additionally, it has completed test firings of the ramjet engine to prove that those same forces are sufficient to ignite the engine, and that it will sustain a burn long enough to allow the shell to reach its expected range. These tests will allow the team to move forward with preparations for powered ballistic tests in early 2020.
Polymer ammunition cases is another, where Nammo during 2018 secured a controlling stake in US-based Mac LLC, one of the companies that is been at the forefront of bringing lightweight ammunition into service.
“This is a technology that is gaining traction. USSOCOM is using Mac-cases on ammunition carried by helicopters, adding range and time on station. Going
forward we will be expanding our offering in this area by merging more of our high-performance projectiles with polymer cases, giving the user the ability to choose what is right for their mission,” said David Rolen, Nammo’s Director of US Business Development and Marketing.
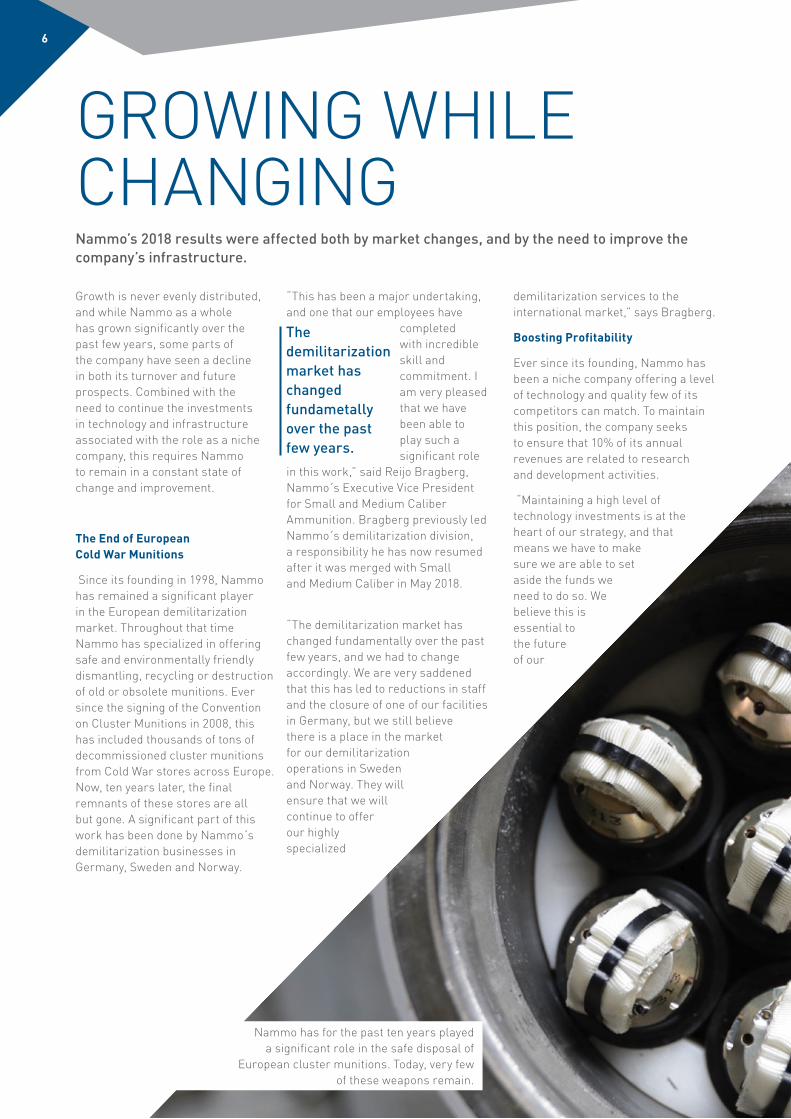
Nammo has for the past ten years played a significant role in the safe disposal of
European cluster munitions. Today, very few of these weapons remain.
6
The demilitarization market has changed fundametally over the past few years.
Growth is never evenly distributed, and while Nammo as a whole has grown significantly over the past few years, some parts of the company have seen a decline in both its turnover and future prospects. Combined with the need to continue the investments in technology and infrastructure associated with the role as a niche company, this requires Nammo to remain in a constant state of change and improvement.
The End of European Cold War Munitions
Since its founding in 1998, Nammo has remained a significant player in the European demilitarization market. Throughout that time Nammo has specialized in offering safe and environmentally friendly dismantling, recycling or destruction of old or obsolete munitions. Ever since the signing of the Convention on Cluster Munitions in 2008, this has included thousands of tons of decommissioned cluster munitions from Cold War stores across Europe. Now, ten years later, the final remnants of these stores are all but gone. A significant part of this work has been done by Nammo s demilitarization businesses in Germany, Sweden and Norway.
“This has been a major undertaking, and one that our employees have
completed with incredible skill and commitment. I am very pleased that we have been able to play such a significant role
in this work,” said Reijo Bragberg, Nammo s Executive Vice President for Small and Medium Caliber Ammunition. Bragberg previously led Nammo s demilitarization division, a responsibility he has now resumed after it was merged with Small and Medium Caliber in May 2018.
“The demilitarization market has changed fundamentally over the past few years, and we had to change accordingly. We are very saddened that this has led to reductions in staff and the closure of one of our facilities in Germany, but we still believe there is a place in the market for our demilitarization operations in Sweden and Norway. They will ensure that we will continue to offer our highly specialized
demilitarization services to the international market,” says Bragberg.
Boosting Profitability
Ever since its founding, Nammo has been a niche company offering a level of technology and quality few of its competitors can match. To maintain this position, the company seeks to ensure that 10% of its annual revenues are related to research and development activities.
“Maintaining a high level of technology investments is at the heart of our strategy, and that means we have to make sure we are able to set aside the funds we need to do so. We believe this is essential to the future of our
Nammo’s 2018 results were affected both by market changes, and by the need to improve the company’s infrastructure.
GROWING WHILE CHANGING

7
Maintaining a high level of technology investments is at the heart of our strategy, and that means we have to make sure we are able to set aside the funds we need to do so.
company, ” said Stein Erik Ommundsen, Chief Financial Officer for the Nammo Group.
To this end, Nammo has started a series of initiatives over the past few years aimed at improving the efficiency of the company.
“Improving efficiency is something every company has to do regularly, and particularly one that has grown as fast as we have. There are structures and processes that may have made sense 10 years ago, but not for where we are today,” said Ommundsen.
During 2018, Nammo incurred significant one-time restrucuring costs related to the closure and relocation of activities. Ommundsen does not expect similar costs during 2019.
“Last year we decided to make several larger structural adjustments, even though it hurt our bottom line. Long term, however, there was no doubt that these changes had to be made, and we expect that they will help improve our profitability already in 2019.”
Nammo’s growth 1998 2018
People
Countries
Locations
1100 2400
4 13
8 34

8
The net income of the year amounted to NOK 240 million, compared to NOK 203 million in 2017. Costs incurred in 2018 from restructuring and transformation initiatives are expected to yield improved profitability in subsequent years.
The Board of Directors will propose an ordinary dividend of NOK 120.1 million (NOK 90.3 million) at the annual general meeting. The order backlog stood at a record high NOK 5 813 million (4 645) at year-end, which confirms that the market continues to respond positively to the products and solutions offered by Nammo. Combined with general market trends, this offers strong prospects for continued growth for the company.
GENERAL COMMENTS
Nammo is an international aerospace and defense company headquartered in Norway. Founded in 1998 from a merger of Norwegian, Swedish and Finnish ammunition manufac-turers, the new company was tasked to grow and develop in the international market during times of peace to ensure its ability to support its home markets in times of crisis and war.
Through 20 years of growth, Nammo has expanded its footprint substantially, and today operates production facilities in eight European countries and in the United States. Consequently, Nammo plays a significant role in the current defense and security infra-structure of NATO and its
partners, providing technologies, components and products critical to their national defense.
Nammo’s core competence continues to be within military specialty ammunition and rocket motors. The company is also a major manufacturer of commercial ammunition, with several strong brands within hunting and competition shooting.
STRATEGY FOR PROFITABLE GROWTH
The core of Nammo’s strategy continues to be achieving profitable growth in the US, in Europe and in the Nordic markets. It is particularly important to maintain the company’s market position in the Nordic countries, and to be a reliable partner to their armed forces and governments. Whenever possible, Nammo will also seek to develop new markets and industrial partnerships to promote its products and technologies.
Securing and improving profitability is crucial to Nammo’s continued development. This will be achieved primarily through rationalization of operational and legal structures, as well as through cost reductions and savings, while divestments of non-core activities will also be considered. These measures are necessary to ensure that Nammo has the financial resources to further develop performance
in current businesses and that Nammo is able to stay ahead of competition by investing in market leading technologies, products and processes. This will also allow Nammo to continue the search for acquisition opportunities of high strategic value close to its core business that offers synergies and growth potentials.
Nammo values its independence and reputation with customers and partners, and the company will both seek to protect and leverage these as it continues to grow. Nammo will also continue to build its commercial brands and the core Nammo brand, focusing on delivering a truly reliable customer advantage.
OPERATIONS
While Nammo in 2018 again demonstrated ability to deliver on growth targets profitability has not shown a similar trend and meets neither needs nor ambitions for the future. Consequently, the Nammo management team has adopted a number of measures to secure long-term profitability.
Several such initiatives are already underway, including company-wide programs working to reduce both structural, operational, supply chain, managerial and organizational costs. These activities are supported by continued development of process excellence. In 2018, a substan-tial part of the organization has undergone training in Lean 6 Sigma.
Nammo concludes 2018 with double digit growth and record high order stocks, combined with strong efforts for further improvement of long term profitability. Going forward, Nammo’s success will depend on its ability to continue development of market leading niche technologies, and to support these through a strong customer focus, state-of-the-art processes and a competent workforce operating within an effective organizational structure.
BOARD OF DIRECTORS’ REPORT 2018

9
BOARD OF DIRECTORS’ REPORT 2018
Other efforts have included continued rationalization and consolidation of physical infra-structure. In that sense, 2018 has been a year of transformation where a signi¬ficant amount of restructuring costs have been absorbed by the bottom line in the interest of future profita-bility. The main measures carried out over the past year have included:
• Relocation of shoulder fired launcher production activities in Davidsville, PA, to Mesa, AZ. This initiative started in 2017, and the 2018 income statement includes non-recurring costs related to the re-establishment of these activities in Mesa. • Merging the business units Demilitarization, Sea Safety and Services and Small and Medium Caliber Ammunition, and closure of the site in Pinnow, Germany. Both were a direct consequence of negative outlooks in the European demilitarization market.
• Consolidation of the military activities in Sweden and discontinuation of all military production at the Lindesberg site.
In total, closing the Pinnow site and ending military production at Lindesberg affected about 90 employees. Furthermore, the 2018 accounts carried NOK 96 million of losses for sites under restructuring.
In the United States Nammo continues to invest in order to strengthen the ability to contri¬bute to the US industrial base. The company remains committed towards the private public partnership with the US Navy at Indian Head, MA, which is key to provide a much
needed boost to the US solid rocket motor manufacturing capability.
Nammo also continues to invest in its commercial ammunition manufacturing and distribution capability in the United States. In 2017 Nammo acquired the California-based Berger Bullets and subsequently relocated the manufacturing facilities to Mesa, AZ. The company then became part of the newly formed Capstone Precision Group (CPG), which also established a distribution center in Sedalia, MO, that now distributes both Berger and Nammo’s other commercial products to retailers throughout the US. 2018 was the first full year of operations for CPG. The US market for commercial ammunition has remained soft in 2018, though the Nammo remains confident that the measures and investments made in manufacturing and distribution channels will contribute towards improved profitability over the coming years.
Another significant development in the US was Nammo’s acquisition of 45 percent of the membership interests in MAC LLC. Based in Bay St. Louis, MS, MAC LLC is one of several companies developing and manufacturing a new generation of lightweight polymer cartridge cases. In December, Nammo exercised the option to acquire another 10 percent of the company. With 55 percent of the total share capital, Nammo now holds a controlling interest in MAC LLC.
This investment reflects Nammo’s need, as niche player, to stay ahead of competition through innovation. Beyond polymer ammunition, there
is also considerable interest in the international defense market for other parts of Nammo’s advanced technologies, including long range, armor piercing and precision products, within both ammunition and tactical rocket motors. In addition there is considerable interest in Nammo’s space propulsion capa¬bilities, particularly following the successful launch of the Nucleus in September, the first rocket powered by a Norwegian motor to enter space.
FINANCIAL STATEMENTS
Pursuant to Section 3-3a of the Norwegian Accounting Act, the Board of Directors confirms that the financial statements have been prepared under the assumption of a going concern as of the date of the financial statements. The Board confirms that the going concern assumption is valid. The Nammo Group’s annual accounts have been prepared in accordance with the Norwegian Accounting Act and Generally Accepted Accounting Principles (N GAAP). The accounting policies used by the Nammo Group have also been applied by Nammo AS and all subsidiaries. For further information, please refer to the financial statements and note disclosures.

10
BOARD OF DIRECTORS’ REPORT 2018
Operating profit and profitability
Nammo reported revenues of NOK 4 920 million in 2018 (4 462), which is 10.3 percent higher than 2017. The largest single market for Nammo is the US, which represented 39 percent of total Nammo revenues in 2018. Earnings Before Interest, Taxes, Depreciation and Amortization (EBITDA) ended at NOK 545 million (539). The accounts for 2018 include NOK 96 million in operating losses and restructuring costs for the closing of the Lindesberg, Pinnow and Davidsville sites. Net financial expenses were NOK 31 million in 2018 (25.5) and 2018 Net Income was NOK 240 million in 2018 (203).
Cash flow and liquidity
Nammo’s net cash flow from operating activities in 2018 was NOK 293 million (177) whilst the net cash flow from investment activities was NOK -379 million (-484). The acquisition of 55 percent of shares in MAC, a US based manufacturer of lightweight polymer cartridge cases amounted to NOK -71 MNOK. The 2018 net cash flow from financing activities amounted to NOK -134 million (+30). The largest contributor to the deterioration was funding from a long-term loan in 2017 that did not reoccur in 2018. The net debt position cash was MNOK -35 million on 31 December 2018 (+185). Nammo had unutilized credit facilities of NOK 864 million (672) measured at the exchange rates on 31 December 2018. In December Nammo extended its revolving multicurrency credit facility with SEB by NOK 300 million. In spite of the 2018 cash flow performance, Nammo’s financial flexibility is considered to be good. Continued focus on working capital efficiency and careful prioritization of investment requirements are focus areas going forward.
Balance sheet
The total assets of the Nammo Group amounted to NOK 6 084 million at the end of 2018 (5 632). Net working capital, excluding cash, was NOK 2 020 million (1 885), while equity was NOK 2 688 million (2 537). Total liabilities were NOK 3 395 million (3 095) at 31 December 2018 and the equity ratio ended at 44 percent in 2018 (45 percent). Total interest-bearing debt to financial institutions amounted to NOK 1 342 million (1 323) at 31 December 2018. RISK FACTORS
Nammo operates in a global market characterized by a potential for unexpected and rapid shifts in political stability, technology, products, exchange rates and other risk factors. Risk management is therefore an integral part of Nammo’s strategic and operative business management, with the aim of supporting both strategic and financial goals. Market risk
The operational and financial development of the Nammo Group is highly reliant on the overall development of the military and commercial ammunition markets. The fact that Nammo operates through five business units, each within a number of different business areas, and a large range of products, is regarded as an advantage, as it spreads the risk over a broad platform of business areas and activities.
Nammo has manufacturing activities in nine different countries, each country having its own export regulations with which Nammo is required to comply. Where export licenses are necessary to address a market, Nammo carries the risk that these might be revoked by the appropriate authorities at any point in time for matters that are beyond Nammo’s control, such as geopolitical changes.
Operational risk
The Group’s value creation consists mainly of products and systems of high technological complexity. Efficient contract management is an important success factor in reducing operational risk along with up-to-date process management systems such as those now being introduced throughout the entire company. Safety is a key priority to Nammo, and the company has established routines and procedures designed to minimize overall operational risk, particularly those related to the handling of explosives and other hazardous material. Finally, procedures have been implemented to secure deliveries of critical raw materials and key components from suppliers. Product safety is an important element governed by the management system.
Financial risk
Nammo has established guidelines for financial risk management at both the corporate and business unit levels. The following have been identified as the key financial risk areas for the Nammo Group:
Currency risk: Nammo’s customer base is global, and currency fluctuations have a major impact on the Group’s financial statements. In light of this, currency risk is continuously monitored through internal risk matching and hedging in the market, using financial instru-ments to secure the calculated earnings on contracts and thereby reducing exposure to fluctuations. Nammo is also exposed to currency risks in relation to equity in subsidiaries and joint ventures reported in foreign currencies. Translation risk is partly reduced through hedge accounting of long-term debt.
Commodity price risk: Price volatility related to copper, steel

11
BOARD OF DIRECTORS’ REPORT 2018
and other raw materials can directly affect Nammo’s operating expenses and can have an effect on the Group’s reported operating results. Nammo reduces this risk by entering into commodity hedges for all the significant purchase transactions of metals that it is possible to hedge in the market.
Liquidity risk: The management of liquidity risk means maintaining sufficient cash and cash equivalents and having funding available through adequate committed credit facilities. Nammo maintains a high degree of financial flexibility via both of the above.
Credit risk: Nammo’s customers are mainly national defense ministries and major companies in the defense and space industry in NATO and EU countries. The inherent credit risk is thus considered low. Credit risk is evaluated annually, and the risk associated with outstanding trade receivables is currently considered low.
Interest rate risk: Interest rate risk for the Nammo Group is monitored and continuously assessed during the year. The main risk is related to long-term financing of the Group and is handled at corporate level. The risk is considered limited.
Reputational risk
Nammo’s reputation is one of the company’s most valuable assets. To protect the Group’s reputation, focus on building a strong company culture from the inside is necessary. During 2018, this has been reinforced by a significant investment in internal communications, which has allowed managers to communicate much more efficiently with their employees.
Nammo has zero tolerance for corruption and runs
training programs aimed at a continuously strengthening the understanding of ethics and compliance within the company.
In order to maintain a strong reputation and the trust of the societies we serve, Nammo’s products must always be developed and produced according to international laws and conventions, and the Group must always comply with national laws and regulations. Our license to operate is dependent on our compliance with strict national export regulations. Failure to do so represents a significant risk to company reputation, and thereby our business. Nammo maintains internal management systems to support the various ISO and military standards as well as national and customer requirements. The integrated procedures and routines are essential risk mitigating factors.
CORPORATE SOCIAL RESPONSIBILITY
Nammo’s number one social responsibility is the Group’s core business: To develop and produce high quality defense products to support and protect our national and allied forces.
Nammo assumes its corporate social responsibility for the Group’s impact on people, the environment, the communities and societies in which the company operates. This responsibility is managed through Nammo business operations with a strong emphasis on environmental issues, ethical behavior and social responsibility in the local communities near the Nammo facilities.
Nammo is committed to ensuring compliance with human and labor rights in all operational sites and that the business does not have any negative effect on the
local environments. Significant environmental protection actions have been introduced in both manufacturing processes as well as in the company facilities. Nammo employees must adapt to the ethical code of conduct, follow national anti-corruption laws and the company ensures that such responsibility flows down the supply chain where this is required.
Nammo follows the Global Reporting Initiative (GRI) Standard for sustainable reporting. In 2018, Nammo delivered its fifth company report, Communication on Progress (COP), to the UN Global Compact.
Nammo continues to address three focus areas chosen from the ten principles of the UN.
Nammo continues to address three focus areas chosen from the ten principles of the UN Global Compact. These three areas are empowering women, environmentally friendly technology development and manufacturing processes, and the work against corruption in all its forms.
Ethics and anti-corruption
During 2018, several types of ethics related training programs have been organized.
The e-learning compliance program has been refreshed with the aim of raising the general awareness level of ethics, anti-corruption and information security among Nammo employees. This training reached around 1,700 employees with a completion rate of 88 percent. Nammo will continue to focus on raising such awareness during 2019. Another training program was based on a series of diverse dilemmas and was used to train key individuals within the organi-zation and management teams of newly acquired companies.

12
BOARD OF DIRECTORS’ REPORT 2018
A third training program had a particular focus on fraud and anti-corruption, tailored to the company structure and sites. During the year, several procedures and due diligence processes have been improved in order to further strengthen the control of selected third parties. A new version of the Supplier Conduct Principles has been developed, focusing on the flow down of UN Global Compacts 10 principles throughout the supply chain. This was finalized during 2018 and will be ready for implementation early 2019.
The activities above represent only some of the ongoing efforts to strengthen Nammo’s focus on ethics and anti-corruption, and the implementation of additional such risk mitigating measures throughout the value chain will continue into 2019. People
Nammo has developed a Human Resources policy to ensure equal opportunities and rights and to prevent discrimination on the grounds of gender, sexual orientation, gender identity, ethnicity, national origin, skin color, language, disabilities, religion, and philosophy of life and/or age. This applies in particular to recruitment, career development, equal pay for equal work and working conditions. Furthermore, the recruitment of personnel shall be performed in accordance with rules and regulations of national security authorities in the respective countries. Nammo believes that the working environment in the company is good.
Women account for 25.1 percent of the employees. Activities to motivate female university graduates and women with other educational backgrounds to join the company will continue to be an important concern, with new measures underway including a planned new mentoring
program. The Group also works to increase the number of women in leadership positions and has increased the number of women at Senior Corporate Management Level.
Health, Environment, Safety & Security (HESS)
NNammo operates in the explosives industry and handles energetic materials. Conditions relating to health, environment, safety and security must always have high priority for employees and are constantly on the management agenda. The Group’s policy is evaluated annually. All accidents or near-accidents involving employees are reported and preventive actions are taken. Monthly reports are collected from all sites. Audits
15 health, environment, safety and security audits were conducted at Nammo’s sites during 2018. These audits are carried out in accordance with a procedure and plan developed by the HESS Director in the Nammo Group every year. In addition, all sites develop an individual plan that includes their respective HESS targets and where improvements are tracked.
Activities and results
Each year, all sites in Nammo have their own education and training schedules related to health, environment, safety and security. Once a year, management organizes a HESS forum gathering the employees responsible for HESS together with representatives from the top management including the CEO. The overall HESS results from 2018 are on a good level. The Key Performance Indicators (KPIs) demonstrate good improvements in several of the areas measured. Nevertheless, HESS improvement potentials remain, and continuous
improvements in this area will always be a priority. Among the areas that have seen year-on-year improvements is sick leave, which in 2018 averaged at 3.7 percent. This is a decrease from 2017 (4.6 percent) and demonstrates the effectiveness of already implemented preventive actions. These include workplace improve-ments, measures to secure a good and healthy working environment, improved protective equipment and physical exercise. Implementing such measures has also received significant management attention. There has been a 15 percent increase in reporting of dangerous conditions, near-accidents and accidents in 2018. This is an indication of growing ownership and engagement among employees for their own safety. This also generates inspiration for continued efforts into preventive work in all areas, and to maintain strong focus on safe working conditions for all employees. Environment
Nammo’s business has a direct impact on the environment through production and testing of ordnance products and services, consumption of paper and energy, waste management, procurement and use of transport. All main Nammo sites are certified in accordance with ISO 14001 or the business activities are conducted in compliance with similar environmental standards. There are some environmental challenges related to historically polluted areas at two sites. These are considered to be under control and are being monitored through internal improvement plans and in close coordination with relevant national authorities.
Security
During 2018, particular attention has been given to access control

Photo: Matthias Schrader/ AP
Norwegian ski jumper Maren Lundby, Olympic Champion, World Champion, and two-time Winner of the ladies ski jumping
World Cup.
13
BOARD OF DIRECTORS’ REPORT 2018
regulation at site level. Several Nammo locations have improved their general security level in line with national evaluations of risk levels. This enables the sites to provide safer access control as well as respond quicker to security violations. There have been no reports of major security violations during 2018.
IT security risk is a business risk. Nammo continues to experience cyber-attacks as adversaries try to infect computers with malicious software in order to establish invisible remote access into the company’s networks. The motivation behind these attempts is in some cases theft of technical data. However, the majority of security incidents are related to fraud, sabotage and extortion.
The company continues to pursue its established strategy to reduce risk by improving technical security, limiting the attack surface and raising awareness levels among the employees. The latter has been achieved by mandatory and continuous e-learning through¬out the year for all employees having access to computers.
Society
Nammo has a strong ambition to be a positive contributor to the development of the local communities where its facilities are located. The Group therefore engages in local sponsor-ships of areas such as sports, science and culture, with a focus on children and youth. In recent years, Nammo has placed a significant emphasis on supporting the continued development of a strong and independent trade press, which includes sponsorship of two annual awards for young trade press journalists.
DISTRIBUTION OF DIVIDEND
The Board of Directors proposes to the annual general meeting of shareholders a dividend payment of NOK 120.1 million for 2018. Assuming the proposed dividend, the profit in the parent company Nammo AS will be distributed as follows: dividend NOK 120 million, other equity NOK -51 million, hence a net total of NOK 69 million distributed.
The proposed dividend represents 50 percent of the Nammo Group’s net income for the year.
OUTLOOK FOR THE NAMMO GROUP
Nammo is well positioned to grow its market position as several key customers are seeking to gain access to new technologies in order to maximize the effectiveness of weapons, vehicles and aircraft already within their inventories.
Defense spending by the US and its European allies is expected to grow somewhat over the coming years, mainly driven by three factors:
1. The expressed intention by the current US administration to grow its defense budget.
2. Increased US pressure on NATO member nations to meet its commitment of spending 2% of their GDP on defense 3. Changes in the international security situation which has led to European defense budgets levelling off, and in some cases returning to growth.
Historically it has proven very difficult to predict changes in the international security situation that can influence the business environment. This means that a high degree of flexibility and ability to adapt is essential. Nor is it a given that increased defense spending by itself translates into improved prospects for Nammo, as this depends entirely on how the funds are allocated. For example, increases in personnel expenditures and general modernization have limited influence on Nammo’s prospects, whereas increased funding investments in training and readiness could potentially do so. Nammo therefore does not rely on increased defense budgets alone for its continued growth. Instead, Nammo is looking to grow the share of the existing market by delivering advanced technologies and products that address future operational priorities.

14
BOARD OF DIRECTORS’ REPORT 2018
One such operational priority is the transition away from low-intensity deployed operations towards high-intensity operations in support of national or allied defense. This has led to an increased focus on security of supply, as well as acquisition of mortar, artillery and tank ammuni¬tion in our Nordic and European markets, as well as in the United States.
More long term, these markets have also expressed an interest in acquiring new ammunition and propulsion technologies in order to boost the combat effectiveness of primary combat systems already in service. This in turn stems partly from the fact that the cost and time required to replace such systems outright continues to grow. Going forward Nammo therefore expects an increased need for the kind of niche technologies that Nammo is well positioned to offer, thanks to long term strategic investments made by the company over the past 10-15 years.
The US market for commercial ammunition is expected to recover from a somewhat soft market in 2018 and the integration of Berger Bullets and the establishment of Capstone Precision Group is expected to bring growth to the Commercial Ammunition Business Unit in the US over the coming years.
Nammo is pursuing opportunities to diversify into new business based on special competences and technologies. The company expects to see opportunities for growth in the Space segment, and will capitalize on the recent acquisition of three specialist companies in the UK and Ireland.
Prospects are that the profit improvement initiatives completed and underway, will deliver results already in 2019. This will also improve competitiveness. It will also help generate funds for continued investment in R&D, infrastructure and equipment as well as enabling Nammo to undertake any potential future acquisitions.
Nammo will continue to invest in competence building. Organization development, process excellence and introduction of state of the art tools and systems will be important building blocks for the Nammo of the future.
The Board of Directors expresses its appreciation to all employees for their commitment and dedication during the year. Nammo’s prospects are good, and several improvement initiatives launched in 2018 will contribute to securing the interests for Nammo’s Customers, Share-holders and Employees.
Ullensaker, 20 March 2019
Dag Schjerven, Chairman of the Board Ville Jaakonsalo, Vice Chairman of the Board Dag J. Opedal, Board member
Ingelise Arntsen, Board member Pasi Niinikoski, Board member Sirpa-Helena Sormunen, Board member
Marianne Stensrud, Board member Petri Kontola, Board member Morten Brandtzæg, President & CEO

15
The Nucleus, a sounding rocket powered by Nammo’s new hybrid rocket motor design,
was launched from Andøya Space Center on 27 September 2018.
15

Notes(NOK 1 000) 2018 2017 adjusted
Revenue 1 4 919 588 4 462 053
Operating expenses
Changes in stock of work in progress and finished goods (121 128) (50 206)Changes in self-manufactured fixed assets (787) (299)Cost of goods sold 1 979 771 1 585 385Payroll expenses 3, 4, 12 1 607 223 1 493 360Depreciation of tangible and intangible fixed assets 7 182 777 172 292Other operating expenses 909 449 894 818
Total operating expenses 4 557 305 4 095 350
Operating result 362 283 366 703
Financial income and expenses
Income from associates and joint ventures - equity method 6 7 917 2 254Interest income 26 100 17 647Other financial income 5 12 873 18 472Interest expenses (58 757) (40 264)Other financial expenses 5 (18 702) (23 604)
Net financial income (expense) (30 569)
(25 495)
Profit before tax 331 714 341 208
Income taxes 13 (91 517) (138 464)
Net income 240 197 202 744
16
NAMMO GROUPINCOME STATEMENTNAMMO GROUP

17
NAMMO GROUP
Notes(NOK 1 000) As of 31.12.18 Adjusted
as of 31.12.17Assets
Non-current assets
Intangible assets
Deferred tax asset 13 96 534 80 412Licenses, trademarks and other intangible assets 7 278 083 265 345Research and development 238 516 278 902Goodwill 7 215 381 130 788
Total intangible assets 828 514 755 447
Tangible assets
Buildings 7 354 120 316 033Land 7 35 330 35 836Machines and equipment 7 557 695 472 285Fixtures and fittings, tools, office machinery, etc. 7 97 629 79 760Plant under construction 7 298 693 295 895Leased fixed assets 7 65 151 66 028
Total intangible assets 1 408 618 1 265 837
Financial fixed assets
Shares in joint controlled companies 6 32 905 23 350Other shares and participations 6 8 222 5 473Pension assets 12 85 408 64 155Other receivables 8 12 342 11 465
Total financial fixed assets 138 877 104 443
Totel non-current assets
2 376 009
2 125 727
Inventory
Raw materials 897 811 790 004Work in progress 1 087 733 861 051Finished goods 282 757 388 311
Total inventory 2 268 301 2 039 366
Receivables
Accounts receivable 9 1 022 712 782 904Other receivables 8 308 226 415 348Advance payments to suppliers 108 418 83 610Total receivables 1 439 356 1 281 862
Cash and cash equivalents 10 -
184 749
Total current assets 3 707 657 3 505 977
Total assets 6 083 666 5 631 704
BALANCE SHEETNAMMO GROUP
Current assets

Dag Schjerven, Chairman of the Board Ville Jaakonsalo, Vice Chairman of the Board Dag J. Opedal, Board member
Ingelise Arntsen, Board member Pasi Niinikoski, Board member Sirpa-Helena Sormunen, Board member
Marianne Stensrud, Board member Petri Kontola, Board member Morten Brandtzæg, President & CEO
Ullensaker, 20 March 2019
18
NAMMO GROUP
Notes(NOK 1 000) As of 31.12.18 Adjusted as of 31.12.17
Equity and liabilities
Equity
Share capital 100 000 100 000Other paid in capital 258 670 258 670Other equity 2 328 434 2 178 416Total equity 2 687 104 2 537 086
Minority interest 912 -
Total equity and minority interest 11 2 688 016 2 537 086
Non-current liabilities
Pension liabilities 12 185 933 188 643Deferred tax liabilities 13 41 198 52 813Other provisions 1 353 2 431Total non-current liabilites 228 484 243 887
Other non-current liabilities
Liabilities to financial institutions 14 1 342 188 1 322 768Other non-current liabilities 101 900 91 243
Total other non-current liabilities 1 444 088 1 414 011
Current liabilities
Bank overdraft 10 35 324 -Warranty provisions 59 826 78 601Accounts payables 280 162 332 124Current tax payables 13 55 967 66 007Public duties 142 622 92 539Dividend payable 120 100 90 300Prepayments from customers 725 304 482 867Other short term liabilities 303 773 294 282
Total current liabilities 1 723 078 1 436 720
Total liabilities 3 395 650 3 094 618
Total equity and liabilities 6 083 666
5 631 704
Liabilities

19
NAMMO GROUP
CASH FLOWNAMMO GROUP
(NOK 1 000) 2018 2017 adjusted
Cash flow from operational activities
Result before tax 331 714 341 208Tax payments (118 728) (47 865)Gain and loss on sales of fixed assets 3 800 (93)Ordinary depreciation 182 777 172 292Net interest cost 32 657 22 617Changes in inventory (186 450) (95 692)Changes regarding accounts receivables (214 259) (82 817)Changes regarding accounts payables (65 950) 79 611Difference pension costs and paid pension premiums (14 551) (274)Changes in other dispositions 342 168 (212 431)Net cash flow from operational activities (a) 293 178 176 556
Cash flow from financing activities
Payments received regarding new long-term loans 19 192 201 982Installments on long-term loans (30 198) (9 724)Net interest payments (32 657) (22 617)Paid dividend (90 300) (140 000)Net cash flow from financing activities (c) (133 963) 29 641
Cash flow from investment activities
Sale of fixed assets 883 264Purchase of fixed assets (306 917) (298 440)Sale of long-term investments - 4 500Purchase of other long-term investments (73 254) (190 595)Net cash flow from investment activities (b) (379 288) (484 271)
Net changes in cash and bank accounts (a+b+c) (220 073) (278 074)Cash and bank accounts as of 01.01. 184 749 462 823Cash and bank accounts as of 31.12. (35 324) 184 749
Total unused cash credits as of 31 December 2018 is NOK 864.4 million. See note 14.

20
NAMMO GROUP
GENERAL
The Nammo Group consists of Nammo AS and its subsidiaries. Nammo AS is a public limited liability company (Aksjeselskap). The Nammo AS headquarters are located in Raufoss, Norway.
The consolidated financial statements consist of the group and its interests in associated companies and joint ventures.
The consolidated financial statements have been prepared in accordance with the Norwegian Accounting Act and the Norwegian General Accepted Accounting Principles.
BASIS OF CONSOLIDATION
The consolidated financial statements include Nammo AS and subsidiaries where Nammo AS, directly or indirectly have a controlling interest. Controlling interest is usually achieved when Nammo has more than 50 percent of voting rights. In some situations, de facto control of an entity may be achieved through contractual agreements. Subsidiaries that are acquired or sold during the year are included or excluded from consolidation when the group achieves control or ceases to have control. All inter-company transactions and balances between group companies are eliminated.
Minority interests of consolidated subsidiaries are identified separately from equity attribute to equityholders of Nammo AS. Minority interests consist of the
Accounting policies Nammo GroupNotes to the financial statements 1. Revenue 2. Financial market risk 3. Board of directors’ statement on management remuneration
amount of those interests at the acquisition date (see below) and the minority’s share of changes in equity since the acquisition date.
FOREIGN CURRENCIES
The individual financial statements of a subsidiary are prepared in the company’s functional currency, normally the currency of the country where the company is located. Nammo AS uses NOK as its functional currency, which is also used as the presentation currency for the consolidated financial statements.
In preparing the consolidated financial statements, the financial statements of foreign subsidiaries are translated to NOK using the exchange rates at year-end for balance sheet items and yearly average exchange rates for income statement items. Translation gains and losses, including effects of exchange rate changes on transactions designated as hedges of net foreign investments, are included in shareholder’s equity.
In individual subsidiaries, transactions in currencies other than the entity’s functional currency are recorded at the exchange rate at the date of the transaction. Gains and losses arising on transactions, assets and liabilities other than the translation gains/losses, are recognized in the income statement, except for gains and losses on transactions designated and effective as hedge accounting.
4. Employee and management remuneration 5. Financial items 6. Shares in other companies 7. Fixed and intangible assets 8. Other receivables (long and short term)
To hedge the group’s currency exposure the group enters into currency-based derivative financial instruments. The group’s accounting policies for such hedge contracts are explained in these accounting policies.
BUSINESS COMBINATIONS
Acquisitions of subsidiaries are accounted for using the acquisition method. The cost of the business combination is measured as the aggregate of the fair values (at the date of exchange) of assets given and liabilities incurred or assumed, plus any costs directly attributable to the business combination. The acquiree’s identifiable assets, liabilities and contingent liabilities that meet the conditions for recognition under NRS 17, are recognized at their fair values at the acquisition date. The interest of minority shareholders in the acquiree is initially measured at the minority’s proportion of the net fair value of the assets, liabilities and contingent liabilities recognized.
Goodwill arising on the acquisition of a subsidiary represents the excess of the cost of the acquisition over the group’s interest in the net fair value of the identifiable assets, liabilities and contingent liabilities of the subsidiary recognized at the date of acquisition. Goodwill is initially recognized at cost and then depreciated according to the assessed economic lifetime.
9. Receivables and losses on bad debts 10.Cash reserve 11. Equity and shareholders 12. Pension liability and pension cost 13. Income taxes 14. Interest bearing loans and guarantees 15. Acquisition of MAC LLC.
NAMMO GROUP 2018 - CONSOLIDATED FINANCIAL STATEMENTSCONTENT NOTES
ACCOUNTING POLICIES NAMMO GROUP

21
NAMMO GROUP
REVENUE RECOGNITION
Revenue is measured at the fair value of the consideration received or receivable, and represents amounts receivable for products provided in the normal course of business, net of discounts and sales related taxes. Revenue from the sale of products is recognized when all of the following conditions are satisfied:
• The group has transferred to the buyer the significant risks and rewards of ownership of the goods
• The group retains neither continuing managerial involvement to the degree usually associated with ownership nor effective control over the goods sold
• The amount of revenue can be measured reliably
• It is probable that the economic benefits associated with the transaction will flow to the group
• The costs incurred or o be incurred in respect of the transaction can be measured reliably
DIVIDENDS RECEIVED
Dividends from investments are recognized in the income statement when the group has a right to receive the dividends.
INTEREST INCOME
Interest income is recognized in the income statement as it is accrued.
GOVERNMENT GRANTS
Government grants are recognized in the consolidated financial statement when the group has reasonable assurance that it will receive them and comply with conditions attached to them. Government grants that compensate the group for expenses are recognized in the income statement as the expenses
are incurred. Government grants that compensate the group for the cost of an asset are recognized as a reduction to the total investment and thus also to the future depreciations of the asset.
INCOME TAXES
Income tax expense represents the sum of the tax currently payable and deferred tax.
The tax currently payable is based on taxable profit for the year.
Deferred tax is recognized on differences between the carrying amounts of assets and liabilities in the financial statements and the corresponding tax base used in the computation of taxable profit. Deferred tax liabilities are generally recognized for all taxable temporary differences, and deferred tax assets are generally recognized for all deductible temporary differences to the extent that it is probable that taxable profits will be available against which those deductible temporary differences can be utilized. Such assets and liabilities are not recognized if the temporary difference arises from goodwill that is not deductible for tax purposes.
Current and deferred taxes are recognized as expense or income in the income statement, except when they relate to items recognized directly in equity, in which case the tax is also recognized directly in equity.
In the case of a business combination, the tax effect is taken into account in calculating goodwill or determining the excess of Nammo’s interest in the net fair value of the acquiree’s identifiable assets, liabilities and contingent liabilities over cost.
INTANGIBLE ASSETS
Separately acquired intangible assets are recognized at cost at the time of acquisition. Intangible assets acquired as a result of contracts or legal rights, or rights that can be separated from the acquired entity, are recognized at fair value.
Cost relating to significant development projects for new technologies, products, tooling etc., which is estimated to give future positive cash flow, is recognized as research and development costs in the balance sheet. All other research and development costs are expensed when incurred.
Intangible assets are amortized on a straight-line basis over their expected useful life.
PROPERTY, PLANT AND EQUIPMENT
Property, plant and equipment are measured at historic cost less accumulated depreciation and any impairment loss.
Expenses in connection with ordinary maintenance and repairs are recognized in the income statement as they incur. Expenses incurred in connection with major replacements and renewals are capitalized and depreciated on a systematic basis.
Property, plant and equipment are depreciated on a straight-line basis over their expected useful life.
Gain or loss due to sale or retirement of property, plant and equipment is calculated as the difference between sales proceeds and carrying value and is recognized in the income statement. Interest is capitalized as part of the historical cost of major assets constructed.

22
NAMMO GROUP
ASSOCIATED COMPANIES
Associated companies are investments in companies where the group has significant influence, but not control. Significant influence normally exists when the group controls between 20 percent and 50 percent of the voting rights. The share of net income, assets and liabilities of associated companies are incorporated into the consolidated financial statements using the equity method of accounting.
JOINT VENTURES
A joint venture is a contractual arrangement whereby the group and one or more parties undertake an economic activity that is subject to joint control, which is when the strategic and financial and operating policy decisions relating to the activities of the joint venture require the unanimous consent of the parties sharing control. Accounting for participation in joint ventures is based on the equity method as described under the accounting principles for associated companies.
INVENTORY
Inventories are recorded at the lower of cost, using the first-in, first-out method (FIFO) and net realizable value. Net realizable value is estimated sales price reduced by costs of completion and other sales costs. Historic cost for work in progress or finished goods are all appropriate direct and indirect production costs, while raw materials and other inventory are recognized at purchase price (historic cost).
IMPAIRMENT OF NON-CURRENT ASSETS
The group assesses the carrying amount of tangible assets and identifiable intangible assets annually, or more frequently if events or changes in circumstances indicate that such carrying amounts may not be recoverable. Factors
considered material by the group trigger an impairment test.
These include:
• Significant underperformance relative to historical or projected future results, or significant changes in the manner of the group’s use of the assets or the strategy for the overall business, or
• Significant negative industry or economic trends
The recoverable amount of an asset or cash-generating unit is the higher of its fair value less cost to sell and value in use. When it is determined that the carrying amount of tangible assets and identifiable intangible assets may not be recoverable based upon the existence of one or more of the above indicators of impairment, an impairment charge is measured based on discounted projected cash flows. An impairment loss is recognized to the extent that the carrying amount of an asset or a cash-generating unit exceeds its recoverable amount. Previously recognized impairment losses are reversed if the assumptions for impairment are no longer present.
DIVIDEND LIABILITY
A divident liability is recognized based on the Board of Directors proposal to be approved by the annual General Meeting.
DEFINED BENEFIT PLANS
The group’s net obligation in respect of defined benefit plans are calculated separately for each plan, based on the legislation in the respective countries where group companies have defined benefit plans. The amount is an estimation of future benefits that the employees have earned in return for their service in current and prior periods. The benefit is discounted to determine its present value, and the fair value of the plan assets
and unvested past service cost is deducted. The discount rate is based on the risk free rate (interest rate on long term government bonds) and the recommendation from The Norwegian Accounting Standards Board (Norsk Regnskapsstiftelse), plus a risk premium. Qualified actuaries perform the calculations.
The actuarial gains or losses are recognized using a corridor. The corridor is defined as 10 percent of the highest of the defined benefit obligation (DBO) and total plan assets. The net actuarial gain or loss exceeding the corridor is amortized in the income statement over the estimated remaining period of service from the members in the plan.
DEFINED CONTRIBUTION PLANS
Contributions to defined contribution pension plans are recognized as an expense in the income statement when employees have rendered services entitling them to the contributions.
RESTRUCTURING
A restructuring provision is recognized when the group has developed a detailed formal plan for the restructuring and has raised a valid expectation in those affected that it will carry out the restructuring by starting to implement the plan or announcing its main features to those affected by it. The measurement of a restructuring provision includes only the direct expenditures arising from the restructuring, which are those amounts that are both necessarily entailed by the restructuring and not associated with the ongoing activities of the entity.
ONEROUS CONTRACTS
Present obligations arising under onerous contracts are recognized and measured as a provision. An onerous contract is considered to exist where the group has a contract under which the unavoidable costs of meeting

23
NAMMO GROUP
the obligations under the contract exceeds the economic benefits expected to be received from it.
WARRANTIES
Provisions for warranties are recognized when the products or services are sold. This is done to meet future claims on already sold products and services. The provision is based on an assessment of the business Nammo operates in, historical information on actual warranty payments incurred, and the probability that claims will be made.
CASH AND CASH EQUIVALENTS
Cash and cash equivalents include cash and bank deposits.
TRADE RECEIVABLES AND OTHER SHORT-TERM RECEIVABLES
Trade receivables and other short-term receivables are recognized at the lower of the transaction amount (historic cost) and the fair value at the time of reporting.
IMPAIRMENT OF FINANCIAL ASSETS
Financial assets, other than those recognized at fair value through the income statement, are assessed for indicators of impairment at each balance sheet date. Financial assets are impaired when there is objective evidence that, as a result of one or more events that occurred after the initial recognition of the financial asset, the estimated future cash flows of the investment have been impacted. For financial assets carried at historic cost, the amount of the impairment is the difference between the asset’s carrying amount and the present value of estimated future cash flows.
INTEREST-BEARING BORROWINGS
Interest-bearing borrowings are recognized initially at historic costs including transaction costs.
FINANCIAL INSTRUMENTS
The group uses financial instruments to hedge exposure against foreign exchange risk in operating, financing and investment activities. The financial instruments are entered into based on a ‘back-to-back’ process, meaning that we normally make a hedge based on a specific underlying sale or purchase contract.
HEDGE ACCOUNTING
The group designates certain financial instruments as either hedges of foreign currency risk of future cash flows (cash flow hedges), or hedges of net investments in foreign operations.
CASH FLOW HEDGES
The effect of the financial instruments used as hedging instrument in a cash flow hedge are recognized in the profit and loss in the same period as the underlying hedged transaction is recognized.
HEDGE OF NET INVESTMENT
Changes in book value of financial instruments used as hedges of net investment in foreign operations are recognized directly in equity.
LEASING
Property, plant and equipment which is leased on conditions which substantially transfer all the economic risks and rewards to Nammo (finance lease) are accounted for as property, plant and equipment at the present value of minimum lease payments or fair value if this is lower. The corresponding finance lease liabilities are included in other non-current liabilities. Property, plant and equipment is depreciated over the estimated useful lives of the assets. The related liabilities are reduced by the amount of lease payments less the effective interest expense. Other leases are accounted for as operating leases, with lease payments recognized as an expense over the lease terms.

Transaction type Buy/Sell(-) CAD CHF EUR GBP SEK DKK USD
FX ForwardBuy
Sell(-)441
-1415
-32 367
(52 388)6 999
(12 690)18 956
(24 186)-
(6 048)10 309
(107 787)
FX SWAPBuy
Sell(-)- -
2 172
-
2 023 (12 190)
- (913)
3 990
-
- -
12 557 (41 627)
(Amounts in currency 1 000)
24
NAMMO GROUP
1. REVENUE
The Nammo Group consists of subsidiaries in Norway, Sweden, Finland, Germany, Switzerland, Spain, USA, England, Ireland, Poland, Canada, India and Australia.
NOTES TO THE FINANCIAL STATEMENTSNAMMO GROUP
2. FINANCIAL MARKET RISK
The Nammo Group has both sales and purchases in foreign currencies. To reduce the financial risk of currency
changes, secured exchange rate instruments (forwards contracts) are used to hedge contracts in foreign currency with
both the customers and suppliers.
Transactions are recorded at the hedged rates of exchange.
Cash flow hedges as of December 2018:
(NOK 1 000) 2018 2017
Norway 1 842 286 1 663 309
USA 1 017 141 958 908
Germany 714 113 626 757
Sweden 487 995 427 893
Finland 467 374 522 870
Spain 299 833 215 881
England 70 056 30 852
Ireland 19 385 13 021
Switzerland 1 405 2 562
Total 4 919 588 4 462 053
(NOK 1 000) 2018 2017
Norway, Sweden and Finland 991 205 799 364
Other Europe 1 415 628 1 299 021
North America 2 002 119 1 818 654
Asia 411 891 348 425
Other countries 98 745 198 589
Total 4 919 588 4 462 053
Revenue from Nammo subsidiaries per country
Revenue per geographical location of customers

Transaction type Buy/Sell Year 2019 Year 2020 Year 2021 Later
FX ForwardBuy Sell
95% 65%
5% 30%
- 5%
- -
FX SWAPBuy Sell
100% 100%
- -
- -
- -
25
NAMMO GROUP
The board proposes the following guidelines to be applied for 2019, up until the annual general meeting in 2020. The Board of Directors has established an HR (Human Resource) and Compensation Committee which consists of four board members, whereof one is an employee representative and one member is appointed as the chairman of the committee.
The main principles of the remuneration policy for the CEO and executive management The principles applying to remuneration of executive management are set by the board. On a yearly basis the HR and Compensation Committee assesses the key principles and standards for the executive management remuneration in Nammo and presents these to the Board of Directors. Based on the input from the HR and Compensation Committee the board makes a final assessment of the CEO’s remuneration and other compensation matters, including the structure of the top management compensation schemes. The CEO determines the compensation for all other members of corporate management, following the guidelines given by the board. Management remuneration at Nammo AS and its subsidiaries is based on the following main principles:
• Top management remuneration shall be competitive, but not leading and within this framework, support general moderation in the development of top management remunerations.
• It shall be structured to attract and motivate managers to strive to achieve constant improvements in operations and company results.
• The remuneration system shall be understandable, transparent and acceptable both inside and outside of Nammo
• It shall be flexible and open to adjustments when requirements change.
• The system shall encourage cooperation.
Corporate management compensation will reflect their responsibility for the management, performance and sustainable development of Nammo, taking into account the size and complexity of the business. The arrangements shall always be transparent and in line with principles for good corporate governance. All companies where Nammo is in control shall comply with the main principles of the senior executive remuneration policy, although, for members of top management employed outside of Norway, the compensation package might be somewhat adjusted to meet local market conditions.
Elements of management remuneration – fixed salary and variable benefits
The basis for wage setting is the aggregated level of a manager’s ordinary salary and variable benefits. The fixed salary comprises a basic salary plus benefits in kind and post-employment benefit plans. Variable benefits consist of performance-based salary. Regular and relevant surveys are made to ensure that overall compensation packages are competitive, but not leading. The latest survey was done in 2018, and a report will be published in 2019. Based on the 2016 survey, the board concluded the following main criteria for the top-managers salary level.
• Position grading, relative to size and complexity of the area of responsibility
• Age of the employee
• Length of employment at Nammo
• Time in top management
In accordance with the Norwegian Governments guidelines, Nammo does not have a pension scheme for income above 12 G. The board is of the opinion that this scheme is not generally competitive, and a salary element is added to the base salary to compensate for lack of pension for salaries above 12 G.
According to the Norwegian accounting legislation the hedging instrument is recognized in the profit and loss in the same period as the underlying transaction. In some cases the underlying transaction does not happen at the maturity date of the hedging instrument. In these cases FX SWAPs are placed with a maturity date matching the new estimated time of the underlying transaction. The
profit and loss effect of both the FX Forward and FX SWAP is matched with the underlying transaction.
Maturity FX Forward’s and FX SWAP’s - percentage allocation based on nominal value in NOK:
3. BOARD OF DIRECTORS’ STATEMENT ON MANAGMENT REMUNERATION

26
NAMMO GROUP
Base compensation
Base compensation consists of both base salary and an annual pension compensation payment. The base salary is the main element of the managers’ remuneration. Effective from 1 January 2017, management in Norway is compensated for the limitation of 12G in the Norwegian pension scheme. This is done through increased base compensation, intended for personal retirement savings. The annual compensation for this is 20 percent of the base salary above 12G.
In relation to the group CEO pension, the guiding principle that the total pension at the age of 67 years should be 60 percent of the salary at that time, is reflected in the CEO annual pension compensation agreement. Benefits
Common benefits for comparable positions in the different countries are offered to key management personnel. In Norway, there are no company car arrangements, but such arrangement may occur in other countries. Some top-managers will receive a car-allowance. There are four categories depending on managerial status. There is a car-rental arrangement for transportation from Raufoss to the airport. Managers using this service will have their car-allowance reduced. There are no particular limitations on the type of benefits that can be agreed. Performance-based salary
Beyond the main principle of a base salary, there is a bonus-scheme. The bonus system adheres to the limits set by the Norwegian government regarding the sizes and levels of variable pay, for instance the bonus may not exceed six months’ salary.
For 2019, the top-management of Nammo has two main targets; improved operational and financial performance. The performance targets for 2019 are linked to these overall targets for all the top
managers. Therefore, the bonus scheme is based on improvements in operational and financial performance both in their individual business unit (40-50 percent of total bonus) and on the overall improvements of the group (35-45 percent of the total bonus). In addition, all top-managers have personal goals (10-20 percent of total bonus). Good results over time should yield a 50 percent of individual maximum bonus.
The performance-based salary provides no basis for pension and is annually assessed by the Board of Directors and/or the CEO to ensure that it works as intended and that any required adjustments are made. Pension plans
Nammo shall have pension schemes that are in line with the market of the home country. New employees shall be enrolled into existing schemes. These plans meet the government’s guidelines for pension schemes for senior management or similar arrangements in the country where the top manager is employed. In Norway, employees have a defined benefit pension scheme, financed through a group pension scheme with Storebrand, limited to 12G, with an estimated coverage of 60 percent of salary at time of retirement.
The group CEO has an agreement for retirement at the age of 65. After retirement at the age of 65, the CEO will receive 60 percent of his base salary for two years. Severance package arrangement
If the board asks the CEO to resign from his position before his retirement age at 65, he is entitled to a maximum of 12 months compensation. No other senior executives are entitled to pay after termination of employment beyond the regular dismissal period.
Statement for the fiscal year 2018
The executive compensation structure was implemented in accordance with the above-mentioned information with full effect from 1 January 2017. The salary of the CEO has been set by the Board of Directors in line with the principles in the remuneration policy. In addition, the performance-based salary outlined above, has resulted in payments as described below in note 4. Besides the above described, Nammo has not made or amended any agreements for compensation with material impact on the company or its shareholders in the previous financial year. Remuneration to the group CEO and other executives are shown in note 4 below.

(NOK 1 000) 2018 2017
Group auditors fees 3 850 5 580
Other auditors fees 869 -
Fees for other assurance work - 245
Tax advisory services - 1 202
Other services - 1 613
Total 4 719 8 640
(NOK 1 000) 2018 2017
Gain on exchange
Other financial income
12 840
33
18 464
8
Total other financial income 12 873 18 472
Loss on exchange
Other financial expenses
(13 702)
(5 000)
(20 411)
(3 193)
Total other financial expenses (18 702) (23 604)
Average number of man years 2 409 2 217
5. FINANCIAL ITEMS
(NOK 1 000) 2018 2017
Salaries 1 231 802 1 153 341
Employment taxes 107 107 90 427
Pension costs 107 775 103 250
Other personnel costs 160 539 146 342
Total 1 607 223 1 493 360
27
NAMMO GROUP
4. EMPLOYEE/MANAGEMENT REMUNERATION AND AUDITOR’S FEES
Auditor’s fee
Remuneration CEO, board of directors and corporate management
All Norwegian corporate management members are included in a collective defined benefit pension plan in Norway. Loan to the CEO had a balance of NOK 113 723 as of 31 December 2018. The loan was repaid in January 2019.
All numbers are presented exclusive VAT.
Morten Brandtzæg President and CEO 5 656 782 285 300 283 203 339 616 6 564 901
Kjell Kringsjå SVP Business Development 2 252 499 135 005 232 031 328 874 2 948 409
Stein Erik Nodeland EVP AP from February 2018 1 375 684 - 175 427 210 817 1 761 928
Vegard Sande EVP LCA 1 949 908 129 611 245 189 228 504 2 553 212
Stein Erik Ommundsen CFO 1 871 875 30 000 130 620 214 866 2 247 361
Camilla Becker SVP Human Resources from April 2018 1 092 519 - 54 535 204 800 1 351 854
Bertil Pålsrud SVP Business Integration 1 813 679 129 861 200 811 351 322 2 495 673
Sissel Solum SVP Compliance 1 545 458 88 828 141 261 329 480 2 105 027
Endre Lunde SVP Communications 1 187 110 - 84 012 125 087 1 396 209
Anne Haugen-Flermoe SVP Legal 1 332 023 56 517 61 225 203 452 1 653 217
Board of Directors Board members 2 042 249 - - - 2 042 249
(NOK) Function SalaryBonus
payment
Other compen-
sation
Pension premium payment Total

Company’s share capital
Numbers of shares owned
Nominal value
Booked value NOK
Ownership
Joint controlled companies: SN Technologies SA, Meyrin, Switzerland
CHF 200 000
100
CHF 100 000
32 905
50%
Total 32 905
Other shares and participations: Komm-In AS, Norway Sintef Raufoss Manufacturing AS, Raufoss, Norway Raufoss Holding AS, Raufoss, Norway Nordic Additive Manufacturing, Raufoss, Norway Others
4 500 1 302 1 375 1 000
45
8%
14%
2.5%
21%
Total 8 222
(NOK 1 000)
Goodwill
Buildings
Land
Machinery and
equipment
Fixtures, fittings,
tools, office machinery,
etc
Plants under
construction
Total assets
Acquisition cost as of 01.01.18 654 174 323 139 744 422 46 993 1 872 717 391 742 311 925 4 345 112
Reclassifications - - 14 258 - 50 515 3 833 (68 606) -
Additions during the year 35 163 75 312 41 807 - 152 459 26 277 67 285 398 303
Disposals during the year (2 308) (2 745) (647) (125) (19 573) (6 680) (4 955) (37 033)
Exchange difference acq. cost 34 346 20 038 6 542 64 12 140 4 201 9 249 86 580
Acquisition cost 31.12.18 721 375 415 744 806 382 46 932 2 068 258 419 373 314 898 4 792 962
Accum. depreciations 31.12.18 (443 292) (200 363) (452 262) (11 602) (1 510 563) (321 744) (16 205) (2 956 031)
Book value as of 31.12.18
278 083
215 381
354 120
35 330
557 695
97 629
298 693
1 836 931
Depreciations this year
34 520
(2 143)
25 301
616
105 810
18 673
-
182 777
Annual leasing cost of assets not recognized in balance sheet Economic life time (years)Depreciation plan
-
1-25 Linear
-
5-10 Linear
70 500 10-50
Linear
14 926
- Linear
16 184
5-20 Linear
6 559
3-10 Linear
- -
Linear
108 169
- Linear
6. SHARES IN OTHER COMPANIES
8. OTHER RECEIVABLES (CURRENT AND NON-CURRENT)
7. FIXED AND INTANGIBLE ASSETS
Patents, trade- marks and other
intangible assets
(NOK 1 000)
28
NAMMO GROUP
The financial leases capitalized in the balance sheet is two lease contracts in Finland. The leases expires in 2029 and 2032 respectively. Yearly lease cost is NOK 6.7 million.
Goodwill depreciated over more than five years is goodwill originating from companies with products strongly rooted with the customers and a strong market position, which is expected to last materially longer than five years.
These items include accrued revenue, receivables from employees, VAT receivables and other receivables.
Joint controlled companies are recognized according to the equity method in the consolidated financial statements. In 2018 the Nammo Group accounted for a share of the net income from SN Technologies SA at NOK 7.9 million.
For information about the Nammo AS subsidiaries, reference is made to Nammo AS’ financial statement note 5.

9. RECEIVABLES AND LOSSES ON BAD DEBTS
10. CASH RESERVE
(NOK 1 000) 2018 2017
Accounts receivables Provision for bad debt
1 028 037
(5 325)
788 011
(5 107)
Book value of accounts receivables 1 022 712 782 904
(NOK 1 000) 2018 2017
Cash and cash equivalents Unused cash credits
(35 324)
864 394
184 749
672 055
Net cash reserve 829 070 856 804
(NOK 1 000)
29
NAMMO GROUP
Nammo AS has established an international cash pool together with the following group companies:
Finland: Nammo Lapua Oy and Nammo Vihtavuori Oy Germany: Nammo Schönebeck GmbH, Nammo Buck GmbH and Nammo Germany GmbH Norway: Nammo AS, Nammo Raufoss AS and Nammo NAD AS Sweden: Hansson Pyrotech AB, Nammo Sweden AB and Nammo Demil AB. USA: Nammo Inc., Nammo Talley Inc., Nammo Composite Solutions LLC., Nammo Tactical Ammunition LLC., Nammo Pocal Inc., Nammo Technologies Inc. and Capstone Precision Group LLC. Spain: Nammo Palencia S.L. Ireland: Nammo Ireland Ltd. UK: Nammo Westcott Ltd. and Nammo Cheltenham Ltd.
No receivables fall due later than 5 years from 31 December 2018.
All parties participating in the cash pool are mutually liable.
Share capital
Premium fund
Other equity
Minority interest
Total
Reported equity as of 31.12.16 100 000 258 670 2 024 432 2 383 102
Adjustment equity 31.12.16 for US tax items - - 20 748 - 20 748
Adjusted equity as of 31.12.16 100 000 258 670 2 045 180 - 2 403 850
Reported net income 2017 - - 180 590 - 180 590
Adjustment net income 2017 for US tax items - - 22 154 - 22 154
Proposed dividend shareholders 2017 - - (90 300) - (90 300)
Other items reported 2017 - - (49 924) - (49 924)
Adjusted exchange differences 2017 - - 70 716 - 70 716
Adjusted equity as of 31.12.17 100 000 258 670 2 178 416 - 2 537 086
Profit for the year - - 240 197 - 240 197
Proposed dividend to shareholders 1) - - (120 100) - (120 100)
Minority share - - - 912 912
Other items - - 28 334 - 28 334
Exchange differences - - 1 587 - 1 587
Equity as of 31.12.18 100 000 258 670 2 328 434 912 2 688 016
11. EQUITY AND SHAREHOLDERS
1) Board of director’s proposal to the general meeting of shareholders.
Nammo AS shareholders are disclosed in Nammo AS’ financial statement, note 7.

12. PENSION LIABILITY – PENSION COST
The companies with pension arrangements, which provide the employees with the right to defined future pension payments, are included in the calculations of the pension liability (defined benefit plans). The pension liability at 31 December 2018 was NOK 185.9 million, which is derived from the companies in Sweden, Germany and Finland. Pension assets in Norway were 85.4 million at 31 December 2018. The defined benefit plan in Norway has 794 active members, whereas in Sweden there are 129 active members. In addition, contribution pension plans exist in the other countries where we operate.
The total periodic pension costs for both defined benefit plans and defined contribution plans are included in personnel costs in the profit and loss statement. The different pension plans are structured and based upon the laws and regulation in the respective countries. The assumptions used for the actuary calculations are as follows:
Assumptions
Norway
Sweden
Discount rate Yield from pension funds Annual salary increase Annual increase in G Annual increase Income Base amount Annual change in pensions Inflation
2.30% 4.00% 2.50% 2.25%
- 0.40%
-
2.20% -
2.50% -
2.50% -
2.00%
(NOK 1 000)
2018
2017
Service costs 70 374 58 254
Amortization of net actuarial losses (gains) 10 001 9 525
Interest costs (income) 218 3 188
Expected return on plan assets (10 821) (6 336)
Pension cost related to defined contribution plans 38 003 38 619
Net periodic pension costs 107 775 103 250
(NOK 1 000)
2018
2017
Defined benefit obligation incl. social security tax - Fair value of plan assets
750 432 (439 870)
717 258 (404 441)
Net pension obligation Items not recorded in the profit and loss: Unrecognized net actuarial loss (gain)
310 562
(210 037)
312 817
(188 329)
Net pension liability 100 525 124 488
Classified as pension asset in the balance sheet
85 408
64 155
Classified as pension liabilities in the balance sheet
185 933
188 643
30
NAMMO GROUP
Pensions costs
Pension liabilities/assets

(NOK 1 000)
2018
2017
Change
Temporary differences:
Intangible assets 7 580 (34 408) (41 988)
Fixed assets (52 572) (43 908) 8 664
Accounts receivables 7 972 6 341 (1 631)
Inventory (37 412) 18 233 55 645
Pension liabilities 37 429 14 584 (22 845)
Warranty liabilities (46 080) (56 220) (10 140)
Financial non-current temporary differences 103 391 85 490 (17 901)
Other non-current temporary differences (41 490) (25 387) 16 103
Other current temporary differences (28 819) 73 770 102 589
Temporary differences (50 001) 38 495 88 496
Carried forward losses for tax purposes (296 995) (358 001)
Total temporary differences (346 996) (319 506)
Gross deferred tax / deferred tax assets (-) (98 124) (79 011)
Deferred tax assets not recognized in the balance sheet 42 788 51 412
Net deferred tax liability/deferred tax asset (-) (55 336) (27 599)
Classified as deferred tax asset 96 534 80 412
Deferred tax liability in the balance sheet
41 198
52 813
13. INCOME TAXES
The deferred tax liabilities/tax asset has been calculated on the basis of the temporary differences existing at the end of the accounting year between accounting values and taxation values. The specification below shows the temporary differences and the calculation of the deferred tax liabilities/tax assets as at the end of the accounting year.
Deferred tax liability / deferred tax asset (-)
31
NAMMO GROUP

(NOK 1 000)
2018
Net income before tax 331 714
Changes in temporary differences 88 496
Exchange differences temporary differences (43 638)
Permanent differences 952
Use of carried forward losses (27 678)
Taxable income 349 846
Payable income tax 105 037
Tax expenses in profit and loss
Payable tax on this year’s result 105 817
Adjustments prior years (780)
Payable tax in this year’s tax cost 105 037
Payable tax in the balance sheet
Payable taxes 111 390
Prepaid taxes (55 470)
Other items 47
Payable tax in balance sheet 55 967
Change in deferred tax / deferred tax asset (11 546)
Other items (1 974)
Tax expense in the P&L 91 517
Payable income taxes
32
NAMMO GROUP

14. INTEREST BEARING LOANS, AVAILABLE CASH CREDITS AND GUARANTEES
15. ACQUISTION OF MAC LLC
(NOK 1 000) 2018 2017
Total interest bearing loans 1 342 188 1 322 768
Nammo AS long term loans from credit institutions per 31 December 2018:
Available unused cash credits at 31 December 2018:
The financial covenants related to the long term loans from credit institution are:
- Net debt to EBITDA maximum 4.0, and - Total Equity to Total assets, minimum at 30% At December 31, 2018 there are no default related to the financial covenants.
Nammo Technologies Inc. acquired 55 % of the membership interests in MAC LLC. during 2018. 45% as acquired in January 2018, while the last 10 % was acquired in mid-December 2018. After the purchase of the last 10 % in December 2018, Nammo have a controlling interest in MAC LLC.
The total purchase price for 55% of the membership interests were USD 8 880 840. The excess value of USD 8.7 million (NOK 75.3 million) is allocated to goodwill in the Nammo Group balance sheet.
(NOK 1 000) Final maturity date Facility total Utilized Available
Term loan facility, EUR 98.1 millions 19 September 2021 976 177 976 177 -
Revolving credit facility, NOK 1 000 millions 6 December 2021 1 000 000 338 852 661 148
(NOK 1 000) Cash credit
Revolving credit facility 661 148
Additional cash credits available 203 246
Total unused cash credits at year-end 864 394
Guarantees:
Guarantees not recognized in the balance sheet as of 31 December 2018 is NOK 422.1 million.
33
NAMMO GROUP

34
Notes(NOK 1 000) 2018 2017
Revenue 1 100 650 91 572
Operating expensesPayroll expenses 2 54 805 44 938Depreciation of tangible and intangible fixed assets 4 477 364Other operating expenses 76 560 73 888
Total operating expenses 131 842 119 190
Operating profit (31 192) (27 618)
Financial income and expenses
Received group contribution 100 000 100 000Interest income 3 50 773 41 265Other financial income 3 71 375 -Interest expenses 3 (32 449) (22 710)Other financial expenses 3, 14 (64 970) (132 902)
Net financial income (expense) 124 729 (14 347)
Profit before tax 93 537 (41 965)
Income taxes 11 (24 406) (1 182)
Net income 69 131 (43 147)
The board’s proposal for allocation of the profitDividend 120 100 90 300
Other equity (50 969) (133 447)
Total 69 131 (43 147)
NAMMO ASINCOME STATEMENTNAMMO AS

35
NAMMO AS
Notes(NOK 1 000)
As of 31.12.18 As of 31.12.17
Assets
Non-current assets
Tangible assets
Buildings 4 59 -Machines and equipment 4 99 33Fixtures and fittings, tools, office machinery, etc. 4 4 010 950
Total tangible assets 4 4 168 983
Financial assets
Investments in subsidiariess 5 609 365 609 365Investments in other shares and participations 1 375 1 375Loans to group companies 1 013 293 901 484Pension assets 10 3 157 2 325Other receivables 2 547 2 379
Total financial assets 1 629 737 1 516 927
Totel non-current assets 1 633 905 1 517 910
Receivables
Accounts receivable 6 568 -Receivables from group companies 13 644 426 566 970Receivable group contributions 100 000 100 000Prepayments to vendors 5 378 5 902Other receivables 8 532 6 615Total receivables 758 904 679 487
Cash and cash equivalents 7, 13 - 120 596
Total current assets 758 904 800 083
Total assets 2 392 809 2 317 993
BALANCE SHEETNAMMO AS
Current assets

Dag Schjerven, Chairman of the Board Ville Jaakonsalo, Vice Chairman of the Board Dag J. Opedal, Board member
Ingelise Arntsen, Board member Pasi Niinikoski, Board member Sirpa-Helena Sormunen, Board member
Marianne Stensrud, Board member Petri Kontola, Board member Morten Brandtzæg, President & CEO
Ullensaker, 20 March 2019
36
Notes(NOK 1 000) As of 31.12.18 As of 31.12.17
Equity and liabilities
EquityShare capital 8, 9 100 000 100 000Premium fund 9 258 670 258 670
Total paid in capital 358 670 358 670
Other equity 9 443 436 494 403
Total earned equity 443 436 494 403
Total equity 802 106 853 073
Non-current liabilitiesDeferred tax 11 23 130 19 524
Total non-current liabilities 23 130 19 524
Other non-current liabilities
Liabilities to financial institutions 12 1 315 029 1 304 026
Total other non-current liabilities 1 315 029 1 304 026
Bank overdraft 7 87 121 -Accounts payables 5 256 8 021Payables to group companies 8 014 9 288Income tax payable 11 20 773 25 153Public duties payable 4 486 3 743Dividend payable to shareholders 120 100 90 300Other current liabilities 6 794 4 865Total current liabilities 252 544 141 370
Total liabilities 1 590 703 1 464 920
Total equity and liabilities 2 392 809 2 317 993
BALANCE SHEETNAMMO AS
Liabilities
Current liabilities

37
NAMMO AS
(NOK 1 000) 2018 2017
Cash flow from operational activities
Result before tax 93 537 (41 965)
Tax payments (25 181) (3 230)
Ordinary depreciation 477 364
Changes in accounts receivable 19 604 (11 458)
Changes in accounts payable (4 039) 10 359
Pension cost less paid pension premium (831) (229)
Changes in loans to group companies (111 809) (150 189)
Changes in other dispositions (185 964) (214 969)
Net cash flow from operational activities (a) (214 206) (411 317)
Cash flow from financing activities
Payments from new long-term loans - 201 777
Installments long term loans (18 702) -
Received dividend 19 153 -
Received group contribution 100 000 90 000
Paid dividend (90 300) (140 000)
Net cash flow from financing activities (c) 10 151 151 777
Cash flow from investment activities
Investments in financial fixed assets - (16 660)
Investments in fixed assets (3 662) -
Net cash flow from investment activities (b) (3 662) (16 660)
Net changes in cash and bank accounts (a+b+c) (207 717) (276 200)
Cash and bank accounts as of 01.01. 120 596 396 796
Cash and bank accounts as of 31.12. (87 121) 120 596
CASH FLOWNAMMO AS
Unused credit facilities is NOK 864.4 million. See note 12.

38
NAMMO AS
GENERAL
Nammo AS is a public limited company (Aksjeselskap). The Nammo AS headquarters are located in Raufoss, Norway.
The financial statements for Nammo AS have been prepared in accordance with the Norwegian Accounting Act and the Norwegian General Accepted Accounting Principles.
Nammo AS provides financing to most of the subsidiary companies in the Nammo Group.
FOREIGN CURRENCIES
Realized and unrealized gains and losses on transactions, assets and liabilities denominated in a currency other than the functional currency (NOK) of Nammo AS and that do not qualify for hedge accounting, are included in net income.
REVENUE RECOGNITION
Revenues are mainly sale of Group services to other Group companies. Revenue from services is recognized as the services are rendered.
DIVIDENDS RECEIVED
Dividends from investments are recognized in the income statement when Nammo AS has a right to receive the dividends.
INTEREST INCOME
Interest income is recognized in the income statement as it is accrued.
Accounting policies Nammo ASNotes to the financial statements
1. Related party transactions and revenue 2. Salaries and social cost
GOVERNMENT GRANTS
Government grants are recognized in the consolidated financial statement when Nammo AS has reasonable assurance that it will receive them and comply with conditions attached to them.
Government grants that compensate Nammo AS for expenses are recognized in the income statement as the expenses are incurred. Government grants that compensate Nammo AS for the cost of an asset are recognized as a reduction to the total investment, and thus also to the future depreciations of the asset.
INCOME TAXES
Income tax expense represents the sum of the tax currently payable and deferred tax.
The tax currently payable is based on taxable profit for the year.
Deferred tax is recognized on differences between the carrying amounts of assets and liabilities in the financial statements, and the corresponding tax base used in the computation of taxable profit. Deferred tax liabilities are generally recognized for all taxable temporary differences, and deferred tax assets are generally recognized for all deductible temporary differences, to the extent of probability that taxable profits will be available against which those deductible temporary differences can be utilized.
3. Financial items 4. Fixed and intangible assets 5. Shares in other companies 6. Accounts receivables 7. Cash reserve 8. Share capital 9. Equity
Current and deferred taxes are recognized as expense or income in the income statement, except when they relate to items recognized directly in equity, in which case the tax is also recognized directly in equity.
In the case of a business combination, the tax effect is taken into account in calculating goodwill or determining the excess of Nammo’s interest in the net fair value of the acquiree’s identifiable assets, liabilities and contingent liabilities over cost.
INTANGIBLE ASSETS
Separately acquired intangible assets are recognized at cost at the time of acquisition. Intangible assets acquired as a result of contracts or legal rights, or rights that can be separated from the acquired entity, are recognized at fair value.
Intangible assets are amortized on a straight-line basis over their expected useful life.
PROPERTY, PLANT AND EQUIPMENT
Property, plant and equipment are measured at historic cost, less accumulated depreciation and any impairment loss.
Expenses in connection with ordinary maintenance and repairs are recognized in the income statement as they are incurred.
Expenses incurred in connection with major replacements and
10. Pension liability and pension costs 11. Income taxes 12. Interest bearing loans and guarantees 13. Cash pool 14. Impairment investment in subsidiary
NAMMO AS 2018 - FINANCIAL STATEMENTSCONTENT NOTES
ACCOUNTING POLICIES NAMMO AS

39
NAMMO AS
renewals are capitalized and depreciated on a systematic basis.
Property, plant and equipment are depreciated on a straight-line basis over their expected useful life.
Gain or loss due to sale or retirement of property, plant and equipment is calculated as the difference between sales proceeds and carrying value, and is recognized in the income statement.
SUBSIDIARIES AND ASSOCIATED COMPANIES
Shares in subsidiaries and associated companies are recognized according to the historic cost method.
IMPAIRMENT OF NON-CURRENT ASSETS
Nammo AS assesses the carrying amount of tangible assets and identifiable intangible assets annually, or more frequently if events or changes in circumstances indicate that such carrying amounts may not be recoverable. Factors considered to be material which trigger an impairment test include:
• Significant underperformance relative to historical or projected future results, or
• Significant changes in the manner of the company’s use of the assets or the strategy for the overall business, or
• Significant negative industry or economic trends
The recoverable amount of an asset or cash-generating unit is the higher of its fair value less cost to sell and value in use. When it is determined that the carrying amount of tangible assets and identifiable intangible assets may not be recoverable based upon the existence of one or more of the above indicators of impairment, an impairment charge is measured based on discounted projected cash flows. An impairment loss is recognized to the extent that
the carrying amount of an asset or a cash-generating unit exceeds its recoverable amount. Previously recognized impairment losses are reversed if the assumptions for impairment are no longer present.
DIVIDEND LIABILITY
A dividend liability is recognized based on the board of directors proposal to be approved by the annual general meeting.
DEFINED BENEFIT PLANS
The net obligation in respect to defined benefit plans are calculated separately for each plan. The amount is an estimation of future benefits that the employees have earned in return for their service in current and prior periods. The benefit is discounted to determine its present value, and the fair value of the plan assets, and then unvested past service cost is deducted. The discount rate is based on the risk free rate (interest rate on long-term government bonds) and the recommendation from The Norwegian Accounting Standards Board (Norsk Regnskapsstiftelse), plus a risk premium. Qualified actuaries perform the calculations.
The actuarial gains or losses are recognized using a corridor. The corridor is defined as 10 percent of the highest of the Defined Benefit Obligation (DBO) and total plan assets. The net actuarial gain or loss exceeding the corridor is amortized in the income statement over the estimated remaining period of service from the members in the plan.
CASH AND CASH EQUIVALENTS
Cash and cash equivalents include cash and bank deposits. TRADE RECEIVABLES AND OTHER SHORT-TERM RECEIVABLES
Trade payables are recognized at the higher of the transaction
amount (historic cost) and the fair value at the time of reporting.
IMPAIRMENT OF FINANCIAL ASSETS
Financial assets, other than those recognized at fair value through the income Accounting policies statement, are assessed for indicators of impairment at each balance sheet date. Financial assets are impaired when there is objective evidence that, as a result of one or more events that occurred after the initial recognition of the financial asset, the estimated future cash flows of the investment have been impacted. For financial assets carried at historic cost, the amount of the impairment is the difference between the asset’s carrying amount and the present value of estimated future cash flows.
INTEREST-BEARING BORROWINGS
Interest-bearing borrowings are recognized initially at historic cost including transaction costs.are included in net income.
FINANCIAL INSTRUMENTS
Nammo AS uses financial instruments to hedge exposure against foreign exchange risk in operating, financing and investment activities. These are mainly forward currency contracts to hedge risk of currency fluctuations (cash flow hedges). The effect of the financial instruments used as hedging instruments in a cash flow hedge, are recognized in the income statement in the same period as the hedged transaction is recognized (hedge accounting).

40
NAMMO AS
1. RELATED PARTY TRANSACTIONS AND REVENUE Sales and purchase transactions with group companies are conducted in compliance with normal commercial terms and the arm’s length principle. Agreements with related parties are concluded in writing.
NOTES TO THE ACCOUNTSNAMMO AS
For details about the remuneration to the CEO and the Board of Directors, refer to note 4 in the Group financial
statements.
Revenue:
(NOK 1 000) 2018 2017
Management service fee group companies 95 862 87 104
Other 4 788 4 468
Total 100 650 91 572
2. SALARIES AND SOCIAL COST
(NOK 1 000) 2018 2017
Salaries 39 816 33 026
Employment taxes 5 384 4 832
Pension costs 4 399 3 516
Other social costs 5 206 3 564
Total 54 805 44 938
Average number of man-years 18 17
Auditor’s fee
(NOK 1 000) All numbers are presented exclusive VAT 2018 2017
Auditor’s fee 272 575
Other services - 124
Total 272 699
(NOK 1 000) 2018 2017
Interest income from group companies 33 851 27 436
Other interest income 16 922 13 829
Total interest income 50 773 41 265
Gain on exchange 52 222 -
Dividend from group companies 19 153 -
Total other financial income 71 375 -
Loss on exchange (28 356) (80 609)
Write-down receivable Nammo Buck GmbH, see note 14 (33 387) (50 036)
Other financial expenses (3 227) (2 255)
Total other financial expenses (64 970) (132 902)
Other interest cost (32 449) (22 710)
Total interest cost (32 449) (22 710)
3. FINANCIAL ITEMS

41
NAMMO AS
4. FIXED AND INTANGIBLE ASSETS
5. SHARES IN OTHER COMPANIES
6. ACCOUNTS RECEIVABLES
7. CASH RESERVE
BuildingsMachines and
equipmentFixtures, fittings and
office equipment
Total
Acquisition cost as of 01.01.18 845 606 7 054 8 505
Additions during the year 67 88 3 507 3 662
Acquisition cost as of 31.12.18 912 694 10 561 12 167
Accumulated depreciations 31.12.18 (853) (595) (6 551) (7 999)
Book value as of 31.12.18 59 99 4 010 4 168
Ordinary depreciations for the year 8 22 447 477
Annual leasing cost on assets not in the balance sheet 1 010 42 36 1 088
Economic life time (years) 5 years 3-5 years 3-10 years -
Depreciation plan Linear Linear Linear
Company’s share capital
Number of shares owned
Nominal value
Booked value
Ownership
Subsidiaries:
Nammo Raufoss AS, Raufoss NOK 150 000 000 150 000 150 000 175 000 100%
Nammo Sweden AB, Lindesberg SEK 10 000 000 100 000 10 000 59 961 100%
Nammo Lapua Oy, Lapua EUR 4 793 000 285 000 - 105 006 100%
Nammo Buck GmbH, Pinnow EUR 26 000 1 26 - 100%
Nammo Incorporated, Virginia USD 38 380 000 - - 239 983 100%
Nammo NAD AS, Løkken Verk NOK 4 782 000 23 910 2 391 8 136 100%
Nammo Polska SP. Z. O. O, Warsaw PLN 50 000 1 000 50 108 100%
Nammo India Ltd, New Delhi INR 100 000 10 000 100 12 100%
Nammo UK Holding Ltd., Westcott - - - - 100%
Nammo Ireland Ltd., Dublin EUR 476 250 375 000 476 250 21 159 100%
Nammo Technologies Inc., Virginia - - - - 100%
Total 609 365
(NOK 1 000) 2018 2017
Accounts receivables 568 -
Accounts receivable are booked at nominal value. There has been no loss on accounts receivable in 2018.
Cash is reduced with the draw that the group companies has in the international cash pool of NOK 621.8 million. This is classified as receivables from group companies. Refer to note 13. Net cash is negative and presented as bank overdraft as part of current liabilities in the balance sheet.
(NOK 1 000)
(NOK 1 000)

42
NAMMO AS
8. SHARE CAPITAL As of 31 December 2018, Nammo AS’s share capital is NOK 100 million, split on 1 000 000 shares of NOK 100 each. Nammo AS shareholders as of 31 December 2018:
Number of shareholders
Number of
shares
Ownership
/vote
The Norwegian State, represented by the Ministry of Trade, Industry and Fisheries
500 000 50%
Patria Oyj, Finland 500 000 50%
Total 2 1 000 000 100%
9. EQUITY
Share capitalOther paid
in capitalOther equity
Total
Equity as of 01.01.18 100 000 258 670 494 403 853 073
Net income - - 69 131 69 131
Dividend *) - - (120 100) (120 100)
Other items - - 2 2
Equity as of 31.12.18 100 000 258 670 443 436 802 106
10. PENSION LIABILITY AND PENSION COSTS
*) Board of directors proposal for the annual general meeting
The pension liabilities are calculated based on the Norwegian accounting standard. Nammo AS has established a collective pension plan according to Norwegian tax law and the law for pensions for all employees (Lov om foretakspensjon). The plan includes 18 active members. Nammo AS is a member of the LO/NHO AFP-plan. The old plan is closed and the corresponding pension liability deriving from the plan is de-recognized in the balance sheet. The pension liability in the new AFP-plan is not possible to estimate reliably at year-end; therefore, this pension liability is not recognized in the balance sheet. The net periodic pension cost is based on this year’s actuarial calculations of earning of pension rights, and is included in payroll expenses in the profit and loss. The actuarial calculation was performed in December 2018 with the following assumptions:
Yield from pension funds 4.00% Interest rate used to discount future cash flows 2.30% Annual salary increase 2.50% Annual increase in G 2.25% Annual change in pension 0.40%
Pension cost
(NOK 1 000) 2018 2017
Service costs 4 412 2 632
Amortization of net actuarial losses (gains) 756 1 010
Interest costs 22 276
Expected return on plan assets (791) (402)
Net pension cost 4 399 3 516
(NOK 1 000)
(NOK 1 000)

43
NAMMO AS
11. INCOME TAXES
11.1.This year’s tax cost
(NOK 1 000) 2018 2017
Defined benefit obligation incl. payroll tax 40 912 38 411
- Fair value of plan assets (31 086) (29 030)
Gross pension liability 9 826 9 381
Items not recognized in the profit and loss:
Unrecognized net actuarial loss (gain) (12 983) (11 706)
Net amount recognized in the balance sheet (3 157) (2 325)
The difference between the net income before tax and the basis for the tax calculation is specified below.
(NOK 1 000) 2018 2017
Profit before tax 93 537 (41 965)
Permanent differences 17 025 54 981
Changes in temporary differences (20 251) 96 343
Taxable income 90 311 109 359
Deferred tax calculation
(NOK 1 000) 2018 2017
Tangible fixed assets (67) (1 111)
Financial fixed asset 102 346 83 971
Accounts receivables (300) (300)
Pension liability/asset 3 157 2 325
Net temporary differences as basis for deferred tax /tax asset (-) 105 136 84 885
Deferred tax/deferred tax asset (-) 23 130 19 524
Specification of the tax cost in the profit and loss:
Tax payable 20 773 25 153
Changes in deferred tax 3 606 (23 971)
Adjustment previous period 27 -
This year’s tax cost 24 406 1 182
Explanation to why the tax cost is not 23% of profit before tax:
Profit before tax 93 537
23 % of profit before tax 21 514
23 % of permanent differences 3 915
Adjustment last year 27
Effect of change in tax rate (1 050)
Calculated tax cost 24 406
Effective tax rate 26.1 %
11.2. Deferred taxes
The deferred tax liabilities/tax assets have been calculated based on the temporary differences existing at the end of the accounting year between accounting values and taxation values. The specification below shows the temporary differences and the calculation of the deferred tax liabilities/tax assets at the end of the accounting year.
Pension liabilities

44
NAMMO AS
12. INTEREST BEARING LOANS AND GUARANTEES SHARE CAPITAL
13. CASH POOL
14. IMPAIRMENT INVESTMENT IN SUBSIDIARY
(NOK 1 000) Final maturity date Facility total Utilized Available
Term loan facility, EUR 98.1 millions 19 September 2021 976 177 976 177 -
Revolving credit facility, NOK 1 000 millions 6 December 2021 1 000 000 338 852 661 148
Nammo AS long term loans from credit institutions as of 31 December, 2018 consist of:
Available unused cash credits at 31 December 2018:
The financial covenants related to the long term loans from credit institution are: - Net Debt to EBITDA maximum 4.0, and - Total Equity to Total assets, minimum at 30% At December 31, 2018 there are no default related to the financial covenants.
Nammo AS has established an international cash pool together with the following group companies:
Finland: Nammo Lapua Oy and Nammo Vihtavuori Oy Germany: Nammo Schönebeck GmbH, Nammo Buck GmbH and Nammo Germany GmbH Norway: Nammo AS, Nammo Raufoss AS and Nammo NAD AS Sweden: Hansson Pyrotech AB, Nammo Sweden AB and Nammo Demil AB USA: Nammo Inc., Nammo Talley Inc., Nammo Composite Solutions LLC., Nammo Tactical Ammunition LLC., Nammo Pocal Inc., Nammo Technologies Inc. and Capstone Precision Group LLC. Spain: Nammo Palencia S.L. Ireland: Nammo Ireland Ltd. UK: Nammo Westcott Ltd. and Nammo Cheltenham Ltd.
Nammo AS subsidiaries’ balance on the cash pool is included in receivables from group companies. This amounts to NOK 621.8 million. See note 7.
At 31 December, 2018 Nammo AS had a cash credit receivable towards our subsidiary Nammo Buck GmbH at a total of NOK 83.5 million. At year-end we performed an impairment test and concluded that this asset is impaired, hence the amount is written down in full at year end (of which NOK 50 million was written off in 2017). The write-down is related to a cash credit receivable, and therefore the write-down is classified as other financial expenses in the profit and loss.
(NOK 1 000) Cash credits
Revolving credit facility 661 148
Additional cash credits available 203 246
Total unused cash credits at year-end 864 394
(NOK 1 000) 2018 2017
Total interest bearing loans 1 315 029 1 304 026
Guarantees:Guarantees not recognized in the balance sheet as of 31 December 2018 is NOK 417.2 million.

45
AUDITOR’S REPORT

46
AUDITOR’S REPORT

47
AUDITOR’S REPORT

48
INTRODUCTION
Nammo AS is a limited liability company established under Norwegian law, with a governance structure based on the Norwegian Limited Liability Companies Act (Aksjeloven) and similar laws in the other countries where we operate. Our governance system has been developed through cooperation between the Board of Directors and the Nammo Group management in order to ensure compliance with the relevant laws and regulations. Our governance system is also important to ensure efficient controls for the business processes. Corporate governance is regarded as a key element in the short-term sustainability of business operations, as well as preparation for a long-term development of the company. Corporate governance encompasses the leadership culture, vision and values, ethical code of conduct, risk management, reporting and control mechanisms.
Over the latest years we have implemented an updated corporate governance framework, Nammo Management System (NMS). The Nammo Management System describes how the Nammo Group is managed and our continuous process for identifying and handling risks in our business. Through the NMS we have formalized a yearly process for risk management and re-enforced the hierarchy and structure of the steering documents such as directives, procedures and instructions. The risk assessment process and the evaluation of the steering documents is a continuous process throughout the year and the status will be reported to the Board of Directors on a regular basis, minimum once per year.
CORPORATE DIRECTIVES
The framework for leadership, organization and culture is the foundation of the Nammo management system. The system is based on the delegation of responsibility to our legal subsidiaries and business units, as well as corporate functions, such as finance, human resources, communication, IT, HESS and business development etc. In order to maintain uniform standards and control, we have defined common requirements in the form of corporate directives that are mandatory for all parts of our organization. The directives address areas such as strategy and business planning, finance, risk management, organizational and employee development, HESS (Health, Environment, Safety and Security), ethics, as well as corporate social responsibility.
CONTROLS AND PROCEDURES
The Nammo management system is designed to provide reasonable assurance to Nammo’s Group management and the Board of
Directors regarding the preparation and presentation of our financial statements. The management of Nammo AS is responsible for establishing and maintaining adequate internal control over financial reporting. Our internal control over financial reporting is a process designed under the supervision of the Group CEO and the Group CFO. The accounting principles applied by the group follow the Norwegian Generally Accepted Accounting Principles (N GAAP).
In the finance area, there are directives for budgeting and forecasting, financial reporting and treasury management. As an integral part of the directives in the financial area, we have implemented an accounting manual that regulates the accounting treatments for all material accounting processes. This work has also resulted in an internal control handbook that states the minimum requirements for the internal control activities to be performed in the respective financial areas.
GENERAL MEETING OF SHAREHOLDERS
The shareholders of Nammo AS have the ultimate authority through the general meeting. The shareholders are Patria Oyj and the Norwegian State, represented by the Ministry of Trade, Industry and Fisheries. The annual general meeting is normally held in the second quarter each year. The shareholders’ agreement outlines the number of representatives on the Board of Directors for each of the owners, and guidelines for the election of the chairman of the board.
CORPORATE GOVERNANCE

49
CORPORATE GOVERNANCE
The annual general meeting approves the annual report based on the Norwegian requirements and financial statements, including the dividend proposed by the Board of Directors and recommended by the group management. The general meeting also appoints the external auditors and determines the Auditor’s remuneration. In addition, the general meeting deals with all other matters listed in the notice convening the meeting.
BOARD OF DIRECTORS
The Board of Directors of Nammo AS shall consist of six to eight directors in accordance with the shareholders’ agreement: three from each owner, and two directors representing the employees. The employees may also nominate one additional observer, so that all the employees from Norway, Sweden and Finland are represented. The position, chairman of the board, alternates annually between the two owners. The Board of Directors meets regularly with a minimum of four meetings per year.
In accordance with the Norwegian Limited Liability Companies Act (Aksjeloven), the Board of Directors exercises the overall governance of the company, including ensuring that appropriate management and control systems are in place.
The Board of Directors supervises the daily management carried out by the group CEO.
PRESIDENT AND CEO
The president and CEO constitute a formal corporate body in accordance with Norwegian Limited Liability Companies act (Aksjeloven). The CEO is responsible for the day-to-day management of the group. The CEO’s responsibility is outlined in the shareholders’ agreement. The CEO governs the operation through the internally established corporate directives described above, current corporate policies, management meetings and business reviews. Management meetings are held about eight times a year and are called by the CEO. The executive vice presidents and senior vice presidents on the CEO’s staff also participate. These meetings focus on monitoring the status of operations and key performance indicators. The market situation and business development issues are also addressed, as well as health, environment, safety and security indicators and human resource issues. The group CEO conducts quarterly individual business review meetings with the business units. These meetings are a vehicle for scrutiny of the business units’
performance relative to budgets and targets. The market situation, order intake, new opportunities and other significant items at the time are also addressed.

www.nammo.com
Nammo ASP.O. Box 142NO-2831 RaufossNorway