2018-2022 corporate plan summary - … · be from chinese visitors during the 2018 year of...
TRANSCRIPT
1 | 2018-2022 Corporate Plan Summary

Destination Canada | 2
CONTENTS CONTENTS 2
MESSAGE FROM THE CHAIR OF THE BOARD 3
EXECUTIVE SUMMARY 4
ABOUT US 5
2016 ORGANIZATIONAL PERFORMANCE 9
GLOBAL CONTEXT 10
CANADIAN INDUSTRY CONTEXT 12
ORGANIZATIONAL CONTEXT 15
STRATEGIC PLAN: NORTH STAR 22 17
MEASURING PERFORMANCE 26
LINK TO FEDERAL PRIORITIES 28
GOVERNANCE 30
FINANCIAL PLAN 36
ANNEX A: STRATEGIC RISK MANAGEMENT 57
3 | 2018-2022 Corporate Plan Summary
MESSAGE FROM THE CHAIR OF THE BOARD
The last few years have been an exciting time for Canada’s tourism industry. Canada has been welcoming visitors at near-record numbers and at long last the country is gaining market share. The Government of Canada’s New Tourism Vision, led by the Honourable Bardish Chagger, Minister of Small Business and Tourism, charts a concrete path towards long-term growth. We thank the Minister and the Prime Minister of Canada for formally recognizing tourism, through this New Tourism Vision, as a concrete driver of economic growth for the middle class and a direct support for over 720,000 jobs. As part of this New Tourism Vision, Destination Canada will see its annual appropriations stabilize, beginning in 2018. My colleagues on the Board and I are grateful for this additional investment which provides stability for federal marketing on an ongoing basis. Destination Canada is leading a new and industry-centric approach to how it markets and invests. This is a long-term strategy premised on collaboration and alignment with industry partners, and is in direct support of Canada’s New Tourism Vision and the mandate that has been placed on the Minister. Under this “North Star 22” Strategy, Destination Canada is leading an aligned partnership of tourism marketing organizations at the provincial, territorial and city levels. We are working better and smarter together to deliver innovative and compelling marketing programs that will facilitate international market reach for small- and medium-sized tourism businesses, and ultimately accelerate growth in visitation and spending for Canada. We will work to accelerate growth particularly from China as 2018 has been designated as the Year of Canada-China Tourism. To commemorate this exciting milestone, we will significantly boost our marketing presence in this market in 2018. Outperforming our competitors and growing market share for Canada will take a “Team Canada” approach. I look forward to the industry working jointly and in alignment under the North Star 22 marketing partnership to take the industry to new heights and enhance Canada’s long-term competitiveness.
Ben Cowan-Dewar Chair, Board of Directors

Destination Canada | 4
EXECUTIVE SUMMARY Canada is experiencing a period of strong performance when it comes to tourism. After a decade of declining international visitation and reduced market share, Canada saw a turning point in 2014 as a result of the global economic recovery. Increased visitation has continued over the years, with growth in international arrivals to Canada in 2016 hitting a 14-year high and outperforming the global average by nearly three times. Prominent publications such as Lonely Planet, Condé Nast and the New York Times named Canada as a top vacation destination for 2017. Forecasts for 2017 are positive with predictions of continued momentum along this trajectory. All players in the industry – destination marketers, tourism businesses and the federal, provincial and territorial governments – understand that tourism is a vital part of the economy. While visitation is on the rise, the country is far from reaching its potential as a competitive destination for leisure tourists and business travellers. We all need to do our respective parts to ensure that Canada is seen as a destination of choice – whether for travel, business or long-term investment opportunities. The federal government recently unveiled Canada’s New Tourism Vision containing a clear plan to improve long-term visitation to Canada and position the country to compete for a top ten ranking among international destinations. Aligned with this Vision, we are leading a collaborative Team Canada approach with our industry partners to chart a path towards increased visitation, spending and market share. This approach is a truly aligned, multi-year investment plan with our partners to reap Canada’s fair share of the global tourism economy and surpass global growth on an ongoing basis. Canada’s New Tourism Vision target of increasing arrivals by 30% is ambitious, but is the key to creating long-term competitiveness for Canada as a tourism destination and increasing capital investment in the sector. As outlined in this Corporate Plan, Destination Canada’s specific goal will be to incite nearly 1.5 million additional travellers spending $1.9 billion by 2022, and we anticipate a large portion of this travel to be from Chinese visitors during the 2018 Year of Canada-China Tourism. This is the incremental economic benefit that we will produce in our capacity as an accelerator of travel demand. Working together as Team Canada, we will invest in a long-term, sustainable tourism strategy that will harness existing tailwinds and accelerate economic growth across the country. We envision a boost to Canada’s position on the world stage, and ensuing private capital investment in the tourism sector that will strengthen Canada as a compelling destination.
5 | 2018-2022 Corporate Plan Summary
ABOUT US
Role Tourism plays a critical role in Canada’s entrepreneurial development and job creation. As Canada’s national tourism marketer, Destination Canada (DC) markets Canada abroad to leisure and business travellers to increase international arrivals and grow the Canadian tourism industry. We work with partners in provincial and territorial governments and stakeholders in the tourism industry to help Canada’s tourism businesses reach international markets. Supporting the federal priorities to grow the tourism sector and create jobs, we are a catalyst of long-term success and prosperity for the thousands of small- and medium-sized businesses that make up Canada’s tourism community. We connect local tourism operators with new markets, contributing to their livelihood and prosperity. We are also a leader in industry knowledge, equipping partners with intelligence, tools, and insights to optimize their business and maximize their reach.
Mandate As a federal Crown corporation owned by the Government of Canada, we report to the Minister of Small Business and Tourism. Established under the Canadian Tourism Commission Act, our legislative mandate is to:
sustain a vibrant and profitable Canadian tourism industry;
market Canada as a desirable tourist destination;
support a cooperative relationship between the private sector and the governments of Canada, the provinces and the territories with respect to Canadian tourism; and
provide information about Canadian tourism to the private sector and to the governments of Canada, the provinces and the territories.
Presence As of September 1, 2017, we have a staff complement of 103.5 full-time equivalent employees around the world. We are headquartered in Vancouver and have a small satellite office in Ottawa focused on government relations activities including aligning with government priorities and working with the federal family on tourism-related issues.

Destination Canada | 6
Markets We target 10 leisure markets around the world and five business markets for the purposes of bringing meetings, conventions and incentive travel programs to Canada. These markets are chosen based on prevailing market conditions and performance potential for Canada.

7 | 2018-2022 Corporate Plan Summary
Funding We operate on a calendar fiscal year and are financed primarily through parliamentary appropriations according to the Government of Canada fiscal year running from April 1 to March 31. Beginning in government fiscal year 2018/2019, our base funding level will stabilize at $95.5 million. For the 2017/2018 year, the base funding level is $58 million and is supplemented with time-limited funding. Through our co-investment strategy, we create public and private partnerships to leverage our core appropriations and extend our global marketing reach.
Working with Partners Working in cooperation with tourism partners helps to advance the relevancy of our programs and platforms, and drives commercial interests that generate economic prosperity across the country. Over the years, we’ve examined our partnership model to increase co-investments that are more commercially relevant and enhance service delivery of our programs geared at driving long-term success for Canada’s tourism entrepreneurs. In 2016, co-investments increased by 55% from the year prior, while core and one-time appropriations increased by 37% during this same time period. This demonstrates the increasing relevancy of our programs and initiatives with commercial partners. We’ve collaborated with our partners on sharing consumer data to enhance analytical capabilities and derive stronger intelligence, and on exploring opportunities to better measure the effectiveness of our digital marketing efforts to inform future marketing decisions. These are just a few examples of the ways that working jointly with our tourism partners helps to foster entrepreneurial prosperity for Canada’s tourism businesses. In 2016, we entered into the following three strategic agreements, reaffirming our commitment to work closely with partners:
a multi-year partnership with Air Canada for global collaboration on strategic marketing initiatives
a multi-year agreement with Parks Canada to drive international visitation to Canada’s parks and historic sites
a renewal of our relationship with Aboriginal Tourism Association of Canada for the continued development of Aboriginal tourism destination and product awareness
(in millions) CALENDAR YEAR
FUNDING TYPE
2017 2018 2019 2020 2021 2022
A-Base $58.0 $86.1 $95.5 $95.5 $95.5 $95.5
Connecting America
$10.0 $7.7 - - - -
Budget 2016
$31.6 $6.4 - - - -
TOTAL $99.6 $100.2 $95.5 $95.5 $95.5 $95.5

Destination Canada | 8
Mostly recently, in 2017 we entered into a three-year global partnership with WestJet to align marketing strategies in shared international markets. This agreement brings together our marketing efforts with WestJet's continuing expansion of air access to grow Canada's tourism industry. These types of strategic partnerships are significantly changing the way we work together and how we collectively strive for success. By bringing together the right partners and aligning industry efforts, we help Canadian tourism businesses extend their reach and assert a greater presence internationally.

9 | 2018-2022 Corporate Plan Summary
2016 ORGANIZATIONAL PERFORMANCE Our ability to grow arrivals and ultimately contribute to increasing Canada’s market share is premised on translating the effectiveness of our marketing efforts into actual visitation. Employing rigor in our assessment practices, we use various methods for attributing our performance in our channels: third-party marketing attribution modelling to assess our direct to consumer marketing activities; actual sales resulting from promotions undertaken with the travel trade; and the value of confirmed international business event bookings to Canada. In 2016, our marketing efforts attracted almost 1.2 million additional visitors and business delegates to Canada collectively spending over $1.5 billion.

Destination Canada | 10
GLOBAL CONTEXT
Tourism Performance 2016 marked the seventh straight year of sustained growth in international tourism. According to the United Nations World Tourism Organization (UNWTO), 1.2 billion travellers were on the move – an increase of 47 million from 2015. Such solid and uninterrupted growth has not been seen since the 1960s1.
Despite threats of terrorism and political unrest, world travel in 2016 grew at a stable 3.9%, fueled once again by outbound travel from the rapidly developing Chinese market. International tourism expenditure by Chinese travellers grew by 12%, consolidating their position as the world’s biggest spender on outbound tourism and making the Chinese traveller a lucrative segment for tourism destinations2. The United States, the world’s second largest source market, also contributed largely to global growth, thanks to its strong dollar which encouraged more Americans to travel abroad3.
While concern about safety and security are heightened, it had virtually no impact on the volume of outbound travel. World tourism is still resilient and remains on a growth path. Sensitivity to possible security risks continues to impact consumer travel, but in terms of destination choice rather than the decision to travel4. Projections for 2017 are also positive. A similar pace of world tourism growth is expected, and is predicted to be powered by growing middle classes in emerging economies, increased air connectivity and more affordable travel.
Travel Trends The global travel industry is a dynamic one where trends have the power to influence how tourism businesses meet the changing needs of travellers. Over the last few years, we’ve seen a rise in the number of millennials travelling abroad. They have quickly become the largest generation in history, are tech-savvy and are not shy about travelling off the beaten path; in fact, they seek it. With time and disposable income, millennials are regarded by many as a key segment to tourism growth. Active and adventure trips have been growing in popularity. While interests have been falling in hard adventure travel, interest has been rising in tourism products featuring soft adventure travel along with a customized experience.
1 UNWTO World Tourism Barometer, Volume 15, March 2017. 2 Ibid. 3 ITB World Travel Trends Report 2016/2017 4 Ibid.

11 | 2018-2022 Corporate Plan Summary
Keeping up with tourism marketing trends means we are watching what our competition is doing. We look at our comparative market share on a country by country basis to better understand where travellers are going and why. We also conduct primary market research to understand how the Canada brand competes with other country brands.
We stay on top of industry news by subscribing to global media publications like e-Marketer and Skift. We were named by Skift as the only national marketing organization with a best-in-class tourism website for two years in a row. Our paid media agencies have compared our website to our competitors’ in regular market audits.
In social media platforms we follow our competitors using analytic tools to compare audience size and engagement and to seek best practices. As an example, on Instagram we are on track to hit one million followers by the end of 2017. The only country with more followers is Tourism Australia (Brand USA has 58,000, Visit Britain has 366,000 and New Zealand has 679,000).
Food tourism has also become a great motivator for travel. An emerging travel trend, culinary tourism offers a great way to connect with local culture and tradition. The combination of travel with edible experiences presents travellers with a direct way to experience authentic local culture and really get to know the destination they’re visiting.
Marketing Trends Changing consumer travel preferences and rapid advances in technology greatly impact the marketing strategies of tourism destinations. With some two billion consumers worldwide owning a smartphone, relationship marketing is now more important than ever. Building long-term engagement and trust with consumers is regarded as the key to driving visitation to a destination. There’s been a noticeable shift from mass marketing to personalized outreach efforts, particularly when it comes to tourism, and this is proving an effective method for driving long-term loyalty and consumer advocacy. Personalized marketing necessitates having access to mass amounts of data that can inform business decisions. Access to data through sophisticated analytics and interpretable reports can reveal patterns and trends in consumer behavior, and inform decisions on which consumer demographics to target, when and through which channels. In addition to relationship marketing and big data analytics, another major trend in travel marketing is using multi-channels to reach the consumer. Tourism marketing is operating in a very complex and changing environment. Digital disruptors like Uber and Airbnb, just to name a couple, are revolutionizing how travel is planned and experienced. Consumers are “always on”, often toggling between multiple devices to research and book travel. With opportunities for distraction aplenty, marketing in this hyper-connected world means eliminating complexity so that a traveller’s decision to visit a destination is made easy. This is a golden age of marketing, with more tools, technologies and channels at marketers’ disposals to engage and convert travellers.

Destination Canada | 12
CANADIAN INDUSTRY CONTEXT
Tourism in Canada Tourism is a significant driver of Canada’s economy, generating over 720,000 jobs in the sector and
support for nearly 200,000 small- and medium-sized tourism businesses across Canada in 2016. As the
country’s number one service export, tourism is larger than agriculture, forestry, fishing and hunting combined. In every region of the country, tourism creates jobs and opportunities for Canada's middle class. Canada welcomed close to 20 million international overnight visitors spending $20 billion in 2016, just shy of the record 20.06 million arrivals in 20025. Canada’s growth of 11.1% was its strongest in 30 years, outpacing global growth by nearly three times. Not since Expo 86 has Canada seen such a rise in demand. As a result of improved market conditions across the globe, increased air capacity and innovative marketing, Canada’s market share is growing. In other words, Canada’s pace of growth is outperforming global growth. Over the last few years, improvements have been made to reduce visa barriers, including lifting visa requirements for Mexican travellers and expanding the Electronic Travel Authorization Program to select visa-required countries. In addition, liberalization of air access, such as with China and Mexico, have resulted in substantial increases in air capacity to Canada from priority markets. Similarly, innovative marketing has helped to drive interest and encourage action. Movements towards content marketing and embracing digital technologies to be “always on” have resulted in being able to reach and engage with travellers at multiple touch points and at multiple times, and have served to positively influence traveller perceptions. The above conditions have helped to foster the recent tourism boom in Canada. Coming off of the excitement of celebrations commemorating Canada’s 150th birthday in 2017, the country is in the international spotlight like never before. The world has taken notice of Canada and market share is growing. While Canada is on an upswing, it falls into the bottom tier of a competitive set of advanced economies, including Australia and the UK, with similar travel costs, connectivity, tourism product and infrastructure. Continuing to outpace global growth would allow Canada to catch up to the next tier of countries, such as Germany and New Zealand, which has been maintaining or growing market share over the last decade. Additionally, internal capacity issues in the sector have been mounting. We’ve heard from our colleagues in the industry of capacity constraints in the areas of accommodations, local transport and attractions during peak seasons, particularly in gateway cities, and the need to address this real concern. We also know that many tourism businesses do not have the resources needed to reach high-yield international markets and therefore require national leadership to expand their reach.
5 Statistics Canada, International Travel Survey, 2016.

13 | 2018-2022 Corporate Plan Summary
Increasing capacity and developing new products won’t happen overnight, and will require the concerted cooperation and investment of governments at all levels and the private sector. Until changes come online, the phenomenal growth Canada has seen over the last two years may slow somewhat. Going forward, in order to keep pace and surpass the market shares of competitor countries, it will be imperative to capitalize on market opportunities and travel trends in a coordinated fashion with all stakeholders – governments and industry.
Canada’s New Tourism Vision According to the UNWTO, “It is time for destinations to diversify to new markets, create new products and develop new segments”6. The Government of Canada’s New Tourism Vision, launched in May 2017 and led by the Honourable Bardish Chagger, Minister of Small Business and Tourism, has recently identified a whole of government approach to seize the global opportunity that tourism offers. Specifically, the plan will invest in stronger and more sustained marketing, address issues related to travelling to and within the country, and support tourism businesses and operators as they work to upgrade their offerings with new, innovative products and services. Under these three pillars – marketing, access and product – this Vision sets out concrete targets for growth that will mean more jobs and a boost for tourism businesses across the country.
Marketing Marketing is key when it comes to attracting tourists to Canada. As part of Budget 2017, the Government of Canada will invest $95.5 million to DC on an annual basis. Previously, targeted short-term funding had been provided for specific marketing campaigns, but this long-term stabilized funding will allow us to plan ahead with certainty and continue sustained marketing campaigns to attract more visitors. Most importantly, long-term funding allows for us to plan with our partners in confidence, generating greater alignment and efficiency.
Access Trip planning undoubtedly is affected by ease of access to a destination. Making Canada easier to get to through liberalized air transport agreements and a lifting of visa requirements in recent years has proven an effective strategy in increasing tourism and trade between countries. The Government of Canada’s lift of visa requirements for Mexican nationals in 2016 will continue to encourage growth in air travel from one of Canada’s highest source markets. Additionally, expanding the number of visa application centres (VACs) in China from four to up to 11 will increase commercial ties and boost tourism flows from that country. With 2018 being designated as the Year of Canada-China Tourism, additional VACs present an opportunity to welcome more visitors from the world's largest outbound travel market.
6 ITB World Travel Trends Report 2016/2017

Destination Canada | 14
Product In a competitive global market where tourists seek authentic experiences, investments in product development can help to differentiate Canada from the competition and help its cultural and tourism assets stand out in a crowded marketplace. As part of this Vision, the federal government has made commitments to support the development of Canada’s unique and authentic Indigenous tourism industry, LGBTQ2 tourism, culinary tourism, and to broaden Statistics Canada’s tourism data collection.
Working with Provincial and Territorial Partners The government is also committed to working closely with provincial and territorial colleagues through the Canadian Council of Tourism Ministers to grow and increase the competitiveness of Canada’s tourism sector.

15 | 2018-2022 Corporate Plan Summary
ORGANIZATIONAL CONTEXT
Corporate Services Ensuring that we are optimally resourced, both from a financial and non-financial perspective, supports the execution of our strategy. In 2015, we hired the firm Ernst & Young, LLP to undertake an internal audit of the efficiency and effectiveness of our corporate functions. The assessment included reviews of our business units of human resources, information technology, financial operations and procurement. The results of this audit noted that, on the whole, our corporate functions were efficiently resourced and effective, but lean compared to public and private sector comparators. In particular, our corporate functions of human resources, information technology and procurement were found to be leaner than most, and our corporate expenditures were found to be approximately six percent lower than the average. Opportunities for improvement were identified in the leveraging of technology and standardization of processes. We also continue to explore opportunities to onboard new technology for the automation of some human resources and procurement processes.
Strategic Planning Process We follow a highly-integrated planning process when it comes to setting our long-term strategic objectives. We value the input we receive from Canada’s tourism industry stakeholders. Our robust practice of ensuring that our strategic decisions are based on strong market insights is premised on industry consultations with our advisory committees, as well as with leaders of tourism marketing organizations, provinces, territories, and other industry stakeholders. Our consultation structure facilitates bringing together key stakeholders from industry and governments to share the latest market knowledge and spot emerging challenges and opportunities. As an example, we are a member of the Air Consultative Committee co-chaired by Canada Border Services Agency and Transport Canada. This committee, which includes members representing airlines, airports, industry associations and other government departments, regularly meets to discuss developments in air transport policy and to share market research and tourism insights. In addition, our Tourism Town Halls, in partnership with the Tourism Industry Association of Canada, provide an opportunity to engage small- and medium-sized business owner-operators across Canada to better understand efforts being made on national tourism issues. Town Halls allow owner-operators to provide first hand input on issues affecting their business and the tourism industry such as marketing, export readiness, government policies, financing and business development. Complementing the input we receive from industry advisors and stakeholders is our in-depth quantitative analysis to inform our budgeting process. We use forecasting models and traveller yields to determine where regional investment is needed to drive long-term visitation and spending. This analysis is complemented by detailed country by country analysis to determine the annual recommended investment

Destination Canada | 16
levels in each potential market. Our models assess general economic conditions and detailed information on the Canadian industry, incorporate on the ground intelligence, and factor in risk/reward tradeoffs. As part of our planning process we conduct a detailed risk assessment, described in Annex A, and key risks affecting our performance success continue to be those that are outside our control, including currency fluctuations and disruptions in the global economic and political environment. To mitigate against these risks, we maintain a diversified portfolio of markets. The rigor we apply in conducting analysis and consultations with our industry stakeholders is key in ensuring that we address industry challenges and government priorities while delivering on our mandate.
Change to our Markets of Focus As mentioned, we maintain a balanced portfolio approach in our market investments to mitigate against influential factors beyond our control. At the same time, we undertake an assessment of how all of our markets are performing on an annual basis. Based on a recent assessment of our markets, in 2018, we will cease our leisure marketing operations in Brazil. In recent years, due to a variety of factors outside our control such as currency exchange and dampened economic conditions in Brazil, tourism arrivals from this market have not been reaching anticipated levels. Our exit in 2018 will enable us to further invest in high-yield markets like China, the US, the UK and Mexico.
17 | 2018-2022 Corporate Plan Summary
STRATEGIC PLAN: NORTH STAR 22 Our mission at DC is to propel a vibrant and profitable Canadian tourism industry over the long-run. We are leading the charge for a multi-year sustainable strategy to outperform the global rate of tourism growth over the next five years and capture increased market share for Canada. This five-year strategy, entitled North Star 22, is a multi-year, Team Canada collaborative plan with our partners for better marketing alignment, collaboration and co-investments. Just as the North Star has historically been used as a critical navigation tool, North Star 22 will serve as a focal point for the industry to come together in a coordinated and unified fashion to invest and promote Canada in priority international markets like never before. Underpinned by growing aviation capacity, currency advantages, a strong country brand and increased federal marketing investments, Canada’s tourism industry is currently experiencing healthy tailwinds. Increased visitation over the last few years has far surpassed the rate of global growth and this momentum is predicted to continue in the near future. This current wave of success is welcomed after a sustained period of decline. Canada is only beginning to tap into the growth in global travellers and future growth in the long-term is not guaranteed. There is still much work to do to increase Canada’s competitive position as a destination for leisure and business travellers who bring fresh dollars that support tourism businesses in every region of Canada. While our business of tourism marketing has the power to influence travellers’ perceptions of Canada as a destination, is should be noted that it is one of many factors impacting Canada’s international competitiveness. These factors, including sufficient capacity in the transport and accommodations sectors, visa policies, foreign exchange and political and economic stability, just to name a few, all have the power to influence a traveller’s decision to visit Canada and extend beyond Destination Canada’s mandate.
The internal capacity challenge noted earlier requires the increased pursuit of higher value international visitation. A lucrative segment, the international visitor stays longer and spends substantially more than a domestic traveller, and is, therefore, an important driver for industry profitability. It is this high-value, high-yield segment that will drive long-term prosperity for Canada’s tourism businesses and the sector at large. Canada’s New Tourism Vision articulates key policy shifts to remove travel barriers, encourages new product development and establishes sustained investments in tourism marketing in support of growth. Our corporate strategy complements this Vision and forges a path to long-term success that is predicated on harnessing the current momentum and translating it into a meaningful and aligned marketing approach with our tourism partners. Amongst our provincial, territorial and destination marketing partners, there is a consensus that driving Canada’s long-term competitiveness requires a joint “Team Canada” effort. With sustained long-term funding, better coordination and increasingly aligned co-investments in tourism promotion and innovative marketing, the industry as a whole will be poised to capture a greater share of the growing outbound travel market and improve its competitive position. This real, sustainable growth has the power to incite investor confidence and further encourage long-term structural opportunity in the
Destination Canada | 18
sector. This enticement of private capital investment in product development in turn stimulates further demand, accelerating economic growth across the country.
Contributing to NorthStar 22 and Canada’s New Tourism Vision Goals North Star 22 establishes a shared long-term goal for visitation and revenue to purposefully drive demand in a manner that regains Canada’s global market share. Effectively this strategy sets a goal to beat the rate of international growth, projected at 4-5%, on an annualized basis. We are committing to bring nearly 1.5 million DC-attributable visitors to Canada spending $1.9 billion by 2022. This is the incremental economic benefit that we will produce in our capacity as an accelerator of travel demand. The remainder, we believe, will be captured by the industry as a collective by working better together and in harmony. As part of this long-term strategy to grow market share and contribute to economic prosperity, we at DC are focusing on priority areas under three strategic objectives that will contribute to the success of this initiative. In particular, over the next five years, we will evolve our marketing to become more innovative in the digital marketing space to drive opportunity for tourism businesses; evolve our marketing channel approach to maximize our commercial relevancy; improve our research analytics and build towards stronger industry data and insights; and become a leader in productivity and corporate efficiency to ensure maximum resources are dedicated to marketing Canada.
Objective 1: Increase demand for Canada with innovative marketing
Poetry and Plumbing Our mandate is to drive a vibrant and profitable tourism sector in Canada. While the last few years of strong tourism performance has been an economic driver for Canada, some regions and cities have been at maximum capacities at peak travel times during the course of the year. To help address this long-standing challenge, our strategy is not only to grow visitation and revenue overall for Canada, but to diversify this travel to include more during off-peak periods (shoulder season) and to “spread out” the traffic across the country beyond gateway cities. In essence, we will strive to flatten out the demand curve while raising it. We will do this by taking a consumer-centric approach to focus on passions that are emotion-focused and interests that are activity-focused. Showcasing areas such as music, culinary, arts, culture, outdoor adventure, LGBTQ2 and Indigenous tourism will help to grow the seasonal opportunity for tourism businesses. Additionally, we will expand our audience focus to the millennial travel segment in our international markets, applying the valuable learnings gained from our recently concluded Millennial Travel Program. As noted in Canada’s New Tourism Vision, millennials are an exciting and growing group of tourists, and we will appeal to this younger generation of high-value travellers in all our markets to drive more off season and off the beaten path travel to lesser-known and frequented destinations.

19 | 2018-2022 Corporate Plan Summary
Warm Winter Canada In 2017 we worked with the Japanese studio behind Your Name – the highest-grossing anime film of all time – to create a 30-second spot highlighting the most beautiful sights of a Canadian winter.
Meant to show Japanese tourists everything they can do during a Canadian winter, the tourism video captures the essence of winter in Canada as it follows a couple exploring famous landmarks and taking in iconic scenes. The video is already a big hit; within the first month of the video’s release in September, it had garnered over 220,000 views on Facebook and Twitter and had reached more than 770,000 people.
As we compete for a traveller’s attention, we will tell a consistent story that speaks to passions and interests. We will continue to change outdated perceptions of Canada so that it stands out from the competition, reduces the reliance on peak travel seasons, and diversifies travel beyond known landmark locations. As we continue to tell an evocative and compelling story to make Canada a top of mind destination, we will bring this “poetry” to life at every stage of a traveller’s decision-making journey and across a multitude of channels. Digitization impacts not only the story we tell, but how and where we tell that story. Harnessing the “plumbing” of numerous real-time digital technologies and distribution channels, we will work with third party media and paid influencers to reach the eyes, hearts and minds of consumers through meaningful and personalized content. We will connect them with exciting travel experiences provided by partners, inciting a movement from intention to action.
Year of Canada-China Tourism China continues to be the world’s number one source market for outbound travel and leads as the world’s top spender on international tourism. Canada has been seeing double-digit growth from this robust market for the last few years, with 2016 marking an all-time high for arrivals from China that were up 24% year-over-year7. In comparison, overall outbound growth in travel from China in 2016 fell to 5.7% from 9.7% the year prior, outlining a considerable advantage to Canada8. With its visitors contributing over $1 billion annually to Canada's economy9, the China market is considered a valuable segment. The Chinese market presents an immense opportunity to further enhance tourism flows between the two countries and to strengthen bilateral relations. 2018 has been designated by the Right Honourable Justin Trudeau, Prime Minister of Canada and His Excellency Li Keqiang, Premier of the State Council of the People’s Republic of China as the Canada-China Year of Tourism. To support this milestone, we will boost our marketing presence in China in 2018. In support of Canada’s New Tourism Vision’s goal to double the number of tourists arriving from China by 2021, we will appeal to the values that Chinese travellers hold dear, including trust, safety and the role of the family. We will reinforce trust between the two nations and create stronger connections through the promotion of family-friendly travel. Consistent with our marketing approach in all our markets, we will increase travellers during shoulder seasons and drive traffic to lesser-known destinations in Canada. With a high percentage of business travellers coming to Canada from China, we will also focus on this segment to turn business travellers into influencers amongst their professional and social circles. We will
7 Statistics Canada, Frontier Counts. 8 UNWTO World Tourism Barometer, Volume 15, March 2017, 9 Innovation, Science and Economic Development News Release, September 2, 2016.

Destination Canada | 20
use cultural business events and innovative conferences to improve Canada’s influence and reputation in China’s business world. Our key activities in late 2017 and in 2018 include leading familiarization tours10, leveraging social media, and encouraging the development of new travel itineraries. In particular, we will:
Lead a media familiarization tour for Chinese media and key influencers to experience the beauty of Canada in order to generate positive media coverage for Canada as a destination;
Lead a VVIP familiarization tour with key trade partners to explore new business opportunities and educate them about family-oriented itineraries and offerings;
Lead a familiarization tour during a shoulder season with Chinese celebrities to leverage their influences to attract media attention and create social buzz; and
Present content related to the Year of Canada-China Tourism through highly influential Chinese video websites.
Connecting America The US is Canada’s largest source of foreign visitors. Increased consumer confidence, greater flight capacity between Canada and the US, increased passport ownership and a penchant for international travel means the time was right for Canada to re-enter the US leisure market with a bold and innovative marketing campaign. Connecting America is a three-year program that invites Americans to visit and experience the vibrant, unexpected and unique side of Canada. Launched in 2016, the program utilizes a Team Canada approach whereby provinces and territories, plus city, resort and commercial partners from across the country, have come together to support a unified campaign. The coordinated effort allows us to pool budgets to create a more effective content presence, while providing a strong, consistent and targeted invitation to Americans. Our focus has included outdoor adventures, vibrant cities, natural wonders, a rich culinary scene, and world-class festivals and events. Innovation has been infused through all aspects of the program, including incorporating a fully-digital platform delivering relevant content to potential travellers. We’ll continue to use digital advertising, videos, media publisher content, social media activity and media relations to highlight the best Canadian travel opportunities and provide digital leads to our partners so they can continue the conversation and ultimately serve travel offers. The program was our first national tourism initiative in the US since 2011, and was borne out of a $30 million federal investment over three years with a target to attract 680,000 additional US visitors. As the program was later supplemented with $20 million in incremental funds from Budget 2016 and from A-base appropriations, we accordingly increased our targets.
10 A hosted trip to bring an international influencer to Canada to experience a trip itinerary. The trip is designed to educate and equip influencers to better promote Canada in their home country, and could include site visits, excursions and local experiences.
21 | 2018-2022 Corporate Plan Summary
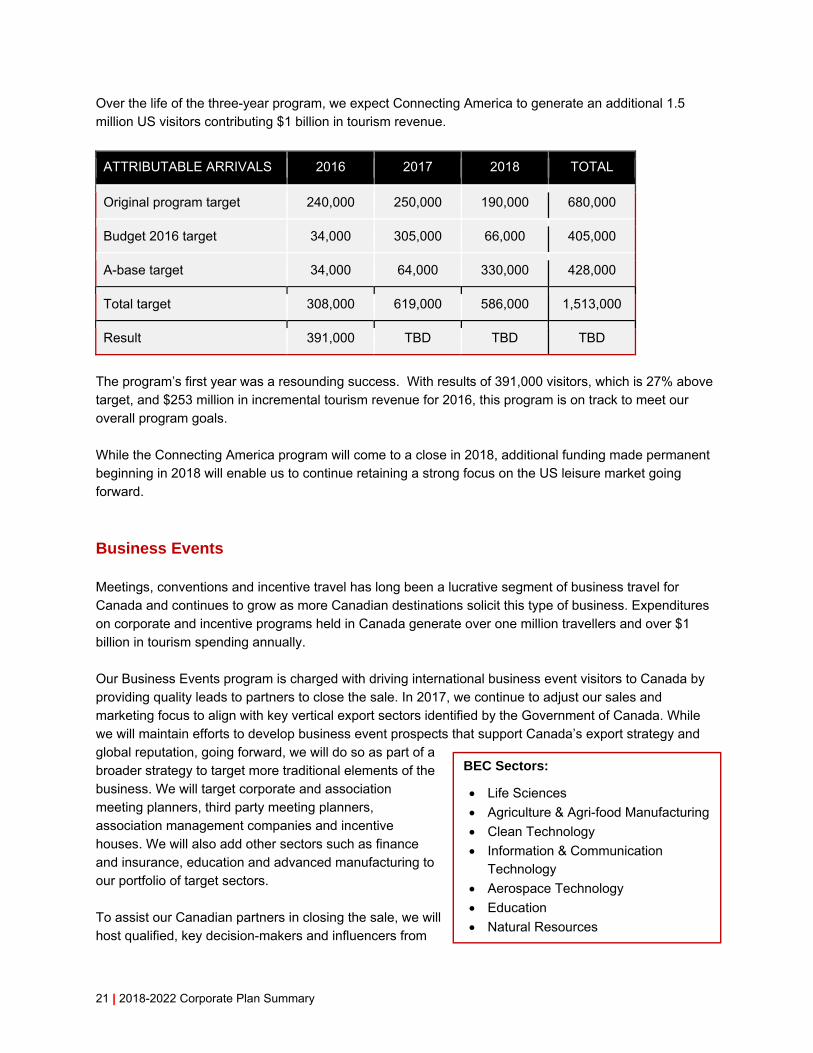
BEC Sectors:
Life Sciences
Agriculture & Agri-food Manufacturing
Clean Technology
Information & Communication Technology
Aerospace Technology
Education
Natural Resources
Over the life of the three-year program, we expect Connecting America to generate an additional 1.5 million US visitors contributing $1 billion in tourism revenue.
ATTRIBUTABLE ARRIVALS 2016 2017 2018 TOTAL
Original program target 240,000 250,000 190,000 680,000
Budget 2016 target 34,000 305,000 66,000 405,000
A-base target 34,000 64,000 330,000 428,000
Total target 308,000 619,000 586,000 1,513,000
Result 391,000 TBD TBD TBD
The program’s first year was a resounding success. With results of 391,000 visitors, which is 27% above target, and $253 million in incremental tourism revenue for 2016, this program is on track to meet our overall program goals. While the Connecting America program will come to a close in 2018, additional funding made permanent beginning in 2018 will enable us to continue retaining a strong focus on the US leisure market going forward.
Business Events Meetings, conventions and incentive travel has long been a lucrative segment of business travel for Canada and continues to grow as more Canadian destinations solicit this type of business. Expenditures on corporate and incentive programs held in Canada generate over one million travellers and over $1 billion in tourism spending annually. Our Business Events program is charged with driving international business event visitors to Canada by providing quality leads to partners to close the sale. In 2017, we continue to adjust our sales and marketing focus to align with key vertical export sectors identified by the Government of Canada. While we will maintain efforts to develop business event prospects that support Canada’s export strategy and global reputation, going forward, we will do so as part of a broader strategy to target more traditional elements of the business. We will target corporate and association meeting planners, third party meeting planners, association management companies and incentive houses. We will also add other sectors such as finance and insurance, education and advanced manufacturing to our portfolio of target sectors. To assist our Canadian partners in closing the sale, we will host qualified, key decision-makers and influencers from

Destination Canada | 22
relevant business markets to position Canada as a stable, safe and clean destination with state of the art event infrastructure. Further, as part of a whole of government approach, we will develop strategic alignment with select Government of Canada departments, Canadian embassies and consulates that are aligned with Canada's export strategy. With a mission to grow Canada’s share of business events, we will continue to positively influence perceptions of Canada as the business events destination of choice and our efforts will continue to create growth for the Canadian economy.
Objective 2: Advance the commercial competitiveness of the tourism sector Enhanced Consumer Data We pay close attention to consumer trends and competitive pressures in order to be responsive with new ways to compel travellers to visit. As articulated in Canada’s New Tourism Vision, reliable, clear and comprehensive data are necessary for making evidence-based decisions that support the Canadian tourism industry. The broadening of tourism data that Statistics Canada will undertake as part of Canada’s New Tourism Vision will strengthen data at the provincial and territorial levels which will assist in our decision-making. In addition, in the years ahead we will be focusing on two key research areas to gather competitive intelligence to support the success of the Canadian tourism industry. As part of our North Star 22 strategy, we are leading a consortium with our tourism industry partners, in collaboration with Statistics Canada, to acquire better data on visitor spending that are credible, accurate, timely and region-specific. While we have a historical perspective on overall average spending per visitor based on source market, we lack insight on how much, where and on what visitors spend while travelling Canada. Beyond informing important business and strategic investment decisions, having a deep understanding of the spending habits of international visitors in and around the country informs us and the tourism industry on what to promote, who to promote to, who to partner with, and which products and experiences should be developed in order to drive optimal returns. Additionally, we’re working to secure better audience segmentation and targeting data to improve our understanding of how consumers make travel decisions. Access to more detailed and timely research on consumer behavior and emerging perceptions and trends enhances our ability to reach potential travellers in real time and influence them earlier in their decision-making process. With improved targeting efforts, we will be able to generate stronger leads for our partners and help them capture a greater share of the growing international travel market.
Marketing Dashboard Marketing insights, research and analytics enable us and our partners to be responsive and continually enhance marketing efforts. A Team Canada approach necessitates a common framework to measure the impact of our tourism marketing efforts. As part of our North Star 22 strategy, we are leading the development of a common dashboard for Team Canada containing shared success metrics. In order to

23 | 2018-2022 Corporate Plan Summary
retain a continual focus on growing market share, this framework, anticipated to be completed in 2018, will include key performance metrics in a data visualization tool for both visitation and expenditure levels. It will also enable the consortium to evaluate successes and assess areas of improvement.
Trade Strategy Many Canadian tourism entrepreneurs rely on the trade shows and media events that we attend or participate in to establish a bridge to important export markets. Through these shows and events, we provide the platforms for small- and medium-sized businesses to bring their products and experiences to a variety of markets and generate international business leads. Leveraging our national leadership and international reach connects them with travel agents, tour operators and media from around the world that can help them generate export success. In 2017 we began a review of all the trade shows and media events that we host or participate in with a view to enhance service delivery while still ensuring value and relevance to our partners’ goals. Beginning in 2018, we will reduce the number of trade shows that we lead and attend, from annual to bi-annual in some markets, such as Australia, India, Japan and Mexico, and ensure that these shows are consistently branded. In alternate years, we will focus on leading familiarization trips for the most influential sellers of tourism product to increase the breadth and depth of their product knowledge so they are appropriately equipped to sell Canada. Additionally, beginning in 2019, we will combine our two domestic shows, Rendez-vous Canada and GoMedia Canada, into one annual show to reduce duplication and increase efficiencies. This new streamlined plan for our shows and events will increase brand awareness, enhance efficiencies, and facilitate better coordination with our provincial, territorial and destination partners across the sector. It will further strengthen the Team Canada approach to tourism marketing and will improve how we facilitate access to global markets for Canadian tourism businesses. Also beginning in 2018, we will identify and work with strategic travel trade partners to influence how Canada is sold. We will continue to provide training to travel agents to sell the Canada that we want to sell, and will build stronger relationships with key tour operators to encourage the development of new product and itineraries that feature shoulder season and off the beaten path travel.
Partnerships Partners are an integral part of the work we do. The success of our marketing campaigns and trade programs are anchored in solid public partnerships and private sector co-investments across all our marketing channels and markets. Forging external relationships that are strategic and commercially beneficial have the power to propel long-term success for Canada’s tourism entrepreneurs. In 2018 and beyond, we will continue working in cooperation with tourism partners to help advance the relevancy of our programs and platforms. We will strive for equal partner co-investment against our appropriated funding in order to exert a stronger marketing presence internationally. In this way, we will continue helping Canadian tourism businesses to extend their international reach and foster entrepreneurial prosperity.
Destination Canada | 24
Objective 3: Increase corporate efficiency and effectiveness
People and Tools Our drive to increase corporate efficiency and effectiveness depends on the full support of a motivated, knowledgeable and innovative workforce. Our people are our greatest assets and equipping them with the tools and resources they need to excel is essential. Over the years, we’ve invested in recruiting new talent and in leveraging innovative technologies and we will continue to put our workforce at the forefront. As part of our plan to drive employee engagement and enablement, in the coming years we will focus on training and job enrichment opportunities. We will also enhance employee communications and reduce administrative burden through streamlined processes, including in our annual business and budget planning processes, our policy guidelines on travel, hospitality, conferences and event expenditures, and through the automation of some human resources and procurement processes. Lastly, we will implement a modernized staffing approach and roll out succession plans at the management level to ensure the seamless continuity of business when key leadership positions are vacated.
Organizational Efficiency Over the last few years, we’ve taken a critical look at our business operations to maximize productivity and corporate efficiency in order to effectively get more “dollars on the screen”. In the past three years, we’ve considerably reduced overhead costs, going from 13% in 2014 to just 6% in 2016. These cost savings have resulted in shifting $3 million into marketing programs on an annual basis and have led to increased efficiencies in how we operate as an organization. In the years ahead, we will continue searching for new efficiencies by leveraging technologies, simplifying processes and optimizing human resources. In 2018, we will undertake minor investments to enhance services to our Board of Directors and for shareholder relations activities, including training for new board members, additional administrative support for board members, travel for board and committee meetings, and additional support for meeting government reporting requirements. We will also strengthen our internal control framework by amending our financial policies as needed. Additionally, we will address any deficiencies stemming from our annual risk assessment and our planned internal audit on compliance with our Travel, Hospitality, Conference and Event Expenditures policy.
Pension Plan De-Risking As part of a proactive look at all corporate costs, we’ve greatly mitigated our financial exposure to future pension liabilities. We’ve collapsed our defined benefit pension plan for Canadian employees in favour of the more sustainable defined contribution pension plan. We’ve also adopted a strategy that would see our future pension risk transferred to the private sector. This would take the form of purchasing annuities from
an insurance company licensed in Canada to cover the pension benefits. We began monitoring the
annuity purchase market in 2017 for an appropriate time to purchase these annuities, and at a price falling within an established financial threshold. Depending on when and under what conditions an agreement is reached, the transfer of risk could take place in 2017 or beyond and only if the desired financial outcome can be achieved.

25 | 2018-2022 Corporate Plan Summary
Our actions taken to date have already greatly mitigated our financial exposure to future pension liabilities. Beyond limiting our long-term financial exposure, these steps provide greater certainty in our planning for the future and ensure that maximum financial resources are available for our core business of marketing.

Destination Canada | 26
MEASURING PERFORMANCE We are committed to an industry-wide goal and anticipate long-term outcomes of our strategy to be an enhanced competitive position internationally for Canada, increased market share, and investor confidence in the industry premised on sustainable growth. While North Star 22 is a collaborative, long-term plan with our industry partners, it is important to distinguish our particular contribution from the industry’s collective performance. The table below outlines Canada’s historical performance in terms of international arrivals and tourism revenue:
Canada’s Tourism Industry Performance
MEASURE 2011
RESULT 2012
RESULT 2013
RESULT 2014
RESULT 2015
RESULT 2016
RESULT
International arrivals*
16.0 million 16.3 million 16.1 million 16.5 million 18.0 million 20.0 million
International visitor spending**
$15.6 billion $16.0 billion $16.3 billion $17.1 billion $18.1 billion $20.0 billion
* Statistics Canada, Frontier Counts. ** Statistics Canada, National Tourism Indicators, 2016 data.
Our Scorecard Consistent with our mandate and recognizing that our performance contributes to the sector’s overall performance, the scorecard on the following page outlines our targets for the next five years. These performance targets are attributable to DC and are based on activities funded by both parliamentary appropriations and partner co-investments that we attract. In addition to funding received through standard annual parliamentary appropriations of $58 million, we received one-time monies through two additional appropriations:
In 2015, we received $30 million over a three-year period for Connecting America, our initiative targeted exclusively at bringing visitors to Canada from the US.
Beginning in 2016, we received $50 million over a two-year period to augment marketing initiatives in important international markets. With this funding, we increased our investments in most of our leisure markets, placing a heavy concentration on the US leisure market and China.
In addition to the above one-time funding envelopes, Budget 2017 stabilizes our core funding level to $95.5 million annually, up from $58 million, beginning April 1, 2018. With this additional core funding, we

27 | 2018-2022 Corporate Plan Summary
will engage in partnerships and maintain presence in key markets, continue to build on marketing in the US, and seize growth opportunities in key markets like China. No new programs are planned for 2018 as a result of this stabilized funding. As these investments were blended with existing investments for programs and initiatives, results are not able to be separated according to one-time funding envelopes. As such, the results and targets identified in the scorecard below are reflective of investments made through all appropriations. Results for 2016 and targets for 2017-2022 are based on federal funding levels as follows: $81.5 million in 2016, $99.6 million in 2017, $100.2 million in 2018, and $95.5 million in 2019, 2020, 2021 and 2022.
MEASURE 2016
RESULT 2017
TARGET 2018
TARGET 2019
TARGET 2020
TARGET 2021
TARGET 2022
TARGET
GOAL: Increase arrivals of international visitors to Canada and increase tourism export revenue
Attributable arrivals 1,188,000 1,335,000 1,320,000 1,324,000 1,382,000 1,423,000 1,466,000
Attributable tourism export revenue
$1.5 billion $1.56 billion $1.57 billion $1.63 billion $1.73 billion $1.82 billion $1.91 billion
Objective 1: Increase demand for Canada with innovative marketing
Active consideration1 6.9% 8% 9% 10% 11% 11.5% 12%
Leads to partners2 1.15 million 1.9 million +10% +10% +10% +10% +10%
Objective 2: Advance the commercial competitiveness of the tourism sector
Partner co-investment ratio
1.1:1 0.9:13 1:1 1:1 1:1 1:1 1:1
% of partners who indicate DC activities advance their business objectives
81% 85% 85% 85% 85% 85% 85%
Objective 3: Increase corporate efficiency and effectiveness
Marketing and sales ratio4 94% 90% 90% 90% 90% 90% 90%
1 Percentage of long-haul travellers in DC markets who are somewhat or very interested in visiting Canada in the next two years. 2 The number of potential customers DC passes on to its marketing partners to convert into actual visitation. DC has identified these potential travellers as having an interest in Canada and looking for destination-specific information which can be found on partner sites. 3 While the ratio target decreased in 2017 as a result of a larger budget allocation, the actual dollar value of partner co-investment being targeted reflects an increase of $8 million from the prior year’s target. 4 Percentage of marketing and sales expenditures over total expenditures. Targets for 2018-2022 exclude one-time depreciation costs of the defined benefit pension plan as a result of de-risking the plan.

Destination Canada | 28
LINK TO FEDERAL PRIORITIES
Canada’s New Tourism Vision Canada’s New Tourism Vision commits to investing in stronger and more sustained marketing. We are aligned with this Vision in the following ways:
Building on the success of our Connecting America campaign, we will continue to market to the US in order to keep growing visitation from our largest source market.
We will augment marketing programs in China in support of the 2018 Canada-China Year of Tourism.
We will continue to promote the exciting travel experiences that speak to the passions and interests of our target travellers, including featuring content on Indigenous, culinary and LGBTQ2 tourism.
Applying the lessons learned from our recent Millennial Travel Program, we will place a greater emphasis on targeting the next generation of millennial travellers in our international markets.
We will harness innovative technology to supply us with enhanced segmentation and targeting data that will improve how we market to international travellers.
We’ve renewed our relationship with Aboriginal Tourism Association of Canada for the continued development of Indigenous tourism destination and product awareness.
We’ve established a multi-year agreement with Parks Canada to drive international visitation to Canada’s parks and historic sites. This work is in support of Parks Canada’s efforts to continuously innovate and improve the quality of their places and experiences.
Canadian Council of Tourism Ministers The Canadian Council of Tourism Ministers has agreed to the Nunavut Declaration, a declaration committing to collaboration on important issues in order to grow and increase the competitiveness of Canada’s tourism sector. Key areas for federal-provincial-territorial collaboration include marketing, the sharing economy, air competitiveness and access, labour and workforce, Indigenous tourism, festivals and events, parks tourism, and statistics and research. As Destination Canada leads the marketing action area, our North Star initiative supports the Nunavut Declaration through collaborative marketing activities that will position Canada’s tourism sector for long-term success. Additionally, we will continue to showcase Indigenous tourism and various festivals and events in our marketing. The Canadian Council of Tourism Ministers has also agreed to capitalize on the Canada-China Year of Tourism in 2018, including collaborating on a mission to China to promote the Canadian tourism industry.

29 | 2018-2022 Corporate Plan Summary
Building a Strong Middle Class Tourism supports over 720,000 jobs and is the largest employer of youth. Our commitment to increase
long‐term visitation to Canada supports the federal priority to create jobs and broad-based prosperity for middle class Canadians. It also generates essential tax revenue which supports federal programming for those who need it most.
Whole of Industry Approach The Minister of Small Business and Tourism’s mandate letter focuses on improving partnerships with
provincial, territorial and municipal governments. Our long‐term strategy to increase Canada’s international competitiveness is premised on a shared goal under a Team Canada approach with our industry partners across the country.
Small Businesses The Minister of Small Business and Tourism’s mandate letter focuses on supporting small businesses to become more productive, more innovative and more export-oriented. Our programs to advance
commercial competitiveness assist tourism businesses, particularly small- and medium‐sized, to reach
international markets. This helps businesses become export‐oriented and facilitates increased economic opportunity.
Innovation and Skills Plan Canada’s future success depends on building an economy that is as inclusive as it is innovative. The Government of Canada’s Innovation and Skills Plan strives to make Canada a world-leading centre for innovation. Through new and innovative approaches, and in collaboration with Statistics Canada, we will improve our understanding of how consumers make travel decisions and of consumers’ spending patterns once in Canada. In support of our mandate, we will share this information with our industry and with government partners in order to improve collective targeting efforts, compete globally in a digital world, and inform investment and policy decisions.
Strengthening the Canadian Brand The Minister of Small Business and Tourism’s mandate letter focuses on strengthening the Canadian brand abroad for tourists. The objective is to raise Canada’s profile of tourism products and help them stand out from the competition. Our leisure and business marketing programs serve to bring the Canada brand to life for global travellers so that Canada climbs to the top of their list of places to visit.
Delivering Results The Minister of Small Business and Tourism’s mandate letter focuses on ensuring the delivery of results for Canadians. We employ a rigorous approach to measuring our performance and regularly assess key metrics contained in our scorecard. We are committed to assessing the effectiveness of our work and on reporting on the progress of our commitments in our annual reports.

Destination Canada | 30
GOVERNANCE
Legislative Framework As an agent of the Crown, we are a federal Crown corporation wholly owned by the Government of Canada. We are provided with overarching public policy priorities, broad strategic goals and expectations. The Canadian Tourism Commission Act and various regulations provide the legislative basis for our establishment and our activities. Through the Minister of Small Business and Tourism, we are accountable to Canada’s Parliament through the submissions of an Annual Report, a 5-year Corporate Plan and an Operating and Capital Budget annually to Parliament.
Board of Directors The Board consists of up to 12 members who oversee the management of DC, and provide strategic guidance and effective oversight. With the support of two committees, the Board ensures that appropriate systems of governance, leadership and stewardship are in place while at the same time empowering management to deliver on its mandate. Examples of specific functions of the Board are:
Establishing the organization’s corporate objectives
Monitoring corporate performance and evaluating results
Ensuring effective strategic risk management
Providing financial oversight
Monitoring the CEO’s performance
Overseeing succession planning of the CEO
Reviewing and approving major decisions affecting the organization The Board comprises the Chair and the President & CEO of DC which are Governor in Council appointments, and the Deputy Minister of Innovation, Science and Economic Development Canada (ex officio). Further, up to nine additional directors, appointed by the Minister with Governor in Council approval, make up the remainder of the Board. Directors are appointed based on the full range of skills, experience and competencies required to add value to DC’s decisions on strategic opportunities and risks. In 2017, the membership of the board was updated to account for board vacancies and expiring terms. Appointments were made in accordance with the Government of Canada’s new approach on Governor in Council appointments. This approach is based on an open and transparent process and results in appointments that are merit-based and representative of the diversity of Canadians.

31 | 2018-2022 Corporate Plan Summary
Board Membership As anticipated at January 1, 2018
Ben Cowan-Dewar Chairperson of the Board of Directors
Toronto, ON
David Goldstein President & CEO, Destination Canada
Vancouver, BC
Ben is the owner of Cabot Links golf course, and a tourism entrepreneur. A past Chair of the Board for Nova Scotia Tourism, he is a member of the Board of The Golf Canada Foundation and the Young Presidents Organization.
Term until February 21, 2022
David assumed leadership of Destination Canada in December 2014 after leading the Tourism Industry Association of Canada. He works with industry leaders across Canada to market Brand Canada globally.
Term until November 30, 2019
John Knubley (ex officio) Deputy Minister, Innovation, Science and Economic Development Canada
Ottawa, ON
Patti Balsillie Management Consultant
Whitehorse, YK
As stipulated in the Canadian Tourism Commission Act, the Deputy Minister is an ex officio director of the Board.
Patti brings over 20 years of experience in governance and development for the private and non-profit sectors in Canada’s North. Tourism planning for UNESCO sites, First Nation Traditional Territories, niche feasibility and more comprise Patti’s expertise.
Term until April 11, 2021
Destination Canada | 32
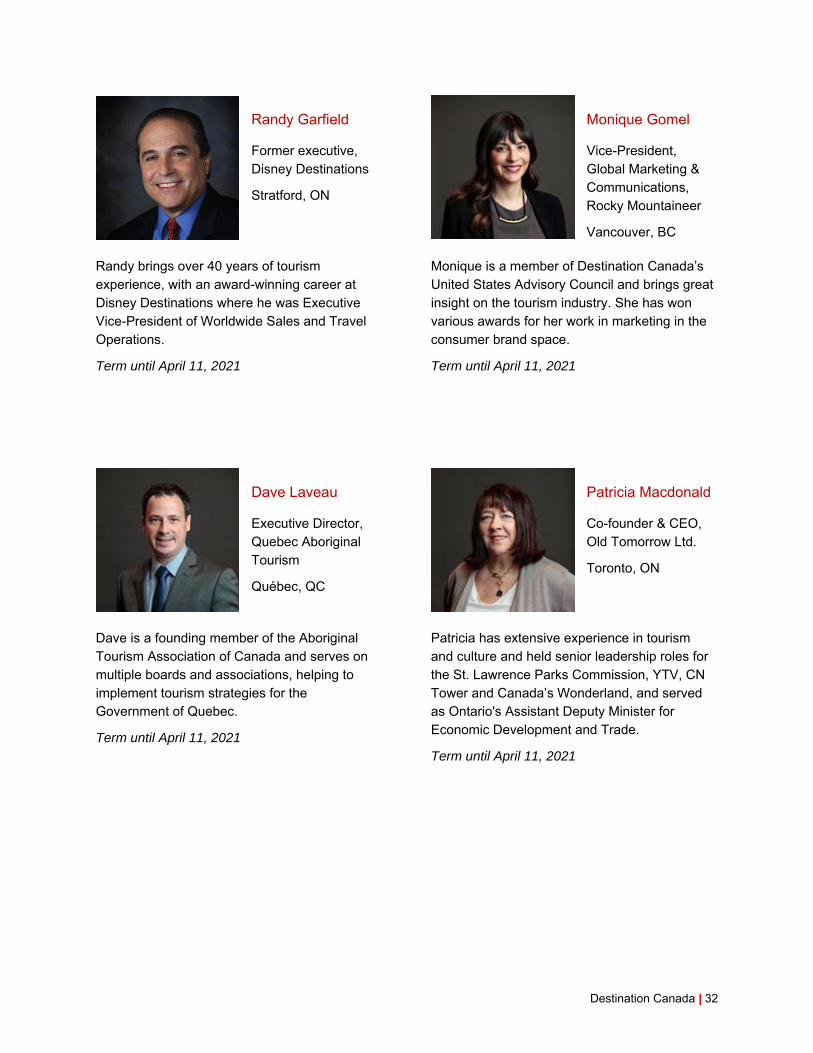
Randy Garfield Former executive, Disney Destinations
Stratford, ON
Monique Gomel Vice-President, Global Marketing & Communications, Rocky Mountaineer
Vancouver, BC Randy brings over 40 years of tourism experience, with an award-winning career at Disney Destinations where he was Executive Vice-President of Worldwide Sales and Travel Operations.
Term until April 11, 2021
Monique is a member of Destination Canada’s United States Advisory Council and brings great insight on the tourism industry. She has won various awards for her work in marketing in the consumer brand space.
Term until April 11, 2021
Dave Laveau Executive Director, Quebec Aboriginal Tourism
Québec, QC
Patricia Macdonald Co-founder & CEO, Old Tomorrow Ltd.
Toronto, ON
Dave is a founding member of the Aboriginal Tourism Association of Canada and serves on multiple boards and associations, helping to implement tourism strategies for the Government of Quebec.
Term until April 11, 2021
Patricia has extensive experience in tourism and culture and held senior leadership roles for the St. Lawrence Parks Commission, YTV, CN Tower and Canada’s Wonderland, and served as Ontario's Assistant Deputy Minister for Economic Development and Trade.
Term until April 11, 2021

33 | 2018-2022 Corporate Plan Summary
Dragan Matovic Chairman and CEO, Halex Capital Inc.
Niagara Falls, ON
Danielle Poudrette Executive Advisor, DMVP Solutions
Montréal, QC
Dragan has a background in economics and marketing and is an expert in real-estate development of tourism-related properties, including hotels and resorts.
Term until April 11, 2020
Danielle brings over 25 years of marketing and business improvement experience as a former Air Canada executive and a consultant for tourism-related businesses.
Term until April 29, 2019
Additional Board Members effective February 1, 2018 Julie Canning Cowgirl and Operating Partner, Banff Trail Riders Julie has been a long standing member of the Asia Pacific Working Group and currently serves as its Vice Chairperson. She brings extensive experience in tourism and entrepreneurship.
Term until January 31, 2022
Stan Cook Owner and President, Stan Cook Sea Kayak Adventures Stan is a strong advocate for tourism, chairing various boards including the Adventure Tourism Association of Newfoundland, the Newfoundland and Labrador Tourism Board and Atlantic Canada Tourism.
Term until January 31, 2022

Destination Canada | 34
Committees of the Board In 2017, the Governance and Nominating Committee and the Human Resources Committee were combined into a newly formed Governance, Nominating and Human Resources Committee. This committee advises and supports directors in applying our corporate governance principles, assists in evaluating potential board candidates and develops recommendations to the Minister on board appointments (excluding the Chair, the President & CEO and the ex officio director). Additionally, the committee reviews and advises on the President & CEO’s annual objectives and our human resources policies, plans and processes, including succession, compensation and benefits plans. In addition to the duties and functions mandated by the FAA, the Audit and Pension Committee reviews and recommends to the Board processes for identifying and managing risk, internal control systems and processes for complying with related laws and regulations. The Committee also oversees the administration, investment activities and financial reporting of our pension plans.
Advisory Committees From time to time, the Board creates advisory committees to advise it on how best to deliver our programs and services. The committees take their direction from the Board and report to both the Board and the President & CEO. A majority of the advisory committee members are appointed from private sector tourism entities that play an important role in linking DC to the tourism industry. We currently have four advisory committees: Business Events; International; Research and United States.

35 | 2018-2022 Corporate Plan Summary
Executive Team The President & CEO is accountable to the Board, and has responsibility for the day-to-day operations of DC. Senior Management plays a vital role in strategic leadership, working closely with the Board to set objectives, develop strategies, implement actions and manage performance. Executive management also recommends to the Board sweeping changes, identifies business risks and manages the complex intellectual, capital and technical resources of DC.
Executive Team As at November 1, 2017
Vacant Chief Financial Officer
Jon Mamela Chief Marketing Officer
Sarah Sidhu General Counsel & Corporate Secretary
Emmanuelle Legault Vice-President, International
Dave Robinson Vice-President, Strategy & Stakeholder Relations

Destination Canada | 36
FINANCIAL PLAN The planned spending enclosed in this Corporate Plan includes permanent funding of $37.5 million per year announced in Budget 2017. This new funding brings our base appropriation to $95.5 million in 2019. 2018 will be a transition year as we plan to spend the remaining temporary funding for Connecting America ($7.7 million) and Budget 2016 ($6.4 million) as well as the partially adjusted base funding ($86.1 million) for a total of $100.2 million. After making steep cuts in corporate services in 2015 and having reviewed the Ernst & Young internal audit report on corporate efficiency and internal capacity, and with funding certainty, we are now in a position to make minor investments in corporate services in 2018 to increase service to our Board of Directors, enhance shareholder relations activities and leverage existing and new technologies. This incremental investment in overhead ($0.8 million in 2018 increasing to $1.2 million in 2019 and beyond) represents approximately 1% of our overall expenses. We will remain lean with overhead expenses representing no more than 10% of total expenses. This allows us to allocate the majority of our parliamentary appropriations directly into marketing programs. Our pension de-risking strategy outlined in the section entitled “Strategic Plan” eliminates the need to make special solvency payments throughout this 5-year spending plan. In accordance with Treasury Board Secretariat’s accounting standards, our forecast Statement of Operations recognizes our unamortized actuarial losses (estimated at $8.9 million) over the average remaining employment life of pension plan members (8.6 years) so long as there are active employees in the plan. Annual pension accounting expenses in the amount of approximately $100,000 are included in the Marketing and sales, Corporate services and Strategy and planning expense lines in the financial tables.
Major Assumptions The Financial Statements and Operating and Capital Budgets are based on the following assumptions:
Foreign exchange rates are based on historical trends;
Pension funding requirements are based on the most recent valuations;
Salary costs are based on the existing collective agreement which expired in June 2017; and
The purchase of annuities for the Canadian defined benefit pension plan will not occur during this 5-year planning period.

37 | 2018-2022 Corporate Plan Summary
Financial Risks Planned spending noted in the financial tables is exposed to the following risks:
Temporary Accounting Deficit In July 2017, we began monitoring the market to purchase annuities for the Canadian defined benefit pension plan. Our Board of Directors approved and delegated the required authorities to senior management for the purchase of annuities within an established financial threshold. Upon purchase, the full unamortized actuarial loss will be recorded in the year of purchase. This actuarial loss, estimated at $8.9 million, will result in a temporary accounting deficit. Although there will be no significant incremental cash disbursement generated by this transaction, the figures contained in the forecasted Statement of Financial Position and Operations would change significantly.
Rising Salary Cost Payroll is our largest fixed cost and is expected to increase as a result of the collective bargaining process in 2017. While an increase in our base appropriations will offset some of these costs, it is expected to cover only one-third of our expected salary increase. We will leverage existing and new technologies and streamlined processes mentioned earlier to generate new efficiencies to cover the residual salary increase.
Foreign Exchange Our functional currency is the Canadian dollar, but we regularly transact in multiple foreign currencies as part of our international operations. As a result, we are impacted by fluctuations in foreign exchange rates. Realized gains and losses arise from the settlement of foreign currency transactions when translated into Canadian dollar equivalents using rates of exchange in effect at the time of the transaction. Unrealized gains and losses arise from the translation of monetary assets and liabilities denominated in foreign currencies translated into Canadian dollar equivalents at the rate of exchange in effect at year end. Realized gains and losses are considered Operating Expenses and are included on the Statement of Operations as Corporate Service expenses. Unrealized gains and losses are reported on the Statement of Remeasurement Gains and Losses.
In order to mitigate our foreign exchange risk, we have made an effort to set up contracts with vendors to transact in Canadian dollars whenever possible, which starts at the request for proposal stage of procurement. As our appropriations are in Canadian dollars, our risk is lower if our value and volume of foreign currency transactions are reduced.
In 2016, the foreign exchange rates of many currencies experienced some volatility, and the Canadian dollar regained some value lost in the previous year. We had significant transactions in British Pounds, Chinese Yuan, Euros, Japanese Yen, and US Dollars resulting in a realized foreign exchange gain of $208,129 and an unrealized foreign exchange loss of $53,000. The realized gain is included as a reduction in Corporate Service expenses. The following five currencies are our highest transacted foreign currencies and the Canadian dollar gained value against all of them during the year, with the exception of the Japanese Yen.

Destination Canada | 38
Significant Accounting Policies The financial statements have been prepared in accordance with Canadian public sector accounting standards (“PSAS”). Significant accounting policies are as follows: a) Parliamentary appropriations
We are funded primarily by the Government of Canada through parliamentary appropriations. Parliamentary appropriations used to fund core operations and capital expenditures are considered unrestricted and recognized as revenues when the appropriations are authorized and any eligibility criteria are met. Parliamentary appropriations used to fund one-time activities, such as Connecting America, The Olympic Games or Stimulus, are considered restricted. Restricted appropriations have eligibility criteria and stipulations that give rise to an obligation that meets the definition of a liability. Restricted appropriations are recognized as deferred revenue when the stipulation gives rise to a liability. Restricted appropriation revenue is recognized as the stipulation liabilities are settled.
As our year-end (December 31) differs from that of the Government of Canada’s (March 31), we receive parliamentary appropriations from two different Government fiscal years.
We will have a deferred parliamentary appropriations balance at year-end when the restricted funding received for the period exceeds the restricted appropriations recognized for the related fiscal period. We will have a parliamentary appropriations receivable balance when restricted appropriations recognized exceed the restricted funding received.
We do not have the authority to exceed approved appropriations.
b) Partnership contributions
We conduct marketing activities in partnership with a variety of Canadian and foreign organizations. When we assume the financial risks of conducting a marketing activity, contributions received from a partnering organization are recognized as income when the related marketing activity takes place.
2015 2016
$78,299 $75,551
€70,573 €68,250
₤51,238 ₤55,922
¥491,771 ¥501,578
¥9,476,551 ¥8,207,521
AVERAGE VALUE OF $100,000 CDN
39 | 2018-2022 Corporate Plan Summary
Partnership contributions received for marketing activities yet to take place are recognized as deferred revenue.
c) Other revenues
Other revenues consist of cost recoveries from co-location partners, interest, capital asset sales and other miscellaneous revenues. These items are recognized as revenue in the period in which the transaction or event occurred.
d) Foreign currency translation
Monetary assets and monetary liabilities denominated in foreign currencies are translated into Canadian dollars at the year-end exchange rate. Non-monetary assets and non-monetary liabilities denominated in foreign currencies are translated into Canadian dollars at historical exchange rates. Revenue and expense items are translated during the year at the exchange rate in effect on the date of the transaction. Amortization expenses of tangible capital assets are translated at historical rates to which the assets relate. Realized gains and losses are considered Operating Expenses and are included in the Statement of Operations as Corporate Services. Unrealized gains and losses are reported on the Statement of Remeasurement Gains and Losses and on the Statement of Change in Net Financial Assets. We do not hedge against the risk of foreign currency fluctuations.
e) Cash and cash equivalents
Cash and cash equivalents include cash in bank and a money market term deposit. These are readily convertible to a known amount of cash and are subject to an insignificant risk of change in value.
f) Portfolio investments
Portfolio investments are measured at amortized cost. Interest income related to these investments is calculated based on the effective interest method.
g) Prepaid expenses
Prepaid expenses consist of program and operating expenses recognized as an expense based on the term of usage for items such as subscriptions or based on the event date of trade shows.
h) Tangible capital assets
Tangible capital assets are recorded at cost less accumulated amortization and the amount of any write-downs or disposals. Tangible capital assets are amortized on a straight-line basis over the estimated useful life of the assets as follows:
Leasehold Improvements Remaining term of lease Office furniture 5 years Computer hardware 3 years Computer software 5 years

Destination Canada | 40
Intangible assets are not recognized in the financial statements. i) Deferred revenue
Deferred revenue consists of deferred revenues from partnering organizations which are recognized as revenues based on an event’s date or a license period.
j) Deferred lease inducements Deferred lease inducements consist of various office lease inducements including reimbursement of leasehold improvement costs and free rent periods. These inducements are deferred and recognized as a straight-line reduction to office lease expenses over the term of the lease.
k) Asset retirement obligation
Asset retirement obligation consists of decommissioning costs for office leases. We recognize asset retirement obligations as a result of legal obligations to restore leased office spaces to their original state at the end of the lease. Asset retirement obligations are measured initially at fair value, based on management’s best estimates, with the resulting amount capitalized into the carrying amount of the related asset. The capitalized asset retirement cost is amortized on a straight-line basis over the term of the lease. The amortization expense is included in Corporate Services in determining the net cost of operations.
l) Employee future benefits
We offer a number of funded, partly funded and unfunded defined benefit pension plans, other unfunded defined benefit plans (which include post-employment benefits, post-retirement benefits and non-vested sick leave), and defined contribution pension plans. Pension plans include a statutory plan, a supplemental plan and a plan to cover certain employees working outside of Canada. Other benefit plans include post-employment severance benefits and post-retirement health, dental and life insurance benefits and non-vested sick leave. The defined benefit pension plans provide benefits based on years of service and average pensionable earnings at retirement. The defined benefit component of the statutory plan and the supplemental plan will be closed effective December 30, 2017 and benefits and service of plan participants will be frozen as of that date. We fund certain pension plans annually based on actuarially determined amounts needed to satisfy employee future benefit entitlements under current benefit regulations. Cost of living adjustments are automatically provided for retirees in accordance with Consumer Price Index increases.
The costs and obligations of the defined benefit plans are actuarially determined using the projected benefit method prorated on service that incorporates management’s best estimates of the rate of employee turnover, the average retirement age, the average cost of claims per person, future salary and benefit levels, expected return on plan assets, future medical costs, and other actuarial factors. The expected return on plan assets is calculated on market value.
Past service costs arising from plan amendments are recognized in the years of which the plan amendment occurred.
41 | 2018-2022 Corporate Plan Summary
Actuarial gains and losses are amortized over expected average remaining service lifetime (“EARSL”) of active employees. For 2016, EARSL is 8.6 years (8.9 years – 2015) for the Registered Pension Plan for Employees of DC (“RPP”), 0.0 years (0.0 years – 2015) for the Supplementary Retirement Plan for certain employees of DC (“SRP”), 12.2 years (12.6 years – 2015) for the Pension Plan for Employees of DC in Japan, South Korea and China (“WWP”), 7 years (7 years – 2015) for non-pension post-retirement benefits, 13 years (13 years – 2015) for severance benefits and 13 years (13 years – 2015) for sick leave benefits.
Employees working in the United Kingdom and the United States participate in the Department of Foreign Affairs defined benefit pension plans administered by the Government of Canada. The assets of these plans cannot be allocated among participating employers, and as such, these plans are deemed “multi-employer” plans and accounted for as defined contribution plans. Our contributions to these plans reflect the full benefit cost of the employer. These amounts vary depending upon the plan and are based on a percentage of the employee’s gross earnings. Contributions may change over time depending on the experience of the plans since we are required under present legislation to make adjustments for the rate of contributions to cover any actuarial deficiencies of these plans. Contributions represent the total pension obligations by us for these employees and are charged to Operations during the year in which the services are rendered.
m) Financial instruments
Financial assets consist of cash and cash equivalents, accounts receivable and portfolio investments, while financial liabilities consist of accounts payable and accrued liabilities. Financial assets and financial liabilities are measured at amortized cost, which approximates their fair value.
n) Measurement uncertainty
The preparation of financial statements in accordance with Canadian PSAS requires management to make estimates and assumptions that affect the reported amounts of assets and liabilities at the date of the financial statements and the amounts of income and expense during the reporting periods. Actual results could differ significantly from those estimates. The most significant estimates involve the determination of the employee future benefits liability and related accrued benefit asset, the useful lives for amortization of tangible capital assets and the fair value of the asset retirement obligation.
o) Related party transactions
Through common ownership, we are related to all Government of Canada created departments, agencies and Crown corporations. Our transactions with these entities are in the normal course of operations and are measured at the exchange amount.
p) Services provided without charge and partnership contributions in-kind
Audit services are provided without charge from the Office of the Auditor General of Canada to us for the annual audit of the financial statements. In the normal course of business, we receive in-kind contributions from our partners including the transfer of various types of goods and services to assist in the delivery of programs. These in-kind contributions received are not recognized in the financial statements.

Destination Canada | 42
Financial Statements
Statement of Financial Position As at December 31, 2016 to December 31, 2022
Our financial position will remain relatively stable throughout the 2018-2022 planning period sustained by new base funding announced in the 2017 Federal Budget. This replaces the previously time limited funding for Connecting America and Marketing Canadian as a Premier Tourism Destination. Assets Financial assets are expected to decrease slightly between December 31, 2016 and December 31, 2022, driven by the annual depreciation of accrued defined benefit pension asset. Canadian public sector accounting standards require the unamortized actuarial losses recorded in accrued benefit assets to be depreciated over the average remaining employment life of pension plan members. As of December 31, 2016, our unamortized actuarial loss was estimated at $8.7 million. The average remaining employment life of pension plan members was estimated at 8.6 years.

43 | 2018-2022 Corporate Plan Summary
As part of our pension plan de-risking strategy, we expect to transfer future Canadian employees’ defined benefit pension risk to the insurance industry. This transfer will be accomplished by purchasing annuities from an insurance company licensed to transact such business in Canada to cover the pension plan’s liabilities. Our Board of Directors approved this plan and delegated authority to senior management to purchase annuities within a set financial threshold. In July 2017, we began monitoring the market for a suitable annuity purchase. The full unamortized actuarial loss will be recorded in our statements in the year of purchase. This actuarial loss, estimated at $8.7 million as at December 31, 2016, will produce a temporary accounting deficit in-year. Although there will be no significant incremental cash disbursement generated by this transaction, the figures contained in the forecasted Statement of Financial Position and Operations would change significantly. Liabilities Our overall liability is expected to decrease slightly between December 31, 2016 and December 31, 2022. This is driven primarily by the amortization over 10 years of the headquarters deferred lease inducement received in 2016. Accumulated Surplus We plan to spend all our appropriation and cash partnership contributions during the 2018-2022 planning period, and in addition, show annual deficits. These deficits represent the depreciation of tangible assets, unamortized actuarial loss of pension plan, and amortization of the deferred lease inducement. The sum of these expenses and revenues account for the entire in-year deficit and is covered by previous year accumulated surplus.
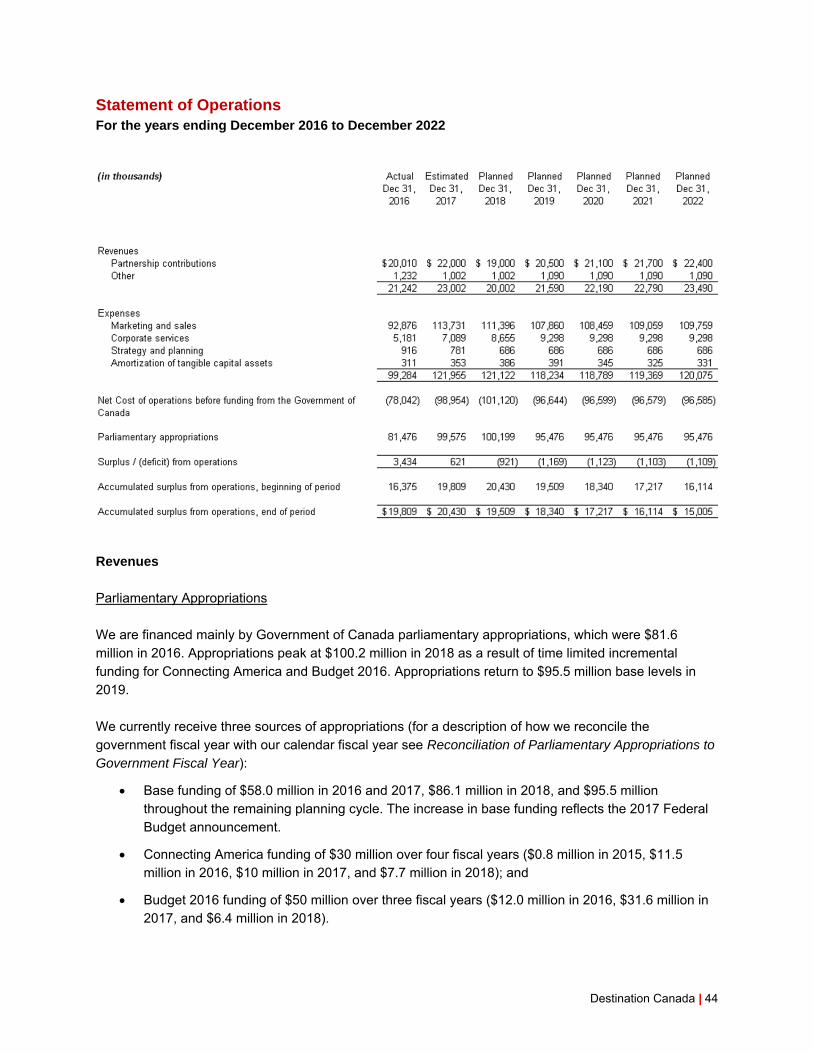
Destination Canada | 44
Statement of Operations For the years ending December 2016 to December 2022
Revenues Parliamentary Appropriations We are financed mainly by Government of Canada parliamentary appropriations, which were $81.6 million in 2016. Appropriations peak at $100.2 million in 2018 as a result of time limited incremental funding for Connecting America and Budget 2016. Appropriations return to $95.5 million base levels in 2019. We currently receive three sources of appropriations (for a description of how we reconcile the government fiscal year with our calendar fiscal year see Reconciliation of Parliamentary Appropriations to Government Fiscal Year):
Base funding of $58.0 million in 2016 and 2017, $86.1 million in 2018, and $95.5 million throughout the remaining planning cycle. The increase in base funding reflects the 2017 Federal Budget announcement.
Connecting America funding of $30 million over four fiscal years ($0.8 million in 2015, $11.5 million in 2016, $10 million in 2017, and $7.7 million in 2018); and
Budget 2016 funding of $50 million over three fiscal years ($12.0 million in 2016, $31.6 million in 2017, and $6.4 million in 2018).
45 | 2018-2022 Corporate Plan Summary
Partner Revenues We leverage the value of appropriated funding by partnering with other organizations in marketing campaigns to strengthen the Canada brand. For marketing campaigns that we lead, partner organizations provide either cash or in-kind contributions. Cash contributions are recognized and reported as partner revenues in the Statement of Operations. We continue expanding partnerships with provincial and territorial marketing organizations, national, regional and local companies, destination marketers, media, non-traditional partners and tourism associations. Our success is clearly reflected in our 2017 estimated partnership revenues which will hit a $22 million record in 2017. We are harvesting the benefits of advancing, by several months, our business planning process to better align with tourism industry partners. Preliminary estimates show a decrease in cash contributions in 2018 as the Connecting America and the Millennial Travel Program marketing campaigns are completed. Starting in 2019, on the strength of new increased base funding, cash contributions will consistently increase from year to year. Expenses Marketing and Sales We are committed to invest a minimum of 90% of all revenues and parliamentary appropriations in
marketing and sales throughout the 2018-2022 planning cycle. Shifts in annual parliamentary appropriations and fluctuations in cash partnership contributions have a direct impact on the marketing and sales spending levels. Corporate Services Over the planning period the cost of corporate services, as a percent of overall spending, is expected to remain below the 15% maximum set by Treasury Board. We are committed to spend no more than 10% of our combined revenue in corporate services throughout the 2018-2022 planning cycle. In 2018 and 2019, we will undertake minor investments that will increase corporate services expenses and then stabilize going forward. These investments will enhance support services to our Board of Directors and shareholder relations activities (e.g. continued training of board members, additional administrative support of board members, travel related to board and committee meetings and additional support to meet reporting requirements to the Shareholder). These investments are also required to strengthen and modernize our internal control framework. Depreciation This Statement of Operations includes depreciation expense of tangible assets, unamortized pension plan loss, and depreciation of the tenant improvement allowance received in 2016. The sum of these expenses and revenues accounts for the entire in-year deficit. The annual deficit is covered by previous year accumulated surplus.
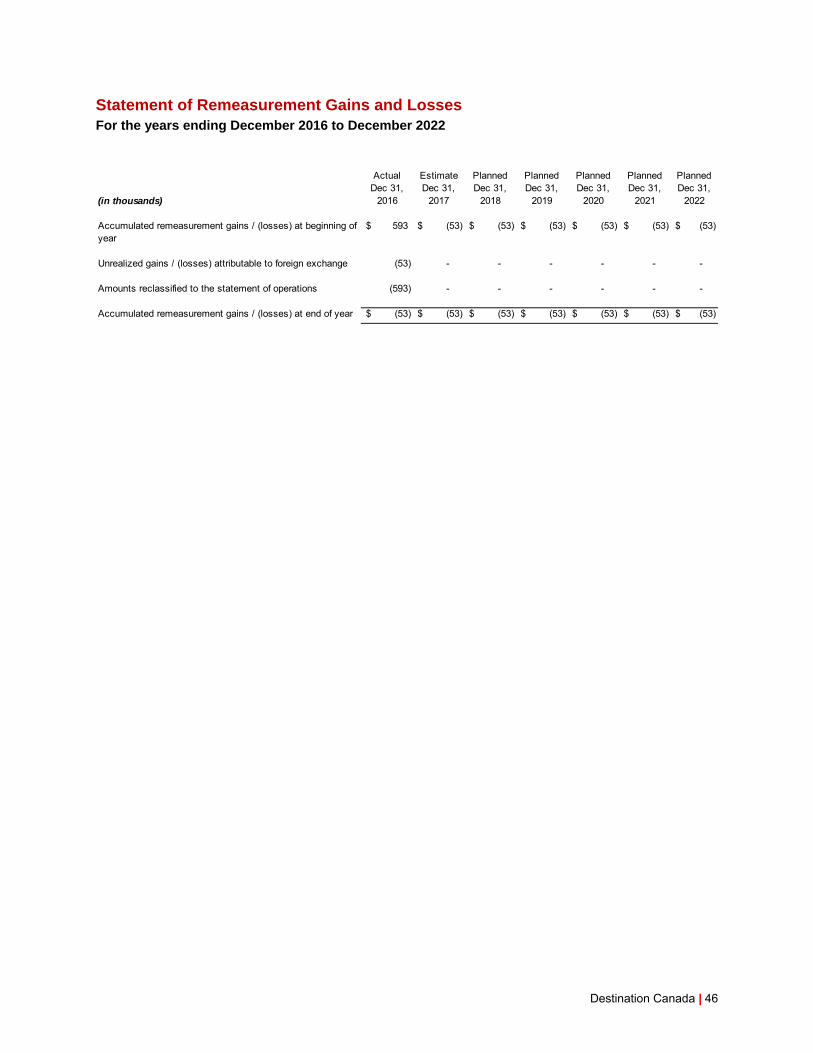
Destination Canada | 46
Statement of Remeasurement Gains and Losses For the years ending December 2016 to December 2022
Actual Estimate Planned Planned Planned Planned Planned
(in thousands)Dec 31,
2016Dec 31,
2017Dec 31,
2018Dec 31,
2019Dec 31,
2020Dec 31,
2021Dec 31,
2022
Accumulated remeasurement gains / (losses) at beginning of year
593$ (53)$ (53)$ (53)$ (53)$ (53)$ (53)$
Unrealized gains / (losses) attributable to foreign exchange (53) - - - - - -
Amounts reclassified to the statement of operations (593) - - - - - -
Accumulated remeasurement gains / (losses) at end of year (53)$ (53)$ (53)$ (53)$ (53)$ (53)$ (53)$

47 | 2018-2022 Corporate Plan Summary
Statement of Change in Net Financial Assets For the years ending December 2016 to December 2022

Destination Canada | 48
Statement of Cash Flows For the years ending December 2016 to December 2022
Actual Estimated Planned Planned Planned Planned Planned
(in thousands)Dec 31,
2016Dec 31,
2017Dec 31,
2018Dec 31,
2019Dec 31,
2020Dec 31,
2021Dec 31,
2022
Operating transactions:Cash received from:
Parliamentary appropriations used to fund operating transactions 81,476$ 99,575$ 100,199$ 95,476$ 95,476$ 95,476$ 95,476$ Partner revenues 22,140 20,015 19,000 20,500 21,100 21,700 22,400 Other revenues 2,046 1,315 1,153 1,227 1,187 1,166 1,170 Interest 151 151 151 151 151 151 151
105,814 121,057 120,504 117,355 117,915 118,494 119,198 Cash paid for:
Cash payments to suppliers (86,723) (107,179) (109,210) (105,765) (105,371) (105,349) (105,354) Cash payments to and on behalf of employees (12,898) (13,670) (12,878) (12,380) (12,379) (12,379) (12,379)
Cash applied to / (used in) operating transactions 6,192 208 (1,584) (790) 164 765 1,465
Capital transactions:Acquisition of tangible capital assets (931) (106) (344) (100) (100) (100) (100) Cash received from disposal of tangible capital assets - - - - - - -
Investing transactionsAcquisition of portfolio investments - - - - - - - Disposition of portfolio investments 57 93 - 76 - 60 -
(646) - - - - - -
Net increase / (decrease) in cash during the period 4,672 195 (1,928) (814) 64 725 1,365
Cash and cash equivalents, beginning of period 16,616 21,288 21,483 19,555 18,742 18,805 19,529 Cash and cash equivalents, end of period 21,288$ 21,483$ 19,555$ 18,742$ 18,805$ 19,529$ 20,892$
Net remeasurement gain / (loss) for the period

49 | 2018-2022 Corporate Plan Summary
Reconciliation of Parliamentary Appropriations to Government Fiscal Year For the years ending December 2016 to December 2022
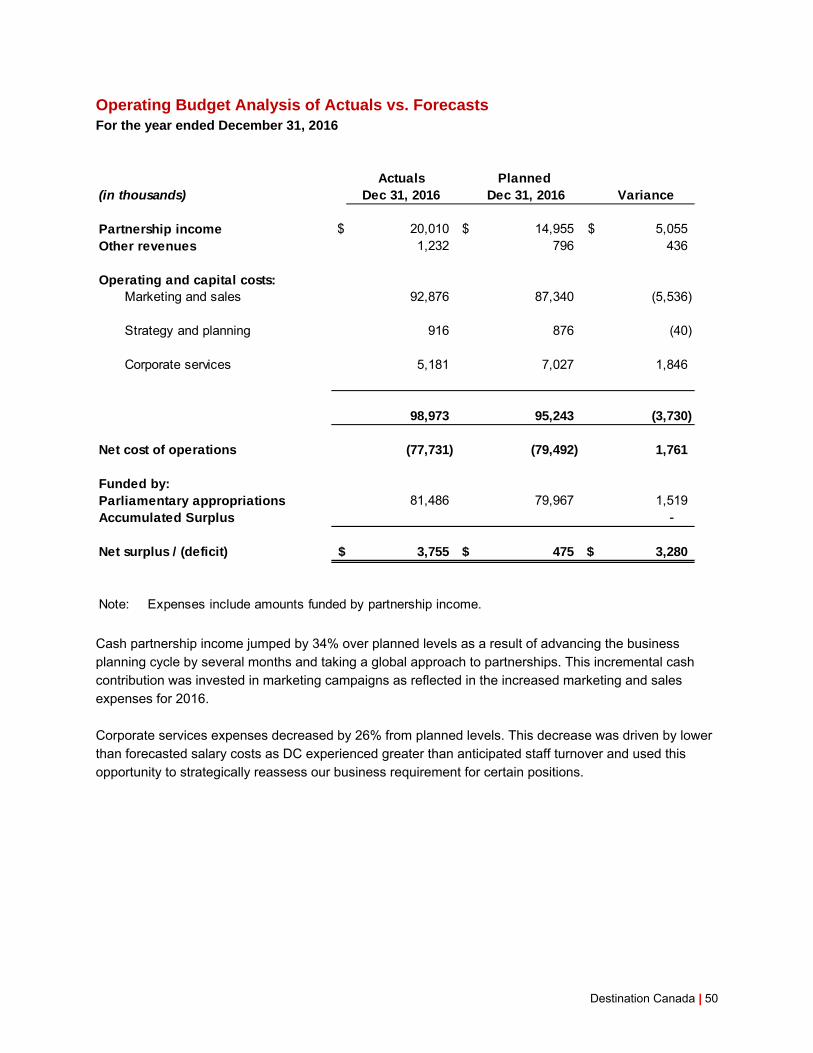
Destination Canada | 50
Operating Budget Analysis of Actuals vs. Forecasts For the year ended December 31, 2016
Cash partnership income jumped by 34% over planned levels as a result of advancing the business planning cycle by several months and taking a global approach to partnerships. This incremental cash contribution was invested in marketing campaigns as reflected in the increased marketing and sales expenses for 2016. Corporate services expenses decreased by 26% from planned levels. This decrease was driven by lower than forecasted salary costs as DC experienced greater than anticipated staff turnover and used this opportunity to strategically reassess our business requirement for certain positions.
Actuals Planned (in thousands) Dec 31, 2016 Dec 31, 2016 Variance
Partnership income $ 20,010 $ 14,955 $ 5,055 Other revenues 1,232 796 436
Operating and capital costs:Marketing and sales 92,876 87,340 (5,536)
Strategy and planning 916 876 (40)
Corporate services 5,181 7,027 1,846
98,973 95,243 (3,730)
Net cost of operations (77,731) (79,492) 1,761
Funded by:Parliamentary appropriations 81,486 79,967 1,519 Accumulated Surplus -
Net surplus / (deficit) $ 3,755 $ 475 $ 3,280
Note: Expenses include amounts funded by partnership income.

51 | 2018-2022 Corporate Plan Summary
Operating Budget Analysis of Actuals vs. Forecasts For the year ending December 31, 2017
Cash partnership income is forecast to jump by 25% over planned levels, driven by our advanced business planning cycle and earlier engagement of partners in developing marketing plans. This incremental cash is invested directly in marketing campaigns and explains the increase in marketing and sales expenses for 2017. We encountered some delays onboarding the new marketing agencies. This will result in minor spending delays and deferrals to 2018. Corporate services costs are forecast to fall 9% below planned levels, driven primarily by lower salary costs. There will be significantly lower staff turnover in 2017. We will continue reassessing business requirements and delivery models before refilling positions.
Estimated * Planned (in thousands) Dec 31, 2017 Dec 31, 2017 Variance
Partnership income $ 22,000 $ 17,551 $ 4,449 Other revenues 1,002 1,002 -
Operating and capital costs:Marketing and sales 113,241 109,834 (3,407)
Strategy and planning 781 822 41
Corporate services 6,806 7,461 655
120,828 118,118 (2,710)
Net cost of operations (97,826) (99,565) 1,740
Funded by:Parliamentary appropriations 99,575 99,565 10 Accumulated Surplus -
Net surplus / (deficit) $ 1,749 $ (0) $ 1,750
Note: Expenses include amounts funded by partnership income.
* Estimate is based on 3 months of actual data, 9 months of forecasted data
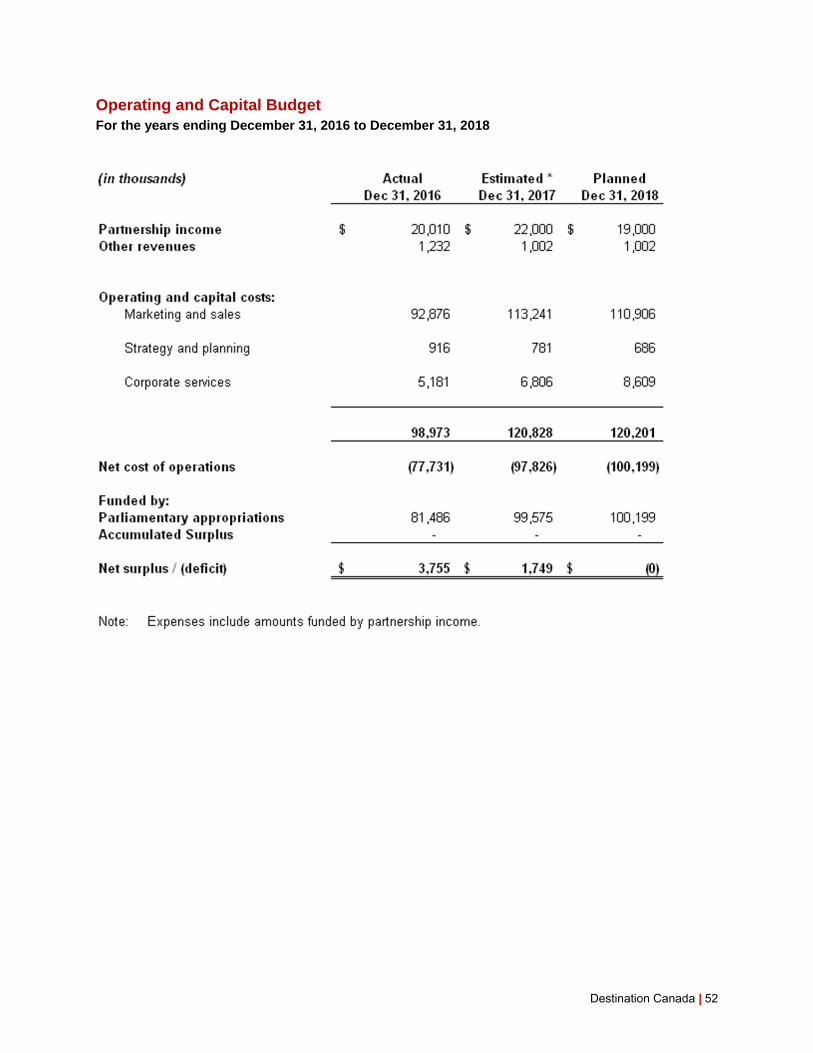
Destination Canada | 52
Operating and Capital Budget For the years ending December 31, 2016 to December 31, 2018

53 | 2018-2022 Corporate Plan Summary
Capital Budget For the year ended December 31, 2016
Higher spending in leasehold improvements reflects projects carried forward from 2015. As planned, our headquarters data centre was updated for an estimated $220,000 to a new generation, in-house data centre. The investment costs came in lower than anticipated because of effective cost benefit analysis and negotiation of contract prices.
Actual Planned Dec 31, 2016 Dec 31, 2016 Variance
Tangible capital assets
Leasehold improvements 274,000$ 50,000$ (224,000)$ and decommissioning
Office furniture - 10,000 10,000
Computer equipment 223,000 350,000 127,000 and software
497,000$ 410,000$ (87,000)$

Destination Canada | 54
Capital Budget For the year ending December 31, 2017
Our forecast is aligned with planned levels in 2017. Lower spending in computer equipment and software is the result of greater diligence of business requirements before purchasing technology. As a result, some purchases may be delayed until 2018.
Estimated Planned Dec 31, 2017 Dec 31, 2017 Variance
Tangible capital assets
Leasehold improvements 10,000$ -$ (10,000)$ and decommissioning
Office furniture 5,000 5,000 -
Computer equipment 91,000 140,000 49,000 and software
106,000$ 145,000$ 39,000$
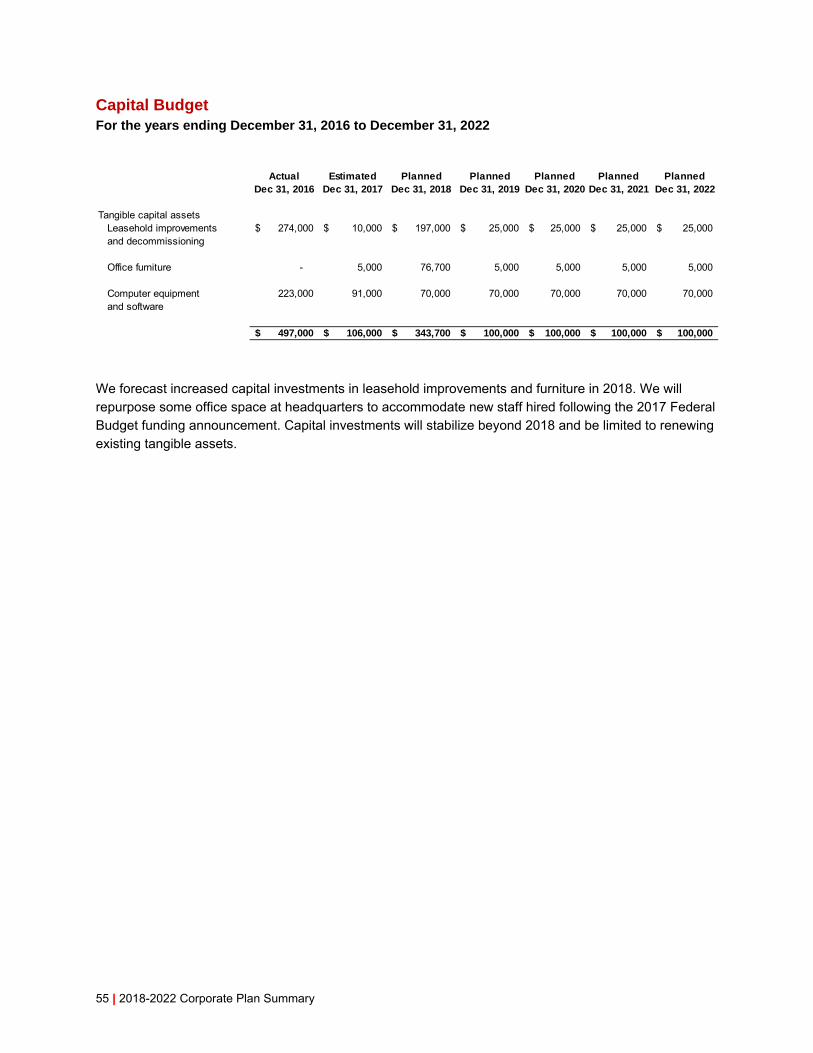
55 | 2018-2022 Corporate Plan Summary
Capital Budget For the years ending December 31, 2016 to December 31, 2022
We forecast increased capital investments in leasehold improvements and furniture in 2018. We will repurpose some office space at headquarters to accommodate new staff hired following the 2017 Federal Budget funding announcement. Capital investments will stabilize beyond 2018 and be limited to renewing existing tangible assets.
Actual Estimated Planned Planned Planned Planned PlannedDec 31, 2016 Dec 31, 2017 Dec 31, 2018 Dec 31, 2019 Dec 31, 2020 Dec 31, 2021 Dec 31, 2022
Tangible capital assetsLeasehold improvements 274,000$ 10,000$ 197,000$ 25,000$ 25,000$ 25,000$ 25,000$ and decommissioning
Office furniture - 5,000 76,700 5,000 5,000 5,000 5,000
Computer equipment 223,000 91,000 70,000 70,000 70,000 70,000 70,000 and software
497,000$ 106,000$ 343,700$ 100,000$ 100,000$ 100,000$ 100,000$

Destination Canada | 56
Actual and forecasted expenditures for Travel, Hospitality and Conferences For the years ending December 31, 2018 to December 31, 2022
In July 2015, the Government of Canada directed all Crown corporations to align their travel and hospitality policies with those of the Treasury Board Secretariat (TBS). For travel after the 2015 effective date of the directive, we have aligned our travel and hospitality practices with those of the relevant TBS instruments. As a result of the transition to the new directive, we have observed 1) that some travel and hospitality had been recorded as marketing and sales expenditures, understating the actual 2016 travel and hospitality costs; 2) a reduction in volume in 2016 and 2017 as travellers got acquainted with the policy; and 3) a reduction of travel and hospitality cost per trip. We implemented the directive with the objective of extracting the greatest value from our travel and hospitality budgets. Forecast spending in Travel and Hospitality over the planning period of 2018-2022 will align with budgeted levels.
Actual Estimated Planned Planned Planned Planned PlannedDec 31, 2016 Dec 31, 2017 Dec 31, 2018 Dec 31, 2019 Dec 31, 2020 Dec 31, 2021 Dec 31, 2022
TravelPublic servants 942,000$ 1,970,000$ 2,253,000$ 2,253,000$ 2,253,000$ 2,253,000$ 2,253,000$ Non-public servants 592,000 830,000 922,000 922,000 922,000 922,000 922,000
Hospitality 136,000 420,000 420,000 420,000 420,000 420,000 420,000
Conferences 73,000 104,000 104,000 104,000 104,000 104,000 104,000
Total 1,743,000$ 3,324,000$ 3,699,000$ 3,699,000$ 3,699,000$ 3,699,000$ 3,699,000$

57 | 2018-2022 Corporate Plan Summary
ANNEX A: STRATEGIC RISK MANAGEMENT Our strong risk management culture allows us to mitigate certain risks as we work with our partners to increase visitation, market share, and economic growth for Canada. We manage risk through formal risk review processes at both staff and Board of Director levels, and by using the expert advice of independent third parties. As well, we are monitored by the Office of the Auditor General of Canada and undergo special examinations periodically as required by the Financial Administration Act. As a Crown corporation with a service mandate, our ultimate overarching risk is a lack of relevance to our partners and shareholder, resulting in an erosion of investor confidence. By identifying strategic risks that impact our organizational objectives, we can address these risks proactively to ensure they do not impact our relevance. Following are the key risks to our strategic objectives along with planned mitigation activities. While relevant from both a strategic and an operational perspective, financial risks are discussed in the Financial Plan section.
High residual risk Medium residual risk Low residual risk
KEY RISKS FOR OBJECTIVE 1:
Increase demand for Canada with innovative marketing
MARKETING EFFECTIVENESS 2017: 2016:
There is a risk that we are not effective at promoting Canada as a premier tourism destination. While the impact of this risk materializing would be significant, the mitigation activities in place contribute to a low likelihood of occurrence.
Mitigation activities: We will maintain a strong brand; employ marketing that is innovative and aligned with a consumer’s path to purchase; assess the effectiveness of our marketing; use insights to inform decisions; communicate our value and impact to the tourism industry; and apply human and financial resources optimally.
PERFORMANCE MEASUREMENT 2017: 2016:
There is a risk that we will be unable to measure the impact, effectiveness and attributable results of our marketing efforts, including the use of new marketing communications technologies in a manner that is meaningful to our stakeholders. Both the impact and likelihood of this risk are assessed as moderate, given the weight placed on the ability to measure results and the complexity of measuring them.
Mitigation activities: We will utilize the latest technology to measure the results of our marketing efforts and we will continue working with our partners to standardize performance measurement approaches.
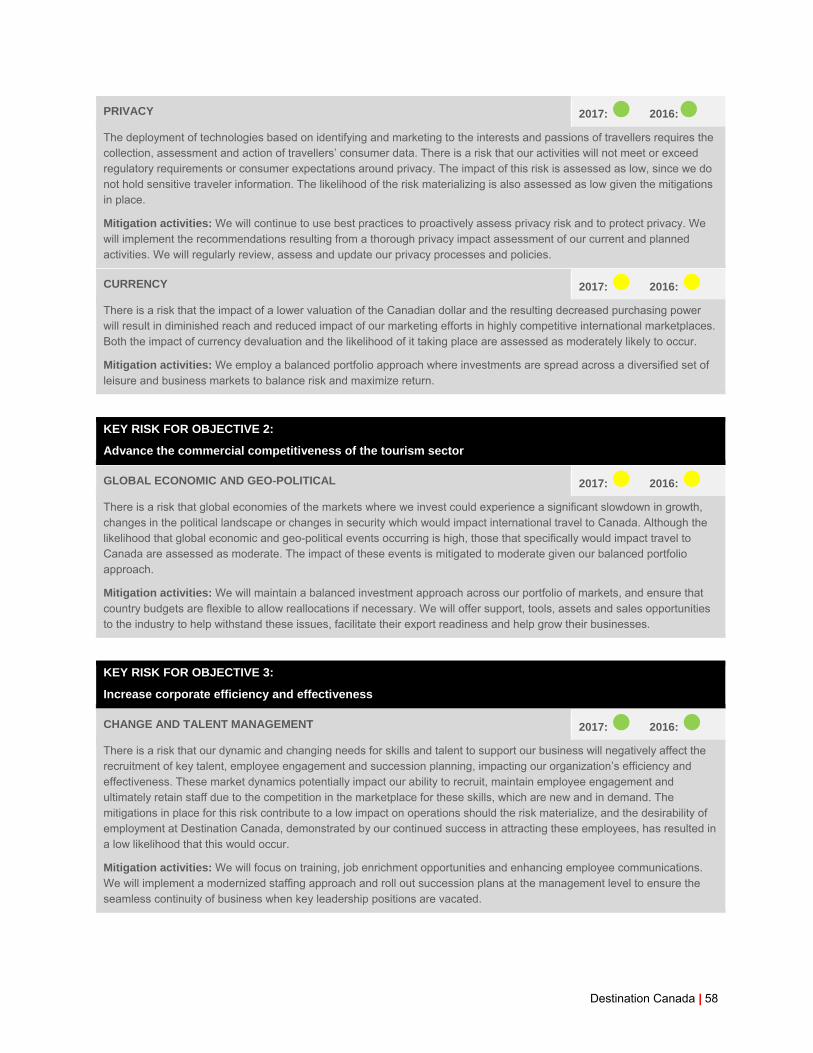
Destination Canada | 58
PRIVACY 2017: 2016:
The deployment of technologies based on identifying and marketing to the interests and passions of travellers requires the collection, assessment and action of travellers’ consumer data. There is a risk that our activities will not meet or exceed regulatory requirements or consumer expectations around privacy. The impact of this risk is assessed as low, since we do not hold sensitive traveler information. The likelihood of the risk materializing is also assessed as low given the mitigations in place.
Mitigation activities: We will continue to use best practices to proactively assess privacy risk and to protect privacy. We will implement the recommendations resulting from a thorough privacy impact assessment of our current and planned activities. We will regularly review, assess and update our privacy processes and policies.
CURRENCY 2017: 2016:
There is a risk that the impact of a lower valuation of the Canadian dollar and the resulting decreased purchasing power will result in diminished reach and reduced impact of our marketing efforts in highly competitive international marketplaces. Both the impact of currency devaluation and the likelihood of it taking place are assessed as moderately likely to occur.
Mitigation activities: We employ a balanced portfolio approach where investments are spread across a diversified set of leisure and business markets to balance risk and maximize return.
KEY RISK FOR OBJECTIVE 2:
Advance the commercial competitiveness of the tourism sector
GLOBAL ECONOMIC AND GEO-POLITICAL 2017: 2016:
There is a risk that global economies of the markets where we invest could experience a significant slowdown in growth, changes in the political landscape or changes in security which would impact international travel to Canada. Although the likelihood that global economic and geo-political events occurring is high, those that specifically would impact travel to Canada are assessed as moderate. The impact of these events is mitigated to moderate given our balanced portfolio approach.
Mitigation activities: We will maintain a balanced investment approach across our portfolio of markets, and ensure that country budgets are flexible to allow reallocations if necessary. We will offer support, tools, assets and sales opportunities to the industry to help withstand these issues, facilitate their export readiness and help grow their businesses.
KEY RISK FOR OBJECTIVE 3:
Increase corporate efficiency and effectiveness
CHANGE AND TALENT MANAGEMENT 2017: 2016:
There is a risk that our dynamic and changing needs for skills and talent to support our business will negatively affect the recruitment of key talent, employee engagement and succession planning, impacting our organization’s efficiency and effectiveness. These market dynamics potentially impact our ability to recruit, maintain employee engagement and ultimately retain staff due to the competition in the marketplace for these skills, which are new and in demand. The mitigations in place for this risk contribute to a low impact on operations should the risk materialize, and the desirability of employment at Destination Canada, demonstrated by our continued success in attracting these employees, has resulted in a low likelihood that this would occur.
Mitigation activities: We will focus on training, job enrichment opportunities and enhancing employee communications. We will implement a modernized staffing approach and roll out succession plans at the management level to ensure the seamless continuity of business when key leadership positions are vacated.

59 | 2018-2022 Corporate Plan Summary
Destination Canada 800-1045 Howe St., Vancouver BC, Canada V6Z 2A9 www.destinationcanada.com