2017.3.83 gll file84 b. jankowicz, p. piotrowski gll no. 3 • 2017 it is worth emphasizing that one...
TRANSCRIPT

Selected methodS for improving photointerpretation featureS of ultraSonographic imageS with the practical application of wavelet tranSformation
Bogdan Jankowicz, Piotr Piotrowski
Summary
Images of different sections of the examined tissue, and in the result, the spatial image of the examined organ on the flat screen of the monitor, are obtained using the mobile apparatus head, which is moved by the physician over the patient’s body surface. The obtained image exactly reproduces the reality, but its interpretation always depends on the physician.Only the proficient knowledge of anatomy enables the correct interpretation of the image. For example, a cyst looks like a homogeneous dark spot with regular shape and smooth edges, while the tumour has a heterogeneous structure, visible as different shades of grey and ragged edges. Of course, the interpretation of the image is not always as simple as that, and therefore, among the professionals it is considered, that good diagnostics is more important than even the most modern equipment. However, the technology and methodology of processing and visualization of images is not without significance. By using the wavelet filtration to transform original images – their photointerpretation becomes easier, and more accurate.
Keywords
photointerpretation of images •wavelet transformation • ultrasonography
1. Methodologyofimageprocessing–waveletfiltration
Due to the characteristics of the changes taking place in the processing, it is worth noting the filtration, which depends on the type of the analysed area. That is why multi-resolution wavelet analysis becomes essential, as it provides the means for local modification of different scales of coefficients, as well as facilitating creation of a recon-struction of the desired part of the image.
However, the signal filtration in the field of wavelet transform is reduced to the modification of transform coefficients, after which the appropriate calculations of the inverse transform are performed. There is a possibility of local analysis, as well as changing the signal reconstructed in different scales using the wavelet tool, which is not possible in the case of the Fourier transformation.
http://dx.doi.org/10.15576/GLL/2017.3.83
GLLGeomatics, Landmanagement and Landscape No. 3 • 2017, 83–88

B. Jankowicz, P. Piotrowski84
GLL No. 3 • 2017
It is worth emphasizing that one of the important advantages of wavelet trans-formation is the option of selecting the basic functions, depending on the properties of the useful signal. This is helpful at a later stage, that is, when extracting (showing, highlighting) pathological changes from the redundant background (noise, image of a healthy tissue, artefacts) at the threshold level. It is possible to adaptively increase values of transform coefficients in the area where a significant object occurs. However, it should be realized that several conditions must be met when constructing the base for analysing functions due to the possibility of subsequent signal reconstruction. In other words, for the designed transformation, the proper selected wavelet base and the number of decomposition levels, the appropriate procedure to modify the coefficient values should be selected.
There are many methods for thresholding values of transform coefficients (for instance, hard or soft thresholding). Also applied to weaken or strengthen the value of the coefficients, among other things, are: the initial classification, context, stimulation of the shape of a useful object, etc.
Next, a schematic representation of the discrete wavelet transformation is presented, which uses a pair of cascade processing filters (Figure 1). The filter impulse responses are dependent on the transform base wavelet and on the form of the scal-ing function.
L
Source: authors’ study
Fig. 1. A. Diagram of a discrete wavelet transformation implementation: synthesis, analysis B. Cascade processing, multi-resolution analysis using three levels of decomposition (hpf – high pass filter, lpf – low pass filter, d – decimation, c – complement the samples)
A.
input
hpf
lpf d
d
output
hpf’
lpf’ c
c
H
L
H
L
B.
input
hpf
lpf
hpf
lpf
d
d
d
d
d
d
hpf
lpf
L
H2
H1
H0

Selected methodS for imProving PhotointerPretation... 85
Geomatics, Landmanagement and Landscape No. 3 • 2017
On the other hand, when considering classic wavelet transformation, it should be emphasized that the orthogonal filter banks are used. However, these are also used in many applications of wavelet image processing methods turned into bases of biorthog-onal functions. Thanks to these databases, it is possible to perform wavelet transforma-tions using linear phase filters with finite impulse responses. Accurate reproduction of the signal from the transform coefficients is possible thanks to the biorthogonal filters, which meet the condition of the so-called perfect reconstruction.
hpf(z)hpf(z–1) + lpf(z)lpf(z–1) = 2
hpf(z)hpf(–z–1) + lpf(z)lpf(–z–1) = 0
In addition, it is also worth mentioning the lifting diagram, which facilitates the design of new bases, and also saves time. There is an option to use a lifting scheme by wavelet transformation with biorthogonal bases. As it turns out, it is possible to convert the filters from the weave implementation to the lifting shape. It consists of predictive and clarifying steps (Figure 2). These steps are determined thanks to the factoring of the polyphase matrix of the analysis filter bank. Furthermore, factoriza-tion replaces complex filter banks (form of set of impulse response coefficients) with a series of simple filters for subsequent lifting steps. However, it should be noted that a better solution is the direct design of the prediction and clarification functions, as well as calculation of filter coefficients by means of which it is possible to implement a convolutional design of transformation, as the factoring process is not entirely reli-able.
Source: authors’ study
Fig. 2. A lifting diagram containing a prediction step (p), and a clarifying step (u) with a signal time shift of one sample
d
d
input p u p u
z–1 H
Referring to wavelet transformations that involve the transformation of one-dimensional signals, it turns out that with the so-called separable kernel (one-dimensional kernel used independently for both dimensions) it is possible to obtain a two-dimensional wavelet form of images. Two-dimensional kernels are created to allow detailed analysis of irregularly shaped objects, and also taking into account the image characteristics. In addition, the hexagonal wavelet kernel is used to test the transformation form.
B. Jankowicz, P. Piotrowski86
GLL No. 3 • 2017
2. Practicalapplications
In Doppler ultrasonography, by measuring the change in the frequency of ultrasound reflections, we determine the speed of the reflecting obstacle. This phenomenon has just been used in the construction of special ultrasonic devices, which allow, for example, the assessment of blood flow in the blood vessels and heart. Ultrasounds reflected from the moving blood mass return to the probe with a different frequency than the output. The difference in frequencies is the basis for Doppler images. After computer process-ing of the received signals, it is possible to get a colour image. If its colour depends on the direction of the blood flow, the physician will receive additional important infor-mation to distinguish between venous and arterial blood. In general, arterial blood is displayed in red and venous in blue. It is also possible to accurately measure blood flow velocity and other parameters on a special chart.
In wide vessels, blood flows through the cross section of the vessel at different speeds. It flows the fastest along the axis of the vessel, i.e. in the middle, and it becomes slower as it approaches its lateral walls. Ultrasounds, bouncing from individual layers, change their frequency by different values. Therefore, we get not one Doppler frequency, but the whole spectrum of frequencies. From this spectrum, the distribution of blood flow velocity in the blood vessel can be determined, and subsequently, the average speed can be calculated. In turn, to determine the amount of blood flowing through a vessel per unit of time, it is still necessary to determine the width of the vessel. It is determined by measuring the time difference of the return of ultrasound reflected from both walls of the blood vessel. Doppler ultrasonography records heart contractions or blood flow in blood vessels. It is possible to determine whether the visible anatomical structure is a blood vessel, whether there is blood movement in it, and what kind of movement it is (cork, laminar or turbulent), as well as what is the direction of blood flow.
Changes in blood flow velocity are also determined at the place of an intravascular obstruction or narrowing of the entire vessel; this presents the pathological vasculari-zation of the tumour, and calculates quantitative blood flow parameters.
3. Conclusion
Photography is the source of enormous amount of information about the studied subject. Despite possible faults (for example, not capturing exactly all the details), it has great information potential [Piech 2013]. But, as demonstrated by the examples given and the photos shown, the technology and methodology of image visualization is of great importance to proper and accurate interpretation of ultrasound images. The multi-resolution image decomposition performed in the wavelet transformation makes it possible to pack signal energy in a small number of wavelet coefficients and to emphasize the characteristics of the image (such as contours and edges distribution, texture and noise properties), which creates greater possibilities and better solutions for effective compression and encoding algorithms [Przelaskowski 2002]. Another interesting option for photointerpretation may be the supervised classification. Thanks to the latter, the image is analysed, on which each pixel is categorized into the appropri-
Selected methodS for imProving PhotointerPretation... 87
Geomatics, Landmanagement and Landscape No. 3 • 2017
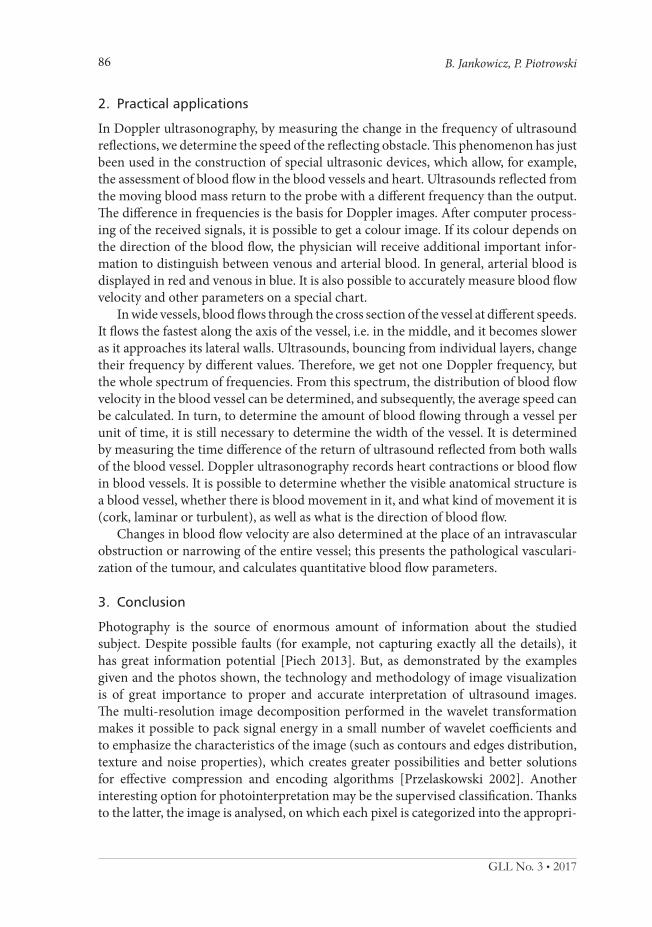
Source: authors’ study
Fig. 3. The illustration shows the effect of applying different filtering methods to the USG image – arterial blood (red) flows through the carotid artery narrowed slightly by atheromatous plaque. Blue point indicates swirling of blood. Above the jugular, a vein can be seen, through which the blood returns to the heart (blue). Applied filters: a) sharp, b) sketch, c) glowing, d) light
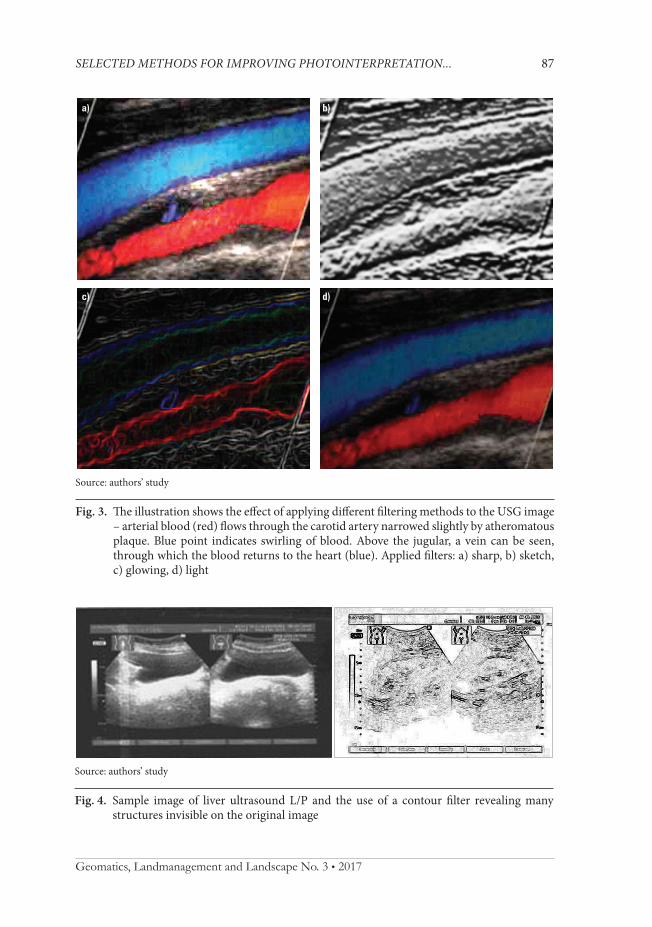
Source: authors’ study
Fig. 4. Sample image of liver ultrasound L/P and the use of a contour filter revealing many structures invisible on the original image
a) b)
c) d)

B. Jankowicz, P. Piotrowski88
ate class [Kwoczyńska et al. 2014]. This method of analysis of ultrasound images can also be widely used in interpretation.
By using the right tools to transform the original images, their photointerpreta-tion becomes easier, and therefore more accurate, which undoubtedly contributes to formulating the correct medical diagnosis.
References
Kwoczyńska B., Litwin U., Mitka B., Piech I., Salata T. 2014. Analysis of land development conformity obtained using photogrammetric and remote sensing methods with Geographic Information System (GIS) technology. Int. J. Physic. Sci., 9(7) 123–139.
Piech I. 2013. Geodetic and photogrammetric measurements in the area of historic grange in Mściwojów. Geomat. Landmanag. Landsc. (GLL), 1, 73–81.
Periaswamy S. 1996. Detection of microcalcification in mammograms using hexagonal wave-lets, University of South Carolina.
Przelaskowski A. 2002. Falkowe metody kompresji danych obrazowych. Oficyna Wydawnicza Politechniki Warszawskiej, Warszawa.
Said A., Pearlman W.A. 1993. Reversible image compression via multiresolution representation and predictive coding. Visual Communications and Image Processing, Proceedings of SPIE, 2094, 664–674.
Said A., Pearlman W.A. 1996. An Image Multiresolution Representation for Lossless and Lossy Image Compression. IEEE Trans. Image Proc., 5, 1303–1310.
Sayood K. 2002. Kompresja danych – wprowadzenie. Wydawnictwo RM, Warszawa. Shuler S., Laine A. 2003. Hexagonal wavelet processing of digital mammography. Gainesville,
Florida.Skarbek W. 1993. Metody reprezentacji obrazów cyfrowych. Akademicka Oficyna Wydawnicza
PLJ, Warszawa.Skarbek W. (ed.). 1998. Multimedia algorytmy i standardy kompresji. Akademicka Oficyna
Wydawnicza PLJ, Warszawa 1998. Starosolski R. 2002. Algorytmy bezstratnej kompresji obrazów. Stud. Inform., 23, 4(51), 277–
300. Starosolski R. 2003. Algorytmy bezstratnej kompresji danych. Stud. Inform., 24, 1(52), 137–58.
Drinż.BogdanJankowiczUniwersytetRolniczywKrakowieKatedraGeodezjiRolnej,KatastruiFotogrametrii30-198Kraków,ul.Balicka253ae-mail:[email protected]
Mgrinż.PiotrPiotrowskiUniwersytetRolniczywKrakowieKatedraGeodezjiRolnej,KatastruiFotogrametrii30-198Kraków,ul.Balicka253ae-mail:[email protected]