20170413 disclosure report 2016 - commerzbank · pdf filedisclosure report 2016 ... than 17.5...
TRANSCRIPT

The bank at your side
Disclosure Report 2016
Disclosure in accordance with the Capital Requirements Regulation as at 31 December 2016

3 Introduction
5 Equity capital 5 Capital structure
12 Capital requirements
16 Risk-oriented overall bank management 16 Risk statement
17 Risk management organisation
17 Risk strategy and risk management
20 Risk-taking capability and stress testing
22 Specific risk management 22 Default risk
22 Risk management
25 Loan portfolio model
32 Quantitative information on default risks
46 Loan loss provisions for default risks
51 Investments in the banking book
53 Securitisations
62 Market risk
62 Risk management
63 Market risk model
65 Quantitative information on market risks
66 Interest rate risk in the banking book
67 Liquidity risk
67 Risk management
68 Liquidity risk model
70 Operational risk
70 Risk management
71 OpRisk model
72 Other risks
73 Appendix 73 Consolidation matrix and material Group entities
75 Additional tables
80 Overview of risk reporting
82 List of tables
83 List of abbreviations
Contents
Due to rounding, numbers and percentages presented throughout this report
may not add up precisely to the totals provided.
Introduction Equity capital Risk-oriented overall bank management Specific risk management Appendix 3
Commerzbank
Commerzbank is leading international commercial bank with
branches and offices in almost 50 countries. With approximately
1,000 branches Commerzbank has one of the densest branch net-
works among German private banks. Commerzbank serves more
than 17.5 million private and small business customers and more
than 60,000 corporate clients, multinationals, financial service
providers, and institutional clients.
As part of its new strategy, Commerzbank is focusing its busi-
ness activities on the two core segments “Private and Small-
Business Customers” and “Corporate Clients”, hereby offering a
comprehensive portfolio of banking and capital market services.
The run-off segment Asset & Capital Recovery (ACR) comprises –
besides the Public Finance business – all non-strategic activities of
commercial real estate and ship financing. Each segment
is managed by a member of the Board of Managing Directors.
All staff and management functions are contained in Group
Management: Group Audit, Group Communications, Group Com-
pliance, Group Development & Strategy, Group Finance, Group
Human Resources, Group Investor Relations, Group Legal, Group
Treasury and the central risk functions. The support functions are
provided by Group Services. These include Group Banking Opera-
tions, Group Markets Operations, Group Information Technology,
Group Organisation & Security and Group Delivery Center. The
staff, management and support functions are combined in the
Others and Consolidation division.
On the domestic market, Commerzbank Aktiengesellschaft is
headquartered in Frankfurt am Main, from where it manages a
nationwide branch network through which all customer groups are
served. The most important domestic subsidiaries are comdirect
bank AG and Commerz Real AG. Outside Germany, the Bank has 6
material subsidiaries, 23 operational foreign branches and 34 rep-
resentative offices in more than 50 countries and is represented in
all major financial centres, such as London, New York, Tokyo,
Hong Kong and Singapore. However, the focus of the international
activities is on Europe.
A detailed description of Commerzbank Group is given in the
Annual Report 2016. Information regarding the remuneration sys-
tem of Commerzbank is laid down in the Remuneration Report
2016 (according to the German Remuneration Ordinance for Insti-
tutions) as well as in the section Remuneration Report in the Annu-
al Report 2016.
Objective of the Disclosure Report
This report is intended to give the reader a detailed insight into
Commerzbank’s current risk profile and risk management. In par-
ticular, it contains information on:
• the Commerzbank Group’s structure from both a regulatory and accounting perspective,
• the Group’s capital structure, • the Commerzbank Group’s general risk management system and
• the risk management in respect of specific types of risk.
The report may also be seen as complementary to the Annual Re-
port pursuant to the German Commercial Code (Han-
delsgesetzbuch – HGB), since in contrast to the Annual Report it
focuses primarily on the supervisory perspective.
In this report Commerzbank Aktiengesellschaft as the ultimate
parent company of the regulated banking group is complying with
the disclosure requirements of Article 431 – 455 of the regulation
(EU) No. 575/2013 – Capital Requirements Regulation (CRR) as at
the reporting date 31 December 2016.
An overview of the structure of risk reporting in the Annual Re-
port and Disclosure Report 2016 may be found in table 55 in the
appendix to this document.
Scope
This Disclosure Report is based on the group of companies consol-
idated for regulatory purposes. The companies consolidated for
regulatory purposes only include those carrying out banking and
other financial business. The consolidated group consists of a do-
mestic parent company and its affiliated companies. The aim of
regulatory consolidation is to prevent multiple use of capital that
in fact exists only once by subsidiary companies in the financial
sector. The companies consolidated under IFRS, by contrast, com-
prise all the companies controlled by the ultimate parent company.
In accordance with the materiality principle set out in Article
432 (1) CRR, this disclosure relates to the largest entities within
the Commerzbank Group. This enables the focus to be placed on
the information that is most material. Subsidiaries classified as
material during the annual risk inventory are included in the Dis-
closure Report according to a uniform definition of materiality
throughout the Group. In addition, at least 95% coverage of the
capital adequacy requirements of the entire Commerzbank Group
must be achieved with these companies. This applies for default
risks and also for market and operational risks. If this is not the
case, other subsidiaries will be brought into the group of consoli-
Introduction
4 Commerzbank Disclosure Report 2016
dated companies. A check is carried out in the run-up to the annu-
al Disclosure Report to determine whether or not the 95% ratio is
complied with for all risk types. An adjustment to the group of
consolidated companies would be implemented as at 31 December,
if applicable, and remains unchanged for the upcoming three
quarterly reports.
In accordance with this definition, the following companies – as
in last year’s report – are included in the Disclosure Report 2016
alongside Commerzbank Aktiengesellschaft:
• mBank S.A., • comdirect bank AG, • Commerz Real AG, • Commerzbank Finance & Covered Bond S.A. (CFCB) and • Loan Solutions Frankfurt GmbH (LSF).
These six companies account for over 95% of the Com-
merzbank Group’s total capital adequacy requirement. The 95%
condition is also met in each case for the individual types of risk.
The information in this Disclosure Report generally relates to
the six consolidated entities listed above. Where this is not the
case – e.g. with regard to the capital structure – it is explicitly stat-
ed. All entities are fully consolidated both from a supervisory per-
spective and in accordance with IFRS.
In the context of the disclosure requirements (Article 431 (3)
CRR), besides the Disclosure Report itself, all policies and pro-
cesses have to be documented as a main component to fulfil the
Pillar 3 requirements of the Basel framework. The appropriateness
and practicality of the Bank’s disclosure practice has to be re-
viewed on a regular basis. For this purpose, Commerzbank has
defined guidelines for the Disclosure Report which regulate the
overarching, strategic part of the instructions. The operative tar-
gets and responsibilities are additionally defined in separate doc-
uments.
With consolidated total assets that are regularly well in excess
of €30bn, Commerzbank is one of the biggest financial institutions
in Germany. Hence, independent of the criteria in Article 433 CRR,
Commerzbank has implemented the reporting requirements dur-
ing the period from Q2 2015 on and discloses the quarterly and
semi-annually required information as appropriate.1
Waiver rule pursuant to Article 7 CRR
Under the waiver rule pursuant to Article 7 CRR in conjunction
with section 2a (1) of the German Banking Act (KWG), subsidiary
companies in a banking group may apply for exemption from the
requirements of Article 6 (1) CRR (on capital, large exposures, ex-
posures to transferred credit risk and disclosure) at single entity
level. This is on condition, among other things, that both the par-
ent company and subsidiary are licensed in the same member
state and the subsidiary is included in the supervision on a consol-
idated basis of the parent company.
Exemption is also on condition that there is no current or fore-
seen material practical or legal impediment to the prompt transfer
of own funds or the repayment of liabilities by the parent company,
that the parent company guarantees the commitments entered into
by the subsidiary, the risk evaluation, measurement and control
procedures of the parent company cover the subsidiary, and the
parent company holds more than 50% of the voting rights in the
subsidiary or can appoint or remove a majority of the members of
the management body and can therefore exercise a dominant in-
fluence over the subsidiary.2
In the case of institutions and parent companies that were al-
ready making use of a waiver before the CRR came into effect un-
der the rules of the German Banking Act (KWG) applicable at the
time, using the disclosure procedure then specified, exemption is
deemed to have been granted under Article 7 CRR and the rele-
vant standards under section 25a (1) sentence 3 KWG (see section
2a (5) KWG).
The waiver rule is used by comdirect bank AG. It is – for in-
stance by virtue of the risk management carried out at Group level
(in line with MaRisk) – fully integrated into the internal processes
and risk management of Commerzbank Aktiengesellschaft as the
ultimate parent company of the banking group. This applies in
particular to the methods used, risk management, monitoring of
operations, management and reporting. Commerzbank Aktieng-
esellschaft holds 81.3% of the voting rights in comdirect bank AG
and guarantees its commitments towards third parties (through
letters of comfort).
According to Article 7 CRR in conjunction with section 2a (1)
KWG, parent companies within the group of companies consoli-
dated for regulatory purposes are also entitled to this exemption.
The opportunity this offers for Commerzbank Aktiengesellschaft as
the ultimate parent company of the Commerzbank Group to be
exempted from the requirements at single entity level has been
utilised since 2007. The conditions for claiming the waiver contin-
ue to apply.
Utilisation of the waiver rule was reported at the outset to
BaFin and the Bundesbank with evidence of compliance with the
requirements and is subsequently monitored and documented on
occasion.
1 For this see EBA/GL/2014/14, title V (18).
2 Under Article 7 (1) d) CRR, a dominant influence means either having a majority of voting rights or having the right to appoint a
majority of the members of the management body of the subsidiary.

Introduction Equity capital Risk-oriented overall bank management Specific risk management Appendix 5
Capital structure
The main rules governing compliance with minimum regulatory
capital ratios for solvency purposes in the EU are contained in the
Capital Requirements Directive (CRD) IV, the Capital Requirements
Regulation (CRR), a European regulation which, unlike the CRD IV
Directive, has direct legal effect for all European banks, together
with the SSM Regulation (Council Regulation No. 1024/2013 of
15 October 2013 conferring specific tasks on the European Central
Bank concerning policies relating to the prudential supervision of
credit institutions). This legislation is supplemented at national
level in Germany by further provisions in the German Banking Act,
the German Solvency Regulation and other regulations. In addition,
Implementing Technical Standards (ITS) and Regulatory Technical
Standards (RTS) provide explanations about particularly complex
matters. The introduction of the new regulations in 2014 has
strengthened the quality of regulatory capital compared with the
previous regime, made capital requirements more stringent and
set higher minimum requirements for banks’ capital adequacy.
To avoid having the requirements take effect on a single date,
certain parts of the new rules are subject to defined phase-in rules.
Common Equity Tier 1 (CET1) capital consists largely of sub-
scribed capital plus reserves and non-controlling interests. Ad-
justments to this figure may be necessitated by any number of
causes, for example goodwill, intangible assets, write-downs of
assets (if assets are not valued cautiously enough in the regulator’s
view), shortfalls due to the comparison of expected losses with the
provisions recognised for them and the correction of tax loss car-
ry-forwards. Adding Additional Tier 1 capital (AT1), which can
contain subordinated debt instruments with certain conditions,
produces Tier 1 capital. Tier 2 capital consists largely of subordi-
nated debt instruments which are not eligible as Additional Tier 1
capital. The eligibility of these capital components has been re-
duced, as over the final five years of their life they may now only
be amortised on a straight-line basis.
Commerzbank seeks to achieve the following objectives in
managing its capital:
• adherence to the statutory minimum capital requirements at Group level and in all companies included in the regulatory
Group,
• ensuring that the planned capital ratios are met, including the new ECB/EBA requirements,
• provision of sufficient reserves to guarantee the Bank’s freedom of action at all times,
• strategic allocation of Tier 1 capital to business segments and divisions in order to exploit growth opportunities.
The financial crisis made the importance of adequate CET1 capital
levels for banks become an issue of increasing public concern. At
Commerzbank, Tier 1 capital has always been a key management
target. The Bank’s specifications for the capital ratios far exceed
the minimum statutory requirements. The Bank’s risk-bearing ca-
pacity and market expectations play an important role in determin-
ing the internal capital ratio targets. For this reason, Com-
merzbank has stipulated minimum ratios for regulatory capital.
CET1 capital is allocated via a regular process that takes account
of the Bank’s strategic direction, profitable new business opportu-
nities in the core business of each business segment as well as
aspects of risk-bearing capacity.
Measures relating to the Bank’s capital are approved by the
Board of Managing Directors, subject to the authorisation granted
by the annual general meeting. During the past year, Com-
merzbank met the minimum statutory capital requirements as well
as the requirements of the ECB and EBA at all times. All of the
proposed new regulations are still subject to change. Parts of the
proposed ITS and RTS are still outstanding. Consequently, all fig-
ures for risk-weighted assets, capital and capital ratios reflect
Commerzbank’s current understanding of the applicable regula-
tions. In the pro forma calculation of fully phased-in implementa-
tion of the CRR requirements, the transitional regulations are
completely disregarded.
To provide a comprehensive overview of the Group’s available
equity, the analyses shown in tables 1 to 4 comprise the complete
group of companies consolidated for regulatory purposes. This
equity capital is the basis for the calculation of the equity capital
adequacy as reported to the Bundesbank.
Details of the issued capital instruments of the Commerzbank
Group according to Article 437 (1) b) and c) CRR are given on the
Commerzbank website in the section Debt holder infor-
mation/Capital instruments. Further information on our leverage
ratio according to Article 451 CRR is given in Note 90 (Capital re-
quirements and leverage ratio) in the Annual Report 2016, which
is published on our website.
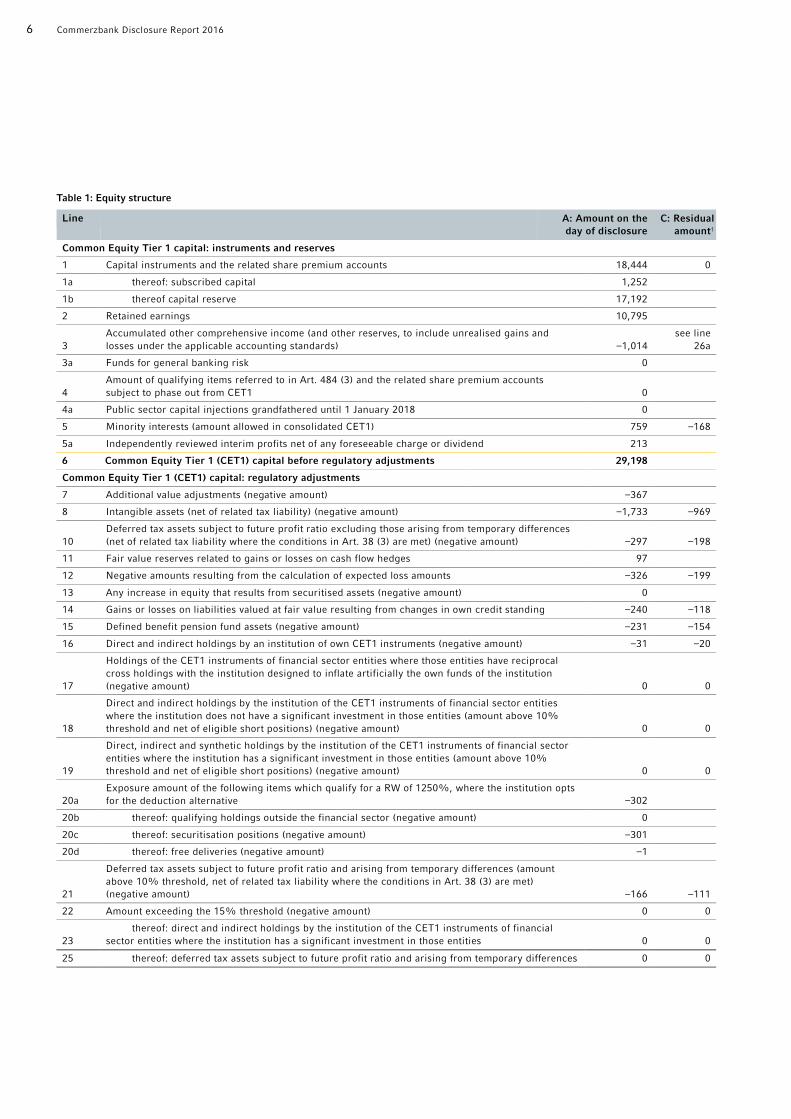
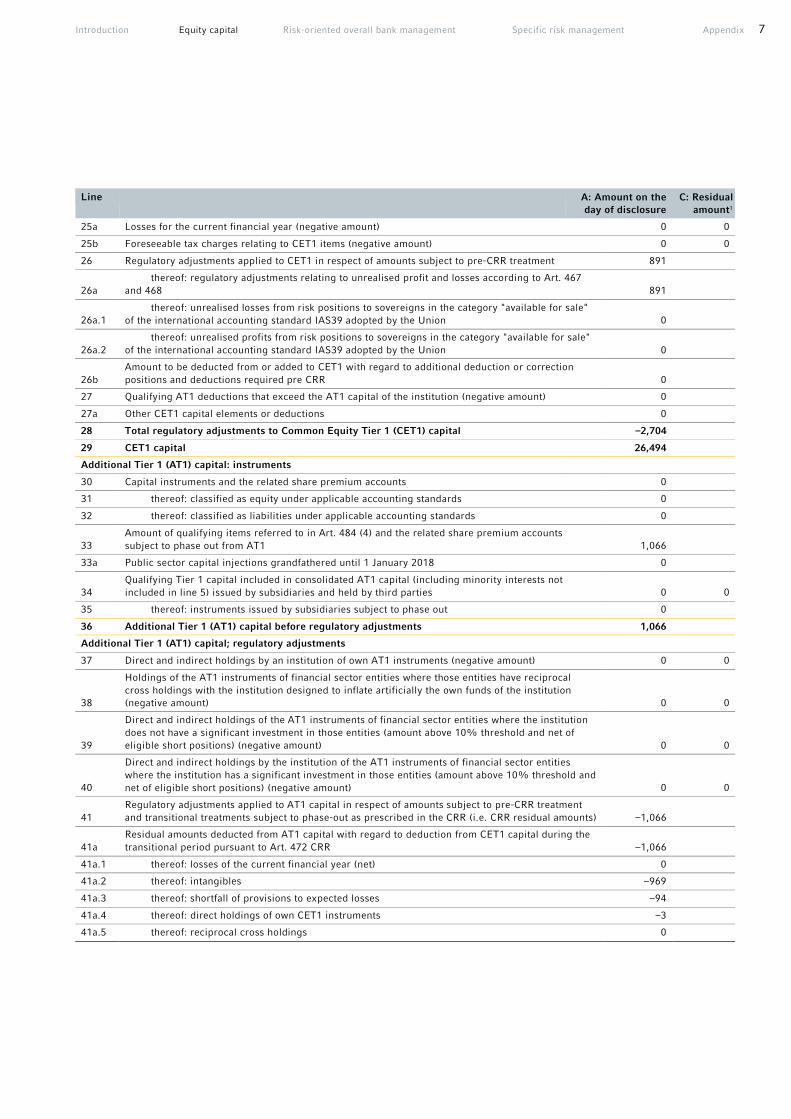
The composition of the regulatory equity capital and the equity
capital ratios are shown in the following table:
Equity capital
6 Commerzbank Disclosure Report 2016
Table 1: Equity structure
Line A: Amount on the
day of disclosure
C: Residual
amount1
Common Equity Tier 1 capital: instruments and reserves
1 Capital instruments and the related share premium accounts 18,444 0
1a thereof: subscribed capital 1,252
1b thereof capital reserve 17,192
2 Retained earnings 10,795
3
Accumulated other comprehensive income (and other reserves, to include unrealised gains and
losses under the applicable accounting standards) –1,014
see line
26a
3a Funds for general banking risk 0
4
Amount of qualifying items referred to in Art. 484 (3) and the related share premium accounts
subject to phase out from CET1 0
4a Public sector capital injections grandfathered until 1 January 2018 0
5 Minority interests (amount allowed in consolidated CET1) 759 –168
5a Independently reviewed interim profits net of any foreseeable charge or dividend 213
6 Common Equity Tier 1 (CET1) capital before regulatory adjustments 29,198
Common Equity Tier 1 (CET1) capital: regulatory adjustments
7 Additional value adjustments (negative amount) –367
8 Intangible assets (net of related tax liability) (negative amount) –1,733 –969
10
Deferred tax assets subject to future profit ratio excluding those arising from temporary differences
(net of related tax liability where the conditions in Art. 38 (3) are met) (negative amount) –297 –198
11 Fair value reserves related to gains or losses on cash flow hedges 97
12 Negative amounts resulting from the calculation of expected loss amounts –326 –199
13 Any increase in equity that results from securitised assets (negative amount) 0
14 Gains or losses on liabilities valued at fair value resulting from changes in own credit standing –240 –118
15 Defined benefit pension fund assets (negative amount) –231 –154
16 Direct and indirect holdings by an institution of own CET1 instruments (negative amount) –31 –20
17
Holdings of the CET1 instruments of financial sector entities where those entities have reciprocal
cross holdings with the institution designed to inflate artificially the own funds of the institution
(negative amount) 0 0
18
Direct and indirect holdings by the institution of the CET1 instruments of financial sector entities
where the institution does not have a significant investment in those entities (amount above 10%
threshold and net of eligible short positions) (negative amount) 0 0
19
Direct, indirect and synthetic holdings by the institution of the CET1 instruments of financial sector
entities where the institution has a significant investment in those entities (amount above 10%
threshold and net of eligible short positions) (negative amount) 0 0
20a
Exposure amount of the following items which qualify for a RW of 1250%, where the institution opts
for the deduction alternative –302
20b thereof: qualifying holdings outside the financial sector (negative amount) 0
20c thereof: securitisation positions (negative amount) –301
20d thereof: free deliveries (negative amount) –1
21
Deferred tax assets subject to future profit ratio and arising from temporary differences (amount
above 10% threshold, net of related tax liability where the conditions in Art. 38 (3) are met)
(negative amount) –166 –111
22 Amount exceeding the 15% threshold (negative amount) 0 0
23
thereof: direct and indirect holdings by the institution of the CET1 instruments of financial
sector entities where the institution has a significant investment in those entities 0 0
25 thereof: deferred tax assets subject to future profit ratio and arising from temporary differences 0 0
Introduction Equity capital Risk-oriented overall bank management Specific risk management Appendix 7
Line A: Amount on the
day of disclosure
C: Residual
amount1
25a Losses for the current financial year (negative amount) 0 0
25b Foreseeable tax charges relating to CET1 items (negative amount) 0 0
26 Regulatory adjustments applied to CET1 in respect of amounts subject to pre-CRR treatment 891
26a
thereof: regulatory adjustments relating to unrealised profit and losses according to Art. 467
and 468 891
26a.1
thereof: unrealised losses from risk positions to sovereigns in the category "available for sale"
of the international accounting standard IAS39 adopted by the Union 0
26a.2
thereof: unrealised profits from risk positions to sovereigns in the category "available for sale"
of the international accounting standard IAS39 adopted by the Union 0
26b
Amount to be deducted from or added to CET1 with regard to additional deduction or correction
positions and deductions required pre CRR 0
27 Qualifying AT1 deductions that exceed the AT1 capital of the institution (negative amount) 0
27a Other CET1 capital elements or deductions 0
28 Total regulatory adjustments to Common Equity Tier 1 (CET1) capital –2,704
29 CET1 capital 26,494
Additional Tier 1 (AT1) capital: instruments
30 Capital instruments and the related share premium accounts 0
31 thereof: classified as equity under applicable accounting standards 0
32 thereof: classified as liabilities under applicable accounting standards 0
33
Amount of qualifying items referred to in Art. 484 (4) and the related share premium accounts
subject to phase out from AT1 1,066
33a Public sector capital injections grandfathered until 1 January 2018 0
34
Qualifying Tier 1 capital included in consolidated AT1 capital (including minority interests not
included in line 5) issued by subsidiaries and held by third parties 0 0
35 thereof: instruments issued by subsidiaries subject to phase out 0
36 Additional Tier 1 (AT1) capital before regulatory adjustments 1,066
Additional Tier 1 (AT1) capital; regulatory adjustments
37 Direct and indirect holdings by an institution of own AT1 instruments (negative amount) 0 0
38
Holdings of the AT1 instruments of financial sector entities where those entities have reciprocal
cross holdings with the institution designed to inflate artificially the own funds of the institution
(negative amount) 0 0
39
Direct and indirect holdings of the AT1 instruments of financial sector entities where the institution
does not have a significant investment in those entities (amount above 10% threshold and net of
eligible short positions) (negative amount) 0 0
40
Direct and indirect holdings by the institution of the AT1 instruments of financial sector entities
where the institution has a significant investment in those entities (amount above 10% threshold and
net of eligible short positions) (negative amount) 0 0
41
Regulatory adjustments applied to AT1 capital in respect of amounts subject to pre-CRR treatment
and transitional treatments subject to phase-out as prescribed in the CRR (i.e. CRR residual amounts) –1,066
41a
Residual amounts deducted from AT1 capital with regard to deduction from CET1 capital during the
transitional period pursuant to Art. 472 CRR –1,066
41a.1 thereof: losses of the current financial year (net) 0
41a.2 thereof: intangibles –969
41a.3 thereof: shortfall of provisions to expected losses –94
41a.4 thereof: direct holdings of own CET1 instruments –3
41a.5 thereof: reciprocal cross holdings 0

8 Commerzbank Disclosure Report 2016
Line A: Amount on the
day of disclosure
C: Residual
amount1
41a.6
thereof: equity capital instruments of financial sector entities where the institution does not
have a significant investment in those entities 0
41a.7
thereof: equity capital instruments of financial sector entities where the institution has a
significant investment in those entities 0
41b
Residual amounts deducted from AT1 capital with regard to deductions from Tier 2 capital during the
transitional period pursuant to Art. 475 CRR 0
41b.1 thereof: reciprocal cross holdings of Tier 2 instruments 0
41b.2 thereof: direct positions of non-significant capital holdings of other financial sector entities 0
41c
Amount to be deducted from or added to AT1 capital with regard to additional deduction or
correction positions and deductions required pre CRR 0
41c.1 thereof: possible deduction or correction positions for unrealised losses 0
41c.2 thereof: possible deduction or correction positions for unrealised profits 0
41c.3 thereof: others 0
42 Qualifying Tier 2 deductions that exceed the Tier 2 capital of the institution (negative amount) 0
42a Other AT1 capital elements or deductions 0
43 Total regulatory adjustments to Additional Tier 1 (AT1) capital –1,066
44 Additional Tier 1 (AT1) capital 0
45 Tier 1 capital (T1 = CET1 + AT1) 26,494
Tier 2 capital: instruments and provisions
46 Capital instruments and the related share premium accounts 5,495
47
Amount of qualifying items referred to in Art. 484 (5) and the related share premium accounts
subject to phase out from Tier 2 84
47a Public sector capital injections grandfathered until 1 January 2018 0
48
Qualifying own funds instruments included in consolidated Tier 2 capital (including minority interests
and AT1 instruments not included in rows 5 or 34) issued by subsidiaries and held by third parties 284 –7
49 thereof: instruments issued by subsidiaries subject to phase out 7
50 Credit risk adjustments 0
51 Tier 2 capital before regulatory adjustments 5,862
Tier 2 capital: regulatory adjustments
52
Direct and indirect holdings by an institution of own Tier 2 instruments and subordinated loans
(negative amount) –80 0
53
Holdings of the Tier 2 instruments and subordinated loans of financial sector entities where those
entities have reciprocal cross holdings with the institution designed to inflate artificially the own
funds of the institution (negative amount) 0 0
54
Direct and indirect holdings of the Tier 2 instruments and subordinated loans of financial sector
entities where the institution does not have a significant investment in those entities (amount above
10% threshold and net of eligible short positions) (negative amount) 0 0
54a thereof: new holdings not subject to transitional arrangements 0 0
54b thereof: holdings existing before 1 January 2013 and subject to transitional arrangements 0 0
55
Direct and indirect holdings of the Tier 2 instruments and subordinated loans of financial sector
entities where the institution has a significant investment in those entities (amount above 10%
threshold and net of eligible short positions) (negative amount) 0 0
56
Regulatory adjustments applied to Tier 2 in respect of amounts subject to pre-CRR treatment and
transitional treatments subject to phase-out as prescribed in the CRR (i.e. CRR residual amounts) –105
56a
Residual amounts deducted from Tier 2 capital with regard to deduction from Common Equity Tier1
capital during the transitional period pursuant to Art. 472 of the CRR –105
56a.1 thereof: shortfall of provisions to expected losses –105

Introduction Equity capital Risk-oriented overall bank management Specific risk management Appendix 9
Line A: Amount on the
day of disclosure
C: Residual
amount1
56a.2
thereof: CET1 instruments of financial sector entities where the institution does not have a
significant investment in those entities 0
56a.3
thereof: CET1 instruments of financial sector entities where the institution has a significant
investment in those entities 0
56b
Residual amount deducted from Tier 2 capital with regard to deduction from AT1 capital during the
transitional period pursuant to Art. 475 CRR 0
56b.1
thereof: AT1 capital of financial sector entities where the institution does not have a significant
investment in those entities 0
56b.2
thereof: AT1 capital of financial sector entities where the institution has a significant investment
in those entities 0
56c
Amount to be deducted from or added to Tier 2 capital with regard to additional deduction or
correction positions and deductions required pre CRR 0
56c.1 thereof: possible deduction or correction positions for unrealised losses 0
56c.2 thereof: possible deduction or correction positions for unrealised profits 0
56d Other Tier 2 capital elements or deductions 0
57 Total regulatory adjustments to Tier 2 capital –185
58 Tier 2 capital 5,677
59 Total capital (TC = Tier 1 + Tier 2) 32,171
59a
Risk-weighted assets in respect of amounts subject to pre-CRR treatment and transitional
treatments subject to phase-out as prescribed in CRR (i.e. CRR residual amounts) 326
59a.1 thereof: items not to be deducted from CET1 (CRR residual amounts) 215
59a.1.1 thereof: deferred tax assets subject to future profitability, net of related tax liabilities 198
59a.1.2 thereof: indirect holdings of own CET1 instruments 17
59a.1.3 thereof: items not to be deducted from CET1 capital positions (CRR residual amounts) 0
59a.1.4
thereof: reciprocal cross holdings of CET1 instruments, direct holdings of non-significant
investments in the capital of other financial sector entities 0
59a.2 thereof: items not to be deducted from AT1 capital positions (CRR residual amounts) 0
59a.2.1 thereof: indirect holdings of own AT1 instruments 0
59a.2.2
thereof: indirect holdings of non-significant investments in the AT1 capital of other financial
sector entities 0
59a.2.3
thereof: indirect holdings of significant investments in the AT1 capital of other financial sector
entities 0
59a.3 thereof: items not to be deducted from Tier 2 capital positions (CRR residual amounts) 0
59a.3.1 thereof: indirect holdings of own Tier 2 instruments 0
59a.3.2
thereof: indirect holdings of non-significant investments in the capital of other financial sector
entities 0
59a.3.3
thereof: indirect holdings of significant investments in the capital of other financial sector
entities 0
60 Total risk-weighted assets 190,527
10 Commerzbank Disclosure Report 2016
Line A: Amount on the
day of disclosure
C: Residual
amount1
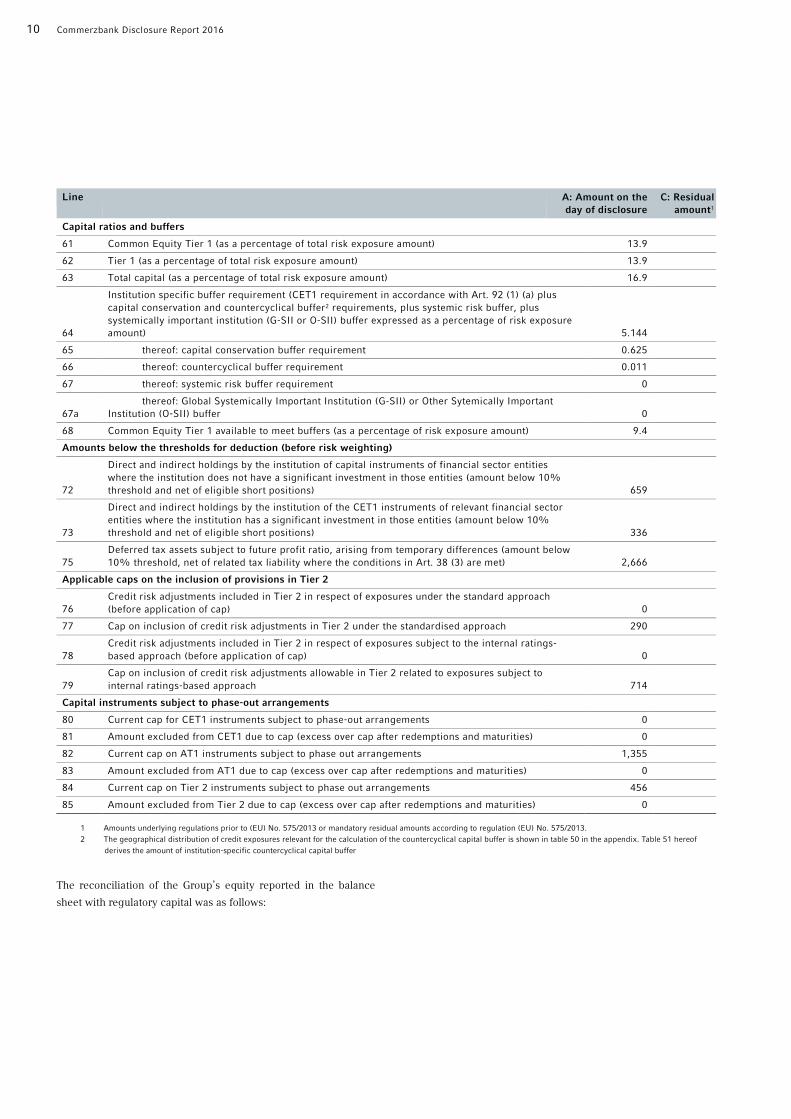
Capital ratios and buffers
61 Common Equity Tier 1 (as a percentage of total risk exposure amount) 13.9
62 Tier 1 (as a percentage of total risk exposure amount) 13.9
63 Total capital (as a percentage of total risk exposure amount) 16.9
64
Institution specific buffer requirement (CET1 requirement in accordance with Art. 92 (1) (a) plus
capital conservation and countercyclical buffer2 requirements, plus systemic risk buffer, plus
systemically important institution (G-SII or O-SII) buffer expressed as a percentage of risk exposure
amount) 5.144
65 thereof: capital conservation buffer requirement 0.625
66 thereof: countercyclical buffer requirement 0.011
67 thereof: systemic risk buffer requirement 0
67a
thereof: Global Systemically Important Institution (G-SII) or Other Sytemically Important
Institution (O-SII) buffer 0
68 Common Equity Tier 1 available to meet buffers (as a percentage of risk exposure amount) 9.4
Amounts below the thresholds for deduction (before risk weighting)
72
Direct and indirect holdings by the institution of capital instruments of financial sector entities
where the institution does not have a significant investment in those entities (amount below 10%
threshold and net of eligible short positions) 659
73
Direct and indirect holdings by the institution of the CET1 instruments of relevant financial sector
entities where the institution has a significant investment in those entities (amount below 10%
threshold and net of eligible short positions) 336
75
Deferred tax assets subject to future profit ratio, arising from temporary differences (amount below
10% threshold, net of related tax liability where the conditions in Art. 38 (3) are met) 2,666
Applicable caps on the inclusion of provisions in Tier 2
76
Credit risk adjustments included in Tier 2 in respect of exposures under the standard approach
(before application of cap) 0
77 Cap on inclusion of credit risk adjustments in Tier 2 under the standardised approach 290
78
Credit risk adjustments included in Tier 2 in respect of exposures subject to the internal ratings-
based approach (before application of cap) 0
79
Cap on inclusion of credit risk adjustments allowable in Tier 2 related to exposures subject to
internal ratings-based approach 714
Capital instruments subject to phase-out arrangements
80 Current cap for CET1 instruments subject to phase-out arrangements 0
81 Amount excluded from CET1 due to cap (excess over cap after redemptions and maturities) 0
82 Current cap on AT1 instruments subject to phase out arrangements 1,355
83 Amount excluded from AT1 due to cap (excess over cap after redemptions and maturities) 0
84 Current cap on Tier 2 instruments subject to phase out arrangements 456
85 Amount excluded from Tier 2 due to cap (excess over cap after redemptions and maturities) 0
1 Amounts underlying regulations prior to (EU) No. 575/2013 or mandatory residual amounts according to regulation (EU) No. 575/2013.
2 The geographical distribution of credit exposures relevant for the calculation of the countercyclical capital buffer is shown in table 50 in the appendix. Table 51 hereof
derives the amount of institution-specific countercyclical capital buffer
The reconciliation of the Group’s equity reported in the balance
sheet with regulatory capital was as follows:

Introduction Equity capital Risk-oriented overall bank management Specific risk management Appendix 11
Table 2: Reconciliation of equity as reported in the balance sheet with regulatory capital
Position
€m
Equity IFRS
(Phase in)1
Equity
FINREP2
Equity
COREP3
Subscribed capital 1,252 1,252 1,252
Capital reserve 17,192 17,192 17,192
Retained earnings 11,283 11,252 11,252
Silent participations 0 0 0
Actuarial profits/losses current year –378 –378 –378
Revaluation reserve –781 –783 –783
Valuation of cash flow hedges –97 –97 –97
Currency translation reserve –137 –134 –134
Distributable profit/loss from previous year (after suspension of retained earnings) 0 0 0
Distributable profit/loss from current year 279 321 321
Non-controlling interests 1,027 1,018 1,018
Equity as shown in balance sheet 29,640 29,643 29,643
Effects from debit valuation adjustments –177
Correction of revaluation reserve 313
Correction to cash flow hedges reserve 97
Correction to phase-in (IAS 19) 578
Correction to non-controlling interests (minority) –258
Goodwill –1,496
Intangible assets –1,206
Surplus in plan assets –231
Deferred tax assets from loss carryforwards –297
Shortfall due to expected loss –420
Prudential valuation –367
Own shares –33
First loss positions from securitisations –301
Advance payment risks –1
Deduction of offset components of Additional Tier 1 capital (AT1) 1,066
Deferred tax assets from temporary differences which exceed the 10% threshold –166
Dividend accrual 0
Others and rounding –250
CET1 26,494
Hybrid capital 1,167 1,167 1,167
Not eligible issues –23
Others, especially hedge accounting, interests, agio, disagio –78
Additional Tier 1 before deductions 1,066
Deduction of offset components of Additional Tier 1 capital (AT1) –1,066
Additional Tier 1 after deductions 0
Subordinated capital 9,802 9,802 9,802
Decreased offsetting in the last 5 years of residual maturity –3,569
Not eligible non-controlling interests –45
Others, especially hedge accounting, interests, agio, disagio –405
Tier 2 before deductions 5,782
Shortfall due to expected loss –105
Tier 2 after deductions 5,677
Own funds 40,609 40,612 32,171
1 Equity as shown in balance sheet. 2 Financial reporting, equity as shown in balance sheet, regulatory group of consolidated companies. 3 Common solvency ratio reporting, regulatory capital.

12 Commerzbank Disclosure Report 2016
For Commerzbank as a banking group as defined in section 10a
KWG and Article 11 CRR the capital relevant to the determination
of regulatory capital is based on the consolidated financial state-
ments under FINREP which is prepared based on the Groups bal-
ance sheet according to IFRS. To reconcile the requirements for
regulatory capital with the slightly different amounts reported in
the financial statements, capital as determined under IFRS was
adjusted with the aid of so-called prudential filters.
There was no under-capitalisation of subsidiaries subject to the
deduction method during the period under review.
With Basel 3, the Basel Committee on Banking Supervision
published among other things comprehensive rules on the com-
ponents of shareholders’ equity and ratios as well as the manage-
ment of liquidity risk. The Capital Requirements Directive and
Regulation (CRD-IV) package of measures, constituting the Euro-
pean implementation of Basel 3, has been in force since 1 January
2014. The more stringent capital requirements will be phased in
by 2019. Since then, numerous supplementary regulations have
been published by the European Banking Authority (EBA) in par-
ticular, and are gradually entering into force. This will continue in
2017 and in subsequent years. Commerzbank has prepared itself
for the more stringent capital adequacy requirements by taking a
number of steps.
Capital requirements
The capital requirements set out below relate to the Commerzbank
Group and include details of the requirements relating to the ma-
terial consolidated units included in this Disclosure Report. The
figures are the same with regard to content as in the capital ade-
quacy reports submitted to the Deutsche Bundesbank under Basel
3 Pillar 1.
Capital requirements by risk type
Of the overall capital requirement 77% relates to default risk posi-
tions. These include balance sheet, off-balance-sheet and deriva-
tive positions, as well as advance payment risk positions. Of the
total capital requirement for default risks, around €0.7bn relates to
the trading book. Commerzbank uses the Advanced Internal Rat-
ings Based Approach (advanced IRBA; in the following referred to
as IRBA) to determine the regulatory capital required. Article 150
CRR gives the option of partial use. The Standardised Approach to
Credit Risk (SACR) may be used for part of the portfolios.
The Commerzbank Group and accordingly the group compa-
nies included in the disclosure are, as IRBA banks as defined in
Article 148 (5) CRR, generally obliged to value investments in ac-
cordance with the IRBA rules. For investments entered into prior
to 1 January 2008, Commerzbank has opted to apply grandfather-
ing. These investment positions are temporarily excluded from the
IRBA and treated in accordance with the SACR rules. They are
given a risk weighting of 100%. The CRR also allows items to be
permanently exempted from the IRBA. Since 31 December 2009
Commerzbank has applied the option pursuant to section 70 sen-
tence 1 no. 9b of the German Solvency Regulation (SolvV) and Ar-
ticle 150 CRR. All investment positions which do not fall under the
above-mentioned temporary grandfathering option are valued us-
ing the permanent partial use according to SACR.
Securitised positions in the banking book and counterparty de-
fault risk positions from market value hedges in connection with
securitisations also fall under the category of default risk positions
subject to a capital requirement. Commerzbank treats these ac-
cording to the IRBA and SACR rules for securitised positions. Cap-
ital deduction items of securitisations directly reduce the liable
equity and thus are not included in the capital requirements.
Pursuant to Article 92 (3) b) and c) CRR, adequate capital must
be set aside for market risk positions. Commerzbank uses an in-
ternal market risk model to calculate the regulatory capital re-
quirement. This affects both the equity price and interest rate-
related risk positions in the trading book as well as the total of cur-
rency positions and commodity positions. The standardised ap-
proaches are applied for smaller units in the Commerzbank Group
in accordance with the partial use option.
To calculate the capital adequacy requirement for operational
risks, Commerzbank uses the advanced measurement approach
(AMA).

Introduction Equity capital Risk-oriented overall bank management Specific risk management Appendix 13
Table 3: Capital requirements and risk weighted assets by risk type
€m 31.12.2016 31.12.2015
Capital
requirements
Risk weighted
assets
Capital
requirements
Risk weighted
assets
Default risks
Standardised Approach to Credit Risk (SACR) 1,448 18,097 1,734 21,679
Central governments or central banks 9 114 18 224
Regional or local authorities 137 1,710 169 2,114
Public sector bodies 26 323 15 185
Multilateral development banks 0 0 0 0
International organisations 0 0 0 0
Banks 47 591 81 1,018
Companies 464 5,805 658 8,227
thereof: SMEs 33 413 44 550
Retail banking 72 900 75 933
thereof: SMEs 3 35 1 11
Exposures secured by real estate property 44 544 55 682
thereof: SMEs 1 9 0 4
Defaulted positions 43 534 33 411
Particularly high risk positions 4 52 4 55
Covered debt instruments 2 20 2 20
Banks/companies with short-term external rating 0 0 0 0
Collective investment undertakings 44 549 45 564
Other exposures 556 6,954 580 7,245
Advanced approach (IRBA) 9,529 119,113 10,170 127,130
Central governments or central banks 439 5,482 545 6,811
Banks 1,684 21,046 1,845 23,066
Companies 6,018 75,224 6,348 79,346
thereof specialised lending 1,663 20,794 1,715 21,436
thereof SMEs 450 5,630 571 7,135
Retail banking 1,166 14,575 1,250 15,627
Secured by real estate property 516 6,456 754 9,425
thereof SMEs 23 285 28 344
Qualified revolving 38 477 41 508
Other 611 7,642 456 5,695
thereof SMEs 187 2,343 179 2,238
Other non-loan based assets 223 2,787 182 2,280
Securitisation risks 227 2,838 223 2,782
Securitised positions IRBA 121 1,514 93 1,163
thereof resecuritisations 1 10 4 50
Securitisation positions SACR 106 1,325 129 1,619
thereof resecuritisations 0 0 1 7
Investment risks 97 1,208 85 1,066
Investment positions SACR (permanent partial use) 97 1,208 85 1,066
thereof investments with method contin. (grandfathering) 9 111 12 148
Investment positions IRBA 0 0 0 0
Processing risk 1 12 0 6
Contribution to default fund 13 164 1 7
Non-material entities 436 5,448 539 6,738
Total default risk 11,750 146,880 12,753 159,408
14 Commerzbank Disclosure Report 2016
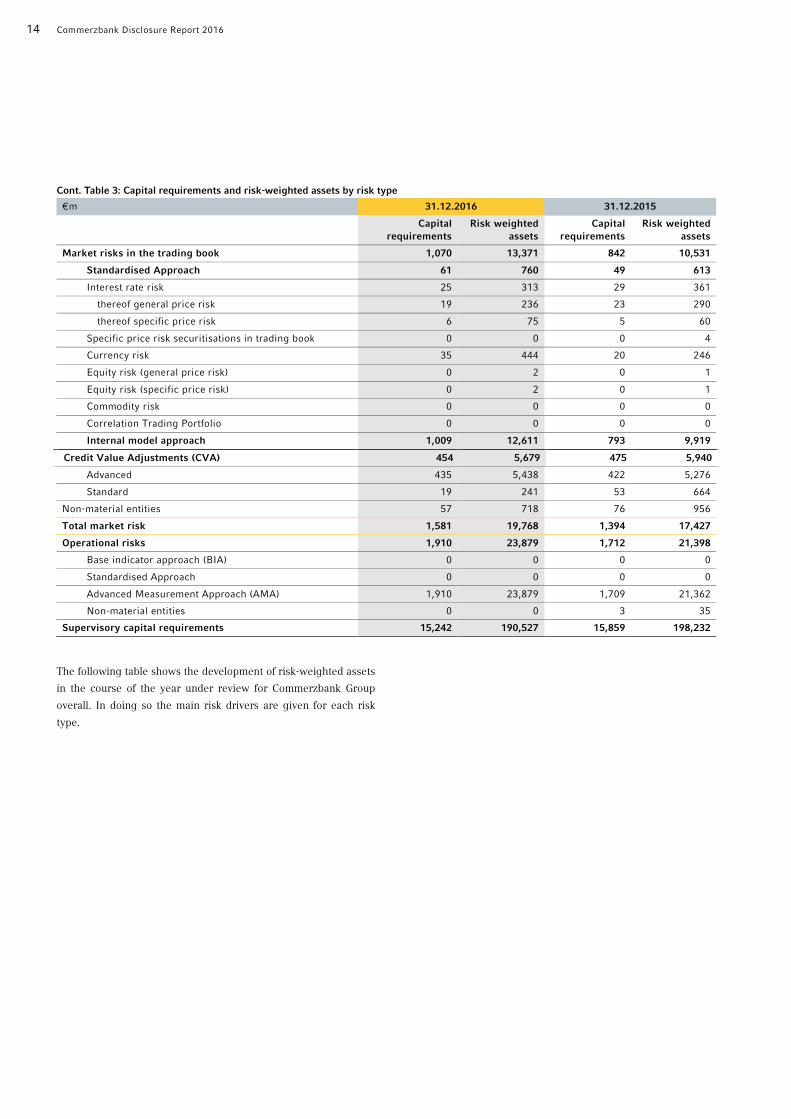
Cont. Table 3: Capital requirements and risk-weighted assets by risk type
€m 31.12.2016 31.12.2015
Capital
requirements
Risk weighted
assets
Capital
requirements
Risk weighted
assets
Market risks in the trading book 1,070 13,371 842 10,531
Standardised Approach 61 760 49 613
Interest rate risk 25 313 29 361
thereof general price risk 19 236 23 290
thereof specific price risk 6 75 5 60
Specific price risk securitisations in trading book 0 0 0 4
Currency risk 35 444 20 246
Equity risk (general price risk) 0 2 0 1
Equity risk (specific price risk) 0 2 0 1
Commodity risk 0 0 0 0
Correlation Trading Portfolio 0 0 0 0
Internal model approach 1,009 12,611 793 9,919
Credit Value Adjustments (CVA) 454 5,679 475 5,940
Advanced 435 5,438 422 5,276
Standard 19 241 53 664
Non-material entities 57 718 76 956
Total market risk 1,581 19,768 1,394 17,427
Operational risks 1,910 23,879 1,712 21,398
Base indicator approach (BIA) 0 0 0 0
Standardised Approach 0 0 0 0
Advanced Measurement Approach (AMA) 1,910 23,879 1,709 21,362
Non-material entities 0 0 3 35
Supervisory capital requirements 15,242 190,527 15,859 198,232
The following table shows the development of risk-weighted assets
in the course of the year under review for Commerzbank Group
overall. In doing so the main risk drivers are given for each risk
type.
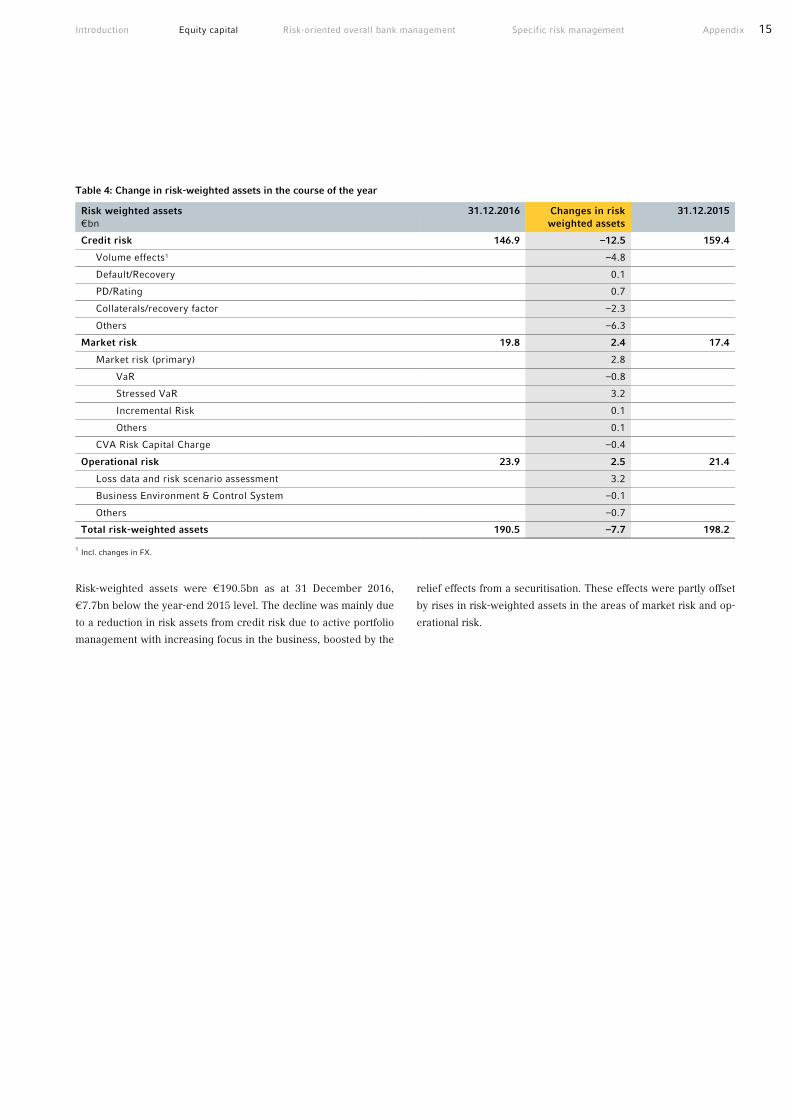
Introduction Equity capital Risk-oriented overall bank management Specific risk management Appendix 15
Table 4: Change in risk-weighted assets in the course of the year
Risk weighted assets
€bn
31.12.2016 Changes in risk
weighted assets
31.12.2015
Credit risk 146.9 –12.5 159.4
Volume effects1 –4.8
Default/Recovery 0.1
PD/Rating 0.7
Collaterals/recovery factor –2.3
Others –6.3
Market risk 19.8 2.4 17.4
Market risk (primary) 2.8
VaR –0.8
Stressed VaR 3.2
Incremental Risk 0.1
Others 0.1
CVA Risk Capital Charge –0.4
Operational risk 23.9 2.5 21.4
Loss data and risk scenario assessment 3.2
Business Environment & Control System –0.1
Others –0.7
Total risk-weighted assets 190.5 –7.7 198.2
1 Incl. changes in FX.
Risk-weighted assets were €190.5bn as at 31 December 2016,
€7.7bn below the year-end 2015 level. The decline was mainly due
to a reduction in risk assets from credit risk due to active portfolio
management with increasing focus in the business, boosted by the
relief effects from a securitisation. These effects were partly offset
by rises in risk-weighted assets in the areas of market risk and op-
erational risk.
16 Commerzbank Disclosure Report 2016
Commerzbank defines risk as the danger of possible losses or
profits foregone due to internal or external factors. In risk man-
agement, we normally distinguish between quantifiable and non-
quantifiable types of risk. Quantifiable risks are those to which a
value can normally be attached in financial statements or in regu-
latory capital requirements, while non-quantifiable types of risk
include reputational and compliance risk.
Risk statement
According to Article 435 (1) e) and f) CRR, the risk statement is a
declaration approved by the management body providing assur-
ance that the risk management systems put in place are adequate
and giving a description of the institution’s general risk profile as-
sociated with the business strategy. The approval by the Board of
Managing Directors was given together with the approval of the
Disclosure Report.
Banks are facing major challenges due to the persistently diffi-
cult interest rate environment, regulatory initiatives, increasingly
tough competition and digitalisation, which demands significant
investment. The fundamental aim of the new focused business
model is to position Commerzbank as a leading, fair and compe-
tent bank with two strong customer segments: “Private and Small-
Business Customers” and “Corporate Clients”. Our focused growth
strategy is based on digitalisation and an attractive, simplified
product portfolio with a wide geographic presence. At the same
time, digitalisation and a reduction in complexity will cut costs
considerably. Non-strategic assets will continue to be divested,
freeing up capital. Commerzbank will become simpler and more
efficient and gain clear competitive advantages through the speed
of digitalisation.
Our portfolio is already clearly dominated by default risks,
which account for more than 65% of economically required capi-
tal, with market risk accounting for 28%. Our two main markets,
Germany and Poland, in turn account for 57% of the credit expo-
sure.
In the current difficult banking environment we wish to achieve
a cost/income ratio (CIR) of under 66% and a net return on tangi-
ble equity (RoTE) of more than 6% by the end of 2020 through
our strategy.
Commerzbank’s business model, defined as part of the busi-
ness strategy, is embedded as a set of objectives in the overall risk
strategy. This takes into account exogenous factors, such as risks
from the macroeconomic environment, and endogenous factors, in
particular the results of the annual risk inventory. In the risk inven-
tory process, all economically significant quantifiable and unquan-
tifiable risks arising from our business activities are assessed in
terms of their materiality for risk management. For all material risk
types, corresponding sub-risk strategies are drawn up for the pur-
poses of further detailed treatment and operationalisation.
Risk appetite refers to the maximum risk, in terms of both the
amount and structure, which the Bank is willing and able to incur
in pursuing its business objectives, without exposing itself to exis-
tential threats (risk tolerance). The guiding principle regarding
risk appetite is to ensure that the Commerzbank Group has suffi-
cient liquidity and capital resources on a sustained basis. Banks’
core functions as transformers of liquidity and risk result in inevi-
table threats that can in extreme cases endanger the continued
existence of the institution. For Commerzbank, in view of its busi-
ness model, these inherent existential threats include e.g. the de-
fault of Germany, Poland, one or more of the other major EU coun-
tries (France, Italy, Spain or the UK, although Brexit is not deemed
to be a default) or the default of the USA. Others include a deep
recession lasting several years with serious repercussions for the
German economy, a bank run and the collapse of global clearing
houses or the foreign exchange markets, possibly triggered by a
cyber-attack. In general, cyber risk is an accepted, inherent, exis-
tential risk for Commerzbank in the context of increasing digitali-
sation of the business environment.
Risk appetite is quantified in terms of risk limits and escalation
mechanisms for liquidity and capital management, and by means
of comprehensive early warning systems. Limits and guidelines
are broken down across the risk types, segments and portfolios.
They form an integral part of ongoing management and monitor-
ing. In addition, regular portfolio-specific stress tests are also car-
ried out. Our liquidity management is based on the liquidity gap
profile, which determines the expected future available net liquidi-
ty from positions both on and off the balance sheet over time sub-
ject to various scenario assumptions. In addition, under Basel 3
the leverage ratio is used as a new and non-risk-sensitive indicator
of indebtedness. Compliance with economic risk-bearing capacity
requirements and the regulatory capital ratios is reviewed by
means of an early warning system in both a forecast scenario and
an adverse scenario. This is based on a gone concern approach
aimed at protecting unsubordinated lenders. The approach is sup-
plemented by scenarios aimed at ensuring the institution’s contin-
uing existence (going concern perspective).
Risk-oriented overall bank management
Introduction Equity capital Risk-oriented overall bank management Specific risk management Appendix 17
Our Common Equity Tier 1 ratio was 13.9% at the end of 2016
under the transitional rules, or 12.3% under full application of Ba-
sel 3. For the transitional period we are aiming for a CET1 ratio of
at least 12%, which should rise to more than 13% by the end of
2020. The risk-bearing capacity (RBC) ratio of 178%
get: >100%) comfortably meets risk-bearing capacity require-
ments. Loan loss provisions were at €900m in 2016, €204m higher
than in the previous year (€696m). The expected increase in loan
loss provisions as compared to the previous year is still due to the
tough environment in the ship finance area. Here, we expect fur-
ther charges in the year 2017. The loan loss provision in the seg-
ments Private and Small-Business Customers and Corporate Cli-
ents is expected to remain on the level of the year 2016. For ship
financing we are expecting a level of €450m to €600m. In the case
of an unexpected massive worsening in the geopolitical or the
overall economic conditions or in the event of a default of large
customers, a significantly higher loan loss provision might be re-
quired.
Comprehensive, prompt, transparent and methodically ade-
quate risk measurement is vital for ensuring that the Com-
merzbank Group has sufficient liquidity and capital resources on a
permanent basis. Our business and risk strategy is made measura-
ble, transparent, and controllable by the processes used. The risk
measurement methods and models that we use comply with the
latest common banking industry standards and are regularly re-
viewed by risk control, internal audit, our external auditors and the
German and European supervisory authorities. The processes en-
sure that our risk-bearing capacity is maintained on a lasting basis.
We consider our risk management methods and processes to be
appropriate and effective.
Risk management organisation
Risk management at Commerzbank is an overarching bank mis-
sion and follows the principle of the “three lines of defence”. Each
unit (segments and functions) forms the first line of defence within
its framework of operative responsibility. For credit, market and
liquidity risk the responsibility for the second line of defence lies
with the Chief Risk Officer (CRO). The CRO is responsible for im-
plementing the Group’s risk policy guidelines laid down by the
Board of Managing Directors, and for the controlling of operation-
al risks. For other risks (e.g. IT risks or legal risks) the responsibil-
ity for the second line of defence may lie outside the risk function
depending on the kind of risk. The third line of defence is internal
audit.
The CRO is responsible for risk management and regularly re-
ports to the Board of Managing Directors and the Risk Committee
of the Supervisory Board on the risk situation within the Group.
The responsibilities within the risk function are split between
Credit Risk Management of the core business segments Private
and Small-Business Customers (PSBC) and Corporate Customers
(CC), Credit Risk Management Asset & Capital Recovery (ACR),
Intensive Care, Market Risk Management as well as Risk Control-
ling and Capital Management. In all segments except for the ACR
segment, credit risk management is separated into a performing
loan area and Intensive Care, while in ACR it has been merged into
a single unit across all rating classes. All divisions have a direct
reporting line to the CRO. The heads of these risk management
divisions together with the CRO make up the Risk Management
Board within Group Management.
The Board of Managing Directors has sole responsibility for
fundamental strategic decisions. The Board of Managing Directors
has delegated operational risk management to committees. Under
the relevant rules of procedure, these are the Group Credit Com-
mittee, the Group Market Risk Committee, the Group OpRisk
Committee and the Group Strategic Risk Committee, which de-
cides on risk issues of an overarching nature. The CRO chairs all
these committees and has the right of veto. In addition, the CRO is
a member of the Asset Liability Committee.
The Chairman of the Board of Managing Directors (CEO) bears
responsibility for controlling risks related to the Bank’s business
strategy, reputational risks and legal risks. The Chief Financial Of-
ficer (CFO) assumes responsibility for controlling compliance risk
with particular regard to investor protection, insider trading guide-
lines and money laundering. The Chief Operating Officer (COO) is
responsible for monitoring personnel and IT risks. Further details
on the risk management organisation can be found in the Risk Re-
port in the Annual Report 2016.
Risk strategy and risk management
The overall risk strategy, together with the business strategy, de-
fines the strategic risk management guidelines for the develop-
ment of Commerzbank’s investment portfolio. Furthermore, the
risk appetite is set as the maximum risk that the Bank is prepared
and able to accept while following its business objectives without
exposing itself to existential threats over and above the risks in-
herent in the business. The guiding idea is to ensure that the
Group holds sufficient liquidity and capital. Based on these re-
quirements, suitable limits for the risk resources capital and li-
quidity reserve available to the Group are defined. The overarch-
ing limits of the overall risk strategy are consistent with the
restructuring indicators of the recovery plan.
18 Commerzbank Disclosure Report 2016
Banks’ core functions as transformers of liquidity and risk re-
sult in inevitable threats that can in extreme cases endanger the
continued existence of the institution. For Commerzbank, in view
of its business model, these inherent existential threats include the
default of Germany, Poland, one or more of the other major EU
countries (France, Italy, Spain or the UK, although Brexit is not
deemed to be a default) or the default of the USA. Others include a
deep recession lasting several years with serious repercussions for
the German economy, a bank run and the collapse of global clear-
ing houses or the foreign exchange markets, possibly triggered by
a cyber-attack. In general, cyber risk is an accepted, inherent, ex-
istential risk for Commerzbank in the context of increasing digital-
isation. These existential threats are taken on board deliberately in
the pursuit of the business targets. It may be necessary to adjust
the business model and hence the business and risk strategies in
the medium and long term if the Board of Managing Directors’
assessment of these threats to Commerzbank changes substantial-
ly. To the extent that it is able to do so, Commerzbank makes early
preparations in anticipation of forthcoming changes in regulatory
requirements and accounting standards. Such changes and their
(retrospective) interpretation may have lasting implications for –
and even threaten the survival of – Commerzbank’s business mod-
el. Commerzbank takes these “regulatory risks” into account be-
cause there are many cases where there is no option to mitigate or
manage them.
The overall risk strategy covers all material risks to which
Commerzbank is exposed. It is detailed further in the form of sub-
risk strategies for the risk types which are material. These are then
specified and made operational through policies, regulations and
instructions/guidelines. By means of the risk inventory process –
which is to be carried out annually or on an ad hoc basis as re-
quired – Commerzbank ensures that all risks of relevance to the
Group are identified and their materiality is assessed. The assess-
ment of the materiality of a risk is based on whether its occurrence
could have a major direct or indirect negative impact on the
Bank’s risk-bearing capacity.
As part of the planning process, the Board of Managing Direc-
tors decides the extent to which the risk coverage potential of the
Group should be utilised. On that basis, individual types of quanti-
fiable risk contributing to the capital demand are limited in a sec-
ond stage. A capital framework is allocated to the management-
relevant units through the planning process. Compliance with lim-
its and guidelines is monitored during the year, and management
measures are put in place where required. In addition, further
qualitative and quantitative early warning indicators are estab-
lished in the overall risk strategy. Potential negative developments
can be identified at an early stage with the help of these indicators.
One of the primary tasks of risk management is the avoidance
of risk concentrations. These can arise from the synchronous
movement of risk positions both within a single risk type (intra-
risk concentrations) and across different risk types (inter-risk con-
centrations). The latter result from common risk drivers or from
interactions between different risk drivers of different risk types.
By establishing adequate risk management and controlling
processes, Commerzbank provides for the identification, assess-
ment, management, monitoring and communication of substantial
risks and related risk concentrations. This ensures that all Com-
merzbank-specific risk concentrations are adequately taken into
account. Stress tests are regularly used to ensure transparency
regarding risk concentrations. Management is regularly informed
about the results of the analyses so that the potential risk of losses
can be avoided in good time.
The Group Risk & Capital Monitor (GRCM) is the monthly, con-
trolling oriented risk report for capital, credit risk, market risk, li-
quidity and OpRisk related subjects of Commerzbank’s risk man-
agement. It comprehensively presents all risk types, including the
economic and regulatory risk-bearing capacity, for Commerzbank
Group. The aim of the report is to inform the Board of Managing
Directors as well as the Supervisory Board’s Risk Committee in a
transparent and comprehensive way, to highlight important devel-
opments from a risk point of view and to manage steering impuls-
es. Particularly, limits and guidelines of the Group Risk Strategy
are monitored by the report.
Commerzbank has adopted a code of conduct that defines
binding minimum standards for Commerzbank’s corporate re-
sponsibility, its dealings with customers, business partners and
colleagues, and its day-to-day business. It goes without saying that
the Bank complies with relevant laws, regulatory requirements,
industry standards and internal rules, and this therefore forms a
particularly important part of its risk culture. It demands appropri-
ate and courageous conduct in compliance with rules, and any
failure to comply with rules is penalised.
The main pillar of the Bank’s overall risk management and cul-
ture is the concept of “three lines of defence”, which is a core el-
ement of the Corporate Charter. Under this “three lines of de-
fence” principle, protecting against undesirable risks is an activity
that is not restricted to the risk function. Each unit (segment or
function) forms the first line of defence within its area of opera-
tional responsibility and is responsible for identifying and manag-
ing risks within it while complying with the prescribed risk stand-
ards and policies. For example, the front office forms the first line
of defence in all business decisions and has to take risk aspects
into account in reaching them. The second line of defence for each
type of risk lays down standards for appropriate management of
risks of that type, monitors this and ensures the application of
such standards, and analyses and evaluates the risks. The risk
function forms the second line of defence against credit and mar-
ket risks associated with business decisions. Particularly for credit
risk, this includes involvement in the credit decision process
through means of a second vote. Units outside the risk function
(such as Group Compliance and Group Finance) also operate as
Introduction Equity capital Risk-oriented overall bank management Specific risk management Appendix 19
the second line of defence for certain risk types. The third line of
defence is internal audit.
Under the provisions of the Remuneration Ordinance for Insti-
tutions (Institutsvergütungsverordnung), every year Commerzbank
identifies, in a regular process, those employees whose actions
have a material impact on Commerzbank’s overall risk profile (risk
takers). These risk takers are identified in accordance with regula-
tory requirements on the basis of their function within the organi-
sation (including management level) and their function-related
activities. Special regulations apply to risk takers as regards meas-
uring their performance and the manner in which their variable
remuneration is paid out. Information in relation to the remunera-
tion system of Commerzbank Group according to Article 450 CRR
can be found in the Remuneration Report within the Annual Re-
port 2016 and in the separate Remuneration Report on the inter-
net pages of Commerzbank.
The nomination committee of Commerzbank’s Supervisory
Board supports the Supervisory Board in identifying candidates to
fill positions on bank management bodies. In doing so it considers
the fair balance and variety in knowledge, skills and experiences
of all members of the Board of Managing Directors, designs a job
description including the applicant profile and specifies the ex-
penditure of time related to the job. The Supervisory Board will
ensure that greater attention is paid to diversity and in particular
in relation to seniority, educational and professional background
and will aim at achieving an appropriate degree of female repre-
sentation.
With regard to the ratio legally to be set for women on the
Board of Managing Directors, the Supervisory Board has set itself
the objective of appointing women. It will therefore monitor the
measures taken by the Board of Managing Directors to increase
the percentage of women at management levels one and two as a
way of systematically producing suitable female candidates for
appointment to the Board of Managing Directors. The Supervisory
Board of Commerzbank set the target ratio to zero as at 30 June
2017 for women on the Board of Managing Directors. In view of
the present circumstances, the Supervisory Board was unable to
set a higher binding target ratio for this period. It also takes the
view that positions should be filled solely on the basis of qualifica-
tion and expertise, regardless of gender.
The efforts of the Board of Managing Directors and the Super-
visory Board in regard of qualifying women for an appointment to
the Board of Managing Directors were successful. On 6 March
2016 the Supervisory Board nominated Ms Dr. Orlopp for the
Board of Managing Directors. Before, Ms Dr. Orlopp was Division-
al Board Member of Group Development & Strategy at Com-
merzbank. The effectiveness of the nomination requires superviso-
ry approval which is expected for November 2017. Until approval
is granted, Ms Dr. Orlopp will take her responsibilities as fully au-
thorised representative of Commerzbank. After the appointment to
the Board, the ratio of females in the Board will stand at 14.3%.
Additional information on corporate governance according to
Article 435 (2) CRR are provided in the Annual Report 2016 (Cor-
porate Governance Report) and on the internet pages of Com-
merzbank.
Information on the indicators of global systemic importance
according to Article 441 CRR is given in a separate disclosure on
the internet pages of Commerzbank in the section Bondholder in-
formation/Transparency disclosures.

20 Commerzbank Disclosure Report 2016
Risk-bearing capacity and stress
testing
Risk-bearing capacity analysis is a key part of overall bank man-
agement and Commerzbank’s ICAAP. The purpose is to ensure
that sufficient capital is held at all times.
Commerzbank monitors risk-bearing capacity using a gone
concern approach which seeks primarily to protect unsubordinat-
ed lenders. This objective should be achieved even in the event of
extraordinarily high losses from an unlikely extreme event. The
gone concern analysis is supplemented here by elements aimed at
ensuring the institution’s continuing existence (going concern
perspective).
When determining the economically required capital, allow-
ance is made for potential unexpected fluctuations in value. Where
such fluctuations exceed forecasts, they must be covered by the
available economic capital to absorb unexpected losses (economic
risk coverage potential). The quantification of the economic risk
coverage potential is based on a differentiated view on the ac-
counting values of assets and liabilities and involves economic
valuations of certain balance sheet items.
The capital requirement for the risks taken is quantified using
the internal economic capital model. When assessing the econom-
ic capital required, allowance is made for all the types of risk at
the Commerzbank Group that are classified as material and quanti-
fiable in the annual risk inventory. The economic risk approach
therefore also comprises risk types that are not included in the
regulatory requirements for banks’ capital adequacy. The model
also reflects diversification effects incorporating all types of risk.
The confidence level of 99.91% in the economic capital model is
in line with the underlying gone concern assumptions and ensures
the economic risk-bearing capacity concept is internally consistent.
The quantifiable risks in the economic capital model can be divid-
ed into default risk, market risk, operational risk and (although not
shown separately in table 5 below) business risk, property value
change risk, investment portfolio risk and reserve risk. Business
risk is the risk of a potential loss resulting from discrepancies be-
tween actual income and expense and the respective budgeted
figures. Business risk is considered as a deductible amount in risk
coverage potential. Investment portfolio risk indicates the risk of
an unexpected fall in the value of unlisted investments. Property
value change risk is the risk of an unexpected fall in the value of
owned property which is either already booked as an asset in the
Group’s balance sheet or which can be capitalised during the next
twelve months by contractually assured obligations with option
character (especially real estate). Reserve risk is the risk of addi-
tional charges being incurred on the portfolio of loans already in
default through the creation of additional loan loss provisions. Al-
lowance is made for this risk when considering risk-bearing ca-
pacity by means of a risk buffer. The results of the risk-bearing
capacity analysis are shown using the risk-bearing capacity ratio
(RBC ratio), indicating the excess of the risk coverage potential in
relation to the economically required capital.
The risk-bearing capacity is monitored and managed monthly
at Group level. Risk-bearing capacity is deemed to be assured as
long as the RBC ratio is higher than 100%. In 2016, the RBC ratio
was consistently above 100% and stood at 178% on 31 December
2016. The decrease in the RBC ratio compared with December
2015 is mainly due to the enhancements of the market risk meth-
ods as well as the market-related developments in the Public Fi-
nance portfolio. Although the RBC ratio has fallen since
31 December 2015, it still remains at a high level.
Table 5: Group’s risk-bearing capacity
Risk-bearing capacity Group | €bn 31.12.2016 31.12.2015
Economic risk coverage potential1 30 30
Economically required capital2 17 15
thereof for credit risk 11 11
thereof for market risk 5 3
thereof for operational risk 2 2
thereof diversification effects –2 –2
RBC ratio3 178% 193%
1 Including potential deductible amounts for business risk.
2 Including property value change risk, risk of unlisted investments and reserve risk.
3 RBC ratio = economic risk coverage potential/economically required capital
(including risk buffer).
The risk-bearing capacity and stress testing concept is subject to
an annual internal review and is refined on an ongoing basis. The
development of the regulatory environment is also taken into ac-
count.
Commerzbank uses macroeconomic stress tests to review the
risk-bearing capacity in the event of assumed adverse changes in
the economic environment. The scenarios on which they are based
take into account the interdependence in development between
the real and financial economies and extend over a time horizon of
at least two years. They are updated quarterly and approved by the
Asset Liability Committee (ALCO). The scenarios describe an ex-
traordinary but plausible adverse development in the economy,
focusing in particular on portfolio priorities and business strate-
gies of relevance to Commerzbank. The scenario simulation is run
monthly using the input parameters of the economic capital re-
quirements calculation for all material and quantifiable risk types.
In addition to the capital required, the profit and loss calculation is
also subjected to a stress test based on the macroeconomic sce-
narios. Based on this, changes in the risk coverage potential are
simulated. Whereas the RBC ratio is embedded into Com-
merzbank’s limit system, guidelines for risk-bearing capacity are
set as an early warning system in the stressed environment. The
ongoing monitoring of the limits and guidelines is a key part of

Introduction Equity capital Risk-oriented overall bank management Specific risk management Appendix 21
internal reporting. Defined escalations are triggered if the limit is
breached.
In addition to the regular stress tests, “reverse stress tests” are
implemented annually at Group level. Unlike regular stress testing,
the result of the simulation – a sustained threat to the Bank – is
determined in advance. The aim of the analysis process in the re-
verse stress test is to improve the transparency of Bank-specific
risk potential and interactions of risk by identifying and assessing
extreme scenarios and events. On this basis, for instance, action
areas in risk management including the regular stress tests can be
identified and taken into account in the ongoing development ef-
forts.

22 Commerzbank Disclosure Report 2016
Specific risk management
Default risk
Default risk is defined as the risk of losses sustained or profits
foregone due to the default of a counterparty. It is a quantifiable
material risk and includes the material sub-risk types of credit de-
fault risk, issuer risk, counterparty risk, country and transfer risk,
dilution risk and reserve risk.
Risk management
Strategy and organisation
The credit risk strategy is the partial risk strategy for default risks
and is derived from the overall risk strategy. It is embedded in the
ICAAP process of the Commerzbank Group and forms a link be-
tween the Bank’s overall risk management across all risk types and
the operationalisation of default risk management. The overriding
aim is to ensure the adequate structural risk quality of the credit
portfolio. To this end, the credit risk strategy defines the credit risk
appetite, specifies risk strategy priorities, provides an overview of
the material credit risk management concepts and thereby plays
an integral part in maintaining the Group’s risk-bearing capacity.
The credit risk strategy makes use of quantitative and qualitative
management tools that give decision-makers clear guidance on
both portfolio management and decisions in specific cases. Quan-
titative credit risk strategy guidelines limit risks with regard to
poorer credit ratings and exposures with high loss-at-default con-
tributions (concentration management) and for selected sub-
portfolios. Detailed arrangements for operationalising the guide-
lines for selected sub-portfolios are set out in separate portfolio
policies. In addition, qualitative management guidelines in the
form of credit policies define the target business of the Bank. At
the level of individual transactions, they regulate the transaction
type with which the risk resources provided are to be used. These
credit policies are firmly embedded in the credit process: transac-
tions which do not meet the requirements are escalated through a
fixed competence regulation.
The Group Credit Committee is the topmost decision-making
committee for operative credit risk management, comprising two
represenatives each from the back office and front office. It takes
decisions in line with the competencies delegated to it by the full
Board of Managing Directors and is generally responsible for the
management of all credit risk. The Group Credit Committee acts
on the basis of the Credit Risk Strategy in force.
Underneath the Group Credit Committee, sub-credit commit-
tees are established, respectively acting for C&FISP (Corporates &
Financial Institutions & Special Products), P (Private & Small
Business Customers) and IC (Intensive Care) on basis of their in-
ternal rules and procedures and within the competencies dele-
gated by the Board of Managing Directors. They are made up of
at least two representatives of the segments and two representa-
tives of Group Risk Management. The sub-credit committees are
generally in charge of managing all credit risks of the sub-
portfolios they take responsibility for and are authorised to fur-
ther delegate specific credit decisions in accordance with their
competencies
Independent back office units are responsible for the operative
credit risk management on portfolio and individual case level. The
responsibilities are separated between the performing loan area
on the one hand and Intensive Care on the other.
All credit decisions in the performing loan area are risk/return
decisions. The front and back office take joint responsibility for
risk and return from an exposure, with the front office having pri-
mary responsibility for the return, and the back office for the risk.
Accordingly, neither office can be overruled in its primary respon-
sibility in the lending process.
Higher-risk customers of the operative segments Private and
Small Business Customers and Corporate Clients are handled by
specialist Intensive Care areas. The customers are moved to these
areas as soon as they meet defined criteria for assignment or
mandatory transfer. The principal reasons for assignment to Inten-
sive Care areas are criteria relating to number of days overdrawn,
together with event-related criteria such as rating, third-party en-
forcement measures or credit fraud. Intensive Care decides on fur-
ther action based on the circumstances of individual cases. Cus-
tomers must be transferred to Intensive Care if they are in default
(for example due to insolvency). This graduated approach ensures
that higher-risk customers can continue to be managed promptly
by specialists in a manner appropriate to the risks involved and in
defined standardised processes.
In the ACR segment, by contrast, there is no separation of re-
sponsibilities between the performing loan area and Intensive Care.
Credit risk management here has been merged into one unit
across all rating classes.

Introduction Equity capital Risk-oriented overall bank management Specific risk management Appendix 23
The aim is to fully wind down all the assets grouped in this
segment in a way that preserves value. To this end, exposure at
default-based guidelines have been established and an asset man-
agement programme has been implemented. This is carried out
through regular asset planning. The main aim here is to prioritise
the winding down or reduction of those parts of the portfolio and
individual loans for which the capital requirement is particularly
high. Opportunities for selling sub-portfolios in a way that pre-
serves value may also be used to free up capital as part of the sys-
tematic portfolio reduction. For business in Public Finance, the
reduction is primarily through regular maturities of assets. Market
opportunities that arise are used in a targeted way for the sale of
individual assets.
Risk management
Commerzbank manages default risk using a comprehensive risk
management system. The management framework comprises an
organisational structure, methods and models, quantitative and
qualitative management tools and regulations and processes. The
risk management system ensures that the entire portfolio and the
sub-portfolios, right down to individual exposure level, are man-
aged consistently and thoroughly on a top-down basis.
The ratios and measures required for the operational process of
risk management are based on overarching Group objectives. They
are enhanced at downstream levels by sub-portfolio and product
specifics. Risk-based credit approval regulations focus manage-
ment attention in the highest decision-making bodies on issues
such as risk concentrations or deviations from the risk strategy.
Management of economic capital commitment
Economic capital commitment is managed in order to ensure that
the Commerzbank Group holds sufficient capital. All risk types in
the overall risk strategy for economic risk capital are given limits
on a Group-wide basis, with, in particular, a CVaR limit being
specified. Due to the systematically restricted options for reducing
default risk on a short-term basis, it is important to take account of
expected trends (medium-term and long-term) in order to manage
credit risk. For this reason, forecast values of credit risk parame-
ters play a key role in ongoing management. At segment and busi-
ness area level, changes to forecasts are monitored and adjust-
ments made when necessary. There is no cascaded limit concept
for credit risk below Group level, i.e. the Group credit limit is not
allocated to segments or business areas.
Management of risk concentrations
The avoidance of risk concentrations is a core strategy of risk
management. Risk concentrations are actively managed in order to
identify at an early stage and contain the increased potential for
loss in the synchronous movement of risk positions. In addition to
exposure-related credit risk concentrations (bulk risks), default
risk also includes country and sector concentrations. Segment-
specific features are taken into account here.
A uniform definition based on “all-in” is used to manage bulk
risk. The all-in concept comprises all customer credit lines ap-
proved by the Bank in their full amount – irrespective of the loan
utilisation to date.
Management and the Supervisory Board’s Risk Committee are
regularly informed about the results of the analyses.
Country risk management
The Group’s country risk calculation records both transfer risks
and event risks defined by political and economic events which
impact on the individual economic entities of a country. Country
risks are managed on the basis of defined credit risk and transfer
risk limits at country level. Country exposures which are signifi-
cant for Commerzbank due to their size, and exposures in coun-
tries in which Commerzbank holds significant investments in
comparison to the GDP of those countries, are handled by the
Strategic Risk Committee on a separate basis.
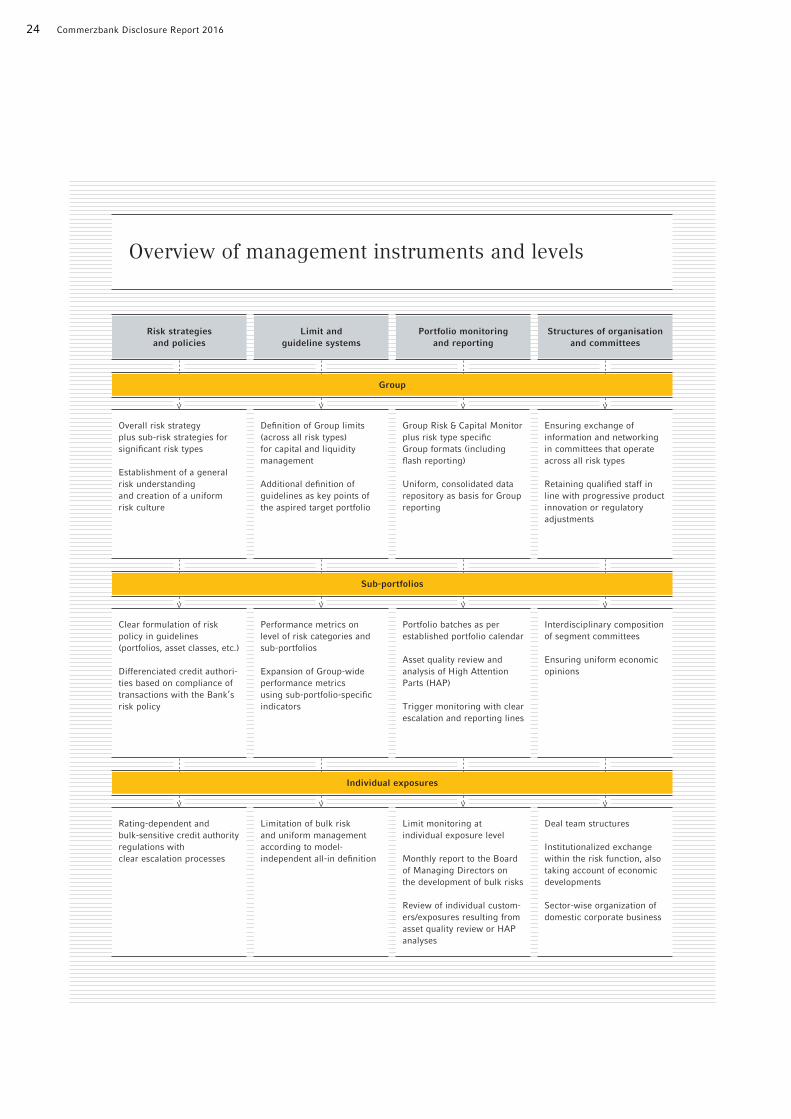
24 Commerzbank Disclosure Report 2016
Overview of management instruments and levels
Risk strategies
and policies
Limit and
guideline systems
Portfolio monitoring
and reporting
Structures of organisation
and committees
Overall risk strategy
plus sub-risk strategies for
significant risk types
Establishment of a general
risk understanding
and creation of a uniform
risk culture
Definition of Group limits
(across all risk types)
for capital and liquidity
man age ment
Additional definition of
guide lines as key points of
the aspired target portfolio
Group Risk & Capital Monitor
plus risk type specific
Group formats (including
flash reporting)
Uniform, consolidated data
repository as basis for Group
reporting
Ensuring exchange of
information and networking
in committees that operate
across all risk types
Retaining qualified staff in
line with progressive product
innovation or regulatory
adjustments
Clear formulation of risk
policy in guidelines
(portfolios, asset classes, etc.)
Differenciated credit authori-
ties based on com pliance of
transactions with the Bank’s
risk policy
Performance metrics on
level of risk categories and
sub-portfolios
Expansion of Group-wide
per formance metrics
using sub-portfolio-specific
indicators
Portfolio batches as per
established portfolio calendar
Asset quality review and
analysis of High Attention
Parts (HAP)
Trigger monitoring with clear
escalation and reporting lines
Interdisciplinary composition
of segment committees
Ensuring uniform economic
opinions
Rating-dependent and
bulk-sensitive credit authority
regulations with
clear escalation processes
Limitation of bulk risk
and uniform management
according to model-
independent all-in definition
Limit monitoring at
individual exposure level
Monthly report to the Board
of Managing Directors on
the development of bulk risks
Review of individual custom -
ers/exposures resulting from
asset quality review or HAP
analyses
Deal team structures
Institutionalized exchange
within the risk function, also
taking account of economic
developments
Sector-wise organization of
domestic corporate business
Group
Sub-portfolios
Individual exposures
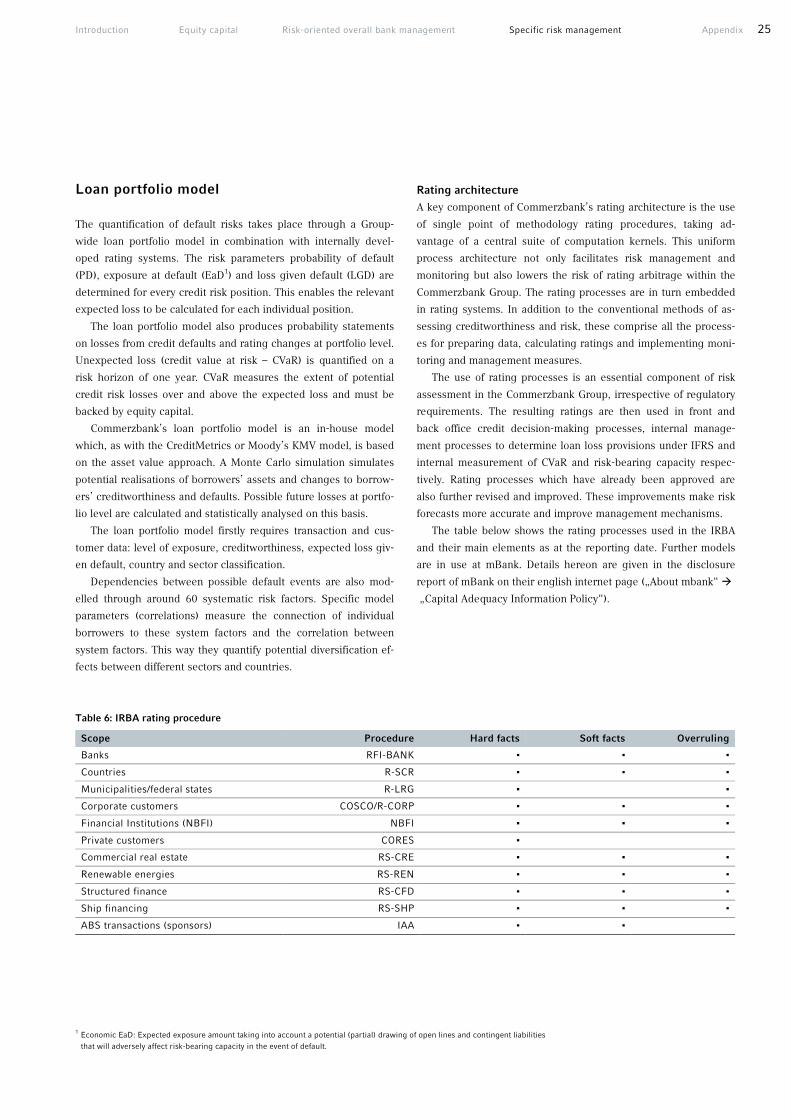
Introduction Equity capital Risk-oriented overall bank management Specific risk management Appendix 25
Loan portfolio model
The quantification of default risks takes place through a Group-
wide loan portfolio model in combination with internally devel-
oped rating systems. The risk parameters probability of default
(PD), exposure at default (EaD1) and loss given default (LGD) are
determined for every credit risk position. This enables the relevant
expected loss to be calculated for each individual position.
The loan portfolio model also produces probability statements
on losses from credit defaults and rating changes at portfolio level.
Unexpected loss (credit value at risk – CVaR) is quantified on a
risk horizon of one year. CVaR measures the extent of potential
credit risk losses over and above the expected loss and must be
backed by equity capital.
Commerzbank’s loan portfolio model is an in-house model
which, as with the CreditMetrics or Moody’s KMV model, is based
on the asset value approach. A Monte Carlo simulation simulates
potential realisations of borrowers’ assets and changes to borrow-
ers’ creditworthiness and defaults. Possible future losses at portfo-
lio level are calculated and statistically analysed on this basis.
The loan portfolio model firstly requires transaction and cus-
tomer data: level of exposure, creditworthiness, expected loss giv-
en default, country and sector classification.
Dependencies between possible default events are also mod-
elled through around 60 systematic risk factors. Specific model
parameters (correlations) measure the connection of individual
borrowers to these system factors and the correlation between
system factors. This way they quantify potential diversification ef-
fects between different sectors and countries.
Rating architecture
A key component of Commerzbank’s rating architecture is the use
of single point of methodology rating procedures, taking ad-
vantage of a central suite of computation kernels. This uniform
process architecture not only facilitates risk management and
monitoring but also lowers the risk of rating arbitrage within the
Commerzbank Group. The rating processes are in turn embedded
in rating systems. In addition to the conventional methods of as-
sessing creditworthiness and risk, these comprise all the process-
es for preparing data, calculating ratings and implementing moni-
toring and management measures.
The use of rating processes is an essential component of risk
assessment in the Commerzbank Group, irrespective of regulatory
requirements. The resulting ratings are then used in front and
back office credit decision-making processes, internal manage-
ment processes to determine loan loss provisions under IFRS and
internal measurement of CVaR and risk-bearing capacity respec-
tively. Rating processes which have already been approved are
also further revised and improved. These improvements make risk
forecasts more accurate and improve management mechanisms.
The table below shows the rating processes used in the IRBA
and their main elements as at the reporting date. Further models
are in use at mBank. Details hereon are given in the disclosure
report of mBank on their english internet page („About mbank“ �
„Capital Adequacy Information Policy“).
Table 6: IRBA rating procedure Scope Procedure Hard facts Soft facts Overruling
Banks RFI-BANK ▪ ▪ ▪
Countries R-SCR ▪ ▪ ▪
Municipalities/federal states R-LRG ▪ ▪
Corporate customers COSCO/R-CORP ▪ ▪ ▪
Financial Institutions (NBFI) NBFI ▪ ▪ ▪
Private customers CORES ▪
Commercial real estate RS-CRE ▪ ▪ ▪
Renewable energies RS-REN ▪ ▪ ▪
Structured finance RS-CFD ▪ ▪ ▪
Ship financing RS-SHP ▪ ▪ ▪
ABS transactions (sponsors) IAA ▪ ▪
1 Economic EaD: Expected exposure amount taking into account a potential (partial) drawing of open lines and contingent liabilities
that will adversely affect risk-bearing capacity in the event of default.

26 Commerzbank Disclosure Report 2016
Hard facts refer to system-based factors which are used in the
rating process and allow no scope for interpretation. For instance,
these may be data from companies’ annual financial statements,
the income of a private individual, or the age of the documents
being used.
Soft facts refer to structured areas of analysis where the rating
analyst needs to make an assessment and where there is therefore
scope for discretion on a case-by-case basis. Examples include an
assessment of management or the product quality of the customer
being rated.
Overruling is a downstream area of analysis where there is a
further opportunity for the analyst to assess circumstances sepa-
rately based on his or her personal judgement. The system result
can be adjusted upwards or downwards. The relevant reason for
the decision is documented. Overruling should particularly be
used when there are strongly fluctuating developments (e.g. mar-
ket changes) such that an adequate assessment of a company’s
situation based on the analysis of statistical information (e.g. an-
nual financial statements) is not sufficient to give a future-oriented
probability of default. Due to the degree of freedom this gives the
rating process, overruling is subject to strict standards and regular
monitoring.
The Commerzbank rating method comprises 25 rating classes
for loans not in default (1.0 to 5.8) and five default classes (6.1 to
6.5). The Commerzbank master scale allocates a non-overlapping
range of probabilities of default that are stable over time to each
rating class. The rating methods are validated and recalibrated
annually so that they reflect the latest projection based on all actu-
al observed defaults. The default ranges assigned to the ratings
are the same for all portfolios. This ensures internal comparability
consistent with the master scale method. For the purpose of guid-
ance, the Commerzbank master scale shows external ratings as
well as rating classes according to Article 136 CRR. However, a
direct reconciliation is not possible, because external ratings of
different portfolios show fluctuating default rates from year to year.
The credit approval authorities of both individual staff and the
committees (Board of Managing Directors, credit committee, cred-
it sub-committees) are graduated by a range of factors including
size of exposure and rating class.

Introduction Equity capital Risk-oriented overall bank management Specific risk management Appendix 27
Commerzbank master scale
Commerzbank AG PD and EL mid-point PD and EL range
rating % %S&P scale Credit quality steps
in accordance withArticle 136 CRR1
1.0 0 0
1.2 0.01 0– 0.02
1.4 0.02 0.02– 0.03
1.6 0.04 0.03– 0.05
1.8 0.07 0.05– 0.08
2.0 0.11 0.08– 0.13
2.2 0.17 0.13– 0.21
2.4 0.26 0.21– 0.31
2.6 0.39 0.31– 0.47
2.8 0.57 0.47– 0.68
3.0 0.81 0.68– 0.96
3.2 1.14 0.96– 1.34
3.4 1.56 1.34– 1.81
3.6 2.10 1.81– 2.40
3.8 2.74 2.40– 3.10
4.0 3.50 3.10– 3.90
4.2 4.35 3.90– 4.86
4.4 5.42 4.86– 6.04
4.6 6.74 6.04– 7.52
4.8 8.39 7.52– 9.35
5.0 10.43 9.35– 11.64
5.2 12.98 11.64– 14.48
5.4 16.15 14.48– 18.01
5.6 20.09 18.01– 22.41
5.8 47.34 22.41– 99.99
6.1 > 90 days past due
6.2 Imminent insolvency
6.3 Restructuring with recapitalisation
6.4 Termination without insolvency
6.5 Insolvency
100
Investment
grade
Non-investment
grade
DefaultD
AAA
AA+AA
A
BBB+
BBB
BBB–
III
IV
V
VI
B
BB
BBB
BB+
AAA
CCC+,
CCC, CCC–,
CC, C
CCC,
CC, C
BB
BB–
B+
B
B–
AA, AA–
A+, A
A–
I
II
1 CRR = Capital Requirements Regulation (EU) No 575/2013.

28 Commerzbank Disclosure Report 2016
Commerzbank has defined an implementation plan for the suc-
cessive transition of the SACR portfolios into the IRBA. As at 31
December 2016, Commerzbank has an IRBA coverage ratio at
Group level of 98.7% for IRBA exposure values and 94.8% for risk
weighted IRBA exposure values, exceeding the IRBA exit thresh-
old of 92% under section 10 of the Solvency Regulation (in the
version applicable as at 1 January 2014). For loans and receivables
that are not covered by the procedures approved by the superviso-
ry authorities for the IRBA, the standardised approach for credit
risk (SACR) applies, under which flat risk weightings are to be
used or risk weightings are to be based on external assessments of
the borrower’s creditworthiness.
Risk parameters
In addition to classifying the default risk within the scope of the
rating process, correctly assessing loss severity is essential for a
reliable and holistic risk assessment. The loss severity is deter-
mined firstly by the exposure at default (EaD) and secondly by the
loss given default (LGD).
When forecasting EaD unused credit lines and other contingent
liabilities are included via credit conversion factors (CCFs). De-
pending on the transaction and the customer, the CCFs describe
the probability of drawdown in the event of a default within the
next twelve months.
The LGD is primarily determined by the expected proceeds
from collateral and unsecured portions of loans. Proceeds from
collateral are modelled via recovery rates representing a discount
on the previously defined market value. The recovery rate depends
on the characteristics of the collateral. For instance, when model-
ling for properties, the collateral is differentiated by property type
and location. To determine the proceeds on unsecured portions of
loans, the focus is primarily on the characteristics of the customer
and the transaction.
The CCF and LGD models are based on bank-internal empirical
loss data. For this purpose, Commerzbank refers to a database of
internal credit defaults since 1997. New defaults are recorded con-
tinuously and are made available for statistical analysis once pro-
cessing is complete. For quality assurance purposes, the data col-
lection process is monitored by a number of controls and
automatic checking procedures.
Both the internal and regulatory requirements of the CRR are
taken into account when developing statistical models for estimat-
ing EaD and LGD. Discussions with experts from back office and
debt workout departments play an important role when validating
the results and identifying relevant factors. In instances where
there is only a small number of historical default or collateral utili-
sation cases, the empirical analyses are supplemented with expert
assessments. All of the models are regularly validated and recali-
brated on the basis of the new findings. Empirically-based LGD
and EaD parameters are used in all important internal processes at
Commerzbank. The suitability of the models was verified by the
Bundesbank and the BaFin as part of the inspection prior to the
granting of authorisation for the advanced IRBA.
Finally, combining the above components yields an assessment
of the expected loss (EL = EaD*PD*LGD) and the risk density as a
ratio of EL to EaD (EL to EaD in basis points). The internal master
scale is used to clearly allocate borrower PDs (customer ratings)
and loan commitment risk densities (credit ratings) to the Bank's
internal rating classes.
Validation
Pursuant to Article 185 CRR, all risk classification procedures are
subject to a regular validation and calibration of parameters. Risk
Management, which is independent of the front office units, is
responsible for preparing the validation reports. The validation
outcome and resulting need for action are presented for approval
to a designated validation committee in which the management
body is also represented. A summary of the validation commit-
tee’s results as well as any irregularities and necessary changes
are presented to the Bank’s Strategic Risk Committee for approval.
Regular monitoring of procedures is an additional system control
element. To check the quality of the rating procedures, Internal
Audit regularly reviews the methods and processes used and in-
spects validation and monitoring methods.
Detailed validation concepts are defining which analyses have to
be carried out rotationally for the rating systems as well as for EaD
and LGD models. All of the analysis results are grouped and evalu-
ated using a traffic-light system. If the standards and limits that
have been defined in the validation concept are not met, the specif-
ic causes must be established. Concrete steps must then be defined
along with a timetable for implementing them. These steps may
include, for instance, measures to improve data quality or a revision
of the process in question.
Generally a distinction is made between quantitative and quali-
tative reviews of the models. Data quality aspects and statistical
analyses are of specific interest in the quantitative validation. This
involves comparing the model forecasts with the reality over the
course of the assessment period. The quality of the forecasts is
verified using statistical methods. Assessing the discriminatory
power of rating procedures may involve using Gini coefficients,
concordance indices and hit rate analyses, for instance. The cali-
bration of procedures may be checked using various statistical
tests, such as the Spiegelhalter or binomial test.

Introduction Equity capital Risk-oriented overall bank management Specific risk management Appendix 29
Depending on the type of model a different validation proce-
dure to back-test each single model has to be applied, as de-
scribed in the following:
• Default/non-default rating procedure: In default/non-default
models, ratio selection, parameter estimates and calibration are
mainly based on internal default periods. A check is therefore
made during validation to ascertain whether the internally
measured default rates tally with the predicted probabilities of
default. Discriminatory power is also checked by calculating
the AUC value, and the Gini coefficient respectively.
• Shadow rating procedure: The classic back-testing methods
used for default/non-default models cannot normally be applied
to portfolios with very few defaults. Consequently, back-testing
in shadow rating procedures relies very heavily on comparisons
with external ratings. Comparing the Bank’s internal ratings
with those of external agencies (Standard & Poor’s, Moody’s
and FitchRatings) gives indications of how the Bank’s credit
rating estimates should be classified in relative terms. For this
benchmarking, contingency tables, for example, are produced,
variances analysed and the correlation coefficient determined
according to Spearman. A benchmarking analysis is naturally
only useful or possible if a large number of external ratings are
available. If this is not the case, pseudo discriminatory power
values, for example, can be calculated using either external or
final internal ratings.
• Hybrid models: Hybrid models are basically mixtures of de-
fault/non–default models and shadow rating procedures. In
some low-default portfolios, an internal data history has had
time to develop. While this alone is not sufficient to develop a
default/non-default model and corresponding validation, the
available data history is yet being incorporated for validation or
development purposes. The validation techniques of de-
fault/non-default models and shadow rating procedures are
combined in these procedures.
• Cash flow-based procedures: In rating procedures for special
funding, the customer’s credit rating derives principally from
the cash flows generated by the rating object. Typically, the rat-
ing procedures are therefore based on cash flow simulations
using stochastic processes. The procedures are normally used
in low default and low number respectively portfolios for which
only very few external benchmarks exist. The models are there-
fore causally produced and often calibrated using expert
knowledge. Direct comparisons of the predicted PDs with real-
ised default rates and discriminatory power analyses using the
AUC are not normally very meaningful due to the low number
of defaults. The statistical testing of EaD and LGD predictions
of these models are likewise difficult. Key elements of the vali-
dation of these procedures are descriptive analyses of the input
data and comparisons of the cash flows and volatilities predict-
ed by the users with actual cash flows.
• Wholly expert-based PD procedures: No external target crite-
rion is available for these procedures and there are no cash
flow simulations. Calibration is based wholly on expert
knowledge. Validation is therefore very heavily reliant on ex-
pert know-how, as is the development. For the validation, the
results produced by the procedure in particular are compared
with the expert opinion, e.g. by evaluating the overruling pat-
tern.
• EaD and LGD models: On the basis of additional default and
loss data full-sample and out-of-sample tests are carried out
through statistical backtests. In this context the validity of ex-
isting parameter differentiations and the discriminatory power
of the applied risk factors have always to be analysed. Data
quality and the representativeness of observations for future
loss events are also important subjects of analyses.
The following table gives an overview of the quantitative valida-
tion procedures used for the individual rating procedures:
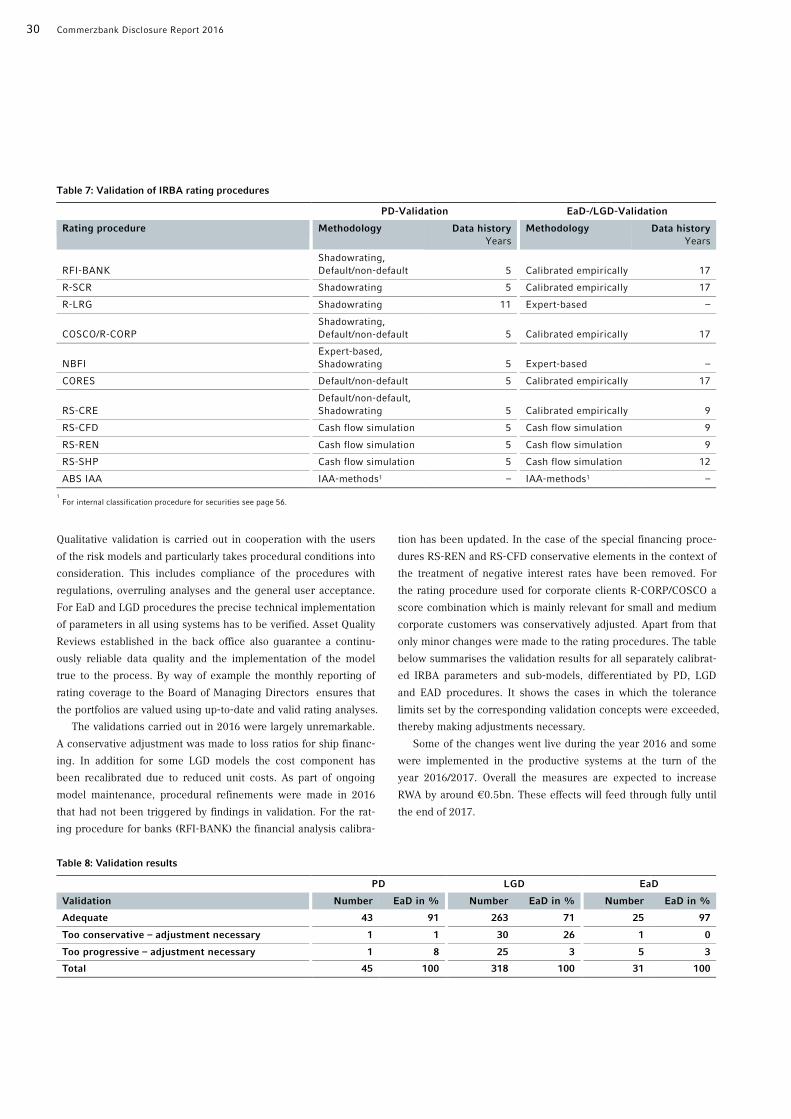
30 Commerzbank Disclosure Report 2016
Table 7: Validation of IRBA rating procedures
PD-Validation EaD-/LGD-Validation
Rating procedure Methodology Data history
Years
Methodology Data history
Years
RFI-BANK
Shadowrating,
Default/non-default 5 Calibrated empirically 17
R-SCR Shadowrating 5 Calibrated empirically 17
R-LRG Shadowrating 11 Expert-based –
COSCO/R-CORP
Shadowrating,
Default/non-default 5 Calibrated empirically 17
NBFI
Expert-based,
Shadowrating 5 Expert-based –
CORES Default/non-default 5 Calibrated empirically 17
RS-CRE
Default/non-default,
Shadowrating 5 Calibrated empirically 9
RS-CFD Cash flow simulation 5 Cash flow simulation 9
RS-REN Cash flow simulation 5 Cash flow simulation 9
RS-SHP Cash flow simulation 5 Cash flow simulation 12
ABS IAA IAA-methods1 – IAA-methods1 –
1
For internal classification procedure for securities see page 56.
Qualitative validation is carried out in cooperation with the users
of the risk models and particularly takes procedural conditions into
consideration. This includes compliance of the procedures with
regulations, overruling analyses and the general user acceptance.
For EaD and LGD procedures the precise technical implementation
of parameters in all using systems has to be verified. Asset Quality
Reviews established in the back office also guarantee a continu-
ously reliable data quality and the implementation of the model
true to the process. By way of example the monthly reporting of
rating coverage to the Board of Managing Directors ensures that
the portfolios are valued using up-to-date and valid rating analyses.
The validations carried out in 2016 were largely unremarkable.
A conservative adjustment was made to loss ratios for ship financ-
ing. In addition for some LGD models the cost component has
been recalibrated due to reduced unit costs. As part of ongoing
model maintenance, procedural refinements were made in 2016
that had not been triggered by findings in validation. For the rat-
ing procedure for banks (RFI-BANK) the financial analysis calibra-
tion has been updated. In the case of the special financing proce-
dures RS-REN and RS-CFD conservative elements in the context of
the treatment of negative interest rates have been removed. For
the rating procedure used for corporate clients R-CORP/COSCO a
score combination which is mainly relevant for small and medium
corporate customers was conservatively adjusted. Apart from that
only minor changes were made to the rating procedures. The table
below summarises the validation results for all separately calibrat-
ed IRBA parameters and sub-models, differentiated by PD, LGD
and EAD procedures. It shows the cases in which the tolerance
limits set by the corresponding validation concepts were exceeded,
thereby making adjustments necessary.
Some of the changes went live during the year 2016 and some
were implemented in the productive systems at the turn of the
year 2016/2017. Overall the measures are expected to increase
RWA by around €0.5bn. These effects will feed through fully until
the end of 2017.
Table 8: Validation results PD LGD EaD
Validation Number EaD in % Number EaD in % Number EaD in %
Adequate 43 91 263 71 25 97
Too conservative – adjustment necessary 1 1 30 26 1 0
Too progressive – adjustment necessary 1 8 25 3 5 3
Total 45 100 318 100 31 100
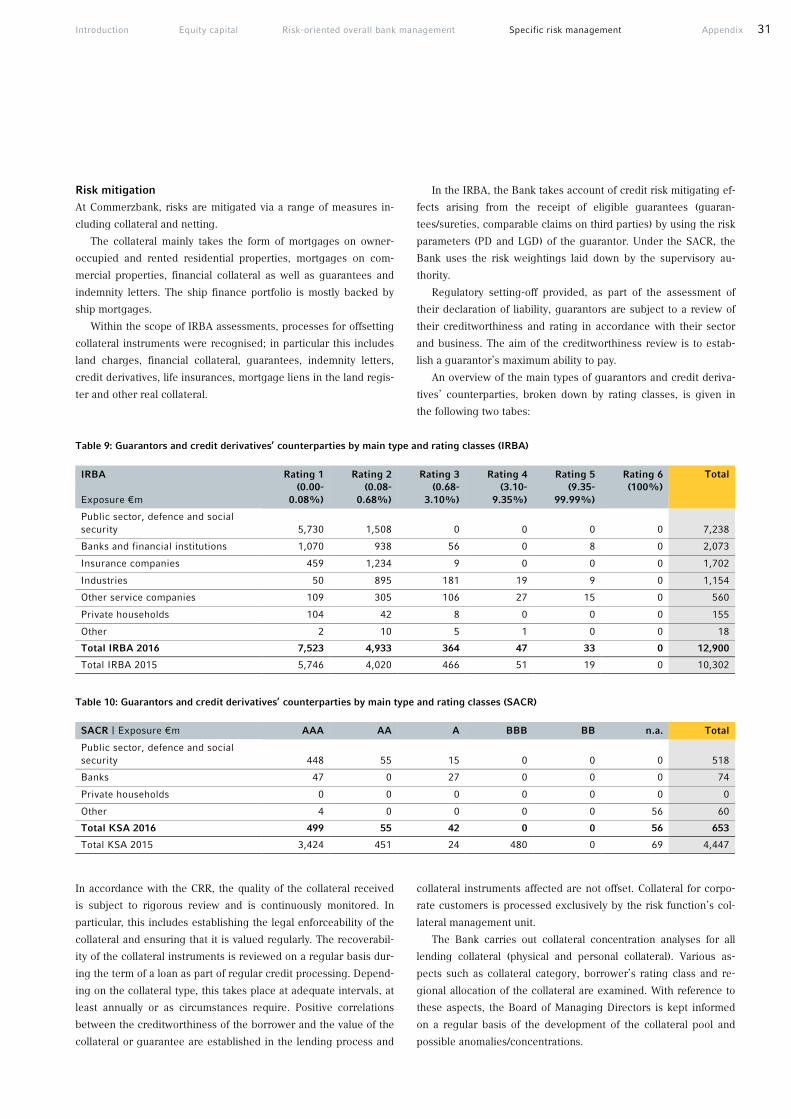
Introduction Equity capital Risk-oriented overall bank management Specific risk management Appendix 31
Risk mitigation
At Commerzbank, risks are mitigated via a range of measures in-
cluding collateral and netting.
The collateral mainly takes the form of mortgages on owner-
occupied and rented residential properties, mortgages on com-
mercial properties, financial collateral as well as guarantees and
indemnity letters. The ship finance portfolio is mostly backed by
ship mortgages.
Within the scope of IRBA assessments, processes for offsetting
collateral instruments were recognised; in particular this includes
land charges, financial collateral, guarantees, indemnity letters,
credit derivatives, life insurances, mortgage liens in the land regis-
ter and other real collateral.
In the IRBA, the Bank takes account of credit risk mitigating ef-
fects arising from the receipt of eligible guarantees (guaran-
tees/sureties, comparable claims on third parties) by using the risk
parameters (PD and LGD) of the guarantor. Under the SACR, the
Bank uses the risk weightings laid down by the supervisory au-
thority.
Regulatory setting-off provided, as part of the assessment of
their declaration of liability, guarantors are subject to a review of
their creditworthiness and rating in accordance with their sector
and business. The aim of the creditworthiness review is to estab-
lish a guarantor’s maximum ability to pay.
An overview of the main types of guarantors and credit deriva-
tives’ counterparties, broken down by rating classes, is given in
the following two tabes:
Table 9: Guarantors and credit derivatives’ counterparties by main type and rating classes (IRBA)
Table 10: Guarantors and credit derivatives’ counterparties by main type and rating classes (SACR)
In accordance with the CRR, the quality of the collateral received
is subject to rigorous review and is continuously monitored. In
particular, this includes establishing the legal enforceability of the
collateral and ensuring that it is valued regularly. The recoverabil-
ity of the collateral instruments is reviewed on a regular basis dur-
ing the term of a loan as part of regular credit processing. Depend-
ing on the collateral type, this takes place at adequate intervals, at
least annually or as circumstances require. Positive correlations
between the creditworthiness of the borrower and the value of the
collateral or guarantee are established in the lending process and
collateral instruments affected are not offset. Collateral for corpo-
rate customers is processed exclusively by the risk function’s col-
lateral management unit.
The Bank carries out collateral concentration analyses for all
lending collateral (physical and personal collateral). Various as-
pects such as collateral category, borrower’s rating class and re-
gional allocation of the collateral are examined. With reference to
these aspects, the Board of Managing Directors is kept informed
on a regular basis of the development of the collateral pool and
possible anomalies/concentrations.
IRBA
Exposure €m
Rating 1
(0.00-
0.08%)
Rating 2
(0.08-
0.68%)
Rating 3
(0.68-
3.10%)
Rating 4
(3.10-
9.35%)
Rating 5
(9.35-
99.99%)
Rating 6
(100%)
Total
Public sector, defence and social
security 5,730 1,508 0 0 0 0 7,238
Banks and financial institutions 1,070 938 56 0 8 0 2,073
Insurance companies 459 1,234 9 0 0 0 1,702
Industries 50 895 181 19 9 0 1,154
Other service companies 109 305 106 27 15 0 560
Private households 104 42 8 0 0 0 155
Other 2 10 5 1 0 0 18
Total IRBA 2016 7,523 4,933 364 47 33 0 12,900
Total IRBA 2015 5,746 4,020 466 51 19 0 10,302
SACR | Exposure €m AAA AA A BBB BB n.a. Total
Public sector, defence and social
security 448 55 15 0 0 0 518
Banks 47 0 27 0 0 0 74
Private households 0 0 0 0 0 0 0
Other 4 0 0 0 0 56 60
Total KSA 2016 499 55 42 0 0 56 653
Total KSA 2015 3,424 451 24 480 0 69 4,447

32 Commerzbank Disclosure Report 2016
The valuation and processing of collateral are governed by uni-
versally applicable standards and collateral-specific instructions
(guidelines, descriptions of processes, IT instructions, legally vali-
dated standard contracts and samples). The standards established
to hedge against or mitigate the risks of loans, which also take ac-
count of the regulatory requirements of CRR, include:
• Legal and operational standards for documentation and data collection as well as valuation standards.
• The standardisation and updating of collateral valuations are ensured by laying down valuation processes, prescribing
standardised valuation methods, parameters and defined dis-
counts for collateral, clearly defining responsibilities for the
processing and valuation process, and stipulating requirements
for revaluations at regular intervals.
• Other standards for taking account of specific risks, e.g. opera-tional risks, correlation and concentration risks, market price
change risks (e.g. due to currency fluctuations), country risks,
legal risks or risks of changes in the law, and risks of insuffi-
cient insurance cover.
For the vast majority of its derivative default risk positions,
Commerzbank Group uses the internal model method (IMM) ac-
cording to Article 283 CRR. The credit equivalent amounts are de-
termined as expected future exposure through the simulation of
various market scenarios, taking netting and collateral into account.
Also for securities repurchase, lending and comparable transac-
tions involving securities or goods, the exposures are determined in
accordance with Article 283 and Article 273 (2) CRR on the basis of
an internal model method. Guarantees and credit derivatives are
taken into account via the substitution approach. The double-
default procedure defined under Article 153 (3) CRR is applied.
Quantitative information on default risks
Commerzbank Group’s IRBA portfolio
The IRBA portfolio of all Commerzbank Group companies included
in this Disclosure Report is shown below, broken down into the
relevant IRBA asset classes. The structuring of the rating classes
corresponds to the Commerzbank internal management via the PD
master scale. These have been grouped into five main classes for
reasons of clarity. Rating classes 6.1 to 6.5 comprise borrowers in
default according to IRBA regulations, whereby the IRBA defini-
tion of default is also used for internal purposes. The risk parame-
ters PD and LGD are calculated as exposure-weighted averages;
the same also applies to the average risk weighting (RW).
The IRBA exposure value refers to the risk exposure values to
be defined according to Article 166 CRR. These represent the ex-
pected amounts of the IRBA position that will be exposed to a risk
of loss. The risk exposure value for off-balance-sheet default risk
exposures is calculated by multiplying with a conversion factor.
The companies in the Commerzbank Group use the Advanced
IRB. They may therefore use the internal estimates of credit con-
version factors (CCFs) for regulatory purposes, too. CCFs are nec-
essary for off-balance-sheet transactions in order to assess the
likely exposure in the event of a possible default on commitments
that have not yet been drawn.
In tables 11 to 15, only portfolios which fall under the scope of
application of the IRBA and are rated with a rating process that
has been approved by the supervisory authority are shown. Posi-
tions in the risk exposure class other non-loan-related assets are
not listed. These assets amounting to €2.7bn do not have any cre-
ditworthiness risks and are therefore not relevant for the manage-
ment of default risks. Furthermore, mBank S.A. positions in the
amount of €1.7bn are not included; they are subject to the IRBA
slotting approach. Securitisation positions in the IRBA are pre-
sented separately in the securitisations section in this chapter.
The risk exposure values shown in this section generally differ
from the EaD values in the Annual Report (economic EaD) due to
the following:
• For derivative positions, there are differences in definitions be-tween the exposures reported in the Annual Report and the
regulatory figures presented in this Disclosure Report.
• Some transactions are not included in risk-weighted assets (RWA) for regulatory purposes but are included in the EaD of
the Annual Report and Risk Report respectively.
• The figures presented in this Disclosure Report relate to six entities within the Commerzbank Group considered important
for disclosure. By contrast, the figures in the Annual Report re-
late to all companies that have to be consolidated according to
IFRS.
All of the IRBA exposures are presented as follows:

Introduction Equity capital Risk-oriented overall bank management Specific risk management Appendix 33
Table 11: IRBA exposures by rating class – on-balance and off-balance
Investment Grade Non-Investment Grade Default
Asset class
€m
Rating 1
(0.00-
0.08%)
Rating 2
(0.08-
0.68%)
Rating 3
(0.68-
3.10%)
Rating 4
(3.10-
9.35%)
Rating 5
(9.35-
99.99%)
Rating 6
(100%)
Total
Central governments
or central banks
EaD 9,413 12,123 633 213 181 0 22,562
Ø LGD % 30.4 23.9 76.7 96.2 69.0 20.0 29.1
Ø PD % 0.0 0.2 0.9 3.9 12.4 100.0 0.3
Ø RW % 9.9 20.8 131.9 278.8 330.6 0.0 24.3
RWA 933 2,522 835 594 598 0 5,482
Institutions
EaD 19,688 19,008 7,629 2,249 337 104 49,016
Ø LGD % 39.0 38.2 38.1 17.1 23.9 74.8 37.5
Ø PD % 0.0 0.3 1.3 7.0 25.0 100.0 1.0
Ø RW % 17.6 48.9 85.1 55.3 125.8 56.1 42.8
RWA 3,468 9,291 6,496 1,244 424 58 20,981
Corporates
EaD 15,981 88,500 22,156 5,714 4,034 4,921 141,305
Ø LGD % 37.8 38.5 36.1 33.1 27.5 51.0 38.0
Ø PD % 0.0 0.3 1.3 5.2 41.2 100.0 5.3
Ø RW % 19.0 45.2 77.8 108.5 121.0 50.2 52.3
RWA 3,044 40,044 17,244 6,197 4,882 2,471 73,882
thereof specialised
lending
EaD 5,972 10,364 4,584 3,261 3,351 2,461 29,993
Ø LGD % 35.7 38.6 32.5 31.5 26.9 46.8 35.7
Ø PD % 0.0 0.3 1.5 5.4 45.1 100.0 14.2
Ø RW % 19.1 49.3 81.5 109.1 118.5 78.5 64.9
RWA 1,143 5,110 3,737 3,559 3,969 1,933 19,451
thereof SMEs
EaD 1,055 5,145 3,372 893 231 598 11,295
Ø LGD % 28.3 32.7 36.7 35.0 31.4 59.7 35.1
Ø PD % 0.0 0.3 1.5 5.1 18.1 100.0 6.6
Ø RW % 11.0 34.5 69.9 92.6 122.0 46.0 49.8
RWA 116 1,773 2,357 827 282 275 5,630
Retail
EaD 36,802 49,957 12,363 3,286 1,857 1,220 105,485
Ø LGD % 25.2 23.2 29.3 30.1 21.1 54.2 25.2
Ø PD % 0.0 0.3 1.4 5.3 23.4 100.0 2.0
Ø RW % 2.4 11.0 32.4 53.8 71.8 89.1 13.8
RWA 882 5,505 4,001 1,766 1,334 1,087 14,575
Total
EaD 81,883 169,587 42,781 11,462 6,409 6,245 318,368
Ø LGD % 31.6 32.9 35.1 30.3 26.6 52.1 33.0
Ø PD % 0.0 0.3 1.3 5.5 34.3 100.0 3.2
Ø RW % 10.2 33.8 66.8 85.5 112.9 57.9 36.1
RWA 8,326 57,362 28,576 9,801 7,238 3,616 114,919

34 Commerzbank Disclosure Report 2016
Table 12: IRBA exposures in retail banking by rating classes – on-balance and off-balance
Investment Grade Non-Investment Grade Default
Asset class
€m
Rating 1
(0.00-
0.08%)
Rating 2
(0.08-
0.68%)
Rating 3
(0.68-
3.10%)
Rating 4
(3.10-
9.35%)
Rating 5
(9.35-
99.99%)
Rating 6
(100%)
Total
Retail banking
EaD 36,802 49,957 12,363 3,286 1,857 1,220 105,485
Ø LGD % 25.2 23.2 29.3 30.1 21.1 54.2 25.2
Ø PD % 0.0 0.3 1.4 5.3 23.4 100.0 2.0
Ø RW % 2.4 11.0 32.4 53.8 71.8 89.1 13.8
RWA 882 5,505 4,001 1,766 1,334 1,087 14,575
Secured by
mortgages on
immovable
property,
excluding SMEs
EaD 23,970 33,214 4,981 1,128 705 507 64,506
Ø LGD % 14.6 14.9 15.6 16.3 18.1 39.3 15.1
Ø PD % 0.0 0.3 1.3 5.5 20.8 100.0 1.4
Ø RW % 2.0 7.6 24.1 58.5 100.6 120.1 9.6
RWA 478 2,516 1,198 660 709 609 6,171
Secured by
mortgages on
immovable
property, SMEs
EaD 57 676 264 38 39 49 1,123
Ø LGD % 14.9 19.6 19.3 24.7 28.2 53.3 21.3
Ø PD % 0.0 0.3 1.3 5.4 19.3 100.0 5.7
Ø RW % 1.5 8.8 23.5 65.2 121.0 184.4 25.4
RWA 1 59 62 25 47 91 285
Qualifying
revolving
EaD 5,946 1,245 462 114 35 8 7,810
Ø LGD % 59.4 59.5 59.9 60.2 60.1 74.6 59.5
Ø PD % 0.0 0.3 1.4 5.3 16.8 100.0 0.4
Ø RW % 1.6 8.0 31.0 78.7 145.6 0.0 6.1
RWA 93 100 143 90 52 0 477
Other, excluding
SMEs
EaD 6,455 10,965 3,805 848 714 365 23,152
Ø LGD % 32.7 39.6 39.6 39.4 16.2 64.0 37.3
Ø PD % 0.0 0.3 1.4 5.0 29.1 100.0 3.0
Ø RW % 4.5 20.4 43.8 60.0 46.2 73.2 22.9
RWA 293 2,235 1,666 509 330 267 5,300
Other, SMEs
EaD 373 3,857 2,851 1,158 364 291 8,894
Ø LGD % 37.4 36.9 35.6 34.0 31.9 67.5 36.9
Ø PD % 0.1 0.3 1.5 5.2 18.3 100.0 5.3
Ø RW % 4.5 15.4 32.7 41.7 54.0 41.2 26.3
RWA 17 595 932 483 197 120 2,343
The following two tables solely show off-balance sheet IRBA-
positions:

Introduction Equity capital Risk-oriented overall bank management Specific risk management Appendix 35
Table 13: IRBA exposures for off-balance sheet transactions by rating class – unutilised lending commitments
Investment Grade Non-Investment Grade Default
Asset class €m
Rating 1 (0.00-
0.08%)
Rating 2 (0.08-
0.68%)
Rating 3 (0.68-
3.10%)
Rating 4 (3.10-
9.35%)
Rating 5 (9.35-
99.99%)
Rating 6 (100%)
Total
Central
governments or
central banks
Total sum 663 38 86 50 79 0 918
Ø CCF (%) 48 49 49 46 49 0 48
EaD1 321 19 43 9 7 0 398
Ø EaD 12 3 14 28 101 0 14
Institutions
Total sum 630 1,309 619 190 49 0 2,797
Ø CCF (%) 46 48 48 49 45 45 48
EaD 301 630 183 58 15 0 1,186
Ø EaD 37 42 94 40 9 0 48
Corporates
Total sum 9,537 69,532 10,229 1,552 485 123 91,459
Ø CCF (%) 45 46 45 47 45 45 46
EaD 4,449 31,939 4,480 613 216 55 41,754
Ø EaD 60 78 14 34 11 2 68
thereof
specialised
lending
Total sum 934 844 433 402 370 16 2,999
Ø CCF (%) 48 47 53 50 44 49 48
EaD 637 888 255 201 165 8 2,154
Ø EaD 78 16 42 44 13 1 39
thereof SMEs
Total sum 259 1,803 1,107 197 34 23 3,423
Ø CCF (%) 42 43 48 51 50 39 45
EaD 107 778 509 99 16 8 1,517
Ø EaD 1 2 5 2 1 1 3
Retail
Total sum 14,116 11,368 3,103 507 65 14 29,172
Ø CCF (%) 63 65 62 54 55 39 63
EaD 8,931 7,319 1,903 270 35 6 18,463
Ø EaD 0 10 0 2 0 0 4
thereof secured
by mortgages
on immovable
property, SMEs
Total sum 0 34 13 1 0 0 48
Ø CCF (%) 99 94 119 101 225 0 101
EaD 0 32 14 1 0 0 48
Ø EaD 0 0 0 0 0 0 0
thereof secured
by mortgages
on immovable
property,
excluding SMEs
Total sum 665 1,087 172 14 2 0 1,940
Ø CCF (%) 100 99 100 98 88 38 99
EaD 662 1,079 171 14 2 0 1,928
Ø EaD 0 0 0 0 0 0 0
thereof qualified
revolving
Total sum 9,737 1,640 391 64 10 0 11,842
Ø CCF (%) 59 58 56 57 57 53 59
EaD 5,763 944 220 37 6 0 6,969
Ø EaD 0 0 0 0 0 0 0
thereof other
SMEs
Total sum 542 4,204 1,438 264 36 10 6,493
Ø CCF (%) 43 46 48 47 47 41 47
EaD 231 1,928 690 123 17 4 2,992
Ø EaD 1 1 0 0 0 0 1
thereof other,
excluding SMEs
Total sum 3,172 4,404 1,089 163 17 4 8,849
Ø CCF (%) 71 76 74 59 64 34 73
EaD 2,275 3,336 808 96 11 1 6,527
Ø EaD 1 26 1 5 0 0 14
Total
Total sum 24,947 82,247 14,037 2,299 678 138 124,346
Ø CCF (%) 55 49 49 49 46 45 50
EaD 14,002 39,907 6,609 949 274 61 61,802
Ø EaD 25 68 13 26 12 2 52
1 EaD is calculated from the assessment basis, CCFs, collateral deposits and withdrawals, and substitution effects.

36 Commerzbank Disclosure Report 2016
Table 14: IRBA exposures for off-balance sheet transactions by rating class – other unutilised non-derivative off-balance sheet assets1
Investment Grade Non-Investment Grade Default
Asset class €m
Rating 1 (0.00-
0.08%)
Rating 2 (0.08-
0.68%)
Rating 3 (0.68-
3.10%)
Rating 4 (3.10-
9.35%)
Rating 5 (9.35-
99.99%)
Rating 6 (100%)
Total
Central
governments or
central banks
Total sum 108 122 64 50 282 0 626
Ø CCF (%) 38 56 38 43 16 0 32
EaD2 41 69 24 22 41 0 196
Ø EaD 1 4 0 0 22 0 10
Institutions
Total sum 1,498 2,514 1,678 1,454 304 6 7,453
Ø CCF (%) 78 50 46 46 46 33 54
EaD 1,180 1,251 735 578 111 2 3,857
Ø EaD 56 18 7 24 4 0 24
Corporates
Total sum 3,261 18,201 4,099 365 341 254 26,521
Ø CCF (%) 37 37 25 27 22 26 35
EaD 1,611 6,839 824 94 74 64 9,505
Ø EaD 24 27 13 1 1 1 24
thereof
specialised
lending
Total sum 235 178 189 25 36 19 682
Ø CCF (%) 33 28 27 26 24 20 31
EaD 420 195 56 7 9 4 690
Ø EaD 7 2 1 0 0 1 5
thereof SMEs
Total sum 690 782 389 94 36 26 2,018
Ø CCF (%) 44 24 33 26 30 42 33
EaD 303 184 124 23 11 11 655
Ø EaD 84 0 1 0 1 0 29
Retail
Total sum 117 548 181 44 12 20 921
Ø CCF (%) 26 24 26 29 25 32 25
EaD 31 129 46 12 3 6 228
Ø EaD 0 0 0 0 0 0 0
thereof secured
by mortgages
on immovable
property, SMEs
Total sum 0 0 0 0 0 0 0
Ø CCF (%) 0 0 0 0 0 0 0
EaD 0 0 0 0 0 0 0
Ø EaD 0 0 0 0 0 0 0
thereof secured
by mortgages
on immovable
property,
excluding SMEs
Total sum 0 0 0 0 0 0 0
Ø CCF (%) 0 0 0 0 0 0 0
EaD 0 0 0 0 0 0 0
Ø EaD 0 0 0 0 0 0 0
thereof qualified
revolving
Total sum 0 0 0 0 0 0 0
Ø CCF (%) 0 0 0 0 0 0 0
EaD 0 0 0 0 0 0 0
Ø EaD 0 0 0 0 0 0 0
thereof other
SMEs
Total sum 48 486 161 38 11 16 761
Ø CCF (%) 23 23 26 28 25 33 24
EaD 11 112 40 10 3 5 182
Ø EaD 0 0 0 0 0 0 0
thereof other,
excluding SMEs
Total sum 69 62 20 5 2 3 160
Ø CCF (%) 28 27 30 37 22 24 28
EaD 20 17 6 2 0 1 45
Ø EaD 0 0 0 0 0 0 0
Total
Total sum 4,984 21,385 6,022 1,912 939 280 35,521
Ø CCF (%) 47 39 32 42 27 26 39
EaD 2,863 8,288 1,629 706 229 72 13,786
Ø EaD 31 25 10 18 8 1 23
1 Securities lending and repurchase transactions are not included.
2 EaD is calculated from the assessment basis, CCFs, collateral deposits and withdrawals, and substitution effects.

Introduction Equity capital Risk-oriented overall bank management Specific risk management Appendix 37
The following table shows the scope of the credit risk mitigation
effects of financial collateral, guarantees, credit derivatives, mort-
gage liens and life insurances under the IRBA. In addition to the
collateral in the SACR, under the IRBA some physical and other
collateral which is only eligible for recognition under the IRBA is
also offset. In the table below, financial collateral and IRBA collat-
eral are shown separately from the guarantees.
Table 15: Total collateralised IRBA exposures1
Asset class
€m
Financial
collateral
Guarantees Life
insurances
Credit
derivatives
Mortgage
liens
Other IRBA-
collateral2
Total
Central governments or central banks 31 377 0 0 0 0 407
Institutions 1,504 2,696 0 20 14 50 4,284
Corporates 1,819 8,779 164 729 8,864 3,955 24,312
thereof specialised lending 134 346 46 0 5,033 0 5,560
thereof SMEs 709 611 38 0 1,835 836 4,028
Retail 2,294 264 1,161 0 52,179 281 56,180
Secured by mortgages on
immovable property 806 29 961 0 46,889 1 48,686
thereof SMEs 8 20 12 0 946 0 987
Qualifying revolving 0 0 0 0 0 0 0
Other 1,489 235 200 0 5,290 280 7,494
thereof SMEs 159 184 31 0 803 279 1,458
Other non credit-obligation assets 0 0 0 0 0 0 0
Total 2016 5,649 12,115 1,325 749 61,058 4,287 85,183
Total 2015 7,330 9,840 1,339 563 57,387 4,137 80,596
1 For reasons of materiality, secured investment positions are not represented.
2 Amongst others financial receivables (release of covenant) and other physical collateral.
The calculation of collateral is based on market values weighted
with recovery rates. These recovery rates are based on empirical
data and form part of the LGD models. By definition, the rates
cannot exceed 100%; therefore, the figures shown are normally
lower than the market values. By contrast, under the IRBA the
substitution approach is used to offset guarantees and credit de-
rivatives. The protection therefore does not take effect in the LGD,
as is the case with financial and other IRBA collateral, but via the
substitution of the debtor’s risk parameters with those of the guar-
antor. Alternatively, the double-default procedure may be used in
the IRBA.
Table 53 in the Appendix contains an overview of the exposure-
weighted averages of the credit risk parameters PD and LGD by
asset class and relevant geographical location (countries in which
Commerzbank has been authorised or has a branch or a subsidi-
ary).
Commerzbank Group’s SACR portfolio
The portfolios currently excluded from the IRBA are measured in
accordance with SACR regulations as permitted under partial use
provisions. In contrast to the IRBA, the SACR is largely based on a
flat risk weighting or external ratings. Commerzbank has nominat-
ed the rating agencies Standard & Poor’s Rating Services, Moody’s
Investors Service and FitchRatings for the use of external ratings.
Where an external credit rating is available for a position, that
external rating is used to determine the risk weighting. Where two
or more external credit ratings are available for one position, the
risk weighting is assigned in accordance with the provisions of
Article 138 CRR.
For unrated positions, if the conditions set out in Articles 139
and 140 CRR are met, a risk weighting is calculated on the basis of
a derived credit rating. In all other cases, the position is treated as
an unrated exposure.
External ratings for positions in local currency are not used to
derive risk weightings for foreign currency exposures.
SACR portfolio by risk weightings The risk weightings deter-
mined by external ratings or flat risk weightings and the alloca-
tions of the exposures to these risk weightings are shown below.
The table shows the SACR exposures before and after credit risk
mitigation (CRM) according to part 3 title II chapter 4 CRR.

38 Commerzbank Disclosure Report 2016
Table 16: Exposures in the Standard Approach to Credit Risk before credit risk mitigation
Risk weightings (RW)1
Asset class €m
0% 2% 10% 20% 35% 50% 75% 100% 150% 250% Other RW
Total
Central gov. or central banks 48,392 0 0 0 0 206 0 0 0 0 0 48,598
Regional gov. or local authorities 17,308 0 0 7,203 0 397 0 39 0 0 0 24,947
Public-sector entities 8,513 0 0 1,745 0 25 0 1 0 0 0 10,284
Multilateral development banks 354 0 0 0 0 0 0 0 0 0 0 354
International organisations 345 0 0 0 0 0 0 0 0 0 0 345
Institutions 465 2,769 0 2,339 0 214 0 3 0 0 0 5,790
Corporates 0 1,832 0 331 0 1,360 0 5,787 0 0 0 9,309
thereof SMEs 0 0 0 0 0 90 0 531 0 0 0 622
Retail 0 0 0 0 0 0 1,345 0 0 0 0 1,345
thereof SMEs 0 0 0 0 0 0 55 0 0 0 0 55
Secured by mortgages on
immovable property 0 0 0 0 1,303 178 0 0 0 0 0 1,481
thereof SMEs 0 0 0 0 0 0 0 0 0 0 0 0
Defaulted positions 0 0 0 0 0 0 0 50 340 0 0 390
Particularly high risk exposures 0 0 0 0 0 0 0 0 35 0 0 35
Covered bonds 0 0 0 100 0 0 0 0 0 0 0 100
Collective investment undertakings 0 0 0 0 0 0 0 224 0 0 531 755
Other items 0 0 0 0 0 0 0 289 0 2,666 0 2,955
Equity exposures 0 0 0 0 0 0 0 595 0 245 0 840
Total 2016 75,378 4,601 0 11,718 1,303 2,380 1,345 6,987 375 2,911 531 107,530
Total 2015 67,019 4,622 0 14,955 1,236 3,305 1,432 11,959 539 2,924 489 108,480
1 No positions in RW 70%.
Table 17: Exposures in the Standard Approach to Credit Risk after credit risk mitigation
Risk weightings (RW)1
Asset class €m
0% 2% 10% 20% 35% 50% 75% 100% 150% 250% Other RW
Total
Central gov. or central banks 53,359 0 0 19 0 221 0 0 0 0 0 53,600
Regional gov. or local authorities 18,124 0 0 7,361 0 397 0 39 0 0 0 25,921
Public-sector entities 8,828 0 0 1,583 0 10 0 1 0 0 0 10,423
Multilateral development banks 413 0 0 0 0 0 0 0 0 0 0 413
International organisations 345 0 0 0 0 0 0 0 0 0 0 345
Institutions 466 2,769 0 2,061 0 241 0 3 0 0 0 5,541
Corporates 0 1,832 0 337 2 1,037 0 5,192 0 0 0 8,400
thereof SMEs 0 0 0 0 0 5 0 421 0 0 0 425
Retail 0 0 0 0 0 0 1,204 0 0 0 0 1,204
thereof SMEs 0 0 0 0 0 0 50 0 0 0 0 50
Secured by mortgages on
immovable property 0 0 0 0 1,303 178 0 0 0 0 0 1,481
thereof SMEs 0 0 0 0 2 18 0 0 0 0 0 20
Defaulted positions 0 0 0 0 0 0 0 34 333 0 0 367
Particularly high risk exposures 0 0 0 0 0 0 0 0 35 0 0 35
Covered bonds 0 0 0 100 0 0 0 0 0 0 0 100
Collective investment undertakings 0 0 0 0 0 0 0 224 0 0 531 755
Other items 0 0 0 0 0 0 0 289 0 2,666 0 2,955
Equity exposures 0 0 0 0 0 0 0 595 0 245 0 840
Total 2016 81,535 4,601 0 11,461 1,306 2,084 1,204 6,377 368 2,911 531 112,379
Total 2015 75,359 4,622 0 14,442 1,238 2,006 1,251 8,998 533 2,924 489 111,862
1 No positions in RW 70%.

Introduction Equity capital Risk-oriented overall bank management Specific risk management Appendix 39
In order to mitigate credit risk in the SACR, the Commerzbank
Group takes financial collateral and guarantees into consideration.
These will be dealt with separately in the section risk mitigation.
Furthermore, collateral in the form of property charges also re-
duces the risk weighting.
To determine the SACR exposure before credit risk mitigation,
the nominal value before credit risk mitigation is multiplied by the
respective SACR conversion factor in accordance with Article 111
CRR. The risk exposure after credit risk mitigation corresponds to
the value of the exposure reduced by the amount of the collateral
value taking into account the conversion factors. For the SACR risk
exposure, in contrast to the IRBA, the valuation allowances based
on each of the positions are deducted.
Under the SACR, guarantees are treated according to the sub-
stitution principle. This means that the borrower’s risk weighting
is replaced by that of the guarantor. Consequently, the guaranteed
amount is transferred from the borrower’s exposure class to that
of the guarantor. However, this shift only takes place if the risk
weighting of the guarantor is lower than that of the borrower. This
is why the exposure before CRM for assets guaranteed by central
governments and central banks, for example, is less than after
CRM. This can be seen in the table under the 0% risk weighting.
Past due positions are shown with a risk weighting of 150%.
Depending on the valuation allowances based on them (SLLP, Port
LLP impaired) or the collateral, a risk weighting of 100% can be
applied or they may be shifted to another exposure class.
The following table shows the scope of the credit risk mitiga-
tion effects of financial collateral, guarantees, life insurances,
credit derivatives and mortgage liens under the SACR. The effec-
tively secured risk exposures, i.e. taking into consideration all of
the relevant haircuts for the collateral, are allocated to the SACR
exposure class. In taking financial collateral into account as a
credit risk mitigation technique, Commerzbank generally uses the
comprehensive method as defined under Articles 223 to 228 CRR.
In doing so, the risk exposure value for the default risk position is
reduced by the value of the financial collateral.
Table 18: Collateralised SACR risk exposures1
Asset class
€m
Financial
collateral
Guarantees Life
insurances
Credit
derivatives
Mortgage
liens
Total
Central governments or central banks 0 0 0 0 0 0
Regional governments or local authorities 1 22 0 0 0 23
Public-sector entities 1 212 0 0 0 212
Institutions 238 56 0 0 0 294
Corporates 618 316 6 0 197 1,137
thereof SMEs 92 90 0 0 16 199
Retail 111 27 3 0 1,284 1,424
thereof SMEs 2 0 0 0 4 6
Secured by mortgages on immovable property 0 0 0 0 0 0
thereof SMEs 0 0 0 0 0 0
Defaulted positions 1 21 0 0 22 43
Total 2016 970 653 9 0 1,503 3,134
Total 2015 803 4,447 16 0 1,702 6,969
1 For reasons of materiality, secured investment positions are not presented.
The secured positions shown under mortgage liens are the expo-
sures that are allocated to the SACR exposure class “Exposures
secured by immovable property”. For the purposes of comparabil-
ity with the figures shown under the IRBA, this exposure class is
not presented separately; exposures secured by immovable prop-
erty are instead classified according to the borrower’s exposure
class.
40 Commerzbank Disclosure Report 2016
Overarching portfolio analyses
This section provides an overview of the total portfolio containing
default risks with an assessment basis1 amounting to €524bn as at
31 December 2016.
We show the sum of SACR and IRBA positions with their as-
sessment basis (risk exposure value), as defined in Articles 111 ff.
and 151 ff. CRR. The IRBA assessment basis for loans is the
amount claimed by the customer. Unlike with the volume of assets
determined in accordance with IFRS accounting standards, valua-
tion allowances are not deducted. Off-balance-sheet positions re-
late to the amount committed to but not yet claimed by the cus-
tomer. They are not weighted with the conversion factor. For
securities, the IRBA assessment basis is determined as the higher
of the acquisition costs or the sum of the carrying amount and de-
fault risk-related write-downs. For derivative positions, the credit
equivalent amount as defined in Article 271 ff. CRR is applied. The
SACR assessment basis is calculated using the IFRS carrying value
of the positions, taking into account the write-downs in the last
approved annual financial statements. The assessment basis in-
cludes all positions subject to credit risks, regardless of whether
the positions are listed in the banking or the trading book.
Effectively securitised positions are not included in the tables
below. In accordance with Articles 243 and 244 CRR, positions
are deemed to be effectively securitised if there has been an ef-
fective and operative transfer of risk. This applies regardless of
whether these are traditionally or synthetically securitised posi-
tions. Securitisation positions arising from Group companies in-
cluded in this Disclosure Report acting as investors or sponsors
have also not been shown. Due to their particular significance,
these are shown in the separate chapter on securitisations.
Other non-loan-related assets and other items, respectively, are
only listed when they are characterised as claims. These are main-
ly cash items in the process of collection and accrued items. Other
non-loan-related assets which are largely formed through tangible
assets as well as other positions which are not characterised as
claims are not included in the following tables. Only positions that
are exposed to credit risks are shown.
1 Original risk position before applying conversion factors.

Introduction Equity capital Risk-oriented overall bank management Specific risk management Appendix 41
The selected country clusters correspond to the geographical clas-
sification of the assessment basis used for internal purposes.
Table 19: Assessment basis by country cluster (independent of segment classification)
Asset class
€m
Germany Western
Europe
(without
Germany)
Central
and
Eastern
Europe
North
America
Asia Other Total
SACR
Central governments or central banks 20,918 17,877 9,633 220 0 5 48,653
Regional governments or local authorities 16,358 6,504 227 2,625 146 0 25,860
Public-sector entities 9,572 981 29 22 0 0 10,605
Multilateral development banks 0 81 0 0 0 273 354
International organisations 0 0 0 0 0 345 345
Institutions 3,936 1,072 27 4 0 752 5,791
Corporates 2,499 4,160 2,393 770 19 111 9,952
thereof SMEs 151 90 521 0 0 0 762
Retail 4,273 46 896 5 10 5 5,235
thereof SMEs 121 0 9 0 0 0 131
Secured by mortgages on immovable property 202 6 1,282 0 0 0 1,490
thereof SMEs 39 0 0 0 0 0 40
Defaulted positions 101 238 194 20 11 0 564
Positions of particularly high risk 35 0 0 0 0 0 35
Covered bonds 0 100 0 0 0 0 100
Institutions/corporates with short-term
credit assessment 0 0 0 0 0 0 0
Collective investment undertakings 755 0 0 0 0 0 755
Other items 2,608 85 128 0 0 0 2,821
Total SACR 61,259 31,150 14,809 3,666 187 1,491 112,561
IRBA
Central governments or central banks 79 4,539 350 3,951 10,859 2,392 22,170
Institutions 6,758 22,845 2,943 5,532 11,585 6,898 56,561
Corporates 105,293 64,664 12,954 19,200 8,020 4,030 214,161
thereof specialised lending 15,186 9,833 2,476 477 197 1,555 29,723
thereof SMEs 11,009 624 3,188 33 104 12 14,970
Retail 104,009 1,095 11,252 170 330 131 116,988
Secured by mortgages on immovable
property 58,029 569 6,809 87 127 48 65,669
thereof SMEs 599 6 533 4 0 0 1,142
Qualifying revolving 12,463 112 18 24 32 33 12,682
Other 33,517 414 4,425 59 171 50 38,636
thereof SMEs 11,244 68 1,732 18 48 1 13,111
Other non credit-obligation assets 1,511 6 400 0 1 10 1,927
Total IRBA 217,650 93,148 27,899 28,853 30,795 13,461 411,806
Total 2016 278,908 124,299 42,708 32,519 30,982 14,952 524,367
Total 2015 263,828 135,377 43,227 33,857 30,225 19,543 526,057
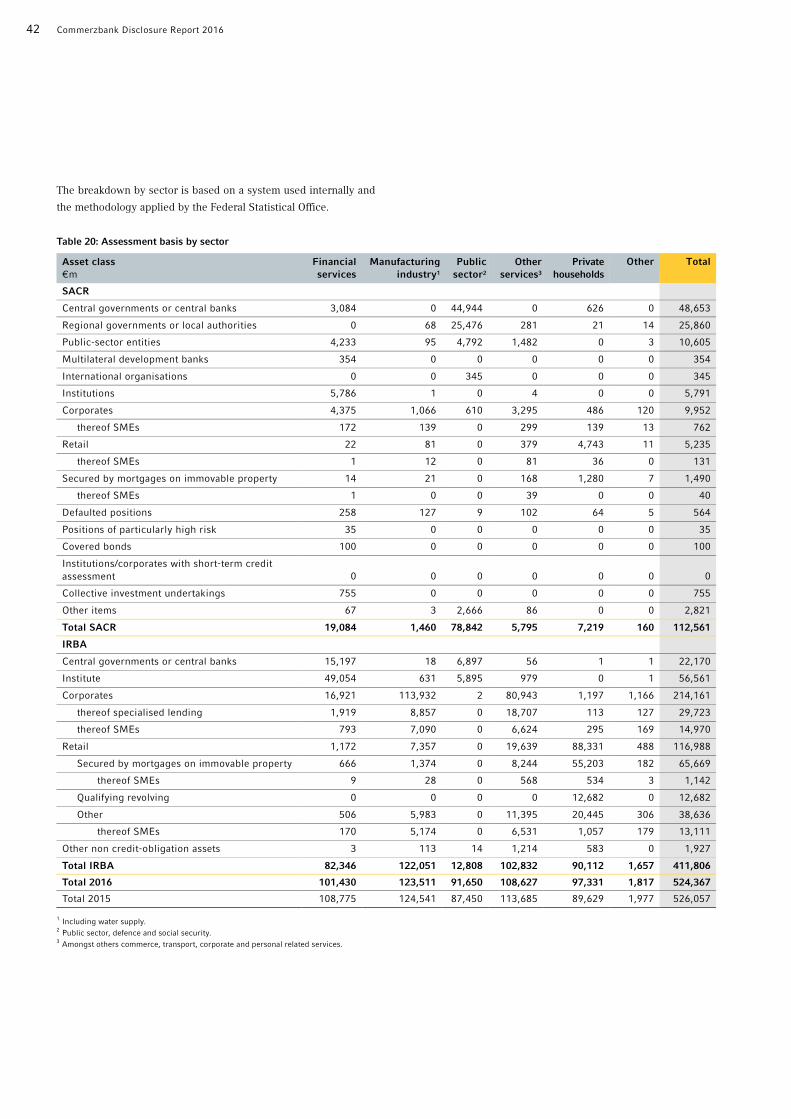
42 Commerzbank Disclosure Report 2016
The breakdown by sector is based on a system used internally and
the methodology applied by the Federal Statistical Office.
Table 20: Assessment basis by sector
Asset class
€m
Financial
services
Manufacturing
industry1
Public
sector2
Other
services3
Private
households
Other Total
SACR
Central governments or central banks 3,084 0 44,944 0 626 0 48,653
Regional governments or local authorities 0 68 25,476 281 21 14 25,860
Public-sector entities 4,233 95 4,792 1,482 0 3 10,605
Multilateral development banks 354 0 0 0 0 0 354
International organisations 0 0 345 0 0 0 345
Institutions 5,786 1 0 4 0 0 5,791
Corporates 4,375 1,066 610 3,295 486 120 9,952
thereof SMEs 172 139 0 299 139 13 762
Retail 22 81 0 379 4,743 11 5,235
thereof SMEs 1 12 0 81 36 0 131
Secured by mortgages on immovable property 14 21 0 168 1,280 7 1,490
thereof SMEs 1 0 0 39 0 0 40
Defaulted positions 258 127 9 102 64 5 564
Positions of particularly high risk 35 0 0 0 0 0 35
Covered bonds 100 0 0 0 0 0 100
Institutions/corporates with short-term credit
assessment 0 0 0 0 0 0 0
Collective investment undertakings 755 0 0 0 0 0 755
Other items 67 3 2,666 86 0 0 2,821
Total SACR 19,084 1,460 78,842 5,795 7,219 160 112,561
IRBA
Central governments or central banks 15,197 18 6,897 56 1 1 22,170
Institute 49,054 631 5,895 979 0 1 56,561
Corporates 16,921 113,932 2 80,943 1,197 1,166 214,161
thereof specialised lending 1,919 8,857 0 18,707 113 127 29,723
thereof SMEs 793 7,090 0 6,624 295 169 14,970
Retail 1,172 7,357 0 19,639 88,331 488 116,988
Secured by mortgages on immovable property 666 1,374 0 8,244 55,203 182 65,669
thereof SMEs 9 28 0 568 534 3 1,142
Qualifying revolving 0 0 0 0 12,682 0 12,682
Other 506 5,983 0 11,395 20,445 306 38,636
thereof SMEs 170 5,174 0 6,531 1,057 179 13,111
Other non credit-obligation assets 3 113 14 1,214 583 0 1,927
Total IRBA 82,346 122,051 12,808 102,832 90,112 1,657 411,806
Total 2016 101,430 123,511 91,650 108,627 97,331 1,817 524,367
Total 2015 108,775 124,541 87,450 113,685 89,629 1,977 526,057
1 Including water supply.
2 Public sector, defence and social security. 3 Amongst others commerce, transport, corporate and personal related services.

Introduction Equity capital Risk-oriented overall bank management Specific risk management Appendix 43
The breakdown according to residual term is based on maturity.
Overnight receivables include call and overnight transactions and
credit lines that can be terminated at any time.
Table 21: Assessment basis by time to maturity Asset class | €m Due on
demand
>1 day to 3
months
>3 months
to 1 year
>1 year to
5 years
Over 5
years
Total
SACR
Central governments or central banks 20,866 1,832 2,056 11,023 12,877 48,653
Regional governments or local authorities 940 662 1,205 7,347 15,707 25,860
Public-sector entities 177 2,947 2,326 3,711 1,444 10,605
Multilateral development banks 0 0 0 81 273 354
International organisations 0 0 25 320 0 345
Institutions 2,012 2,306 395 740 337 5,791
Corporates 2,853 909 612 1,496 4,081 9,952
thereof SMEs 95 52 133 288 194 762
Retail 4,603 19 78 99 436 5,235
thereof SMEs 30 1 24 5 71 131
Secured by mortgages on immovable property 728 5 8 51 698 1,490
thereof SMEs 0 0 0 9 30 40
Defaulted positions 247 7 12 49 250 564
Particularly high risk positions 35 0 0 0 0 35
Covered bonds 0 0 100 0 0 100
Institutions/corporates with short-term credit
assessment 0 0 0 0 0 0
Collective investment undertakings 0 0 0 0 755 755
Other items 69 0 0 0 2,752 2,821
Total SACR 32,531 8,686 6,817 24,917 39,611 112,561
IRBA
Central governments or central banks 13,729 763 1,267 3,625 2,786 22,170
Institutions 8,727 7,720 13,591 14,626 11,897 56,561
Corporates 52,539 17,954 26,149 79,855 37,663 214,161
thereof specialised lending 2,995 627 3,496 9,622 12,984 29,723
thereof SMEs 4,163 1,318 2,281 3,536 3,672 14,970
Retail 28,043 1,675 5,412 10,371 71,487 116,988
Secured by mortgages on immovable property 189 250 1,170 4,372 59,689 65,669
thereof SMEs 3 2 9 83 1,046 1,142
Qualifying revolving 12,671 5 4 3 0 12,682
Other 15,183 1,420 4,239 5,996 11,799 38,636
thereof SMEs 9,072 637 964 1,406 1,032 13,111
Other non credit-obligation assets 1,615 0 0 0 312 1,927
Total IRBA 104,653 28,111 46,420 108,477 124,145 411,806
Total 2016 137,184 36,797 53,236 133,394 163,756 524,367
Total 2015 122,341 36,039 60,699 133,205 173,773 526,057
Table 54 in the Appendix provides an overview of the average as-
sessment basis during the reporting period by exposure class over
the four quarters of 2016.
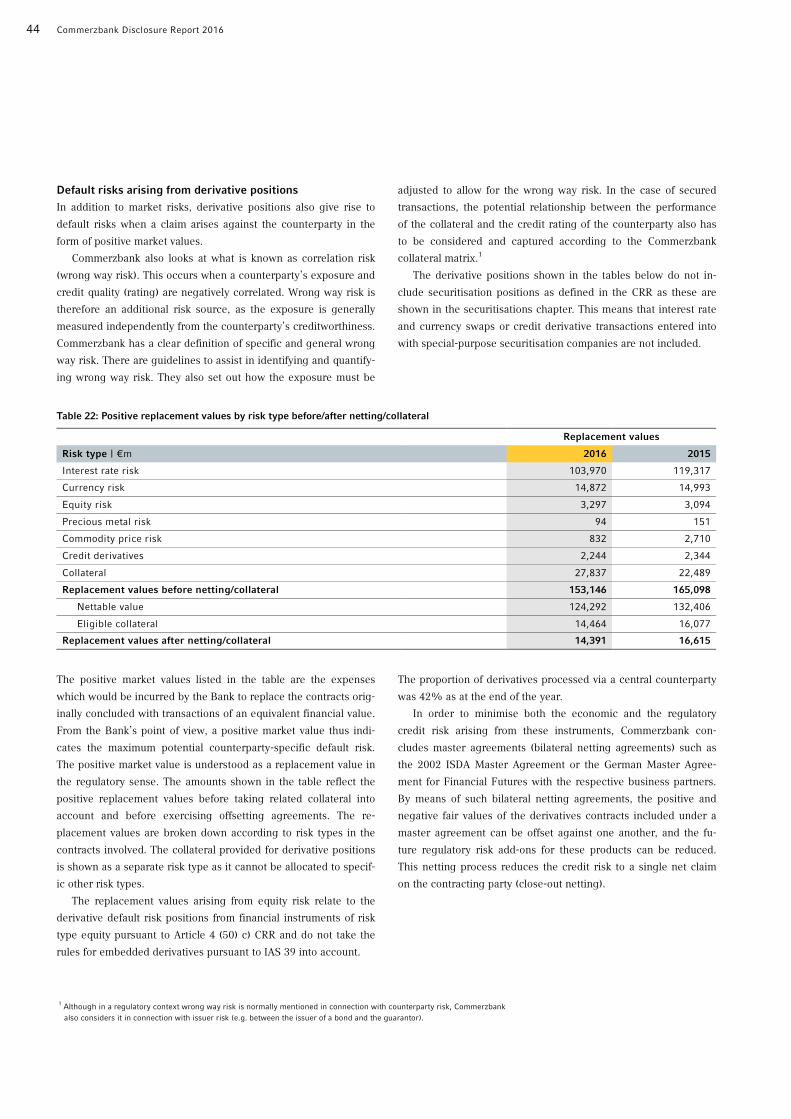
44 Commerzbank Disclosure Report 2016
Default risks arising from derivative positions
In addition to market risks, derivative positions also give rise to
default risks when a claim arises against the counterparty in the
form of positive market values.
Commerzbank also looks at what is known as correlation risk
(wrong way risk). This occurs when a counterparty’s exposure and
credit quality (rating) are negatively correlated. Wrong way risk is
therefore an additional risk source, as the exposure is generally
measured independently from the counterparty’s creditworthiness.
Commerzbank has a clear definition of specific and general wrong
way risk. There are guidelines to assist in identifying and quantify-
ing wrong way risk. They also set out how the exposure must be
adjusted to allow for the wrong way risk. In the case of secured
transactions, the potential relationship between the performance
of the collateral and the credit rating of the counterparty also has
to be considered and captured according to the Commerzbank
collateral matrix.1
The derivative positions shown in the tables below do not in-
clude securitisation positions as defined in the CRR as these are
shown in the securitisations chapter. This means that interest rate
and currency swaps or credit derivative transactions entered into
with special-purpose securitisation companies are not included.
Table 22: Positive replacement values by risk type before/after netting/collateral
Replacement values
Risk type | €m 2016 2015
Interest rate risk 103,970 119,317
Currency risk 14,872 14,993
Equity risk 3,297 3,094
Precious metal risk 94 151
Commodity price risk 832 2,710
Credit derivatives 2,244 2,344
Collateral 27,837 22,489
Replacement values before netting/collateral 153,146 165,098
Nettable value 124,292 132,406
Eligible collateral 14,464 16,077
Replacement values after netting/collateral 14,391 16,615
The positive market values listed in the table are the expenses
which would be incurred by the Bank to replace the contracts orig-
inally concluded with transactions of an equivalent financial value.
From the Bank’s point of view, a positive market value thus indi-
cates the maximum potential counterparty-specific default risk.
The positive market value is understood as a replacement value in
the regulatory sense. The amounts shown in the table reflect the
positive replacement values before taking related collateral into
account and before exercising offsetting agreements. The re-
placement values are broken down according to risk types in the
contracts involved. The collateral provided for derivative positions
is shown as a separate risk type as it cannot be allocated to specif-
ic other risk types.
The replacement values arising from equity risk relate to the
derivative default risk positions from financial instruments of risk
type equity pursuant to Article 4 (50) c) CRR and do not take the
rules for embedded derivatives pursuant to IAS 39 into account.
The proportion of derivatives processed via a central counterparty
was 42% as at the end of the year.
In order to minimise both the economic and the regulatory
credit risk arising from these instruments, Commerzbank con-
cludes master agreements (bilateral netting agreements) such as
the 2002 ISDA Master Agreement or the German Master Agree-
ment for Financial Futures with the respective business partners.
By means of such bilateral netting agreements, the positive and
negative fair values of the derivatives contracts included under a
master agreement can be offset against one another, and the fu-
ture regulatory risk add-ons for these products can be reduced.
This netting process reduces the credit risk to a single net claim
on the contracting party (close-out netting).
1 Although in a regulatory context wrong way risk is normally mentioned in connection with counterparty risk, Commerzbank
also considers it in connection with issuer risk (e.g. between the issuer of a bond and the guarantor).

Introduction Equity capital Risk-oriented overall bank management Specific risk management Appendix 45
For both regulatory reports and the internal measurement and
monitoring of credit commitments, these risk-mitigating tech-
niques are only used if Commerzbank considers them enforceable
in the jurisdiction in question, should the counterparty become
insolvent. Legal opinions are obtained from various international
law firms in order to verify enforceability.
Similar to the master agreements are the collateral agreements
(e.g. collateralisation annex for financial futures contracts, Credit
Support Annex), which Commerzbank concludes with its business
partners to secure the net claim or liability remaining after netting
(receipt or provision of collateral). As a rule, this collateral man-
agement reduces credit risk by means of prompt, usually daily or
weekly, measurement and adjustment of the customer exposure.
The – mostly cash – collateral and netting opportunities shown in
the aforementioned table reduce the exposure to counterparties to
€14,391m (2015: €16,615m).
The basis for determining the offset amounts for the default
risk from derivative positions is not the positive market values but
instead the credit equivalent values. To determine the assessment
basis of derivative default risk positions, Commerzbank uses the
internal model method (IMM) pursuant to Article 283 ff. CRR and
the market valuation method pursuant to Article 274 CRR.
The approach to risk quantification under the IMM is generally
based on a risk simulation which generates future market scenari-
os and creates portfolio valuations based on these scenarios. Net-
ting and collateral agreements are taken into account.
In applying the internal model method, the EaD is defined per
counterparty as the product of the alpha factor and the calculated
effective expected positive exposure E*. Risks that are not taken
into account when determining E*, correlation risks for example,
are included in the capital adequacy calculation through the alpha
factor. Banks can either estimate the alpha factor themselves or
use the supervisory value of 1.4. Commerzbank does not estimate
its own alpha factor, preferring instead to use the supervisory val-
ue to calculate exposure at default.
The credit equivalent values for the counterparty default risk
from derivative positions – including exchange-traded deriva-
tives – used to determine the (net) assessment basis amounted to
€9,972m at the end of 2016 using the market valuation method
and €15,526m using the internal model method. Credit equivalent
values effectively correspond to the exposures of on-balance-sheet
default risk positions, as a credit conversion factor of 100% is ap-
plied to derivative positions.
All operative units, branches and subsidiaries are, subject to
compliance with the regulations, authorised to use credit deriva-
tives to hedge credit risks in loan portfolios (i.e. purchase of hedg-
es). This allows them to hedge credit risks with a credit derivative
without having to sell or assign the loan.
Table 23: Breakdown of credit derivative business in the banking and trading book
Banking book Trading book
Type of credit derivative Nominal value | €m Buy position Sell position Buy position Sell position
Credit Default Swap 3,980 2,892 25,063 27,906
Total Return Swap 0 0 1,370 0
Total 2016 3,980 2,892 26,433 27,906
Total 2015 5,048 3,725 34,282 32,822
Contractual agreements that oblige Commerzbank to provide addi-
tional collateral to its counterparties in the event of a downgrading
of its own rating are governed in the Credit Support Annexes
which are established as part of the netting master agreements for
OTC derivative business.
The counterparty ratings (from Standard & Poor’s, Moody’s and
FitchRatings) are automatically uploaded on a daily basis via inter-
faces with Reuters, Telerate or Bloomberg into the collateral man-
agement system, which can simulate downgrade scenarios if nec-
essary. This makes it possible to carry out an advance analysis of
the potential effects on the collateral amounts. Commerzbank reg-
ularly reviews these collateral amounts as part of its stress test
assuming a simultaneous two-notch downgrade by the three big
rating agencies.
The results of this stress test are shown in the table below:

46 Commerzbank Disclosure Report 2016
Table 24: Additional contractual obligations
Additional contractual obligations | €m
Contractual derivative outflows and margin calls 584
thereof collateralised interest rate derivatives 100
thereof uncollateralised interest rate derivatives 484
Other contractual outflows and margin calls 33
Total 2016 617
Total 2015 617
As part of the new regulatory requirements under Basel 3, since
2015 the Commerzbank Group has additionally calculated the cap-
ital requirements for credit value adjustments (CVA risk) according
to Article 381 ff. CRR. For the portfolios of Commerzbank Aktien-
gesellschaft, CVA risk is calculated using the advanced method
according to Article 383 CRR via a sensitivity-based approach. For
the Group’s subsidiaries, the standardised approach according to
Article 384 CRR is applied. As at 31 December 2016 there were
eligible hedges according to Article 386 CRR: iTraxx senior finan-
cials of €508m and single name CDS of €94m. The capital re-
quirements for CVA risk amounted to €493m (€6,160m RWA) as at
31 December 2016 for the Group.
Loan loss provisions for default risks
Responsibility for processing non-performing loans for the core
business segments PSBC and CC lies with Group Intensive Care,
while Group Credit Risk Management Non Core is responsible for
the ACR segment. These two divisions bring together the specific
expert knowledge needed to support customers undergoing re-
structuring and to successfully process terminated commitments
including collateral realisation.
The lending risks reported under the IFRS category LaR (loans
and receivables) are taken into account by forming specific loan
loss provisions (SLLP), portfolio loan loss provisions (PLLP) and
general loan loss provisions (GLLP) for on- and off-balance-sheet
claims on the basis of the rules and regulations according to
IAS 37 and IAS 39.
When determining loan loss provisions, the fundamental crite-
ria include whether the claims are in default or not and whether
the claims are insignificant (exposure up to €5m) or significant
(exposure over €5m).
All claims which are in default under the Basel regulations are
defined as in default or non-performing. The following events are
decisive in determining the default of a customer:
• Imminent insolvency or over 90 days past due. • The Bank is assisting in the financial rescue measures of the customer with or without restructuring contributions.
• The Bank has demanded repayment of its claim. • The customer becomes insolvent.
A portfolio loan loss provision (PLLP impaired) is recognised
for insignificant defaulted claims using internal parameters. For
significant defaulted claims, the net present value of the expected
future cash flows is used to calculate both specific valuation allow-
ances and specific loan loss provisions (SLLP). The cash flows in-
clude both the expected payments and the expected proceeds
from realising collateral and other recoverable cash flows. The
loan loss provision is equal to the difference between the claim
amount and the net present value of all the expected cash flows.
The general loan loss provision (GLLP and PLLP non-impaired) for
on-balance-sheet and off-balance-sheet transactions is calculated
at individual transaction level using internal default parameters
(PD, LGD) and taking the LIP factor into account (LIP = loss identi-
fication period). Country risks are not accounted for separately
under IFRS but are included for the purposes of the SLLP calcula-
tion in the individual cash flow estimates and given a lump-sum
value in the LGD parameters when calculating portfolio loan loss
provisions.
Impairment tests are also performed for securities classified as
available for sale (AfS) and loans and receivables (LaR) if the fair
value is below the amortised acquisition costs due to the credit
rating. A review is conducted at each balance sheet date to deter-
mine whether there is objective evidence (trigger event) of im-
pairment and whether this case of loss will have an impact on the
expected cash flows. The trigger event review is based on the cre-
ditworthiness of the borrower/issuer or the issue rating, e.g. for
Pfandbriefe (German covered bonds) and ABS transactions. Trig-
ger events may include:

Introduction Equity capital Risk-oriented overall bank management Specific risk management Appendix 47
• Past due/default in payments of interest or principal on the part of the issuer/borrower.
• Restructuring of the debt instrument due to significant financial difficulties on the part of the issuer (of a security) or debtor (of
a loan).
• Increased probability of a restructuring procedure. • Increased probability of insolvency.
The trigger events are operationalised through a combination
of rating and fair value changes. To achieve this, the individual
securities are split into three groups (listed and unlisted equity
instruments and debt instruments) that form the basis for further
individual impairment reviews. If trigger events are found, an im-
pairment is recognised in the income statement and the corre-
sponding claim is deemed to be non-performing. For AfS positions,
if no trigger event is found but the fair value is below the amor-
tised acquisition cost, the revaluation reserve is charged. The im-
pairment amount is determined from the difference between the
amortised acquisition cost and the fair value.
The total amount of the loan loss provisions, insofar as they re-
late to claims on the balance sheet, is deducted from the respec-
tive balance sheet items. Provision for risks in off-balance-sheet
business – guarantees, endorsement liabilities, lending commit-
ments – is shown as other provisions for specific/portfolio risks in
lending business.
In accordance with the Group’s write-down policy, impaired
positions are written down to the net present value of the claim
two years after the notice of termination using existing loan loss
provisions and valuation allowances (SLLPs/PLLPs impaired).
Amounts recovered on claims written down are recognised in the
income statement.
The tables below on loan loss provisions show the total amount
of non-performing claims or those past due in the IFRS category
LaR, including the related loan loss provisions with the corre-
sponding write-downs grouped by sector and country of residence
of the respective borrower.
Past due claims refer to all claims that are in arrears by at least
one day up to 90 days and are not defined as loans in default un-
der consideration of the minimum threshold (2.5% of the limit or
€100).
The table below sets the total on-balance-sheet and off-balance
sheet claims from non-performing and past due claims against the
loan loss provisions, net allocations and direct write-downs. The
following definitions are used here:
• SLLP on-balance is the sum of specific loan loss provisions for significant claims, determined on the basis of individual cash
flow estimates.
• PLLP impaired on-balance is the sum of portfolio loan loss pro-visions for insignificant non-performing claims, determined on
the basis of internal risk parameters per portfolio.
• SLLP and PLLP impaired off-balance is the total sum of provi-sions for significant and insignificant off-balance sheet claims.
These provisions are determined in the same way as for on-
balance sheet claims.
• GLLP/PLLP non-impaired (NI) on-/off-balance is the sum of general loan loss provisions relating to past due claims.
The net additions column shows the net position from additions
and reversals of loan loss provisions for on-balance-sheet and off-
balance-sheet transactions. This does not include direct write-
downs and recoveries on written-down assets. These are shown
separately in the columns Direct write-ups/-downs and Recoveries
on written-down assets.
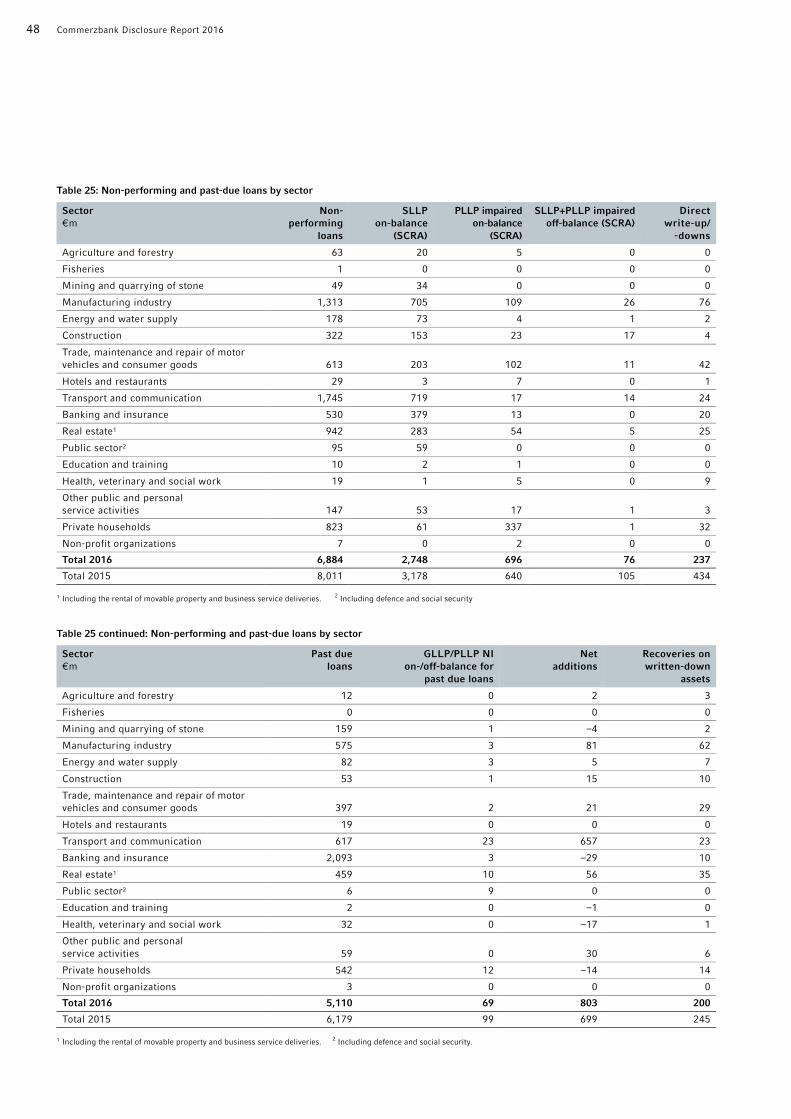
48 Commerzbank Disclosure Report 2016
Table 25: Non-performing and past-due loans by sector
Sector €m
Non-performing
loans
SLLP on-balance
(SCRA)
PLLP impaired on-balance
(SCRA)
SLLP+PLLP impaired off-balance (SCRA)
Direct write-up/
-downs
Agriculture and forestry 63 20 5 0 0
Fisheries 1 0 0 0 0
Mining and quarrying of stone 49 34 0 0 0
Manufacturing industry 1,313 705 109 26 76
Energy and water supply 178 73 4 1 2
Construction 322 153 23 17 4
Trade, maintenance and repair of motor
vehicles and consumer goods 613 203 102 11 42
Hotels and restaurants 29 3 7 0 1
Transport and communication 1,745 719 17 14 24
Banking and insurance 530 379 13 0 20
Real estate1 942 283 54 5 25
Public sector2 95 59 0 0 0
Education and training 10 2 1 0 0
Health, veterinary and social work 19 1 5 0 9
Other public and personal
service activities 147 53 17 1 3
Private households 823 61 337 1 32
Non-profit organizations 7 0 2 0 0
Total 2016 6,884 2,748 696 76 237
Total 2015 8,011 3,178 640 105 434
1 Including the rental of movable property and business service deliveries. 2 Including defence and social security
Table 25 continued: Non-performing and past-due loans by sector
Sector €m
Past due loans
GLLP/PLLP NI on-/off-balance for
past due loans
Net additions
Recoveries on written-down
assets
Agriculture and forestry 12 0 2 3
Fisheries 0 0 0 0
Mining and quarrying of stone 159 1 –4 2
Manufacturing industry 575 3 81 62
Energy and water supply 82 3 5 7
Construction 53 1 15 10
Trade, maintenance and repair of motor
vehicles and consumer goods 397 2 21 29
Hotels and restaurants 19 0 0 0
Transport and communication 617 23 657 23
Banking and insurance 2,093 3 –29 10
Real estate1 459 10 56 35
Public sector2 6 9 0 0
Education and training 2 0 –1 0
Health, veterinary and social work 32 0 –17 1
Other public and personal
service activities 59 0 30 6
Private households 542 12 –14 14
Non-profit organizations 3 0 0 0
Total 2016 5,110 69 803 200
Total 2015 6,179 99 699 245
1 Including the rental of movable property and business service deliveries. 2 Including defence and social security.

Introduction Equity capital Risk-oriented overall bank management Specific risk management Appendix 49
Commerzbank bases its definition of the total sum of non-
performing and past due claims on its accounting. Pursuant to Art.
315a (1) of the German Commercial Code, the Commerzbank
Group issues Group financial statements based on International
Financial Reporting Standards (IFRS). For this reason, the book
values according to IFRS are applied for the total amount of non-
performing and past due claims. Credit risk mitigation techniques
which can mitigate risks for the purposes of determining the capi-
tal requirement are not relevant for the determination of the claim
amount for accounting procedures.
The total non-performing and past due claims amount to
€12.0bn, of which €6.9bn is attributable to the default portfolio
(non-performing loans) and €5.1bn is attributable to past due
loans. In addition to the loan loss provisions presented below, col-
lateral value is also held against the total non-performing claims
and taken into account accordingly in the calculation of the SLLP,
PLLP and GLLP. The amounts recovered on written-down claims
amounting to €200m are booked as income in the loan loss provi-
sions.
Table 26: Non-performing and past-due loans by country cluster
Country cluster
€m
Non-
performing
loans
SLLP on-
balance
PLLP
impaired
on-balance
(SCRA)
SLLP+PLLP
impaired
off-balance
(SCRA)
Direct
write-up/
-downs
Past due
loans
GLLP/PLLP NI
on-/off-balance
for past due
loans
Germany 3,373 1,114 378 61 185 3,351 23
Western Europe (excl.
Germany) 1,246 667 11 2 25 607 26
Central and Eastern Europe 1,332 389 305 4 12 575 11
North America 67 46 0 0 0 34 3
Asia 187 92 1 0 9 193 0
Other 680 439 1 10 6 350 6
Total 2016 6,884 2,748 696 76 237 5,110 69
Total 2015 8,011 3,178 640 105 434 6,179 99
The breakdown by country cluster reflects the Commerzbank
Group’s focus on Germany and selected markets throughout Eu-
rope. This means that the vast majority of the loan loss provisions
are attributable to borrowers based in these regions.
The tables below only show the development of loan loss provi-
sions relating to the lending business. Only claims or loan com-
mitments under the IFRS category LaR and their corresponding
loan loss provisions are included in the tables. Write-downs on
securities are not recognised in loan loss provisions but in net in-
vestment income. Note 36 to the Group financial statements in the
Annual Report 2016 provides more details on this.
Table 27: Development of loan loss provision in 2016
Type of provision
€m
Opening
balance
Additions Reversals Utilisation Exchange
rate changes
Other
changes
Closing
balance
SLLP on-balance (SCRA) 2,557 1,179 429 952 22 –11 2,365
PLLP impaired on-balance (SCRA) 640 340 125 187 –11 40 696
SLLP+PLLP impaired off-balance (SCRA) 105 34 65 0 0 1 76
GLLP/PLLP NI on/off-balance 791 39 159 0 –7 0 665
Total 4,093 1,591 778 1,139 5 31 3,802
Table 28 shows the realised losses related to the lending business
over the reporting period in detail. Losses incurred in the lending
business refer to direct write-downs (net of write-ups) and the uti-
lisation of valuation allowances for claims classified as IRBA posi-
tions according to the CRR. Amounts recovered on written-down
claims reduce the realised loss.
In addition, table 29 shows the expected losses of the preced-
ing period for the non-defaulted portfolio.
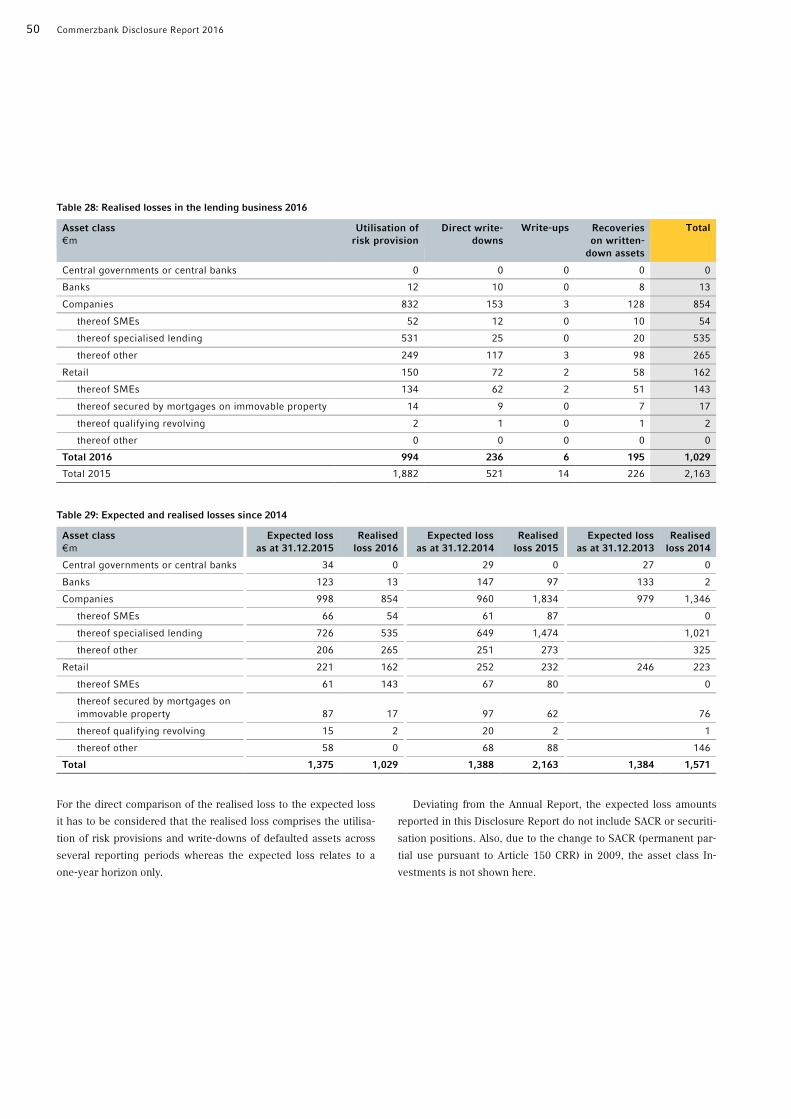
50 Commerzbank Disclosure Report 2016
Table 28: Realised losses in the lending business 2016
Asset class
€m
Utilisation of
risk provision
Direct write-
downs
Write-ups Recoveries
on written-
down assets
Total
Central governments or central banks 0 0 0 0 0
Banks 12 10 0 8 13
Companies 832 153 3 128 854
thereof SMEs 52 12 0 10 54
thereof specialised lending 531 25 0 20 535
thereof other 249 117 3 98 265
Retail 150 72 2 58 162
thereof SMEs 134 62 2 51 143
thereof secured by mortgages on immovable property 14 9 0 7 17
thereof qualifying revolving 2 1 0 1 2
thereof other 0 0 0 0 0
Total 2016 994 236 6 195 1,029
Total 2015 1,882 521 14 226 2,163
Table 29: Expected and realised losses since 2014
Asset class
€m
Expected loss
as at 31.12.2015
Realised
loss 2016
Expected loss
as at 31.12.2014
Realised
loss 2015
Expected loss
as at 31.12.2013
Realised
loss 2014
Central governments or central banks 34 0 29 0 27 0
Banks 123 13 147 97 133 2
Companies 998 854 960 1,834 979 1,346
thereof SMEs 66 54 61 87 0
thereof specialised lending 726 535 649 1,474 1,021
thereof other 206 265 251 273 325
Retail 221 162 252 232 246 223
thereof SMEs 61 143 67 80 0
thereof secured by mortgages on
immovable property 87 17 97 62 76
thereof qualifying revolving 15 2 20 2 1
thereof other 58 0 68 88 146
Total 1,375 1,029 1,388 2,163 1,384 1,571
For the direct comparison of the realised loss to the expected loss
it has to be considered that the realised loss comprises the utilisa-
tion of risk provisions and write-downs of defaulted assets across
several reporting periods whereas the expected loss relates to a
one-year horizon only.
Deviating from the Annual Report, the expected loss amounts
reported in this Disclosure Report do not include SACR or securiti-
sation positions. Also, due to the change to SACR (permanent par-
tial use pursuant to Article 150 CRR) in 2009, the asset class In-
vestments is not shown here.
Introduction Equity capital Risk-oriented overall bank management Specific risk management Appendix 51
Investments in the banking book
Investment risks or shareholder risks are potential losses arising
from the provision of equity capital to investments as a result of a
fall in their value. They can be caused by general market
fluctuations or company-specific factors.
Composition of investments
Commerzbank’s portfolio of holdings is broken down in accord-
ance with its significance to business policy. The bulk of the in-
vestments held as financial assets (banking book) and holdings in
consolidated companies are designed to further the Bank’s busi-
ness objectives by supporting business lines/segments in the Bank
(segment-supporting investments) or by having a strategic man-
agement or service function for the Group as a whole (other stra-
tegic investments).
There are also other non-strategic investments, some of which
are allocated to the Assets & Capital Recovery segment. A divest-
ment concept is applied here, the aim of which is to optimise
Commerzbank’s market value, capital and income statement under
appropriate market conditions.
Risk management
The investment risks are managed centrally as part of the ongoing
management and monitoring of Commerzbank’s holdings by the
Group Development & Strategy department and locally by the
segments. The central monitoring is primarily concentrated on the
non-strategic investments, while the strategic investments that
form part of the Bank’s core business are controlled on a decen-
tralised basis by the Commerzbank segments responsible for them.
The strategic investments are mainly majority holdings.
Under the “three lines of defence” principle, aimed at protect-
ing against undesirable risks and set out by Commerzbank in the
overall risk strategy, the respective operational segments respon-
sible therefore represent the first line of defence for investment
risks, while Group Development & Strategy, as the area responsi-
ble for the investment risk strategy, represents the second line of
defence.
Regulatory valuation of investments
The Commerzbank Group and accordingly the group companies
included in the disclosure are, as IRBA banks as defined in Article
147 CRR, generally obliged to value investments in accordance
with the IRBA rules. For investments entered into prior to 1 Janu-
ary 2008, Commerzbank has opted to apply grandfathering. These
investment positions are temporarily excluded from the IRBA and
treated in accordance with the SACR rules. They are given a risk
weighting of 100%. The CRR also allows items to be permanently
exempted from the IRBA. Since 31 December 2009 Commerzbank
has applied the partial use option pursuant to section 70 sentence
1 no. 9b SolvV and Article 150 CRR, and uses the SACR perma-
nently to value all investment positions which do not fall under the
above-mentioned temporary grandfathering option. Investments
that are associated with particularly high risk according to the def-
inition under Article 128 CRR, such as private equity investments
or venture capital investments, are recognised in the correspond-
ing SACR asset class.
Commercial valuation and accounting
Investments and shares in the banking book comprise equity in-
struments classified as available for sale (AfS) and those reported
in the financial statements as fully consolidated or using the equity
method. All equity instruments not held in the trading portfolio are
therefore accounted for in this category.
Investments classified as AfS are reported at their fair value if it
is available. Differences between historic costs and fair value are
reported as equity capital without effect on net income. Equity in-
struments that are unlisted or listed but not actively traded are
recognised at historic cost if their fair value is not reliably deter-
minable.
Listed investments are continuously monitored with regard to
their market price development. External analysts’ opinions and
share price forecasts (consensus forecasts) are included in the risk
assessment. Listed holdings are monitored by means of impair-
ment tests carried out at least quarterly by Group Finance in ac-
cordance with the impairment policy and tested for any significant
qualitative or quantitative indicators (trigger events) of impairment.
As soon as there are any indications of significant or lasting im-
pairment, unrealised losses are written down.
Risks arising from unlisted holdings are subject to regular mon-
itoring involving a database-supported year-end valuation, a moni-
toring of trigger events for relevant holdings to each balance sheet
reporting date and special monitoring of investments classified as
critical. Various valuation methods (e.g. capitalised earnings value,
net asset value, liquidation value) are used to quantify the risks,
depending on the book value, status (e.g. active, inactive, in liqui-
dation) and type of business activity (e.g. operational, property
holding company, holding) of the investment. If the intention is to
sell the investment, it will be written down, if necessary, to a lower
expected selling price; any appreciation in value would be report-
ed in the revaluation reserve without effect on net income. For
companies valued using the equity method, the valuation is equal
to the proportionate IFRS equity capital.

52 Commerzbank Disclosure Report 2016
Quantitative information on investments
This section covers investments as defined in Article 112 p) CRR.
This means that only equity investments that are not consolidated
for regulatory purposes but relate to the companies covered by
this report are shown. The definition of an investment in CRR is
wider than the usual accounting definition. For example, shares in
limited companies (GmbHs), profit-sharing certificates with equity
characteristics, promissory notes and derivative positions whose
underlying is an investment position have to be classified as in-
vestments for regulatory purposes. Classical forms of investments
nevertheless make up the majority of this CRR asset class.
The table below shows the book value and fair value of the in-
vestment instruments under IFRS as reported in the financial
statements for the investment groups relevant to the Group’s ob-
jectives and strategy.
Table 30: Valuation of investment instruments
Book value
(IFRS)
Fair value Market value
(listed positions)
Investment group | €m 2016 2015 2016 2015 2016 2015
Segment-supporting investments 448 454 448 457 5 5
thereof listed positions 2 2 2 5 5 5
thereof unlisted positions 445 452 445 452 0 0
Other strategic investments 35 141 35 141 0 0
Other investments 358 162 358 162 0 0
Funds and certificates 0 0 0 0 0 0
Investments total 840 757 840 759 5 5
For listed positions the market value is given as well. For listed
investments the book value under IFRS is their historic costs. Dif-
ferences between book value under IFRS and fair value of listed
investments result from the revaluation reserve.
For unlisted companies the book values under IFRS are used as
fair value. Special purpose vehicles (SPVs) are not shown as they
are not investments pursuant to regulatory definitions. The posi-
tions shown under Other strategic investments are exclusively un-
listed positions. Only €0.2m of the Other investments are listed
positions. All unlisted positions are classified as adequately diver-
sified investment portfolios.
Shares in investment funds are allocated to the investment
group Funds and certificates if the precise composition of the in-
vestment fund is not known and an average risk weighting sup-
plied by the investment company is not used for capital adequacy
purposes. Only shares in investment funds that invest wholly or
partly in investment instruments are relevant. Therefore, shares in
investment funds that are solely invested in fixed-income securi-
ties (e.g. bond funds) are not included here.
Table 31: Realised and unrealised profits/losses from investment instruments
Unrealised revaluation profit/loss
€m Realised profit/loss
from sale/liquidation
Total thereof accounted for
in CET1 capital
thereof accounted for
in Tier 2 capital
2016 114 102 102 0
2015 106 141 141 0
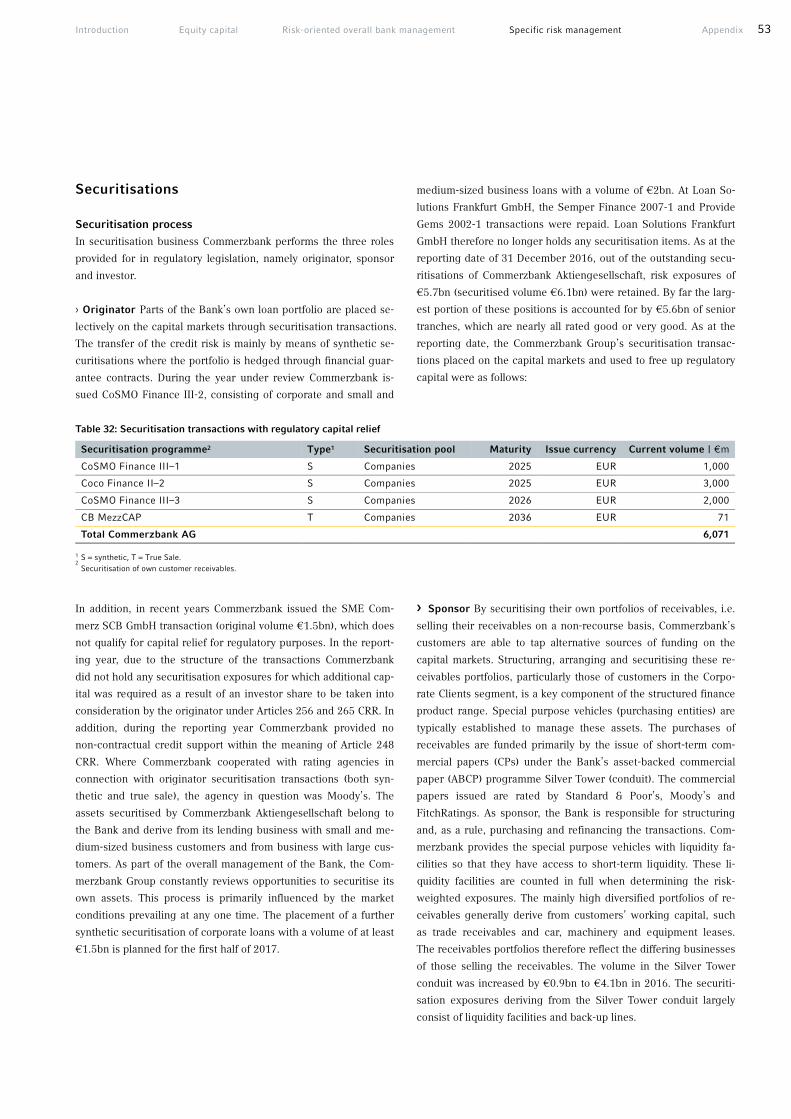
Introduction Equity capital Risk-oriented overall bank management Specific risk management Appendix 53
Securitisations
Securitisation process
In securitisation business Commerzbank performs the three roles
provided for in regulatory legislation, namely originator, sponsor
and investor.
› Originator Parts of the Bank’s own loan portfolio are placed se-
lectively on the capital markets through securitisation transactions.
The transfer of the credit risk is mainly by means of synthetic se-
curitisations where the portfolio is hedged through financial guar-
antee contracts. During the year under review Commerzbank is-
sued CoSMO Finance III-2, consisting of corporate and small and
medium-sized business loans with a volume of €2bn. At Loan So-
lutions Frankfurt GmbH, the Semper Finance 2007-1 and Provide
Gems 2002-1 transactions were repaid. Loan Solutions Frankfurt
GmbH therefore no longer holds any securitisation items. As at the
reporting date of 31 December 2016, out of the outstanding secu-
ritisations of Commerzbank Aktiengesellschaft, risk exposures of
€5.7bn (securitised volume €6.1bn) were retained. By far the larg-
est portion of these positions is accounted for by €5.6bn of senior
tranches, which are nearly all rated good or very good. As at the
reporting date, the Commerzbank Group’s securitisation transac-
tions placed on the capital markets and used to free up regulatory
capital were as follows:
Table 32: Securitisation transactions with regulatory capital relief
Securitisation programme2 Type1 Securitisation pool Maturity Issue currency Current volume | €m
CoSMO Finance III–1 S Companies 2025 EUR 1,000
Coco Finance II–2 S Companies 2025 EUR 3,000
CoSMO Finance III–3 S Companies 2026 EUR 2,000
CB MezzCAP T Companies 2036 EUR 71
Total Commerzbank AG 6,071
1 S = synthetic, T = True Sale. 2
Securitisation of own customer receivables.
In addition, in recent years Commerzbank issued the SME Com-
merz SCB GmbH transaction (original volume €1.5bn), which does
not qualify for capital relief for regulatory purposes. In the report-
ing year, due to the structure of the transactions Commerzbank
did not hold any securitisation exposures for which additional cap-
ital was required as a result of an investor share to be taken into
consideration by the originator under Articles 256 and 265 CRR. In
addition, during the reporting year Commerzbank provided no
non-contractual credit support within the meaning of Article 248
CRR. Where Commerzbank cooperated with rating agencies in
connection with originator securitisation transactions (both syn-
thetic and true sale), the agency in question was Moody’s. The
assets securitised by Commerzbank Aktiengesellschaft belong to
the Bank and derive from its lending business with small and me-
dium-sized business customers and from business with large cus-
tomers. As part of the overall management of the Bank, the Com-
merzbank Group constantly reviews opportunities to securitise its
own assets. This process is primarily influenced by the market
conditions prevailing at any one time. The placement of a further
synthetic securitisation of corporate loans with a volume of at least
€1.5bn is planned for the first half of 2017.
› Sponsor By securitising their own portfolios of receivables, i.e.
selling their receivables on a non-recourse basis, Commerzbank’s
customers are able to tap alternative sources of funding on the
capital markets. Structuring, arranging and securitising these re-
ceivables portfolios, particularly those of customers in the Corpo-
rate Clients segment, is a key component of the structured finance
product range. Special purpose vehicles (purchasing entities) are
typically established to manage these assets. The purchases of
receivables are funded primarily by the issue of short-term com-
mercial papers (CPs) under the Bank’s asset-backed commercial
paper (ABCP) programme Silver Tower (conduit). The commercial
papers issued are rated by Standard & Poor’s, Moody’s and
FitchRatings. As sponsor, the Bank is responsible for structuring
and, as a rule, purchasing and refinancing the transactions. Com-
merzbank provides the special purpose vehicles with liquidity fa-
cilities so that they have access to short-term liquidity. These li-
quidity facilities are counted in full when determining the risk-
weighted exposures. The mainly high diversified portfolios of re-
ceivables generally derive from customers’ working capital, such
as trade receivables and car, machinery and equipment leases.
The receivables portfolios therefore reflect the differing businesses
of those selling the receivables. The volume in the Silver Tower
conduit was increased by €0.9bn to €4.1bn in 2016. The securiti-
sation exposures deriving from the Silver Tower conduit largely
consist of liquidity facilities and back-up lines.
54 Commerzbank Disclosure Report 2016
› Investor The Commerzbank Group invests under its regulatory
banking book in securitisation positions. The Bank’s internal credit
risk strategy provides limited scope for entering into new securiti-
sation positions provided that the risk profile of each securitisation
position is subjected to a differentiated analysis and documenta-
tion. This allows transaction risk drivers that may impact directly
or indirectly on the securitised position’s risk content to be taken
into account. In the year under review Commerzbank invested in
senior-ranking securitisation positions, mainly backed by pools of
corporate loans and consumer loans.
Risk Management
The internal processes for monitoring the risk profile of securitisa-
tion exposures are based on the provisions of Articles 406 and 408
CRR and on the principles of the Minimum Requirements for Risk
Management (MaRisk) as amended. They apply equally to all se-
curitisation exposures, irrespective of whether they are part of the
regulatory trading or banking book, or whether Commerzbank acts
as the originator, sponsor or investor.
The processes put in place by the Bank take account of the in-
dividual risk profile of securitisation exposures on the basis of a
wide range of information sources. They ensure that various risks
directly and indirectly affecting the probability of default of the
securitised positions are monitored in a continuous and timely
manner. This also includes carrying out regular stress tests that
take account of macroeconomic factors and the individual risk pro-
file of the securitised positions.
› Originator The credit process for loans to customers does not
distinguish between loans which the Bank will securitise at a later
date and those for which it will continue to assume the risk. Trans-
actions which allow reliefs in capital for regulatory purposes are
subject to a monitoring process that ensures the continuous com-
pliance with the regulations on significant risk transfer according
to Articles 243 and 244 CRR. The amount to be retained in securit-
isation transactions in accordance with Article 405 CRR is re-
viewed regularly and published in the Investor Report. A potential
placement risk for Commerzbank’s transactions is taken fully into
account, as the receivables are included in full in the Bank’s risk
and capital management process up until the actual risk transfer
by means of securitisation and placement.
› Sponsor The customer transactions funded via conduits are sub-
ject to an ongoing credit process. A risk analysis of the transac-
tions is conducted when the transactions are structured and again
in regular reviews which are carried out annually and as circum-
stances require. A rating is assigned using the ABS rating systems
certified by the banking regulators (internal assessment approach).
For this purpose we take into account all significant risk drivers of
the securitised receivables portfolio (e.g. type of receivable, de-
fault rates, collateral provided, diversification, dilution risks, com-
mingling risks) and of the securitisation structure (e.g. whether
the creditor claims have a waterfall structure, credit enhance-
ments). Qualitative risk drivers ascertained from regular on-site
visits to the seller of receivables as well as the seller’s financial
position are also taken into account. For trade receivables, struc-
ture-inherent covers through credit insurance are taken into ac-
count in the rating model and credit analysis. Credit insurance is
used in order to mitigate concentration risk. The main counterpar-
ties here are Euler Hermes Kreditversicherungs AG and the Ger-
man branch of Coface S.A. Before any purchase of customer re-
ceivables, the minimum conditions agreed in the contract
documentation are reviewed and any non-qualifying receivables
are excluded. After the receivables have been bought, their quality
is reviewed continuously. If any potential problems come to light
another credit analysis of the structure is carried out.
› Investor Strict internal guidelines must be followed when acquir-
ing a new securitisation position. Such positions are subject to a
specific internal credit process that also ensures that the specific
requirements for securitisation positions regarding due diligence
and retention under Articles 405-406 CRR are met. In the credit
process applied to the Bank’s securitisation portfolio, the risk pro-
file of the securitisation positions is analysed quarterly or as cir-
cumstances require. In preparing a credit assessment, at the level
of the individual tranche a securitisation-specific rating system is
used which has been developed internally within the Bank, while
external standard models are also applied. In the case of resecurit-
isations, the analysis relates not only to the securitisation expo-
sures contained in the pool but also covers the underlying portfo-
lios on a risk basis (look-through principle). As with securitisation
exposures, the ranking of the individual tranches contained in the
pool within a securitisation structure are taken into account in this
analysis, as are the specific features of the asset classes and of the
different jurisdictions, in order to generate the expected aggregate
cash flow. The results are then used to model the entire waterfall
structure at the level of the resecuritisation.
Commerzbank takes into account not only the original default
risk of the securitised receivables but also secondary risks such as
market value risk, liquidity risk, legal risk and operational risk in-
sofar as they are relevant with a direct or indirect impact on the
default risk. This process looks, for example, at the performance
reports for the securitised receivables, changes in external ratings
and movements in the market value of the securitisation exposures.
When determining market price risk, changes relating to inter-
est rates, foreign currency rates or credit spreads, among others,
are taken into account for the risk assessment of each tranche. In
addition, the combination of various conventional risk measures
(e.g. VaR) ensures the appropriate management of market risk
concentrations at Group level.
Liquidity risk refers in this context to the risk that Com-
merzbank will be unable to meet its payment obligations on a day-
Introduction Equity capital Risk-oriented overall bank management Specific risk management Appendix 55
to-day basis. Liquidity risks from ABS transactions are modelled
conservatively in the internal liquidity risk model. Firstly, a worst
case assumption is made that Commerzbank has to take on virtual-
ly the entire funding of the purchase facilities provided to the spe-
cial purpose vehicles under the Silver Tower conduit. Secondly,
the Bank’s holdings of securitisation transactions only qualify as
liquid assets if they are eligible for rediscount at the European
Central Bank. These positions are only included in the liquidity
risk calculation after applying conservative discounts. With regard
to the Silver Tower conduit, it is assumed not only that external
refinancing of the conduit will be replaced by Commerzbank on
expiry, but also that additional drawdowns on credit lines by cus-
tomers of the conduit will have to be refinanced by Commerzbank.
Legal risk in the context of securitisation transactions is the
risk that the Bank might suffer losses as a result of flaws in legal
transaction structures or as a result of missing or flawed legal
documentation. Commerzbank’s independent Legal department is
responsible for examining legal structures and all transaction con-
tracts. In terms of content, risks are divided into those arising from
the sphere of the originator itself or those directly connected with
the portfolio to be securitised. The subsequent refinancing and
collateral structure is also a key element of legal structuring and
risk assessment.
As well as being associated with legal risk as a risk type under
the overall heading of operational risk, securitisation business is
subject to the Group-wide management of operational risks. It
therefore falls within the framework of the certified advanced
measurement approach used by Commerzbank to measure opera-
tional risks.
Regulatory valuation of securitisations
Securitisation positions in the banking book In the reporting
period, Commerzbank applied the regulations of both the IRBA
and the SACR for regulatory purposes.
› Originator The ratings-based approach is used for externally
rated securitisation exposures that have been retained from the
Commerzbank Group’s own securitisation transactions. Capital is
held against synthetic securitisation tranches that have been
placed on the market based on the risk weighting of the party
providing the collateral. Counterparties to the hedging instruments
used, e.g. financial guarantees, are institutional investors, whose
deposits serve as collateral, as well as multilateral development
banks. For all synthetic transactions the supervisory formula ap-
proach (SFA) is used.
› Sponsor The overwhelming majority of sponsor transactions
have to be allocated to the conduit business. Only in a few cases
does Commerzbank hold other sponsor positions. Under the inter-
nal assessment approach (IAA), ABS rating systems certified by
the supervisory authority are used for the Silver Tower conduit
sponsored by Commerzbank. In the reporting period, we applied
our own rating systems to the Silver Tower conduit for the follow-
ing classes of receivables: trade receivables, car finance and leas-
ing, equipment leasing and consumer lending. The rating systems
are developed in accordance with the stipulations of regulatory
requirements, independently of the front office, by Com-
merzbank’s risk function. In accordance with the CRR, the meth-
odology follows the guidelines of the rating agencies Standard &
Poor’s, Moody’s and FitchRatings. The systems were certified at
the outset by BaFin and the Bundesbank. They are subject to a
regular review by the supervisors and internal audit. In addition,
the internal assessment approach is subject to an annual validation
by Commerzbank’s risk function.
The various internal assessments take account of all features of
the securitised receivables portfolio identified by the rating agen-
cies as significant risk drivers as well as the specific structuring
characteristics of the securitisation exposure. Other quantitative
and qualitative risk components that are regarded as material by
Commerzbank are also included in the assessment. These include,
in particular, seller risks and qualitative risk drivers that are evalu-
ated via structured qualitative questionnaires. The result of the
rating process is a tranche-specific rating derived from the quanti-
tative and qualitative results of the assessment approach. Depend-
ing on the specific approach used, this rating is based on the
probability of default or expected loss (EL) of the securitised
tranche. No external ratings from the above-mentioned rating
agencies are available for the securitisation exposures subject to
the internal assessment approach. The results of the internal as-
sessment approach are used to determine regulatory capital re-
quirements. They are also used within the internal capital model,
in portfolio monitoring and in setting limits (ICAAP processes).
56 Commerzbank Disclosure Report 2016
The approaches to modelling probability of default or expected
loss (EL) for securitisation tranches differ depending on the type
of securitised asset class. For the asset classes trade receivables,
car finance and leasing, equipment leasing and consumer lending,
a range of different stress factors used by the rating agencies are
applied, depending on the main risk drivers for the relevant trans-
actions. These are, for example, stress factors on concentration
risks, default risks, dilution risks and interest rate risks. Quantita-
tive and qualitative modelling components devised by the Bank are
also used. When calculating loss buffers, stress factors are deter-
mined individually for different securitised asset types on the basis
of the risk profiles of the securitisation transactions. In addition, in
two cases the practice of making a capital deduction where no ap-
plicable external rating is available is used. Both the supervisory
formula approach (SFA) and the look-through approach (LTA) are
used in just a single case each.
› Investor For investor positions, external ratings are generally
available and lead to the ratings-based approach (RBA) being ap-
plied. Commerzbank Aktiengesellschaft takes account of all avail-
able external ratings of securitisation positions issued by the rat-
ing agencies nominated by Commerzbank Aktiengesellschaft,
namely Standard & Poor’s, Moody’s and FitchRatings. It does so
irrespective of the type of receivables securitised and the type of
securitisation exposure. A very small portion of investor positions
is covered by guarantees from guarantors including the European
Investment Fund (EIF). The guarantee is taken into account in the
calculation of RWAs by substituting the risk weighting of the guar-
antor for the risk weighting of the securitisation. The look-through
approach is used to a limited extent. In just a few cases a capital
deduction is used due to the lack of an applicable external rating.
Companies which are consolidated within the Commerzbank
Group for regulatory purposes may, as part of the Group-wide
business and risk strategy, act as investors in securitisation trans-
actions in which the Bank is acting as sponsor or originator.
Commerzbank Aktiengesellschaft currently only holds securiti-
sation exposures from securitisation transactions where it acts as
sponsor or originator. All retentions or repurchases of securitisa-
tion exposures from the Bank’s own transactions with recognised
regulatory risk transfer and securitisation exposures from transac-
tions where Commerzbank has acted as sponsor are taken into
account when determining the regulatory capital requirement. In
the case of transactions without recognised regulatory risk transfer,
the regulatory capital requirement is determined for the secu-
ritised portfolio.
Securitisation exposures in the trading book As at 31 Decem-
ber 2016, the majority of securitisation positions included in the
trading book are hedged against performance-induced market
price risks by means of credit default swaps with counterparties of
good credit quality. In addition, further positions are allocated to
the correlation trading book. The capital adequacy requirements
are determined by application of the provisions of Articles 337 and
338 CRR relevant for securitisation exposures.
Valuation and accounting procedures
In true sale or synthetic securitisation transactions via special pur-
pose vehicles, IFRS accounting regulations require the Bank to
review whether or not the securitising special purpose vehicles
need to be consolidated in accordance with IFRS 10. This review
process is centralised in the Commerzbank Group in the account-
ing department. The central unit is informed of the establishment
or restructuring of a special purpose vehicle. On the basis of the
information submitted, it carries out a review to determine wheth-
er or not the special purpose vehicle needs to be consolidated
› Originator If the special purpose vehicle is consolidated as part
of the Commerzbank Group, no further derecognition test is car-
ried out under IAS 39 rules. The asset is not derecognised in this
case. If the special purpose vehicle does not have to be consoli-
dated, in true sale securitisations the possible derecognition of the
securitised receivables from the balance sheet is assessed. Follow-
ing an assessment of the risks and rewards of ownership as the
primary derecognition criterion and the control concept as the
secondary derecognition criterion (IAS 39.15 ff.), a derecognition
or partial derecognition (continuing involvement) is reported
where appropriate. In the case of synthetic securitisations, the un-
derlying receivables remain on the balance sheet. As with secu-
ritised receivables in true sale securitisations that are not derec-
ognised, they are reported in their original IFRS category. These
receivables continue to be accounted for in accordance with the
rules for this IFRS category. Where securitised receivables are de-
recognised, any resultant gains or losses are recognised in the in-
come statement. In some cases, the derecognition of receivables
may lead to the first-time recognition of new exposures, for exam-
ple bonds issued by special purpose vehicles. Under IFRS these
exposures are categorised on the basis of the intention with which
the securities were acquired and the type of securities in one of
the three IAS 39 categories (held for trading, loans and receivables
or available for sale). Please refer to Note 5 to the IFRS Group fi-
nancial statements for a detailed explanation of the classification
rules and the related valuation procedures. No securitisation
transactions leading to derecognition of receivables were carried
out in the period under review. As a result, no gains or losses were
realised from the sale of receivables in connection with securitisa-
tion transactions during the reporting period.
Introduction Equity capital Risk-oriented overall bank management Specific risk management Appendix 57
The securitising special purpose vehicles for the following
transactions are currently consolidated for accounting purposes:
Coco Finance II–2 Ltd. and SME Commerz SCB GmbH. However,
these entities are not consolidated for regulatory purposes. CB
MezzCap Limited Partnership is currently not consolidated either
for accounting purposes or for the purposes of regulatory capital
adequacy requirements. If assets are earmarked for securitisation,
this has no direct impact on their accounting treatment or meas-
urement within the applicable IFRS categories.
› Sponsor Under IFRS the funding entities Silver Tower Funding
Ltd and Silver Tower US Funding LLC are not consolidated under
Silver Tower. No purchasing entities are consolidated either.
Moreover, no purchasing or funding entities are consolidated un-
der Silver Tower for regulatory purposes. If a beneficiary special
purpose vehicle is not consolidated under IFRS, the liquidity line
provided to it is recorded in the notes to the Annual Report as a
contingent liability in its full unutilised amount. Any utilised
amount is recognised as a receivable in the IFRS category loans
and receivables.
› Investor Under IFRS, investor positions are categorised on the
basis of the intention with which the securities were acquired and
the type of securities in one of the three IAS 39 categories (held
for trading, loans and receivables or available for sale). For a de-
tailed explanation, please refer to Note 5 to the IFRS Group finan-
cial statements, which also explains the related valuation proce-
dures. If the securitisation exposures are traded on liquid markets
with observable pricing, they are valued on the basis of independ-
ent market prices. If direct measurement at market prices is not
possible, the value of the securitisation exposure is determined
using prices from external providers. In some cases the value of
the securitisation exposure is determined with the help of valua-
tion models. This involves the application of a discounted cash
flow approach, with the cash flows and other relevant parameters
being based on data observable on the market. Moreover, the ap-
proach is calibrated with market data for application to similar se-
curitisation structures. In many cases the prices estimated by ex-
ternal providers are used. There were no significant changes in the
methods used to value securitisation positions in the period under
review.
Quantitative information on securitisations
To provide a comprehensive overview of the Commerzbank
Group’s securitisation positions, the analyses shown in tables 33
to 39 comprise the complete group of companies consolidated for
regulatory purposes.
Securitisation exposures in the banking book The following
information relates to transactions for which risk-weighted expo-
sures are determined in accordance with Articles 242–270 CRR.
This also includes the Commerzbank Group’s own securitisation
transactions for which capital relief is available and made use of
for regulatory purposes.
The total volume of all retained or acquired securitisation expo-
sures (on- and off-balance-sheet) was €17.6bn as at the reporting
date. This amount corresponds to the IRBA and SACR exposures
after deducting eligible collateral.
A breakdown of retained or acquired securitisation exposures
by exposure type and the regulatory role assumed by Com-
merzbank is given in the following table.
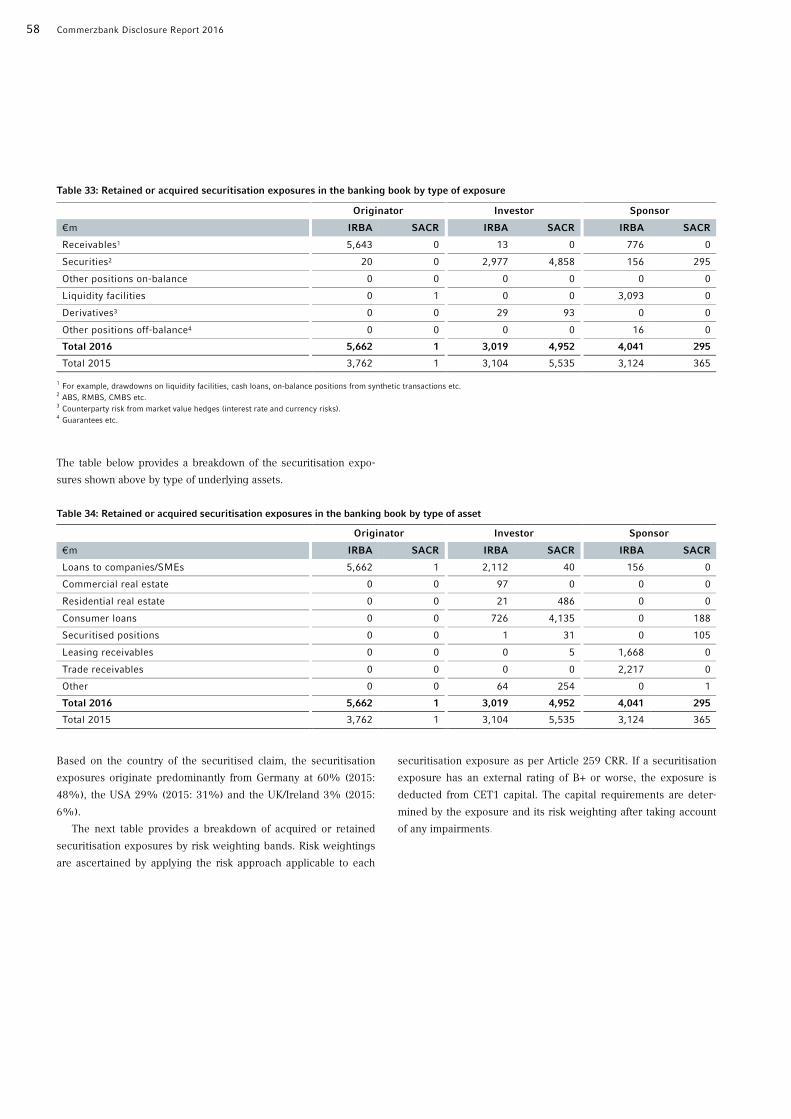
58 Commerzbank Disclosure Report 2016
Table 33: Retained or acquired securitisation exposures in the banking book by type of exposure
Originator Investor Sponsor
€m IRBA SACR IRBA SACR IRBA SACR
Receivables1 5,643 0 13 0 776 0
Securities2 20 0 2,977 4,858 156 295
Other positions on-balance 0 0 0 0 0 0
Liquidity facilities 0 1 0 0 3,093 0
Derivatives3 0 0 29 93 0 0
Other positions off-balance4 0 0 0 0 16 0
Total 2016 5,662 1 3,019 4,952 4,041 295
Total 2015 3,762 1 3,104 5,535 3,124 365
1 For example, drawdowns on liquidity facilities, cash loans, on-balance positions from synthetic transactions etc.
2 ABS, RMBS, CMBS etc.
3 Counterparty risk from market value hedges (interest rate and currency risks).
4 Guarantees etc.
The table below provides a breakdown of the securitisation expo-
sures shown above by type of underlying assets.
Table 34: Retained or acquired securitisation exposures in the banking book by type of asset
Originator Investor Sponsor
€m IRBA SACR IRBA SACR IRBA SACR
Loans to companies/SMEs 5,662 1 2,112 40 156 0
Commercial real estate 0 0 97 0 0 0
Residential real estate 0 0 21 486 0 0
Consumer loans 0 0 726 4,135 0 188
Securitised positions 0 0 1 31 0 105
Leasing receivables 0 0 0 5 1,668 0
Trade receivables 0 0 0 0 2,217 0
Other 0 0 64 254 0 1
Total 2016 5,662 1 3,019 4,952 4,041 295
Total 2015 3,762 1 3,104 5,535 3,124 365
Based on the country of the securitised claim, the securitisation
exposures originate predominantly from Germany at 60% (2015:
48%), the USA 29% (2015: 31%) and the UK/Ireland 3% (2015:
6%).
The next table provides a breakdown of acquired or retained
securitisation exposures by risk weighting bands. Risk weightings
are ascertained by applying the risk approach applicable to each
securitisation exposure as per Article 259 CRR. If a securitisation
exposure has an external rating of B+ or worse, the exposure is
deducted from CET1 capital. The capital requirements are deter-
mined by the exposure and its risk weighting after taking account
of any impairments.

Introduction Equity capital Risk-oriented overall bank management Specific risk management Appendix 59
Table 35: Retained or acquired securitisation exposures in the banking book by risk weighting band
IRBA RBA IAA SFA
Risk weighting band | €m Position value Capital
requirement
Position value Capital
requirement
Position value Capital
requirement
≤ 10% 2,835 17 1,478 10 5,572 31
> 10% ≤ 20% 130 1 1,397 21 0 0
> 20% ≤ 50% 7 0 732 18 154 3
> 50% ≤ 100% 0 0 278 14 0 0
> 100% ≤ 650% 1 0 0 0 0 0
> 650% < 1,250% 0 0 0 0 21 16
Total 2016 2,972 19 3,885 63 5,747 51
Total 2015 3,029 22 2,939 39 3,921 42
SACR RBA IAA LTA
Risk weighting band | €m Position value Capital
requirement
Position value Capital
requirement
Position value Capital
requirement
≤ 10% 0 0 0 0 0 0
> 10% ≤ 20% 4,539 73 0 0 0 0
> 20% ≤ 50% 50 2 188 8 0 0
> 50% ≤ 100% 182 15 0 0 0 0
> 100% ≤ 650% 8 2 0 0 94 11
> 650% < 1,250% 0 0 0 0 0 0
Total 2016 4,779 91 188 8 94 11
Total 2015 4,999 93 230 9 447 32
As at 31 December 2016 the value of the securitisation expo-
sures (including resecuritisations) deducted from equity capital
was €287m (2015: €259m). After taking account of impairments,
the capital deduction amounted to €254m (2015: €236m). The
next table provides a breakdown of acquired or retained resecurit-
isation exposures by risk weighting bands. The capital require-
ment values do not consider hedge positions or insurances.
Table 36: Retained or acquired resecuritisation exposures in the banking book by risk weighting band
IRBA SACR
Risk weighting band | €m Position value Capital
requirement
Position value Capital
requirement
≤ 10% 0 0 0 0
> 10% ≤ 20% 0 0 0 0
> 20% ≤ 50% 17 1 0 0
> 50% ≤ 100% 0 0 0 0
> 100% ≤ 650% 1 0 0 0
> 650% < 1,250% 0 0 0 0
Total 2016 17 1 0 0
Total 2015 55 4 11 1

60 Commerzbank Disclosure Report 2016
The table below shows the outstanding volumes of the Com-
merzbank Group’s securitisation transactions. These were origina-
tor transactions with recognised regulatory risk transfer or prima-
ry ABCP-funded sponsor transactions
Table 37: Securitisation assets outstanding
Originator Originator Sponsor1
Traditional Synthetic
€m 2016 2015 2016 2015 2016 2015
Loans to companies/SMEs 71 71 5,996 4,000 214 261
Commercial real estate 0 0 0 13 0 0
Residential real estate 0 0 0 65 0 0
Consumer loans 0 0 0 0 189 225
Securitised positions 0 0 0 0 1 1
Leasing receivables 0 0 0 0 2,316 1,040
Trade receivables 0 0 0 0 1,824 1,419
Other 0 0 0 0 40 47
Total 71 71 5,996 4,079 4,583 2,993
1 Mainly ABCP.
On the reporting date, the securitised portfolios included non-
performing or past due loans as shown below.
Table 38: Impaired / past-due assets securitised
Non-performing loans Past due loans
€m 2016 2015 2016 2015
Loans to companies/SMEs 13 0 9 6
Commercial real estate 0 2 0 0
Residential real estate 0 1 0 0
Total 13 3 9 6
During the period under review, portfolio losses occurred under
the two repaid originator transactions of Loan Solutions Frankfurt
GmbH: €0.4m (previous year: €0.8m) where the underlying asset
class was residential real estate and €3.2m (previous year: €0.4m)
where the underlying asset class was commercial real estate.
Commerzbank AG incurred portfolio losses of €5m (previous year:
no loss) on traditional originator transactions where the underly-
ing asset class was loans to companies. We have taken the infor-
mation on portfolio losses and on impaired and past due claims
from the investor reports for the respective underlying transac-
tions.
Securitisation exposures in the trading book The information in
this section relates to securitisation exposures in the trading book
(excluding the correlation trading portfolio) for which risk-
weighted exposure values are determined in accordance with Arti-
cle 337 CRR. This comprises securitisation exposures where
Commerzbank acts as sponsor, originator or investor.
The total net exposure of all retained or acquired securitisation
positions was €2m at the reporting date, including credit deriva-
tive hedges according to article 337 CRR. There are no further off-
balance-sheet hedge positions.
The table below shows the retained or acquired securitisation
exposures by type of exposure:
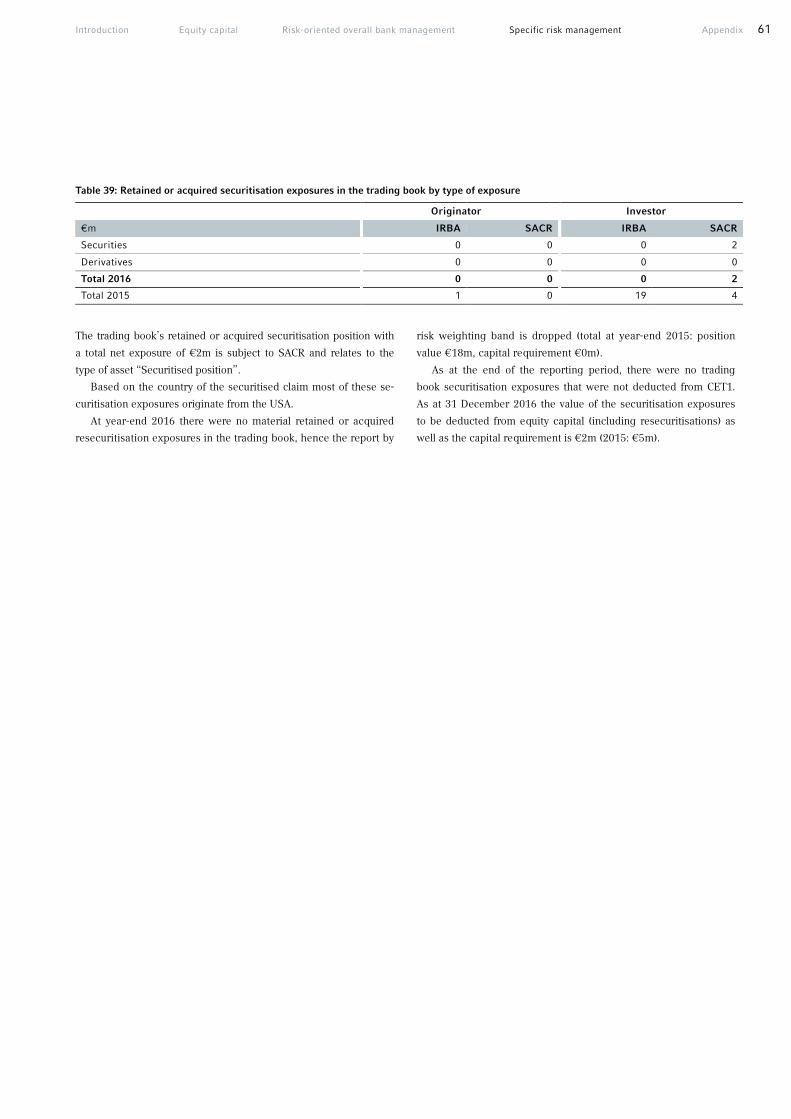
Introduction Equity capital Risk-oriented overall bank management Specific risk management Appendix 61
Table 39: Retained or acquired securitisation exposures in the trading book by type of exposure
Originator Investor
€m IRBA SACR IRBA SACR
Securities 0 0 0 2
Derivatives 0 0 0 0
Total 2016 0 0 0 2
Total 2015 1 0 19 4
The trading book’s retained or acquired securitisation position with
a total net exposure of €2m is subject to SACR and relates to the
type of asset “Securitised position”.
Based on the country of the securitised claim most of these se-
curitisation exposures originate from the USA.
At year-end 2016 there were no material retained or acquired
resecuritisation exposures in the trading book, hence the report by
risk weighting band is dropped (total at year-end 2015: position
value €18m, capital requirement €0m).
As at the end of the reporting period, there were no trading
book securitisation exposures that were not deducted from CET1.
As at 31 December 2016 the value of the securitisation exposures
to be deducted from equity capital (including resecuritisations) as
well as the capital requirement is €2m (2015: €5m).

62 Commerzbank Disclosure Report 2016
Market risk
Market risk is the risk of financial losses due to changes in market
prices (interest rates, commodities, credit spreads, exchange rates
and equity prices) or in parameters that affect prices such as vola-
tilities and correlations. Losses may impact profit or loss directly,
e.g. in the case of trading book positions. However, for banking
book positions they would be reflected in the revaluation reserve
or in hidden liabilities/reserves.
Risk management
Strategy and organisation
Commerzbank’s market risk strategy is derived from its overall risk
strategy and the business strategies of the individual segments. It
sets targets for market risk management in relation to Com-
merzbank’s main business activities. The core market risk man-
agement tasks are the identification of all key market risks and
drivers of market risk and the independent measurement and
evaluation of these. The results and estimates serve as the basis
for risk/return-oriented management.
The Board of Managing Directors of Commerzbank is responsi-
ble for ensuring the effective management of market risk through-
out the Commerzbank Group. Specific levels of authority and re-
sponsibility in relation to market risk management have been
assigned to the appropriate market risk committees.
Within the Bank, various market risk committees have been es-
tablished. In these, segment representatives, along with repre-
sentatives from the risk function and finance area, discuss current
risk positioning issues and decide on appropriate action. Chaired
by the risk function, the Group Market Risk Committee, which
meets monthly, deals with Commerzbank Group’s market risk po-
sition. Discussions centre on the monthly market risk report,
which is also presented to the Board of Managing Directors for
their consideration. The report summarises the latest develop-
ments on financial markets, the Bank’s positioning and the risk
ratios derived from this. The Segment Market Risk Committee,
which focuses on the trading-intensive Corporate Clients and
Treasury areas, meets once a week. This committee also manages
market risks arising from non-core activities (Asset & Capital Re-
covery).
The risk management process involves the identification,
measurement, management and monitoring of risks and reporting
on them. It is the responsibility in functional terms of market risk
management, which is independent of trading activities. Central
market risk management is complemented by decentralised mar-
ket risk management units at segment level and for regional units
and subsidiaries. The close integration of central and local risk
management with the business units means that the risk manage-
ment process starts in the trading areas themselves. The trading
units are responsible in particular for the active management of
market risk positions, e.g. reduction measures or hedging.
Risk management
Commerzbank uses a wide range of quantitative and qualitative
tools to manage and monitor market risk. Quantitative limits for
sensitivities, value at risk (VaR) figures, stress tests, scenario anal-
yses and ratios on economic capital limit the market risk. Our
comprehensive rulebook, in the form of market risk policies and
guidelines as well as restrictions on portfolio structure, new prod-
ucts, maturities and minimum ratings, establishes the qualitative
framework for market risk management. The market risk strategy
lays down the weighting of figures in each segment by reference
to their relevance. Thereby allowance is made for the varying im-
pact of the parameters for the management of the segments in line
with the business strategy.
Market risk is managed internally at Group level, segment level
and in the segment’s reporting units. A comprehensive internal
limit system broken down to portfolio level is implemented and
forms a core part of internal market risk management.
The quantitative and qualitative factors limiting market price
risk are determined by the market risk committees by reference to
the Group’s management of economic capital. The utilisation of
these limits, together with the relevant net income figures, is re-
ported daily to the Board of Managing Directors and the responsi-
ble heads of the Group divisions. Based on qualitative analyses
and quantitative ratios, the market risk function identifies potential
future risks, anticipates potential financial losses in collaboration
with the finance function, and draws up proposals for further ac-
tion, which are discussed with the market units. Voting on the
proposed measures or exposures takes place in the above-
mentioned market risk committees and is subsequently submitted
to the Board of Managing Directors for approval.
Risk concentrations are restricted directly with specific limits or
are indirectly avoided, for example using stress test limits. In addi-
tion, the combination of various conventional risk measures (e.g.
VaR, sensitivities) ensures the appropriate management of concen-
tration risks. Furthermore, risk drivers are analysed on a regular
basis in order to identify concentrations. The risk management of
existing concentrations is also reviewed using situation-driven
analyses and, where necessary, supplemented by targeted
measures such as limits.

Introduction Equity capital Risk-oriented overall bank management Specific risk management Appendix 63
Any individual limits that are breached are handled in a sepa-
rate escalation procedure. After a limit breach has been identified,
the front office and risk units design measures to bring the respec-
tive portfolio back within the limit. If the limit breach cannot be
remedied within a few days, it will be escalated by the market risk
function to the next hierarchical level.
Regulatory risk measures that are not included in economic
risk-bearing capacity are limited and managed separately. These
include, for example, stressed VaR and incremental risk charge.
Market risk model
Value at Risk
A standardised value at risk model incorporating all positions is
used for the internal management of market risk. The VaR quanti-
fies the potential loss from financial instruments as a result of
changed market conditions over a predefined time horizon and
with a specific probability.
Our VaR market risk model is based on a historical simulation
with a one-year interval of historical market data. The historical
simulation determines the profit and loss distribution of the cur-
rent portfolio by means of revaluation using historical changes in
market prices and volatility. This is done on the basis of independ-
ent market data which is quality-assured on a daily basis and fed
into a central market database at a standard defined time. Market
data is provided for all relevant positions in the asset classes inter-
est rates, credit spreads, equities, foreign currencies and commod-
ities. This market data takes the form of prices quoted directly on
the market or market data such as yield and credit spread curves
derived using internal methods. A proxy concept is used if no
market data is available for individual exposures. In this case,
prices are derived from those for comparable instruments.
For internal management purposes, a confidence level of
97.5% and a holding period of one day are assumed. The value at
risk concept makes it possible to compare risks over a variety of
business areas. It enables many positions to be aggregated, taking
account of correlations between different assets. This ensures a
consolidated view of the market risk at all times. A comprehensive
internal limit system broken down to portfolio level is implement-
ed and represents an important part of internal market risk man-
agement.
The VaR market risk model described above is also used to cal-
culate regulatory required capital. This regulatory capital backing
is required for trading book risks and for currency and commodity
price risks in the banking book. A confidence level of 99% and a
ten-day holding period are used for the regulatory capital adequa-
cy requirement. These assumptions meet the requirements of the
Basel Committee and other international standards on the man-
agement of market risk. For certain evaluations, such as backtest-
ing and disclosure, the VaR is also calculated on the basis of a
one-day holding period. In order to provide a consistent presenta-
tion in this report, all figures relating to the VaR are based on a
confidence level of 99%, a holding period of one day, equally
weighted market data and a 254 days’ history.
Stress test
As the VaR concept gives a prediction of potential losses on the
assumption of normal market conditions, it is supplemented by the
calculation of stress tests. These stress tests measure the risk to
which Commerzbank is exposed, based on unlikely but still plausi-
ble events. These events may be simulated using extreme move-
ments on various financial markets. The key scenarios relate to
major changes in credit spreads, interest rates and yield curves,
exchange rates, share prices and commodities prices. Events sim-
ulated in stress tests include all stock prices falling by 15%, a par-
allel shift in the yield curve or changes to the curve’s gradient.
Extensive Group-wide stress tests and scenario analyses are
carried out as part of risk monitoring. The Bank-wide stress test
calculation is based on a combination of short-term stress test
scenarios and scenarios based on macro-economic variables. The
stress test framework is completed by portfolio-specific stress tests
and ad-hoc scenario analyses.
Stress tests are intended to simulate the impact of crises and
extreme market conditions on the Bank’s overall market risk posi-
tion. The impact on the respective components of capital and the
income statement is also quantified in these tests.
In order to manage and monitor risks, short-term scenarios are
calculated daily, compared against fixed limits and reported to the
Board of Managing Directors. The longer-term scenarios are cal-
culated on a monthly basis and discussed in the respective com-
mittees.
Model validation
The reliability of the internal model is monitored by backtesting on
a daily basis. The VaR calculated is set against actually occurring
profits and losses. The process draws a distinction between “clean
P&L” and “dirty P&L” backtesting. In the former, exactly the same
positions in the income statement are used as were used for calcu-
lating the VaR. This means that the profits and losses solely result
from changes in market prices. In dirty P&L backtesting, by con-
trast, profits and losses from newly-concluded and expired trans-
actions from the day under consideration are included. If the loss
thus arrived at exceeds the VaR, it is described as a negative
backtesting outlier.
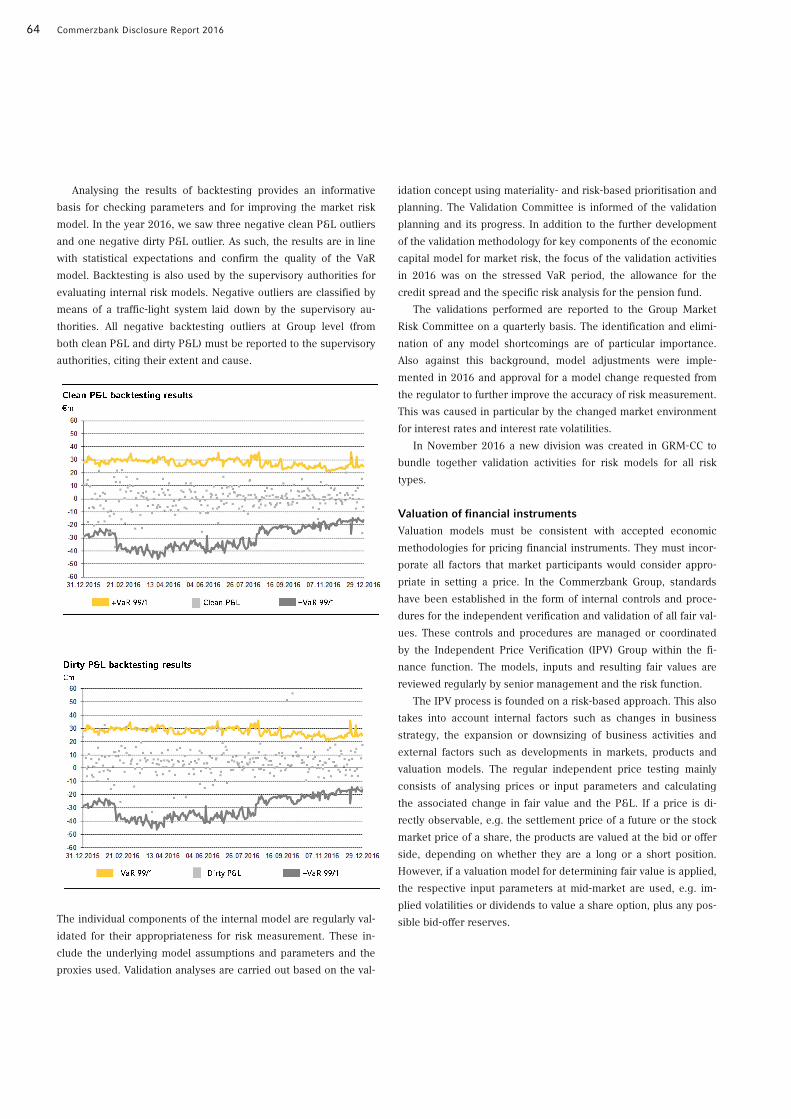
64 Commerzbank Disclosure Report 2016
Analysing the results of backtesting provides an informative
basis for checking parameters and for improving the market risk
model. In the year 2016, we saw three negative clean P&L outliers
and one negative dirty P&L outlier. As such, the results are in line
with statistical expectations and confirm the quality of the VaR
model. Backtesting is also used by the supervisory authorities for
evaluating internal risk models. Negative outliers are classified by
means of a traffic-light system laid down by the supervisory au-
thorities. All negative backtesting outliers at Group level (from
both clean P&L and dirty P&L) must be reported to the supervisory
authorities, citing their extent and cause.
The individual components of the internal model are regularly val-
idated for their appropriateness for risk measurement. These in-
clude the underlying model assumptions and parameters and the
proxies used. Validation analyses are carried out based on the val-
idation concept using materiality- and risk-based prioritisation and
planning. The Validation Committee is informed of the validation
planning and its progress. In addition to the further development
of the validation methodology for key components of the economic
capital model for market risk, the focus of the validation activities
in 2016 was on the stressed VaR period, the allowance for the
credit spread and the specific risk analysis for the pension fund.
The validations performed are reported to the Group Market
Risk Committee on a quarterly basis. The identification and elimi-
nation of any model shortcomings are of particular importance.
Also against this background, model adjustments were imple-
mented in 2016 and approval for a model change requested from
the regulator to further improve the accuracy of risk measurement.
This was caused in particular by the changed market environment
for interest rates and interest rate volatilities.
In November 2016 a new division was created in GRM-CC to
bundle together validation activities for risk models for all risk
types.
Valuation of financial instruments
Valuation models must be consistent with accepted economic
methodologies for pricing financial instruments. They must incor-
porate all factors that market participants would consider appro-
priate in setting a price. In the Commerzbank Group, standards
have been established in the form of internal controls and proce-
dures for the independent verification and validation of all fair val-
ues. These controls and procedures are managed or coordinated
by the Independent Price Verification (IPV) Group within the fi-
nance function. The models, inputs and resulting fair values are
reviewed regularly by senior management and the risk function.
The IPV process is founded on a risk-based approach. This also
takes into account internal factors such as changes in business
strategy, the expansion or downsizing of business activities and
external factors such as developments in markets, products and
valuation models. The regular independent price testing mainly
consists of analysing prices or input parameters and calculating
the associated change in fair value and the P&L. If a price is di-
rectly observable, e.g. the settlement price of a future or the stock
market price of a share, the products are valued at the bid or offer
side, depending on whether they are a long or a short position.
However, if a valuation model for determining fair value is applied,
the respective input parameters at mid-market are used, e.g. im-
plied volatilities or dividends to value a share option, plus any pos-
sible bid-offer reserves.

Introduction Equity capital Risk-oriented overall bank management Specific risk management Appendix 65
IFRS 13, which has had to be applied since the financial year
2013, standardises the rules for measuring fair value. Under
IFRS 13, the fair value of an asset is the amount for which it could
be sold between knowledgeable, willing, independent parties in an
arm’s length transaction. The fair value therefore represents a re-
alisable price.
The fair value of a liability is defined as the price at which the
debt could be transferred to a third party as part of an orderly
transaction. Furthermore, for the valuation of a debt one’s own
default risk has to be considered.
The most suitable measure of fair value is the quoted price for
an identical instrument in an active market (fair value hierarchy
level I). In cases where no quoted prices are available, valuation is
based on quoted prices for similar instruments in active markets.
Where quoted prices are not available for identical or similar fi-
nancial instruments, fair value is derived using an appropriate val-
uation model where the data inputs are obtained, as far as possible,
from verifiable market sources (fair value hierarchy level II).
Most valuation methods are based on data from verifiable mar-
ket sources. However, some valuation models use inputs for which
sufficient verifiable current market data is not available. These
valuation methods inherently include a greater level of expert or
management judgement. These unobservable inputs may include
data that is extrapolated or interpolated, or may be derived by ap-
proximation to correlated or historical data. However, to a maxi-
mum extent, these inputs are market or third-party inputs and rely
as little as possible on expert estimates or company-specific inputs
(fair value hierarchy level III).
Quantitative information on market risks
Market risk in the trading book
The development of regulatory market risk ratios in the trading
book portfolio is shown below. Most of Commerzbank’s trading
book positions derive from the Corporate Clients and Treasury di-
visions.
The VaR fell from €29m to €15m over the year. The decline
was mainly caused by a defensive position in light of the political
events in 2016 (Brexit, US presidential elections, referendum in
Italy).
Table 40: VaR of trading book portfolios
(based on regulatory capital requirement) VaR | €m 2016 2015
Minimum 14 17
Average 30 25
Maximum 46 39
Year-end figure 15 29
The market risk profile is diversified across all asset classes. The
dominant asset classes are credit spread and foreign exchange
risks, followed by interest rate risks and equity price risks. To a
lesser extent, value at risk is also affected by commodity and infla-
tion risk.
Further risk ratios are calculated for regulatory capital adequa-
cy. This includes the calculation of stressed VaR. Stressed VaR is
calculated using the internal model on the basis of the VaR meth-
od described above. The main difference lies in the market data
used to value the assets. Stressed VaR measures the risk in the
present position in the trading book by reference to market
movements from a specified crisis period in the past. The crisis
observation period used for this is checked regularly through
model validation and approval processes and adjusted where nec-
essary. The crisis observation period was changed in the course of
the year. This is the cause for the sharp rise in stressed VaR year-
on-year.
Table 41: Stressed VaR of trading book portfolios
VaR | €m 2016 2015
Minimum 17 25
Average 28 34
Maximum 51 49
Year-end figure 48 27
In addition, the incremental risk charge and equity event VaR rati-
os quantify the risk of deterioration in creditworthiness as well as
event risks in trading book positions. Equity event VaR is concep-
tually part of the historical simulation taking into account empiri-
cal equity events over long observation periods. It is a component
in the regulatory VaR calculation and included in the values of ta-
ble 40.
The incremental risk charge is based on the credit VaR model
with historical data for rating migration and default probabilities
and for recovery factors. The model shows current gains and loss-
es on positions in the event of rating changes. In addition, in cal-
culating the incremental risk charge, assumptions are made re-
garding liquidity (average regrouping/liquidity horizon). These
liquidity horizons are set on a portfolio-specific basis, taking into
account market structure and activity and concentrations of posi-
tions. The incremental risk charge as at 31 December 2016 was as
follows:

66 Commerzbank Disclosure Report 2016
Table 42: Incremental risk charge
IRC | €m 2016 2015
Minimum 143 107
Average 164 180
Maximum 195 247
Year-end figure 163 148
Table 43: Incremental risk charge by sub-portfolio
Sub-portfolio IRC1
€m
Average regrouping
horizon | months
Corporates & Markets 167 4.4
Treasury 1 12.0
1 Excluding diversification effects between sub-portfolios.
Stressed VaR rose by €21m year-on-year to €48m. This was main-
ly due to the introduction of a new stressed VaR period. The in-
cremental risk charge rose by €15m to €163m. This was mainly
attributable to exposure changes in the business area Corporate
Clients.
Market liquidity risk
In taking steps to ensure economic capital adequacy, Com-
merzbank also considers market liquidity risk. This is the risk of
the Bank not being able to liquidate or hedge risky positions in a
timely manner, to the desired extent and on acceptable terms as a
result of insufficient liquidity in the market.
The first step is to create a realistic downsizing profile for each
portfolio on the basis of its product and risk strategies and an as-
sessment of the market. This enables portfolios to be classified in
terms of their convertibility into cash using a “market liquidity fac-
tor”. The market liquidity factor takes into account the heightened
volatility of portfolio value resulting from the extended holding
period for risk positions in line with the portfolio’s downsizing pro-
file. The market risk of every portfolio is then evaluated based on a
one-year view and weighted with the market liquidity factor.
At the end of 2016, Commerzbank earmarked €0.2bn in eco-
nomic capital to cover market liquidity risk in the trading and
banking book. Asset-backed securities and structured products in
particular have a higher market liquidity risk.
Table 44: Market liquidity VaR Capital requirement | €m 2016 2015
Minimum 193 151
Average 219 202
Maximum 251 256
Year-end figure 217 207
Interest rate risk in the banking book
Interest rate risk is one of the most significant financial risks posed
by banking operations. This includes in particular the risk of value
adjustments as a result of interest rate fluctuations over time. The
maturity of interest rate positions and their refinancing structure
are fundamental factors in the management of interest rate risks.
In commercial business, the modelling of interest rate risk in-
cludes assumptions on early repayments and on investor behav-
iour when deposits are open-ended. The risk of a flattening or
steepening in the yield curve is also covered. Interest rate risks
may also arise if positions are closed as a result of hedging trans-
actions with a different pricing type to the underlying transaction
(basis risks). Interest rate risks relate to Commerzbank’s banking
book and trading book. The combined position of both books re-
sults in Commerzbank’s overall interest rate risk.
Strategy and organisation
The interest rate risk in the Commerzbank Group’s banking book
primarily results from commercial business. Interest rate risks
arise here if interest rate positions in customer business are not
hedged or are only partially hedged. Interest rate risks also arise
from the investment models used by the central ALCO (Asset Lia-
bility Committee), which comprise in particular the investment
and/or refinancing of products without contractually fixed interest
rates, e.g. for equity capital, savings and sight deposits.
In the Commerzbank Group, interest rate risk in the banking
book is the responsibility of Group Treasury within the scope of
the business strategy. In addition to the positions of the central
Group Treasury division, the treasury activities of branches and all
subsidiaries are also taken into consideration.
Treasury’s main tasks include the management of the balance
sheet structure and of liquidity risks. The aim is to generate a posi-
tive interest margin from interest income and refinancing expens-
es. This gives rise to interest rate risks if positions are not re-
financed with matching maturities and matching currencies.
Management
Commerzbank jointly manages interest rate risk from both the
trading and banking book. This is done strategically by means of
risk policies and operationally by means of appropriate limit sys-
tems. The risks are consolidated in central risk management. Cen-
tral risk management is supplemented by a risk management unit
for Treasury within the market risk function.

Introduction Equity capital Risk-oriented overall bank management Specific risk management Appendix 67
Interest rate risks in the banking book are managed in line with
the business strategy by means of maturity- and currency-
congruent refinancing and the use of interest rate derivatives. For
example, interest rate swaps with sufficient market liquidity ena-
ble a prompt response to management measures. However, some
products without fixed maturities, such as sight and savings de-
posits or equity capital, are available to the Bank in the long term.
Here the Bank uses appropriate models to manage interest rate
risks and stabilise earnings performance. Our models are regularly
monitored.
Quantitative information on interest rate risks in the bank-
ing book
The measurement of interest rate risk is completely integrated into
the Bank’s daily measurement and monitoring of risk. As with the
measurement of trading book risks, risks in the banking book are
also quantified using the value at risk method. Stress tests and
scenario analyses are also calculated on a daily and monthly basis.
The stress test calculations as mentioned above are used for this
purpose. This standardised procedure is intended to ensure trans-
parency of interest rate risks in both the trading and banking book.
A further control variable for interest rate risks in the banking
book is interest rate sensitivities. These indicate how interest in-
come varies following a change in interest rates, for example of
one basis point (bp). Interest rate sensitivities are also monitored
on a daily and monthly basis. This monitoring takes place at both
portfolio and segment level as well as for the Commerzbank Group.
For management purposes, interest rate sensitivities are limited to
the various maturity bands at both Group and segment level. The
main focus is on interest rate sensitivities relating to long maturity
periods.
The impact of an interest rate shock on the economic value of
the Group’s banking books is simulated monthly in compliance
with regulatory requirements. In accordance with the Banking Di-
rective, the Federal Financial Supervisory Authority (BaFin) has
prescribed two uniform, sudden and unexpected changes in inter-
est rates (+/–200 basis points) to be used by all banks, which have
to report on the results of this stress test every quarter.
On this basis, the interest rate shift of +200 basis points would
give a potential loss of €2,066m, and the shift of –200 basis points
would lead to a potential gain of €425m as at 31 December 2016.
Table 45: Interest rate risk in the banking book by currency
€m 2016 2015
Interest
rate shock
–200 bp +200 bp –200 bp +200 bp
EUR –311 –1,618 63 –1,417
USD 147 –67 266 –142
GBP 463 –391 627 –180
JPY 66 2 89 6
CHF 54 12 62 –14
Other 6 –4 33 –36
Total 425 –2,066 1,141 –1,784
The potential gains and losses in comparison to 2015 are primarily
caused by movements in the Euro and GBP yield curve. In addition,
a change in the Treasury interest rate position was influencing the
EUR result.
Liquidity risk
We define liquidity risk in a narrower sense as the risk that Com-
merzbank will be unable to meet its payment obligations on a day-
to-day basis. In a broader sense, liquidity risk describes the risk
that future payments cannot be funded for the full amount, in the
required currency or at standard market conditions, as and when
they are due.
Risk management
Strategy and organisation
The Board of Managing Directors adopts the business strategy and
the Bank’s risk tolerance, which is associated with it. Liquidity risk
tolerance is then operationalised by defining the liquidity reserve
period and the limit framework. In order to ensure an appropriate
liquidity risk management process, the Board of Managing Direc-
tors delegates certain competences and responsibilities in connec-
tion with the Group-wide liquidity risk strategy to the risk and
treasury functions.
The central Asset Liability Committee (ALCO) is responsible for
limiting, analysing and monitoring liquidity risk and for strategic
liquidity positioning. ALCO is supported by various sub-
committees in this.
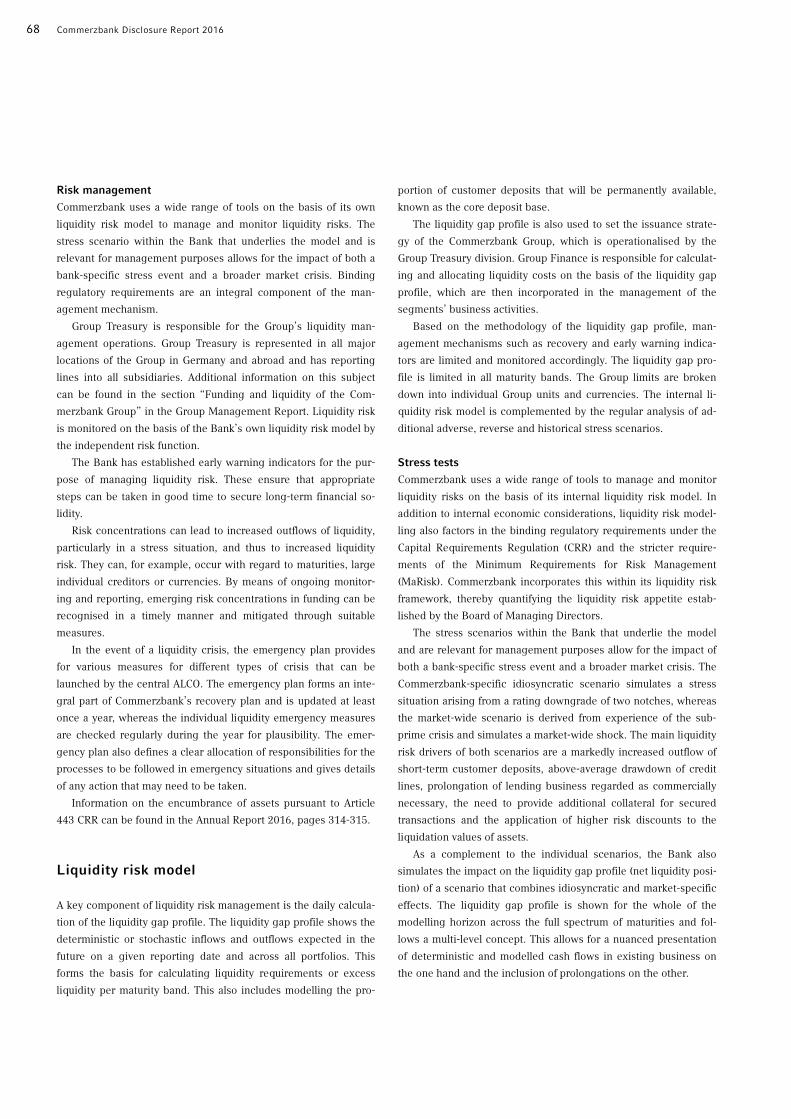
68 Commerzbank Disclosure Report 2016
Risk management
Commerzbank uses a wide range of tools on the basis of its own
liquidity risk model to manage and monitor liquidity risks. The
stress scenario within the Bank that underlies the model and is
relevant for management purposes allows for the impact of both a
bank-specific stress event and a broader market crisis. Binding
regulatory requirements are an integral component of the man-
agement mechanism.
Group Treasury is responsible for the Group’s liquidity man-
agement operations. Group Treasury is represented in all major
locations of the Group in Germany and abroad and has reporting
lines into all subsidiaries. Additional information on this subject
can be found in the section “Funding and liquidity of the Com-
merzbank Group” in the Group Management Report. Liquidity risk
is monitored on the basis of the Bank’s own liquidity risk model by
the independent risk function.
The Bank has established early warning indicators for the pur-
pose of managing liquidity risk. These ensure that appropriate
steps can be taken in good time to secure long-term financial so-
lidity.
Risk concentrations can lead to increased outflows of liquidity,
particularly in a stress situation, and thus to increased liquidity
risk. They can, for example, occur with regard to maturities, large
individual creditors or currencies. By means of ongoing monitor-
ing and reporting, emerging risk concentrations in funding can be
recognised in a timely manner and mitigated through suitable
measures.
In the event of a liquidity crisis, the emergency plan provides
for various measures for different types of crisis that can be
launched by the central ALCO. The emergency plan forms an inte-
gral part of Commerzbank’s recovery plan and is updated at least
once a year, whereas the individual liquidity emergency measures
are checked regularly during the year for plausibility. The emer-
gency plan also defines a clear allocation of responsibilities for the
processes to be followed in emergency situations and gives details
of any action that may need to be taken.
Information on the encumbrance of assets pursuant to Article
443 CRR can be found in the Annual Report 2016, pages 314-315.
Liquidity risk model
A key component of liquidity risk management is the daily calcula-
tion of the liquidity gap profile. The liquidity gap profile shows the
deterministic or stochastic inflows and outflows expected in the
future on a given reporting date and across all portfolios. This
forms the basis for calculating liquidity requirements or excess
liquidity per maturity band. This also includes modelling the pro-
portion of customer deposits that will be permanently available,
known as the core deposit base.
The liquidity gap profile is also used to set the issuance strate-
gy of the Commerzbank Group, which is operationalised by the
Group Treasury division. Group Finance is responsible for calculat-
ing and allocating liquidity costs on the basis of the liquidity gap
profile, which are then incorporated in the management of the
segments’ business activities.
Based on the methodology of the liquidity gap profile, man-
agement mechanisms such as recovery and early warning indica-
tors are limited and monitored accordingly. The liquidity gap pro-
file is limited in all maturity bands. The Group limits are broken
down into individual Group units and currencies. The internal li-
quidity risk model is complemented by the regular analysis of ad-
ditional adverse, reverse and historical stress scenarios.
Stress tests
Commerzbank uses a wide range of tools to manage and monitor
liquidity risks on the basis of its internal liquidity risk model. In
addition to internal economic considerations, liquidity risk model-
ling also factors in the binding regulatory requirements under the
Capital Requirements Regulation (CRR) and the stricter require-
ments of the Minimum Requirements for Risk Management
(MaRisk). Commerzbank incorporates this within its liquidity risk
framework, thereby quantifying the liquidity risk appetite estab-
lished by the Board of Managing Directors.
The stress scenarios within the Bank that underlie the model
and are relevant for management purposes allow for the impact of
both a bank-specific stress event and a broader market crisis. The
Commerzbank-specific idiosyncratic scenario simulates a stress
situation arising from a rating downgrade of two notches, whereas
the market-wide scenario is derived from experience of the sub-
prime crisis and simulates a market-wide shock. The main liquidity
risk drivers of both scenarios are a markedly increased outflow of
short-term customer deposits, above-average drawdown of credit
lines, prolongation of lending business regarded as commercially
necessary, the need to provide additional collateral for secured
transactions and the application of higher risk discounts to the
liquidation values of assets.
As a complement to the individual scenarios, the Bank also
simulates the impact on the liquidity gap profile (net liquidity posi-
tion) of a scenario that combines idiosyncratic and market-specific
effects. The liquidity gap profile is shown for the whole of the
modelling horizon across the full spectrum of maturities and fol-
lows a multi-level concept. This allows for a nuanced presentation
of deterministic and modelled cash flows in existing business on
the one hand and the inclusion of prolongations on the other.

Introduction Equity capital Risk-oriented overall bank management Specific risk management Appendix 69
The following table shows the liquidity gap profile after appli-
cation of the respective stress scenarios for periods of one and
three months. Obviously, significantly more liquidity flows out in a
combined stress scenario compared with the individual scenarios.
As at 31 December 2016, in the one-month and three-month peri-
ods, the combined stress scenario leaves the net liquidity to
€18.5bn and €21.6bn respectively.
Table 46: Liquidity gap profile in the stress scenarios
Net liquidity in the stress scenario | €bn 31.12.2016
Idiosyncratic scenario
1 month 23.0
3 months 27.5
Market-wide scenario
1 month 26.8
3 months 29.9
Combined scenario
1 month 18.5
3 months 21.6
Liquidity reserves
Significant factors in the liquidity risk appetite include the reserve
period, the size of the liquidity reserve portfolio held to compen-
sate for unexpected short-term liquidity outflows, and the limits in
the various maturity bands. As the liquidity reserve portfolio con-
sists of highly liquid assets, it functions as a buffer in stress situa-
tions. The liquidity reserve portfolio is funded in line with the li-
quidity risk appetite in order to ensure that it is kept at the
required size throughout the entire reserve period stipulated by
the Board of Managing Directors.
As at the reporting date, the Bank had a liquidity reserve of
€80.0bn in the form of highly liquid assets. A part of this liquidity
reserve is held in a separate stress liquidity reserve portfolio man-
aged by Treasury to cover liquidity outflows should a stress event
occur and to ensure solvency at all times. In addition, the Bank
operates an intraday liquidity reserve portfolio in the amount of
€8.4bn as at the reporting date.
Liquidity reserves comprise highly liquid assets made up of the
following three components:
• Level 1 contains cash holdings, withdrawable deposits at cen-tral banks, assets of central governments, central banks, re-
gional and local governments, public-sector entities, multilat-
eral development banks and international organisations, banks
with state guarantees, qualifying units or equities of undertak-
ings for collective investment (UCIs) with level 1 assets, exclud-
ing extremely high quality covered bonds, as underlyings, cov-
ered bonds (minimum rating AA–, minimum issue volume
€500m, over-collateralisation at least 2%).
• Level 2A contains assets of central governments, central banks, regional and local governments, public-sector entities (with a
20 % risk weighting); also covered bonds (not contained in
level 1), corporate bonds (minimum rating AA–, minimum vol-
ume €250m, maximum original maturity 10 years), qualifying
units or equities of UCIs with level 2A assets as underlying as-
sets.
• Level 2B contains equities (from main indices), corporate bonds (minimum rating BBB–, minimum volume €250m, max-
imum original maturity 10 years), qualifying units or equities of
UCIs with corporate bonds (credit quality steps 2/3), equities
(major equity index) or non-interest bearing assets (held by
banks for religious reasons) (credit quality steps 3-5) as under-
lying assets.
Table 47: Liquidity reserves from highly liquid assets
Liquidity reserves from highly liquid assets
€bn
31.12.2016
Highly liquid assets 80.0
of which level 1 64.6
of which level 2A 13.6
of which level 2B 1.8
Liquidity ratios
In 2016, Commerzbank’s internal liquidity ratios, including the
regulatory liquidity coverage ratio (LCR), were at all times above
the limits set by the Board of Managing Directors. The same is
true of compliance with the survival period calculation set down
by MaRisk and with the external regulatory German Liquidity
Regulation; at the end of the year, the liquidity ratio under the
German Liquidity Regulation stood at 1.52.
The regulatory LCR is contained in the internal liquidity risk
model as a binding secondary condition. The LCR is calculated as
the ratio of liquid assets to net liquidity outflows under stressed
conditions. It is used to measure whether a bank has a large
enough liquidity buffer to independently withstand any potential
imbalance between inflows and outflows of liquidity under
stressed conditions over a period of 30 calendar days. Following
an introductory period, a minimum ratio of 100% must be com-
plied with from 1 January 2018 onwards. From the start of the new
financial year 2017, the ratio to be complied with is 80%.
70 Commerzbank Disclosure Report 2016
In the past financial year 2016, Commerzbank significantly ex-
ceeded the stipulated minimum ratio of 70% on every reporting
date, meaning that its LCR remained very comfortably in excess of
minimum statutory requirements last year.
Operational risk
Based on the Capital Requirements Regulation (CRR), Com-
merzbank defines operational risk (OpRisk) as the risk of loss re-
sulting from the inadequacy or failure of internal processes, peo-
ple and systems or from external events. This definition includes
legal risks; it does not cover strategic or reputational risks. Given
its heightened economic significance, compliance risk is managed
as a separate risk type. In line with the CRR, however, losses from
compliance risks are still incorporated into the model for deter-
mining regulatory and economic capital for operational risks.
Risk management
Strategy and organisation
Within Commerzbank, OpRisk and governance issues of the inter-
nal control system (ICS) are closely connected in terms of both
organisational structure and methodology and are continuously
being enhanced. This is because many OpRisk cases are closely
linked with failures in the control mechanisms. A properly func-
tioning ICS thereby helps to reduce or avoid losses from opera-
tional risks and thus to lower the amount of capital required to
cover operational risks in the medium to long term. Conversely,
the operational risk management systems enable the ICS to adapt
itself consistently to them. Strengthening the ICS control mecha-
nism is an essential aspect of the proactive reduction and preven-
tion of operational risks.
Chaired by the CRO, the Group OpRisk Committee meets four
times a year and deals with the management of operational risks
within the Commerzbank Group. It also acts as the escalation and
decision-making committee for key OpRisk topics that span all ar-
eas. The Management Boards and/or the Segment Committees
with responsibility for operational risk deal with the management
of operational risk in the relevant units. They analyse all OpRisk
issues that affect them, such as loss events, and define subsequent
measures or recommend action.
Commerzbank’s OpRisk strategy is approved on an annual ba-
sis by the Board of Managing Directors after it has been discussed
and voted upon in the Group OpRisk Committee. It describes the
risk profile, key elements of the desired risk culture, its manage-
ment framework and measures to be taken by the Bank to manage
operational risk.
As such, OpRisk management is based on three consecutive
levels (three lines of defence) which, when taken together, are
crucial for reaching the given strategic aims.
Risk management
Commerzbank takes an active approach to managing operational
risk, aiming to systematically identify OpRisk profiles and risk
concentrations and to define, prioritise and implement risk mitiga-
tion measures.
Operational risks are characterised by asymmetric distribution
of losses. This means that most of the losses are relatively small,
while isolated losses with a very low probability of occurrence
have the potential to be large and devastating. This makes it nec-
essary not only to limit high loss potential but also to proactively
manage losses that can be expected to occur frequently.
To do this, Commerzbank has set up a multi-stage system that
brings together the defined limits on economic capital (risk ca-
pacity) and those set for operational risk management during the
year (risk appetite/tolerance), complemented by rules on the
transparent and conscious acceptance and approval of individual
risks (risk acceptance).
OpRisk management includes an annual evaluation of the
Bank’s ICS and a risk scenario assessment. OpRisk loss events are
also subject to ongoing analysis and ICS backtesting on an event-
driven basis. Where loss events involve ≥ €1m, lessons learned
activities are carried out. External OpRisk events at competitors
are also systematically evaluated.
A structured, centralised and decentralised reporting system
ensures that the management of the Bank and its segments, mem-
bers of the OpRisk Committees and the supervisory bodies are in-
formed regularly, promptly and fully about operational risk.
OpRisk reports are produced quarterly. They contain changes in
OpRisk losses, the segments’ main loss events, current risk anal-
yses, changes in the capital requirement and the status of
measures implemented. Operational risks are also part of the regu-
lar risk reporting process to the Board of Managing Directors and
to the Risk Committee of the Supervisory Board.

Introduction Equity capital Risk-oriented overall bank management Specific risk management Appendix 71
OpRisk model
Commerzbank measures regulatory and economic capital for op-
erational risk using the advanced measurement approach (AMA).
The capital charge determined using quantitative methods is sup-
plemented by qualitative components, in line with the require-
ments of CRR. The AMA is applied throughout the group. The cap-
ital of a subsidiary not included in the AMA is calculated using an
outside AMA.
Quantitative components
The AMA model’s quantitative components include internal and
external OpRisk loss data along with mathematical/statistical mod-
elling.
Group-wide internal OpRisk loss data in line with regulatory
requirements is collected from a starting threshold of €10,000 in a
Group-wide loss database. As the internally calculated loss data
history cannot always reflect extreme OpRisk events adequately,
external OpRisk events must also be factored into the AMA model.
For this purpose we use relevant external data from the Opera-
tional Riskdata eXchange Association (ORX), Zurich, a data con-
sortium of international banks. For mathematical/statistical model-
ling, the data is grouped by combinations of business line, event
category and region. Loss frequency is modelled on the basis of
internal loss data, while distribution is modelled on the basis of
internal and external loss data.
Modelling of insurance and alternative OpRisk transfers does
not currently take place.
Qualitative components
Qualitative methods (risk scenario assessment and business envi-
ronment and control system) are used to complement the infor-
mation from the quantitative model components.
The risk scenario assessment is an ex-ante risk assessment of
operational risks. Based on expert opinions and in accordance
with the requirements of MaRisk, they serve to identify exception-
al but plausibly possible risk events which could jeopardise the
Bank’s existence or severely affect its results and incorporate
these into modelling.
The business environment and control (BEC) system provides
incentives to reduce operational risk and improve risk manage-
ment. Business environment and internal control factors are
shown in the OpRisk model in the form of add-ons and reductions
to regulatory and economic OpRisk capital. The BEC system takes
into account the following qualitative OpRisk elements:
• Internal control system (ICS): As part of the annual ICS review, the company-wide ICS control mechanism is evaluated in terms
of its functionality. To ensure that the internal control system
factors are properly represented, the ICS as a BEC subject area
consists of three components: ICS self-assessment (assessment
by the units implementing the controls), ICS testing (independ-
ent review by internal audit) and ICS documentation (modelling
status in the Bank’s process model).
• Human resources risk: The human resources risk report pre-pared by the Group Human Resources division takes into ac-
count current areas of human resources activity and presents
risk information on the basis of set criteria.
• IT risk: The IT risk report prepared by the Group Services divi-sion brings together data relating to IT risk in the areas of IT
changes and incidents, IT security and access management.
The data cover the four IT security targets: confidentiality, in-
tegrity, availability and transparency.
• Key risk indicators (KRIs): KRIs are used to manage operational risk by means of early warning signals.
• OpRisk management: The OpRisk & ICS area evaluates the ac-tive OpRisk management of the material units on the basis of a
uniform list of criteria. Information on the progress made to-
wards addressing audit findings is also included in the BEC
system.
• Top-level adjustments (TLAs): TLAs are only used in well-founded exceptional cases to establish a risk buffer for extraor-
dinary changes in the OpRisk environment and include this in
the OpRisk capital calculation at short notice. No TLAs are cur-
rently applied.
Stress testing and validation
As an integral part of risk management and the risk-bearing ca-
pacity concept, stress tests for operational risk are carried out on a
regular basis. As a basis for the stress methodology, the AMA
model is consistently used to determine the capital requirement,
with suitable increases in the relevant influencing factors (such as
losses).
To ensure that the AMA model remains appropriate, the meas-
urement approach is validated on a regular basis. The validation
covers assessments of both quantitative and qualitative compo-
nents and the interaction between them. The validation of all AMA
components conducted in 2016 confirmed the appropriateness of
the model. Insignificant changes are planned or have already been
implemented as part of the ongoing development of the AMA
measurement system. No need for material additions or changes
was identified.

72 Commerzbank Disclosure Report 2016
Other risks
In addition to the risk types explicitly defined in the CRR, further
risk types are systematically and actively managed within the
Commerzbank Group. For details on other risks please refer to
page 119 ff. of the Risk Report in the Annual Report 2016.
Introduction Equity capital Risk-oriented overall bank management Specific risk management Appendix 73
Consolidation matrix and material Group entities
While the Commerzbank Group’s Annual Report is based on the
group of consolidated entities under IFRS definitions, the infor-
mation in this Disclosure Report relates to the entities consolidat-
ed for regulatory purposes.
Subsidiaries or controlled companies for the purposes of IFRS
accounting that are not in the financial sector are not consolidated
for regulatory purposes. They are, however, consolidated in the
Group financial statements under IFRS.
The consolidation matrix (see following table 48) shows the
regulatory consolidation categories for the various companies in
Commerzbank Group. The material companies included in this
Disclosure Report are shown individually in the upper part of the
matrix.
The immaterial companies which are of lesser financial signifi-
cance in accordance with the definition of materiality are shown in
the lower part of the matrix.
The classification of the companies is based on section 1 KWG,
supplemented by insurance companies and capital investment
companies. The Commerzbank Group’s investments that are not
consolidated for regulatory purposes are not shown.
The Bank’s classification includes both universal banks and
specialist banks. Financial services institutions include investment
companies, holding companies and other financial companies.
The special purpose vehicles that are deemed to be controlled
by Commerzbank Aktiengesellschaft under the criteria of IFRS 10
are mainly securitisation vehicles and special funds consolidated
under IFRS. 16 special purpose vehicles were consolidated under
IFRS at the reporting date; there is currently no requirement to
consolidate these vehicles for regulatory purposes.
Material companies of the Commerzbank Group are listed by
name in the Company column in the consolidation matrix. The
number of subsidiaries as well as investments of material com-
panies which are relevant for regulatory purposes is shown, bro-
ken down into segments, by consolidation type in the Consolida-
tion column. There are two types of consolidation for regulatory
purposes: full and pro rata. Full consolidation is applied to subsid-
iaries and pro rata consolidation for qualified minority interests.
To avoid the deduction for investments pursuant to section 10.6
KWG, equity investments in institutions and financial companies
may also be voluntarily consolidated on a pro rata basis.
The material entities in the Group – besides Commerzbank
Aktiengesellschaft – are the following:
• mBank S.A. is a modern bank operating in the direct banking area. As such, it serves customers in retail, corporate and in-
vestment banking in Poland, and in retail banking in the Czech
Republic and Slovakia. mBank is one of the largest financial in-
stitutions in Poland.
• comdirect bank AG is one of the leading direct banks in Ger-many. As a full-service bank, it offers private customers all
services from one source. Belonging to the comdirect Group,
comdirect bank is the market leader among Germany’s online
brokers.
• Commerz Real AG is a provider of leasing and investment solu-tions. At the end of 2016, the volume of the managed assets
amounted to around €32bn.
• Effective from 15 February 2016, Commerzbank Finance & Covered Bond S.A. (CFCB) was originated through renaming
Erste Europäische Pfandbrief- und Kommunalkreditbank AG in
Luxembourg (EEPK). It is a specialist bank concentrating on
public finance.
• Loan Solutions Franfurt GmbH (LSF, formerly Hypothekenbank Frankfurt AG) is a service company with the task to self-
dependently and to the greatest possible extent, handle and
further reduce the commercial real estate portfolio which has
been transferred to Commerzbank Aktiengesellschaft.
Risk-weighted investments shown in table 49 below are in-
vestments that are consolidated under IFRS but not for regulatory
purposes. They are allocated to the equity investments asset class
under the CRR and are treated like any other investment position
in this asset class.
Information on the Group consolidation of Commerzbank Ak-
tiengesellschaft is set out in the notes to the Annual Report (online
version), Note 103: Ownership interests.
Appendix
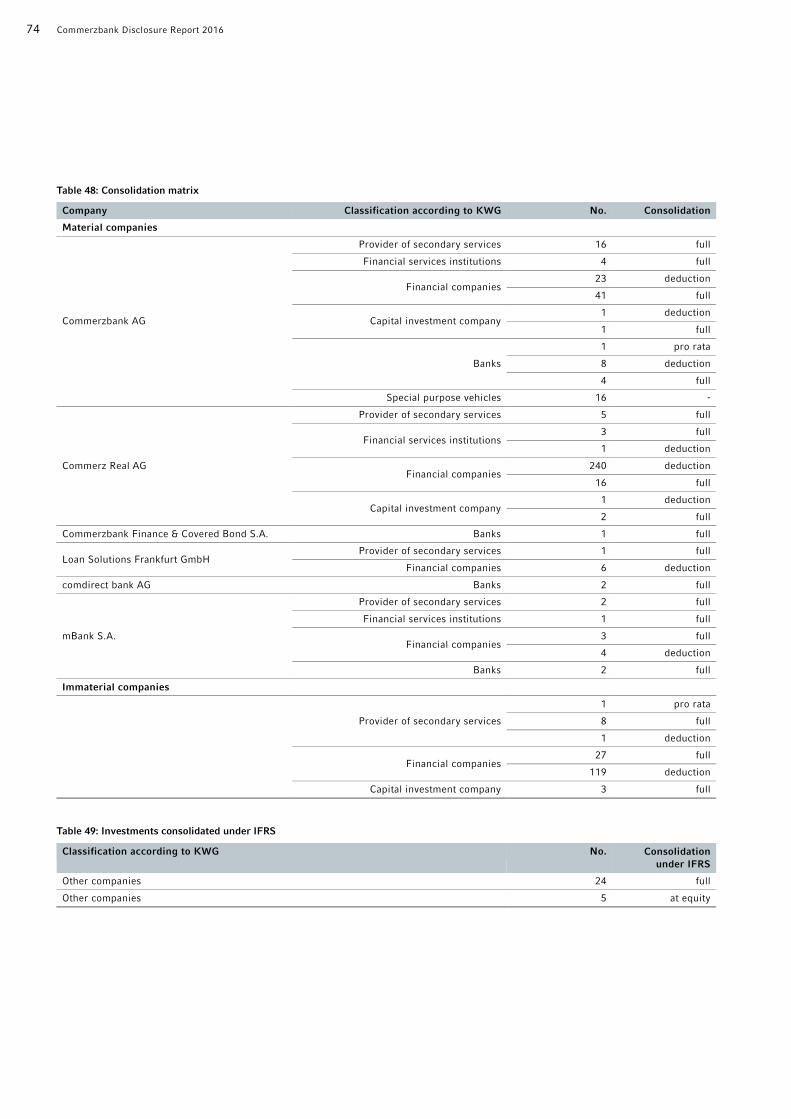
74 Commerzbank Disclosure Report 2016
Table 48: Consolidation matrix Company Classification according to KWG No. Consolidation
Material companies
Commerzbank AG
Provider of secondary services 16 full
Financial services institutions 4 full
Financial companies 23 deduction
41 full
Capital investment company 1 deduction
1 full
Banks
1 pro rata
8 deduction
4 full
Special purpose vehicles 16 -
Commerz Real AG
Provider of secondary services 5 full
Financial services institutions 3 full
1 deduction
Financial companies 240 deduction
16 full
Capital investment company 1 deduction
2 full
Commerzbank Finance & Covered Bond S.A. Banks 1 full
Loan Solutions Frankfurt GmbH Provider of secondary services 1 full
Financial companies 6 deduction
comdirect bank AG Banks 2 full
mBank S.A.
Provider of secondary services 2 full
Financial services institutions 1 full
Financial companies 3 full
4 deduction
Banks 2 full
Immaterial companies
Provider of secondary services
1 pro rata
8 full
1 deduction
Financial companies 27 full
119 deduction
Capital investment company 3 full
Table 49: Investments consolidated under IFRS
Classification according to KWG No. Consolidation
under IFRS
Other companies 24 full
Other companies 5 at equity
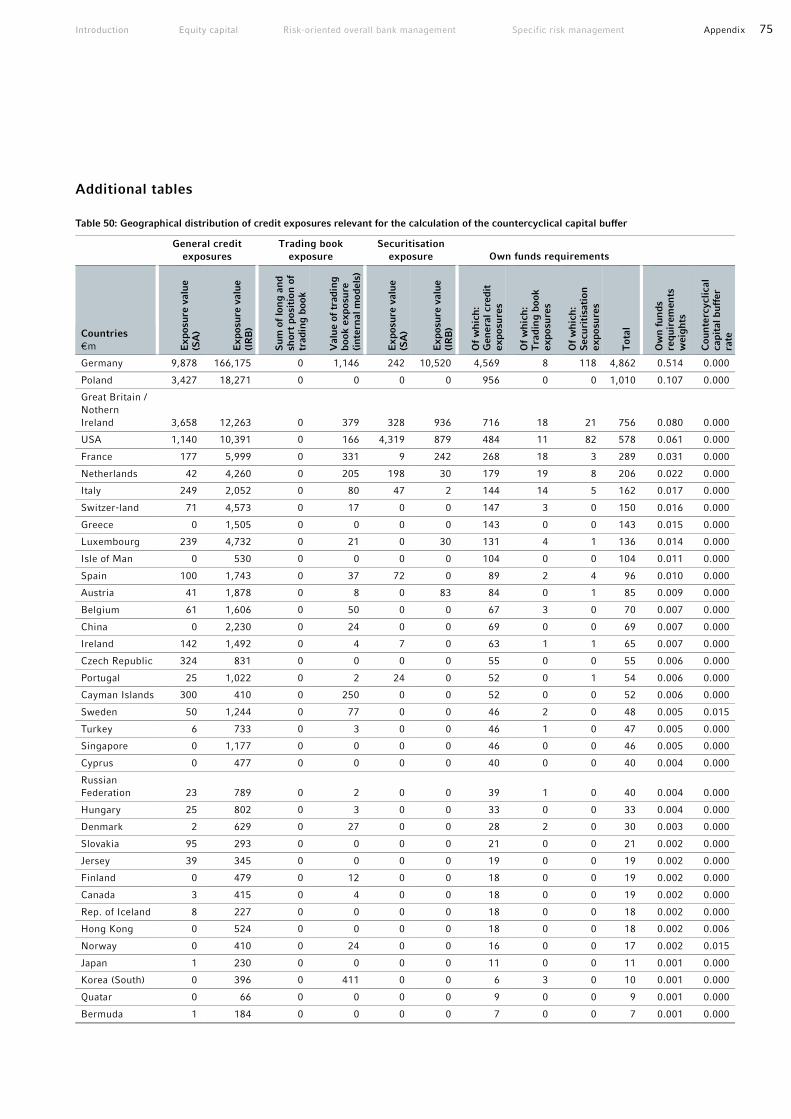
Introduction Equity capital Risk-oriented overall bank management Specific risk management Appendix 75
Additional tables
Table 50: Geographical distribution of credit exposures relevant for the calculation of the countercyclical capital buffer
General credit
exposures
Trading book
exposure
Securitisation
exposure Own funds requirements
Countries
€m Exposu
re v
alu
e
(SA
)
Exposu
re v
alu
e
(IRB
)
Sum
of lo
ng a
nd
short
posi
tion o
f tr
adin
g b
ook
Valu
e o
f tr
adin
g
book e
xposu
re
(inte
rnal m
odels
)
Exposu
re v
alu
e
(SA
)
Exposu
re v
alu
e
(IRB
)
Of w
hic
h:
Genera
l cre
dit
exposu
res
Of w
hic
h:
Tra
din
g b
ook
exposu
res
Of w
hic
h:
Secu
ritisa
tion
exposu
res
Tota
l
Ow
n funds
requir
em
ents
w
eig
hts
Counte
rcycl
ical
capital buffer
rate
Germany 9,878 166,175 0 1,146 242 10,520 4,569 8 118 4,862 0.514 0.000
Poland 3,427 18,271 0 0 0 0 956 0 0 1,010 0.107 0.000
Great Britain /
Nothern
Ireland 3,658 12,263 0 379 328 936 716 18 21 756 0.080 0.000
USA 1,140 10,391 0 166 4,319 879 484 11 82 578 0.061 0.000
France 177 5,999 0 331 9 242 268 18 3 289 0.031 0.000
Netherlands 42 4,260 0 205 198 30 179 19 8 206 0.022 0.000
Italy 249 2,052 0 80 47 2 144 14 5 162 0.017 0.000
Switzer-land 71 4,573 0 17 0 0 147 3 0 150 0.016 0.000
Greece 0 1,505 0 0 0 0 143 0 0 143 0.015 0.000
Luxembourg 239 4,732 0 21 0 30 131 4 1 136 0.014 0.000
Isle of Man 0 530 0 0 0 0 104 0 0 104 0.011 0.000
Spain 100 1,743 0 37 72 0 89 2 4 96 0.010 0.000
Austria 41 1,878 0 8 0 83 84 0 1 85 0.009 0.000
Belgium 61 1,606 0 50 0 0 67 3 0 70 0.007 0.000
China 0 2,230 0 24 0 0 69 0 0 69 0.007 0.000
Ireland 142 1,492 0 4 7 0 63 1 1 65 0.007 0.000
Czech Republic 324 831 0 0 0 0 55 0 0 55 0.006 0.000
Portugal 25 1,022 0 2 24 0 52 0 1 54 0.006 0.000
Cayman Islands 300 410 0 250 0 0 52 0 0 52 0.006 0.000
Sweden 50 1,244 0 77 0 0 46 2 0 48 0.005 0.015
Turkey 6 733 0 3 0 0 46 1 0 47 0.005 0.000
Singapore 0 1,177 0 0 0 0 46 0 0 46 0.005 0.000
Cyprus 0 477 0 0 0 0 40 0 0 40 0.004 0.000
Russian
Federation 23 789 0 2 0 0 39 1 0 40 0.004 0.000
Hungary 25 802 0 3 0 0 33 0 0 33 0.004 0.000
Denmark 2 629 0 27 0 0 28 2 0 30 0.003 0.000
Slovakia 95 293 0 0 0 0 21 0 0 21 0.002 0.000
Jersey 39 345 0 0 0 0 19 0 0 19 0.002 0.000
Finland 0 479 0 12 0 0 18 0 0 19 0.002 0.000
Canada 3 415 0 4 0 0 18 0 0 19 0.002 0.000
Rep. of Iceland 8 227 0 0 0 0 18 0 0 18 0.002 0.000
Hong Kong 0 524 0 0 0 0 18 0 0 18 0.002 0.006
Norway 0 410 0 24 0 0 16 0 0 17 0.002 0.015
Japan 1 230 0 0 0 0 11 0 0 11 0.001 0.000
Korea (South) 0 396 0 411 0 0 6 3 0 10 0.001 0.000
Quatar 0 66 0 0 0 0 9 0 0 9 0.001 0.000
Bermuda 1 184 0 0 0 0 7 0 0 7 0.001 0.000
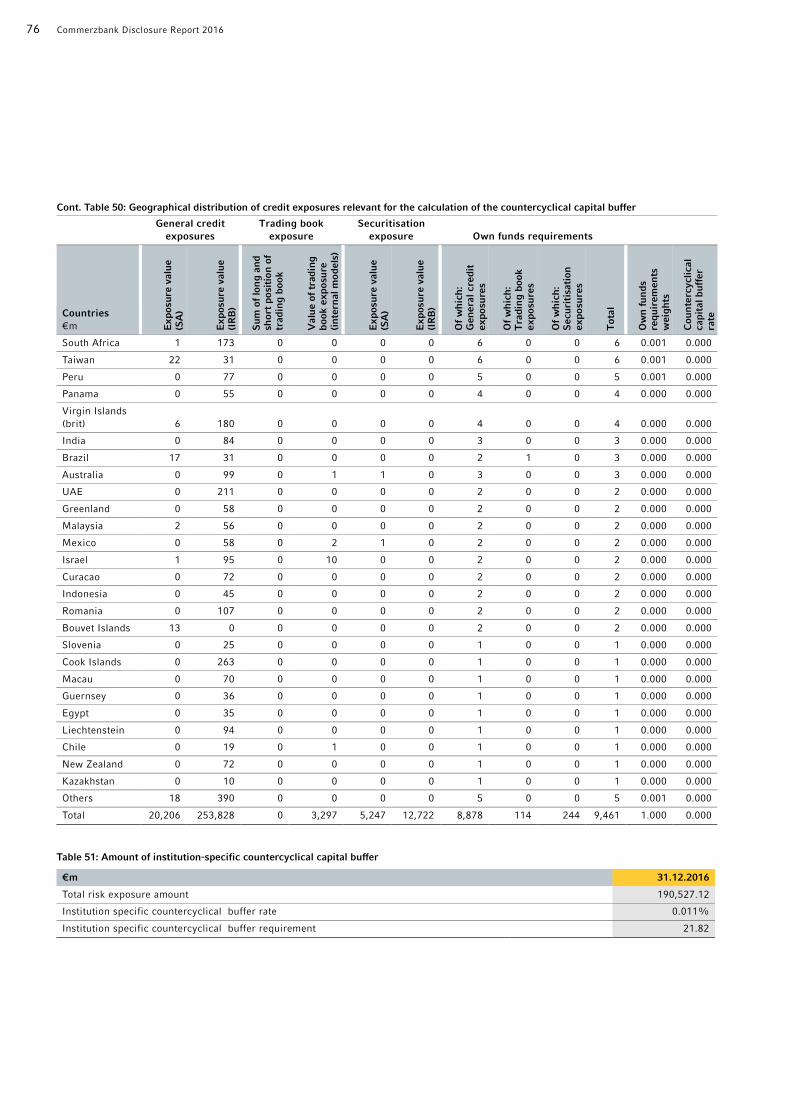
76 Commerzbank Disclosure Report 2016
Cont. Table 50: Geographical distribution of credit exposures relevant for the calculation of the countercyclical capital buffer
General credit
exposures
Trading book
exposure
Securitisation
exposure Own funds requirements
Countries
€m Exposu
re v
alu
e
(SA
)
Exposu
re v
alu
e
(IRB
)
Sum
of lo
ng a
nd
short
posi
tion o
f tr
adin
g b
ook
Valu
e o
f tr
adin
g
book e
xposu
re
(inte
rnal m
odels
)
Exposu
re v
alu
e
(SA
)
Exposu
re v
alu
e
(IRB
)
Of w
hic
h:
Genera
l cre
dit
exposu
res
Of w
hic
h:
Tra
din
g b
ook
exposu
res
Of w
hic
h:
Secu
ritisa
tion
exposu
res
Tota
l
Ow
n funds
requir
em
ents
w
eig
hts
Counte
rcycl
ical
capital buffer
rate
South Africa 1 173 0 0 0 0 6 0 0 6 0.001 0.000
Taiwan 22 31 0 0 0 0 6 0 0 6 0.001 0.000
Peru 0 77 0 0 0 0 5 0 0 5 0.001 0.000
Panama 0 55 0 0 0 0 4 0 0 4 0.000 0.000
Virgin Islands
(brit) 6 180 0 0 0 0 4 0 0 4 0.000 0.000
India 0 84 0 0 0 0 3 0 0 3 0.000 0.000
Brazil 17 31 0 0 0 0 2 1 0 3 0.000 0.000
Australia 0 99 0 1 1 0 3 0 0 3 0.000 0.000
UAE 0 211 0 0 0 0 2 0 0 2 0.000 0.000
Greenland 0 58 0 0 0 0 2 0 0 2 0.000 0.000
Malaysia 2 56 0 0 0 0 2 0 0 2 0.000 0.000
Mexico 0 58 0 2 1 0 2 0 0 2 0.000 0.000
Israel 1 95 0 10 0 0 2 0 0 2 0.000 0.000
Curacao 0 72 0 0 0 0 2 0 0 2 0.000 0.000
Indonesia 0 45 0 0 0 0 2 0 0 2 0.000 0.000
Romania 0 107 0 0 0 0 2 0 0 2 0.000 0.000
Bouvet Islands 13 0 0 0 0 0 2 0 0 2 0.000 0.000
Slovenia 0 25 0 0 0 0 1 0 0 1 0.000 0.000
Cook Islands 0 263 0 0 0 0 1 0 0 1 0.000 0.000
Macau 0 70 0 0 0 0 1 0 0 1 0.000 0.000
Guernsey 0 36 0 0 0 0 1 0 0 1 0.000 0.000
Egypt 0 35 0 0 0 0 1 0 0 1 0.000 0.000
Liechtenstein 0 94 0 0 0 0 1 0 0 1 0.000 0.000
Chile 0 19 0 1 0 0 1 0 0 1 0.000 0.000
New Zealand 0 72 0 0 0 0 1 0 0 1 0.000 0.000
Kazakhstan 0 10 0 0 0 0 1 0 0 1 0.000 0.000
Others 18 390 0 0 0 0 5 0 0 5 0.001 0.000
Total 20,206 253,828 0 3,297 5,247 12,722 8,878 114 244 9,461 1.000 0.000
Table 51: Amount of institution-specific countercyclical capital buffer
€m 31.12.2016
Total risk exposure amount 190,527.12
Institution specific countercyclical buffer rate 0.011%
Institution specific countercyclical buffer requirement 21.82

Introduction Equity capital Risk-oriented overall bank management Specific risk management Appendix 77
Table 52: Addition to table 1 (Equity structure):
B: Reference to article in EU regulation no. 575/2013 Line (B) Reference to article in the regulation
(EU) Nr. 575/2013
1 26 (1), 27, 28, 29, EBA list 26 (3)
1a EBA list 26 (3)
1b EBA list 26 (3)
1c EBA list 26 (3)
2 26 (1) (c)
3 26 (1)
3a 26 (1) (f)
4 486 (2)
4a 483 (2)
5 84, 479, 480
5a 26 (2)
6
7 34, 105
8 36 (1) (b), 37, 472 (4)
9
10 36 (1) (c), 37, 472 (4)
11 33 (a)
12 36 (1) (d), 40, 159, 472 (6)
13 32 (1)
14 33 (b)
15 36 (1) (e), 41, 472 (7)
16 36 (1) (f), 42, 472 (8)
17 36 (1) (g), 44, 472 (9)
18 36 (1) (h), 43, 45, 46, 49 (2) (3), 79, 472 (10)
19
36 (1) (i), 43, 45, 47, 48 (1) (b), 49 (1) to
(3), 79, 470, 471 (11)
20
20a 36 (1) (k)
20b 36 (1) (k) (i), 89 to 91
20c 36 (1) (k) (ii), 243 (1) (b), 244 (1) (b), 258
20d 36 (1) (k) (iii), 379 (3)
21 36 (1) (c), 38, 48 (1) (a), 470, 472 (5)
22 48 (1)
23 36 (1) (i), 48 (1) (b), 470, 472 (11)
24
25 36 (1) (c), 38, 48 (1) (a), 470, 472 (5)
25a 36 (1) (a), 472 (2)
25b 36 (1) (l)
26
26a
26a.1 467
26a.2 468
26b 481
27 36 (1) (j)
28
29
30 51, 52
31
Line (B) Reference to article in the regulation
(EU) Nr. 575/2013
32
33 486 (3)
33a 486 (3)
34 85, 86, 480
35 486 (3)
36
37 52 (1) (b), 56 (a), 57, 475 (2)
38 56 (b), 58, 475 (3)
39 56 (c), 59, 60, 79, 475 (4)
40 56 (d), 59, 79, 475 (4)
41
41a
472, 472 (3)(a), 472 (4), 472 (6), 472 (8)
(a), 472 (9), 472 (10) (a), 472 (11) (a)
41a.1 472 (3)(a)
41a.2 472 (4)
41a.3 472 (6)
41a.4 472 (8)(a)
41a.5 472(9)
41a.6 472(10)
41.7 472(11)
41b 477, 477 (3), 477 (4) (a)
41c 467, 468, 481
41c.1 467
41c.2 468
41c.3 481
42 56 (e)
43
44
45
46 62, 63
47 486 (4)
47a 483 (4)
48 87, 87, 480
49 486 (4)
50 62 (c) & (d)
51
52 63 (b) (i), 66 (a), 67, 477 (2)
53 66 (b), 68, 477 (3)
54 66 (c), 69, 70, 79, 477 (4)
55 66 (d), 69, 79, 477 (4)
56
56a
472, 472 (3)(a), 472 (4), 472 (6), 472 (8)
(a), 472 (9), 472 (10) (a), 472 (11) (a)
56b 475, 475 (2) (a), 475 (3), 475 (4) (a)
56c 467, 468, 481
56c.1 467
56c.2 468
57
58
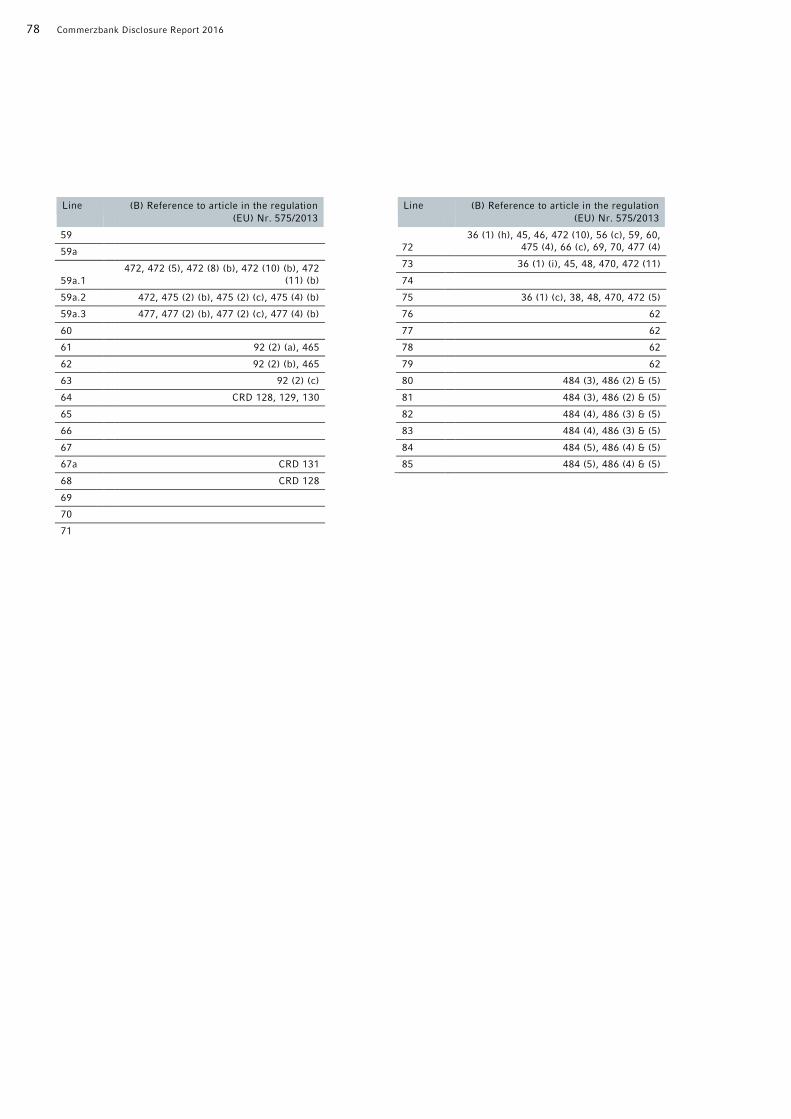
78 Commerzbank Disclosure Report 2016
Line (B) Reference to article in the regulation
(EU) Nr. 575/2013
59
59a
59a.1
472, 472 (5), 472 (8) (b), 472 (10) (b), 472
(11) (b)
59a.2 472, 475 (2) (b), 475 (2) (c), 475 (4) (b)
59a.3 477, 477 (2) (b), 477 (2) (c), 477 (4) (b)
60
61 92 (2) (a), 465
62 92 (2) (b), 465
63 92 (2) (c)
64 CRD 128, 129, 130
65
66
67
67a CRD 131
68 CRD 128
69
70
71
Line (B) Reference to article in the regulation
(EU) Nr. 575/2013
72
36 (1) (h), 45, 46, 472 (10), 56 (c), 59, 60,
475 (4), 66 (c), 69, 70, 477 (4)
73 36 (1) (i), 45, 48, 470, 472 (11)
74
75 36 (1) (c), 38, 48, 470, 472 (5)
76 62
77 62
78 62
79 62
80 484 (3), 486 (2) & (5)
81 484 (3), 486 (2) & (5)
82 484 (4), 486 (3) & (5)
83 484 (4), 486 (3) & (5)
84 484 (5), 486 (4) & (5)
85 484 (5), 486 (4) & (5)

Introduction Equity capital Risk-oriented overall bank management Specific risk management Appendix 79
Table 53: Credit risk parameters by geographical location (incl. default portfolio, i.e. for default positions PD = 1)
in % Belgium China Germany France
UK Hong-kong
Italy Japan Luxem-bourg
Nether-lands
Austria
Central governments or
central banks
Ø LGD 36.07 10.54 59.04 20.00
Ø PD 0.17 0.04 0.05 0.22
Institutions Ø LGD 37.10 46.38 39.50 42.18 57.30 55.27 43.60 44.95 40.34 50.78 25.57
Ø PD 0.06 0.68 0.14 0.14 1.10 0.18 0.96 0.08 0.10 0.10 0.38
Corporates Ø LGD 43.25 36.60 35.90 40.77 42.91 35.43 44.28 40.97 33.27 40.33 41.36
Ø PD 0.44 0.49 5.88 2.86 1.21 4.23 4.08 0.93 7.98 3.49 0.75
thereof specialised
lending
Ø LGD 47.53 41.14 33.65 33.84 35.77 38.86 46.52 55.02 37.58 25.66
Ø PD 0.70 0.85 16.13 17.62 4.15 3.19 11.11 38.93 11.91 8.25
thereof SMEs Ø LGD 43.78 31.37 42.92 53.83 43.77 59.29 65.79 43.86 40.87
Ø PD 0.10 6.22 0.20 2.45 0.40 0.50 0.37 0.62 0.27
Retail Ø LGD 22.23 28.95 23.99 20.77 18.21 24.09 20.19 32.60 21.29 23.13 27.22
Ø PD 1.50 1.00 1.52 0.97 1.28 0.66 0.37 8.26 2.56 2.04 2.18
Secured by mortg. on
immov. property, SMEs
Ø LGD 10.62 2.50 23.04
Ø PD 1.38 0.19 0.66
Sec. by mortg.on immov.
property, excl. SMEs
Ø LGD 12.53 10.89 13.54 12.45 11.77 8.94 10.16 12.19 13.32 14.21 12.42
Ø PD 1.91 0.18 0.96 1.27 0.42 0.55 0.31 5.26 3.38 0.59 0.76
Qualifying revolving Ø LGD 59.62 57.32 59.52 59.48 59.16 58.21 59.58 59.86 58.61 59.67 58.80
Ø PD 0.92 0.14 0.40 0.29 0.92 0.10 0.26 0.20 0.30 0.95 1.11
Other, SMEs Ø LGD 40.82 41.92 37.07 43.12 39.09 38.98 33.09 45.08 28.37 39.92 22.11
Ø PD 0.81 3.73 4.50 0.70 3.04 1.17 0.90 15.37 0.50 12.04 2.01
Other, excluding
SMEs
Ø LGD 34.31 40.20 35.89 20.09 26.43 45.51 18.87 33.23 40.41 33.25 35.87
Ø PD 0.50 0.44 2.50 0.78 3.59 0.31 0.33 1.80 1.30 1.60 3.44
Total Ø LGD 41.26 39.43 29.38 40.89 47.52 41.91 43.75 22.18 34.20 42.23 33.80
Ø PD 0.36 0.52 3.24 2.23 1.17 2.88 2.65 0.23 6.86 2.77 0.63
Cont. Table 53: Credit risk parameters by geographical location (incl. default portfolio, i.e. for default positions PD = 1)
in % Poland Russia Switzer-land
Singa-pore
Slova-kia
Spain Czech Republic
Hungary Unit. Arab Emirates
USA
Central governments or
central banks
Ø LGD 100.00 100.00 10.00 22.49 45.00 100.00 100.00 99.92 10.00
Ø PD 0.13 0.81 0.02 0.03 1.56 0.05 0.24 0.15
Institutions Ø LGD 37.13 38.30 27.71 52.96 46.81 13.55 40.69 40.49 54.06 30.10
Ø PD 0.28 2.78 0.07 0.10 0.19 0.41 0.17 3.77 0.28 0.75
Corporates Ø LGD 40.87 41.96 39.26 38.71 39.90 40.38 36.79 47.71 18.34 41.68
Ø PD 5.11 8.99 0.37 2.42 0.91 6.42 5.27 0.62 0.57 3.63
thereof specialised
lending
Ø LGD 28.30 42.83 21.19 33.71 41.58 42.53 35.67 89.85 42.52 51.69
Ø PD 10.87 0.13 0.52 13.85 0.96 4.01 2.48 1.17 0.11 1.77
thereof SMEs Ø LGD 43.89 64.87 33.16 44.07 19.27 57.68 56.31 43.78 43.33
Ø PD 5.89 93.47 0.56 0.58 0.58 29.53 48.24 1.60 1.61
Retail Ø LGD 35.60 17.01 22.51 22.81 33.16 24.33 31.48 33.09 23.22 22.95
Ø PD 6.59 0.50 1.05 0.28 14.38 0.85 3.11 2.78 0.96 1.10
Secured by mortg. on
immov. property, SMEs
Ø LGD 33.01 2.50 21.38
Ø PD 10.56 0.40 0.82
Sec. by mortg.on immov.
property, excl. SMEs
Ø LGD 29.45 11.41 15.76 12.96 22.11 11.35 10.79 9.63 11.85 13.29
Ø PD 5.13 0.40 0.84 0.20 49.37 0.55 2.54 5.54 0.37 1.03
Qualifying revolving Ø LGD 60.15 59.03 59.00 57.74 61.82 59.80 60.51 59.82 56.78 59.67
Ø PD 0.60 0.33 0.65 0.20 0.84 0.20 0.48 0.17 0.28 0.29
Other, SMEs Ø LGD 36.28 43.60 41.31 43.51 35.04 42.88 30.54 43.90 34.63
Ø PD 8.89 2.55 1.40 0.57 2.56 2.13 3.50 0.25 0.97
Other, excluding
SMEs
Ø LGD 51.63 24.74 28.21 31.94 51.64 24.37 41.65 48.15 34.06 30.45
Ø PD 7.93 0.67 1.39 0.30 4.53 1.31 3.37 3.94 1.70 1.53
Total Ø LGD 37.72 42.79 26.54 36.97 39.83 26.18 39.49 53.91 49.15 34.94
Ø PD 5.88 5.09 0.21 1.73 1.06 3.22 4.94 0.66 0.37 2.47
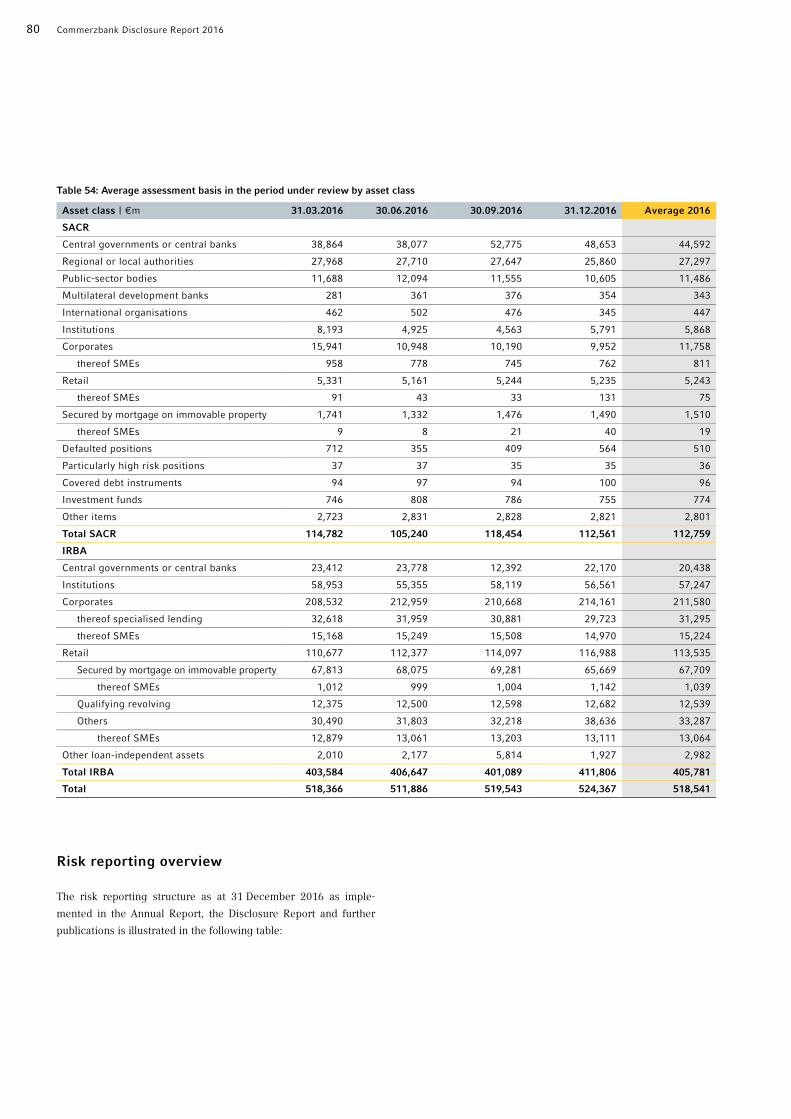
80 Commerzbank Disclosure Report 2016
Table 54: Average assessment basis in the period under review by asset class Asset class | €m 31.03.2016 30.06.2016 30.09.2016 31.12.2016 Average 2016
SACR
Central governments or central banks 38,864 38,077 52,775 48,653 44,592
Regional or local authorities 27,968 27,710 27,647 25,860 27,297
Public-sector bodies 11,688 12,094 11,555 10,605 11,486
Multilateral development banks 281 361 376 354 343
International organisations 462 502 476 345 447
Institutions 8,193 4,925 4,563 5,791 5,868
Corporates 15,941 10,948 10,190 9,952 11,758
thereof SMEs 958 778 745 762 811
Retail 5,331 5,161 5,244 5,235 5,243
thereof SMEs 91 43 33 131 75
Secured by mortgage on immovable property 1,741 1,332 1,476 1,490 1,510
thereof SMEs 9 8 21 40 19
Defaulted positions 712 355 409 564 510
Particularly high risk positions 37 37 35 35 36
Covered debt instruments 94 97 94 100 96
Investment funds 746 808 786 755 774
Other items 2,723 2,831 2,828 2,821 2,801
Total SACR 114,782 105,240 118,454 112,561 112,759
IRBA
Central governments or central banks 23,412 23,778 12,392 22,170 20,438
Institutions 58,953 55,355 58,119 56,561 57,247
Corporates 208,532 212,959 210,668 214,161 211,580
thereof specialised lending 32,618 31,959 30,881 29,723 31,295
thereof SMEs 15,168 15,249 15,508 14,970 15,224
Retail 110,677 112,377 114,097 116,988 113,535
Secured by mortgage on immovable property 67,813 68,075 69,281 65,669 67,709
thereof SMEs 1,012 999 1,004 1,142 1,039
Qualifying revolving 12,375 12,500 12,598 12,682 12,539
Others 30,490 31,803 32,218 38,636 33,287
thereof SMEs 12,879 13,061 13,203 13,111 13,064
Other loan-independent assets 2,010 2,177 5,814 1,927 2,982
Total IRBA 403,584 406,647 401,089 411,806 405,781
Total 518,366 511,886 519,543 524,367 518,541
Risk reporting overview
The risk reporting structure as at 31 December 2016 as imple-
mented in the Annual Report, the Disclosure Report and further
publications is illustrated in the following table:

Introduction Equity capital Risk-oriented overall bank management Specific risk management Appendix 81
Table 55: Risk reporting overview
Topic Detail Disclosure report Page
Annual Report Page
Further publications
Equity capital
Capital structure 5–12 248
Equity instruments 213–214
Commerzbank
homepage
Capital requirements and leverage ratio 12–15 246–252
Risk-oriented
overall bank
management
Risk statement 16–17
Risk management organisation 17 94–95
Risk strategy and risk management 17–19 95–96
Risk parameters 96–97
Risk-bearing capacity and stress testing 20–21 97–98
Regulatory environment 98–99
Default risk
Strategy and organisation 22 100
Risk management 23–24 100–104
Credit risk model 25–32
Rating architecture 25–28 103
Quantitative information on default risks 32–46 104–111
Analysis by segment 106–108
Analysis by regulatory approach (IRBA/SACR) 32–43
Default risks from derivative positions 44–46
Loan loss provisions for default risks 46–50 105–108
Investments in the banking book 51–52 187–190
Securitisations 53–61
107, 110–111,
265–268
Market risk
Strategy and organisation 62 112
Risk management 62–63 112–113
Market risk model 63–65
Quantitative information on market risks 65–66 113–115
Interest rate risk in the banking book 66–67 114–115
Market liquidity risk 66 115
Liquidity risk
Strategy and organisation 67 115
Risk management 68 115–116
Quantification and stress testing 116
Liquidity risk model 68–70 116
Encumbrance of assets 314–315
Operational risk
Strategy and organisation 70 118
Risk management 70 118–119
OpRisk model 71
Other
Legal risk 119–121
Compliance risk 121
Reputational risk 121–122
IT risk 122–123
Human resources risk 123
Business strategy risk 123
Model risk 124
Corporate governance report 21–25
Commerzbank
homepage
Remuneration 26–40
Commerzbank
homepage
Indicators of systemic importance
Commerzbank
homepage
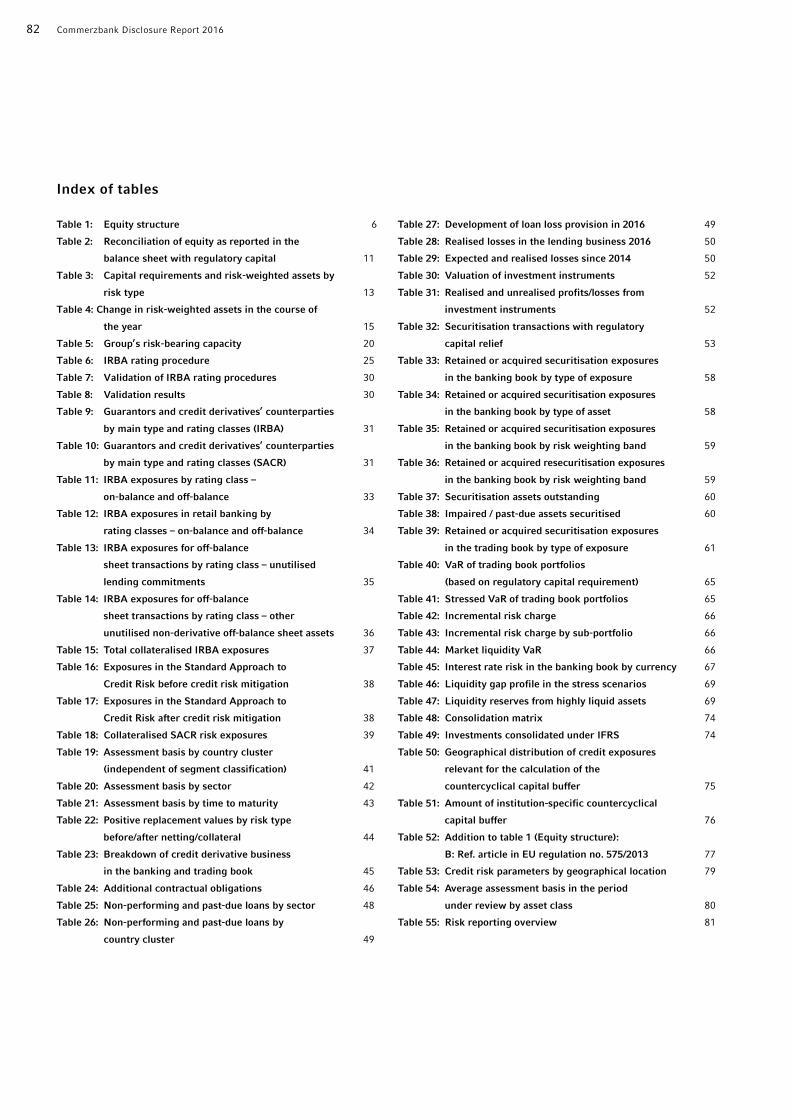
82 Commerzbank Disclosure Report 2016
Index of tables
Table 1: Equity structure 6
Table 2: Reconciliation of equity as reported in the
balance sheet with regulatory capital 11
Table 3: Capital requirements and risk-weighted assets by
risk type 13
Table 4: Change in risk-weighted assets in the course of
the year 15
Table 5: Group’s risk-bearing capacity 20
Table 6: IRBA rating procedure 25
Table 7: Validation of IRBA rating procedures 30
Table 8: Validation results 30
Table 9: Guarantors and credit derivatives’ counterparties
by main type and rating classes (IRBA) 31
Table 10: Guarantors and credit derivatives’ counterparties
by main type and rating classes (SACR) 31
Table 11: IRBA exposures by rating class –
on-balance and off-balance 33
Table 12: IRBA exposures in retail banking by
rating classes – on-balance and off-balance 34
Table 13: IRBA exposures for off-balance
sheet transactions by rating class – unutilised
lending commitments 35
Table 14: IRBA exposures for off-balance
sheet transactions by rating class – other
unutilised non-derivative off-balance sheet assets 36
Table 15: Total collateralised IRBA exposures 37
Table 16: Exposures in the Standard Approach to
Credit Risk before credit risk mitigation 38
Table 17: Exposures in the Standard Approach to
Credit Risk after credit risk mitigation 38
Table 18: Collateralised SACR risk exposures 39
Table 19: Assessment basis by country cluster
(independent of segment classification) 41
Table 20: Assessment basis by sector 42
Table 21: Assessment basis by time to maturity 43
Table 22: Positive replacement values by risk type
before/after netting/collateral 44
Table 23: Breakdown of credit derivative business
in the banking and trading book 45
Table 24: Additional contractual obligations 46
Table 25: Non-performing and past-due loans by sector 48
Table 26: Non-performing and past-due loans by
country cluster 49
Table 27: Development of loan loss provision in 2016 49
Table 28: Realised losses in the lending business 2016 50
Table 29: Expected and realised losses since 2014 50
Table 30: Valuation of investment instruments 52
Table 31: Realised and unrealised profits/losses from
investment instruments 52
Table 32: Securitisation transactions with regulatory
capital relief 53
Table 33: Retained or acquired securitisation exposures
in the banking book by type of exposure 58
Table 34: Retained or acquired securitisation exposures
in the banking book by type of asset 58
Table 35: Retained or acquired securitisation exposures
in the banking book by risk weighting band 59
Table 36: Retained or acquired resecuritisation exposures
in the banking book by risk weighting band 59
Table 37: Securitisation assets outstanding 60
Table 38: Impaired / past-due assets securitised 60
Table 39: Retained or acquired securitisation exposures
in the trading book by type of exposure 61
Table 40: VaR of trading book portfolios
(based on regulatory capital requirement) 65
Table 41: Stressed VaR of trading book portfolios 65
Table 42: Incremental risk charge 66
Table 43: Incremental risk charge by sub-portfolio 66
Table 44: Market liquidity VaR 66
Table 45: Interest rate risk in the banking book by currency 67
Table 46: Liquidity gap profile in the stress scenarios 69
Table 47: Liquidity reserves from highly liquid assets 69
Table 48: Consolidation matrix 74
Table 49: Investments consolidated under IFRS 74
Table 50: Geographical distribution of credit exposures
relevant for the calculation of the
countercyclical capital buffer 75
Table 51: Amount of institution-specific countercyclical
capital buffer 76
Table 52: Addition to table 1 (Equity structure):
B: Ref. article in EU regulation no. 575/2013 77
Table 53: Credit risk parameters by geographical location 79
Table 54: Average assessment basis in the period
under review by asset class 80
Table 55: Risk reporting overview 81
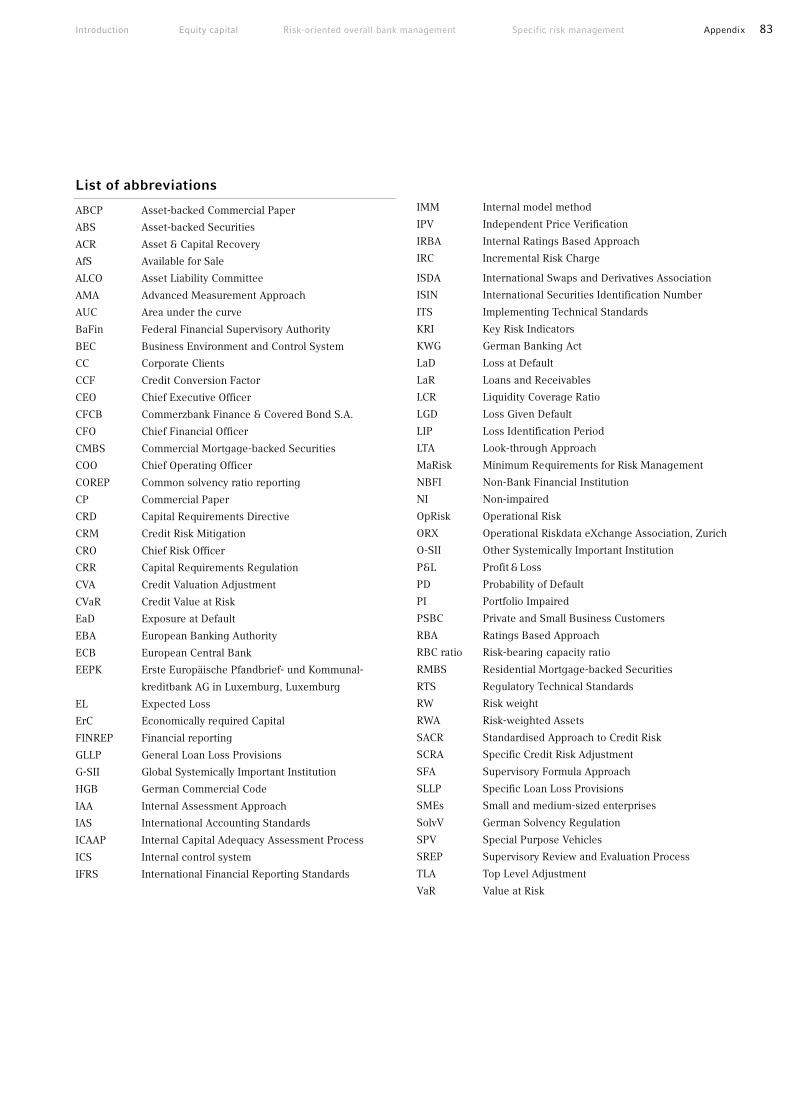
Introduction Equity capital Risk-oriented overall bank management Specific risk management Appendix 83
List of abbreviations
ABCP Asset-backed Commercial Paper
ABS Asset-backed Securities
ACR Asset & Capital Recovery
AfS Available for Sale
ALCO Asset Liability Committee
AMA Advanced Measurement Approach
AUC Area under the curve
BaFin Federal Financial Supervisory Authority
BEC Business Environment and Control System
CC Corporate Clients
CCF Credit Conversion Factor
CEO Chief Executive Officer
CFCB Commerzbank Finance & Covered Bond S.A.
CFO Chief Financial Officer
CMBS Commercial Mortgage-backed Securities
COO Chief Operating Officer
COREP Common solvency ratio reporting
CP Commercial Paper
CRD Capital Requirements Directive
CRM Credit Risk Mitigation
CRO Chief Risk Officer
CRR Capital Requirements Regulation
CVA Credit Valuation Adjustment
CVaR Credit Value at Risk
EaD Exposure at Default
EBA European Banking Authority
ECB European Central Bank
EEPK Erste Europäische Pfandbrief- und Kommunal-
kreditbank AG in Luxemburg, Luxemburg
EL Expected Loss
ErC Economically required Capital
FINREP Financial reporting
GLLP General Loan Loss Provisions
G-SII Global Systemically Important Institution
HGB German Commercial Code
IAA Internal Assessment Approach
IAS International Accounting Standards
ICAAP Internal Capital Adequacy Assessment Process
ICS Internal control system
IFRS International Financial Reporting Standards
IMM Internal model method
IPV Independent Price Verification
IRBA Internal Ratings Based Approach
IRC Incremental Risk Charge
ISDA International Swaps and Derivatives Association
ISIN International Securities Identification Number
ITS Implementing Technical Standards
KRI Key Risk Indicators
KWG German Banking Act
LaD Loss at Default
LaR Loans and Receivables
LCR Liquidity Coverage Ratio
LGD Loss Given Default
LIP Loss Identification Period
LTA Look-through Approach
MaRisk Minimum Requirements for Risk Management
NBFI Non-Bank Financial Institution
NI Non-impaired
OpRisk Operational Risk
ORX Operational Riskdata eXchange Association, Zurich
O-SII Other Systemically Important Institution
P&L Profit & Loss
PD Probability of Default
PI Portfolio Impaired
PSBC Private and Small Business Customers
RBA Ratings Based Approach
RBC ratio Risk-bearing capacity ratio
RMBS Residential Mortgage-backed Securities
RTS Regulatory Technical Standards
RW Risk weight
RWA Risk-weighted Assets
SACR Standardised Approach to Credit Risk
SCRA Specific Credit Risk Adjustment
SFA Supervisory Formula Approach
SLLP Specific Loan Loss Provisions
SMEs Small and medium-sized enterprises
SolvV German Solvency Regulation
SPV Special Purpose Vehicles
SREP Supervisory Review and Evaluation Process
TLA Top Level Adjustment
VaR Value at Risk

84 Commerzbank Disclosure Report 2016
Disclaimer
Commerzbank’s internal risk measurement methods and models which form the basis for the calculation of the figures shown in this report
are state-of-the-art and are based on banking sector practice. The risk models produce results appropriate to the management of the Bank.
The measurement approaches are regularly reviewed by risk control and internal audit, external auditors and the German supervisory au-
thorities. Despite being carefully developed and regularly monitored, models cannot cover all the influencing factors that have an impact in
reality or illustrate their complex behaviour and interactions. These limits to risk modelling apply particularly in extreme situations. Supple-
mentary stress tests and scenario analyses can only show examples of the risks to which a portfolio may be exposed in extreme market situ-
ations. However, stress testing all imaginable scenarios is not feasible. Stress tests cannot offer a final estimate of the maximum loss should
an extreme event occur.
The interpretations with regard to CRR/CRD IV rules are still ongoing. For example, some of the related binding Technical Standards
are not yet available in their final version. Against this background we will continue to refine our methods and models in line with the in-
terpretation of the rules. Thus, our measures may not be comparable with previously published measures and our competitors’ measures
published may differ from ours.
This report contains forward-looking statements on Commerzbank’s business and earnings performance, which are based upon our
current plans, estimates, forecasts and expectations. The statements entail risks and uncertainties, as there is a variety of factors which
influence our business and to a great extent lie beyond our sphere of influence. Above all, these include the economic situation, the state
of the financial markets worldwide and possible loan defaults. Actual results and developments may, therefore, diverge considerably from
our current assumptions, which, for this reason, are valid only at the time of publication. We undertake no obligation to revise our for-
ward-looking statements in the light of either new information or unexpected events.

Commerzbank AG
Head Office
Kaiserplatz
Frankfurt am Main
www.commerzbank.de
Postal address
60261 Frankfurt am Main
Tel. +49 69 136- 20
Investor Relations
Tel. +49 69 136- 22255
Fax +49 69 136- 29492