2017 the common sense census€¦ · the common sense census: media use by kids age zero to eight 4...
TRANSCRIPT

THE COMMON SENSE CENSUS: MEDIA USE BY KIDS
AGE ZERO TO EIGHT
2017


Common Sense is a nonprofit, nonpartisan organization dedicated to improving the lives of kids, families, and educators by providing the trustworthy information, education, and independent voice they need to thrive in a world of media and technology.
Our independent research is designed to provide parents, educators, health organizations, and policymakers with reliable, independent data on children’s use of media and technology and the impact it has on their physical, emotional, social, and intellectual development. For more information, visit www.commonsense.org/research.

Common Sense is grateful for the generous support and underwriting that funded this research report.
The Morgan Family Foundation
Peter and Helen Bing
John H.N. Fisher and Jennifer CaldwellEva and Bill Price
Carnegie Corporation of New York The Grable Foundation
The David and Lucile Packard Foundation

EXECUTIVE SUMMARY
Opening Letter 4
Essays 6
Jenny Radesky: Taking Advantage of Real Opportunities
to Help Families Overwhelmed by Technology . . . . . . . . . . . . . . . . . . . . 6
Michael H. Levine: M Is for Mobile . . . . . . . . . . . . . . . . . . . . . . . . . . . 6
Julián Castro: A Narrowing but Still Troubling Divide . . . . . . . . . . . . . . . . 8
At a Glance: Evolution of Kids’ Media Use 2011–2017 9
Introduction 11
Methodology 12
Survey Sample . . . . . . . . . . . . . . . . . . . . . . . . . . . . . . . . . . . . . . . 12
Media Definitions . . . . . . . . . . . . . . . . . . . . . . . . . . . . . . . . . . . . . 12
Demographic Definitions . . . . . . . . . . . . . . . . . . . . . . . . . . . . . . . . 13
Presentation of Data in the Text . . . . . . . . . . . . . . . . . . . . . . . . . . . 13
Key Findings 15
Conclusion 29
Board of Directors 30
Board of Advisors 30
To access the full research report, visit www commonsense org/zero-to-eight-census
4 THE COMMON SENSE CENSUS: MEDIA USE BY KIDS AGE ZERO TO EIGHT © 2017 COMMON SENSE MEDIA . ALL RIGHTS RESERVED.
At Common Sense, our mission has always been to help families navigate
the vast and ever-changing landscape of media and technology. To do
this effectively, we have always focused on understanding the underlying
attitudes and behaviors of parents and kids, as we believe that facts,
consistently gathered, are vital to a productive dialogue. Before we can
begin to understand the impact of media and technology on kids and
families, we have to better understand their attitudes and behaviors. And
before we can begin to discuss how to best leverage media and technology
for educational and social goals, it is essential to know which platforms
kids prefer to use and what they like to do on those platforms.
So in 2011, we embarked on our first Zero to Eight project in an endeavor to understand the patterns of media use among children in America. Today, we are grateful to be able to continue along the journey we started six years ago with our third Zero to Eight study, which gives us critical data tracking the incredible and far-reaching presence that devices and media have in the lives of our youngest population.
We have leveraged the data from our Zero to Eight research to shape and inform much of our work over the past six years. When our data showed that children gravitate toward mobile apps, streaming media, and online video, we dedicated more resources to reviews, advice, and articles focused on those types of media. And as research shows the ubiquity of media and tech in family life, we’ve created initiatives to help families have meaningful conversations about their digital lives. We’ve also ramped up our reviews and ratings for educators in order to help teachers and administrators be informed about the most up-to-date educational technologies in classrooms. And we’ve developed a digital citizenship curriculum to help children become safe, productive, and critical consumers of all types of media.
Our findings have also fueled our advocacy efforts. Our agenda, from children’s privacy to universal access to high-quality early-learning programs, stems from the concerns parents relay to us in our research. Today, we’re thrilled to be able to build on the foundations of our prior research with this third Zero to Eight report, which is full of facts on current and emerging trends.
Facts are both intriguing and essential to progress. They have the power to open our eyes and disabuse us of stereotypes. We were surprised, for example, to find out that children overwhelmingly prefer paper books over digital. Of the 29 minutes children spend reading each day, just three minutes occur on electronic devices. The rest are spent with old-fashioned printed books, debunking the notion that children want to do everything on a screen.

THE COMMON SENSE CENSUS: MEDIA USE BY KIDS AGE ZERO TO EIGHT 5© 2017 COMMON SENSE MEDIA . ALL RIGHTS RESERVED.
Other significant data on children’s media use in this report include:
� Kids age 8 and under spend an average of 2 hours and 19 minutes a day with screen media, roughly the same as in prior years. Where they spend that time, however, has changed dramatically.
� TV is still king, commanding 58 minutes a day of kids’ attention this year. But mobile is rapidly gaining ground, rising from 5 minutes a day in 2011 to 15 minutes in 2013 and now to 48 minutes a day in 2017. Meanwhile, time spent watching TV declined 11 minutes over the same period.
� More families now subscribe to streaming video services such as Netflix and Hulu than pay for cable TV.
� Virtual reality headsets and voice-activated assistant devices are starting to make inroads. These technologies can be found in roughly one in 10 homes with young children.
� Lower-income families continue to lag higher-income counterparts in internet and computer access. The gap in home computer access is 25 percentage points, while the gap in high-speed internet access at home is 24 percentage points, demonstrating that although the digital divide has narrowed, it remains an issue.
Common Sense’s Zero to Eight studies represent an essential view into the media habits of children in the United States. Because our questions and methodologies have remained consistent, we are able to offer statistically reliable data on how media use among children has changed from 2011 to the present as technology has evolved.
There is another revelation that came with the Zero to Eight initiative: We realized that we were not the only ones who needed this data. Since we published our second Zero to Eight study in 2013, the research has been cited more than 3,200 times by hundreds of media outlets, including the New York Times, the Christian Science Monitor, the Washington Post, the Los Angeles Times, National Public Radio, CNN, Forbes, and Parents magazine. The study has also been cited by authors in more than 300 scientific journals, including Pediatrics and Child Development, both flagship journals of their respective organizations.
That in turn has helped inform parents, educators, policymakers, pediatricians, and media creators as they make decisions about important matters affecting children, such as what types of educational media to produce and how much screen time to recommend.
We hope the research presented in this report will serve as a compass and inspiration as we all navigate the continually shifting technology landscape and strive to improve the quality of children’s media, help families achieve a healthy and balanced approach to media, and teach our children to be critical thinkers wherever they encounter media.
James P. SteyerFounder and Chief Executive Officer, Common Sense
Reveta Franklin BowersChair, Common Sense Board of Directors
6 THE COMMON SENSE CENSUS: MEDIA USE BY KIDS AGE ZERO TO EIGHT © 2017 COMMON SENSE MEDIA . ALL RIGHTS RESERVED.
M IS FOR MOBILEBy Michael H Levine
You may have heard that Sesame Street ’s beloved Cookie
Monster has learned some valuable lessons in delaying his
gratification and eating right. He now knows that his favorite
chocolate chip treat is a “sometime food,” part of a balanced
diet of fruits, vegetables, and the occasional hubcap!
The same is true of children’s media diets. Some experiences
may constitute “empty” calories that should certainly be limited,
while others that are proven to be educational, like Sesame
Street, are more substantive staples. But parents and educators
cannot know what “balanced” means if they don’t have an
understanding of how kids are actually spending their time
with media. Thanks to Common Sense’s Zero to Eight research
initiative, we have a precise record of how much time kids spend
on various types of media. We know what devices and platforms
they’re using. We know the types of activities they engage in.
And we know how those patterns have changed over time.
This year’s report contains a treasure trove of important find-
ings. For me, the key one is the very rapid rise of mobile vis-a-vis
other media, regardless of family income. In itself, mobile usage
among young children is not a new phenomenon; our own
research at the Joan Ganz Cooney Center at Sesame Workshop
has been documenting this trend since the introduction of the
iPhone a decade ago. What is most interesting is the significant
narrowing of the “app gap” as mobile device ownership has
become more universal. And as this report documents, mobile
is certainly here to stay. Children now spend 48 minutes a day
on mobile devices. That’s a very substantial increase from just
four years ago, when the daily average was 15 minutes!
The big question now: Can well-designed mobile media pro-
mote the type of parent-child “serve and return” dialogue that
we know is so important to learning in the first few years of
life? How can parents and educators ensure their children are
engaging with well-designed, next-generation technologies
as part of their balanced digital diet? We raised this concern
nearly 10 years ago in a pioneering survey jointly conducted
by the Cooney Center and Common Sense Media about the
role of digital media in children’s lives. The question remains
The findings from the 2017 Common Sense Zero to Eight Census
tell me that we have a long way to go in helping parents feel
comfortable navigating the flood of new technologies in their
homes. Ownership of smartphones, tablets, and new tech-
nologies like virtual reality and virtual assistants continues to
rise — which, in my research, parents describe as both a huge
source of pleasure, but incredibly overwhelming too. Even
though the overall time of screen media use is unchanged, the
nature and experience of media use are different: Mobile device
use is more individual, immersive, and on-demand, and it
influences interpersonal dynamics differently and can be harder
to break yourself (or your child) away from. For these reasons,
parents describe it as more difficult to mediate and manage.
My lower-income patients’ parents with lower digital literacy
describe being particularly unsure how best to support their
kids’ digital lives.
Pediatricians see ourselves as child advocates—it’s part of our
training. So when we see parents and children feeling over-
whelmed or engaging in heavy or inappropriate media use in
the context of obesity, sleep problems, executive functioning,
or strained relationships—behaviors that determine life course,
health, emotional wellness, and productivity—we want to help.
While our 2016 media guidelines were designed to be more
family-centered and action-oriented, the Zero to Eight findings
tell us that these messages are not reaching the majority of
parents, especially the families facing more stress and adversity.
But there’s lots of interest, which gives us a huge opportunity to
meet families where they are! I’m hopeful that resources like the
AAP guidelines and those provided by Common Sense Media
can start to reach families through outreach not only in pediatric
clinics, but also environments such as schools, birth-to-three
or home-visiting programs, and early education centers. By
TAKING ADVANTAGE OF REAL OPPORTUNITIES TO HELP FAMILIES OVERWHELMED BY TECHNOLOGYBy Jenny Radesky

THE COMMON SENSE CENSUS: MEDIA USE BY KIDS AGE ZERO TO EIGHT 7© 2017 COMMON SENSE MEDIA . ALL RIGHTS RESERVED.
Michael H. Levine is the founding executive director of
the Joan Ganz Cooney Center at Sesame Workshop. The
center conducts research, builds multisector alliances,
and catalyzes industry and policy reforms needed to
advance high-quality media experiences for all children.
Michael also serves on the executive team at Sesame
Workshop, where he focuses on educational impact and
partnerships for the global nonprofit.
as relevant now as it has ever been, with technology continuing
to morph at breakneck speeds.
The Cooney Center’s recent research suggests that many par-
ents—particularly those with lower household incomes—may
not feel confident with technology themselves, nor do they have
the mentoring and support to find or use the highest-quality con-
tent with their children to maximum advantage. And while the
Zero to Eight report suggests that young children are increasingly
facile in operating mobile technologies, we don’t know yet how
to best drive educational and home-based practices to extend
learning and development outside of the screen. New programs
that support trusted media mentors such as librarians and that
offer professional development on the effective use of digital
media for early educators are now very much needed.
Grounded in the reality of what children are doing every day, the
data contained in this report will stimulate an important debate
around many important questions. Today’s increasingly mobile
families have a real opportunity to tap the potential of media to
help establish a foundation for lifelong learning and success.
embedding practical (e.g., where to look for good TV programs;
how to handle a screen transition tantrum) and conceptual (e.g.,
how to teach a child to use media as a tool, and not be consumed
by it) guidance in the contexts in which children live, we have
the potential to be much more helpful to families in the distinct
ways in which media integrates into families’ lives.
We will also need the tech industry’s support to help empower
parents to use media the way that feels right for their family. The
high rates of media use at bedtime is a great example. In my
experience and that of my sleep specialist colleagues, changing
bedtime media habits is exceedingly tough. All the motivational
interviewing and behavioral charts in the world can’t change
some families’ use of tech at night. In addition to putting the onus
on parents, pediatricians and media scholars should continue
to work with industry to embed design features (e.g., bedtime
Wi-Fi shutoffs or filters that only allow relaxation apps before
bed) that will ease the job for parents and children who find
it hard to regulate their own technology use. For the sake of
child sleep, health, and family balance, it’s time to rethink user
engagement as the primary goal of child technology design.
Dr. Jenny Radesky authored the 2016 American Academy
of Pediatrics policy statement “Media and Young Minds.”
She received her M.D. from Harvard Medical School and
completed pediatric training at University of Washington and
subspecialty training in Developmental Behavioral Pediatrics
at Boston Medical Center. She is an assistant professor of
pediatrics at University of Michigan, where her focus is digital
media use by young children and their parents, child self-
regulation, and parent-child interaction. Clinically, she works
with children with developmental differences such as autism
spectrum disorder, ADHD, and self-regulation problems, with
an emphasis on family advocacy and psychosocial stress.

8 THE COMMON SENSE CENSUS: MEDIA USE BY KIDS AGE ZERO TO EIGHT © 2017 COMMON SENSE MEDIA . ALL RIGHTS RESERVED.
A NARROWING BUT STILL TROUBLING DIVIDEBy Julián Castro
The latest Zero to Eight report reveals that the digital divide
has narrowed considerably in the past few years. This news
should make me ecstatic. Instead, I confess that when it
comes to this topic, I tend to see the glass as half— or at least
one-quarter— empty.
Today, 74 percent of lower-income families with children age
0 to 8 have high-speed internet service at home, compared
with 96 percent of higher-income families. In 2011, only 42
percent of lower-income families had broadband access at
home, versus 92 percent of higher-income families.
Although the digital gap between rich and poor is smaller, I
still see this as evidence of a tragically missed opportunity.
These numbers tell me there are still millions of children who
don’t have computers or broadband at home, a problem that
has led to a new term, called the Homework Gap. As school
curricula increasingly shift to online educational portals,
the lack of reliable broadband access to those resources at
home is a crippling disadvantage, setting back even the most
motivated learners.
All parents want their children to succeed on a level playing
field. As the father of two young children, I’m no different.
I want my kids to have the opportunity to fully contribute
to the advancement of whatever profession they choose,
whether it’s the arts, science, or public service. If everyone
in America has the opportunity to reach for their maximum
potential, our whole country will prosper.
There is a strong, positive correlation between a country’s
broadband penetration rate and how well-off its people are.
A 10 percentage-point increase in broadband adoption cor-
relates to a $13,036 increase in GDP per capita, according
to the World Bank’s World Development Report 2016: Digital
Dividends. Although the report is careful to note that there
may not be direct causation, it points to “mutual feedback
between the economy and factors that influence it.”
That is one reason why I, and Common Sense, have strongly
supported policy initiatives to expand access to affordable
broadband, with federal programs such as ConnectHome
and Lifeline, which help low-income families secure broad-
band at home, and E-rate, which gives schools and libraries
access to discounted internet access. As long as the digital
divide persists, our nation’s ability to compete in the 21st-
century global economy is crippled. I urge local, state, and
federal policymakers to use the data in this report to mobilize
the resources, both public and private, to ensure every
member of our society can contribute to his or her fullest.
We all have an interest in closing this divide.
Julián Castro served as mayor of San Antonio from 2009–2014. He was
appointed U.S. Secretary of Housing and Urban Development in 2014 and
spearheaded the ConnectHome initiative to bring low-cost broadband to
low-income families with school-age children. Since the program’s launch in
2015 in 27 U.S. cities and one tribal nation, 37 percent of HUD-assisted
households with children in these communities have gained internet access.
Secretary Castro has two kids, an 8-year-old daughter and a 2-year-old son.

THE COMMON SENSE CENSUS: MEDIA USE BY KIDS AGE ZERO TO EIGHT 9© 2017 COMMON SENSE MEDIA . ALL RIGHTS RESERVED.

10 THE COMMON SENSE CENSUS: MEDIA USE BY KIDS AGE ZERO TO EIGHT © 2017 COMMON SENSE MEDIA . ALL RIGHTS RESERVED.

THE COMMON SENSE CENSUS: MEDIA USE BY KIDS AGE ZERO TO EIGHT 11© 2017 COMMON SENSE MEDIA . ALL RIGHTS RESERVED.
INTRODUCTION
We explore the media devices accessible to children at home, how access to mobile media is disrupting more traditional forms of media use, whether the digital divide is closing, and what is happening with screen media use among children under 2
This year’s survey also provides key insights into how parents
view their children’s media use — whether they think it helps or
hurts their children across a range of developmental outcomes,
and what does or does not concern them about media. It also
explores parental co-use of media with children.
Media are so integrated into our daily lives that we inevitably
assume that our own experiences and those of the people we
know are at least somewhat indicative of what’s happening in the
rest of the country — that what happens with our own children
or our friends’ kids is probably what’s happening with all kids.
This report gives us a chance to get out of our “bubbles” and
observe the revolutionary national trends that are unfolding
around us, and to base our conclusions about kids and media
not on anecdote or opinion, but on statistically reliable data.
This report describes the results of a unique national study —
the third in a series of nationally representative, probability-
based surveys documenting media-use patterns among children
from birth to age 8 in America. The 2017 survey includes a
representative sample of more than 1,400 parents from all
regions of the country, from low- and high-income families,
including parents who never graduated from high school and
those who hold doctorates, and representing diverse racial and
ethnic backgrounds. Combined with the results from the two
earlier waves of the survey, in 2011 and 2013, the data offer an
unprecedented opportunity to see how children’s use of media
has evolved over time as new technologies and new forms of
content have been introduced.
Media have become such a central part of children’s lives that
understanding which media activities children are engaged in, for
how long, and in what context is essential knowledge for those
who are working to support children’s healthy development. The
topics covered in this report include:
� How much time children spend engaged in various media
activities, including watching TV or online videos, playing
video games, reading, or listening to music.
� How children divide their activities among various media
devices, from television sets and console video games to
computers, tablets, and mobile phones.
� How children’s use of media varies by age, gender, socio-
economic status, and race/ethnicity.
� How children’s patterns of media use have changed over
the course of the three waves of the study, in 2011, 2013,
and 2017.

12 THE COMMON SENSE CENSUS: MEDIA USE BY KIDS AGE ZERO TO EIGHT © 2017 COMMON SENSE MEDIA . ALL RIGHTS RESERVED.
METHODOLOGY
This report presents the results of a nationally representative,
probability-based online survey of 1,454 parents of children age
8 or under, conducted from Jan. 20, 2017, to Feb. 10, 2017. The
survey was designed by Common Sense and VJR Consulting and
fielded by the research firm GfK, using its KnowledgePanel©, a
probability-based web panel designed to be representative of
the U.S. population. The project was directed by Michael Robb,
director of research at Common Sense, and Victoria Rideout of
VJR Consulting. Data analyses were conducted by Melissa
Saphir of Saphir Research Services. The report was written by
Ms. Rideout.
The survey is the third in a series of cross-sectional tracking
surveys conducted by Common Sense. Previous surveys were
conducted in 2011 and 2013. To the extent possible, the survey
conducted in 2017 duplicates the questions asked in previous
years. The full text of the questionnaire and all topline results can
be found at the end of this report. In cases where the question
wording or structure has changed, those changes are noted in
the relevant tables.
Measuring children’s media use. It should be noted that all find-
ings in this report are based on parents’ responses to questions
about their child’s use of media. Parents were asked about a
specific, randomly selected focal child in their household. No
parent’s estimate of their child’s media use is likely to be exact.
However, when dealing with children age 8 and under, time and
frequency estimates from parents are more likely to be reliable
than those obtained from the child. By asking parents to focus
on a specific day in their child’s life (the day prior to taking the
survey), we hope to elicit more precise estimates of children’s
media use than by asking about a “typical day.” Surveying was
spread out over the seven days of the week in order to avoid
any bias toward either weekdays or weekend days.
Survey Sample The use of a probability sample. GfK’s KnowledgePanel© members
were recruited using probability-based methods such as
address-based sampling and random-digit-dial telephone calls.
Households that were not already online were provided with
a notebook computer and internet access for the purpose of
participating in surveys. The use of a probability sample means
the results are substantially more generalizable to the U.S.
population than are results based on “convenience” samples.
Convenience samples include only respondents who are already
online and/or who volunteer through word of mouth or adver-
tising to participate in surveys.
Participant consent and respondent compensation. Consent was obtained for all respondents. Respondents received a cash equivalent of $5 for their participation; some African-American respondents received an additional $5 or $10 equivalent to improve response rates among this lower-incidence demographic group.
Treatment of outliers. Of the 1,476 cases completing the main survey, 1,454 cases were determined to be valid cases to be included in the final analyses. Fourteen cases were excluded due to speeding through the survey (completing in less than a third of the median time), and eight were excluded due to reporting media use times of greater than 24 hours for their child.
Weighting. The use of probability-based recruitment methods for the KnowledgePanel© is designed to ensure that the resulting sample properly represents the U.S. population geographically, demographically (e.g., age, gender, race/ethnicity, income), and in terms of home internet access. Study-specific post-stratification weights were applied once the data were finalized, to adjust for any survey nonresponse and to ensure the proper distributions for the specific target population (in this case, parents of 0- to 8-year-olds). Geo-demographic distributions for this population were obtained from the March 2016 supplemental data from the U.S. Census Bureau’s Current Population Survey.
Over-samples. Over-samples of African-American (n = 250) and Hispanic/Latino (n = 352) respondents were included in the survey, enabling us to analyze results by various demographic factors within each racial/ethnic group (for example, by age or gender). Those samples were then weighted back down to their representative level for analyzing the survey results as a whole. Separate weights were used when analyzing results among African-American or Hispanic/Latino respondents alone. The survey was offered in English and Spanish.
Margin of error. The margin of error for the full sample at a 95 percent confidence level is +/- 3 percent. The margin of error among white respondents is +/- 3.7 percent, for Hispanic/Latino respondents +/- 6.8 percent, and for African-American respondents +/- 8.5 percent.
Media DefinitionsThis report looks at children’s media use two ways: by activities
and by devices.
Activities. In recent years, “screen time” has come to encompass behaviors as diverse as watching (i.e., video content), reading, interactive play (i.e., gaming), video-chatting, and immersion in virtual worlds. Accordingly, this report quantifies the portion
THE COMMON SENSE CENSUS: MEDIA USE BY KIDS AGE ZERO TO EIGHT 13© 2017 COMMON SENSE MEDIA . ALL RIGHTS RESERVED.
of young people’s screen media time that is devoted to the fol-lowing broad categories of media activities: watching TV, DVDs, or videos; playing media games (including video, computer, and mobile gaming); electronic reading; homework; video-chatting; using virtual reality; and using digital devices for other purposes, such as browsing websites. In addition to screen media, the study also measures time spent reading print and listening to music.
Devices. This report covers many media technologies, including television sets, digital video recorders (DVRs), DVD players, videotapes, video game consoles, handheld video game players, desktop and laptop computers, tablets, smartphones, iPod Touches or similar devices, e-readers, virtual reality headsets, toys that connect to the internet, and voice-activated virtual assistant devices such as the Amazon Echo or Google Home. The survey also asked about print reading materials, such as books, and about listening to music, without specifying which devices were used for listening. This report often groups media devices into five major platforms: television set; DVD/videotapes; mobile device (i.e., smartphones, tablets, and e-readers); computer (i.e., laptop and desktop); video game device (i.e., console and handheld players).
Other subcategories of activities or devices referenced in the report (in alphabetical order):
Handheld video game players include devices specifically designed for playing video games, such as a Game Boy, PSP, or DS.
Live TV means content watched on a TV set as it was broadcast (i.e., not time-shifted).
Mobile media/devices refers to smartphones, tablet devices such as iPads or similar products, and other devices such as the iPod Touch that can connect to the internet, display videos, and download “apps” (mobile applications).
Screen media includes television, DVDs/videotapes, video game players, computers, tablets, smartphones, other small digital devices such as an iPod Touch or similar, and virtual reality headsets.
Smart TV or internet-connected TV includes television sets that are connected to the internet, whether directly or through an add-on device such as Apple TV or Roku.
Streaming video includes time spent watching TV shows or movies through subscription services.
Subscription services are companies such as Netflix, Hulu, or Amazon Prime Video that charge membership fees to enable users to stream or download TV shows or movies.
Total TV/video time includes time spent watching TV or movies on a television set, watching DVDs or videotapes, or watching any type of online or streaming video, such as YouTube-type videos or TV shows or movies watched through a website or internet-based subscription service, whether on a computer or mobile device.
Demographic DefinitionsFamilies. This survey concerns media use among children age 8 or under and the views of parents of children in that age range. In the report, we occasionally use the term “families” as short-hand to refer to families with children in this age group or the term “children” to refer to children age 8 or under.
Income categories. For the purposes of this report, “lower income” is defined as families earning less than $30,000 a year; “middle income” includes those earning from $30,000 to $75,000 a year; and “higher income” is families earning over $75,000 a year.
Education categories. For the purposes of this report, parents who have a high school degree or less are referred to as “less educated,” parents with some college experience are referred to as “middle educated,” and parents with a college degree or higher are referred to as “highly educated.”
Race/ethnicity. The term “African-American” refers to any respondents who self-identify as “black, non-Hispanic.” The term “white” refers to any respondents who self-identify as “white, non-Hispanic.” The term “Hispanic/Latino” refers to any respondents who self-identify as Hispanic. The term “other” is a collapsed category that includes individuals who self-identify as another racial group or as two or more races, none of which is Hispanic. Where findings are broken out by race/ethnicity, results are presented for only white, African-American, and Hispanic/Latino children. Respondents in the “other” category are included in results based on the total sample but not in results that are broken out by race, because the cell sizes of each individual group in the “other” category are not large enough to examine differences among them.
Presentation of Data in the TextStatistical significance. Where relevant, differences over time or among demographic groups have been tested for statistical significance. Unless otherwise noted, findings are described in the text in a comparative manner (e.g., “more than,” “less than”) only if the differences are statistically significant at the level of p < .05. In tables where statistical significance has been tested, superscripts (using letters such as a, b, or c) are used to indicate whether results differ at a statistically significant level (p < .05) within a set of columns or rows (e.g., parent race/ethnicity, or 2011 vs. 2017). Means that share a common superscript— and means that have no superscript at all — are not significantly different from each other.
Notation of hours and minutes. Throughout the report, times spent with media are presented in hours:minutes. For example, two hours and 10 minutes is presented as 2:10, and 10 minutes is presented as :10.
Percentages. Percentages will not always add up to 100 due to rounding or multiple response options, or because those who marked “don’t know” or did not respond are not included.

14 THE COMMON SENSE CENSUS: MEDIA USE BY KIDS AGE ZERO TO EIGHT © 2017 COMMON SENSE MEDIA . ALL RIGHTS RESERVED.
95%OF FAMILIES WITH KIDS 0-8 NOW HAVE SMARTPHONES,
UP FROM 63% IN 2013 AND 41% IN 2011

THE COMMON SENSE CENSUS: MEDIA USE BY KIDS AGE ZERO TO EIGHT 15© 2017 COMMON SENSE MEDIA . ALL RIGHTS RESERVED.
KEY FINDINGS
1 Mobile media have become a nearly universal part of the children’s media landscape, across all levels of society
Nearly all (98 percent) children age 8 and under live in a home
with some type of mobile device, the same percentage that
have a TV in the home (mobile media ownership is up from
75 percent in 2013 and 52 percent in 2011). Ninety-five percent
of families with children this age now have a smartphone, up
from 63 percent in 2013 and 41 percent in 2011, and 78 percent
have a tablet (up from 40 percent in 2013 and 8 percent just
six years ago, in 2011). Indeed, 42 percent of children now have
their own tablet device — up from 7 percent four years ago and
less than 1 percent in 2011.
Mobile devices in the home, 2011–2017
Among 0- to 8-year-olds, percent with each device
16 THE COMMON SENSE CENSUS: MEDIA USE BY KIDS AGE ZERO TO EIGHT © 2017 COMMON SENSE MEDIA . ALL RIGHTS RESERVED.
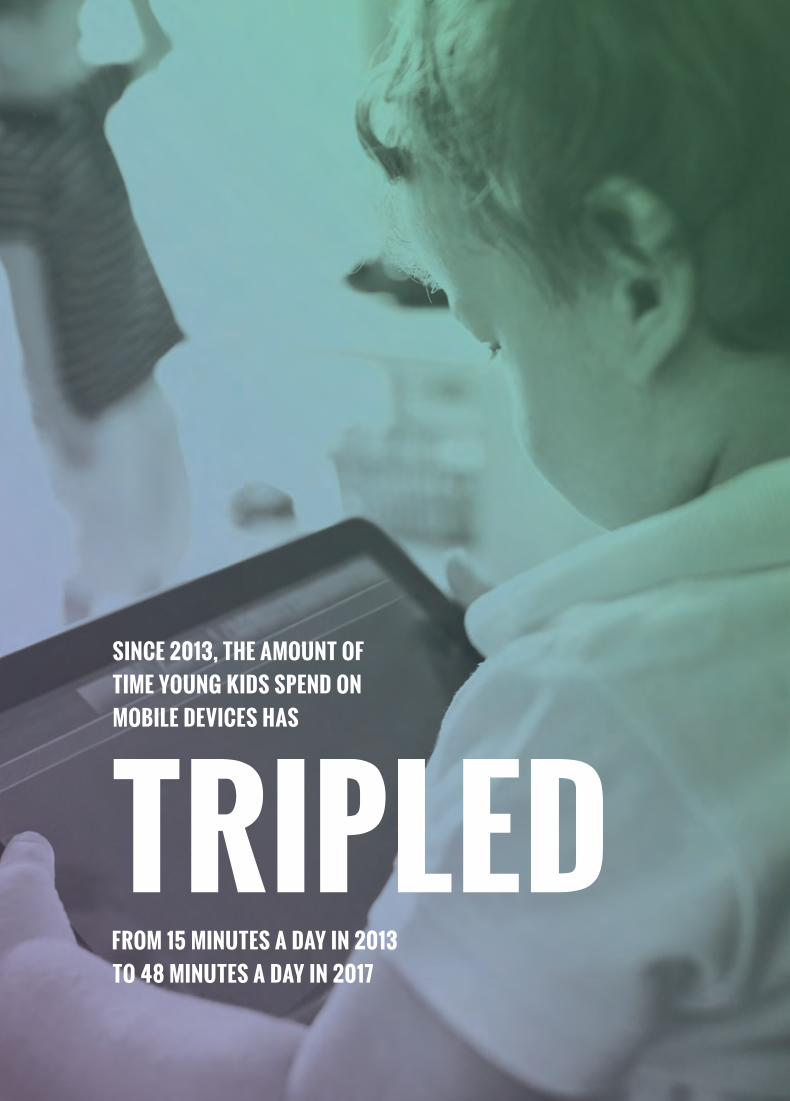
SINCE 2013, THE AMOUNT OF TIME YOUNG KIDS SPEND ON MOBILE DEVICES HAS
TRIPLEDFROM 15 MINUTES A DAY IN 2013 TO 48 MINUTES A DAY IN 2017

THE COMMON SENSE CENSUS: MEDIA USE BY KIDS AGE ZERO TO EIGHT 17© 2017 COMMON SENSE MEDIA . ALL RIGHTS RESERVED.
2 Though the overall amount of media use is about the same as in past years, how children are using media has shifted considerably: The average amount of time spent with mobile devices each day has tripled (again), going from 5 minutes a day in 2011 to 15 minutes a day in 2013 to 48 minutes a day in 2017
Overall, children 8 and under spend an average of about two-
and-a-quarter hours (2:19) a day with screen media, up from 1:55
in 2013 but almost exactly the same amount they devoted to
screens in 2011 (2:16). But online videos and content accessed
through subscription services are a substantial part of the mix:
Children spend an average of 17 minutes a day watching online
videos from a source such as YouTube, 17 percent of all TV/video
viewing time, and families with young children are now more
likely to have a subscription video service such as Netflix or Hulu
(72 percent) than they are to have cable TV (65 percent).
Screen media use among children under 2 appears to be trending
downward, from 58 minutes a day in 2013 to 42 minutes in 2017
(though this 16-minute difference is not statistically significant),
due mostly to declining viewing of DVDs. Use of mobile devices
in this age group has increased modestly, but not as much as
DVD viewing has declined.
Screen media use, by device, 2011 and 2017
Among 0- to 8-year-olds, proportion of screen time spent with
each device
Note: Video game player includes console and handheld players. Mobile device includes smartphone, tablet, iPod Touch, or similar device.
Screen media use, by device and age, 2017
Among 0- to 8-year-olds, average amount of screen time spent
daily with each device (hours: minutes)
Device
All Child’s age
0 to 8 Under 2 2 to 4 5 to 8
Television set :58 :29a 1:09b 1:04b
DVD/videotape :17 :06a :23b :18b
Mobile device :48 :07a :58b 1:02b
Computer :10 *a :05b :20c
Video game player :06 *a :04b :12c
Total screen media 2:19 :42a 2:39b 2:56b
*Less than one minute but more than zero.
Note: Superscripts (a,b,c) are used to denote whether differences between groups are statistically significant (p < .05). Items with different superscripts differ significantly. Items that do not have a superscript, or that share a common superscript, do not differ significantly.

18 THE COMMON SENSE CENSUS: MEDIA USE BY KIDS AGE ZERO TO EIGHT © 2017 COMMON SENSE MEDIA . ALL RIGHTS RESERVED.
1. AAP Council on Communications and Media. (2016). Media use in school-aged children and adolescents. Pediatrics, 138(5). http://dx.doi.org/10.1542/peds.2016-2592
2. AAP Council on Communications and Media (2016). Media and young minds. Pediatrics, 138(5). http://dx.doi.org/10.1542/peds.2016-2591
3 Contrary to recommendations from pediatricians, many children use media shortly before bedtime, and many families leave the TV on in the background most of the time
According to parents, nearly half (49 percent) of children age 8
or under often or sometimes watch TV or videos or play video
games in the hour before bedtime, and 42 percent say the TV is
on “always” or “most of the time” in their home, whether anyone
is watching or not. But the American Academy of Pediatrics
(AAP) recommends that children not sleep with devices in their
bedrooms and refrain from using screen media for an hour
before bed1. The AAP also recommends that parents turn off TVs
when not in use, due to negative effects of background media2.
4 There are large differences in screen time by household income and parent education: Children from lower-income homes spend an average of 1:39 more time with screen media each day than those from higher-income homes (3:29 vs 1:50) Children from homes with lower parent education consume more screen media than children from homes with higher parent education (2:50 vs 1:37; a 1:13 difference)
In contrast to these large differences by household income and
parent education, there are no statistically significant differences
in overall screen time by gender or race/ethnicity. The difference
in screen media use between lower- and higher-income children
and between those with lower- vs. higher-educated parents has
been apparent across all three waves of the survey (2011, 2013,
and 2017), but the gap is even larger in 2017 than it was in prior
years. The reason the gap has grown larger is that in 2017, lower-
income children’s television use has gone up (along with their
use of mobile media), but higher-income children’s television use
has gone down. On any given day, more lower-income kids watch
TV now than did four years ago (58 percent vs. 42 percent), and
those who watch TV spend more time doing so (2:23 vs. 2:02).
Screen media use, by income, 2011–2017
Among 0- to 8-year-olds, average amount of time spent daily
with screen media (hours: minutes)
Note: Lower-income is under $30,000 a year; middle-income is $30,000 to $75,000 a year; and higher-income is more than $75,000 a year.

THE COMMON SENSE CENSUS: MEDIA USE BY KIDS AGE ZERO TO EIGHT 19© 2017 COMMON SENSE MEDIA . ALL RIGHTS RESERVED.
ON AVERAGE, KIDS FROM LOWER-INCOME FAMILIES SPEND
1:39 MOREWITH SCREEN MEDIA EACH DAY THAN KIDS FROM HIGHER-INCOME FAMILIES

20 THE COMMON SENSE CENSUS: MEDIA USE BY KIDS AGE ZERO TO EIGHT © 2017 COMMON SENSE MEDIA . ALL RIGHTS RESERVED.
83% OF AFRICAN-AMERICAN PARENTS SAY THEIR
CHILD BENEFITS FROM MEDIA USE

THE COMMON SENSE CENSUS: MEDIA USE BY KIDS AGE ZERO TO EIGHT 21© 2017 COMMON SENSE MEDIA . ALL RIGHTS RESERVED.
5 In general, Hispanic/Latino parents are the most concerned about children’s media use, and African-American parents are most likely to say their children benefit from screen media
Hispanic/Latino parents express the highest levels of concern
about every potentially negative issue raised in the survey, such
as sex and violence in media. For example, 54 percent of
Hispanic/Latino parents are “very” concerned about violence in
media, compared to 38 percent of African-American parents
and 28 percent of whites. Similarly, 43 percent of Hispanic/Latino
parents “strongly” agree that the less time kids spend with screen
media the better, compared to 23 percent of white parents and
13 percent of African-American parents. On the other hand,
African-American parents are more likely than white parents to
say their child benefits from media use (83 percent vs. 72 percent,
with Hispanic/Latino parents in between at 77 percent).
Parental concerns about media, by race/ethnicity, 2017

22 THE COMMON SENSE CENSUS: MEDIA USE BY KIDS AGE ZERO TO EIGHT © 2017 COMMON SENSE MEDIA . ALL RIGHTS RESERVED.
TODAY,
74% OF LOWER-INCOME FAMILIES HAVE HIGH-SPEED
INTERNET AT HOME, UP FROM 42% IN 2011

THE COMMON SENSE CENSUS: MEDIA USE BY KIDS AGE ZERO TO EIGHT 23© 2017 COMMON SENSE MEDIA . ALL RIGHTS RESERVED.
6 The digital divide still exists, but is much smaller than it used to be: Today there is a 25 percentage-point gap in home computer access and a 22 percentage-point gap in high-speed internet access at home between children in lower- and higher-income households (72 percent vs 97 percent for a home computer and 74 percent vs 96 percent for high-speed internet)
Digital divide and app gap, by income, 2011–2017
Among families of kids age 0 to 8, those who:
Note: Lower-income is less than $30,000 a year and higher-income is more than $75,000 a year.
The gap in home computer and internet access is much smaller
than it used to be: down from gaps between groups of 43 and 50
percentage points, respectively, in 2011. Children in lower-
income homes are also still less likely to have a tablet at home
(a 24 percentage-point difference). Sixty-one percent of lower-
income families now have a tablet device, compared to only 2
percent in 2011 (and compared to 85 percent of higher-income
families today). However, the gap in overall mobile ownership
has virtually disappeared (3 percentage points), due to the
number of lower-income families that now have a smartphone.
In 2011, 34 percent of lower-income families had a mobile device
in the home; today 96 percent do. What we previously dubbed
the “app gap” has shrunk substantially as well. Today two-thirds
of lower-income parents (67 percent— not significantly different
from higher-income parents) have downloaded apps for their
child to use, compared to 14 percent in 2011. And lower-income
children are as likely as higher-income children to have their own
tablet device (40 percent from each group, and 45 percent of
those in the middle-income group).

24 THE COMMON SENSE CENSUS: MEDIA USE BY KIDS AGE ZERO TO EIGHT © 2017 COMMON SENSE MEDIA . ALL RIGHTS RESERVED.
7 The amount of time children spend reading each day has held steady since 2011, but many children under 2 are not read to regularly
On average, 0- to 8-year-olds spend about a half-hour a day
reading or being read to, an amount that has remained remark-
ably steady over the past six years (:29 in 2011, :28 in 2013,
and :29 in 2017). Forty percent of lower-income children
read or are read to every day, compared to 65 percent of chil-
dren from higher-income families (57 percent among all).
Although the AAP recommends reading to children “beginning
in infancy” because of its importance to children’s language
skills and literacy acquisition, fewer than half (43 percent)
of children under 2 are read to on a daily basis3. Despite the
advent of e-readers and the spread of tablets, electronic reading
has not become popular among children. Of the 29 minutes
children spend reading each day, 26 are in print and only three
are electronic.
8 Parents are concerned about the amount of violence, sexual content, and advertising in media, but they are optimistic about the use of media for learning and supporting creativity
Top concerns are violent content (78 percent are very or
somewhat concerned), sexual content (77 percent), spending
too much time with media (70 percent), and exposure to
materialism and advertising in media (69 percent). On the other
hand, 67 percent of parents whose children use screen media
say it helps their learning (a lot or a little), and 57 percent say
it helps their creativity.
3. AAP Council on Early Childhood (2014). Literacy promotion: An essential component of primary care pediatric practice. Pediatrics, 134 (2). http://dx.doi.org/10.1542/peds.2014-1384
Parental concerns about media, 2017
Among parents of 0- to 8-year-olds, those who are very or
somewhat concerned about each topic as it relates to their child’s
use of screen media, today and in the future

THE COMMON SENSE CENSUS: MEDIA USE BY KIDS AGE ZERO TO EIGHT 25© 2017 COMMON SENSE MEDIA . ALL RIGHTS RESERVED.
57%OF KIDS READ OR ARE READ TO EVERY DAY

26 THE COMMON SENSE CENSUS: MEDIA USE BY KIDS AGE ZERO TO EIGHT © 2017 COMMON SENSE MEDIA . ALL RIGHTS RESERVED.
9 Pediatricians have reached only one in five parents with their recommendations about children’s media use and have been more successful in reaching white, higher-income, and higher-educated parents
One in five (20 percent) parents say they know the AAP recom-
mendations for their child’s media use, half (51 percent) don’t
know but say they are interested in learning about them, and
29 percent don’t know and aren’t interested. The AAP has been
more successful in reaching white, higher-income, and higher-
educated parents: 24 percent of higher-income and college-
educated parents know the AAP recommendations for their
child, compared to 16 percent of lower-income or high school-
educated parents. Hispanic/Latino parents are the least aware
of the AAP recommendations (13 percent say they know what
they are, compared to 21 percent of African-American parents
and 23 percent of white parents) and are most interested in
learning more about them (69 percent, compared to 49 percent
of African-American parents and 42 percent of white parents).
10 Several cutting-edge technologies, including virtual reality, voice-activated assistants, and internet-connected toys, are making their first appearances in children’s homes
The survey offers a first look at the early penetration of these
new technologies, any one of which could ultimately have
profound implications for children’s development. Today, about
one in 10 kids age 8 or under live in a home with a virtual reality
headset (11 percent), have “smart” toys that connect to the
internet (10 percent), or have a voice-activated virtual assistant
device available to them in the home, such as an Amazon Echo
or Google Home (9 percent).

THE COMMON SENSE CENSUS: MEDIA USE BY KIDS AGE ZERO TO EIGHT 27© 2017 COMMON SENSE MEDIA . ALL RIGHTS RESERVED.
67% OF PARENTS WHOSE CHILDREN USE SCREEN MEDIA
SAY IT HELPS THEIR LEARNING


THE COMMON SENSE CENSUS: MEDIA USE BY KIDS AGE ZERO TO EIGHT 29© 2017 COMMON SENSE MEDIA . ALL RIGHTS RESERVED.
This report is the third installment in an ongoing series of surveys tracking the use of media and technology among U S children from birth to age 8 At a time of revolutionary change in the media landscape, these reports provide consistent, objective data monitoring the introduction of new technologies and media-based activities into the lives of our youngest children
We are fortunate that these studies began when they did — just
a few years after the introduction of mobile phones and touch-
screen devices — offering us a once-in-a-lifetime look at how
such revolutionary new technologies have been introduced into
children’s lives. Today we are at the cutting edge of the intro-
duction of several other new technologies that have the potential
to have a profound effect on children’s lives: virtual reality, in
which children can be immersed in 360-degree gaming or video
environments; voice-activated virtual assistant devices, which
hold the potential for preliterate children to conduct searches,
make phone calls, send texts, request videos, or play music; and
internet-connected toys, the child’s version of the “internet of
things.” As we consider the implications of these trends, we
hope it will be valuable to have nationally representative data
documenting their uptake among the nation’s children. The next
iteration of this survey will give us a sense of whether any or all
of these new technologies will have the impact mobile media and
touchscreens have had in terms of how kids spend their time.
There are important limitations to these studies. Like a popula-
tion census, a media census describes broad national trends, in
this case the adoption and use of media in the country as a
whole — a sort of Dow Jones Industrial Average of media use
among children in this age group. But a census is less effective
at helping us understand how any one child might make use of
media, all the exciting things she may explore or create with
technology, or the ideas and concepts she might learn. Another
limitation is that the study measures the amount of time children
spend with media and technology, but it doesn’t document the
content of the TV shows, videos, and games in use — whether
they are educational, age-appropriate, high- or low-quality — nor
does it measure any effects of media on children. Content has
repeatedly been shown to be a major factor in how media affect
learning and development. In short, this survey should not be
read as a judgment on the quality of children’s time with media;
rather, it is a snapshot of how media and technology are infused
into daily life. Additional experimental and qualitative work
is essential to better understanding the full implications of
children’s media use.
Lastly, this is the first time Common Sense has asked questions
about new technologies, including virtual reality, voice-activated
assistants, and internet-connected toys, and there is some
uncertainty about whether respondents knew enough about
each technology to answer accurately. For example, parents may
not realize that their children’s toys connect to the internet or
what a virtual reality headset is. We will be monitoring each new
technology’s integration into family life in future surveys as they
become more mainstream and better understood.
Through these surveys, we are able to see what changes and
what stays the same in terms of children’s use of media. What
clearly has changed is how young people access and view TV
shows, videos, and games; what has not changed is the fact that
children engage in these activities starting at a young age and
devote hours a day to them. What has changed is that devices
are now mobile, connected, and interactive; what hasn’t changed
is that the primary activities conducted on these devices are the
same as they were six years ago: watching TV or videos and
playing games. What has changed is that the various digital divides
identified in our previous reports have shrunk substantially;
what hasn’t changed is that many children from lower-income
households still don’t have a home computer or tablet.
We hope the data presented here will help inform the work of the
many content creators, educators, health professionals, researchers,
policymakers, and advocates who care about the role of media in
children’s lives— and that they will encourage parents to gather
the information and tools they need to make mindful choices
about their children’s engagement with media and technology.
CONCLUSION

30 THE COMMON SENSE CENSUS: MEDIA USE BY KIDS AGE ZERO TO EIGHT © 2017 COMMON SENSE MEDIA . ALL RIGHTS RESERVED.
BOARD OF DIRECTORSHarvey Anderson Strategic Advisor
Lynne Benioff Community Volunteer
Reveta Bowers (Chair) Retired Head of School, The Center for Early Education
Julián Castro Former Secretary of the U.S. Department of Housing and Urban Development
Ann Pao Chen Independent Consultant
Geoffrey Cowan University Professor and Annenberg Family Chair, USC
Amy Errett CEO and Founder, Madison Reed
John H.N. Fisher Partner, Draper Fisher Jurvetson
Andrew Hoine Partner & Director of Research, Paulson & Co. Inc.
Matthew Johnson Managing Partner, Ziffren Brittenham LLP
Lucinda Lee Katz Head of School, Marin Country Day School
Gary E. Knell President and CEO, National Geographic Society
Manny Maceda Partner, Bain & Company
April McClain-Delaney Washington Director, Common Sense
Michael D. McCurry Partner, Public Strategies Washington Inc.
William E. McGlashan, Jr. Managing Partner, TPG Growth
Robert L. Miller President and CEO, Miller Publishing Group
Diana L. Nelson Board Chair, Carlson
William S. Price, III Proprietor, Price Family Vineyards and Estates
Susan Sachs Community Volunteer
James P. Steyer Founder and CEO, Common Sense
Gene Sykes Managing Director, Goldman, Sachs & Co.
Nicole Taylor Deputy Vice President and Dean of Students, Arizona State University
Michael Tubbs Mayor, City of Stockton
Lawrence Wilkinson (Vice Chair) Chairman, Heminge & Condell
BOARD OF ADVISORSAileen Adams Former Deputy Mayor, City of Los Angeles
Larry Baer President and CEO, San Francisco Giants
Rich Barton Co-Founder and Executive Chair, Zillow.com
Richard I. Beattie Chairman, Simpson Thacher & Bartlett LLP
Angela Glover Blackwell Founder and CEO, PolicyLink
Geoffrey Canada Founder and President, Harlem Children’s Zone
Marcy Carsey Founding Partner, Carsey-Werner Productions
Chelsea Clinton Vice Chair, Clinton Foundation

THE COMMON SENSE CENSUS: MEDIA USE BY KIDS AGE ZERO TO EIGHT 31© 2017 COMMON SENSE MEDIA . ALL RIGHTS RESERVED.
Ramon Cortines Former Superintendent, Los Angeles Unified School District
James Coulter Founding Partner, TPG Capital LP
Yogen Dalal Managing Director, Mayfield Fund
Steven A. Denning Founding Partner, General Atlantic Partners
Susan Ford Dorsey President, Sand Hill Foundation
Millard Drexler Chairman and CEO, J.Crew
Ezekiel Emanuel, M.D., Ph.D. Chair, Department of Medical Ethics and Health Policy, University of Pennsylvania
Robert J. Fisher Director, Gap Inc.
Howard Gardner, Ph.D. Professor, School of Education, Harvard University
Jim Herbert, II President and CEO, First Republic Bank
David Hornik Partner, August Capital
Ron Johnson Trustee, Stanford University
Mitchell Kapor Partner, Kapor Capital
David Lawrence Jr. President, Early Childhood Initiative Foundation
Eddie Lazarus General Counsel, Tribune Company
Ronnie Lott NFL Hall of Famer
Susan McCaw U.S. Ambassador to Austria (Ret.)
Nion McEvoy Chairman and CEO, Chronicle Books
George Miller Education Advisor to Cengage Learning and Retired Member of Congress
Nell Minow Founder, The Corporate Library and Movie Mom
Newton Minow Counsel, Sidley, Austin and Brown and Former Chairman, Federal Communications Commission
James Montoya Senior Vice President, The College Board
Becky Morgan President, Morgan Family Foundation
David Plouffe President of Policy and Advocacy, Chan Zuckerberg Initiative
Carrie Schwab Pomerantz President, Charles Schwab Foundation
Michael Riordan Founder, Gilead Sciences
George Roberts Founding Partner, Kohlberg Kravis Roberts & Co.
Jesse Rogers Founder, Altamont Capital
Jim Ryan Dean, Harvard Graduate School of Education
Alan Schwartz Executive Chairman, Guggenheim Partners
Darrell Steinberg Chair, California Government Law & Policy Practice, Greenberg Traurig LLP
Thomas Steyer Founder and President, NextGen Climate
Deborah Stipek Faculty Director, Haas Center for Public Service, Stanford University
Mike Tollin President, Mandalay Sports Media
Robert S. Townsend Partner, Morrison & Foerster LLP
Laura Walker President, WNYC Radio
Eugene Washington, M.D. Chancellor, Medical School, Duke University
Alice Waters Founder, Chez Panisse and Chez Panisse Foundation
Robert Wehling Founder, Family Friendly Programming Forum
Tim Zagat Co-Founder and Co-Chair, Zagat Survey

CreditsAuthor: Victoria Rideout, M.A., VJR Consulting
Editor: Michael B. Robb, Ph.D.
Data analysis: Melissa Saphir, Ph.D., Saphir Research
Copy editor: Uyen Phan
Designer: Allison Rudd
Special Thanks: Vikki Katz, Ph.D., and Michael Levine, Ph.D., of the Joan Ganz Cooney Center
THE COMMON SENSE CENSUS: MEDIA USE BY KIDS
AGE ZERO TO EIGHT
Suggested citation: Rideout, V. (2017). The Common Sense census: Media use by kids age zero to eight. San Francisco, CA: Common Sense Media.


OUR OFFICESSan Francisco Headquarters 650 Townsend Street, Suite 435 San Francisco, CA 94103
New York Office 575 Madison Avenue New York, NY 10022
Los Angeles Office 1100 Glendon Avenue, 17th Floor Los Angeles, CA 90024
Washington, D.C. Office 2200 Pennsylvania Avenue, NW, 4th Floor East Washington, D.C. 20037
© 2017 Common Sense Media. All rights reserved. Common Sense, associated names, associated trademarks, and logos are trademarks of Common Sense Media, a 501(c)(3) nonprofit organization (FEIN 41-2024986).