2017 techqual+ it survey report - s3.wp.wsu.edu · pdf file2017 techqual+ it survey report ......
TRANSCRIPT

Washington State University Spokane
2017 TECHQUAL+IT SURVEY REPORT
JULY 2017

Executive Summary .......................................................................................................................................................... 32017 TechQual+ Survey Questions ................................................................................................................................... 4Respondent Population Charts .......................................................................................................................................... 5
Survey Review1. Connectivity and Access ............................................................................................................................................... 72. Technology and Collaboration .................................................................................................................................... 113. Support and Training .................................................................................................................................................. 154. Blackboard and Instructional Technologies .................................................................................................................. 195. Research Resources for Faculty .................................................................................................................................... 236. Computer Labs for Students ....................................................................................................................................... 277. Videoconferencing for Faculty and Staff ...................................................................................................................... 31 Additional Questions Visualized 2017 Technology Expectations ................................................................................................................................. 34
2017 Top Technology Focus ..................................................................................................................................... 352017 Top Three Most Helpful IT Services .................................................................................................................. 362017 Top Three IT Services Needing Improvement ................................................................................................... 372017 Training Preferences for Faculty and Staff ......................................................................................................... 38
AppendicesAppendix A: Survey Data ................................................................................................................................................ 39
All Respondents ........................................................................................................................................................ 40All Students .............................................................................................................................................................. 42All Faculty ................................................................................................................................................................. 43All Staff ..................................................................................................................................................................... 45
Appendix B: Service Level Analysis Charts ....................................................................................................................... 47Service Adequacy Gap Analysis ................................................................................................................................. 48Superiority Gap Analysis ........................................................................................................................................... 50Minimum and Desired Service Level Rankings .......................................................................................................... 52Service Adequacy Gap by Gender ............................................................................................................................. 54
Appendix C: Top Three Response Analysis ....................................................................................................................... 57Appendix D: Comment Analysis ...................................................................................................................................... 59
Students ................................................................................................................................................................... 60Faculty ..................................................................................................................................................................... 64Staff ......................................................................................................................................................................... 69
TABLE OF CONTENTS
WSU Spokane 2017 TechQual+ Survey ReportPage 2
To improve the technological experience at WSU Spokane, gain useful feedback, and gauge perceptions, WSU Spokane Information Technology Services utilized the standardized technology survey designed by the Higher Education TechQual+ Project for the third consecutive year (www.TechQual.org).
In 2017, 10% of students, 21% of faculty, and 42% of staff responded to the survey. A total of 421 comments and 2,173 responses were provided to help lend context, depth, and perceptions to the survey regarding the strengths, challenges, and opportunities ahead for WSU Spokane ITS. Similar to past years, the results of the 2017 survey provide a strong indicator for setting technology priorities and planning initiatives.
Based on the findings of focus groups at participating institutions nationwide, the TechQual+ Project has articulated a set of generalizable IT service outcomes that are expected of IT organizations by students, faculty, and staff within higher education. The TechQual+ core survey analyzes 13 items designed to measure the performance of three core commitments. For each question, respondents are asked to indicate their minimum service level expectation, desired service level expectation, and perceived service level. In addition, WSU Spokane added 10 questions grouped into 4 campus-specific service areas to create 7 categories of IT service.
• Connectivity and Access
• Technology and Collaboration Services
• Support and Training
• Blackboard and Instructional Technology
• Research Resources
• Computer Labs
• Videoconferencing Services
With three years of TechQual+ survey experience, Spokane IT is excited to present the 2017 results in a new and easier-to-understand format focused on the 7 service categories comparing the results by students, faculty, and staff including the following:
• Highlights offers a quick glance at the results
• Service Expectations displays the range of expectations and how they are being met
• 3-Year Service Adequacy Gap Trends show year-to-year progress and changing expectations
• Comment Analysis summarizes major feedback themes with a sampling of comments
Highlights of the 2017 Survey
• 358 members of the WSU Spokane community started the survey; 117 students, 66 faculty, and 97 staff completed it.
• 421 comments were submitted containing over 500 feedback topics and suggestions.
• 54% of services exceeded minimum expectations.
• Overall, 7 of the 13 standard TechQual+ IT services exceeded minimum expectations.
• Respondents reported a 94% customer satisfaction rate with regard to IT technical support.
• Given the option to improve one service on campus, 30% of the respondents chose Wi-Fi access and speed, including reliability in classrooms, slowness of speed during times of high traffic, and visitor login processes.
• Speed and reliability of Wi-Fi during times of high traffic or in areas around buildings is a prominent frustration for WSU Spokane users.
• Inadequate cellular coverage is a high frustration point for students, faculty, and staff. Basements, faculty offices, and labs were reported as the greatest problem areas.
EXECUTIVE SUMMARY
WSU Spokane 2017 TechQual+ Survey ReportPage 3

Connectivity & Access1. Having an Internet service that operates reliably.2. Having an Internet service that provides adequate
capacity or speed.3. Having an Internet service that provides adequate Wi-Fi
coverage.4. Having adequate cellular (or mobile) coverage
throughout campus.
Technology and Collaboration Services5. Having Web sites and online services that are easy to
use.6. Having online services that enhance the teaching and
learning experience.7. Having technology services that allow me to collabo-
rate effectively with others.8. Having systems that provide timely access to data that
informs decision-making.9. The availability of classrooms or meeting spaces with
technology that enhances the teaching and learning experience.
Support and Training10. Getting timely resolution of technology problems that I
am experiencing.11. Technology support staff who have the knowledge to
answer my questions.12. Receiving communications regarding technology ser-
vices that I can understand.13. Getting access to training or other self-help information
that increases my effectiveness with technology.
Other Important Information Technology Services14. Having information and access to new and useful in-
structional technologies or methods. 15. Having an effective, intuitive, and reliable Learning
Management System (Blackboard). 16. Getting timely and helpful support for Blackboard (the
WSU learning management system).
Research Resources for Faculty17. Having access to high speed computing for research. 18. Having internet speed/capacity specifically in terms of
research needs. 19. Having data storage space used specifically for research
data.
Computer Labs20. Availability and hours for open computer lab (SAC311). 21. Having a positive environment (cleanliness, noise, tem-
perature, etc.) for the open computer lab (SAC311).
Videoconferencing22. Availability of classrooms or meeting spaces with video-
conferencing technology. 23. Getting timely and helpful support for videoconferenc-
ing technology in classrooms or meeting spaces.
Additional Questions24. What one issue would you choose as the top priority
for WSU Spokane IT in 2017? 25. What type of training suits you best when learning
technology applications available at WSU (such as: Skype for Business, OneDrive, or Blackboard)?
26. WSU provides training on technology applications (such as: Skype for Business, OneDrive, or Blackboard). What is the best way to advertise these training oppor-tunities to you?
27. Tell us three (3) WSU Spokane IT services that need improvement and why?
28. Tell us three (3) WSU Spokane IT services that you find helpful and why?
WSU Spokane 2017 TechQual+ Survey ReportPage 4
2017 TechQual+ Survey Questions
Highlights of the 2017 Survey (continued)
• Many users reported annoyance with the current room scheduling system.
• Many respondends cited issues with the WSU Spokane and MyWSU website navigation, ease of use, and availability of information.
• Users reported being largely satisfied with ITS support staff and the levels of support available. They also requested more self-help resources.
EXECUTIVE SUMMARY (continued)

University Role (Self-reported)All survey participants are asked to self report their role, gender, and age group.
Response Rates (WSU Spokane Classification)These are the numbers of participants invited to participate in the survey as classified by the University
Gender (Self-reported)All survey participants are asked to self report their role, gender, and age group.
Pop (N) # Attempted # Complete Response Rate
2015 2016 2017 2015 2016 2017 2015 2016 2017 2015 2016 2017
Faculty 328 341 448 93 79 92 78 68 79 28% 23% 21%
Staff 263 289 306 132 130 128 114 110 102 50% 45% 42%
Student 1355 1475 1419 147 136 138 117 106 104 11% 9% 10%
Totals 1946 2105 2173 372 245 358 309 284 284 19% 16% 16%
# Attempted # Complete Completion Rate
2015 2016 2017 2015 2016 2017 2015 2016 2017
Faculty 94 77 77 81 68 66 86% 88% 85%
Staff 124 125 120 107 108 97 86% 86% 80%
Student 147 132 149 116 102 117 78% 77% 78%
Totals 372 345 358 309 284 284 83% 82% 79%
# Attempted # Complete Completion Rate
2015 2016 2017 2015 2016 2017 2015 2016 2017
Not Declared 68 64 56 55 52 43 80% 81% 76%
0-24 48 43 42 40 31 33 83% 72% 78%
25-34 100 105 106 73 80 80 73% 76% 75%
35-44 51 50 48 44 44 36 86% 88% 75%
45-54 4 36 52 38 33 44 90% 91% 84%
55 & ABOVE 63 47 54 59 44 48 93% 93% 88%
Totals 372 345 358 309 284 284 83% 82% 79%
RESPONDENT POPULATION CHARTS
# Attempted # Complete Completion Rate
2015 2016 2017 2015 2016 2017 2015 2016 2017
Female 232 113 232 186 100 189 80% 88% 81%
Male 119 214 102 104 173 83 87% 80% 81%
Not Declared 21 18 24 19 11 12 90% 61% 50%
Totals 372 345 358 309 284 284 83% 82% 79%
Age (Self-reported)All survey participants are asked to self report their role, gender, and age group.
WSU Spokane 2017 TechQual+ Survey ReportPage 5

WSU Spokane 2017 TechQual+ Survey ReportPage 6

1CONNECTIVITY
& ACCESS
WSU Spokane 2017 TechQual+ Survey ReportPage 7

CONNECTIVITY & ACCESS
Service Expectations• A reliable campus network (#1 for students and staff
and #2 for staff) continues to be highly important to all campus groups.
• Wi-Fi coverage ranked as the second highest level of service expected for students and faculty, while ade-quate internet capacity ranked as the second highest level of service expected for staff.
Service Gaps (perceived minus minimum)• Compared to 2016, questions in this category showed
signficant decline in adequacy for faculty.• Students and staff rated this category as meeting expec-
tations.• The largest decline came in the adequacy rating of
capacity and speed of internet service, which decreased 3.5% in rankings.
• Student perceptions of the Wi-Fi service have increased positively by 15%.
• Adequate cellular coverage remains an issue.• Cellular Coverage is ranked as an extreme pain point for
faculty, with a -1.16 adequacy gap.Needs/Wants Ranking
• Wi-Fi remains the most important issue to the WSU
Spokane community, with 19% of respondents select-ing it as the top priority for WSU Spokane IT in 2017.
• 28% of students rank Wi-Fi as the most important issue of 2017, which is nearly double of the next highest priority.
Pick 3: Services that are most helpful & need improvement (open-ended questions)
• For students, Wi-Fi remains to be the most helpful, and within the top three services that are in need of improvement.
• Faculty and Staff agree that reliable Wi-Fi must be a priority.
2017 Technology Focus Ranking (pick one)• 19% of all respondents cite Wi-Fi as the top priority and
16% chose information security as top priority.• 28% of students chose Wi-Fi as the top priority.• 22% of staff and 16% of faculty indicated information
security should be the top priority.Comments
• 92 total comments: 41 students, 23 faculty, and 28 from staff.
• Comments expressed the need for a reliable connection and for a connection that reaches all the way to the parking lots.
2017 Highlights
Service Expectations
• For each question, service expec-tations are measured as a range as opposed to a single, scaled point.
• The range between end users’ minimum service expectations (needs) and desired service expectations constitutes what is known as the “zone of toler-ance.”
• The Adequacy Gap range (min-imum desired level of service to perceived level of service) is also shown.
• This chart displays the end users’ range of service expectations and how they perceive those service expectations being met.
• It also compares service expec-tation levels between students, faculty, staff, and all.
WSU Spokane 2017 TechQual+ Survey ReportPage 8
Students Faculty Staff
All Adequacy Gap
1

Service Adequacy Gap — 3-Year TrendThe Service Adequacy Gap indicates the degree to which basic, minimum service levels are being met. It is computed by subtracting the minimum level of service score from the perceived level of service score. Points on the charts below that are above the zero line indicate a positive adequacy score, meaning that users are satisfied, though there is always room for improvement. Points that are below the zero line indicate dissatisfaction with the service.
CONNECTIVITY & ACCESS (continued)1
2015 2016 2017All 0.37 0.17 0.07Staff 0.52 0.09 0.39Faculty 0.18 0.18 -0.45Student 0.39 0.24 0.07
-1.6-1.4-1.2
-1-0.8-0.6-0.4-0.2
00.20.40.60.8
11.21.41.6
Adeq
uacy
Gap
Question #1: Having an Internet service that operates reliably
2015 2016 2017
All 0.4 0.34 0.23
Staff 0.37 0.27 0.5
Faculty 0.25 0.44 -0.32
Student 0.52 0.35 0.28
-1.8-1.6-1.4-1.2
-1-0.8-0.6-0.4-0.2
00.20.40.60.8
11.21.41.61.8
Ad
equa
cy G
ap
Question #2: Having an Internet service that provides adequate
capacity and speed
2015 2016 2017All 0.05 0.01 0Staff 0.01 0.09 0.34Faculty -0.19 -0.11 -0.85Student 0.24 0 0.15
-1-0.9-0.8-0.7-0.6-0.5-0.4-0.3-0.2-0.1
00.10.20.30.40.50.60.70.80.9
1
Question #3: Having an Internet service that provides adequate
Wi-Fi coverage
2015 2016 2017All -0.04 0.00 -0.05Staff -0.28 -0.13 0.34Faculty -0.16 -0.36 -1.02Student 0.25 0.36 0.18
-1.00-0.90-0.80-0.70-0.60-0.50-0.40-0.30-0.20-0.100.000.100.200.300.400.500.600.700.800.901.00
Question #4: Having adequate cellular or mobile coverage
throughout campus
WSU Spokane 2017 TechQual+ Survey ReportPage 9
Students Faculty Staff
All Adequacy Gap

Install Wi-Fi coverage in the Ignite NW building. I have none in my office.
- Faculty
Comment Analysis
• Wi-Fi often drops signal across campus.• Wi-Fi can be slow to connect in main buildings such as the
Student Academic Center and the Nursing Building.• There is a loss of Wi-Fi coverage around buildings and in
parking lots. • There is little to no Wi-Fi coverage in the Ignite Spokane
building.• SAC 20 receives infamously poor cellular reception.• Some expressed gaps in service at the beginning of
semesters.
• There is poor cell phone reception in the lower floors of buildings, especially the Nursing and Pharmacy buildings.
• There are dead zones in the library that lack both cellular reception and Wi-Fi signal.
• Some respondents cited improvement concerning cellular reception.
• Users of all major networks admitted to having issues.
Major Themes
Question 1Internet Reliability
Question 2Internet Capacity/Speed
Question 3Wi-Fi
Question 4Cellular Coverage
#Respondents
#Commenters
#Comments
#Respondents
#Commenters
#Comments
#Respondents
#Commenters
#Comments
#Respondents
#Commenters
#Comments
Students 116 12 13 116 4 4 116 11 11 115 12 13
Faculty 66 4 4 63 4 4 62 4 4 64 10 11
Staff 96 3 3 96 4 5 90 7 7 91 11 13
Totals 278 19 20 275 12 13 268 22 22 270 33 37
Comment Sampling
CONNECTIVITY & ACCESS (continued)1
WSU Spokane 2017 TechQual+ Survey ReportPage 10
“There are some areas of the buildings where cell service (Verizon) is hard to get.
PBS, SEWC, and some areas of SAC. Improvement would be nice although does
not impede my ability to do my job.” -Staff
“In certain areas of campus, we do not receive any mobile coverage such as SAC 20.” - Student
“I have been in 4 different offices within the College of Nursing and each have had different levels of Wi-Fi. The 4th floor north side had very poor Wi-Fi.” - Staff
“Basement of PBS was a big problem for
2 years, but WAY TO GO
KENNY now!” - Faculty
“(Wi-Fi reliability) Doesn’t work in certain parts of buildings and could have a wider range extended to parking lots.” - Student

Question 1Internet Reliability
Question 2Internet Capacity/Speed
Question 3Wi-Fi
Question 4Cellular Coverage
#Respondents
#Commenters
#Comments
#Respondents
#Commenters
#Comments
#Respondents
#Commenters
#Comments
#Respondents
#Commenters
#Comments
Students 116 12 13 116 4 4 116 11 11 115 12 13
Faculty 66 4 4 63 4 4 62 4 4 64 10 11
Staff 96 3 3 96 4 5 90 7 7 91 11 13
Totals 278 19 20 275 12 13 268 22 22 270 33 37
2TECHNOLOGY & COLLABORATION
WSU Spokane 2017 TechQual+ Survey ReportPage 11

TECHNOLOGY & COLLABORATION
Service Expectations• Having improved WSU Spokane websites is the third
highest priority for everyone.• Blackboard Support is the fourth highest priority.
Service Gaps (perceived minus minimum)• Compared to 2016, questions in this category showed
significant decline in adequacy for faculty, while percep-tions among staff ranked more positively than 2016.
• Students and staff rated this entire category as meeting expectations, though some questions declined from previous years.
• Availability of spaces with technology to enhance teach-ing and learning declined across the board, though only received a negative adequacy score by faculty.
Needs/Wants Ranking• Many respondents would like to see search results on
the WSU Spokane website to only show results for that campus, not Pullman or other WSU campuses.
• Many respondents suggested a switch to Canvas LMS
in response to Online services that enhance teaching/learning.
Pick 3: Services that are most helpful & need improvement (open-ended questions)
• For students, Online services that enhance teaching/learning has the potential to be very helpful, but ser-vices like the WSU Spokane website and Blackboard are too unintuitive and outdated to prove helpful.
2017 Technology Focus Ranking• 12% of faculty, 11% of staff, and 14% chose WSU
Spokane websites as the top priority for improvement in 2017.
Comments• Search and navigation functions on WSU website are
not intuitive, user-friendly, or accurate.• Many users would like to see more streamlined online
administrative services, and more support for collabora-tive services.
2017 Highlights
WSU Spokane 2017 TechQual+ Survey ReportPage 12
• For each question, ser-vice expectations are measured as a range as opposed to a single, scaled point.
• The range between end users’ minimum service expectations (needs) and desired service expectations constitutes what is known as the “zone of tolerance.”
• The Adequacy Gap range (minimum desired level of service to perceived level of service) is also shown.
• This chart displays the end users’ range of service expectations and how they perceive those service expecta-tions being met.
• It also compares ser-vice expectation levels between students, faculty, staff, and all.
Service Expectations
Students Faculty Staff
All Adequacy Gap
2
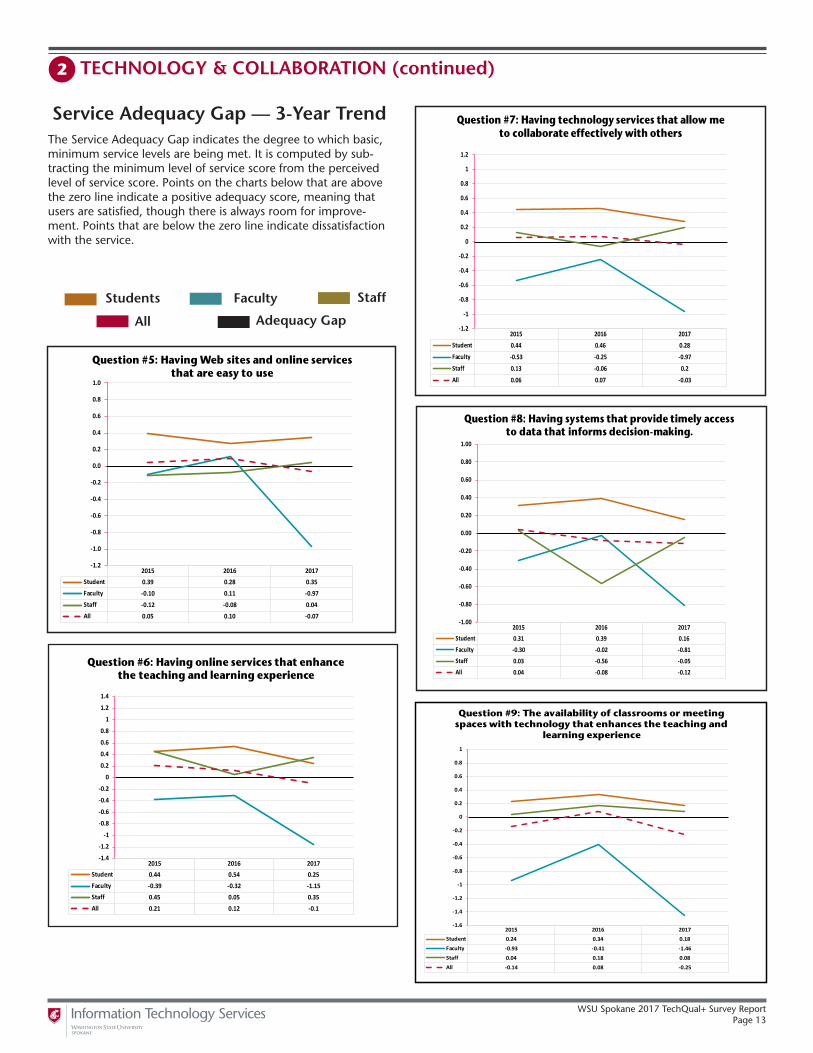
Service Adequacy Gap — 3-Year TrendThe Service Adequacy Gap indicates the degree to which basic, minimum service levels are being met. It is computed by sub-tracting the minimum level of service score from the perceived level of service score. Points on the charts below that are above the zero line indicate a positive adequacy score, meaning that users are satisfied, though there is always room for improve-ment. Points that are below the zero line indicate dissatisfaction with the service.
Students Faculty Staff
All Adequacy Gap
2015 2016 2017Student 0.39 0.28 0.35Faculty -0.10 0.11 -0.97Staff -0.12 -0.08 0.04All 0.05 0.10 -0.07
-1.2
-1.0
-0.8
-0.6
-0.4
-0.2
0.0
0.2
0.4
0.6
0.8
1.0
Question #5: Having Web sites and online services that are easy to use
TECHNOLOGY & COLLABORATION (continued)2
2015 2016 2017Student 0.44 0.46 0.28Faculty -0.53 -0.25 -0.97Staff 0.13 -0.06 0.2All 0.06 0.07 -0.03
-1.2
-1
-0.8
-0.6
-0.4
-0.2
0
0.2
0.4
0.6
0.8
1
1.2
Question #7: Having technology services that allow me to collaborate effectively with others
2015 2016 2017Student 0.31 0.39 0.16Faculty -0.30 -0.02 -0.81Staff 0.03 -0.56 -0.05All 0.04 -0.08 -0.12
-1.00
-0.80
-0.60
-0.40
-0.20
0.00
0.20
0.40
0.60
0.80
1.00
Question #8: Having systems that provide timely access to data that informs decision-making.
2015 2016 2017Student 0.24 0.34 0.18Faculty -0.93 -0.41 -1.46Staff 0.04 0.18 0.08All -0.14 0.08 -0.25
-1.6
-1.4
-1.2
-1
-0.8
-0.6
-0.4
-0.2
0
0.2
0.4
0.6
0.8
1
Question #9: The availability of classrooms or meeting spaces with technology that enhances the teaching and
learning experience
WSU Spokane 2017 TechQual+ Survey ReportPage 13
2015 2016 2017Student 0.44 0.54 0.25Faculty -0.39 -0.32 -1.15Staff 0.45 0.05 0.35All 0.21 0.12 -0.1
-1.4
-1.2
-1
-0.8
-0.6
-0.4
-0.2
0
0.2
0.4
0.6
0.8
1
1.2
1.4
Question #6: Having online services that enhance the teaching and learning experience
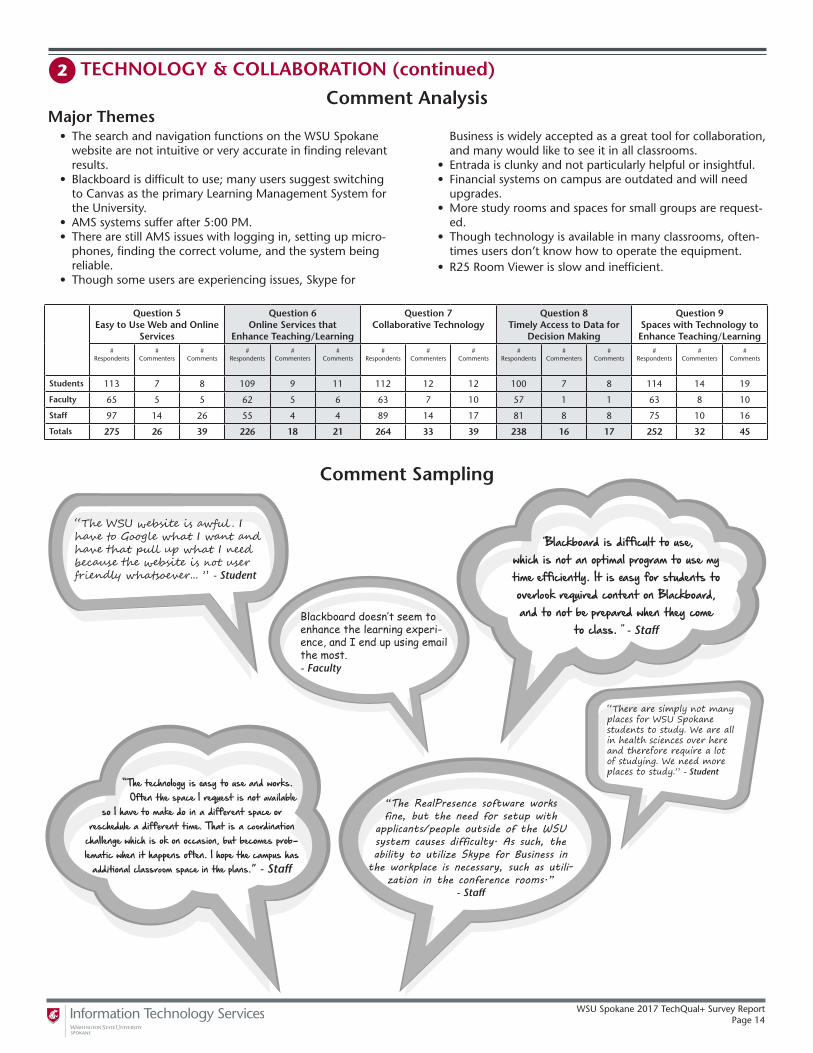
Comment Analysis
• The search and navigation functions on the WSU Spokane website are not intuitive or very accurate in finding relevant results.
• Blackboard is difficult to use; many users suggest switching to Canvas as the primary Learning Management System for the University.
• AMS systems suffer after 5:00 PM.• There are still AMS issues with logging in, setting up micro-
phones, finding the correct volume, and the system being reliable.
• Though some users are experiencing issues, Skype for
Business is widely accepted as a great tool for collaboration, and many would like to see it in all classrooms.
• Entrada is clunky and not particularly helpful or insightful.• Financial systems on campus are outdated and will need
upgrades.• More study rooms and spaces for small groups are request-
ed.• Though technology is available in many classrooms, often-
times users don’t know how to operate the equipment.• R25 Room Viewer is slow and inefficient.
Major Themes
Question 5Easy to Use Web and Online
Services
Question 6Online Services that
Enhance Teaching/Learning
Question 7Collaborative Technology
Question 8Timely Access to Data for
Decision Making
Question 9Spaces with Technology to Enhance Teaching/Learning
#Respondents
#Commenters
#Comments
#Respondents
#Commenters
#Comments
#Respondents
#Commenters
#Comments
#Respondents
#Commenters
#Comments
#Respondents
#Commenters
#Comments
Students 113 7 8 109 9 11 112 12 12 100 7 8 114 14 19
Faculty 65 5 5 62 5 6 63 7 10 57 1 1 63 8 10
Staff 97 14 26 55 4 4 89 14 17 81 8 8 75 10 16
Totals 275 26 39 226 18 21 264 33 39 238 16 17 252 32 45
Comment Sampling
TECHNOLOGY & COLLABORATION (continued)2
WSU Spokane 2017 TechQual+ Survey ReportPage 14
“The WSU website is awful . I have to Google what I want and have that pull up what I need because the website is not user friendly whatsoever... ” - Student
“Blackboard is difficult to use, which is not an optimal program to use my time efficiently. It is easy for students to overlook required content on Blackboard, and to not be prepared when they come
to class.” - StaffBlackboard doesn’t seem to enhance the learning experi-ence, and I end up using email the most. - Faculty
“There are simply not many places for WSU Spokane students to study. We are all in health sciences over here and therefore require a lot of studying. We need more places to study.” - Student
“The technology is easy to use and works. Often the space I request is not available
so I have to make do in a different space or reschedule a different time. That is a coordination
challenge which is ok on occasion, but becomes prob-lematic when it happens often. I hope the campus has
additional classroom space in the plans.” - Staff
“The RealPresence software works fine, but the need for setup with
applicants/people outside of the WSU system causes difficulty. As such, the ability to utilize Skype for Business in
the workplace is necessary, such as utili-zation in the conference rooms.”
- Staff

3SUPPORT & TRAINING
WSU Spokane 2017 TechQual+ Survey ReportPage 15

SUPPORT & TRAINING
Service Expectations• Faculty have the highest of expectations for this cat-
egory, but perceive each question as falling short of expectations.
• Students have low expectations but perceive this cate-gory as doing quite well.
Service Gaps (perceived minus minimum)• Compared to the last few years, questions in this cate-
gory showed signficant decline in adequacy for faculty and students.
• Students and staff rated this category as meeting mini-mum service level expectations.
• Each question has scored negatively for faculty.Pick 3: Services that are most helpful & need improvement (open-ended questions)
• Respondents would like faster solutions to their techni-cal support questions.
2017 Technology Focus Ranking• A quarter of staff rank technical support as the most
prominent priority of 2017, while a very close 20% rank techincal training as most important.
• 16% of faculty rank technical training as the highest priority, while 12% of faculty rank technical support as the highest priority.
Training Preferences• 46% of faculty prefer group workshops, 43% prefer
videos, and 39% prefer individual one-to-one trainings.• 53% of staff prefer group workshops, 45% prefer vid-
eos, and 38% prefer individual one-to-one trainings.Comment Analysis
• 73 total comments: 25 from students, 19 from faculty, and 29 from staff.
• Respondents are generally happy with current technical support. They would like to see more training opportu-nities.
2017 Highlights
WSU Spokane 2017 TechQual+ Survey ReportPage 16
Service Expectations
Students Faculty Staff
All Adequacy Gap
3
• For each question, ser-vice expectations are measured as a range as opposed to a single, scaled point.
• The range between end users’ minimum service expectations (needs) and desired service expectations constitutes what is known as the “zone of tolerance.”
• The Adequacy Gap range (minimum desired level of service to perceived level of service) is also shown.
• This chart displays the end users’ range of service expectations and how they perceive those service expecta-tions being met.
• It also compares ser-vice expectation levels between students, faculty, staff, and all.

2015 2016 2017Student 0.27 0.90 0.76Faculty 0.35 0.50 -0.38Staff 0.20 -0.01 0.30All 0.26 0.40 0.31
-0.80
-0.60
-0.40
-0.20
0.00
0.20
0.40
0.60
0.80
1.00
Question #13: Getting Access to training or other self-help information that increases my
effectiveness with technology
Service Adequacy Gap — 3-Year Trend
The Service Adequacy Gap indicates the degree to which basic, minimum service levels are being met. It is computed by subtracting the minimum level of service score from the perceived level of service score. Points on the charts below that are above the zero line indicate a positive adequacy score, meaning that users are satisfied, though there is always room for improvement. Points that are below the zero line indicate dissatisfaction with the service.
Students Faculty Staff
All Adequacy Gap
SUPPORT & TRAINING (continued)3
WSU Spokane 2017 TechQual+ Survey ReportPage 17
2015 2016 2017Student 0.45 0.62 0.55Faculty 0.03 0.52 -0.07Staff 0.35 0.33 0.67All 0.28 0.48 0.46
-0.8
-0.6
-0.4
-0.2
0
0.2
0.4
0.6
0.8
Question #10: Getting timely resolution of technology problems that I am experiencing
2015 2016 2017Student 0.69 1.10 0.74Faculty 0.19 0.60 -0.11Staff 0.32 0.41 0.62All 0.41 0.69 0.51
-0.60
-0.40
-0.20
0.00
0.20
0.40
0.60
0.80
1.00
1.20
Question #12: Receiving communications regarding technology services that I can
understand
2015 2016 2017Student 0.82 0.82 0.61Faculty 0.09 0.36 -0.16Staff 0.11 0.04 0.53All 0.36 0.39 0.4
-1
-0.8
-0.6
-0.4
-0.2
0
0.2
0.4
0.6
0.8
1
Question #11: Technology support staff who have the knowledge to answer my questions

Question 10Timely Resolution to Prob-
lems
Question 11Knowledgeable Support
Staff
Question 12Understandable Tech
Communication
Question 13Access to Training that Increases Effectiveness
#Respondents
#Commenters
#Comments
#Respondents
#Commenters
#Comments
#Respondents
#Commenters
#Comments
#Respondents
#Commenters
#Comments
Students 106 6 9 104 6 8 107 3 4 95 6 6
Faculty 61 4 5 63 5 6 65 3 3 61 7 7
Staff 96 3 4 96 6 8 94 6 7 91 13 18
Totals 263 13 18 263 17 22 266 12 14 247 26 31
Comment Analysis
• While training opportunities are available, some staff do not know how to access those sessions, while some believe the content is outdated.
• Some faculty and staff either do not have time for training, or the training is regularly scheduled at a time they’re not available.
• Getting accurate and timely resolution to issues can be a “hit or miss” scenario.
• Both students and faculty commented that support could be improved if the Spokane ITS department was entirely autonomous from Pullman.
• Self-help resources are highly requested from all groups.• Students would appreciate an IT person that worked week-
ends and late evenings for students.• People would like to hear more communications regarding
the strategic direction of IT services.
Major Themes
Comment Sampling
SUPPORT & TRAINING (continued)3
WSU Spokane 2017 TechQual+ Survey ReportPage 18
BLACKBOARD & INSTRUCTIONAL TECHNOLOGIES
“Often I do not bring my technology concerns/questions to staff because I am not sure if they are officially qualified for a particular situation (virus, new Windows 10 not working) or if we are
just hiring students with a slight knowledge in computer works.”
- Student
The tech people have been as help-ful and wonderful as they can be. This is not a people issue. It is a finance and logistical issue. When you don’t prioritize tech in the classroom, you fall behind. - Faculty
“I’m not sure where to access self-help resources.” - Staff
“Please switch to Canvas. More effective, more stream-
line, more user friendly. More everything compared to
Blackboard. - Student
“Training always occurs during clinical and teach-ing times during the sem-ster. I am unable to attend due to the times offered.”
- Faculty

Comment Sampling
4BLACKBOARD &
INSTRUCTIONAL TECHNOLOGIES
WSU Spokane 2017 TechQual+ Survey ReportPage 19

Blackboard & Instructional Technologies
Service Expectations• Having an effective, intuitive, and reliable learning
mangement system (Blackboard) ranked in the top five highest minimum service level scores for students and faculty.
• Neither group’s desired level of service is met.Service Gaps (perceived minus minimum)
• Though these questions haven’t been asked in previous years by WSU Spokane ITS and therefore cannot be compared to previous years, this category has nearly unanimous dissapproval.
• There is exactly a 1% difference for the adequacy score for students betweeen the absolute minimum and the percEIved service scope for Question 16.
• Students find all services to be at least adequate, except for having an effective, intuitive, and reliable LMS (Blackboard).
• Faculty ranked all three questions as being less than adequate.
• Having an effective, intuitive, and reliable LMS was the least adequate service overall according to faculty.
Pick 3: Services that are most helpful & need improvement (Open-ended questions)
• 23.64% of students rank Blackboard as the top service needing improvement.
• 8.33% of faculty rank Blackboard as one of the top three services needing improvement.
2017 Technology Focus Ranking• 15% of students, 9% of faculty, and 8% of overall re-
spondents chose Blackboard Support as the top priority for Spokane ITS in 2017.
Comments• 62 total comments: 42 students and 20 faculty.• Both students and faculty are frustrated with Blackboard
for being unintuitive, outdated, and unreliable.• There were very few users who were satisfied with
Blackboard.• A few respondents believe the issue in Blackboard lies
in how differently each professor approaches using the LMS.
• Many users suggested a switch to Canvas.
2017 Highlights
• For each question, service expectations are mea-sured as a range as opposed to a single, scaled point.
• The range between end users’ minimum service expectations (needs) and desired service expec-tations constitutes what is known as the “zone of tolerance.”
• The Adequacy Gap range (minimum desired lev-el of service to perceived level of service) is also shown. This chart displays the end users’ range of service expectations and how they perceive those service expectations being met.
• It also compares service expectation levels be-tween students, faculty, staff, and all.
WSU Spokane 2017 TechQual+ Survey ReportPage 20
4
Service Expectations
Students Faculty Staff
All Adequacy Gap

Question 14Access to New & Useful
Instructional Technologies
Question 15Having an Effective, In-
tuitive, and Reliable LMS (Blackboard)
Question 16Timely & Helpful
Blackboard Support
#Respondents
#Commenters
#Comments
#Respondents
#Commenters
#Comments
#Respondents
#Commenters
#Comments
Students N/A N/A N/A 109 23 35 86 7 7
Faculty 57 5 6 47 9 12 44 2 2
Totals 57 5 6 156 31 47 130 9 9
• Both faculty and students expressed frustration and disdain for Blackboard.
• Many professors who use Blackboard do not have a consis-tent way of utilizing it, and it confuses students.
• The interface for Blackboard is outdated, unintuitive, unac-
cessible, and difficult to navigate.• Current technical support for Blackboard is either met with
glowing recommendations, or takes several days to get back to faculty and students.
• Several respondents prefer Canvas.
Comment Analysis
Major Themes
Service Adequacy Gap
Students Faculty AllSeries1 -0.51 -1.3 -0.75
-1.4
-1.2
-1
-0.8
-0.6
-0.4
-0.2
0
Question 15: Having an effective, intuitive, and reliable Learning Management
System (Blackboard)
The Service Adequacy Gap indicates the degree to which basic, minimum service levels are being met. It is computed by subtracting the minimum level of service score from the perceived level of service score. Points on the charts below that are above the zero line in-dicate a positive adequacy score, meaning that users are satisfied, though there is always room for improvement. Points that are below
the zero line indicate dissatisfaction with the service.
Students Faculty Staff All
BLACKBOARD & INSTRUCTIONAL TECHNOLOGIES (continued)4
WSU Spokane 2017 TechQual+ Survey ReportPage 21
FacultySeries1 -0.65
-0.7
-0.6
-0.5
-0.4
-0.3
-0.2
-0.1
0
Question 14: Having information and access to new and useful instructional
technologies and methods
Students Faculty AllSeries1 0.01 -0.5 -0.16
-0.6
-0.5
-0.4
-0.3
-0.2
-0.1
0
0.1
Question 16: Getting timely and helpful support for Blackboard

Comment Sampling
BLACKBOARD & INSTRUCTIONAL TECHNOLOGIES (continued)4
WSU Spokane 2017 TechQual+ Survey ReportPage 22
“I would like EWU and WSU to resolve the Canvas/ Blackboard issue. SHS is a collaborative program and
using 2 systems is cumbersome for students and instructors. I use EWU’s Canvas. It would be great to have the
entire campus on one LMS.” - Faculty
“PLEASE IMPLEMENT CANVAS! I use Canvas with my joint classes with EWU professors for speech and hearing and Canvas is WAY more user-friendly than Blackboard. A lot of my WSU class-
mates and I agree!!!” - Student
“Blackboard works pretty well, but there is room for improvement.”
- Student
“The best way to improve this service is to get a new one. Blackboard is outdated, unintuitive, and difficult to navigate. Their mobile platforms don’t work, and make it nearly impossible to use Blackboard effectively on a phone. There are better alternatives. My last university made the switch to Canvas from Blackboard
while I was there and it was an easy transition for students and staff and is a more effective, intuitive platform with
mobile capabilities.” - Faculty
“More than once this semester, there was a
problem accessing the pre-class videos. Often I only
have a short window to view videos, etc. When the video is not accessible it prevents me from preparing for class.”
- Student
“Please switch to Canvas. More effective, more stream-
line, more user friendly. More everything compared to
Blackboard. - Student
“Blackboard interface for WSU Spokane looks like it was created in the 90’s and no one has updated it. It’s not intuitive compared to what I’ve used from my trans-
fer college. When I came to WSU they preached to their students about how innovative they are. Blackboard is the opposite of innovative and it takes forever to find
the material I need. I spend 10 minutes trying to find the material I need for class. It’s not intuitive for either the student or professor. It has been the biggest let-down
that I’ve experienced at WSU Spokane.” - Faculty
(In regards to Blackboard Support) “Usually very good, but sometimes
there are black holes when no one is available i.e. lunch time. Most facul-ty do not take lunch and it is a time
when we catch up.” - Faculty

5RESEARCH RESOURCES
FOR FACULTY
WSU Spokane 2017 TechQual+ Survey ReportPage 23

Research Resources for Faculty
Service Gaps (perceived minus minimum)• Faculty have approximately the same service expecta-
tions for each question.• Access to high speed computing for research had the
largest adequacy gap. A comment provided in the sur-vey that details worries of scheduling issues may provide insight.
• Internet speed/capacity for research needs had the lowest adequacy gap.
• This category had the least “pain” for service adequacy gaps.
• Self-identifying male faculty ranked access to data as being a greater problem than female faculty.
Comments• 4 total comments from faculty.• While respondents realize they have access to a large
amount of data storage, some prefer their own storage option.
• One respondent reported syncing issues with OneDrive.• One respondent reported worries with scheduling time
with the HPCC.
2017 Highlights
• For each question, service expectations are measured as a range as opposed to a single, scaled point.
• The range between end users’ minimum service expecta-tions (needs) and desired service expectations constitutes what is known as the “zone of tolerance.”
• The Adequacy Gap range (minimum desired level of ser-vice to perceived level of service) is also shown. This chart displays the end users’ range of service expectations and how they perceive those service expectations being met.
• It also compares service expectation levels between stu-dents, faculty, staff, and all.
WSU Spokane 2017 TechQual+ Survey ReportPage 24
Comment Sampling
5
Service Expectations
Students Faculty Staff
All Adequacy Gap

Question 17Access to High Speed
Computing for Research
Question 18Internet Speed/Capacity for
Research Needs
Question 19Data Storage Space for
Research Data#
Respondents#
Commenters#
Comments#
Respondents#
Commenters#
Comments#
Respondents#
Commenters#
Comments
Faculty 57 1 1 47 0 0 44 3 3
Totals 57 1 1 47 0 0 44 3 3
• Faculty have access to many types of storage.• There are syncing issues within these storage options.• Our faculty use multiple hard drives.
• Faculty are aware of the HPCC, but worry that it will be difficult to schedule time to use it.
• Faculty would like to set up SQL server instances on a central server.
Comment AnalysisMajor Themes
Comment Sampling
RESEARCH RESOURCES FOR FACULTY (continued)5
WSU Spokane 2017 TechQual+ Survey ReportPage 25
“I would like to setup SQL server instances on a central server.
There should be a web interface to configure this instance according to my needs within a prescribed limit. It should be automatically
provisioned within minutes.” - Faculty
“I have data on multiple hard drives
and none backed up to a server.” - Faculty
(Regarding access to high speed comput-ing) ”Not a big deal yet. I am aware of HPCC services. Once I begin utilizing these resources, I fear that I will encounter scheduling and compute issues.” - Faculty
“While we have plenty of storage through OneDrive, I have
had several syncing issues.” - Faculty

COMPUTER LABSFOR STUDENTS
WSU Spokane 2017 TechQual+ Survey ReportPage 26

6COMPUTER LABSFOR STUDENTS
WSU Spokane 2017 TechQual+ Survey ReportPage 27

Computer Labs for Students
Service Expectations• Though students had low minimum service require-
ments for the computer labs, their desired level of service is quite high in comparison to other categories.
• Students’ desired level of service has not been met.Service Gaps (perceived minus minimum)
• Though these questions haven’t been asked in previous years by WSU Spokane ITS and therefore cannot be compared to previous years, this category has nearly unanimous approval quantitatively.
• Students find all services to be at least adequate.
Pick 3: Services that are most helpful & need improvement (open-ended questions)
• 1.82% of students chose printing capabilities in labs to be the top priority for 2017
Comments• 15 total comments from students.• Lab availability was mentioned frequently to extend the
hours of the computer lab.• Students noted the lab is not a quiet study environ-
ment.
2017 Highlights
• For each question, service expectations are measured as a range as opposed to a single, scaled point.
• The range between end users’ minimum service expecta-tions (needs) and desired service expectations constitutes what is known as the “zone of tolerance.”
• The Adequacy Gap range (minimum desired level of service to perceived level of service) is also shown. This chart dis-plays the end users’ range of service expectations and how they perceive those service expectations being met.
• It also compares service expectation levels between stu-dents, faculty, staff, and all.
WSU Spokane 2017 TechQual+ Survey ReportPage 28
6
Service Expectations
Students Faculty Staff
All Adequacy Gap

Question 20Availability of Open
Computer Labs
Question 21Positive Computer Lab Environment
#Respondents
#Commenters
#Comments
#Respondents
#Commenters
#Comments
Student 57 10 11 47 5 5
Totals 57 10 11 47 5 5
Comment Sampling
Comment Analysis
• Students would like more availability of open computer labs.
• Several students suggested extending the hours of the computer lab to include evenings and weekends.
• Students would appreciate a quiet study environment.
• Respondents from the Yakima campus noted the lack of computer lab on their campus, and would like to see one implemented.
• Yakima-based respondents suggested adding printing options for students.
Major Themes
COMPUTER LABS FOR STUDENTS (continued)6
WSU Spokane 2017 TechQual+ Survey ReportPage 29
“I wish it was open till 12 am (midnight) Thursday,
Friday and Saturday.” - Student
“Having a positive envi-ronment is only as good as the availability — one cannot take advantage of it, if it is not available.”
- Student
“I DID NOT KNOW THIS EXISTED. Does this have 24 hour printing??????? That would be one thing that would be great.”
- Student
“I feel we should have the campus open later to students so they may hold study groups since we get out at 4 from class some days and are unable to stay in the building after five.” - Student
“It needs to be quieter.”
- Student
“Would be nice if hours were
broader.” - Student

VIDEOCONFERENCINGFOR FACULTY AND STAFF
WSU Spokane 2017 TechQual+ Survey ReportPage 30

7VIDEOCONFERENCING
FOR FACULTY AND STAFF
WSU Spokane 2017 TechQual+ Survey ReportPage 31

VIDEOCONFERENCING FOR FACULTY AND STAFF
Service Expectations• Both staff and faculty have high expectations for video-
conferencing and related support.• Neither group’s desired level of service is met.
Service Gaps (perceived minus minimum)• Though these questions have not been asked in previ-
ous years by WSU Spokane ITS and therefore cannot be compared to previous years, this category scored as inadequate by faculty.
• Staff, though ranking availability of spaces as adequate, found that support for videoconferencing to be inade-quate.
• Faculty ranked availability of spaces with videoconfer-encing technology as highly painful.
Pick 3: Services that are most helpful & need improvement (open-ended questions)
• 45.83% of faculty and 26.47% of staff voted video-conferencing/AMS as the service needing the most improvement.
• 12.50% of faculty and 11.43% of staff named video-conferencing/AMS as one of the top three most helpful IT Services.
Comments• 38 total comments: 11 from faculty, 27 from staff.• Availability of videoconferencing-enabled spaces was
mentioned frequently, along with recommendations to increase the amount of enabled spaces.
• Many noted that support for videoconferencing was neither timely nor helpful.
2017 Highlights
• For each question, service expectations are measured as a range as op-posed to a single, scaled point.
• The range between end users’ minimum service expectations (needs) and desired service expectations constitutes what is known as the “zone of tolerance.”
• The Adequacy Gap range (minimum desired level of service to perceived level of service) is also shown. This chart displays the end users’ range of service expectations and how they perceive those service expectations being met.
• It also compares service expectation levels between students, faculty, staff, and all.
WSU Spokane 2017 TechQual+ Survey ReportPage 32
7
Service Expectations
Students Faculty Staff
All Adequacy Gap

Question 22Availability of Spaces with
Videoconferencing Technology
Question 23Timely & Helpful Support for
Videoconferencing#
Respondents#
Commenters#
Comments#
Respondents#
Commenters#
Comments
Faculty 61 6 6 62 5 5
Staff 80 10 11 84 8 16
Totals 141 16 17 146 13 21
Comment Analysis
• Both faculty and staff have noted a lack of spaces on campus with videoconferencing technology.
• Many respondents suggested increasing the amount of spac-es on campus with videoconferencing technology.
• Some respondents say they would rather use Skype for Business in lieu of booking a space with videoconferencing technology.
• Oftentimes, faculty and staff experience connection prob-lems moments before they need to utilize videoconferencing technology.
• Several respondents experienced a lack of support staff when problems occur.
• Respondents also cited a lack of knowledge by support staff regarding videoconferencing.
Major Themes
Comment Sampling
VIDEOCONFERENCING FOR FACULTY AND STAFF (continued)6
WSU Spokane 2017 TechQual+ Survey ReportPage 33
“With SAC147A and EWU auditorium no
longer set up for video technology, this has limited my ability
to find space .” - Staff
“Pretty much every meeting involving videoconferencing is delayed because of connection problems. We need a new videoconferencing system. The expense of new infrastructure could easily be recovered from the reduced need for staff support.” - Faculty
“While there are many classrooms with AMS capability, I often have to settle for rooms that are far across campus from my college, co-workers and students.” - Faculty
“IT staff generally are able to respond to requests for support in a timely manner. However, occasionally, the problem is not resolved in a timely manner.” - Faculty
“Seems as though these rooms are decreasing with this availability. It also appears IT staff are sometimes unsure as to how to fix prob-lems in these rooms when they occur.” - Staff
“Typically there is good response, but depends on
the time of day and staffing. Often, I’m told there is only one person on duty or
around to help so they will get there as soon as they can!” - Staff

WSU Spokane 2017 TechQual+ Survey ReportPage 34
2017 TECHNOLOGY EXPECTATIONS
For each core item in the survey, respondents were asked to rate a service on three dimensions: minimum expectation levels, desired service levels, and perceived service levels. To identify priority of service quality, the scores for minimum and desired services were ranked from highest to lowest. The charts below show key findings from the ranking of minimum expectation levels and desired service levels. See Appendix B for the full chart.
Students Faculty Staff
1. Having an Internet service that provides adequate Wi-Fi coverage. 7.61 (7.31)
2. Having an Internet service that operates reliably. 7.53 (7.07)
3. Having an Internet service that provides adequate capacity or speed. 7.48 (7.02)
4. Having an effective, intuitive, and reliable Learning Management System (Blackboard). 7.47 (N/A)
5. Technology support staff who have the knowl-edge to answer my questions. 7.42 (7.18)
1. Having an Internet service that operates reliably. 8.30 (7.75)
2. Getting timely and helpful support for Blackboard (the WSU learning management system). 8.09 (N/A)
3. Technology support staff who have the knowl-edge to answer my questions. 8.06 (7.77)
4. Getting timely and helpful support for videocon-ferencing technology in classrooms or meeting spaces. 8.03 (N/A)
5. Having an Internet service that provides adequate capacity or speed. 8.02 (7.53)
1. Having an Internet service that operates reliably 7.84 (7.84)
2. Having an Internet service that provides adequate capacity or speed. 7.74 (7.61)
3. Technology support staff who have the knowl-edge to answer my questions. 7.54 (7.65)
4. Getting timely and helpful support for videocon-ferencing technology in classrooms or meeting spaces. 7.42 (N/A)
5. Getting timely resolution of technology problems that I am experiencing. 7.32 (7.31)
Dropped from the Top 5Getting timely resolution of technology problems that I am experiencing. (3 to 8)
Having adequate cellular (or mobile) coverage throughout campus. (5 to 6)
Having an Internet service that provides adequate Wi-Fi coverage. (4 to 7)
Getting timely resolution of technology problems that I am experiencing. (5 to 7)
Having systems that provide timely access to data that informs decision-making. (4 to 9)
Having technology services that allow me to collabo-rate effectively with others. (5 to 10)
2017 Five Highest Minimum Service Level Scores(2016 ranking in parenthesis)
2017 Five Highest Desired Service Level Scores(2016 ranking in parenthesis)
Students Faculty Staff
1. Having an Internet service that operates reliably. 8.86 (8.81)
2. Having an Internet service that provides adequate Wi-Fi coverage. 8.84 (8.84)
3. Having an Internet service that provides adequate capacity or speed. 8.78 (8.78)
4. Having an effective, intuitive, and reliable Learning Management System (Blackboard). 8.72 (N/A)
5. Technology support staff who have the knowl-edge to answer my questions. 8.70 (8.56)
1. Having an Internet service that operates reliably. 8.92 (8.81)
2. Technology support staff who have the knowl-edge to answer my questions. 8.89 (8.56)
3. Having Web sites and online services that are easy to use. 8.86 (8.56)
4. Having an Internet service that provides adequate Wi-Fi coverage. 8.85 (8.84)
5. Getting timely resolution of technology problems that I am experiencing. 8.82 (8.53)
Dropped from the Top 5Having adequate cellular (or mobile) coverage throughout campus. (4 to 9)
Having Web sites and online services that are easy to use. (5 to 8)
Having an Internet service that provides adequate capacity or speed. (3 to 6)
Having adequate cellular (or mobile) coverage throughout campus. (4 to 10)
Having systems that provide timely access to data that informs decision-making. (4 to 7)
1. Having an Internet service that provides adequate capacity or speed. 8.82 (8.81)
2. Having an Internet service that operates reliably. 8.77 (8.90)
3. Technology support staff who have the knowl-edge to answer my questions. 8.75 (8.72)
4. Getting timely resolution of technology problems that I am experiencing. 8.69 (8.69)
5. Getting timely and helpful support for videocon-ferencing technology in classrooms or meeting spaces. 8.57 (N/A)
What one issue would you choose as the top priority for WSU Spokane ITS in 2017?

WSU Spokane 2017 TechQual+ Survey ReportPage 35
2017 TOP TECHNOLOGY FOCUS
When asked to choose the top priority for Spokane IT in 2017, information security ranked in the top four for students, faculty, and staff. Technical support made it into the top three for faculty and staff, while Wi-Fi made it into the top three for students and faculty. The following results are from the WSU Spokane ITS TechQual+ questions asked of all self-identi-fied students, faculty, and staff.
2017 # % Rank
Wi-Fi 33 28% 1
Blackboard support 18 15% 2
WSU Spokane websites 17 14% 3
Information security 12 10% 4
Technical support 11 9% 5
Cellphone coverage 8 6% 6
Technology training 6 5% 7
Non-WSU computer and device support 5 4% 8
2017 # % Rank
Technology training 11 16% 1
Information security 11 16% 1
Wi-Fi 10 15% 2
Technical support 9 13% 3
WSU Spokane websites 8 12% 4
Blackboard support 6 9% 5
Cellphone coverage 5 7% 6
Non-WSU computer and device support 3 4% 7
2017 # % Rank
Technical support 25 25% 1
Information security 22 22% 2
Technology training 20 20% 3
Wi-Fi 11 11% 4
WSU Spokane websites 9 9% 5
Cellphone coverage 5 5% 6
Non-WSU computer and device support 1 1% 7
Blackboard support 0 0% 8
What one issue would you choose as the top priority for WSU Spokane ITS in 2017?
Stud
ents
Facu
lty
Staf
f

WSU Spokane 2017 TechQual+ Survey ReportPage 36
2017 TOP THREE MOST HELPFUL IT SERVICES
In an open-ended question, survey participants were asked which three WSU Spokakne ITS services are most helpful. There were a total of 107 respondents: 48 students, 24 faculty, and 35 staff.
Technical Support 60.42%
Wi-Fi 29.17%
Blackboard 10.42%
Blackboard Support 8.33%
Cellphone Coverage 6.25%
StudentsFive Most Helpful Services
Technical Support 62.50%
Wi-Fi 12.50%
Blackboard Support 12.50%
Videoconf. & AMS 12.50%
Technology Training 8.33%
FacultyFive Most Helpful Services
Technical Support 94.29%
Wi-Fi 20.00%
Technology Training 14.29%
Classroom Technology 11.43%
Videoconf. & AMS 11.43%
StaffFive Most Helpful Services
0.00%
10.00%
20.00%
30.00%
40.00%
50.00%
60.00%
70.00%
80.00%
90.00%
100.00%
Student Faculty Staff
Chart of Most Helpful IT Services

WSU Spokane 2017 TechQual+ Survey ReportPage 37
2017 TOP THREE IT SERVICES NEEDING IMPROVEMENT
In an open-ended question, survey participants were asked which three WSU Spokane ITS services need improvement. There were a total of 113 respondents: 55 students, 24 faculty, and 34 staff. Find complete results in Appendix C (Page 48).
Wi-Fi 23.64%
Blackboard 23.64%
Videoconf. & AMS 18.18%
Internet Speed/Reliability 14.55%
Information Security 12.73%
StudentsFive Most Requested Improvements
Videoconf. & AMS 45.83%
WiFi 16.67%
Technical Support 16.67%
Information Security 12.50%
Accessible Online Resources
8.33%
FacultyFive Most Requested Improvements
Videoconf. & AMS 26.47%
Technical Support 23.53%
Tech. Communications 20.59%
Wi-Fi 14.71%
Technology Training 14.71%
StaffFive Most Requested Improvements
Chart of Most Helpful IT Services
0.00%
5.00%
10.00%
15.00%
20.00%
25.00%
30.00%
35.00%
40.00%
45.00%
50.00%
Student Faculty Staff
Chart of IT Services Needing Improvement

WSU Spokane 2017 TechQual+ Survey ReportPage 38
2017 TRAINING PREFERENCES FOR FACULTY AND STAFF
What type of training suits you best when learning technology applications at WSU Spokane?
(Multiple Answer Question)
1. Group workshops 31 46%
2. Videos 29 43%
3. Individual one-to-one trainings 26 39%
4. Written tutorials 20 30%
1. Group workshops 52 53%
2. Videos 44 45%
3. Individual one-to-one trainings 37 38%
4. Written tutorials 35 36%
Facu
ltyFa
culty
1. Individual email 44 66%
2. Website announcements 17 25%
3. Weekly FYI or department news letters
16 24%
4. Signs around campus 6 9%
5. Recommendation from a super- visor or student advisor
5 7%
Staf
fSt
aff
1. Individual email 53 54%
2. Weekly FYI or department news letters
44 45%
3. Website announcements 33 34%
4. Recommendation from a super- visor or student advisor
16 16%
5.Signs around campus 9 9%
What is the best way to advertise technology training opportunities?(Multiple Answer Question)
APPENDIX ASURVEY DATA

1. Group workshops 52 53%
2. Videos 44 45%
3. Individual one-to-one trainings 37 38%
4. Written tutorials 35 36%
A
WSU Spokane 2017 TechQual+ Survey ReportPage 39
APPENDIX ASURVEY DATA

All Respondents(includes incomplete surveys)
Connectivity & Access
# Item Min Des Per Adeq Supr N
1 Having an Internet service that operates reliably. 7.81 8.85 7.90 0.09 -0.96 315
2 Having an Internet service that provides adequate capacity or speed. 7.70 8.80 7.91 .21 -0.90 307
3 Having an Internet service that provides adequate Wi-Fi coverage. 7.55 8.72 7.53 -0.02 -1.18 303
4 Having adequate cellular (or mobile) coverage throughout campus. 7.48 8.59 7.38 -0.10 -1.21 306
# Item Min Des Per Adeq Supr N
5 Having Web sites and online services that are easy to use. 7.24 8.59 7.16 -0.08 -1.42 291
6 Having online services that enhance the teaching and learning experience. 7.16 8.50 7.08 -0.09 -1.43 240
7 Having technology services that allow me to collaborate effectively with others. 7.13 8.43 7.13 0.00 -1.30 281
8 Having systems that provide timely access to data that informs decision making. 7.23 8.48 7.08 -0.14 -1.39 251
9The availability of classrooms or meeting spaces with technology that enhances the teaching/learn-ing experience.
7.32 8.55 7.07 -0.25 -1.48 267
# Item Min Des Per Adeq Supr N
10 Getting timely resolution of technology problems that I am experiencing. 7.41 8.72 7.88 0.47 -0.84 273
11 Technology support staff who have the knowledge to answer my questions. 7.61 8.76 8.01 0.40 -0.75 273
12 Receiving communications regarding technology services that I can understand. 7.15 8.43 7.65 0.50 -0.78 275
13Getting access to training or other self-help information that increases my effectiveness with technology.
6.73 8.11 7.03 0.30 -1.08 255
# Item Min Des Per Adeq Supr N
14Having information and access to new and useful instructional technologies or methods. Self- reported faculty only.
7.05 8.22 6.38 -0.67 -1.84 58
15Having an effective, intuitive, and reliable Learning Management System (Blackboard). Self-reported faculty, students only.
7.63 8.74 6.87 -0.77 -1.87 158
16Getting timely and helpful support for Blackboard (the WSU learning management system). Self- reported faculty, students only.
7.55 8.65 7.39 -0.16 -1.26 131
Legend: Min = Minimum Level of Service; Des = Desired Level of Service; Per = Perceived Service Quality; Adeq = Adequacy Gap Score (perceived - minimum); Supr = Superi-ority Gap Score (perceived - desired); N = Number of Observations
Technology & Collaboration Services
Support & Training
Blackboard & Instructional Technologyfor Faculty & Students
WSU Spokane 2017 TechQual+ Survey ReportPage 40

All Respondents (continued)(includes incomplete surveys)
# Item Min Des Per Adeq Supr N
17 Having access to high speed computing for research. Self-reported faculty only. 7.24 8.21 6.76 -0.47 -1.45 38
18 Having internet speed/capacity specifically in terms of research needs. Self-reported faculty only. 7.36 8.24 7.17 -0.19 -1.07 42
19 Having data storage space used specifically for research data. Self-reported faculty only. 7.40 8.33 7.12 -0.29 -1.21 42
Research Resourcesfor Faculty
# Item Min Des Per Adeq Supr N
20 Availability and hours for open computer labs. Self-reported students only. 6.45 7.88 7.12 0.67 -0.76 67
21Having a positive environment (cleanliness, noise, temperature, etc.) for the open computer lab (SAC 311). Self reported students only.
6.90 8.09 7.37 0.47 -0.72 68
Computer Labsfor Students
Videoconferencingfor Faculty and Staff
# Item Min Des Per Adeq Supr N
22Availability of classrooms and meeting spaces with videoconferencing technology. Self-reported faculty, staff only.
7.19 8.42 7.22 0.03 -1.20 142
23Getting timely and helpful support for videoconferencing technology in classrooms or meeting spaces. Self-reported faculty, staff only.
7.69 8.68 7.42 -0.27 -1.26 148
Legend: Min = Minimum Level of Service; Des = Desired Level of Service; Per = Perceived Service Quality; Adeq = Adequacy Gap Score (perceived - minimum); Supr = Superi-ority Gap Score (perceived - desired); N = Number of Observations
WSU Spokane 2017 TechQual+ Survey ReportPage 41

All Students(includes incomplete surveys)
Connectivity & Access
# Item Min Des Per Adeq Supr N
1 Having an Internet service that operates reliably. 7.52 8.87 7.62 0.10 -1.25 128
2 Having an Internet service that provides adequate capacity or speed. 7.48 8.78 7.77 0.29 -1.02 125
3 Having an Internet service that provides adequate Wi-Fi coverage. 7.57 8.84 7.69 0.12 -1.16 128
4 Having adequate cellular (or mobile) coverage throughout campus. 7.43 8.56 7.55 0.12 -1.01 127
# Item Min Des Per Adeq Supr N
5 Having Web sites and online services that are easy to use. 7.02 8.55 7.35 0.33 -1.20 117
6 Having online services that enhance the teaching and learning experience. 7.02 8.50 7.28 0.26 -1.22 112
7 Having technology services that allow me to collaborate effectively with others. 6.96 8.39 7.24 0.29 -1.15 115
8 Having systems that provide timely access to data that informs decision making. 7.14 8.40 7.28 0.15 -1.12 102
9The availability of classrooms or meeting spaces with technology that enhances the teaching/learn-ing experience.
7.10 8.47 7.30 0.20 -1.16 116
# Item Min Des Per Adeq Supr N
10 Getting timely resolution of technology problems that I am experiencing. 7.20 8.68 7.76 0.56 -0.93 107
11 Technology support staff who have the knowledge to answer my questions. 7.41 8.70 8.03 0.62 -0.67 105
12 Receiving communications regarding technology services that I can understand. 6.98 8.37 7.73 0.75 -0.64 108
13Getting access to training or other self-help information that increases my effectiveness with technology.
6.20 7.84 6.98 0.78 -0.86 96
# Item Min Des Per Adeq Supr N
14Having information and access to new and useful instructional technologies or methods. Self- reported faculty only.
0.00 0.00 0.00 0.00 0.00 0
15Having an effective, intuitive, and reliable Learning Management System (Blackboard). Self-reported faculty, students only.
7.47 8.72 6.95 -0.51 -1.76 109
16Getting timely and helpful support for Blackboard (the WSU learning management system). Self- reported faculty, students only.
7.27 8.58 7.28 0.01 -1.30 86
Technology & Collaboration Services
Support & Training
Blackboard & Instructional Technologyfor Faculty & Students
# Item Min Des Per Adeq Supr N
20 Availability and hours for open computer labs. Self-reported students only. 6.45 7.88 7.12 0.67 -0.76 67
21Having a positive environment (cleanliness, noise, temperature, etc.) for the open computer lab (SAC 311). Self reported students only.
6.90 8.09 7.37 0.47 -0.72 68
Computer Labsfor Students
Legend: Min = Minimum Level of Service; Des = Desired Level of Service; Per = Perceived Service Quality; Adeq = Adequacy Gap Score (perceived - minimum); Supr = Superi-ority Gap Score (perceived - desired); N = Number of Observations
WSU Spokane 2017 TechQual+ Survey ReportPage 42

All Faculty(includes incomplete surveys)
Connectivity & Access
# Item Min Des Per Adeq Supr N
1 Having an Internet service that operates reliably. 8.28 8.91 7.85 -0.43 -1.05 75
2 Having an Internet service that provides adequate capacity or speed. 8.07 8.82 7.69 -0.38 -1.13 71
3 Having an Internet service that provides adequate Wi-Fi coverage. 7.99 8.86 7.06 -0.93 -1.80 71
4 Having adequate cellular (or mobile) coverage throughout campus. 7.95 8.74 6.78 -1.16 -1.96 73
# Item Min Des Per Adeq Supr N
5 Having Web sites and online services that are easy to use. 7.82 8.84 6.85 -0.97 -1.99 68
6 Having online services that enhance the teaching and learning experience. 7.71 8.69 6.58 -1.12 -2.11 65
7 Having technology services that allow me to collaborate effectively with others. 7.41 8.52 6.45 -0.95 -2.06 66
8 Having systems that provide timely access to data that informs decision making. 7.50 8.47 6.62 -0.88 -1.85 60
9The availability of classrooms or meeting spaces with technology that enhances the teaching/learn-ing experience.
7.90 8.73 6.46 -1.43 -2.27 67
# Item Min Des Per Adeq Supr N
10 Getting timely resolution of technology problems that I am experiences 7.92 8.81 7.84 -0.08 -0.97 64
11 Technology support staff who have the knowledge to answer my questions. 8.03 8.88 7.83 -0.20 -1.05 66
12 Receiving communications regarding technology services that I can understand. 7.53 8.51 7.37 -0.16 -1.15 68
13Getting access to training or other self-help information that increases my effectiveness with tech-nology.
7.39 8.31 7.00 -0.39 -1.31 64
# Item Min Des Per Adeq Supr N
14Having information and access to new and useful instructional technologies or methods. Self- reported faculty only.
7.05 8.22 6.38 -0.67 -1.84 58
15Having an effective, intuitive, and reliable Learning Management System (Blackboard). Self-reported faculty, students only.
8.00 8.80 6.67 -1.33 2.12 49
16Getting timely and helpful support for Blackboard (the WSU learning management system). Self- reported faculty, students only.
8.09 8.78 7.60 -0.49 -1.18 45
Technology & Collaboration Services
Support & Training
Blackboard & Instructional Technologyfor Faculty & Students
Legend: Min = Minimum Level of Service; Des = Desired Level of Service; Per = Perceived Service Quality; Adeq = Adequacy Gap Score (perceived - minimum); Supr = Superi-ority Gap Score (perceived - desired); N = Number of Observations
WSU Spokane 2017 TechQual+ Survey ReportPage 43

All Faculty(includes incomplete surveys)
# Item Min Des Per Adeq Supr N
17 Having access to high speed computing for research. Self-reported faculty only. 7.24 8.21 6.76 -0.47 -1.45 38
18 Having internet speed/capacity specifically in terms of research needs. Self-reported faculty only. 7.36 8.24 7.17 -0.19 -1.07 42
19 Having data storage space used specifically for research data. Self-reported faculty only. 7.40 8.33 7.12 -0.29 -1.21 42
Research Resourcesfor Faculty
Videoconferencingfor Faculty and Staff
# Item Min Des Per Adeq Supr N
22Availability of classrooms and meeting spaces with videoconferencing technology. Self-reported faculty, staff only.
7.58 8.61 7.08 -0.50 -1.53 62
23Getting timely and helpful support for videoconferencing technology in classrooms or meeting spaces. Self-reported faculty, staff only.
8.05 8.81 7.44 -0.61 -1.38 64
Legend: Min = Minimum Level of Service; Des = Desired Level of Service; Per = Perceived Service Quality; Adeq = Adequacy Gap Score (perceived - minimum); Supr = Superi-ority Gap Score (perceived - desired); N = Number of Observations
WSU Spokane 2017 TechQual+ Survey ReportPage 44

All Staff(includes incomplete surveys)
Connectivity & Access
# Item Min Des Per Adeq Supr N
1 Having an Internet service that operates reliably. 7.82 8.79 8.21 0.38 -0.58 107
2 Having an Internet service that provides adequate capacity or speed. 7.69 8.81 8.17 0.48 -0.64 107
3 Having an Internet service that provides adequate Wi-Fi coverage. 7.23 8.49 7.63 0.40 -0.86 100
4 Having adequate cellular (or mobile) coverage throughout campus. 7.20 8.49 7.56 0.36 -0.93 102
# Item Min Des Per Adeq Supr N
5 Having Web sites and online services that are easy to use. 7.13 8.51 7.17 0.04 -1.34 101
6 Having online services that enhance the teaching and learning experience. 6.90 8.33 7.27 0.37 -1.07 60
7 Having technology services that allow me to collaborate effectively with others. 7.11 8.39 7.36 0.25 -1.03 95
8 Having systems that provide timely access to data that informs decision making. 7.13 8.56 7.10 -0.02 -1.45 86
9The availability of classrooms or meeting spaces with technology that enhances the teaching/learn-ing experience.
7.16 8.54 7.23 0.06 -1.13 80
# Item Min Des Per Adeq Supr N
10 Getting timely resolution of technology problems that I am experiencing. 7.31 8.69 7.99 0.68 -0.70 97
11 Technology support staff who have the knowledge to answer my questions. 7.54 8.75 8.08 0.55 -0.67 97
12 Receiving communications regarding technology services that I can understand. 7.11 8.45 7.74 0.63 -0.72 95
13Getting access to training or other self-help information that increases my effectiveness with technology.
6.86 8.30 7.13 0.27 -1.17 92
Technology & Collaboration Services
Support & Training
Videoconferencingfor Faculty and Staff
# Item Min Des Per Adeq Supr N
22Availability of classrooms and meeting spaces with videoconferencing technology. Self-reported faculty, staff only.
6.89 8.28 7.33 0.44 -0.95 80
23Getting timely and helpful support for videoconferencing technology in classrooms or meeting spaces. Self-reported faculty, staff only.
7.42 8.57 7.40 -0.01 -1.17 84
Legend: Min = Minimum Level of Service; Des = Desired Level of Service; Per = Perceived Service Quality; Adeq = Adequacy Gap Score (perceived - minimum); Supr = Superi-ority Gap Score (perceived - desired); N = Number of Observations
WSU Spokane 2017 TechQual+ Survey ReportPage 45

WSU Spokane 2017 TechQual+ Survey ReportPage 46

B
WSU Spokane 2017 TechQual+ Survey ReportPage 47
APPENDIX BSERVICE LEVEL ANALYSIS CHARTS

Cat
ego
ry#
Item
Stud
ents
NFa
cult
yN
Staf
fN
All
N
Co
nn
ecti
vity
an
d A
cces
s
1H
avin
g an
Inte
rnet
ser
vice
tha
t op
erat
es r
elia
bly.
0.10
128
-0.4
375
0.38
107
0.09
315
2H
avin
g an
Inte
rnet
ser
vice
tha
t p
rovi
des
adeq
uate
cap
acity
or
spee
d.0.
2912
5-0
.38
710.
4810
70.
2130
7
3H
avin
g an
Inte
rnet
ser
vice
tha
t p
rovi
des
adeq
uate
Wi-F
i cov
erag
e.0.
1212
8-0
.93
710.
4010
0-0
.02
303
4H
avin
g ad
equa
te c
ellu
lar
(or
mob
ile)
cove
rage
thr
ough
out
cam
pus
.0.
1212
7-1
.16
730.
3610
2-0
.10
306
Tech
no
log
y an
d
Co
llab
ora
tio
n S
ervi
ces
5H
avin
g w
ebsi
tes
and
onlin
e se
rvic
es t
hat
are
easy
to
use.
0.33
117
-0.9
768
0.04
101
-0.0
829
1
6H
avin
g on
line
serv
ices
tha
t en
hanc
e th
e te
achi
ng a
nd le
arni
ng e
xper
ienc
e.0.
2611
2-1
.12
650.
3760
-0.0
924
0
7H
avin
g te
chno
logy
ser
vice
s th
at a
llow
me
to c
olla
bora
te e
ffect
ivel
y w
ith o
ther
s.0.
2911
5-0
.95
660.
2595
0.00
281
8H
avin
g sy
stem
s th
at p
rovi
de t
imel
y ac
cess
to
data
tha
t in
form
s de
cisi
on m
akin
g.0.
1510
2-0
.88
60-0
.02
86-0
.14
251
9Th
e av
aila
bilit
y of
cla
ssro
oms
or m
eetin
g sp
aces
with
tec
hnol
ogy
that
enh
ance
s th
e te
achi
ng a
nd le
arni
ng
exp
erie
nce.
0.20
116
-1.4
367
0.06
80-0
.25
267
Sup
po
rt a
nd
Tra
inin
g
10G
ettin
g tim
ely
reso
lutio
n of
tec
hnol
ogy
pro
blem
s th
at I
am e
xper
ienc
ing.
0.56
107
-0.0
864
0.68
970.
4727
3
11Te
chno
logy
sup
por
t st
aff w
ho h
ave
the
know
eldg
e to
ans
wer
my
que
stio
ns.
0.62
105
-0.2
066
0.55
970.
4027
3
12Re
ceiv
ing
com
mun
icat
ions
reg
ardi
ng t
echn
olog
y se
rvic
es t
hat
I can
und
erst
and.
0.75
108
-0.1
668
0.63
950.
5027
5
13G
ettin
g ac
cess
to
trai
ning
or
othe
r se
lf-he
lp in
form
atio
n th
at in
crea
ses
my
effe
ctiv
enes
s w
ith t
echn
olog
y.0.
7896
-0.3
964
0.27
920.
3025
5
Co
lor
Leg
end
:Po
siti
ve>0
Mild
Pai
n0
to -
0.49
Hig
h P
ain
-0.5
to
-0.
99Ex
trem
e Pa
in1.
0
14H
avin
g in
form
atio
n an
d ac
cess
to
new
and
use
ful i
nstr
uctio
nal t
echn
olog
ies
or m
etho
ds. S
elf-
repo
rted
fa
culty
onl
y.-0
.67
58-0
.67
58
15H
avin
g an
effe
ctiv
e, in
tuiti
ve, a
nd r
elia
ble
Lear
ning
Man
agem
nt S
yste
m (
Blac
kboa
rd).
Sel
f-re
port
ed fa
culty
an
d st
uden
ts o
nly.
-0.5
110
9-1
.33
49-0
.77
158
16G
ettin
g tim
ely
and
help
ful s
upp
ort
for
Blac
kboa
rd (
the
WSU
lear
ning
man
agem
ent
syst
em. S
elf-
repo
rted
fa
culty
and
stu
dent
s on
ly.
0.01
86-0
.49
45-0
.16
131
17H
avin
g ac
cess
to
high
sp
eed
com
put
ing
for
rese
arch
. Sel
f-re
port
ed fa
culty
onl
y.-0
.47
38-0
.47
38
18H
avin
g in
tern
et s
pee
d/ca
pac
ity s
pec
ifica
lly in
ter
ms
of r
esea
rch
need
s. S
elf-
repo
rted
facu
lty o
nly.
-0.1
942
-0.1
942
19H
avin
g da
ta s
tora
ge s
pac
e us
ed s
pec
ifica
lly fo
r re
sear
ch d
ata.
Sel
f-re
port
ed fa
culty
onl
y.-0
.29
42-0
.29
42
20Av
aila
bilit
y an
d ho
urs
for
open
com
put
er la
bs. S
elf-
repo
rted
stu
dent
s on
ly.
0.67
670.
6767
21H
avin
g a
pos
itive
env
ironm
ent
(cle
anlin
ess,
noi
se, t
emp
erat
ure,
etc
.) fo
r th
e op
en c
omp
uter
lab
(SA
C
311)
. Sel
f-re
port
ed s
tude
nts
only
.0.
4768
0.47
68
22Av
aila
bilit
y of
cla
ssro
oms
and
mee
ting
spac
es w
ith v
ideo
conf
eren
ncin
g te
chno
logy
. Sel
f-re
port
ed fa
culty
an
d st
aff o
nly.
-0
.50
620.
4480
0.03
142
23G
ettin
g tim
ely
and
help
ful s
upp
ort
for
vide
ocon
fere
ncin
g te
chno
logy
in c
lass
room
s or
mee
ting
spac
es.
Self-
repo
rted
facu
lty a
nd s
taff
only
.-0
.61
64-0
.01
84-0
.27
148
Blackboard & Instructional Tech
Research Resources
Comp.Labs
Video-conf.
WSU
Sp
oka
ne
Tech
no
log
y
2017
– S
ervi
ce A
deq
uacy
Gap
An
alys
isC
omp
aris
on o
f the
Ade
qua
cy G
ap S
core
s (p
erce
ived
-min
imum
) fo
r St
uden
ts, F
acul
ty, a
nd S
taff
WSU Spokane 2017 TechQual+ Survey ReportPage 48

Stud
ents
Facu
lty
Staf
fA
ll
Cat
ego
ry#
Item
2017
2016
2015
2 yr
∆20
1720
1620
152
yr ∆
2017
2016
2015
2 yr
∆20
1720
1620
152
yr ∆
Co
nn
ecti
vity
an
d
Acc
ess
1H
avin
g an
Inte
rnet
ser
vice
tha
t op
erat
es r
elia
bly.
0.10
0.16
0.38
-0.2
8-0
.43
0.17
0.18
-0.2
50.
380.
130.
47-0
.09
0.09
0.15
0.36
-0.2
7
2H
avin
g an
Inte
rnet
ser
vice
tha
t p
rovi
des
adeq
uate
cap
acity
or
spee
d.0.
290.
300.
52-0
.23
-0.3
80.
420.
25-0
.13
0.48
0.30
0.35
0.13
0.21
0.32
0.38
-0.1
7
3H
avin
g an
Inte
rnet
ser
vice
tha
t p
rovi
des
adeq
uate
Wi-F
i cov
erag
e.0.
12-0
.01
0.24
-0.1
2-0
.93
-0.1
0-0
.19
-0.7
40.
400.
120.
070.
33-0
.02
0.01
0.06
-0.0
8
4H
avin
g ad
equa
te c
ellu
lar
(or
mob
ile)
cove
rage
thr
ough
out
cam
pus
.0.
120.
230.
28-0
.16
-1.1
6-0
.48
-0.1
5-1
.01
0.36
-0.1
5-0
.33
0.69
-0.1
0-0
.09
-0.0
4-0
.06
Tech
no
log
y an
d
Co
llab
ora
tio
n
Serv
ices
5H
avin
g w
ebsi
tes
and
onlin
e se
rvic
es t
hat
are
easy
to
use.
0.33
0.20
0.41
-0.0
8-0
.97
0.10
-0.1
1-0
.86
0.04
-0.0
8-0
.07
0.13
-0.0
80.
070.
07-0
.15
6H
avin
g on
line
serv
ices
tha
t en
hanc
e th
e te
achi
ng a
nd le
arni
ng e
xper
ienc
e.0.
260.
520.
44-0
.18
-1.1
2-0
.32
-0.3
8-0
.74
0.37
0.05
0.49
-0.1
2-0
.09
0.12
0.22
-0.2
7
7H
avin
g te
chno
logy
ser
vice
s th
at a
llow
me
to c
olla
bora
te e
ffect
ivel
y w
ith o
ther
s.0.
290.
460.
44-0
.15
-0.9
5-0
.28
-0.5
1-0
.44
0.25
-0.0
60.
180.
070.
000.
070.
08-0
.08
8H
avin
g sy
stem
s th
at p
rovi
de t
imel
y ac
cess
to
data
tha
t in
form
s de
cisi
on m
akin
g.0.
150.
390.
31-0
.16
-0.8
8-0
.02
-0.3
0-0
.58
-0.0
2-0
.56
0.02
0.0
-0.1
4-0
.07
0.04
-0.1
8
9Th
e av
aila
bilit
y of
cla
ssro
oms
or m
eetin
g sp
aces
with
tec
hnol
ogy
that
enh
ance
s th
e te
achi
ng a
nd le
arni
ng e
xper
ienc
e.0.
200.
350.
22-0
.02
-1.4
3-0
.28
-0.9
5-0
.48
0.06
0.18
0.10
-0.0
4-0
.25
0.07
-0.1
3-0
.12
Sup
po
rt a
nd
Tr
ain
ing
10G
ettin
g tim
ely
reso
lutio
n of
tec
hnol
ogy
pro
blem
s th
at I
am e
xper
ienc
ing.
0.56
0.62
0.44
0.12
-0.0
80.
390.
01-0
.09
0.68
0.33
0.35
0.33
0.47
0.45
0.27
0.20
11Te
chno
logy
sup
por
t st
aff w
ho h
ave
the
know
eldg
e to
ans
wer
my
que
stio
ns.
0.62
0.82
0.81
-0.1
9-0
.20
0.23
0.06
-0.2
60.
550.
040.
110.
440.
400.
360.
350.
05
12Re
ceiv
ing
com
mun
icat
ions
reg
ardi
ng t
echn
olog
y se
rvic
es t
hat
I can
und
erst
and.
0.75
1.04
0.69
-0.0
6-0
.16
0.52
0.15
-0.3
10.
630.
410.
350.
280.
500.
660.
410.
09
13G
ettin
g ac
cess
to
trai
ning
or
othe
r se
lf-he
lp in
form
atio
n th
at in
crea
ses
my
effe
ctiv
enes
s w
ith t
echn
olog
y.0.
780.
860.
28-0
.50
-0.3
90.
490.
28-0
.67
0.27
-0.0
10.
210.
060.
300.
390.
250.
05
2017
v. 2
016
v. 2
015
– Se
rvic
e A
deq
uacy
Gap
An
alys
isYe
ar-t
o-Ye
ar C
omp
aris
on o
f the
Ade
qua
cy G
ap S
core
s (p
erce
ived
-min
imum
) fo
r St
uden
ts, F
acul
ty, a
nd S
taff
WSU Spokane 2017 TechQual+ Survey ReportPage 49
Co
lor
Leg
end
:Po
siti
ve>0
Mild
Pai
n0
to -
0.49
Hig
h P
ain
-0.5
to
-0.
99Ex
trem
e Pa
in1.
0

Cat
ego
ry#
Item
Stud
ents
NFa
cult
yN
Staf
fN
All
N
Co
nn
ecti
vity
an
d A
cces
s
1H
avin
g an
Inte
rnet
ser
vice
tha
t op
erat
es r
elia
bly.
-1.2
512
8-1
.05
75-0
.58
107
-0.9
631
5
2H
avin
g an
Inte
rnet
ser
vice
tha
t p
rovi
des
adeq
uate
cap
acity
or
spee
d.-1
.02
125
-1.1
371
-0.6
410
7-0
.90
307
3H
avin
g an
Inte
rnet
ser
vice
tha
t p
rovi
des
adeq
uate
Wi-F
i cov
erag
e.-1
.16
128
-1.8
071
-0.8
610
0-1
.18
303
4H
avin
g ad
equa
te c
ellu
lar
(or
mob
ile)
cove
rage
thr
ough
out
cam
pus
.-1
.01
127
-1.9
673
0.93
102
-1.2
130
6
Tech
no
log
y an
d
Co
llab
ora
tio
n S
ervi
ces
5H
avin
g w
ebsi
tes
and
onlin
e se
rvic
es t
hat
are
easy
to
use.
-1.2
011
7-1
.99
68-1
.34
101
-1.4
229
1
6H
avin
g on
line
serv
ices
tha
t en
hanc
e th
e te
achi
ng a
nd le
arni
ng e
xper
ienc
e.-1
.22
112
-2.1
165
-1.0
760
-1.4
324
0
7H
avin
g te
chno
logy
ser
vice
s th
at a
llow
me
to c
olla
bora
te e
ffect
ivel
y w
ith o
ther
s.-1
.15
115
-2.0
666
-1.0
395
-1.3
028
1
8H
avin
g sy
stem
s th
at p
rovi
de t
imel
y ac
cess
to
data
tha
t in
form
s de
cisi
on m
akin
g.-1
.12
102
-1.8
560
-1.4
586
-1.3
925
1
9Th
e av
aila
bilit
y of
cla
ssro
oms
or m
eetin
g sp
aces
with
tec
hnol
ogy
that
enh
ance
s th
e te
achi
ng a
nd le
arni
ng
exp
erie
nce.
-1.1
611
6-2
.27
67-1
.13
80-1
.48
267
Sup
po
rt a
nd
Tra
inin
g
10G
ettin
g tim
ely
reso
lutio
n of
tec
hnol
ogy
pro
blem
s th
at I
am e
xper
ienc
ing.
-0.9
310
7-0
.97
64-0
.70
97-0
.84
273
11Te
chno
logy
sup
por
t st
aff w
ho h
ave
the
know
eldg
e to
ans
wer
my
que
stio
ns.
-0.6
710
5-1
.05
66-0
.67
97-0
.75
273
12Re
ceiv
ing
com
mun
icat
ions
reg
ardi
ng t
echn
olog
y se
rvic
es t
hat
I can
und
erst
and.
-0.6
410
8-1
.15
68-0
.72
95-0
.78
275
13G
ettin
g ac
cess
to
trai
ning
or
othe
r se
lf-he
lp in
form
atio
n th
at in
crea
ses
my
effe
ctiv
enes
s w
ith t
echn
olog
y.-0
.86
96-1
.31
64-1
.17
92-1
.08
255
14H
avin
g in
form
atio
n an
d ac
cess
to
new
and
use
ful i
nstr
uctio
nal t
echn
olog
ies
or m
etho
ds. S
elf-
repo
rted
fa
culty
onl
y.-1
.84
58-1
.84
58
15H
avin
g an
effe
ctiv
e, in
tuiti
ve, a
nd r
elia
ble
Lear
ning
Man
agem
nt S
yste
m (
Blac
kboa
rd).
Sel
f-re
port
ed fa
culty
an
d st
uden
ts o
nly.
-1.7
610
9-2
.12
49-1
.87
158
16G
ettin
g tim
ely
and
help
ful s
upp
ort
for
Blac
kboa
rd (
the
WSU
lear
ning
man
agem
ent
syst
em. S
elf-
repo
rted
fa
culty
and
stu
dent
s on
ly.
-1.3
086
-1.1
845
-1.2
613
1
17H
avin
g ac
cess
to
high
sp
eed
com
put
ing
for
rese
arch
. Sel
f-re
port
ed fa
culty
onl
y.-1
.45
38-1
.45
38
18H
avin
g in
tern
et s
pee
d/ca
pac
ity s
pec
ifica
lly in
ter
ms
of r
esea
rch
need
s. S
elf-
repo
rted
facu
lty o
nly.
-1.0
742
-1.0
742
19H
avin
g da
ta s
tora
ge s
pac
e us
ed s
pec
ifica
lly fo
r re
sear
ch d
ata.
Sel
f-re
port
ed fa
culty
onl
y.-1
.21
42-1
.21
42
20Av
aila
bilit
y an
d ho
urs
for
open
com
put
er la
bs. S
elf-
repo
rted
stu
dent
s on
ly.
-0.7
667
-0.7
667
21H
avin
g a
pos
itive
env
ironm
ent
(cle
anlin
ess,
noi
se, t
emp
erat
ure,
etc
.) fo
r th
e op
en c
omp
uter
lab
(SA
C
311)
. Sel
f-re
port
ed s
tude
nts
only
.-0
.72
68-0
.72
68
22Av
aila
bilit
y of
cla
ssro
oms
and
mee
ting
spac
es w
ith v
ideo
conf
eren
ncin
g te
chno
logy
. Sel
f-re
port
ed fa
culty
an
d st
aff o
nly.
-1
.53
62-0
.95
80-1
.20
142
23G
ettin
g tim
ely
and
help
ful s
upp
ort
for
vide
ocon
fere
ncin
g te
chno
logy
in c
lass
room
s or
mee
ting
spac
es.
Self-
repo
rted
facu
lty a
nd s
taff
only
.-1
.38
64-1
.17
84-1
.26
148
Blackboard & Instructional Tech
Research Resources
Comp.Labs
Video-conf.
WSU
Sp
oka
ne
Tech
no
log
y
2017
– S
uper
iori
ty G
ap A
nal
ysis
Com
par
ison
of t
he S
uper
iorit
y G
ap S
core
s (d
esire
d-m
inim
um)
for
Stud
ents
, Fac
ulty
, and
Sta
ff
WSU Spokane 2017 TechQual+ Survey ReportPage 50
Co
lor
Leg
end
:M
inim
al0
to -
1.0
Smal
l Gap
-1.0
to
-2.
0La
rge
Gap
-2.0
to
-3.
0Ex
trem
e G
ap>
-3.0

Stud
ents
Facu
lty
Staf
fA
ll
Cat
ego
ry#
Item
2017
2016
2015
2 yr
∆20
1720
1620
152
yr ∆
2017
2016
2015
2 yr
∆20
1720
1620
152
yr ∆
Co
nn
ecti
vity
an
d A
cces
s
1H
avin
g an
Inte
rnet
ser
vice
tha
t op
erat
es r
elia
bly.
-1.2
5-1
.58
-1.1
10.
14-1
.05
-0.8
9-0
.78
-0.2
7-0
.58
-1.0
0-0
.63
-0.0
5-0
.96
-1.1
8-0
.86
-0.1
0
2H
avin
g an
Inte
rnet
ser
vice
tha
t p
rovi
des
adeq
uate
cap
acity
or
spee
d.-1
.02
-1.4
3-1
.01
0.01
-1.1
3-0
.80
-0.7
8-0
.35
-0.6
4-0
.94
-0.7
6-0
.12
-0.9
0-1
.08
-0.8
6-0
.04
3H
avin
g an
Inte
rnet
ser
vice
tha
t p
rovi
des
adeq
uate
Wi-F
i cov
erag
e.-1
.16
-1.5
7-1
.12
0.04
-1.8
0-1
.23
-1.3
7-0
.43
-0.8
6-1
.33
-1.2
90.
43-1
.18
-1.3
8-1
.26
0.08
4H
avin
g ad
equa
te c
ellu
lar
(or
mob
ile)
cove
rage
thr
ough
out
cam
pus
.-1
.01
-1.4
7-1
.34
0.33
-1.9
6-1
.68
-1.2
5-0
.71
-0.9
3-1
.52
-1.5
60.
63-1
.21
-1.5
4-1
.39
0.18
Tech
no
log
y an
d
Co
llab
ora
tio
n
Serv
ices
5H
avin
g w
ebsi
tes
and
onlin
e se
rvic
es t
hat
are
easy
to
use.
-1.2
0-1
.66
-1.2
70.
07-1
.99
-1.3
6-1
.59
-0.4
0-1
.34
-1.4
4-1
.44
0.10
-1.4
2-1
.51
-1.4
30.
01
6H
avin
g on
line
serv
ices
tha
t en
hanc
e th
e te
achi
ng a
nd le
arni
ng
exp
erie
nce.
-1.2
2-1
.28
-1.1
5-0
.07
-2.1
1-1
.68
-1.7
0-0
.41
-1.0
7-1
.33
-0.8
7-0
.20
-1.4
3-1
.42
-1.2
2-0
.21
7H
avin
g te
chno
logy
ser
vice
s th
at a
llow
me
to c
olla
bora
te e
ffect
ivel
y w
ith o
ther
s.-1
.15
-1.2
7-1
.18
0.03
-2.0
6-1
.72
-1.7
8-0
.28
-1.0
3-1
.33
-1.1
20.
09-1
.30
-1.4
1-1
.32
0.02
8H
avin
g sy
stem
s th
at p
rovi
de t
imel
y ac
cess
to
data
tha
t in
form
s de
cisi
on m
akin
g.-1
.12
-1.2
2-1
.08
-0.0
4-1
.85
-1.2
7-1
.53
-0.3
2-1
.45
-1.6
6-1
.16
-0.2
9-1
.39
-1.4
0-1
.23
-0.1
6
9Th
e av
aila
bilit
y of
cla
ssro
oms
or m
eetin
g sp
aces
with
tec
hnol
ogy
that
enh
ance
s th
e te
achi
ng a
nd le
arni
ng e
xper
ienc
e.-1
.16
-1.3
1-1
.39
0.23
-2.2
7-1
.78
-2.0
3-0
.24
-1.3
1-1
.19
-1.0
8-0
.23
-1.4
8-1
.40
-1.4
6-0
.02
Sup
po
rt a
nd
Tr
ain
ing
10G
ettin
g tim
ely
reso
lutio
n of
tec
hnol
ogy
pro
blem
s th
at I
am
exp
erie
ncin
g.-0
.93
-0.8
7-0
.97
0.04
-0.9
7-0
.80
-1.1
40.
17-0
.70
-1.0
4-0
.91
-0.2
1-0
.84
-0.9
2-1
.01
0.15
11Te
chno
logy
sup
por
t st
aff w
ho h
ave
the
know
eldg
e to
ans
wer
my
que
stio
ns.
-0.6
7-0
.55
-0.3
9-0
.28
-1.0
5-0
.81
-1.0
4-0
.01
-0.6
7-1
.04
-1.1
30.
46-0
.75
-0.8
0-0
.84
0.09
12Re
ceiv
ing
com
mun
icat
ions
reg
ardi
ng t
echn
olog
y se
rvic
es t
hat
I can
un
ders
tand
.-0
.64
-0.5
1-0
.59
-0.0
5-1
.15
-0.8
6-1
.11
-.04
-0.7
2-0
.86
-0.9
00.
18-0
.78
-0.7
5-0
.85
0.07
13G
ettin
g ac
cess
to
trai
ning
or
othe
r se
lf-he
lp in
form
atio
n th
at
incr
ease
s m
y ef
fect
iven
ess
with
tec
hnol
ogy.
-0.8
6-0
.76
-1.1
1-0
.75
-1.3
1-1
.07
-1.1
6-0
.15
-1.1
7-1
.59
-1.2
50.
08-1
.08
-1.2
0-1
.17
0.09
Co
lor
Leg
end
:M
inim
al0
to -
1.0
Smal
l Gap
-1.0
to
-2.
0La
rge
Gap
-2.0
to
-3.
0Ex
trem
e G
ap>
-3.0
2017
v. 2
016
v. 2
015
– Su
per
iori
ty G
ap A
nal
ysis
Year
-to-
Year
Com
par
ison
of t
he S
uper
iorit
y G
ap S
core
s (d
esire
d-m
inim
um)
for
Stud
ents
, Fac
ulty
, and
Sta
ff
WSU Spokane 2017 TechQual+ Survey ReportPage 51

Cat
ego
ry#
Item
Stud
ents
Facu
lty
Staf
fA
ll
Min
Rank
Des
Rank
NM
inRa
nkD
esRa
nkN
Min
Rank
Des
Rank
NM
inRa
nkD
esRa
nkN
Co
nn
ecti
vity
an
d
Acc
ess
1H
avin
g an
Inte
rnet
ser
vice
tha
t op
erat
es r
elia
bly.
7.52
28.
871
128
8.28
18.
911
757.
821
8.79
110
77.
811
8.85
131
5
2H
avin
g an
Inte
rnet
ser
vice
tha
t p
rovi
des
adeq
uate
cap
acity
or
spee
d.7.
483
8.78
312
58.
073
8.82
571
7.69
28.
1713
107
7.70
28.
802
307
3H
avin
g an
Inte
rnet
ser
vice
tha
t p
rovi
des
adeq
uate
Wi-F
i cov
erag
e.7.
571
8.84
212
87.
996
8.86
371
7.23
67.
6314
100
7.55
68.
725
303
4H
avin
g ad
equa
te c
ellu
lar
(or
mob
ile)
cove
rage
thr
ough
out
cam
pus
.7.
435
8.56
812
77.
957
8.74
973
7.20
77.
5615
102
7.48
78.
598
306
Tech
no
log
y an
d
Co
llab
ora
tio
n
Serv
ices
5H
avin
g w
ebsi
tes
and
onlin
e se
rvic
es t
hat
are
easy
to
use.
7.02
118.
559
117
7.82
108.
844
687.
138
8.51
710
17.
2412
8.59
829
1
6H
avin
g on
line
serv
ices
tha
t en
hanc
e th
e te
achi
ng a
nd le
arni
ng e
xper
ienc
e.7.
0211
8.50
1011
27.
7111
8.69
1165
6.90
118.
3310
607.
1614
8.50
1024
0
7H
avin
g te
chno
logy
ser
vice
s th
at a
llow
me
to c
olla
bora
te e
ffect
ivel
y w
ith o
ther
s.6.
9613
8.39
1311
57.
4115
8.52
1366
7.11
108.
399
957.
1316
8.43
1228
1
8H
avin
g sy
stem
s th
at p
rovi
de t
imel
y ac
cess
to
data
tha
t in
form
s de
cisi
on m
akin
g.7.
149
8.40
1210
27.
5014
8.47
1560
7.13
98.
565
867.
2313
8.48
1125
1
9Th
e av
aila
bilit
y of
cla
ssro
oms
or m
eetin
g sp
aces
with
tec
hnol
ogy
that
enh
ance
s th
e te
achi
ng a
nd le
arni
ng e
xper
ienc
e.7.
1010
8.47
1111
67.
909
8.73
1067
7.16
88.
546
807.
3211
8.55
926
7
14H
avin
g in
form
atio
n an
d ac
cess
to
new
and
use
ful i
nstr
uctio
nal t
echn
olog
ies
or
met
hods
. Sel
f-re
port
ed fa
culty
onl
y7.
0520
8.22
1958
7.05
178.
2216
58
15H
avin
g an
effe
ctiv
e, in
tuiti
ve, a
nd r
elia
ble
Lear
ning
Man
agem
nt S
yste
m (
Blac
k-bo
ard)
. Sel
f-re
port
ed fa
culty
and
stu
dent
s on
ly.
7.47
48.
724
109
8.00
58.
807
497.
634
8.74
415
8
16G
ettin
g tim
ely
and
help
ful s
upp
ort
for
Blac
kboa
rd (
the
WSU
lear
ning
man
agem
ent
syst
em. S
elf-
repo
rted
facu
lty a
nd s
tude
nts
only
.7.
277
8.58
786
8.09
28.
788
457.
556
8.65
713
1
17H
avin
g ac
cess
to
high
sp
eed
com
put
ing
for
rese
arch
. Sel
f-re
port
ed fa
culty
onl
y.7.
2419
8.21
2038
7.24
128.
2117
38
18H
avin
g in
tern
et s
pee
d/ca
pac
ity s
pec
ifica
lly in
ter
ms
of r
esea
rch
need
s. S
elf-
repo
rted
fa
culty
onl
y.7.
3618
8.24
1842
7.36
108.
2415
42
19H
avin
g da
ta s
tora
ge s
pac
e us
ed s
pec
ifica
lly fo
r re
sear
ch d
ata.
Sel
f-re
port
ed fa
culty
on
ly.
7.40
168.
3316
427.
409
8.33
1442
20Av
aila
bilit
y an
d ho
urs
for
open
com
put
er la
bs. S
elf-
repo
rted
stu
dent
s on
ly.
6.45
157.
8816
676.
4520
7.88
2067
21H
avin
g a
pos
itive
env
ironm
ent
(cle
anlin
ess,
noi
se, t
emp
erat
ure,
etc
.) fo
r th
e op
en
com
put
er la
b (S
AC
311
). S
elf-
repo
rted
stu
dent
s on
ly.
6.90
148.
0915
686.
9018
8.09
1968
22Av
aila
bilit
y of
cla
ssro
oms
and
mee
ting
spac
es w
ith v
ideo
conf
eren
ncin
g te
chno
logy
. Se
lf-re
port
ed fa
culty
and
sta
ff on
ly.
7.58
128.
6112
626.
8912
8.28
1280
7.19
148.
4213
142
23G
ettin
g tim
ely
and
help
ful s
upp
ort
for
vide
ocon
fere
ncin
g te
chno
logy
in c
lass
room
s or
mee
ting
spac
es. S
elf-
repo
rted
facu
lty a
nd s
taff
only
.8.
054
8.81
664
7.42
48.
574
847.
693
8.68
614
8
Co
lor
Leg
end
Top
34-
6
Blackboard & Instructional Tech
Research Resources
Comp.Labs Video-conf.
WSU
Sp
oka
ne
Tech
no
log
y
Sup
po
rt a
nd
Tra
inin
g
10G
ettin
g tim
ely
reso
lutio
n of
tec
hnol
ogy
pro
blem
s th
at I
am e
xper
ienc
ing.
7.20
88.
686
107
7.92
88.
816
647.
315
8.69
397
7.41
88.
725
273
11Te
chno
logy
sup
por
t st
aff w
ho h
ave
the
know
eldg
e to
ans
wer
my
que
stio
ns.
7.41
68.
705
105
8.03
58.
882
667.
543
8.75
297
7.61
58.
763
273
12Re
ceiv
ing
com
mun
icat
ions
reg
ardi
ng t
echn
olog
y se
rvic
es t
hat
I can
und
erst
and.
6.98
128.
3714
108
7.53
138.
5114
687.
1110
8.45
899
57.
1515
8.43
1227
5
13G
ettin
g ac
cess
to
trai
ning
or
othe
r se
lf-he
lp in
form
atio
n th
at in
crea
ses
my
effe
ctiv
e-ne
ss w
ith t
echn
olog
y.6.
2016
7.84
1796
7.39
178.
3117
646.
8613
8.30
1192
6.73
198.
1118
255
2017
– M
inim
um a
nd
Des
ired
Ser
vice
Lev
el R
anki
ng
sSe
rvic
e Le
vels
(m
inim
um a
nd d
esire
d) fo
r St
uden
ts, F
acul
ty, a
nd S
taff
(Top
6 h
ighl
ight
ed)
WSU Spokane 2017 TechQual+ Survey ReportPage 52

Stud
ents
Facu
lty
Staf
fA
ll
Nee
dW
ant
Nee
dW
ant
Nee
dW
ant
Nee
dW
ant
Cat
ego
ry#
Item
2017
M
in20
17
Ran
k20
16
Ran
k20
15
Ran
k20
17
Des
2017
R
ank
2016
R
ank
2015
R
ank
2017
M
in20
17
Ran
k20
16
Ran
k20
15
Ran
k20
17
Des
2017
R
ank
2016
R
ank
2015
R
ank
2017
M
in20
17
Ran
k20
16
Ran
k20
15
Ran
k20
17
Des
2017
R
ank
2016
R
ank
2015
R
ank
2017
M
in20
17
Ran
k20
16
Ran
k20
15
Ran
k20
17
Des
2017
R
ank
2016
R
ank
2015
R
ank
Co
nn
ecti
vity
an
d A
cces
s
1H
avin
g an
Inte
rnet
ser
vice
tha
t op
erat
es r
elia
bly.
7.52
23
31
128
21
8.28
12
18.
911
11
7.82
11
18.
791
11
7.81
11
18.
851
11
2H
avin
g an
Inte
rnet
ser
vice
tha
t p
rovi
des
adeq
uate
cap
acity
or
spee
d.7.
483
54
312
53
38.
073
33
8.82
53
37.
692
23
8.17
132
37.
702
32
8.80
22
2
3H
avin
g an
Inte
rnet
ser
vice
tha
t p
rovi
des
adeq
uate
Wi-F
i cov
erag
e.7.
571
11
212
81
27.
996
47
8.86
38
67.
236
68
7.63
146
87.
556
43
8.72
53
2
4H
avin
g ad
equa
te c
ellu
lar
(or
mob
ile)
cove
rage
thr
ough
out
cam
pus
.7.
435
69
812
74
77.
957
85
8.74
91
87.
207
57
7.56
155
77.
487
75
8.59
86
6
Tech
no
log
y an
d
Co
llab
ora
tio
n
Serv
ices
5H
avin
g w
ebsi
tes
and
onlin
e se
rvic
es t
hat
are
easy
to
use.
7.02
118
108.
559
58
7.82
1011
128.
844
106
7.13
88
108.
517
96
7.24
1210
68.
598
78
6H
avin
g on
line
serv
ices
tha
t en
hanc
e th
e te
achi
ng a
nd le
arni
ng
exp
erie
nce.
7.02
1112
118.
5010
910
7.71
117
88.
6911
45
6.90
119
138.
3310
1013
7.16
1410
108.
5010
1012
7H
avin
g te
chno
logy
ser
vice
s th
at a
llow
me
to c
olla
bora
te e
ffect
ivel
y w
ith o
ther
s.6.
9613
1112
8.39
1310
107.
4115
99
8.52
139
97.
1110
129
8.39
97
117.
1316
88
8.43
129
10
8H
avin
g sy
stem
s th
at p
rovi
de t
imel
y ac
cess
to
data
tha
t in
form
s de
cisi
on m
akin
g.7.
149
75
8.40
128
57.
5014
1011
8.47
1511
117.
139
105
8.56
54
87.
2313
612
8.48
117
7
9Th
e av
aila
bilit
y of
cla
ssro
oms
or m
eetin
g sp
aces
with
tec
hnol
ogy
that
enh
ance
s th
e te
achi
ng a
nd le
arni
ng e
xper
ienc
e.7.
1010
98
8.47
1111
127.
909
59
8.73
104
97.
168
106
8.54
612
97.
3211
911
8.55
911
8
Sup
po
rtan
d T
rain
ing
10G
ettin
g tim
ely
reso
lutio
n of
tec
hnol
ogy
pro
blem
s th
at I
am
exp
erie
ncin
g.7.
208
46
8.68
67
67.
928
64
8.81
66
47.
315
44
8.69
35
47.
418
54
8.72
55
5
11Te
chno
logy
sup
por
t st
aff w
ho h
ave
the
know
eldg
e to
ans
wer
my
que
stio
ns.
7.41
62
28.
705
54
8.03
51
28.
882
22
7.54
33
28.
752
310
7.61
52
28.
763
44
12Re
ceiv
ing
com
mun
icat
ions
reg
ardi
ng t
echn
olog
y se
rvic
es t
hat
I ca
n un
ders
tand
.6.
9812
107
8.37
1412
97.
5313
1211
8.51
1412
127.
1110
311
8.45
811
107.
1515
129
8.43
1212
10
13G
ettin
g ac
cess
to
trai
ning
or
othe
r se
lf-he
lp in
form
atio
n th
at
incr
ease
s m
y ef
fect
iven
ess
with
tec
hnol
ogy.
6.20
1613
137.
8417
1313
7.39
1713
138.
3117
1313
6.86
1313
148.
3011
1313
6.73
1913
138.
1118
1313
Co
lor
Leg
end
Top
34-
6
2017
v. 2
016
v. 2
015
– M
inim
um a
nd
Des
ired
Ser
vice
Lev
el R
anki
ng
sYe
ar-t
o-Ye
ar C
omp
aris
on o
f the
Ser
vice
Lev
els
(min
imum
and
des
ired)
for
Stud
ents
, Fac
ulty
, and
Sta
ff
WSU Spokane 2017 TechQual+ Survey ReportPage 53
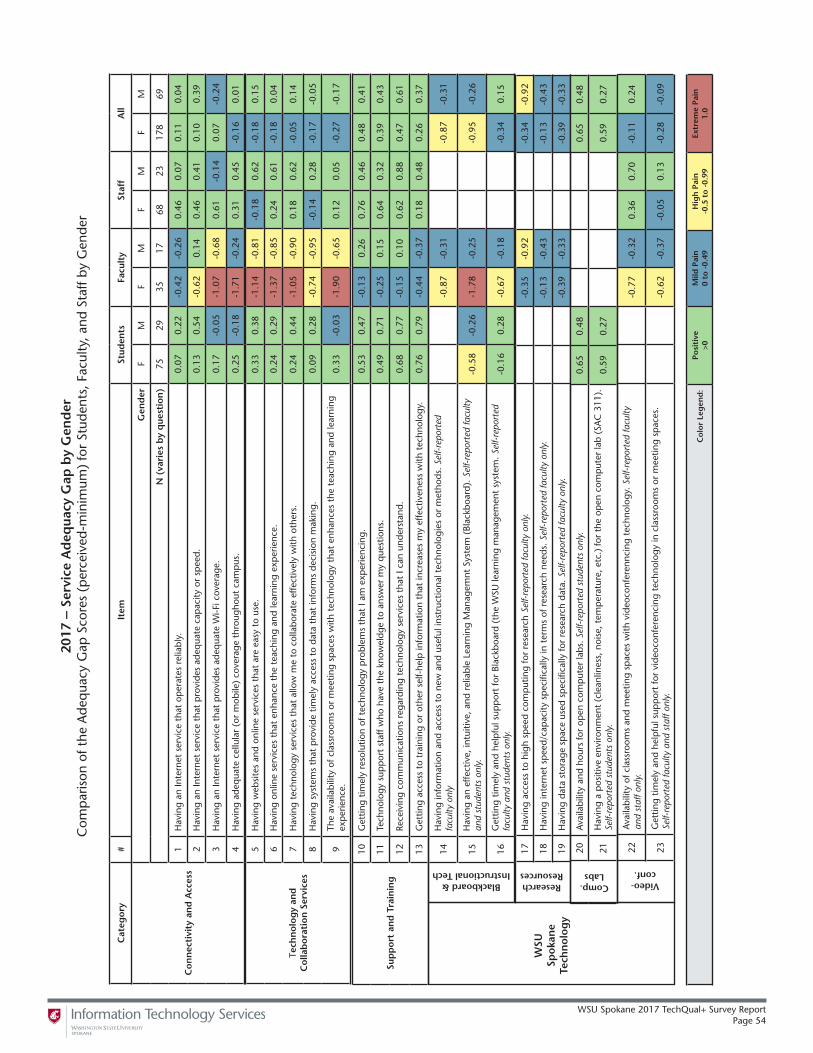
Cat
ego
ry#
Item
Stud
ents
Facu
lty
Staf
fA
ll
Co
nn
ecti
vity
an
d A
cces
s
Gen
der
FM
FM
FM
FM
N (
vari
es b
y q
uest
ion
)75
2935
1768
2317
869
1H
avin
g an
Inte
rnet
ser
vice
tha
t op
erat
es r
elia
bly.
0.07
0.22
-0.4
2-0
.26
0.46
0.07
0.11
0.04
2H
avin
g an
Inte
rnet
ser
vice
tha
t p
rovi
des
adeq
uate
cap
acity
or
spee
d.0.
130.
54-0
.62
0.14
0.46
0.41
0.10
0.39
3H
avin
g an
Inte
rnet
ser
vice
tha
t p
rovi
des
adeq
uate
Wi-F
i cov
erag
e.0.
17-0
.05
-1.0
7-0
.68
0.61
-0.1
40.
07-0
.24
4H
avin
g ad
equa
te c
ellu
lar
(or
mob
ile)
cove
rage
thr
ough
out
cam
pus
.0.
25-0
.18
-1.7
1-0
.24
0.31
0.45
-0.1
60.
01
Tech
no
log
y an
d
Co
llab
ora
tio
n S
ervi
ces
5H
avin
g w
ebsi
tes
and
onlin
e se
rvic
es t
hat
are
easy
to
use.
0.33
0.38
-1.1
4-0
.81
-0.1
80.
62-0
.18
0.15
6H
avin
g on
line
serv
ices
tha
t en
hanc
e th
e te
achi
ng a
nd le
arni
ng e
xper
ienc
e.0.
240.
29-1
.37
-0.8
50.
240.
61-0
.18
0.04
7H
avin
g te
chno
logy
ser
vice
s th
at a
llow
me
to c
olla
bora
te e
ffect
ivel
y w
ith o
ther
s.0.
240.
44-1
.05
-0.9
00.
180.
62-0
.05
0.14
8H
avin
g sy
stem
s th
at p
rovi
de t
imel
y ac
cess
to
data
tha
t in
form
s de
cisi
on m
akin
g.0.
090.
28-0
.74
-0.9
5-0
.14
0.28
-0.1
7-0
.05
9Th
e av
aila
bilit
y of
cla
ssro
oms
or m
eetin
g sp
aces
with
tec
hnol
ogy
that
enh
ance
s th
e te
achi
ng a
nd le
arni
ng
exp
erie
nce.
0.33
-0.0
3-1
.90
-0.6
50.
120.
05-0
.27
-0.1
7
Sup
po
rt a
nd
Tra
inin
g
10G
ettin
g tim
ely
reso
lutio
n of
tec
hnol
ogy
pro
blem
s th
at I
am e
xper
ienc
ing.
0.53
0.47
-0.1
30.
260.
760.
460.
480.
41
11Te
chno
logy
sup
por
t st
aff w
ho h
ave
the
know
eldg
e to
ans
wer
my
que
stio
ns.
0.49
0.71
-0.2
50.
150.
640.
320.
390.
43
12Re
ceiv
ing
com
mun
icat
ions
reg
ardi
ng t
echn
olog
y se
rvic
es t
hat
I can
und
erst
and.
0.68
0.77
-0.1
50.
100.
620.
880.
470.
61
13G
ettin
g ac
cess
to
trai
ning
or
othe
r se
lf-he
lp in
form
atio
n th
at in
crea
ses
my
effe
ctiv
enes
s w
ith t
echn
olog
y.0.
760.
79-0
.44
-0.3
70.
180.
480.
260.
37
14H
avin
g in
form
atio
n an
d ac
cess
to
new
and
use
ful i
nstr
uctio
nal t
echn
olog
ies
or m
etho
ds. S
elf-
repo
rted
fa
culty
onl
y-0
.87
-0.3
1-0
.87
-0.3
1
15H
avin
g an
effe
ctiv
e, in
tuiti
ve, a
nd r
elia
ble
Lear
ning
Man
agem
nt S
yste
m (
Blac
kboa
rd).
Sel
f-re
port
ed fa
culty
an
d st
uden
ts o
nly.
-0.5
8-0
.26
-1.7
8-0
.25
-0.9
5-0
.26
16G
ettin
g tim
ely
and
help
ful s
upp
ort
for
Blac
kboa
rd (
the
WSU
lear
ning
man
agem
ent
syst
em. S
elf-
repo
rted
fa
culty
and
stu
dent
s on
ly.
-0.1
60.
28-0
.67
-0.1
8-0
.34
0.15
Blackboard & Instructional Tech
17H
avin
g ac
cess
to
high
sp
eed
com
put
ing
for
rese
arch
Sel
f-re
port
ed fa
culty
onl
y.-0
.35
-0.9
2-0
.34
-0.9
2
18H
avin
g in
tern
et s
pee
d/ca
pac
ity s
pec
ifica
lly in
ter
ms
of r
esea
rch
need
s. S
elf-
repo
rted
facu
lty o
nly.
-0.1
3-0
.43
-0.1
3-0
.43
19H
avin
g da
ta s
tora
ge s
pac
e us
ed s
pec
ifica
lly fo
r re
sear
ch d
ata.
Sel
f-re
port
ed fa
culty
onl
y.-0
.39
-0.3
3-0
.39
-0.3
3
Research Resources
20Av
aila
bilit
y an
d ho
urs
for
open
com
put
er la
bs. S
elf-
repo
rted
stu
dent
s on
ly.
0.65
0.48
0.65
0.48
21H
avin
g a
pos
itive
env
ironm
ent
(cle
anlin
ess,
noi
se, t
emp
erat
ure,
etc
.) fo
r th
e op
en c
omp
uter
lab
(SA
C 3
11).
Se
lf-re
port
ed s
tude
nts
only
.0.
590.
270.
590.
27
Comp.Labs
22Av
aila
bilit
y of
cla
ssro
oms
and
mee
ting
spac
es w
ith v
ideo
conf
eren
ncin
g te
chno
logy
. Sel
f-re
port
ed fa
culty
an
d st
aff o
nly.
-0
.77
-0.3
20.
360.
70-0
.11
0.24
23G
ettin
g tim
ely
and
help
ful s
upp
ort
for
vide
ocon
fere
ncin
g te
chno
logy
in c
lass
room
s or
mee
ting
spac
es.
Self-
repo
rted
facu
lty a
nd s
taff
only
.-0
.62
-0.3
7-0
.05
0.13
-0.2
8-0
.09
Video-conf.
WSU
Sp
oka
ne
Tech
no
log
y
2017
– S
ervi
ce A
deq
uacy
Gap
by
Gen
der
Com
par
ison
of t
he A
deq
uacy
Gap
Sco
res
(per
ceiv
ed-m
inim
um)
for
Stud
ents
, Fac
ulty
, and
Sta
ff by
Gen
der
WSU Spokane 2017 TechQual+ Survey ReportPage 54
Co
lor
Leg
end
:Po
siti
ve>0
Mild
Pai
n0
to -
0.49
Hig
h P
ain
-0.5
to
-0.
99Ex
trem
e Pa
in1.
0

Item
Stud
ents
Facu
lty
Staf
f
Gen
der
F
FF
Dif
fM
MM
Dif
fF
FF
Dif
fM
MM
Dif
fF
FF
Dif
fM
MM
Dif
f
Cat
ego
ry#
2017
2016
2015
2017
2016
2015
2017
2016
2015
2017
2016
2015
2017
2016
2015
2017
2016
2015
N (
vari
es b
y q
uest
ion
7568
7229
3440
3539
4017
2531
6862
7023
4031
Co
nn
ec-
tivi
ty a
nd
A
cces
s
1H
avin
g an
Inte
rnet
ser
vice
tha
t op
erat
es r
elia
bly.
0.07
0.21
0.28
-0.2
10.
220.
290.
55-0
.33
-0.4
20.
130.
08-0
.50
-0.2
60.
400.
45-0
.66
0.46
-0.0
80.
39-0
.07
0.07
0.33
0.74
-0.6
7
2H
avin
g an
Inte
rnet
ser
vice
tha
t p
rovi
des
adeq
uate
ca
pac
ity o
r sp
eed.
0.13
0.49
0.35
-0.2
20.
540.
120.
84-0
.30
-0.6
20.
130.
15-0
.77
0.14
0.96
0.57
-0.4
30.
460.
110.
50-0
.04
0.41
0.54
0.23
0.18
3H
avin
g an
Inte
rnet
ser
vice
tha
t p
rovi
des
adeq
uate
W
i-Fi c
over
age.
0.17
0.02
0.13
0.04
-0.0
50.
060.
55-0
.60
-1.0
7-0
.21
-0.2
5-0
.82
-0.6
8-0
.04
0.19
-0.8
70.
61-0
.17
0.12
0.49
-0.1
40.
470.
07-0
.21
4H
avin
g ad
equa
te c
ellu
lar
(or
mob
ile)
cove
rage
th
roug
hout
cam
pus
.0.
250.
320.
040.
21-0
.18
0.50
0.68
-0.8
6-1
.71
-0.7
90.
03-1
.74
-0.2
40.
170.
00-0
.24
0.31
0.02
-0.3
60.
670.
45-0
.78
-0.1
70.
62
Tech
no
log
y an
d
Co
llab
-o
rati
on
Se
rvic
es
5H
avin
g w
ebsi
tes
and
onlin
e se
rvic
es t
hat
are
easy
to
use
.0.
330.
220.
270.
060.
380.
550.
67-0
.29
-1.1
40.
32-0
.16
-0.9
8-0
.81
-0.1
60.
44-1
.25
-0.1
8-0
.26
-0.2
80.
100.
620.
180.
160.
46
6H
avin
g on
line
serv
ices
tha
t en
hanc
e th
e te
achi
ng a
nd
lear
ning
exp
erie
nce.
0.24
0.76
0.36
-0.1
20.
290.
150.
51-0
.22
-1.3
7-0
.53
-0.3
2-1
.05
-0.8
50.
16-0
.39
-0.4
60.
24-0
.08
0.52
-0.2
80.
610.
330.
560.
05
7H
avin
g te
chno
logy
ser
vice
s th
at a
llow
me
to c
olla
bo-
rate
effe
ctiv
ely
with
oth
ers.
0.24
0.48
0.30
-0.0
60.
440.
670.
64-0
.20
-1.0
5-0
.54
-0.5
8-0
.47
-0.9
00.
22-0
.20
-0.7
00.
18-0
.22
0.18
0.00
0.62
0.24
0.34
0.28
8H
avin
g sy
stem
s th
at p
rovi
de t
imel
y ac
cess
to
data
tha
t in
form
s de
cisi
on m
akin
g.0.
090.
640.
21-0
.12
0.28
0.22
0.54
-0.2
6-0
.74
-0.0
4-0
.03
-0.7
1-0
.95
0.10
-0.1
4-0
.81
-0.1
4-0
.61
-0.1
40.
000.
28-0
.53
0.47
-0.1
9
9Th
e av
aila
bilit
y of
cla
ssro
oms
or m
eetin
g sp
aces
with
te
chno
logy
tha
t en
hanc
es t
he t
each
ing
and
lear
ning
ex
per
ienc
e.0.
330.
720.
160.
18-0
.03
-0.1
50.
49-0
.52
-1.9
0-0
.64
-1.2
6-0
.64
-0.6
50.
00-0
.11
-0.5
40.
12-0
.09
0.00
0.12
0.05
0.64
0.54
-0.4
9
Sup
po
rtan
d
Trai
nin
g
10G
ettin
g tim
ely
reso
lutio
n of
tec
hnol
ogy
pro
blem
s th
at
I am
exp
erie
ncin
g.0.
530.
670.
330.
200.
470.
570.
88-0
.41
-0.1
30.
45-0
.05
-0.0
80.
260.
790.
45-0
.19
0.76
0.40
0.29
0.47
0.46
0.31
0.57
-0.1
1
11Te
chno
logy
sup
por
t st
aff w
ho h
ave
the
know
eldg
e to
an
swer
my
que
stio
ns.
0.49
0.82
0.77
-0.2
80.
710.
871.
00-0
.29
-0.2
50.
31-0
.13
-0.1
20.
150.
610.
67-0
.52
0.64
-0.0
20.
070.
570.
320.
210.
230.
09
12Re
ceiv
ing
com
mun
icat
ions
reg
ardi
ng t
echn
olog
y se
rvic
es t
hat
I can
und
erst
and.
0.68
1.13
0.69
-0.0
10.
771.
130.
83-0
.06
-0.1
50.
230.
08-0
.23
0.10
1.17
0.48
-0.3
80.
620.
240.
130.
490.
880.
780.
670.
21
13G
ettin
g ac
cess
to
trai
ning
or
othe
r se
lf-he
lp in
form
a-tio
n th
at in
crea
ses
my
effe
ctiv
enes
s w
ith t
echn
olog
y.0.
760.
810.
120.
640.
791.
240.
93-0
.14
-0.4
40.
150.
50-0
.94
-0.3
70.
870.
41-0
.04
0.18
-0.3
1-0
.03
0.21
0.48
0.49
0.69
-0.2
1
Co
lor
Leg
end
:Po
siti
ve>0
Mild
Pai
n0
to -
0.49
Hig
h P
ain
-0.5
to
-0.
99Ex
trem
e Pa
in1.
0
2017
v. 2
016
v. 2
015
– Se
rvic
e A
deq
uacy
Gap
by
Gen
der
Year
-to-
Year
Com
par
ison
of t
he S
ervi
ce L
evel
s (p
erce
ived
- m
inim
um)
for
Stud
ents
, Fac
ulty
, and
Sta
ff by
Gen
der
WSU Spokane 2017 TechQual+ Survey ReportPage 55

WSU Spokane 2017 TechQual+ Survey ReportPage 56

C
WSU Spokane 2017 TechQual+ Survey ReportPage 57
APPENDIX CTOP THREE RESPONSE ANALYSIS

Response Analysis – Top Three Most Helpful IT ServicesIn an open ended question, survey respondents were asked which three WSU Spokane IT Services are the most helpful. There were a total of 107 re-spondents: 48 students, 24 faculty, and 35 staff. Top five are highlighted.
Technology ServiceStudent Faculty Staff All
# % # % # % # %
Tech Support 29 60.42% 15 62.50% 33 94.29% 77 49.04%
Wi-Fi 14 29.17% 3 12.50% 7 20.00% 24.00 15.29%
Blackboard 5 10.42% 0 0.00% 0 0.00% 5.00 3.18%
Website 1 2.08% 0 0.00% 0 0.00% 1.00 0.64%
Technology Training 0 0.00% 2 8.33% 5 14.29% 7.00 4.46%
Information Security 1 2.08% 0 0.00% 1 2.86% 2.00 1.27%
Blackboard Support 4 8.33% 3 12.50% 0 0.00% 7.00 4.46%
Printing 0 0.00% 0 0.00% 1 2.86% 1.00 0.64%
Email 0 0.00% 1 4.17% 0 0.00% 1.00 0.64%
Internet Speed/Reliability 0 0.00% 2 8.33% 0 0.00% 2.00 1.27%
Classroom/Conference Room Technology 2 4.17% 1 4.17% 4 11.43% 7.00 4.46%
Tech Communication 1 2.08% 0 0.00% 0 0.00% 1.00 0.64%
Cellphone Coverage 3 6.25% 0 0.00% 1 2.86% 4.00 2.55%
Videoconferencing/AMS Support 2 4.17% 3 12.50% 4 11.43% 9.00 5.73%
Access to Software & Hardware 0 0.00% 0 0.00% 1 2.86% 1.00 0.64%
MAC's 0 0.00% 0 0.00% 3 8.57% 3.00 1.91%
Other (Skype,VDI) 2 4.17% 1 4.17% 2 5.71% 5.00 3.18%
Technology Service Student Faculty Staff All
# % # % # % # %
Wi-Fi 13 23.64% 4 16.67% 5 14.71% 22 19.47%
Cell Coverage 0 0.00% 2 8.33% 2 5.88% 4 3.54%
Information Security (including phishing) 7 12.73% 3 12.50% 2 5.88% 12 10.62%
Blackboard 13 23.64% 2 8.33% 1 2.94% 16 14.16%
WSU Spokane Website 6 10.91% 1 4.17% 2 5.88% 9 7.96%
Computer Lab Environment 0 0.00% 0 0.00% 0 0.00% 0 0.00%
Tech Support 4 7.27% 4 16.67% 8 23.53% 16 14.16%
Technology Training 6 10.91% 2 8.33% 5 14.71% 13 11.50%
Blackboard Support 2 3.64% 0 0.00% 0 0.00% 2 1.77%
MyWSU 1 1.82% 0 0.00% 1 2.94% 2 1.77%
Classroom/Conf. Room Technology 4 7.27% 1 4.17% 2 5.88% 7 6.19%
AMS/Videoconferencing 10 18.18% 11 45.83% 9 26.47% 30 26.55%
Printing Capabilities in Labs 1 1.82% 0 0.00% 0 0.00% 1 0.88%
Internet Speed/Reliability 8 14.55% 1 4.17% 1 2.94% 10 8.85%
CougSync 1 1.82% 0 0.00% 0 0.00% 1 0.88%
Data Storage Management 0 0.00% 2 8.33% 1 2.94% 3 2.65%
Accessibility of Online Resources 1 1.82% 3 12.50% 2 5.88% 6 5.31%
Tech Communications 4 7.27% 2 8.33% 7 20.59% 13 11.50%
ExamSoft 3 5.45% 0 0.00% 0 0.00% 3 2.65%
SharePoint Support and Training 0 0.00% 2 8.33% 4 11.76% 6 5.31%
Response Analysis – Top Three IT Services Needing ImprovementIn an open ended question, survey respondents were asked which three WSU Spokane IT Services need improvement. There were a total of 113 re-spondents: 55 students, 24 faculty, and 34 staff. Top five are highlighted.
WSU Spokane 2017 TechQual+ Survey ReportPage 58
APPENDIX DCOMMENT ANALYSIS
Technology ServiceStudent Faculty Staff All
# % # % # % # %
Tech Support 29 60.42% 15 62.50% 33 94.29% 77 49.04%
Wi-Fi 14 29.17% 3 12.50% 7 20.00% 24.00 15.29%
Blackboard 5 10.42% 0 0.00% 0 0.00% 5.00 3.18%
Website 1 2.08% 0 0.00% 0 0.00% 1.00 0.64%
Technology Training 0 0.00% 2 8.33% 5 14.29% 7.00 4.46%
Information Security 1 2.08% 0 0.00% 1 2.86% 2.00 1.27%
Blackboard Support 4 8.33% 3 12.50% 0 0.00% 7.00 4.46%
Printing 0 0.00% 0 0.00% 1 2.86% 1.00 0.64%
Email 0 0.00% 1 4.17% 0 0.00% 1.00 0.64%
Internet Speed/Reliability 0 0.00% 2 8.33% 0 0.00% 2.00 1.27%
Classroom/Conference Room Technology 2 4.17% 1 4.17% 4 11.43% 7.00 4.46%
Tech Communication 1 2.08% 0 0.00% 0 0.00% 1.00 0.64%
Cellphone Coverage 3 6.25% 0 0.00% 1 2.86% 4.00 2.55%
Videoconferencing/AMS Support 2 4.17% 3 12.50% 4 11.43% 9.00 5.73%
Access to Software & Hardware 0 0.00% 0 0.00% 1 2.86% 1.00 0.64%
MAC's 0 0.00% 0 0.00% 3 8.57% 3.00 1.91%
Other (Skype,VDI) 2 4.17% 1 4.17% 2 5.71% 5.00 3.18%
Technology Service Student Faculty Staff All
# % # % # % # %
Wi-Fi 13 23.64% 4 16.67% 5 14.71% 22 19.47%
Cell Coverage 0 0.00% 2 8.33% 2 5.88% 4 3.54%
Information Security (including phishing) 7 12.73% 3 12.50% 2 5.88% 12 10.62%
Blackboard 13 23.64% 2 8.33% 1 2.94% 16 14.16%
WSU Spokane Website 6 10.91% 1 4.17% 2 5.88% 9 7.96%
Computer Lab Environment 0 0.00% 0 0.00% 0 0.00% 0 0.00%
Tech Support 4 7.27% 4 16.67% 8 23.53% 16 14.16%
Technology Training 6 10.91% 2 8.33% 5 14.71% 13 11.50%
Blackboard Support 2 3.64% 0 0.00% 0 0.00% 2 1.77%
MyWSU 1 1.82% 0 0.00% 1 2.94% 2 1.77%
Classroom/Conf. Room Technology 4 7.27% 1 4.17% 2 5.88% 7 6.19%
AMS/Videoconferencing 10 18.18% 11 45.83% 9 26.47% 30 26.55%
Printing Capabilities in Labs 1 1.82% 0 0.00% 0 0.00% 1 0.88%
Internet Speed/Reliability 8 14.55% 1 4.17% 1 2.94% 10 8.85%
CougSync 1 1.82% 0 0.00% 0 0.00% 1 0.88%
Data Storage Management 0 0.00% 2 8.33% 1 2.94% 3 2.65%
Accessibility of Online Resources 1 1.82% 3 12.50% 2 5.88% 6 5.31%
Tech Communications 4 7.27% 2 8.33% 7 20.59% 13 11.50%
ExamSoft 3 5.45% 0 0.00% 0 0.00% 3 2.65%
SharePoint Support and Training 0 0.00% 2 8.33% 4 11.76% 6 5.31%
D
WSU Spokane 2017 TechQual+ Survey ReportPage 59
APPENDIX DCOMMENT ANALYSIS

Question 1: Having an Internet service that operates reliably.
Comment # %
Hard to connect to Internet and/or Wi-Fi 4 27%
Not reliable 3 20%
Slow during peak times 2 13%
Wi-Fi is weak in some buildings/locations 2 13%
Difficulty connecting to Internet/Wi-Fi on personal computers 2 13%
Sufficient/Okay 1 7%
Would like to see Wi-Fi extended to parking lot 1 7%
Library computers are slow 1 7%
Total comments 16
Number of commenters 12
Number of respondents 116
Question 2: Having an Internet service that provides adequate capacity and speed.
Comment # %
Very important 2 50%
Slow 1 25%
Speed is good 1 25%
Slow in main buildings 1 25%
Total comments 5
Number of commenters 4
Number of respondents 116
Question 3: Having an Internet service that provides adequate Wi-Fi coverage.
Comment # %
Dead spots/spotty coverage 3 15%
Increase coverage in certain areas (parking lots, bathrooms, basements)
2 10%
Coverage is good 2 10%
Not reliable 1 5%
Noticed improvement 1 5%
Issues connecting via phone 1 5%
Issues connecting via laptop or personal computers 1 5%
Cuts out during peak use (i.e. during classes and exams) 3 15%
Very important 6 30%
Total comments 20
Number of commenters 11
Number of respondents 116
Question 4: Having adequate cellular (or mobile) coverage throughout campus.
Comment # %
Coverage is spotty 1 7%
Coverage is lacking in ground floor/basements 1 7%
Lack of cell coverage in SAC 20 3 20%
Safety concerns 1 7%
General lack of coverage in buildings 4 27%
Needs improvement 3 20%
Sufficient coverage 2 13%
Total comments 15
Number of commenters 12
Number of respondents 115
Comment Analysis – Students
Connectivity & Access
WSU Spokane 2017 TechQual+ Survey ReportPage 60

Comment Analysis – Students
Technology and Collaboration Services
Question 5: Having Web sites and online services that are easy to use.
Comment # %
MyWSU is difficult to use/needs improvement 1 13%
WSUS sites need to be more intuitive 1 13%
WSUS sites need general improvement 1 13%
Search functions need updating/refining 3 38%
Library program is confusing/cumbersome 1 13%
Quick links of WSUS site are helpful (MyWSU, email, Black-board)
1 13%
Total comments 8
Number of commenters 7
Number of respondents 113
Question 6: Having online services that enhance the teaching and learning experience.
Comment # %
Online services are difficult to navigate 1 9%
Blackboard is difficult to use 1 9%
Prefer Canvas to Blackboard 1 9%
AMS system needs improvement 2 18%
Pounce is not accessible or as functional as free cloud-based options
1 9%
Technology needs improvement among Nursing sites 1 9%
No suggestions 2 18%
No issues 1 9%
Very important 1 9%
Total comments 11
Number of commenters 9
Number of respondents 109
Question 7: Having technology services that allow me to collaborate effectively with others.
Comment # %
Use other non-university services (i.e. Google, social media) 1 8%
Communication through Blackboard is difficult 1 8%
Prefer Canvas to Blackboard 1 8%
AMS training for students is requested 1 8%
AMS is unreliable 1 8%
AMS is particularly unreliable at peak times 2 17%
AMS has connectivity/log in issues 1 8%
AMS microphones need improvement 1 8%
Library computers are unreliable, slow, and need improvement 1 8%
Collaborative tools to communicate with external parties is requested
1 8%
Too many collaborative tools are hindering communication 1 8%
No suggestions 2 17%
Total comments 14
Number of commenters 12
Number of respondents 112
Question 8: Having systems that provide timely access to data that informs decision-making.
Comment # %
No suggestions 3 38%
Must clear cache to access resources due to slow Wi-Fi 1 13%
Email communications are appreciated 1 13%
Library needs updated computers 1 13%
Lack of decision support for asset management 1 13%
Colleges have too much IT autonomy and it's causing dis-course.
1 13%
Total comments 8
Number of commenters 7
Number of respondents 100
Question 9: The availability of classrooms or meeting spaces with technology that enhances the teaching and learning experience.
Comment # %
Need more study/meeting rooms with appropriate technology 3 16%
Need increased outlet access 1 5%
Lack of health science labs with quality equipment 2 11%
AMS needs improvement 2 11%
Doing a good job 3 16%
Classrooms are too small (not enough tables/chairs) 1 5%
No suggestion 1 5%
Skype should be available in each classroom 1 5%
Collaborative technology in studying/meeting spaces needs improvement
5 26%
Total comments 19
Number of commenters 14
Number of respondents 114
WSU Spokane 2017 TechQual+ Survey ReportPage 61

Comment Analysis – Students
Support and Training
Question 10: Getting timely resolution of technology problems that I am experiencing.
Comment # %
Slow resolution to problems 3 33%
Good service 2 22%
Would like more information or support for using Canvas 1 11%
Would like an IT person here on weekends 1 11%
No issues 2 22%
Total comments 9
Number of commenters 6
Number of respondents 106
Question 11: Technology support staff who have the knowledge to answer my questions.
Comment # %
Not helpful/bad experiences 1 13%
Would appreciate more availability from support staff (i.e. evenings & weekends)
1 13%
Staff seems to lack knowledge 3 38%
Important 1 13%
Great 1 13%
Would appreciate a WSU IT person at extension campus 1 13%
Total comments 8
Number of commenters 6
Number of respondents 104
Question 12: Receiving communications regarding technology services that I can understand.
Comment # %
Unclear communication 2 50%
IT communication needs improvement 1 25%
Communications regarding strategic direction of IT is requested
1 25%
Total comments 4
Number of commenters 3
Number of respondents 107
Question 13: Getting access to training or other self-help information that increases my effectiveness with technology.
Comment # %
More/better training is needed 1 17%
Does not fit in student schedules 1 17%
Ability to solve tech issues would be preferred 1 17%
Prefer Canvas to Blackboard 1 17%
Support staff is doing well 1 17%
No issues 1 17%
Total comments 6
Number of commenters 6
Number of respondents 95
WSU Spokane 2017 TechQual+ Survey ReportPage 62
Blackboard and Instructional Technology
Question 15: Having an effective, intuitive, and reliable Learning Management System (Blackboard).
Comment # %
Issues with Blackboard's connectivity or functionality 7 20%
Difficult to access important documents or information in Blackboard
2 6%
Prefer Canvas or other LMS 6 17%
Blackboard has poor collaborative features and discussion boards
3 9%
Blackboard notifications are poor 2 6%
Blackboard is inferior to other storage systems 1 3%
Faculty does not consistently use Blackboard 4 11%
Faculty use other LMS 1 3%
Blackboard is sufficient/okay 2 6%
Faculty and students need better training on how to use Blackboard
1 3%
General disappointment for Blackboard 3 9%
Make Blackboard available on mobile devices 2 6%
Gratitude for replacing Angel 1 3%
Total comments 35
Number of commenters 23
Number of respondents 109
Question 16: Getting timely and helpful support for Blackboard.
Comment # %
Blackboard support needs improvement 1 13%
Good 3 38%
General disappointment for Blackboard 2 25%
Prefer Canvas to Blackboard 1 13%
No issues 1 13%
Total comments 8
Number of commenters 7
Number of respondents 86

Comment Analysis – Students
Computer Labs
Question 20: Availabilty and hours for open computer labs.
Comment # %
Need to extend hours (earlier/later, weekends) 5 45%
Staff can be disruptive 1 9%
Staff is good 1 9%
Yakima would like a computer lab, preferrably with a printer 3 27%
Availability of study rooms/classrooms is an issue 1 9%
Total comments 11
Number of commenters 10
Number of respondents 57
Question 21: Having a positive environment (cleanliness, noise, temperature, etc.) for the open computer labs
Comment # %
Too loud 1 20%
Yakima would like a computer lab 1 20%
Availability is an issue 2 40%
Study environment has a direct effect on student's work 1 20%
Total comments 5
Number of commenters 5
Number of respondents 47
WSU Spokane 2017 TechQual+ Survey ReportPage 63

WSU Spokane 2017 TechQual+ Survey ReportPage 64
Connectivity & Access
Question 2: Having an Internet Service that provides adequate capacity and speed.
Comment # %
Memory capacity/speed issues hinder class 1 25%
Slow 1 25%
Very important 1 25%
Makes sharing files difficult 1 25%
Total comments 4
Number of commenters 4
Number of respondents 63
Question 3: Having an Internet service that provides adequate Wi-Fi coverage.
Comment # %
Wi-Fi is spotty around buildings 1 33%
The Ignite NW Building has no Wi-Fi coverage 1 33%
There are connectivity issues with WSU Wireless 1 33%
Total comments 3
Number of commenters 4
Number of respondents 62
Question 4: Having adequate cellular (or mobile) coverage throughout campus.
Comment # %
Coverage is spotty/lacking in areas 4 31%
Can be a privacy concern for those that have to leave their office
1 8%
Noticed improvement 1 8%
Very important 2 15%
PBS Building still has issues 1 8%
No suggestions 1 8%
Affects classes because some faculty use phones as clickers 1 8%
First floor of Nursing building is particularly bad 2 15%
Total comments 13
Number of commenters 10
Number of respondents 63
Question 1: Having an Internet Service that operates reliably
Comment # %
Unreliable in certain areas 2 40%
Improved 1 20%
Likely to be caused from problems with older hardware 1 20%
Unreliable connection is affecting students’ exams 1 20%
Total comments 5
Number of commenters 4
Number of respondents 66
Comment Analysis – Faculty

Comment Analysis – Faculty
Technology and Collaboration Services
Question 5: Having Web sites and online services that are easy to use.
Comment # %
WSUS Site is hard to navigate 2 33%
Search functions are unreliable and hard to use 3 50%
Websites are out-dated 1 17%
Total comments 6
Number of commenters 5
Number of respondents 65
Question 6: Having online services that enhance the teaching and learning experience.
Comment # %
General disappointment 1 17%
Suggest making online platforms more user-friendly 2 33%
Blackboard does not enhance the learning experience 1 17%
Blackboard is an improvement from Angel 1 17%
Request for an audience response system that is FERPA com-pliant
1 17%
Total comments 6
Number of commenters 5
Number of respondents 62
Question 7: Having technology services that allow me to collaborate effectively with others.
Comment # %
Skype for Business is great 1 10%
Unaware of collaborative technology offered 1 10%
Videoconferencing between campuses needs improvement 1 10%
Skype for Business needs improvement 2 20%
Prefers Zoom to Skype 1 10%
Very important 1 10%
SharePoint is cumbersome 1 10%
Current collaborative technology is cumbersome 1 10%
Pounce is non-functional 1 10%
Total comments 10
Number of commenters 7
Number of respondents 63
Question 8: Having systems that provide timely access to data that informs decision-making.
Comment # %
Suggestion: Having adequate personnel and technology to support data requests
1 100%
Total comments 1
Number of commenters 1
Number of respondents 57
Question 9: The availability of classrooms or meeting spaces with technology that enhances the teaching and learning experience.
Comment # %
Additional tech-equipped classrooms are needed 3 33%
Every space should have access to technology 1 11%
Good 1 11%
Suggestion: Tablets 1 11%
It's difficult to schedule rooms 2 22%
Suggestion: Adopt Zoom 1 11%
Total comments 9
Number of commenters 8
Number of respondents 63
WSU Spokane 2017 TechQual+ Survey ReportPage 65

WSU Spokane 2017 TechQual+ Survey ReportPage 66
Comment Analysis – Faculty
Support and Training
Question 10: Getting timely resolution of technology problems that I am experiencing.
Comment # %
"Hit or miss" with technical support 1 20%
Customer service is great 2 40%
Customer service is slow 1 20%
University needs to prioritize classroom technology 1 20%
Total comments 5
Number of commenters 4
Number of respondents 63
Question 11: Technology support staff who have the knowledge to answer my questions.
Comment # %
Good/helpful 5 83%
Problems requiring Pullman support do not get solved 1 17%
Total comments 6
Number of commenters 5
Number of respondents 63
Question 12: Receiving communications regarding technology services that I can understand.
Comment # %
Spotty communication 1 33%
Website seems out-of-date 1 33%
It's difficult to know if IT emails are WSU IT or a scam 1 33%
Total comments 3
Number of commenters 3
Number of respondents 65
Question 13: Getting access to training or other self-help information that increases my effectiveness with technology.
Comment # %
Would like clearer access to training schedules (i.e. yearlong calendar)
1 14%
Training is held at inopportune times 1 14%
One-on-one works well 1 14%
Training is done well 1 14%
Self-help tutorials would be helpful 2 29%
More workshops would be helpful 1 14%
Total comments 7
Number of commenters 7
Number of respondents 61

WSU Spokane 2017 TechQual+ Survey ReportPage 67
Comment Analysis – Faculty
Blackboard and Instructional Technology
Question 15: Having an effective, intuitive, and reliable Learning Management System (Blackboard).
Comment # %
Blackboard is "horrible" 1 8%
Support is helpful 1 8%
Suggestion: A template for putting courses on Blackboard would be less confusing for students and faculty
1 8%
Blackboard's grading system needs improvement (inaccurate and not user friendly)
1 8%
Very important 1 8%
Satisfactory 1 8%
Blackboard is not quick or user-friendly 2 17%
Entrada might be a better substitute than Blackboard 1 8%
Students have difficulty with Blackboard 2 17%
Haven't used Blackboard 1 8%
Total comments 12
Number of commenters 9
Number of respondents 47
Question 16: Getting timely and helpful support for Blackboard.
Comment # %
Usually very good 1 33%
Needs to be a support person during lunch 1 33%
Entire campus needs to be on one single LMS 1 33%
Total comments 3
Number of commenters 2
Number of respondents 44
Question 14: Having information and access to new and useful instructional technologies or methods
Comment # %
Unsure of where to find/access information 2 33%
Would love to have information/access to new/useful technol-ogy
2 33%
Current hardware needs updating 1 17%
Suggestion: An audience response system that integrates with Blackboard
1 17%
Total comments 6
Number of commenters 5
Number of respondents 57
Research Resources
Question 18: Having Internet speed/capacity specifically in terms of research needs.
Comment # %
No feedback has been received.
Total comments 0
Number of commenters 0
Number of respondents 47
Question 19: Having data storage space used specifically for research data.
Comment # %
OneDrive has plenty of storage 1 25%
There are syncing issues with OneDrive 1 25%
Faculty would like SQL server instances on a central server 1 25%
Faculty keep data on multiple hard drives but not backed up to a server
1 25%
Total comments 4
Number of commenters 3
Number of respondents 44
Question 17: Having access to high speed computing for research.
Comment # %
Fears that there will be scheduling issues when ESFCOM begins using research technologies
1 100%
Total comments 1
Number of commenters 1
Number of respondents 47

Comment Analysis – Faculty
Videoconferencing
Question 22: Availability of classrooms or meeting spaces with videoconferencing technology.
Comment # %
AMS Camera is low quality 1 11%
There are issues in AMS (delays, disconnects) 3 33%
Need more spaces across campus 2 22%
Skype for Business is not reliable 1 11%
Scheduling spaces can be challenging 2 22%
Total comments 9
Number of commenters 6
Number of respondents 61
Question 23: Getting timely and helpful support forvideoconferencing technology in classrooms or meeting spaces.
Comment # %
Good 1 13%
Very responsive 2 25%
Equipment is poor 1 13%
Not resolved in a timely manner 1 13%
Increasing staff would help 1 13%
New equipment would help 1 13%
Often meetings are delayed until support can arrive 1 13%
Total comments 8
Number of commenters 5
Number of respondents 62
WSU Spokane 2017 TechQual+ Survey ReportPage 68

Question 1: Having an Internet service that operates reliably.
Comment # %
When the internet goes down, it takes a while before it gets fixed
1 20%
Wireless is spotty in areas 1 20%
Local area networks seem to be faster than the Wi-Fi 1 20%
A larger server may help 1 20%
More routers or access points may help 1 20%
Total comments 5
Number of commenters 3
Number of respondents 96
Question 2: Having an Internet service that provides adequate capacity and speed.
Comment # %
Suggestion: Implement secure and private LAN's among campuses
1 25%
Suggestion: Make access to networks credential-based instead of location-based
1 25%
Very important 1 25%
Not very reliable 1 25%
Total comments 4
Number of commenters 4
Number of respondents 96
Connectivity & Access
Question 3: Having an Internet service that provides adequate Wi-Fi coverage.
Comment # %
Service is spotty in certain areas 2 22%
The 4th floor, North side of Nursing has very poor Wi-Fi 1 11%
The Ignite Building has poor Wi-Fi 1 11%
No comment 2 22%
Wi-Fi should cover the entirety of the Spokane campus 1 11%
Wi-Fi drops between buildings 1 11%
Noticeable improvements 1 11%
Total comments 9
Number of commenters 7
Number of respondents 90
Question 4: Having adequate cellular (or mobile) coverage throughout campus.
Comment # %
Coverage is spotty/lacking in areas 4 22%
Boosters have not completely solved the problem 1 6%
Staff must leave their offices to use their phone 4 22%
Basement and lower floors in general have spotty to no coverage
3 17%
Ignite building has spotty service 1 6%
PBS building still has issues 1 6%
Noticeably improved 1 6%
No suggestions 1 6%
Suggestion: Larger antenna coverage 1 6%
First floor of Nursing building is particularly bad 1 6%
Total comments 18
Number of commenters 11
Number of respondents 91
WSU Spokane 2017 TechQual+ Survey ReportPage 69
Comment Analysis – Staff

WSU Spokane 2017 TechQual+ Survey ReportPage 70
Comment Analysis – Staff
Technology and Collaboration Services
Question 5: Having Web sites and online services that are easy to use.
Comment # %
WSUS site is hard to navigate/not user friendly 6 23%
The current web CMS is not customizable and has a poor layout
1 4%
There are too many WSU websites 1 4%
The system for scheduling/reserving rooms is inefficient 3 12%
The payroll system is outdated 3 12%
Suggestion: Implement a single ERP that has everything for finance, HR, procurement, reporting, document management, and more
1 4%
The travel reimbursement process should be streamlined and electronic
2 8%
Entrada is clunky and limited in functionality 1 4%
Suggestion: Put a search bar on every page of website 1 4%
Current consistency on website is helpful 1 4%
Lack of information on websites 2 8%
Blackboard is difficult to use (not efficient, hinders students) 1 4%
SharePoint has glitches 1 4%
Very important 1 4%
Website in general is out-dated and has broken links 1 4%
Total comments 26
Number of commenters 14
Number of respondents 97
Question 6: Having online services that enhance the teaching and learning experience.
Comment # %
Finding information on the WSU website can be challenging 1 25%
Would like to do more online tutorials, videos, etc. 1 25%
Online trainings should be updated 1 25%
No suggestion 1 25%
Total comments 4
Number of commenters 4
Number of respondents 55
Question 7: Having technology services that allow me to collaborate effectively with others.
Comment # %
Too many security sign-in levels on Intranet 1 6%
More training options need to be available 2 12%
Suggestion: Bring trainings to small group's regular meetings, and then schedule follow-up training sessions
1 6%
AMS is difficult for connecting students in a team environment 1 6%
Skype for Business is problematic (causes delays) 1 6%
Skype for Business works well, and needs to be in more confer-ence rooms
3 18%
While great internally, collaboration with external groups is difficult
2 12%
Very important 1 6%
Current collaboration services are not satisfactory 1 6%
Sharing between lab members needs improvement 1 6%
Staff miss Pexip 1 6%
Current services are satisfactory 1 6%
SharePoint is cumbersome, and difficult for creating workflows 1 6%
Total comments 17
Number of commenters 14
Number of respondents 89
Question 8: Having systems that provide timely access to data that informs decision-making.
Comment # %
More data available online would be helpful 2 25%
Current systems are outdated and not user friendly 1 13%
Financial systems need updates 2 25%
R25 room viewer is inefficient 1 13%
Entrada is clunky and not particularly helpful for providing insights
1 13%
No suggestions 1 13%
Total comments 8
Number of commenters 8
Number of respondents 81

Comment Analysis – Staff
Technology and Collaboration Services (continued)
Question 9: The availability of classrooms or meeting spaces with technology that enhances the teaching and learning experience.
Comment # %
Additional tech-equipped classrooms and simulation rooms are needed
1 6%
ITS should communicate enhancements and updates to people 1 6%
Information about current systems needs better communica-tion
1 6%
Scheduling rooms with proper technology is difficult 3 19%
ITS should communicate room-changes to participants better 1 6%
Current technology is easy to use and it works 1 6%
Collaboration between sites is hindering classes 1 6%
Collaboration technology needs improvements 2 13%
More spaces are needed for small groups and active learning 3 19%
No suggestion 2 13%
Total comments 16
Number of commenters 10
Number of respondents 75
WSU Spokane 2017 TechQual+ Survey ReportPage 71
Support and Training
Question 10: Getting timely resolution of technology problems that I am experiencing.
Comment # %
Good/satisfied 1 25%
Wi-Fi service unavailable in office 1 25%
Requests for help have not been answered 1 25%
No suggestions 1 25%
Total comments 4
Number of commenters 3
Number of respondents 96
Question 11: Technology support staff who have the knowledge to answer my questions.
Comment # %
Good/satisfied 3 38%
Staff give conflicting answers sometimes 1 13%
Some staff are more knowledgeable than others 2 25%
Staff answering with "Call so-and-so" or "That person is un-available" is frustrating. All staff should be equally trained.
2 25%
Total comments 8
Number of commenters 6
Number of respondents 96
Question 12: Receiving communications regarding technology services that I can understand.
Comment # %
Some staff do not receive newsletters 1 14%
Communications about updates/enhancements can be improved
1 14%
Information is accessible and understandable 2 29%
AMS system is complicated to use or sign up for 1 14%
There are adequate trainings provided 1 14%
Communications during training is good/satisfactory 1 14%
Total comments 7
Number of commenters 6
Number of respondents 94
Question 13: Getting access to training or other self-help information that increases my effectiveness with technology.
Comment # %
Training does not fit in staff schedules 1 6%
Resources are available, but respondent doesn’t access them 2 11%
Trainings about MyWSU and Nursing database would be helpful
1 6%
Trainings about Microsoft Office would be helpful 1 6%
Communication regarding training opportunitities can be improved
3 17%
Bringing training to work places would be helpful 1 6%
Lynda.com should be be accessible to staff 1 6%
Some documents on WSU website are not easily accessible 1 6%
Some WSU training is outdated and not engaging 1 6%
Training is good/satisfactory 2 11%
Unaware of training or access to training opportunities 4 22%
Total comments 18
Number of commenters 13
Number of respondents 91

Comment Analysis – Staff
Videoconferencing
Question 22: Availability of classrooms or meeting spaces with videoconferencing technology.
Comment # %
Conference rooms are up to date with technology 1 7%
There need to be more available conference rooms 3 21%
SAC147A and EWU auditiorium need video technology again 1 7%
Guidance/training on using conference rooms is important and needed
1 7%
Scheduling spaces is difficult 2 14%
SAC needs more meeting spaces 1 7%
No suggestions 1 7%
Support is not knowledgeable or timely about the issues 1 7%
Support is helpful, readily available, and does their best 2 14%
Uses Skype for videoconferencing 1 7%
Total comments 14
Number of commenters 10
Number of respondents 80
Question 23: Getting timely and helpful support forvideoconferencing technology in classrooms or meeting spaces.
Comment # %
Good and responsive service 1 6%
Technology fails often 2 13%
Not resolved or responded to in a timely manner 4 25%
Support's solutions were not adequate or helpful 3 19%
Automated room scheduling would be helpful 1 6%
Preventative support would be helpful (i.e. anticipating problems, checking rooms before usage, fixing issues ahead of time)
2 13%
There seems to be a disconnect between Pullman and Spokane ITS
1 6%
Technical Support's contact information needs to be easily accessible
1 6%
No suggestions 1 6%
Total comments 16
Number of commenters 8
Number of respondents 84
WSU Spokane 2017 TechQual+ Survey ReportPage 72