2017 state-of-the-wan report - ashton, metzler & … sot wan.pdf2017 state-of-the-wan report...
TRANSCRIPT

2017 State-of-The-WAN Report
Visionary Voices
May 2017 Page 1
2017 State-of-The-WAN Report Where do we stand with the Adoption of Software Defined WANs? By Dr. Jim Metzler, Ashton, Metzler & Associates
Distinguished Research Fellow and Co-Founder Webtorials Analyst Division Steven Taylor, Webtorials Publisher and Editor-in-Chief Co-Founder, Webtorials Analyst Division
Sponsored by:

2017 State-of-The-WAN Report
Visionary Voices
May 2017 Page 2
Introduction The wide area network (WAN) is a critically important topic for number of reasons. Those reasons include:
• The latency, jitter and packet loss that is associated with the WAN often cause the performance of applications to degrade;
• The WAN can be a major source of security vulnerabilities; • Unlike most of the components of IT, the price/performance of enterprise WAN services
such as MPLS doesn’t obey Moore’s Law; • The outage of a WAN link often causes one or more sites to be offline; • The lead time to either install a new WAN link or to increase the capacity of an existing
WAN link can be quite lengthy. A discussion of wide area networking is extremely timely because after a long period with little if any fundamental innovation, the WAN is now the focus of considerable innovation. As a result, for the first time in a decade, network organizations have an opportunity to make a significant upgrade to their WAN architecture and design. The goal of this e-book is to provide insight into the current state of the WAN that is based on a survey that was completed by 114 network professionals in March and April of 2017. Towards that end, this e-book examines the following topics:
• How satisfied are organizations with their current WAN architecture? • What is driving organizations to change their WAN architecture? • Where do network organizations stand relative to evaluating SD-WANs? • What are the drivers of SD-WAN adoption? • What are the inhibitors to SD-WAN adoption? • Where do network organizations want WAN functionality to be hosted? • What deployment option(s) will organizations choose? • Will network organizations stay with their current vendors? • Do network organizations want an SD-WAN to be more than just connectivity? • What has been the initial experiences with SD-WAN? • What issues show up when an SD-WAN is deployed?
Where appropriate, the results of this year’s research will be compared to last year’s which are highlighted in The 2016 State-of-the-WAN Report. While large shifts in a single year are somewhat uncommon, interesting insight into the state of the WAN can be gained from understanding those situations that are at steady state and those that are still evolving.

2017 State-of-The-WAN Report
Visionary Voices
May 2017 Page 3
How Satisfied are Organizations with their Current WAN Architecture? As shown in Figure 1, two thirds of network organizations are at best only moderately satisfied with their current WAN architecture.
Why is this important?
The general lack of satisfaction that network organizations have with their current WAN architecture indicates that a large portion of the WAN marketplace would likely be receptive to alternative WAN architectures.
Figure 1: Satisfaction with Current WAN Architecture
How satisfied is your organization with your current WAN architecture?
Not at all satisfied4%
Somewhat satisfied
16%
Moderately satisfied
46%
Very satisfied25%
Completely satisfied
9%

2017 State-of-The-WAN Report
Visionary Voices
May 2017 Page 4
What is Driving Organizations to Change their WAN Architecture? It’s not surprising that, as shown in Figure 2, reducing cost and increasing security are at the top of the list of factors that are currently driving network organizations to make changes to their WAN architecture. They were the top two factors in last year’s report. The only change in the composition of the top five factors from last year is that in 2016 supporting well-defined business critical applications came in fifth and this year increasing availability edged it out to capture fifth place.
Figure 2: Top Five Factors impacting WAN
Over the next 12 months, which three of the following will be the primary factors that cause your organization to make significant changes to your current WAN architecture?
Why is this important?
The high level of consistency year-over-year in terms of the factors that are driving change in the WAN indicates that the needs of the WAN marketplace are well understood and stable. These marketplace characteristics need to be in place before a major shift can occur.

2017 State-of-The-WAN Report
Visionary Voices
May 2017 Page 5
Where do Network Organizations Stand Relative to Evaluating SD-WANs? Figure 3 shows the six primary ways that network organizations are approaching SD-WAN adoption. While the order has changed somewhat, these are the same approaches that bubbled to the top last year. In addition to the order, the relative popularity of each approach has also changed somewhat. Last year 17% of the respondents indicated that their organization was actively analyzing vendors’s SD-WAN strategies and offerings. This year that rose to 26%. Last year, 10% of respondents indicated that they expected that within a year that their organization would be running SD-WAN somewhere in their production network. This year that rose to 16% One of the most interesting changes in the year-over-year data doesn’t show up in Figure 3. Last year, 5% of the respondents indicated that they were running SD-WAN functionality in their production network. This year that rose to 9%. Figure 3: Primary SD-WAN Evaluation and Implementation Plans
Which of these statements describe your company’s approach to implementing a Software Defined WAN (SD-WAN)? (Please check all that apply.)
Why is this important?
The combination of the fact that year-over-year more organizations are running SD-WAN functionality in production, that more expect to put it into production within the next year and that more are actively analyzing vendor’s SD-WAN strategies and offerings suggests that the adoption of SD-WANs will increase significantly over the next year.
0% 5% 10% 15% 20% 25% 30%
We will likely analyze SD-WAN sometime in thenext year.
We expect that within a year we will be runningSD-WAN somewhere in our production
network.
We currently are running SD-WAN either in alab or in a limited trial.
We have not made any analysis of SD-WAN.
We are currently actively analyzing thepotential value SD-WAN offers.
We are currently actively analyzing vendors’ SD-WAN strategies and offerings.
16%
16%
20%
21%
23%
26%

2017 State-of-The-WAN Report
Visionary Voices
May 2017 Page 6
What are the Drivers of SD-WAN Adoption? The respondents were asked to indicate the three primary factors that would drive their company to implement an SD-WAN. The top five factors are shown in Figure 4. It’s not surprising that reducing OPEX and increasing flexibility are the two top factors currently driving SD-WAN adoption as these were the top two factors in last year’s report. The biggest change in the top five factors year-over-year is that improve availability, which came in sixth last year, jumped up to third place in this year’s survey and improve security, which came in fifth last year, dropped down to seventh.
Figure 4: Top five advantages driving SD-WAN adoption
What are the three primary advantages that would drive your company to implement an SD-WAN?
Why is this important?
Whenever a new technology or architecture is introduced there is uncertainty and confusion as to its benefits. This uncertainty and confusion limits adoption. The consistency of the year-over-year survey results indicate that there currently is little if any uncertainty and confusion about the benefits of SD-WANs.
2017 State-of-The-WAN Report
Visionary Voices
May 2017 Page 7
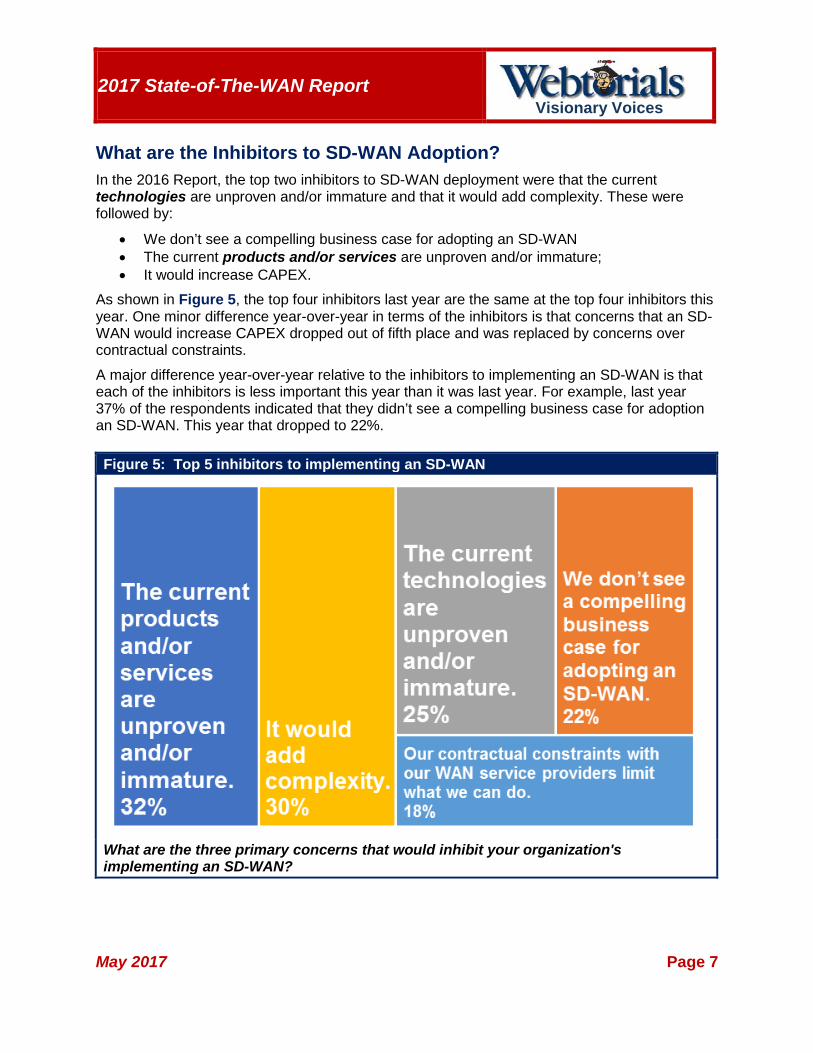
What are the Inhibitors to SD-WAN Adoption? In the 2016 Report, the top two inhibitors to SD-WAN deployment were that the current technologies are unproven and/or immature and that it would add complexity. These were followed by:
• We don’t see a compelling business case for adopting an SD-WAN • The current products and/or services are unproven and/or immature; • It would increase CAPEX.
As shown in Figure 5, the top four inhibitors last year are the same at the top four inhibitors this year. One minor difference year-over-year in terms of the inhibitors is that concerns that an SD-WAN would increase CAPEX dropped out of fifth place and was replaced by concerns over contractual constraints. A major difference year-over-year relative to the inhibitors to implementing an SD-WAN is that each of the inhibitors is less important this year than it was last year. For example, last year 37% of the respondents indicated that they didn’t see a compelling business case for adoption an SD-WAN. This year that dropped to 22%. Figure 5: Top 5 inhibitors to implementing an SD-WAN
What are the three primary concerns that would inhibit your organization's implementing an SD-WAN?

2017 State-of-The-WAN Report
Visionary Voices
May 2017 Page 8
Why is this important?
The fact that the composition of the top five inhibitors barely changed year-over-year is another indication that there is relatively little confusion about SD-WANs. The fact that each of the key inhibitors is less important year-over-year indicates that the resistance to adopting an SD-WAN is diminishing.
2017 State-of-The-WAN Report
Visionary Voices
May 2017 Page 9
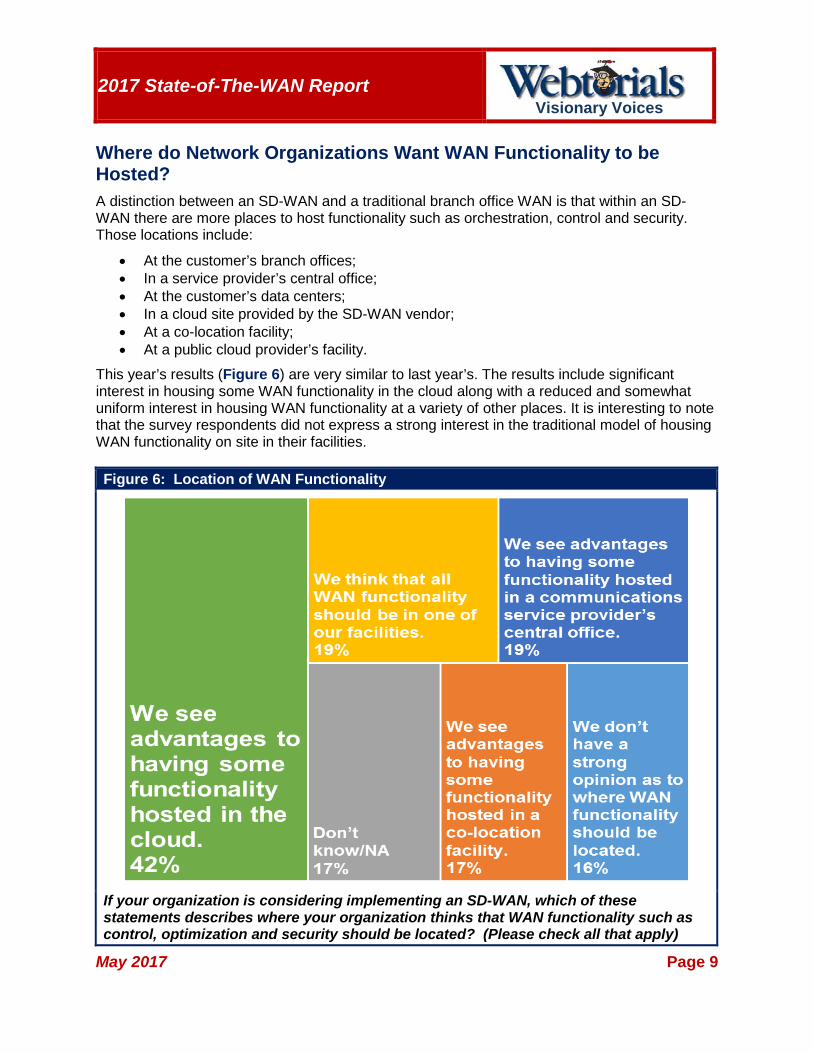
Where do Network Organizations Want WAN Functionality to be Hosted? A distinction between an SD-WAN and a traditional branch office WAN is that within an SD-WAN there are more places to host functionality such as orchestration, control and security. Those locations include:
• At the customer’s branch offices; • In a service provider’s central office; • At the customer’s data centers; • In a cloud site provided by the SD-WAN vendor; • At a co-location facility; • At a public cloud provider’s facility.
This year’s results (Figure 6) are very similar to last year’s. The results include significant interest in housing some WAN functionality in the cloud along with a reduced and somewhat uniform interest in housing WAN functionality at a variety of other places. It is interesting to note that the survey respondents did not express a strong interest in the traditional model of housing WAN functionality on site in their facilities. Figure 6: Location of WAN Functionality
If your organization is considering implementing an SD-WAN, which of these statements describes where your organization thinks that WAN functionality such as control, optimization and security should be located? (Please check all that apply)

2017 State-of-The-WAN Report
Visionary Voices
May 2017 Page 10
Why is this important?
Alternative SD-WAN solutions incorporate a range of approaches for where key WAN functionality is housed. If network organizations have a strong preference for where WAN functionality should be housed, this indicates which solutions they should evaluate.

2017 State-of-The-WAN Report
Visionary Voices
May 2017 Page 11
What Deployment Option(s) Will Organizations Choose? Initially most of the discussion of software-defined branch office WANs focused on Do-It-Yourself (DIY) solutions that called for network organizations to acquire the solution from a vendor and then implement and manage the solution on their own. However, over the last year several providers have announced their intention to offer an SD-WAN as a managed service and/or to provide a Network-as-a-Service offering that leverages an SD-WAN-based infrastructure. The data in Figure 7 indicates that DIY is currently the preferred approach. However, last year the DIY approach had a 12% advantage over the managed service approach. This year that advantage was cut to 7%. As was the case last year, the interest in the DIY approach is notably smaller than the combined interest in the other two implementation options. Figure 7: WAN Implementation Options
If your organization were to adopt an SD-WAN which deployment option are you most likely to implement: (Please check all that apply.)
Why is this important?
The previously discussed concerns about the maturity and complexity of SD-WAN solutions could signal a damper on the adoption of SD-WAN solutions. However, the strong interest in either a managed service or a NaaS solution indicates that is unlikely to happen.
NaaS Solution22%
Managed Service
36%
DIY43%

2017 State-of-The-WAN Report
Visionary Voices
May 2017 Page 12
Will Network Organizations Stay with their Current Vendors? SD-WANs represent a fundamental transformation in terms of how network organizations implement a WAN. As is the case with any fundamental transformation in the IT industry, traditional vendors will compete with start-ups and new entrants for a share of the SD-WAN market. Last year the respondents were roughly evenly divided between staying with their incumbent vendor(s) or looking for alternative vendors. As shown in Figure 8, that is not the case this year. In what is the biggest change in the year-over-year results, the respondents indicated very strong interest in exploring alternative vendors. Figure 8: Interest in Looking for New Vendors
If your network organization were to adopt an SD-WAN, which of the following describes how you will likely approach the selection of a vendor? (Please choose all that apply)
Why is this important?
The more network organizations are willing to explore alternative vendors the more viable and competitive those alternative solutions become and the more pressure this places on incumbent vendors.

2017 State-of-The-WAN Report
Visionary Voices
May 2017 Page 13
Do Network Organizations Want an SD-WAN to be More than just Connectivity? Most of the initial SD-WAN solutions focused very heavily on providing low cost WAN connectivity. In many cases that focus has expanded over time as the provider had added more functionality either on their own or through partnerships. As shown in Figure 9, in the current environment, companies are more likely than not to want the SD-WAN solution they implement to have at least some basic optimization and security functionality.
Figure 9: Interest in Highly Functional SD-WANs
Which of the following BEST describes the focus of your organization’s efforts to analyze, trial or adopt an SD-WAN?
The survey question focused on functionality such as optimization and security. Another alternative was raised by one of the respondents who wrote in that his/her organization was focused on solutions which provide application performance visibility and management.
0% 10% 20% 30% 40%
Other (please specify)
We are focused almost exclusively on providing connectivity and have little if any focus on any
L4 – L7 services such as optimization or …
Don’t know/NA
There are some basic optimization and securityfunctions that must be a part of any solution that
we adopt.
We are focused heavily on providing connectivity, but we are receptive to solutions
that offer some L4 – L7 services such as …
Any solution that we adopt must offer a broadset of security and optimization functionality.
5%
9%
12%
21%
22%
32%

2017 State-of-The-WAN Report
Visionary Voices
May 2017 Page 14
Why is this important?
Given how competitive the SD-WAN marketplace is, the strong interest that network organizations have in SD-WAN solutions that feature L4 – L7 functionality is likely to cause a virtuous cycle in which future SD-WAN solutions feature increasing amounts of higher level functionality.

2017 State-of-The-WAN Report
Visionary Voices
May 2017 Page 15
What has been the Initial Experiences with SD-WAN? As could be expected most of the respondents didn’t have any experience with operating an SD-WAN. While a somewhat smaller sample size than desired, the 53 respondents who did have experience provided important insight (Figure 10) into how the initial deployments are going.
Figure 10: Results of the Initial Implementations of SD-WAN
If you have either started or finished a POC or trial of an SD-WAN or if you have an SD-WAN in production, which of the following best describe your experiences? (Please check all that apply.)
Given that SD-WAN products and services are still relatively new to the market, the fact that two thirds of the respondents indicated that their experiences with these products and services were either in line with, or better than the vendor promised is positive. In addition, when the respondents with experience were asked, only 4 of them (8%) indicated that their organization had performed a POC or trial and decided to not implement the solution at this time.
0% 10% 20% 30% 40% 50% 60%
The results were better than the vendorpromised.
The results were notably less than the vendorpromised.
The results were somewhat less than thevendor promised.
The results were in line with what the vendorpromised.
9%
15%
17%
58%

2017 State-of-The-WAN Report
Visionary Voices
May 2017 Page 16
Why is this important?
Because of the associated risk, the clear majority of organizations prefer to not be among the first to implement a new technology or architecture. The results shown in Figure 10 indicates that the initial deployments of SD-WAN solutions are going well. This is likely to encourage other network organizations to accelerate their evaluation and adoption of SD-WAN solutions.

2017 State-of-The-WAN Report
Visionary Voices
May 2017 Page 17
What Issues Show up with an SD-WAN is Deployed? Like the previous question, while a somewhat smaller sample size than desired, the responses of the respondents who did have experience provide important insight (Figure 11) into the issues that they have experienced with the initial SD-WAN deployments.
Figure 11: Issues in Initial SD-WAN Deployments
If you have either started or finished a POC or trial of an SD-WAN solution or if you have an SD-WAN solution in production, what were the biggest issues you have encountered so far with your solution? (Please check all that apply.)
Some of the respondents also wrote in issues that were not included in the survey question. The two issues that were mentioned the most were:
• Integrating an SD-WAN solution with the existing WAN during the transition is very complex
• Implementing an SD-WAN changes how operations are performed and changing how people work is a complex task.
0% 5% 10% 15% 20% 25% 30% 35% 40% 45%
It didn’t significantly increase our flexibility.
Availability didn’t increase.
Application performance didn’t improve.
We didn’t see the opex savings we had hoped to see.
Troubleshooting problems was more difficultthan we expected.
It made operations more complex.
Setting up and maintaining policy was moredifficult than we thought it would be.
It created security challenges.
The implementation was more difficult than wethought it would be.
7%
9%
16%
20%
25%
25%
27%
27%
45%

2017 State-of-The-WAN Report
Visionary Voices
May 2017 Page 18
Why is this important?
Knowing the issues that the early adopters have experienced should help network organizations anticipate those issues and hence either eliminate or minimize their impact.

2017 State-of-The-WAN Report
Visionary Voices
May 2017 Page 19
About the Webtorials® Editorial/Analyst Division Webtorials® provides in-depth research, analysis and reporting on current and emerging technologies including Unified Communications, UCaas, WebRTC, VoWiFi, Managed Services, Managed Security Services, Application Delivery, Software-Defined Networks, Software-Defined WAN, Session Border Controllers, CyberSecurity, Network Security, Mobile Communications, Mobile Security, Cloud Computing, Cloud Security, Data Security, SIP, and IoT. The Webtorials® team of analysts and technology experts covers the technology sector and publishes syndicated content for its worldwide subscribers. Webtorials® authors and publishes TechNotes™, State-of-the-Market Reports, and customized end-user surveys. Through reports that examine industry dynamics from both a demand and supply perspective, the firm educates the marketplace on emerging trends and the role that IT products, services and processes play in responding to those trends. Jim Metzler has a broad background in the IT industry. This includes being a software engineer, an engineering manager for high-speed data services for a major network service provider, a product manager for network hardware, a network manager at two Fortune 500 companies, and the principal of a consulting organization. In addition, he has created software tools for designing customer networks for a major network service provider and directed and performed market research at a major industry analyst firm. Jim’s current interests include cloud networking and application delivery. For more information and for additional Webtorials® Editorial/Analyst Division products, please contact Jim Metzler or Steven Taylor.
Published by Webtorials Editorial/Analyst Division www.Webtorials.com Division Cofounders: Jim Metzler [email protected] Steven Taylor [email protected]
Professional Opinions Disclaimer All information presented and opinions expressed in this publication represent the current opinions of the author(s) based on professional judgment and best available information at the time of the presentation. Consequently, the information is subject to change, and no liability for advice presented is assumed. Ultimate responsibility for choice of appropriate solutions remains with the reader. Copyright © 2017 Webtorials For editorial and sponsorship information, contact Jim Metzler or Steven Taylor. The Webtorials Editorial/Analyst Division is an analyst and consulting joint venture of Steven Taylor and Jim Metzler.

Sinefa and Wavin: Wavin reduces NOC inbound calls by 20%
Sinefa Case Study
BackgroundWavin is the world leader in plastic pipe systems for residential, non-ˇresidential and civil engineering projects. The Company operates in 26 Countries within Europe and was recently purchased by the Mexichem Group (www.mexichem.com).
From an ICT perspective, there are four data centres in Europe, plus file servers in the UK, France, Denmark, Holland, Poland and Turkey. The Company has recently moved 3,000 users to Office 365 and is busy moving infrastructure to Azure.
Previously, the network consisted of MPLS links only, but two years ago the Company started to migrate some MPLS lines to internet links. The Company uses SAP as its ERP and it was looking to increase the performance of its WAN.
Wavin’s corporate policy now is that all technology should be cloud-ˇbased and accounted as monthly operating expenditure, to enable the business to scale as required and be agile. As a result, there will be no more long term contracts or
hardware.
The challengeThe network manager recognised the need to improve application visibility and quality of service on internet links. They were particularly concerned about Office 365, Citrix and Telnet based applications. Previously, both Sflow and Netflow were tried but neither worked.
The poor performance of critical applications was having major productivity impact. Forklift drivers rely on Telnet for instructions, which was experiencing dropped data packets and was causing issues. When sessions dropped out drivers would become very annoyed. They would have to go back to service desk to unlock the Telnet session. This meant that their job couldn’t be completed, resulting in lost productivity.
Citrix users were getting a rubber keyboard (i.e. typing but no response) because it was competing with other traffic on the network like windows updates. Users were experiencing major delays and printing jobs were hell. Even small PDF files sent to a printer were congesting the link and delaying other applications.
When the transition to Office 365 started, 150 users were syncing and the network didn’t work for 5 to 6 days, even after migration was completed. The source of these
problems was known but IT wasn’t able to prevent it.
Abstract:
Multinational plastic pipe manufacturer Wavin have recently migrated 3,000 users and 90 locations to Office 365. Application performance problems were affecting the productivity of their workforce.
By introducing Sinefa’s visibility and control solution they have identified network problems and prioritized mission- critical applications, resulting in improved network performance. They have saved an estimated 30 - 50% of link costs, reduced user frustration and taken the pressure off their service desk, with a reduction in inbound calls by 20%.
© 2016 Sinefa
Version1. February 2016

Sinefa and Wavin: Wavin reduces NOC inbound calls by 20%
In conclusionIt is intended to expand the scope of Sinefa
across the entire Company WAN, which consists
of 90 locations and 4,200 users. It has proven to
be very good value, and is rated as 8 out of 10
by the network manager. The investment is very
easy to justify according to the network manager.
In terms of installing Office 365, the network
team consider it was mandatory to deploy the
Sinefa solution.
They intend to extend the Sinefa solution when
they look at taking up the Microsoft ExpressRoute
offer and will look into deploying a Sinefa virtual
probe inside the Azure cloud from the Azure
market place.
The solutionThe move to the cloud and the closure of data centres prompted Wavin to trial Sinefa’s technology. The alternatives considered were Ipanema & another offering via a Dutch reseller.
Sinefa was chosen because the proof of concept was simple, and no cost. Deployment was fast and flexible. The ability to use one model of probe in 79 sites and the ability to scale with the business were also attractive features for Wavin.
Sinefa was found to be very easy to install and use. The 2 minute demo provided enough to get an initial understanding of what it is about. All the things needed to manage a network are within the product.
There was some capex requirement (with the purchase of the hardware probes) but compared to the alternatives the choice was easy - it is half the price. The opex component is very affordable and attractive too.
Another factor in decision- making was the ability to profile the Company’s own internet services and keep its suppliers accountable.
ResultsThe number of MPLS links has been reduced but not eliminated. They have been replaced with local internet provider links, which has saved around 30% - 50% of link costs. There are still issues with application performance on the remaining MPLS links as Sinefa is not deployed in this part of the network.
SAP now has guaranteed bandwidth meaning forklifts and trucks don’t have to wait anymore because terminals are not responding. The problems with backups and windows have been solved. The Telnet link has been shaped to prioritize and protect its bandwidth and now the performance issues are gone. Sinefa has solved multiple problems in the WAN and provided insight on where the problems were coming from, which was not previously possible.
A lot of time and frustration has been saved and the business is more productive. There are less service desk calls, therefore technical staff can focus on other matters. There has been a decrease of 20% in critical incidents tickets to the NOC and, for example, a site of 200 people can now use critical applications reliably and consistently which they previously couldn’t. There is potential to delay or eliminate bandwidth upgrades of links and the Sinefa Utilization screen allows proper sizing according to bandwidth usage. It has been possible to either save or avoid costs in many areas.
The aim is to lower business data costs alone by 50 %. Sinefa will help the Company to achieve this objective.
The bandwidth control feature allows the organization to customize the shaping policies. This is an attractive feature as some sites have marketing personnel who need certain apps, while other sites are heavy SAP users. The network manager is finding most benefit from the utilization feature; being able to zoom in and drill down on what happened. They consider the amount of control they now have is excellent.
For more informationTo learn more about Sinefa and to improve
the visibility and cotrol of applications on your
network visit:
www.sinefa.com
Sinefa Case Study