2017 semi-annual report - renaissance capital · pdf file2017 semi-annual report march 31, ......
TRANSCRIPT
RENAISSANCE IPO ETF
RENAISSANCE INTERNATIONAL IPO ETF
2017 Semi-Annual Report
March 31, 2017
Renaissance Capital LLC
The IPO Expert
Investors should consider the investment objectives, risks, charges and expenses carefully before investing. For a prospectus or summary prospectus with this and other information about the Funds, please visit our website at www.renaissancecapital.com/Docs/Renaissance-IPO-ETFs-Prospectus.pdf or call (866) 486-6645. Read the prospectus or summary prospectus carefully before investing.
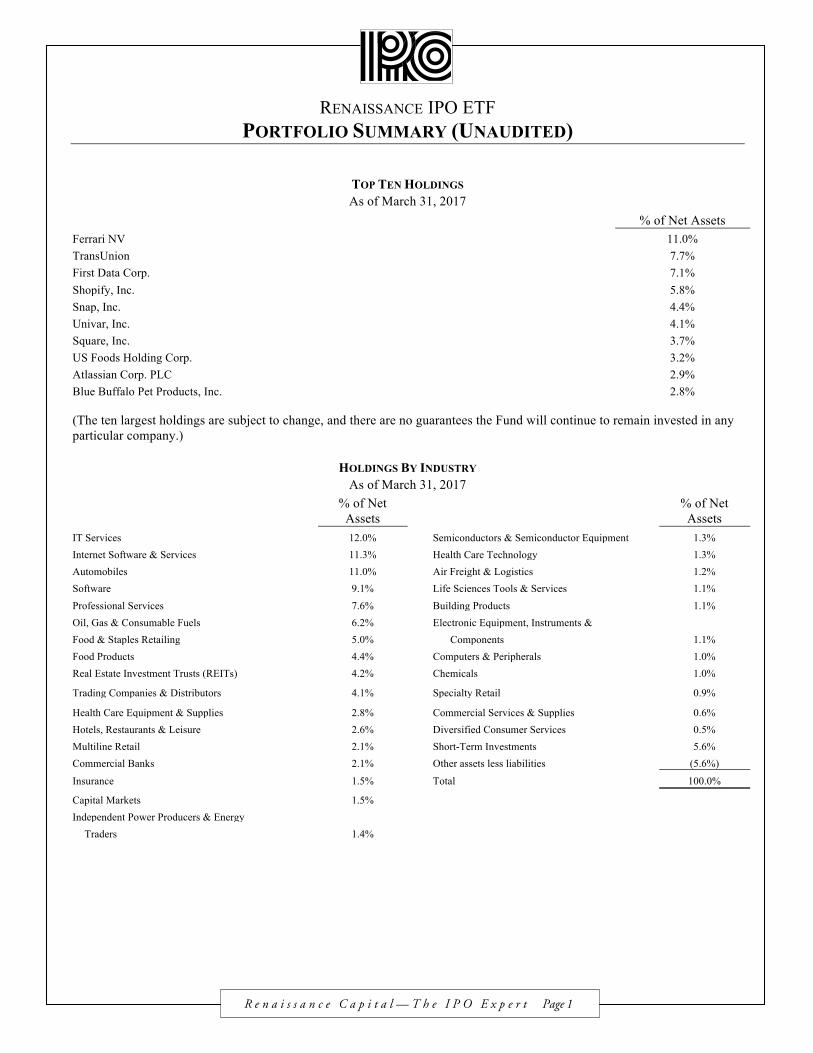
RENAISSANCE IPO ETF PORTFOLIO SUMMARY (UNAUDITED)
TOP TEN HOLDINGS As of March 31, 2017
% of Net Assets
Ferrari NV
11.0% TransUnion
7.7%
First Data Corp.
7.1% Shopify, Inc.
5.8%
Snap, Inc.
4.4% Univar, Inc.
4.1%
Square, Inc.
3.7% US Foods Holding Corp.
3.2%
Atlassian Corp. PLC
2.9% Blue Buffalo Pet Products, Inc.
2.8%
(The ten largest holdings are subject to change, and there are no guarantees the Fund will continue to remain invested in any particular company.)
HOLDINGS BY INDUSTRY As of March 31, 2017
% of Net Assets
% of Net Assets
IT Services 12.0% Semiconductors & Semiconductor Equipment 1.3% Internet Software & Services 11.3% Health Care Technology 1.3% Automobiles 11.0% Air Freight & Logistics 1.2% Software 9.1% Life Sciences Tools & Services 1.1% Professional Services 7.6% Building Products 1.1% Oil, Gas & Consumable Fuels 6.2% Electronic Equipment, Instruments & Food & Staples Retailing 5.0% Components 1.1% Food Products 4.4% Computers & Peripherals 1.0% Real Estate Investment Trusts (REITs) 4.2% Chemicals 1.0%
Trading Companies & Distributors
4.1%
Specialty Retail
0.9%
Health Care Equipment & Supplies 2.8% Commercial Services & Supplies 0.6% Hotels, Restaurants & Leisure 2.6% Diversified Consumer Services 0.5% Multiline Retail 2.1% Short-Term Investments 5.6% Commercial Banks 2.1% Other assets less liabilities (5.6%)
Insurance 1.5% Total 100.0%
Capital Markets 1.5% Independent Power Producers & Energy
Traders 1.4%
R e n a i s s a n c e C a p i t a l — T h e I P O E x p e r t Page 1
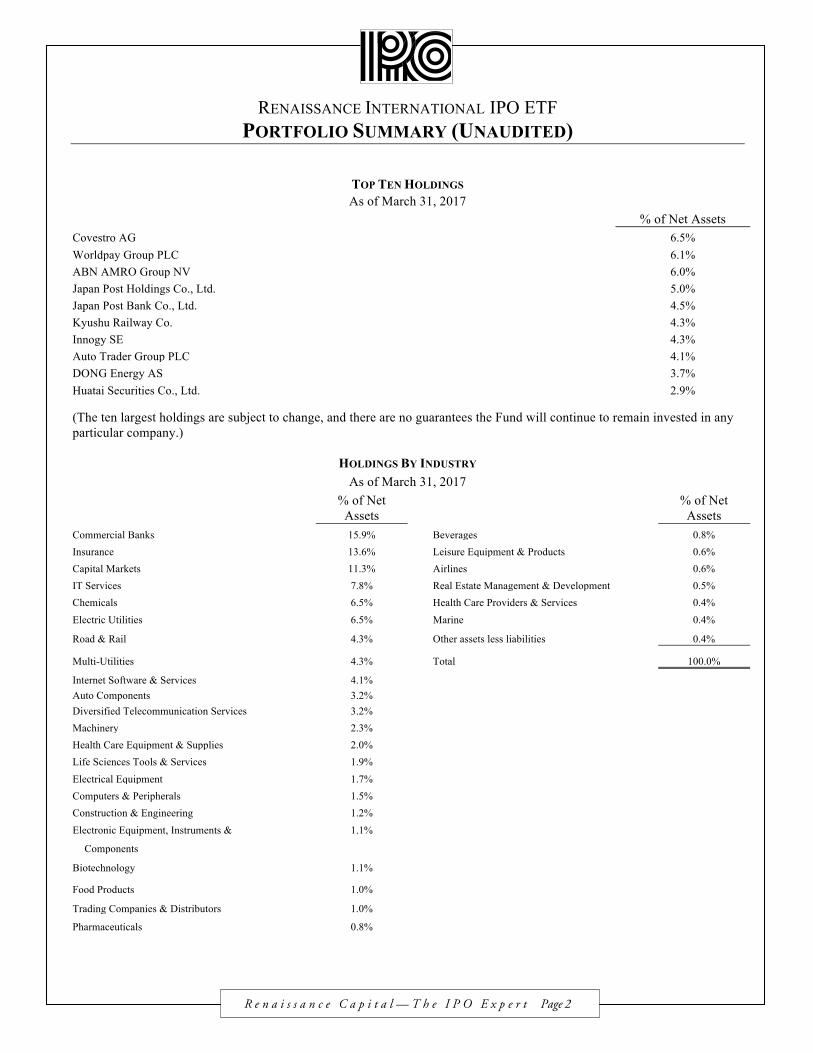
RENAISSANCE INTERNATIONAL IPO ETF PORTFOLIO SUMMARY (UNAUDITED)
TOP TEN HOLDINGS As of March 31, 2017
% of Net Assets
Covestro AG 6.5% Worldpay Group PLC 6.1% ABN AMRO Group NV 6.0% Japan Post Holdings Co., Ltd. 5.0% Japan Post Bank Co., Ltd. 4.5% Kyushu Railway Co. 4.3% Innogy SE 4.3% Auto Trader Group PLC 4.1% DONG Energy AS 3.7% Huatai Securities Co., Ltd. 2.9%
(The ten largest holdings are subject to change, and there are no guarantees the Fund will continue to remain invested in any particular company.)
HOLDINGS BY INDUSTRY As of March 31, 2017
% of Net Assets
% of Net Assets
Commercial Banks 15.9% Beverages 0.8% Insurance 13.6% Leisure Equipment & Products 0.6% Capital Markets 11.3% Airlines 0.6% IT Services 7.8% Real Estate Management & Development 0.5% Chemicals 6.5% Health Care Providers & Services 0.4% Electric Utilities 6.5% Marine 0.4%
Road & Rail
4.3%
Other assets less liabilities 0.4%
Multi-Utilities 4.3% Total 100.0%
Internet Software & Services 4.1% Auto Components 3.2% Diversified Telecommunication Services 3.2% Machinery 2.3% Health Care Equipment & Supplies 2.0% Life Sciences Tools & Services 1.9% Electrical Equipment 1.7% Computers & Peripherals 1.5% Construction & Engineering 1.2% Electronic Equipment, Instruments & 1.1%
Components
Biotechnology 1.1%
Food Products 1.0%
Trading Companies & Distributors 1.0% Pharmaceuticals 0.8%
R e n a i s s a n c e C a p i t a l — T h e I P O E x p e r t Page 2
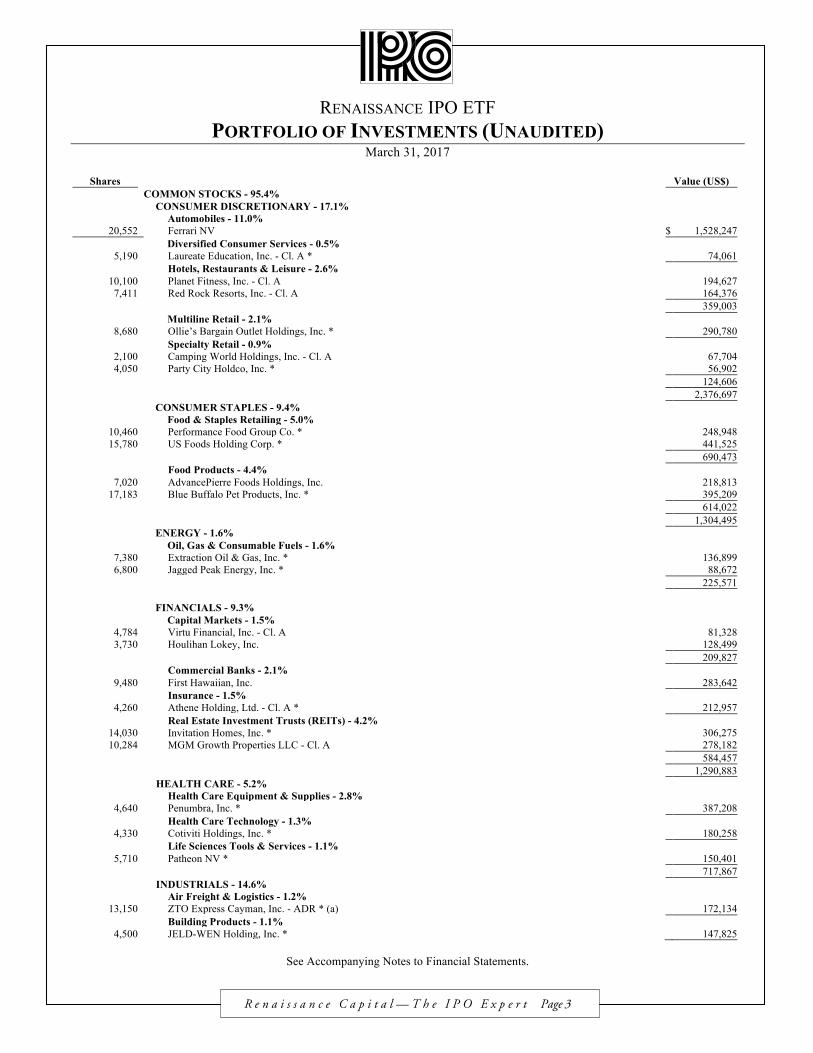
RENAISSANCE IPO ETF PORTFOLIO OF INVESTMENTS (UNAUDITED)
March 31, 2017
Shares Value (US$) COMMON STOCKS - 95.4% CONSUMER DISCRETIONARY - 17.1% Automobiles - 11.0% 20,552 Ferrari NV $ 1,528,247 Diversified Consumer Services - 0.5% 5,190 Laureate Education, Inc. - Cl. A * 74,061 Hotels, Restaurants & Leisure - 2.6% 10,100 Planet Fitness, Inc. - Cl. A 194,627 7,411 Red Rock Resorts, Inc. - Cl. A 164,376 359,003 Multiline Retail - 2.1% 8,680 Ollie’s Bargain Outlet Holdings, Inc. * 290,780 Specialty Retail - 0.9% 2,100 Camping World Holdings, Inc. - Cl. A 67,704 4,050 Party City Holdco, Inc. * 56,902 124,606 2,376,697 CONSUMER STAPLES - 9.4% Food & Staples Retailing - 5.0% 10,460 Performance Food Group Co. * 248,948 15,780 US Foods Holding Corp. * 441,525 690,473 Food Products - 4.4% 7,020 AdvancePierre Foods Holdings, Inc. 218,813 17,183 Blue Buffalo Pet Products, Inc. * 395,209 614,022 1,304,495 ENERGY - 1.6% Oil, Gas & Consumable Fuels - 1.6% 7,380 Extraction Oil & Gas, Inc. * 136,899 6,800 Jagged Peak Energy, Inc. * 88,672 225,571
FINANCIALS - 9.3% Capital Markets - 1.5% 4,784 Virtu Financial, Inc. - Cl. A 81,328 3,730 Houlihan Lokey, Inc. 128,499 209,827 Commercial Banks - 2.1% 9,480 First Hawaiian, Inc. 283,642 Insurance - 1.5% 4,260 Athene Holding, Ltd. - Cl. A * 212,957 Real Estate Investment Trusts (REITs) - 4.2% 14,030 Invitation Homes, Inc. * 306,275 10,284 MGM Growth Properties LLC - Cl. A 278,182 584,457 1,290,883 HEALTH CARE - 5.2% Health Care Equipment & Supplies - 2.8% 4,640 Penumbra, Inc. * 387,208 Health Care Technology - 1.3% 4,330 Cotiviti Holdings, Inc. *
180,258
Life Sciences Tools & Services - 1.1% 5,710 Patheon NV * 150,401 717,867 INDUSTRIALS - 14.6% Air Freight & Logistics - 1.2% 13,150 ZTO Express Cayman, Inc. - ADR * (a) 172,134 Building Products - 1.1% 4,500 JELD-WEN Holding, Inc. * 147,825
See Accompanying Notes to Financial Statements.
R e n a i s s a n c e C a p i t a l — T h e I P O E x p e r t Page 3
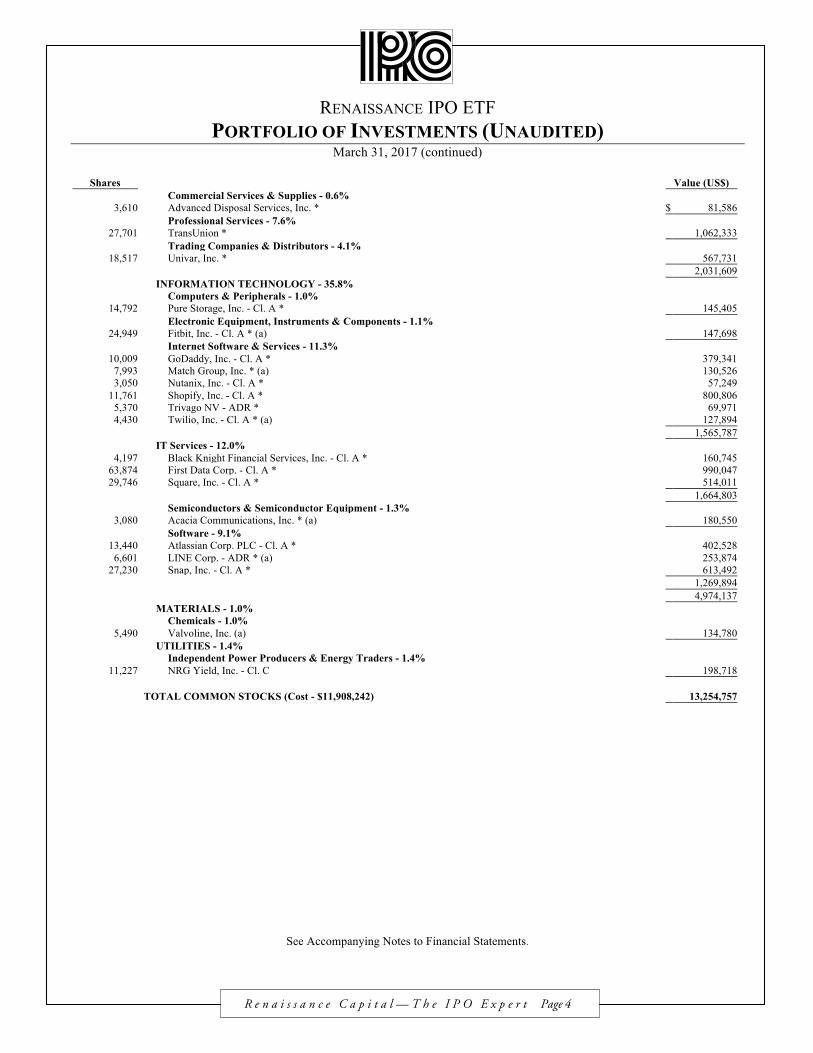
RENAISSANCE IPO ETF PORTFOLIO OF INVESTMENTS (UNAUDITED)
March 31, 2017 (continued)
Shares Value (US$) Commercial Services & Supplies - 0.6% 3,610 Advanced Disposal Services, Inc. * $ 81,586 Professional Services - 7.6% 27,701 TransUnion * 1,062,333 Trading Companies & Distributors - 4.1% 18,517 Univar, Inc. * 567,731 2,031,609 INFORMATION TECHNOLOGY - 35.8% Computers & Peripherals - 1.0% 14,792 Pure Storage, Inc. - Cl. A * 145,405 Electronic Equipment, Instruments & Components - 1.1% 24,949 Fitbit, Inc. - Cl. A * (a) 147,698 Internet Software & Services - 11.3% 10,009 GoDaddy, Inc. - Cl. A * 379,341 7,993 Match Group, Inc. * (a) 130,526 3,050 Nutanix, Inc. - Cl. A * 57,249 11,761 Shopify, Inc. - Cl. A * 800,806 5,370 Trivago NV - ADR * 69,971 4,430 Twilio, Inc. - Cl. A * (a) 127,894 1,565,787 IT Services - 12.0% 4,197 Black Knight Financial Services, Inc. - Cl. A * 160,745 63,874 First Data Corp. - Cl. A * 990,047 29,746 Square, Inc. - Cl. A * 514,011 1,664,803 Semiconductors & Semiconductor Equipment - 1.3% 3,080 Acacia Communications, Inc. * (a) 180,550 Software - 9.1% 13,440 Atlassian Corp. PLC - Cl. A * 402,528 6,601 LINE Corp. - ADR * (a) 253,874 27,230 Snap, Inc. - Cl. A * 613,492 1,269,894 4,974,137 MATERIALS - 1.0% Chemicals - 1.0% 5,490 Valvoline, Inc. (a) 134,780 UTILITIES - 1.4% Independent Power Producers & Energy Traders - 1.4% 11,227 NRG Yield, Inc. - Cl. C 198,718 TOTAL COMMON STOCKS (Cost - $11,908,242) 13,254,757
See Accompanying Notes to Financial Statements.
R e n a i s s a n c e C a p i t a l — T h e I P O E x p e r t Page 4
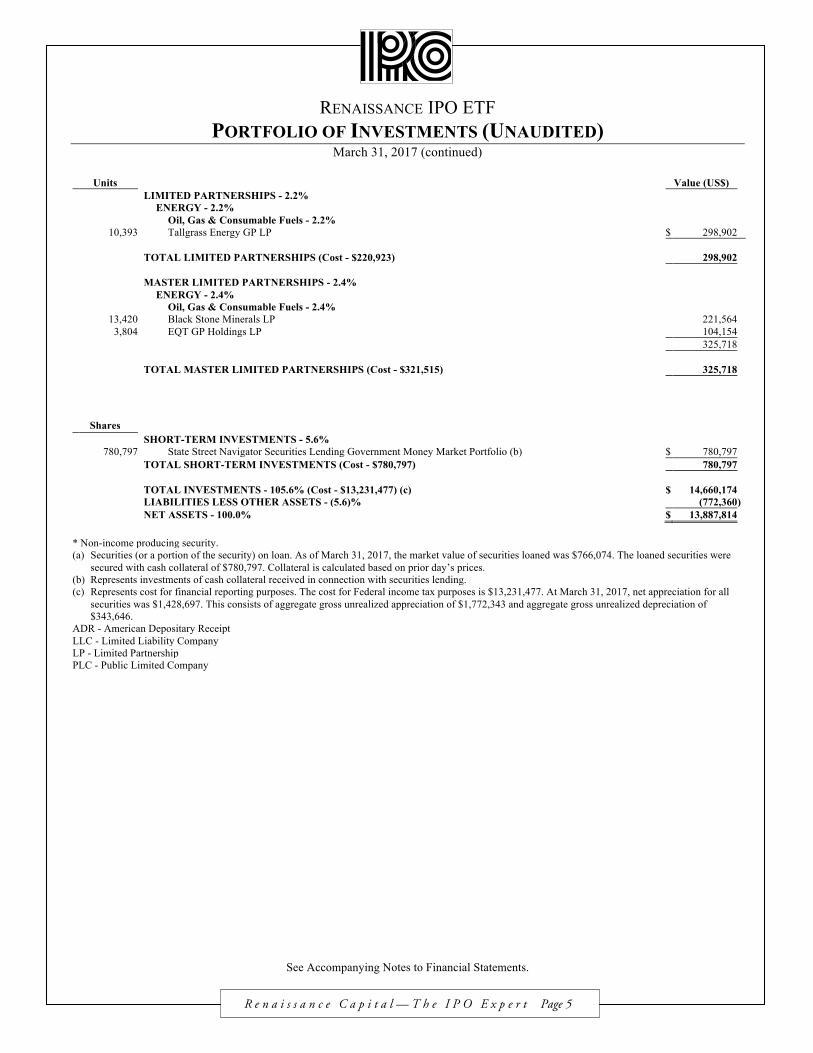
RENAISSANCE IPO ETF PORTFOLIO OF INVESTMENTS (UNAUDITED)
March 31, 2017 (continued)
Units Value (US$) LIMITED PARTNERSHIPS - 2.2% ENERGY - 2.2% Oil, Gas & Consumable Fuels - 2.2% 10,393 Tallgrass Energy GP LP $ 298,902 TOTAL LIMITED PARTNERSHIPS (Cost - $220,923) 298,902 MASTER LIMITED PARTNERSHIPS - 2.4% ENERGY - 2.4% Oil, Gas & Consumable Fuels - 2.4% 13,420 Black Stone Minerals LP 221,564 3,804 EQT GP Holdings LP 104,154 325,718 TOTAL MASTER LIMITED PARTNERSHIPS (Cost - $321,515) 325,718
Shares SHORT-TERM INVESTMENTS - 5.6% 780,797 State Street Navigator Securities Lending Government Money Market Portfolio (b) $ 780,797 TOTAL SHORT-TERM INVESTMENTS (Cost - $780,797) 780,797 TOTAL INVESTMENTS - 105.6% (Cost - $13,231,477) (c) $ 14,660,174 LIABILITIES LESS OTHER ASSETS - (5.6)% (772,360 ) NET ASSETS - 100.0% $ 13,887,814
* Non-income producing security. (a) Securities (or a portion of the security) on loan. As of March 31, 2017, the market value of securities loaned was $766,074. The loaned securities were
secured with cash collateral of $780,797. Collateral is calculated based on prior day’s prices. (b) Represents investments of cash collateral received in connection with securities lending. (c) Represents cost for financial reporting purposes. The cost for Federal income tax purposes is $13,231,477. At March 31, 2017, net appreciation for all
securities was $1,428,697. This consists of aggregate gross unrealized appreciation of $1,772,343 and aggregate gross unrealized depreciation of $343,646.
ADR - American Depositary Receipt LLC - Limited Liability Company LP - Limited Partnership PLC - Public Limited Company
See Accompanying Notes to Financial Statements.
R e n a i s s a n c e C a p i t a l — T h e I P O E x p e r t Page 5
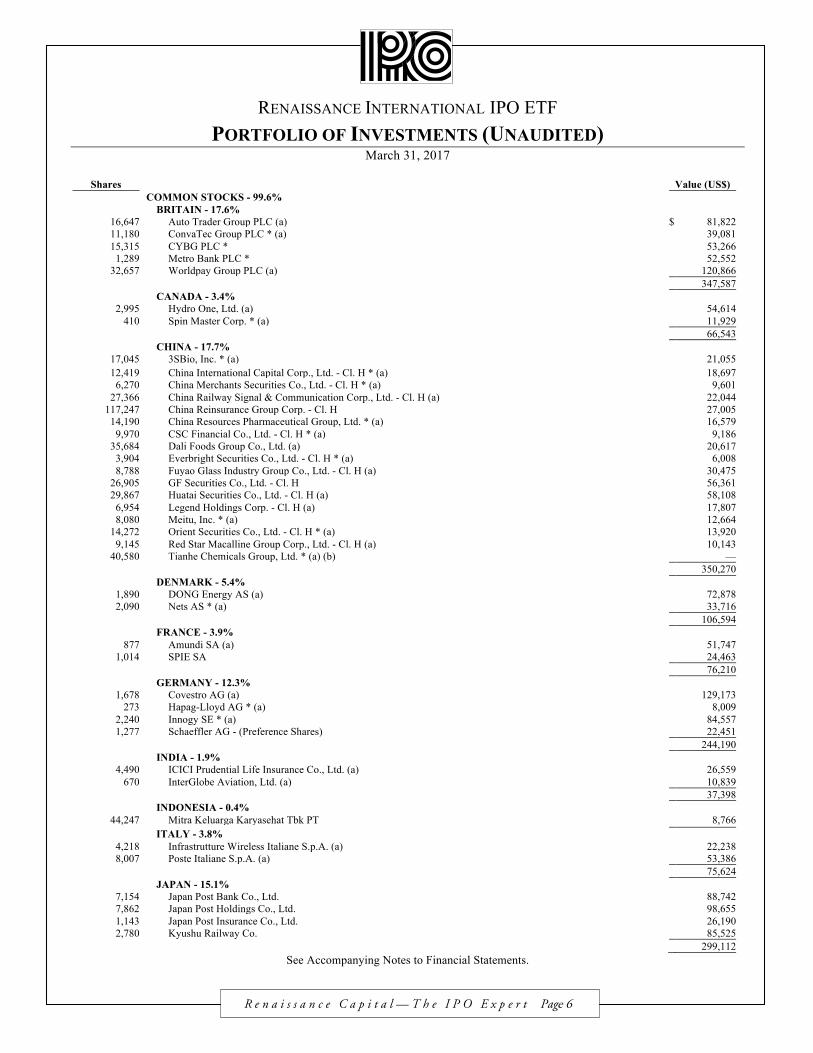
RENAISSANCE INTERNATIONAL IPO ETF PORTFOLIO OF INVESTMENTS (UNAUDITED)
March 31, 2017
Shares Value (US$) COMMON STOCKS - 99.6% BRITAIN - 17.6% 16,647 Auto Trader Group PLC (a) $ 81,822 11,180 ConvaTec Group PLC * (a) 39,081 15,315 CYBG PLC * 53,266 1,289 Metro Bank PLC * 52,552 32,657 Worldpay Group PLC (a) 120,866 347,587 CANADA - 3.4% 2,995 Hydro One, Ltd. (a) 54,614 410 Spin Master Corp. * (a) 11,929 66,543 CHINA - 17.7% 17,045 3SBio, Inc. * (a) 21,055 12,419 China International Capital Corp., Ltd. - Cl. H * (a) 18,697 6,270 China Merchants Securities Co., Ltd. - Cl. H * (a) 9,601 27,366 China Railway Signal & Communication Corp., Ltd. - Cl. H (a) 22,044 117,247 China Reinsurance Group Corp. - Cl. H 27,005 14,190 China Resources Pharmaceutical Group, Ltd. * (a) 16,579 9,970 CSC Financial Co., Ltd. - Cl. H * (a) 9,186 35,684 Dali Foods Group Co., Ltd. (a) 20,617 3,904 Everbright Securities Co., Ltd. - Cl. H * (a) 6,008 8,788 Fuyao Glass Industry Group Co., Ltd. - Cl. H (a) 30,475 26,905 GF Securities Co., Ltd. - Cl. H 56,361 29,867 Huatai Securities Co., Ltd. - Cl. H (a) 58,108 6,954 Legend Holdings Corp. - Cl. H (a) 17,807 8,080 Meitu, Inc. * (a) 12,664 14,272 Orient Securities Co., Ltd. - Cl. H * (a) 13,920 9,145 Red Star Macalline Group Corp., Ltd. - Cl. H (a) 10,143 40,580 Tianhe Chemicals Group, Ltd. * (a) (b) — 350,270 DENMARK - 5.4% 1,890 DONG Energy AS (a) 72,878 2,090 Nets AS * (a) 33,716 106,594 FRANCE - 3.9% 877 Amundi SA (a) 51,747 1,014 SPIE SA 24,463 76,210 GERMANY - 12.3% 1,678 Covestro AG (a) 129,173 273 Hapag-Lloyd AG * (a) 8,009 2,240 Innogy SE * (a) 84,557 1,277 Schaeffler AG - (Preference Shares) 22,451 244,190 INDIA - 1.9% 4,490 ICICI Prudential Life Insurance Co., Ltd. (a) 26,559 670 InterGlobe Aviation, Ltd. (a) 10,839 37,398 INDONESIA - 0.4% 44,247 Mitra Keluarga Karyasehat Tbk PT 8,766
ITALY - 3.8%
4,218 Infrastrutture Wireless Italiane S.p.A. (a) 22,238 8,007 Poste Italiane S.p.A. (a) 53,386 75,624 JAPAN - 15.1% 7,154 Japan Post Bank Co., Ltd.
88,742
7,862 Japan Post Holdings Co., Ltd. 98,655 1,143 Japan Post Insurance Co., Ltd. 26,190 2,780 Kyushu Railway Co. 85,525 299,112
See Accompanying Notes to Financial Statements.
R e n a i s s a n c e C a p i t a l — T h e I P O E x p e r t Page 6
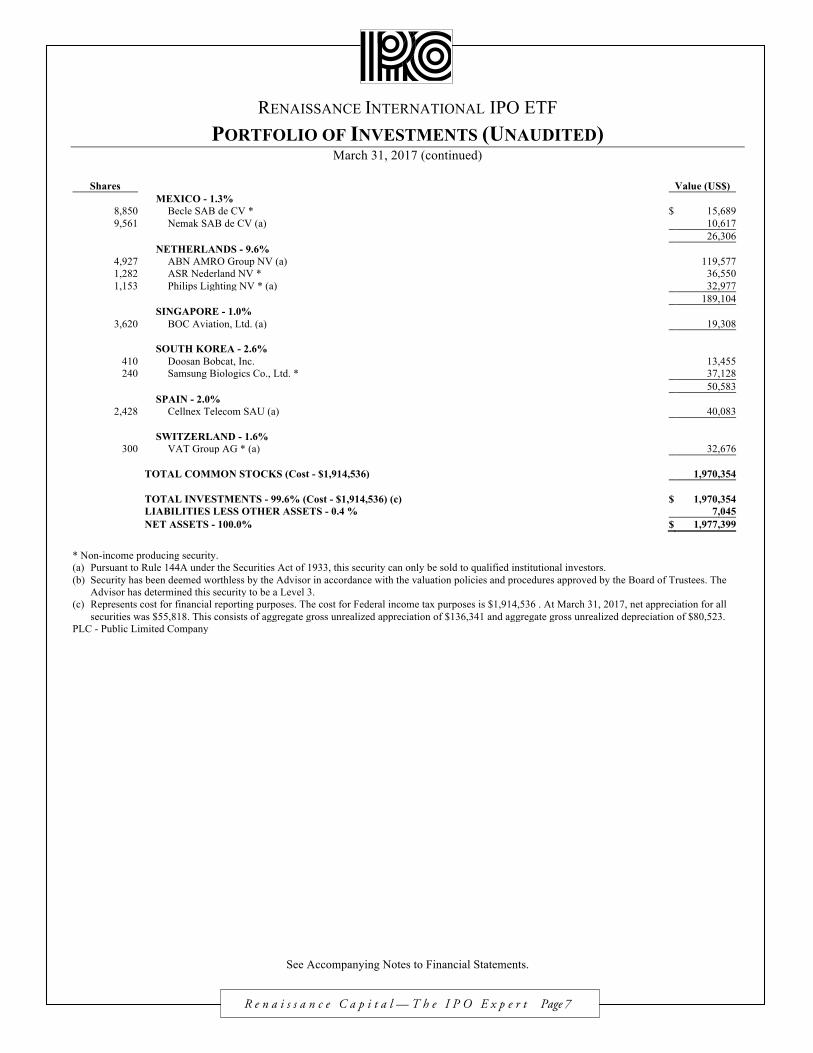
RENAISSANCE INTERNATIONAL IPO ETF PORTFOLIO OF INVESTMENTS (UNAUDITED)
March 31, 2017 (continued)
Shares Value (US$) MEXICO - 1.3% 8,850 Becle SAB de CV * $ 15,689 9,561 Nemak SAB de CV (a) 10,617 26,306 NETHERLANDS - 9.6% 4,927 ABN AMRO Group NV (a) 119,577 1,282 ASR Nederland NV * 36,550 1,153 Philips Lighting NV * (a) 32,977 189,104 SINGAPORE - 1.0% 3,620 BOC Aviation, Ltd. (a) 19,308 SOUTH KOREA - 2.6% 410 Doosan Bobcat, Inc. 13,455 240 Samsung Biologics Co., Ltd. * 37,128 50,583 SPAIN - 2.0% 2,428 Cellnex Telecom SAU (a) 40,083 SWITZERLAND - 1.6% 300 VAT Group AG * (a) 32,676 TOTAL COMMON STOCKS (Cost - $1,914,536) 1,970,354 TOTAL INVESTMENTS - 99.6% (Cost - $1,914,536) (c) $ 1,970,354 LIABILITIES LESS OTHER ASSETS - 0.4 % 7,045 NET ASSETS - 100.0% $ 1,977,399
* Non-income producing security. (a) Pursuant to Rule 144A under the Securities Act of 1933, this security can only be sold to qualified institutional investors. (b) Security has been deemed worthless by the Advisor in accordance with the valuation policies and procedures approved by the Board of Trustees. The
Advisor has determined this security to be a Level 3. (c) Represents cost for financial reporting purposes. The cost for Federal income tax purposes is $1,914,536 . At March 31, 2017, net appreciation for all
securities was $55,818. This consists of aggregate gross unrealized appreciation of $136,341 and aggregate gross unrealized depreciation of $80,523. PLC - Public Limited Company
See Accompanying Notes to Financial Statements.
R e n a i s s a n c e C a p i t a l — T h e I P O E x p e r t Page 7
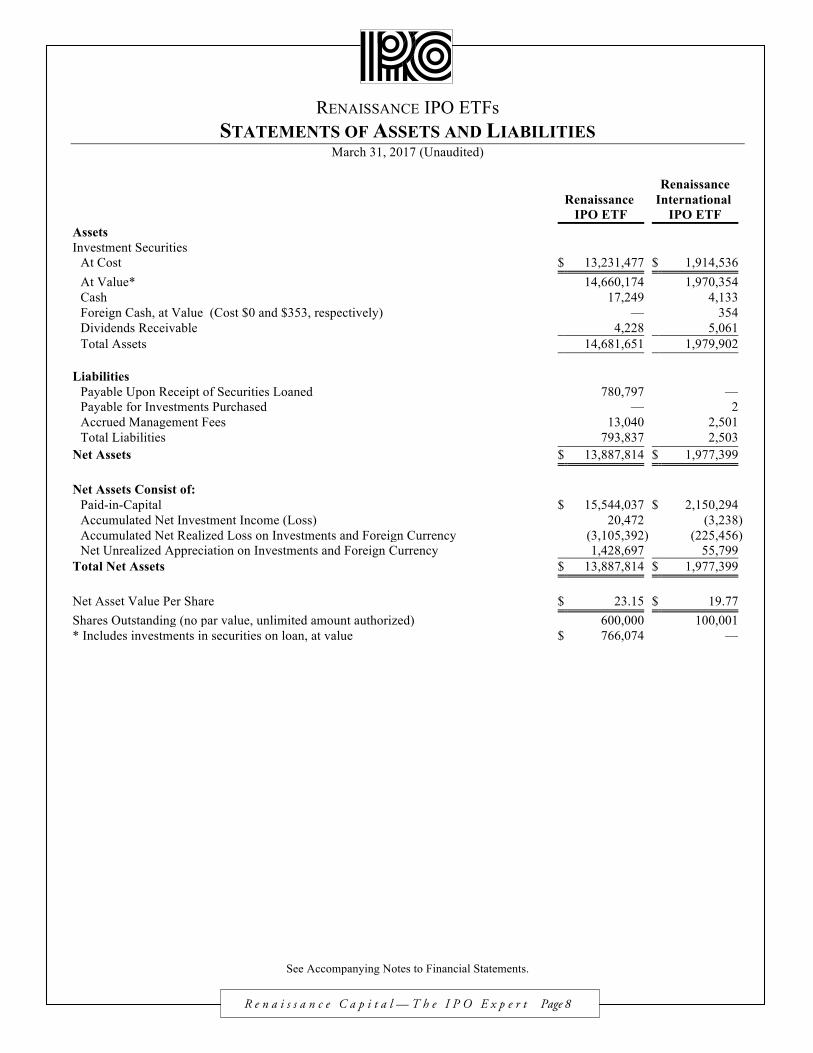
RENAISSANCE IPO ETFs STATEMENTS OF ASSETS AND LIABILITIES
March 31, 2017 (Unaudited)
Renaissance
IPO ETF
Renaissance International
IPO ETF Assets Investment Securities
At Cost $ 13,231,477 $ 1,914,536 At Value* 14,660,174 1,970,354 Cash 17,249 4,133 Foreign Cash, at Value (Cost $0 and $353, respectively) — 354 Dividends Receivable 4,228 5,061 Total Assets 14,681,651 1,979,902
Liabilities
Payable Upon Receipt of Securities Loaned 780,797 — Payable for Investments Purchased — 2 Accrued Management Fees 13,040 2,501 Total Liabilities 793,837 2,503
Net Assets $ 13,887,814 $ 1,977,399
Net Assets Consist of: Paid-in-Capital $ 15,544,037 $ 2,150,294 Accumulated Net Investment Income (Loss) 20,472 (3,238 ) Accumulated Net Realized Loss on Investments and Foreign Currency (3,105,392 ) (225,456 ) Net Unrealized Appreciation on Investments and Foreign Currency 1,428,697 55,799
Total Net Assets $ 13,887,814 $ 1,977,399
Net Asset Value Per Share $ 23.15 $ 19.77 Shares Outstanding (no par value, unlimited amount authorized) 600,000 100,001 * Includes investments in securities on loan, at value $ 766,074 —
See Accompanying Notes to Financial Statements.
R e n a i s s a n c e C a p i t a l — T h e I P O E x p e r t Page 8
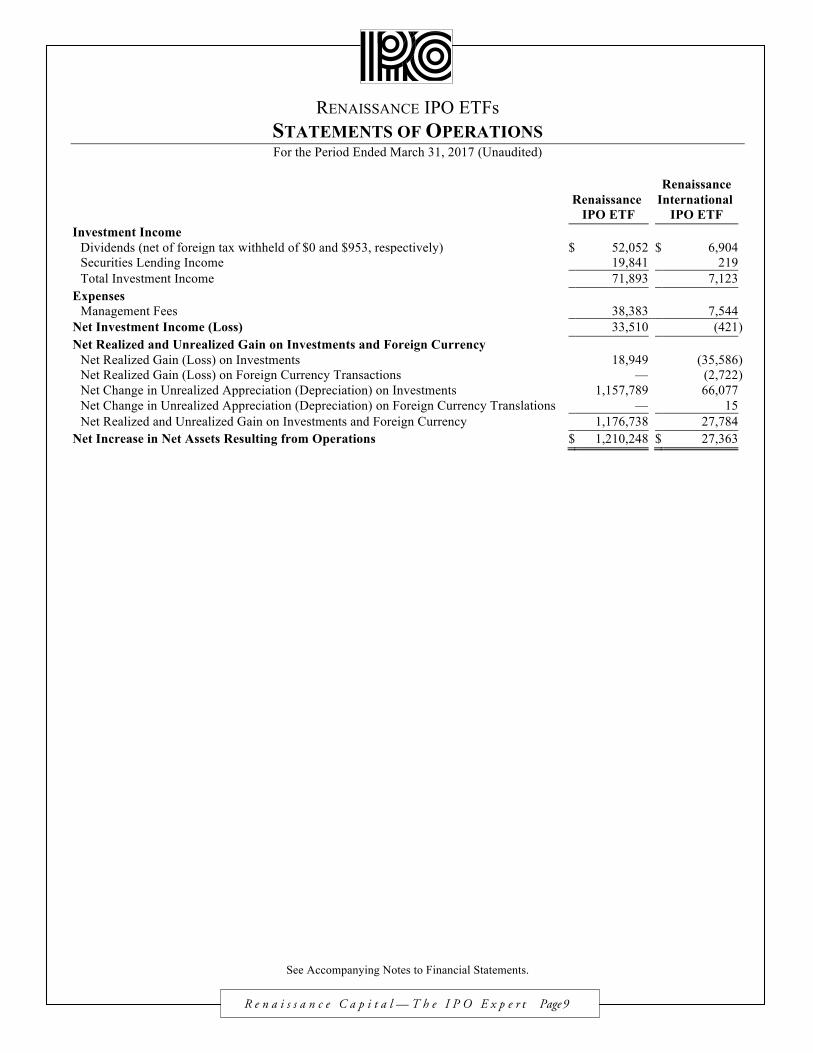
RENAISSANCE IPO ETFs STATEMENTS OF OPERATIONS For the Period Ended March 31, 2017 (Unaudited)
Renaissance
IPO ETF
Renaissance International
IPO ETF Investment Income
Dividends (net of foreign tax withheld of $0 and $953, respectively) $ 52,052 $ 6,904 Securities Lending Income 19,841 219 Total Investment Income 71,893 7,123
Expenses Management Fees 38,383 7,544
Net Investment Income (Loss) 33,510 (421 ) Net Realized and Unrealized Gain on Investments and Foreign Currency
Net Realized Gain (Loss) on Investments 18,949 (35,586 ) Net Realized Gain (Loss) on Foreign Currency Transactions — (2,722 ) Net Change in Unrealized Appreciation (Depreciation) on Investments 1,157,789 66,077 Net Change in Unrealized Appreciation (Depreciation) on Foreign Currency Translations — 15 Net Realized and Unrealized Gain on Investments and Foreign Currency 1,176,738 27,784
Net Increase in Net Assets Resulting from Operations $ 1,210,248 $ 27,363
See Accompanying Notes to Financial Statements.
R e n a i s s a n c e C a p i t a l — T h e I P O E x p e r t Page 9
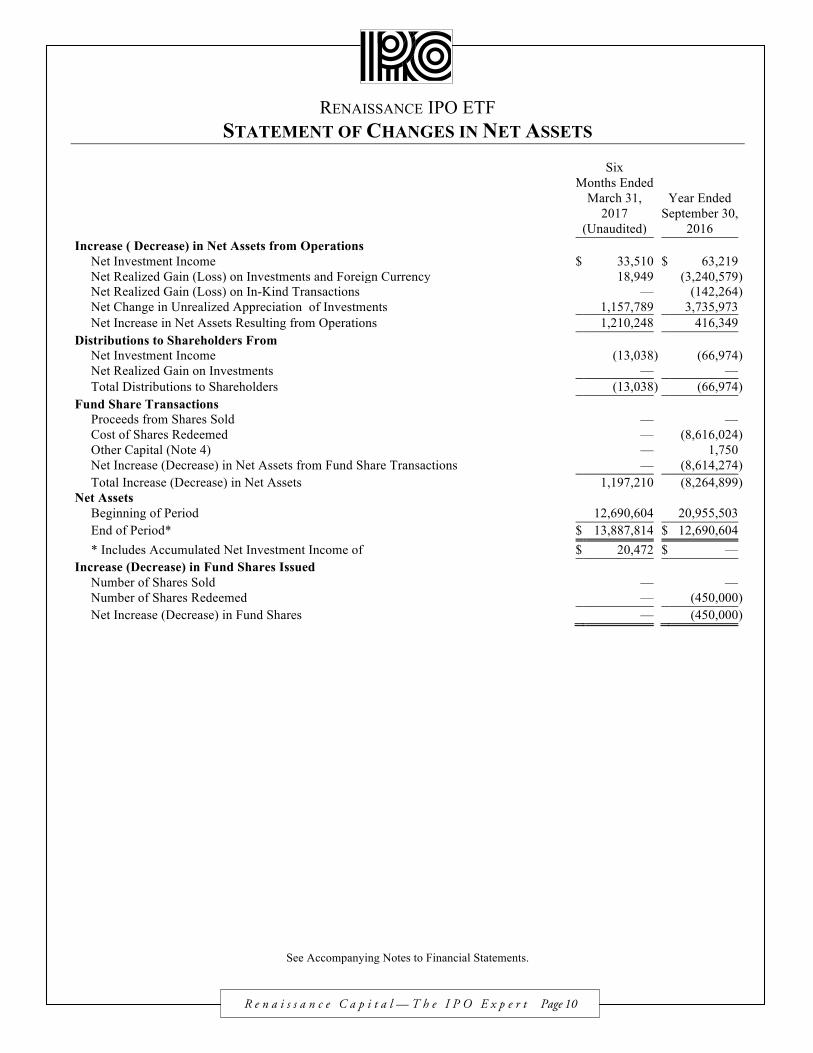
RENAISSANCE IPO ETF STATEMENT OF CHANGES IN NET ASSETS
Six
Months Ended
March 31, 2017
(Unaudited)
Year Ended September 30,
2016 Increase ( Decrease) in Net Assets from Operations
Net Investment Income $ 33,510 $ 63,219 Net Realized Gain (Loss) on Investments and Foreign Currency 18,949 (3,240,579 ) Net Realized Gain (Loss) on In-Kind Transactions — (142,264 ) Net Change in Unrealized Appreciation of Investments 1,157,789 3,735,973 Net Increase in Net Assets Resulting from Operations 1,210,248 416,349
Distributions to Shareholders From Net Investment Income (13,038 ) (66,974 ) Net Realized Gain on Investments — — Total Distributions to Shareholders (13,038 ) (66,974 )
Fund Share Transactions Proceeds from Shares Sold — — Cost of Shares Redeemed — (8,616,024 ) Other Capital (Note 4) — 1,750 Net Increase (Decrease) in Net Assets from Fund Share Transactions — (8,614,274 ) Total Increase (Decrease) in Net Assets 1,197,210 (8,264,899 )
Net Assets Beginning of Period 12,690,604 20,955,503 End of Period* $ 13,887,814 $ 12,690,604 * Includes Accumulated Net Investment Income of $ 20,472 $ —
Increase (Decrease) in Fund Shares Issued Number of Shares Sold — — Number of Shares Redeemed — (450,000 ) Net Increase (Decrease) in Fund Shares — (450,000 )
See Accompanying Notes to Financial Statements.
R e n a i s s a n c e C a p i t a l — T h e I P O E x p e r t Page 10
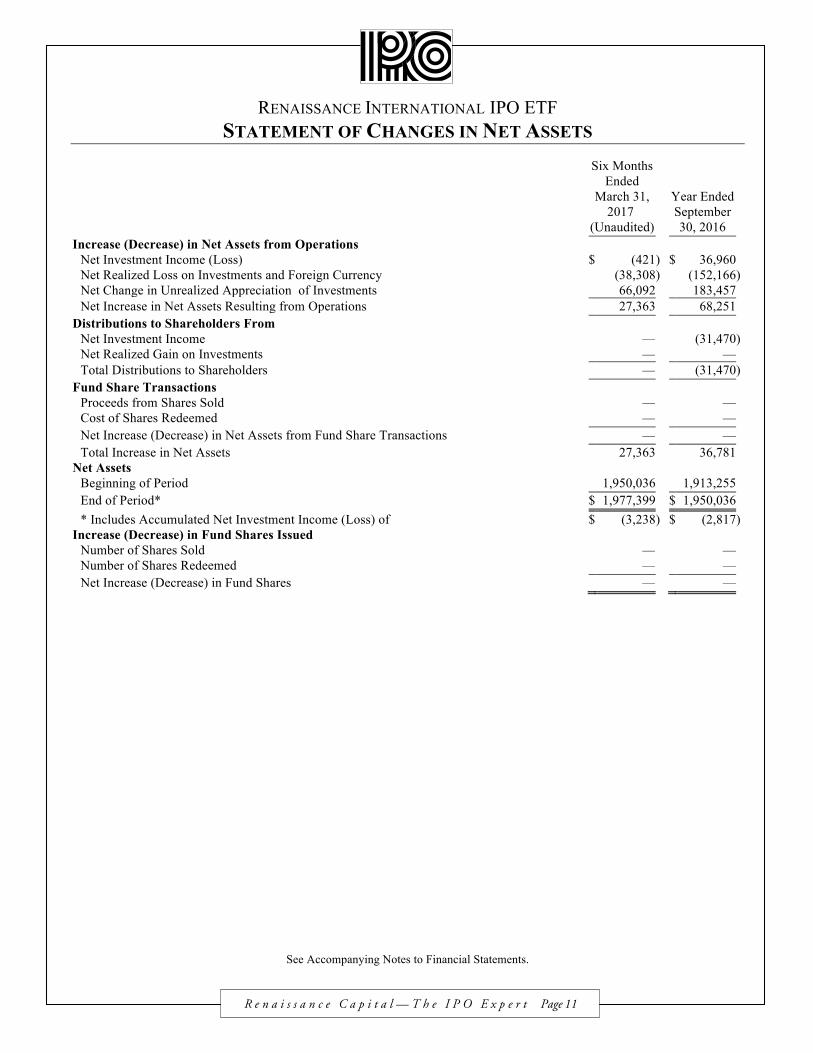
RENAISSANCE INTERNATIONAL IPO ETF STATEMENT OF CHANGES IN NET ASSETS
Six Months
Ended
March 31, 2017
(Unaudited)
Year Ended September 30, 2016
Increase (Decrease) in Net Assets from Operations Net Investment Income (Loss) $ (421 ) $ 36,960 Net Realized Loss on Investments and Foreign Currency (38,308 ) (152,166 ) Net Change in Unrealized Appreciation of Investments 66,092 183,457 Net Increase in Net Assets Resulting from Operations 27,363 68,251
Distributions to Shareholders From Net Investment Income — (31,470 ) Net Realized Gain on Investments — — Total Distributions to Shareholders — (31,470 )
Fund Share Transactions Proceeds from Shares Sold — — Cost of Shares Redeemed — — Net Increase (Decrease) in Net Assets from Fund Share Transactions — — Total Increase in Net Assets 27,363 36,781
Net Assets Beginning of Period 1,950,036 1,913,255 End of Period* $ 1,977,399 $ 1,950,036 * Includes Accumulated Net Investment Income (Loss) of $ (3,238 ) $ (2,817 )
Increase (Decrease) in Fund Shares Issued Number of Shares Sold — — Number of Shares Redeemed — — Net Increase (Decrease) in Fund Shares — —
See Accompanying Notes to Financial Statements.
R e n a i s s a n c e C a p i t a l — T h e I P O E x p e r t Page 11
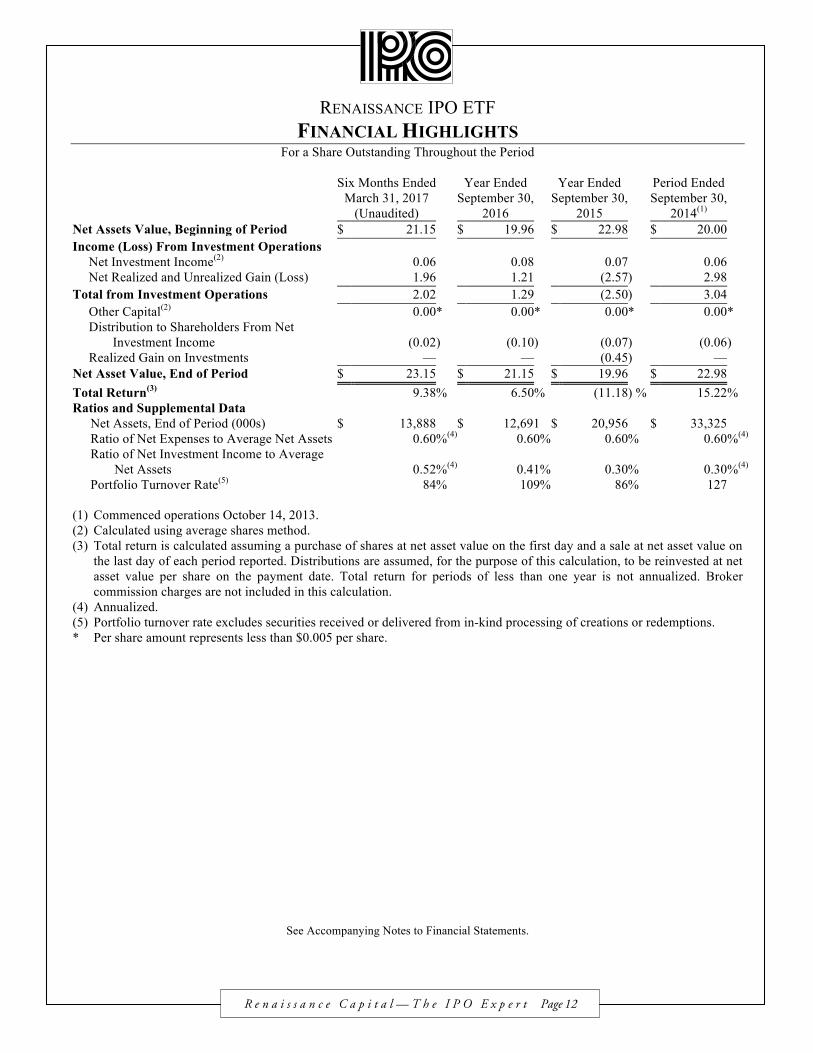
RENAISSANCE IPO ETF FINANCIAL HIGHLIGHTS
For a Share Outstanding Throughout the Period
Six Months Ended March 31, 2017
(Unaudited)
Year Ended September 30,
2016
Year Ended September 30,
2015
Period Ended September 30,
2014(1) Net Assets Value, Beginning of Period $ 21.15 $ 19.96 $ 22.98 $ 20.00 Income (Loss) From Investment Operations
Net Investment Income(2) 0.06 0.08 0.07 0.06 Net Realized and Unrealized Gain (Loss) 1.96 1.21 (2.57 ) 2.98
Total from Investment Operations 2.02 1.29 (2.50 ) 3.04 Other Capital(2) 0.00 * 0.00 * 0.00 * 0.00 * Distribution to Shareholders From Net
Investment Income (0.02 ) (0.10 ) (0.07 ) (0.06 ) Realized Gain on Investments — — (0.45 ) —
Net Asset Value, End of Period $ 23.15 $ 21.15 $ 19.96 $ 22.98 Total Return(3) 9.38 % 6.50 % (11.18 ) % 15.22 % Ratios and Supplemental Data
Net Assets, End of Period (000s) $ 13,888
$
12,691 $
20,956 $ 33,325 Ratio of Net Expenses to Average Net Assets 0.60 %(4) 0.60 % 0.60 % 0.60 %(4)
Ratio of Net Investment Income to Average Net Assets 0.52 %(4) 0.41 % 0.30 % 0.30 %(4)
Portfolio Turnover Rate(5) 84 % 109 % 86 % 127 (1) Commenced operations October 14, 2013. (2) Calculated using average shares method. (3)
Total return is calculated assuming a purchase of shares at net asset value on the first day and a sale at net asset value on the last day of each period reported. Distributions are assumed, for the purpose of this calculation, to be reinvested at net asset value per share on the payment date. Total return for periods of less than one year is not annualized. Broker commission charges are not included in this calculation.
(4) Annualized. (5) Portfolio turnover rate excludes securities received or delivered from in-kind processing of creations or redemptions. * Per share amount represents less than $0.005 per share.
See Accompanying Notes to Financial Statements.
R e n a i s s a n c e C a p i t a l — T h e I P O E x p e r t Page 12
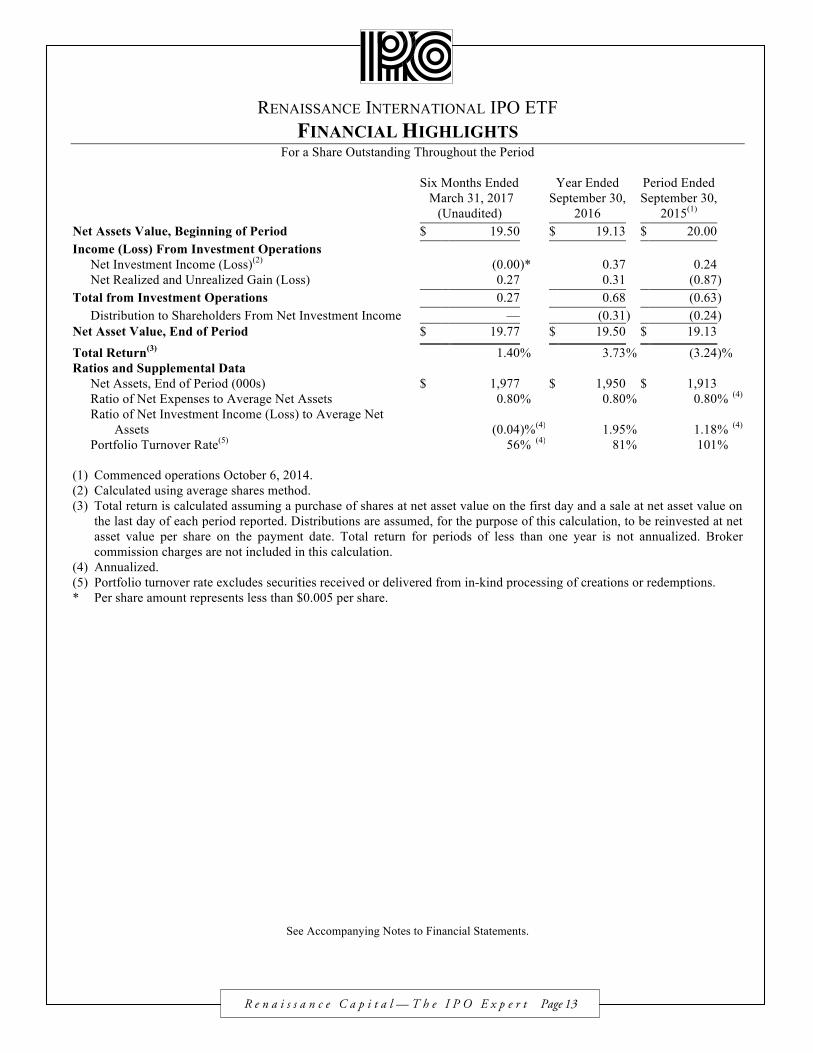
RENAISSANCE INTERNATIONAL IPO ETF FINANCIAL HIGHLIGHTS
For a Share Outstanding Throughout the Period
Six Months Ended March 31, 2017
(Unaudited)
Year Ended September 30,
2016
Period Ended September 30,
2015(1) Net Assets Value, Beginning of Period $
19.50 $ 19.13 $ 20.00
Income (Loss) From Investment Operations Net Investment Income (Loss)(2) (0.00 )* 0.37 0.24 Net Realized and Unrealized Gain (Loss) 0.27 0.31 (0.87 )
Total from Investment Operations 0.27 0.68 (0.63 ) Distribution to Shareholders From Net Investment Income — (0.31 ) (0.24 )
Net Asset Value, End of Period $
19.77 $ 19.50 $ 19.13 Total Return(3) 1.40 % 3.73 % (3.24 )% Ratios and Supplemental Data
Net Assets, End of Period (000s) $
1,977 $ 1,950 $ 1,913 Ratio of Net Expenses to Average Net Assets 0.80 % 0.80 % 0.80 % (4)
Ratio of Net Investment Income (Loss) to Average Net Assets (0.04 )% (4) 1.95 % 1.18 % (4)
Portfolio Turnover Rate(5) 56 % (4) 81 % 101 % (1) Commenced operations October 6, 2014. (2) Calculated using average shares method. (3)
Total return is calculated assuming a purchase of shares at net asset value on the first day and a sale at net asset value on the last day of each period reported. Distributions are assumed, for the purpose of this calculation, to be reinvested at net asset value per share on the payment date. Total return for periods of less than one year is not annualized. Broker commission charges are not included in this calculation.
(4) Annualized. (5) Portfolio turnover rate excludes securities received or delivered from in-kind processing of creations or redemptions. * Per share amount represents less than $0.005 per share.
See Accompanying Notes to Financial Statements.
R e n a i s s a n c e C a p i t a l — T h e I P O E x p e r t Page 13
RENAISSANCE IPO ETFs NOTES TO FINANCIAL STATEMENTS
For the Period Ended March 31, 2017 (Unaudited)
The Renaissance IPO ETF and the Renaissance International IPO ETF (each a “Fund” and collectively, the “Funds”) are a series of Renaissance Capital Greenwich Funds (“the Trust”), a Delaware Trust, operating as a registered, non-diversified, open-end investment company under the Investment Company Act of 1940, as amended (“1940 Act”). The Trust, organized on February 3, 1997, may issue an unlimited number of shares of the Funds. The shares of the Fund are referred to herein as “Shares.” The Trust currently consists of three series: an open-end mutual fund and the Funds. The Renaissance IPO ETF commenced operations on October 14, 2013 and the Renaissance International IPO ETF commenced operations on October 6, 2014. The financial statements herein relate solely to those of the Funds. The Funds are exchange-traded funds (“ETFs”). As ETFs, the Funds trade like other publicly-traded securities and are designed to track an index. Unlike shares of a mutual fund, which can be bought from and redeemed by the issuing fund by all shareholders at a price based on net asset value (“NAV”), Shares of the Funds may be directly purchased from and redeemed by a Fund at NAV solely by certain large institutional investors. The Shares of the Funds are listed on the NYSE Arca (the “Exchange”), and trade in the secondary market at market prices that may differ from the Shares’ NAV. 1. SIGNIFICANT ACCOUNTING POLICIES: The following is a summary of significant accounting policies followed by the Funds in preparation of their financial statements. These policies are in conformity with accounting principles generally accepted in the United States of America (“GAAP”). The preparation of financial statements in conformity with GAAP requires management to make estimates and assumptions that affect the reported amounts of assets and liabilities and disclosure of contingent assets and liabilities at the date of the financial statements and the reported amounts of increases and decreases in net assets from operations during the reporting period. Actual results could differ from those estimates. These financial statements are presented in United States dollars. Each Fund is an investment company and accordingly follows the investment company accounting and reporting guidance of the Financial Accounting Standards Board (FASB) Accounting Standard Codification Topic 946 "Financial Services - Investment Companies”. A. FOREIGN CURRENCY TRANSLATIONS: Values of investments denominated in foreign currencies are converted into U.S. dollars using the current exchange rates each business day. Purchases and sales of investments and dividend income are translated into U.S. dollars using the current prevailing exchange rate on the transaction date. The effect of changes in foreign exchange rates on realized and unrealized gains or losses on securities is reflected as a component of such gains or losses. Transactions in foreign denominated assets may involve greater risks than domestic transactions. B. SECURITY VALUATION: The values of the Funds’ securities are based on the securities’ closing prices on their principal markets, where available. In the absence of a last reported sales price, values may be based on the mean between the last bid and ask prices, if available. For restricted securities, as well as securities or other assets for which market quotations are not readily available or are unreliable, those securities are to be valued at fair value using good faith estimates as determined in accordance with the Trust’s Fund Securities Valuation Procedures, which is approved annually by the Board of Trustees (the “Board”). There is no single standard for determining the fair value of such securities. Rather, in determining the fair value of a security, the Fair Value Committee, after consulting with representatives of the Fund’s Adviser, Renaissance Capital LLC (the “Advisor”), and/or the Fund’s Administrator, State Street Bank and Trust, shall take into account the relevant factors and surrounding circumstances, a few of which may include: (i) market prices for a security or securities deemed comparable, including the frequency of trades or quotes for the security and comparable securities; (ii) dealer valuations of a security or securities deemed comparable; (iii) short-term instruments with maturities of 60 days or less at the date of the purchase are valued at amortized cost, which approximates fair value; short-term instruments with maturities greater than 60 days at the date of purchase are valued at the midpoint between the latest available and representative asked and bid prices, and commencing 60 days prior to maturity such securities are valued at amortized cost; and (iv) determinations of value by one or more pricing services for a security or securities deemed comparable. The Funds may also use fair value pricing in a variety of circumstances, including, but not limited to, situations where the value of a security in a Fund’s portfolio has been materially affected by events occurring after the close of the market on which the security is principally traded, or where trading in a security has been suspended or halted. Fair value pricing involves
R e n a i s s a n c e C a p i t a l — T h e I P O E x p e r t Page 14
RENAISSANCE IPO ETFs NOTES TO FINANCIAL STATEMENTS
For the Period Ended March 31, 2017 (Unaudited) (continued)
subjective judgments and it is possible that a fair value determination for a security is materially different than the value that could be realized upon the sale of the security. In addition, fair value pricing could result in a difference between the prices used to calculate the NAV of the Funds and the prices used by each of the Funds’ benchmark indices, the Renaissance IPO Index and the Renaissance International IPO Index, respectively (the “Indices”). This may adversely affect the Funds’ ability to track the Indices. The Funds utilize various methods to measure the fair value of most of their investments on a recurring basis. GAAP establishes a hierarchy that prioritizes inputs to valuation methods. The three levels of input are: Level 1 – Unadjusted quoted prices in active markets for identical assets and liabilities that the Funds have the ability to access. Level 2 – Observable inputs other than quoted prices included in Level 1 that are observable for the asset or liability, either directly or indirectly. These inputs may include quoted prices for the identical instrument on an inactive market, prices for the identical instrument on an inactive market, prices for similar instruments, interest rates, prepayment speeds, credit risk, yield curves, default rates and similar data. Level 3 – Unobservable inputs for the asset or liability, to the extent relevant observable inputs are not available, representing the Funds’ own assumptions about the assumptions a market participant would use in valuing the asset or liability and would be based on the best information available. The inputs or methodology used for valuing securities are not necessarily an indication of the risk associated with investing in those securities. At March 31, 2017, all of the Funds’ investments were valued based on Level 1 inputs, except as noted and detailed on the Portfolio of Investments. It is the Funds’ policy to record transfers in to or out of Level 1, Level 2, and Level 3 at the end of the reporting period. There were no significant transfers in to or out of any level during the current period presented. C. INVESTMENT INCOME: Dividend income is recorded on the ex-dividend date. Interest income, if any, is recorded on an accrual basis. D. INVESTMENT TRANSACTIONS: Security transactions are accounted for on a trade date basis for financial reporting purposes. In determining the gain or loss from the sale of securities, the cost of securities sold is determined on the basis of identified cost. 2. FEDERAL INCOME TAXES: It is the Funds’ intention to qualify as a regulated investment company under Subchapter M of the Internal Revenue Code and intend to distribute all of their taxable income to relieve it from all, or substantially all, Federal income and excise taxes. Accordingly, no provision for Federal income taxes is required in the financial statements. The Funds may be subject to foreign taxes on income, gains on investments, or currency repatriation, a portion of which may be recoverable. The Funds will accrue such taxes and recoveries as applicable, based upon its current interpretation of tax rules and regulations that exist in the markets in which it invests. The Funds recognize the tax benefits of uncertain tax positions only when the position is “more likely than not” to be sustained assuming examination by tax authorities. Management has reviewed the tax positions in the open tax years (current and prior years, as applicable) or expected to be taken in the Fund’s 2017 tax returns and concluded that no liability for unrecognized tax benefits should be recorded related to uncertain tax positions taken in the above open tax years. The Funds identify their major tax jurisdictions as U.S. Federal and foreign jurisdictions where the Funds make significant investments. A. DISTRIBUTIONS TO SHAREHOLDERS: The Funds will normally distribute substantially all of their net investment income at least annually. Any realized net capital gains will be distributed annually. The Funds may also pay a special distribution at any time to comply with U.S. federal tax requirements. All distributions are recorded on the ex-dividend date.
R e n a i s s a n c e C a p i t a l — T h e I P O E x p e r t Page 15
RENAISSANCE IPO ETFs NOTES TO FINANCIAL STATEMENTS
For the Period Ended March 31, 2017 (Unaudited) (continued)
The amount and character of income and capital gain distributions to be paid are determined in accordance with Federal income tax regulations, which may differ from GAAP. These “book/tax” differences are considered either temporary (e.g., deferred losses, capital loss carryforwards) or permanent in nature. To the extent these differences are permanent in nature, such amounts are reclassified within the composition of net assets based on their federal tax-basis treatment; temporary differences do not require reclassification. Any such reclassifications will have no effect on net assets, results of operations, or net asset values per share of the Funds. 3. FEES AND EXPENSES A. MANAGEMENT FEE: The Advisor serves as investment advisor to the Funds pursuant to an investment management agreement between the Trust and the Advisor (the “Investment Management Agreement”). Under the Investment Management Agreement, the Advisor, subject to the supervision of the Board and in conformity with the stated investment policies of the Funds, manages the investment of the Funds’ assets. The Advisor is responsible for placing purchase and sale orders and providing continuous supervision of the investment portfolio of the Funds. Pursuant to a Supervision and Administration Agreement between the Trust, on behalf of the Funds, and the Advisor, the Advisor oversees the operation of the Funds, provides or causes to be furnished the advisory, supervisory, administrative, distribution, transfer agency, custody and all other services necessary for the Funds to operate, and exercises day-to-day oversight over the Funds’ service providers. Under the Supervision and Administration Agreement, the Advisor also bears all the fees and expenses incurred in connection with its obligations under the Supervision and Administration Agreement, including, but not limited to, the costs of various third-party services required by the Funds, including audit, certain custody, portfolio accounting, legal, transfer agency and printing costs, except those fees and expenses specifically assumed by the Trust on behalf of the Funds. Pursuant to the terms of each of the Investment Management Agreement and the Supervision and Administration Agreement, the Trust has agreed to indemnify the Advisor for certain liabilities, including certain liabilities arising under the federal securities laws, unless such loss or liability results from willful misfeasance, bad faith or gross negligence in the performance of its duties or the reckless disregard of its obligations and duties. The Investment Management Agreement also provides that the Advisor may engage in other businesses, devote time and attention to any other business, whether of a similar or dissimilar nature, and render investment advisory services to others. As compensation for its services, the Advisor is paid a monthly management fee for providing investment advisory, supervisory, administrative and other services the Funds require under an all-in fee structure based on a percentage of the Funds’ average daily net assets at the annual rate of 0.60% for Renaissance IPO ETF and 0.80% for Renaissance International IPO ETF. The Funds also bear certain other expenses, which are specifically excluded from being covered under the management fee and the Supervision and Administration Agreement (“Excluded Expenses”) and may vary and will affect the total level of expenses paid by the Funds. Such Excluded Expenses include taxes, brokerage fees, commissions and other transaction expenses, interest and extraordinary expenses (such as litigation and indemnification expenses). The Funds also bear asset-based custodial fees not covered by the Supervision and Administration Agreement. B. DISTRIBUTION AND SERVICING FEES: Foreside Fund Services, LLC (the “Distributor”) serves as the distributor of the Shares of the Funds. The Board of Trustees of the Trust has adopted a distribution and services plan (the “Plan”) pursuant to Rule 12b-1 under the 1940 Act. Under the Plan, the Funds are authorized to pay distribution fees in connection with the sale and distribution of their Shares and pay service fees in connection with the provision of ongoing services to shareholders and the maintenance of shareholder accounts in an amount up to 0.25% of the Funds’ average daily net assets each year. No Rule 12b-1 fees are currently paid by the Funds, and there are no current plans to impose these fees. However, in the event Rule 12b-1 fees are charged in the future, because these fees are paid out of the Funds’ assets on an ongoing basis, these fees will increase the cost of your investment in the Funds.
R e n a i s s a n c e C a p i t a l — T h e I P O E x p e r t Page 16
RENAISSANCE IPO ETFs NOTES TO FINANCIAL STATEMENTS
For the Period Ended March 31, 2017 (Unaudited) (continued)
4. SHAREHOLDER TRANSACTIONS: The Funds issue and redeem Shares at NAV only in a large specified number of Shares each called a “Creation Unit,” or multiples thereof. Creation Units are sold to and from institutional brokers through participation agreements. Except when aggregated in Creation Units, Shares of the Funds are not redeemable. Such transactions generally consist of the in-kind deposit of a designated portfolio of equity securities (the “Deposit Securities”) that comprise the Index and an amount of cash computed as described below (the “Cash Component”) or, as permitted or required by the Funds, of cash. The Cash Component together with the Deposit Securities, as applicable, are referred to as the “Fund Deposit,” which represents the minimum initial and subsequent investment amount for Shares. The Cash Component represents the difference between the NAV of a Creation Unit and the market value of Deposit Securities and may include a Dividend Equivalent Payment. The “Dividend Equivalent Payment” enables the Funds to make a complete distribution of dividends on the next dividend payment date, and is an amount equal, on a per Creation Unit basis, to the dividends on all the securities held by the Funds (“Fund Securities”) with ex-dividend dates within the accumulation period for such distribution (the “Accumulation Period”), net of expenses and liabilities for such period, as if all of the Fund Securities had been held by the Trust for the entire Accumulation Period. The Accumulation Period begins on the ex-dividend date for the Funds and ends on the next ex-dividend date. Transactions in capital shares for the Funds are disclosed in detail in the Statements of Changes in Net Assets. A fixed transaction fee of $500 per Creation Unit for the Renaissance IPO ETF and $1,000 per Creation Unit for the Renaissance International IPO ETF, regardless of the number of Creation Units that are created or redeemed on the same day, is charged to the institutional broker creating or redeeming Creation Units. An additional variable fee may be charged for certain transactions. Transaction fees are received by the Trust and/or Custodian and are used to defray related expenses. The amounts are included in Other Capital on the Statements of Changes in Net Assets. 5. INDEMNIFICATION: Under the Funds’ organizational documents, their officers and trustees are indemnified against certain liabilities arising out of the performance of their duties for the Funds. In addition, in the normal course of business, the Funds may enter into contracts with vendors that contain a variety of representations and warranties that provide general indemnification. The Funds’ maximum exposure under these arrangements is unknown, as this would involve future claims that may be made against the Funds. However, based on experience, the risk of loss due to these warranties appears to be remote. 6. INVESTMENT TRANSACTIONS: For the six months ended March 31, 2017, the Renaissance IPO ETF and the Renaissance International IPO ETF did not have any in-kind transactions. The in-kind contributions and in-kind redemptions may not agree with the Fund Share Transactions on the Statements of Changes in Net Assets. The amounts represent the accumulation of each Fund’s daily net shareholder transactions while the Statements of Changes in Net Assets reflects gross shareholder transactions including any cash component of the transaction. The length of time the Funds have held a particular security is not generally a consideration in investment decisions. A change in the securities held by each Fund is known as “portfolio turnover.” The Funds may engage in frequent and active trading of portfolio securities to achieve their investment objective, including, without limitation, to reflect changes in the component securities of the Index, such as reconstitutions or additions or deletions of component securities. To the extent that Creation Unit purchases from and redemptions by the Funds are effected in cash, frequent purchases and redemptions may increase the rate of portfolio turnover. High portfolio turnover involves correspondingly greater expenses to the Funds, including brokerage commissions or dealer mark-ups and other transaction costs on the sale of securities and reinvestments in other securities. Such sales may also result in realization of taxable capital gains, including short-term capital gains (which are generally taxed at ordinary income tax rates). The trading costs and tax effects associated with portfolio turnover may adversely affect the Funds’ performance. The portfolio turnover rates are reported in the Financial Highlights. For the six months ended March 31, 2017, the Renaissance IPO ETF made purchases with a cost of $11,079,578 and sales with proceeds of $10,825,866 of investment securities and the Renaissance International IPO ETF made purchases with a cost of $1,065,443 and sales with proceeds of $1,072,202 of investment securities (excluding short-term securities).
R e n a i s s a n c e C a p i t a l — T h e I P O E x p e r t Page 17
RENAISSANCE IPO ETFs NOTES TO FINANCIAL STATEMENTS
For the Period Ended March 31, 2017 (Unaudited) (continued)
7. SECURITIES LENDING: The Funds may lend their portfolio securities to brokers, dealers and other financial institutions desiring to borrow securities to complete transactions and for other purposes. In connection with such loans, the Funds receive liquid collateral equal to at least 102% for U.S. securities and 105% for international securities of the value of the portfolio securities being loaned. This collateral is marked-to-market on a daily basis. Although the Funds will receive collateral in connection with all loans of its securities holdings, the Funds would be exposed to a risk of loss should a borrower fail to return the borrowed securities (e.g., the loaned securities may have appreciated beyond the value of the collateral held by the Funds) or become insolvent. The Funds may pay fees to the party arranging the loan of securities. In addition, the Funds will bear the risk of loss of any cash collateral that it invests. The Funds will then invest the cash collateral received in the State Street Navigator Securities Lending Government Money Market Portfolio, and record a liability for the return of the collateral, during the period the securities are on loan. The Funds are subject to a lending limit of 33⅓% of total assets (including the value of collateral). The loans are subject to termination at the option of the borrower or the Funds. Upon termination of the loan, the borrower will return to the lender securities identical to the loaned securities. Should the borrower of the securities fail to return loaned securities, the Funds have the right to repurchase the securities using the collateral in the open market. The borrower pays fees at the Funds’ direction to the lending agent. The lending agent may retain a portion of the fees and interest earned on the cash collateral invested as compensation for its services. Investments made with the cash collateral are disclosed on the Schedules of Investments. The lending fees and the Funds’ portion of the interest income earned on the cash collateral are included on the Statements of Operations as securities lending income. See the Portfolio of Investments for information about the value of the securities on loan and their related collateral. The loaned securities are subject to enforceable netting arrangements and as of March 31, 2017, the value of the related collateral exceeded the value of the securities loaned.
Gross Amounts not offset in the Statement of Financial Position
Securities Lending
Gross Amounts of Recognized
Liabilities
Gross Amounts Offset in the Statement of
Financial Position
Net Amounts Presented in the
Statement of Financial Position
Financial Instruments
Collateral Pledged
(Received)
Net Amount
Renaissance IPO ETF $ 780,797 $ — $780,797 $ 780,797 (a) $ — $ —
(a) Collateral for securities on loan is included in the Schedule of Investments The following table represents the amount of payables for cash collateral received on securities on loan as shown on the Statements of Assets and Liabilities for the six months ended March 31, 2017:
Remaining Contractual Maturity of the Agreements
As of March 31, 2017
Overnight and
Continuous
<30 days
Between 30 & 90 days
>90 days
Total
Securities Lending Transactions Common Stocks $ 780,797 $ — $ — $ — $ 780,797
Total Borrowings $ 780,797 $ — $ — $ — $ 780,797 Gross amount of recognized liabilities for securities lending transactions $ 780,797 8. PRINCIPAL RISKS: Investors in the Funds should be willing to accept a high degree of volatility in the price of the Funds’ Shares and the possibility of significant losses. An investment in the Funds involves a substantial degree of risk. Therefore, you should consider carefully the following risks before investing in the Funds. In the normal course of business the Funds trade financial instruments and enter into financial transactions where risk of potential loss exists due to such
R e n a i s s a n c e C a p i t a l — T h e I P O E x p e r t Page 18
RENAISSANCE IPO ETFs NOTES TO FINANCIAL STATEMENTS
For the Period Ended March 31, 2017 (Unaudited) (continued)
things as changes in the market (market risk) or failure or inability of the other party to a transaction to perform (credit and counterparty risk). See below for a detailed description of selected principal risks. For a more comprehensive list of potential risks the Funds may be subject to, please see the Funds’ Prospectus. A. RISK OF INVESTING IN IPOs. The Funds invest in companies that have recently completed an initial public offering. The stocks of such companies are unseasoned equities lacking a trading history, a track record of reporting to investors, widely available research coverage and often may have a limited operating history. IPOs are thus often subject to extreme price volatility and speculative trading. These stocks may have above-average price appreciation in connection with the initial public offering prior to inclusion in the Indices. The price of stocks included in the Indices may not continue to appreciate and the performance of these stocks may not replicate the performance exhibited in the past. In addition, IPOs share similar illiquidity risks of private equity and venture capital. The free float shares held by the public in an IPO are typically a small percentage of the market capitalization. The ownership of many IPOs often include large holdings by venture capital and private equity investors who seek to sell their shares in the public market in the months following an IPO when shares restricted by lock-up are released, causing greater volatility and possible downward pressure during the time that locked-up shares are released. B. FINANCIAL SECTOR RISK. Financial companies frequently represent the largest sector in the Renaissance International IPO Index. Financial companies are especially subject to the adverse effects of economic recession, currency exchange rates, government regulation, decreases in the availability of capital, volatile interest rates, portfolio concentrations in geographic markets and in commercial and residential real estate loans, and competition from new entrants in their fields of business. C. INFORMATION TECHNOLOGY RISK. Information technology companies frequently represent the largest sector in the Renaissance IPO Index. Information technology companies are generally subject to the risks of rapidly changing technologies; short product life cycles; fierce competition; aggressive pricing and reduced profit margins; the loss of patent, copyright and trademark protections; cyclical market patterns; evolving industry standards; and frequent new product introductions. Information technology companies may be smaller and less experienced companies, with limited product lines, markets or financial resources and fewer experienced management or marketing personnel. Information technology company stocks, especially those which are internet-related, have experienced extreme price and volume fluctuations that are often unrelated to their operating performance. D. SMALL AND MID-CAPITALIZATION COMPANY RISK. The Funds invest in small and mid-capitalization companies. Such companies may be more vulnerable to adverse general market or economic developments, and their securities may be less liquid and may experience greater price volatility than larger, more established companies as a result of several factors, including limited trading volumes, products or financial resources, management inexperience and less publicly available information. Accordingly, such companies are generally subject to greater market risk than larger, more established companies. E. DEPOSITARY RECEIPT RISK. The Funds may hold the securities of non-U.S. companies in the form of ADRs and GDRs. ADRs are negotiable certificates issued by a U.S. financial institution that represent a specified number of shares in a foreign stock and trade on a U.S. national securities exchange, such as the New York Stock Exchange. GDRs are certificates issued in more than one country for shares in a foreign company. The shares are held by a foreign branch of an international bank. The shares trade as domestic shares, but are offered for sale globally through the various bank branches. Sponsored ADRs or GDRs are issued with the support of the issuer of the foreign stock underlying the ADRs or GDRs and carry all of the rights of common shares, including voting rights. The underlying securities of the ADRs and GDRs in the Funds’ portfolios are usually denominated or quoted in currencies other than the U.S. Dollar. As a result, changes in foreign currency exchange rates may affect the value of the Funds’ portfolios. In addition, because the underlying securities of ADRs or GDRs trade on foreign exchanges at times when the U.S. markets are not open for trading, the value of the securities underlying the ADRs or GDRs may change materially at times when the U.S. markets are not open for trading, regardless of whether there is an active U.S. market for shares of the Funds.
R e n a i s s a n c e C a p i t a l — T h e I P O E x p e r t Page 19
RENAISSANCE IPO ETFs NOTES TO FINANCIAL STATEMENTS
For the Period Ended March 31, 2017 (Unaudited) (continued)
F. REIT RISK. Investments in securities of real estate companies involve risks. These risks include, among others, adverse changes in foreign, national, state or local real estate conditions; obsolescence of properties; changes in the availability, cost and terms of mortgage funds; and the impact of changes in environmental laws. In addition, a Real Estate Investment Trust (a “REIT”) that fails to comply with foreign or domestic tax requirements affecting REITs may be subject to income taxation, including the U.S. federal tax requirement that a REIT distribute substantially all of its net income to its shareholders may result in a REIT having insufficient capital for future expenditures. The value of a REIT can depend on the structure of and cash flow generated by the REIT. In addition, like mutual funds, REITs have expenses, including advisory and administration fees that are paid by their shareholders. As a result, you will absorb duplicate levels of fees when the Funds invest in REITs. In addition, REITs are subject to certain provisions under federal tax law. The failure of a company to qualify as a REIT could have adverse consequences for a Fund, including significantly reducing return to the Fund on its investment in such company. G. PARTNERSHIP UNIT RISK. Investments in partnership units, such as master limited partnerships and trusts, involve risks that differ from an investment in common stock. Holders of partnership units have more limited control and limited rights to vote on matters affecting the partnership. There are also certain tax risks associated with an investment in partnership units. In addition, conflicts of interest may exist between common unit holders, subordinated unit holders and the general partner of a partnership, including a conflict arising as a result of incentive distribution payments. H. NON-U.S. ISSUER RISK. Certain companies in which the Funds may invest may be non-U.S. issuers whose securities are listed on U.S. exchanges. These securities involve risks beyond those associated with investments in U.S. securities, including greater market volatility, higher transactional costs, the possibility that the liquidity of such securities could be impaired because of future political and/or economic developments, taxation by foreign governments, political instability, the possibility that foreign governmental restrictions may be adopted which might adversely affect such securities and that the selection of such securities may be more difficult because there may be less publicly available information concerning such non-U.S. issuers or the accounting, auditing and financial reporting standards, practices and requirements applicable to non-U.S. issuers may differ from those applicable to U.S. issuers. Current political uncertainty surrounding the European Union (the “EU”) and its membership, including the 2016 referendum in which the United Kingdom voted to exit the EU, may increase market volatility. I. EMERGING MARKETS RISK. The funds may invest a portion of their portfolios in securities of issuers located in emerging markets. Emerging market companies involve certain risks not associated with investing in developed market countries because emerging market countries are often in the initial stages of their industrialization cycles and have low per capita income. These increased risks include the possibility of investment and trading limitations, greater liquidity concerns, higher price volatility, greater delays and possibility of disruptions in settlement transactions, greater political uncertainties and greater dependence on international trade or development assistance. In addition, emerging market countries may be subject to overburdened infrastructures and environmental problems. J. EQUITY SECURITIES RISK. The value of the equity securities held by the Funds may fall due to general market and economic conditions, perceptions regarding the markets in which the issuers of securities held by the Funds participate, or factors relating to specific issuers in which the Funds invest. Equity securities are subordinated to preferred securities and debt in a company’s capital structure with respect to priority in right to a share of corporate income, and therefore will be subject to greater dividend risk than preferred securities or debt instruments. In addition, while broad market measures of equity securities have historically generated higher average returns than fixed income securities, equity securities have also experienced significantly more volatility in those returns. K. MARKET RISK. The prices of the securities in the Funds are subject to the risk associated with investing in the securities market, including general economic conditions and sudden and unpredictable drops in value. An investment in the Funds may lose money. L. INDEX TRACKING RISK. The Funds’ returns may not match the returns of the Indices for a number of reasons. For example, a Fund incurs a number of operating expenses not applicable to its Index and incurs costs associated with buying and selling securities, especially when rebalancing a Fund’s securities holdings to reflect changes in the composition of its
R e n a i s s a n c e C a p i t a l — T h e I P O E x p e r t Page 20
RENAISSANCE IPO ETFs NOTES TO FINANCIAL STATEMENTS
For the Period Ended March 31, 2017 (Unaudited) (continued)
Index. Because the Funds bear the costs and risks associated with buying and selling securities while such costs and risks are not factored into the returns of the Indices, the Funds’ returns may deviate significantly from the returns of the Indices. In addition, the Funds may not be able to invest in certain securities included in the Indices, or invest in them in the exact proportions in which they are represented in the Indices, due to legal restrictions or other limitations. To the extent that a Fund calculates its NAV based on fair value prices and the value of the Index is based on securities’ closing prices, a Fund’s ability to track its Index may be adversely affected. M. REPLICATION MANAGEMENT RISK. An investment in the Funds involves risks similar to those of investing in any fund of equity securities traded on an exchange, such as market fluctuations caused by such factors as economic and political developments, changes in interest rates and perceived trends in security prices. However, because the Funds are not “actively” managed, unless a specific security is removed from one of the Indices, the Funds generally would not sell a security because the security’s issuer was in financial trouble. Therefore, the Funds’ performance could be lower than funds that may actively shift their portfolio assets to take advantage of market opportunities or to lessen the impact of a market decline or a decline in the value of one or more issuers. N. PREMIUM/DISCOUNT RISK. Disruptions to creations and redemptions, the existence of extreme market volatility or potential lack of an active trading market for Shares may result in Shares trading at a significant premium or discount to NAV. If a shareholder purchases Shares at a time when the market price is at a premium to the NAV or sells Shares at a time when the market price is at a discount to the NAV, the shareholders may sustain losses. O. NON-DIVERSIFIED RISK. The Funds are classified as a “non-diversified” investment company under the 1940 Act. Therefore, the Funds may invest a relatively high percentage of their assets in a smaller number of issuers or may invest a larger proportion of their assets in a single company. As a result, the gains and losses on a single investment may have a greater impact on the Funds’ NAV and may make the Funds more volatile than more diversified funds. The Funds may be particularly vulnerable to this risk because they seek to replicate indices that are comprised of a limited number of securities. P. CONCENTRATION RISK. A Fund’s assets may be concentrated in a particular sector or sectors or industry or group of industries to the extent its Index concentrates in a particular sector or sectors or industry or group of industries. The Funds may be subject to the risk that economic, political or other conditions that have a negative effect on that industry will negatively impact the Funds to a greater extent than if the Funds’ assets were invested in a wider variety of sectors or industries. Q. SECURITIES LENDING RISK. The Funds may engage in securities lending. Securities lending involves the risk that the fund may lose money because the borrower of the Funds’ loaned securities fails to return the securities in a timely manner or at all. The Funds could also lose money in the event of a decline in the value of the collateral provided for the loaned securities or a decline in the value of any investments made with cash collateral. These events could also trigger adverse tax consequences for the Funds. R. CUSTODY RISK. The Renaissance International IPO ETF invests in securities on non-U.S. exchanges. Custody risk refers to risks in the process of clearing and settling trades and to the holding of securities by local banks, agents and depositories. Low trading volumes and volatile prices in less developed markets make trades harder to complete and settle. Local agents are held only to the standard of care of the local markets. Governments or trade groups may compel local agents to hold securities in designated depositories that are subject to independent evaluation. The less developed a country’s securities market is, the greater the likelihood of custody problems occurring. S. CURRENCY RISK. The Funds hold investments that are denominated in non-U.S. currencies, or in securities that provide exposure to such currencies, currency exchange rates or interest rates denominated in such currencies. Changes in currency exchange rates and the relative value of non-U.S. currencies will affect the value of the Funds’ investment and the value of the Funds’ Shares. Currency exchange rates can be very volatile and can change quickly and unpredictably. As a result, the value of an investment in the Funds may change quickly and without warning and you may lose money.
R e n a i s s a n c e C a p i t a l — T h e I P O E x p e r t Page 21
RENAISSANCE IPO ETFs NOTES TO FINANCIAL STATEMENTS
For the Period Ended March 31, 2017 (Unaudited) (continued)
T. VALUATION RISK. The sales price the Renaissance International IPO ETF could receive for a security may differ from the Fund’s valuation of the security and may differ from the value used by the Renaissance International IPO Index, particularly for securities that trade in low value or volatile markets or that are valued using a fair value methodology. Because non-U.S. exchanges may be open on days when the Fund does not price its Shares, the value of the securities in the Renaissance International IPO ETF portfolio may change on days when shareholders will not be able to purchase or sell the Fund’s Shares. U. AUTHORIZED PARTICIPANT CONCENTRATION RISK. Only an authorized participant may engage in creation or redemption transactions directly with the Funds. The Funds have a limited number of institutions that act as authorized participants. To the extent that these institutions exit the business or are unable to proceed with creation and/or redemption orders with respect to the Funds and no other authorized participant is able to step forward to create or redeem Creation Units (as defined above), Fund shares may trade at a discount to NAV and possibly face trading halts and/or delisting. This risk may be more pronounced in volatile markets, potentially where there are significant redemptions in ETFs generally. 9. ACCOUNTING PRONOUNCEMENTS: In December 2016, FASB issued Accounting Standards update 2016-19 - Technical Corrections and Improvements (“ASU 2016-19”), which is effective for interim periods for all entities beginning after December 15, 2016. ASU 2016-19 includes an amendment to Topic 820, Fair Value Measurement, which clarifies the difference between a valuation approach and a valuation technique when applying the guidance in that Topic. That amendment also requires an entity to disclose when there has been a change in either or both a valuation approach and/or a valuation technique. The transition guidance for the amendment must be applied prospectively because it could potentially involve the use of hindsight that includes fair value measurements. Although still evaluating the potential impacts of ASU 2016-19 to the Portfolio, management expects that the impact of the Portfolio’s adoption will be limited to additional financial statement disclosures. In October 2016, the U.S. Securities and Exchange Commission (the “SEC”) issued a new rule, Investment Company Reporting Modernization, which, among other provisions, amends Regulation S-X to require standardized, enhanced disclosures, particularly related to derivatives, in investment company financial statements. Compliance with the guidance is effective for financial statements filed with the SEC on or after August 1, 2017; adoption will have no effect on the Portfolio’s net assets or results of operations. Although still evaluating the potential impacts of the Investment Company Reporting Modernization to the Portfolio, management expects that the impact of the Portfolio’s adoption will be limited to additional financial statement disclosures. 10. SUBSEQUENT EVENTS: The Funds are required to recognize in the financial statements the effects of all subsequent events that provide additional evidence about conditions that existed at the date of the Statement of Assets and Liabilities. For non-recognized subsequent events that must be disclosed to keep the financial statements from being misleading, the Funds are required to disclose the nature of the event as well as an estimate of their financial effect, or a statement that such an estimate cannot be made. Management has determined that there were no subsequent events to report through the issuance of these financial statements.
R e n a i s s a n c e C a p i t a l — T h e I P O E x p e r t Page 22
RENAISSANCE IPO ETFs OTHER INFORMATION
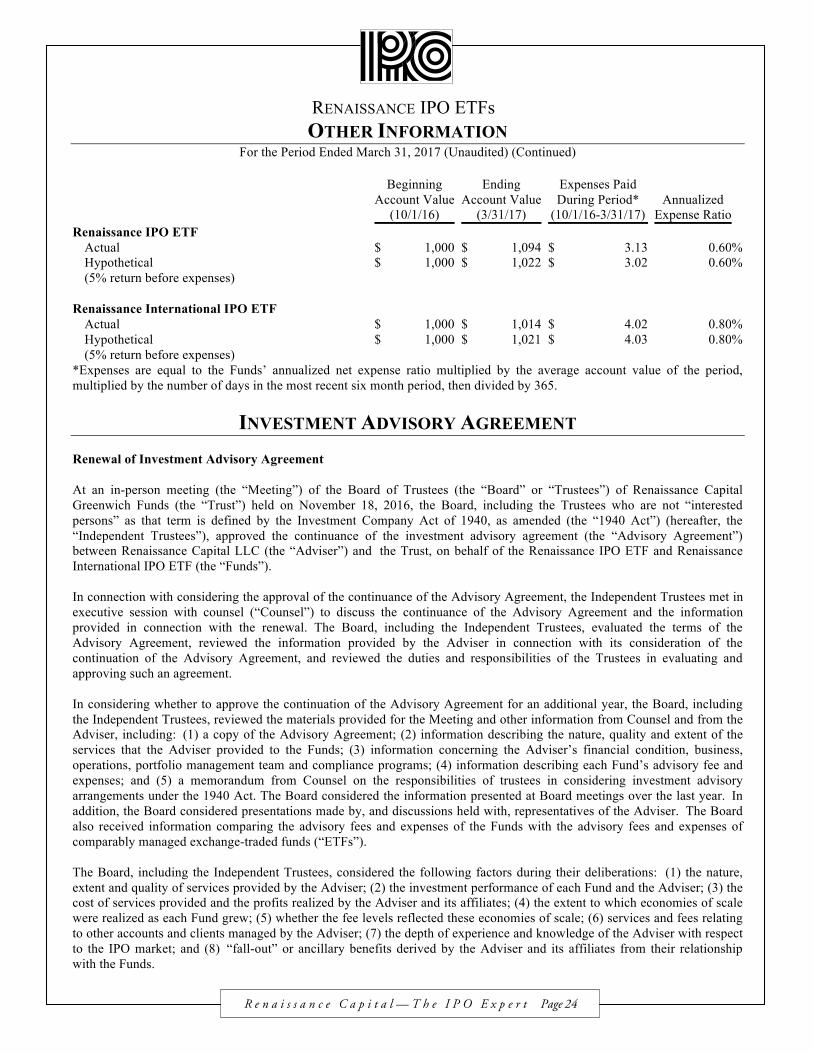
For the Period Ended March 31, 2017 (Unaudited) Proxy Voting Policies and Procedures and Records Information regarding how the Funds voted proxies related to portfolio securities during the year ended June 30 as well as a description of the policies and procedures that the Funds use to determine how to vote proxies is available without charge, upon request, by calling 1-866-486-6645 or by referring to the SEC’s website at http://www.sec.gov. Quarterly Portfolio Schedule The Funds file their complete schedule of portfolio holdings with the SEC for the first and third quarters of each fiscal year on Form N-Q. Form N-Q is available on the SEC’s website at http://www.sec.gov and may be reviewed and copied at the SEC’s Public Reference Room in Washington, DC (1-800-SEC-0330). The information on Form N-Q is available without charge, upon request, by calling 1-866-486-6645. Discount/Premium Information Information regarding how often shares of each Fund traded on NYSE Arca at a price above (i.e., at a premium) or below (i.e., at a discount) the Net Asset Value of the Fund during the past calendar year, when available can be found at www.renaissancecapital.com. Cost of Investing Shareholders of the Funds will incur two types of costs: (1) transaction costs, which may include creation and redemption fees or brokerage charges and (2) ongoing costs, including management fees and other Fund expenses. The following example is intended to help the shareholder understand the ongoing cost (in dollars) of investing in the Funds and to compare these costs with the ongoing costs of investing in other funds. This example is based on an investment of $1,000 invested at the beginning of the period and held for the entire six month period ended March 31, 2017. Actual Expenses: The first line of the table below provides information about actual account values and actual expenses. You may use the information in this line, together with the amount you invested, to estimate the expenses that you paid over the period. Simply divide your account value by $1,000 (for example, an $8,600 account value divided by $1,000 = 8.6), then multiply the result by the number in the first line under the heading entitled “Expenses Paid During Period” to estimate the expenses you paid on your account during the period. Hypothetical Examples for Comparison Purposes The second line of the table below provides information about hypothetical account values and hypothetical expenses based on the Funds’ actual expense ratio and an assumed rate of return of 5% per year before expenses, which is not the Funds’ actual return. Thus, you should not use the hypothetical account values and expenses to estimate the actual ending account balance or your expenses for the period. Rather, these figures are provided to enable you to compare the ongoing costs of investing in the Funds and other funds. To do so, compare this 5% hypothetical example with the 5% hypothetical examples that appear in the shareholder reports of the other funds. The Renaissance IPO ETF charges a transaction fee of $500 per Creation Unit and the Renaissance International IPO ETF charges a transaction fee of $1,000 per Creation Unit to those persons creating or redeeming Creation Units. If you buy or sell the Funds’ shares in the secondary market, you will incur customary brokerage commissions and charges. Please note that the expenses shown in the table are meant to highlight your ongoing costs only and do not reflect any transaction costs, such as creation and redemption fees, or brokerage charges. Therefore, the second line of the table is useful in comparing ongoing costs only, and will not help you determine the relative total costs of owning different funds. In addition, if these transaction costs were included, your costs would have been higher.
R e n a i s s a n c e C a p i t a l — T h e I P O E x p e r t Page 23
RENAISSANCE IPO ETFs OTHER INFORMATION
For the Period Ended March 31, 2017 (Unaudited) (Continued)
Beginning Account Value
(10/1/16)
Ending Account Value
(3/31/17)
Expenses Paid During Period*
(10/1/16-3/31/17) Annualized
Expense Ratio Renaissance IPO ETF
Actual $ 1,000 $ 1,094 $ 3.13 0.60 % Hypothetical $ 1,000 $ 1,022 $ 3.02 0.60 % (5% return before expenses)
Renaissance International IPO ETF
Actual $ 1,000 $ 1,014 $ 4.02 0.80 % Hypothetical $ 1,000 $ 1,021 $ 4.03 0.80 % (5% return before expenses)
*Expenses are equal to the Funds’ annualized net expense ratio multiplied by the average account value of the period, multiplied by the number of days in the most recent six month period, then divided by 365.
INVESTMENT ADVISORY AGREEMENT Renewal of Investment Advisory Agreement At an in-person meeting (the “Meeting”) of the Board of Trustees (the “Board” or “Trustees”) of Renaissance Capital Greenwich Funds (the “Trust”) held on November 18, 2016, the Board, including the Trustees who are not “interested persons” as that term is defined by the Investment Company Act of 1940, as amended (the “1940 Act”) (hereafter, the “Independent Trustees”), approved the continuance of the investment advisory agreement (the “Advisory Agreement”) between Renaissance Capital LLC (the “Adviser”) and the Trust, on behalf of the Renaissance IPO ETF and Renaissance International IPO ETF (the “Funds”). In connection with considering the approval of the continuance of the Advisory Agreement, the Independent Trustees met in executive session with counsel (“Counsel”) to discuss the continuance of the Advisory Agreement and the information provided in connection with the renewal. The Board, including the Independent Trustees, evaluated the terms of the Advisory Agreement, reviewed the information provided by the Adviser in connection with its consideration of the continuation of the Advisory Agreement, and reviewed the duties and responsibilities of the Trustees in evaluating and approving such an agreement. In considering whether to approve the continuation of the Advisory Agreement for an additional year, the Board, including the Independent Trustees, reviewed the materials provided for the Meeting and other information from Counsel and from the Adviser, including: (1) a copy of the Advisory Agreement; (2) information describing the nature, quality and extent of the services that the Adviser provided to the Funds; (3) information concerning the Adviser’s financial condition, business, operations, portfolio management team and compliance programs; (4) information describing each Fund’s advisory fee and expenses; and (5) a memorandum from Counsel on the responsibilities of trustees in considering investment advisory arrangements under the 1940 Act. The Board considered the information presented at Board meetings over the last year. In addition, the Board considered presentations made by, and discussions held with, representatives of the Adviser. The Board also received information comparing the advisory fees and expenses of the Funds with the advisory fees and expenses of comparably managed exchange-traded funds (“ETFs”). The Board, including the Independent Trustees, considered the following factors during their deliberations: (1) the nature, extent and quality of services provided by the Adviser; (2) the investment performance of each Fund and the Adviser; (3) the cost of services provided and the profits realized by the Adviser and its affiliates; (4) the extent to which economies of scale were realized as each Fund grew; (5) whether the fee levels reflected these economies of scale; (6) services and fees relating to other accounts and clients managed by the Adviser; (7) the depth of experience and knowledge of the Adviser with respect to the IPO market; and (8) “fall-out” or ancillary benefits derived by the Adviser and its affiliates from their relationship with the Funds.
R e n a i s s a n c e C a p i t a l — T h e I P O E x p e r t Page 24
The Board, including the Independent Trustees, considered and discussed the following with respect to each Fund: Nature, Extent and Quality of Services Provided by the Adviser. The Board reviewed the services that the Adviser provides to the Funds, including, but not limited to, managing the day-to-day investment of the assets of the Funds in accordance with the stated investment objective and policies of each Fund. The Board reviewed the professional personnel of the Adviser and discussed their qualifications. The Board considered and discussed, among other things, the Adviser’s experience and expertise in IPO investment services and the Adviser’s resources. On this basis, the Board concluded that they were satisfied with the nature, extent and quality of the services provided by the Adviser. Investment Performance of the Funds and the Adviser. The Board considered the Funds’ performance history and market conditions over the last year. The Board considered that each Fund had closely tracked its respective underlying index. The Board considered tracking error data provided by the Adviser to the Board for the Meeting and at prior meetings. The Board also considered information about the premium/discount history of the Funds provided by the Adviser to the Board for the Meeting and at prior meetings, which illustrated the number of times that the market price of the Funds trading on the secondary market closed above or below the net asset value of the Funds, and by how much, measured in basis points. The Board concluded that they were satisfied with the investment performance of the Funds under the Adviser’s management, including the tracking error of the Funds. Costs of Advisory Services. The Board reviewed the report of the advisory fee and expenses of each Fund as compared to the advisory fees and expenses of other comparably managed ETFs. The Trustees noted the Funds’ unitary fee structure. The Board considered the peer group report and concluded that each Fund’s respective advisory fee and expenses were comparable to similar ETFs managed by specialized research-driven investment advisers, in light of the unique nature of the Funds as IPO-focused ETFs. The Board also considered the fee rates charged to other accounts and clients managed by the Adviser, including the differences in services provided to the non-investment company clients. In addition, the Board considered “fall-out” or ancillary benefits derived by the Adviser and its affiliates from their relationship with the Funds. After review of this information, the Board concluded that each Fund’s advisory fee and expenses were reasonable. Profitability. The Board considered the level of profitability of the Adviser from its relationship with the Funds. The Board concluded that the Adviser’s current level of profitability was reasonable. Economies of Scale. The Board reviewed each Fund’s current asset level and concluded that the Funds had not yet reached the level where economies of scale could be achieved. Conclusion. Based on their deliberations and evaluation of the information described above, the Board, including the Independent Trustees, unanimously: (1) concluded that terms of the Advisory Agreement were fair and reasonable; (2) concluded that each Fund’s advisory fee and expenses were reasonable in light of the services that the Adviser provides to the Funds; and (3) agreed to continue the Advisory Agreement for another year.
R e n a i s s a n c e C a p i t a l — T h e I P O E x p e r t Page 25
