2017 school and college performance tables - scomis · this statement of intent sets out our plans...
TRANSCRIPT

2017 School and College Performance Tables Statement of Intent
July 2017

2
Contents Summary 4
Publication timetable 4
Main changes to 2017 performance tables 4
Primary school performance tables 7
Headline performance measures 7
Progress measures 7
Additional performance measures 8
Floor standards 8
Coasting schools 8
Secondary school performance tables 10
Changes to the performance tables and measures 10
GCSE reform 10
Accountability changes in 2017 10
Publication of provisional data 11
How qualifications count 12
Floor standard 13
Coasting schools 13
16 to 18 performance tables 15
Changes to performance measures 15
Reporting of level 2 qualifications 15
Disadvantage measures 15
Introduction of additional measures 16
A level reform 16
Changes to the checking exercise for colleges 17
Minimum standards 17
Shadow data for new headline measures 17
Future developments 17
Cross cutting content 18
Additional information 18
Multi-Academy Trust performance measures 19
Analyse School Performance (ASP) 19

3
Performance tables website 19
Errata period 20
Annex A – primary performance tables content 21
Annex B – secondary performance tables content 24
Annex C – 16 to 18 performance tables content 27
Annex D – cross cutting performance tables content 30

4
Summary The performance tables sit at the heart of the accountability framework. They focus the debate on standards and provide a reliable and accessible source of comparative information on pupil progress and attainment. The performance tables present this information alongside wider contextual data including Ofsted judgements, absence, workforce and finance data, presenting users with a wider understanding of the setting in which schools are operating. This data is designed to be used as the starting point when considering a school’s performance by school, Ofsted, regional school commissioners, local authorities, governors and parents.
This statement of intent sets out our plans for the content of the 2017 school and college performance tables. As a result of previously announced government reforms to the way schools and colleges are held to account for their performance, a number of new performance measures appear for the first time this year at key stage 4 and 16-18.
Publication timetable We plan to publish the 2017 performance tables to the following timetable:
• primary performance tables – December 2017 • secondary performance tables – January 2018 • 16 to 18 performance tables – January and March 2018
As in previous years, we also plan to publish provisional secondary performance measures in October 2017, to help inform parents on their choice of secondary school.
Main changes to 2017 performance tables Primary performance:
• primary assessment and accountability were reformed in 2016. The 2017 accountability measures are broadly the same in 2017
• the government consultation on the future of primary assessment and accountability closed on 22 June, and a government response will be issued in due course
• one minor change is that we will publish some further breakdowns following requests from schools. We will publish average scaled scores per pupil broken down for boys/girls, pupils whose first language is English and for non-mobile pupils. This will be in addition to the average scaled score by prior attainment and disadvantage published in 2016

5
Secondary performance:
• reformed GCSE qualifications in English and mathematics, graded 9-1, will be included in performance tables in 2017, with other reformed GCSEs to follow in 2018 and 2019
• the headline performance measures are broadly unchanged from 2016, except the threshold attainment measures, the headline threshold attainment measures in 2017 will use a grade 5 (strong pass) for reformed English and mathematics. This will mean that these measures will become:
o the proportion of pupils achieving a strong pass in English and mathematics - grade 5 or above
o the proportion of pupils achieving the EBacc - grade 5 or above in English and mathematics, and grade C or above in unreformed subjects
• some additional measures will also be published for the first time from 2017: o for transparency and to help schools show progress, the headline
threshold attainment measures will also be published at grade 4. These are: § the proportion of pupils achieving a standard pass in English and
mathematics – grade 4 or above § the proportion of pupils achieving the EBacc - grade 4 or above in
English and mathematics, and grade C or above in unreformed subjects.
o in addition, as a result of requests for additional data from schools, we will also publish: § average number of EBacc slots filled in Attainment 8 at school level § average number of open slots filled in Attainment 8 at school level
16 to 18 performance:
• the 16 to 18 performance tables will expand to include vocational qualifications at level 2 studied by students aged between 16 and 18
• the headline measures will be published for disadvantaged pupils to illustrate differences between how well disadvantaged students in a school or college do compared to non-disadvantaged students nationally
• we will publish new measures on level 3 mathematics, students returned and retained for a second year, students retained and assessed and on the proportion of students achieving a technical certificate qualification of those whose highest level of entry is at level 2

6
Full details of the contents of this year’s performance tables are set out in the annexes to this document as follows:
• primary – Annex A • secondary – Annex B • 16 to 18 – Annex C • cross-cutting information – Annex D

7
Primary school performance tables In December 2017, the department will publish measures of key stage 2 performance for all state-funded primary schools with a key stage 2 cohort.
The Standards and Testing Agency will provide schools and local authorities with pupils’ test results via the secure NCA tools website on 4 July 2017. This will give for each pupil:
• a raw score (number of marks awarded) for each test • a scaled score for each test • confirmation of whether the pupil has reached the expected standard
As we did in 2016, we will also publish a statistical release on 4 July, which will provide national level data against which they may compare results. This will include:
• the percentage of pupils achieving the expected standard in reading, writing and mathematics (combined)
• the percentage of pupils achieving the expected standard by individual subject (reading, writing and mathematics)
• average scaled score by individual test subject (reading, mathematics and GPS)
As usual, we will share provisional school-level performance measures with schools when we ask them to check and submit any amendments to underlying data via the key stage 2 performance tables data checking exercise. We plan to open the checking website by 31 August, releasing progress data to schools at the same time.
Headline performance measures The 2017 headline measures of performance at the end of key stage 2 will be:
• the percentage of pupils achieving the ‘expected standard’ in reading, writing and mathematics
• the pupils’ average scaled score in each of reading and mathematics • the percentage of pupils who achieve a higher standard in reading, writing and
mathematics • the pupils’ average progress in each of reading, writing and mathematics
This is set out in more detail in the primary school accountability document.
Progress measures
New progress measures were introduced in 2016 for each of reading, writing and mathematics. These compare the key stage 2 achievements of each pupil to that of all others who had similar results to them at the end of key stage 1. A school’s scores

8
show whether, on average, their pupils have made more or less progress between key stage 1 and key stage 2 than other pupils nationally with similar starting points.
More details on the new progress measures can be found in the primary school accountability technical guide.
Floor standards The school performance measures published in performance tables are used to identify schools that are failing to meet minimum performance expectations or ‘floor standards’.
In 2016, a school was considered to be above the floor standard if:
• at least 65% of pupils met the expected standard in reading, writing and mathematics (i.e. achieved that standard in all three subjects) or
• the school achieved sufficient progress scores in all three subjects. At least -5 in reading, -5 in maths and -7 in writing.
If fewer than 65% of pupils met the expected standard in a school, this would not on its own mean the school was below the floor. Such a school would only be below the floor if it also failed to meet the progress part of the floor.
We will confirm the 2017 floor standard criteria by 31 August 2017.
Coasting schools The Education & Adoption Act 2016 allowed the department to identify ‘coasting’ schools for the first time in 2016. Coasting schools are those that consistently fail to ensure pupils reach their potential.
The ‘coasting’ definition covers school performance over 3 years. In 2017, it will consider performance in 2015, 2016 and 2017 and a school will only be identified as coasting if it is within the coasting definition in all three years. Given the change in the accountability measures in 2016, the coasting criteria for 2015 reflects the previous accountability measures, which existed prior to 2016. From 2016 onwards, criteria definitions reflect the new accountability regime.
For primary schools in 2017, the definition will apply to schools that:
• in 2015 had fewer than 85% of pupils achieving level 4 in reading, writing and mathematics and below the median percentage of pupils making expected progress in all of reading, writing and mathematics, and
• in 2016 and 2017 have fewer than 85% of children achieving the new expected standard at the end of primary school and average progress made by pupils in

9
reading or writing or mathematics is below a level set against the new primary progress measures. These threshold progress levels for 2017 will be announced in the autumn, but in 2016 were -2.5, -3.5 and -2.5 respectively.

10
Secondary school performance tables The government introduced Progress 8 and Attainment 8 for all state funded schools in 2016 along with new headline measures. These measures remain broadly the same for 2017; however, GCSE reforms, in 2017, 2018 and 2019 will create some changes. In 2017 the headline measures for all state funded secondary schools and those colleges that offer KS4 education will be:
• Progress 8 • Attainment 8 • the percentage of pupils achieving a 5 or above (strong pass) in English and
mathematics • the percentage of pupils achieving the English Baccalaureate – at a grade 5 or
above in English and mathematics and a C or above in unreformed qualifications • the percentage of pupils entering the English Baccalaureate • the percentage of students staying in education or employment after key stage 4
(destinations)
Changes to the performance tables and measures
GCSE reform
The government has reformed GCSEs as part of its plans to ensure pupils can compete with the top performers in the world and secure the best jobs. New GCSEs in English and mathematics have been taught since September 2015 with the first examinations taking place in Summer 2017. New GCSEs in other subjects were phased in for first teaching from September 2016, continuing into 2017 and a very small number from 2018. To ensure all students benefit from the reformed qualifications, only the new GCSEs will be included in the secondary performance tables as they are introduced (for example, only reformed GCSEs in English and mathematics will be included in 2017). As part of these reforms, a new grading system will be introduced from 2017 to replace the A to U system with a new 9 to 1 scale. A full timeline for when new GCSEs will be introduced can be found on the Ofqual website
Accountability changes in 2017
As announced in March, the headline threshold attainment measures in 2017 will use a grade 5 (strong pass) for reformed English and mathematics. As outlined above this will mean that the threshold measures will become:

11
- the proportion of pupils achieving a strong pass in English and mathematics - grade 5 or above
- the proportion of pupils achieving the EBacc - grade 5 or above in English and mathematics, and grade C or above in unreformed subjects
For transparency and to help schools show progress, the threshold attainment measure will also be published at grade 4 or above, as an additional measure. These additional measures will be:
- the proportion of pupils achieving a standard pass in English and mathematics – grade 4 or above
- the proportion of pupils achieving the EBacc - grade 4 or above in English and mathematics, and grade C or above in unreformed subjects.
As set out previously in Progress 8 guidance, from 2019 performance tables point scores will also be allocated to the new GCSEs on a 9-1 point scale corresponding to the new 9 to 1 grades. During the transition period (2017 and 2018) where a combination of reformed and unreformed GCSEs can count towards performance measures, point scores from unreformed GCSEs will be mapped onto the 9-1 scale with 8.5 being the maximum that can be achieved from an unreformed GCSE. The grade changes mean it is no longer possible to calculate the previous headline measure, 5+A*-C including English and mathematics, and this measure will therefore not appear in the performance tables. Data will however be made available, in the downloadable data file, for pupils achieving 5 or more GCSEs at grade 4/C or above including English and mathematics. Additionally data will remain available for 2015 and 2016 for pupils achieving 5 or more GCSEs at grade A*-C including English and mathematics. Annex B sets out the full range of measures that will be published in 2017 secondary performance tables.
Publication of provisional data Publication of provisional data in advance of the 31 October deadline for secondary school admission applications will continue to be provided to support parents who may wish to use the information when applying for a secondary school place for their child. The provisional school results will be published on the performance tables website (clearly labelled as provisional) and will include the headline performance measures for state funded secondary schools only. Following the provisional results publication in October, full secondary performance tables will be published in January 2018.
12
As the data published in October will be provisional, schools may see changes to their results between the provisional publication and the January performance tables publication. Changes may occur because the provisional publication is mainly based on the results data that awarding organisations supply to the department by August 2017. This data includes the vast majority of pupils’ results. It will not include:
• the small proportion of amendments that awarding organisations may make to examination grades, following any successful enquiries about results
• the small proportion of additional results data that awarding organisations may supply to the department after August 2017, for example, for any qualifications that have been certificated late, any approved amendments that schools have requested the department makes to either the pupil’s details (for example where a pupil has emigrated or died before commencement of exams) or results reported (requests made as part of the checking exercise in September, during which the department shares provisional pupil data with schools)
As in previous years, any amendments between August and November 20171 will be reflected in the full revised performance tables released in January 2018. Amendments made after the start of November 2017 or during the errata period2 will be reflected in the finalised performance tables published in Spring 2018.
How qualifications count In 2014, the calculation of secondary school performance measures underwent significant change following the implementation of both the Wolf review recommendations and the introduction of an early entry policy for English Baccalaureate (EBacc) subjects. Early entry rules:
• only a pupil’s first entry in a particular subject will count towards a school’s performance tables measure. This rule applies to all qualifications taken after 29 September 2013; the date on which this policy was announced
• further guidance on early entry rules, including information on exception discounting for English, mathematics and science, is available in the performance tables technical guides
1 Schools have until 10th October to submit requests for amendments and we will endeavour to include all late results from Awarding Organisations that are submitted by the start of November
2 After we publish the data in the performance tables, there’s a short ‘errata’ period when schools and colleges can ask for amendments to attainment data, for example grade changes due to enquiries about results

13
How qualifications count in performance tables: • the secondary performance tables are restricted to qualifications that are high
quality and rigorous • no qualification can count as larger than one GCSE in performance tables,
irrespective of its size. Points are scaled accordingly. The list of point scores assigned to each qualification can be found in the performance tables technical guides
• the number of approved non-GCSE qualifications that can count towards secondary performance measures is capped. These rules will be unchanged for the 2017 secondary school performance measures, with the exception of some changes to the capping of non-GCSEs as a result of the new accountability system. Up to three GCSE qualifications (including EBacc subjects not used to fill the slots in the EBacc element) and/or non-GCSE qualifications from the approved list for the year in question can count towards the three slots in the ‘open’ element in the Progress 8 measure
• the requirements for what counts as English across the 2017 performance measures is set out in the Progress 8 guidance.
Floor standard The school performance measures published in performance tables are used to identify schools that are failing to meet minimum performance expectations or ‘floor standards’. In 2017, a school or college will be below the secondary floor standard if its Progress 8 score is below -0.5, unless the confidence interval suggests that the school’s underlying performance may not be below average. A Progress 8 score of -0.5 indicates that the average achievement of a school’s pupils is approximately half a grade worse per subject than other pupils with the same prior attainment.
Coasting schools The Education & Adoption Act 2016 allowed the department to identify ‘coasting’ schools for the first time in 2016. Coasting schools are those that consistently fail to ensure pupils reach their potential. The ‘coasting’ definition will capture school performance over 3 years. In 2017 it will consider performance in 2015, 2016 and 2017 and a school will only be identified as coasting if it is within the coasting definition in all three years. Given the change in the accountability regime in 2016, the coasting levels for 2015 will reflect the previous accountability measures. From 2016 onwards it will reflect the new accountability regime. For secondary schools in 2017, the definition will apply to schools which:
14
• in 2015 had fewer than 60% of children achieving 5+ A*-C GCSEs including
English and mathematics, and below the median percentage of pupils making expected progress in English and mathematics
• or in 2015, for Progress 8 opt-in schools, fall below -0.25 in its Progress 8 and the upper band of the 95% confidence interval is below zero), and
• in 2016 and 2017 fall below a level set against Progress 8 score and the upper band of the 95% confidence interval is below zero. This threshold for 2017 will be announced in the autumn, but in 2016 was - 0.25
By 2018, the definition of coasting will be based entirely on three years of Progress 8 data and will not have an attainment element. As explained above, in 2017 there are new GCSEs in English and maths, and the points used in performance tables are changing. Ofsted and Regional School Commissioners will take these factors into account, where relevant, when a school is below the floor or coasting.
Consultation on pupils with extremely negative scores The Department is listening to feedback from schools about the impact that a small number of pupils with extremely negative progress scores can have on a school’s overall Progress 8 score. We intend to make a change to the Progress 8 methodology from 2018, and will work with sector on the best approach in the autumn of 2017. In 2017 we will ensure that those working with school data, including Ofsted, Regional Schools Commissioners and local authorities are aware of the potential impact on a school’s Progress 8 score of pupils with extremely negative progress scores. We will also ensure that they are aware of the wider changes to GCSEs and Attainment 8 point scores. The impact of pupils with extremely negative scores on Progress 8 will also be taken into account where a school is below the floor standard or coasting in 2017.

15
16 to 18 performance tables The government is reforming the 16 to 18 school and college accountability system to set higher expectations for students and institutions, and to make the system fairer, more ambitious and more transparent. These changes were set out in the government consultation response on 16 to 19 accountability in 2014, and are covered in the 16 to 19 accountability technical guide. The first set of changes to the 16 to 18 performance tables to reflect these reforms were carried out in 2016; further changes to 16 to 18 performance measures will be applied to performance tables in 2017. In 2017, as in 2016, the headline measures of performance will be:
• progress • attainment • English and mathematics progress • retention • destinations
Annex C sets out the full range of measures that will be published in the 2017 16 to 18 performance tables.
Changes to performance measures
Reporting of level 2 qualifications
As announced in 2014, the 16 to 18 performance tables in 2017 will expand to include information on vocational level 2 qualifications, in addition to the level 2 (and below) English and mathematics qualifications which were first included in 2016. The 2017 tables will include two new level 2 performance cohorts: vocational qualifications at level 2, and technical certificates, a subset of the former. Technical certificates are rigorous intermediate (level 2) technical qualifications recognised by employers. The 2017 tables will report school and college performance in these qualifications for both new cohorts against the following headline measures: progress, attainment, and retention.
Disadvantage measures
From 2017, the 16 to 18 performance tables will include disadvantage measures to illustrate differences between how well disadvantaged students in a school or college do compared to non-disadvantaged state-funded students nationally. These measures will report on the 16 to 18 outcomes of students eligible for pupil premium funding in year 11, against each of the five headline measures: progress, attainment, English and mathematics progress, retention, and destinations.

16
Disadvantage measures will not be calculated for independent schools. The attainment, progress, retention, and English and mathematics measures will not include students who were not reported at the end of key stage 4 – for example, because they came from overseas. Students who were known to be at independent schools in their last year of key stage 4 will be treated as non-disadvantaged. The destination measures group all students not known to be disadvantaged at the end of key stage 4 as “all other students”.
Introduction of additional measures
The 2017 performance tables will include the following additional measures:
• level 3 maths: This measure supports the ambition for the overwhelming majority of young people in England to study mathematics to age 18 by 2020. This measure will show the percentage of students who achieved A*-C3 in GCSE mathematics (or equivalent) by the end of key stage 4 and who go on to achieve an approved level 3 mathematics qualification. It will be published as an additional attainment measure
• returned and retained for a second year: This supporting retention measure will show the percentage of students who return and complete a second year, completing an aim of size equivalent to at least one A level. It will be published for all level 3 cohorts: A level, academic, applied general, and tech level
• retained and assessed: This supporting retention measure will show the percentage of students who complete their main programme of study and are assessed at the end of their course. It will be published for all level 3 and level 2 cohorts
• technical certificate: This measure will show the percentage of students whose highest attainment is a level 2 qualification and who achieve an approved technical certificate.
A level reform
The government and Ofqual are reforming A levels to match the best education systems in the world and to keep pace with universities’ and employers’ demands. New reformed AS and A levels have been taught in schools in England since September 2015. The first results for the new AS levels were issued in 2016, and for the A levels, and second tranche of reformed AS levels, in 2017. Further subjects will be introduced over the following year.
3 All students reported in the 2017 16 to 18 performance tables would have taken legacy GCSEs or equivalent during key stage 4.

17
More information is available in Ofqual’s full timeline for when new A levels will be introduced.
Changes to the checking exercise for colleges As usual, we will share provisional 16 to 18 performance measures with schools and colleges, when we ask them to check their data and submit any requests for amendments via the performance tables data checking exercise. This takes place from late September to early October. For further education colleges, we plan to extend the checking exercise, giving colleges three weeks to check their data and submit any requests for amendments. This is to reflect the fact that the expansion of the 16 to 18 performance tables to include vocational level 2 qualifications, in addition to the level 2 (and below) English and mathematics qualifications first included in 2016, brought a large number of additional students into the scope of the performance tables. These changes particularly affect the amount of data that colleges need to check through the checking exercise.
Minimum standards The 16 to18 performance measures published in performance tables are used to identify schools and colleges that are failing to meet minimum performance expectations or ‘minimum standards’. At 16 to 18, different minimum standards apply for the different cohorts. Full details of the minimum standards that applied in 2016 can be found in the 16 to 18 minimum standards for 2016 guidance. The minimum standards for the academic and applied general cohorts will be confirmed in the autumn, and for the tech level cohort in Spring 2018.
Shadow data for new headline measures In May 2016, schools and colleges were provided with information to show what new allocations and headline measures would look like based on their 2015 results data, and in June 2017, schools and colleges were provided with data showing the new measures to be introduced for the 2017 tables, based on their 2016 results. The data was intended to support schools and colleges in preparing for the move to the new accountability system and new measures.
Future developments From 2019, only technical certificates will be recognised as level 2 vocational qualifications in the 16 to 18 performance tables. In order to give time for institutions to transition towards these qualifications a broader range of qualifications will also be reported in 2017 and 2018 tables. These include all level 2 vocational qualifications of size equivalent to at least two GCSEs (minimum 145 guided learning hours).

18
Cross cutting content The cross cutting information on absence and pupil population, finance and workforce are unchanged since 2016 performance tables.

19
Additional information
Multi-Academy Trust performance measures In 2016 the government committed to publishing multi-academy trust (MAT) performance measures. Encouraging a self-improving school-led system is at the heart of this government’s agenda with an increasing number of schools being part of a multi-academy trust being central to that aim. In July 2016 we published a statistical working paper that describes our developing approach. Multi-Academy Trust performance measures were published alongside school performance tables for the first time in 2016. We plan to release 2017 MAT performance tables for both key stage 2 and key stage 4 alongside the school and college performance tables in January 2018.
Performance tables website In March 2016, we published our improved performance tables website, the 2016 performance tables publications were released on this website. We continue to gather feedback on the new website, to help us identify and implement further improvements to the website, please use the feedback form link on the site.
Analyse School Performance (ASP) In April 2017, we released an initial version of the replacement to RAISEonline – Analyse School Performance (ASP) for testing, familiarisation and feedback. Following this testing period, we intend to release an updated version of ASP, which will contain more functions and data similar to those in RAISEonline as well as key changes to primary and secondary performance measures for 2017. You can access ASP through Secure Access. Your Secure Access Approver will arrange access for you. If you need further help in accessing the service, please contact:
• the Secure Access helpdesk; or • further information can be found in Secure Access guidance.

20
Errata period After we publish the data in the performance tables, there is a short ‘errata’ period when schools and colleges can ask for amendments to attainment data, for example grade changes following enquiries about results. The errata period has up to now taken place over a varying period for different key stages, however for the 2017 results data this will be standardised to four school weeks. School and colleges should only request amendments during errata that could not have been made during previous checking exercises.

21
Annex A – primary performance tables content Three-year rolling averages will be re-introduced in 2018 once 3 years of comparable data is available.
H
eadl
ine
mea
sure
s
Reading, writing and mathematics: % of pupils achieving the expected standard
Reading, writing and mathematics: % of pupils achieving the higher standard
Key stage 1 to key stage 2 progress: Overall progress score (with confidence intervals) for each of the following subjects:
• in reading • in writing • in mathematics
Pupil’s average scaled score in each of:
Ø Reading Ø Mathematics
Key
sta
ge 2
res
ults
in te
st
subj
ects
% of pupils achieving the expected standard in reading % of pupils achieving the expected standard in mathematics % of pupils achieving the expected standard in grammar, punctuation and spelling % of pupils achieving the higher standard in reading % of pupils achieving the higher standard in mathematics % of pupils achieving the higher standard in grammar, punctuation and spelling % of pupils absent on test day or unable to access the reading test % of pupils absent on test day or unable to access the mathematics test Average scaled score per pupil in grammar, punctuation and spelling
Key
sta
ge 2
teac
her a
sses
smen
t ou
tcom
es
% of pupils working at the expected standard in writing % of pupils working at greater depth within the expected standard in writing % of pupils working towards the expected standard in writing % of pupils absent or disapplied from writing teacher assessment % of pupils working at the expected standard in reading % of pupils absent or disapplied from reading teacher assessment % of pupils working at the expected standard in mathematics % of pupils absent or disapplied from mathematics teacher assessment % of pupils working at the expected standard in science – available from download files % of pupils absent or disapplied from science teacher assessment – available from download files

22
Dis
adva
ntag
ed p
upils
4
Disadvantaged/other pupils Reading, writing and mathematics: % achieving the expected standard Difference between attainment of disadvantaged pupils in the school and other pupils nationally % achieving a high standard Difference between attainment of disadvantaged pupils in the school and other pupils nationally % achieving the expected standard in reading % achieving the expected standard in writing (teacher assessed) % achieving the expected standard in mathematics % achieving the expected standard in grammar, punctuation and spelling % achieving a high standard in reading % of pupils working at greater depth within the expected standard in writing (teacher assessed) % achieving a high standard in mathematics % achieving a high standard in grammar, punctuation and spelling Average scaled score per pupil In each of:
• Reading • Mathematics • Grammar, punctuation & spelling
Key stage 1 to key stage 2 progress: Overall progress score (with confidence intervals) for each of the following subjects:
• Reading • Writing • Mathematics
Difference between school’s progress score for Disadvantaged pupils compared with that for other pupils nationally, in each of:
• Reading • Writing • Mathematics
Non
-mob
ile p
upils
For pupils who have been in the school throughout all of Year 5 and Year 6: % achieving the expected standard in reading, writing and mathematics % achieving a high standard in reading, writing and mathematics Average scaled score per pupil In each of:
• Reading • Mathematics • Grammar, punctuation & spelling
Key stage 1 to key stage 2 progress: Overall progress score (with confidence intervals) for each of the following subjects:
• in reading • in writing • in mathematics
Engl
ish
as a
n ad
ditio
nal l
angu
age
and
gend
er
Results shown separately for boys, girls, and children with English as an Additional Language (i.e. where another language may be spoken in the household) for: % achieving the expected standard in reading, writing and mathematics % achieving a high standard in reading, writing and mathematics Average scaled score per pupil In each of:
4 Disadvantaged pupils are children who were registered as eligible for free school meals at any point in the last six years, children looked after by a local authority and children who left care in England and Wales through adoption or via a Special Guardianship or Child Arrangements Order. In 2016, 32% of 11 year olds were classed as disadvantaged.

23
• Reading • Mathematics • Grammar, punctuation & spelling
Key stage 1 to key stage 2 progress: Overall progress score (with confidence intervals) for each of the following subjects:
• in reading • in writing • in mathematics
Low
/mid
dle/
high
prio
r atta
iner
s
Results shown separately for each of the low, middle and high prior attainment groups based on KS1 outcomes:
% achieving the expected standard in reading % achieving the expected standard in writing (teacher assessed) % achieving the expected standard in mathematics % achieving the expected standard in grammar, punctuation and spelling % achieving a high standard in reading % of pupils working at greater depth within the expected standard in writing (teacher assessed) % achieving a high standard in mathematics % achieving a high standard in grammar, punctuation and spelling Average scaled score per pupil In each of:
• Reading • Mathematics • Grammar, punctuation & spelling
Key stage 1 to key stage 2 progress: Overall progress score (with confidence intervals) for each of the following subjects:
• in reading • in writing • in mathematics
Coh
ort i
nfor
mat
ion
Number and percentage of pupils in the end of key stage 2 cohort who are in each of these groups:
• Boys • Girls • Disadvantaged and ‘other’ pupils • Non-mobile i.e. have been in the school throughout both year 5 and year 6 • Low, middle and high prior attainers (with average KS1 point score for each group) • Have English as an additional language i.e. in a household where another language may
be spoken • Special educational needs - split by those with statements of SEN or Education & Health
Care Plans; and those with SEN but without a statement, EHC Plan (i.e. School Support) Average key stage 1 points score for end of key stage 2 cohort (as used in low/middle/high prior attainment measures)
Sim
ilar
Scho
ols
Schools ranked against headline measures, within a group of 125 similar schools based on key stage 1 average points score.

24
Annex B – secondary performance tables content Three-year rolling averages will be re-introduced in 2018 once 3 years of comparable data is available.
Hea
dlin
e m
easu
res
Progress 8
Attainment 8 Percentage of pupils achieving a strong pass in English and mathematics (grades 9-5) Percentage of pupils achieving a strong pass in the English Baccalaureate (grade 5 or above in English and mathematics, and grade C or above in unreformed subjects) Percentage of pupils entering the English Baccalaureate Percentage of pupils staying in education or employment for at least two terms after key stage 4
Prog
ress
8/ A
ttain
men
t 8
All pupils:
Overall Attainment 8 score and Progress 8 score (with confidence intervals) broken down by the four constituent elements of the measure:
• English
• Mathematics
• Other English Baccalaureate qualifications
• Other qualifications (split to show attainment by GCSE and non-GCSE) Average number of slots filled per pupil in English Baccalaureate and Open slots of Attainment 8 Disadvantaged pupils & other pupils: Overall Attainment 8 score and Progress 8 score, broken down by the four constituent elements of the measure:
• English
• Mathematics
• Other English Baccalaureate qualifications
• Other qualifications (split to show attainment by GCSE and non-GCSE)
KS4
Res
ults
Number & percentage of pupils achieving a strong pass in English and maths (grades 9-5)- All pupils, low, middle & high attainers Number & percentage of pupils achieving a standard pass in English and maths (grades 9-4)- All pupils, low, middle & high attainers Percentage of pupils taking more than one language at GCSE Percentage of pupils taking three single sciences Progress 8 and Attainment 8 - low, middle & high attainers
Average entries per pupil - all qualifications - All pupils, low, middle & high attainers
Percentage of pupils achieving at least 1 qualification Average entries per pupil - GCSEs only - All pupils, low, middle & high attainers

25
Engl
ish
Bac
cala
urea
te
Percentage of pupils achieving a strong pass in all EBacc subjects ( grade 5 or above in English and mathematics, and grade C or above in unreformed subjects ) - All pupils, low middle & high attainers Percentage of pupils achieving a standard pass in all EBacc subjects ( grade 4 or above in English and mathematics, and grade C or above in unreformed subjects) - All pupils, low middle & high attainers Number & percentage of pupils entered for all EBacc subjects - All pupils, low middle & high attainers Percentage of pupils achieving A*-C ( grade 5 or above in English and mathematics, and grade C or above in unreformed subjects )/ achieving A*-C (grade 4 or above in English and mathematics, and grade C or above in unreformed subjects ) / % entered: English, maths, science, humanities, language Percentage of pupils achieving EBacc subjects at grades A*-G (9-1 for English and maths): Overall, English, maths, science, humanities, language EBacc individual GCSE subjects; Value Added scores and confidence limits: Science, humanities, language - All pupils, low, middle & high attainers
Tim
e se
ries
Number and percentage of disadvantaged pupils in KS4 cohort: 2015, 2016, 2017
All pupils, Disadvantaged pupils & other pupils (2015, 2016, 2017):
Progress 8 (2015 for opt-in schools, 2016 and 2017 for all pupils. For disadvantaged & other pupils: 2016 and 2017 only initially) Attainment 8 (2015 for opt-in schools, 2016 and 2017 for all pupils. For disadvantaged & other pupils: 2016 and 2017 only initially)
Percentage achieving A*-C in English and maths (strong pass in 2017, grades 9-5) Percentage entered in EBacc (time series) Percentage achieving EBacc (time series). (To note in 2017, will be based on strong pass (grade 5 or above in English and mathematics, and grade C or above in unreformed subjects) and standard pass (grade 4 or above in English and mathematics, and grade C or above in unreformed subjects) will also be published as an additional measure).
Percentage staying in education or employment for at least two terms after key stage 4 (2016 and 2017 only initially
A
dditi
onal
dat
a fo
r di
sadv
anta
ged
pupi
ls
Difference between disadvantaged pupils in school/local authority and non-disadvantaged pupils nationally:
Progress 8 and Attainment 8 Entries per pupil - all qualifications: All pupils Disadvantaged pupils Other pupils
Engl
ish
as a
n ad
ditio
nal l
angu
age,
no
n-m
obile
pup
ils
and
gend
er
Progress 8 and Attainment 8 Percentage achieving a strong pass in English and maths GCSEs (grades 9-5) Percentage achieving a standard pass in English and maths GCSEs (grades 9-4) Percentage entered for EBacc Percentage achieving a strong pass in the EBacc ( grade 5 or above in English and mathematics, and grade C or above in unreformed subjects ) Percentage achieving a standard pass in the EBacc ((grade 4 or above in English and mathematics, and grade C or above in unreformed subjects)
Coh
ort i
nfor
mat
ion
Number of pupils at end of KS4 - all pupils, boys, girls Number and percentage of: Low, middle and high prior attainers (KS2) & Average KS2 point score
Disadvantaged pupils
Pupils for whom English is not their first language Pupils with Special Educational Needs (split by those with statements or Education & Health Care plans and those without)
Non-mobile pupils

26
Pupi
l des
tinat
ions
(fo
r pup
ils fi
nish
ing
key
stag
e 4
stud
y in
201
4/15
All pupils, disadvantaged pupils and other pupils: Pupil destinations after key stage 4: Pupils staying in education or employment for at least two terms after key stage 4 (see headline measures) Total number of pupils included in destination measures Breakdown of destinations: Apprenticeships Pupils staying in employment for at least two terms after key stage 4 Pupils staying in education for at least two terms after key stage 4 Further education college or other further education provider Sixth form college School sixth form Other education destinations Pupils not in education or employment for at least two terms after key stage 4 Activity not captured in data
Sim
ilar S
choo
ls
Schools rankings within a group of 55 similar schools based on Attainment 8 estimates.
Attainment 8 score
Progress 8 score
Key stage 2 average point score

27
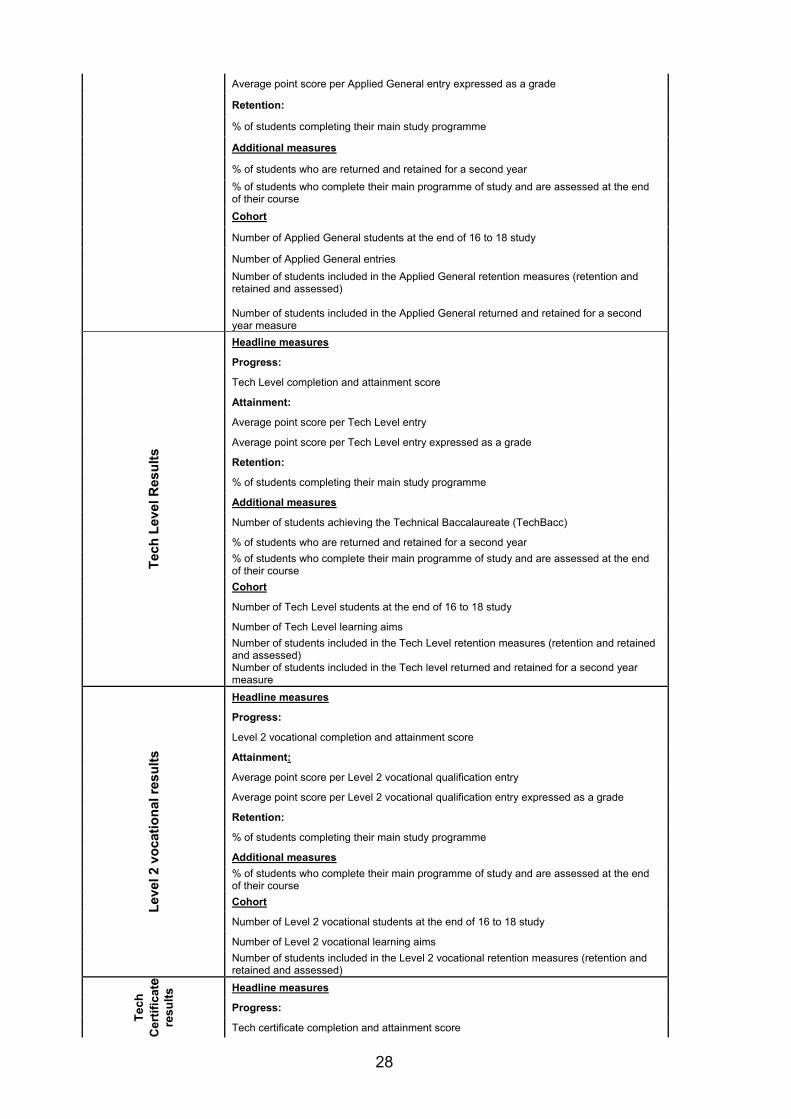
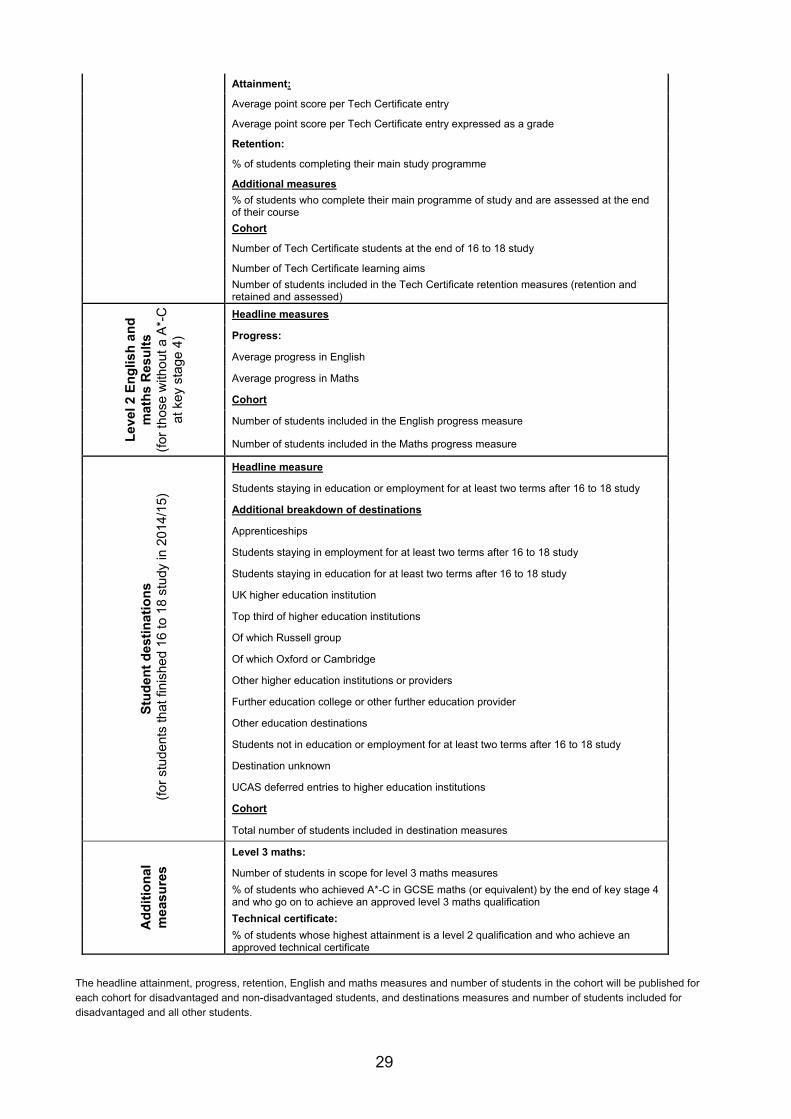
Annex C – 16 to 18 performance tables content
A L
evel
Res
ults
Headline measures
Progress:
A level value added score with confidence limits
Attainment:
Average point score per A level entry
Average point score per A level entry expressed as a grade
Retention:
% of students completing their main study programme
Additional measures
Average point score for a student’s best three A levels
Average point score for a student’s best three A levels, expressed as a grade
% achieving A levels at grades AAB or higher (in at least 2 facilitating subjects)
% of students who are returned and retained for a second year % of students who complete their main programme of study and are assessed at the end of their course Cohort
Number of A level students at the end of 16 to 18 study
Number of A level entries
Number of students included in the best three A level measure
Number of students included in the AAB measure Number of students included in the A level retention measures (retention and retained and assessed) Number of students included in the A level returned and retained for a second year measure
Aca
dem
ic R
esul
ts
Headline measures
Progress:
Academic value added score with confidence limits
Attainment:
Average point score per academic entry
Average point score per academic entry expressed as a grade
Retention:
% of students completing their main study programme
Additional measures
% of students who are returned and retained for a second year % of students who complete their main programme of study and are assessed at the end of their course Cohort
Number of academic students at the end of 16 to 18 study
Number of academic entries Number of students included in the academic retention measures (retention and retained and assessed) Number of students included in the academic returned and retained for a second year measure
App
lied
Gen
eral
R
esul
ts
Headline measures
Progress:
Applied General value added score with confidence limits
Attainment:
Average point score per Applied General entry
28
Average point score per Applied General entry expressed as a grade
Retention:
% of students completing their main study programme
Additional measures
% of students who are returned and retained for a second year % of students who complete their main programme of study and are assessed at the end of their course Cohort
Number of Applied General students at the end of 16 to 18 study
Number of Applied General entries Number of students included in the Applied General retention measures (retention and retained and assessed) Number of students included in the Applied General returned and retained for a second year measure
Tech
Lev
el R
esul
ts
Headline measures
Progress:
Tech Level completion and attainment score
Attainment:
Average point score per Tech Level entry
Average point score per Tech Level entry expressed as a grade
Retention:
% of students completing their main study programme
Additional measures
Number of students achieving the Technical Baccalaureate (TechBacc)
% of students who are returned and retained for a second year % of students who complete their main programme of study and are assessed at the end of their course Cohort
Number of Tech Level students at the end of 16 to 18 study
Number of Tech Level learning aims Number of students included in the Tech Level retention measures (retention and retained and assessed) Number of students included in the Tech level returned and retained for a second year measure
Leve
l 2 v
ocat
iona
l res
ults
Headline measures
Progress:
Level 2 vocational completion and attainment score
Attainment:
Average point score per Level 2 vocational qualification entry
Average point score per Level 2 vocational qualification entry expressed as a grade
Retention:
% of students completing their main study programme
Additional measures % of students who complete their main programme of study and are assessed at the end of their course Cohort
Number of Level 2 vocational students at the end of 16 to 18 study
Number of Level 2 vocational learning aims Number of students included in the Level 2 vocational retention measures (retention and retained and assessed)
Tech
C
ertif
icat
e re
sults
Headline measures
Progress:
Tech certificate completion and attainment score
29
Attainment:
Average point score per Tech Certificate entry
Average point score per Tech Certificate entry expressed as a grade
Retention:
% of students completing their main study programme
Additional measures % of students who complete their main programme of study and are assessed at the end of their course Cohort
Number of Tech Certificate students at the end of 16 to 18 study
Number of Tech Certificate learning aims Number of students included in the Tech Certificate retention measures (retention and retained and assessed)
Leve
l 2 E
nglis
h an
d m
aths
Res
ults
(fo
r tho
se w
ithou
t a A
*-C
at
key
sta
ge 4
)
Headline measures
Progress:
Average progress in English
Average progress in Maths
Cohort
Number of students included in the English progress measure
Number of students included in the Maths progress measure
Stud
ent d
estin
atio
ns
(for
stu
dent
s th
at fi
nish
ed 1
6 to
18
stud
y in
201
4/15
)
Headline measure
Students staying in education or employment for at least two terms after 16 to 18 study
Additional breakdown of destinations
Apprenticeships
Students staying in employment for at least two terms after 16 to 18 study
Students staying in education for at least two terms after 16 to 18 study
UK higher education institution
Top third of higher education institutions
Of which Russell group
Of which Oxford or Cambridge
Other higher education institutions or providers
Further education college or other further education provider
Other education destinations
Students not in education or employment for at least two terms after 16 to 18 study
Destination unknown
UCAS deferred entries to higher education institutions
Cohort
Total number of students included in destination measures
Add
ition
al
mea
sure
s
Level 3 maths:
Number of students in scope for level 3 maths measures % of students who achieved A*-C in GCSE maths (or equivalent) by the end of key stage 4 and who go on to achieve an approved level 3 maths qualification Technical certificate: % of students whose highest attainment is a level 2 qualification and who achieve an approved technical certificate
The headline attainment, progress, retention, English and maths measures and number of students in the cohort will be published for each cohort for disadvantaged and non-disadvantaged students, and destinations measures and number of students included for disadvantaged and all other students.

30
Annex D – cross cutting performance tables content
Abs
ence
Overall absence rate
% of pupils that are persistent absentees (missing 10%+ sessions)
Fina
nce
(prim
ary
& se
cond
ary
only
) Fi
gure
s pr
esen
ted
avai
labl
e as
£ p
er p
upil
or p
ropo
rtion
of t
otal
exp
endi
ture
School income per pupil
Total income
Government funding
Self-generated income
School spending per pupil
Total spend per pupil
Teaching staff
Supply staff
Education support staff
Bought in professional services – curriculum
Other staff costs
Learning resources (not ICT)
ICT Learning resources
Back office (including staff costs)
Catering (including staff costs)
Premises (including staff costs)
Energy
Other spending
School spending per pupil over time
Total spend per pupil
Teaching and education support staff costs
Supply teachers
Back office costs
Energy
All other spending
Wor
kfor
ce
Headcount of all teachers in a school
Headcount of all teaching assistants in a school
Headcount of all support (exc. auxiliary) staff in a school
Full-time equivalent number of all teachers in a school
Full-time equivalent number of all teaching assistants in a school
Full-time equivalent number of all support (exc. auxiliary) staff in a school
Ratio of pupils to teachers in a school
Average gross salary of all fulltime qualified teachers in a school
31
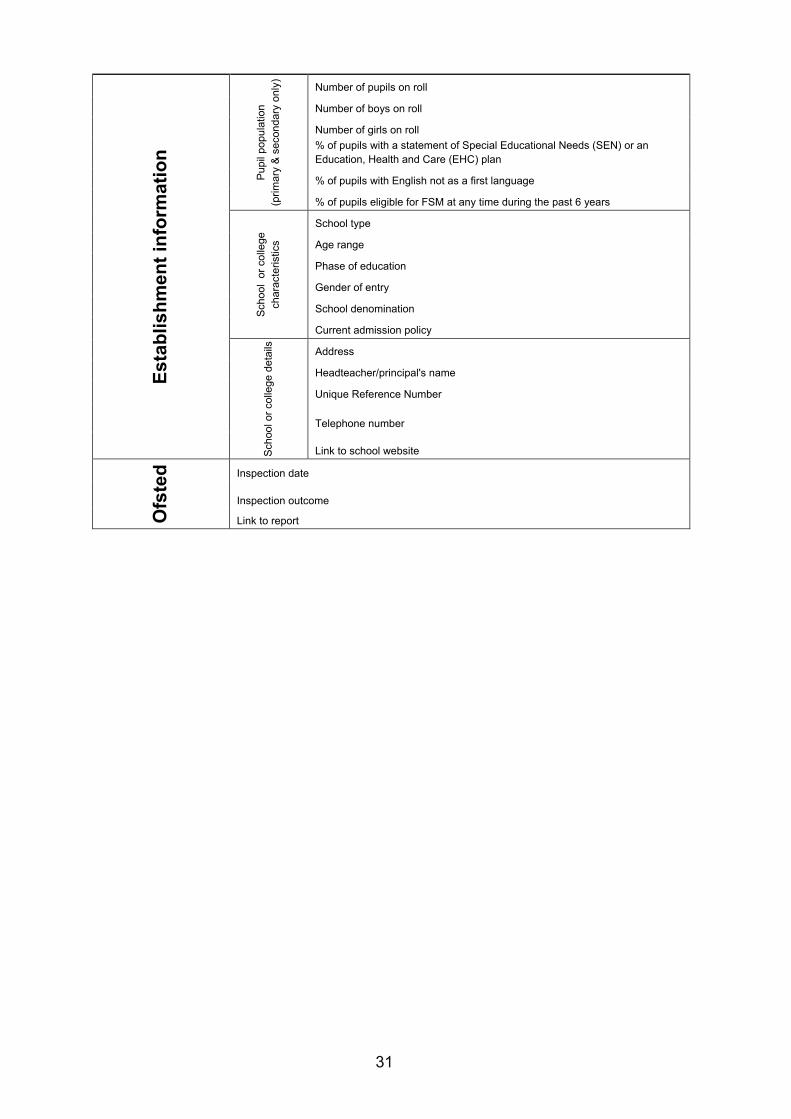
Esta
blis
hmen
t inf
orm
atio
n
Pupi
l pop
ulat
ion
(prim
ary
& se
cond
ary
only
)
Number of pupils on roll
Number of boys on roll
Number of girls on roll % of pupils with a statement of Special Educational Needs (SEN) or an Education, Health and Care (EHC) plan
% of pupils with English not as a first language
% of pupils eligible for FSM at any time during the past 6 years
Scho
ol o
r col
lege
ch
arac
teris
tics
School type
Age range
Phase of education
Gender of entry
School denomination
Current admission policy
Scho
ol o
r col
lege
det
ails
Address
Headteacher/principal's name
Unique Reference Number
Telephone number
Link to school website
Ofs
ted Inspection date
Inspection outcome
Link to report

32
© Crown copyright 2017
This publication (not including logos) is licensed under the terms of the Open Government Licence v3.0 except where otherwise stated. Where we have identified any third party copyright information you will need to obtain permission from the copyright holders concerned.
To view this licence: visit www.nationalarchives.gov.uk/doc/open-government-licence/version/3 email [email protected] write to Information Policy Team, The National Archives, Kew, London, TW9 4DU
About this publication: enquiries www.education.gov.uk/contactus download www.gov.uk/government/publications
Reference: DFE-00188-2017
Follow us on Twitter: @educationgovuk
Like us on Facebook: facebook.com/educationgovuk