2017 road asset valuation - gisborne districtpo box 13-052, armagh, christchurch 8141 tel +64 6 873...
TRANSCRIPT

2017 ROAD ASSET VALUATION Prepared for Gisborne District Council
July 2017
Appendix 1

Status: Final July 2017 Project number: 80507996 Our ref: GDC Valuation 2017 - FINAL
This document has been prepared for the benefit of Gisborne District Council. No liability is accepted by this company or any employee or sub-consultant of this company with respect to its use by any other person.
This disclaimer shall apply notwithstanding that the report may be made available to other persons for an application for permission or approval to fulfil a legal requirement.
QUALITY STATEMENT
PROJECT MANAGER PROJECT TECHNICAL LEAD
Pauline True Pauline True
PREPARED BY
………………………………............... 17/07/2017 Lachlan Crawford
CHECKED BY
………………………………............... 18/07/2017 Pauline True
REVIEWED BY
………………………………............... 20/07/2017 Brian Smith
APPROVED FOR ISSUE BY
………………………………............... 25/07/2017 Pauline True
HAWKES BAY
1st Floor, 100 Warren Street South, Hastings 4122
PO Box 13-052, Armagh, Christchurch 8141
TEL +64 6 873 8900, FAX +64 6 873 8901
REVISION SCHEDULE
Rev No.
Date Description
Signature or Typed Name (documentation on file)
Prepared by
Checked by
Reviewed by
Approved by
1 17/07/2017 Draft for Review L Crawford P True B Smith P True
2 25/07/2017 Final L Crawford P True B Smith P True
Status: Final July 2017 Project number: 80507996 Our ref: GDC Valuation 2017 - FINAL
Gisborne District Council
2017 Road Asset Valuation
CONTENTS 1 Declaration of Valuation ....................................................................................................... 1
1.1 Summary of Asset Valuation Results ..................................................................................... 1
2 Disclosure Requirements ..................................................................................................... 3
3 Comparison ........................................................................................................................ 4
3.1 Introduction ......................................................................................................................... 4
3.2 Comparison by Asset Type ................................................................................................... 5
3.2.1 Land under Roads ......................................................................................................... 5
3.2.2 Formation ..................................................................................................................... 5
3.2.3 Sealed Pavement Surface .............................................................................................. 5
3.2.4 Sealed Pavement Layers ............................................................................................... 6
3.2.5 Unsealed Pavement Layers ............................................................................................ 6
3.2.6 Drainage ....................................................................................................................... 6
3.2.7 Surface Water Channels ................................................................................................ 7
3.2.8 Footpaths...................................................................................................................... 7
3.2.9 Traffic Facilities ............................................................................................................. 7
3.2.10 Minor Structures ............................................................................................................ 7
3.2.11 Signs ............................................................................................................................ 8
3.2.12 Railings ........................................................................................................................ 8
3.2.13 Car Parks...................................................................................................................... 8
3.2.14 Street Lights .................................................................................................................. 9
3.2.15 Bridges and Bridge Culverts ........................................................................................... 9
4 Valuation Methodology ...................................................................................................... 10
4.1 Scope ............................................................................................................................... 10
4.2 Network Statistics .............................................................................................................. 12
4.3 Valuation Process .............................................................................................................. 13
4.3.1 Data Sources .............................................................................................................. 13
4.3.2 Data Verification .......................................................................................................... 13
4.3.3 Significant Assumptions ............................................................................................... 13
4.3.4 Obsolescence ............................................................................................................. 14
4.3.5 Impairment .................................................................................................................. 14
4.3.6 Unit Replacement Costs ............................................................................................... 14
4.3.7 Total Useful Lives ........................................................................................................ 14
Status: Final July 2017 Project number: 80507996 Our ref: GDC Valuation 2017 - FINAL
4.3.8 Residual Lives ............................................................................................................. 14
4.3.8.1 Footpaths ..................................................................................................... 14
4.3.8.2 Pavement Subbase ....................................................................................... 14
4.3.9 Minimum Remaining Useful Lives ................................................................................. 15
4.3.10 Restoration/Dismantling/Removal ................................................................................. 15
4.3.11 Activity Management Plan Review ................................................................................ 15
4.3.11.1 Activity Management Plan .............................................................................. 15
4.3.11.2 2015/25 Long Term Plan ................................................................................ 16
4.3.12 Quality Assurance Process........................................................................................... 16
4.3.13 Borrowing Costs during Construction Period .................................................................. 16
4.3.14 Asset Inspections ........................................................................................................ 16
5 Breakdown by Differential Rating Area ................................................................................ 17
5.1 DRA 1 ............................................................................................................................... 17
5.2 DRA 1A ............................................................................................................................. 18
5.3 DRA 2 ............................................................................................................................... 19
5.4 DRA 3 ............................................................................................................................... 20
5.5 DRA 4 ............................................................................................................................... 21
5.6 DRA 5 ............................................................................................................................... 22
6 Land ................................................................................................................................. 23
7 Formation ......................................................................................................................... 24
8 Pavement Surfacing .......................................................................................................... 25
9 Sealed Pavement Layer Structure ...................................................................................... 26
10 Unsealed Pavements Layers .............................................................................................. 28
11 Drainage ........................................................................................................................... 29
12 Surface Water Channels .................................................................................................... 31
13 Footpaths ......................................................................................................................... 32
14 Traffic Facilities ................................................................................................................. 33
15 Minor Structures ................................................................................................................ 34
16 Signs ................................................................................................................................ 35
17 Railings ............................................................................................................................ 36
18 Street Lights ..................................................................................................................... 37
19 Bridges and Bridge Culverts ............................................................................................... 38
20 Car Parks ......................................................................................................................... 39
21 Recommended Improvement Actions .................................................................................. 40
22 Completed Improvement Actions ........................................................................................ 41
23 Glossary ........................................................................................................................... 42
24 References ....................................................................................................................... 43

Status: Final July 2017 Project number: 80507996 Our ref: GDC Valuation 2017 - FINAL
LIST OF TABLES Table 1-1: Summary of 2016/2017 Asset Valuation as at 30 June 2017 ............................................... 1
Table 3-1: Summary of 30 June 2016 Asset Valuation ....................................................................... 4
Table 3-2: 30 June 2016 and 30 June 2017 Valuation Comparison ..................................................... 4
Table 3-3: 30 June 2016 and 30 June 2017 Land Under Roads Results .............................................. 5
Table 3-4: 30 June 2016 and 30 June 2017 Formation Results ........................................................... 5
Table 3-5: 30 June 2016 and 30 June 2017 Sealed Pavement Results ................................................ 5
Table 3-6: 30 June 2016 and 30 June 2017 Sealed Pavement Layers Results ..................................... 6
Table 3-7: 30 June 2016 and 30 June 2017 Unsealed Pavement Layers ............................................. 6
Table 3-8: 30 June 2016 and 30 June 2017 Drainage Results ............................................................ 6
Table 3-9: 30 June 2016 and 30 June 2017 Surface Water Channel Results ....................................... 7
Table 3-10: 30 June 2016 and 30 June 2017 Footpath Results ........................................................... 7
Table 3-11: 30 June 2016 and 30 June 2017 Traffic Facility Results ................................................... 7
Table 3-12: 30 June 2016 and 30 June 2017 Minor Structure Results ................................................. 7
Table 3-13: 30 June 2016 and 30 June 2017 Signs Results ................................................................ 8
Table 3-14: 30 June 2016 and 30 June 2017 Railing Results .............................................................. 8
Table 3-15: 30 June 2016 and 30 June 2017 Car Parks Results ......................................................... 8
Table 3-16: 30 June 2016 and 30 June 2017 Streetlights Results ....................................................... 9
Table 3-17: 30 June 2016 and 30 June 2017 Bridge and Bridge Culvert Results .................................. 9
Table 4-1: Data Confidence ........................................................................................................... 11
Table 4-2: Network Statistics as at 30 June 2017 (by pavement type) ............................................... 12
Table 4-3: Network Statistics as at 30 June 2017 (by pavement use) ................................................ 12
Table 4-4: Network Statistics as at 30 June 2017 (by ONRC Category) ............................................. 12
Table 4-5: Assets to be Valued ....................................................................................................... 13
Table 4-6: Minimum Remaining Useful Lives ................................................................................... 15
Table 4-7: Comparison of useful lives; 2017 Valuation to 2015-25 LTP.............................................. 16
Table 5-1: Summarised valuation results for DRA 1 ......................................................................... 17
Table 5-2: Summarised valuation results for DRA 1A ....................................................................... 18
Table 5-3: Summarised valuation results for DRA 2 ......................................................................... 19
Table 5-4: Summarised valuation results for DRA 3 ......................................................................... 20
Table 5-5: Summarised valuation results for DRA 4 ......................................................................... 21
Table 5-6: Summarised valuation results for DRA 5 ......................................................................... 22
Table 6-1: Valuation Parameters and Results for Land ..................................................................... 23
Table 7-1: Formation Extra Widths for Each Formation Type ............................................................ 24
Table 7-2: Valuation Parameters and Results for Formation ............................................................. 24
Table 8-1: Valuation Parameters and Results Summary for Pavement Surfacing ............................... 25
Table 9-1: Matrix for Estimating Sealed Pavement Structure ............................................................ 26
Table 9-2: Sealed Roads Extra Width Allowances ............................................................................ 26
Table 9-3: Valuation Parameters and Results Summary for Sealed Pavement Layers ........................ 27

Status: Final July 2017 Project number: 80507996 Our ref: GDC Valuation 2017 - FINAL
Table 10-1: Matrix for Estimating Unsealed Pavement Depth ............................................................ 28
Table 10-2: Valuation Parameters and Results Summary for Unsealed Pavements ............................ 28
Table 11-1: Valuation Parameters and Results Summary for Drainage Assets ................................... 30
Table 12-1: Valuation Parameters and Results Summary for Surface Water Channels ....................... 31
Table 13-1: Footpath Depreciation .................................................................................................. 32
Table 13-2: Valuation Parameters and Results Summary for Footpath Assets ................................... 32
Table 14-1: Valuation Parameters and Results Summary for Traffic Facility Assets ............................ 33
Table 15-1: Ford Structures ........................................................................................................... 34
Table 16-1: Valuation Parameters and Results Summary for Sign Assets .......................................... 35
Table 17-1: Valuation Parameters and Results Summary for Railings Asset ...................................... 36
Table 18-1: Valuation Parameters and Results Summary for Street Lights ......................................... 37
Table 19-1: Valuation Parameters and Results Summary for the Bridge and Bridge Culvert Asset ....... 38
Table 20-1: Car Parks Valuation Parameters and Valuation Summary ............................................... 39
Table 21-1: Recommended Improvement Actions ............................................................................ 40
Table 22-1: Completed Improvement Actions .................................................................................. 41
LIST OF FIGURES Figure 9-1: Effective Width for Sealed Pavement Structure Volumes ................................................. 27

GISBORNE DISTRICT COUNCIL
2017 Road Asset Valuation
Status: Final July 2017 Project No.: 80507996 Page 1 Our ref: GDC Valuation 2017 - FINAL
1 Declaration of Valuation
MWH New Zealand Ltd (MWH) was commissioned by Gisborne District Council (GDC) to value its roading infrastructure assets as at 30 June 2017.
We certify that the valuations summarised below have been completed in accordance with the following:
• NZ Infrastructure Asset Valuation and Depreciation Guidelines – Version 2.0;
• Accounting Standards PBE IPSAS 17 and PBE IPSAS 21, and
• The Local Government Act 2002.
1.1 Summary of Asset Valuation Results
Table 1-1 shows the total valuation results for all assets. This shows an annual depreciation cost of $10,800,479.
Table 1-1: Summary of 2016/2017 Asset Valuation as at 30 June 2017
Asset Description Replacement
Cost
Total Accumulated Depreciation
Depreciated Replacement
Cost
Annual Depreciation
Land $745,709,300 $0 $745,709,300 $0
Formation $400,188,338 $0 $400,188,338 $0
Sealed Pavement Surface $42,644,828 $25,009,090 $17,635,738 $2,789,836
Sealed Pavement Layers $180,507,218 $56,133,543 $124,373,675 $2,800,592
Unsealed Pavement Layers $37,591,086 $8,548,322 $29,042,764 $650,966
Drainage $50,021,554 $24,163,438 $25,858,116 $716,919
Surface Water Channels $41,163,812 $18,307,941 $22,855,871 $548,851
Footpath $43,958,809 $17,624,550 $26,334,259 $609,906
Traffic Facilities $14,158,529 $7,241,971 $6,916,558 $240,258
Minor Structures $173,258 $86,629 $86,629 $2,166
Signs $1,494,281 $1,001,934 $492,348 $122,974
Railings $6,531,039 $4,973,186 $1,557,853 $264,309
Street Lights $5,528,181 $2,481,199 $3,046,982 $300,891
Car Parks $1,774,870 $887,435 $887,435 $43,935
Bridges and Major Culverts $127,608,855 $81,686,383 $45,922,472 $1,708,877
Total $1,699,053,956 $248,145,619 $1,450,908,338 $10,800,479
We are not aware of any reason why GDC auditors should not place reliance in the valuation prepared.
The valuations are based on accurate and substantially complete asset registers and appropriate replacement costs and effective lives. The basis of the data inputs used is described in detail in the report.
GISBORNE DISTRICT COUNCIL
2017 Road Asset Valuation
Status: Final July 2017 Project No.: 80507996 Page 2 Our ref: GDC Valuation 2017 - FINAL
(a) The lives are generally based upon NZ Infrastructure Asset Valuation and Depreciation Guidelines – Version 2.0. In specific cases these have been modified where, in the opinion of MWH and GDC, a different life is appropriate. The changes are justified in the valuation report.
(b) The component level of the data used for the valuation is sufficient to calculate depreciation
separately for those assets that have different useful lives.
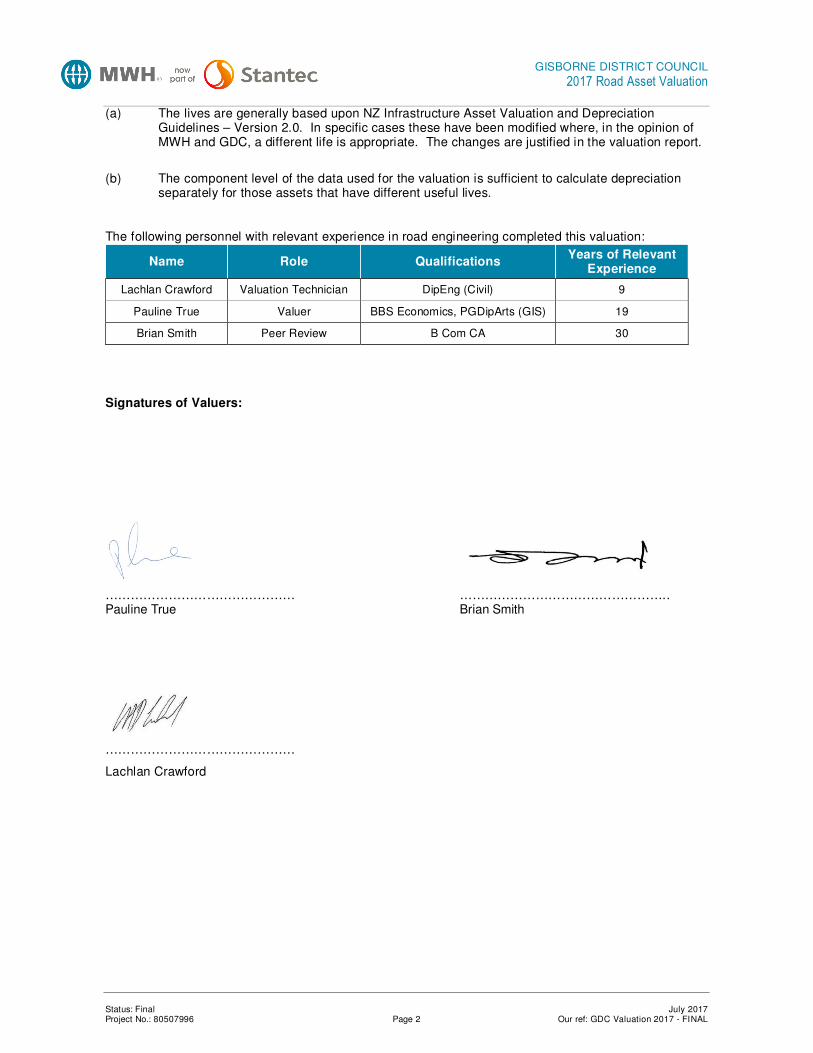
The following personnel with relevant experience in road engineering completed this valuation:
Name Role Qualifications Years of Relevant
Experience
Lachlan Crawford Valuation Technician DipEng (Civil) 9
Pauline True Valuer BBS Economics, PGDipArts (GIS) 19
Brian Smith Peer Review B Com CA 30
Signatures of Valuers:
……………………………………… ………………………………………….. Pauline True Brian Smith
………………………………………
Lachlan Crawford

GISBORNE DISTRICT COUNCIL
2017 Road Asset Valuation
Status: Final July 2017 Project No.: 80507996 Page 3 Our ref: GDC Valuation 2017 - FINAL
2 Disclosure Requirements
Consistent with NZ Infrastructure Asset Valuation and Depreciation Guidelines – Version 2.0, Section 6.2.1, it is prohibited to publish any of the following without the written approval of the valuer as to the form and context in which it is to appear:
• The report in whole or in part or any reference thereto.
• The valuation figures contained within the report.
• The names and professional affiliations of the valuers.
The valuation has been prepared in accordance with appropriate guidelines and standards, that the engagement was performed independently and without bias towards the clients or others.

GISBORNE DISTRICT COUNCIL
2017 Road Asset Valuation
Status: Final July 2017 Project No.: 80507996 Page 4 Our ref: GDC Valuation 2017 - FINAL
3 Comparison
3.1 Introduction
This section shows the comparison between the 30 June 2016 and 30 June 2017 valuations with a summary comparison and an individual comparison of each asset type with explanations for the differences.
Table 3-1 shows the results from the 30 June 2016 valuation for all assets.
Table 3-1: Summary of 30 June 2016 Asset Valuation
Asset Description Replacement Cost Depreciated
Replacement Cost Annual Depreciation
Land $730,942,439 $730,942,439 $0
Formation $386,207,940 $386,207,940 $0
Sealed Pavement Surface $41,341,974 $17,149,811 $2,676,215
Sealed Pavement Layers $175,303,125 $124,158,416 $2,720,042
Unsealed Pavement Layers $36,109,771 $27,372,897 $644,721
Drainage $48,328,400 $24,999,027 $692,656
Surface Water Channels $39,745,413 $22,089,470 $529,939
Footpath $41,562,888 $25,093,470 $577,247
Traffic Facilities $19,700,447 $9,648,907 $311,129
Minor Structures $167,513 $83,756 $2,094
Signs $1,355,288 $474,885 $112,668
Railings $4,055,454 $383,585 $101,356
Street Lights $5,410,239 $3,030,176 $295,016
Car Parks $1,718,888 $859,444 $42,717
Bridges and Major Culverts $120,851,660 $44,730,671 $1,626,702
Total $1,652,801,441 $1,417,224,892 $10,332,501
Table 3-2: 30 June 2016 and 30 June 2017 Valuation Comparison
Valuation Replacement Cost Depreciated Replacement Cost Annual Depreciation
30 June 2016 $1,652,801,441 $1,417,224,892 $10,332,501
30 June 2017 $1,699,053,956 $1,450,908,338 $10,800,479
% Change 2.80% 2.38% 4.53%
In summary the 2017 RAMM valuation aligns well with the 2016 RAMM valuation, with some notable exceptions that will be explained in this report. Council continues to better utilise RAMM, continuing to grow and invest time in collection and auditing of assets. This year Council have undertaken major data collection and validation on both the retaining walls and railing tables. This investment helps to better manage their network with a more robust understanding of the assets they are responsible for. With better field validations and data collection, Council can have additional confidence in the valuation process, making adjustments to the lives of assets based on robust information and local knowledge. This relates the 2017 valuation more closely with current design practices and council procedures. It is also important for Council to monitor these changes as they have had a significant impact on the value of their assets.

GISBORNE DISTRICT COUNCIL
2017 Road Asset Valuation
Status: Final July 2017 Project No.: 80507996 Page 5 Our ref: GDC Valuation 2017 - FINAL
3.2 Comparison by Asset Type
3.2.1 Land under Roads
Table 3-3: 30 June 2016 and 30 June 2017 Land Under Roads Results
Valuation Replacement Cost Depreciated Replacement Cost Annual Depreciation
30 June 2016 $730,942,439 $730,942,439 $0
30 June 2017 $745,709,300 $745,709,300 $0
% Change 2.02% 2.02%
The increases in Replacement Cost and Depreciated Replacement Cost are due to an increase in land values in the Gisborne Region, and a small increase in land quantity.
3.2.2 Formation
Table 3-4: 30 June 2016 and 30 June 2017 Formation Results
Valuation Replacement Cost Depreciated Replacement Cost Annual Depreciation
30 June 2016 $386,207,940 $386,207,940 $0
30 June 2017 $400,188,338 $400,188,338 $0
% Change 3.62% 3.62%
The increases in Replacement Cost and Depreciated Replacement Cost are due to an increase in unit rates and a small increase in formation quantity.
3.2.3 Sealed Pavement Surface
Table 3-5: 30 June 2016 and 30 June 2017 Sealed Pavement Results
Valuation Replacement Cost Depreciated Replacement Cost Annual Depreciation
30 June 2016 $41,341,974 $17,149,811 $2,676,215
30 June 2017 $42,644,828 $17,635,738 $2,789,836
% Change 3.15% 2.83% 4.25%
The increases in Replacement Cost, Depreciated Replacement Cost and Annual Depreciation are due to an increase in the unit rates for resealing.
GISBORNE DISTRICT COUNCIL
2017 Road Asset Valuation
Status: Final July 2017 Project No.: 80507996 Page 6 Our ref: GDC Valuation 2017 - FINAL
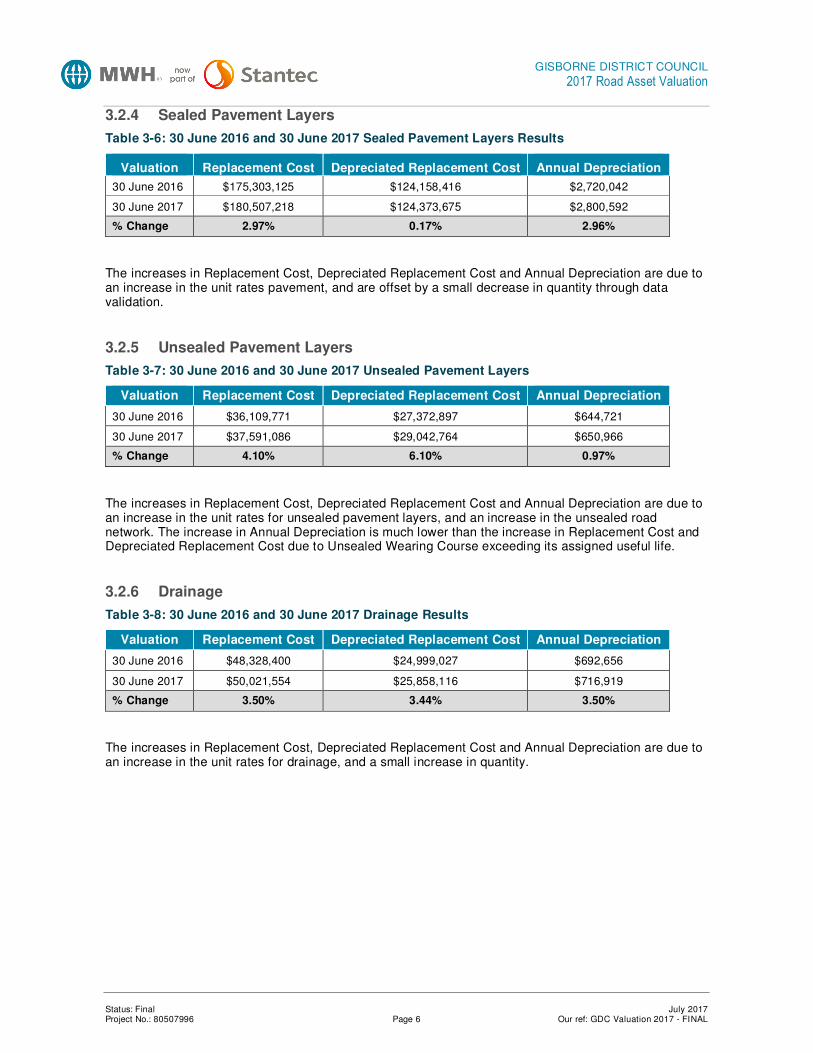
3.2.4 Sealed Pavement Layers
Table 3-6: 30 June 2016 and 30 June 2017 Sealed Pavement Layers Results
Valuation Replacement Cost Depreciated Replacement Cost Annual Depreciation
30 June 2016 $175,303,125 $124,158,416 $2,720,042
30 June 2017 $180,507,218 $124,373,675 $2,800,592
% Change 2.97% 0.17% 2.96%
The increases in Replacement Cost, Depreciated Replacement Cost and Annual Depreciation are due to an increase in the unit rates pavement, and are offset by a small decrease in quantity through data validation.
3.2.5 Unsealed Pavement Layers
Table 3-7: 30 June 2016 and 30 June 2017 Unsealed Pavement Layers
Valuation Replacement Cost Depreciated Replacement Cost Annual Depreciation
30 June 2016 $36,109,771 $27,372,897 $644,721
30 June 2017 $37,591,086 $29,042,764 $650,966
% Change 4.10% 6.10% 0.97%
The increases in Replacement Cost, Depreciated Replacement Cost and Annual Depreciation are due to an increase in the unit rates for unsealed pavement layers, and an increase in the unsealed road network. The increase in Annual Depreciation is much lower than the increase in Replacement Cost and Depreciated Replacement Cost due to Unsealed Wearing Course exceeding its assigned useful life.
3.2.6 Drainage
Table 3-8: 30 June 2016 and 30 June 2017 Drainage Results
Valuation Replacement Cost Depreciated Replacement Cost Annual Depreciation
30 June 2016 $48,328,400 $24,999,027 $692,656
30 June 2017 $50,021,554 $25,858,116 $716,919
% Change 3.50% 3.44% 3.50%
The increases in Replacement Cost, Depreciated Replacement Cost and Annual Depreciation are due to an increase in the unit rates for drainage, and a small increase in quantity.

GISBORNE DISTRICT COUNCIL
2017 Road Asset Valuation
Status: Final July 2017 Project No.: 80507996 Page 7 Our ref: GDC Valuation 2017 - FINAL
3.2.7 Surface Water Channels
Table 3-9: 30 June 2016 and 30 June 2017 Surface Water Channel Results
Valuation Replacement Cost Depreciated Replacement Cost Annual Depreciation
30 June 2016 $39,745,413 $22,089,470 $529,939
30 June 2017 $41,163,812 $22,855,871 $548,851
% Change 3.57% 3.47% 3.57%
The increases in Replacement Cost, Depreciated Replacement Cost and Annual Depreciation are due to an increase in the unit rates for surface water channel, and a small increase in quantity.
3.2.8 Footpaths
Table 3-10: 30 June 2016 and 30 June 2017 Footpath Results
Valuation Replacement Cost Depreciated Replacement Cost Annual Depreciation
30 June 2016 $41,562,888 $25,093,470 $577,247
30 June 2017 $43,958,809 $26,334,259 $609,906
% Change 5.76% 4.94% 5.66%
The increases in Replacement Cost, Depreciated Replacement Cost and Annual Depreciation are due to an increase in the unit rates for footpaths, and an increase in quantity largely due to the construction of the Wainui and Oneroa Cycle and Walkways.
3.2.9 Traffic Facilities
Table 3-11: 30 June 2016 and 30 June 2017 Traffic Facility Results
Valuation Replacement Cost Depreciated Replacement Cost Annual Depreciation
30 June 2016 $19,700,447 $9,648,907 $311,129
30 June 2017 $14,158,529 $6,916,558 $240,258
% Change -28.13% -28.32% -22.78%
The decreases in Replacement Cost, Depreciated Replacement Cost and Annual Depreciation are due to the data collection and validation of the retaining walls table, which has resulted in a decrease in quantity.
3.2.10 Minor Structures
Table 3-12: 30 June 2016 and 30 June 2017 Minor Structure Results
Valuation Replacement Cost Depreciated Replacement Cost Annual Depreciation
30 June 2016 $167,513 $83,756 $2,094
30 June 2017 $173,258 $86,629 $2,166
% Change 3.43% 3.43% 3.44%
The increases in Replacement Cost, Depreciated Replacement Cost and Annual Depreciation are due to an increase in the unit rates for minor structures.

GISBORNE DISTRICT COUNCIL
2017 Road Asset Valuation
Status: Final July 2017 Project No.: 80507996 Page 8 Our ref: GDC Valuation 2017 - FINAL
3.2.11 Signs
Table 3-13: 30 June 2016 and 30 June 2017 Signs Results
Valuation Replacement Cost Depreciated Replacement Cost Annual Depreciation
30 June 2016 $1,355,288 $474,885 $112,668
30 June 2017 $1,494,281 $492,348 $122,974
% Change 10.26% 3.68% 9.15%
The increases in Replacement Cost, Depreciated Replacement Cost and Annual Depreciation are due to an increase in the unit rates for signs, and an increase in the quantity of signs in the network.
3.2.12 Railings
Table 3-14: 30 June 2016 and 30 June 2017 Railing Results
Valuation Replacement Cost Depreciated Replacement Cost Annual Depreciation
30 June 2016 $4,055,454 $383,585 $101,356
30 June 2017 $6,531,039 $1,557,853 $264,309
% Change 61.04% 306.13% 160.77%
The increases in Replacement Cost, Depreciated Replacement Cost and Annual Depreciation are due to the data collection and validation of the railing table, which has resulted in significant increase in quantity.
3.2.13 Car Parks
Table 3-15: 30 June 2016 and 30 June 2017 Car Parks Results
Valuation Replacement Cost Depreciated Replacement
Cost Annual
Depreciation
30 June 2016 $1,718,888 $859,444 $42,717
30 June 2017 $1,774,870 $887,435 $43,935
% Change 3.26% 3.26% 2.85%
The increases in Replacement Cost, Depreciated Replacement Cost and Annual Depreciation are due to an increase in the unit rates for surface and pavement.
GISBORNE DISTRICT COUNCIL
2017 Road Asset Valuation
Status: Final July 2017 Project No.: 80507996 Page 9 Our ref: GDC Valuation 2017 - FINAL
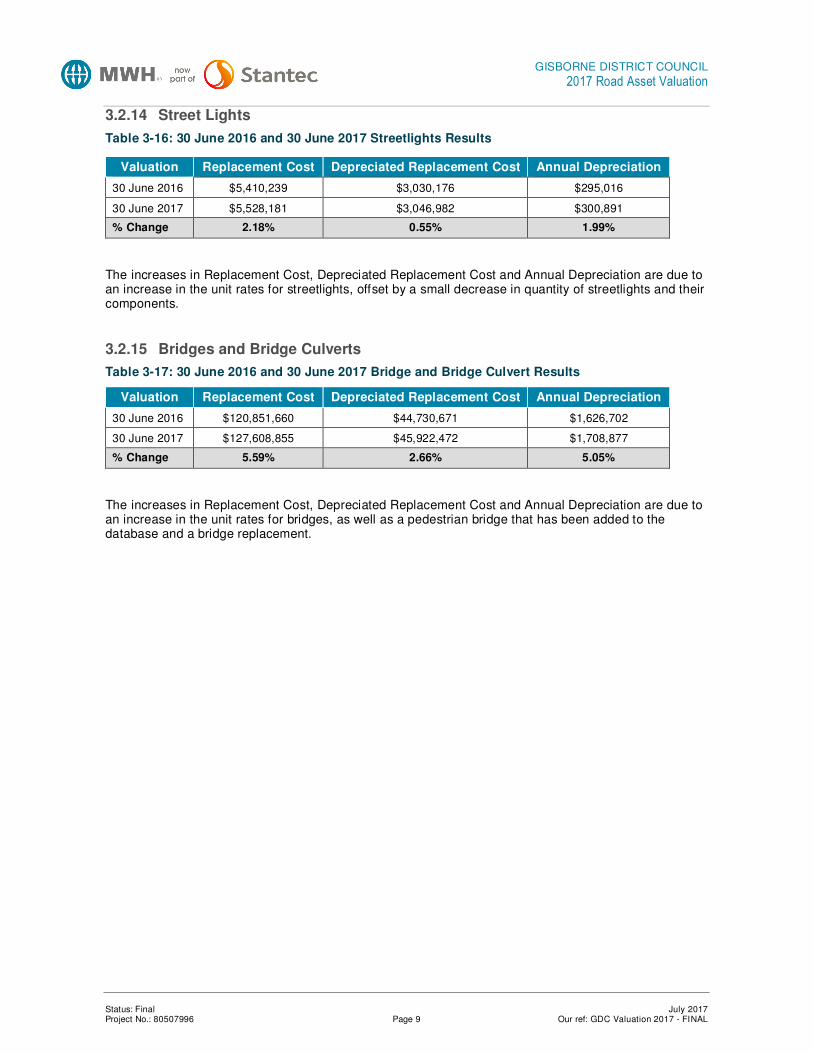
3.2.14 Street Lights
Table 3-16: 30 June 2016 and 30 June 2017 Streetlights Results
Valuation Replacement Cost Depreciated Replacement Cost Annual Depreciation
30 June 2016 $5,410,239 $3,030,176 $295,016
30 June 2017 $5,528,181 $3,046,982 $300,891
% Change 2.18% 0.55% 1.99%
The increases in Replacement Cost, Depreciated Replacement Cost and Annual Depreciation are due to an increase in the unit rates for streetlights, offset by a small decrease in quantity of streetlights and their components.
3.2.15 Bridges and Bridge Culverts
Table 3-17: 30 June 2016 and 30 June 2017 Bridge and Bridge Culvert Results
Valuation Replacement Cost Depreciated Replacement Cost Annual Depreciation
30 June 2016 $120,851,660 $44,730,671 $1,626,702
30 June 2017 $127,608,855 $45,922,472 $1,708,877
% Change 5.59% 2.66% 5.05%
The increases in Replacement Cost, Depreciated Replacement Cost and Annual Depreciation are due to an increase in the unit rates for bridges, as well as a pedestrian bridge that has been added to the database and a bridge replacement.

GISBORNE DISTRICT COUNCIL
2017 Road Asset Valuation
Status: Final July 2017 Project No.: 80507996 Page 10 Our ref: GDC Valuation 2017 - FINAL
4 Valuation Methodology
4.1 Scope
The scope of this valuation is to determine the replacement cost, depreciated replacement cost, and annual depreciation cost associated with GDC’s roading assets as at 30 June 2017. The valuation of the roading network has been completed to the appropriate component level.
The general components under which the assets have been valued are: • Land • Formation • Pavement (Structure and Surfacing) • Drainage • Surface Water Channels • Footpaths • Traffic Facilities • Minor Structures • Signs • Railings • Street Lights • Bridges and Bridge Culverts • Car Parks
The majority of the information for valuing the above components was sourced from the Road Assessment and Maintenance Management (RAMM) database. Enhancements have needed to be made to the various tables within the database so that the valuation software would run smoothly. Where data is missing, assumptions have been made to enable the valuation to be completed. These enhancements and assumptions are discussed further in the detail sections of this report.
GDC has utilised the RAMM Administrations Asset Valuation Module (RAVM) for the majority of components for this valuation. See Table 4-1 for a summary in data confidence.

GISBORNE DISTRICT COUNCIL
2017 Road Asset Valuation
Status: Final July 2017 Project No.: 80507996 Page 11 Our ref: GDC Valuation 2017 - FINAL
Table 4-1: Data Confidence
Asset Description Confidence Comments
Land B – Reliable The land uses an assumed reserve width where this is not available.
Formation B – Reliable The formation valuation uses assumed pavement extra width allowances that have been calculated based on local engineering knowledge.
Sealed Pavement Surface
A – Highly Reliable No assumptions have been made.
Sealed Pavements B – Reliable The sealed pavement valuation uses assumed pavement depths and extra width allowances that have been calculated based on local engineering knowledge. 58% of pavements use the default construction date (50% of TUL) as they have no construction information.
Unsealed Pavements B – Reliable The unsealed pavement valuation uses assumed pavement and wearing course depths that have been calculated based on local engineering knowledge.
Drainage B – Reliable Some issues with the classification of bridge culverts.
Surface Water Channels
B – Reliable 97% of surface water channels use the default construction date (50% of TUL) as they have no construction information.
Footpaths A – Highly Reliable No assumptions have been made.
Traffic Facilities C – Uncertain Some data provided by others. Uncertain of accuracy.
Minor Structures B – Reliable These assets were added in 2003 and 2011 when better data collection processes were in place. However no construction dates have been recorded.
Signs B – Reliable 30% of signs use the default construction date (50% of TUL) as they have no installation information.
Railings B – Reliable 5% of railings use the default construction date (50% of TUL) as they have no construction information.
Street Lights B – Reliable 96% of streetlight poles brackets and lamps use the default construction date (50% of TUL) as they have no construction information.
Bridges and Bridge Culverts
B – Reliable Some issues with the classification of bridge culverts (see notes on Drainage). 18% of bridges and 99% of bridge culverts use the default construction date (50% of TUL) as they have no construction information.
Car Parks C – Uncertain 100% of car parks use the default construction date (50% of TUL) as they have no construction information.
Based on NZ Infrastructure Asset Valuation and Depreciation Guidelines – Version 2.0, Table 4.3.1: Data confidence grading system.
A – Highly Reliable Data based on sound records, procedure, investigations and analysis which is properly documented and recognised as the best method of assessment.
B – Reliable Data based on sound records, procedures, investigations and analysis which is properly documented but has minor shortcomings.
C – Uncertain Data based on sound records, procedures, investigation and analysis which is incomplete or unsupported, or extrapolation from limited sample for which grade A or B data is available.
D – Very Uncertain Data based on unconfirmed verbal report and/or cursory inspection and analysis.

GISBORNE DISTRICT COUNCIL
2017 Road Asset Valuation
Status: Final July 2017 Project No.: 80507996 Page 12 Our ref: GDC Valuation 2017 - FINAL
4.2 Network Statistics
The following statistics summarise the GDC’s roading network as at 30 June 2017. This information has been obtained from the treatment length table of the RAMM database.
The lengths are calculated as the sum of the end displacement minus the start displacement (rather than the sum of the lengths). While this effectively double count the areas at intersections, it is considered to be offset by the intersection flares, which are not included.
Network statistics are based on this method to allow for direct comparison with the treatment length table, which also uses the end displacements minus the start displacements. These statistics can then be used to confirm the lengths in the Formation, Surfacing and Pavement valuations. These tables do include bridges that have their own treatment length; these are excluded when calculating formation and pavement.
Table 4-2: Network Statistics as at 30 June 2017 (by pavement type)
Pavement Type Urban (km) Rural (km) Total (km)
Sealed 227.884 617.036 844.92
Unsealed 9.433 1028.341 1037.774
Major Bridges 0.304 1.122 1.426
Total 237.621 1646.499 1884.12
Table 4-3: Network Statistics as at 30 June 2017 (by pavement use)
Pavement Use Urban Rural Total
1 ADT < 100 24.526 1114.19 1138.716
2 ADT 100-500 122.131 432.454 554.585
3 ADT 500-2000 48.862 92.31 141.172
4 ADT 2000-4000 16.595 4.49 21.085
5 ADT 4000-10000 14.337 3.055 17.392
6 ADT 10000-20000 11.17 0 11.17
7 ADT > 20000 0 0 0
Total 237.621 1646.499 1884.12
Table 4-4: Network Statistics as at 30 June 2017 (by ONRC Category)
ONRC Category Sealed Unsealed Major Bridges Total
Arterial 15.784 0 0.048 15.832
Primary Collector 48.477 0 0.156 48.633
Secondary Collector 306.232 16.554 0.057 322.843
Low Volume 141.061 731.68 0.932 873.673
Access 332.684 288.87 0.233 621.787
Not Assigned 0.682 0.67 0 1.352
Total 844.92 1037.774 1.426 1884.12

GISBORNE DISTRICT COUNCIL
2017 Road Asset Valuation
Status: Final July 2017 Project No.: 80507996 Page 13 Our ref: GDC Valuation 2017 - FINAL
4.3 Valuation Process
These values have been calculated to define this roading asset valuation Optimised Replacement Cost, Depreciated Replacement Cost and Annual Depreciation. These are defined in the Glossary (see Section 20).
4.3.1 Data Sources
The general categories under which the road components are to be valued are outlined in Table 4-5 below.
Table 4-5: Assets to be Valued
Component RAMM Table Data Source
Land Treatment Length RAMM
Formation Treatment Length RAMM
Pavements
• Sealed Pavement Structure Treatment Length RAMM
• Unsealed Pavement Structure Treatment Length RAMM
• Sealed Surfaces Treatment Length RAMM
Drainage Drainage RAMM
Surface Water Channels Surface Water Channel RAMM
Footpaths Footpath RAMM
Traffic Facilities
• Retaining Walls Retaining Walls RAMM
• Other Structures Traffic Facilities RAMM
• Parking Meters Traffic Facilities RAMM
• Traffic Signals Traffic Signals RAMM
• Raised Pavement Markers Markings RAMM
Fords Minor Structure RAMM
Markings NA Council supplied data
Signs Signs RAMM
Railings Railings RAMM
Streetlights Street Light RAMM
Bridges and Bridge Culverts Bridge RAMM
Car Parks Treatment Length RAMM
4.3.2 Data Verification
The RAMM database has been checked and any issues, errors, or missing data that need to be addressed before the valuation could run were identified and passed onto the RAMM team for updating.
4.3.3 Significant Assumptions
The default construction date will be 50% of the Total Useful Life (TUL) – unless it is otherwise stated – and only used where there is no construction date contained in RAMM. Default dates are calculated as the first of January of the year that would make the asset halfway through its life.
GISBORNE DISTRICT COUNCIL
2017 Road Asset Valuation
Status: Final July 2017 Project No.: 80507996 Page 14 Our ref: GDC Valuation 2017 - FINAL
Straight-line depreciation has been used in this valuation except where assets are deemed not to depreciate.
All assets that have been valued in RAVM have been identified as asset owner “L” (or “LA” in the signs table) for Local authority in the RAMM database.
All replacement rates, where appropriate, have included in the cost an amount for removal and disposal of the existing asset, an amount for site establishment, and an amount for the formation, supply, placement, shaping, etc., of materials.
All significant assumptions were reviewed by Council prior to the 2015 full valuation and confirmed as appropriate for the purposes of running the 30 June 2017 valuation.
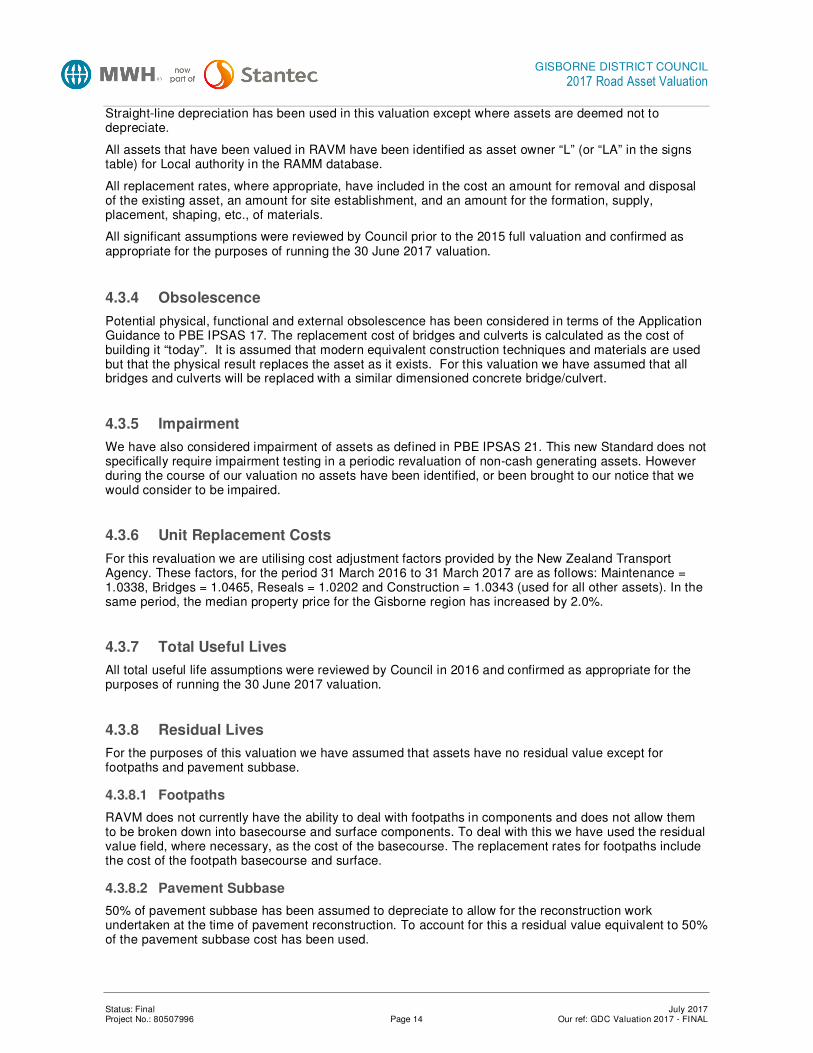
4.3.4 Obsolescence
Potential physical, functional and external obsolescence has been considered in terms of the Application Guidance to PBE IPSAS 17. The replacement cost of bridges and culverts is calculated as the cost of building it “today”. It is assumed that modern equivalent construction techniques and materials are used but that the physical result replaces the asset as it exists. For this valuation we have assumed that all bridges and culverts will be replaced with a similar dimensioned concrete bridge/culvert.
4.3.5 Impairment
We have also considered impairment of assets as defined in PBE IPSAS 21. This new Standard does not specifically require impairment testing in a periodic revaluation of non-cash generating assets. However during the course of our valuation no assets have been identified, or been brought to our notice that we would consider to be impaired.
4.3.6 Unit Replacement Costs
For this revaluation we are utilising cost adjustment factors provided by the New Zealand Transport Agency. These factors, for the period 31 March 2016 to 31 March 2017 are as follows: Maintenance = 1.0338, Bridges = 1.0465, Reseals = 1.0202 and Construction = 1.0343 (used for all other assets). In the same period, the median property price for the Gisborne region has increased by 2.0%.
4.3.7 Total Useful Lives
All total useful life assumptions were reviewed by Council in 2016 and confirmed as appropriate for the purposes of running the 30 June 2017 valuation.
4.3.8 Residual Lives
For the purposes of this valuation we have assumed that assets have no residual value except for footpaths and pavement subbase.
4.3.8.1 Footpaths
RAVM does not currently have the ability to deal with footpaths in components and does not allow them to be broken down into basecourse and surface components. To deal with this we have used the residual value field, where necessary, as the cost of the basecourse. The replacement rates for footpaths include the cost of the footpath basecourse and surface.
4.3.8.2 Pavement Subbase
50% of pavement subbase has been assumed to depreciate to allow for the reconstruction work undertaken at the time of pavement reconstruction. To account for this a residual value equivalent to 50% of the pavement subbase cost has been used.

GISBORNE DISTRICT COUNCIL
2017 Road Asset Valuation
Status: Final July 2017 Project No.: 80507996 Page 15 Our ref: GDC Valuation 2017 - FINAL
4.3.9 Minimum Remaining Useful Lives
The Minimum Remaining Useful Life is applied to assets that are older than their useful life. It recognises that although an asset is older than its useful life it may still be in service and therefore have some value. Where an asset is older than its standard useful life, the minimum remaining useful life is added to the assets age and used in the calculation of the depreciated replacement value. The minimum remaining useful lives of assets in this valuation are included in the asset assumption tables, and in Table 4-6. Where an asset description has NA it indicates an asset type that is either deemed to not depreciate, or has a one year Total Useful Life.
Table 4-6: Minimum Remaining Useful Lives
Asset Description Minimum Remaining Useful Life
Land NA
Formation NA
Pavement Surface 1
Sealed Pavement First Coats 2
Sealed Pavement Basecourse 2
Sealed Pavement Subbase 2
Unsealed Pavement Wearing Course 2
Unsealed Pavement Subbase NA
Drainage 2
Surface Water Channels 2
Footpath 2
Traffic Facilities 2
Minor Structures 2
Signs 2
Railings 2
Street Lights 2
Bridges and Major Culverts 5
Car Parks 2
4.3.10 Restoration/Dismantling/Removal
All replacement rates include, where appropriate, an amount for removal and disposal of the existing asset, an amount for site establishment, and an amount for the formation, supply, placement, shaping, etc. of materials.
4.3.11 Activity Management Plan Review
The assumptions used in this valuation have been reviewed to ensure they are in line with current best practice and with the Council’s 2015/25 Long Term Plan (LTP). Areas where the valuation differs from the 2015/25 LTP are listed below.
4.3.11.1 Activity Management Plan
A comparison between the Activity Management Plan (AMP) and this valuation has been conducted. It is believed any differences in useful life information is more a result of the AMP being at a summarised level than the detailed valuation information.

GISBORNE DISTRICT COUNCIL
2017 Road Asset Valuation
Status: Final July 2017 Project No.: 80507996 Page 16 Our ref: GDC Valuation 2017 - FINAL
4.3.11.2 2015/25 Long Term Plan
A comparison of the useful lives between the LTP and this valuation is listed below. We are unaware of the specific reasons why some useful lives reported in the LTP differ from those assumed in this valuation.
Table 4-7: Comparison of useful lives; 2017 Valuation to 2015-25 LTP
Valuation
2015 – 2025 LTP
AMP
Pavement Surface (seal) 5 – 20 years 1 – 20 years 1-20 years
Pavement Surface (unsealed) 5 years 5 years 5 years
Pavement Layers (basecourse) 40 – 100 years 75 – 100 years 75-100 years
Formation Not Depreciated Not Depreciated Not Depreciated
Culverts 70 years 25 – 50 years 25 – 50 years
Footpaths 20 – 75 years 20 – 75 years 20 – 75 years
Surface Water Channels 75 years 50 years 50 years
Signs 12 years 12 years 12 years
Streetlights 15 – 25 years 15 – 25 years 15 – 25 years
Bridges 25 – 80 years 25 – 80 years 25 – 80 years
Retaining Structures 80 years 80 years 80 years
Traffic Signals 15 years 15 years 15 years
Parking Meters 15 years 25 years 25 years
Railings 10 – 15 years 10 – 15 years 10 – 15 years
Safety Projects 10 – 13 years 10 – 13 years
4.3.12 Quality Assurance Process
Quality checks, based on NZ Infrastructure Asset Valuation and Depreciation Guidelines – Version 2.0, Section 6.2.2, have been undertaken on this document by both the valuer and the reviewer.
4.3.13 Borrowing Costs during Construction Period
No borrowing costs have been included in this valuation. The Financial Reporting Standard PBE IPSAS 5 gives Public Benefit Entities the option to exclude or include borrowing costs on assets during the construction period. GDC has opted to exclude borrowing costs.
4.3.14 Asset Inspections
No asset inspections were required as part of this valuation.

GISBORNE DISTRICT COUNCIL
2017 Road Asset Valuation
Status: Final July 2017 Project No.: 80507996 Page 17 Our ref: GDC Valuation 2017 - FINAL
5 Breakdown by Differential Rating Area
The tables below show the results for each Differential Rating Area (DRA) broken down by asset type. These tables do not include Carparks or accessways, as they are not assigned a DRA.
5.1 DRA 1
Table 5-1: Summarised valuation results for DRA 1
Asset Type Replacement Cost
Depreciated Replacement Cost
Annual Depreciated Replacement Cost
Bridge Culvert $180,651 $90,325 $3,613
Bridges $10,552,452 $2,488,389 $141,628
Drainage $150,444 $101,097 $2,149
First Coat Seals $8,073,964 $4,466,336 $201,849
Footpath $38,923,448 $23,108,919 $537,276
Formation $21,114,189 $21,114,189 $0
Land $491,861,245 $491,861,245 $0
Railings $443,430 $113,420 $20,961
Retaining Walls $230,126 $166,408 $2,877
Sealed Pavement Basecourse $16,408,037 $9,133,099 $410,201
Sealed Pavement Subbase $21,889,343 $17,500,442 $119,380
Signs $762,829 $157,075 $63,122
Streetlights - brackets $1,036,941 $561,095 $69,130
Streetlights - lights $1,410,216 $793,703 $94,005
Streetlights - poles $2,305,160 $1,179,600 $92,882
Surface Water Channels $33,383,256 $17,528,081 $445,110
Surfacing $20,998,456 $10,525,890 $1,231,139
Traffic Facilities $650,639 $64,407 $30,989
Grand Total $670,374,827 $600,953,720 $3,466,310

GISBORNE DISTRICT COUNCIL
2017 Road Asset Valuation
Status: Final July 2017 Project No.: 80507996 Page 18 Our ref: GDC Valuation 2017 - FINAL
5.2 DRA 1A
Table 5-2: Summarised valuation results for DRA 1A
Asset Type Replacement Cost
Depreciated Replacement Cost
Annual Depreciated Replacement Cost
Bridge Culvert $168,996 $34,188 $4,273
Bridges $422,525 $191,274 $7,333
Drainage $826,741 $417,708 $11,811
First Coat Seals $1,108,607 $620,473 $27,715
Footpath $1,409,078 $1,049,601 $18,848
Formation $6,290,715 $6,290,715 $0
Land $124,190,350 $124,190,350 $0
Railings $37,840 $10,576 $2,276
Retaining Walls $107,770 $55,010 $1,347
Sealed Pavement Basecourse $2,291,241 $1,280,324 $57,281
Sealed Pavement Subbase $3,275,151 $2,716,818 $17,380
Signs $47,905 $11,346 $3,964
Streetlights - brackets $67,891 $37,076 $4,526
Streetlights - lights $141,537 $93,450 $9,436
Streetlights - poles $149,087 $75,824 $5,999
Surface Water Channels $1,926,872 $1,272,295 $25,692
Surfacing $1,568,697 $629,118 $104,019
Unsealed Pavement Subbase $106,112 $79,582 $531
Unsealed Pavement Wearing Course $9,867 $5,921 $1,974
Grand Total $144,146,984 $139,061,651 $304,404
GISBORNE DISTRICT COUNCIL
2017 Road Asset Valuation
Status: Final July 2017 Project No.: 80507996 Page 19 Our ref: GDC Valuation 2017 - FINAL
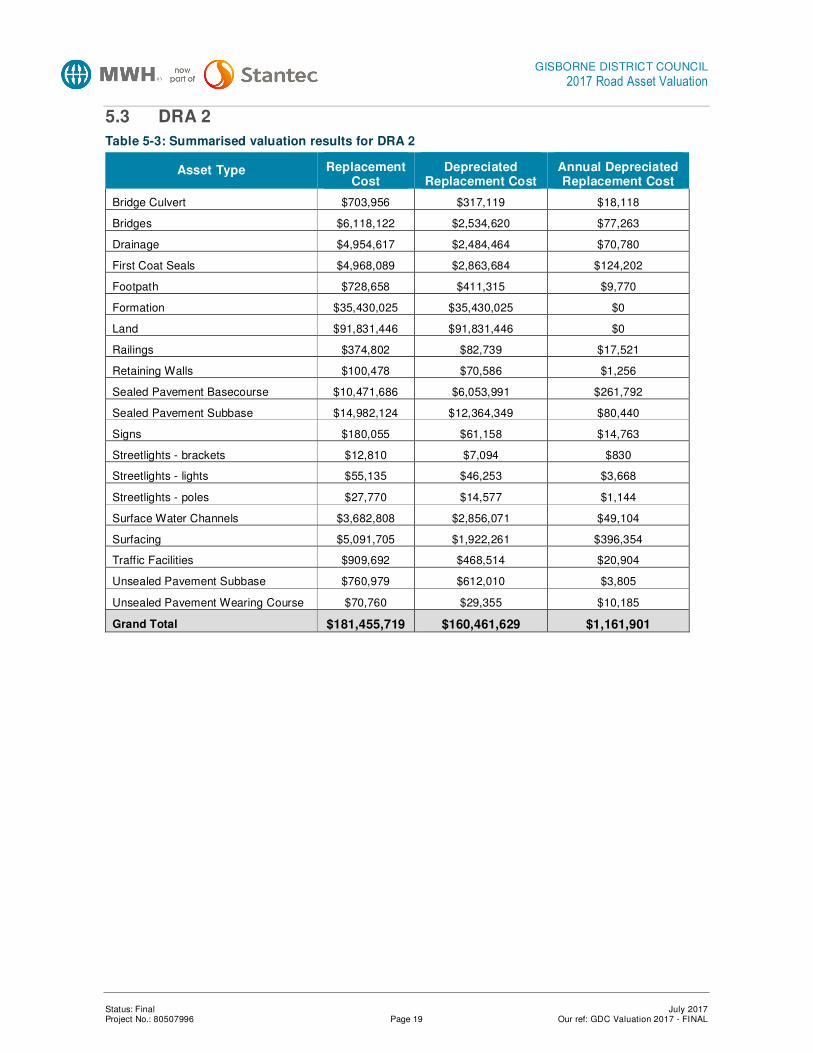
5.3 DRA 2
Table 5-3: Summarised valuation results for DRA 2
Asset Type Replacement Cost
Depreciated Replacement Cost
Annual Depreciated Replacement Cost
Bridge Culvert $703,956 $317,119 $18,118
Bridges $6,118,122 $2,534,620 $77,263
Drainage $4,954,617 $2,484,464 $70,780
First Coat Seals $4,968,089 $2,863,684 $124,202
Footpath $728,658 $411,315 $9,770
Formation $35,430,025 $35,430,025 $0
Land $91,831,446 $91,831,446 $0
Railings $374,802 $82,739 $17,521
Retaining Walls $100,478 $70,586 $1,256
Sealed Pavement Basecourse $10,471,686 $6,053,991 $261,792
Sealed Pavement Subbase $14,982,124 $12,364,349 $80,440
Signs $180,055 $61,158 $14,763
Streetlights - brackets $12,810 $7,094 $830
Streetlights - lights $55,135 $46,253 $3,668
Streetlights - poles $27,770 $14,577 $1,144
Surface Water Channels $3,682,808 $2,856,071 $49,104
Surfacing $5,091,705 $1,922,261 $396,354
Traffic Facilities $909,692 $468,514 $20,904
Unsealed Pavement Subbase $760,979 $612,010 $3,805
Unsealed Pavement Wearing Course $70,760 $29,355 $10,185
Grand Total $181,455,719 $160,461,629 $1,161,901

GISBORNE DISTRICT COUNCIL
2017 Road Asset Valuation
Status: Final July 2017 Project No.: 80507996 Page 20 Our ref: GDC Valuation 2017 - FINAL
5.4 DRA 3
Table 5-4: Summarised valuation results for DRA 3
Asset Type Replacement Cost
Depreciated Replacement Cost
Annual Depreciated Replacement Cost
Bridge Culvert $676,567 $288,286 $13,795
Bridges $25,573,720 $9,565,698 $319,647
Drainage $8,366,528 $4,273,195 $119,704
First Coat Seals $5,149,478 $2,952,978 $128,737
Footpath $675,902 $407,959 $12,156
Formation $67,084,358 $67,084,358 $0
Land $16,892,020 $16,892,020 $0
Railings $1,430,250 $396,502 $57,091
Retaining Walls $721,981 $394,236 $9,025
Sealed Pavement Basecourse $11,246,868 $6,468,155 $281,172
Sealed Pavement Subbase $15,456,547 $12,923,598 $86,378
Signs $154,947 $79,345 $12,682
Streetlights - brackets $7,686 $3,977 $512
Streetlights - lights $40,125 $33,421 $2,675
Streetlights - poles $16,636 $8,224 $691
Surface Water Channels $963,355 $541,407 $12,845
Surfacing $4,547,273 $1,543,162 $334,352
Traffic Facilities $240,237 $123,728 $9,374
Unsealed Pavement Subbase $5,004,352 $3,924,922 $25,022
Unsealed Pavement Wearing Course $465,333 $235,220 $80,332
Grand Total $164,714,161 $128,140,390 $1,506,190

GISBORNE DISTRICT COUNCIL
2017 Road Asset Valuation
Status: Final July 2017 Project No.: 80507996 Page 21 Our ref: GDC Valuation 2017 - FINAL
5.5 DRA 4
Table 5-5: Summarised valuation results for DRA 4
Asset Type Replacement Cost
Depreciated Replacement Cost
Annual Depreciated Replacement Cost
Bridge Culvert $2,220,258 $1,132,390 $65,267
Bridges $45,349,330 $18,419,252 $578,024
Drainage $23,155,259 $12,052,647 $332,160
First Coat Seals $7,058,303 $3,829,559 $176,458
Footpath $156,535 $71,750 $2,334
Formation $169,210,537 $169,210,537 $0
Land $16,621,386 $16,621,386 $0
Minor Structures $127,056 $63,528 $1,588
Railings $2,550,116 $683,510 $105,695
Retaining Walls $1,294,865 $744,905 $16,186
Sealed Pavement Basecourse $15,628,426 $8,485,464 $390,711
Sealed Pavement Subbase $21,246,703 $17,506,591 $120,356
Signs $242,150 $124,963 $19,615
Streetlights - brackets $5,764 $3,122 $384
Streetlights - lights $43,897 $39,907 $2,926
Streetlights - poles $13,821 $7,778 $604
Surface Water Channels $347,945 $200,592 $4,639
Surfacing $6,698,855 $2,070,361 $476,007
Traffic Facilities $1,881,726 $969,136 $40,094
Unsealed Pavement Subbase $17,773,212 $14,520,752 $88,866
Unsealed Pavement Wearing Course $1,652,654 $644,604 $227,300
Grand Total $333,278,798 $267,402,732 $2,649,216

GISBORNE DISTRICT COUNCIL
2017 Road Asset Valuation
Status: Final July 2017 Project No.: 80507996 Page 22 Our ref: GDC Valuation 2017 - FINAL
5.6 DRA 5
Table 5-6: Summarised valuation results for DRA 5
Asset Type Replacement Cost
Depreciated Replacement Cost
Annual Depreciated Replacement Cost
Bridge Culvert $705,121 $358,621 $20,163
Bridges $34,937,155 $10,502,309 $459,752
Drainage $12,567,964 $6,529,005 $180,317
First Coat Seals $3,530,727 $1,996,076 $88,268
Footpath $2,065,188 $1,284,715 $29,521
Formation $101,058,514 $101,058,514 $0
Land $4,312,852 $4,312,852 $0
Minor Structures $46,202 $23,101 $578
Railings $1,694,602 $271,107 $60,765
Retaining Walls $1,029,896 $370,210 $12,871
Sealed Pavement Basecourse $6,983,584 $3,950,269 $174,590
Sealed Pavement Subbase $10,738,340 $9,261,470 $53,682
Signs $106,396 $58,462 $8,828
Streetlights - brackets $29,462 $17,405 $1,964
Streetlights - lights $100,129 $86,463 $6,675
Streetlights - poles $64,114 $38,015 $2,838
Surface Water Channels $859,575 $457,425 $11,461
Surfacing $3,739,841 $944,946 $247,965
Traffic Facilities $6,735,577 $3,468,991 $85,121
Unsealed Pavement Subbase $10,748,372 $8,527,429 $53,742
Unsealed Pavement Wearing Course $999,444 $462,969 $159,210
Grand Total $203,053,057 $153,980,353 $1,658,310

GISBORNE DISTRICT COUNCIL
2017 Road Asset Valuation
Status: Final July 2017 Project No.: 80507996 Page 23 Our ref: GDC Valuation 2017 - FINAL
6 Land
This component covers all land that is identified as local authority in the RAMM treatment length table and comprises the land required to form the road corridor from boundary to boundary.
Where reserve widths were missing a standard width of 20.1 metres has been applied.
Land has been separated into groups based on geographic area.
Table 6-1 shows the total valuation results for Land.
Table 6-1: Valuation Parameters and Results for Land
Sta
nd
ard
R
ep
lac
em
en
t C
os
t D
es
cri
pti
on
Un
it
Len
gth
(m
)
Qu
an
tity
Un
it C
os
t
To
tal
Us
efu
l L
ife
Min
imu
m
Re
main
ing
Us
efu
l
Re
pla
ce
me
nt
Co
st
De
pre
cia
ted
R
ep
lac
em
en
t C
os
t
An
nu
al
De
pre
cia
tio
n
City Residential ha 165835 324.1 $1,394,963.65 N/A N/A $452,170,021 $452,170,021 $0
Gisborne City CBD ha 14686 33.2 $2,916,820.64 N/A N/A $96,972,927 $96,972,927 $0
Industrial Subdivision ha 4616 11.0 $1,648,627.03 N/A N/A $18,197,049 $18,197,049 $0
Northern Hill Country ha 505281 783.0 $5,353.65 N/A N/A $4,228,040 $4,228,040 $0
Poverty Bay Flats ha 203119 390.3 $95,139.18 N/A N/A $37,121,719 $37,121,719 $0
Prime Beachfront ha 11339 21.9 $5,706,870.17 N/A N/A $125,042,231 $125,042,231 $0
Southern Hill Country ha 938188 1568.9 $5,961.61 N/A N/A $9,413,236 $9,413,236 $0
Tolaga Bay Flats ha 39630 69.9 $36,742.18 N/A N/A $2,564,076 $2,564,076 $0
TOTAL 1882694 3202 $745,709,300 $745,709,300 $0
The unit cost for land has been rounded in the valuation process as land is valued in m2 in RAVM.

GISBORNE DISTRICT COUNCIL
2017 Road Asset Valuation
Status: Final July 2017 Project No.: 80507996 Page 24 Our ref: GDC Valuation 2017 - FINAL
7 Formation
This item comprises bulk earthworks (excluding retaining structures) required to form the road corridor. It is not possible to accurately determinate the quantities involved, as much of the construction was completed on a progressive basis over the earlier part of last century when detailed records were not kept.
Formation includes all earthworks necessary to prepare the cut and fill batters and bring the road foundation up to the underside of the subbase. It also includes formation of swale drain, side drains and shoulders.
The formation is assumed not to depreciate as regular maintenance (slip clearing, etc.) will allow it to provide adequate service indefinitely.
Each rate included an allowance for: i) Engineering fees (10%).
ii) Clearing vegetation and stripping topsoil.
iii) Bulk earthwork costs (cut-to-fill, borrow-to-fill, etc.).
iv) Preparation of subgrade (over excavation in “soft” areas).
The replacement cost for formation is calculated as the length x (width + extra) of the treatment length multiplied by the square metre rate. The extra width allows for additional shoulder, feather edge and surface water channel (SWC).
Table 7-1: Formation Extra Widths for Each Formation Type
Rural Sealed Extra Urban Sealed Extra Unsealed Extra
Formation Extra Width 4 metres 4 metres 4 metres
Table 7-2 shows the total valuation results for Formation.
Table 7-2: Valuation Parameters and Results for Formation
Sta
nd
ard
R
ep
lac
em
en
t C
os
t D
es
cri
pti
on
Un
it
Len
gth
(m
)
Qu
an
tity
(m
2)
Un
it C
os
t (I
nclu
din
g
Fe
es
)
To
tal
Us
efu
l L
ife
Min
imu
m
Re
main
ing
Us
efu
l
Re
pla
ce
me
nt
Co
st
De
pre
cia
ted
R
ep
lac
em
en
t C
os
t
An
nu
al
De
pre
cia
tio
n
Urban Sealed m² 227884 2831013 $9.89 N/A N/A $27,998,718 $27,998,718 $0
Rural Sealed m² 617036 6120199 $19.62 N/A N/A $120,078,301 $120,078,301 $0
Unsealed m² 1037774 8546146 $29.50 N/A N/A $252,111,319 $252,111,319 $0
TOTAL 1882694 17497358 $400,188,338 $400,188,338 $0

GISBORNE DISTRICT COUNCIL
2017 Road Asset Valuation
Status: Final July 2017 Project No.: 80507996 Page 25 Our ref: GDC Valuation 2017 - FINAL
8 Pavement Surfacing
Pavement surfaces have been placed into groups based on surface material and pavement use for valuation purposes.
Each rate includes an allowance for: i) Engineering fees (5%).
ii) Surfacing supply and placement based on recent contract rates.
Table 8-1 shows the key parameters used in the valuation of pavement surfaces.
Note that the capital cost of installing first coat seals have been allowed for as part of the sealed basecourse.
Table 8-1: Valuation Parameters and Results Summary for Pavement Surfacing
Sta
nd
ard
R
ep
lac
em
en
t C
os
t D
es
cri
pti
on
Un
it
Le
ng
th (
m)
Qu
an
tity
(m
2)
Un
it C
os
t (I
nclu
din
g F
ee
s)
To
tal
Us
efu
l L
ife
Re
pla
ce
men
t C
os
t
De
pre
cia
ted
R
ep
lac
em
en
t C
os
t
An
nu
al
De
pre
cia
tio
n
Asphaltic Concrete m² 31253 362119 $43.13 20 $15,618,202 $8,267,725 $777,468
Single Coat (reseal) m² 231208 1391649 $5.43 12 $7,556,652 $2,629,496 $565,904
Single Coat (second coat) m² 41783 235933 $5.39 12 $1,271,680 $266,057 $92,000
Two Coat (reseal) m² 344815 2293629 $5.39 12 $12,362,661 $4,250,657 $900,007
Two Coat (second coat) m² 52566 345407 $7.19 12 $2,483,474 $940,961 $190,122
Slurry Seal m² 768 12036 $4.92 5 $59,219 $33,864 $11,541
Void Fill Seal m² 46739 290844 $4.52 12 $1,314,615 $525,396 $99,743
Rack in Seal m² 53442 385208 $4.52 12 $1,741,140 $665,970 $133,377
Texturising Seal m² 8532 52474 $4.52 12 $237,183 $55,613 $19,674
Single Coat (first coat) m² 597 4534 $0.00 N/A $0 $0 $0
Two Coat (first coat) m² 33217 197698 $0.00 N/A $0 $0 $0
Totals 844920 5571532 $42,644,828 $17,635,738 $2,789,836
The pavement surface results show that some roads surfacing are exceeding their assigned Total Useful lives (TUL). It is recommended that Council review these lives for the next valuation.
GISBORNE DISTRICT COUNCIL
2017 Road Asset Valuation
Status: Final July 2017 Project No.: 80507996 Page 26 Our ref: GDC Valuation 2017 - FINAL
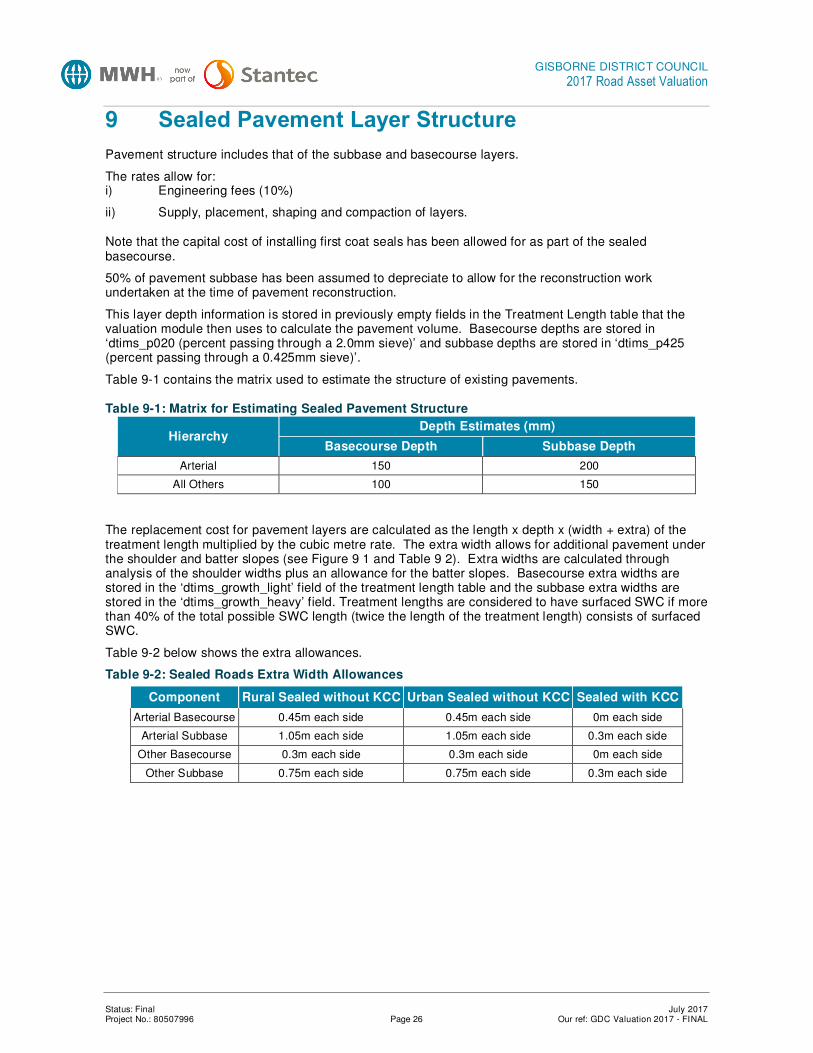
9 Sealed Pavement Layer Structure
Pavement structure includes that of the subbase and basecourse layers.
The rates allow for: i) Engineering fees (10%)
ii) Supply, placement, shaping and compaction of layers.
Note that the capital cost of installing first coat seals has been allowed for as part of the sealed basecourse.
50% of pavement subbase has been assumed to depreciate to allow for the reconstruction work undertaken at the time of pavement reconstruction.
This layer depth information is stored in previously empty fields in the Treatment Length table that the valuation module then uses to calculate the pavement volume. Basecourse depths are stored in ‘dtims_p020 (percent passing through a 2.0mm sieve)’ and subbase depths are stored in ‘dtims_p425 (percent passing through a 0.425mm sieve)’.
Table 9-1 contains the matrix used to estimate the structure of existing pavements.
Table 9-1: Matrix for Estimating Sealed Pavement Structure
Hierarchy Depth Estimates (mm)
Basecourse Depth Subbase Depth
Arterial 150 200
All Others 100 150
The replacement cost for pavement layers are calculated as the length x depth x (width + extra) of the treatment length multiplied by the cubic metre rate. The extra width allows for additional pavement under the shoulder and batter slopes (see Figure 9 1 and Table 9 2). Extra widths are calculated through analysis of the shoulder widths plus an allowance for the batter slopes. Basecourse extra widths are stored in the ‘dtims_growth_light’ field of the treatment length table and the subbase extra widths are stored in the ‘dtims_growth_heavy’ field. Treatment lengths are considered to have surfaced SWC if more than 40% of the total possible SWC length (twice the length of the treatment length) consists of surfaced SWC.
Table 9-2 below shows the extra allowances.
Table 9-2: Sealed Roads Extra Width Allowances
Component Rural Sealed without KCC Urban Sealed without KCC Sealed with KCC
Arterial Basecourse 0.45m each side 0.45m each side 0m each side
Arterial Subbase 1.05m each side 1.05m each side 0.3m each side
Other Basecourse 0.3m each side 0.3m each side 0m each side
Other Subbase 0.75m each side 0.75m each side 0.3m each side

GISBORNE DISTRICT COUNCIL
2017 Road Asset Valuation
Status: Final July 2017 Project No.: 80507996 Page 27 Our ref: GDC Valuation 2017 - FINAL
Figure 9-1: Effective Width for Sealed Pavement Structure Volumes
Effective Width (with KCC) Effective Width (without KCC)
Table 9-3 shows the total valuation results for sealed pavement layers.
Table 9-3: Valuation Parameters and Results Summary for Sealed Pavement Layers
Sta
nd
ard
R
ep
lac
em
en
t C
os
t D
es
cri
pti
on
Un
it
Len
gth
(m
)
Qu
an
tity
(m
3)
Un
it C
os
t (I
nclu
din
g
Fe
es
)
Re
sid
ua
l V
alu
e
(In
clu
din
g F
ee
s)
To
tal
Us
efu
l L
ife
Min
imu
m R
em
ain
ing
U
se
ful
Lif
e
Re
pla
ce
me
nt
Co
st
De
pre
cia
ted
R
ep
lac
em
en
t C
os
t
An
nu
al
Dep
rec
iati
on
First Coat Arterial m² 142,799 1,170,079 $7.15 40 2 $8,366,064 $4,839,917 $209,152
First Coat Other m² 702,121 4,401,453 $4.89 40 2 $21,523,105 $11,889,190 $538,078
Basecourse Arterial m3 142,799 194,230 $108.20 40 2 $21,015,684 $12,152,940 $525,392
Basecourse Other m3 702,121 480,766 $87.39 40 2 $42,014,157 $23,218,360 $1,050,354
Subbase Arterial m3 142,799 292,748 $81.40 $40.70 75 2 $23,829,650 $19,783,779 $158,864
Subbase Other m3 702,121 814,806 $78.25 $39.13 100 2 $63,758,558 $52,489,490 $318,752
TOTAL 844,920 7354081 $180,507,218 $124,373,675 $2,800,592
Width/2 Extra
5
1
AP65 M/4
Width/2 Extra

GISBORNE DISTRICT COUNCIL
2017 Road Asset Valuation
Status: Final July 2017 Project No.: 80507996 Page 28 Our ref: GDC Valuation 2017 - FINAL
10 Unsealed Pavements Layers
Unsealed pavements are separated into wearing course and basecourse (valued as subbase) components. The estimates of basecourse depth are based on local knowledge and were provided by the GDC. Regular maintenance of the wearing course, through replacement of lost metal, ensures the basecourse layer will be unaffected by surface wear and tear and will provide a service indefinitely.
The rates allow for: i) Engineering fees for unsealed basecourse (6%).
ii) Engineering fees for unsealed wearing course (6%).
iii) Supply, placement, shaping and compaction of layers.
GDC replenishes the required pavement structure on a cyclic programme. Table 10-1 shows the matrix developed for this calculation. This layer depth information is stored in previously empty fields in the Treatment Length table that the valuation module then uses to calculate the pavement volume. Wearing course depths are stored in ‘dtims_p020 (percent passing through a 2.0mm sieve)’ and basecourse depths are stored in ‘dtims_p425 (percent passing through a 0.425mm sieve)’.
Table 10-1: Matrix for Estimating Unsealed Pavement Depth
Wearing Course Depth (mm) Subbase Depth (mm)
Unsealed Pavement Depth 50 100
Table 10-2 shows the total valuation result for unsealed pavements.
Table 10-2: Valuation Parameters and Results Summary for Unsealed Pavements
Sta
nd
ard
R
ep
lac
em
en
t C
ost
De
sc
rip
tio
n
Un
it
Le
ng
th (
m)
Qu
an
tity
(m
3)
Un
it C
os
t (I
nclu
din
g F
ee
s)
Re
sid
ua
l V
alu
e
(In
clu
din
g F
ee
s)
To
tal
Us
efu
l L
ife
Min
imu
m
Re
ma
inin
g U
se
ful
Lif
e
Re
pla
ce
men
t C
ost
De
pre
cia
ted
R
ep
lac
em
en
t C
ost
An
nu
al
De
pre
cia
tio
n
Unsealed Wearing Course m³ 1,037,774 219,753 $14.55 5 2 $3,198,058 $1,378,069 $479,001
Unsealed Subbase m³ 1,037,774 439,505 $78.25 $39.13 100 2 $34,393,027 $27,664,695 $171,965
TOTAL 1037774 659258 $37,591,086 $29,042,764 $650,966
50% of pavement subbase has been assumed to depreciate to allow for the reconstruction work undertaken at the time of pavement reconstruction.
As unsealed wearing course is exceeding its assigned TUL, council will need to review this for the next valuation.

GISBORNE DISTRICT COUNCIL
2017 Road Asset Valuation
Status: Final July 2017 Project No.: 80507996 Page 29 Our ref: GDC Valuation 2017 - FINAL
11 Drainage
This component covers the following drainage assets only: • Culverts (with end areas less than 3.4m2).
• Canvas socks.
• Sumps.
• Subsoil drains.
• Flume down batters.
• Headwalls.
NZTA classifies any culvert with an end area greater than or equal to 3.4m2 as a bridge and as such, they are valued together with the bridge valuation.
The rates allow for: i) Engineering fees (12%).
ii) Supply, placement and compaction of backfill.
The RAMM database has many different culvert material types that when replaced would be replaced with concrete pipe.
The replacement value for earthenware, steel, wood, aluminium, PVC, etc. have had the concrete value assigned to give a more accurate modern equivalent replacement cost.
Where culverts diameters are missing, we have assumed that they are the most common size of 300mm.
Table 11-1 shows the total valuation results for all assets.

GISBORNE DISTRICT COUNCIL
2017 Road Asset Valuation
Status: Final July 2017 Project No.: 80507996 Page 30 Our ref: GDC Valuation 2017 - FINAL
Table 11-1: Valuation Parameters and Results Summary for Drainage Assets
Sta
nd
ard
R
ep
lac
em
en
t C
ost
De
sc
rip
tio
n
Un
it
Le
ng
th (
m)
Qu
an
tity
Un
it C
os
t (I
nclu
din
g F
ee
s)
To
tal
Us
efu
l L
ife
Min
imu
m
Re
ma
inin
g U
se
ful
Re
pla
ce
men
t C
ost
De
pre
cia
ted
R
ep
lac
em
en
t C
ost
An
nu
al
De
pre
cia
tio
n
Culvert dia <600mm m 76,572 8,144 $297.01 70 2 $22,742,650 $12,050,110 $324,895
Culvert dia 601 - 675mm m 57 6 $387.85 70 2 $22,107 $11,054 $316
Culvert dia 676 - 750mm m 1,934 165 $1,377.38 70 2 $2,663,853 $1,357,802 $38,055
Culvert dia 751 - 825mm m 124 9 $1,449.12 70 2 $179,691 $89,845 $2,567
Culvert dia 826 - 900mm m 3,290 271 $1,614.13 70 2 $5,310,649 $2,695,124 $75,866
Culvert dia 901 - 975mm m 117 9 $1,721.73 70 2 $201,442 $109,674 $2,878
Culvert dia 976 - 1050mm m 213 14 $2,044.55 70 2 $435,489 $217,745 $6,221
Culvert dia 1051 - 1200mm m 2,817 223 $2,367.37 70 2 $6,669,355 $3,357,675 $95,277
Culvert dia 1201 - 1350mm m 323 24 $2,332.78 70 2 $753,488 $390,241 $10,764
Culvert dia 1351 - 1650mm m 1,442 115 $4,335.00 70 2 $6,252,804 $3,164,705 $89,326
Culvert dia 1651 - 1800mm m 555 45 $5,276.86 70 2 $2,928,657 $1,464,329 $41,838
Culvert dia 1801 - 2080mm m 269 18 $6,283.65 70 2 $1,690,302 $845,151 $24,147
Canvas Sock Each 92 11 $1,351.37 20 2 $14,865 $5,541 $743
Sump Each 301 52 $1,251.15 70 2 $65,060 $45,578 $929
Subsoil Drain m 150 5 $27.96 20 2 $4,194 $1,826 $210
Manhole Each 168 69 $323.11 70 2 $22,295 $18,228 $319
Flume down batter Each 396 82 $788.45 25 2 $64,653 $33,490 $2,569
TOTAL 88821 9262 $50,021,554 $25,858,116 $716,919
GISBORNE DISTRICT COUNCIL
2017 Road Asset Valuation
Status: Final July 2017 Project No.: 80507996 Page 31 Our ref: GDC Valuation 2017 - FINAL
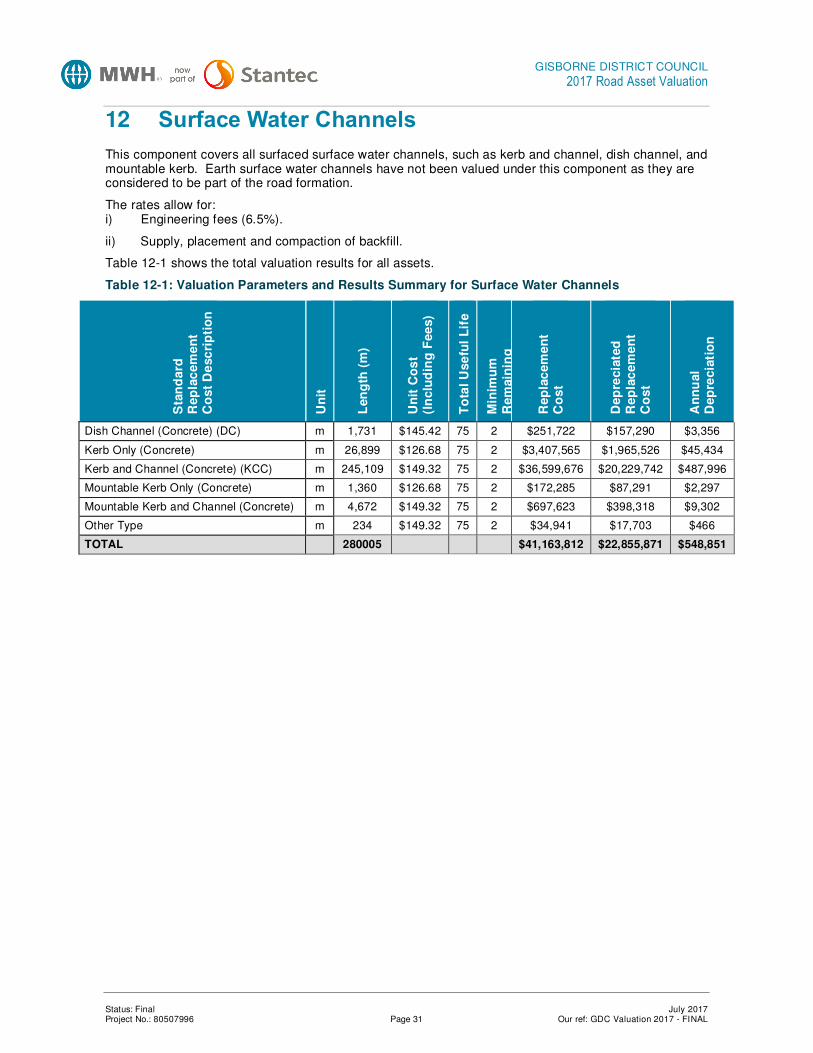
12 Surface Water Channels
This component covers all surfaced surface water channels, such as kerb and channel, dish channel, and mountable kerb. Earth surface water channels have not been valued under this component as they are considered to be part of the road formation.
The rates allow for: i) Engineering fees (6.5%).
ii) Supply, placement and compaction of backfill.
Table 12-1 shows the total valuation results for all assets.
Table 12-1: Valuation Parameters and Results Summary for Surface Water Channels
Sta
nd
ard
R
ep
lac
em
en
t C
os
t D
esc
rip
tio
n
Un
it
Len
gth
(m
)
Un
it C
os
t (I
nc
lud
ing
Fe
es)
To
tal
Us
efu
l L
ife
Min
imu
m
Re
main
ing
Re
pla
ce
me
nt
Co
st
De
pre
cia
ted
R
ep
lac
em
en
t C
os
t
An
nu
al
De
pre
cia
tio
n
Dish Channel (Concrete) (DC) m 1,731 $145.42 75 2 $251,722 $157,290 $3,356
Kerb Only (Concrete) m 26,899 $126.68 75 2 $3,407,565 $1,965,526 $45,434
Kerb and Channel (Concrete) (KCC) m 245,109 $149.32 75 2 $36,599,676 $20,229,742 $487,996
Mountable Kerb Only (Concrete) m 1,360 $126.68 75 2 $172,285 $87,291 $2,297
Mountable Kerb and Channel (Concrete) m 4,672 $149.32 75 2 $697,623 $398,318 $9,302
Other Type m 234 $149.32 75 2 $34,941 $17,703 $466
TOTAL 280005 $41,163,812 $22,855,871 $548,851
GISBORNE DISTRICT COUNCIL
2017 Road Asset Valuation
Status: Final July 2017 Project No.: 80507996 Page 32 Our ref: GDC Valuation 2017 - FINAL
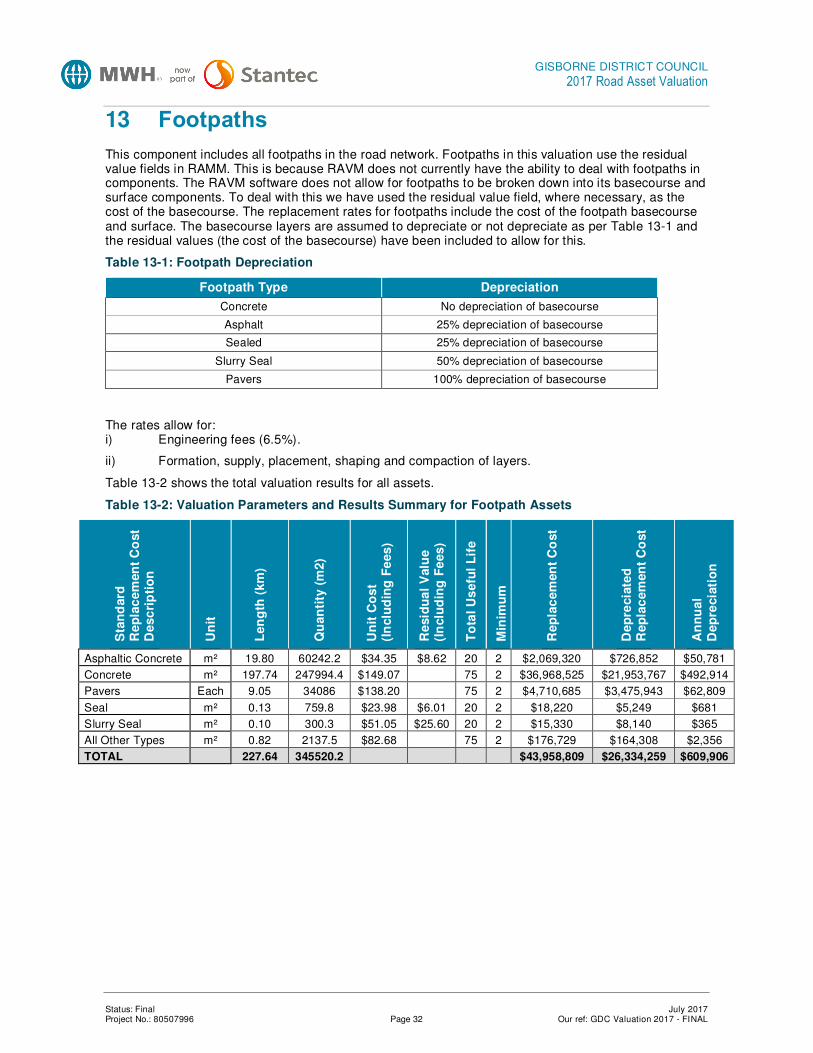
13 Footpaths
This component includes all footpaths in the road network. Footpaths in this valuation use the residual value fields in RAMM. This is because RAVM does not currently have the ability to deal with footpaths in components. The RAVM software does not allow for footpaths to be broken down into its basecourse and surface components. To deal with this we have used the residual value field, where necessary, as the cost of the basecourse. The replacement rates for footpaths include the cost of the footpath basecourse and surface. The basecourse layers are assumed to depreciate or not depreciate as per Table 13-1 and the residual values (the cost of the basecourse) have been included to allow for this.
Table 13-1: Footpath Depreciation
Footpath Type Depreciation
Concrete No depreciation of basecourse
Asphalt 25% depreciation of basecourse
Sealed 25% depreciation of basecourse
Slurry Seal 50% depreciation of basecourse
Pavers 100% depreciation of basecourse
The rates allow for: i) Engineering fees (6.5%).
ii) Formation, supply, placement, shaping and compaction of layers.
Table 13-2 shows the total valuation results for all assets.
Table 13-2: Valuation Parameters and Results Summary for Footpath Assets
Sta
nd
ard
R
ep
lac
em
en
t C
ost
De
sc
rip
tio
n
Un
it
Le
ng
th (
km
)
Qu
an
tity
(m
2)
Un
it C
os
t (I
nclu
din
g F
ee
s)
Re
sid
ua
l V
alu
e
(In
clu
din
g F
ee
s)
To
tal
Us
efu
l L
ife
Min
imu
m
Re
ma
inin
g U
se
ful
Re
pla
ce
men
t C
ost
De
pre
cia
ted
R
ep
lac
em
en
t C
ost
An
nu
al
De
pre
cia
tio
n
Asphaltic Concrete m² 19.80 60242.2 $34.35 $8.62 20 2 $2,069,320 $726,852 $50,781
Concrete m² 197.74 247994.4 $149.07 75 2 $36,968,525 $21,953,767 $492,914
Pavers Each 9.05 34086 $138.20 75 2 $4,710,685 $3,475,943 $62,809
Seal m² 0.13 759.8 $23.98 $6.01 20 2 $18,220 $5,249 $681
Slurry Seal m² 0.10 300.3 $51.05 $25.60 20 2 $15,330 $8,140 $365
All Other Types m² 0.82 2137.5 $82.68 75 2 $176,729 $164,308 $2,356
TOTAL 227.64 345520.2 $43,958,809 $26,334,259 $609,906
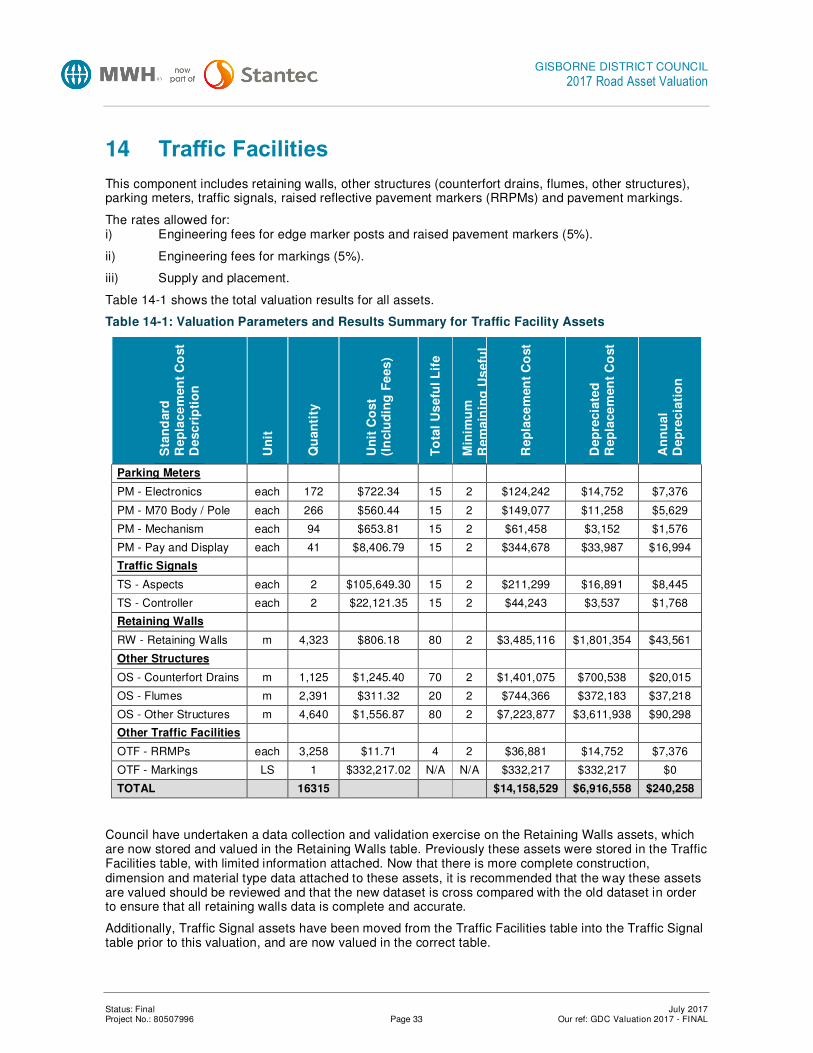
GISBORNE DISTRICT COUNCIL
2017 Road Asset Valuation
Status: Final July 2017 Project No.: 80507996 Page 33 Our ref: GDC Valuation 2017 - FINAL
14 Traffic Facilities
This component includes retaining walls, other structures (counterfort drains, flumes, other structures), parking meters, traffic signals, raised reflective pavement markers (RRPMs) and pavement markings.
The rates allowed for: i) Engineering fees for edge marker posts and raised pavement markers (5%).
ii) Engineering fees for markings (5%).
iii) Supply and placement.
Table 14-1 shows the total valuation results for all assets.
Table 14-1: Valuation Parameters and Results Summary for Traffic Facility Assets
Sta
nd
ard
R
ep
lac
em
en
t C
ost
De
sc
rip
tio
n
Un
it
Qu
an
tity
Un
it C
os
t (I
nclu
din
g F
ee
s)
To
tal
Us
efu
l L
ife
Min
imu
m
Re
ma
inin
g U
se
ful
Re
pla
ce
men
t C
ost
De
pre
cia
ted
R
ep
lac
em
en
t C
ost
An
nu
al
De
pre
cia
tio
n
Parking Meters
PM - Electronics each 172 $722.34 15 2 $124,242 $14,752 $7,376
PM - M70 Body / Pole each 266 $560.44 15 2 $149,077 $11,258 $5,629
PM - Mechanism each 94 $653.81 15 2 $61,458 $3,152 $1,576
PM - Pay and Display each 41 $8,406.79 15 2 $344,678 $33,987 $16,994
Traffic Signals
TS - Aspects each 2 $105,649.30 15 2 $211,299 $16,891 $8,445
TS - Controller each 2 $22,121.35 15 2 $44,243 $3,537 $1,768
Retaining Walls
RW - Retaining Walls m 4,323 $806.18 80 2 $3,485,116 $1,801,354 $43,561
Other Structures
OS - Counterfort Drains m 1,125 $1,245.40 70 2 $1,401,075 $700,538 $20,015
OS - Flumes m 2,391 $311.32 20 2 $744,366 $372,183 $37,218
OS - Other Structures m 4,640 $1,556.87 80 2 $7,223,877 $3,611,938 $90,298
Other Traffic Facilities
OTF - RRMPs each 3,258 $11.71 4 2 $36,881 $14,752 $7,376
OTF - Markings LS 1 $332,217.02 N/A N/A $332,217 $332,217 $0
TOTAL 16315 $14,158,529 $6,916,558 $240,258
Council have undertaken a data collection and validation exercise on the Retaining Walls assets, which are now stored and valued in the Retaining Walls table. Previously these assets were stored in the Traffic Facilities table, with limited information attached. Now that there is more complete construction, dimension and material type data attached to these assets, it is recommended that the way these assets are valued should be reviewed and that the new dataset is cross compared with the old dataset in order to ensure that all retaining walls data is complete and accurate.
Additionally, Traffic Signal assets have been moved from the Traffic Facilities table into the Traffic Signal table prior to this valuation, and are now valued in the correct table.
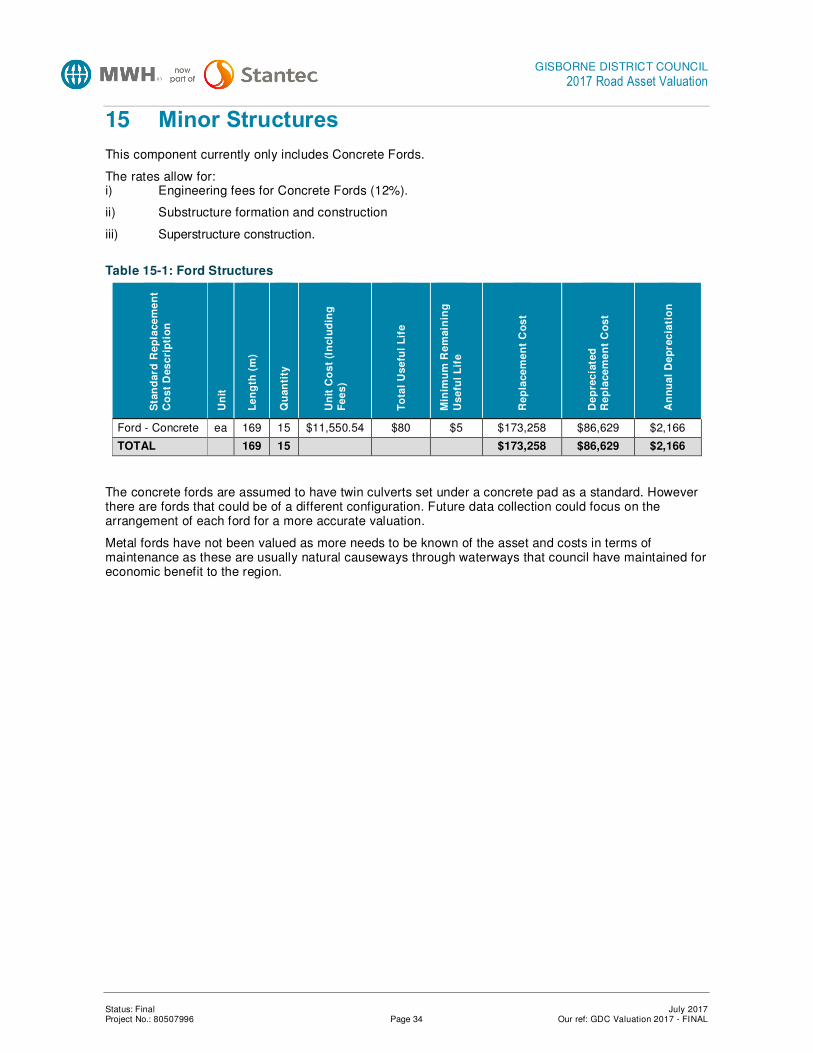
GISBORNE DISTRICT COUNCIL
2017 Road Asset Valuation
Status: Final July 2017 Project No.: 80507996 Page 34 Our ref: GDC Valuation 2017 - FINAL
15 Minor Structures
This component currently only includes Concrete Fords.
The rates allow for: i) Engineering fees for Concrete Fords (12%).
ii) Substructure formation and construction
iii) Superstructure construction.
Table 15-1: Ford Structures
Sta
nd
ard
Re
pla
ce
me
nt
Co
st
Des
cri
pti
on
Un
it
Le
ng
th (
m)
Qu
an
tity
Un
it C
os
t (I
nclu
din
g
Fe
es
)
To
tal
Us
efu
l L
ife
Min
imu
m R
em
ain
ing
Us
efu
l L
ife
Re
pla
ce
me
nt
Co
st
De
pre
cia
ted
R
ep
lace
me
nt
Co
st
An
nu
al
De
pre
cia
tio
n
Ford - Concrete ea 169 15 $11,550.54 $80 $5 $173,258 $86,629 $2,166
TOTAL 169 15 $173,258 $86,629 $2,166
The concrete fords are assumed to have twin culverts set under a concrete pad as a standard. However there are fords that could be of a different configuration. Future data collection could focus on the arrangement of each ford for a more accurate valuation.
Metal fords have not been valued as more needs to be known of the asset and costs in terms of maintenance as these are usually natural causeways through waterways that council have maintained for economic benefit to the region.

GISBORNE DISTRICT COUNCIL
2017 Road Asset Valuation
Status: Final July 2017 Project No.: 80507996 Page 35 Our ref: GDC Valuation 2017 - FINAL
16 Signs
The replacement rates for posts are included in the signs rate.
The rates allow for: i) Engineering fees (5%).
ii) Supply and placement.
Table 16-1 shows the total valuation results for all assets.
Table 16-1: Valuation Parameters and Results Summary for Sign Assets
Sta
nd
ard
R
ep
lac
em
en
t C
os
t D
es
cri
pti
on
Un
it
Qu
an
tity
Un
it C
os
t (I
nc
lud
ing
F
ees
)
To
tal
Us
efu
l L
ife
Min
imu
m R
em
ain
ing
U
se
ful
Lif
e
Rep
lac
em
en
t C
os
t
Dep
rec
iate
d
Rep
lac
em
en
t C
os
t
An
nu
al
De
pre
cia
tio
n
Guide Each 11 $239.54 12 2 $2,635 $1,697 $220
Hazard markers Each 559 $53.35 12 2 $29,876 $10,260 $2,260
Information General Each 35 $225.67 12 2 $7,898 $2,072 $538
Information Signs Each 139 $225.67 12 2 $31,368 $15,601 $2,591
Information Miscellaneous Each 11 $225.67 12 2 $2,482 $448 $139
Miscellaneous Each 1,824 $295.34 12 2 $538,996 $128,025 $44,680
Motorist Services Each 42 $225.67 12 2 $9,478 $2,069 $790
Permanent Warning Each 1,373 $224.86 12 2 $308,958 $129,025 $25,378
Regulatory General Each 1,783 $225.72 12 2 $402,684 $135,484 $33,141
Regulatory Heavy Vehicles Each 137 $225.59 12 2 $30,906 $20,890 $2,568
Regulatory Parking Each 636 $194.19 12 2 $123,505 $43,948 $10,234
Tourist Each 13 $239.43 12 2 $3,113 $1,816 $259
Warning Miscellaneous Each 15 $158.82 12 2 $2,382 $1,013 $175
TOTAL 6578 $1,494,281 $492,348 $122,974

GISBORNE DISTRICT COUNCIL
2017 Road Asset Valuation
Status: Final July 2017 Project No.: 80507996 Page 36 Our ref: GDC Valuation 2017 - FINAL
17 Railings
This component covers all guard-rails and sight rails stored in the RAMM railings table.
The rates allow for: i) Engineering fees (10%)
ii) Supply and construction.
Table 17-1 shows the total valuation results for all assets.
Table 17-1: Valuation Parameters and Results Summary for Railings Asset
Sta
nd
ard
R
ep
lac
em
en
t C
os
t D
es
cri
pti
on
Un
it
Le
ng
th (
m)
Qu
an
tity
Un
it C
os
t (I
nc
lud
ing
F
ees
)
To
tal
Us
efu
l L
ife
Min
imu
m R
em
ain
ing
U
se
ful
Lif
e
Rep
lac
em
en
t C
os
t
Dep
rec
iate
d
Rep
lac
em
en
t C
os
t
An
nu
al
De
pre
cia
tio
n
Bridge Rail m 24657 1314 $211.75 15 2 $5,221,120 $877,517 $167,676
Guard Rail m 2911 33 $193.50 15 2 $563,279 $451,719 $37,371
Sight Rail m 9991 799 $63.68 10 2 $636,227 $191,369 $51,905
Steel or Aluminium m 19 1 $211.74 15 2 $4,023 $2,146 $268
Timber m 42 2 $63.68 10 2 $2,675 $349 $175
W Section Guard Rail m 536 17 $193.50 15 2 $103,716 $34,753 $6,914
TOTAL 38156 2166 $6,531,039 $1,557,853 $264,309
45% of Bridge Railings have exceeded their Total Useful Life of 15 years. Council need to investigate the Total Useful Live assigned to these assets as in most cases they are designed to last the life time of the bridge they are attached to.

GISBORNE DISTRICT COUNCIL
2017 Road Asset Valuation
Status: Final July 2017 Project No.: 80507996 Page 37 Our ref: GDC Valuation 2017 - FINAL
18 Street Lights
This component covers all the street lights that were identified in RAMM as owned by the GDC roading department.
Lights were valued as entire head and lamp units to account for the discrepancy in price between Kendelier and other brands.
In previous valuations, Street Light Brackets that had been physically replaced had not had their data updated to reflect this, and as such were being included in the valuation.
The rates allow for: i) Engineering fees (10%).
ii) Supply and construction.
Table 18-1 below shows the total valuation results for the street lights.
Table 18-1: Valuation Parameters and Results Summary for Street Lights
Sta
nd
ard
R
ep
lac
em
en
t C
ost
De
sc
rip
tio
n
Un
it
Qu
an
tity
Un
it C
os
t (I
nc
lud
ing
F
ee
s)
To
tal
Us
efu
l L
ife
Min
imu
m R
em
ain
ing
U
se
ful
Lif
e
Re
pla
ce
men
t C
ost
De
pre
cia
ted
R
ep
lac
em
en
t C
ost
An
nu
al
Dep
rec
iati
on
Pole
Concrete ea 68 $1,650.11 25 2 $112,207 $56,236 $4,488
Fibreglass ea 20 $1,269.32 15 2 $25,386 $13,032 $1,692
Steel ea 1,713 $1,396.25 25 2 $2,391,776 $1,227,695 $95,671
Wood ea 35 $1,269.32 20 2 $44,426 $25,715 $2,195
Unknown ea 2 $1,396.25 25 2 $2,793 $1,340 $112
Bracket
Unknown ea 1,825 $635.92 15 2 $1,160,554 $629,768 $77,347
Light
Corysal Sodium 150W ea 954 $496.50 15 2 $473,661 $386,523 $31,568
Corysal Sodium 70W ea 1 $362.73 15 2 $363 $193 $24
Gough Metal Halide 70W ea 1 $401.22 15 2 $401 $294 $27
Gough Sodium 100W ea 34 $362.73 15 2 $12,333 $6,698 $822
Gough Sodium 150W ea 648 $496.45 15 2 $321,700 $173,625 $21,447
Gough Sodium 250W ea 73 $636.54 15 2 $46,467 $25,292 $3,098
Gough Sodium 70W ea 1,517 $362.77 15 2 $550,322 $295,957 $36,680
Kendelier Sodium 100W ea 4 $2,163.62 15 2 $8,654 $4,616 $577
Kendelier Sodium 70W ea 185 $2,036.41 15 2 $376,736 $199,704 $25,116
Total 7081 $5,528,181 $3,046,982 $300,891
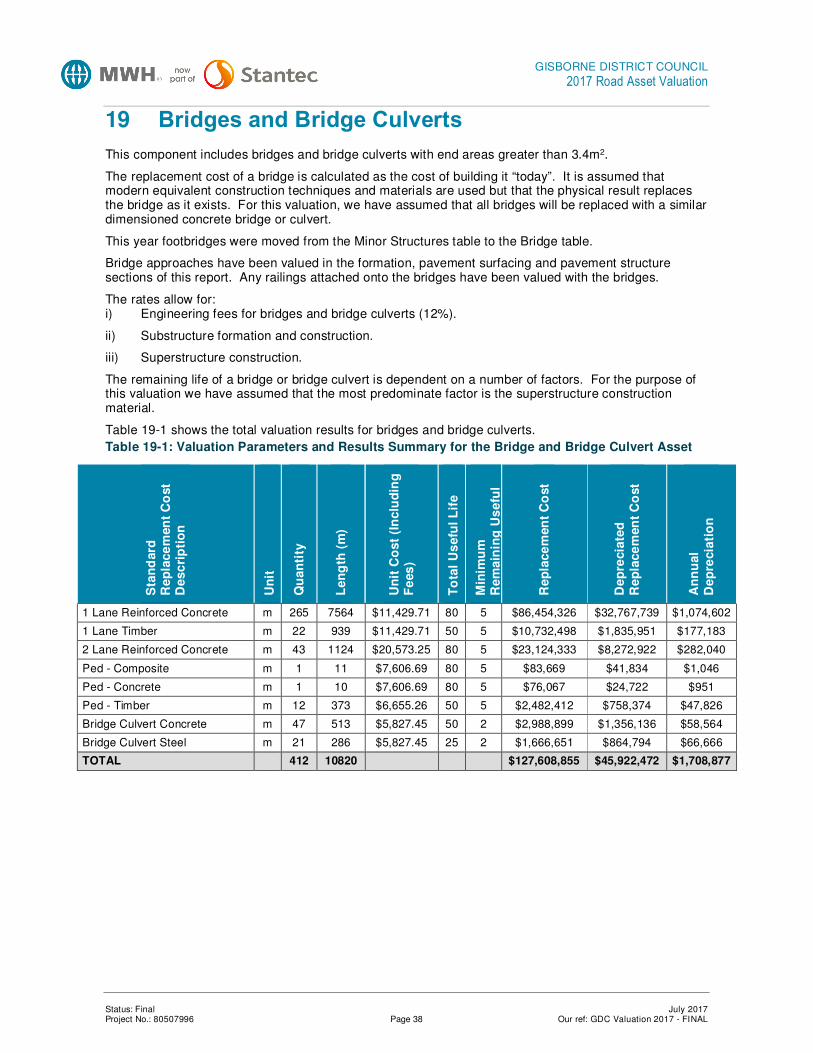
GISBORNE DISTRICT COUNCIL
2017 Road Asset Valuation
Status: Final July 2017 Project No.: 80507996 Page 38 Our ref: GDC Valuation 2017 - FINAL
19 Bridges and Bridge Culverts
This component includes bridges and bridge culverts with end areas greater than 3.4m2.
The replacement cost of a bridge is calculated as the cost of building it “today”. It is assumed that modern equivalent construction techniques and materials are used but that the physical result replaces the bridge as it exists. For this valuation, we have assumed that all bridges will be replaced with a similar dimensioned concrete bridge or culvert.
This year footbridges were moved from the Minor Structures table to the Bridge table.
Bridge approaches have been valued in the formation, pavement surfacing and pavement structure sections of this report. Any railings attached onto the bridges have been valued with the bridges.
The rates allow for: i) Engineering fees for bridges and bridge culverts (12%).
ii) Substructure formation and construction.
iii) Superstructure construction.
The remaining life of a bridge or bridge culvert is dependent on a number of factors. For the purpose of this valuation we have assumed that the most predominate factor is the superstructure construction material.
Table 19-1 shows the total valuation results for bridges and bridge culverts.
Table 19-1: Valuation Parameters and Results Summary for the Bridge and Bridge Culvert Asset
Sta
nd
ard
R
ep
lac
em
en
t C
ost
De
sc
rip
tio
n
Un
it
Qu
an
tity
Le
ng
th (
m)
Un
it C
os
t (I
nc
lud
ing
F
ees
)
To
tal
Us
efu
l L
ife
Min
imu
m
Re
ma
inin
g U
se
ful
Re
pla
ce
men
t C
ost
De
pre
cia
ted
R
ep
lac
em
en
t C
ost
An
nu
al
De
pre
cia
tio
n
1 Lane Reinforced Concrete m 265 7564 $11,429.71 80 5 $86,454,326 $32,767,739 $1,074,602
1 Lane Timber m 22 939 $11,429.71 50 5 $10,732,498 $1,835,951 $177,183
2 Lane Reinforced Concrete m 43 1124 $20,573.25 80 5 $23,124,333 $8,272,922 $282,040
Ped - Composite m 1 11 $7,606.69 80 5 $83,669 $41,834 $1,046
Ped - Concrete m 1 10 $7,606.69 80 5 $76,067 $24,722 $951
Ped - Timber m 12 373 $6,655.26 50 5 $2,482,412 $758,374 $47,826
Bridge Culvert Concrete m 47 513 $5,827.45 50 2 $2,988,899 $1,356,136 $58,564
Bridge Culvert Steel m 21 286 $5,827.45 25 2 $1,666,651 $864,794 $66,666
TOTAL 412 10820 $127,608,855 $45,922,472 $1,708,877

GISBORNE DISTRICT COUNCIL
2017 Road Asset Valuation
Status: Final July 2017 Project No.: 80507996 Page 39 Our ref: GDC Valuation 2017 - FINAL
20 Car Parks
This component includes car parks owned by Council, and was valued using a spreadsheet.
The Rates allow for: i) Engineering fees for surface water channels (6.5%).
ii) Engineering fees for all other components (5%).
Table 20-1 shows the total valuation results for car parks.
The asset information associated with car parks has yet to be collected therefore we have assumed the following. These assumptions are in line with those made for the sealed pavement structure (sealed pavement with KCC not an arterial). • Formation extra width = 4 metres. • Basecourse depth = 100mm. • Subbase depth = 150mm. • Basecourse extra width = 0 metres each side. • Subbase extra width = 0.3 metres each side. • Surfacing is single coat seal (reseal).
Table 20-1: Car Parks Valuation Parameters and Valuation Summary
Sta
nd
ard
Rep
lac
em
en
t C
os
t D
esc
rip
tio
n
Un
it
Qu
an
tity
(m
2)
Un
it C
os
t (I
nc
lud
ing
F
ee
s)
Re
sid
ua
l V
alu
e
(In
clu
din
g F
ee
s)
To
tal
Us
efu
l L
ife
Min
imu
m R
em
ain
ing
U
se
ful
Lif
e
Re
pla
ce
me
nt
Co
st
De
pre
cia
ted
R
ep
lac
em
en
t C
os
t
An
nu
al
De
pre
cia
tio
n
First Coat m2 38231 $4.84 40 2 $185,018 $92,509 $4,625
Surface m2 38231 $5.61 12 2 $214,517 $107,258 $17,876
Basecourse m2 38231 $16.36 40 2 $625,331 $312,666 $15,633
Subbase m2 38231 $11.38 $5.70 75 2 $434,979 $217,489 $5,800
Formation m2 38231 $8.24 N/A N/A $315,025 $157,513 $0
TOTAL 38231 $1,774,870 $887,435 $43,935
50% of pavement subbase has been assumed to depreciate to allow for the reconstruction work undertaken at the time of pavement reconstruction.

GISBORNE DISTRICT COUNCIL
2017 Road Asset Valuation
Status: Final July 2017 Project No.: 80507996 Page 40 Our ref: GDC Valuation 2017 - FINAL
21 Recommended Improvement Actions
The following recommendations will improve the accuracy of future valuations by reducing the number of assumptions required and by ensuring that those assumptions that are used best represent the conditions in the District.
Table 21-1: Recommended Improvement Actions
Recommended Improvement Actions
Priority Links to OAG Assessment Criteria for
Asset Management*
Sealed Surfacing Methodology
Research is required to find the appropriate total useful life break-down for these assets to be used in the next valuation.
Incorporate the results of dTIMS, TSA, condition assessments, and other decision making tools into the calculation of total useful lives.
1 Life cycle optimised decision
making
Unsealed Pavement Layer
Methodology
Research is required to find the appropriate total useful life break down for these assets to be used in the next valuation.
Incorporate the results of dTIMS, TSA, condition assessments, and other decision making tools into the calculation of total useful lives.
1 Life cycle optimised decision
making
Retaining Walls Now that there is more complete construction, dimension and material type data attached to these assets, it is recommended that the way these assets are valued should be reviewed and that the new dataset is cross compared with the old dataset in order to ensure that all retaining walls data is complete and accurate.
1 Description of assets
Car park Assets Currently only surface and pavement data exists for council car parks. Further auditing needs to be undertaken to capture such assets as, lighting, parking meters, kerb and channel, that may exist.
2 Description of assets
Railings Investigate TUL for bridge railings, these assets are usually designed to last the life of the bridge they are attached to. Currently assigned a TUL of 15 years.
1 Description of assets
Fords Gather further information to value more accurately and determine whether they require inspection with the current bridge stock.
1 Description of assets

GISBORNE DISTRICT COUNCIL
2017 Road Asset Valuation
Status: Final July 2017 Project No.: 80507996 Page 41 Our ref: GDC Valuation 2017 - FINAL
22 Completed Improvement Actions
The following recommendations have been undertaken during the year to improve the RAMM database. They are all recommendations made in the 2016 valuation.
Table 22-1: Completed Improvement Actions
Recommended Improvement Actions
Action Taken
Construction Dates
Drainage, streetlights, and surface water channels are missing almost all of their construction dates. Bridges and signs have large percentage of assets missing construction dates. Investigate other sources of construction date data. Ensure construction date data is recorded for all assets in the future.
On-going updating is occurring through inspections as part of maintenance contracts.
Missing Data
Collect and record in RAMM all missing asset data including, but not exclusive to, railings, footbridges, ADLS (large cantilever signs), retaining walls and stock underpasses.
On-going data collection is taking place with new assets being added to RAMM when identified through field visits

GISBORNE DISTRICT COUNCIL
2017 Road Asset Valuation
Status: Final July 2017 Project No.: 80507996 Page 42 Our ref: GDC Valuation 2017 - FINAL
23 Glossary
Annual Depreciation
The Annual Depreciation is the amount the asset depreciates in a year. It is defined as the replacement cost minus the residual value, divided by the estimated total useful life for the asset.
Depreciation
Depreciation is a measure of the consumption of the economic benefits embodied in an asset. It distributes the cost or value of an asset over its estimated useful life. Thus depreciation only applies to those assets with finite lives. Assets with infinite lives (e.g. Land, Formation and Subbase) are not depreciated. Straight-line depreciation is used in this valuation.
Depreciated Replacement Cost
Depreciated Replacement Cost is the current replacement cost less allowance for physical deterioration and optimisation for obsolescence and relevant surplus capacity.
Where the remaining life of an asset can be assessed, the Depreciated Replacement Cost has been calculated as:
Remaining useful life X (replacement cost – residual value) + residual value
Total useful life
Note: That for assets that have exceeded their Total Useful Lives (TUL) the Adjusted Total Useful Life is calculated as the age of the asset plus the Minimum Remaining Useful Life (MRUL).
Minimum Remaining Useful Life (MRUL)
The Minimum Remaining Useful Life is applied to assets that are older than their useful life. It recognises that, although an asset is older than its useful life, it may still be in service and therefore have some value. Where an asset is older than its standard useful life, the minimum remaining useful life is added to the standard useful life and used in the calculation of the depreciated replacement value. The minimum remaining useful lives of assets in this valuation are included in the asset assumption tables.
Optimised Replacement Cost
The Optimised Replacement Cost is the cost of building the asset “today”. In arriving at the value, it is assumed that modern construction techniques and modern equivalent materials are used, but that the physical result replaces the asset as it exists.
Residual Value
The Residual Value is the value of the asset when it reaches the end of its life. For the purposes of this valuation we have assumed that all assets have no residual value. The residual value has been removed due to the minimum remaining useful life being a more appropriate way of valuing assets that have reached the end of their TUL.
Total Useful Life (TUL)
The Total Useful Life is the period over which an asset is expected to be available for use by an entity.

GISBORNE DISTRICT COUNCIL
2017 Road Asset Valuation
Status: Final July 2017 Project No.: 80507996 Page 43 Our ref: GDC Valuation 2017 - FINAL
24 References NZIAMM (1996) “New Z e a l a n d I n f r a s t r u c t u r e A s s e t M a n a g e m e n t
M a n u a l ”, F i r s t Edition, Second Issue, November 1996.
IIMM (2000) “International I n f r a s t r u c t u r e M a n a g e m e n t M a n u a l ”,
A u s t r a l i a /New Zealand Edition, Version 1.0, April 2000.
NZIAV&DG (2001) New Zealand Infrastructure Asset Valuation and Depreciation
Guidelines”, Version 1, April 2001.

Hawkes Bay
1st Floor, 100 Warren Street South Hastings 4122
PO Box 13-052, Armagh Christchurch 8141
Tel +64 6 873 8900 Fax +64 6 873 8901
www.mwhglobal.com