2017 retirement plan trends for … retirement plan trends for institutions of higher education |...
TRANSCRIPT

2017 RETIREMENT PLAN TRENDS FOR INSTITUTIONS OF HIGHER EDUCATION
FOR PLAN SPONSOR AND FINANCIAL ADVISOR USE ONLY

2
32017 RETIREMENT PLAN TRENDS FOR INSTITUTIONS OF HIGHER EDUCATION | TRANSAMERICA
EXECUTIVE SUMMARY
THE NUMBER OF 403(b) PLANS CONTINUES TO DECLINE
IMPROVEMENTS IN PLAN ELIGIBILITY
A MARKED INCREASE IN THE ADOPTION OF AUTO FEATURES
INVESTMENT OPTIONS: OPTIMIZING CHOICE AND PERFORMANCE
EMPLOYER CONTRIBUTIONS MORE PREVALENT, BUT LESS GENEROUS
EMPLOYEE CONTRIBUTION LEVELS ON THE WANE
LOANS AND HARDSHIP WITHDRAWALS NOW WIDELY AVAILABLE
ADVISORS BECOMING ESSENTIAL IN HIGHER EDUCATION PLANS
PLAN ADMINISTRATION, SERVICES, AND EXPENSES
SPONSORS EAGER TO MAKE PLAN IMPROVEMENTS
PARTICIPANT EDUCATORS BEST WHEN ON SITE
RETIREMENT READINESS – A MORE CONSISTENT APPROACH NEEDED
CONCLUSION
SAMPLE CHARACTERISTICS
4
6
8
10
12
14
18
20
22
26
28
31
32
37
38
CONTENTS
4
EXECUTIVE SUMMARY2016 represented another year of change for the Higher Education retirement plan market.
Litigation was foremost on the mind of many Higher Education institutions. From July to October 2016, a slew of prestigious institutions including Columbia University, Cornell University, Duke University, Emory University, Johns Hopkins University, Massachusetts Institute of Technology, Northwestern, New York University, University of Pennsylvania, University of Southern California, and Vanderbilt University faced lawsuits alleging a breach of fiduciary duty under ERISA. Twelve lawsuits were filed by law firm Schlichter, Bogard & Denton alone. In some cases, plans were faulted for excessive fees. In other cases, a wide range of practices were questioned for the selection of investment options, liquidity options of stable value options, duplication of services, and investment options in multi-vendor plans. It seems law firms view all the usual and customary characteristics of Higher Education plans as intrinsically flawed.
Facing the threat of lawsuits and competition for top talent from the corporate sector, American institutions of Higher Education look to adopt retirement plan features and practices that more closely resemble those of large cap firms. In 2016, the trend of a decline in the number of 403(b) plans continued alongside an increase in the number of 401(k) plans. Greater numbers of Higher Education institutions see value in hiring consultants and advisors to offer guidance as they move away from multi-provider arrangements in favor of a single, exclusive provider relationship. Currently, more than two-thirds of Higher Education institutions rely on an exclusive provider.
Higher Education institutions today are making more employees, full-time and part-time, eligible for their organizations’ retirement plans. This is certainly good news for the legions of adjunct professors previously receiving few or no benefits, while having little hope of ever finding a tenured position. While more of these employees are now eligible for the retirement plan, many Higher Education institutions have put longer waiting periods in place before employees can join the plan. This likely reflects higher recordkeeping costs associated with accounting for employees who leave the institution and its plan.
2016 saw a large increase in the percentage of Higher Education institutions allowing loans and hardship withdrawals. Traditionally, many Higher Education plans have been philosophically opposed to allowing loans and hardship withdrawals—for good reasons. The decision to ease standards likely stems from Higher Education institutions’ desire to offer services more in line with corporate plans, where loans and hardship withdrawals are commonplace. On the investment front, more than three out of four (76%) of Higher Education plans now have an investment policy statement in place.
In addition to eligibility and liquidity feature enhancements, 2016 has seen a significant uptick in the number of Higher Education institutions offering automatic enrollment. However, this improvement is muted as many of the institutions offering automatic enrollment apply it only
4
52017 RETIREMENT PLAN TRENDS FOR INSTITUTIONS OF HIGHER EDUCATION | TRANSAMERICA
to new faculty and staff. More troubling is the nearly negligible increase in the percentage of Higher Ed plans offering automatic deferral increases. This is unfortunate because many in the retirement industry see these deferral increases as a key ingredient in plan design that helps employees retire successfully. It is hoped more plans will add this valuable feature in the near future.
2016 saw a significant jump in the percentage of HigherEducation plans using an advisor. In fact, advisors havepractically become a necessity for the responsible oversight ofany large organization’s retirement plan. Given concerns aboutcompliance with evolving fiduciary regulations, fewer will relyon their advisor to assist with plan compliance issues, perhapsbecause the threat or reality of litigation leads them to rely onan ERISA attorney for these functions. Institutions are scaling back to semi-annual or annual meetings with advisors. While the most common method of payment to advisors remains payments from participant accounts (38%), advisor fees are also paid out of plan investments or through direct billing.
Nevertheless, many Higher Education institutions credit advisors not only with helping them move from a multi-provider environment to an exclusive provider arrangement, but also for convincing them to outsource more plan services in the interest of saving money and enhancing administrative performance. Advisors have also shown Higher Education institutions the importance of providing a customized webpage to plan participants that shows balances and delivers updates and educational messages. It’s become clear that this is a fundamental offering to help participants engage and succeed on their retirement path.
Higher Education institutions are rapidly evolving their approach to retirement plans as part of a strategy to offer competitive compensation and benefits. While many have already made changes and added features, many more are looking to add investment options, improve employee education, reduce the number of providers, offer financial planning, and change their advisor.
76%More than three out of four Higher Education plans now have an investment policy statement in place.
6
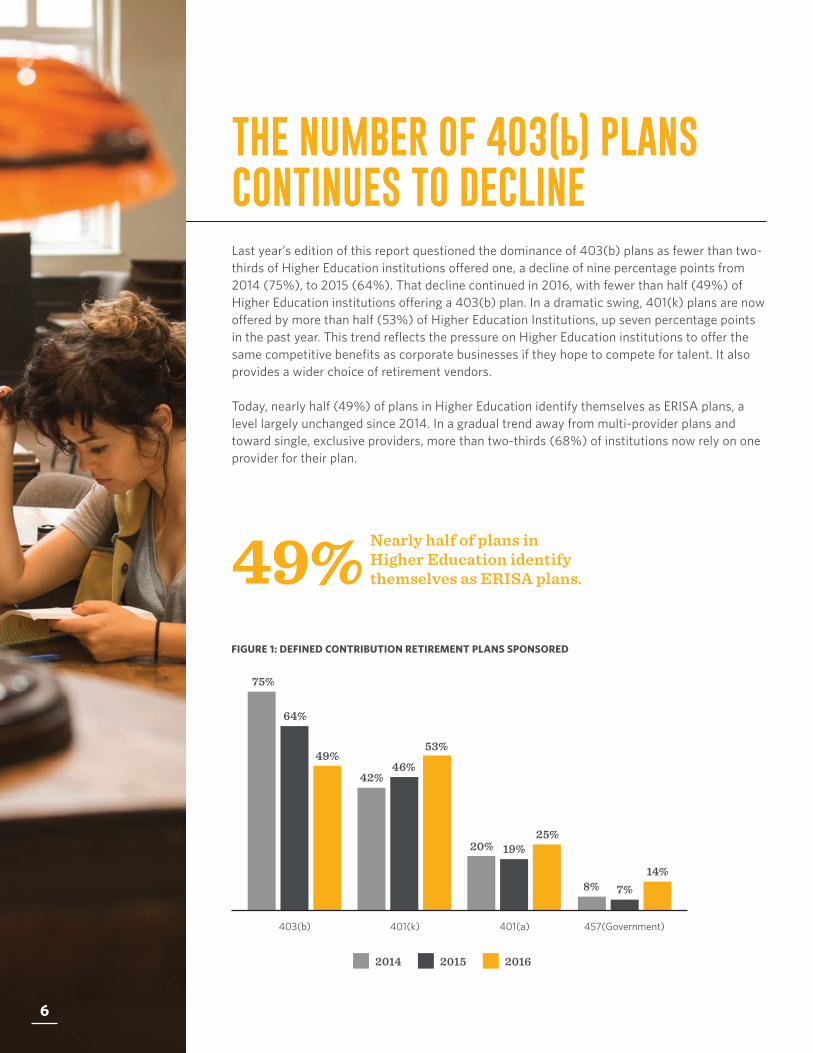
Last year’s edition of this report questioned the dominance of 403(b) plans as fewer than two-thirds of Higher Education institutions offered one, a decline of nine percentage points from 2014 (75%), to 2015 (64%). That decline continued in 2016, with fewer than half (49%) of Higher Education institutions offering a 403(b) plan. In a dramatic swing, 401(k) plans are now offered by more than half (53%) of Higher Education Institutions, up seven percentage points in the past year. This trend reflects the pressure on Higher Education institutions to offer the same competitive benefits as corporate businesses if they hope to compete for talent. It also provides a wider choice of retirement vendors.
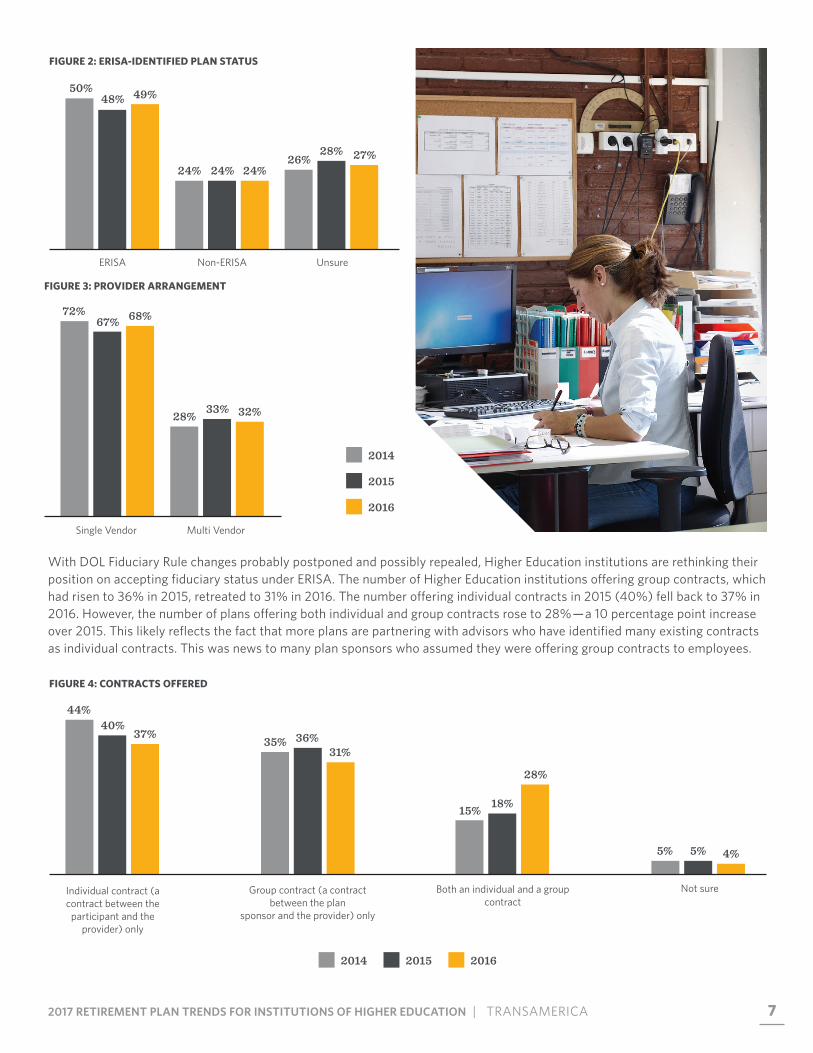
Today, nearly half (49%) of plans in Higher Education identify themselves as ERISA plans, a level largely unchanged since 2014. In a gradual trend away from multi-provider plans and toward single, exclusive providers, more than two-thirds (68%) of institutions now rely on one provider for their plan.
FIGURE 1: DEFINED CONTRIBUTION RETIREMENT PLANS SPONSORED
THE NUMBER OF 403(B) PLANS CONTINUES TO DECLINE
49% Nearly half of plans in Higher Education identify themselves as ERISA plans.
403(b) 401(k) 401(a) 457(Government)
49%
64%
75%
53%
46% 42%
25% 19% 20%
14% 7% 8%
2014 2015 2016
6
72017 RETIREMENT PLAN TRENDS FOR INSTITUTIONS OF HIGHER EDUCATION | TRANSAMERICA
FIGURE 2: ERISA-IDENTIFIED PLAN STATUS
With DOL Fiduciary Rule changes probably postponed and possibly repealed, Higher Education institutions are rethinking their position on accepting fiduciary status under ERISA. The number of Higher Education institutions offering group contracts, which had risen to 36% in 2015, retreated to 31% in 2016. The number offering individual contracts in 2015 (40%) fell back to 37% in 2016. However, the number of plans offering both individual and group contracts rose to 28%—a 10 percentage point increase over 2015. This likely reflects the fact that more plans are partnering with advisors who have identified many existing contracts as individual contracts. This was news to many plan sponsors who assumed they were offering group contracts to employees.
FIGURE 4: CONTRACTS OFFERED
THE NUMBER OF 403(B) PLANS CONTINUES TO DECLINE
ERISA Non-ERISA Unsure
49% 48% 50%
24% 24% 24% 27% 28%
26%
FIGURE 3: PROVIDER ARRANGEMENT
Single Vendor Multi Vendor
68% 67% 72%
32% 33% 28%
2014
2015
2016
Individual contract (a contract between the
participant and the provider) only
Group contract (a contract between the plan
sponsor and the provider) only
Both an individual and a group contract
Not sure
37% 40%
44%
31% 36% 35%
28%
18% 15%
4% 5% 5%
2014 2015 2016
8
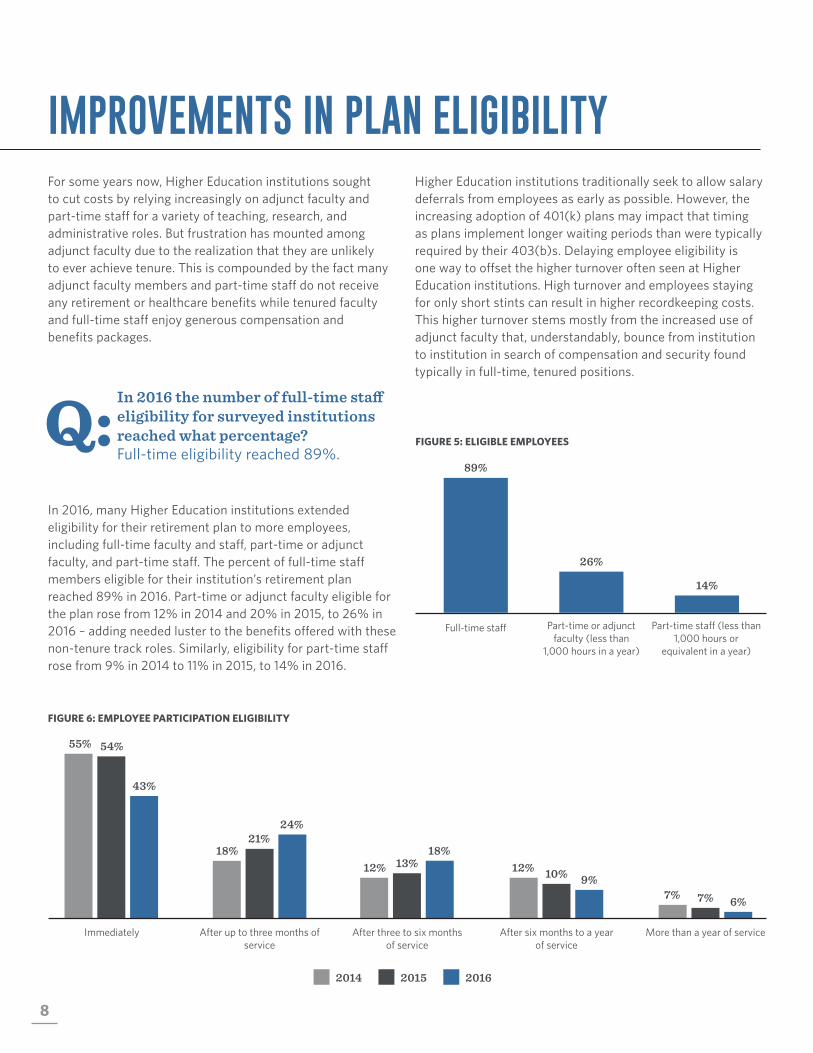
For some years now, Higher Education institutions sought to cut costs by relying increasingly on adjunct faculty and part-time staff for a variety of teaching, research, and administrative roles. But frustration has mounted among adjunct faculty due to the realization that they are unlikely to ever achieve tenure. This is compounded by the fact many adjunct faculty members and part-time staff do not receive any retirement or healthcare benefits while tenured faculty and full-time staff enjoy generous compensation and benefits packages.
In 2016, many Higher Education institutions extended eligibility for their retirement plan to more employees, including full-time faculty and staff, part-time or adjunct faculty, and part-time staff. The percent of full-time staff members eligible for their institution’s retirement plan reached 89% in 2016. Part-time or adjunct faculty eligible for the plan rose from 12% in 2014 and 20% in 2015, to 26% in 2016 – adding needed luster to the benefits offered with these non-tenure track roles. Similarly, eligibility for part-time staff rose from 9% in 2014 to 11% in 2015, to 14% in 2016.
FIGURE 5: ELIGIBLE EMPLOYEES
Higher Education institutions traditionally seek to allow salary deferrals from employees as early as possible. However, the increasing adoption of 401(k) plans may impact that timing as plans implement longer waiting periods than were typically required by their 403(b)s. Delaying employee eligibility is one way to offset the higher turnover often seen at Higher Education institutions. High turnover and employees staying for only short stints can result in higher recordkeeping costs. This higher turnover stems mostly from the increased use of adjunct faculty that, understandably, bounce from institution to institution in search of compensation and security found typically in full-time, tenured positions.
FIGURE 6: EMPLOYEE PARTICIPATION ELIGIBILITY
IMPROVEMENTS IN PLAN ELIGIBILITY
Q: In 2016 the number of full-time sta� eligibility for surveyed institutions reached what percentage? Full-time eligibility reached 89%.
After six months to a year of service
More than a year of serviceAfter three to six months of service
After up to three months of service
Immediately
43%
54% 55%
24% 21%
18% 18% 13% 12%
9% 10% 12%
6% 7% 7%
2014 2015 2016
89%
26%
14%
Full-time staff Part-time or adjunct faculty (less than
1,000 hours in a year)
Part-time staff (less than 1,000 hours or
equivalent in a year)

92017 RETIREMENT PLAN TRENDS FOR INSTITUTIONS OF HIGHER EDUCATION | TRANSAMERICA
FIGURE 5: ELIGIBLE EMPLOYEES
IT’S NOT ONLYDOING IT RIGHT,IT’S DOING IT BEST.
92017 RETIREMENT PLAN TRENDS FOR INSTITUTIONS OF HIGHER EDUCATION | TRANSAMERICA
10
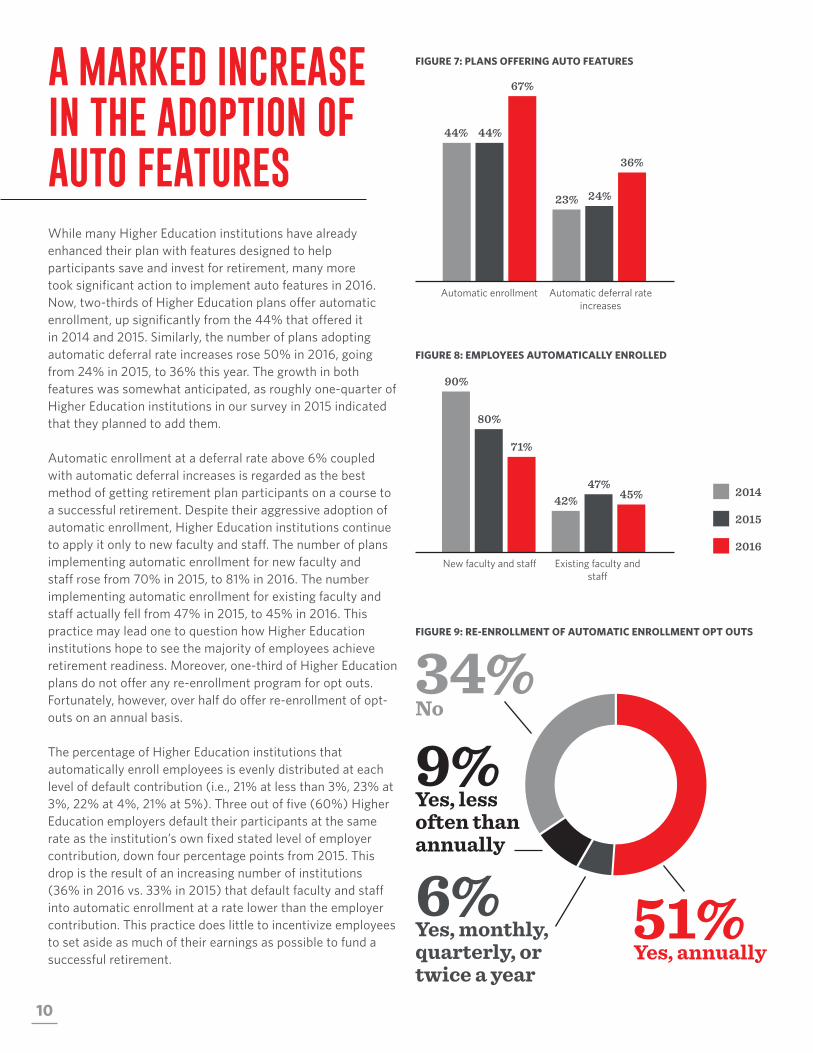
While many Higher Education institutions have already enhanced their plan with features designed to help participants save and invest for retirement, many more took significant action to implement auto features in 2016. Now, two-thirds of Higher Education plans offer automatic enrollment, up significantly from the 44% that offered it in 2014 and 2015. Similarly, the number of plans adopting automatic deferral rate increases rose 50% in 2016, going from 24% in 2015, to 36% this year. The growth in both features was somewhat anticipated, as roughly one-quarter of Higher Education institutions in our survey in 2015 indicated that they planned to add them.
Automatic enrollment at a deferral rate above 6% coupled with automatic deferral increases is regarded as the best method of getting retirement plan participants on a course to a successful retirement. Despite their aggressive adoption of automatic enrollment, Higher Education institutions continue to apply it only to new faculty and staff. The number of plans implementing automatic enrollment for new faculty and staff rose from 70% in 2015, to 81% in 2016. The number implementing automatic enrollment for existing faculty and staff actually fell from 47% in 2015, to 45% in 2016. This practice may lead one to question how Higher Education institutions hope to see the majority of employees achieve retirement readiness. Moreover, one-third of Higher Education plans do not offer any re-enrollment program for opt outs. Fortunately, however, over half do offer re-enrollment of opt-outs on an annual basis.
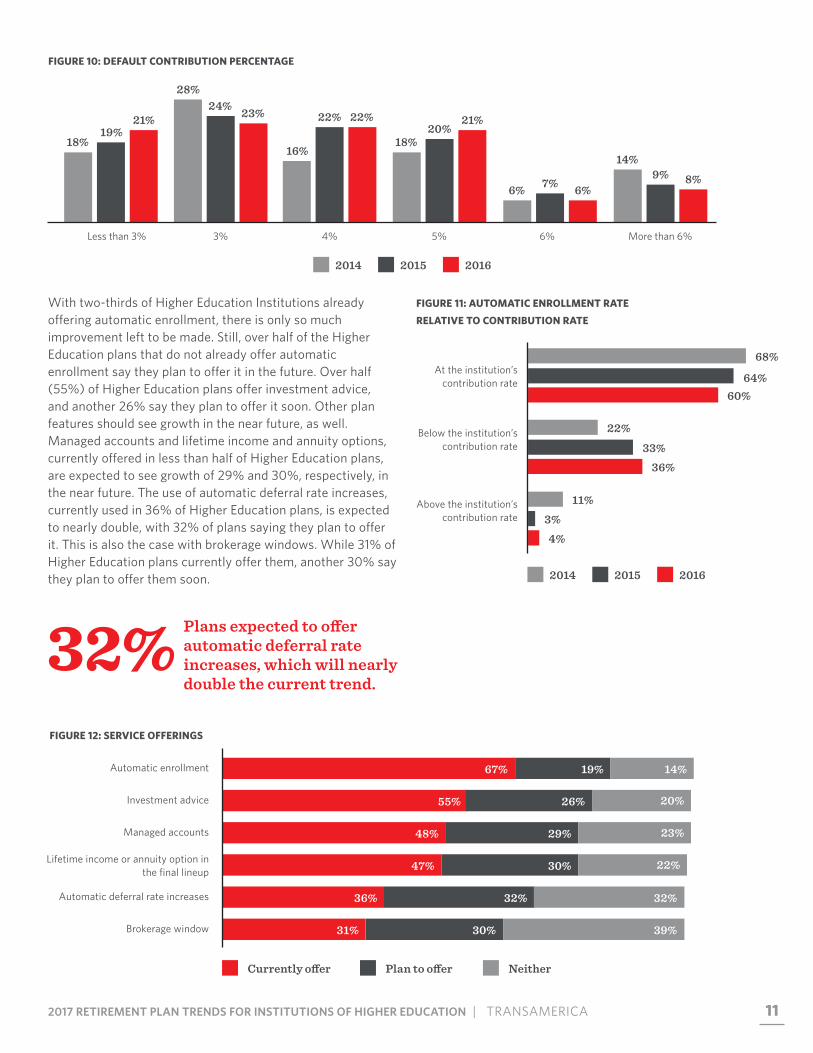
The percentage of Higher Education institutions that automatically enroll employees is evenly distributed at each level of default contribution (i.e., 21% at less than 3%, 23% at 3%, 22% at 4%, 21% at 5%). Three out of five (60%) Higher Education employers default their participants at the same rate as the institution’s own fixed stated level of employer contribution, down four percentage points from 2015. This drop is the result of an increasing number of institutions (36% in 2016 vs. 33% in 2015) that default faculty and staff into automatic enrollment at a rate lower than the employer contribution. This practice does little to incentivize employees to set aside as much of their earnings as possible to fund a successful retirement.
FIGURE 7: PLANS OFFERING AUTO FEATURES
FIGURE 8: EMPLOYEES AUTOMATICALLY ENROLLED
FIGURE 9: RE-ENROLLMENT OF AUTOMATIC ENROLLMENT OPT OUTS
A MARKED INCREASE IN THE ADOPTION OF AUTO FEATURES
Automatic enrollment Automatic deferral rateincreases
67%
44% 44%
36%
24% 23%
New faculty and staff Existing faculty andstaff
71%
80%
90%
45% 47%
42% 2014
2015
2016
51%Yes, annually
34%No
6%Yes, monthly, quarterly, or twice a year
9%Yes, less often than annually
112017 RETIREMENT PLAN TRENDS FOR INSTITUTIONS OF HIGHER EDUCATION | TRANSAMERICA
FIGURE 10: DEFAULT CONTRIBUTION PERCENTAGE
FIGURE 11: AUTOMATIC ENROLLMENT RATE
RELATIVE TO CONTRIBUTION RATE
With two-thirds of Higher Education Institutions already offering automatic enrollment, there is only so much improvement left to be made. Still, over half of the Higher Education plans that do not already offer automatic enrollment say they plan to offer it in the future. Over half (55%) of Higher Education plans offer investment advice, and another 26% say they plan to offer it soon. Other plan features should see growth in the near future, as well. Managed accounts and lifetime income and annuity options, currently offered in less than half of Higher Education plans, are expected to see growth of 29% and 30%, respectively, in the near future. The use of automatic deferral rate increases, currently used in 36% of Higher Education plans, is expected to nearly double, with 32% of plans saying they plan to offer it. This is also the case with brokerage windows. While 31% of Higher Education plans currently offer them, another 30% say they plan to offer them soon.
Plans expected to o�er automatic deferral rate increases, which will nearly double the current trend.
FIGURE 12: SERVICE OFFERINGS
Managed accounts 48% 29%
Lifetime income or annuity option in the final lineup 47% 30%
Automatic enrollment 67% 19%
Investment advice 55% 26%
Automatic deferral rate increases 36% 32%
14%
20%
23%
22%
32%
Brokerage window 31% 30% 39%
More than 6%6%5%4%3%Less than 3%
21% 19%
18%
23% 24% 28%
22% 22%
16%
21% 20%
18%
6% 7% 6% 8% 9%
14%
2014 2015 2016
22%
33%36%
At the institution’s contribution rate
Below the institution’s contribution rate
Above the institution’s contribution rate
60%64%
68%
11%3%4%
2014 2015 2016
Currently o�er Plan to o�er Neither

12
INVESTMENT OPTIONS: OPTIMIZING CHOICE AND PERFORMANCETaking a more hands-on approach to the investment options in their plans, better than three out of four (76%) of Higher Education institutions have investment policy statements in place, up 16 percentage points from 2015.
Close to one-third (31%) of Higher Education institutions offer between 11 and 15 investment options in their retirement plans. Another 27% offer fewer than 10 investment options, which is considered by many to be too few to provide a truly diverse investment selection. Just 12% of Higher Education plans offer between 16 and 20 investment options, generally considered the ideal number for accommodating – but not overwhelming – participants with choice. Participants offered too few investment options in their retirement plan can quickly become disenchanted by the lack of choice. Participants offered too many investment options can be so overwhelmed by the selection process that they abandon the plan. So, plans try to find the sweet spot with an investment menu that offers a diverse selection of investment vehicles, but not enough to discourage participation.
FIGURE 13: INSTITUTIONS WITH INVESTMENT POLICY STATEMENT
FIGURE 14: NUMBER OF PLAN INVESTMENT OPTIONS FIGURE 15: AVAILABILITY OF A ROTH CONTRIBUTION OPTION
No
37%
40%24%
Yes
76%60%
63%
2014 2015 2016
27%
31%
12%
7%
Less than 10
11-15
16-20
21-30
3%
6%
31-40
41-50
6%More than 50
8%Not sure
61%
35%
4%
Yes
No
Don’t know
132017 RETIREMENT PLAN TRENDS FOR INSTITUTIONS OF HIGHER EDUCATION | TRANSAMERICA
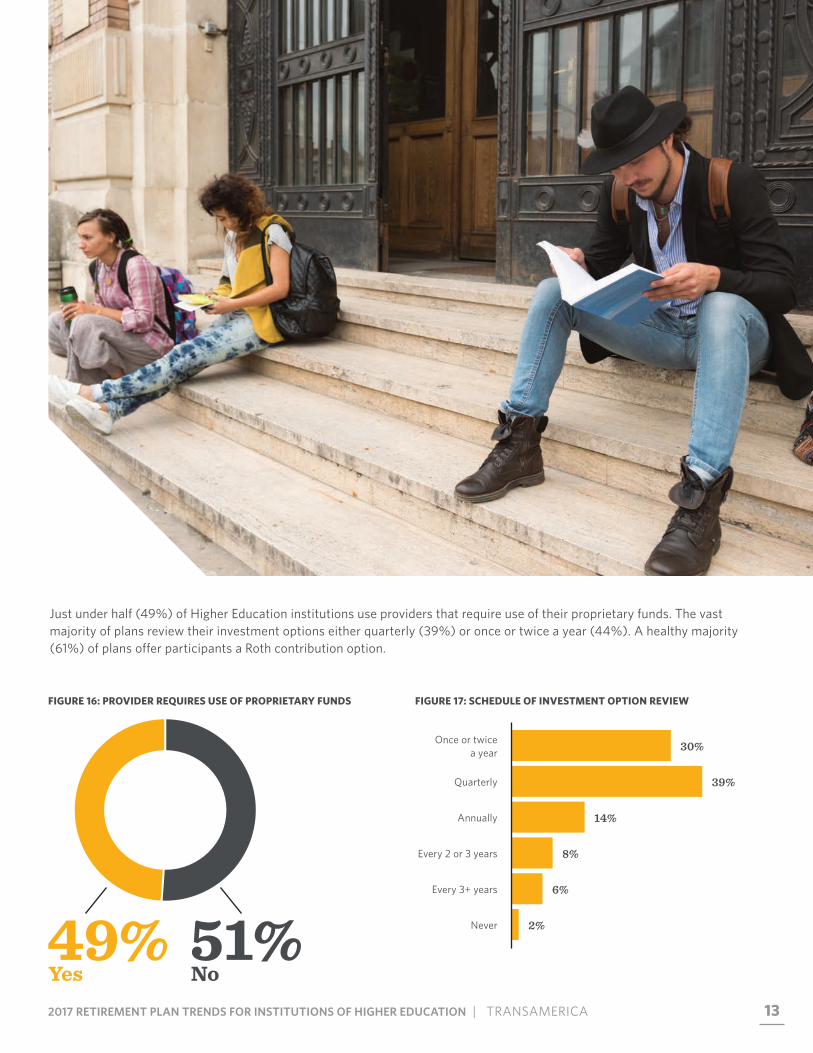
Just under half (49%) of Higher Education institutions use providers that require use of their proprietary funds. The vast majority of plans review their investment options either quarterly (39%) or once or twice a year (44%). A healthy majority (61%) of plans offer participants a Roth contribution option.
FIGURE 16: PROVIDER REQUIRES USE OF PROPRIETARY FUNDS FIGURE 17: SCHEDULE OF INVESTMENT OPTION REVIEW
49%Yes
51%No
30%
39%
14%
8%
Once or twice a year
Quarterly
Annually
Every 2 or 3 years
6%
2%
Every 3+ years
Never

14
An impressive 95% of Higher Education institutions now offer an employer contribution of some sort to employees. The percentage offering a fixed contribution is up five points from 2015 to 71%. The percentage offering a discretionary contribution is down four points from 2015 to 24%.
In 2016, the percentage of Higher Education institutions offering immediate eligibility for employer contributions fell for the second year in a row, going from 58% in 2014 and 44% in 2015 to just 36% in 2016. This drop was offset by small, incremental changes in the percent of institutions offering eligibility for employer contributions after three months, six months, or one year of service. The trend toward eligibility requirements began several years ago, but has accelerated of late.
Regarding the employer contribution formula in Higher Education plans, there has been a sharp reversal of the trend of going from a fixed percentage amount to a fixed dollar amount. In 2016, the percentage of institutions opting for contributions as a fixed percentage of employee salary went from 37% to 65%, while the percentage using a fixed dollar amount fell from 30% to 11%. This is a significant reversal from 2015, when institutions using fixed percentage contributions fell from 54% to 37% and those using fixed dollar contributions rose from 21% to
30%. Higher Education institutions opting for the fixed percentage over the fixed dollar amount are doing more to help their highly compensated faculty and staff. Although the number of institutions adopting a fixed percentage for the employer contribution has risen, the levels of those fixed percentages have changed very little over the past three years. Nonetheless, the shift towards a budget approach to employer contributions continues as 76% of Higher Education plans now opt for a fixed employer contribution. Employer formula or percent matches of the employee contribution fell from 39% of Higher Education institutions in 2015 to just 23% in 2016. This is unfortunate because matching contributions are far more effective at inspiring employees to contribute at a level sufficient to fund an enjoyable retirement lifestyle.
EMPLOYER CONTRIBUTIONS MORE PREVALENT, BUT LESS GENEROUS
FIGURE 19: TYPE OF EMPLOYER CONTRIBUTION
FIGURE 18: EMPLOYER CONTRIBUTION ELIGIBILITY
A fixed contribution stated in
the plan document
A discretionary contribution
No employer contributions
are made
71% 66% 64%
24% 28% 27%
4% 7% 9%
2014 2015 2016
Immediately After up to three months of service
After six months to a year of service
After three to six months of service
After more than a year of service
36% 44%
58%
25% 24% 17%
14% 12% 14% 16% 16%
5% 9% 8% 10%
2014 2015 2016

152017 RETIREMENT PLAN TRENDS FOR INSTITUTIONS OF HIGHER EDUCATION | TRANSAMERICA
FIGURE 20: EMPLOYER CONTRIBUTION FORMULA
FIGURE 21: EMPLOYER FIXED PERCENT CONTRIBUTED (% OF SALARY)
A fixed dollar amount A fixed percentage amount
A percent match of the employee’s
contribution
A formula match of the employee’s contribution
No contribution
11%
30%
21%
65%
37%
54%
10% 14% 10% 13%
25% 19%
1% 5% 6%
2014 2015 2016
2% - 4% 5% - 6% 10% +7% - 9%
27% 27%
23%
31% 29%
36%
23%
27% 25%
18% 16%
18%
2014 2015 2016
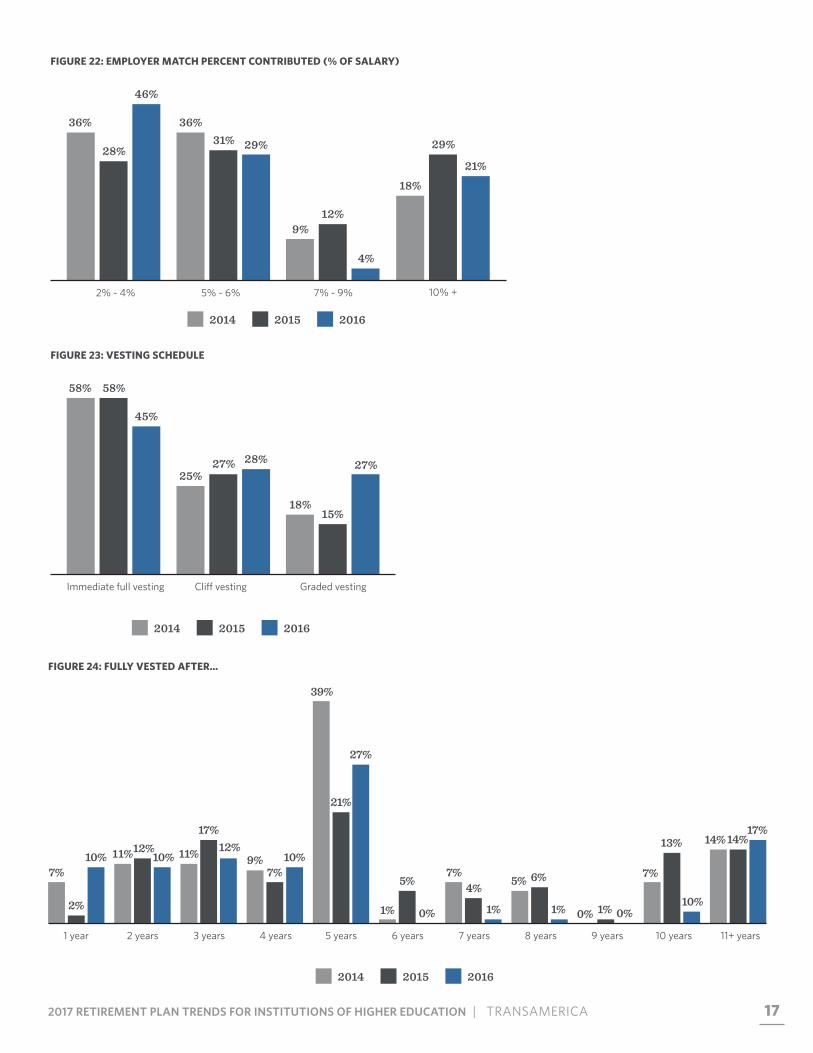
Among institutions offering an employer matching contribution, the trend in 2015 was to stretch the match to encourage employees to defer at a high enough level to fund a dignified retirement. But in 2016, employers appear to have backed off that strategy. The 29% of Higher Education institutions that matched 10% or more of pay in 2015 fell to 23% in 2016. The percentage of institutions matching at 5%-6% or 7%-9% both increased two points during that same time.
Traditionally, Higher Education plans fully vest employees immediately. This appears to have changed in 2016, when suddenly less than half (45%) of plans provide faculty and staff with immediate full vesting, compared to 58% in both 2014 and 2015.
This may be a response to the increased turnover levels now seen at Higher Education institutions. The use of cliff vesting continues to grow in popularity (28% of plans in 2016 vs. 27% in 2015), but it was graded vesting that grew in popularity the most, rising from 15% of Higher Education plans in 2015 to 27% in 2016.
Among plans not using immediate vesting, a five-year vesting horizon continues to be the most common, but the largest increase among Higher Education plans is to a one-year horizon, going from just 2% of plans in 2015 to 10% in 2016. The second largest increase in 2016 apart from five-year vesting is the increase in 11-plus-year vesting, which went from 14% in both 2014 and 2015 to 17% in 2016. Higher Education plans continue to move toward either shorter or longer vesting horizons.

16
172017 RETIREMENT PLAN TRENDS FOR INSTITUTIONS OF HIGHER EDUCATION | TRANSAMERICA
FIGURE 22: EMPLOYER MATCH PERCENT CONTRIBUTED (% OF SALARY)
FIGURE 23: VESTING SCHEDULE
FIGURE 24: FULLY VESTED AFTER…
10% +2% - 4% 5% - 6% 7% - 9%
46%
28%
36%
29% 31% 36%
21%
29%
18%
4%
12% 9%
2014 2015 2016
Immediate full vesting Cliff vesting Graded vesting
45%
58% 58%
28% 27% 25%
27%
15% 18%
2014 2015 2016
2014 2015 2016
10%
2%
7%11%12%
10% 11%
17%12%
9%7%
10%
39%
21%
27%
1%
5%
0%
7%4%
1%
5% 6%
1% 0% 1% 0%
7%
13%
10%
14% 14%17%
1 year 2 years 3 years 4 years 5 years 6 years 7 years 8 years 9 years 10 years 11+ years
18
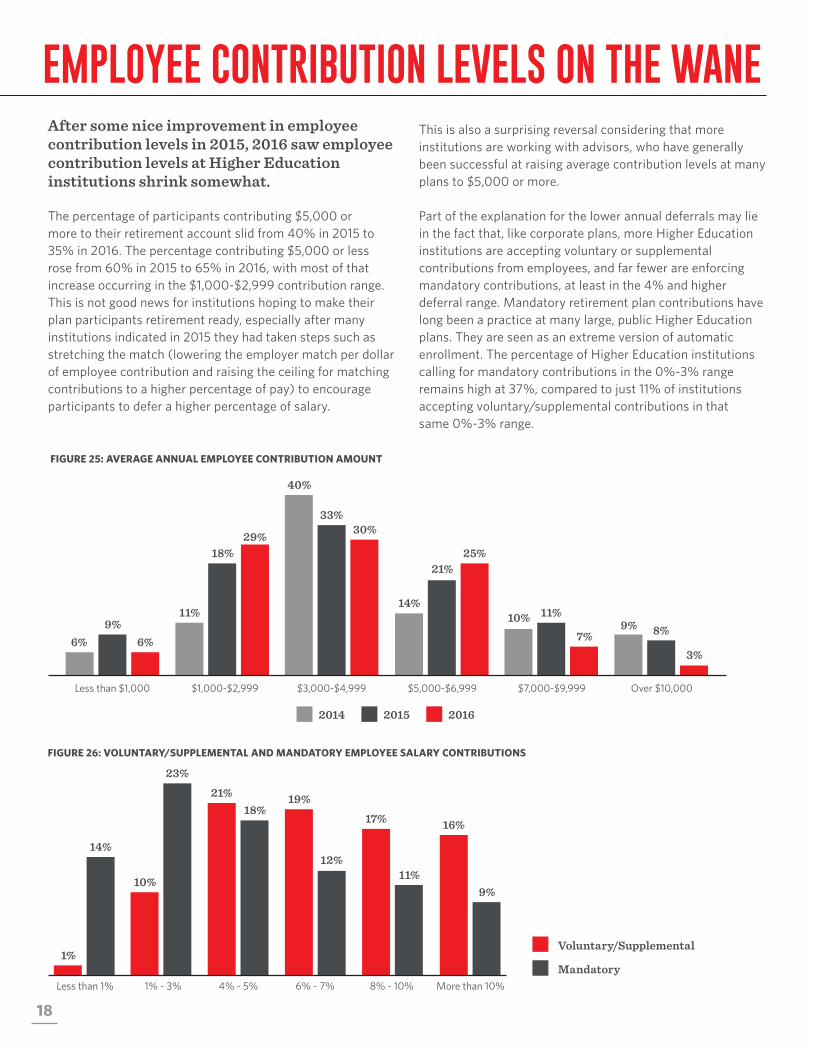
After some nice improvement in employee contribution levels in 2015, 2016 saw employee contribution levels at Higher Education institutions shrink somewhat.
The percentage of participants contributing $5,000 or more to their retirement account slid from 40% in 2015 to 35% in 2016. The percentage contributing $5,000 or less rose from 60% in 2015 to 65% in 2016, with most of that increase occurring in the $1,000-$2,999 contribution range. This is not good news for institutions hoping to make their plan participants retirement ready, especially after many institutions indicated in 2015 they had taken steps such as stretching the match (lowering the employer match per dollar of employee contribution and raising the ceiling for matching contributions to a higher percentage of pay) to encourage participants to defer a higher percentage of salary.
This is also a surprising reversal considering that more institutions are working with advisors, who have generally been successful at raising average contribution levels at many plans to $5,000 or more.
Part of the explanation for the lower annual deferrals may lie in the fact that, like corporate plans, more Higher Education institutions are accepting voluntary or supplemental contributions from employees, and far fewer are enforcing mandatory contributions, at least in the 4% and higher deferral range. Mandatory retirement plan contributions have long been a practice at many large, public Higher Education plans. They are seen as an extreme version of automatic enrollment. The percentage of Higher Education institutions calling for mandatory contributions in the 0%-3% range remains high at 37%, compared to just 11% of institutions accepting voluntary/supplemental contributions in that same 0%-3% range.
FIGURE 25: AVERAGE ANNUAL EMPLOYEE CONTRIBUTION AMOUNT
FIGURE 26: VOLUNTARY/SUPPLEMENTAL AND MANDATORY EMPLOYEE SALARY CONTRIBUTIONS
EMPLOYEE CONTRIBUTION LEVELS ON THE WANE
Less than $1,000 $1,000-$2,999 $5,000-$6,999$3,000-$4,999 $7,000-$9,999 Over $10,000
6% 9%
6%
29% 18%
11%
25% 21%
14%
30% 33%
40%
7%
11% 10%
3%
8% 9%
2014 2015 2016
Less than 1% 1% - 3% 4% - 5% 6% - 7% 8% - 10% More than 10%
14%
1%
23%
10%
12%
19% 18%
21%
11%
17%
9%
16%
Voluntary/Supplemental
Mandatory

192017 RETIREMENT PLAN TRENDS FOR INSTITUTIONS OF HIGHER EDUCATION | TRANSAMERICA
ACCOMPLISH TODAY, LIVE BETTER TOMORROW.
192017 RETIREMENT PLAN TRENDS FOR INSTITUTIONS OF HIGHER EDUCATION | TRANSAMERICA

20
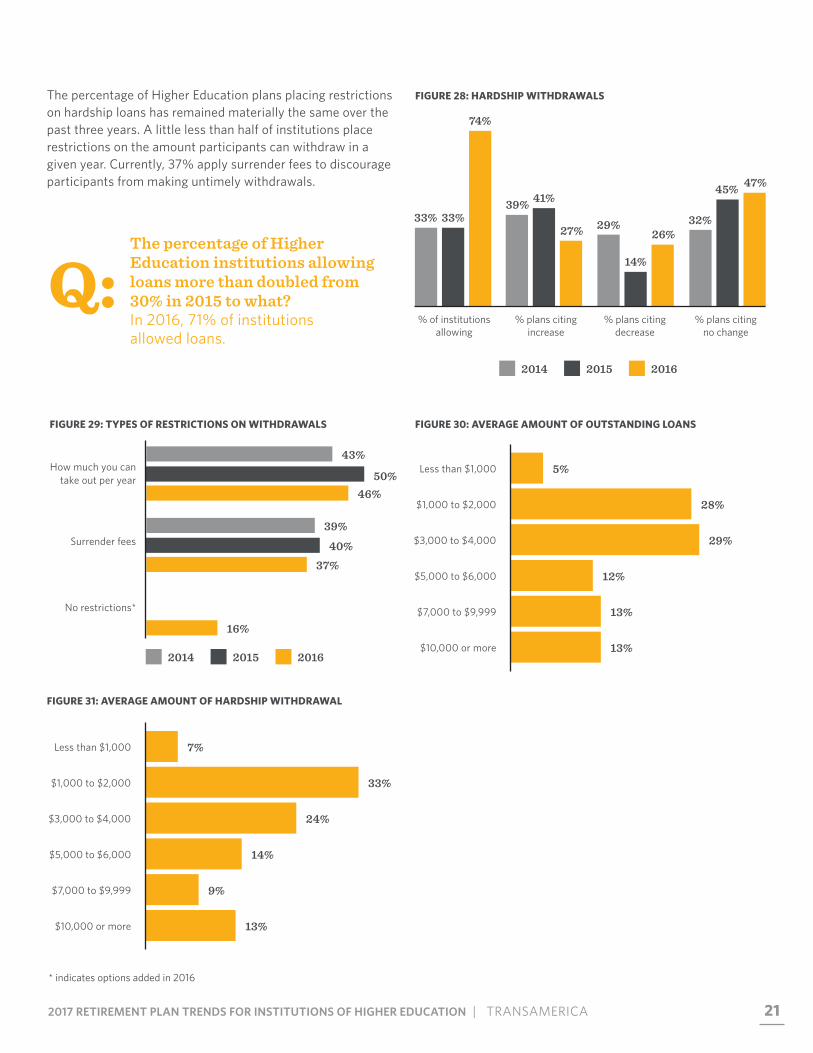
The past year has shown marked increases in the number of Higher Education institutions allowing loans and hardship withdrawals. The percent allowing loans more than doubled, rising from 30% in 2015 to 71% in 2016.
The number allowing hardship withdrawals also more than doubled, going from 33% in 2015 to 74% in 2016. Higher Education plans have historically shied away from offering loans, but several things help explain the change. First and foremost is the adoption of 401(k) plans where loans are more feasible along with the gradual phasing out of 403(b) plans, where loans are looked at with disfavor. Also, as more institutions gravitate to exclusive provider arrangements, the difficulty inherent in recordkeeping loans in multi-provider plans becomes less of an issue. In addition, on the advice of advisors, more institutions are outsourcing the handling of loans. Fortunately, the increased availability of loans has not translated into increased usage: In 2016 Higher Education institutions show just 10% of participants taking loans, compared to 22% in 2015. Moreover, the percentage of loans in default dropped from 14% in 2015 to just 6% in 2016, a marked improvement. Over half of borrowings range between $1,000 and $4,000.
The story for hardship withdrawals is similar. Even though considerably more plans now allow them, the uptake of hardship withdrawals has gone down. Just 27% of Higher Education institutions have seen an increase in the use of hardship withdrawals, compared to 41% in 2015. In fact, 26% cite a decrease in hardship withdrawals in 2016, compared to just 14% in 2015. One-third (33%) of employee hardship withdrawals ranged between $1,000 and $2,000, with another 38% ranging between $3,000 and $6,000.
LOANS AND HARDSHIP WITHDRAWALS NOW WIDELY AVAILABLE
FIGURE 27: LOANS
% of plans allowing Mean % of participantsborrowing
Mean % ofloans in default
71%
30% 22%
10%
22% 19%
6% 14%
6%
2014 2015 2016
20
212017 RETIREMENT PLAN TRENDS FOR INSTITUTIONS OF HIGHER EDUCATION | TRANSAMERICA
FIGURE 30: AVERAGE AMOUNT OF OUTSTANDING LOANS
FIGURE 31: AVERAGE AMOUNT OF HARDSHIP WITHDRAWAL
FIGURE 29: TYPES OF RESTRICTIONS ON WITHDRAWALS
The percentage of Higher Education plans placing restrictions on hardship loans has remained materially the same over the past three years. A little less than half of institutions place restrictions on the amount participants can withdraw in a given year. Currently, 37% apply surrender fees to discourage participants from making untimely withdrawals.
Q:The percentage of Higher Education institutions allowing loans more than doubled from 30% in 2015 to what?In 2016, 71% of institutions allowed loans.
FIGURE 28: HARDSHIP WITHDRAWALS
5%
28%
29%
12%
Less than $1,000
$1,000 to $2,000
$3,000 to $4,000
$5,000 to $6,000
13%
13%
$7,000 to $9,999
$10,000 or more
7%
33%
24%
14%
Less than $1,000
$1,000 to $2,000
$3,000 to $4,000
$5,000 to $6,000
9%
13%
$7,000 to $9,999
$10,000 or more
% of institutions allowing
% plans citing increase
% plans citing decrease
% plans citing no change
33% 33%
74%
32%
45% 47% 41%
27%
39%
29%
14%
26%
2014 2015 2016
39%
40%37%
How much you can take out per year
Surrender fees
No restrictions*
46%50%
43%
16%
2014 2015 2016
* indicates options added in 2016

22
The number of Higher Education institutions enlisting the services of retirement plan advisors and consultants jumped dramatically in 2016, moving to 41% of plans compared to just 17% in 2015. Another 24% of institutions say they plan to hire an advisor within the next 12 months. Still, 36% of institutions in 2016 said they do not use the services of an advisor.
FIGURE 32: ADVISOR/CONSULTANT USAGE
Survey responses suggest institutions of higher education are increasingly relying on plan advisors as project consultants. Some institutions are contracting specific functions as stand-alone, time-limited projects as needed instead of compensating advisors with a fee for a bundle of services. As a consequence, certain tasks routinely performed by advisors are less likely to fall under the purview of a plan advisor. These tasks may be outsourced to another party (e.g., ERISA Attorney) or undertaken less often (e.g., every other year instead of every year). Plan compliance activities, investment selection, and performance monitoring fall into this category. For example, investment selection was the responsibility of a plan advisor for 40% of institutions in 2016 compared to 61% in 2015. Ongoing investment monitoring was an advisor responsibility at 43% of institutions in 2016 compared to 55% in 2015. The rising tide of litigation in the higher education sector could be driving the trend toward less costly and more purposeful stand-alone investment selection packages.
The most common role for advisors when working with retirement plans at Higher Education institutions is to meet with employees to provide retirement plan education. More than half of advisor clients rely on their advisor for this function. In 2016, institutions relied on their advisors more frequently than in the past to make recommendations on plan design (45%), and to assist with the selection of a service provider (33%). Fewer institutions than in the past rely on their advisor to assist with plan compliance (44% in 2016 compared to 50% in 2015), perhaps because they are more likely to rely on an ERISA attorney to mitigate the risk of a lawsuit. Although more than one-third of institutions rely on their advisor to assist with the implementation of the fiduciary process, slightly fewer (29% in 2016 and 30% in 2015) say their advisor acts as a fiduciary (a situation that would change with the new Department of Labor Fiduciary Rule) and the number that rely on their advisor to help develop an investment policy statement fell to 26% in 2016 from 36% in 2015.
ADVISORS BECOMING ESSENTIAL IN HIGHER EDUCATION PLANS
Yes NoNo, but we have plans to hire one within
the next 12 months
41%
17%
24%
38% 36%
45%
2015 2016
22

232017 RETIREMENT PLAN TRENDS FOR INSTITUTIONS OF HIGHER EDUCATION | TRANSAMERICA
FIGURE 33: ADVISOR RESPONSIBILITIES
In light of the DOL Fiduciary Rule change, advisors are exceedingly mindful of the fiduciary role they agree to in the service of a Higher Education retirement plan. Higher Education institutions can hire advisors in a variety of fiduciary capacities. For those who want their advisor to assist only in executing their basic responsibilities, the advisor can act in a completely non-fiduciary capacity, but that option will no longer be open when the new regulation is in force. More than one-third (35%) hire their advisor in an ERISA 3(16) fiduciary capacity, where the advisor assists the plan sponsor with the plan’s many administrative tasks and perhaps with participant education, but does not render investment advice. These advisors would include third parties involved in the administration of a multi-vendor plan, for example. Nearly as many institutions (32%) hire their advisor in an ERISA 3(21) capacity, where the advisor assists in determining the plan’s investment lineup and provides investment advice in addition to assisting with plan administration and education. Higher Education plans looking for an advisor with full responsibility for the retirement plan’s investments and investment performance will hire their advisor in an ERISA 3(38) fiduciary capacity. Currently, 22% of Higher Education institutions engage an advisor at this level of responsibility.
41%Number of Higher Education institutions enlisting services of retirement plan advisors and consultants.
FIGURE 34: ADVISOR ERISA RESPONSIBILITIES
Plan design
38%
43%
45%
Meet with employees to
provide retirement plan education* 51%
Plan compliance
42%
50%
44%
Ongoing investment monitoring
31%
55%
43%
Investment selection
40%
61%
40%
Assist you with the
implementation of the fiduciary
process*35%
Vendor selection
11%25%
33%
Act as the plan fiduciary
38%
30%
29%
Develop the investment policy
statement
22%
36%
26%
35% 32%
22% 21% 18%
Administrative service [ERISA 3(16)]
Investment advice [ERISA 3(21)]
Full-scope investment discretion [ERISA 3(38)]
Assisting the plan sponsor in meeting its
responsibilities, but not acting in a fiduciary
capacity
Don’t know/Not sure
2014
2015
2016
*indicates options added in 2016

24
FIGURE 36: ADVISOR FEE ARRANGEMENT
At more than half (54%) of institutions, investment performance monitoring is performed by the recordkeeping service provider. The fee for the service is most likely financed by asset-based fees.
Advisors are most often hired on a retainer basis, but the percent of institutions that pay their advisor directly is rising quickly, while fewer plans pay their advisor out of participant accounts. The gradual shift supports the hypothesis that more institutions are retaining their advisor as a project consultant. Also supporting this hypothesis is that between 2015 and 2016, the percentage of Higher Education institutions paying their advisor an asset-based fee fell from 51% to 44%. The percentage of institutions paying their advisor more than once a year also declined from 14% to 12% in 2016 and the percent paying a one-time-only hard dollar fee actually rose slightly from 16% in 2015 to 20%. Advisor fees appear to be resisting compression very nicely. The percentage of institutions paying their advisor 5-10 basis points (bps) of plan assets rose from 27% in 2015 to 36% in 2016. The percentage paying 11-15 bps doubled, going from 9% in 2015 to 18% in 2016. The percentage of institutions paying their advisor less than 5 bps fell from 45% to 27% in 2016.
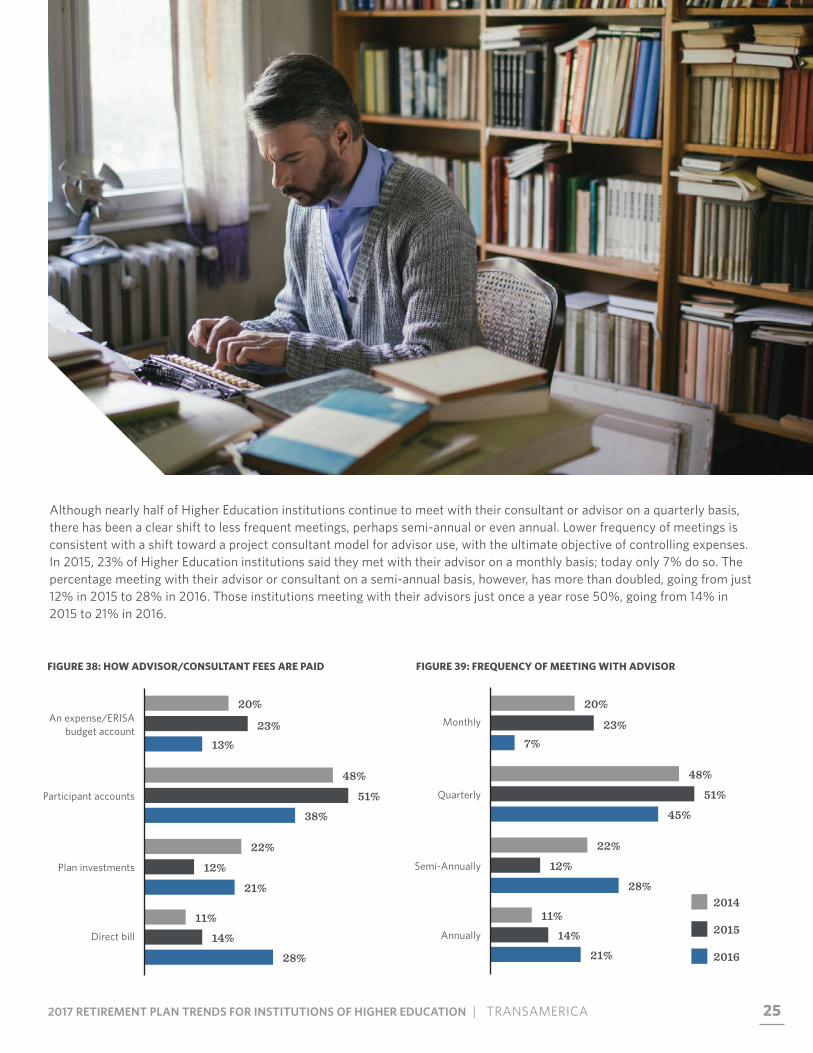
Increasingly, institutions of higher education are paying advisor fees directly, and relying less on plan investments, participant accounts, and ERISA budget accounts. The percentage of Higher Education institutions paying advisor fees out of participant accounts fell from over half (51%) in 2015 to 38% in 2016. Those paying from an expense account or ERISA budget account fell from 23% in 2015 to just 13% in 2016. Those paying advisor fees as a direct bill doubled to 28% in 2016.
FIGURE 37: AMOUNT OF FEE PAID TO ADVISOR
Q: What percentage of Higher Education istitutions investment performance monitoring is performed by recordkeepers?More than half, 54%.
FIGURE 35: WHO MONITORS INVESTMENT PERFORMANCE
54%Your providers
35%Independent third party advisor or consultant
11%Other
Asset based fee Hard dollar fee - one time only
Hard dollar fee - more than
one time (e.g., quarterly,
yearly)
Don’t know/not sure
48% 51%
44%
15% 19%
25%
16% 20% 22%
15% 14% 12%
Less than 5 bps 5 to 10 bps 11 to 15 bps More than 15 bps
32%
45%
27%
14% 19% 18%
27%
36% 32%
23%
9%
18% 2014
2015
2016
252017 RETIREMENT PLAN TRENDS FOR INSTITUTIONS OF HIGHER EDUCATION | TRANSAMERICA
FIGURE 38: HOW ADVISOR/CONSULTANT FEES ARE PAID
Although nearly half of Higher Education institutions continue to meet with their consultant or advisor on a quarterly basis, there has been a clear shift to less frequent meetings, perhaps semi-annual or even annual. Lower frequency of meetings is consistent with a shift toward a project consultant model for advisor use, with the ultimate objective of controlling expenses. In 2015, 23% of Higher Education institutions said they met with their advisor on a monthly basis; today only 7% do so. The percentage meeting with their advisor or consultant on a semi-annual basis, however, has more than doubled, going from just 12% in 2015 to 28% in 2016. Those institutions meeting with their advisors just once a year rose 50%, going from 14% in 2015 to 21% in 2016.
FIGURE 39: FREQUENCY OF MEETING WITH ADVISOR
Quarterly
48%
51%
45%
Monthly
Semi-Annually
Annually
7%23%
20%
22%
12%
28%
11%
14%
21%
Participant accounts
48%
51%
38%
An expense/ERISA budget account
Plan investments
Direct bill
13%23%
20%
22%
12%
21%
11%
14%
28%
2014
2015
2016
26
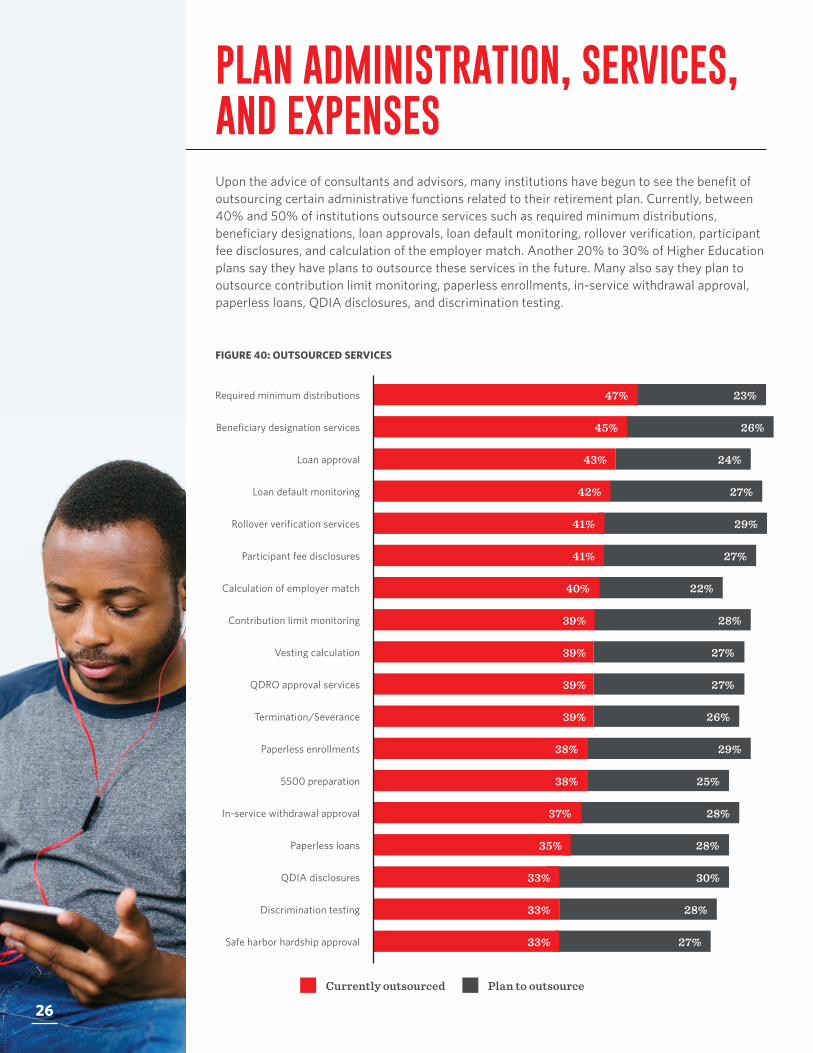
Upon the advice of consultants and advisors, many institutions have begun to see the benefit of outsourcing certain administrative functions related to their retirement plan. Currently, between 40% and 50% of institutions outsource services such as required minimum distributions, beneficiary designations, loan approvals, loan default monitoring, rollover verification, participant fee disclosures, and calculation of the employer match. Another 20% to 30% of Higher Education plans say they have plans to outsource these services in the future. Many also say they plan to outsource contribution limit monitoring, paperless enrollments, in-service withdrawal approval, paperless loans, QDIA disclosures, and discrimination testing.
FIGURE 40: OUTSOURCED SERVICES
PLAN ADMINISTRATION, SERVICES, AND EXPENSES
Loan approval 43% 24%
Loan default monitoring 42% 27%
Rollover verification services 41% 29%
Participant fee disclosures 41% 27%
Calculation of employer match 40% 22%
Contribution limit monitoring 39% 28%
Vesting calculation 39% 27%
QDRO approval services 39% 27%
Termination/Severance 39% 26%
Paperless enrollments 38% 29%
5500 preparation 38% 25%
In-service withdrawal approval 37% 28%
Paperless loans 35% 28%
30%QDIA disclosures 33%
Discrimination testing 33% 28%
Safe harbor hardship approval 33% 27%
Required minimum distributions 47% 23%
Beneficiary designation services 45% 26%
Currently outsourced Plan to outsource
26

272017 RETIREMENT PLAN TRENDS FOR INSTITUTIONS OF HIGHER EDUCATION | TRANSAMERICA
The cost associated with administering a retirement plan can be covered by a mix of four sources: monies paid by the sponsoring institution directly; monies paid by investment managers whose funds are offered in the plan (in the form of 12b-1 fees for instance); monies from an expense or ERISA budget account fed by revenue from investment managers (sub-transfer agent recordkeeping compensation for example); or from plan participant accounts if other revenue sources are insufficient to cover expenses. Employee benefit budgets are increasingly challenged, and many institutions must rely on revenue sources other than their own outlay to cover administrative expenses. The threat of litigation and general competitive pressure on contract fees leads many plan sponsors to rely increasingly on group contracts, institutional share classes, and low-cost investment options. Therefore, at many colleges and universities, revenue from investment options becomes insufficient to cover additional expenses, and sponsors rely on fees paid for by participants to fund the program.
The quest to equalize revenue and achieve fee fairness affects the evolution of the retirement plans business. Greater reliance on participant funding leads institutions to consider or implement expense equalization policies. Without revenue equalization, participants make an uneven contribution to the cost of administrative service. Participants who invest in funds that pay higher 12b-1 and sub-transfer agent compensation support a greater share of the recordkeeper’s cost of providing shared accounting and compliance services, while other participants carry less than their own weight.
Currently, 43% of Higher Education institutions equalize recordkeeping expenses across participants. Another 28% are currently planning to equalize recordkeeping expenses. More and more institutions are establishing, documenting, and implementing revenue equalization policies. More than a third of institutions have already adopted a formal policy at their school, and an additional 34% intend to adopt an equalization policy in the future.
The number of institutions that say their provider acts as a fiduciary on the plan’s administrative functions is nearly unchanged (59% in 2016, down from 61% in 2015). On the other hand, more Higher Education institutions report that their provider creates a customized web page for their plan. Indeed, in this age of rapidly advancing communications technology, with much of the emphasis on mobile technology and smart phones, service providers who want to be competitive need to offer plan participants branded web access from the pre-conversion stage on. In 2016, 61% of Higher Education institutions reported having a customized web page from their provider, up five points from 2015.
FIGURE 41: FEE AND EXPENSE EQUALIZATION POLICIES
FIGURE 42: DOES PROVIDER ACT AS FIDUCIARY ON
ADMINISTRATIVE FUNCTIONS?
FIGURE 43: DOES PROVIDER CREATE A CUSTOMIZED
WEB PAGE FOR YOUR PLAN
Yes 61%2016
59%2015
No
48%
44%
39%
Yes
61%56%
52%
Equalize recordkeeping expenses? 43% 28% 17% 12%
Have fee equalization policy? 35% 34% 17% 14%
2014 2015 2016
Yes No, but plan to implement one in the future No, and no plans to implement Unsure

28
Because they face increased competition for top talent, Higher Education institutions, more than employers of other sectors, strive to enhance their retirement plans. Over the past 12-24 months, many have added investment options, improved employee education, cut back on the number of providers, and changed advisors. Many institutions are considering such changes in the next 12 months. Among the enhancements large numbers of Higher Education institutions contemplate are a change in recordkeeper, transition to a custom plan design, adding a managed account/advice option, and adding a Roth 403(b) contribution type.
FIGURE 44: RECENT PLAN CHANGES
SPONSORS EAGER TO MAKE PLAN IMPROVEMENTS
Add investment options 23% 25%
Consolidate investments for multiple plans 23% 19%
Improve employee education 22% 31%
Offer financial planning 15%22% 27%
15%22% 27%Reduce the number of providers
15%19% 26%Change advisor
19% 25%Reduce the number of retirement plans offered
18% 28%Consolidate recordkeeping for multiple plans
25%Add Roth 401(k) 18%
Adopt a prototype plan 17% 30%
Reduce the employer contribution 17% 28%
Change the way plan expenses are paid 16% 29%
16% 28%Create written plan documents
16% 28%Reinstate the employer contribution
16% 26%Add Roth 403(b)
15% 26%Change recordkeeper
14% 27%Eliminate employer contribution
14% 29%Transition to custom plan design from prototype plan
14% 27%Add a managed account/advice option
Changes made in past 12-24 months
Changes planned in next 12 months

292017 RETIREMENT PLAN TRENDS FOR INSTITUTIONS OF HIGHER EDUCATION | TRANSAMERICA
FIGURE 45: RECENT PLAN CHANGES – 2015-2016 COMPARISON
Add investment options23%
14%
Consolidate investments for multiple plans23%
10%
Improve employee education22%
18%
Offer financial planning22%
13%
Reduce the number of providers22%
13%
Reduce the number of retirement plans offered19%
11%
Change advisor19%
10%
Add Roth 401(k)18%
15%
Consolidate recordkeeping for multiple plans18%
11%
Adopt a prototype plan17%
5%
Reduce the employer contribution17%
5%
Add Roth 403(b)16%
12%
Create written plan documents16%
10%
Change the way plan expenses are paid16%
8%
Reinstate the employer contribution16%
7%
Change recordkeeper16%
4%
Eliminate employer contribution15%
6%
Transition to custom plan design from prototype plan14%
7%
Add a managed account/advice option14%
4% Recent Changes 2016
Recent Changes 2015
29

30
THE WORK WE PUT IN TODAY CAN GIVE US A SECURE TOMORROW.
30
312017 RETIREMENT PLAN TRENDS FOR INSTITUTIONS OF HIGHER EDUCATION | TRANSAMERICA
80%2014
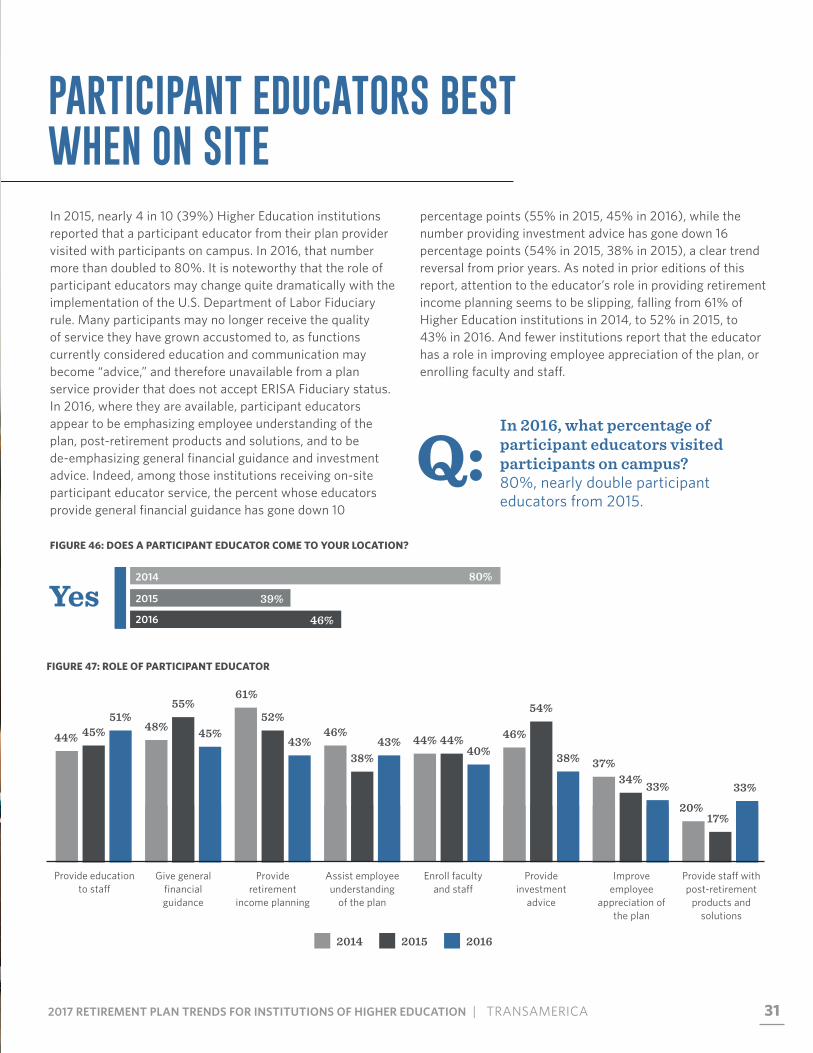
In 2015, nearly 4 in 10 (39%) Higher Education institutions reported that a participant educator from their plan provider visited with participants on campus. In 2016, that number more than doubled to 80%. It is noteworthy that the role of participant educators may change quite dramatically with the implementation of the U.S. Department of Labor Fiduciary rule. Many participants may no longer receive the quality of service they have grown accustomed to, as functions currently considered education and communication may become “advice,” and therefore unavailable from a plan service provider that does not accept ERISA Fiduciary status. In 2016, where they are available, participant educators appear to be emphasizing employee understanding of the plan, post-retirement products and solutions, and to be de-emphasizing general financial guidance and investment advice. Indeed, among those institutions receiving on-site participant educator service, the percent whose educators provide general financial guidance has gone down 10
percentage points (55% in 2015, 45% in 2016), while the number providing investment advice has gone down 16 percentage points (54% in 2015, 38% in 2015), a clear trend reversal from prior years. As noted in prior editions of this report, attention to the educator’s role in providing retirement income planning seems to be slipping, falling from 61% of Higher Education institutions in 2014, to 52% in 2015, to 43% in 2016. And fewer institutions report that the educator has a role in improving employee appreciation of the plan, or enrolling faculty and staff.
FIGURE 46: DOES A PARTICIPANT EDUCATOR COME TO YOUR LOCATION?
FIGURE 47: ROLE OF PARTICIPANT EDUCATOR
PARTICIPANT EDUCATORS BEST WHEN ON SITE
Yes46%2016
39%2015
Q:In 2016, what percentage of participant educators visited participants on campus?80%, nearly double participant educators from 2015.
Provide education to staff
44% 45%51%
Give general financial guidance
45%
55%
48%
Provide retirement
income planning
61%
52%
43%
Assist employee understanding
of the plan
46%
38%43% 44%
Enroll faculty and staff
44%40%
Provide investment
advice
38%
46%
54%
33%
37%
Improve employee
appreciation of the plan
34%
20%
Provide staff with post-retirement
products and solutions
33%
17%
2014 2015 2016
32
1 “Partner with a Professional Retirement Plan Advisor and Achieve Higher Participant Retirement Readiness Scores,” Retirement Advisor Council, July 30, 2014,
http://retirementadvisor.us/enhance-retirement-readiness
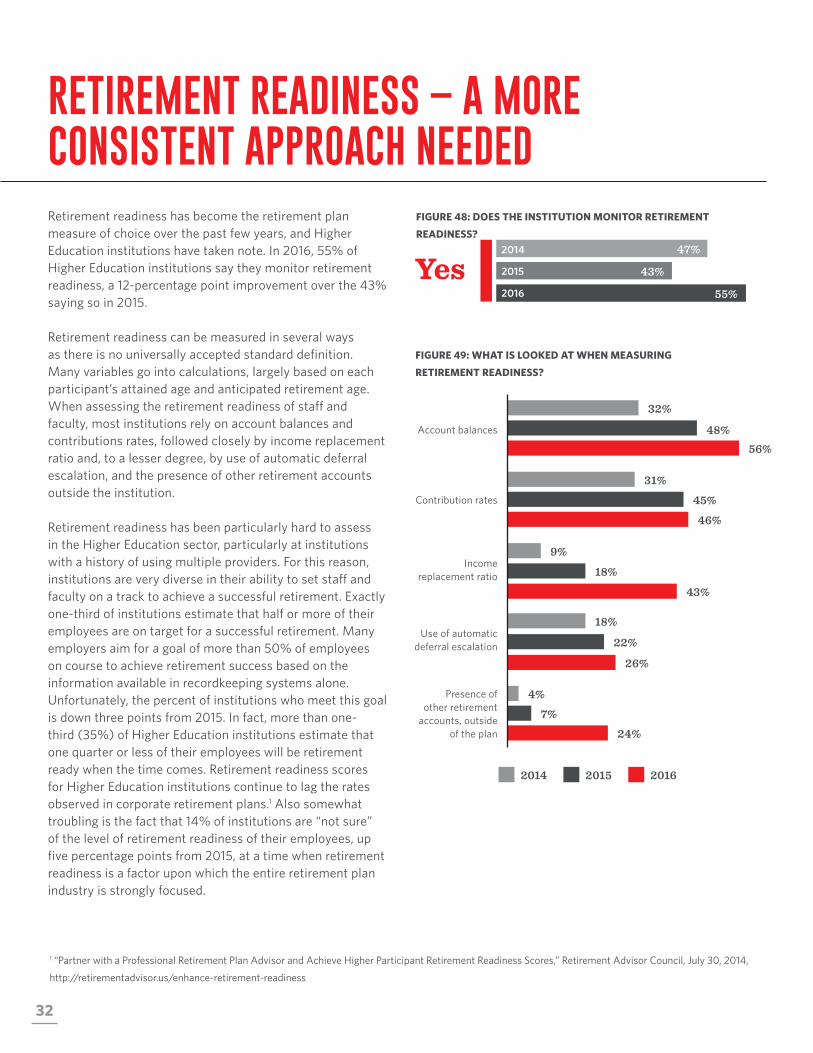
Retirement readiness has become the retirement plan measure of choice over the past few years, and Higher Education institutions have taken note. In 2016, 55% of Higher Education institutions say they monitor retirement readiness, a 12-percentage point improvement over the 43% saying so in 2015.
Retirement readiness can be measured in several ways as there is no universally accepted standard definition. Many variables go into calculations, largely based on each participant’s attained age and anticipated retirement age. When assessing the retirement readiness of staff and faculty, most institutions rely on account balances and contributions rates, followed closely by income replacement ratio and, to a lesser degree, by use of automatic deferral escalation, and the presence of other retirement accounts outside the institution.
Retirement readiness has been particularly hard to assess in the Higher Education sector, particularly at institutions with a history of using multiple providers. For this reason, institutions are very diverse in their ability to set staff and faculty on a track to achieve a successful retirement. Exactly one-third of institutions estimate that half or more of their employees are on target for a successful retirement. Many employers aim for a goal of more than 50% of employees on course to achieve retirement success based on the information available in recordkeeping systems alone. Unfortunately, the percent of institutions who meet this goal is down three points from 2015. In fact, more than one-third (35%) of Higher Education institutions estimate that one quarter or less of their employees will be retirement ready when the time comes. Retirement readiness scores for Higher Education institutions continue to lag the rates observed in corporate retirement plans.1 Also somewhat troubling is the fact that 14% of institutions are “not sure” of the level of retirement readiness of their employees, up five percentage points from 2015, at a time when retirement readiness is a factor upon which the entire retirement plan industry is strongly focused.
RETIREMENT READINESS – A MORE CONSISTENT APPROACH NEEDED
FIGURE 48: DOES THE INSTITUTION MONITOR RETIREMENT
READINESS?
FIGURE 49: WHAT IS LOOKED AT WHEN MEASURING
RETIREMENT READINESS?
Yes 43%
55%2016
2015
47%2014
Contribution rates
31%
45%
46%
Account balances
Income replacement ratio
Use of automatic deferral escalation
Presence of other retirement
accounts, outside of the plan
56%48%
32%
9%
18%
43%
18%
22%
26%
4%
7%
24%
2014 2015 2016
332017 RETIREMENT PLAN TRENDS FOR INSTITUTIONS OF HIGHER EDUCATION | TRANSAMERICA
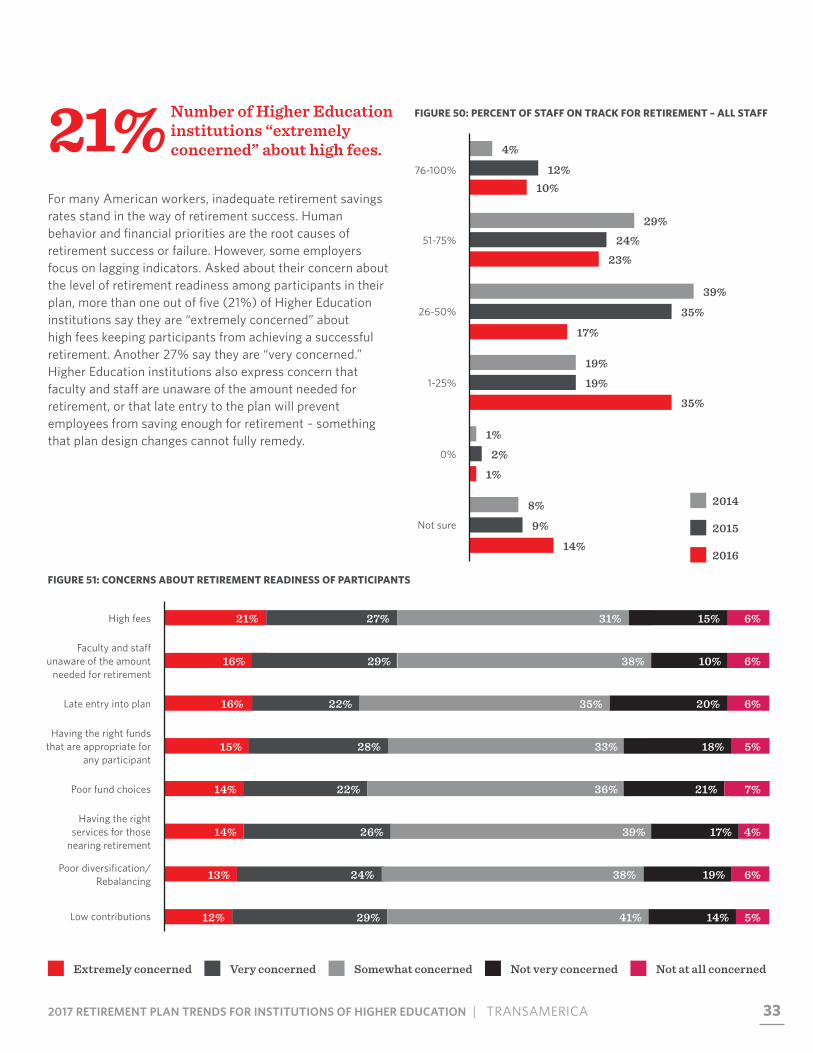
For many American workers, inadequate retirement savings rates stand in the way of retirement success. Human behavior and financial priorities are the root causes of retirement success or failure. However, some employers focus on lagging indicators. Asked about their concern about the level of retirement readiness among participants in their plan, more than one out of five (21%) of Higher Education institutions say they are “extremely concerned” about high fees keeping participants from achieving a successful retirement. Another 27% say they are “very concerned.” Higher Education institutions also express concern that faculty and staff are unaware of the amount needed for retirement, or that late entry to the plan will prevent employees from saving enough for retirement – something that plan design changes cannot fully remedy.
FIGURE 51: CONCERNS ABOUT RETIREMENT READINESS OF PARTICIPANTS
FIGURE 50: PERCENT OF STAFF ON TRACK FOR RETIREMENT – ALL STAFF21% Number of Higher Education institutions “extremely concerned” about high fees.
51-75%
29%24%
23%
76-100%
26-50%
1-25%
0%
10%12%
4%
8%
9%
14%
39%
35%
17%
19%
19%
35%
1%
2%
1%
Not sure
High fees 21% 27% 31% 15% 6%
Faculty and staff unaware of the amount
needed for retirement16% 29% 38% 10% 6%
Late entry into plan 16% 22% 35% 20% 6%
Having the right funds that are appropriate for
any participant15% 28% 33% 18% 5%15% 28% 33% 18% 5%
15% 36% 21% 5%14% 22% 7%Poor fund choices
15% 39% 17% 5%14% 26% 4%Having the right
services for those nearing retirement
38% 19% 5%13% 24% 6%Poor diversification/ Rebalancing
41% 14% 5%12% 29% 5%Low contributions
Extremely concerned Very concerned Somewhat concerned Not very concerned Not at all concerned
2014
2015
2016

34
Other factors Higher Education institutions cite as barriers to adequate retirement savings are expenses and debt (46% of Higher Education plans), low income (42%), a preference to spend rather than save (30%), lack of financial literacy or understanding of the savings required (27%), and a lack of motivation to increase the contribution once enrolled in the plan (27%).
On the other hand, retirement readiness among older workers of the Higher Education sector appears to be improving. One encouraging statistic is the percentage of Higher Education institutions with 50% or more of faculty and staff age 50 and over reportedly are on course for a successful retirement. The percentage has risen from 32% in 2015, to 40% in 2016.
While employers and retirement plan service providers face challenges to help participants save for retirement, 27% of Higher Education institutions say their service provider offers a great deal of help in addressing retirement readiness. Going beyond education and communication, providers can help with plan design and behavioral finance to engineer a choice architecture that leads the majority to retirement success unless they opt for a path to failure. Service providers have the experience and expertise to design such an experience, and a quarter of Higher Education institutions already benefit from partnering with a service provider with the required tool set and consultative approach.
FIGURE 53: PLAN PROVIDER HELPFULNESS WITH RETIREMENT READINESS
FIGURE 54: BEST INDICATOR OF PLAN SUCCESS
FIGURE 52: PERCENT OF STAFF ON TRACK FOR
RETIREMENT – STAFF 50 AND OVER
10%61%
27%
2%
51-75%27%
23%
22%
27%
76-100%
26-50%
1-25%
Not sure
13%
9%
20%
35%
9%
13%
3%
1%0%
22%22%
16%
13%11%
9%
6%
Retirement readiness of
your employee population
Participation rate Amount saved per employee
Plan operating cost
Income replacement ratio
Retirement savings gap
Deferral rate
2015 2016
A great deal of help Some help A little help No help

352017 | RETIREMENT PLAN TRENDS FOR INSTITUTIONS OF HIGHER EDUCATION
TODAY IS THE BEGINNING OF YOUR PATH. OWN IT.
352017 RETIREMENT PLAN TRENDS FOR INSTITUTIONS OF HIGHER EDUCATION | TRANSAMERICA

36

372017 RETIREMENT PLAN TRENDS FOR INSTITUTIONS OF HIGHER EDUCATION | TRANSAMERICA
The Higher Education sector is unique in many ways. Competition for top talent is always a challenge, but attention paid to retirement benefits can help.
However, dollars may not always be spent in a way that most effectively leads staff and faculty to retirement success. While senior faculty may continue working even after achieving retirement goals, others, including support staff, may not be taking advantage of the savings opportunities extended to them. Competition for top talent leads institutions to mirror the offerings and practices of large corporate employers with whom they compete for researchers and academics. Like corporate employers, they seek to shutter defined benefit plans in favor of defined contribution plans, where the employee, not the institution, makes the bulk of the retirement contribution. Higher Education institutions also follow the example of private sector employers as they have extended eligibility to more employees, implemented automatic enrollment, become more relaxed about offering loans and hardship withdrawals, enlisted the services of advisors, added Investment Policy Statements, adopted Roth contributions, and sought to measure the retirement readiness of their employee populations. For a variety of reasons, not the least of which have been the stagnant economy and competition from for-profit Higher Education institutions, many Higher Education plans have extended the time requirements before faculty and staff become eligible to receive employer contributions, trimmed those employer contributions, and extended vesting schedules, all of which drag on an employee’s ability to achieve retirement readiness. However, Higher Education institutions are working to improve their retirement plans by consolidating provider relationships, adding services and investment options, providing better participant education, leaning on advisors to take a fiduciary role in the plan, implementing needed changes, and putting faculty and staff on the path to retirement readiness.
CONCLUSION

38
This report presents results of a survey of 249 plan sponsors at institutions of Higher Education conducted in May 2016.
The sample is slightly smaller than the size for the prior edition (276 institutions), but close enough in size that we are able to clearly show year-over-year trends and to analyze data by segments. The 2016 sample consists of two-thirds (67%) public institutions and one-third (33%) private. More than three-quarters of the sample (77%) is made up of four-year colleges or universities. Not-for-profit institutions account for 60% of the survey sample, and for-profit institutions 36%. Two-thirds (67%) of institutions in the sample have plan assets of less than $100 million. The remaining 33% have plan assets of over $100 million, and just 6% have assets of over $500 million. Differences in sample composition can impact year-over-year comparisons.
FIGURE 55: PUBLIC VS. PRIVATE INSTITUTIONS OF HIGHER EDUCATION
FIGURE 56: TYPE OF ORGANIZATION
SAMPLE CHARACTERISTICS
15%
77%
8%
Two year college
Four year college or university
Stand-alone graduate of professional school
Private
44%
40%33%
Public
56%
60%67%
2014 2015 2016
38

392017 RETIREMENT PLAN TRENDS FOR INSTITUTIONS OF HIGHER EDUCATION | TRANSAMERICA
Traditionally, plans at private institutions are more active in performing due diligence and behave more like corporate plans. Plans at public institutions are more likely to rely on multiple providers and to be less aggressive in performing due diligence of service providers available on campus. However, the trend even for public institutions is to emulate corporate plan standards as a best practice. For example, Higher Education plans are traditionally more likely than corporate plans to work with more than one service provider. In 2013, 48% of Higher Education plans characterized their plan as “multi-vendor;” but in 2016 only 32% of institutions characterize their plan as multi-vendor. The trend is toward a single recordkeeper.
Plans in the multi-vendor segment use fewer service providers than they once did. In 2013, 23% of the multi-vendor segment used six or more providers. None did in the 2014 sample. In 2015, only 16% of respondents used six or more providers, and in 2016 just 13% did. The number of plans using two, three, or five providers all went down. Only the number using four providers rose, going from 4% in 2015 to 15% in 2016.
FIGURE 57: NUMBER OF SERVICE PROVIDERS
FIGURE 58: PROVIDER ARRANGEMENT
FIGURE 59: ESTIMATED DEFINED CONTRIBUTION PLAN ASSETS FIGURE 60: CATEGORY OF ORGANIZATION
67%Of institutions in the sample have less than $100 million in plan assets.
60%
36%
8%
2%
Not-for-profit
For-profit
Faith-based
Other
20%
21%
26%
19%
Less then $10MM
$10-$24.9MM
$25-$99.9MM
$100-$249.9MM
8%
6%
$250-$499.9MM
Over $500MM
Three
10%
32%30%
Two
Four
Five
Six or more
62%
33%30%
17%
4%15%
10%
15%11%
0%16%
13%
Multi Vendor
28%
33%32%
Exclusive
72%
67%68%
2014
2015
2016
When it comes to preparing for your future, there’s no time like the present.
Find out more at transamerica.com
All rights reserved. Displays or reproductions of any part of this material must include the following mention on every page: “Source: Transamerica Retirement Solutions’ Retirement Plans for Institutions of Higher Education—2016.” Submit requests for display or reproduction to the contacts listed on this page.
FOR PLAN SPONSOR AND FINANCIAL PROFESSIONAL USE ONLY
24195_ERPSB0517© 2017 Transamerica Retirement Solutions, LLC.