2017 report to the 85 - public utility commission of · pdf file2017 report to the 85th ......
TRANSCRIPT

2017
Report to the 85th
Texas Legislature
Scope of Competition in Electric Markets in Texas
Public Utility Commission of Texas
January 2017
ACKNOWLEDGEMENTS
Public Utility Commission of Texas Donna L Nelson Chairman
Kenneth W Anderson Jr Commissioner Brandy Marty Marquez Commissioner
Brian H Lloyd Executive Director
Project Supervisors Scott Smyth Director Competitive Markets Division
Julia Harvey Section Director Competitive Markets Division Liz Kayser Section Director Competitive Markets Division
Project Leader
Kristin Abbott Wholesale Market Analyst Competitive Markets Division
In addition special thanks to other PUC staff members who contributed to the preparation of this report
William Abbott Mark Bryant Chris Burch Gabriel Cardenas
Shawnee Claiborn-Pinto Cliff Crouch Mark Filarowicz Denise Foote
Ben Haguewood Therese Harris Michael Hoke Diane Hopingardner
Teresa Kirk Mick Long Jennifer Luckey Alicia Maloy
Katie Rich Keith Rogas Werner Roth Jay Stone
Darryl Tietjen Joshua Walters Pam Whittington Jeffrey Wirth
12 Donna L Nelson Kenn derson Jr Brandy Marty quez Chairman issioner Commissioner
DONNA L NELSON CHAIRMAN
KENNETH W ANDERSON JR COMMISSIONER
BRANDY MARTY MARQUEZ COMMISSIONER
GREG ABBOTT GOVERNOR
Public Utility Commission of Texas
January 15 2017
Honorable Members of the 85th Texas Legislature
We are pleased to submit to you the 2017 Scope of Competition in Electric Markets Report as required by Section 31003 of the Public Utility Regulatory Act This report provides an overview of the current status of electric competition in Texas and describes other electric industry matters for which the Commission has responsibility under State law The report concludes with a discussion of recommendations that the Legislature may wish to consider
We look forward to continued collaboration with the Legislature as we work together to secure a bright energy future for Texas residents businesses and industries If you need additional information about the issues addressed in this report or any other PUC issues please contact us
Sincerely
Printed on recycled paper An Equal Opportunity Employer
1701 N Congress Avenue PO Box 13326 Austin TX 78711 512936-7000 Fax 512936-7003
Web site httpwwwpuctexasgov
2017 SCOPE OF COMPETITION IN ELECTRIC MARKETS IN TEXAS REPORT
2017 Scope of Competition in Electric Markets in Texas
Table of Contents
I EXECUTIVE SUMMARY1
II STATE OF THE COMPETITIVE MARKET2
Overview 2 Retail Market Development and Prices 2
1 Customer Choice2 2 Retail Prices 3 3 Customer Complaints5 4 Energy-Efficiency Programs7 5 Customer Education Activities 8
Wholesale Market Development 10
1 Wholesale Market Prices 10 2 Peak Demand 12 3 Generation Diversity14
III SUMMARY OF COMMISSION ACTIVITIES FROM 2015 TO 201616
Introduction 16 Resource Adequacy 16
1 Capacity Demand and Reserves Report16 2 Operating Reserve Demand Curve 17 3 Transmission Congestion17 4 Wholesale Market Design Initiatives18 5 Reliability Standard 18
Non-ERCOT Utilities Market Development Activities 18
1 Southwest Power Pool 19 2 Midcontinent Independent System Operator 19 3 Western Electricity Coordinating Council20
Rulemaking Activities 20
1 Cost Recovery and Rate Adjustment 21 2 Changes to Certificates of Convenience and Necessity and CREZ Rule 21 3 Use of Handheld Device for Enrollment 21 4 Smart Meter Texas Portal 22
Sharyland Utilities 22 PowerToChoose Website 23 Report on Alternative Ratemaking Mechanisms 24
i | P a g e
2017 SCOPE OF COMPETITION IN ELECTRIC MARKETS IN TEXAS REPORT
Request for Purchase of Oncor Electric Delivery Company 24 Integration of Lubbock Power and Light 24 Desalination Project ERCOT Studies 25 Oversight and Enforcement Actions 25 Low-Income Discount System Benefit Fund 26 Homeland Security 27 Demand Response 27
IV LEGISLATIVE RECOMMENDATIONS28
A Determination of Low-Income Customer Eligibility 28 B Outside Counsel for Proceedings before Regional Transmission
Organizations 28 C Repeal of Natural Gas and Renewable Energy Mandates 29
1 Natural Gas 29 2 Renewable Energy 29
D Advisory Opinions 29 E Administrative 30
Gross Receipts Assessment30
V APPENDICES31
ii | P a g e
2017 SCOPE OF COMPETITION IN ELECTRIC MARKETS IN TEXAS REPORT
List of Appendices
APPENDIX A ndash ACRONYMS32 APPENDIX B ndash ERCOT DESALINATION REPORT 33
iii | P a g e
2017 SCOPE OF COMPETITION IN ELECTRIC MARKETS IN TEXAS REPORT
List of Tables
TABLE 1 NUMBER OF REPS AND PRODUCTS SERVING RESIDENTIAL CUSTOMERS SEPTEMBER 20163 TABLE 2 INFLATION-ADJUSTED COMPARISON OF RESIDENTIAL REGULATED AND COMPETITIVE RATES4 TABLE 3 CURRENT LOWEST AND AVERAGE RESIDENTIAL PLANS BY TDU SERVICE TERRITORY5 TABLE 4 2015 VERIFIED ENERGY EFFICIENCY SAVINGS 8 TABLE 5 WEBSITE STATISTICS SEPTEMBER 2015 ndash AUGUST 2016 9 TABLE 6 ERCOT PEAK DEMAND 2012 ndash 201613 TABLE 7 MAY 2016 CAPACITY DEMAND AND RESERVES REPORT FORECAST17 TABLE 8 NOTICES OF VIOLATIONS 25 TABLE 9 CERTIFICATES REVOKED OR RELINQUISHED 25 TABLE 10 WARNING LETTERS26
iv | P a g e
2017 SCOPE OF COMPETITION IN ELECTRIC MARKETS IN TEXAS REPORT
List of Figures
FIGURE 1 PERCENTAGE OF OBSERVABLE SWITCHING BY CUSTOMER CLASS 3
FIGURE 4 MONTHLY AVERAGE NATURAL GAS PRICES SEPTEMBER 2014 ndash AUGUST 201611 FIGURE 5 LOAD-WEIGHTED AVERAGE REAL-TIME MONTHLY SETTLEMENT POINT PRICES SEPTEMBER
FIGURE 2 TOTAL ELECTRIC COMPLAINTS RECEIVED SEPTEMBER 2014 ndash AUGUST 2016 6 FIGURE 3 ELECTRIC COMPLAINTS RECEIVED BY CATEGORY SEPTEMBER 2014 ndash AUGUST 2016 7
2014 ndash AUGUST 2016 12 FIGURE 6 HIGH LOAD HOURS IN ERCOT 2011 ndash 2016 13 FIGURE 7 MONTHLY PEAK DEMAND IN ERCOT JANUARY 2014 ndash AUGUST 201614 FIGURE 8 ENERGY USE IN ERCOT BY RESOURCE TYPE 201515
v | P a g e
2017 SCOPE OF COMPETITION IN ELECTRIC MARKETS IN TEXAS REPORT
I EXECUTIVE SUMMARY
This year marks 15 years since the opening of the Texas retail electric market in
2002 brought about by the passage of Senate Bill 7 by the Texas Legislature which began
the project of restructuring the Texas electricity market In the 15 years since the market
opening the Public Utility Commission of Texas (Commission) has overseen the
transformation of the Texas electric landscape from one of incumbent utilities to a thriving
electric market in the Electric Reliability Council of Texas (ERCOT) region This Scope
of Competition in Electric Markets Report will provide a review of the activities the
Commission has undertaken during the last two years to continue to foster market
competition improve the customer experience and promote infrastructure to deliver
electricity to power the lives of Texans
Under the Commissionrsquos oversight the Texas retail market remains the national leader in competitive residential commercial and industrial offerings with the highest
number of competitors and product variety in the country As of March 2016 in the portion
of the state that is open to customer choice 92 of all customers had exercised their ability
to switch providers
On average residential retail rates in the competitive areas of Texas have declined
since 2014 to prices as low as 45 cents per kilowatt-hour (kWh) compared to a nationwide
average of 1345 cents per kWh in 2016 In addition wholesale market prices in Texas
have fallen 21 since 2013
Alongside the Commissionrsquos work refining the retail market the Commission has
also focused on continuing to enhance the customer experience by adapting to
technological changes as well as evaluating market mechanisms to ensure that the
wholesale market is as efficient and reliable as possible To further its objective of reliable
affordable and efficient power for Texas industry and residents the Commission has
several ongoing projects focused on promoting efficient and sustainable outcomes in the
wholesale market
On August 11 2016 the ERCOT region broke the previous all-time record for peak
demand with customers across the region using 71093 Megawatts (MW) of electricity in
part because of hot weather across the state Power generation was sufficient to meet this
record level of demand
This Report summarizes the continuing trends affecting competition in the electric
industry It highlights the effects of competition on rates customer protection and
complaint issues oversight and enforcement action and other noteworthy Commission
activities This Report concludes with suggestions for the Legislaturersquos consideration that
may facilitate continued efficiency and promote the Commissionrsquos objective of providing high quality service to Texans
1 | P a g e
2017 SCOPE OF COMPETITION IN ELECTRIC MARKETS IN TEXAS REPORT
II STATE OF THE COMPETITIVE MARKET
Overview
In the 15 years since the implementation of customer choice in Texas customers
continue to enjoy the benefits of a competitive market a plethora of retail electric providers
offering innovative products designed to meet the needs of residential commercial and
industrial customers The diversity of retail electric providers and products has created a
robust competitive market that continues to provide Texas customers with low electricity
prices With Senate Bill 7 the Texas Legislature put in place a foundation for a restructured
electric market that continues to set the standard across this nation Because of SB 7
Texas remains the national leader in competitive electric markets The Commission will
continue to oversee the competitive electric market in Texas to ensure that it stays true to
the foundation created by SB 7 and that it provides Texans with the reliable competitively
priced electricity they have come to expect
Retail Market Development and Prices
1 Customer Choice
The Commission has continued to guide improvements of the Texas competitive
retail electric market in which customers are able to choose which electric rates and
services best suit their needs from Retail Electric Providers (REPs) which sell electricity
to the end-use customer The number and diversity of REPs competing for customers
provides an indicator of the health of the retail market Since the publication of the 2015
Scope of Competition in Electric Markets Report the number of REPs and competitive
offers in ERCOT has remained stable As of September 2016 109 REPs were operating
in ERCOT providing 440 total unique products 97 of which solely support electricity
generated from 100 renewable sources1
Because of the number of providers and plans available from which customers can
choose Texas continues to be recognized as the most successful competitive retail market
in North America as demonstrated by its first-place rank for the past eight years in the
Annual Baseline Assessment of Choice in Canada and the United States a scorecard that
compares the retail competitiveness of electric markets in the US states and Canadian
provinces2
The number of REPs serving residential customers and the associated number of
product offerings by transmission and distribution utility (TDU) in the ERCOT grid are
shown in Table 1
1 Public Utility Commission wwwpowertochooseorg
2 Annual Baseline Assessment of Choice in Canada and the United States Distributed Energy
Financial Group July 2015 Available at httpwwwcompetecoalitioncomfilesABACCUS-2015-vfpdf
2 | P a g e
2017 SCOPE OF COMPETITION IN ELECTRIC MARKETS IN TEXAS REPORT
Table 1 Number of REPs and Products Serving Residential Customers September 2016
TDU Service Territory3 Residential
Suppliers
Number of
Products
AEP Central 52 355
AEP North 49 295
CenterPoint 55 400
Oncor 55 390
Sharyland ndash McAllen 14 103
Sharyland Utilities 22 155
TNMP 49 320
2 Retail Prices
Together the REPs in the competitive market serve 6153293 residential
customers 1053032 commercial customers and 4336 industrial customers4 In this
highly competitive retail market 92 of all customers have exercised their ability to switch
REPs since the market opening in 2002 Figure 1 depicts the percentage of customers in
each customer class who have switched REPs at least once since 2002
Figure 1 Percentage of Observable Switching by Customer Class5
3 American Electric Power ndash Texas Central Company (ldquoAEP Centralrdquo) American Electric Power ndash Texas North Company (ldquoAEP Northrdquo) CenterPoint Energy (ldquoCenterPointrdquo) Oncor Electric Delivery Company (ldquoOncorrdquo) Sharyland Utilities (ldquoSharyland ndash McAllenrdquo serves McAllen Texas and ldquoSharyland Utilitiesrdquo serves Stanton Brady and Colorado City) and Texas-New Mexico Power (ldquoTNMPrdquo)
4 ERCOT Provider of Last Resort Counts March 31 2016 Available at
httpwwwercotcomcontentwcmkey_documents_lists89277POLR_Counts_Energy_2016_Reportingx
lsx
5 ERCOT Supplemental Information - Retail Electric Market April 2015ndashMarch 2016 Available
at
httpercotcomcontentwcmkey_documents_lists89277Observed_Selection_of_Electric_Providers_Mar
ch_2016pptpptx
3 | P a g e
2017 SCOPE OF COMPETITION IN ELECTRIC MARKETS IN TEXAS REPORT
The success of the competitive market is highlighted in Table 2 which compares
the last regulated retail rate with the current lowest 12-month fixed retail offering per 1000
kWh in each region adjusted for inflation Since 2001 average retail rates across Texas
have decreased 63 percent
Table 2 Inflation-Adjusted Comparison of Residential Regulated and Competitive Rates
TDU Service
Territory6
Last Regulated
Rate (2001)
centkWh7
Last Regulated
Rate Adjusted for
Inflation
Current
Lowest Fixed
Price8
Percentage
Change
AEP Central 96 131 56 ndash5725
AEP North 100 136 50 ndash6324
CenterPoint 104 141 54 ndash617
Oncor 97 132 45 ndash6591
TNMP 106 144 50 ndash6528
The average lowest available residential price across the competitive market was
51 cents per kilowatt-hour (kWh) in September 2016 and the average across all plans
available in the competitive market in Texas was 98 cents per kWh 9 Moreover rates in
ERCOT have not only decreased since Texasrsquo transition to the competitive market but both fixed and variable rates have continued to be much lower than nationwide averages
of 1345 cents per kWh in July 2016 and 1362 cents per kWh in July 201510
Table 3 compares the current lowest fixed price available for residential service in
each TDU service territory with the average price of plans available and the nationwide
average excluding Texas
6 Sharyland Utilities was formed shortly before the market opening to serve part of McAllen
Texas it is not included in this table because of its limited number of customers at that time In Docket No
21591 Sharyland Utilities committed that its average bundled residential rates would not exceed those of
Central Power amp Light Company (now AEP Central)
7 Association of Electric Companies of Texas Available at httpwwwaectnetinside-the-charts-
prices-available-in-the-competitive-market-today-well-below-the-last-regulated-rate
8 The current lowest fixed price available for a residential plan in each TDU service territory as of
September 2016 for a 12-month plan without time-of-use features prepaid features or a minimum usage
fee for a fixed month-to-month rate for a customer who expects to consume approximately 1000 kWh of
electricity a month Available at wwwpowertochooseorg
9 This average is for a residential customer expecting to consume approximately 1000 kWh of
electricity each month Available at wwwpowertochooseorg
10 The nationwide average is for July 2016 and includes all US states except Texas Source US
Energy Information Administration Average Retail Price of Electricity Electricity Data Browser July
2016 Available at httpwwweiagovelectricitydatacfm
4 | P a g e
2017 SCOPE OF COMPETITION IN ELECTRIC MARKETS IN TEXAS REPORT
Table 3 Current Lowest and Average Residential Plans by TDU Service Territory
TDU Service
Territory
Current Lowest
Fixed Price
(centkWh)11
Current Average
All Available
Plans12
Nationwide
Average13
AEP Central 56 94
1345
AEP North 50 94
CenterPoint 54 91
Oncor 45 83
Sharyland ndash McAllen 56 98
Sharyland Utilities 45 133
TNMP 50 92
3 Customer Complaints
The Commissionrsquos rules permit a customer to file a complaint with the Commission
about their electric service The Commissionrsquos staff works with the customer and electric service provider to resolve the complaints first in an informal complaint process and then
directs the customer to a formal complaint process if the customer is dissatisfied with the
resolution The Commission keeps records of these complaints and evaluates the
complaint statistics as a barometer for analyzing company behavior and its effect on
customers The Commission uses the data to identify any company-specific trends work
with companies to address any issues or otherwise take enforcement action
From September 1 2014 to August 31 2016 the average number of days to resolve
a utility complaint was 18 days The slight decline in the number of electric complaints
received in 2015 through 2016 may be attributed to the mild winter weather which resulted
in lower overall prices as well as the absence of significant disruptions to electric service
Figure 2 shows the total complaints received from September 1 2014 to August 31 2016
11 The current lowest fixed price available for a residential plan in each TDU service territory as of
September 2016 for a 12-month plan without time-of-use features prepaid features or a minimum usage
fee for a fixed month-to-month rate for a customer who expects to consume approximately 1000 kWh of
electricity a month Source wwwpowertochooseorg
12 The average is for a residential customer expecting to consume approximately 1000 kWh of
electricity a month Source wwwpowertochooseorg
13 The nationwide average is for July 2016 and includes all US states except Texas Source US
Energy Information Administration Average Retail Price of Electricity Electricity Data Browser July
2016 Available at httpwwweiagovelectricitydatacfm
5 | P a g e
2017 SCOPE OF COMPETITION IN ELECTRIC MARKETS IN TEXAS REPORT
Figure 2 Total Electric Complaints Received September 2014 ndash August 2016
From September 1 2014 to August 31 2016 the Commission received 4465
electric complaints Billing complaints continue to be the greatest cause of customer
complaints with 42 of all electric complaints concerning billing issues Complaints
relating to the provision of service including customer service and the refusal of service
were the second highest cause of complaints at 15 Quality of service contributed to the
third-leading cause of complaints at 12 Complaints are broken down by category in
Figure 3
6 | P a g e
2017 SCOPE OF COMPETITION IN ELECTRIC MARKETS IN TEXAS REPORT
Figure 3 Electric Complaints Received by Category September 2014 ndash August 2016 14
4 Energy-Efficiency Programs
Energy-efficiency programs in Texas are administered by the TDUs in ERCOT and
the vertically integrated utilities outside of ERCOT pursuant to the Public Utility
Regulatory Act (PURA) sect39905 The utilities recover the cost of the energy-efficiency
programs through a surcharge on electric bills which are adjusted and approved annually
by the Commission Under the energy-efficiency programs TDUs reduced 559369 MWh
of electricity consumption in 2015 exceeding the goal for the year by 40 The energy-
efficiency programs are designed to reduce customersrsquo energy consumption as well as
electric peak demand In 2011 SB 1125 increased the peak demand goal reduction to a
30 growth in demand Once a utility reaches this goal the utility must achieve a
reduction of four-tenths of one percent of the utilityrsquos summer weather-adjusted peak
demand in subsequent years
The 2011 legislation also required that the Commission develop an evaluation
measurement and verification (EMampV) framework to promote effective program design
to provide consistent and streamlined reporting and to retain a third-party contractor to
conduct these activities EMampV efforts for the 2015 program year focused on evaluating
targeted programs for which the associated peak demand and energy savings were most
uncertain A primary component of EMampV is the statewide Technical Reference Manual
(TRM) a single common reference document prepared and maintained by the EMampV
contractor to estimate energy and peak demand savings resulting from the installation of
14 ldquoCrammingrdquo is the practice of adding unauthorized charges for any services to an electric bill without verified consent by the customer ldquoSlammingrdquo is the practice of switching the customer to another provider without authorization
7 | P a g e
2017 SCOPE OF COMPETITION IN ELECTRIC MARKETS IN TEXAS REPORT
energy efficiency measures sponsored by utility-administered programs in Texas In 2015
changes made to the TRM added and updated existing deemed savings values and added
standardized EMampV protocols for determining and verifying energy and demand savings
effective for the 2016 program year Verified demand and energy savings and program
costs for 2015 are shown in Table 4
Table 4 2015 Verified Energy Efficiency Savings15
MW MWh MW MWh
El Paso Electric 1231 22283 1116 19552 $4039278
Entergy Texas 1809 39688 1550 27156 $7023009
SPS 817 14537 549 9627 $3190744
SWEPCO 988 15262 560 9811 $3220359
Non-ERCOT Total 4844 91770 3775 66146 $17473390
AEP Central 4378 68482 1293 22653 $13261480
AEP North 454 12289 426 7464 $2727260
CenterPoint 16849 188255 5883 103069 $35832993
Oncor 11581 178908 6940 121589 $47438836
Sharyland 060 2528 100 1752 $633252
TNMP 866 17452 5770 10109 $4011627
ERCOT Total 34188 467915 15219 266636 $103905448
Grand Total 39033 559685 18994 332782 $121378838
Excludes Statewide EMampV contractor expenses of approximately $3M for review of prior program year
GoalProgram CostUtility
Verified Savings
In 2015 the utilities cumulatively achieved 206 of the demand reduction goal
(226 for utilities in ERCOT) and 168 of the energy reduction goal (175 for utilities
in ERCOT)
5 Customer Education Activities
The Commission engages with residential and small commercial electric customers
about retail electric competition through its ldquoTexas Electric Choicerdquo campaign and also informs customers about energy conservation opportunities through its ldquoPower to Save Texasrdquo campaign In addition to engaging with customers through these two campaigns
Commission staff also respond to customer inquiries and distribute literature about
electricity facts and issues
15 The non-ERCOT utilities within the state of Texas are El Paso Electric Company (ldquoEl Paso Electricrdquo) Entergy Texas Inc (ldquoEntergy Texasrdquo) Southwestern Public Service Company (ldquoSPSrdquo) and Southwestern Electric Power Company (ldquoSWEPCOrdquo)
8 | P a g e
2017 SCOPE OF COMPETITION IN ELECTRIC MARKETS IN TEXAS REPORT
a ldquoPower to Chooserdquo
The Commission educates customers about the evolving marketplace continuing
its ldquoTexas Electric Choicerdquo campaign which began in February 2001 with the goal of educating Texans about the changes and choices in the retail electric market The
PowerToChooseorg website and its Spanish-language counterpart PoderDeEscogerorg
provides a simple one-stop shop portal for Texans who live in a service territory open to
customer choice to enter in their zip code and browse through the numerous plans offered
by the REPs
b ldquoPower to Save Texasrdquo
In addition to the ldquoTexas Electric Choicerdquo campaign and the PowerToChoose website the Commission has also continued its statewide initiative ldquoPower to Save
Texasrdquo together with its parallel Spanish-language initiative ldquoPoder de Ahorrarrdquo which educates Texans about conserving energy during the summer peak times of 3 pm to 7
pm when the demand for electricity tends to be the highest The PowerToSaveTexasorg
website and its Spanish-language counterpart PoderDeAhorrarTexasorg provide Texans
with energy saving tips for homes and businesses
As part of the Power to Save Texas campaign the Commission contracted with
Resource Action Programs (RAP) to develop and implement a middle school energy
conservation outreach program in Hidalgo Harris Dallas and Tarrant counties In the
2015 ndash 2016 school year the program provided an effective energy education program
which strongly supports the Texas Essential Knowledge and Skills (TEKS) curriculum
standards as well as engages students through school challenges and at-home activities
c Campaign Outreach
PowerToChooseorg and its Spanish-language counterpart PoderDeEscogerorg
have proven valuable in educating customers about customer choice in the electricity
market The Commission conducted a number of activities to further promote the statersquos official electric choice website through social media community events trade shows and
expos From September 1 2015 through August 31 2016 nearly a million potential
customers visited the PowerToChooseorg and PoderDeEscogerorg websites Website
statistics are contained in Table 5
Table 5 Website Statistics September 2015 ndash August 2016
PowerToChoosecom Unique Visitors 980473
PoderDeEscogercom Unique Visitors 4652
d Low-IncomeElderly Outreach and Collaboration with Faith- and
Community-Based Organizations
Throughout 2015 and 2016 the Commissionrsquos staff also worked with legislative
offices and faith- and community-based organizations to provide educational materials and
training to help their constituents better understand the deregulated electric market and the
9 | P a g e
2017 SCOPE OF COMPETITION IN ELECTRIC MARKETS IN TEXAS REPORT
Commissionrsquos websites The Commission has actively participated with the Interagency
Coordinating Group (ICG) which was established by the Texas Legislature to expand and
improve relationships between state government and faith- and community-based
organizations Information on customer assistance programs such as LITE-UP Texas was
provided to community organizations such as Legal Aid of Northwest Texas senior
activity centers and religious groups
e Call Center
The Commission has trained its Customer Protection Division staff who are fluent
in both English and Spanish to answer customer calls and to assemble and mail
informational packets comparing electric plans when requested by customers without
Internet access From September 2015 to August 2016 the Customer Protection Division
staff handled 7663 calls from customers requesting assistance with shopping
f Educational Literature
In addition to the educational materials on the Commissionrsquos website the Commission provides brochures fact sheets and other educational materials by mail and
e-mail through a network of community organizations and events and in response to
customer requests to the call center Up-to-date fact sheets are available on the
Commissionrsquos website PowertoChooseorg and PoderDeEscogerorg as part of the
campaignrsquos outreach efforts The fact sheets provide information on a number of current
industry and consumer topics
Throughout 2015 and 2016 campaign educational materials promoting the
agencyrsquos programs including Power to Choose and Power to Save Texas were distributed
at numerous community events and civic town hall events such as Hurst-Euless-Bedford
ldquoBack 2 Schoolrdquo day Dickenson Housing Family Fair Energy Day DFW Family Fair
Earth Day Texas Texas Home and Garden shows in Houston Texas Black Expo National
Night Out events and minor league baseball games
Wholesale Market Development
The Commission engages regularly with ERCOT to oversee market developments
and ensure system supply reliability security and improved price formation and market
outcomes Market design changes made as a result of this working relationship have
created new opportunities for a variety of generation resources to enter the market and
supported the formation of wholesale prices that reflect real-time market conditions more
accurately and therefore improve the efficiency of the market
1 Wholesale Market Prices
Wholesale market prices have fallen in comparison to prices seen in the 2012 ndash 2014 period The ERCOT load-weighted real-time average price of energy in 2015 was
$2677 per Megawatt-hour (MWh) a 34 decrease from the average price in 2014 and a
decrease of 21 from the average seen in 2013
10 | P a g e
2017 SCOPE OF COMPETITION IN ELECTRIC MARKETS IN TEXAS REPORT
Falling wholesale prices are correlated with the current trend of lower natural gas
prices the primary fuel of many of the regionrsquos power plants The average Houston Ship Channel spot price for natural gas was 41 lower in 2015 than in 2014 decreasing from
$437MMBtu in 2014 to $258 in 2015 Through March the average price for 2016 has
fallen to $192MMBtu Natural gas price trends from September 2014 through August
2016 are shown in Figure 4
Figure 4 Monthly Average Natural Gas Prices September 2014 ndash August 2016
Monthly average wholesale electricity prices are shown in Figure 5 Load-
weighted prices are calculated by dividing the price at a load zone by the associated
demand This metric provides a useful proxy for the actual wholesale prices paid by load16
16 It is worth noting that most power in ERCOT is sold through various bilateral arrangements that
are designed to hedge daily real-time market price risk
11 | P a g e
2017 SCOPE OF COMPETITION IN ELECTRIC MARKETS IN TEXAS REPORT
Figure 5 Load-Weighted Average Real-Time Monthly Settlement Point Prices September 2014 ndash August 2016
Another component of the real-time price of electricity is the cost of transmission
congestion Transmission congestion occurs when there is insufficient transmission
capacity to dispatch energy in a least-cost fashion The recent build-out of additional
transmission lines in areas of high congestion has partially relieved the cost burden in these
areas particularly in West Texas where oil and gas production growth rapidly increased
the demand for electricity resulting in relatively higher zonal prices
2 Peak Demand
After the very high peak demand levels during the hot summer of 2011 peak
demand in ERCOT was lower in 2012 through 2014 In 2015 peak demand again
increased though not to 2011 levels with load exceeding 60000 MW for 330 hours and
exceeding 65000 MW for 91 hours as shown in Figure 6 below In 2016 ERCOT
experienced a record week in August which saw the previous record peak demand broken
six times and the ERCOT region hit its all-time peak demand of 71093 MW on August
11 2016
As peak demand has increased the recorded availability of generation supply in the
region during times of high load has decreased slightly Physical Responsive Capability
(PRC) analogous to the amount of reserves available on the system at any given time fell
below 3000 MW for 269 hours in 2015 up slightly from 213 hours in 2014 and 215
hours in 2013 but well below the 371 hours recorded during the 2011 summer
12 | P a g e
2017 SCOPE OF COMPETITION IN ELECTRIC MARKETS IN TEXAS REPORT
Figure 6 High Load Hours in ERCOT 2011 ndash 2016
As shown in Table 6 the ERCOT system peak demand was 69877 MW in 2015
up 5 from the 2014 peak and the 2016 ERCOT system peak demand increased 174
from the peak demand of the previous year
Table 6 ERCOT Peak Demand 2012 ndash 2016
Year
ERCOT Peak
Demand (MW)
Percentage Change
from Prior Year
2012 66548 ndash 2013 67245 105
2014 66454 ndash118
2015 69877 515
2016 71093 174
Figure 7 shows the hourly peak load for each month in ERCOT from January 2014 to
August 2016
13 | P a g e
2017 SCOPE OF COMPETITION IN ELECTRIC MARKETS IN TEXAS REPORT
Figure 7 Monthly Peak Demand in ERCOT January 2014 ndash August 2016
3 Generation Diversity
As electricity consumption has increased in ERCOT the diversity of the systemrsquos generation portfolio has also increased Generators participating in the statersquos renewable energy credit (REC) trading program reported an 11 increase in renewable generation
from 2013 to 2015 rising from 376 million MWh to 469 million MWh with wind
representing 96 of the total renewable mix Landfill gas was the second most prevalent
renewable source representing approximately 12 of all renewable generation in 2015
Energy produced from wind generation was up by 13 in 2015 from 2013 and solar
energy capacity more than doubled from 121 MW in 2013 to 288 MW in 2015 Coal-fired
generation has been steadily shrinking as a proportion of total generation declining from
37 of electricity produced in 2014 to 28 in 2015 Energy use in the ERCOT region by
fuel type for 2015 is shown in Figure 8
14 | P a g e
2017 SCOPE OF COMPETITION IN ELECTRIC MARKETS IN TEXAS REPORT
Figure 8 Energy Use in ERCOT by Resource Type 2015
The Commissionrsquos projects are further described in the following section of this report
15 | P a g e
2017 SCOPE OF COMPETITION IN ELECTRIC MARKETS IN TEXAS REPORT
III SUMMARY OF COMMISSION ACTIVITIES FROM 2015 TO 2016
Introduction
The Commission develops and modifies rules policies and procedures for the
competitive electric market in Texas in response to the technological advances in the
industry and the evolving needs of customers The Commission also continues to carry
out oversight of programs with which the Legislature has tasked it ndash such as energy
efficiency renewable energy and advanced metering infrastructure Within the
ERCOT region the monopoly wires-and-poles companies that provide transmission
and distribution services throughout the grid remain subject to traditional rate
regulation by the Commission The Commission continues to set rates for these
utilities as they are not subject to the forces of market competition This section
provides an overview of the Commissionrsquos activities in its oversight of the wholesale and retail electric markets as well as its governance over regulated electric utilities
Resource Adequacy
Resource adequacy is the long-term ability of the system to serve demand reliably
when consumption is highest given the available installed capacity load resources and
the operational reliability of the system Assessing resource adequacy requires comparing
the systemrsquos forecast installed capacity and load resources against the forecast peak
summer load The difference between the forecast of available generation and load
resources and the forecasted demand for electricity is referred to as an ldquoinstalled capacity
reserve marginrdquo which is an indicator of the ability of the system to meet customer demand
during peak conditions In addition to evaluating the forecast reserve margin assessing
resource adequacy includes evaluating the systemrsquos operational reliability The systemrsquos operational reliability depends on the ability of generators to manage plant operations
successfully as well as the grid operatorrsquos ability to manage the system to avoid or to mitigate load curtailment During 2015 and 2016 the ERCOT system performed well with
respect to resource adequacy The Commission has devoted significant attention to
ensuring that ERCOT maintains an adequate installed capacity reserve margin and a high
level of operational reliability developing a wholesale market design that allows
consumers to continue to receive low-cost and reliable electricity over the long term
1 Capacity Demand and Reserves Report
The Capacity Demand and Reserves (CDR) Report published by ERCOT semi-
annually is a snapshot estimate of long-term supply and demand and the associated annual
reserve margin for peak summer and winter conditions While the CDR Report is not a
forecast of any particular outcome it provides insight into possible resource adequacy
trends
16 | P a g e
2017 SCOPE OF COMPETITION IN ELECTRIC MARKETS IN TEXAS REPORT
The May 2016 CDR Report shows estimated reserve margins well above the
current target reserve margin of 1375 Installed capacity reserve margin estimates taken
from this CDR Report are shown below in Table 7
Table 7 May 2016 Capacity Demand and Reserves Report Forecast
Forecast 2017 2018 2019 2020 2021 2022 2023 2024 2025 2026
Peak Load
(MW)
68548 69409 70795 71420 72098 72792 73482 74168 74864 75704
Total
Capacity
(MW)
80995 87019 87238 87407 87678 87738 87738 87728 87728 87728
Reserve
Margin
182 254 232 224 216 205 194 183 172 159
2 Operating Reserve Demand Curve
In ERCOT the price signals produced by the energy-only wholesale electric market
should provide incentives to promote short-term reliability as well as induce optimal long-
run investment in new resources If the prices are efficient and reflect the full cost of
dispatching resources to meet demand the benefits that accrue to both consumers and
producers can be maximized at the least cost and new generating capacity (or load
resources) should develop to maintain the equilibrium as old resources retire or demand
increases
The Operating Reserve Demand Curve (ORDC) implemented at the Commissionrsquos direction in June 2014 improves price formation by allowing prices to more fully reflect
the value of operating reserves The ORDC assigns an economic value to operating
reserves or the amount of extra capacity available to maintain system reliability on a daily
basis
As part of its ongoing review of resource adequacy in ERCOT the Commission is
currently evaluating the accuracy of the inputs to the ORDC to ensure that its contribution
to price formation appropriately reflects the costs of meeting demand and the underlying
needs of the system
3 Transmission Congestion
Although competitive power producers and regulated transmission providers form
two distinct segments of the market transmission buildout has a direct effect on wholesale
power prices When there is insufficient transmission capacity to dispatch energy in a least-
cost fashion the system operator takes action to ensure that the physical limits of the
transmission system facilities are not violated The re-dispatch of generation because of
transmission limits results in disparate prices at different locations on the system In
comparison to prior years transmission congestion in ERCOT has lessened because of the
large increase in transmission investment and the reduction of high demand related to oil
and gas production in West Texas ERCOT and the Commission continually evaluate the
need for cost-effective additional transmission investment to manage congestion
17 | P a g e
2017 SCOPE OF COMPETITION IN ELECTRIC MARKETS IN TEXAS REPORT
4 Wholesale Market Design Initiatives
While the ERCOT wholesale market has been successful in attracting new resource
investment and also maintaining competitive prices for consumers certain improvements
to the market design could yield additional benefits in terms of efficient price formation
and opportunities for entry of new technology Initiatives already in place in many other
regions such as real-time co-optimization and multi-interval real-time resource dispatch
may allow existing capacity to be used more effectively and create opportunities for the
integration of additional load resources to serve electric demand The Commission
continues to work with ERCOT and interested stakeholders to determine the value of
implementing such enhancements particularly as ERCOTrsquos resource mix changes over time
5 Reliability Standard
In early 2014 the Commission opened a project to review its use of a target installed
capacity reserve margin based on a reliability standard equivalent to one loss-of-load event
every ten years In this project the Commission received written comment from interested
parties conducted a public workshop consulted with independent experts and reviewed
the application of reliability standards in other regions As a result of this review future
reliability metrics to be estimated in ERCOT will include the market equilibrium reserve
margin the economically-optimal reserve margin and the associated levels of expected
unserved energy The Commission believes that publishing these metrics represents an
improvement over reporting a one-event-in-ten-years standard by enhancing insight into
expected outcomes in ERCOTrsquos energy-only market
Non-ERCOT Utilities Market Development Activities
SB 7 the law that introduced retail competition to the Texas market in 1999
granted the Commission authority to delay retail competition in an area where deregulation
would not result in fair competition and reliable service because of the lack of an
independent organization to coordinate the electric system and the concentration of
ownership in the generation sector in some of those areas Consequently SB 7 included
provisions recognizing the difficulty of implementing retail competition in areas outside of
ERCOT Therefore the utilities outside of the ERCOT region remain vertically integrated
owning generation transmission and distribution assets as well as selling power to end-
use customers These vertically integrated utilities remain subject to traditional regulation
including rates set by the Commission and customer choice is not offered in the service
territories of these utilities
The Commission does continue to monitor ongoing activities in the non-ERCOT
portions of the state In 2015 the Legislature granted the Commission the authority to
retain counsel and consulting experts in order to participate in legal proceedings at the
Federal Energy Regulatory Commission (FERC) which has regulatory jurisdiction over
wholesale power sales and transmission rates outside of ERCOT This authority has
18 | P a g e
2017 SCOPE OF COMPETITION IN ELECTRIC MARKETS IN TEXAS REPORT
permitted the Commission to participate more effectively in FERC proceedings affecting
Texasrsquo utilities located outside of ERCOT
1 Southwest Power Pool
The Southwest Power Pool (SPP) is the Regional Transmission Operator (RTO) for
areas of Northeast Texas and the Texas Panhandle In Texas the utilities Southwestern
Electric Power Company (SWEPCO) Southwestern Public Service (SPS) and several
electric cooperatives and municipally owned utilities are in SPP In addition to these areas
of Texas the SPP footprint includes parts of New Mexico Arkansas Missouri Nebraska
Louisiana and all of Kansas and Oklahoma In 2015 SPP became the RTO for the
Integrated System and neighboring areas which includes parts of Iowa Minnesota North
Dakota South Dakota Wyoming and Montana SPP has spent extensive time and
resources over the last two years to integrate these new areas successfully The expansion
added 5000 MW of peak demand 7600 MW of generating capacity and 9500 miles of
transmission lines17
In 2014 SPP launched its new Integrated Marketplace which provides a Day-
Ahead Market a Real-Time Balancing Market and Congestion Hedging Markets
mechanisms similar to those available in ERCOT The implementation of the Integrated
Marketplace resulted in a savings of $422 million in 2015 As a result of the Integrated
Marketplace SPPrsquos planning reserve margin will be reduced from 136 to 12 a change
expected to save about $90 million annually
Chairman Donna L Nelson represents the Commission as a voting member on
SPPrsquos Regional State Committee (RSC) The RSC provides collective state regulatory
agency input on a variety of issues In addition the RSC has authority over the cost
allocation methodologies for transmission upgrades allocation of Financial Transmission
Rights and the approach used for resource adequacy across the SPP region The RSC
regularly meets on a quarterly basis and meets more frequently if necessary
2 Midcontinent Independent System Operator
The Midcontinent Independent System Operator (MISO) is an RTO that serves all
or part of 15 states in the central US one Canadian province and the portion of eastern
Texas served by the vertically integrated utility Entergy Texas Inc MISO provides a Day
Two market which has a variety of functions and services including energy and ancillary
service markets economic dispatch congestion management financial transmission rights
and transmission planning The MISO Independent Market Monitor concluded that the
MISO wholesale markets were competitive in 2015
Like SPP MISO is in the Eastern Interconnection which crosses state boundaries
and is therefore subject to FERC jurisdiction A number of recent FERC proceedings have
17 2015 Southwest Power Pool Annual Report Available at
httpswwwspporgdocuments37800201520southwest20power20pool20annual20reportpdf
19 | P a g e
2017 SCOPE OF COMPETITION IN ELECTRIC MARKETS IN TEXAS REPORT
affected the portion of Texas that is in the MISO footprint The Commission through
outside counsel has been an active party in such FERC proceedings FERC Docket No
ER14-1174 addressed in part a dispute regarding the availability of transmission capacity
under the Joint Operating Agreement between MISO and the SPP Ultimately FERC
approved a settlement agreement under which MISO will compensate SPP and its members
for using their or other entitiesrsquo transmission systems
In a related pending docket at FERC Docket No ER14-1736 parties are addressing
how the cost of these payments will be allocated among MISO market participants Parties
in this proceeding are engaged in settlement discussions In addition in Docket No ER14-
75-000 FERC approved a settlement agreement among the participating Entergy
Operating Companies and their retail regulators to terminate the Entergy System
Agreement effective August 31 2016 The settlement terms prohibit any post-termination
payments that roughly equalize production costs among the operating companies after
December 31 2015 terminate certain specific cross-purchase power agreements between
Entergy Texas and former Entergy Gulf State Louisiana and permit the continuation of
several other purchase power agreements
Commissioner Kenneth W Anderson Jr represents the Commission as a voting
member in the Organization of MISO States (OMS) the purpose of which is to coordinate
regulatory oversight among the states in the MISO region and to make recommendations
to MISO FERC and other entities Commissioner Anderson also represents the
Commission as a voting member of the Entergy Regional State Committee (ERSC) which
has certain FERC-approved authority for five years after the Entergy integration with
regard to cost allocation for Entergy transmission projects and adding transmission projects
to the Entergy construction plan The ERSC meets quarterly
3 Western Electricity Coordinating Council
The Western Electricity Coordinating Council (WECC) is a Regional Entity whose
region includes the area surrounding El Paso and extends from Canada to Mexico
including the provinces of Alberta and British Columbia the northern portion of Baja
California and all or portions of the 14 Western states in between WECC is the Regional
Entity responsible for Bulk Electric System reliability in the Western Interconnection and
associated compliance monitoring and enforcement WECC does not have organized
markets outside of California but is organized into 38 separate balancing authorities
WECC is geographically the largest and most diverse of the eight Regional Entities in the
United States with delegated authority from the North American Electric Reliability
Corporation (NERC) and the Federal Energy Regulatory Commission In Texas El Paso
Electric Company is a member of WECC
Rulemaking Activities
The Commission has continued to adopt new rules and modify existing rules in
order to further the continued successful operation of the competitive retail and wholesale
markets and to comply with statutory changes made to PURA by the Legislature This
20 | P a g e
2017 SCOPE OF COMPETITION IN ELECTRIC MARKETS IN TEXAS REPORT
section of the Report provides a high-level overview of the Commissionrsquos key rulemaking
activities highlighting the market improvements made in 2015 and 2016
1 Cost Recovery and Rate Adjustment
The Commission adopted new rule 16 TAC sect25246 on June 29 2016 to
implement Section Nos 1 through 3 of House Bill 1535 of the 84th Legislature The new
rule only applies to a utility that operates solely outside of ERCOT and allows for the use
of an update period beyond the test year for which the utility initially files estimated
information The rule clarifies that all information originally estimated must be updated
with actual information and also provides requirements for a post-test-year adjustment for
a natural gas-fired plant A non-ERCOT utility also is required to initiate a new base rate
case on or before the four year anniversary of the final order in the utilityrsquos most recent comprehensive base rate case or if the commission determines that the utility has
materially earned more than its authorized rate of return in two consecutive years The rule
also provides requirements and procedures for the relation back of final rates to an effective
date 155 days after the filing of the rate application
2 Changes to Certificates of Convenience and Necessity and CREZ Rule
The Commission conducted a rulemaking to implement changes pursuant to
Legislative mandates in SB 776 SB 933 and HB 1535 of the 84th Legislature SB 776
required municipally owned utilities to apply for a certificate of convenience and necessity
(CCN) before constructing transmission facilities outside the boundaries of the
municipality that owns the municipally owned utility SB 933 also requires persons to
obtain a CCN before interconnecting a tie line into the ERCOT grid HB 1535 requires the
Commission to issue a final order within 181 days for a non-ERCOT utility requesting a
CCN for an existing electric generating facility and 366 days after a non-ERCOT utility
files a CCN for a newly constructed generating facility In addition the Commission also
determined in this rulemaking that all future transmission projects in a Competitive
Renewable Energy Zone (CREZ) must meet the need criteria of PURA sectsect 37056(c)(1)
and (2) rather than being exempt Finally the Commission determined that the CREZ
project established in 2008 was complete following the installation of a second circuit on
a Sharyland line
3 Use of Handheld Device for Enrollment
As the market evolves the Commission evaluates market changes balancing its
desire to encourage customer-focused innovation with its concern for customer protection
against potential abuses In Docket No 44518 the Commission granted a REP a
temporary 12-month waiver from its rules requiring the marketer to obtain telephonic
verification of the customerrsquos desire to switch REPs as well as a waiver from certain authorization disclosure requirements among other stipulations the Commission placed
upon the REP The Commission then opened Project No 45625 to study the issue of REPs
utilizing hand-held devices for customer enrollment more broadly and engage with market
representatives consumer representatives and other stakeholders The Commission
anticipates considering an amendment to its rules in the spring of 2017
21 | P a g e
2017 SCOPE OF COMPETITION IN ELECTRIC MARKETS IN TEXAS REPORT
4 Smart Meter Texas Portal
The electric utilities in Texas that have advanced metering systems (AMS) jointly
own and operate a single web portal known as Smart Meter Texas (SMT)18 SMT fulfills
two requirements imposed by the Commissionrsquos advanced metering rule on a utility with
AMS (1) provide to the retail customer the REP serving the customer and other entities
authorized by the customer access to such retail customerrsquos consumption data and (2)
allow devices at the customerrsquos premises to communicate through a home area network with the advanced meter at the premises SMT also facilitates near real-time on-demand
reads of a customerrsquos meter that aids prepaid service offered by certain REPs
In Project No 42786 Review of Advanced Metering System Web Portal
Commission staff and stakeholders examined options for the long-term operational
structure governance and funding of SMT The Commission determined that ownership
of SMT should remain with the TDUs because they can operate the portal at a lower cost
than transferring the data repository to ERCOT The Commission opened two
rulemakings one to ascertain the appropriate governance performance and funding of
SMT and a second to determine the appropriate access for third parties ensuring that
customers have the freedom to grant and give third parties access to their data if made
knowingly while also securing customer privacy
Sharyland Utilities
In early 2015 customers of Sharyland Utilities the smallest investor-owned
transmission and distribution utility in ERCOT began to file with the Commission a
significant number of complaints regarding high electricity bills In response the
Commission opened Project No 44592 Relating to a Project Regarding Sharyland
Utilities to provide for a more formal process for Commission review of the large number
of complaints As part of this project Commission staff prepared a report to evaluate the
electricity rates and electric bills in the operating area of Sharyland Utilities that was
previously part of Cap Rock Energy
Staffrsquos report found that a number of factors contributed to the comparatively high
bills for many of Sharyland-Cap Rockrsquos customers First Sharylandrsquos small size and its low customer density result in high TDU rates for all customers relative to other TDUs In
particular Staffrsquos report found that Sharyland-Cap Rockrsquos rates for distribution service are
up to three times higher than those of other TDUs in Texas In addition to Sharyland-Cap
Rockrsquos high costs for distribution service higher wholesale transmission costs also
contributed to the rate increases charged to Sharyland-Cap Rockrsquos customers These transmission costs are the result of increased transmission investment in recent years
throughout Texas that has increased transmission costs for all distribution providers
18 The participating Texas TDUs are AEP Texas Central Company and AEP Texas North Company (jointly
ldquoAEPrdquo) CenterPoint Energy Houston Electric LLC (ldquoCenterPointrdquo) Oncor Electric Delivery Company LLC (ldquoOncorrdquo) and Texas-New Mexico Power Company (TNMP) collectively referred to as the ldquoJoint TDUsrdquo Operation of an AMS web portal was addressed in the orders approving particular utilitiesrsquo deployment of AMS and approving surcharges for AMS cost recovery While Sharyland Utilities filed comments in the proceeding it did not
participate as it had not fully completed its AMS deployment at the time
22 | P a g e
2017 SCOPE OF COMPETITION IN ELECTRIC MARKETS IN TEXAS REPORT
including Sharyland Utilities Second the comparatively colder winter of 2014 ndash 2015
which was the time period generally consistent with the timeframe in which the
Commission began receiving complaints appeared to result in higher electricity usage than
normal This combination of high TDU rates and the higher electricity usage led to higher
bills for customers
Staffrsquos report also noted that in Sharyland-Cap Rockrsquos last rate case in 2014 the
approved rates reflected movement towards more cost-based rates for all customers
including some customers that previously had been heavily subsidized by other customers
Additionally in the process of standardizing Sharyland-Cap Rockrsquos customer classification
with the classifications of the other TDUs in Texas some customers may have experienced
a move from one class that previously was paying below-cost rates to another class that
was now paying above-cost rates For some of these customers the combined effects of
the movement towards cost-based rates and the change to a different class may have
contributed to a significant change in the customersrsquo rates Regardless of any cost-shifting
between customer classes Sharylandrsquos rates remain two to three times higher than those of other TDUs in Texas for all customers in all classes
On December 4 2015 the Commission signed an order directing Sharyland to file
an application for a comprehensive rate review by April 30 2016 Sharyland filed its rate
application on April 29 2016 in Docket No 45414 Review of the Rates of Sharyland
Utilities LP On October 10 2016 the Commission ordered Sharyland to file an amended
application as soon as practicable but no later than January 1 2017 to reflect the unique
aspects of the companyrsquos organizational structure as a real estate investment trust (REIT) At the time of publication Sharyland is expected to file its amended application in
December 2016
PowerToChoose Website
As part of its ongoing evaluation of the competitive market the Commission
opened Project No 45730 to evaluate the functionality and usability of its PowerToChoose
website which allows customers to select a REP and an electric plan based on their zip
code In the process the Commission received significant feedback from customers stating
that the Commissionrsquos PowerToChoose website was an important tool that plays a
fundamental role in their shopping process In response to the feedback received from
industry representatives and consumers Commission staff changed how the website sorts
and filters retail electric plans adding a filter to allow customers to unselect plans that
contain minimum usage fees or credits This filter is now a default setting and plans with
minimum usage fees and credits are not shown unless the customer actively selects to
search for such plans In addition Commission staff made other changes to increase the
clarity of the REP complaint rating The Commission continues to evaluate other changes
to improve the customer experience of the PowerToChoose website and provide
transparency for retail electric plans
23 | P a g e
2017 SCOPE OF COMPETITION IN ELECTRIC MARKETS IN TEXAS REPORT
Report on Alternative Ratemaking Mechanisms
In 2015 the Legislature enacted SB 774 which requires the Commission or its
consultant to conduct a study and make a report to the Legislature analyzing the alternative
ratemaking mechanisms adopted by other states In addition SB 774 extended the
authorization for the Periodic Rate Adjustment (PRA) mechanism from 2017 to 2019
which the Legislature had authorized in 2011 (SB 1693) as a version of an alternative
ratemaking mechanism that provides to utilities a means for expedited recovery of
distribution infrastructure costs Pursuant to SB 774 the Commission retained a consultant
to produce the report and the consultantrsquos recommendations included streamlining the ratemaking process to reduce procedural costs providing for a periodic review of the
prudency of the costs and using certain types of alternative ratemaking mechanisms that
decouple the recovery of costs from variations in load The Commission held a public
hearing to receive comments on the report from stakeholders and after consideration of
those comments has provided to the Legislature the consultantrsquos report together with its
own discussion of the report
Request for Purchase of Oncor Electric Delivery Company
In March 2016 the Commission approved with conditions an application by an
investor group led by Hunt Consolidated Inc the owners of Sharyland Utilities to acquire
control of Oncor Electric Delivery Company (Oncor) the largest transmission and
distribution utility in Texas from Oncorrsquos parent company Energy Future Holdings which
is in bankruptcy The Commission approved the request subject to certain conditions
including stipulations regarding the organization of the new entities and treatment of tax
benefits The investor-led group subsequently declined to pursue the transaction that was
approved by the Commission
In September 2016 NextEra Energy which owns Florida Power amp Light received
approval from the United States Bankruptcy Court in Delaware for its plan to purchase
Oncor In October 2016 NextEra Energy filed an application with the Commission in
Docket No 46238 for approval of the proposed transaction The Commission will evaluate
the application to determine if the transaction is in the public interest
Integration of Lubbock Power and Light
In March 2016 the Commission opened Project No 45633 to study and identify
the issues related to the request of Lubbock Power and Light the statersquos third-largest
municipally owned utility to be integrated into ERCOT The Commission is currently
working with stakeholders ERCOT and SPP to determine the cost and benefits of any
potential switch by Lubbock Power and Light into ERCOT and whether such a switch is
in the public interest
24 | P a g e
2017 SCOPE OF COMPETITION IN ELECTRIC MARKETS IN TEXAS REPORT
Desalination Project ERCOT Studies
In 2015 the Legislature passed HB 4097 which directed the Commission and
ERCOT to study whether existing transmission and distribution planning processes are
sufficient to provide adequate infrastructure for seawater desalination projects and to study
the potential for desalination projects to participate in demand response opportunities in
the ERCOT market Pursuant to that direction ERCOT staff have prepared a report on the
feasibility of interconnection of large desalination projects and on opportunities for such
projects to participate in ERCOTrsquos demand response programs which is attached to this Report in Appendix B
Oversight and Enforcement Actions
The Commissionrsquos enforcement of statutes rules and orders applicable to entities
under its jurisdiction serves to protect consumers the electric markets the reliability of the
electric grid and to promote fair competition The Commissionrsquos enforcement efforts in the electric industry focus on violations of PURA the Commissionrsquos rules and ERCOT
protocols
During the period from January 2015 through August 31 2016 the Commission
assessed $3258500 in penalties against electric market participants Table 8 provides a
summary of electric industry Notices of Violation since January 2015 During 2015 and
2016 Commission staff opened 212 investigations for the electric industry and closed 177
investigations
Table 8 Notices of Violations
Violation Type Total Penalty Amount
Retail Market Violations $539000
Service Quality Violations $451500
Wholesale Market Violations $2268000
TOTAL $3258500
In addition to the imposition of administrative penalties the Commission uses other
enforcement mechanisms in exercising its enforcement duties including revoking a
companyrsquos certificate to operate In addition some companies may be required to relinquish a certificate as part of a settlement after enforcement action has proceeded
Table 9 provides a breakdown of the number of certificates revoked or relinquished In
2016 the Commission revoked the certificate of the REP TruSmart Energy
Table 9 Certificates Revoked or Relinquished
Type Number
Certificates Revoked 1
Certificates Relinquished 0
25 | P a g e
2017 SCOPE OF COMPETITION IN ELECTRIC MARKETS IN TEXAS REPORT
The Oversight amp Enforcement division also issues warning letters to companies in
the electric market when it determines that a violation occurred but given the
circumstances surrounding the violation and other mitigating concerns no administrative
penalty is warranted During 2015 and 2016 the Oversight amp Enforcement division issued
50 warning letters Finally the Commission generally seeks to reimburse money directly
to customers when appropriate In 2015 and 2016 the Commission ordered the
reimbursement of $8543596 to Texas electric customers
Table 10 Warning Letters
Warning Letter Type Number
Retail Market Warning Letter 8
Service Quality Warning Letter 1
Wholesale Market Warning Letter 41
TOTAL 50
In addition to its enforcement activities the Commission also enters into voluntary
mitigation plans with generators that request one through a contested case proceeding
pursuant to PURA sect15023(f) and 16 TAC sect25504(e) The Commission entered into one
voluntary mitigation plan during 2015 and 2016 in Docket No 44635
Low-Income Discount System Benefit Fund
The System Benefit Fund (SBF) was originally established in 1999 to fund
discounts to low-income customers customer education activities energy-efficiency and
weatherization and electric market oversight through a nonbypassable surcharge on retail
electric bills HB 1101 of the 84th Legislature provided that the SBF be sunset on
September 1 2017 by which time the SBF is intended to be exhausted In the 2016 Fiscal
Year (FY) $325521250 was appropriated in the SBF to provide a 25ndash31 percent discount
to low-income customers over a 12-month period
To assist the drawdown of the remaining balance HB 1101 authorized the
Commission to use any unexpended SBF balance in FY 2017 to assist low-income
customers The Commission estimates that the remaining SBF balance will be
approximately $17 million by August 31 2017 The Commission has determined that this
amount is insufficient to fund the rate reduction program however the Commission will
spend approximately $100000 to continue automatic enrollment in the program to provide
REPs a list of customers eligible to receive late fee waiver and deposit installment benefits
These two ancillary benefits of the rate reduction program will continue for the duration of
FY 2017
26 | P a g e
2017 SCOPE OF COMPETITION IN ELECTRIC MARKETS IN TEXAS REPORT
Homeland Security
The Commission assesses the efforts of ERCOT and utilities to defend against
mitigate and respond to the variety of risks that the modern electricity system faces The
Commission also meets with ERCOT utilities and governmental entities on an ongoing
basis to discuss preparation for everything from hurricanes and other severe weather to
cyber-threats and threats of physical damage to the grid from accidents or intentional
malfeasance In addition the Commission monitors industry and federal programs that
address homeland security issues
The Commission serves as an information liaison between state government and
electric utilities during emergencies The Commissionrsquos main roles include
Conveying outage and service restoration information from electric utilities to
state government
Conveying service restoration priorities (hospitals water treatment facilities
etc) from state government to electric utilities and
Facilitating the clearance of downed power lines in disaster re-entry areas and
facilitating entry of electric utilities into disaster areas
The Commissionrsquos Emergency Management Response Team (EMRT) provided staff at the
State Operation Center for the May 2015 and April 2016 flooding events in Texas as well
as additional staffing for severe winter weather
Demand Response
ERCOT staff have begun to report annually on the participation of customers in
REP-sponsored demand response programs These programs which have been facilitated
by the deployment of smart meters throughout the competitive areas within ERCOT and
by many municipal and cooperative electric utilities take the form of rebates for reduction
in usage during peak period time-of-use pricing real-time volumetric price compensation
for load reduction and direct control of customer load among other plans
These programs have seen dramatic increases in participation since ERCOT began
to gather this information in 2013 From 2013 to 2014 the number of residential customers
participating in these programs increased from 151793 to 721273 and the number of
commercial and industrial customers participating rose from 30275 to 50205 The
Commission continues to monitor ERCOTrsquos stakeholder process for efforts relating to the integration of demand response
27 | P a g e
2017 SCOPE OF COMPETITION IN ELECTRIC MARKETS IN TEXAS REPORT
IV LEGISLATIVE RECOMMENDATIONS
A Determination of Low-Income Customer Eligibility
In 2015 HB 1101 required that all remaining funds in the System Benefit Fund
(SBF) be expended that the fee that funded the program as a nonbypassable surcharge on
electric bills be set at zero and that the SBF be sunset on September 1 2017 Per the
provisions of HB 1101 the SBF fee was set at zero in September 2016 concluding the
funding for the program The sunset of the SBF program also concluded the relationship
between the Texas Health and Human Services Commission (HHSC) and the Commission
in which the HHSC provided to the Commission eligible electric customers for the SBF
low-income discount Because of the termination of the relationship with HHSC with the
termination of the SBF the Commission will no longer be able to determine easily an
electric customerrsquos eligibility for other low-income programs such as late penalty waivers
and the option of paying an electric deposit over multiple months
The Legislature may wish to consider easing low-income customers access to these
low-income programs by facilitating the process used to determine eligibility The
Commission offers four possible approaches in which the Legislature could continue these
low-income programs
(1) Authorize HSSC to provide identification of eligible low-income customers to the
Commission
(2) Allow retail electric providers (REPs) to provide such low-income programs using
the Low Income Discount Administratorrsquos (LIDA) Telecommunications Lifeline
Service Program list to identify low-income customers
(3) Require REPs to offer such low-income programs with customers self-enrolling
and REPs verifying income eligibility or
(4) Allow REPs to voluntarily provide such low-income programs at their own
discretion
B Outside Counsel for Proceedings before Regional Transmission
Organizations
Regional Transmission Organizations (RTO) manage the power grid across wide
regions of the United States Most of Texas is inside the ERCOT region however there
are significant portions of East Texas and the Panhandle that are in the Midcontinent
Independent System Operator (MISO) and the Southwest Power Pool (SPP) Issues arise
in these other RTOs that have significant impact on Texas ratepayers such as how
transmission infrastructure costs will be shared These tend to be very lengthy and
complicated proceedings that require specialized legal and consulting services
28 | P a g e
2017 SCOPE OF COMPETITION IN ELECTRIC MARKETS IN TEXAS REPORT
PURA sect 394525 currently authorizes the Commission to use outside consultants
auditors engineers or attorneys to represent the Commission in proceedings before the
Federal Energy Regulatory Commission This provision has been an important tool for the
Commission to respond to complex matters in the federal arena to enable it to protect the
public interest in Texas The PUC recommends that the Legislature expand the language
in this statute to include the ability to hire outside assistance for proceedings before other
RTOs to provide those same protections to Texas ratepayers in those areas
C Repeal of Natural Gas and Renewable Energy Mandates
1 Natural Gas
PURA sect 399044 establishes natural gas as ldquothe preferential fuelrdquo in Texas for electricity generation and requires the Commission to adopt rules to establish a system of
natural gas energy trading credits The majority of all new non-renewable electricity
generation constructed since 2000 for Texas has used natural gas as a primary fuel and this
trend is expected to continue in the foreseeable future The thresholds used to trigger the
natural gas energy trading credit system in PURA sect 399044 have not been reached and
they are not expected to be reached in the foreseeable future
Because natural gas-fueled facilities have been the most commonly built new
generation in Texas for many years and are expected to continue to be there is no need to
establish incentives for natural gas generation The PUC recommends that the Legislature
consider repealing PURA sect 399044 because it is no longer necessary
2 Renewable Energy
PURA sect 39904 establishes goals for renewable energy Subsection (a) requires
the installation of 5880 megawatts of renewable energy by 2015 and Subsection (b)
establishes a renewable energy credits trading program to implement the requirement The
5880 megawatts mandates in Subsection (a) was met in 2008 While the Commission
believes the renewable energy trading credit program is needed for retail electric providers
to validate renewable energy marketing claims the Commission believes the 5880
megawatts mandate in Subsection (a) is no longer necessary
D Advisory Opinions
Many regulatory agencies in Texas have authority to issue informal guidance to the
persons they regulate particularly with respect to outlining whether a particular course of
conduct would in the agencyrsquos view be consistent with the laws and regulations that the agency administers19 The issuance of an advisory opinion can provide regulatory clarity
to a company before making investments or conducting operations the permissibility of
which may be unclear under state law The Legislature may want to consider granting the
19 In addition certain federal agencies such as the Federal Communications Commission
Internal Revenue Service Securities and Exchange Commission and Federal Election
Commission have authority to issue advisory opinions
29 | P a g e
2017 SCOPE OF COMPETITION IN ELECTRIC MARKETS IN TEXAS REPORT
Commission the authority to issue advisory opinions In the electric industry providing
clarification to a company concerning issues such as the purchase of assets or the
acquisition of another company could allow it to avoid expensive regulatory proceedings
without impairing the Commissionrsquos authority The following state agencies have statutory authority to issue advisory opinions
Texas Ethics Commission20
Texas Medical Board21
State Board of Dental Examiners22
Texas Board of Nursing23
Texas Board of Professional Engineers24
Texas Lottery Commission and25
Texas Securities Board26
E Administrative
Gross Receipts Assessment
PURA sect 16001 provides for a gross receipts assessment that is used to defray the
expenses incurred by the Commission to administer PURA An assessment of one sixth of
one percent is collected from public utilities electric cooperatives retail electric providers
and interexchange carriersrsquo gross receipts from consumers The funds from this assessment
are remitted to the general revenue fund but currently they have not been explicitly
dedicated to funding of the Commission In contrast similar assessments on water
utilities insurance companies and other regulated entities have traditionally been used to
explicitly fund the underlying regulatory programs at the respective agencies The
Commission is one of four Article VIII agencies that is not designated as self-funded
The Commission recommends that the Legislature designate the Commission as a
self-funded agency whereby the collected assessments would be explicitly dedicated to the
funding of the agency Implementing this recommendation would require the Public Utility
Commission to be included in the Appropriations Limited to Revenue Collections rider
located in the Special Provisions Relating to All Regulatory Agencies section of the
General Appropriations Act Designation as a self-leveling agency would require the
Commission to set the gross receipts assessment at a rate sufficient to generate revenue in
the amount of the agencyrsquos general revenue appropriation each fiscal year which would require a statutory change to PURA sect16001(b) Based upon the Commissionrsquos baseline budget request authorizing the PUCrsquos self-leveling designation would result in an overall
estimated tax reduction of $456 million per year or 774
20 Government Code sect 571091 21 Occupations Code sect 162107 22 Occupations Code sect 258157 23 Occupations Code sect 301607 24 Occupations Code sect 1001601 25 Occupations Code sect 2001059 26 Tex Rev Civ Stat Ann Arts 581-28-1 amp 581-35 7 Tex Admin Code 1012
30 | P a g e
2017 SCOPE OF COMPETITION IN ELECTRIC MARKETS IN TEXAS REPORT
V APPENDICES
31 | P a g e
2017 SCOPE OF COMPETITION IN ELECTRIC MARKETS IN TEXAS REPORT
Appendix A ndash Acronyms
AEP American Electric Power
AMS Advanced Metering System
CenterPoint CenterPoint Energy Houston Electric LLC
DG Distributed Generation
DRG Distributed Renewable Generation
ERCOT Electric Reliability Council of Texas
ERSC Entergy Regional State
ERS Emergency Response Service
ETI Entergy Texas Inc
IMM ERCOT Independent Market Monitor
kWh Kilowatt-hour
LMP Locational Marginal Pricing
LSP Large Service Provider
MISO Midwest Independent System Operator
MMBtu One million British Thermal Unit (BTU)
MW Megawatt
MWh Megawatt-hour
Nodal Texas Nodal Market Design
ORDC Operating Reserve Demand Curve
PGC Power Generation Company
POLR Provider of Last Resort
PURA Public Utility Regulatory Act
REP Retail Electric Provider
RSC Regional State Committee
RTO Regional Transmission Organization
SCED Security Constrained Economic Dispatch
Sharyland Sharyland Utilities LP
SBF System Benefit Fund
SPP Southwest Power Pool
TDU Transmission and Distribution Utility
TNMP Texas-New Mexico Power Company
32 | P a g e
2017 SCOPE OF COMPETITION IN ELECTRIC MARKETS IN TEXAS REPORT
Appendix B ndash ERCOT Desalination Report
This page intentionally left blank
33 | P a g e
ERCOT Public
Study on the Demand Response Potential for Seawater Desalination Projects
ERCOT November 18 2016
Study on the Demand Response Potential for Seawater Desalination Projects ERCOT Public
Executive Summary
In 2015 the 84th Texas Legislature enacted House Bill (HB) 4097 which included several provisions relating to seawater desalination projects including a requirement that the Public Utility Commission of Texas (PUC) and Electric Reliability Council of Texas (ERCOT) study the potential for seawater desalination projects to participate in existing demand response opportunities in ERCOT There are several demand response products in which demand-side resources (ie consumers of electricity) can participate These programs help to preserve system reliability and provide economic benefits to participating demand-side resources Seawater desalination is an energy-intensive process that removes salt and other minerals from salt water to produce fresh water for municipal consumption industrial use or irrigation Participation in demand response could help mitigate electricity costs for future seawater desalination projects in Texas and provide reliability benefits to the grid
There are two main demand response reliability-based services administered by ERCOT participation by demand-side resources in the Ancillary Services market and the Emergency Response Service (ERS) Within the Ancillary Services market the most common service provided by demand-side resources is Responsive Reserve Service (RRS) which requires resources to respond either instantaneously or within 10 minutes in response to unplanned system emergencies ERS is separate from ERCOTrsquos Ancillary Services market and allows demand-side resources and distributed generation to provide reliability services in the event of an energy emergency Resources can qualify for either the 10-minute or 30-minute response time ERS programs
There are several key considerations that will impact a demand-side resourcersquos ability to participate in different demand response opportunities response time recovery time predictability of electrical demand and flexibility of operations Considering these factors together it appears that seawater desalination plants could be designed to meet the requirements for participation in demand response Because the ability to meet the qualification requirements is dependent on the plant design demand response opportunities should be considered early in a projectrsquos development if participation is desirable
Whether project developers will choose to address these requirements will depend on the economic benefits of participation There may be additional costs to design seawater desalination plants to operate in the manner required in order to participate in demand response These include costs associated with additional plant design specifications need for excess capacity and storage to make up for lost production during demand response deployment operational costs resulting from interruptions to plant processes and potential financial penalties if demand response deployment results in failure to meet contract demands The interplay of the benefits of participation and these costs will determine whether it would be beneficial for a future seawater desalination plant to participate in demand response in ERCOT
To date participation of seawater desalination plants in demand response programs has been limited Because the process of seawater desalination is energy-intensive participation in demand response could help to reduce electricity costs while posing a relatively low risk to plant operations As stakeholders in Texas continue to plan for possible future droughts in the region and identify water management strategies consideration of demand response could play a role in mitigating some costs associated with seawater desalination and allow seawater desalination plants to assist with maintaining electric reliability in the region
copy 2016 ERCOT All rights reserved i
Study on the Demand Response Potential for Seawater Desalination Projects ERCOT Public
Table of Contents
1 Introduction 1
2 Seawater Desalination 2
21 Seawater Desalination Plant Operations 2
22 Seawater Desalination Plant Economics 3
3 Demand Response Opportunities in ERCOT 4
31 ERCOT-Dispatched Demand Response 4
311 Ancillary Services Markets 5
312 Emergency Response Service (ERS) 5
32 Non-ERCOT-Dispatched Demand Response 6
321 Four Coincident Peak (4CP) 6
322 LSE or DR Provider Contracted Price Response 6
323 Self-Directed Price Response 6
4 Demand Response Potential for Seawater Desalination 7
41 Operational Considerations for ERCOT-Dispatched Demand Response 7
42 Economic Considerations for ERCOT-Dispatched Demand Response 8
43 Considerations for Non-ERCOT-Dispatched Demand Response 9
5 Conclusion 11
copy 2016 ERCOT All rights reserved ii
Study on the Demand Response Potential for Seawater Desalination Projects ERCOT Public
1 Introduction
In 2015 the 84th Texas Legislature enacted House Bill (HB) 4097 which included several provisions relating to seawater desalination projects including a requirement that the Public Utility Commission of Texas (PUC) and Electric Reliability Council of Texas (ERCOT) study the potential for seawater desalination projects to participate in existing demand response opportunities in ERCOT ERCOT and the PUC initiated this study to fulfill that requirement and evaluated the operational and economic characteristics of seawater desalination plants in light of ERCOTrsquos primary demand response products1
ERCOT is the independent system operator (ISO) for the ERCOT Interconnection which encompasses approximately 90 of demand for electricity in Texas ERCOT is the independent organization established by the Texas Legislature to be responsible for the reliable planning and operation of the electric grid for the ERCOT Interconnection ERCOT also administers and maintains a forward-looking open market to provide affordable and reliable electricity to consumers in Texas In collaboration with market participants ERCOT has developed demand response products and services for customers that have the ability to reduce or modify electricity use in response to instructions or signals These programs help preserve system reliability and provide economic benefits to participating demand-side resources
The process of seawater desalination removes salt and other minerals from salt water to produce fresh water for consumption industrial processes or irrigation The drought-prone Texas climate coupled with projections for increasing water demand in the state has created interest in seawater desalination as a future water source The 2017 Texas State Water Plan includes seawater desalination as a future water management strategy for water users in the state However the seawater desalination process is energy intensive and electricity consumption can be a significant cost driver for these projects To the extent that these plants could participate in demand response it would help to defray these costs Thus there is a potential nexus between seawater desalination projects built in Texas to mitigate drought but which have large electricity requirements and ERCOT demand response opportunities which could help to reduce their electricity costs and provide reliability benefits
This study evaluates the demand response potential of seawater desalination plants based on their operational characteristics and economic drivers The report is organized as follows
Section 2 provides background on typical seawater desalination plant operations and economics
Section 3 describes the current demand response opportunities in ERCOT
Section 4 evaluates the characteristics of seawater desalination plants to determine their potential to participate in demand response opportunities in ERCOT and
Section 5 provides a summary of the conclusions of this study
1 In the course of developing this report ERCOT consulted with several desalination experts with experience with existing or planned seawater desalination plants in the US The technical experts consulted included Jorge Arroyo (Water Management Consultant) Andrew Chastain-Howley (Black amp Veatch) Jonathan Loveland (Black amp Veatch) Ron Parker (Black amp Veatch) John Wolfhope (Freese and Nichols) and Srinivas Veerapaneni (Black amp Veatch)
copy 2016 ERCOT All rights reserved 1
Study on the Demand Response Potential for Seawater Desalination Projects ERCOT Public
2 Seawater Desalination
There are two primary methods for seawater desalination distillation (also referred to as ldquothermalrdquo) and reverse osmosis Distillation uses heat to remove salts and minerals from seawater by boiling water at high pressures In contrast reverse osmosis technology forces saline water through a membrane to separate water from the salts and minerals While both distillation and reverse osmosis are energy intensive distillation requires thermal energy to heat the water and overall has a higher energy requirement whereas reverse osmosis requires primarily electrical energy and overall is less energy intensive ndash though still with significant electricity requirements
Globally most thermal desalination plants are located in the Middle East due to low energy prices in the region Plants located elsewhere including in the US typically use reverse osmosis technology2 There are two large existing seawater desalination plants in the US one in Carlsbad California providing water to the San Diego area and one in Gibsonton Florida providing water to the Tampa Bay area Both plants use reverse osmosis technology In addition there are several desalination projects currently in the planning stages or under development in Texas in the Corpus Christi area that would use reverse osmosis technology For that reason this report focuses on reverse osmosis technology in the evaluation of demand response potential of seawater desalination plants
While there are currently no existing seawater desalination plants in Texas there are several municipal and industrial brackish water desalination plants in the state According to the Texas Water Development Board (TWDB) there are 46 municipal brackish water desalination plants with capacities greater than 0025 million gallons per day (MGD) in Texas representing a total of 123 MGD of capacity3 The desalination of brackish water is typically less expensive compared to seawater due to the lower relative salinity of brackish water This study focuses exclusively on seawater desalination consistent with the requirements of HB 4097 but it should be noted that conclusions may also apply to brackish water desalination though at a different cost and scale
This section provides high-level information on the operations (Section 21) and economics (Section 22) of seawater desalination plants to inform the discussion of their demand response potential in Section 4
21 Seawater Desalination Plant Operations Seawater desalination plants typically range in capacity from less than 5 MGD up to 165 MGD For example the Carlsbad seawater desalination plant has a capacity of approximately 50 MGD and the plant in Tampa Bay has a capacity of approximately 25 MGD The associated electricity consumption ranges between 10 and 15 kWh1000 gallons produced depending on the salinity of the water being processed456 More saline water (eg seawater) requires larger amounts of electricity for desalination Thus a seawater desalination plant would have larger electricity consumption requirements compared to a similarly sized brackish water desalination plant
2 American Water ldquoInnovation Solutions within the Water Industry Desalinationrdquo Available at httpwwwamwatercomfilesInnovationsSolutionsWithinTheWaterIndustryDesalinationpdf 3 Texas Water Development Board ldquoDesalination Factsrdquo Available at httpswwwtwdbtexasgovinnovativewaterdesalfactsasp 4 American Membrane Technology Association April 2016 ldquoMembrane Desalination Power Usage Put in Perspectiverdquo Available at httpwwwamtaorgcomwp-contentuploads7_MembraneDesalinationPowerUsagePutInPerspectivepdf 5 Water Reuse Association November 2011 ldquoSeawater Desalination Power Consumptionrdquo Available at httpswatereuseorgwpshycontentuploads201510Power_consumption_white_paperpdf 6 Ghaffour N TM Missimer and G Amy January 2013 ldquoTechnical review and evaluation of the economics of water desalination Current and future challenges for better water supply sustainabilityrdquo Desalination 309 pp197-207 Available at httpswwwresearchgatenetpublication256693140_Technical_review_and_evaluation_of_the_economics_of_water_desalination_ Current_and_future_challenges_for_better_water_supply_sustainability
copy 2016 ERCOT All rights reserved 2
Study on the Demand Response Potential for Seawater Desalination Projects ERCOT Public
While the two existing seawater desalination plants in the US were co-located with power plants to ease compliance with regulations on water intake and discharge structures and reduce costs many other reverse osmosis desalination plants receive their electricity from the grid However plants may have on-site backup generation in case of a power outage This will vary depending on the size and design of the plant and other factors For example the Carlsbad plant in California does have diesel backup generation to power control systems and flushing systems in the case of a power outage The plant in Tampa Bay was not built with backup power due to potential storm surge risks from hurricanes and other storms The plant does use uninterruptible power supply (UPS) backup to power control systems during power outages
Reverse osmosis plants are typically designed with several ldquotrainsrdquo which consists of a high-pressure pump turbine and reverse osmosis membrane Desalination plants are turned on or off one train at a time in a highly controlled process The process of ramping up or down an individual train under normal operations typically takes one to two hours While plants can be designed to handle immediate shutdowns (ie in a power outage) re-starting a system after an interruption would take this amount of time In addition the saline water must be pretreated (ie filtered) before going through the reverse osmosis train and this can sometimes pose constraints on the flexibility of operations
Demand for water is the key factor driving the level of production at seawater desalination plants Typically the plant will have a contract or contracts with municipal or other water users to deliver desalinated water and is operated to meet that demand Alternatively if the plant is municipally owned it would similarly be operated to meet the level of water demand in conjunction with other available water sources If water demands are close to a plantrsquos full capacity the operatorrsquos flexibility to adjust its electricity consumption as part of demand response may be limited However this does mean that plant operations are fairly predictable on a day-to-day basis which is necessary for participation in demand response
The amount of flexibility in plant operations will also be impacted by the amount of water storage available For example if a plant has sufficient water storage on-site or storage within the customerrsquos distribution system it could provide flexibility for the plant to reduce its operations during peak hours when electricity prices are likely to be highest It would also mitigate the impacts of interruptions to production from demand response deployments
22 Seawater Desalination Plant Economics Seawater desalination is typically more expensive than other sources of water and a major driver of the overall cost is energy costs In 2016 the Carlsbad plant charged rates at between $2131 and $2367 per acre-foot78 This charge is intended to cover both the fixed costs of the plant and the variable costs to produce a unit volume of water Typically half to two thirds of the cost of providing desalinated seawater are accounted for by capital cost recovery with the remainder accounted for by operations and maintenance costs including electricity costs Electricity costs can account for 20shy25 of the total costs of seawater desalination with reverse osmosis technology9
Factors affecting the capital cost of a seawater desalination plant include plant size type of desalination process and pre-post-treatment technologies plant infrastructure (eg piping water storage backup power) and compliance with applicable regulations (eg regulations on intake structures brine byproduct disposal) A significant driver of operating and maintenance costs is membrane replacement Reverse osmosis membranes need to be replaced every few years and
7 Source San Diego County Water Authority ldquoSeawater Desalinationrdquo Available at httpwwwsdcwaorgseawater-desalination 8 Note that 1 acre-foot is approximately 325851 gallons 9 Based on technical input from Black amp Veatch
copy 2016 ERCOT All rights reserved 3
Study on the Demand Response Potential for Seawater Desalination Projects ERCOT Public
the rate at which they are replaced will depend on the salinity of the feedwater and how the plant is operated Treatment and disposal of the salty brine byproduct from desalination may also incur operating costs
Electricity costs will vary depending on a range of factors including the size of the plant type of desalination technology source of electricity and quality of the feedwater As previously noted more saline water requires higher amounts of electricity in desalination and thus the amount of electricity consumption is a key difference between brackish water and seawater desalination As a result electricity costs comprise a significant share of the costs of seawater desalination These costs could potentially be defrayed in part by participation in demand response initiatives
3 Demand Response Opportunities in ERCOT
Broadly speaking demand response can be broken down into two major categories dispatchable or non-dispatchable For purposes of this report we will define dispatchable as those demand response events that are initiated by ERCOT and non-dispatchable as an event not specifically initiated by ERCOT These non-dispatchable events may include decisions made by the end-use customer to alter its consumption pattern or may include contractual obligations with another entity such as the end-use customerrsquos retail electric provider (ldquoREPrdquo) to alter consumption patterns
ERCOTrsquos wholesale market is open to several types of dispatchable demand response which are deployed to maintain system reliability Demand-side resources providing Emergency Response Service (ERS) may offer based on either a 10 or 30-minute response time commonly referred to as the ldquoramp periodrdquo Alternatively demand-side resources may register and qualify as a Load Resource that can provide Reserves in the Ancillary Services market The most common service provided by demand-side resources is Responsive Reserve Service which requires an under-frequency relay that can instantaneously interrupt the load during certain system reliability events Some demand-side resources can also participate in other Ancillary Services as Controllable Load Resources that require sophisticated control systems that allow them to be deployed in a more incremental proportional manner
Non-dispatchable demand response in ERCOT can include a response to avoid transmission costs where rates are based on Four Coincident Peak Pricing (4CP) response to wholesale energy prices initiated by the customer or by a REP or other load-serving entity (ldquoLSErdquo) or utility-managed Load Management programs (LM)
The sections that follow provide a description of both ERCOT-dispatched (Section 31) and nonshyERCOT-dispatched (Section 32) demand response For a more detailed description of opportunities for demand-side resources to participate in demand response in ERCOT see ERCOTrsquos guide Load Participation in the ERCOT Nodal Market10
31 ERCOT-Dispatched Demand Response There are two main demand response reliability-based services administered by ERCOT participation by demand-side resources in the Ancillary Services market and participation in ERS These services are dispatched by ERCOT during system emergencies
10 Available at httpwwwercotcomcontentservicesprogramsloadLoad20Participation20in20the20ERCOT20Nodal20Market_302d oc
copy 2016 ERCOT All rights reserved 4
Study on the Demand Response Potential for Seawater Desalination Projects ERCOT Public
Demand-side resources with demand response capability that can meet a set of performance requirements can be qualified to provide Ancillary Services as Load Resources in the Ancillary Services Market The value of having a Load Resource available to reduce load is equal to the value of having a generator available to increase its generation at a generating plant The providers of operating reserves selected to provide Ancillary Services are eligible for capacity payments regardless of whether the Resource is actually deployed (or curtailed in the case of the Load Resource)
ERCOT holds auctions on a daily basis for each of the following Ancillary Services Regulation Up Regulation Down Responsive Reserve and Non-Spinning Reserve11 Table 1 describes the various Load Resource types and their qualification requirements and eligible services
Table 1 Load Resource Types and Ancillary Services
Service Load Resource Type a Qualification Responsive Reserves (le50 of total Reserve requirement)
Non Controllable Under-Frequency Relay and 10-minute ramp to manual dispatch instruction
Responsive Reserves
Controllable Primary Frequency Response and follow 5-minute dispatch instructions
Regulation-Up Regulation-Down
Controllable Primary Frequency Response and respond to Regulation deployments
Non-Spin Reserves Controllable Follow 5-minute dispatch instructions a A Controllable Load Resource is a Load Resource capable of controllably reducing or increasing consumption under dispatch control by ERCOT
Demand-side resources that agree to reduce load when directed by ERCOT and that meet other metering and operational requirements as specified in the ERCOT Protocols may participate in Ancillary Services market auctions As noted in Table 1 the type of Ancillary Service that a Load Resource may provide will depend upon the demand-side resourcersquos response time and metering system as well as other requirements described in the Protocols In the Responsive Reserve and Non-Spin Reserve markets the Load Resource will receive capacity payments regardless of whether or not the load was actually deployed but the load must be available for deployment at any time while providing the service
ERCOT procures ERS to maintain grid reliability during emergency conditions and reduce the likelihood of the need for rotating outages ERS participants may offer to provide demand response with either a 10-minute ramp period requirement (similar to Load Resources providing Responsive Reserve Service) or a 30-minute ramp period requirement ERS Resources do not have the same telemetry and under-frequency relay requirements as Load Resources
11 Regulation Up and Regulation Down service respond to signals from ERCOT every 4 seconds to respond to changes in system frequency full response has to be provided within 5 minutes Responsive reserves must provide their committed capacity either instantaneously in an under-frequency event (eg due to a generator outage) or in energy scarcity conditions within ten minutes following an instruction from ERCOT Non-spinning reserves must provide their committed capacity within 30 minutes based on economic dispatch instructions Non-spinning reserve is used as replacement reserve to replenish other ancillary services and during energy scarcity
copy 2016 ERCOT All rights reserved 5
Study on the Demand Response Potential for Seawater Desalination Projects ERCOT Public
ERS is procured through a request for proposal (RFP) process three times per year for four-month contract terms each of which is further split into smaller time periods based on business cycles and other factors Demand-side resources may choose to submit offers in all time periods or only in those that best fit their unique circumstances and may vary both the price and demand response capacity offers by time period
Payments for ERS are performed up to 80 days after each four month contract term has ended and are subject to downward revision based upon delivered demand response capacity and the demand-side resourcersquos availability during the contract term
32 Non-ERCOT-Dispatched Demand Response The options listed below are not dispatched by ERCOT but they either are controlled directly by a customer or are dispatchable by another entity such as a demand response provider (ldquoDR Providerrdquo) REP or a transmission and distribution utility
Many industrial customers are subject to transmission charges based upon a Four Coincident Peak (4CP) demand The 4CP demand is determined by averaging the consumerrsquos actual demand during the 15-minute settlement interval with the highest ERCOT demand during each of the four summer months (June through September) This measured 4CP demand serves as the basis for the customerrsquos transmission tariff charges for the following year By correctly predicting the ERCOT system peaks during the summer and curtailing load during those intervals a consumer can help reduce the stress imposed on the electric system during peak periods of consumption and reduce its transmission charges for the following calendar year
In the competitive areas of ERCOT consumers can contract with their REP or a DR Provider to have their load respond to the REPrsquos or DR Providerrsquos instructions The contract will usually outline the parameters of this response ndash at what times and frequency demand response events can be called ramp periods sustained response periods compensation etc Because this response is a contractual matter between the REP or DR Provider and the consumer a great deal of variety can be present in these arrangements For example a consumerrsquos response may be voluntary or required compensation could come in the form of reduced energy prices or rebate payments for each curtailment event consumers might be notified up to a day in advance or could have no notification at all (for automated curtailment)
In areas of ERCOT not open to competition interruptible tariffs may be available These tariffs will usually offer a reduced energy price for defined curtailment obligations
REPs may offer dynamic pricing options or consumers within a municipality or cooperative may have their energy prices determined by a published tariff which also may be structured based upon Time-of-Use (TOU) or have a Critical Peak Pricing (CPP) or Peak Time Rebate (PTR) component Self-directed price response refers to consumers making an independent decision to respond to energy prices contained in a governing tariff or in either the ERCOT Day Ahead or Real Time energy markets
TOU offerings will typically have higher energy prices during normal peak periods ndash for example a TOU tariff may charge one price during Monday through Friday from 2 pm through 8 pm and another price during all other times Customers may choose to reduce consumption during these high priced periods Load reduction can be accomplished by load shifting (loads can be shifted by
copy 2016 ERCOT All rights reserved 6
Study on the Demand Response Potential for Seawater Desalination Projects ERCOT Public
rescheduling certain processes or by utilizing thermal storage) ending certain processes that are no longer economic or through energy efficiency measures
Offerings that incorporate CPP usually have prescribed high prices only during certain defined periods ndash for example when load or prices are expected to reach a certain level Response to CPP may be similar to those employed under TOU tariffs especially if CPP is reached frequently More often CPP is infrequent and as such short-term load curtailment may be the more appropriate response to meet economic objectives
4 Demand Response Potential for Seawater Desalination
This section evaluates whether the operational characteristics and economics of seawater desalination plants would enable them to participate in one or more of the various demand response opportunities in the ERCOT Region To date participation of seawater desalination plants in demand response programs has been limited Neither the plant in Carlsbad nor the plant in Tampa Bay participate in demand response programs in California or Florida respectively However as will be described below it appears that these plants can be designed and operated to meet the requirements for participation in demand response and receive economic benefit from participation in these programs
Section 41 describes the operational parameters that must be met for a demand-side resource to provide ERCOT-dispatched demand response and evaluates the ability of seawater desalination plants to meet these criteria Section 42 discusses the tradeoffs between payments for participation in ERCOT-dispatched demand response and potential additional costs posed to seawater desalination plants Finally Section 43 presents other opportunities for seawater desalination plants to reduce their electricity costs outside of ERCOTrsquos reliability-based services that are open to demand response assets
41 Operational Considerations for ERCOT-Dispatched Demand Response There are several key operational parameters that impact a demand-side resourcersquos ability to participate in different demand response services response time recovery time predictability of electrical demand and flexibility of operations This section discusses each of these considerations as they apply to seawater desalination plants
As discussed in Section 31 one of the differentiating factors between ERCOTrsquos demand response products is the amount of time within which a demand-side resource must respond to a deployment instruction to reduce electricity consumption during an event Participation in RRS requires an automatic response within either half a second (ie instantaneous) based on grid frequency or within 10 minutes via a manual instruction ERS requires a response time of either 10 or 30 minutes As noted in Section 21 the typical time to take a reverse osmosis train on- or off-line is 1-2 hours under normal controlled operations To comply with the response time requirements of RRS or ERS a seawater desalination plant would need to be able to reduce its electricity consumption far more quickly than in normal operations This is an element of plant design that would need to be accounted for in the specifications of the project Considerations include the potential need for on-site backup generation including uninterruptible power supply potential impacts to plant infrastructure (eg piping) reverse osmosis membranes and pretreatment systems
The two large US desalination plants provide illustrative counterpoints in this respect The Carlsbad plant was designed to withstand instantaneous power interruptions and has on-site backup generation including uninterruptible power supply to provide the ability to power control systems and flush the membranes in the event of a power loss In contrast the Tampa Bay plant was not
copy 2016 ERCOT All rights reserved 7
Study on the Demand Response Potential for Seawater Desalination Projects ERCOT Public
designed with on-site backup generation and a loss of power would result in a plant shutdown and may require several days to bring the plant back on-line Thus it appears that it is technically possible for a seawater desalination plant to meet the response time requirements for participation in demand response so long as this factor is considered in the design of the facility
The time it takes a desalination train to return to operations after an event is also a consideration Demand-side resources participating in RRS must be able to come back on-line within three hours and those participating in ERS must return within 10 hours Again it appears that it is technically feasible for desalination plants to meet this requirement so long as this requirement is considered in the plant design
An additional consideration is the predictability of a demand-side resourcersquos electricity consumption Participation in the responsive reserves ancillary service market requires bidding in the day-ahead market and thus a demand-side resource must know with great accuracy (within 95) its electrical demand at least a day ahead of time For ERS auctions are held three times a year for four-month contract periods Thus to participate in ERS a resource must know its forecasted electrical demand several months in advance Because seawater desalination plant operations are driven by contracted demand for water it is likely that a plant operator would have a good idea of the plantrsquos electrical demand days or even weeksmonths in advance especially for summer months when demand is likely to be relatively steady An important consideration however is the salinity of the water which drives the electrical requirements and which can be impacted by recent weather events Similarly reductions in demand for water during non-summer months or wet summer days where demand may be reduced could also impact a plantrsquos ability to predict its electricity demand
Finally a seawater desalination plant must have sufficient flexibility in its day-to-day operations so that it can afford to lose several hours of production when deployed for demand response It should be noted that demand-side resources participating in RRS and ERS are called infrequently demand-side resources providing responsive reserves were deployed one time in 2015 and ERS was not deployed that year However this is an important factor to consider if a plant is operating at close to full capacity and would incur financial penalties if it fails to meet its contract obligations due to a demand response event Including additional storage and building a plant with extra capacity could help to mitigate this risk It should also be noted that a plant operator does not need to commit the full plant capacity to these services but rather can specify an amount of MW that will be committed Thus a plant operator could mitigate issues both with predictability and flexibility of plant operations by committing only a portion of its predicted electrical demand to participate in demand response
Considering these factors together it appears that seawater desalination plants could be designed to meet the operational requirements for participation in ERCOTrsquos demand response services (both RRS and ERS) Because the ability to meet the requirements is dependent on the plant design demand response would need to be considered early in a projectrsquos development if participation is desirable Whether project developers will choose to address these requirements will depend on the economic benefits of participation in demand response which will be discussed in the next section
42 Economic Considerations for ERCOT-Dispatched Demand Response This section describes the economic benefits to demand-side resources from participation in ERCOT-dispatched demand response programs The average price paid for a demand-side resource participating in RRS in 2015 was $1087 per MW per hour and for ERS was $645 per MW per hour for the contract periods during the 2015 program year These payments could provide a significant financial benefit to seawater desalination plants To give a simplified example for a plant with an electrical demand of 10 MW operating at a 100 annual load factor (10 MW times 24 hours times 365 days) the annual benefit would be on the order of $500000 for ERS or $1 million for RRS
copy 2016 ERCOT All rights reserved 8
Study on the Demand Response Potential for Seawater Desalination Projects ERCOT Public
In 2015 demand-side resources providing responsive reserves were deployed one time for a duration of 10 minutes and ERS was not deployed12 The most ERS was ever deployed in a single year was two times in 2011 Thus participation in either program could result in a substantial payment to a seawater desalination plant with a relatively low risk of deployment and associated disruption of plant operations although it is important to note that participation in either ERCOT service subjects demand response resources to annual unannounced testing Other than testing the frequency of deployment will depend on grid conditions and is a risk that should be considered
The financial benefits of participation must be weighed against the costs of designing facilities with the capabilities to operate in this manner These include
bull The costs to design the plant to reduce electrical demand within the required timeframes for demand response and to withstand an instantaneous interruption if not already part of the plant design For example a plant may need to be designed to have backup power generation on-site In addition there could also be costs to restart the system after an interruption
bull The costs to build a plant with excess capacity andor storage to make up for lost production hours when demand response is deployed This will add to the total capital costs of the project Land area constraints should also be considered when considering additional storage as the space requirements for the necessary storage capacity could be significant
bull Costs associated with the impact of interruptions on plant processes (eg more frequent replacement of membranes impacts to pretreatment system or plant infrastructure)
bull Potential financial penalties that would be incurred if deployment as part of demand response were to result in failure to meet contract obligations to supply water
bull The loss of potential benefits in the form of cost avoidance from participation in non-ERCOTshydispatched demand response opportunities (see Section 43) If a plant is committed to RRS or ERS the plant operator would lose the flexibility to take advantage of these other opportunities to reduce their electricity costs
The interplay of these benefits and costs will determine whether it would be beneficial for a future seawater desalination plant to participate in demand response in ERCOT
43 Considerations for Non-ERCOT-Dispatched Demand Response Outside of the reliability-based services administered by ERCOT there are other opportunities for seawater desalination plants to reduce their electricity costs As described in Section 321 seawater desalination plants may be able to reduce the demand charges on their electricity bills through curtailing load during 4CP intervals In addition plant operators may adjust operations in response to real-time electricity prices to take advantage of lower off-peak prices and avoid price spikes (see Sections 322 and 323) All of these opportunities require that the plant have flexibility to reduce production during certain times of the day
In the ERCOT region as noted above a portion of transmission and distribution charges are set based on the peak systemwide 15-minute interval of the four summer months (June through September) referred to as the four coincident peaks (4CP) Large customers can reduce or avoid this charge by reducing electrical consumption during these four peak intervals AEP Central Texas and CenterPoint are the transmission providers covering the majority of the Gulf Coast in Texas13
12 ERCOT June 2016 ldquoLoad Resource Deployment Updaterdquo Available at httpwwwercotcomcontentwcmkey_documents_lists870985_RRS_Load_Resource_Deployment_Updatepdf 13 It is also possible that a seawater desalination plant could be located in an area that as not opted in to competition in which case the plant owner would need to negotiate its electricity charges bilaterally with the Non Opt-In Entity (NOIE)
copy 2016 ERCOT All rights reserved 9
Study on the Demand Response Potential for Seawater Desalination Projects ERCOT Public
Assuming a future seawater desalination plant would be connected at transmission-level voltages the relevant 4CP charges based on the 2016 tariffs accounting for both transmission charges and transmission cost recovery factors would be $41425 per 4CP kW for AEP Central Texas and $41870 per 4CP kVA for CenterPoint14 If a seawater desalination plant has 10 MW of load and is capable of interrupting all of it and successfully does so for all four 4CP intervals the savings based on the 2016 tariffs would be approximately $500000 per year ($41425 times 1000 (kW to MW) times 10 MW times 12 months) Thus a seawater desalination plant that reduces its electricity use during the 4CP intervals could avert some or all of these charges
Another opportunity for seawater desalination plants to reduce their electricity costs is through adjusting operations in response to real-time electricity prices In 2015 the average electricity price in ERCOT was $2677MWh However prices exceeded $50MWh in 254 hours (3 of all hours) $100MWh in 88 hours (1) $200MWh in 40 hours (05) and $300MWh in 21 hours (02) Prices exceeded $3000MWh for 021 hours15 Depending on the desalination plantrsquos exposure to real-time wholesale market prices (via its retail contract) the degree of high prices the plant owner is willing to avoid and grid conditions in a given year reducing unit operations in order to avoid high electricity prices could impact operators for anywhere between a few and several hundred hours out of the year In addition a plant can plan its operations to take advantage of lower electricity prices during off-peak periods (eg at night when generation from wind is high) For example at least one company is marketing a modular desalination unit design intended to take advantage of low prices during periods of high renewables generation and to provide grid reliability services through demand response16
There are several factors to consider regarding these opportunities to reduce electricity costs The plant would need to monitor the ERCOT market or hire a contractor to do so in order to know when to reduce demand for electricity These programs do not impose any requirements on response time as with RRS or ERS and there may be sufficient warning of 4CP intervals or peak pricing to allow the plant operator to plan its operations earlier in the day with sufficient time to ramp down production under controlled conditions However quicker ramping capability may be desirable to respond to electricity price fluctuations
For 4CP because the four intervals used to set demand charges are not known ahead of time it is likely that the plant would need to reduce its demand multiple times per summer to ensure the 4CP intervals are hit impacting production at the facility Timing operations to coincide with off-peak pricing or to avoid price spikes would similarly result in reduced operations during certain hours To offset the lost production hours the plant may need to be designed with extra capacity and water storage capability to maintain the ability to meet its contractual obligations for freshwater delivery Because the period of reduced operations is greater than with ERCOT-dispatched demand response services this need would be greater for a seawater desalination plant reducing load during 4CP intervals or in response to real-time electricity prices and would increase the capital costs of the project It should also be noted that high prices in the ERCOT Region typically but not always occur in summer months when drought conditions are more likely to develop and demand for desalinated water is likely to be highest This may limit the flexibility of the plant to time its electricity consumption to avoid high-priced hours
14 Public Utility Commission of Texas ldquoTransmission and Distribution Rates for Investor Owned Utilitiesrdquo Available at httpwwwpuctexasgovindustryelectricratestdraspx 15 Potomac Economics June 2016 2015 State of the Market Report for the ERCOT Wholesale Electricity Markets Available at httpswwwpotomaceconomicscomindexphpmarkets_monitoredERCOT 16 Sisyan LLC ldquoDemand Response Desalinationrdquo Available at httprenewabledesalinationcomwpshycontentuploads201506Demand-Response-Desalinationpdf
copy 2016 ERCOT All rights reserved 10
Study on the Demand Response Potential for Seawater Desalination Projects ERCOT Public
In addition the plantrsquos ability to participate in demand response would also be limited for those hours it is reducing load as part of 4CP response or in response to real-time prices because the plant would not be able to reduce its electricity consumption if that demand is already committed to another demand response service Thus participating in demand response versus taking advantage of these other opportunities may be to some extent mutually exclusive
5 Conclusion
Based on this analysis it appears that the operational characteristics of seawater desalination plants would allow them to participate in demand response opportunities in ERCOT so long as the necessary operational requirements are considered in the design specifications of the plant Project developers should consider the necessary requirements early in the plant design Whether the economic benefits of participation would provide a sufficient incentive for them to do so will depend on the costs of accommodating those operational requirements and whether there is the flexibility available to operate the plant as necessary under these programs Though most existing seawater desalination plants do not participate in demand response programs it does appear that participation by these plants is possible and could result in a financial benefit Table 2 compares the different demand response opportunities available to demand-side resources in ERCOT
Table 2 Comparison of Demand Response Opportunities Demand Response
Opportunity Requirements for
Participation Impacts to Plant
Operations Financial Benefit Ancillary Services ndash Responsive Reserve Service (RRS)
bull Under-Frequency Relay bull Instantaneous or 10 minute
response time bull Recover load within 3
hours bull Bid in day-ahead market
bull Deployed once in 2015 for 10 minutes bull Subject to annual
unannounced testing
bull $1087 per MW per hour (based on 2015 prices)
Emergency Response Service (ERS)
bull 10 or 30 minute response time bull Recover load within 10
hours bull Four-month contract term
bull Not deployed in 2015 the most times ever deployed in a single year was twice in 2011 bull Subject to annual
unannounced testing
bull $645 per MW per hour (based on 2015 prices)
Four Coincident bull Interval Data Recorder bull Likely plant will need to bull Avoid ~$48000 per 4CP Peak (4CP) (IDR) meter
bull Ability to predict system-wide peak demand hours during summer months
reduce load multiple times per summer to hit 4CP intervals bull Likely to be able to predict
possible 4CP intervals earlier in day
MW per year (based on 2016 tariffs) if successful in reducing during all four summer months
LSE or DR Provider Contracted Price Response
bull Varies based on contractual arrangements
bull Varies based on contractual arrangements
bull Varies based on contractual arrangements
Self-Directed Price bull Retail contract with bull Varies depending on bull Varies depending on Response exposure to real-time
market prices bull Ability to monitor real-time
prices in ERCOT wholesale market
number and severity of pricing events bull May be able to predict
peak pricing events earlier in day
number and severity of pricing events
copy 2016 ERCOT All rights reserved 11
Study on the Demand Response Potential for Seawater Desalination Projects ERCOT Public
Demand response programs in ERCOT provide opportunities for demand-side resources to defray their electricity costs and provide reliability benefits to the ERCOT electric grid Because the process of seawater desalination is energy intensive participation in demand response could help to reduce electricity costs while posing a relatively low risk to plant operations if demand response participation is factored into plant design
Participation in non-ERCOT-dispatched demand response opportunities such as reducing load during 4CP intervals or in response to real-time electricity prices may also help to reduce electricity costs for seawater desalination plants in Texas As stakeholders in Texas continue to plan for possible future droughts in the region and identify water management strategies consideration of demand response could play a role in mitigating some costs associated with seawater desalination and allow seawater desalination plants to assist with maintaining electric reliability in the region
copy 2016 ERCOT All rights reserved 12
2017 SCOPE OF COMPETITION IN ELECTRIC MARKETS IN TEXAS REPORT
List of Appendices
APPENDIX A ndash ACRONYMS32 APPENDIX B ndash ERCOT DESALINATION REPORT 33
iii | P a g e
2017 SCOPE OF COMPETITION IN ELECTRIC MARKETS IN TEXAS REPORT
List of Tables
TABLE 1 NUMBER OF REPS AND PRODUCTS SERVING RESIDENTIAL CUSTOMERS SEPTEMBER 20163 TABLE 2 INFLATION-ADJUSTED COMPARISON OF RESIDENTIAL REGULATED AND COMPETITIVE RATES4 TABLE 3 CURRENT LOWEST AND AVERAGE RESIDENTIAL PLANS BY TDU SERVICE TERRITORY5 TABLE 4 2015 VERIFIED ENERGY EFFICIENCY SAVINGS 8 TABLE 5 WEBSITE STATISTICS SEPTEMBER 2015 ndash AUGUST 2016 9 TABLE 6 ERCOT PEAK DEMAND 2012 ndash 201613 TABLE 7 MAY 2016 CAPACITY DEMAND AND RESERVES REPORT FORECAST17 TABLE 8 NOTICES OF VIOLATIONS 25 TABLE 9 CERTIFICATES REVOKED OR RELINQUISHED 25 TABLE 10 WARNING LETTERS26
iv | P a g e
2017 SCOPE OF COMPETITION IN ELECTRIC MARKETS IN TEXAS REPORT
List of Figures
FIGURE 1 PERCENTAGE OF OBSERVABLE SWITCHING BY CUSTOMER CLASS 3
FIGURE 4 MONTHLY AVERAGE NATURAL GAS PRICES SEPTEMBER 2014 ndash AUGUST 201611 FIGURE 5 LOAD-WEIGHTED AVERAGE REAL-TIME MONTHLY SETTLEMENT POINT PRICES SEPTEMBER
FIGURE 2 TOTAL ELECTRIC COMPLAINTS RECEIVED SEPTEMBER 2014 ndash AUGUST 2016 6 FIGURE 3 ELECTRIC COMPLAINTS RECEIVED BY CATEGORY SEPTEMBER 2014 ndash AUGUST 2016 7
2014 ndash AUGUST 2016 12 FIGURE 6 HIGH LOAD HOURS IN ERCOT 2011 ndash 2016 13 FIGURE 7 MONTHLY PEAK DEMAND IN ERCOT JANUARY 2014 ndash AUGUST 201614 FIGURE 8 ENERGY USE IN ERCOT BY RESOURCE TYPE 201515
v | P a g e
2017 SCOPE OF COMPETITION IN ELECTRIC MARKETS IN TEXAS REPORT
I EXECUTIVE SUMMARY
This year marks 15 years since the opening of the Texas retail electric market in
2002 brought about by the passage of Senate Bill 7 by the Texas Legislature which began
the project of restructuring the Texas electricity market In the 15 years since the market
opening the Public Utility Commission of Texas (Commission) has overseen the
transformation of the Texas electric landscape from one of incumbent utilities to a thriving
electric market in the Electric Reliability Council of Texas (ERCOT) region This Scope
of Competition in Electric Markets Report will provide a review of the activities the
Commission has undertaken during the last two years to continue to foster market
competition improve the customer experience and promote infrastructure to deliver
electricity to power the lives of Texans
Under the Commissionrsquos oversight the Texas retail market remains the national leader in competitive residential commercial and industrial offerings with the highest
number of competitors and product variety in the country As of March 2016 in the portion
of the state that is open to customer choice 92 of all customers had exercised their ability
to switch providers
On average residential retail rates in the competitive areas of Texas have declined
since 2014 to prices as low as 45 cents per kilowatt-hour (kWh) compared to a nationwide
average of 1345 cents per kWh in 2016 In addition wholesale market prices in Texas
have fallen 21 since 2013
Alongside the Commissionrsquos work refining the retail market the Commission has
also focused on continuing to enhance the customer experience by adapting to
technological changes as well as evaluating market mechanisms to ensure that the
wholesale market is as efficient and reliable as possible To further its objective of reliable
affordable and efficient power for Texas industry and residents the Commission has
several ongoing projects focused on promoting efficient and sustainable outcomes in the
wholesale market
On August 11 2016 the ERCOT region broke the previous all-time record for peak
demand with customers across the region using 71093 Megawatts (MW) of electricity in
part because of hot weather across the state Power generation was sufficient to meet this
record level of demand
This Report summarizes the continuing trends affecting competition in the electric
industry It highlights the effects of competition on rates customer protection and
complaint issues oversight and enforcement action and other noteworthy Commission
activities This Report concludes with suggestions for the Legislaturersquos consideration that
may facilitate continued efficiency and promote the Commissionrsquos objective of providing high quality service to Texans
1 | P a g e
2017 SCOPE OF COMPETITION IN ELECTRIC MARKETS IN TEXAS REPORT
II STATE OF THE COMPETITIVE MARKET
Overview
In the 15 years since the implementation of customer choice in Texas customers
continue to enjoy the benefits of a competitive market a plethora of retail electric providers
offering innovative products designed to meet the needs of residential commercial and
industrial customers The diversity of retail electric providers and products has created a
robust competitive market that continues to provide Texas customers with low electricity
prices With Senate Bill 7 the Texas Legislature put in place a foundation for a restructured
electric market that continues to set the standard across this nation Because of SB 7
Texas remains the national leader in competitive electric markets The Commission will
continue to oversee the competitive electric market in Texas to ensure that it stays true to
the foundation created by SB 7 and that it provides Texans with the reliable competitively
priced electricity they have come to expect
Retail Market Development and Prices
1 Customer Choice
The Commission has continued to guide improvements of the Texas competitive
retail electric market in which customers are able to choose which electric rates and
services best suit their needs from Retail Electric Providers (REPs) which sell electricity
to the end-use customer The number and diversity of REPs competing for customers
provides an indicator of the health of the retail market Since the publication of the 2015
Scope of Competition in Electric Markets Report the number of REPs and competitive
offers in ERCOT has remained stable As of September 2016 109 REPs were operating
in ERCOT providing 440 total unique products 97 of which solely support electricity
generated from 100 renewable sources1
Because of the number of providers and plans available from which customers can
choose Texas continues to be recognized as the most successful competitive retail market
in North America as demonstrated by its first-place rank for the past eight years in the
Annual Baseline Assessment of Choice in Canada and the United States a scorecard that
compares the retail competitiveness of electric markets in the US states and Canadian
provinces2
The number of REPs serving residential customers and the associated number of
product offerings by transmission and distribution utility (TDU) in the ERCOT grid are
shown in Table 1
1 Public Utility Commission wwwpowertochooseorg
2 Annual Baseline Assessment of Choice in Canada and the United States Distributed Energy
Financial Group July 2015 Available at httpwwwcompetecoalitioncomfilesABACCUS-2015-vfpdf
2 | P a g e
2017 SCOPE OF COMPETITION IN ELECTRIC MARKETS IN TEXAS REPORT
Table 1 Number of REPs and Products Serving Residential Customers September 2016
TDU Service Territory3 Residential
Suppliers
Number of
Products
AEP Central 52 355
AEP North 49 295
CenterPoint 55 400
Oncor 55 390
Sharyland ndash McAllen 14 103
Sharyland Utilities 22 155
TNMP 49 320
2 Retail Prices
Together the REPs in the competitive market serve 6153293 residential
customers 1053032 commercial customers and 4336 industrial customers4 In this
highly competitive retail market 92 of all customers have exercised their ability to switch
REPs since the market opening in 2002 Figure 1 depicts the percentage of customers in
each customer class who have switched REPs at least once since 2002
Figure 1 Percentage of Observable Switching by Customer Class5
3 American Electric Power ndash Texas Central Company (ldquoAEP Centralrdquo) American Electric Power ndash Texas North Company (ldquoAEP Northrdquo) CenterPoint Energy (ldquoCenterPointrdquo) Oncor Electric Delivery Company (ldquoOncorrdquo) Sharyland Utilities (ldquoSharyland ndash McAllenrdquo serves McAllen Texas and ldquoSharyland Utilitiesrdquo serves Stanton Brady and Colorado City) and Texas-New Mexico Power (ldquoTNMPrdquo)
4 ERCOT Provider of Last Resort Counts March 31 2016 Available at
httpwwwercotcomcontentwcmkey_documents_lists89277POLR_Counts_Energy_2016_Reportingx
lsx
5 ERCOT Supplemental Information - Retail Electric Market April 2015ndashMarch 2016 Available
at
httpercotcomcontentwcmkey_documents_lists89277Observed_Selection_of_Electric_Providers_Mar
ch_2016pptpptx
3 | P a g e
2017 SCOPE OF COMPETITION IN ELECTRIC MARKETS IN TEXAS REPORT
The success of the competitive market is highlighted in Table 2 which compares
the last regulated retail rate with the current lowest 12-month fixed retail offering per 1000
kWh in each region adjusted for inflation Since 2001 average retail rates across Texas
have decreased 63 percent
Table 2 Inflation-Adjusted Comparison of Residential Regulated and Competitive Rates
TDU Service
Territory6
Last Regulated
Rate (2001)
centkWh7
Last Regulated
Rate Adjusted for
Inflation
Current
Lowest Fixed
Price8
Percentage
Change
AEP Central 96 131 56 ndash5725
AEP North 100 136 50 ndash6324
CenterPoint 104 141 54 ndash617
Oncor 97 132 45 ndash6591
TNMP 106 144 50 ndash6528
The average lowest available residential price across the competitive market was
51 cents per kilowatt-hour (kWh) in September 2016 and the average across all plans
available in the competitive market in Texas was 98 cents per kWh 9 Moreover rates in
ERCOT have not only decreased since Texasrsquo transition to the competitive market but both fixed and variable rates have continued to be much lower than nationwide averages
of 1345 cents per kWh in July 2016 and 1362 cents per kWh in July 201510
Table 3 compares the current lowest fixed price available for residential service in
each TDU service territory with the average price of plans available and the nationwide
average excluding Texas
6 Sharyland Utilities was formed shortly before the market opening to serve part of McAllen
Texas it is not included in this table because of its limited number of customers at that time In Docket No
21591 Sharyland Utilities committed that its average bundled residential rates would not exceed those of
Central Power amp Light Company (now AEP Central)
7 Association of Electric Companies of Texas Available at httpwwwaectnetinside-the-charts-
prices-available-in-the-competitive-market-today-well-below-the-last-regulated-rate
8 The current lowest fixed price available for a residential plan in each TDU service territory as of
September 2016 for a 12-month plan without time-of-use features prepaid features or a minimum usage
fee for a fixed month-to-month rate for a customer who expects to consume approximately 1000 kWh of
electricity a month Available at wwwpowertochooseorg
9 This average is for a residential customer expecting to consume approximately 1000 kWh of
electricity each month Available at wwwpowertochooseorg
10 The nationwide average is for July 2016 and includes all US states except Texas Source US
Energy Information Administration Average Retail Price of Electricity Electricity Data Browser July
2016 Available at httpwwweiagovelectricitydatacfm
4 | P a g e
2017 SCOPE OF COMPETITION IN ELECTRIC MARKETS IN TEXAS REPORT
Table 3 Current Lowest and Average Residential Plans by TDU Service Territory
TDU Service
Territory
Current Lowest
Fixed Price
(centkWh)11
Current Average
All Available
Plans12
Nationwide
Average13
AEP Central 56 94
1345
AEP North 50 94
CenterPoint 54 91
Oncor 45 83
Sharyland ndash McAllen 56 98
Sharyland Utilities 45 133
TNMP 50 92
3 Customer Complaints
The Commissionrsquos rules permit a customer to file a complaint with the Commission
about their electric service The Commissionrsquos staff works with the customer and electric service provider to resolve the complaints first in an informal complaint process and then
directs the customer to a formal complaint process if the customer is dissatisfied with the
resolution The Commission keeps records of these complaints and evaluates the
complaint statistics as a barometer for analyzing company behavior and its effect on
customers The Commission uses the data to identify any company-specific trends work
with companies to address any issues or otherwise take enforcement action
From September 1 2014 to August 31 2016 the average number of days to resolve
a utility complaint was 18 days The slight decline in the number of electric complaints
received in 2015 through 2016 may be attributed to the mild winter weather which resulted
in lower overall prices as well as the absence of significant disruptions to electric service
Figure 2 shows the total complaints received from September 1 2014 to August 31 2016
11 The current lowest fixed price available for a residential plan in each TDU service territory as of
September 2016 for a 12-month plan without time-of-use features prepaid features or a minimum usage
fee for a fixed month-to-month rate for a customer who expects to consume approximately 1000 kWh of
electricity a month Source wwwpowertochooseorg
12 The average is for a residential customer expecting to consume approximately 1000 kWh of
electricity a month Source wwwpowertochooseorg
13 The nationwide average is for July 2016 and includes all US states except Texas Source US
Energy Information Administration Average Retail Price of Electricity Electricity Data Browser July
2016 Available at httpwwweiagovelectricitydatacfm
5 | P a g e
2017 SCOPE OF COMPETITION IN ELECTRIC MARKETS IN TEXAS REPORT
Figure 2 Total Electric Complaints Received September 2014 ndash August 2016
From September 1 2014 to August 31 2016 the Commission received 4465
electric complaints Billing complaints continue to be the greatest cause of customer
complaints with 42 of all electric complaints concerning billing issues Complaints
relating to the provision of service including customer service and the refusal of service
were the second highest cause of complaints at 15 Quality of service contributed to the
third-leading cause of complaints at 12 Complaints are broken down by category in
Figure 3
6 | P a g e
2017 SCOPE OF COMPETITION IN ELECTRIC MARKETS IN TEXAS REPORT
Figure 3 Electric Complaints Received by Category September 2014 ndash August 2016 14
4 Energy-Efficiency Programs
Energy-efficiency programs in Texas are administered by the TDUs in ERCOT and
the vertically integrated utilities outside of ERCOT pursuant to the Public Utility
Regulatory Act (PURA) sect39905 The utilities recover the cost of the energy-efficiency
programs through a surcharge on electric bills which are adjusted and approved annually
by the Commission Under the energy-efficiency programs TDUs reduced 559369 MWh
of electricity consumption in 2015 exceeding the goal for the year by 40 The energy-
efficiency programs are designed to reduce customersrsquo energy consumption as well as
electric peak demand In 2011 SB 1125 increased the peak demand goal reduction to a
30 growth in demand Once a utility reaches this goal the utility must achieve a
reduction of four-tenths of one percent of the utilityrsquos summer weather-adjusted peak
demand in subsequent years
The 2011 legislation also required that the Commission develop an evaluation
measurement and verification (EMampV) framework to promote effective program design
to provide consistent and streamlined reporting and to retain a third-party contractor to
conduct these activities EMampV efforts for the 2015 program year focused on evaluating
targeted programs for which the associated peak demand and energy savings were most
uncertain A primary component of EMampV is the statewide Technical Reference Manual
(TRM) a single common reference document prepared and maintained by the EMampV
contractor to estimate energy and peak demand savings resulting from the installation of
14 ldquoCrammingrdquo is the practice of adding unauthorized charges for any services to an electric bill without verified consent by the customer ldquoSlammingrdquo is the practice of switching the customer to another provider without authorization
7 | P a g e
2017 SCOPE OF COMPETITION IN ELECTRIC MARKETS IN TEXAS REPORT
energy efficiency measures sponsored by utility-administered programs in Texas In 2015
changes made to the TRM added and updated existing deemed savings values and added
standardized EMampV protocols for determining and verifying energy and demand savings
effective for the 2016 program year Verified demand and energy savings and program
costs for 2015 are shown in Table 4
Table 4 2015 Verified Energy Efficiency Savings15
MW MWh MW MWh
El Paso Electric 1231 22283 1116 19552 $4039278
Entergy Texas 1809 39688 1550 27156 $7023009
SPS 817 14537 549 9627 $3190744
SWEPCO 988 15262 560 9811 $3220359
Non-ERCOT Total 4844 91770 3775 66146 $17473390
AEP Central 4378 68482 1293 22653 $13261480
AEP North 454 12289 426 7464 $2727260
CenterPoint 16849 188255 5883 103069 $35832993
Oncor 11581 178908 6940 121589 $47438836
Sharyland 060 2528 100 1752 $633252
TNMP 866 17452 5770 10109 $4011627
ERCOT Total 34188 467915 15219 266636 $103905448
Grand Total 39033 559685 18994 332782 $121378838
Excludes Statewide EMampV contractor expenses of approximately $3M for review of prior program year
GoalProgram CostUtility
Verified Savings
In 2015 the utilities cumulatively achieved 206 of the demand reduction goal
(226 for utilities in ERCOT) and 168 of the energy reduction goal (175 for utilities
in ERCOT)
5 Customer Education Activities
The Commission engages with residential and small commercial electric customers
about retail electric competition through its ldquoTexas Electric Choicerdquo campaign and also informs customers about energy conservation opportunities through its ldquoPower to Save Texasrdquo campaign In addition to engaging with customers through these two campaigns
Commission staff also respond to customer inquiries and distribute literature about
electricity facts and issues
15 The non-ERCOT utilities within the state of Texas are El Paso Electric Company (ldquoEl Paso Electricrdquo) Entergy Texas Inc (ldquoEntergy Texasrdquo) Southwestern Public Service Company (ldquoSPSrdquo) and Southwestern Electric Power Company (ldquoSWEPCOrdquo)
8 | P a g e
2017 SCOPE OF COMPETITION IN ELECTRIC MARKETS IN TEXAS REPORT
a ldquoPower to Chooserdquo
The Commission educates customers about the evolving marketplace continuing
its ldquoTexas Electric Choicerdquo campaign which began in February 2001 with the goal of educating Texans about the changes and choices in the retail electric market The
PowerToChooseorg website and its Spanish-language counterpart PoderDeEscogerorg
provides a simple one-stop shop portal for Texans who live in a service territory open to
customer choice to enter in their zip code and browse through the numerous plans offered
by the REPs
b ldquoPower to Save Texasrdquo
In addition to the ldquoTexas Electric Choicerdquo campaign and the PowerToChoose website the Commission has also continued its statewide initiative ldquoPower to Save
Texasrdquo together with its parallel Spanish-language initiative ldquoPoder de Ahorrarrdquo which educates Texans about conserving energy during the summer peak times of 3 pm to 7
pm when the demand for electricity tends to be the highest The PowerToSaveTexasorg
website and its Spanish-language counterpart PoderDeAhorrarTexasorg provide Texans
with energy saving tips for homes and businesses
As part of the Power to Save Texas campaign the Commission contracted with
Resource Action Programs (RAP) to develop and implement a middle school energy
conservation outreach program in Hidalgo Harris Dallas and Tarrant counties In the
2015 ndash 2016 school year the program provided an effective energy education program
which strongly supports the Texas Essential Knowledge and Skills (TEKS) curriculum
standards as well as engages students through school challenges and at-home activities
c Campaign Outreach
PowerToChooseorg and its Spanish-language counterpart PoderDeEscogerorg
have proven valuable in educating customers about customer choice in the electricity
market The Commission conducted a number of activities to further promote the statersquos official electric choice website through social media community events trade shows and
expos From September 1 2015 through August 31 2016 nearly a million potential
customers visited the PowerToChooseorg and PoderDeEscogerorg websites Website
statistics are contained in Table 5
Table 5 Website Statistics September 2015 ndash August 2016
PowerToChoosecom Unique Visitors 980473
PoderDeEscogercom Unique Visitors 4652
d Low-IncomeElderly Outreach and Collaboration with Faith- and
Community-Based Organizations
Throughout 2015 and 2016 the Commissionrsquos staff also worked with legislative
offices and faith- and community-based organizations to provide educational materials and
training to help their constituents better understand the deregulated electric market and the
9 | P a g e
2017 SCOPE OF COMPETITION IN ELECTRIC MARKETS IN TEXAS REPORT
Commissionrsquos websites The Commission has actively participated with the Interagency
Coordinating Group (ICG) which was established by the Texas Legislature to expand and
improve relationships between state government and faith- and community-based
organizations Information on customer assistance programs such as LITE-UP Texas was
provided to community organizations such as Legal Aid of Northwest Texas senior
activity centers and religious groups
e Call Center
The Commission has trained its Customer Protection Division staff who are fluent
in both English and Spanish to answer customer calls and to assemble and mail
informational packets comparing electric plans when requested by customers without
Internet access From September 2015 to August 2016 the Customer Protection Division
staff handled 7663 calls from customers requesting assistance with shopping
f Educational Literature
In addition to the educational materials on the Commissionrsquos website the Commission provides brochures fact sheets and other educational materials by mail and
e-mail through a network of community organizations and events and in response to
customer requests to the call center Up-to-date fact sheets are available on the
Commissionrsquos website PowertoChooseorg and PoderDeEscogerorg as part of the
campaignrsquos outreach efforts The fact sheets provide information on a number of current
industry and consumer topics
Throughout 2015 and 2016 campaign educational materials promoting the
agencyrsquos programs including Power to Choose and Power to Save Texas were distributed
at numerous community events and civic town hall events such as Hurst-Euless-Bedford
ldquoBack 2 Schoolrdquo day Dickenson Housing Family Fair Energy Day DFW Family Fair
Earth Day Texas Texas Home and Garden shows in Houston Texas Black Expo National
Night Out events and minor league baseball games
Wholesale Market Development
The Commission engages regularly with ERCOT to oversee market developments
and ensure system supply reliability security and improved price formation and market
outcomes Market design changes made as a result of this working relationship have
created new opportunities for a variety of generation resources to enter the market and
supported the formation of wholesale prices that reflect real-time market conditions more
accurately and therefore improve the efficiency of the market
1 Wholesale Market Prices
Wholesale market prices have fallen in comparison to prices seen in the 2012 ndash 2014 period The ERCOT load-weighted real-time average price of energy in 2015 was
$2677 per Megawatt-hour (MWh) a 34 decrease from the average price in 2014 and a
decrease of 21 from the average seen in 2013
10 | P a g e
2017 SCOPE OF COMPETITION IN ELECTRIC MARKETS IN TEXAS REPORT
Falling wholesale prices are correlated with the current trend of lower natural gas
prices the primary fuel of many of the regionrsquos power plants The average Houston Ship Channel spot price for natural gas was 41 lower in 2015 than in 2014 decreasing from
$437MMBtu in 2014 to $258 in 2015 Through March the average price for 2016 has
fallen to $192MMBtu Natural gas price trends from September 2014 through August
2016 are shown in Figure 4
Figure 4 Monthly Average Natural Gas Prices September 2014 ndash August 2016
Monthly average wholesale electricity prices are shown in Figure 5 Load-
weighted prices are calculated by dividing the price at a load zone by the associated
demand This metric provides a useful proxy for the actual wholesale prices paid by load16
16 It is worth noting that most power in ERCOT is sold through various bilateral arrangements that
are designed to hedge daily real-time market price risk
11 | P a g e
2017 SCOPE OF COMPETITION IN ELECTRIC MARKETS IN TEXAS REPORT
Figure 5 Load-Weighted Average Real-Time Monthly Settlement Point Prices September 2014 ndash August 2016
Another component of the real-time price of electricity is the cost of transmission
congestion Transmission congestion occurs when there is insufficient transmission
capacity to dispatch energy in a least-cost fashion The recent build-out of additional
transmission lines in areas of high congestion has partially relieved the cost burden in these
areas particularly in West Texas where oil and gas production growth rapidly increased
the demand for electricity resulting in relatively higher zonal prices
2 Peak Demand
After the very high peak demand levels during the hot summer of 2011 peak
demand in ERCOT was lower in 2012 through 2014 In 2015 peak demand again
increased though not to 2011 levels with load exceeding 60000 MW for 330 hours and
exceeding 65000 MW for 91 hours as shown in Figure 6 below In 2016 ERCOT
experienced a record week in August which saw the previous record peak demand broken
six times and the ERCOT region hit its all-time peak demand of 71093 MW on August
11 2016
As peak demand has increased the recorded availability of generation supply in the
region during times of high load has decreased slightly Physical Responsive Capability
(PRC) analogous to the amount of reserves available on the system at any given time fell
below 3000 MW for 269 hours in 2015 up slightly from 213 hours in 2014 and 215
hours in 2013 but well below the 371 hours recorded during the 2011 summer
12 | P a g e
2017 SCOPE OF COMPETITION IN ELECTRIC MARKETS IN TEXAS REPORT
Figure 6 High Load Hours in ERCOT 2011 ndash 2016
As shown in Table 6 the ERCOT system peak demand was 69877 MW in 2015
up 5 from the 2014 peak and the 2016 ERCOT system peak demand increased 174
from the peak demand of the previous year
Table 6 ERCOT Peak Demand 2012 ndash 2016
Year
ERCOT Peak
Demand (MW)
Percentage Change
from Prior Year
2012 66548 ndash 2013 67245 105
2014 66454 ndash118
2015 69877 515
2016 71093 174
Figure 7 shows the hourly peak load for each month in ERCOT from January 2014 to
August 2016
13 | P a g e
2017 SCOPE OF COMPETITION IN ELECTRIC MARKETS IN TEXAS REPORT
Figure 7 Monthly Peak Demand in ERCOT January 2014 ndash August 2016
3 Generation Diversity
As electricity consumption has increased in ERCOT the diversity of the systemrsquos generation portfolio has also increased Generators participating in the statersquos renewable energy credit (REC) trading program reported an 11 increase in renewable generation
from 2013 to 2015 rising from 376 million MWh to 469 million MWh with wind
representing 96 of the total renewable mix Landfill gas was the second most prevalent
renewable source representing approximately 12 of all renewable generation in 2015
Energy produced from wind generation was up by 13 in 2015 from 2013 and solar
energy capacity more than doubled from 121 MW in 2013 to 288 MW in 2015 Coal-fired
generation has been steadily shrinking as a proportion of total generation declining from
37 of electricity produced in 2014 to 28 in 2015 Energy use in the ERCOT region by
fuel type for 2015 is shown in Figure 8
14 | P a g e
2017 SCOPE OF COMPETITION IN ELECTRIC MARKETS IN TEXAS REPORT
Figure 8 Energy Use in ERCOT by Resource Type 2015
The Commissionrsquos projects are further described in the following section of this report
15 | P a g e
2017 SCOPE OF COMPETITION IN ELECTRIC MARKETS IN TEXAS REPORT
III SUMMARY OF COMMISSION ACTIVITIES FROM 2015 TO 2016
Introduction
The Commission develops and modifies rules policies and procedures for the
competitive electric market in Texas in response to the technological advances in the
industry and the evolving needs of customers The Commission also continues to carry
out oversight of programs with which the Legislature has tasked it ndash such as energy
efficiency renewable energy and advanced metering infrastructure Within the
ERCOT region the monopoly wires-and-poles companies that provide transmission
and distribution services throughout the grid remain subject to traditional rate
regulation by the Commission The Commission continues to set rates for these
utilities as they are not subject to the forces of market competition This section
provides an overview of the Commissionrsquos activities in its oversight of the wholesale and retail electric markets as well as its governance over regulated electric utilities
Resource Adequacy
Resource adequacy is the long-term ability of the system to serve demand reliably
when consumption is highest given the available installed capacity load resources and
the operational reliability of the system Assessing resource adequacy requires comparing
the systemrsquos forecast installed capacity and load resources against the forecast peak
summer load The difference between the forecast of available generation and load
resources and the forecasted demand for electricity is referred to as an ldquoinstalled capacity
reserve marginrdquo which is an indicator of the ability of the system to meet customer demand
during peak conditions In addition to evaluating the forecast reserve margin assessing
resource adequacy includes evaluating the systemrsquos operational reliability The systemrsquos operational reliability depends on the ability of generators to manage plant operations
successfully as well as the grid operatorrsquos ability to manage the system to avoid or to mitigate load curtailment During 2015 and 2016 the ERCOT system performed well with
respect to resource adequacy The Commission has devoted significant attention to
ensuring that ERCOT maintains an adequate installed capacity reserve margin and a high
level of operational reliability developing a wholesale market design that allows
consumers to continue to receive low-cost and reliable electricity over the long term
1 Capacity Demand and Reserves Report
The Capacity Demand and Reserves (CDR) Report published by ERCOT semi-
annually is a snapshot estimate of long-term supply and demand and the associated annual
reserve margin for peak summer and winter conditions While the CDR Report is not a
forecast of any particular outcome it provides insight into possible resource adequacy
trends
16 | P a g e
2017 SCOPE OF COMPETITION IN ELECTRIC MARKETS IN TEXAS REPORT
The May 2016 CDR Report shows estimated reserve margins well above the
current target reserve margin of 1375 Installed capacity reserve margin estimates taken
from this CDR Report are shown below in Table 7
Table 7 May 2016 Capacity Demand and Reserves Report Forecast
Forecast 2017 2018 2019 2020 2021 2022 2023 2024 2025 2026
Peak Load
(MW)
68548 69409 70795 71420 72098 72792 73482 74168 74864 75704
Total
Capacity
(MW)
80995 87019 87238 87407 87678 87738 87738 87728 87728 87728
Reserve
Margin
182 254 232 224 216 205 194 183 172 159
2 Operating Reserve Demand Curve
In ERCOT the price signals produced by the energy-only wholesale electric market
should provide incentives to promote short-term reliability as well as induce optimal long-
run investment in new resources If the prices are efficient and reflect the full cost of
dispatching resources to meet demand the benefits that accrue to both consumers and
producers can be maximized at the least cost and new generating capacity (or load
resources) should develop to maintain the equilibrium as old resources retire or demand
increases
The Operating Reserve Demand Curve (ORDC) implemented at the Commissionrsquos direction in June 2014 improves price formation by allowing prices to more fully reflect
the value of operating reserves The ORDC assigns an economic value to operating
reserves or the amount of extra capacity available to maintain system reliability on a daily
basis
As part of its ongoing review of resource adequacy in ERCOT the Commission is
currently evaluating the accuracy of the inputs to the ORDC to ensure that its contribution
to price formation appropriately reflects the costs of meeting demand and the underlying
needs of the system
3 Transmission Congestion
Although competitive power producers and regulated transmission providers form
two distinct segments of the market transmission buildout has a direct effect on wholesale
power prices When there is insufficient transmission capacity to dispatch energy in a least-
cost fashion the system operator takes action to ensure that the physical limits of the
transmission system facilities are not violated The re-dispatch of generation because of
transmission limits results in disparate prices at different locations on the system In
comparison to prior years transmission congestion in ERCOT has lessened because of the
large increase in transmission investment and the reduction of high demand related to oil
and gas production in West Texas ERCOT and the Commission continually evaluate the
need for cost-effective additional transmission investment to manage congestion
17 | P a g e
2017 SCOPE OF COMPETITION IN ELECTRIC MARKETS IN TEXAS REPORT
4 Wholesale Market Design Initiatives
While the ERCOT wholesale market has been successful in attracting new resource
investment and also maintaining competitive prices for consumers certain improvements
to the market design could yield additional benefits in terms of efficient price formation
and opportunities for entry of new technology Initiatives already in place in many other
regions such as real-time co-optimization and multi-interval real-time resource dispatch
may allow existing capacity to be used more effectively and create opportunities for the
integration of additional load resources to serve electric demand The Commission
continues to work with ERCOT and interested stakeholders to determine the value of
implementing such enhancements particularly as ERCOTrsquos resource mix changes over time
5 Reliability Standard
In early 2014 the Commission opened a project to review its use of a target installed
capacity reserve margin based on a reliability standard equivalent to one loss-of-load event
every ten years In this project the Commission received written comment from interested
parties conducted a public workshop consulted with independent experts and reviewed
the application of reliability standards in other regions As a result of this review future
reliability metrics to be estimated in ERCOT will include the market equilibrium reserve
margin the economically-optimal reserve margin and the associated levels of expected
unserved energy The Commission believes that publishing these metrics represents an
improvement over reporting a one-event-in-ten-years standard by enhancing insight into
expected outcomes in ERCOTrsquos energy-only market
Non-ERCOT Utilities Market Development Activities
SB 7 the law that introduced retail competition to the Texas market in 1999
granted the Commission authority to delay retail competition in an area where deregulation
would not result in fair competition and reliable service because of the lack of an
independent organization to coordinate the electric system and the concentration of
ownership in the generation sector in some of those areas Consequently SB 7 included
provisions recognizing the difficulty of implementing retail competition in areas outside of
ERCOT Therefore the utilities outside of the ERCOT region remain vertically integrated
owning generation transmission and distribution assets as well as selling power to end-
use customers These vertically integrated utilities remain subject to traditional regulation
including rates set by the Commission and customer choice is not offered in the service
territories of these utilities
The Commission does continue to monitor ongoing activities in the non-ERCOT
portions of the state In 2015 the Legislature granted the Commission the authority to
retain counsel and consulting experts in order to participate in legal proceedings at the
Federal Energy Regulatory Commission (FERC) which has regulatory jurisdiction over
wholesale power sales and transmission rates outside of ERCOT This authority has
18 | P a g e
2017 SCOPE OF COMPETITION IN ELECTRIC MARKETS IN TEXAS REPORT
permitted the Commission to participate more effectively in FERC proceedings affecting
Texasrsquo utilities located outside of ERCOT
1 Southwest Power Pool
The Southwest Power Pool (SPP) is the Regional Transmission Operator (RTO) for
areas of Northeast Texas and the Texas Panhandle In Texas the utilities Southwestern
Electric Power Company (SWEPCO) Southwestern Public Service (SPS) and several
electric cooperatives and municipally owned utilities are in SPP In addition to these areas
of Texas the SPP footprint includes parts of New Mexico Arkansas Missouri Nebraska
Louisiana and all of Kansas and Oklahoma In 2015 SPP became the RTO for the
Integrated System and neighboring areas which includes parts of Iowa Minnesota North
Dakota South Dakota Wyoming and Montana SPP has spent extensive time and
resources over the last two years to integrate these new areas successfully The expansion
added 5000 MW of peak demand 7600 MW of generating capacity and 9500 miles of
transmission lines17
In 2014 SPP launched its new Integrated Marketplace which provides a Day-
Ahead Market a Real-Time Balancing Market and Congestion Hedging Markets
mechanisms similar to those available in ERCOT The implementation of the Integrated
Marketplace resulted in a savings of $422 million in 2015 As a result of the Integrated
Marketplace SPPrsquos planning reserve margin will be reduced from 136 to 12 a change
expected to save about $90 million annually
Chairman Donna L Nelson represents the Commission as a voting member on
SPPrsquos Regional State Committee (RSC) The RSC provides collective state regulatory
agency input on a variety of issues In addition the RSC has authority over the cost
allocation methodologies for transmission upgrades allocation of Financial Transmission
Rights and the approach used for resource adequacy across the SPP region The RSC
regularly meets on a quarterly basis and meets more frequently if necessary
2 Midcontinent Independent System Operator
The Midcontinent Independent System Operator (MISO) is an RTO that serves all
or part of 15 states in the central US one Canadian province and the portion of eastern
Texas served by the vertically integrated utility Entergy Texas Inc MISO provides a Day
Two market which has a variety of functions and services including energy and ancillary
service markets economic dispatch congestion management financial transmission rights
and transmission planning The MISO Independent Market Monitor concluded that the
MISO wholesale markets were competitive in 2015
Like SPP MISO is in the Eastern Interconnection which crosses state boundaries
and is therefore subject to FERC jurisdiction A number of recent FERC proceedings have
17 2015 Southwest Power Pool Annual Report Available at
httpswwwspporgdocuments37800201520southwest20power20pool20annual20reportpdf
19 | P a g e
2017 SCOPE OF COMPETITION IN ELECTRIC MARKETS IN TEXAS REPORT
affected the portion of Texas that is in the MISO footprint The Commission through
outside counsel has been an active party in such FERC proceedings FERC Docket No
ER14-1174 addressed in part a dispute regarding the availability of transmission capacity
under the Joint Operating Agreement between MISO and the SPP Ultimately FERC
approved a settlement agreement under which MISO will compensate SPP and its members
for using their or other entitiesrsquo transmission systems
In a related pending docket at FERC Docket No ER14-1736 parties are addressing
how the cost of these payments will be allocated among MISO market participants Parties
in this proceeding are engaged in settlement discussions In addition in Docket No ER14-
75-000 FERC approved a settlement agreement among the participating Entergy
Operating Companies and their retail regulators to terminate the Entergy System
Agreement effective August 31 2016 The settlement terms prohibit any post-termination
payments that roughly equalize production costs among the operating companies after
December 31 2015 terminate certain specific cross-purchase power agreements between
Entergy Texas and former Entergy Gulf State Louisiana and permit the continuation of
several other purchase power agreements
Commissioner Kenneth W Anderson Jr represents the Commission as a voting
member in the Organization of MISO States (OMS) the purpose of which is to coordinate
regulatory oversight among the states in the MISO region and to make recommendations
to MISO FERC and other entities Commissioner Anderson also represents the
Commission as a voting member of the Entergy Regional State Committee (ERSC) which
has certain FERC-approved authority for five years after the Entergy integration with
regard to cost allocation for Entergy transmission projects and adding transmission projects
to the Entergy construction plan The ERSC meets quarterly
3 Western Electricity Coordinating Council
The Western Electricity Coordinating Council (WECC) is a Regional Entity whose
region includes the area surrounding El Paso and extends from Canada to Mexico
including the provinces of Alberta and British Columbia the northern portion of Baja
California and all or portions of the 14 Western states in between WECC is the Regional
Entity responsible for Bulk Electric System reliability in the Western Interconnection and
associated compliance monitoring and enforcement WECC does not have organized
markets outside of California but is organized into 38 separate balancing authorities
WECC is geographically the largest and most diverse of the eight Regional Entities in the
United States with delegated authority from the North American Electric Reliability
Corporation (NERC) and the Federal Energy Regulatory Commission In Texas El Paso
Electric Company is a member of WECC
Rulemaking Activities
The Commission has continued to adopt new rules and modify existing rules in
order to further the continued successful operation of the competitive retail and wholesale
markets and to comply with statutory changes made to PURA by the Legislature This
20 | P a g e
2017 SCOPE OF COMPETITION IN ELECTRIC MARKETS IN TEXAS REPORT
section of the Report provides a high-level overview of the Commissionrsquos key rulemaking
activities highlighting the market improvements made in 2015 and 2016
1 Cost Recovery and Rate Adjustment
The Commission adopted new rule 16 TAC sect25246 on June 29 2016 to
implement Section Nos 1 through 3 of House Bill 1535 of the 84th Legislature The new
rule only applies to a utility that operates solely outside of ERCOT and allows for the use
of an update period beyond the test year for which the utility initially files estimated
information The rule clarifies that all information originally estimated must be updated
with actual information and also provides requirements for a post-test-year adjustment for
a natural gas-fired plant A non-ERCOT utility also is required to initiate a new base rate
case on or before the four year anniversary of the final order in the utilityrsquos most recent comprehensive base rate case or if the commission determines that the utility has
materially earned more than its authorized rate of return in two consecutive years The rule
also provides requirements and procedures for the relation back of final rates to an effective
date 155 days after the filing of the rate application
2 Changes to Certificates of Convenience and Necessity and CREZ Rule
The Commission conducted a rulemaking to implement changes pursuant to
Legislative mandates in SB 776 SB 933 and HB 1535 of the 84th Legislature SB 776
required municipally owned utilities to apply for a certificate of convenience and necessity
(CCN) before constructing transmission facilities outside the boundaries of the
municipality that owns the municipally owned utility SB 933 also requires persons to
obtain a CCN before interconnecting a tie line into the ERCOT grid HB 1535 requires the
Commission to issue a final order within 181 days for a non-ERCOT utility requesting a
CCN for an existing electric generating facility and 366 days after a non-ERCOT utility
files a CCN for a newly constructed generating facility In addition the Commission also
determined in this rulemaking that all future transmission projects in a Competitive
Renewable Energy Zone (CREZ) must meet the need criteria of PURA sectsect 37056(c)(1)
and (2) rather than being exempt Finally the Commission determined that the CREZ
project established in 2008 was complete following the installation of a second circuit on
a Sharyland line
3 Use of Handheld Device for Enrollment
As the market evolves the Commission evaluates market changes balancing its
desire to encourage customer-focused innovation with its concern for customer protection
against potential abuses In Docket No 44518 the Commission granted a REP a
temporary 12-month waiver from its rules requiring the marketer to obtain telephonic
verification of the customerrsquos desire to switch REPs as well as a waiver from certain authorization disclosure requirements among other stipulations the Commission placed
upon the REP The Commission then opened Project No 45625 to study the issue of REPs
utilizing hand-held devices for customer enrollment more broadly and engage with market
representatives consumer representatives and other stakeholders The Commission
anticipates considering an amendment to its rules in the spring of 2017
21 | P a g e
2017 SCOPE OF COMPETITION IN ELECTRIC MARKETS IN TEXAS REPORT
4 Smart Meter Texas Portal
The electric utilities in Texas that have advanced metering systems (AMS) jointly
own and operate a single web portal known as Smart Meter Texas (SMT)18 SMT fulfills
two requirements imposed by the Commissionrsquos advanced metering rule on a utility with
AMS (1) provide to the retail customer the REP serving the customer and other entities
authorized by the customer access to such retail customerrsquos consumption data and (2)
allow devices at the customerrsquos premises to communicate through a home area network with the advanced meter at the premises SMT also facilitates near real-time on-demand
reads of a customerrsquos meter that aids prepaid service offered by certain REPs
In Project No 42786 Review of Advanced Metering System Web Portal
Commission staff and stakeholders examined options for the long-term operational
structure governance and funding of SMT The Commission determined that ownership
of SMT should remain with the TDUs because they can operate the portal at a lower cost
than transferring the data repository to ERCOT The Commission opened two
rulemakings one to ascertain the appropriate governance performance and funding of
SMT and a second to determine the appropriate access for third parties ensuring that
customers have the freedom to grant and give third parties access to their data if made
knowingly while also securing customer privacy
Sharyland Utilities
In early 2015 customers of Sharyland Utilities the smallest investor-owned
transmission and distribution utility in ERCOT began to file with the Commission a
significant number of complaints regarding high electricity bills In response the
Commission opened Project No 44592 Relating to a Project Regarding Sharyland
Utilities to provide for a more formal process for Commission review of the large number
of complaints As part of this project Commission staff prepared a report to evaluate the
electricity rates and electric bills in the operating area of Sharyland Utilities that was
previously part of Cap Rock Energy
Staffrsquos report found that a number of factors contributed to the comparatively high
bills for many of Sharyland-Cap Rockrsquos customers First Sharylandrsquos small size and its low customer density result in high TDU rates for all customers relative to other TDUs In
particular Staffrsquos report found that Sharyland-Cap Rockrsquos rates for distribution service are
up to three times higher than those of other TDUs in Texas In addition to Sharyland-Cap
Rockrsquos high costs for distribution service higher wholesale transmission costs also
contributed to the rate increases charged to Sharyland-Cap Rockrsquos customers These transmission costs are the result of increased transmission investment in recent years
throughout Texas that has increased transmission costs for all distribution providers
18 The participating Texas TDUs are AEP Texas Central Company and AEP Texas North Company (jointly
ldquoAEPrdquo) CenterPoint Energy Houston Electric LLC (ldquoCenterPointrdquo) Oncor Electric Delivery Company LLC (ldquoOncorrdquo) and Texas-New Mexico Power Company (TNMP) collectively referred to as the ldquoJoint TDUsrdquo Operation of an AMS web portal was addressed in the orders approving particular utilitiesrsquo deployment of AMS and approving surcharges for AMS cost recovery While Sharyland Utilities filed comments in the proceeding it did not
participate as it had not fully completed its AMS deployment at the time
22 | P a g e
2017 SCOPE OF COMPETITION IN ELECTRIC MARKETS IN TEXAS REPORT
including Sharyland Utilities Second the comparatively colder winter of 2014 ndash 2015
which was the time period generally consistent with the timeframe in which the
Commission began receiving complaints appeared to result in higher electricity usage than
normal This combination of high TDU rates and the higher electricity usage led to higher
bills for customers
Staffrsquos report also noted that in Sharyland-Cap Rockrsquos last rate case in 2014 the
approved rates reflected movement towards more cost-based rates for all customers
including some customers that previously had been heavily subsidized by other customers
Additionally in the process of standardizing Sharyland-Cap Rockrsquos customer classification
with the classifications of the other TDUs in Texas some customers may have experienced
a move from one class that previously was paying below-cost rates to another class that
was now paying above-cost rates For some of these customers the combined effects of
the movement towards cost-based rates and the change to a different class may have
contributed to a significant change in the customersrsquo rates Regardless of any cost-shifting
between customer classes Sharylandrsquos rates remain two to three times higher than those of other TDUs in Texas for all customers in all classes
On December 4 2015 the Commission signed an order directing Sharyland to file
an application for a comprehensive rate review by April 30 2016 Sharyland filed its rate
application on April 29 2016 in Docket No 45414 Review of the Rates of Sharyland
Utilities LP On October 10 2016 the Commission ordered Sharyland to file an amended
application as soon as practicable but no later than January 1 2017 to reflect the unique
aspects of the companyrsquos organizational structure as a real estate investment trust (REIT) At the time of publication Sharyland is expected to file its amended application in
December 2016
PowerToChoose Website
As part of its ongoing evaluation of the competitive market the Commission
opened Project No 45730 to evaluate the functionality and usability of its PowerToChoose
website which allows customers to select a REP and an electric plan based on their zip
code In the process the Commission received significant feedback from customers stating
that the Commissionrsquos PowerToChoose website was an important tool that plays a
fundamental role in their shopping process In response to the feedback received from
industry representatives and consumers Commission staff changed how the website sorts
and filters retail electric plans adding a filter to allow customers to unselect plans that
contain minimum usage fees or credits This filter is now a default setting and plans with
minimum usage fees and credits are not shown unless the customer actively selects to
search for such plans In addition Commission staff made other changes to increase the
clarity of the REP complaint rating The Commission continues to evaluate other changes
to improve the customer experience of the PowerToChoose website and provide
transparency for retail electric plans
23 | P a g e
2017 SCOPE OF COMPETITION IN ELECTRIC MARKETS IN TEXAS REPORT
Report on Alternative Ratemaking Mechanisms
In 2015 the Legislature enacted SB 774 which requires the Commission or its
consultant to conduct a study and make a report to the Legislature analyzing the alternative
ratemaking mechanisms adopted by other states In addition SB 774 extended the
authorization for the Periodic Rate Adjustment (PRA) mechanism from 2017 to 2019
which the Legislature had authorized in 2011 (SB 1693) as a version of an alternative
ratemaking mechanism that provides to utilities a means for expedited recovery of
distribution infrastructure costs Pursuant to SB 774 the Commission retained a consultant
to produce the report and the consultantrsquos recommendations included streamlining the ratemaking process to reduce procedural costs providing for a periodic review of the
prudency of the costs and using certain types of alternative ratemaking mechanisms that
decouple the recovery of costs from variations in load The Commission held a public
hearing to receive comments on the report from stakeholders and after consideration of
those comments has provided to the Legislature the consultantrsquos report together with its
own discussion of the report
Request for Purchase of Oncor Electric Delivery Company
In March 2016 the Commission approved with conditions an application by an
investor group led by Hunt Consolidated Inc the owners of Sharyland Utilities to acquire
control of Oncor Electric Delivery Company (Oncor) the largest transmission and
distribution utility in Texas from Oncorrsquos parent company Energy Future Holdings which
is in bankruptcy The Commission approved the request subject to certain conditions
including stipulations regarding the organization of the new entities and treatment of tax
benefits The investor-led group subsequently declined to pursue the transaction that was
approved by the Commission
In September 2016 NextEra Energy which owns Florida Power amp Light received
approval from the United States Bankruptcy Court in Delaware for its plan to purchase
Oncor In October 2016 NextEra Energy filed an application with the Commission in
Docket No 46238 for approval of the proposed transaction The Commission will evaluate
the application to determine if the transaction is in the public interest
Integration of Lubbock Power and Light
In March 2016 the Commission opened Project No 45633 to study and identify
the issues related to the request of Lubbock Power and Light the statersquos third-largest
municipally owned utility to be integrated into ERCOT The Commission is currently
working with stakeholders ERCOT and SPP to determine the cost and benefits of any
potential switch by Lubbock Power and Light into ERCOT and whether such a switch is
in the public interest
24 | P a g e
2017 SCOPE OF COMPETITION IN ELECTRIC MARKETS IN TEXAS REPORT
Desalination Project ERCOT Studies
In 2015 the Legislature passed HB 4097 which directed the Commission and
ERCOT to study whether existing transmission and distribution planning processes are
sufficient to provide adequate infrastructure for seawater desalination projects and to study
the potential for desalination projects to participate in demand response opportunities in
the ERCOT market Pursuant to that direction ERCOT staff have prepared a report on the
feasibility of interconnection of large desalination projects and on opportunities for such
projects to participate in ERCOTrsquos demand response programs which is attached to this Report in Appendix B
Oversight and Enforcement Actions
The Commissionrsquos enforcement of statutes rules and orders applicable to entities
under its jurisdiction serves to protect consumers the electric markets the reliability of the
electric grid and to promote fair competition The Commissionrsquos enforcement efforts in the electric industry focus on violations of PURA the Commissionrsquos rules and ERCOT
protocols
During the period from January 2015 through August 31 2016 the Commission
assessed $3258500 in penalties against electric market participants Table 8 provides a
summary of electric industry Notices of Violation since January 2015 During 2015 and
2016 Commission staff opened 212 investigations for the electric industry and closed 177
investigations
Table 8 Notices of Violations
Violation Type Total Penalty Amount
Retail Market Violations $539000
Service Quality Violations $451500
Wholesale Market Violations $2268000
TOTAL $3258500
In addition to the imposition of administrative penalties the Commission uses other
enforcement mechanisms in exercising its enforcement duties including revoking a
companyrsquos certificate to operate In addition some companies may be required to relinquish a certificate as part of a settlement after enforcement action has proceeded
Table 9 provides a breakdown of the number of certificates revoked or relinquished In
2016 the Commission revoked the certificate of the REP TruSmart Energy
Table 9 Certificates Revoked or Relinquished
Type Number
Certificates Revoked 1
Certificates Relinquished 0
25 | P a g e
2017 SCOPE OF COMPETITION IN ELECTRIC MARKETS IN TEXAS REPORT
The Oversight amp Enforcement division also issues warning letters to companies in
the electric market when it determines that a violation occurred but given the
circumstances surrounding the violation and other mitigating concerns no administrative
penalty is warranted During 2015 and 2016 the Oversight amp Enforcement division issued
50 warning letters Finally the Commission generally seeks to reimburse money directly
to customers when appropriate In 2015 and 2016 the Commission ordered the
reimbursement of $8543596 to Texas electric customers
Table 10 Warning Letters
Warning Letter Type Number
Retail Market Warning Letter 8
Service Quality Warning Letter 1
Wholesale Market Warning Letter 41
TOTAL 50
In addition to its enforcement activities the Commission also enters into voluntary
mitigation plans with generators that request one through a contested case proceeding
pursuant to PURA sect15023(f) and 16 TAC sect25504(e) The Commission entered into one
voluntary mitigation plan during 2015 and 2016 in Docket No 44635
Low-Income Discount System Benefit Fund
The System Benefit Fund (SBF) was originally established in 1999 to fund
discounts to low-income customers customer education activities energy-efficiency and
weatherization and electric market oversight through a nonbypassable surcharge on retail
electric bills HB 1101 of the 84th Legislature provided that the SBF be sunset on
September 1 2017 by which time the SBF is intended to be exhausted In the 2016 Fiscal
Year (FY) $325521250 was appropriated in the SBF to provide a 25ndash31 percent discount
to low-income customers over a 12-month period
To assist the drawdown of the remaining balance HB 1101 authorized the
Commission to use any unexpended SBF balance in FY 2017 to assist low-income
customers The Commission estimates that the remaining SBF balance will be
approximately $17 million by August 31 2017 The Commission has determined that this
amount is insufficient to fund the rate reduction program however the Commission will
spend approximately $100000 to continue automatic enrollment in the program to provide
REPs a list of customers eligible to receive late fee waiver and deposit installment benefits
These two ancillary benefits of the rate reduction program will continue for the duration of
FY 2017
26 | P a g e
2017 SCOPE OF COMPETITION IN ELECTRIC MARKETS IN TEXAS REPORT
Homeland Security
The Commission assesses the efforts of ERCOT and utilities to defend against
mitigate and respond to the variety of risks that the modern electricity system faces The
Commission also meets with ERCOT utilities and governmental entities on an ongoing
basis to discuss preparation for everything from hurricanes and other severe weather to
cyber-threats and threats of physical damage to the grid from accidents or intentional
malfeasance In addition the Commission monitors industry and federal programs that
address homeland security issues
The Commission serves as an information liaison between state government and
electric utilities during emergencies The Commissionrsquos main roles include
Conveying outage and service restoration information from electric utilities to
state government
Conveying service restoration priorities (hospitals water treatment facilities
etc) from state government to electric utilities and
Facilitating the clearance of downed power lines in disaster re-entry areas and
facilitating entry of electric utilities into disaster areas
The Commissionrsquos Emergency Management Response Team (EMRT) provided staff at the
State Operation Center for the May 2015 and April 2016 flooding events in Texas as well
as additional staffing for severe winter weather
Demand Response
ERCOT staff have begun to report annually on the participation of customers in
REP-sponsored demand response programs These programs which have been facilitated
by the deployment of smart meters throughout the competitive areas within ERCOT and
by many municipal and cooperative electric utilities take the form of rebates for reduction
in usage during peak period time-of-use pricing real-time volumetric price compensation
for load reduction and direct control of customer load among other plans
These programs have seen dramatic increases in participation since ERCOT began
to gather this information in 2013 From 2013 to 2014 the number of residential customers
participating in these programs increased from 151793 to 721273 and the number of
commercial and industrial customers participating rose from 30275 to 50205 The
Commission continues to monitor ERCOTrsquos stakeholder process for efforts relating to the integration of demand response
27 | P a g e
2017 SCOPE OF COMPETITION IN ELECTRIC MARKETS IN TEXAS REPORT
IV LEGISLATIVE RECOMMENDATIONS
A Determination of Low-Income Customer Eligibility
In 2015 HB 1101 required that all remaining funds in the System Benefit Fund
(SBF) be expended that the fee that funded the program as a nonbypassable surcharge on
electric bills be set at zero and that the SBF be sunset on September 1 2017 Per the
provisions of HB 1101 the SBF fee was set at zero in September 2016 concluding the
funding for the program The sunset of the SBF program also concluded the relationship
between the Texas Health and Human Services Commission (HHSC) and the Commission
in which the HHSC provided to the Commission eligible electric customers for the SBF
low-income discount Because of the termination of the relationship with HHSC with the
termination of the SBF the Commission will no longer be able to determine easily an
electric customerrsquos eligibility for other low-income programs such as late penalty waivers
and the option of paying an electric deposit over multiple months
The Legislature may wish to consider easing low-income customers access to these
low-income programs by facilitating the process used to determine eligibility The
Commission offers four possible approaches in which the Legislature could continue these
low-income programs
(1) Authorize HSSC to provide identification of eligible low-income customers to the
Commission
(2) Allow retail electric providers (REPs) to provide such low-income programs using
the Low Income Discount Administratorrsquos (LIDA) Telecommunications Lifeline
Service Program list to identify low-income customers
(3) Require REPs to offer such low-income programs with customers self-enrolling
and REPs verifying income eligibility or
(4) Allow REPs to voluntarily provide such low-income programs at their own
discretion
B Outside Counsel for Proceedings before Regional Transmission
Organizations
Regional Transmission Organizations (RTO) manage the power grid across wide
regions of the United States Most of Texas is inside the ERCOT region however there
are significant portions of East Texas and the Panhandle that are in the Midcontinent
Independent System Operator (MISO) and the Southwest Power Pool (SPP) Issues arise
in these other RTOs that have significant impact on Texas ratepayers such as how
transmission infrastructure costs will be shared These tend to be very lengthy and
complicated proceedings that require specialized legal and consulting services
28 | P a g e
2017 SCOPE OF COMPETITION IN ELECTRIC MARKETS IN TEXAS REPORT
PURA sect 394525 currently authorizes the Commission to use outside consultants
auditors engineers or attorneys to represent the Commission in proceedings before the
Federal Energy Regulatory Commission This provision has been an important tool for the
Commission to respond to complex matters in the federal arena to enable it to protect the
public interest in Texas The PUC recommends that the Legislature expand the language
in this statute to include the ability to hire outside assistance for proceedings before other
RTOs to provide those same protections to Texas ratepayers in those areas
C Repeal of Natural Gas and Renewable Energy Mandates
1 Natural Gas
PURA sect 399044 establishes natural gas as ldquothe preferential fuelrdquo in Texas for electricity generation and requires the Commission to adopt rules to establish a system of
natural gas energy trading credits The majority of all new non-renewable electricity
generation constructed since 2000 for Texas has used natural gas as a primary fuel and this
trend is expected to continue in the foreseeable future The thresholds used to trigger the
natural gas energy trading credit system in PURA sect 399044 have not been reached and
they are not expected to be reached in the foreseeable future
Because natural gas-fueled facilities have been the most commonly built new
generation in Texas for many years and are expected to continue to be there is no need to
establish incentives for natural gas generation The PUC recommends that the Legislature
consider repealing PURA sect 399044 because it is no longer necessary
2 Renewable Energy
PURA sect 39904 establishes goals for renewable energy Subsection (a) requires
the installation of 5880 megawatts of renewable energy by 2015 and Subsection (b)
establishes a renewable energy credits trading program to implement the requirement The
5880 megawatts mandates in Subsection (a) was met in 2008 While the Commission
believes the renewable energy trading credit program is needed for retail electric providers
to validate renewable energy marketing claims the Commission believes the 5880
megawatts mandate in Subsection (a) is no longer necessary
D Advisory Opinions
Many regulatory agencies in Texas have authority to issue informal guidance to the
persons they regulate particularly with respect to outlining whether a particular course of
conduct would in the agencyrsquos view be consistent with the laws and regulations that the agency administers19 The issuance of an advisory opinion can provide regulatory clarity
to a company before making investments or conducting operations the permissibility of
which may be unclear under state law The Legislature may want to consider granting the
19 In addition certain federal agencies such as the Federal Communications Commission
Internal Revenue Service Securities and Exchange Commission and Federal Election
Commission have authority to issue advisory opinions
29 | P a g e
2017 SCOPE OF COMPETITION IN ELECTRIC MARKETS IN TEXAS REPORT
Commission the authority to issue advisory opinions In the electric industry providing
clarification to a company concerning issues such as the purchase of assets or the
acquisition of another company could allow it to avoid expensive regulatory proceedings
without impairing the Commissionrsquos authority The following state agencies have statutory authority to issue advisory opinions
Texas Ethics Commission20
Texas Medical Board21
State Board of Dental Examiners22
Texas Board of Nursing23
Texas Board of Professional Engineers24
Texas Lottery Commission and25
Texas Securities Board26
E Administrative
Gross Receipts Assessment
PURA sect 16001 provides for a gross receipts assessment that is used to defray the
expenses incurred by the Commission to administer PURA An assessment of one sixth of
one percent is collected from public utilities electric cooperatives retail electric providers
and interexchange carriersrsquo gross receipts from consumers The funds from this assessment
are remitted to the general revenue fund but currently they have not been explicitly
dedicated to funding of the Commission In contrast similar assessments on water
utilities insurance companies and other regulated entities have traditionally been used to
explicitly fund the underlying regulatory programs at the respective agencies The
Commission is one of four Article VIII agencies that is not designated as self-funded
The Commission recommends that the Legislature designate the Commission as a
self-funded agency whereby the collected assessments would be explicitly dedicated to the
funding of the agency Implementing this recommendation would require the Public Utility
Commission to be included in the Appropriations Limited to Revenue Collections rider
located in the Special Provisions Relating to All Regulatory Agencies section of the
General Appropriations Act Designation as a self-leveling agency would require the
Commission to set the gross receipts assessment at a rate sufficient to generate revenue in
the amount of the agencyrsquos general revenue appropriation each fiscal year which would require a statutory change to PURA sect16001(b) Based upon the Commissionrsquos baseline budget request authorizing the PUCrsquos self-leveling designation would result in an overall
estimated tax reduction of $456 million per year or 774
20 Government Code sect 571091 21 Occupations Code sect 162107 22 Occupations Code sect 258157 23 Occupations Code sect 301607 24 Occupations Code sect 1001601 25 Occupations Code sect 2001059 26 Tex Rev Civ Stat Ann Arts 581-28-1 amp 581-35 7 Tex Admin Code 1012
30 | P a g e
2017 SCOPE OF COMPETITION IN ELECTRIC MARKETS IN TEXAS REPORT
V APPENDICES
31 | P a g e
2017 SCOPE OF COMPETITION IN ELECTRIC MARKETS IN TEXAS REPORT
Appendix A ndash Acronyms
AEP American Electric Power
AMS Advanced Metering System
CenterPoint CenterPoint Energy Houston Electric LLC
DG Distributed Generation
DRG Distributed Renewable Generation
ERCOT Electric Reliability Council of Texas
ERSC Entergy Regional State
ERS Emergency Response Service
ETI Entergy Texas Inc
IMM ERCOT Independent Market Monitor
kWh Kilowatt-hour
LMP Locational Marginal Pricing
LSP Large Service Provider
MISO Midwest Independent System Operator
MMBtu One million British Thermal Unit (BTU)
MW Megawatt
MWh Megawatt-hour
Nodal Texas Nodal Market Design
ORDC Operating Reserve Demand Curve
PGC Power Generation Company
POLR Provider of Last Resort
PURA Public Utility Regulatory Act
REP Retail Electric Provider
RSC Regional State Committee
RTO Regional Transmission Organization
SCED Security Constrained Economic Dispatch
Sharyland Sharyland Utilities LP
SBF System Benefit Fund
SPP Southwest Power Pool
TDU Transmission and Distribution Utility
TNMP Texas-New Mexico Power Company
32 | P a g e
2017 SCOPE OF COMPETITION IN ELECTRIC MARKETS IN TEXAS REPORT
Appendix B ndash ERCOT Desalination Report
This page intentionally left blank
33 | P a g e
ERCOT Public
Study on the Demand Response Potential for Seawater Desalination Projects
ERCOT November 18 2016
Study on the Demand Response Potential for Seawater Desalination Projects ERCOT Public
Executive Summary
In 2015 the 84th Texas Legislature enacted House Bill (HB) 4097 which included several provisions relating to seawater desalination projects including a requirement that the Public Utility Commission of Texas (PUC) and Electric Reliability Council of Texas (ERCOT) study the potential for seawater desalination projects to participate in existing demand response opportunities in ERCOT There are several demand response products in which demand-side resources (ie consumers of electricity) can participate These programs help to preserve system reliability and provide economic benefits to participating demand-side resources Seawater desalination is an energy-intensive process that removes salt and other minerals from salt water to produce fresh water for municipal consumption industrial use or irrigation Participation in demand response could help mitigate electricity costs for future seawater desalination projects in Texas and provide reliability benefits to the grid
There are two main demand response reliability-based services administered by ERCOT participation by demand-side resources in the Ancillary Services market and the Emergency Response Service (ERS) Within the Ancillary Services market the most common service provided by demand-side resources is Responsive Reserve Service (RRS) which requires resources to respond either instantaneously or within 10 minutes in response to unplanned system emergencies ERS is separate from ERCOTrsquos Ancillary Services market and allows demand-side resources and distributed generation to provide reliability services in the event of an energy emergency Resources can qualify for either the 10-minute or 30-minute response time ERS programs
There are several key considerations that will impact a demand-side resourcersquos ability to participate in different demand response opportunities response time recovery time predictability of electrical demand and flexibility of operations Considering these factors together it appears that seawater desalination plants could be designed to meet the requirements for participation in demand response Because the ability to meet the qualification requirements is dependent on the plant design demand response opportunities should be considered early in a projectrsquos development if participation is desirable
Whether project developers will choose to address these requirements will depend on the economic benefits of participation There may be additional costs to design seawater desalination plants to operate in the manner required in order to participate in demand response These include costs associated with additional plant design specifications need for excess capacity and storage to make up for lost production during demand response deployment operational costs resulting from interruptions to plant processes and potential financial penalties if demand response deployment results in failure to meet contract demands The interplay of the benefits of participation and these costs will determine whether it would be beneficial for a future seawater desalination plant to participate in demand response in ERCOT
To date participation of seawater desalination plants in demand response programs has been limited Because the process of seawater desalination is energy-intensive participation in demand response could help to reduce electricity costs while posing a relatively low risk to plant operations As stakeholders in Texas continue to plan for possible future droughts in the region and identify water management strategies consideration of demand response could play a role in mitigating some costs associated with seawater desalination and allow seawater desalination plants to assist with maintaining electric reliability in the region
copy 2016 ERCOT All rights reserved i
Study on the Demand Response Potential for Seawater Desalination Projects ERCOT Public
Table of Contents
1 Introduction 1
2 Seawater Desalination 2
21 Seawater Desalination Plant Operations 2
22 Seawater Desalination Plant Economics 3
3 Demand Response Opportunities in ERCOT 4
31 ERCOT-Dispatched Demand Response 4
311 Ancillary Services Markets 5
312 Emergency Response Service (ERS) 5
32 Non-ERCOT-Dispatched Demand Response 6
321 Four Coincident Peak (4CP) 6
322 LSE or DR Provider Contracted Price Response 6
323 Self-Directed Price Response 6
4 Demand Response Potential for Seawater Desalination 7
41 Operational Considerations for ERCOT-Dispatched Demand Response 7
42 Economic Considerations for ERCOT-Dispatched Demand Response 8
43 Considerations for Non-ERCOT-Dispatched Demand Response 9
5 Conclusion 11
copy 2016 ERCOT All rights reserved ii
Study on the Demand Response Potential for Seawater Desalination Projects ERCOT Public
1 Introduction
In 2015 the 84th Texas Legislature enacted House Bill (HB) 4097 which included several provisions relating to seawater desalination projects including a requirement that the Public Utility Commission of Texas (PUC) and Electric Reliability Council of Texas (ERCOT) study the potential for seawater desalination projects to participate in existing demand response opportunities in ERCOT ERCOT and the PUC initiated this study to fulfill that requirement and evaluated the operational and economic characteristics of seawater desalination plants in light of ERCOTrsquos primary demand response products1
ERCOT is the independent system operator (ISO) for the ERCOT Interconnection which encompasses approximately 90 of demand for electricity in Texas ERCOT is the independent organization established by the Texas Legislature to be responsible for the reliable planning and operation of the electric grid for the ERCOT Interconnection ERCOT also administers and maintains a forward-looking open market to provide affordable and reliable electricity to consumers in Texas In collaboration with market participants ERCOT has developed demand response products and services for customers that have the ability to reduce or modify electricity use in response to instructions or signals These programs help preserve system reliability and provide economic benefits to participating demand-side resources
The process of seawater desalination removes salt and other minerals from salt water to produce fresh water for consumption industrial processes or irrigation The drought-prone Texas climate coupled with projections for increasing water demand in the state has created interest in seawater desalination as a future water source The 2017 Texas State Water Plan includes seawater desalination as a future water management strategy for water users in the state However the seawater desalination process is energy intensive and electricity consumption can be a significant cost driver for these projects To the extent that these plants could participate in demand response it would help to defray these costs Thus there is a potential nexus between seawater desalination projects built in Texas to mitigate drought but which have large electricity requirements and ERCOT demand response opportunities which could help to reduce their electricity costs and provide reliability benefits
This study evaluates the demand response potential of seawater desalination plants based on their operational characteristics and economic drivers The report is organized as follows
Section 2 provides background on typical seawater desalination plant operations and economics
Section 3 describes the current demand response opportunities in ERCOT
Section 4 evaluates the characteristics of seawater desalination plants to determine their potential to participate in demand response opportunities in ERCOT and
Section 5 provides a summary of the conclusions of this study
1 In the course of developing this report ERCOT consulted with several desalination experts with experience with existing or planned seawater desalination plants in the US The technical experts consulted included Jorge Arroyo (Water Management Consultant) Andrew Chastain-Howley (Black amp Veatch) Jonathan Loveland (Black amp Veatch) Ron Parker (Black amp Veatch) John Wolfhope (Freese and Nichols) and Srinivas Veerapaneni (Black amp Veatch)
copy 2016 ERCOT All rights reserved 1
Study on the Demand Response Potential for Seawater Desalination Projects ERCOT Public
2 Seawater Desalination
There are two primary methods for seawater desalination distillation (also referred to as ldquothermalrdquo) and reverse osmosis Distillation uses heat to remove salts and minerals from seawater by boiling water at high pressures In contrast reverse osmosis technology forces saline water through a membrane to separate water from the salts and minerals While both distillation and reverse osmosis are energy intensive distillation requires thermal energy to heat the water and overall has a higher energy requirement whereas reverse osmosis requires primarily electrical energy and overall is less energy intensive ndash though still with significant electricity requirements
Globally most thermal desalination plants are located in the Middle East due to low energy prices in the region Plants located elsewhere including in the US typically use reverse osmosis technology2 There are two large existing seawater desalination plants in the US one in Carlsbad California providing water to the San Diego area and one in Gibsonton Florida providing water to the Tampa Bay area Both plants use reverse osmosis technology In addition there are several desalination projects currently in the planning stages or under development in Texas in the Corpus Christi area that would use reverse osmosis technology For that reason this report focuses on reverse osmosis technology in the evaluation of demand response potential of seawater desalination plants
While there are currently no existing seawater desalination plants in Texas there are several municipal and industrial brackish water desalination plants in the state According to the Texas Water Development Board (TWDB) there are 46 municipal brackish water desalination plants with capacities greater than 0025 million gallons per day (MGD) in Texas representing a total of 123 MGD of capacity3 The desalination of brackish water is typically less expensive compared to seawater due to the lower relative salinity of brackish water This study focuses exclusively on seawater desalination consistent with the requirements of HB 4097 but it should be noted that conclusions may also apply to brackish water desalination though at a different cost and scale
This section provides high-level information on the operations (Section 21) and economics (Section 22) of seawater desalination plants to inform the discussion of their demand response potential in Section 4
21 Seawater Desalination Plant Operations Seawater desalination plants typically range in capacity from less than 5 MGD up to 165 MGD For example the Carlsbad seawater desalination plant has a capacity of approximately 50 MGD and the plant in Tampa Bay has a capacity of approximately 25 MGD The associated electricity consumption ranges between 10 and 15 kWh1000 gallons produced depending on the salinity of the water being processed456 More saline water (eg seawater) requires larger amounts of electricity for desalination Thus a seawater desalination plant would have larger electricity consumption requirements compared to a similarly sized brackish water desalination plant
2 American Water ldquoInnovation Solutions within the Water Industry Desalinationrdquo Available at httpwwwamwatercomfilesInnovationsSolutionsWithinTheWaterIndustryDesalinationpdf 3 Texas Water Development Board ldquoDesalination Factsrdquo Available at httpswwwtwdbtexasgovinnovativewaterdesalfactsasp 4 American Membrane Technology Association April 2016 ldquoMembrane Desalination Power Usage Put in Perspectiverdquo Available at httpwwwamtaorgcomwp-contentuploads7_MembraneDesalinationPowerUsagePutInPerspectivepdf 5 Water Reuse Association November 2011 ldquoSeawater Desalination Power Consumptionrdquo Available at httpswatereuseorgwpshycontentuploads201510Power_consumption_white_paperpdf 6 Ghaffour N TM Missimer and G Amy January 2013 ldquoTechnical review and evaluation of the economics of water desalination Current and future challenges for better water supply sustainabilityrdquo Desalination 309 pp197-207 Available at httpswwwresearchgatenetpublication256693140_Technical_review_and_evaluation_of_the_economics_of_water_desalination_ Current_and_future_challenges_for_better_water_supply_sustainability
copy 2016 ERCOT All rights reserved 2
Study on the Demand Response Potential for Seawater Desalination Projects ERCOT Public
While the two existing seawater desalination plants in the US were co-located with power plants to ease compliance with regulations on water intake and discharge structures and reduce costs many other reverse osmosis desalination plants receive their electricity from the grid However plants may have on-site backup generation in case of a power outage This will vary depending on the size and design of the plant and other factors For example the Carlsbad plant in California does have diesel backup generation to power control systems and flushing systems in the case of a power outage The plant in Tampa Bay was not built with backup power due to potential storm surge risks from hurricanes and other storms The plant does use uninterruptible power supply (UPS) backup to power control systems during power outages
Reverse osmosis plants are typically designed with several ldquotrainsrdquo which consists of a high-pressure pump turbine and reverse osmosis membrane Desalination plants are turned on or off one train at a time in a highly controlled process The process of ramping up or down an individual train under normal operations typically takes one to two hours While plants can be designed to handle immediate shutdowns (ie in a power outage) re-starting a system after an interruption would take this amount of time In addition the saline water must be pretreated (ie filtered) before going through the reverse osmosis train and this can sometimes pose constraints on the flexibility of operations
Demand for water is the key factor driving the level of production at seawater desalination plants Typically the plant will have a contract or contracts with municipal or other water users to deliver desalinated water and is operated to meet that demand Alternatively if the plant is municipally owned it would similarly be operated to meet the level of water demand in conjunction with other available water sources If water demands are close to a plantrsquos full capacity the operatorrsquos flexibility to adjust its electricity consumption as part of demand response may be limited However this does mean that plant operations are fairly predictable on a day-to-day basis which is necessary for participation in demand response
The amount of flexibility in plant operations will also be impacted by the amount of water storage available For example if a plant has sufficient water storage on-site or storage within the customerrsquos distribution system it could provide flexibility for the plant to reduce its operations during peak hours when electricity prices are likely to be highest It would also mitigate the impacts of interruptions to production from demand response deployments
22 Seawater Desalination Plant Economics Seawater desalination is typically more expensive than other sources of water and a major driver of the overall cost is energy costs In 2016 the Carlsbad plant charged rates at between $2131 and $2367 per acre-foot78 This charge is intended to cover both the fixed costs of the plant and the variable costs to produce a unit volume of water Typically half to two thirds of the cost of providing desalinated seawater are accounted for by capital cost recovery with the remainder accounted for by operations and maintenance costs including electricity costs Electricity costs can account for 20shy25 of the total costs of seawater desalination with reverse osmosis technology9
Factors affecting the capital cost of a seawater desalination plant include plant size type of desalination process and pre-post-treatment technologies plant infrastructure (eg piping water storage backup power) and compliance with applicable regulations (eg regulations on intake structures brine byproduct disposal) A significant driver of operating and maintenance costs is membrane replacement Reverse osmosis membranes need to be replaced every few years and
7 Source San Diego County Water Authority ldquoSeawater Desalinationrdquo Available at httpwwwsdcwaorgseawater-desalination 8 Note that 1 acre-foot is approximately 325851 gallons 9 Based on technical input from Black amp Veatch
copy 2016 ERCOT All rights reserved 3
Study on the Demand Response Potential for Seawater Desalination Projects ERCOT Public
the rate at which they are replaced will depend on the salinity of the feedwater and how the plant is operated Treatment and disposal of the salty brine byproduct from desalination may also incur operating costs
Electricity costs will vary depending on a range of factors including the size of the plant type of desalination technology source of electricity and quality of the feedwater As previously noted more saline water requires higher amounts of electricity in desalination and thus the amount of electricity consumption is a key difference between brackish water and seawater desalination As a result electricity costs comprise a significant share of the costs of seawater desalination These costs could potentially be defrayed in part by participation in demand response initiatives
3 Demand Response Opportunities in ERCOT
Broadly speaking demand response can be broken down into two major categories dispatchable or non-dispatchable For purposes of this report we will define dispatchable as those demand response events that are initiated by ERCOT and non-dispatchable as an event not specifically initiated by ERCOT These non-dispatchable events may include decisions made by the end-use customer to alter its consumption pattern or may include contractual obligations with another entity such as the end-use customerrsquos retail electric provider (ldquoREPrdquo) to alter consumption patterns
ERCOTrsquos wholesale market is open to several types of dispatchable demand response which are deployed to maintain system reliability Demand-side resources providing Emergency Response Service (ERS) may offer based on either a 10 or 30-minute response time commonly referred to as the ldquoramp periodrdquo Alternatively demand-side resources may register and qualify as a Load Resource that can provide Reserves in the Ancillary Services market The most common service provided by demand-side resources is Responsive Reserve Service which requires an under-frequency relay that can instantaneously interrupt the load during certain system reliability events Some demand-side resources can also participate in other Ancillary Services as Controllable Load Resources that require sophisticated control systems that allow them to be deployed in a more incremental proportional manner
Non-dispatchable demand response in ERCOT can include a response to avoid transmission costs where rates are based on Four Coincident Peak Pricing (4CP) response to wholesale energy prices initiated by the customer or by a REP or other load-serving entity (ldquoLSErdquo) or utility-managed Load Management programs (LM)
The sections that follow provide a description of both ERCOT-dispatched (Section 31) and nonshyERCOT-dispatched (Section 32) demand response For a more detailed description of opportunities for demand-side resources to participate in demand response in ERCOT see ERCOTrsquos guide Load Participation in the ERCOT Nodal Market10
31 ERCOT-Dispatched Demand Response There are two main demand response reliability-based services administered by ERCOT participation by demand-side resources in the Ancillary Services market and participation in ERS These services are dispatched by ERCOT during system emergencies
10 Available at httpwwwercotcomcontentservicesprogramsloadLoad20Participation20in20the20ERCOT20Nodal20Market_302d oc
copy 2016 ERCOT All rights reserved 4
Study on the Demand Response Potential for Seawater Desalination Projects ERCOT Public
Demand-side resources with demand response capability that can meet a set of performance requirements can be qualified to provide Ancillary Services as Load Resources in the Ancillary Services Market The value of having a Load Resource available to reduce load is equal to the value of having a generator available to increase its generation at a generating plant The providers of operating reserves selected to provide Ancillary Services are eligible for capacity payments regardless of whether the Resource is actually deployed (or curtailed in the case of the Load Resource)
ERCOT holds auctions on a daily basis for each of the following Ancillary Services Regulation Up Regulation Down Responsive Reserve and Non-Spinning Reserve11 Table 1 describes the various Load Resource types and their qualification requirements and eligible services
Table 1 Load Resource Types and Ancillary Services
Service Load Resource Type a Qualification Responsive Reserves (le50 of total Reserve requirement)
Non Controllable Under-Frequency Relay and 10-minute ramp to manual dispatch instruction
Responsive Reserves
Controllable Primary Frequency Response and follow 5-minute dispatch instructions
Regulation-Up Regulation-Down
Controllable Primary Frequency Response and respond to Regulation deployments
Non-Spin Reserves Controllable Follow 5-minute dispatch instructions a A Controllable Load Resource is a Load Resource capable of controllably reducing or increasing consumption under dispatch control by ERCOT
Demand-side resources that agree to reduce load when directed by ERCOT and that meet other metering and operational requirements as specified in the ERCOT Protocols may participate in Ancillary Services market auctions As noted in Table 1 the type of Ancillary Service that a Load Resource may provide will depend upon the demand-side resourcersquos response time and metering system as well as other requirements described in the Protocols In the Responsive Reserve and Non-Spin Reserve markets the Load Resource will receive capacity payments regardless of whether or not the load was actually deployed but the load must be available for deployment at any time while providing the service
ERCOT procures ERS to maintain grid reliability during emergency conditions and reduce the likelihood of the need for rotating outages ERS participants may offer to provide demand response with either a 10-minute ramp period requirement (similar to Load Resources providing Responsive Reserve Service) or a 30-minute ramp period requirement ERS Resources do not have the same telemetry and under-frequency relay requirements as Load Resources
11 Regulation Up and Regulation Down service respond to signals from ERCOT every 4 seconds to respond to changes in system frequency full response has to be provided within 5 minutes Responsive reserves must provide their committed capacity either instantaneously in an under-frequency event (eg due to a generator outage) or in energy scarcity conditions within ten minutes following an instruction from ERCOT Non-spinning reserves must provide their committed capacity within 30 minutes based on economic dispatch instructions Non-spinning reserve is used as replacement reserve to replenish other ancillary services and during energy scarcity
copy 2016 ERCOT All rights reserved 5
Study on the Demand Response Potential for Seawater Desalination Projects ERCOT Public
ERS is procured through a request for proposal (RFP) process three times per year for four-month contract terms each of which is further split into smaller time periods based on business cycles and other factors Demand-side resources may choose to submit offers in all time periods or only in those that best fit their unique circumstances and may vary both the price and demand response capacity offers by time period
Payments for ERS are performed up to 80 days after each four month contract term has ended and are subject to downward revision based upon delivered demand response capacity and the demand-side resourcersquos availability during the contract term
32 Non-ERCOT-Dispatched Demand Response The options listed below are not dispatched by ERCOT but they either are controlled directly by a customer or are dispatchable by another entity such as a demand response provider (ldquoDR Providerrdquo) REP or a transmission and distribution utility
Many industrial customers are subject to transmission charges based upon a Four Coincident Peak (4CP) demand The 4CP demand is determined by averaging the consumerrsquos actual demand during the 15-minute settlement interval with the highest ERCOT demand during each of the four summer months (June through September) This measured 4CP demand serves as the basis for the customerrsquos transmission tariff charges for the following year By correctly predicting the ERCOT system peaks during the summer and curtailing load during those intervals a consumer can help reduce the stress imposed on the electric system during peak periods of consumption and reduce its transmission charges for the following calendar year
In the competitive areas of ERCOT consumers can contract with their REP or a DR Provider to have their load respond to the REPrsquos or DR Providerrsquos instructions The contract will usually outline the parameters of this response ndash at what times and frequency demand response events can be called ramp periods sustained response periods compensation etc Because this response is a contractual matter between the REP or DR Provider and the consumer a great deal of variety can be present in these arrangements For example a consumerrsquos response may be voluntary or required compensation could come in the form of reduced energy prices or rebate payments for each curtailment event consumers might be notified up to a day in advance or could have no notification at all (for automated curtailment)
In areas of ERCOT not open to competition interruptible tariffs may be available These tariffs will usually offer a reduced energy price for defined curtailment obligations
REPs may offer dynamic pricing options or consumers within a municipality or cooperative may have their energy prices determined by a published tariff which also may be structured based upon Time-of-Use (TOU) or have a Critical Peak Pricing (CPP) or Peak Time Rebate (PTR) component Self-directed price response refers to consumers making an independent decision to respond to energy prices contained in a governing tariff or in either the ERCOT Day Ahead or Real Time energy markets
TOU offerings will typically have higher energy prices during normal peak periods ndash for example a TOU tariff may charge one price during Monday through Friday from 2 pm through 8 pm and another price during all other times Customers may choose to reduce consumption during these high priced periods Load reduction can be accomplished by load shifting (loads can be shifted by
copy 2016 ERCOT All rights reserved 6
Study on the Demand Response Potential for Seawater Desalination Projects ERCOT Public
rescheduling certain processes or by utilizing thermal storage) ending certain processes that are no longer economic or through energy efficiency measures
Offerings that incorporate CPP usually have prescribed high prices only during certain defined periods ndash for example when load or prices are expected to reach a certain level Response to CPP may be similar to those employed under TOU tariffs especially if CPP is reached frequently More often CPP is infrequent and as such short-term load curtailment may be the more appropriate response to meet economic objectives
4 Demand Response Potential for Seawater Desalination
This section evaluates whether the operational characteristics and economics of seawater desalination plants would enable them to participate in one or more of the various demand response opportunities in the ERCOT Region To date participation of seawater desalination plants in demand response programs has been limited Neither the plant in Carlsbad nor the plant in Tampa Bay participate in demand response programs in California or Florida respectively However as will be described below it appears that these plants can be designed and operated to meet the requirements for participation in demand response and receive economic benefit from participation in these programs
Section 41 describes the operational parameters that must be met for a demand-side resource to provide ERCOT-dispatched demand response and evaluates the ability of seawater desalination plants to meet these criteria Section 42 discusses the tradeoffs between payments for participation in ERCOT-dispatched demand response and potential additional costs posed to seawater desalination plants Finally Section 43 presents other opportunities for seawater desalination plants to reduce their electricity costs outside of ERCOTrsquos reliability-based services that are open to demand response assets
41 Operational Considerations for ERCOT-Dispatched Demand Response There are several key operational parameters that impact a demand-side resourcersquos ability to participate in different demand response services response time recovery time predictability of electrical demand and flexibility of operations This section discusses each of these considerations as they apply to seawater desalination plants
As discussed in Section 31 one of the differentiating factors between ERCOTrsquos demand response products is the amount of time within which a demand-side resource must respond to a deployment instruction to reduce electricity consumption during an event Participation in RRS requires an automatic response within either half a second (ie instantaneous) based on grid frequency or within 10 minutes via a manual instruction ERS requires a response time of either 10 or 30 minutes As noted in Section 21 the typical time to take a reverse osmosis train on- or off-line is 1-2 hours under normal controlled operations To comply with the response time requirements of RRS or ERS a seawater desalination plant would need to be able to reduce its electricity consumption far more quickly than in normal operations This is an element of plant design that would need to be accounted for in the specifications of the project Considerations include the potential need for on-site backup generation including uninterruptible power supply potential impacts to plant infrastructure (eg piping) reverse osmosis membranes and pretreatment systems
The two large US desalination plants provide illustrative counterpoints in this respect The Carlsbad plant was designed to withstand instantaneous power interruptions and has on-site backup generation including uninterruptible power supply to provide the ability to power control systems and flush the membranes in the event of a power loss In contrast the Tampa Bay plant was not
copy 2016 ERCOT All rights reserved 7
Study on the Demand Response Potential for Seawater Desalination Projects ERCOT Public
designed with on-site backup generation and a loss of power would result in a plant shutdown and may require several days to bring the plant back on-line Thus it appears that it is technically possible for a seawater desalination plant to meet the response time requirements for participation in demand response so long as this factor is considered in the design of the facility
The time it takes a desalination train to return to operations after an event is also a consideration Demand-side resources participating in RRS must be able to come back on-line within three hours and those participating in ERS must return within 10 hours Again it appears that it is technically feasible for desalination plants to meet this requirement so long as this requirement is considered in the plant design
An additional consideration is the predictability of a demand-side resourcersquos electricity consumption Participation in the responsive reserves ancillary service market requires bidding in the day-ahead market and thus a demand-side resource must know with great accuracy (within 95) its electrical demand at least a day ahead of time For ERS auctions are held three times a year for four-month contract periods Thus to participate in ERS a resource must know its forecasted electrical demand several months in advance Because seawater desalination plant operations are driven by contracted demand for water it is likely that a plant operator would have a good idea of the plantrsquos electrical demand days or even weeksmonths in advance especially for summer months when demand is likely to be relatively steady An important consideration however is the salinity of the water which drives the electrical requirements and which can be impacted by recent weather events Similarly reductions in demand for water during non-summer months or wet summer days where demand may be reduced could also impact a plantrsquos ability to predict its electricity demand
Finally a seawater desalination plant must have sufficient flexibility in its day-to-day operations so that it can afford to lose several hours of production when deployed for demand response It should be noted that demand-side resources participating in RRS and ERS are called infrequently demand-side resources providing responsive reserves were deployed one time in 2015 and ERS was not deployed that year However this is an important factor to consider if a plant is operating at close to full capacity and would incur financial penalties if it fails to meet its contract obligations due to a demand response event Including additional storage and building a plant with extra capacity could help to mitigate this risk It should also be noted that a plant operator does not need to commit the full plant capacity to these services but rather can specify an amount of MW that will be committed Thus a plant operator could mitigate issues both with predictability and flexibility of plant operations by committing only a portion of its predicted electrical demand to participate in demand response
Considering these factors together it appears that seawater desalination plants could be designed to meet the operational requirements for participation in ERCOTrsquos demand response services (both RRS and ERS) Because the ability to meet the requirements is dependent on the plant design demand response would need to be considered early in a projectrsquos development if participation is desirable Whether project developers will choose to address these requirements will depend on the economic benefits of participation in demand response which will be discussed in the next section
42 Economic Considerations for ERCOT-Dispatched Demand Response This section describes the economic benefits to demand-side resources from participation in ERCOT-dispatched demand response programs The average price paid for a demand-side resource participating in RRS in 2015 was $1087 per MW per hour and for ERS was $645 per MW per hour for the contract periods during the 2015 program year These payments could provide a significant financial benefit to seawater desalination plants To give a simplified example for a plant with an electrical demand of 10 MW operating at a 100 annual load factor (10 MW times 24 hours times 365 days) the annual benefit would be on the order of $500000 for ERS or $1 million for RRS
copy 2016 ERCOT All rights reserved 8
Study on the Demand Response Potential for Seawater Desalination Projects ERCOT Public
In 2015 demand-side resources providing responsive reserves were deployed one time for a duration of 10 minutes and ERS was not deployed12 The most ERS was ever deployed in a single year was two times in 2011 Thus participation in either program could result in a substantial payment to a seawater desalination plant with a relatively low risk of deployment and associated disruption of plant operations although it is important to note that participation in either ERCOT service subjects demand response resources to annual unannounced testing Other than testing the frequency of deployment will depend on grid conditions and is a risk that should be considered
The financial benefits of participation must be weighed against the costs of designing facilities with the capabilities to operate in this manner These include
bull The costs to design the plant to reduce electrical demand within the required timeframes for demand response and to withstand an instantaneous interruption if not already part of the plant design For example a plant may need to be designed to have backup power generation on-site In addition there could also be costs to restart the system after an interruption
bull The costs to build a plant with excess capacity andor storage to make up for lost production hours when demand response is deployed This will add to the total capital costs of the project Land area constraints should also be considered when considering additional storage as the space requirements for the necessary storage capacity could be significant
bull Costs associated with the impact of interruptions on plant processes (eg more frequent replacement of membranes impacts to pretreatment system or plant infrastructure)
bull Potential financial penalties that would be incurred if deployment as part of demand response were to result in failure to meet contract obligations to supply water
bull The loss of potential benefits in the form of cost avoidance from participation in non-ERCOTshydispatched demand response opportunities (see Section 43) If a plant is committed to RRS or ERS the plant operator would lose the flexibility to take advantage of these other opportunities to reduce their electricity costs
The interplay of these benefits and costs will determine whether it would be beneficial for a future seawater desalination plant to participate in demand response in ERCOT
43 Considerations for Non-ERCOT-Dispatched Demand Response Outside of the reliability-based services administered by ERCOT there are other opportunities for seawater desalination plants to reduce their electricity costs As described in Section 321 seawater desalination plants may be able to reduce the demand charges on their electricity bills through curtailing load during 4CP intervals In addition plant operators may adjust operations in response to real-time electricity prices to take advantage of lower off-peak prices and avoid price spikes (see Sections 322 and 323) All of these opportunities require that the plant have flexibility to reduce production during certain times of the day
In the ERCOT region as noted above a portion of transmission and distribution charges are set based on the peak systemwide 15-minute interval of the four summer months (June through September) referred to as the four coincident peaks (4CP) Large customers can reduce or avoid this charge by reducing electrical consumption during these four peak intervals AEP Central Texas and CenterPoint are the transmission providers covering the majority of the Gulf Coast in Texas13
12 ERCOT June 2016 ldquoLoad Resource Deployment Updaterdquo Available at httpwwwercotcomcontentwcmkey_documents_lists870985_RRS_Load_Resource_Deployment_Updatepdf 13 It is also possible that a seawater desalination plant could be located in an area that as not opted in to competition in which case the plant owner would need to negotiate its electricity charges bilaterally with the Non Opt-In Entity (NOIE)
copy 2016 ERCOT All rights reserved 9
Study on the Demand Response Potential for Seawater Desalination Projects ERCOT Public
Assuming a future seawater desalination plant would be connected at transmission-level voltages the relevant 4CP charges based on the 2016 tariffs accounting for both transmission charges and transmission cost recovery factors would be $41425 per 4CP kW for AEP Central Texas and $41870 per 4CP kVA for CenterPoint14 If a seawater desalination plant has 10 MW of load and is capable of interrupting all of it and successfully does so for all four 4CP intervals the savings based on the 2016 tariffs would be approximately $500000 per year ($41425 times 1000 (kW to MW) times 10 MW times 12 months) Thus a seawater desalination plant that reduces its electricity use during the 4CP intervals could avert some or all of these charges
Another opportunity for seawater desalination plants to reduce their electricity costs is through adjusting operations in response to real-time electricity prices In 2015 the average electricity price in ERCOT was $2677MWh However prices exceeded $50MWh in 254 hours (3 of all hours) $100MWh in 88 hours (1) $200MWh in 40 hours (05) and $300MWh in 21 hours (02) Prices exceeded $3000MWh for 021 hours15 Depending on the desalination plantrsquos exposure to real-time wholesale market prices (via its retail contract) the degree of high prices the plant owner is willing to avoid and grid conditions in a given year reducing unit operations in order to avoid high electricity prices could impact operators for anywhere between a few and several hundred hours out of the year In addition a plant can plan its operations to take advantage of lower electricity prices during off-peak periods (eg at night when generation from wind is high) For example at least one company is marketing a modular desalination unit design intended to take advantage of low prices during periods of high renewables generation and to provide grid reliability services through demand response16
There are several factors to consider regarding these opportunities to reduce electricity costs The plant would need to monitor the ERCOT market or hire a contractor to do so in order to know when to reduce demand for electricity These programs do not impose any requirements on response time as with RRS or ERS and there may be sufficient warning of 4CP intervals or peak pricing to allow the plant operator to plan its operations earlier in the day with sufficient time to ramp down production under controlled conditions However quicker ramping capability may be desirable to respond to electricity price fluctuations
For 4CP because the four intervals used to set demand charges are not known ahead of time it is likely that the plant would need to reduce its demand multiple times per summer to ensure the 4CP intervals are hit impacting production at the facility Timing operations to coincide with off-peak pricing or to avoid price spikes would similarly result in reduced operations during certain hours To offset the lost production hours the plant may need to be designed with extra capacity and water storage capability to maintain the ability to meet its contractual obligations for freshwater delivery Because the period of reduced operations is greater than with ERCOT-dispatched demand response services this need would be greater for a seawater desalination plant reducing load during 4CP intervals or in response to real-time electricity prices and would increase the capital costs of the project It should also be noted that high prices in the ERCOT Region typically but not always occur in summer months when drought conditions are more likely to develop and demand for desalinated water is likely to be highest This may limit the flexibility of the plant to time its electricity consumption to avoid high-priced hours
14 Public Utility Commission of Texas ldquoTransmission and Distribution Rates for Investor Owned Utilitiesrdquo Available at httpwwwpuctexasgovindustryelectricratestdraspx 15 Potomac Economics June 2016 2015 State of the Market Report for the ERCOT Wholesale Electricity Markets Available at httpswwwpotomaceconomicscomindexphpmarkets_monitoredERCOT 16 Sisyan LLC ldquoDemand Response Desalinationrdquo Available at httprenewabledesalinationcomwpshycontentuploads201506Demand-Response-Desalinationpdf
copy 2016 ERCOT All rights reserved 10
Study on the Demand Response Potential for Seawater Desalination Projects ERCOT Public
In addition the plantrsquos ability to participate in demand response would also be limited for those hours it is reducing load as part of 4CP response or in response to real-time prices because the plant would not be able to reduce its electricity consumption if that demand is already committed to another demand response service Thus participating in demand response versus taking advantage of these other opportunities may be to some extent mutually exclusive
5 Conclusion
Based on this analysis it appears that the operational characteristics of seawater desalination plants would allow them to participate in demand response opportunities in ERCOT so long as the necessary operational requirements are considered in the design specifications of the plant Project developers should consider the necessary requirements early in the plant design Whether the economic benefits of participation would provide a sufficient incentive for them to do so will depend on the costs of accommodating those operational requirements and whether there is the flexibility available to operate the plant as necessary under these programs Though most existing seawater desalination plants do not participate in demand response programs it does appear that participation by these plants is possible and could result in a financial benefit Table 2 compares the different demand response opportunities available to demand-side resources in ERCOT
Table 2 Comparison of Demand Response Opportunities Demand Response
Opportunity Requirements for
Participation Impacts to Plant
Operations Financial Benefit Ancillary Services ndash Responsive Reserve Service (RRS)
bull Under-Frequency Relay bull Instantaneous or 10 minute
response time bull Recover load within 3
hours bull Bid in day-ahead market
bull Deployed once in 2015 for 10 minutes bull Subject to annual
unannounced testing
bull $1087 per MW per hour (based on 2015 prices)
Emergency Response Service (ERS)
bull 10 or 30 minute response time bull Recover load within 10
hours bull Four-month contract term
bull Not deployed in 2015 the most times ever deployed in a single year was twice in 2011 bull Subject to annual
unannounced testing
bull $645 per MW per hour (based on 2015 prices)
Four Coincident bull Interval Data Recorder bull Likely plant will need to bull Avoid ~$48000 per 4CP Peak (4CP) (IDR) meter
bull Ability to predict system-wide peak demand hours during summer months
reduce load multiple times per summer to hit 4CP intervals bull Likely to be able to predict
possible 4CP intervals earlier in day
MW per year (based on 2016 tariffs) if successful in reducing during all four summer months
LSE or DR Provider Contracted Price Response
bull Varies based on contractual arrangements
bull Varies based on contractual arrangements
bull Varies based on contractual arrangements
Self-Directed Price bull Retail contract with bull Varies depending on bull Varies depending on Response exposure to real-time
market prices bull Ability to monitor real-time
prices in ERCOT wholesale market
number and severity of pricing events bull May be able to predict
peak pricing events earlier in day
number and severity of pricing events
copy 2016 ERCOT All rights reserved 11
Study on the Demand Response Potential for Seawater Desalination Projects ERCOT Public
Demand response programs in ERCOT provide opportunities for demand-side resources to defray their electricity costs and provide reliability benefits to the ERCOT electric grid Because the process of seawater desalination is energy intensive participation in demand response could help to reduce electricity costs while posing a relatively low risk to plant operations if demand response participation is factored into plant design
Participation in non-ERCOT-dispatched demand response opportunities such as reducing load during 4CP intervals or in response to real-time electricity prices may also help to reduce electricity costs for seawater desalination plants in Texas As stakeholders in Texas continue to plan for possible future droughts in the region and identify water management strategies consideration of demand response could play a role in mitigating some costs associated with seawater desalination and allow seawater desalination plants to assist with maintaining electric reliability in the region
copy 2016 ERCOT All rights reserved 12
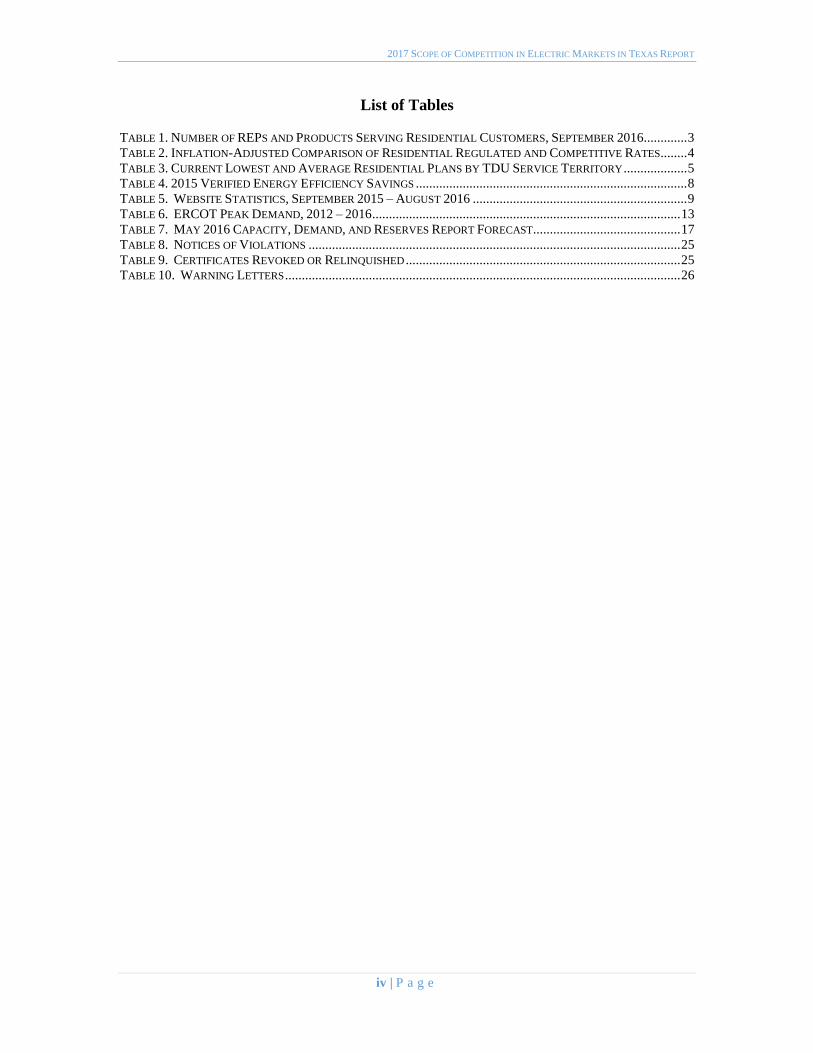
2017 SCOPE OF COMPETITION IN ELECTRIC MARKETS IN TEXAS REPORT
List of Tables
TABLE 1 NUMBER OF REPS AND PRODUCTS SERVING RESIDENTIAL CUSTOMERS SEPTEMBER 20163 TABLE 2 INFLATION-ADJUSTED COMPARISON OF RESIDENTIAL REGULATED AND COMPETITIVE RATES4 TABLE 3 CURRENT LOWEST AND AVERAGE RESIDENTIAL PLANS BY TDU SERVICE TERRITORY5 TABLE 4 2015 VERIFIED ENERGY EFFICIENCY SAVINGS 8 TABLE 5 WEBSITE STATISTICS SEPTEMBER 2015 ndash AUGUST 2016 9 TABLE 6 ERCOT PEAK DEMAND 2012 ndash 201613 TABLE 7 MAY 2016 CAPACITY DEMAND AND RESERVES REPORT FORECAST17 TABLE 8 NOTICES OF VIOLATIONS 25 TABLE 9 CERTIFICATES REVOKED OR RELINQUISHED 25 TABLE 10 WARNING LETTERS26
iv | P a g e
2017 SCOPE OF COMPETITION IN ELECTRIC MARKETS IN TEXAS REPORT
List of Figures
FIGURE 1 PERCENTAGE OF OBSERVABLE SWITCHING BY CUSTOMER CLASS 3
FIGURE 4 MONTHLY AVERAGE NATURAL GAS PRICES SEPTEMBER 2014 ndash AUGUST 201611 FIGURE 5 LOAD-WEIGHTED AVERAGE REAL-TIME MONTHLY SETTLEMENT POINT PRICES SEPTEMBER
FIGURE 2 TOTAL ELECTRIC COMPLAINTS RECEIVED SEPTEMBER 2014 ndash AUGUST 2016 6 FIGURE 3 ELECTRIC COMPLAINTS RECEIVED BY CATEGORY SEPTEMBER 2014 ndash AUGUST 2016 7
2014 ndash AUGUST 2016 12 FIGURE 6 HIGH LOAD HOURS IN ERCOT 2011 ndash 2016 13 FIGURE 7 MONTHLY PEAK DEMAND IN ERCOT JANUARY 2014 ndash AUGUST 201614 FIGURE 8 ENERGY USE IN ERCOT BY RESOURCE TYPE 201515
v | P a g e
2017 SCOPE OF COMPETITION IN ELECTRIC MARKETS IN TEXAS REPORT
I EXECUTIVE SUMMARY
This year marks 15 years since the opening of the Texas retail electric market in
2002 brought about by the passage of Senate Bill 7 by the Texas Legislature which began
the project of restructuring the Texas electricity market In the 15 years since the market
opening the Public Utility Commission of Texas (Commission) has overseen the
transformation of the Texas electric landscape from one of incumbent utilities to a thriving
electric market in the Electric Reliability Council of Texas (ERCOT) region This Scope
of Competition in Electric Markets Report will provide a review of the activities the
Commission has undertaken during the last two years to continue to foster market
competition improve the customer experience and promote infrastructure to deliver
electricity to power the lives of Texans
Under the Commissionrsquos oversight the Texas retail market remains the national leader in competitive residential commercial and industrial offerings with the highest
number of competitors and product variety in the country As of March 2016 in the portion
of the state that is open to customer choice 92 of all customers had exercised their ability
to switch providers
On average residential retail rates in the competitive areas of Texas have declined
since 2014 to prices as low as 45 cents per kilowatt-hour (kWh) compared to a nationwide
average of 1345 cents per kWh in 2016 In addition wholesale market prices in Texas
have fallen 21 since 2013
Alongside the Commissionrsquos work refining the retail market the Commission has
also focused on continuing to enhance the customer experience by adapting to
technological changes as well as evaluating market mechanisms to ensure that the
wholesale market is as efficient and reliable as possible To further its objective of reliable
affordable and efficient power for Texas industry and residents the Commission has
several ongoing projects focused on promoting efficient and sustainable outcomes in the
wholesale market
On August 11 2016 the ERCOT region broke the previous all-time record for peak
demand with customers across the region using 71093 Megawatts (MW) of electricity in
part because of hot weather across the state Power generation was sufficient to meet this
record level of demand
This Report summarizes the continuing trends affecting competition in the electric
industry It highlights the effects of competition on rates customer protection and
complaint issues oversight and enforcement action and other noteworthy Commission
activities This Report concludes with suggestions for the Legislaturersquos consideration that
may facilitate continued efficiency and promote the Commissionrsquos objective of providing high quality service to Texans
1 | P a g e
2017 SCOPE OF COMPETITION IN ELECTRIC MARKETS IN TEXAS REPORT
II STATE OF THE COMPETITIVE MARKET
Overview
In the 15 years since the implementation of customer choice in Texas customers
continue to enjoy the benefits of a competitive market a plethora of retail electric providers
offering innovative products designed to meet the needs of residential commercial and
industrial customers The diversity of retail electric providers and products has created a
robust competitive market that continues to provide Texas customers with low electricity
prices With Senate Bill 7 the Texas Legislature put in place a foundation for a restructured
electric market that continues to set the standard across this nation Because of SB 7
Texas remains the national leader in competitive electric markets The Commission will
continue to oversee the competitive electric market in Texas to ensure that it stays true to
the foundation created by SB 7 and that it provides Texans with the reliable competitively
priced electricity they have come to expect
Retail Market Development and Prices
1 Customer Choice
The Commission has continued to guide improvements of the Texas competitive
retail electric market in which customers are able to choose which electric rates and
services best suit their needs from Retail Electric Providers (REPs) which sell electricity
to the end-use customer The number and diversity of REPs competing for customers
provides an indicator of the health of the retail market Since the publication of the 2015
Scope of Competition in Electric Markets Report the number of REPs and competitive
offers in ERCOT has remained stable As of September 2016 109 REPs were operating
in ERCOT providing 440 total unique products 97 of which solely support electricity
generated from 100 renewable sources1
Because of the number of providers and plans available from which customers can
choose Texas continues to be recognized as the most successful competitive retail market
in North America as demonstrated by its first-place rank for the past eight years in the
Annual Baseline Assessment of Choice in Canada and the United States a scorecard that
compares the retail competitiveness of electric markets in the US states and Canadian
provinces2
The number of REPs serving residential customers and the associated number of
product offerings by transmission and distribution utility (TDU) in the ERCOT grid are
shown in Table 1
1 Public Utility Commission wwwpowertochooseorg
2 Annual Baseline Assessment of Choice in Canada and the United States Distributed Energy
Financial Group July 2015 Available at httpwwwcompetecoalitioncomfilesABACCUS-2015-vfpdf
2 | P a g e
2017 SCOPE OF COMPETITION IN ELECTRIC MARKETS IN TEXAS REPORT
Table 1 Number of REPs and Products Serving Residential Customers September 2016
TDU Service Territory3 Residential
Suppliers
Number of
Products
AEP Central 52 355
AEP North 49 295
CenterPoint 55 400
Oncor 55 390
Sharyland ndash McAllen 14 103
Sharyland Utilities 22 155
TNMP 49 320
2 Retail Prices
Together the REPs in the competitive market serve 6153293 residential
customers 1053032 commercial customers and 4336 industrial customers4 In this
highly competitive retail market 92 of all customers have exercised their ability to switch
REPs since the market opening in 2002 Figure 1 depicts the percentage of customers in
each customer class who have switched REPs at least once since 2002
Figure 1 Percentage of Observable Switching by Customer Class5
3 American Electric Power ndash Texas Central Company (ldquoAEP Centralrdquo) American Electric Power ndash Texas North Company (ldquoAEP Northrdquo) CenterPoint Energy (ldquoCenterPointrdquo) Oncor Electric Delivery Company (ldquoOncorrdquo) Sharyland Utilities (ldquoSharyland ndash McAllenrdquo serves McAllen Texas and ldquoSharyland Utilitiesrdquo serves Stanton Brady and Colorado City) and Texas-New Mexico Power (ldquoTNMPrdquo)
4 ERCOT Provider of Last Resort Counts March 31 2016 Available at
httpwwwercotcomcontentwcmkey_documents_lists89277POLR_Counts_Energy_2016_Reportingx
lsx
5 ERCOT Supplemental Information - Retail Electric Market April 2015ndashMarch 2016 Available
at
httpercotcomcontentwcmkey_documents_lists89277Observed_Selection_of_Electric_Providers_Mar
ch_2016pptpptx
3 | P a g e
2017 SCOPE OF COMPETITION IN ELECTRIC MARKETS IN TEXAS REPORT
The success of the competitive market is highlighted in Table 2 which compares
the last regulated retail rate with the current lowest 12-month fixed retail offering per 1000
kWh in each region adjusted for inflation Since 2001 average retail rates across Texas
have decreased 63 percent
Table 2 Inflation-Adjusted Comparison of Residential Regulated and Competitive Rates
TDU Service
Territory6
Last Regulated
Rate (2001)
centkWh7
Last Regulated
Rate Adjusted for
Inflation
Current
Lowest Fixed
Price8
Percentage
Change
AEP Central 96 131 56 ndash5725
AEP North 100 136 50 ndash6324
CenterPoint 104 141 54 ndash617
Oncor 97 132 45 ndash6591
TNMP 106 144 50 ndash6528
The average lowest available residential price across the competitive market was
51 cents per kilowatt-hour (kWh) in September 2016 and the average across all plans
available in the competitive market in Texas was 98 cents per kWh 9 Moreover rates in
ERCOT have not only decreased since Texasrsquo transition to the competitive market but both fixed and variable rates have continued to be much lower than nationwide averages
of 1345 cents per kWh in July 2016 and 1362 cents per kWh in July 201510
Table 3 compares the current lowest fixed price available for residential service in
each TDU service territory with the average price of plans available and the nationwide
average excluding Texas
6 Sharyland Utilities was formed shortly before the market opening to serve part of McAllen
Texas it is not included in this table because of its limited number of customers at that time In Docket No
21591 Sharyland Utilities committed that its average bundled residential rates would not exceed those of
Central Power amp Light Company (now AEP Central)
7 Association of Electric Companies of Texas Available at httpwwwaectnetinside-the-charts-
prices-available-in-the-competitive-market-today-well-below-the-last-regulated-rate
8 The current lowest fixed price available for a residential plan in each TDU service territory as of
September 2016 for a 12-month plan without time-of-use features prepaid features or a minimum usage
fee for a fixed month-to-month rate for a customer who expects to consume approximately 1000 kWh of
electricity a month Available at wwwpowertochooseorg
9 This average is for a residential customer expecting to consume approximately 1000 kWh of
electricity each month Available at wwwpowertochooseorg
10 The nationwide average is for July 2016 and includes all US states except Texas Source US
Energy Information Administration Average Retail Price of Electricity Electricity Data Browser July
2016 Available at httpwwweiagovelectricitydatacfm
4 | P a g e
2017 SCOPE OF COMPETITION IN ELECTRIC MARKETS IN TEXAS REPORT
Table 3 Current Lowest and Average Residential Plans by TDU Service Territory
TDU Service
Territory
Current Lowest
Fixed Price
(centkWh)11
Current Average
All Available
Plans12
Nationwide
Average13
AEP Central 56 94
1345
AEP North 50 94
CenterPoint 54 91
Oncor 45 83
Sharyland ndash McAllen 56 98
Sharyland Utilities 45 133
TNMP 50 92
3 Customer Complaints
The Commissionrsquos rules permit a customer to file a complaint with the Commission
about their electric service The Commissionrsquos staff works with the customer and electric service provider to resolve the complaints first in an informal complaint process and then
directs the customer to a formal complaint process if the customer is dissatisfied with the
resolution The Commission keeps records of these complaints and evaluates the
complaint statistics as a barometer for analyzing company behavior and its effect on
customers The Commission uses the data to identify any company-specific trends work
with companies to address any issues or otherwise take enforcement action
From September 1 2014 to August 31 2016 the average number of days to resolve
a utility complaint was 18 days The slight decline in the number of electric complaints
received in 2015 through 2016 may be attributed to the mild winter weather which resulted
in lower overall prices as well as the absence of significant disruptions to electric service
Figure 2 shows the total complaints received from September 1 2014 to August 31 2016
11 The current lowest fixed price available for a residential plan in each TDU service territory as of
September 2016 for a 12-month plan without time-of-use features prepaid features or a minimum usage
fee for a fixed month-to-month rate for a customer who expects to consume approximately 1000 kWh of
electricity a month Source wwwpowertochooseorg
12 The average is for a residential customer expecting to consume approximately 1000 kWh of
electricity a month Source wwwpowertochooseorg
13 The nationwide average is for July 2016 and includes all US states except Texas Source US
Energy Information Administration Average Retail Price of Electricity Electricity Data Browser July
2016 Available at httpwwweiagovelectricitydatacfm
5 | P a g e
2017 SCOPE OF COMPETITION IN ELECTRIC MARKETS IN TEXAS REPORT
Figure 2 Total Electric Complaints Received September 2014 ndash August 2016
From September 1 2014 to August 31 2016 the Commission received 4465
electric complaints Billing complaints continue to be the greatest cause of customer
complaints with 42 of all electric complaints concerning billing issues Complaints
relating to the provision of service including customer service and the refusal of service
were the second highest cause of complaints at 15 Quality of service contributed to the
third-leading cause of complaints at 12 Complaints are broken down by category in
Figure 3
6 | P a g e
2017 SCOPE OF COMPETITION IN ELECTRIC MARKETS IN TEXAS REPORT
Figure 3 Electric Complaints Received by Category September 2014 ndash August 2016 14
4 Energy-Efficiency Programs
Energy-efficiency programs in Texas are administered by the TDUs in ERCOT and
the vertically integrated utilities outside of ERCOT pursuant to the Public Utility
Regulatory Act (PURA) sect39905 The utilities recover the cost of the energy-efficiency
programs through a surcharge on electric bills which are adjusted and approved annually
by the Commission Under the energy-efficiency programs TDUs reduced 559369 MWh
of electricity consumption in 2015 exceeding the goal for the year by 40 The energy-
efficiency programs are designed to reduce customersrsquo energy consumption as well as
electric peak demand In 2011 SB 1125 increased the peak demand goal reduction to a
30 growth in demand Once a utility reaches this goal the utility must achieve a
reduction of four-tenths of one percent of the utilityrsquos summer weather-adjusted peak
demand in subsequent years
The 2011 legislation also required that the Commission develop an evaluation
measurement and verification (EMampV) framework to promote effective program design
to provide consistent and streamlined reporting and to retain a third-party contractor to
conduct these activities EMampV efforts for the 2015 program year focused on evaluating
targeted programs for which the associated peak demand and energy savings were most
uncertain A primary component of EMampV is the statewide Technical Reference Manual
(TRM) a single common reference document prepared and maintained by the EMampV
contractor to estimate energy and peak demand savings resulting from the installation of
14 ldquoCrammingrdquo is the practice of adding unauthorized charges for any services to an electric bill without verified consent by the customer ldquoSlammingrdquo is the practice of switching the customer to another provider without authorization
7 | P a g e
2017 SCOPE OF COMPETITION IN ELECTRIC MARKETS IN TEXAS REPORT
energy efficiency measures sponsored by utility-administered programs in Texas In 2015
changes made to the TRM added and updated existing deemed savings values and added
standardized EMampV protocols for determining and verifying energy and demand savings
effective for the 2016 program year Verified demand and energy savings and program
costs for 2015 are shown in Table 4
Table 4 2015 Verified Energy Efficiency Savings15
MW MWh MW MWh
El Paso Electric 1231 22283 1116 19552 $4039278
Entergy Texas 1809 39688 1550 27156 $7023009
SPS 817 14537 549 9627 $3190744
SWEPCO 988 15262 560 9811 $3220359
Non-ERCOT Total 4844 91770 3775 66146 $17473390
AEP Central 4378 68482 1293 22653 $13261480
AEP North 454 12289 426 7464 $2727260
CenterPoint 16849 188255 5883 103069 $35832993
Oncor 11581 178908 6940 121589 $47438836
Sharyland 060 2528 100 1752 $633252
TNMP 866 17452 5770 10109 $4011627
ERCOT Total 34188 467915 15219 266636 $103905448
Grand Total 39033 559685 18994 332782 $121378838
Excludes Statewide EMampV contractor expenses of approximately $3M for review of prior program year
GoalProgram CostUtility
Verified Savings
In 2015 the utilities cumulatively achieved 206 of the demand reduction goal
(226 for utilities in ERCOT) and 168 of the energy reduction goal (175 for utilities
in ERCOT)
5 Customer Education Activities
The Commission engages with residential and small commercial electric customers
about retail electric competition through its ldquoTexas Electric Choicerdquo campaign and also informs customers about energy conservation opportunities through its ldquoPower to Save Texasrdquo campaign In addition to engaging with customers through these two campaigns
Commission staff also respond to customer inquiries and distribute literature about
electricity facts and issues
15 The non-ERCOT utilities within the state of Texas are El Paso Electric Company (ldquoEl Paso Electricrdquo) Entergy Texas Inc (ldquoEntergy Texasrdquo) Southwestern Public Service Company (ldquoSPSrdquo) and Southwestern Electric Power Company (ldquoSWEPCOrdquo)
8 | P a g e
2017 SCOPE OF COMPETITION IN ELECTRIC MARKETS IN TEXAS REPORT
a ldquoPower to Chooserdquo
The Commission educates customers about the evolving marketplace continuing
its ldquoTexas Electric Choicerdquo campaign which began in February 2001 with the goal of educating Texans about the changes and choices in the retail electric market The
PowerToChooseorg website and its Spanish-language counterpart PoderDeEscogerorg
provides a simple one-stop shop portal for Texans who live in a service territory open to
customer choice to enter in their zip code and browse through the numerous plans offered
by the REPs
b ldquoPower to Save Texasrdquo
In addition to the ldquoTexas Electric Choicerdquo campaign and the PowerToChoose website the Commission has also continued its statewide initiative ldquoPower to Save
Texasrdquo together with its parallel Spanish-language initiative ldquoPoder de Ahorrarrdquo which educates Texans about conserving energy during the summer peak times of 3 pm to 7
pm when the demand for electricity tends to be the highest The PowerToSaveTexasorg
website and its Spanish-language counterpart PoderDeAhorrarTexasorg provide Texans
with energy saving tips for homes and businesses
As part of the Power to Save Texas campaign the Commission contracted with
Resource Action Programs (RAP) to develop and implement a middle school energy
conservation outreach program in Hidalgo Harris Dallas and Tarrant counties In the
2015 ndash 2016 school year the program provided an effective energy education program
which strongly supports the Texas Essential Knowledge and Skills (TEKS) curriculum
standards as well as engages students through school challenges and at-home activities
c Campaign Outreach
PowerToChooseorg and its Spanish-language counterpart PoderDeEscogerorg
have proven valuable in educating customers about customer choice in the electricity
market The Commission conducted a number of activities to further promote the statersquos official electric choice website through social media community events trade shows and
expos From September 1 2015 through August 31 2016 nearly a million potential
customers visited the PowerToChooseorg and PoderDeEscogerorg websites Website
statistics are contained in Table 5
Table 5 Website Statistics September 2015 ndash August 2016
PowerToChoosecom Unique Visitors 980473
PoderDeEscogercom Unique Visitors 4652
d Low-IncomeElderly Outreach and Collaboration with Faith- and
Community-Based Organizations
Throughout 2015 and 2016 the Commissionrsquos staff also worked with legislative
offices and faith- and community-based organizations to provide educational materials and
training to help their constituents better understand the deregulated electric market and the
9 | P a g e
2017 SCOPE OF COMPETITION IN ELECTRIC MARKETS IN TEXAS REPORT
Commissionrsquos websites The Commission has actively participated with the Interagency
Coordinating Group (ICG) which was established by the Texas Legislature to expand and
improve relationships between state government and faith- and community-based
organizations Information on customer assistance programs such as LITE-UP Texas was
provided to community organizations such as Legal Aid of Northwest Texas senior
activity centers and religious groups
e Call Center
The Commission has trained its Customer Protection Division staff who are fluent
in both English and Spanish to answer customer calls and to assemble and mail
informational packets comparing electric plans when requested by customers without
Internet access From September 2015 to August 2016 the Customer Protection Division
staff handled 7663 calls from customers requesting assistance with shopping
f Educational Literature
In addition to the educational materials on the Commissionrsquos website the Commission provides brochures fact sheets and other educational materials by mail and
e-mail through a network of community organizations and events and in response to
customer requests to the call center Up-to-date fact sheets are available on the
Commissionrsquos website PowertoChooseorg and PoderDeEscogerorg as part of the
campaignrsquos outreach efforts The fact sheets provide information on a number of current
industry and consumer topics
Throughout 2015 and 2016 campaign educational materials promoting the
agencyrsquos programs including Power to Choose and Power to Save Texas were distributed
at numerous community events and civic town hall events such as Hurst-Euless-Bedford
ldquoBack 2 Schoolrdquo day Dickenson Housing Family Fair Energy Day DFW Family Fair
Earth Day Texas Texas Home and Garden shows in Houston Texas Black Expo National
Night Out events and minor league baseball games
Wholesale Market Development
The Commission engages regularly with ERCOT to oversee market developments
and ensure system supply reliability security and improved price formation and market
outcomes Market design changes made as a result of this working relationship have
created new opportunities for a variety of generation resources to enter the market and
supported the formation of wholesale prices that reflect real-time market conditions more
accurately and therefore improve the efficiency of the market
1 Wholesale Market Prices
Wholesale market prices have fallen in comparison to prices seen in the 2012 ndash 2014 period The ERCOT load-weighted real-time average price of energy in 2015 was
$2677 per Megawatt-hour (MWh) a 34 decrease from the average price in 2014 and a
decrease of 21 from the average seen in 2013
10 | P a g e
2017 SCOPE OF COMPETITION IN ELECTRIC MARKETS IN TEXAS REPORT
Falling wholesale prices are correlated with the current trend of lower natural gas
prices the primary fuel of many of the regionrsquos power plants The average Houston Ship Channel spot price for natural gas was 41 lower in 2015 than in 2014 decreasing from
$437MMBtu in 2014 to $258 in 2015 Through March the average price for 2016 has
fallen to $192MMBtu Natural gas price trends from September 2014 through August
2016 are shown in Figure 4
Figure 4 Monthly Average Natural Gas Prices September 2014 ndash August 2016
Monthly average wholesale electricity prices are shown in Figure 5 Load-
weighted prices are calculated by dividing the price at a load zone by the associated
demand This metric provides a useful proxy for the actual wholesale prices paid by load16
16 It is worth noting that most power in ERCOT is sold through various bilateral arrangements that
are designed to hedge daily real-time market price risk
11 | P a g e
2017 SCOPE OF COMPETITION IN ELECTRIC MARKETS IN TEXAS REPORT
Figure 5 Load-Weighted Average Real-Time Monthly Settlement Point Prices September 2014 ndash August 2016
Another component of the real-time price of electricity is the cost of transmission
congestion Transmission congestion occurs when there is insufficient transmission
capacity to dispatch energy in a least-cost fashion The recent build-out of additional
transmission lines in areas of high congestion has partially relieved the cost burden in these
areas particularly in West Texas where oil and gas production growth rapidly increased
the demand for electricity resulting in relatively higher zonal prices
2 Peak Demand
After the very high peak demand levels during the hot summer of 2011 peak
demand in ERCOT was lower in 2012 through 2014 In 2015 peak demand again
increased though not to 2011 levels with load exceeding 60000 MW for 330 hours and
exceeding 65000 MW for 91 hours as shown in Figure 6 below In 2016 ERCOT
experienced a record week in August which saw the previous record peak demand broken
six times and the ERCOT region hit its all-time peak demand of 71093 MW on August
11 2016
As peak demand has increased the recorded availability of generation supply in the
region during times of high load has decreased slightly Physical Responsive Capability
(PRC) analogous to the amount of reserves available on the system at any given time fell
below 3000 MW for 269 hours in 2015 up slightly from 213 hours in 2014 and 215
hours in 2013 but well below the 371 hours recorded during the 2011 summer
12 | P a g e
2017 SCOPE OF COMPETITION IN ELECTRIC MARKETS IN TEXAS REPORT
Figure 6 High Load Hours in ERCOT 2011 ndash 2016
As shown in Table 6 the ERCOT system peak demand was 69877 MW in 2015
up 5 from the 2014 peak and the 2016 ERCOT system peak demand increased 174
from the peak demand of the previous year
Table 6 ERCOT Peak Demand 2012 ndash 2016
Year
ERCOT Peak
Demand (MW)
Percentage Change
from Prior Year
2012 66548 ndash 2013 67245 105
2014 66454 ndash118
2015 69877 515
2016 71093 174
Figure 7 shows the hourly peak load for each month in ERCOT from January 2014 to
August 2016
13 | P a g e
2017 SCOPE OF COMPETITION IN ELECTRIC MARKETS IN TEXAS REPORT
Figure 7 Monthly Peak Demand in ERCOT January 2014 ndash August 2016
3 Generation Diversity
As electricity consumption has increased in ERCOT the diversity of the systemrsquos generation portfolio has also increased Generators participating in the statersquos renewable energy credit (REC) trading program reported an 11 increase in renewable generation
from 2013 to 2015 rising from 376 million MWh to 469 million MWh with wind
representing 96 of the total renewable mix Landfill gas was the second most prevalent
renewable source representing approximately 12 of all renewable generation in 2015
Energy produced from wind generation was up by 13 in 2015 from 2013 and solar
energy capacity more than doubled from 121 MW in 2013 to 288 MW in 2015 Coal-fired
generation has been steadily shrinking as a proportion of total generation declining from
37 of electricity produced in 2014 to 28 in 2015 Energy use in the ERCOT region by
fuel type for 2015 is shown in Figure 8
14 | P a g e
2017 SCOPE OF COMPETITION IN ELECTRIC MARKETS IN TEXAS REPORT
Figure 8 Energy Use in ERCOT by Resource Type 2015
The Commissionrsquos projects are further described in the following section of this report
15 | P a g e
2017 SCOPE OF COMPETITION IN ELECTRIC MARKETS IN TEXAS REPORT
III SUMMARY OF COMMISSION ACTIVITIES FROM 2015 TO 2016
Introduction
The Commission develops and modifies rules policies and procedures for the
competitive electric market in Texas in response to the technological advances in the
industry and the evolving needs of customers The Commission also continues to carry
out oversight of programs with which the Legislature has tasked it ndash such as energy
efficiency renewable energy and advanced metering infrastructure Within the
ERCOT region the monopoly wires-and-poles companies that provide transmission
and distribution services throughout the grid remain subject to traditional rate
regulation by the Commission The Commission continues to set rates for these
utilities as they are not subject to the forces of market competition This section
provides an overview of the Commissionrsquos activities in its oversight of the wholesale and retail electric markets as well as its governance over regulated electric utilities
Resource Adequacy
Resource adequacy is the long-term ability of the system to serve demand reliably
when consumption is highest given the available installed capacity load resources and
the operational reliability of the system Assessing resource adequacy requires comparing
the systemrsquos forecast installed capacity and load resources against the forecast peak
summer load The difference between the forecast of available generation and load
resources and the forecasted demand for electricity is referred to as an ldquoinstalled capacity
reserve marginrdquo which is an indicator of the ability of the system to meet customer demand
during peak conditions In addition to evaluating the forecast reserve margin assessing
resource adequacy includes evaluating the systemrsquos operational reliability The systemrsquos operational reliability depends on the ability of generators to manage plant operations
successfully as well as the grid operatorrsquos ability to manage the system to avoid or to mitigate load curtailment During 2015 and 2016 the ERCOT system performed well with
respect to resource adequacy The Commission has devoted significant attention to
ensuring that ERCOT maintains an adequate installed capacity reserve margin and a high
level of operational reliability developing a wholesale market design that allows
consumers to continue to receive low-cost and reliable electricity over the long term
1 Capacity Demand and Reserves Report
The Capacity Demand and Reserves (CDR) Report published by ERCOT semi-
annually is a snapshot estimate of long-term supply and demand and the associated annual
reserve margin for peak summer and winter conditions While the CDR Report is not a
forecast of any particular outcome it provides insight into possible resource adequacy
trends
16 | P a g e
2017 SCOPE OF COMPETITION IN ELECTRIC MARKETS IN TEXAS REPORT
The May 2016 CDR Report shows estimated reserve margins well above the
current target reserve margin of 1375 Installed capacity reserve margin estimates taken
from this CDR Report are shown below in Table 7
Table 7 May 2016 Capacity Demand and Reserves Report Forecast
Forecast 2017 2018 2019 2020 2021 2022 2023 2024 2025 2026
Peak Load
(MW)
68548 69409 70795 71420 72098 72792 73482 74168 74864 75704
Total
Capacity
(MW)
80995 87019 87238 87407 87678 87738 87738 87728 87728 87728
Reserve
Margin
182 254 232 224 216 205 194 183 172 159
2 Operating Reserve Demand Curve
In ERCOT the price signals produced by the energy-only wholesale electric market
should provide incentives to promote short-term reliability as well as induce optimal long-
run investment in new resources If the prices are efficient and reflect the full cost of
dispatching resources to meet demand the benefits that accrue to both consumers and
producers can be maximized at the least cost and new generating capacity (or load
resources) should develop to maintain the equilibrium as old resources retire or demand
increases
The Operating Reserve Demand Curve (ORDC) implemented at the Commissionrsquos direction in June 2014 improves price formation by allowing prices to more fully reflect
the value of operating reserves The ORDC assigns an economic value to operating
reserves or the amount of extra capacity available to maintain system reliability on a daily
basis
As part of its ongoing review of resource adequacy in ERCOT the Commission is
currently evaluating the accuracy of the inputs to the ORDC to ensure that its contribution
to price formation appropriately reflects the costs of meeting demand and the underlying
needs of the system
3 Transmission Congestion
Although competitive power producers and regulated transmission providers form
two distinct segments of the market transmission buildout has a direct effect on wholesale
power prices When there is insufficient transmission capacity to dispatch energy in a least-
cost fashion the system operator takes action to ensure that the physical limits of the
transmission system facilities are not violated The re-dispatch of generation because of
transmission limits results in disparate prices at different locations on the system In
comparison to prior years transmission congestion in ERCOT has lessened because of the
large increase in transmission investment and the reduction of high demand related to oil
and gas production in West Texas ERCOT and the Commission continually evaluate the
need for cost-effective additional transmission investment to manage congestion
17 | P a g e
2017 SCOPE OF COMPETITION IN ELECTRIC MARKETS IN TEXAS REPORT
4 Wholesale Market Design Initiatives
While the ERCOT wholesale market has been successful in attracting new resource
investment and also maintaining competitive prices for consumers certain improvements
to the market design could yield additional benefits in terms of efficient price formation
and opportunities for entry of new technology Initiatives already in place in many other
regions such as real-time co-optimization and multi-interval real-time resource dispatch
may allow existing capacity to be used more effectively and create opportunities for the
integration of additional load resources to serve electric demand The Commission
continues to work with ERCOT and interested stakeholders to determine the value of
implementing such enhancements particularly as ERCOTrsquos resource mix changes over time
5 Reliability Standard
In early 2014 the Commission opened a project to review its use of a target installed
capacity reserve margin based on a reliability standard equivalent to one loss-of-load event
every ten years In this project the Commission received written comment from interested
parties conducted a public workshop consulted with independent experts and reviewed
the application of reliability standards in other regions As a result of this review future
reliability metrics to be estimated in ERCOT will include the market equilibrium reserve
margin the economically-optimal reserve margin and the associated levels of expected
unserved energy The Commission believes that publishing these metrics represents an
improvement over reporting a one-event-in-ten-years standard by enhancing insight into
expected outcomes in ERCOTrsquos energy-only market
Non-ERCOT Utilities Market Development Activities
SB 7 the law that introduced retail competition to the Texas market in 1999
granted the Commission authority to delay retail competition in an area where deregulation
would not result in fair competition and reliable service because of the lack of an
independent organization to coordinate the electric system and the concentration of
ownership in the generation sector in some of those areas Consequently SB 7 included
provisions recognizing the difficulty of implementing retail competition in areas outside of
ERCOT Therefore the utilities outside of the ERCOT region remain vertically integrated
owning generation transmission and distribution assets as well as selling power to end-
use customers These vertically integrated utilities remain subject to traditional regulation
including rates set by the Commission and customer choice is not offered in the service
territories of these utilities
The Commission does continue to monitor ongoing activities in the non-ERCOT
portions of the state In 2015 the Legislature granted the Commission the authority to
retain counsel and consulting experts in order to participate in legal proceedings at the
Federal Energy Regulatory Commission (FERC) which has regulatory jurisdiction over
wholesale power sales and transmission rates outside of ERCOT This authority has
18 | P a g e
2017 SCOPE OF COMPETITION IN ELECTRIC MARKETS IN TEXAS REPORT
permitted the Commission to participate more effectively in FERC proceedings affecting
Texasrsquo utilities located outside of ERCOT
1 Southwest Power Pool
The Southwest Power Pool (SPP) is the Regional Transmission Operator (RTO) for
areas of Northeast Texas and the Texas Panhandle In Texas the utilities Southwestern
Electric Power Company (SWEPCO) Southwestern Public Service (SPS) and several
electric cooperatives and municipally owned utilities are in SPP In addition to these areas
of Texas the SPP footprint includes parts of New Mexico Arkansas Missouri Nebraska
Louisiana and all of Kansas and Oklahoma In 2015 SPP became the RTO for the
Integrated System and neighboring areas which includes parts of Iowa Minnesota North
Dakota South Dakota Wyoming and Montana SPP has spent extensive time and
resources over the last two years to integrate these new areas successfully The expansion
added 5000 MW of peak demand 7600 MW of generating capacity and 9500 miles of
transmission lines17
In 2014 SPP launched its new Integrated Marketplace which provides a Day-
Ahead Market a Real-Time Balancing Market and Congestion Hedging Markets
mechanisms similar to those available in ERCOT The implementation of the Integrated
Marketplace resulted in a savings of $422 million in 2015 As a result of the Integrated
Marketplace SPPrsquos planning reserve margin will be reduced from 136 to 12 a change
expected to save about $90 million annually
Chairman Donna L Nelson represents the Commission as a voting member on
SPPrsquos Regional State Committee (RSC) The RSC provides collective state regulatory
agency input on a variety of issues In addition the RSC has authority over the cost
allocation methodologies for transmission upgrades allocation of Financial Transmission
Rights and the approach used for resource adequacy across the SPP region The RSC
regularly meets on a quarterly basis and meets more frequently if necessary
2 Midcontinent Independent System Operator
The Midcontinent Independent System Operator (MISO) is an RTO that serves all
or part of 15 states in the central US one Canadian province and the portion of eastern
Texas served by the vertically integrated utility Entergy Texas Inc MISO provides a Day
Two market which has a variety of functions and services including energy and ancillary
service markets economic dispatch congestion management financial transmission rights
and transmission planning The MISO Independent Market Monitor concluded that the
MISO wholesale markets were competitive in 2015
Like SPP MISO is in the Eastern Interconnection which crosses state boundaries
and is therefore subject to FERC jurisdiction A number of recent FERC proceedings have
17 2015 Southwest Power Pool Annual Report Available at
httpswwwspporgdocuments37800201520southwest20power20pool20annual20reportpdf
19 | P a g e
2017 SCOPE OF COMPETITION IN ELECTRIC MARKETS IN TEXAS REPORT
affected the portion of Texas that is in the MISO footprint The Commission through
outside counsel has been an active party in such FERC proceedings FERC Docket No
ER14-1174 addressed in part a dispute regarding the availability of transmission capacity
under the Joint Operating Agreement between MISO and the SPP Ultimately FERC
approved a settlement agreement under which MISO will compensate SPP and its members
for using their or other entitiesrsquo transmission systems
In a related pending docket at FERC Docket No ER14-1736 parties are addressing
how the cost of these payments will be allocated among MISO market participants Parties
in this proceeding are engaged in settlement discussions In addition in Docket No ER14-
75-000 FERC approved a settlement agreement among the participating Entergy
Operating Companies and their retail regulators to terminate the Entergy System
Agreement effective August 31 2016 The settlement terms prohibit any post-termination
payments that roughly equalize production costs among the operating companies after
December 31 2015 terminate certain specific cross-purchase power agreements between
Entergy Texas and former Entergy Gulf State Louisiana and permit the continuation of
several other purchase power agreements
Commissioner Kenneth W Anderson Jr represents the Commission as a voting
member in the Organization of MISO States (OMS) the purpose of which is to coordinate
regulatory oversight among the states in the MISO region and to make recommendations
to MISO FERC and other entities Commissioner Anderson also represents the
Commission as a voting member of the Entergy Regional State Committee (ERSC) which
has certain FERC-approved authority for five years after the Entergy integration with
regard to cost allocation for Entergy transmission projects and adding transmission projects
to the Entergy construction plan The ERSC meets quarterly
3 Western Electricity Coordinating Council
The Western Electricity Coordinating Council (WECC) is a Regional Entity whose
region includes the area surrounding El Paso and extends from Canada to Mexico
including the provinces of Alberta and British Columbia the northern portion of Baja
California and all or portions of the 14 Western states in between WECC is the Regional
Entity responsible for Bulk Electric System reliability in the Western Interconnection and
associated compliance monitoring and enforcement WECC does not have organized
markets outside of California but is organized into 38 separate balancing authorities
WECC is geographically the largest and most diverse of the eight Regional Entities in the
United States with delegated authority from the North American Electric Reliability
Corporation (NERC) and the Federal Energy Regulatory Commission In Texas El Paso
Electric Company is a member of WECC
Rulemaking Activities
The Commission has continued to adopt new rules and modify existing rules in
order to further the continued successful operation of the competitive retail and wholesale
markets and to comply with statutory changes made to PURA by the Legislature This
20 | P a g e
2017 SCOPE OF COMPETITION IN ELECTRIC MARKETS IN TEXAS REPORT
section of the Report provides a high-level overview of the Commissionrsquos key rulemaking
activities highlighting the market improvements made in 2015 and 2016
1 Cost Recovery and Rate Adjustment
The Commission adopted new rule 16 TAC sect25246 on June 29 2016 to
implement Section Nos 1 through 3 of House Bill 1535 of the 84th Legislature The new
rule only applies to a utility that operates solely outside of ERCOT and allows for the use
of an update period beyond the test year for which the utility initially files estimated
information The rule clarifies that all information originally estimated must be updated
with actual information and also provides requirements for a post-test-year adjustment for
a natural gas-fired plant A non-ERCOT utility also is required to initiate a new base rate
case on or before the four year anniversary of the final order in the utilityrsquos most recent comprehensive base rate case or if the commission determines that the utility has
materially earned more than its authorized rate of return in two consecutive years The rule
also provides requirements and procedures for the relation back of final rates to an effective
date 155 days after the filing of the rate application
2 Changes to Certificates of Convenience and Necessity and CREZ Rule
The Commission conducted a rulemaking to implement changes pursuant to
Legislative mandates in SB 776 SB 933 and HB 1535 of the 84th Legislature SB 776
required municipally owned utilities to apply for a certificate of convenience and necessity
(CCN) before constructing transmission facilities outside the boundaries of the
municipality that owns the municipally owned utility SB 933 also requires persons to
obtain a CCN before interconnecting a tie line into the ERCOT grid HB 1535 requires the
Commission to issue a final order within 181 days for a non-ERCOT utility requesting a
CCN for an existing electric generating facility and 366 days after a non-ERCOT utility
files a CCN for a newly constructed generating facility In addition the Commission also
determined in this rulemaking that all future transmission projects in a Competitive
Renewable Energy Zone (CREZ) must meet the need criteria of PURA sectsect 37056(c)(1)
and (2) rather than being exempt Finally the Commission determined that the CREZ
project established in 2008 was complete following the installation of a second circuit on
a Sharyland line
3 Use of Handheld Device for Enrollment
As the market evolves the Commission evaluates market changes balancing its
desire to encourage customer-focused innovation with its concern for customer protection
against potential abuses In Docket No 44518 the Commission granted a REP a
temporary 12-month waiver from its rules requiring the marketer to obtain telephonic
verification of the customerrsquos desire to switch REPs as well as a waiver from certain authorization disclosure requirements among other stipulations the Commission placed
upon the REP The Commission then opened Project No 45625 to study the issue of REPs
utilizing hand-held devices for customer enrollment more broadly and engage with market
representatives consumer representatives and other stakeholders The Commission
anticipates considering an amendment to its rules in the spring of 2017
21 | P a g e
2017 SCOPE OF COMPETITION IN ELECTRIC MARKETS IN TEXAS REPORT
4 Smart Meter Texas Portal
The electric utilities in Texas that have advanced metering systems (AMS) jointly
own and operate a single web portal known as Smart Meter Texas (SMT)18 SMT fulfills
two requirements imposed by the Commissionrsquos advanced metering rule on a utility with
AMS (1) provide to the retail customer the REP serving the customer and other entities
authorized by the customer access to such retail customerrsquos consumption data and (2)
allow devices at the customerrsquos premises to communicate through a home area network with the advanced meter at the premises SMT also facilitates near real-time on-demand
reads of a customerrsquos meter that aids prepaid service offered by certain REPs
In Project No 42786 Review of Advanced Metering System Web Portal
Commission staff and stakeholders examined options for the long-term operational
structure governance and funding of SMT The Commission determined that ownership
of SMT should remain with the TDUs because they can operate the portal at a lower cost
than transferring the data repository to ERCOT The Commission opened two
rulemakings one to ascertain the appropriate governance performance and funding of
SMT and a second to determine the appropriate access for third parties ensuring that
customers have the freedom to grant and give third parties access to their data if made
knowingly while also securing customer privacy
Sharyland Utilities
In early 2015 customers of Sharyland Utilities the smallest investor-owned
transmission and distribution utility in ERCOT began to file with the Commission a
significant number of complaints regarding high electricity bills In response the
Commission opened Project No 44592 Relating to a Project Regarding Sharyland
Utilities to provide for a more formal process for Commission review of the large number
of complaints As part of this project Commission staff prepared a report to evaluate the
electricity rates and electric bills in the operating area of Sharyland Utilities that was
previously part of Cap Rock Energy
Staffrsquos report found that a number of factors contributed to the comparatively high
bills for many of Sharyland-Cap Rockrsquos customers First Sharylandrsquos small size and its low customer density result in high TDU rates for all customers relative to other TDUs In
particular Staffrsquos report found that Sharyland-Cap Rockrsquos rates for distribution service are
up to three times higher than those of other TDUs in Texas In addition to Sharyland-Cap
Rockrsquos high costs for distribution service higher wholesale transmission costs also
contributed to the rate increases charged to Sharyland-Cap Rockrsquos customers These transmission costs are the result of increased transmission investment in recent years
throughout Texas that has increased transmission costs for all distribution providers
18 The participating Texas TDUs are AEP Texas Central Company and AEP Texas North Company (jointly
ldquoAEPrdquo) CenterPoint Energy Houston Electric LLC (ldquoCenterPointrdquo) Oncor Electric Delivery Company LLC (ldquoOncorrdquo) and Texas-New Mexico Power Company (TNMP) collectively referred to as the ldquoJoint TDUsrdquo Operation of an AMS web portal was addressed in the orders approving particular utilitiesrsquo deployment of AMS and approving surcharges for AMS cost recovery While Sharyland Utilities filed comments in the proceeding it did not
participate as it had not fully completed its AMS deployment at the time
22 | P a g e
2017 SCOPE OF COMPETITION IN ELECTRIC MARKETS IN TEXAS REPORT
including Sharyland Utilities Second the comparatively colder winter of 2014 ndash 2015
which was the time period generally consistent with the timeframe in which the
Commission began receiving complaints appeared to result in higher electricity usage than
normal This combination of high TDU rates and the higher electricity usage led to higher
bills for customers
Staffrsquos report also noted that in Sharyland-Cap Rockrsquos last rate case in 2014 the
approved rates reflected movement towards more cost-based rates for all customers
including some customers that previously had been heavily subsidized by other customers
Additionally in the process of standardizing Sharyland-Cap Rockrsquos customer classification
with the classifications of the other TDUs in Texas some customers may have experienced
a move from one class that previously was paying below-cost rates to another class that
was now paying above-cost rates For some of these customers the combined effects of
the movement towards cost-based rates and the change to a different class may have
contributed to a significant change in the customersrsquo rates Regardless of any cost-shifting
between customer classes Sharylandrsquos rates remain two to three times higher than those of other TDUs in Texas for all customers in all classes
On December 4 2015 the Commission signed an order directing Sharyland to file
an application for a comprehensive rate review by April 30 2016 Sharyland filed its rate
application on April 29 2016 in Docket No 45414 Review of the Rates of Sharyland
Utilities LP On October 10 2016 the Commission ordered Sharyland to file an amended
application as soon as practicable but no later than January 1 2017 to reflect the unique
aspects of the companyrsquos organizational structure as a real estate investment trust (REIT) At the time of publication Sharyland is expected to file its amended application in
December 2016
PowerToChoose Website
As part of its ongoing evaluation of the competitive market the Commission
opened Project No 45730 to evaluate the functionality and usability of its PowerToChoose
website which allows customers to select a REP and an electric plan based on their zip
code In the process the Commission received significant feedback from customers stating
that the Commissionrsquos PowerToChoose website was an important tool that plays a
fundamental role in their shopping process In response to the feedback received from
industry representatives and consumers Commission staff changed how the website sorts
and filters retail electric plans adding a filter to allow customers to unselect plans that
contain minimum usage fees or credits This filter is now a default setting and plans with
minimum usage fees and credits are not shown unless the customer actively selects to
search for such plans In addition Commission staff made other changes to increase the
clarity of the REP complaint rating The Commission continues to evaluate other changes
to improve the customer experience of the PowerToChoose website and provide
transparency for retail electric plans
23 | P a g e
2017 SCOPE OF COMPETITION IN ELECTRIC MARKETS IN TEXAS REPORT
Report on Alternative Ratemaking Mechanisms
In 2015 the Legislature enacted SB 774 which requires the Commission or its
consultant to conduct a study and make a report to the Legislature analyzing the alternative
ratemaking mechanisms adopted by other states In addition SB 774 extended the
authorization for the Periodic Rate Adjustment (PRA) mechanism from 2017 to 2019
which the Legislature had authorized in 2011 (SB 1693) as a version of an alternative
ratemaking mechanism that provides to utilities a means for expedited recovery of
distribution infrastructure costs Pursuant to SB 774 the Commission retained a consultant
to produce the report and the consultantrsquos recommendations included streamlining the ratemaking process to reduce procedural costs providing for a periodic review of the
prudency of the costs and using certain types of alternative ratemaking mechanisms that
decouple the recovery of costs from variations in load The Commission held a public
hearing to receive comments on the report from stakeholders and after consideration of
those comments has provided to the Legislature the consultantrsquos report together with its
own discussion of the report
Request for Purchase of Oncor Electric Delivery Company
In March 2016 the Commission approved with conditions an application by an
investor group led by Hunt Consolidated Inc the owners of Sharyland Utilities to acquire
control of Oncor Electric Delivery Company (Oncor) the largest transmission and
distribution utility in Texas from Oncorrsquos parent company Energy Future Holdings which
is in bankruptcy The Commission approved the request subject to certain conditions
including stipulations regarding the organization of the new entities and treatment of tax
benefits The investor-led group subsequently declined to pursue the transaction that was
approved by the Commission
In September 2016 NextEra Energy which owns Florida Power amp Light received
approval from the United States Bankruptcy Court in Delaware for its plan to purchase
Oncor In October 2016 NextEra Energy filed an application with the Commission in
Docket No 46238 for approval of the proposed transaction The Commission will evaluate
the application to determine if the transaction is in the public interest
Integration of Lubbock Power and Light
In March 2016 the Commission opened Project No 45633 to study and identify
the issues related to the request of Lubbock Power and Light the statersquos third-largest
municipally owned utility to be integrated into ERCOT The Commission is currently
working with stakeholders ERCOT and SPP to determine the cost and benefits of any
potential switch by Lubbock Power and Light into ERCOT and whether such a switch is
in the public interest
24 | P a g e
2017 SCOPE OF COMPETITION IN ELECTRIC MARKETS IN TEXAS REPORT
Desalination Project ERCOT Studies
In 2015 the Legislature passed HB 4097 which directed the Commission and
ERCOT to study whether existing transmission and distribution planning processes are
sufficient to provide adequate infrastructure for seawater desalination projects and to study
the potential for desalination projects to participate in demand response opportunities in
the ERCOT market Pursuant to that direction ERCOT staff have prepared a report on the
feasibility of interconnection of large desalination projects and on opportunities for such
projects to participate in ERCOTrsquos demand response programs which is attached to this Report in Appendix B
Oversight and Enforcement Actions
The Commissionrsquos enforcement of statutes rules and orders applicable to entities
under its jurisdiction serves to protect consumers the electric markets the reliability of the
electric grid and to promote fair competition The Commissionrsquos enforcement efforts in the electric industry focus on violations of PURA the Commissionrsquos rules and ERCOT
protocols
During the period from January 2015 through August 31 2016 the Commission
assessed $3258500 in penalties against electric market participants Table 8 provides a
summary of electric industry Notices of Violation since January 2015 During 2015 and
2016 Commission staff opened 212 investigations for the electric industry and closed 177
investigations
Table 8 Notices of Violations
Violation Type Total Penalty Amount
Retail Market Violations $539000
Service Quality Violations $451500
Wholesale Market Violations $2268000
TOTAL $3258500
In addition to the imposition of administrative penalties the Commission uses other
enforcement mechanisms in exercising its enforcement duties including revoking a
companyrsquos certificate to operate In addition some companies may be required to relinquish a certificate as part of a settlement after enforcement action has proceeded
Table 9 provides a breakdown of the number of certificates revoked or relinquished In
2016 the Commission revoked the certificate of the REP TruSmart Energy
Table 9 Certificates Revoked or Relinquished
Type Number
Certificates Revoked 1
Certificates Relinquished 0
25 | P a g e
2017 SCOPE OF COMPETITION IN ELECTRIC MARKETS IN TEXAS REPORT
The Oversight amp Enforcement division also issues warning letters to companies in
the electric market when it determines that a violation occurred but given the
circumstances surrounding the violation and other mitigating concerns no administrative
penalty is warranted During 2015 and 2016 the Oversight amp Enforcement division issued
50 warning letters Finally the Commission generally seeks to reimburse money directly
to customers when appropriate In 2015 and 2016 the Commission ordered the
reimbursement of $8543596 to Texas electric customers
Table 10 Warning Letters
Warning Letter Type Number
Retail Market Warning Letter 8
Service Quality Warning Letter 1
Wholesale Market Warning Letter 41
TOTAL 50
In addition to its enforcement activities the Commission also enters into voluntary
mitigation plans with generators that request one through a contested case proceeding
pursuant to PURA sect15023(f) and 16 TAC sect25504(e) The Commission entered into one
voluntary mitigation plan during 2015 and 2016 in Docket No 44635
Low-Income Discount System Benefit Fund
The System Benefit Fund (SBF) was originally established in 1999 to fund
discounts to low-income customers customer education activities energy-efficiency and
weatherization and electric market oversight through a nonbypassable surcharge on retail
electric bills HB 1101 of the 84th Legislature provided that the SBF be sunset on
September 1 2017 by which time the SBF is intended to be exhausted In the 2016 Fiscal
Year (FY) $325521250 was appropriated in the SBF to provide a 25ndash31 percent discount
to low-income customers over a 12-month period
To assist the drawdown of the remaining balance HB 1101 authorized the
Commission to use any unexpended SBF balance in FY 2017 to assist low-income
customers The Commission estimates that the remaining SBF balance will be
approximately $17 million by August 31 2017 The Commission has determined that this
amount is insufficient to fund the rate reduction program however the Commission will
spend approximately $100000 to continue automatic enrollment in the program to provide
REPs a list of customers eligible to receive late fee waiver and deposit installment benefits
These two ancillary benefits of the rate reduction program will continue for the duration of
FY 2017
26 | P a g e
2017 SCOPE OF COMPETITION IN ELECTRIC MARKETS IN TEXAS REPORT
Homeland Security
The Commission assesses the efforts of ERCOT and utilities to defend against
mitigate and respond to the variety of risks that the modern electricity system faces The
Commission also meets with ERCOT utilities and governmental entities on an ongoing
basis to discuss preparation for everything from hurricanes and other severe weather to
cyber-threats and threats of physical damage to the grid from accidents or intentional
malfeasance In addition the Commission monitors industry and federal programs that
address homeland security issues
The Commission serves as an information liaison between state government and
electric utilities during emergencies The Commissionrsquos main roles include
Conveying outage and service restoration information from electric utilities to
state government
Conveying service restoration priorities (hospitals water treatment facilities
etc) from state government to electric utilities and
Facilitating the clearance of downed power lines in disaster re-entry areas and
facilitating entry of electric utilities into disaster areas
The Commissionrsquos Emergency Management Response Team (EMRT) provided staff at the
State Operation Center for the May 2015 and April 2016 flooding events in Texas as well
as additional staffing for severe winter weather
Demand Response
ERCOT staff have begun to report annually on the participation of customers in
REP-sponsored demand response programs These programs which have been facilitated
by the deployment of smart meters throughout the competitive areas within ERCOT and
by many municipal and cooperative electric utilities take the form of rebates for reduction
in usage during peak period time-of-use pricing real-time volumetric price compensation
for load reduction and direct control of customer load among other plans
These programs have seen dramatic increases in participation since ERCOT began
to gather this information in 2013 From 2013 to 2014 the number of residential customers
participating in these programs increased from 151793 to 721273 and the number of
commercial and industrial customers participating rose from 30275 to 50205 The
Commission continues to monitor ERCOTrsquos stakeholder process for efforts relating to the integration of demand response
27 | P a g e
2017 SCOPE OF COMPETITION IN ELECTRIC MARKETS IN TEXAS REPORT
IV LEGISLATIVE RECOMMENDATIONS
A Determination of Low-Income Customer Eligibility
In 2015 HB 1101 required that all remaining funds in the System Benefit Fund
(SBF) be expended that the fee that funded the program as a nonbypassable surcharge on
electric bills be set at zero and that the SBF be sunset on September 1 2017 Per the
provisions of HB 1101 the SBF fee was set at zero in September 2016 concluding the
funding for the program The sunset of the SBF program also concluded the relationship
between the Texas Health and Human Services Commission (HHSC) and the Commission
in which the HHSC provided to the Commission eligible electric customers for the SBF
low-income discount Because of the termination of the relationship with HHSC with the
termination of the SBF the Commission will no longer be able to determine easily an
electric customerrsquos eligibility for other low-income programs such as late penalty waivers
and the option of paying an electric deposit over multiple months
The Legislature may wish to consider easing low-income customers access to these
low-income programs by facilitating the process used to determine eligibility The
Commission offers four possible approaches in which the Legislature could continue these
low-income programs
(1) Authorize HSSC to provide identification of eligible low-income customers to the
Commission
(2) Allow retail electric providers (REPs) to provide such low-income programs using
the Low Income Discount Administratorrsquos (LIDA) Telecommunications Lifeline
Service Program list to identify low-income customers
(3) Require REPs to offer such low-income programs with customers self-enrolling
and REPs verifying income eligibility or
(4) Allow REPs to voluntarily provide such low-income programs at their own
discretion
B Outside Counsel for Proceedings before Regional Transmission
Organizations
Regional Transmission Organizations (RTO) manage the power grid across wide
regions of the United States Most of Texas is inside the ERCOT region however there
are significant portions of East Texas and the Panhandle that are in the Midcontinent
Independent System Operator (MISO) and the Southwest Power Pool (SPP) Issues arise
in these other RTOs that have significant impact on Texas ratepayers such as how
transmission infrastructure costs will be shared These tend to be very lengthy and
complicated proceedings that require specialized legal and consulting services
28 | P a g e
2017 SCOPE OF COMPETITION IN ELECTRIC MARKETS IN TEXAS REPORT
PURA sect 394525 currently authorizes the Commission to use outside consultants
auditors engineers or attorneys to represent the Commission in proceedings before the
Federal Energy Regulatory Commission This provision has been an important tool for the
Commission to respond to complex matters in the federal arena to enable it to protect the
public interest in Texas The PUC recommends that the Legislature expand the language
in this statute to include the ability to hire outside assistance for proceedings before other
RTOs to provide those same protections to Texas ratepayers in those areas
C Repeal of Natural Gas and Renewable Energy Mandates
1 Natural Gas
PURA sect 399044 establishes natural gas as ldquothe preferential fuelrdquo in Texas for electricity generation and requires the Commission to adopt rules to establish a system of
natural gas energy trading credits The majority of all new non-renewable electricity
generation constructed since 2000 for Texas has used natural gas as a primary fuel and this
trend is expected to continue in the foreseeable future The thresholds used to trigger the
natural gas energy trading credit system in PURA sect 399044 have not been reached and
they are not expected to be reached in the foreseeable future
Because natural gas-fueled facilities have been the most commonly built new
generation in Texas for many years and are expected to continue to be there is no need to
establish incentives for natural gas generation The PUC recommends that the Legislature
consider repealing PURA sect 399044 because it is no longer necessary
2 Renewable Energy
PURA sect 39904 establishes goals for renewable energy Subsection (a) requires
the installation of 5880 megawatts of renewable energy by 2015 and Subsection (b)
establishes a renewable energy credits trading program to implement the requirement The
5880 megawatts mandates in Subsection (a) was met in 2008 While the Commission
believes the renewable energy trading credit program is needed for retail electric providers
to validate renewable energy marketing claims the Commission believes the 5880
megawatts mandate in Subsection (a) is no longer necessary
D Advisory Opinions
Many regulatory agencies in Texas have authority to issue informal guidance to the
persons they regulate particularly with respect to outlining whether a particular course of
conduct would in the agencyrsquos view be consistent with the laws and regulations that the agency administers19 The issuance of an advisory opinion can provide regulatory clarity
to a company before making investments or conducting operations the permissibility of
which may be unclear under state law The Legislature may want to consider granting the
19 In addition certain federal agencies such as the Federal Communications Commission
Internal Revenue Service Securities and Exchange Commission and Federal Election
Commission have authority to issue advisory opinions
29 | P a g e
2017 SCOPE OF COMPETITION IN ELECTRIC MARKETS IN TEXAS REPORT
Commission the authority to issue advisory opinions In the electric industry providing
clarification to a company concerning issues such as the purchase of assets or the
acquisition of another company could allow it to avoid expensive regulatory proceedings
without impairing the Commissionrsquos authority The following state agencies have statutory authority to issue advisory opinions
Texas Ethics Commission20
Texas Medical Board21
State Board of Dental Examiners22
Texas Board of Nursing23
Texas Board of Professional Engineers24
Texas Lottery Commission and25
Texas Securities Board26
E Administrative
Gross Receipts Assessment
PURA sect 16001 provides for a gross receipts assessment that is used to defray the
expenses incurred by the Commission to administer PURA An assessment of one sixth of
one percent is collected from public utilities electric cooperatives retail electric providers
and interexchange carriersrsquo gross receipts from consumers The funds from this assessment
are remitted to the general revenue fund but currently they have not been explicitly
dedicated to funding of the Commission In contrast similar assessments on water
utilities insurance companies and other regulated entities have traditionally been used to
explicitly fund the underlying regulatory programs at the respective agencies The
Commission is one of four Article VIII agencies that is not designated as self-funded
The Commission recommends that the Legislature designate the Commission as a
self-funded agency whereby the collected assessments would be explicitly dedicated to the
funding of the agency Implementing this recommendation would require the Public Utility
Commission to be included in the Appropriations Limited to Revenue Collections rider
located in the Special Provisions Relating to All Regulatory Agencies section of the
General Appropriations Act Designation as a self-leveling agency would require the
Commission to set the gross receipts assessment at a rate sufficient to generate revenue in
the amount of the agencyrsquos general revenue appropriation each fiscal year which would require a statutory change to PURA sect16001(b) Based upon the Commissionrsquos baseline budget request authorizing the PUCrsquos self-leveling designation would result in an overall
estimated tax reduction of $456 million per year or 774
20 Government Code sect 571091 21 Occupations Code sect 162107 22 Occupations Code sect 258157 23 Occupations Code sect 301607 24 Occupations Code sect 1001601 25 Occupations Code sect 2001059 26 Tex Rev Civ Stat Ann Arts 581-28-1 amp 581-35 7 Tex Admin Code 1012
30 | P a g e
2017 SCOPE OF COMPETITION IN ELECTRIC MARKETS IN TEXAS REPORT
V APPENDICES
31 | P a g e
2017 SCOPE OF COMPETITION IN ELECTRIC MARKETS IN TEXAS REPORT
Appendix A ndash Acronyms
AEP American Electric Power
AMS Advanced Metering System
CenterPoint CenterPoint Energy Houston Electric LLC
DG Distributed Generation
DRG Distributed Renewable Generation
ERCOT Electric Reliability Council of Texas
ERSC Entergy Regional State
ERS Emergency Response Service
ETI Entergy Texas Inc
IMM ERCOT Independent Market Monitor
kWh Kilowatt-hour
LMP Locational Marginal Pricing
LSP Large Service Provider
MISO Midwest Independent System Operator
MMBtu One million British Thermal Unit (BTU)
MW Megawatt
MWh Megawatt-hour
Nodal Texas Nodal Market Design
ORDC Operating Reserve Demand Curve
PGC Power Generation Company
POLR Provider of Last Resort
PURA Public Utility Regulatory Act
REP Retail Electric Provider
RSC Regional State Committee
RTO Regional Transmission Organization
SCED Security Constrained Economic Dispatch
Sharyland Sharyland Utilities LP
SBF System Benefit Fund
SPP Southwest Power Pool
TDU Transmission and Distribution Utility
TNMP Texas-New Mexico Power Company
32 | P a g e
2017 SCOPE OF COMPETITION IN ELECTRIC MARKETS IN TEXAS REPORT
Appendix B ndash ERCOT Desalination Report
This page intentionally left blank
33 | P a g e
ERCOT Public
Study on the Demand Response Potential for Seawater Desalination Projects
ERCOT November 18 2016
Study on the Demand Response Potential for Seawater Desalination Projects ERCOT Public
Executive Summary
In 2015 the 84th Texas Legislature enacted House Bill (HB) 4097 which included several provisions relating to seawater desalination projects including a requirement that the Public Utility Commission of Texas (PUC) and Electric Reliability Council of Texas (ERCOT) study the potential for seawater desalination projects to participate in existing demand response opportunities in ERCOT There are several demand response products in which demand-side resources (ie consumers of electricity) can participate These programs help to preserve system reliability and provide economic benefits to participating demand-side resources Seawater desalination is an energy-intensive process that removes salt and other minerals from salt water to produce fresh water for municipal consumption industrial use or irrigation Participation in demand response could help mitigate electricity costs for future seawater desalination projects in Texas and provide reliability benefits to the grid
There are two main demand response reliability-based services administered by ERCOT participation by demand-side resources in the Ancillary Services market and the Emergency Response Service (ERS) Within the Ancillary Services market the most common service provided by demand-side resources is Responsive Reserve Service (RRS) which requires resources to respond either instantaneously or within 10 minutes in response to unplanned system emergencies ERS is separate from ERCOTrsquos Ancillary Services market and allows demand-side resources and distributed generation to provide reliability services in the event of an energy emergency Resources can qualify for either the 10-minute or 30-minute response time ERS programs
There are several key considerations that will impact a demand-side resourcersquos ability to participate in different demand response opportunities response time recovery time predictability of electrical demand and flexibility of operations Considering these factors together it appears that seawater desalination plants could be designed to meet the requirements for participation in demand response Because the ability to meet the qualification requirements is dependent on the plant design demand response opportunities should be considered early in a projectrsquos development if participation is desirable
Whether project developers will choose to address these requirements will depend on the economic benefits of participation There may be additional costs to design seawater desalination plants to operate in the manner required in order to participate in demand response These include costs associated with additional plant design specifications need for excess capacity and storage to make up for lost production during demand response deployment operational costs resulting from interruptions to plant processes and potential financial penalties if demand response deployment results in failure to meet contract demands The interplay of the benefits of participation and these costs will determine whether it would be beneficial for a future seawater desalination plant to participate in demand response in ERCOT
To date participation of seawater desalination plants in demand response programs has been limited Because the process of seawater desalination is energy-intensive participation in demand response could help to reduce electricity costs while posing a relatively low risk to plant operations As stakeholders in Texas continue to plan for possible future droughts in the region and identify water management strategies consideration of demand response could play a role in mitigating some costs associated with seawater desalination and allow seawater desalination plants to assist with maintaining electric reliability in the region
copy 2016 ERCOT All rights reserved i
Study on the Demand Response Potential for Seawater Desalination Projects ERCOT Public
Table of Contents
1 Introduction 1
2 Seawater Desalination 2
21 Seawater Desalination Plant Operations 2
22 Seawater Desalination Plant Economics 3
3 Demand Response Opportunities in ERCOT 4
31 ERCOT-Dispatched Demand Response 4
311 Ancillary Services Markets 5
312 Emergency Response Service (ERS) 5
32 Non-ERCOT-Dispatched Demand Response 6
321 Four Coincident Peak (4CP) 6
322 LSE or DR Provider Contracted Price Response 6
323 Self-Directed Price Response 6
4 Demand Response Potential for Seawater Desalination 7
41 Operational Considerations for ERCOT-Dispatched Demand Response 7
42 Economic Considerations for ERCOT-Dispatched Demand Response 8
43 Considerations for Non-ERCOT-Dispatched Demand Response 9
5 Conclusion 11
copy 2016 ERCOT All rights reserved ii
Study on the Demand Response Potential for Seawater Desalination Projects ERCOT Public
1 Introduction
In 2015 the 84th Texas Legislature enacted House Bill (HB) 4097 which included several provisions relating to seawater desalination projects including a requirement that the Public Utility Commission of Texas (PUC) and Electric Reliability Council of Texas (ERCOT) study the potential for seawater desalination projects to participate in existing demand response opportunities in ERCOT ERCOT and the PUC initiated this study to fulfill that requirement and evaluated the operational and economic characteristics of seawater desalination plants in light of ERCOTrsquos primary demand response products1
ERCOT is the independent system operator (ISO) for the ERCOT Interconnection which encompasses approximately 90 of demand for electricity in Texas ERCOT is the independent organization established by the Texas Legislature to be responsible for the reliable planning and operation of the electric grid for the ERCOT Interconnection ERCOT also administers and maintains a forward-looking open market to provide affordable and reliable electricity to consumers in Texas In collaboration with market participants ERCOT has developed demand response products and services for customers that have the ability to reduce or modify electricity use in response to instructions or signals These programs help preserve system reliability and provide economic benefits to participating demand-side resources
The process of seawater desalination removes salt and other minerals from salt water to produce fresh water for consumption industrial processes or irrigation The drought-prone Texas climate coupled with projections for increasing water demand in the state has created interest in seawater desalination as a future water source The 2017 Texas State Water Plan includes seawater desalination as a future water management strategy for water users in the state However the seawater desalination process is energy intensive and electricity consumption can be a significant cost driver for these projects To the extent that these plants could participate in demand response it would help to defray these costs Thus there is a potential nexus between seawater desalination projects built in Texas to mitigate drought but which have large electricity requirements and ERCOT demand response opportunities which could help to reduce their electricity costs and provide reliability benefits
This study evaluates the demand response potential of seawater desalination plants based on their operational characteristics and economic drivers The report is organized as follows
Section 2 provides background on typical seawater desalination plant operations and economics
Section 3 describes the current demand response opportunities in ERCOT
Section 4 evaluates the characteristics of seawater desalination plants to determine their potential to participate in demand response opportunities in ERCOT and
Section 5 provides a summary of the conclusions of this study
1 In the course of developing this report ERCOT consulted with several desalination experts with experience with existing or planned seawater desalination plants in the US The technical experts consulted included Jorge Arroyo (Water Management Consultant) Andrew Chastain-Howley (Black amp Veatch) Jonathan Loveland (Black amp Veatch) Ron Parker (Black amp Veatch) John Wolfhope (Freese and Nichols) and Srinivas Veerapaneni (Black amp Veatch)
copy 2016 ERCOT All rights reserved 1
Study on the Demand Response Potential for Seawater Desalination Projects ERCOT Public
2 Seawater Desalination
There are two primary methods for seawater desalination distillation (also referred to as ldquothermalrdquo) and reverse osmosis Distillation uses heat to remove salts and minerals from seawater by boiling water at high pressures In contrast reverse osmosis technology forces saline water through a membrane to separate water from the salts and minerals While both distillation and reverse osmosis are energy intensive distillation requires thermal energy to heat the water and overall has a higher energy requirement whereas reverse osmosis requires primarily electrical energy and overall is less energy intensive ndash though still with significant electricity requirements
Globally most thermal desalination plants are located in the Middle East due to low energy prices in the region Plants located elsewhere including in the US typically use reverse osmosis technology2 There are two large existing seawater desalination plants in the US one in Carlsbad California providing water to the San Diego area and one in Gibsonton Florida providing water to the Tampa Bay area Both plants use reverse osmosis technology In addition there are several desalination projects currently in the planning stages or under development in Texas in the Corpus Christi area that would use reverse osmosis technology For that reason this report focuses on reverse osmosis technology in the evaluation of demand response potential of seawater desalination plants
While there are currently no existing seawater desalination plants in Texas there are several municipal and industrial brackish water desalination plants in the state According to the Texas Water Development Board (TWDB) there are 46 municipal brackish water desalination plants with capacities greater than 0025 million gallons per day (MGD) in Texas representing a total of 123 MGD of capacity3 The desalination of brackish water is typically less expensive compared to seawater due to the lower relative salinity of brackish water This study focuses exclusively on seawater desalination consistent with the requirements of HB 4097 but it should be noted that conclusions may also apply to brackish water desalination though at a different cost and scale
This section provides high-level information on the operations (Section 21) and economics (Section 22) of seawater desalination plants to inform the discussion of their demand response potential in Section 4
21 Seawater Desalination Plant Operations Seawater desalination plants typically range in capacity from less than 5 MGD up to 165 MGD For example the Carlsbad seawater desalination plant has a capacity of approximately 50 MGD and the plant in Tampa Bay has a capacity of approximately 25 MGD The associated electricity consumption ranges between 10 and 15 kWh1000 gallons produced depending on the salinity of the water being processed456 More saline water (eg seawater) requires larger amounts of electricity for desalination Thus a seawater desalination plant would have larger electricity consumption requirements compared to a similarly sized brackish water desalination plant
2 American Water ldquoInnovation Solutions within the Water Industry Desalinationrdquo Available at httpwwwamwatercomfilesInnovationsSolutionsWithinTheWaterIndustryDesalinationpdf 3 Texas Water Development Board ldquoDesalination Factsrdquo Available at httpswwwtwdbtexasgovinnovativewaterdesalfactsasp 4 American Membrane Technology Association April 2016 ldquoMembrane Desalination Power Usage Put in Perspectiverdquo Available at httpwwwamtaorgcomwp-contentuploads7_MembraneDesalinationPowerUsagePutInPerspectivepdf 5 Water Reuse Association November 2011 ldquoSeawater Desalination Power Consumptionrdquo Available at httpswatereuseorgwpshycontentuploads201510Power_consumption_white_paperpdf 6 Ghaffour N TM Missimer and G Amy January 2013 ldquoTechnical review and evaluation of the economics of water desalination Current and future challenges for better water supply sustainabilityrdquo Desalination 309 pp197-207 Available at httpswwwresearchgatenetpublication256693140_Technical_review_and_evaluation_of_the_economics_of_water_desalination_ Current_and_future_challenges_for_better_water_supply_sustainability
copy 2016 ERCOT All rights reserved 2
Study on the Demand Response Potential for Seawater Desalination Projects ERCOT Public
While the two existing seawater desalination plants in the US were co-located with power plants to ease compliance with regulations on water intake and discharge structures and reduce costs many other reverse osmosis desalination plants receive their electricity from the grid However plants may have on-site backup generation in case of a power outage This will vary depending on the size and design of the plant and other factors For example the Carlsbad plant in California does have diesel backup generation to power control systems and flushing systems in the case of a power outage The plant in Tampa Bay was not built with backup power due to potential storm surge risks from hurricanes and other storms The plant does use uninterruptible power supply (UPS) backup to power control systems during power outages
Reverse osmosis plants are typically designed with several ldquotrainsrdquo which consists of a high-pressure pump turbine and reverse osmosis membrane Desalination plants are turned on or off one train at a time in a highly controlled process The process of ramping up or down an individual train under normal operations typically takes one to two hours While plants can be designed to handle immediate shutdowns (ie in a power outage) re-starting a system after an interruption would take this amount of time In addition the saline water must be pretreated (ie filtered) before going through the reverse osmosis train and this can sometimes pose constraints on the flexibility of operations
Demand for water is the key factor driving the level of production at seawater desalination plants Typically the plant will have a contract or contracts with municipal or other water users to deliver desalinated water and is operated to meet that demand Alternatively if the plant is municipally owned it would similarly be operated to meet the level of water demand in conjunction with other available water sources If water demands are close to a plantrsquos full capacity the operatorrsquos flexibility to adjust its electricity consumption as part of demand response may be limited However this does mean that plant operations are fairly predictable on a day-to-day basis which is necessary for participation in demand response
The amount of flexibility in plant operations will also be impacted by the amount of water storage available For example if a plant has sufficient water storage on-site or storage within the customerrsquos distribution system it could provide flexibility for the plant to reduce its operations during peak hours when electricity prices are likely to be highest It would also mitigate the impacts of interruptions to production from demand response deployments
22 Seawater Desalination Plant Economics Seawater desalination is typically more expensive than other sources of water and a major driver of the overall cost is energy costs In 2016 the Carlsbad plant charged rates at between $2131 and $2367 per acre-foot78 This charge is intended to cover both the fixed costs of the plant and the variable costs to produce a unit volume of water Typically half to two thirds of the cost of providing desalinated seawater are accounted for by capital cost recovery with the remainder accounted for by operations and maintenance costs including electricity costs Electricity costs can account for 20shy25 of the total costs of seawater desalination with reverse osmosis technology9
Factors affecting the capital cost of a seawater desalination plant include plant size type of desalination process and pre-post-treatment technologies plant infrastructure (eg piping water storage backup power) and compliance with applicable regulations (eg regulations on intake structures brine byproduct disposal) A significant driver of operating and maintenance costs is membrane replacement Reverse osmosis membranes need to be replaced every few years and
7 Source San Diego County Water Authority ldquoSeawater Desalinationrdquo Available at httpwwwsdcwaorgseawater-desalination 8 Note that 1 acre-foot is approximately 325851 gallons 9 Based on technical input from Black amp Veatch
copy 2016 ERCOT All rights reserved 3
Study on the Demand Response Potential for Seawater Desalination Projects ERCOT Public
the rate at which they are replaced will depend on the salinity of the feedwater and how the plant is operated Treatment and disposal of the salty brine byproduct from desalination may also incur operating costs
Electricity costs will vary depending on a range of factors including the size of the plant type of desalination technology source of electricity and quality of the feedwater As previously noted more saline water requires higher amounts of electricity in desalination and thus the amount of electricity consumption is a key difference between brackish water and seawater desalination As a result electricity costs comprise a significant share of the costs of seawater desalination These costs could potentially be defrayed in part by participation in demand response initiatives
3 Demand Response Opportunities in ERCOT
Broadly speaking demand response can be broken down into two major categories dispatchable or non-dispatchable For purposes of this report we will define dispatchable as those demand response events that are initiated by ERCOT and non-dispatchable as an event not specifically initiated by ERCOT These non-dispatchable events may include decisions made by the end-use customer to alter its consumption pattern or may include contractual obligations with another entity such as the end-use customerrsquos retail electric provider (ldquoREPrdquo) to alter consumption patterns
ERCOTrsquos wholesale market is open to several types of dispatchable demand response which are deployed to maintain system reliability Demand-side resources providing Emergency Response Service (ERS) may offer based on either a 10 or 30-minute response time commonly referred to as the ldquoramp periodrdquo Alternatively demand-side resources may register and qualify as a Load Resource that can provide Reserves in the Ancillary Services market The most common service provided by demand-side resources is Responsive Reserve Service which requires an under-frequency relay that can instantaneously interrupt the load during certain system reliability events Some demand-side resources can also participate in other Ancillary Services as Controllable Load Resources that require sophisticated control systems that allow them to be deployed in a more incremental proportional manner
Non-dispatchable demand response in ERCOT can include a response to avoid transmission costs where rates are based on Four Coincident Peak Pricing (4CP) response to wholesale energy prices initiated by the customer or by a REP or other load-serving entity (ldquoLSErdquo) or utility-managed Load Management programs (LM)
The sections that follow provide a description of both ERCOT-dispatched (Section 31) and nonshyERCOT-dispatched (Section 32) demand response For a more detailed description of opportunities for demand-side resources to participate in demand response in ERCOT see ERCOTrsquos guide Load Participation in the ERCOT Nodal Market10
31 ERCOT-Dispatched Demand Response There are two main demand response reliability-based services administered by ERCOT participation by demand-side resources in the Ancillary Services market and participation in ERS These services are dispatched by ERCOT during system emergencies
10 Available at httpwwwercotcomcontentservicesprogramsloadLoad20Participation20in20the20ERCOT20Nodal20Market_302d oc
copy 2016 ERCOT All rights reserved 4
Study on the Demand Response Potential for Seawater Desalination Projects ERCOT Public
Demand-side resources with demand response capability that can meet a set of performance requirements can be qualified to provide Ancillary Services as Load Resources in the Ancillary Services Market The value of having a Load Resource available to reduce load is equal to the value of having a generator available to increase its generation at a generating plant The providers of operating reserves selected to provide Ancillary Services are eligible for capacity payments regardless of whether the Resource is actually deployed (or curtailed in the case of the Load Resource)
ERCOT holds auctions on a daily basis for each of the following Ancillary Services Regulation Up Regulation Down Responsive Reserve and Non-Spinning Reserve11 Table 1 describes the various Load Resource types and their qualification requirements and eligible services
Table 1 Load Resource Types and Ancillary Services
Service Load Resource Type a Qualification Responsive Reserves (le50 of total Reserve requirement)
Non Controllable Under-Frequency Relay and 10-minute ramp to manual dispatch instruction
Responsive Reserves
Controllable Primary Frequency Response and follow 5-minute dispatch instructions
Regulation-Up Regulation-Down
Controllable Primary Frequency Response and respond to Regulation deployments
Non-Spin Reserves Controllable Follow 5-minute dispatch instructions a A Controllable Load Resource is a Load Resource capable of controllably reducing or increasing consumption under dispatch control by ERCOT
Demand-side resources that agree to reduce load when directed by ERCOT and that meet other metering and operational requirements as specified in the ERCOT Protocols may participate in Ancillary Services market auctions As noted in Table 1 the type of Ancillary Service that a Load Resource may provide will depend upon the demand-side resourcersquos response time and metering system as well as other requirements described in the Protocols In the Responsive Reserve and Non-Spin Reserve markets the Load Resource will receive capacity payments regardless of whether or not the load was actually deployed but the load must be available for deployment at any time while providing the service
ERCOT procures ERS to maintain grid reliability during emergency conditions and reduce the likelihood of the need for rotating outages ERS participants may offer to provide demand response with either a 10-minute ramp period requirement (similar to Load Resources providing Responsive Reserve Service) or a 30-minute ramp period requirement ERS Resources do not have the same telemetry and under-frequency relay requirements as Load Resources
11 Regulation Up and Regulation Down service respond to signals from ERCOT every 4 seconds to respond to changes in system frequency full response has to be provided within 5 minutes Responsive reserves must provide their committed capacity either instantaneously in an under-frequency event (eg due to a generator outage) or in energy scarcity conditions within ten minutes following an instruction from ERCOT Non-spinning reserves must provide their committed capacity within 30 minutes based on economic dispatch instructions Non-spinning reserve is used as replacement reserve to replenish other ancillary services and during energy scarcity
copy 2016 ERCOT All rights reserved 5
Study on the Demand Response Potential for Seawater Desalination Projects ERCOT Public
ERS is procured through a request for proposal (RFP) process three times per year for four-month contract terms each of which is further split into smaller time periods based on business cycles and other factors Demand-side resources may choose to submit offers in all time periods or only in those that best fit their unique circumstances and may vary both the price and demand response capacity offers by time period
Payments for ERS are performed up to 80 days after each four month contract term has ended and are subject to downward revision based upon delivered demand response capacity and the demand-side resourcersquos availability during the contract term
32 Non-ERCOT-Dispatched Demand Response The options listed below are not dispatched by ERCOT but they either are controlled directly by a customer or are dispatchable by another entity such as a demand response provider (ldquoDR Providerrdquo) REP or a transmission and distribution utility
Many industrial customers are subject to transmission charges based upon a Four Coincident Peak (4CP) demand The 4CP demand is determined by averaging the consumerrsquos actual demand during the 15-minute settlement interval with the highest ERCOT demand during each of the four summer months (June through September) This measured 4CP demand serves as the basis for the customerrsquos transmission tariff charges for the following year By correctly predicting the ERCOT system peaks during the summer and curtailing load during those intervals a consumer can help reduce the stress imposed on the electric system during peak periods of consumption and reduce its transmission charges for the following calendar year
In the competitive areas of ERCOT consumers can contract with their REP or a DR Provider to have their load respond to the REPrsquos or DR Providerrsquos instructions The contract will usually outline the parameters of this response ndash at what times and frequency demand response events can be called ramp periods sustained response periods compensation etc Because this response is a contractual matter between the REP or DR Provider and the consumer a great deal of variety can be present in these arrangements For example a consumerrsquos response may be voluntary or required compensation could come in the form of reduced energy prices or rebate payments for each curtailment event consumers might be notified up to a day in advance or could have no notification at all (for automated curtailment)
In areas of ERCOT not open to competition interruptible tariffs may be available These tariffs will usually offer a reduced energy price for defined curtailment obligations
REPs may offer dynamic pricing options or consumers within a municipality or cooperative may have their energy prices determined by a published tariff which also may be structured based upon Time-of-Use (TOU) or have a Critical Peak Pricing (CPP) or Peak Time Rebate (PTR) component Self-directed price response refers to consumers making an independent decision to respond to energy prices contained in a governing tariff or in either the ERCOT Day Ahead or Real Time energy markets
TOU offerings will typically have higher energy prices during normal peak periods ndash for example a TOU tariff may charge one price during Monday through Friday from 2 pm through 8 pm and another price during all other times Customers may choose to reduce consumption during these high priced periods Load reduction can be accomplished by load shifting (loads can be shifted by
copy 2016 ERCOT All rights reserved 6
Study on the Demand Response Potential for Seawater Desalination Projects ERCOT Public
rescheduling certain processes or by utilizing thermal storage) ending certain processes that are no longer economic or through energy efficiency measures
Offerings that incorporate CPP usually have prescribed high prices only during certain defined periods ndash for example when load or prices are expected to reach a certain level Response to CPP may be similar to those employed under TOU tariffs especially if CPP is reached frequently More often CPP is infrequent and as such short-term load curtailment may be the more appropriate response to meet economic objectives
4 Demand Response Potential for Seawater Desalination
This section evaluates whether the operational characteristics and economics of seawater desalination plants would enable them to participate in one or more of the various demand response opportunities in the ERCOT Region To date participation of seawater desalination plants in demand response programs has been limited Neither the plant in Carlsbad nor the plant in Tampa Bay participate in demand response programs in California or Florida respectively However as will be described below it appears that these plants can be designed and operated to meet the requirements for participation in demand response and receive economic benefit from participation in these programs
Section 41 describes the operational parameters that must be met for a demand-side resource to provide ERCOT-dispatched demand response and evaluates the ability of seawater desalination plants to meet these criteria Section 42 discusses the tradeoffs between payments for participation in ERCOT-dispatched demand response and potential additional costs posed to seawater desalination plants Finally Section 43 presents other opportunities for seawater desalination plants to reduce their electricity costs outside of ERCOTrsquos reliability-based services that are open to demand response assets
41 Operational Considerations for ERCOT-Dispatched Demand Response There are several key operational parameters that impact a demand-side resourcersquos ability to participate in different demand response services response time recovery time predictability of electrical demand and flexibility of operations This section discusses each of these considerations as they apply to seawater desalination plants
As discussed in Section 31 one of the differentiating factors between ERCOTrsquos demand response products is the amount of time within which a demand-side resource must respond to a deployment instruction to reduce electricity consumption during an event Participation in RRS requires an automatic response within either half a second (ie instantaneous) based on grid frequency or within 10 minutes via a manual instruction ERS requires a response time of either 10 or 30 minutes As noted in Section 21 the typical time to take a reverse osmosis train on- or off-line is 1-2 hours under normal controlled operations To comply with the response time requirements of RRS or ERS a seawater desalination plant would need to be able to reduce its electricity consumption far more quickly than in normal operations This is an element of plant design that would need to be accounted for in the specifications of the project Considerations include the potential need for on-site backup generation including uninterruptible power supply potential impacts to plant infrastructure (eg piping) reverse osmosis membranes and pretreatment systems
The two large US desalination plants provide illustrative counterpoints in this respect The Carlsbad plant was designed to withstand instantaneous power interruptions and has on-site backup generation including uninterruptible power supply to provide the ability to power control systems and flush the membranes in the event of a power loss In contrast the Tampa Bay plant was not
copy 2016 ERCOT All rights reserved 7
Study on the Demand Response Potential for Seawater Desalination Projects ERCOT Public
designed with on-site backup generation and a loss of power would result in a plant shutdown and may require several days to bring the plant back on-line Thus it appears that it is technically possible for a seawater desalination plant to meet the response time requirements for participation in demand response so long as this factor is considered in the design of the facility
The time it takes a desalination train to return to operations after an event is also a consideration Demand-side resources participating in RRS must be able to come back on-line within three hours and those participating in ERS must return within 10 hours Again it appears that it is technically feasible for desalination plants to meet this requirement so long as this requirement is considered in the plant design
An additional consideration is the predictability of a demand-side resourcersquos electricity consumption Participation in the responsive reserves ancillary service market requires bidding in the day-ahead market and thus a demand-side resource must know with great accuracy (within 95) its electrical demand at least a day ahead of time For ERS auctions are held three times a year for four-month contract periods Thus to participate in ERS a resource must know its forecasted electrical demand several months in advance Because seawater desalination plant operations are driven by contracted demand for water it is likely that a plant operator would have a good idea of the plantrsquos electrical demand days or even weeksmonths in advance especially for summer months when demand is likely to be relatively steady An important consideration however is the salinity of the water which drives the electrical requirements and which can be impacted by recent weather events Similarly reductions in demand for water during non-summer months or wet summer days where demand may be reduced could also impact a plantrsquos ability to predict its electricity demand
Finally a seawater desalination plant must have sufficient flexibility in its day-to-day operations so that it can afford to lose several hours of production when deployed for demand response It should be noted that demand-side resources participating in RRS and ERS are called infrequently demand-side resources providing responsive reserves were deployed one time in 2015 and ERS was not deployed that year However this is an important factor to consider if a plant is operating at close to full capacity and would incur financial penalties if it fails to meet its contract obligations due to a demand response event Including additional storage and building a plant with extra capacity could help to mitigate this risk It should also be noted that a plant operator does not need to commit the full plant capacity to these services but rather can specify an amount of MW that will be committed Thus a plant operator could mitigate issues both with predictability and flexibility of plant operations by committing only a portion of its predicted electrical demand to participate in demand response
Considering these factors together it appears that seawater desalination plants could be designed to meet the operational requirements for participation in ERCOTrsquos demand response services (both RRS and ERS) Because the ability to meet the requirements is dependent on the plant design demand response would need to be considered early in a projectrsquos development if participation is desirable Whether project developers will choose to address these requirements will depend on the economic benefits of participation in demand response which will be discussed in the next section
42 Economic Considerations for ERCOT-Dispatched Demand Response This section describes the economic benefits to demand-side resources from participation in ERCOT-dispatched demand response programs The average price paid for a demand-side resource participating in RRS in 2015 was $1087 per MW per hour and for ERS was $645 per MW per hour for the contract periods during the 2015 program year These payments could provide a significant financial benefit to seawater desalination plants To give a simplified example for a plant with an electrical demand of 10 MW operating at a 100 annual load factor (10 MW times 24 hours times 365 days) the annual benefit would be on the order of $500000 for ERS or $1 million for RRS
copy 2016 ERCOT All rights reserved 8
Study on the Demand Response Potential for Seawater Desalination Projects ERCOT Public
In 2015 demand-side resources providing responsive reserves were deployed one time for a duration of 10 minutes and ERS was not deployed12 The most ERS was ever deployed in a single year was two times in 2011 Thus participation in either program could result in a substantial payment to a seawater desalination plant with a relatively low risk of deployment and associated disruption of plant operations although it is important to note that participation in either ERCOT service subjects demand response resources to annual unannounced testing Other than testing the frequency of deployment will depend on grid conditions and is a risk that should be considered
The financial benefits of participation must be weighed against the costs of designing facilities with the capabilities to operate in this manner These include
bull The costs to design the plant to reduce electrical demand within the required timeframes for demand response and to withstand an instantaneous interruption if not already part of the plant design For example a plant may need to be designed to have backup power generation on-site In addition there could also be costs to restart the system after an interruption
bull The costs to build a plant with excess capacity andor storage to make up for lost production hours when demand response is deployed This will add to the total capital costs of the project Land area constraints should also be considered when considering additional storage as the space requirements for the necessary storage capacity could be significant
bull Costs associated with the impact of interruptions on plant processes (eg more frequent replacement of membranes impacts to pretreatment system or plant infrastructure)
bull Potential financial penalties that would be incurred if deployment as part of demand response were to result in failure to meet contract obligations to supply water
bull The loss of potential benefits in the form of cost avoidance from participation in non-ERCOTshydispatched demand response opportunities (see Section 43) If a plant is committed to RRS or ERS the plant operator would lose the flexibility to take advantage of these other opportunities to reduce their electricity costs
The interplay of these benefits and costs will determine whether it would be beneficial for a future seawater desalination plant to participate in demand response in ERCOT
43 Considerations for Non-ERCOT-Dispatched Demand Response Outside of the reliability-based services administered by ERCOT there are other opportunities for seawater desalination plants to reduce their electricity costs As described in Section 321 seawater desalination plants may be able to reduce the demand charges on their electricity bills through curtailing load during 4CP intervals In addition plant operators may adjust operations in response to real-time electricity prices to take advantage of lower off-peak prices and avoid price spikes (see Sections 322 and 323) All of these opportunities require that the plant have flexibility to reduce production during certain times of the day
In the ERCOT region as noted above a portion of transmission and distribution charges are set based on the peak systemwide 15-minute interval of the four summer months (June through September) referred to as the four coincident peaks (4CP) Large customers can reduce or avoid this charge by reducing electrical consumption during these four peak intervals AEP Central Texas and CenterPoint are the transmission providers covering the majority of the Gulf Coast in Texas13
12 ERCOT June 2016 ldquoLoad Resource Deployment Updaterdquo Available at httpwwwercotcomcontentwcmkey_documents_lists870985_RRS_Load_Resource_Deployment_Updatepdf 13 It is also possible that a seawater desalination plant could be located in an area that as not opted in to competition in which case the plant owner would need to negotiate its electricity charges bilaterally with the Non Opt-In Entity (NOIE)
copy 2016 ERCOT All rights reserved 9
Study on the Demand Response Potential for Seawater Desalination Projects ERCOT Public
Assuming a future seawater desalination plant would be connected at transmission-level voltages the relevant 4CP charges based on the 2016 tariffs accounting for both transmission charges and transmission cost recovery factors would be $41425 per 4CP kW for AEP Central Texas and $41870 per 4CP kVA for CenterPoint14 If a seawater desalination plant has 10 MW of load and is capable of interrupting all of it and successfully does so for all four 4CP intervals the savings based on the 2016 tariffs would be approximately $500000 per year ($41425 times 1000 (kW to MW) times 10 MW times 12 months) Thus a seawater desalination plant that reduces its electricity use during the 4CP intervals could avert some or all of these charges
Another opportunity for seawater desalination plants to reduce their electricity costs is through adjusting operations in response to real-time electricity prices In 2015 the average electricity price in ERCOT was $2677MWh However prices exceeded $50MWh in 254 hours (3 of all hours) $100MWh in 88 hours (1) $200MWh in 40 hours (05) and $300MWh in 21 hours (02) Prices exceeded $3000MWh for 021 hours15 Depending on the desalination plantrsquos exposure to real-time wholesale market prices (via its retail contract) the degree of high prices the plant owner is willing to avoid and grid conditions in a given year reducing unit operations in order to avoid high electricity prices could impact operators for anywhere between a few and several hundred hours out of the year In addition a plant can plan its operations to take advantage of lower electricity prices during off-peak periods (eg at night when generation from wind is high) For example at least one company is marketing a modular desalination unit design intended to take advantage of low prices during periods of high renewables generation and to provide grid reliability services through demand response16
There are several factors to consider regarding these opportunities to reduce electricity costs The plant would need to monitor the ERCOT market or hire a contractor to do so in order to know when to reduce demand for electricity These programs do not impose any requirements on response time as with RRS or ERS and there may be sufficient warning of 4CP intervals or peak pricing to allow the plant operator to plan its operations earlier in the day with sufficient time to ramp down production under controlled conditions However quicker ramping capability may be desirable to respond to electricity price fluctuations
For 4CP because the four intervals used to set demand charges are not known ahead of time it is likely that the plant would need to reduce its demand multiple times per summer to ensure the 4CP intervals are hit impacting production at the facility Timing operations to coincide with off-peak pricing or to avoid price spikes would similarly result in reduced operations during certain hours To offset the lost production hours the plant may need to be designed with extra capacity and water storage capability to maintain the ability to meet its contractual obligations for freshwater delivery Because the period of reduced operations is greater than with ERCOT-dispatched demand response services this need would be greater for a seawater desalination plant reducing load during 4CP intervals or in response to real-time electricity prices and would increase the capital costs of the project It should also be noted that high prices in the ERCOT Region typically but not always occur in summer months when drought conditions are more likely to develop and demand for desalinated water is likely to be highest This may limit the flexibility of the plant to time its electricity consumption to avoid high-priced hours
14 Public Utility Commission of Texas ldquoTransmission and Distribution Rates for Investor Owned Utilitiesrdquo Available at httpwwwpuctexasgovindustryelectricratestdraspx 15 Potomac Economics June 2016 2015 State of the Market Report for the ERCOT Wholesale Electricity Markets Available at httpswwwpotomaceconomicscomindexphpmarkets_monitoredERCOT 16 Sisyan LLC ldquoDemand Response Desalinationrdquo Available at httprenewabledesalinationcomwpshycontentuploads201506Demand-Response-Desalinationpdf
copy 2016 ERCOT All rights reserved 10
Study on the Demand Response Potential for Seawater Desalination Projects ERCOT Public
In addition the plantrsquos ability to participate in demand response would also be limited for those hours it is reducing load as part of 4CP response or in response to real-time prices because the plant would not be able to reduce its electricity consumption if that demand is already committed to another demand response service Thus participating in demand response versus taking advantage of these other opportunities may be to some extent mutually exclusive
5 Conclusion
Based on this analysis it appears that the operational characteristics of seawater desalination plants would allow them to participate in demand response opportunities in ERCOT so long as the necessary operational requirements are considered in the design specifications of the plant Project developers should consider the necessary requirements early in the plant design Whether the economic benefits of participation would provide a sufficient incentive for them to do so will depend on the costs of accommodating those operational requirements and whether there is the flexibility available to operate the plant as necessary under these programs Though most existing seawater desalination plants do not participate in demand response programs it does appear that participation by these plants is possible and could result in a financial benefit Table 2 compares the different demand response opportunities available to demand-side resources in ERCOT
Table 2 Comparison of Demand Response Opportunities Demand Response
Opportunity Requirements for
Participation Impacts to Plant
Operations Financial Benefit Ancillary Services ndash Responsive Reserve Service (RRS)
bull Under-Frequency Relay bull Instantaneous or 10 minute
response time bull Recover load within 3
hours bull Bid in day-ahead market
bull Deployed once in 2015 for 10 minutes bull Subject to annual
unannounced testing
bull $1087 per MW per hour (based on 2015 prices)
Emergency Response Service (ERS)
bull 10 or 30 minute response time bull Recover load within 10
hours bull Four-month contract term
bull Not deployed in 2015 the most times ever deployed in a single year was twice in 2011 bull Subject to annual
unannounced testing
bull $645 per MW per hour (based on 2015 prices)
Four Coincident bull Interval Data Recorder bull Likely plant will need to bull Avoid ~$48000 per 4CP Peak (4CP) (IDR) meter
bull Ability to predict system-wide peak demand hours during summer months
reduce load multiple times per summer to hit 4CP intervals bull Likely to be able to predict
possible 4CP intervals earlier in day
MW per year (based on 2016 tariffs) if successful in reducing during all four summer months
LSE or DR Provider Contracted Price Response
bull Varies based on contractual arrangements
bull Varies based on contractual arrangements
bull Varies based on contractual arrangements
Self-Directed Price bull Retail contract with bull Varies depending on bull Varies depending on Response exposure to real-time
market prices bull Ability to monitor real-time
prices in ERCOT wholesale market
number and severity of pricing events bull May be able to predict
peak pricing events earlier in day
number and severity of pricing events
copy 2016 ERCOT All rights reserved 11
Study on the Demand Response Potential for Seawater Desalination Projects ERCOT Public
Demand response programs in ERCOT provide opportunities for demand-side resources to defray their electricity costs and provide reliability benefits to the ERCOT electric grid Because the process of seawater desalination is energy intensive participation in demand response could help to reduce electricity costs while posing a relatively low risk to plant operations if demand response participation is factored into plant design
Participation in non-ERCOT-dispatched demand response opportunities such as reducing load during 4CP intervals or in response to real-time electricity prices may also help to reduce electricity costs for seawater desalination plants in Texas As stakeholders in Texas continue to plan for possible future droughts in the region and identify water management strategies consideration of demand response could play a role in mitigating some costs associated with seawater desalination and allow seawater desalination plants to assist with maintaining electric reliability in the region
copy 2016 ERCOT All rights reserved 12
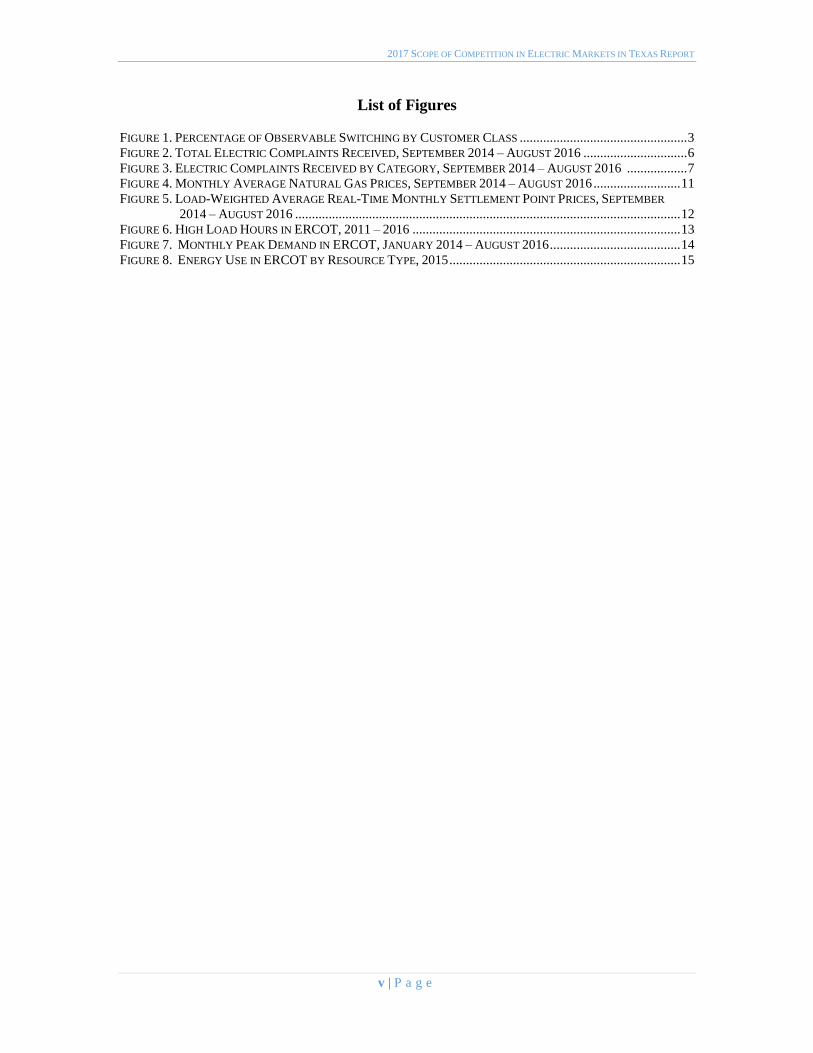
2017 SCOPE OF COMPETITION IN ELECTRIC MARKETS IN TEXAS REPORT
List of Figures
FIGURE 1 PERCENTAGE OF OBSERVABLE SWITCHING BY CUSTOMER CLASS 3
FIGURE 4 MONTHLY AVERAGE NATURAL GAS PRICES SEPTEMBER 2014 ndash AUGUST 201611 FIGURE 5 LOAD-WEIGHTED AVERAGE REAL-TIME MONTHLY SETTLEMENT POINT PRICES SEPTEMBER
FIGURE 2 TOTAL ELECTRIC COMPLAINTS RECEIVED SEPTEMBER 2014 ndash AUGUST 2016 6 FIGURE 3 ELECTRIC COMPLAINTS RECEIVED BY CATEGORY SEPTEMBER 2014 ndash AUGUST 2016 7
2014 ndash AUGUST 2016 12 FIGURE 6 HIGH LOAD HOURS IN ERCOT 2011 ndash 2016 13 FIGURE 7 MONTHLY PEAK DEMAND IN ERCOT JANUARY 2014 ndash AUGUST 201614 FIGURE 8 ENERGY USE IN ERCOT BY RESOURCE TYPE 201515
v | P a g e
2017 SCOPE OF COMPETITION IN ELECTRIC MARKETS IN TEXAS REPORT
I EXECUTIVE SUMMARY
This year marks 15 years since the opening of the Texas retail electric market in
2002 brought about by the passage of Senate Bill 7 by the Texas Legislature which began
the project of restructuring the Texas electricity market In the 15 years since the market
opening the Public Utility Commission of Texas (Commission) has overseen the
transformation of the Texas electric landscape from one of incumbent utilities to a thriving
electric market in the Electric Reliability Council of Texas (ERCOT) region This Scope
of Competition in Electric Markets Report will provide a review of the activities the
Commission has undertaken during the last two years to continue to foster market
competition improve the customer experience and promote infrastructure to deliver
electricity to power the lives of Texans
Under the Commissionrsquos oversight the Texas retail market remains the national leader in competitive residential commercial and industrial offerings with the highest
number of competitors and product variety in the country As of March 2016 in the portion
of the state that is open to customer choice 92 of all customers had exercised their ability
to switch providers
On average residential retail rates in the competitive areas of Texas have declined
since 2014 to prices as low as 45 cents per kilowatt-hour (kWh) compared to a nationwide
average of 1345 cents per kWh in 2016 In addition wholesale market prices in Texas
have fallen 21 since 2013
Alongside the Commissionrsquos work refining the retail market the Commission has
also focused on continuing to enhance the customer experience by adapting to
technological changes as well as evaluating market mechanisms to ensure that the
wholesale market is as efficient and reliable as possible To further its objective of reliable
affordable and efficient power for Texas industry and residents the Commission has
several ongoing projects focused on promoting efficient and sustainable outcomes in the
wholesale market
On August 11 2016 the ERCOT region broke the previous all-time record for peak
demand with customers across the region using 71093 Megawatts (MW) of electricity in
part because of hot weather across the state Power generation was sufficient to meet this
record level of demand
This Report summarizes the continuing trends affecting competition in the electric
industry It highlights the effects of competition on rates customer protection and
complaint issues oversight and enforcement action and other noteworthy Commission
activities This Report concludes with suggestions for the Legislaturersquos consideration that
may facilitate continued efficiency and promote the Commissionrsquos objective of providing high quality service to Texans
1 | P a g e
2017 SCOPE OF COMPETITION IN ELECTRIC MARKETS IN TEXAS REPORT
II STATE OF THE COMPETITIVE MARKET
Overview
In the 15 years since the implementation of customer choice in Texas customers
continue to enjoy the benefits of a competitive market a plethora of retail electric providers
offering innovative products designed to meet the needs of residential commercial and
industrial customers The diversity of retail electric providers and products has created a
robust competitive market that continues to provide Texas customers with low electricity
prices With Senate Bill 7 the Texas Legislature put in place a foundation for a restructured
electric market that continues to set the standard across this nation Because of SB 7
Texas remains the national leader in competitive electric markets The Commission will
continue to oversee the competitive electric market in Texas to ensure that it stays true to
the foundation created by SB 7 and that it provides Texans with the reliable competitively
priced electricity they have come to expect
Retail Market Development and Prices
1 Customer Choice
The Commission has continued to guide improvements of the Texas competitive
retail electric market in which customers are able to choose which electric rates and
services best suit their needs from Retail Electric Providers (REPs) which sell electricity
to the end-use customer The number and diversity of REPs competing for customers
provides an indicator of the health of the retail market Since the publication of the 2015
Scope of Competition in Electric Markets Report the number of REPs and competitive
offers in ERCOT has remained stable As of September 2016 109 REPs were operating
in ERCOT providing 440 total unique products 97 of which solely support electricity
generated from 100 renewable sources1
Because of the number of providers and plans available from which customers can
choose Texas continues to be recognized as the most successful competitive retail market
in North America as demonstrated by its first-place rank for the past eight years in the
Annual Baseline Assessment of Choice in Canada and the United States a scorecard that
compares the retail competitiveness of electric markets in the US states and Canadian
provinces2
The number of REPs serving residential customers and the associated number of
product offerings by transmission and distribution utility (TDU) in the ERCOT grid are
shown in Table 1
1 Public Utility Commission wwwpowertochooseorg
2 Annual Baseline Assessment of Choice in Canada and the United States Distributed Energy
Financial Group July 2015 Available at httpwwwcompetecoalitioncomfilesABACCUS-2015-vfpdf
2 | P a g e
2017 SCOPE OF COMPETITION IN ELECTRIC MARKETS IN TEXAS REPORT
Table 1 Number of REPs and Products Serving Residential Customers September 2016
TDU Service Territory3 Residential
Suppliers
Number of
Products
AEP Central 52 355
AEP North 49 295
CenterPoint 55 400
Oncor 55 390
Sharyland ndash McAllen 14 103
Sharyland Utilities 22 155
TNMP 49 320
2 Retail Prices
Together the REPs in the competitive market serve 6153293 residential
customers 1053032 commercial customers and 4336 industrial customers4 In this
highly competitive retail market 92 of all customers have exercised their ability to switch
REPs since the market opening in 2002 Figure 1 depicts the percentage of customers in
each customer class who have switched REPs at least once since 2002
Figure 1 Percentage of Observable Switching by Customer Class5
3 American Electric Power ndash Texas Central Company (ldquoAEP Centralrdquo) American Electric Power ndash Texas North Company (ldquoAEP Northrdquo) CenterPoint Energy (ldquoCenterPointrdquo) Oncor Electric Delivery Company (ldquoOncorrdquo) Sharyland Utilities (ldquoSharyland ndash McAllenrdquo serves McAllen Texas and ldquoSharyland Utilitiesrdquo serves Stanton Brady and Colorado City) and Texas-New Mexico Power (ldquoTNMPrdquo)
4 ERCOT Provider of Last Resort Counts March 31 2016 Available at
httpwwwercotcomcontentwcmkey_documents_lists89277POLR_Counts_Energy_2016_Reportingx
lsx
5 ERCOT Supplemental Information - Retail Electric Market April 2015ndashMarch 2016 Available
at
httpercotcomcontentwcmkey_documents_lists89277Observed_Selection_of_Electric_Providers_Mar
ch_2016pptpptx
3 | P a g e
2017 SCOPE OF COMPETITION IN ELECTRIC MARKETS IN TEXAS REPORT
The success of the competitive market is highlighted in Table 2 which compares
the last regulated retail rate with the current lowest 12-month fixed retail offering per 1000
kWh in each region adjusted for inflation Since 2001 average retail rates across Texas
have decreased 63 percent
Table 2 Inflation-Adjusted Comparison of Residential Regulated and Competitive Rates
TDU Service
Territory6
Last Regulated
Rate (2001)
centkWh7
Last Regulated
Rate Adjusted for
Inflation
Current
Lowest Fixed
Price8
Percentage
Change
AEP Central 96 131 56 ndash5725
AEP North 100 136 50 ndash6324
CenterPoint 104 141 54 ndash617
Oncor 97 132 45 ndash6591
TNMP 106 144 50 ndash6528
The average lowest available residential price across the competitive market was
51 cents per kilowatt-hour (kWh) in September 2016 and the average across all plans
available in the competitive market in Texas was 98 cents per kWh 9 Moreover rates in
ERCOT have not only decreased since Texasrsquo transition to the competitive market but both fixed and variable rates have continued to be much lower than nationwide averages
of 1345 cents per kWh in July 2016 and 1362 cents per kWh in July 201510
Table 3 compares the current lowest fixed price available for residential service in
each TDU service territory with the average price of plans available and the nationwide
average excluding Texas
6 Sharyland Utilities was formed shortly before the market opening to serve part of McAllen
Texas it is not included in this table because of its limited number of customers at that time In Docket No
21591 Sharyland Utilities committed that its average bundled residential rates would not exceed those of
Central Power amp Light Company (now AEP Central)
7 Association of Electric Companies of Texas Available at httpwwwaectnetinside-the-charts-
prices-available-in-the-competitive-market-today-well-below-the-last-regulated-rate
8 The current lowest fixed price available for a residential plan in each TDU service territory as of
September 2016 for a 12-month plan without time-of-use features prepaid features or a minimum usage
fee for a fixed month-to-month rate for a customer who expects to consume approximately 1000 kWh of
electricity a month Available at wwwpowertochooseorg
9 This average is for a residential customer expecting to consume approximately 1000 kWh of
electricity each month Available at wwwpowertochooseorg
10 The nationwide average is for July 2016 and includes all US states except Texas Source US
Energy Information Administration Average Retail Price of Electricity Electricity Data Browser July
2016 Available at httpwwweiagovelectricitydatacfm
4 | P a g e
2017 SCOPE OF COMPETITION IN ELECTRIC MARKETS IN TEXAS REPORT
Table 3 Current Lowest and Average Residential Plans by TDU Service Territory
TDU Service
Territory
Current Lowest
Fixed Price
(centkWh)11
Current Average
All Available
Plans12
Nationwide
Average13
AEP Central 56 94
1345
AEP North 50 94
CenterPoint 54 91
Oncor 45 83
Sharyland ndash McAllen 56 98
Sharyland Utilities 45 133
TNMP 50 92
3 Customer Complaints
The Commissionrsquos rules permit a customer to file a complaint with the Commission
about their electric service The Commissionrsquos staff works with the customer and electric service provider to resolve the complaints first in an informal complaint process and then
directs the customer to a formal complaint process if the customer is dissatisfied with the
resolution The Commission keeps records of these complaints and evaluates the
complaint statistics as a barometer for analyzing company behavior and its effect on
customers The Commission uses the data to identify any company-specific trends work
with companies to address any issues or otherwise take enforcement action
From September 1 2014 to August 31 2016 the average number of days to resolve
a utility complaint was 18 days The slight decline in the number of electric complaints
received in 2015 through 2016 may be attributed to the mild winter weather which resulted
in lower overall prices as well as the absence of significant disruptions to electric service
Figure 2 shows the total complaints received from September 1 2014 to August 31 2016
11 The current lowest fixed price available for a residential plan in each TDU service territory as of
September 2016 for a 12-month plan without time-of-use features prepaid features or a minimum usage
fee for a fixed month-to-month rate for a customer who expects to consume approximately 1000 kWh of
electricity a month Source wwwpowertochooseorg
12 The average is for a residential customer expecting to consume approximately 1000 kWh of
electricity a month Source wwwpowertochooseorg
13 The nationwide average is for July 2016 and includes all US states except Texas Source US
Energy Information Administration Average Retail Price of Electricity Electricity Data Browser July
2016 Available at httpwwweiagovelectricitydatacfm
5 | P a g e
2017 SCOPE OF COMPETITION IN ELECTRIC MARKETS IN TEXAS REPORT
Figure 2 Total Electric Complaints Received September 2014 ndash August 2016
From September 1 2014 to August 31 2016 the Commission received 4465
electric complaints Billing complaints continue to be the greatest cause of customer
complaints with 42 of all electric complaints concerning billing issues Complaints
relating to the provision of service including customer service and the refusal of service
were the second highest cause of complaints at 15 Quality of service contributed to the
third-leading cause of complaints at 12 Complaints are broken down by category in
Figure 3
6 | P a g e
2017 SCOPE OF COMPETITION IN ELECTRIC MARKETS IN TEXAS REPORT
Figure 3 Electric Complaints Received by Category September 2014 ndash August 2016 14
4 Energy-Efficiency Programs
Energy-efficiency programs in Texas are administered by the TDUs in ERCOT and
the vertically integrated utilities outside of ERCOT pursuant to the Public Utility
Regulatory Act (PURA) sect39905 The utilities recover the cost of the energy-efficiency
programs through a surcharge on electric bills which are adjusted and approved annually
by the Commission Under the energy-efficiency programs TDUs reduced 559369 MWh
of electricity consumption in 2015 exceeding the goal for the year by 40 The energy-
efficiency programs are designed to reduce customersrsquo energy consumption as well as
electric peak demand In 2011 SB 1125 increased the peak demand goal reduction to a
30 growth in demand Once a utility reaches this goal the utility must achieve a
reduction of four-tenths of one percent of the utilityrsquos summer weather-adjusted peak
demand in subsequent years
The 2011 legislation also required that the Commission develop an evaluation
measurement and verification (EMampV) framework to promote effective program design
to provide consistent and streamlined reporting and to retain a third-party contractor to
conduct these activities EMampV efforts for the 2015 program year focused on evaluating
targeted programs for which the associated peak demand and energy savings were most
uncertain A primary component of EMampV is the statewide Technical Reference Manual
(TRM) a single common reference document prepared and maintained by the EMampV
contractor to estimate energy and peak demand savings resulting from the installation of
14 ldquoCrammingrdquo is the practice of adding unauthorized charges for any services to an electric bill without verified consent by the customer ldquoSlammingrdquo is the practice of switching the customer to another provider without authorization
7 | P a g e
2017 SCOPE OF COMPETITION IN ELECTRIC MARKETS IN TEXAS REPORT
energy efficiency measures sponsored by utility-administered programs in Texas In 2015
changes made to the TRM added and updated existing deemed savings values and added
standardized EMampV protocols for determining and verifying energy and demand savings
effective for the 2016 program year Verified demand and energy savings and program
costs for 2015 are shown in Table 4
Table 4 2015 Verified Energy Efficiency Savings15
MW MWh MW MWh
El Paso Electric 1231 22283 1116 19552 $4039278
Entergy Texas 1809 39688 1550 27156 $7023009
SPS 817 14537 549 9627 $3190744
SWEPCO 988 15262 560 9811 $3220359
Non-ERCOT Total 4844 91770 3775 66146 $17473390
AEP Central 4378 68482 1293 22653 $13261480
AEP North 454 12289 426 7464 $2727260
CenterPoint 16849 188255 5883 103069 $35832993
Oncor 11581 178908 6940 121589 $47438836
Sharyland 060 2528 100 1752 $633252
TNMP 866 17452 5770 10109 $4011627
ERCOT Total 34188 467915 15219 266636 $103905448
Grand Total 39033 559685 18994 332782 $121378838
Excludes Statewide EMampV contractor expenses of approximately $3M for review of prior program year
GoalProgram CostUtility
Verified Savings
In 2015 the utilities cumulatively achieved 206 of the demand reduction goal
(226 for utilities in ERCOT) and 168 of the energy reduction goal (175 for utilities
in ERCOT)
5 Customer Education Activities
The Commission engages with residential and small commercial electric customers
about retail electric competition through its ldquoTexas Electric Choicerdquo campaign and also informs customers about energy conservation opportunities through its ldquoPower to Save Texasrdquo campaign In addition to engaging with customers through these two campaigns
Commission staff also respond to customer inquiries and distribute literature about
electricity facts and issues
15 The non-ERCOT utilities within the state of Texas are El Paso Electric Company (ldquoEl Paso Electricrdquo) Entergy Texas Inc (ldquoEntergy Texasrdquo) Southwestern Public Service Company (ldquoSPSrdquo) and Southwestern Electric Power Company (ldquoSWEPCOrdquo)
8 | P a g e
2017 SCOPE OF COMPETITION IN ELECTRIC MARKETS IN TEXAS REPORT
a ldquoPower to Chooserdquo
The Commission educates customers about the evolving marketplace continuing
its ldquoTexas Electric Choicerdquo campaign which began in February 2001 with the goal of educating Texans about the changes and choices in the retail electric market The
PowerToChooseorg website and its Spanish-language counterpart PoderDeEscogerorg
provides a simple one-stop shop portal for Texans who live in a service territory open to
customer choice to enter in their zip code and browse through the numerous plans offered
by the REPs
b ldquoPower to Save Texasrdquo
In addition to the ldquoTexas Electric Choicerdquo campaign and the PowerToChoose website the Commission has also continued its statewide initiative ldquoPower to Save
Texasrdquo together with its parallel Spanish-language initiative ldquoPoder de Ahorrarrdquo which educates Texans about conserving energy during the summer peak times of 3 pm to 7
pm when the demand for electricity tends to be the highest The PowerToSaveTexasorg
website and its Spanish-language counterpart PoderDeAhorrarTexasorg provide Texans
with energy saving tips for homes and businesses
As part of the Power to Save Texas campaign the Commission contracted with
Resource Action Programs (RAP) to develop and implement a middle school energy
conservation outreach program in Hidalgo Harris Dallas and Tarrant counties In the
2015 ndash 2016 school year the program provided an effective energy education program
which strongly supports the Texas Essential Knowledge and Skills (TEKS) curriculum
standards as well as engages students through school challenges and at-home activities
c Campaign Outreach
PowerToChooseorg and its Spanish-language counterpart PoderDeEscogerorg
have proven valuable in educating customers about customer choice in the electricity
market The Commission conducted a number of activities to further promote the statersquos official electric choice website through social media community events trade shows and
expos From September 1 2015 through August 31 2016 nearly a million potential
customers visited the PowerToChooseorg and PoderDeEscogerorg websites Website
statistics are contained in Table 5
Table 5 Website Statistics September 2015 ndash August 2016
PowerToChoosecom Unique Visitors 980473
PoderDeEscogercom Unique Visitors 4652
d Low-IncomeElderly Outreach and Collaboration with Faith- and
Community-Based Organizations
Throughout 2015 and 2016 the Commissionrsquos staff also worked with legislative
offices and faith- and community-based organizations to provide educational materials and
training to help their constituents better understand the deregulated electric market and the
9 | P a g e
2017 SCOPE OF COMPETITION IN ELECTRIC MARKETS IN TEXAS REPORT
Commissionrsquos websites The Commission has actively participated with the Interagency
Coordinating Group (ICG) which was established by the Texas Legislature to expand and
improve relationships between state government and faith- and community-based
organizations Information on customer assistance programs such as LITE-UP Texas was
provided to community organizations such as Legal Aid of Northwest Texas senior
activity centers and religious groups
e Call Center
The Commission has trained its Customer Protection Division staff who are fluent
in both English and Spanish to answer customer calls and to assemble and mail
informational packets comparing electric plans when requested by customers without
Internet access From September 2015 to August 2016 the Customer Protection Division
staff handled 7663 calls from customers requesting assistance with shopping
f Educational Literature
In addition to the educational materials on the Commissionrsquos website the Commission provides brochures fact sheets and other educational materials by mail and
e-mail through a network of community organizations and events and in response to
customer requests to the call center Up-to-date fact sheets are available on the
Commissionrsquos website PowertoChooseorg and PoderDeEscogerorg as part of the
campaignrsquos outreach efforts The fact sheets provide information on a number of current
industry and consumer topics
Throughout 2015 and 2016 campaign educational materials promoting the
agencyrsquos programs including Power to Choose and Power to Save Texas were distributed
at numerous community events and civic town hall events such as Hurst-Euless-Bedford
ldquoBack 2 Schoolrdquo day Dickenson Housing Family Fair Energy Day DFW Family Fair
Earth Day Texas Texas Home and Garden shows in Houston Texas Black Expo National
Night Out events and minor league baseball games
Wholesale Market Development
The Commission engages regularly with ERCOT to oversee market developments
and ensure system supply reliability security and improved price formation and market
outcomes Market design changes made as a result of this working relationship have
created new opportunities for a variety of generation resources to enter the market and
supported the formation of wholesale prices that reflect real-time market conditions more
accurately and therefore improve the efficiency of the market
1 Wholesale Market Prices
Wholesale market prices have fallen in comparison to prices seen in the 2012 ndash 2014 period The ERCOT load-weighted real-time average price of energy in 2015 was
$2677 per Megawatt-hour (MWh) a 34 decrease from the average price in 2014 and a
decrease of 21 from the average seen in 2013
10 | P a g e
2017 SCOPE OF COMPETITION IN ELECTRIC MARKETS IN TEXAS REPORT
Falling wholesale prices are correlated with the current trend of lower natural gas
prices the primary fuel of many of the regionrsquos power plants The average Houston Ship Channel spot price for natural gas was 41 lower in 2015 than in 2014 decreasing from
$437MMBtu in 2014 to $258 in 2015 Through March the average price for 2016 has
fallen to $192MMBtu Natural gas price trends from September 2014 through August
2016 are shown in Figure 4
Figure 4 Monthly Average Natural Gas Prices September 2014 ndash August 2016
Monthly average wholesale electricity prices are shown in Figure 5 Load-
weighted prices are calculated by dividing the price at a load zone by the associated
demand This metric provides a useful proxy for the actual wholesale prices paid by load16
16 It is worth noting that most power in ERCOT is sold through various bilateral arrangements that
are designed to hedge daily real-time market price risk
11 | P a g e
2017 SCOPE OF COMPETITION IN ELECTRIC MARKETS IN TEXAS REPORT
Figure 5 Load-Weighted Average Real-Time Monthly Settlement Point Prices September 2014 ndash August 2016
Another component of the real-time price of electricity is the cost of transmission
congestion Transmission congestion occurs when there is insufficient transmission
capacity to dispatch energy in a least-cost fashion The recent build-out of additional
transmission lines in areas of high congestion has partially relieved the cost burden in these
areas particularly in West Texas where oil and gas production growth rapidly increased
the demand for electricity resulting in relatively higher zonal prices
2 Peak Demand
After the very high peak demand levels during the hot summer of 2011 peak
demand in ERCOT was lower in 2012 through 2014 In 2015 peak demand again
increased though not to 2011 levels with load exceeding 60000 MW for 330 hours and
exceeding 65000 MW for 91 hours as shown in Figure 6 below In 2016 ERCOT
experienced a record week in August which saw the previous record peak demand broken
six times and the ERCOT region hit its all-time peak demand of 71093 MW on August
11 2016
As peak demand has increased the recorded availability of generation supply in the
region during times of high load has decreased slightly Physical Responsive Capability
(PRC) analogous to the amount of reserves available on the system at any given time fell
below 3000 MW for 269 hours in 2015 up slightly from 213 hours in 2014 and 215
hours in 2013 but well below the 371 hours recorded during the 2011 summer
12 | P a g e
2017 SCOPE OF COMPETITION IN ELECTRIC MARKETS IN TEXAS REPORT
Figure 6 High Load Hours in ERCOT 2011 ndash 2016
As shown in Table 6 the ERCOT system peak demand was 69877 MW in 2015
up 5 from the 2014 peak and the 2016 ERCOT system peak demand increased 174
from the peak demand of the previous year
Table 6 ERCOT Peak Demand 2012 ndash 2016
Year
ERCOT Peak
Demand (MW)
Percentage Change
from Prior Year
2012 66548 ndash 2013 67245 105
2014 66454 ndash118
2015 69877 515
2016 71093 174
Figure 7 shows the hourly peak load for each month in ERCOT from January 2014 to
August 2016
13 | P a g e
2017 SCOPE OF COMPETITION IN ELECTRIC MARKETS IN TEXAS REPORT
Figure 7 Monthly Peak Demand in ERCOT January 2014 ndash August 2016
3 Generation Diversity
As electricity consumption has increased in ERCOT the diversity of the systemrsquos generation portfolio has also increased Generators participating in the statersquos renewable energy credit (REC) trading program reported an 11 increase in renewable generation
from 2013 to 2015 rising from 376 million MWh to 469 million MWh with wind
representing 96 of the total renewable mix Landfill gas was the second most prevalent
renewable source representing approximately 12 of all renewable generation in 2015
Energy produced from wind generation was up by 13 in 2015 from 2013 and solar
energy capacity more than doubled from 121 MW in 2013 to 288 MW in 2015 Coal-fired
generation has been steadily shrinking as a proportion of total generation declining from
37 of electricity produced in 2014 to 28 in 2015 Energy use in the ERCOT region by
fuel type for 2015 is shown in Figure 8
14 | P a g e
2017 SCOPE OF COMPETITION IN ELECTRIC MARKETS IN TEXAS REPORT
Figure 8 Energy Use in ERCOT by Resource Type 2015
The Commissionrsquos projects are further described in the following section of this report
15 | P a g e
2017 SCOPE OF COMPETITION IN ELECTRIC MARKETS IN TEXAS REPORT
III SUMMARY OF COMMISSION ACTIVITIES FROM 2015 TO 2016
Introduction
The Commission develops and modifies rules policies and procedures for the
competitive electric market in Texas in response to the technological advances in the
industry and the evolving needs of customers The Commission also continues to carry
out oversight of programs with which the Legislature has tasked it ndash such as energy
efficiency renewable energy and advanced metering infrastructure Within the
ERCOT region the monopoly wires-and-poles companies that provide transmission
and distribution services throughout the grid remain subject to traditional rate
regulation by the Commission The Commission continues to set rates for these
utilities as they are not subject to the forces of market competition This section
provides an overview of the Commissionrsquos activities in its oversight of the wholesale and retail electric markets as well as its governance over regulated electric utilities
Resource Adequacy
Resource adequacy is the long-term ability of the system to serve demand reliably
when consumption is highest given the available installed capacity load resources and
the operational reliability of the system Assessing resource adequacy requires comparing
the systemrsquos forecast installed capacity and load resources against the forecast peak
summer load The difference between the forecast of available generation and load
resources and the forecasted demand for electricity is referred to as an ldquoinstalled capacity
reserve marginrdquo which is an indicator of the ability of the system to meet customer demand
during peak conditions In addition to evaluating the forecast reserve margin assessing
resource adequacy includes evaluating the systemrsquos operational reliability The systemrsquos operational reliability depends on the ability of generators to manage plant operations
successfully as well as the grid operatorrsquos ability to manage the system to avoid or to mitigate load curtailment During 2015 and 2016 the ERCOT system performed well with
respect to resource adequacy The Commission has devoted significant attention to
ensuring that ERCOT maintains an adequate installed capacity reserve margin and a high
level of operational reliability developing a wholesale market design that allows
consumers to continue to receive low-cost and reliable electricity over the long term
1 Capacity Demand and Reserves Report
The Capacity Demand and Reserves (CDR) Report published by ERCOT semi-
annually is a snapshot estimate of long-term supply and demand and the associated annual
reserve margin for peak summer and winter conditions While the CDR Report is not a
forecast of any particular outcome it provides insight into possible resource adequacy
trends
16 | P a g e
2017 SCOPE OF COMPETITION IN ELECTRIC MARKETS IN TEXAS REPORT
The May 2016 CDR Report shows estimated reserve margins well above the
current target reserve margin of 1375 Installed capacity reserve margin estimates taken
from this CDR Report are shown below in Table 7
Table 7 May 2016 Capacity Demand and Reserves Report Forecast
Forecast 2017 2018 2019 2020 2021 2022 2023 2024 2025 2026
Peak Load
(MW)
68548 69409 70795 71420 72098 72792 73482 74168 74864 75704
Total
Capacity
(MW)
80995 87019 87238 87407 87678 87738 87738 87728 87728 87728
Reserve
Margin
182 254 232 224 216 205 194 183 172 159
2 Operating Reserve Demand Curve
In ERCOT the price signals produced by the energy-only wholesale electric market
should provide incentives to promote short-term reliability as well as induce optimal long-
run investment in new resources If the prices are efficient and reflect the full cost of
dispatching resources to meet demand the benefits that accrue to both consumers and
producers can be maximized at the least cost and new generating capacity (or load
resources) should develop to maintain the equilibrium as old resources retire or demand
increases
The Operating Reserve Demand Curve (ORDC) implemented at the Commissionrsquos direction in June 2014 improves price formation by allowing prices to more fully reflect
the value of operating reserves The ORDC assigns an economic value to operating
reserves or the amount of extra capacity available to maintain system reliability on a daily
basis
As part of its ongoing review of resource adequacy in ERCOT the Commission is
currently evaluating the accuracy of the inputs to the ORDC to ensure that its contribution
to price formation appropriately reflects the costs of meeting demand and the underlying
needs of the system
3 Transmission Congestion
Although competitive power producers and regulated transmission providers form
two distinct segments of the market transmission buildout has a direct effect on wholesale
power prices When there is insufficient transmission capacity to dispatch energy in a least-
cost fashion the system operator takes action to ensure that the physical limits of the
transmission system facilities are not violated The re-dispatch of generation because of
transmission limits results in disparate prices at different locations on the system In
comparison to prior years transmission congestion in ERCOT has lessened because of the
large increase in transmission investment and the reduction of high demand related to oil
and gas production in West Texas ERCOT and the Commission continually evaluate the
need for cost-effective additional transmission investment to manage congestion
17 | P a g e
2017 SCOPE OF COMPETITION IN ELECTRIC MARKETS IN TEXAS REPORT
4 Wholesale Market Design Initiatives
While the ERCOT wholesale market has been successful in attracting new resource
investment and also maintaining competitive prices for consumers certain improvements
to the market design could yield additional benefits in terms of efficient price formation
and opportunities for entry of new technology Initiatives already in place in many other
regions such as real-time co-optimization and multi-interval real-time resource dispatch
may allow existing capacity to be used more effectively and create opportunities for the
integration of additional load resources to serve electric demand The Commission
continues to work with ERCOT and interested stakeholders to determine the value of
implementing such enhancements particularly as ERCOTrsquos resource mix changes over time
5 Reliability Standard
In early 2014 the Commission opened a project to review its use of a target installed
capacity reserve margin based on a reliability standard equivalent to one loss-of-load event
every ten years In this project the Commission received written comment from interested
parties conducted a public workshop consulted with independent experts and reviewed
the application of reliability standards in other regions As a result of this review future
reliability metrics to be estimated in ERCOT will include the market equilibrium reserve
margin the economically-optimal reserve margin and the associated levels of expected
unserved energy The Commission believes that publishing these metrics represents an
improvement over reporting a one-event-in-ten-years standard by enhancing insight into
expected outcomes in ERCOTrsquos energy-only market
Non-ERCOT Utilities Market Development Activities
SB 7 the law that introduced retail competition to the Texas market in 1999
granted the Commission authority to delay retail competition in an area where deregulation
would not result in fair competition and reliable service because of the lack of an
independent organization to coordinate the electric system and the concentration of
ownership in the generation sector in some of those areas Consequently SB 7 included
provisions recognizing the difficulty of implementing retail competition in areas outside of
ERCOT Therefore the utilities outside of the ERCOT region remain vertically integrated
owning generation transmission and distribution assets as well as selling power to end-
use customers These vertically integrated utilities remain subject to traditional regulation
including rates set by the Commission and customer choice is not offered in the service
territories of these utilities
The Commission does continue to monitor ongoing activities in the non-ERCOT
portions of the state In 2015 the Legislature granted the Commission the authority to
retain counsel and consulting experts in order to participate in legal proceedings at the
Federal Energy Regulatory Commission (FERC) which has regulatory jurisdiction over
wholesale power sales and transmission rates outside of ERCOT This authority has
18 | P a g e
2017 SCOPE OF COMPETITION IN ELECTRIC MARKETS IN TEXAS REPORT
permitted the Commission to participate more effectively in FERC proceedings affecting
Texasrsquo utilities located outside of ERCOT
1 Southwest Power Pool
The Southwest Power Pool (SPP) is the Regional Transmission Operator (RTO) for
areas of Northeast Texas and the Texas Panhandle In Texas the utilities Southwestern
Electric Power Company (SWEPCO) Southwestern Public Service (SPS) and several
electric cooperatives and municipally owned utilities are in SPP In addition to these areas
of Texas the SPP footprint includes parts of New Mexico Arkansas Missouri Nebraska
Louisiana and all of Kansas and Oklahoma In 2015 SPP became the RTO for the
Integrated System and neighboring areas which includes parts of Iowa Minnesota North
Dakota South Dakota Wyoming and Montana SPP has spent extensive time and
resources over the last two years to integrate these new areas successfully The expansion
added 5000 MW of peak demand 7600 MW of generating capacity and 9500 miles of
transmission lines17
In 2014 SPP launched its new Integrated Marketplace which provides a Day-
Ahead Market a Real-Time Balancing Market and Congestion Hedging Markets
mechanisms similar to those available in ERCOT The implementation of the Integrated
Marketplace resulted in a savings of $422 million in 2015 As a result of the Integrated
Marketplace SPPrsquos planning reserve margin will be reduced from 136 to 12 a change
expected to save about $90 million annually
Chairman Donna L Nelson represents the Commission as a voting member on
SPPrsquos Regional State Committee (RSC) The RSC provides collective state regulatory
agency input on a variety of issues In addition the RSC has authority over the cost
allocation methodologies for transmission upgrades allocation of Financial Transmission
Rights and the approach used for resource adequacy across the SPP region The RSC
regularly meets on a quarterly basis and meets more frequently if necessary
2 Midcontinent Independent System Operator
The Midcontinent Independent System Operator (MISO) is an RTO that serves all
or part of 15 states in the central US one Canadian province and the portion of eastern
Texas served by the vertically integrated utility Entergy Texas Inc MISO provides a Day
Two market which has a variety of functions and services including energy and ancillary
service markets economic dispatch congestion management financial transmission rights
and transmission planning The MISO Independent Market Monitor concluded that the
MISO wholesale markets were competitive in 2015
Like SPP MISO is in the Eastern Interconnection which crosses state boundaries
and is therefore subject to FERC jurisdiction A number of recent FERC proceedings have
17 2015 Southwest Power Pool Annual Report Available at
httpswwwspporgdocuments37800201520southwest20power20pool20annual20reportpdf
19 | P a g e
2017 SCOPE OF COMPETITION IN ELECTRIC MARKETS IN TEXAS REPORT
affected the portion of Texas that is in the MISO footprint The Commission through
outside counsel has been an active party in such FERC proceedings FERC Docket No
ER14-1174 addressed in part a dispute regarding the availability of transmission capacity
under the Joint Operating Agreement between MISO and the SPP Ultimately FERC
approved a settlement agreement under which MISO will compensate SPP and its members
for using their or other entitiesrsquo transmission systems
In a related pending docket at FERC Docket No ER14-1736 parties are addressing
how the cost of these payments will be allocated among MISO market participants Parties
in this proceeding are engaged in settlement discussions In addition in Docket No ER14-
75-000 FERC approved a settlement agreement among the participating Entergy
Operating Companies and their retail regulators to terminate the Entergy System
Agreement effective August 31 2016 The settlement terms prohibit any post-termination
payments that roughly equalize production costs among the operating companies after
December 31 2015 terminate certain specific cross-purchase power agreements between
Entergy Texas and former Entergy Gulf State Louisiana and permit the continuation of
several other purchase power agreements
Commissioner Kenneth W Anderson Jr represents the Commission as a voting
member in the Organization of MISO States (OMS) the purpose of which is to coordinate
regulatory oversight among the states in the MISO region and to make recommendations
to MISO FERC and other entities Commissioner Anderson also represents the
Commission as a voting member of the Entergy Regional State Committee (ERSC) which
has certain FERC-approved authority for five years after the Entergy integration with
regard to cost allocation for Entergy transmission projects and adding transmission projects
to the Entergy construction plan The ERSC meets quarterly
3 Western Electricity Coordinating Council
The Western Electricity Coordinating Council (WECC) is a Regional Entity whose
region includes the area surrounding El Paso and extends from Canada to Mexico
including the provinces of Alberta and British Columbia the northern portion of Baja
California and all or portions of the 14 Western states in between WECC is the Regional
Entity responsible for Bulk Electric System reliability in the Western Interconnection and
associated compliance monitoring and enforcement WECC does not have organized
markets outside of California but is organized into 38 separate balancing authorities
WECC is geographically the largest and most diverse of the eight Regional Entities in the
United States with delegated authority from the North American Electric Reliability
Corporation (NERC) and the Federal Energy Regulatory Commission In Texas El Paso
Electric Company is a member of WECC
Rulemaking Activities
The Commission has continued to adopt new rules and modify existing rules in
order to further the continued successful operation of the competitive retail and wholesale
markets and to comply with statutory changes made to PURA by the Legislature This
20 | P a g e
2017 SCOPE OF COMPETITION IN ELECTRIC MARKETS IN TEXAS REPORT
section of the Report provides a high-level overview of the Commissionrsquos key rulemaking
activities highlighting the market improvements made in 2015 and 2016
1 Cost Recovery and Rate Adjustment
The Commission adopted new rule 16 TAC sect25246 on June 29 2016 to
implement Section Nos 1 through 3 of House Bill 1535 of the 84th Legislature The new
rule only applies to a utility that operates solely outside of ERCOT and allows for the use
of an update period beyond the test year for which the utility initially files estimated
information The rule clarifies that all information originally estimated must be updated
with actual information and also provides requirements for a post-test-year adjustment for
a natural gas-fired plant A non-ERCOT utility also is required to initiate a new base rate
case on or before the four year anniversary of the final order in the utilityrsquos most recent comprehensive base rate case or if the commission determines that the utility has
materially earned more than its authorized rate of return in two consecutive years The rule
also provides requirements and procedures for the relation back of final rates to an effective
date 155 days after the filing of the rate application
2 Changes to Certificates of Convenience and Necessity and CREZ Rule
The Commission conducted a rulemaking to implement changes pursuant to
Legislative mandates in SB 776 SB 933 and HB 1535 of the 84th Legislature SB 776
required municipally owned utilities to apply for a certificate of convenience and necessity
(CCN) before constructing transmission facilities outside the boundaries of the
municipality that owns the municipally owned utility SB 933 also requires persons to
obtain a CCN before interconnecting a tie line into the ERCOT grid HB 1535 requires the
Commission to issue a final order within 181 days for a non-ERCOT utility requesting a
CCN for an existing electric generating facility and 366 days after a non-ERCOT utility
files a CCN for a newly constructed generating facility In addition the Commission also
determined in this rulemaking that all future transmission projects in a Competitive
Renewable Energy Zone (CREZ) must meet the need criteria of PURA sectsect 37056(c)(1)
and (2) rather than being exempt Finally the Commission determined that the CREZ
project established in 2008 was complete following the installation of a second circuit on
a Sharyland line
3 Use of Handheld Device for Enrollment
As the market evolves the Commission evaluates market changes balancing its
desire to encourage customer-focused innovation with its concern for customer protection
against potential abuses In Docket No 44518 the Commission granted a REP a
temporary 12-month waiver from its rules requiring the marketer to obtain telephonic
verification of the customerrsquos desire to switch REPs as well as a waiver from certain authorization disclosure requirements among other stipulations the Commission placed
upon the REP The Commission then opened Project No 45625 to study the issue of REPs
utilizing hand-held devices for customer enrollment more broadly and engage with market
representatives consumer representatives and other stakeholders The Commission
anticipates considering an amendment to its rules in the spring of 2017
21 | P a g e
2017 SCOPE OF COMPETITION IN ELECTRIC MARKETS IN TEXAS REPORT
4 Smart Meter Texas Portal
The electric utilities in Texas that have advanced metering systems (AMS) jointly
own and operate a single web portal known as Smart Meter Texas (SMT)18 SMT fulfills
two requirements imposed by the Commissionrsquos advanced metering rule on a utility with
AMS (1) provide to the retail customer the REP serving the customer and other entities
authorized by the customer access to such retail customerrsquos consumption data and (2)
allow devices at the customerrsquos premises to communicate through a home area network with the advanced meter at the premises SMT also facilitates near real-time on-demand
reads of a customerrsquos meter that aids prepaid service offered by certain REPs
In Project No 42786 Review of Advanced Metering System Web Portal
Commission staff and stakeholders examined options for the long-term operational
structure governance and funding of SMT The Commission determined that ownership
of SMT should remain with the TDUs because they can operate the portal at a lower cost
than transferring the data repository to ERCOT The Commission opened two
rulemakings one to ascertain the appropriate governance performance and funding of
SMT and a second to determine the appropriate access for third parties ensuring that
customers have the freedom to grant and give third parties access to their data if made
knowingly while also securing customer privacy
Sharyland Utilities
In early 2015 customers of Sharyland Utilities the smallest investor-owned
transmission and distribution utility in ERCOT began to file with the Commission a
significant number of complaints regarding high electricity bills In response the
Commission opened Project No 44592 Relating to a Project Regarding Sharyland
Utilities to provide for a more formal process for Commission review of the large number
of complaints As part of this project Commission staff prepared a report to evaluate the
electricity rates and electric bills in the operating area of Sharyland Utilities that was
previously part of Cap Rock Energy
Staffrsquos report found that a number of factors contributed to the comparatively high
bills for many of Sharyland-Cap Rockrsquos customers First Sharylandrsquos small size and its low customer density result in high TDU rates for all customers relative to other TDUs In
particular Staffrsquos report found that Sharyland-Cap Rockrsquos rates for distribution service are
up to three times higher than those of other TDUs in Texas In addition to Sharyland-Cap
Rockrsquos high costs for distribution service higher wholesale transmission costs also
contributed to the rate increases charged to Sharyland-Cap Rockrsquos customers These transmission costs are the result of increased transmission investment in recent years
throughout Texas that has increased transmission costs for all distribution providers
18 The participating Texas TDUs are AEP Texas Central Company and AEP Texas North Company (jointly
ldquoAEPrdquo) CenterPoint Energy Houston Electric LLC (ldquoCenterPointrdquo) Oncor Electric Delivery Company LLC (ldquoOncorrdquo) and Texas-New Mexico Power Company (TNMP) collectively referred to as the ldquoJoint TDUsrdquo Operation of an AMS web portal was addressed in the orders approving particular utilitiesrsquo deployment of AMS and approving surcharges for AMS cost recovery While Sharyland Utilities filed comments in the proceeding it did not
participate as it had not fully completed its AMS deployment at the time
22 | P a g e
2017 SCOPE OF COMPETITION IN ELECTRIC MARKETS IN TEXAS REPORT
including Sharyland Utilities Second the comparatively colder winter of 2014 ndash 2015
which was the time period generally consistent with the timeframe in which the
Commission began receiving complaints appeared to result in higher electricity usage than
normal This combination of high TDU rates and the higher electricity usage led to higher
bills for customers
Staffrsquos report also noted that in Sharyland-Cap Rockrsquos last rate case in 2014 the
approved rates reflected movement towards more cost-based rates for all customers
including some customers that previously had been heavily subsidized by other customers
Additionally in the process of standardizing Sharyland-Cap Rockrsquos customer classification
with the classifications of the other TDUs in Texas some customers may have experienced
a move from one class that previously was paying below-cost rates to another class that
was now paying above-cost rates For some of these customers the combined effects of
the movement towards cost-based rates and the change to a different class may have
contributed to a significant change in the customersrsquo rates Regardless of any cost-shifting
between customer classes Sharylandrsquos rates remain two to three times higher than those of other TDUs in Texas for all customers in all classes
On December 4 2015 the Commission signed an order directing Sharyland to file
an application for a comprehensive rate review by April 30 2016 Sharyland filed its rate
application on April 29 2016 in Docket No 45414 Review of the Rates of Sharyland
Utilities LP On October 10 2016 the Commission ordered Sharyland to file an amended
application as soon as practicable but no later than January 1 2017 to reflect the unique
aspects of the companyrsquos organizational structure as a real estate investment trust (REIT) At the time of publication Sharyland is expected to file its amended application in
December 2016
PowerToChoose Website
As part of its ongoing evaluation of the competitive market the Commission
opened Project No 45730 to evaluate the functionality and usability of its PowerToChoose
website which allows customers to select a REP and an electric plan based on their zip
code In the process the Commission received significant feedback from customers stating
that the Commissionrsquos PowerToChoose website was an important tool that plays a
fundamental role in their shopping process In response to the feedback received from
industry representatives and consumers Commission staff changed how the website sorts
and filters retail electric plans adding a filter to allow customers to unselect plans that
contain minimum usage fees or credits This filter is now a default setting and plans with
minimum usage fees and credits are not shown unless the customer actively selects to
search for such plans In addition Commission staff made other changes to increase the
clarity of the REP complaint rating The Commission continues to evaluate other changes
to improve the customer experience of the PowerToChoose website and provide
transparency for retail electric plans
23 | P a g e
2017 SCOPE OF COMPETITION IN ELECTRIC MARKETS IN TEXAS REPORT
Report on Alternative Ratemaking Mechanisms
In 2015 the Legislature enacted SB 774 which requires the Commission or its
consultant to conduct a study and make a report to the Legislature analyzing the alternative
ratemaking mechanisms adopted by other states In addition SB 774 extended the
authorization for the Periodic Rate Adjustment (PRA) mechanism from 2017 to 2019
which the Legislature had authorized in 2011 (SB 1693) as a version of an alternative
ratemaking mechanism that provides to utilities a means for expedited recovery of
distribution infrastructure costs Pursuant to SB 774 the Commission retained a consultant
to produce the report and the consultantrsquos recommendations included streamlining the ratemaking process to reduce procedural costs providing for a periodic review of the
prudency of the costs and using certain types of alternative ratemaking mechanisms that
decouple the recovery of costs from variations in load The Commission held a public
hearing to receive comments on the report from stakeholders and after consideration of
those comments has provided to the Legislature the consultantrsquos report together with its
own discussion of the report
Request for Purchase of Oncor Electric Delivery Company
In March 2016 the Commission approved with conditions an application by an
investor group led by Hunt Consolidated Inc the owners of Sharyland Utilities to acquire
control of Oncor Electric Delivery Company (Oncor) the largest transmission and
distribution utility in Texas from Oncorrsquos parent company Energy Future Holdings which
is in bankruptcy The Commission approved the request subject to certain conditions
including stipulations regarding the organization of the new entities and treatment of tax
benefits The investor-led group subsequently declined to pursue the transaction that was
approved by the Commission
In September 2016 NextEra Energy which owns Florida Power amp Light received
approval from the United States Bankruptcy Court in Delaware for its plan to purchase
Oncor In October 2016 NextEra Energy filed an application with the Commission in
Docket No 46238 for approval of the proposed transaction The Commission will evaluate
the application to determine if the transaction is in the public interest
Integration of Lubbock Power and Light
In March 2016 the Commission opened Project No 45633 to study and identify
the issues related to the request of Lubbock Power and Light the statersquos third-largest
municipally owned utility to be integrated into ERCOT The Commission is currently
working with stakeholders ERCOT and SPP to determine the cost and benefits of any
potential switch by Lubbock Power and Light into ERCOT and whether such a switch is
in the public interest
24 | P a g e
2017 SCOPE OF COMPETITION IN ELECTRIC MARKETS IN TEXAS REPORT
Desalination Project ERCOT Studies
In 2015 the Legislature passed HB 4097 which directed the Commission and
ERCOT to study whether existing transmission and distribution planning processes are
sufficient to provide adequate infrastructure for seawater desalination projects and to study
the potential for desalination projects to participate in demand response opportunities in
the ERCOT market Pursuant to that direction ERCOT staff have prepared a report on the
feasibility of interconnection of large desalination projects and on opportunities for such
projects to participate in ERCOTrsquos demand response programs which is attached to this Report in Appendix B
Oversight and Enforcement Actions
The Commissionrsquos enforcement of statutes rules and orders applicable to entities
under its jurisdiction serves to protect consumers the electric markets the reliability of the
electric grid and to promote fair competition The Commissionrsquos enforcement efforts in the electric industry focus on violations of PURA the Commissionrsquos rules and ERCOT
protocols
During the period from January 2015 through August 31 2016 the Commission
assessed $3258500 in penalties against electric market participants Table 8 provides a
summary of electric industry Notices of Violation since January 2015 During 2015 and
2016 Commission staff opened 212 investigations for the electric industry and closed 177
investigations
Table 8 Notices of Violations
Violation Type Total Penalty Amount
Retail Market Violations $539000
Service Quality Violations $451500
Wholesale Market Violations $2268000
TOTAL $3258500
In addition to the imposition of administrative penalties the Commission uses other
enforcement mechanisms in exercising its enforcement duties including revoking a
companyrsquos certificate to operate In addition some companies may be required to relinquish a certificate as part of a settlement after enforcement action has proceeded
Table 9 provides a breakdown of the number of certificates revoked or relinquished In
2016 the Commission revoked the certificate of the REP TruSmart Energy
Table 9 Certificates Revoked or Relinquished
Type Number
Certificates Revoked 1
Certificates Relinquished 0
25 | P a g e
2017 SCOPE OF COMPETITION IN ELECTRIC MARKETS IN TEXAS REPORT
The Oversight amp Enforcement division also issues warning letters to companies in
the electric market when it determines that a violation occurred but given the
circumstances surrounding the violation and other mitigating concerns no administrative
penalty is warranted During 2015 and 2016 the Oversight amp Enforcement division issued
50 warning letters Finally the Commission generally seeks to reimburse money directly
to customers when appropriate In 2015 and 2016 the Commission ordered the
reimbursement of $8543596 to Texas electric customers
Table 10 Warning Letters
Warning Letter Type Number
Retail Market Warning Letter 8
Service Quality Warning Letter 1
Wholesale Market Warning Letter 41
TOTAL 50
In addition to its enforcement activities the Commission also enters into voluntary
mitigation plans with generators that request one through a contested case proceeding
pursuant to PURA sect15023(f) and 16 TAC sect25504(e) The Commission entered into one
voluntary mitigation plan during 2015 and 2016 in Docket No 44635
Low-Income Discount System Benefit Fund
The System Benefit Fund (SBF) was originally established in 1999 to fund
discounts to low-income customers customer education activities energy-efficiency and
weatherization and electric market oversight through a nonbypassable surcharge on retail
electric bills HB 1101 of the 84th Legislature provided that the SBF be sunset on
September 1 2017 by which time the SBF is intended to be exhausted In the 2016 Fiscal
Year (FY) $325521250 was appropriated in the SBF to provide a 25ndash31 percent discount
to low-income customers over a 12-month period
To assist the drawdown of the remaining balance HB 1101 authorized the
Commission to use any unexpended SBF balance in FY 2017 to assist low-income
customers The Commission estimates that the remaining SBF balance will be
approximately $17 million by August 31 2017 The Commission has determined that this
amount is insufficient to fund the rate reduction program however the Commission will
spend approximately $100000 to continue automatic enrollment in the program to provide
REPs a list of customers eligible to receive late fee waiver and deposit installment benefits
These two ancillary benefits of the rate reduction program will continue for the duration of
FY 2017
26 | P a g e
2017 SCOPE OF COMPETITION IN ELECTRIC MARKETS IN TEXAS REPORT
Homeland Security
The Commission assesses the efforts of ERCOT and utilities to defend against
mitigate and respond to the variety of risks that the modern electricity system faces The
Commission also meets with ERCOT utilities and governmental entities on an ongoing
basis to discuss preparation for everything from hurricanes and other severe weather to
cyber-threats and threats of physical damage to the grid from accidents or intentional
malfeasance In addition the Commission monitors industry and federal programs that
address homeland security issues
The Commission serves as an information liaison between state government and
electric utilities during emergencies The Commissionrsquos main roles include
Conveying outage and service restoration information from electric utilities to
state government
Conveying service restoration priorities (hospitals water treatment facilities
etc) from state government to electric utilities and
Facilitating the clearance of downed power lines in disaster re-entry areas and
facilitating entry of electric utilities into disaster areas
The Commissionrsquos Emergency Management Response Team (EMRT) provided staff at the
State Operation Center for the May 2015 and April 2016 flooding events in Texas as well
as additional staffing for severe winter weather
Demand Response
ERCOT staff have begun to report annually on the participation of customers in
REP-sponsored demand response programs These programs which have been facilitated
by the deployment of smart meters throughout the competitive areas within ERCOT and
by many municipal and cooperative electric utilities take the form of rebates for reduction
in usage during peak period time-of-use pricing real-time volumetric price compensation
for load reduction and direct control of customer load among other plans
These programs have seen dramatic increases in participation since ERCOT began
to gather this information in 2013 From 2013 to 2014 the number of residential customers
participating in these programs increased from 151793 to 721273 and the number of
commercial and industrial customers participating rose from 30275 to 50205 The
Commission continues to monitor ERCOTrsquos stakeholder process for efforts relating to the integration of demand response
27 | P a g e
2017 SCOPE OF COMPETITION IN ELECTRIC MARKETS IN TEXAS REPORT
IV LEGISLATIVE RECOMMENDATIONS
A Determination of Low-Income Customer Eligibility
In 2015 HB 1101 required that all remaining funds in the System Benefit Fund
(SBF) be expended that the fee that funded the program as a nonbypassable surcharge on
electric bills be set at zero and that the SBF be sunset on September 1 2017 Per the
provisions of HB 1101 the SBF fee was set at zero in September 2016 concluding the
funding for the program The sunset of the SBF program also concluded the relationship
between the Texas Health and Human Services Commission (HHSC) and the Commission
in which the HHSC provided to the Commission eligible electric customers for the SBF
low-income discount Because of the termination of the relationship with HHSC with the
termination of the SBF the Commission will no longer be able to determine easily an
electric customerrsquos eligibility for other low-income programs such as late penalty waivers
and the option of paying an electric deposit over multiple months
The Legislature may wish to consider easing low-income customers access to these
low-income programs by facilitating the process used to determine eligibility The
Commission offers four possible approaches in which the Legislature could continue these
low-income programs
(1) Authorize HSSC to provide identification of eligible low-income customers to the
Commission
(2) Allow retail electric providers (REPs) to provide such low-income programs using
the Low Income Discount Administratorrsquos (LIDA) Telecommunications Lifeline
Service Program list to identify low-income customers
(3) Require REPs to offer such low-income programs with customers self-enrolling
and REPs verifying income eligibility or
(4) Allow REPs to voluntarily provide such low-income programs at their own
discretion
B Outside Counsel for Proceedings before Regional Transmission
Organizations
Regional Transmission Organizations (RTO) manage the power grid across wide
regions of the United States Most of Texas is inside the ERCOT region however there
are significant portions of East Texas and the Panhandle that are in the Midcontinent
Independent System Operator (MISO) and the Southwest Power Pool (SPP) Issues arise
in these other RTOs that have significant impact on Texas ratepayers such as how
transmission infrastructure costs will be shared These tend to be very lengthy and
complicated proceedings that require specialized legal and consulting services
28 | P a g e
2017 SCOPE OF COMPETITION IN ELECTRIC MARKETS IN TEXAS REPORT
PURA sect 394525 currently authorizes the Commission to use outside consultants
auditors engineers or attorneys to represent the Commission in proceedings before the
Federal Energy Regulatory Commission This provision has been an important tool for the
Commission to respond to complex matters in the federal arena to enable it to protect the
public interest in Texas The PUC recommends that the Legislature expand the language
in this statute to include the ability to hire outside assistance for proceedings before other
RTOs to provide those same protections to Texas ratepayers in those areas
C Repeal of Natural Gas and Renewable Energy Mandates
1 Natural Gas
PURA sect 399044 establishes natural gas as ldquothe preferential fuelrdquo in Texas for electricity generation and requires the Commission to adopt rules to establish a system of
natural gas energy trading credits The majority of all new non-renewable electricity
generation constructed since 2000 for Texas has used natural gas as a primary fuel and this
trend is expected to continue in the foreseeable future The thresholds used to trigger the
natural gas energy trading credit system in PURA sect 399044 have not been reached and
they are not expected to be reached in the foreseeable future
Because natural gas-fueled facilities have been the most commonly built new
generation in Texas for many years and are expected to continue to be there is no need to
establish incentives for natural gas generation The PUC recommends that the Legislature
consider repealing PURA sect 399044 because it is no longer necessary
2 Renewable Energy
PURA sect 39904 establishes goals for renewable energy Subsection (a) requires
the installation of 5880 megawatts of renewable energy by 2015 and Subsection (b)
establishes a renewable energy credits trading program to implement the requirement The
5880 megawatts mandates in Subsection (a) was met in 2008 While the Commission
believes the renewable energy trading credit program is needed for retail electric providers
to validate renewable energy marketing claims the Commission believes the 5880
megawatts mandate in Subsection (a) is no longer necessary
D Advisory Opinions
Many regulatory agencies in Texas have authority to issue informal guidance to the
persons they regulate particularly with respect to outlining whether a particular course of
conduct would in the agencyrsquos view be consistent with the laws and regulations that the agency administers19 The issuance of an advisory opinion can provide regulatory clarity
to a company before making investments or conducting operations the permissibility of
which may be unclear under state law The Legislature may want to consider granting the
19 In addition certain federal agencies such as the Federal Communications Commission
Internal Revenue Service Securities and Exchange Commission and Federal Election
Commission have authority to issue advisory opinions
29 | P a g e
2017 SCOPE OF COMPETITION IN ELECTRIC MARKETS IN TEXAS REPORT
Commission the authority to issue advisory opinions In the electric industry providing
clarification to a company concerning issues such as the purchase of assets or the
acquisition of another company could allow it to avoid expensive regulatory proceedings
without impairing the Commissionrsquos authority The following state agencies have statutory authority to issue advisory opinions
Texas Ethics Commission20
Texas Medical Board21
State Board of Dental Examiners22
Texas Board of Nursing23
Texas Board of Professional Engineers24
Texas Lottery Commission and25
Texas Securities Board26
E Administrative
Gross Receipts Assessment
PURA sect 16001 provides for a gross receipts assessment that is used to defray the
expenses incurred by the Commission to administer PURA An assessment of one sixth of
one percent is collected from public utilities electric cooperatives retail electric providers
and interexchange carriersrsquo gross receipts from consumers The funds from this assessment
are remitted to the general revenue fund but currently they have not been explicitly
dedicated to funding of the Commission In contrast similar assessments on water
utilities insurance companies and other regulated entities have traditionally been used to
explicitly fund the underlying regulatory programs at the respective agencies The
Commission is one of four Article VIII agencies that is not designated as self-funded
The Commission recommends that the Legislature designate the Commission as a
self-funded agency whereby the collected assessments would be explicitly dedicated to the
funding of the agency Implementing this recommendation would require the Public Utility
Commission to be included in the Appropriations Limited to Revenue Collections rider
located in the Special Provisions Relating to All Regulatory Agencies section of the
General Appropriations Act Designation as a self-leveling agency would require the
Commission to set the gross receipts assessment at a rate sufficient to generate revenue in
the amount of the agencyrsquos general revenue appropriation each fiscal year which would require a statutory change to PURA sect16001(b) Based upon the Commissionrsquos baseline budget request authorizing the PUCrsquos self-leveling designation would result in an overall
estimated tax reduction of $456 million per year or 774
20 Government Code sect 571091 21 Occupations Code sect 162107 22 Occupations Code sect 258157 23 Occupations Code sect 301607 24 Occupations Code sect 1001601 25 Occupations Code sect 2001059 26 Tex Rev Civ Stat Ann Arts 581-28-1 amp 581-35 7 Tex Admin Code 1012
30 | P a g e
2017 SCOPE OF COMPETITION IN ELECTRIC MARKETS IN TEXAS REPORT
V APPENDICES
31 | P a g e
2017 SCOPE OF COMPETITION IN ELECTRIC MARKETS IN TEXAS REPORT
Appendix A ndash Acronyms
AEP American Electric Power
AMS Advanced Metering System
CenterPoint CenterPoint Energy Houston Electric LLC
DG Distributed Generation
DRG Distributed Renewable Generation
ERCOT Electric Reliability Council of Texas
ERSC Entergy Regional State
ERS Emergency Response Service
ETI Entergy Texas Inc
IMM ERCOT Independent Market Monitor
kWh Kilowatt-hour
LMP Locational Marginal Pricing
LSP Large Service Provider
MISO Midwest Independent System Operator
MMBtu One million British Thermal Unit (BTU)
MW Megawatt
MWh Megawatt-hour
Nodal Texas Nodal Market Design
ORDC Operating Reserve Demand Curve
PGC Power Generation Company
POLR Provider of Last Resort
PURA Public Utility Regulatory Act
REP Retail Electric Provider
RSC Regional State Committee
RTO Regional Transmission Organization
SCED Security Constrained Economic Dispatch
Sharyland Sharyland Utilities LP
SBF System Benefit Fund
SPP Southwest Power Pool
TDU Transmission and Distribution Utility
TNMP Texas-New Mexico Power Company
32 | P a g e
2017 SCOPE OF COMPETITION IN ELECTRIC MARKETS IN TEXAS REPORT
Appendix B ndash ERCOT Desalination Report
This page intentionally left blank
33 | P a g e
ERCOT Public
Study on the Demand Response Potential for Seawater Desalination Projects
ERCOT November 18 2016
Study on the Demand Response Potential for Seawater Desalination Projects ERCOT Public
Executive Summary
In 2015 the 84th Texas Legislature enacted House Bill (HB) 4097 which included several provisions relating to seawater desalination projects including a requirement that the Public Utility Commission of Texas (PUC) and Electric Reliability Council of Texas (ERCOT) study the potential for seawater desalination projects to participate in existing demand response opportunities in ERCOT There are several demand response products in which demand-side resources (ie consumers of electricity) can participate These programs help to preserve system reliability and provide economic benefits to participating demand-side resources Seawater desalination is an energy-intensive process that removes salt and other minerals from salt water to produce fresh water for municipal consumption industrial use or irrigation Participation in demand response could help mitigate electricity costs for future seawater desalination projects in Texas and provide reliability benefits to the grid
There are two main demand response reliability-based services administered by ERCOT participation by demand-side resources in the Ancillary Services market and the Emergency Response Service (ERS) Within the Ancillary Services market the most common service provided by demand-side resources is Responsive Reserve Service (RRS) which requires resources to respond either instantaneously or within 10 minutes in response to unplanned system emergencies ERS is separate from ERCOTrsquos Ancillary Services market and allows demand-side resources and distributed generation to provide reliability services in the event of an energy emergency Resources can qualify for either the 10-minute or 30-minute response time ERS programs
There are several key considerations that will impact a demand-side resourcersquos ability to participate in different demand response opportunities response time recovery time predictability of electrical demand and flexibility of operations Considering these factors together it appears that seawater desalination plants could be designed to meet the requirements for participation in demand response Because the ability to meet the qualification requirements is dependent on the plant design demand response opportunities should be considered early in a projectrsquos development if participation is desirable
Whether project developers will choose to address these requirements will depend on the economic benefits of participation There may be additional costs to design seawater desalination plants to operate in the manner required in order to participate in demand response These include costs associated with additional plant design specifications need for excess capacity and storage to make up for lost production during demand response deployment operational costs resulting from interruptions to plant processes and potential financial penalties if demand response deployment results in failure to meet contract demands The interplay of the benefits of participation and these costs will determine whether it would be beneficial for a future seawater desalination plant to participate in demand response in ERCOT
To date participation of seawater desalination plants in demand response programs has been limited Because the process of seawater desalination is energy-intensive participation in demand response could help to reduce electricity costs while posing a relatively low risk to plant operations As stakeholders in Texas continue to plan for possible future droughts in the region and identify water management strategies consideration of demand response could play a role in mitigating some costs associated with seawater desalination and allow seawater desalination plants to assist with maintaining electric reliability in the region
copy 2016 ERCOT All rights reserved i
Study on the Demand Response Potential for Seawater Desalination Projects ERCOT Public
Table of Contents
1 Introduction 1
2 Seawater Desalination 2
21 Seawater Desalination Plant Operations 2
22 Seawater Desalination Plant Economics 3
3 Demand Response Opportunities in ERCOT 4
31 ERCOT-Dispatched Demand Response 4
311 Ancillary Services Markets 5
312 Emergency Response Service (ERS) 5
32 Non-ERCOT-Dispatched Demand Response 6
321 Four Coincident Peak (4CP) 6
322 LSE or DR Provider Contracted Price Response 6
323 Self-Directed Price Response 6
4 Demand Response Potential for Seawater Desalination 7
41 Operational Considerations for ERCOT-Dispatched Demand Response 7
42 Economic Considerations for ERCOT-Dispatched Demand Response 8
43 Considerations for Non-ERCOT-Dispatched Demand Response 9
5 Conclusion 11
copy 2016 ERCOT All rights reserved ii
Study on the Demand Response Potential for Seawater Desalination Projects ERCOT Public
1 Introduction
In 2015 the 84th Texas Legislature enacted House Bill (HB) 4097 which included several provisions relating to seawater desalination projects including a requirement that the Public Utility Commission of Texas (PUC) and Electric Reliability Council of Texas (ERCOT) study the potential for seawater desalination projects to participate in existing demand response opportunities in ERCOT ERCOT and the PUC initiated this study to fulfill that requirement and evaluated the operational and economic characteristics of seawater desalination plants in light of ERCOTrsquos primary demand response products1
ERCOT is the independent system operator (ISO) for the ERCOT Interconnection which encompasses approximately 90 of demand for electricity in Texas ERCOT is the independent organization established by the Texas Legislature to be responsible for the reliable planning and operation of the electric grid for the ERCOT Interconnection ERCOT also administers and maintains a forward-looking open market to provide affordable and reliable electricity to consumers in Texas In collaboration with market participants ERCOT has developed demand response products and services for customers that have the ability to reduce or modify electricity use in response to instructions or signals These programs help preserve system reliability and provide economic benefits to participating demand-side resources
The process of seawater desalination removes salt and other minerals from salt water to produce fresh water for consumption industrial processes or irrigation The drought-prone Texas climate coupled with projections for increasing water demand in the state has created interest in seawater desalination as a future water source The 2017 Texas State Water Plan includes seawater desalination as a future water management strategy for water users in the state However the seawater desalination process is energy intensive and electricity consumption can be a significant cost driver for these projects To the extent that these plants could participate in demand response it would help to defray these costs Thus there is a potential nexus between seawater desalination projects built in Texas to mitigate drought but which have large electricity requirements and ERCOT demand response opportunities which could help to reduce their electricity costs and provide reliability benefits
This study evaluates the demand response potential of seawater desalination plants based on their operational characteristics and economic drivers The report is organized as follows
Section 2 provides background on typical seawater desalination plant operations and economics
Section 3 describes the current demand response opportunities in ERCOT
Section 4 evaluates the characteristics of seawater desalination plants to determine their potential to participate in demand response opportunities in ERCOT and
Section 5 provides a summary of the conclusions of this study
1 In the course of developing this report ERCOT consulted with several desalination experts with experience with existing or planned seawater desalination plants in the US The technical experts consulted included Jorge Arroyo (Water Management Consultant) Andrew Chastain-Howley (Black amp Veatch) Jonathan Loveland (Black amp Veatch) Ron Parker (Black amp Veatch) John Wolfhope (Freese and Nichols) and Srinivas Veerapaneni (Black amp Veatch)
copy 2016 ERCOT All rights reserved 1
Study on the Demand Response Potential for Seawater Desalination Projects ERCOT Public
2 Seawater Desalination
There are two primary methods for seawater desalination distillation (also referred to as ldquothermalrdquo) and reverse osmosis Distillation uses heat to remove salts and minerals from seawater by boiling water at high pressures In contrast reverse osmosis technology forces saline water through a membrane to separate water from the salts and minerals While both distillation and reverse osmosis are energy intensive distillation requires thermal energy to heat the water and overall has a higher energy requirement whereas reverse osmosis requires primarily electrical energy and overall is less energy intensive ndash though still with significant electricity requirements
Globally most thermal desalination plants are located in the Middle East due to low energy prices in the region Plants located elsewhere including in the US typically use reverse osmosis technology2 There are two large existing seawater desalination plants in the US one in Carlsbad California providing water to the San Diego area and one in Gibsonton Florida providing water to the Tampa Bay area Both plants use reverse osmosis technology In addition there are several desalination projects currently in the planning stages or under development in Texas in the Corpus Christi area that would use reverse osmosis technology For that reason this report focuses on reverse osmosis technology in the evaluation of demand response potential of seawater desalination plants
While there are currently no existing seawater desalination plants in Texas there are several municipal and industrial brackish water desalination plants in the state According to the Texas Water Development Board (TWDB) there are 46 municipal brackish water desalination plants with capacities greater than 0025 million gallons per day (MGD) in Texas representing a total of 123 MGD of capacity3 The desalination of brackish water is typically less expensive compared to seawater due to the lower relative salinity of brackish water This study focuses exclusively on seawater desalination consistent with the requirements of HB 4097 but it should be noted that conclusions may also apply to brackish water desalination though at a different cost and scale
This section provides high-level information on the operations (Section 21) and economics (Section 22) of seawater desalination plants to inform the discussion of their demand response potential in Section 4
21 Seawater Desalination Plant Operations Seawater desalination plants typically range in capacity from less than 5 MGD up to 165 MGD For example the Carlsbad seawater desalination plant has a capacity of approximately 50 MGD and the plant in Tampa Bay has a capacity of approximately 25 MGD The associated electricity consumption ranges between 10 and 15 kWh1000 gallons produced depending on the salinity of the water being processed456 More saline water (eg seawater) requires larger amounts of electricity for desalination Thus a seawater desalination plant would have larger electricity consumption requirements compared to a similarly sized brackish water desalination plant
2 American Water ldquoInnovation Solutions within the Water Industry Desalinationrdquo Available at httpwwwamwatercomfilesInnovationsSolutionsWithinTheWaterIndustryDesalinationpdf 3 Texas Water Development Board ldquoDesalination Factsrdquo Available at httpswwwtwdbtexasgovinnovativewaterdesalfactsasp 4 American Membrane Technology Association April 2016 ldquoMembrane Desalination Power Usage Put in Perspectiverdquo Available at httpwwwamtaorgcomwp-contentuploads7_MembraneDesalinationPowerUsagePutInPerspectivepdf 5 Water Reuse Association November 2011 ldquoSeawater Desalination Power Consumptionrdquo Available at httpswatereuseorgwpshycontentuploads201510Power_consumption_white_paperpdf 6 Ghaffour N TM Missimer and G Amy January 2013 ldquoTechnical review and evaluation of the economics of water desalination Current and future challenges for better water supply sustainabilityrdquo Desalination 309 pp197-207 Available at httpswwwresearchgatenetpublication256693140_Technical_review_and_evaluation_of_the_economics_of_water_desalination_ Current_and_future_challenges_for_better_water_supply_sustainability
copy 2016 ERCOT All rights reserved 2
Study on the Demand Response Potential for Seawater Desalination Projects ERCOT Public
While the two existing seawater desalination plants in the US were co-located with power plants to ease compliance with regulations on water intake and discharge structures and reduce costs many other reverse osmosis desalination plants receive their electricity from the grid However plants may have on-site backup generation in case of a power outage This will vary depending on the size and design of the plant and other factors For example the Carlsbad plant in California does have diesel backup generation to power control systems and flushing systems in the case of a power outage The plant in Tampa Bay was not built with backup power due to potential storm surge risks from hurricanes and other storms The plant does use uninterruptible power supply (UPS) backup to power control systems during power outages
Reverse osmosis plants are typically designed with several ldquotrainsrdquo which consists of a high-pressure pump turbine and reverse osmosis membrane Desalination plants are turned on or off one train at a time in a highly controlled process The process of ramping up or down an individual train under normal operations typically takes one to two hours While plants can be designed to handle immediate shutdowns (ie in a power outage) re-starting a system after an interruption would take this amount of time In addition the saline water must be pretreated (ie filtered) before going through the reverse osmosis train and this can sometimes pose constraints on the flexibility of operations
Demand for water is the key factor driving the level of production at seawater desalination plants Typically the plant will have a contract or contracts with municipal or other water users to deliver desalinated water and is operated to meet that demand Alternatively if the plant is municipally owned it would similarly be operated to meet the level of water demand in conjunction with other available water sources If water demands are close to a plantrsquos full capacity the operatorrsquos flexibility to adjust its electricity consumption as part of demand response may be limited However this does mean that plant operations are fairly predictable on a day-to-day basis which is necessary for participation in demand response
The amount of flexibility in plant operations will also be impacted by the amount of water storage available For example if a plant has sufficient water storage on-site or storage within the customerrsquos distribution system it could provide flexibility for the plant to reduce its operations during peak hours when electricity prices are likely to be highest It would also mitigate the impacts of interruptions to production from demand response deployments
22 Seawater Desalination Plant Economics Seawater desalination is typically more expensive than other sources of water and a major driver of the overall cost is energy costs In 2016 the Carlsbad plant charged rates at between $2131 and $2367 per acre-foot78 This charge is intended to cover both the fixed costs of the plant and the variable costs to produce a unit volume of water Typically half to two thirds of the cost of providing desalinated seawater are accounted for by capital cost recovery with the remainder accounted for by operations and maintenance costs including electricity costs Electricity costs can account for 20shy25 of the total costs of seawater desalination with reverse osmosis technology9
Factors affecting the capital cost of a seawater desalination plant include plant size type of desalination process and pre-post-treatment technologies plant infrastructure (eg piping water storage backup power) and compliance with applicable regulations (eg regulations on intake structures brine byproduct disposal) A significant driver of operating and maintenance costs is membrane replacement Reverse osmosis membranes need to be replaced every few years and
7 Source San Diego County Water Authority ldquoSeawater Desalinationrdquo Available at httpwwwsdcwaorgseawater-desalination 8 Note that 1 acre-foot is approximately 325851 gallons 9 Based on technical input from Black amp Veatch
copy 2016 ERCOT All rights reserved 3
Study on the Demand Response Potential for Seawater Desalination Projects ERCOT Public
the rate at which they are replaced will depend on the salinity of the feedwater and how the plant is operated Treatment and disposal of the salty brine byproduct from desalination may also incur operating costs
Electricity costs will vary depending on a range of factors including the size of the plant type of desalination technology source of electricity and quality of the feedwater As previously noted more saline water requires higher amounts of electricity in desalination and thus the amount of electricity consumption is a key difference between brackish water and seawater desalination As a result electricity costs comprise a significant share of the costs of seawater desalination These costs could potentially be defrayed in part by participation in demand response initiatives
3 Demand Response Opportunities in ERCOT
Broadly speaking demand response can be broken down into two major categories dispatchable or non-dispatchable For purposes of this report we will define dispatchable as those demand response events that are initiated by ERCOT and non-dispatchable as an event not specifically initiated by ERCOT These non-dispatchable events may include decisions made by the end-use customer to alter its consumption pattern or may include contractual obligations with another entity such as the end-use customerrsquos retail electric provider (ldquoREPrdquo) to alter consumption patterns
ERCOTrsquos wholesale market is open to several types of dispatchable demand response which are deployed to maintain system reliability Demand-side resources providing Emergency Response Service (ERS) may offer based on either a 10 or 30-minute response time commonly referred to as the ldquoramp periodrdquo Alternatively demand-side resources may register and qualify as a Load Resource that can provide Reserves in the Ancillary Services market The most common service provided by demand-side resources is Responsive Reserve Service which requires an under-frequency relay that can instantaneously interrupt the load during certain system reliability events Some demand-side resources can also participate in other Ancillary Services as Controllable Load Resources that require sophisticated control systems that allow them to be deployed in a more incremental proportional manner
Non-dispatchable demand response in ERCOT can include a response to avoid transmission costs where rates are based on Four Coincident Peak Pricing (4CP) response to wholesale energy prices initiated by the customer or by a REP or other load-serving entity (ldquoLSErdquo) or utility-managed Load Management programs (LM)
The sections that follow provide a description of both ERCOT-dispatched (Section 31) and nonshyERCOT-dispatched (Section 32) demand response For a more detailed description of opportunities for demand-side resources to participate in demand response in ERCOT see ERCOTrsquos guide Load Participation in the ERCOT Nodal Market10
31 ERCOT-Dispatched Demand Response There are two main demand response reliability-based services administered by ERCOT participation by demand-side resources in the Ancillary Services market and participation in ERS These services are dispatched by ERCOT during system emergencies
10 Available at httpwwwercotcomcontentservicesprogramsloadLoad20Participation20in20the20ERCOT20Nodal20Market_302d oc
copy 2016 ERCOT All rights reserved 4
Study on the Demand Response Potential for Seawater Desalination Projects ERCOT Public
Demand-side resources with demand response capability that can meet a set of performance requirements can be qualified to provide Ancillary Services as Load Resources in the Ancillary Services Market The value of having a Load Resource available to reduce load is equal to the value of having a generator available to increase its generation at a generating plant The providers of operating reserves selected to provide Ancillary Services are eligible for capacity payments regardless of whether the Resource is actually deployed (or curtailed in the case of the Load Resource)
ERCOT holds auctions on a daily basis for each of the following Ancillary Services Regulation Up Regulation Down Responsive Reserve and Non-Spinning Reserve11 Table 1 describes the various Load Resource types and their qualification requirements and eligible services
Table 1 Load Resource Types and Ancillary Services
Service Load Resource Type a Qualification Responsive Reserves (le50 of total Reserve requirement)
Non Controllable Under-Frequency Relay and 10-minute ramp to manual dispatch instruction
Responsive Reserves
Controllable Primary Frequency Response and follow 5-minute dispatch instructions
Regulation-Up Regulation-Down
Controllable Primary Frequency Response and respond to Regulation deployments
Non-Spin Reserves Controllable Follow 5-minute dispatch instructions a A Controllable Load Resource is a Load Resource capable of controllably reducing or increasing consumption under dispatch control by ERCOT
Demand-side resources that agree to reduce load when directed by ERCOT and that meet other metering and operational requirements as specified in the ERCOT Protocols may participate in Ancillary Services market auctions As noted in Table 1 the type of Ancillary Service that a Load Resource may provide will depend upon the demand-side resourcersquos response time and metering system as well as other requirements described in the Protocols In the Responsive Reserve and Non-Spin Reserve markets the Load Resource will receive capacity payments regardless of whether or not the load was actually deployed but the load must be available for deployment at any time while providing the service
ERCOT procures ERS to maintain grid reliability during emergency conditions and reduce the likelihood of the need for rotating outages ERS participants may offer to provide demand response with either a 10-minute ramp period requirement (similar to Load Resources providing Responsive Reserve Service) or a 30-minute ramp period requirement ERS Resources do not have the same telemetry and under-frequency relay requirements as Load Resources
11 Regulation Up and Regulation Down service respond to signals from ERCOT every 4 seconds to respond to changes in system frequency full response has to be provided within 5 minutes Responsive reserves must provide their committed capacity either instantaneously in an under-frequency event (eg due to a generator outage) or in energy scarcity conditions within ten minutes following an instruction from ERCOT Non-spinning reserves must provide their committed capacity within 30 minutes based on economic dispatch instructions Non-spinning reserve is used as replacement reserve to replenish other ancillary services and during energy scarcity
copy 2016 ERCOT All rights reserved 5
Study on the Demand Response Potential for Seawater Desalination Projects ERCOT Public
ERS is procured through a request for proposal (RFP) process three times per year for four-month contract terms each of which is further split into smaller time periods based on business cycles and other factors Demand-side resources may choose to submit offers in all time periods or only in those that best fit their unique circumstances and may vary both the price and demand response capacity offers by time period
Payments for ERS are performed up to 80 days after each four month contract term has ended and are subject to downward revision based upon delivered demand response capacity and the demand-side resourcersquos availability during the contract term
32 Non-ERCOT-Dispatched Demand Response The options listed below are not dispatched by ERCOT but they either are controlled directly by a customer or are dispatchable by another entity such as a demand response provider (ldquoDR Providerrdquo) REP or a transmission and distribution utility
Many industrial customers are subject to transmission charges based upon a Four Coincident Peak (4CP) demand The 4CP demand is determined by averaging the consumerrsquos actual demand during the 15-minute settlement interval with the highest ERCOT demand during each of the four summer months (June through September) This measured 4CP demand serves as the basis for the customerrsquos transmission tariff charges for the following year By correctly predicting the ERCOT system peaks during the summer and curtailing load during those intervals a consumer can help reduce the stress imposed on the electric system during peak periods of consumption and reduce its transmission charges for the following calendar year
In the competitive areas of ERCOT consumers can contract with their REP or a DR Provider to have their load respond to the REPrsquos or DR Providerrsquos instructions The contract will usually outline the parameters of this response ndash at what times and frequency demand response events can be called ramp periods sustained response periods compensation etc Because this response is a contractual matter between the REP or DR Provider and the consumer a great deal of variety can be present in these arrangements For example a consumerrsquos response may be voluntary or required compensation could come in the form of reduced energy prices or rebate payments for each curtailment event consumers might be notified up to a day in advance or could have no notification at all (for automated curtailment)
In areas of ERCOT not open to competition interruptible tariffs may be available These tariffs will usually offer a reduced energy price for defined curtailment obligations
REPs may offer dynamic pricing options or consumers within a municipality or cooperative may have their energy prices determined by a published tariff which also may be structured based upon Time-of-Use (TOU) or have a Critical Peak Pricing (CPP) or Peak Time Rebate (PTR) component Self-directed price response refers to consumers making an independent decision to respond to energy prices contained in a governing tariff or in either the ERCOT Day Ahead or Real Time energy markets
TOU offerings will typically have higher energy prices during normal peak periods ndash for example a TOU tariff may charge one price during Monday through Friday from 2 pm through 8 pm and another price during all other times Customers may choose to reduce consumption during these high priced periods Load reduction can be accomplished by load shifting (loads can be shifted by
copy 2016 ERCOT All rights reserved 6
Study on the Demand Response Potential for Seawater Desalination Projects ERCOT Public
rescheduling certain processes or by utilizing thermal storage) ending certain processes that are no longer economic or through energy efficiency measures
Offerings that incorporate CPP usually have prescribed high prices only during certain defined periods ndash for example when load or prices are expected to reach a certain level Response to CPP may be similar to those employed under TOU tariffs especially if CPP is reached frequently More often CPP is infrequent and as such short-term load curtailment may be the more appropriate response to meet economic objectives
4 Demand Response Potential for Seawater Desalination
This section evaluates whether the operational characteristics and economics of seawater desalination plants would enable them to participate in one or more of the various demand response opportunities in the ERCOT Region To date participation of seawater desalination plants in demand response programs has been limited Neither the plant in Carlsbad nor the plant in Tampa Bay participate in demand response programs in California or Florida respectively However as will be described below it appears that these plants can be designed and operated to meet the requirements for participation in demand response and receive economic benefit from participation in these programs
Section 41 describes the operational parameters that must be met for a demand-side resource to provide ERCOT-dispatched demand response and evaluates the ability of seawater desalination plants to meet these criteria Section 42 discusses the tradeoffs between payments for participation in ERCOT-dispatched demand response and potential additional costs posed to seawater desalination plants Finally Section 43 presents other opportunities for seawater desalination plants to reduce their electricity costs outside of ERCOTrsquos reliability-based services that are open to demand response assets
41 Operational Considerations for ERCOT-Dispatched Demand Response There are several key operational parameters that impact a demand-side resourcersquos ability to participate in different demand response services response time recovery time predictability of electrical demand and flexibility of operations This section discusses each of these considerations as they apply to seawater desalination plants
As discussed in Section 31 one of the differentiating factors between ERCOTrsquos demand response products is the amount of time within which a demand-side resource must respond to a deployment instruction to reduce electricity consumption during an event Participation in RRS requires an automatic response within either half a second (ie instantaneous) based on grid frequency or within 10 minutes via a manual instruction ERS requires a response time of either 10 or 30 minutes As noted in Section 21 the typical time to take a reverse osmosis train on- or off-line is 1-2 hours under normal controlled operations To comply with the response time requirements of RRS or ERS a seawater desalination plant would need to be able to reduce its electricity consumption far more quickly than in normal operations This is an element of plant design that would need to be accounted for in the specifications of the project Considerations include the potential need for on-site backup generation including uninterruptible power supply potential impacts to plant infrastructure (eg piping) reverse osmosis membranes and pretreatment systems
The two large US desalination plants provide illustrative counterpoints in this respect The Carlsbad plant was designed to withstand instantaneous power interruptions and has on-site backup generation including uninterruptible power supply to provide the ability to power control systems and flush the membranes in the event of a power loss In contrast the Tampa Bay plant was not
copy 2016 ERCOT All rights reserved 7
Study on the Demand Response Potential for Seawater Desalination Projects ERCOT Public
designed with on-site backup generation and a loss of power would result in a plant shutdown and may require several days to bring the plant back on-line Thus it appears that it is technically possible for a seawater desalination plant to meet the response time requirements for participation in demand response so long as this factor is considered in the design of the facility
The time it takes a desalination train to return to operations after an event is also a consideration Demand-side resources participating in RRS must be able to come back on-line within three hours and those participating in ERS must return within 10 hours Again it appears that it is technically feasible for desalination plants to meet this requirement so long as this requirement is considered in the plant design
An additional consideration is the predictability of a demand-side resourcersquos electricity consumption Participation in the responsive reserves ancillary service market requires bidding in the day-ahead market and thus a demand-side resource must know with great accuracy (within 95) its electrical demand at least a day ahead of time For ERS auctions are held three times a year for four-month contract periods Thus to participate in ERS a resource must know its forecasted electrical demand several months in advance Because seawater desalination plant operations are driven by contracted demand for water it is likely that a plant operator would have a good idea of the plantrsquos electrical demand days or even weeksmonths in advance especially for summer months when demand is likely to be relatively steady An important consideration however is the salinity of the water which drives the electrical requirements and which can be impacted by recent weather events Similarly reductions in demand for water during non-summer months or wet summer days where demand may be reduced could also impact a plantrsquos ability to predict its electricity demand
Finally a seawater desalination plant must have sufficient flexibility in its day-to-day operations so that it can afford to lose several hours of production when deployed for demand response It should be noted that demand-side resources participating in RRS and ERS are called infrequently demand-side resources providing responsive reserves were deployed one time in 2015 and ERS was not deployed that year However this is an important factor to consider if a plant is operating at close to full capacity and would incur financial penalties if it fails to meet its contract obligations due to a demand response event Including additional storage and building a plant with extra capacity could help to mitigate this risk It should also be noted that a plant operator does not need to commit the full plant capacity to these services but rather can specify an amount of MW that will be committed Thus a plant operator could mitigate issues both with predictability and flexibility of plant operations by committing only a portion of its predicted electrical demand to participate in demand response
Considering these factors together it appears that seawater desalination plants could be designed to meet the operational requirements for participation in ERCOTrsquos demand response services (both RRS and ERS) Because the ability to meet the requirements is dependent on the plant design demand response would need to be considered early in a projectrsquos development if participation is desirable Whether project developers will choose to address these requirements will depend on the economic benefits of participation in demand response which will be discussed in the next section
42 Economic Considerations for ERCOT-Dispatched Demand Response This section describes the economic benefits to demand-side resources from participation in ERCOT-dispatched demand response programs The average price paid for a demand-side resource participating in RRS in 2015 was $1087 per MW per hour and for ERS was $645 per MW per hour for the contract periods during the 2015 program year These payments could provide a significant financial benefit to seawater desalination plants To give a simplified example for a plant with an electrical demand of 10 MW operating at a 100 annual load factor (10 MW times 24 hours times 365 days) the annual benefit would be on the order of $500000 for ERS or $1 million for RRS
copy 2016 ERCOT All rights reserved 8
Study on the Demand Response Potential for Seawater Desalination Projects ERCOT Public
In 2015 demand-side resources providing responsive reserves were deployed one time for a duration of 10 minutes and ERS was not deployed12 The most ERS was ever deployed in a single year was two times in 2011 Thus participation in either program could result in a substantial payment to a seawater desalination plant with a relatively low risk of deployment and associated disruption of plant operations although it is important to note that participation in either ERCOT service subjects demand response resources to annual unannounced testing Other than testing the frequency of deployment will depend on grid conditions and is a risk that should be considered
The financial benefits of participation must be weighed against the costs of designing facilities with the capabilities to operate in this manner These include
bull The costs to design the plant to reduce electrical demand within the required timeframes for demand response and to withstand an instantaneous interruption if not already part of the plant design For example a plant may need to be designed to have backup power generation on-site In addition there could also be costs to restart the system after an interruption
bull The costs to build a plant with excess capacity andor storage to make up for lost production hours when demand response is deployed This will add to the total capital costs of the project Land area constraints should also be considered when considering additional storage as the space requirements for the necessary storage capacity could be significant
bull Costs associated with the impact of interruptions on plant processes (eg more frequent replacement of membranes impacts to pretreatment system or plant infrastructure)
bull Potential financial penalties that would be incurred if deployment as part of demand response were to result in failure to meet contract obligations to supply water
bull The loss of potential benefits in the form of cost avoidance from participation in non-ERCOTshydispatched demand response opportunities (see Section 43) If a plant is committed to RRS or ERS the plant operator would lose the flexibility to take advantage of these other opportunities to reduce their electricity costs
The interplay of these benefits and costs will determine whether it would be beneficial for a future seawater desalination plant to participate in demand response in ERCOT
43 Considerations for Non-ERCOT-Dispatched Demand Response Outside of the reliability-based services administered by ERCOT there are other opportunities for seawater desalination plants to reduce their electricity costs As described in Section 321 seawater desalination plants may be able to reduce the demand charges on their electricity bills through curtailing load during 4CP intervals In addition plant operators may adjust operations in response to real-time electricity prices to take advantage of lower off-peak prices and avoid price spikes (see Sections 322 and 323) All of these opportunities require that the plant have flexibility to reduce production during certain times of the day
In the ERCOT region as noted above a portion of transmission and distribution charges are set based on the peak systemwide 15-minute interval of the four summer months (June through September) referred to as the four coincident peaks (4CP) Large customers can reduce or avoid this charge by reducing electrical consumption during these four peak intervals AEP Central Texas and CenterPoint are the transmission providers covering the majority of the Gulf Coast in Texas13
12 ERCOT June 2016 ldquoLoad Resource Deployment Updaterdquo Available at httpwwwercotcomcontentwcmkey_documents_lists870985_RRS_Load_Resource_Deployment_Updatepdf 13 It is also possible that a seawater desalination plant could be located in an area that as not opted in to competition in which case the plant owner would need to negotiate its electricity charges bilaterally with the Non Opt-In Entity (NOIE)
copy 2016 ERCOT All rights reserved 9
Study on the Demand Response Potential for Seawater Desalination Projects ERCOT Public
Assuming a future seawater desalination plant would be connected at transmission-level voltages the relevant 4CP charges based on the 2016 tariffs accounting for both transmission charges and transmission cost recovery factors would be $41425 per 4CP kW for AEP Central Texas and $41870 per 4CP kVA for CenterPoint14 If a seawater desalination plant has 10 MW of load and is capable of interrupting all of it and successfully does so for all four 4CP intervals the savings based on the 2016 tariffs would be approximately $500000 per year ($41425 times 1000 (kW to MW) times 10 MW times 12 months) Thus a seawater desalination plant that reduces its electricity use during the 4CP intervals could avert some or all of these charges
Another opportunity for seawater desalination plants to reduce their electricity costs is through adjusting operations in response to real-time electricity prices In 2015 the average electricity price in ERCOT was $2677MWh However prices exceeded $50MWh in 254 hours (3 of all hours) $100MWh in 88 hours (1) $200MWh in 40 hours (05) and $300MWh in 21 hours (02) Prices exceeded $3000MWh for 021 hours15 Depending on the desalination plantrsquos exposure to real-time wholesale market prices (via its retail contract) the degree of high prices the plant owner is willing to avoid and grid conditions in a given year reducing unit operations in order to avoid high electricity prices could impact operators for anywhere between a few and several hundred hours out of the year In addition a plant can plan its operations to take advantage of lower electricity prices during off-peak periods (eg at night when generation from wind is high) For example at least one company is marketing a modular desalination unit design intended to take advantage of low prices during periods of high renewables generation and to provide grid reliability services through demand response16
There are several factors to consider regarding these opportunities to reduce electricity costs The plant would need to monitor the ERCOT market or hire a contractor to do so in order to know when to reduce demand for electricity These programs do not impose any requirements on response time as with RRS or ERS and there may be sufficient warning of 4CP intervals or peak pricing to allow the plant operator to plan its operations earlier in the day with sufficient time to ramp down production under controlled conditions However quicker ramping capability may be desirable to respond to electricity price fluctuations
For 4CP because the four intervals used to set demand charges are not known ahead of time it is likely that the plant would need to reduce its demand multiple times per summer to ensure the 4CP intervals are hit impacting production at the facility Timing operations to coincide with off-peak pricing or to avoid price spikes would similarly result in reduced operations during certain hours To offset the lost production hours the plant may need to be designed with extra capacity and water storage capability to maintain the ability to meet its contractual obligations for freshwater delivery Because the period of reduced operations is greater than with ERCOT-dispatched demand response services this need would be greater for a seawater desalination plant reducing load during 4CP intervals or in response to real-time electricity prices and would increase the capital costs of the project It should also be noted that high prices in the ERCOT Region typically but not always occur in summer months when drought conditions are more likely to develop and demand for desalinated water is likely to be highest This may limit the flexibility of the plant to time its electricity consumption to avoid high-priced hours
14 Public Utility Commission of Texas ldquoTransmission and Distribution Rates for Investor Owned Utilitiesrdquo Available at httpwwwpuctexasgovindustryelectricratestdraspx 15 Potomac Economics June 2016 2015 State of the Market Report for the ERCOT Wholesale Electricity Markets Available at httpswwwpotomaceconomicscomindexphpmarkets_monitoredERCOT 16 Sisyan LLC ldquoDemand Response Desalinationrdquo Available at httprenewabledesalinationcomwpshycontentuploads201506Demand-Response-Desalinationpdf
copy 2016 ERCOT All rights reserved 10
Study on the Demand Response Potential for Seawater Desalination Projects ERCOT Public
In addition the plantrsquos ability to participate in demand response would also be limited for those hours it is reducing load as part of 4CP response or in response to real-time prices because the plant would not be able to reduce its electricity consumption if that demand is already committed to another demand response service Thus participating in demand response versus taking advantage of these other opportunities may be to some extent mutually exclusive
5 Conclusion
Based on this analysis it appears that the operational characteristics of seawater desalination plants would allow them to participate in demand response opportunities in ERCOT so long as the necessary operational requirements are considered in the design specifications of the plant Project developers should consider the necessary requirements early in the plant design Whether the economic benefits of participation would provide a sufficient incentive for them to do so will depend on the costs of accommodating those operational requirements and whether there is the flexibility available to operate the plant as necessary under these programs Though most existing seawater desalination plants do not participate in demand response programs it does appear that participation by these plants is possible and could result in a financial benefit Table 2 compares the different demand response opportunities available to demand-side resources in ERCOT
Table 2 Comparison of Demand Response Opportunities Demand Response
Opportunity Requirements for
Participation Impacts to Plant
Operations Financial Benefit Ancillary Services ndash Responsive Reserve Service (RRS)
bull Under-Frequency Relay bull Instantaneous or 10 minute
response time bull Recover load within 3
hours bull Bid in day-ahead market
bull Deployed once in 2015 for 10 minutes bull Subject to annual
unannounced testing
bull $1087 per MW per hour (based on 2015 prices)
Emergency Response Service (ERS)
bull 10 or 30 minute response time bull Recover load within 10
hours bull Four-month contract term
bull Not deployed in 2015 the most times ever deployed in a single year was twice in 2011 bull Subject to annual
unannounced testing
bull $645 per MW per hour (based on 2015 prices)
Four Coincident bull Interval Data Recorder bull Likely plant will need to bull Avoid ~$48000 per 4CP Peak (4CP) (IDR) meter
bull Ability to predict system-wide peak demand hours during summer months
reduce load multiple times per summer to hit 4CP intervals bull Likely to be able to predict
possible 4CP intervals earlier in day
MW per year (based on 2016 tariffs) if successful in reducing during all four summer months
LSE or DR Provider Contracted Price Response
bull Varies based on contractual arrangements
bull Varies based on contractual arrangements
bull Varies based on contractual arrangements
Self-Directed Price bull Retail contract with bull Varies depending on bull Varies depending on Response exposure to real-time
market prices bull Ability to monitor real-time
prices in ERCOT wholesale market
number and severity of pricing events bull May be able to predict
peak pricing events earlier in day
number and severity of pricing events
copy 2016 ERCOT All rights reserved 11
Study on the Demand Response Potential for Seawater Desalination Projects ERCOT Public
Demand response programs in ERCOT provide opportunities for demand-side resources to defray their electricity costs and provide reliability benefits to the ERCOT electric grid Because the process of seawater desalination is energy intensive participation in demand response could help to reduce electricity costs while posing a relatively low risk to plant operations if demand response participation is factored into plant design
Participation in non-ERCOT-dispatched demand response opportunities such as reducing load during 4CP intervals or in response to real-time electricity prices may also help to reduce electricity costs for seawater desalination plants in Texas As stakeholders in Texas continue to plan for possible future droughts in the region and identify water management strategies consideration of demand response could play a role in mitigating some costs associated with seawater desalination and allow seawater desalination plants to assist with maintaining electric reliability in the region
copy 2016 ERCOT All rights reserved 12
2017 SCOPE OF COMPETITION IN ELECTRIC MARKETS IN TEXAS REPORT
II STATE OF THE COMPETITIVE MARKET
Overview
In the 15 years since the implementation of customer choice in Texas customers
continue to enjoy the benefits of a competitive market a plethora of retail electric providers
offering innovative products designed to meet the needs of residential commercial and
industrial customers The diversity of retail electric providers and products has created a
robust competitive market that continues to provide Texas customers with low electricity
prices With Senate Bill 7 the Texas Legislature put in place a foundation for a restructured
electric market that continues to set the standard across this nation Because of SB 7
Texas remains the national leader in competitive electric markets The Commission will
continue to oversee the competitive electric market in Texas to ensure that it stays true to
the foundation created by SB 7 and that it provides Texans with the reliable competitively
priced electricity they have come to expect
Retail Market Development and Prices
1 Customer Choice
The Commission has continued to guide improvements of the Texas competitive
retail electric market in which customers are able to choose which electric rates and
services best suit their needs from Retail Electric Providers (REPs) which sell electricity
to the end-use customer The number and diversity of REPs competing for customers
provides an indicator of the health of the retail market Since the publication of the 2015
Scope of Competition in Electric Markets Report the number of REPs and competitive
offers in ERCOT has remained stable As of September 2016 109 REPs were operating
in ERCOT providing 440 total unique products 97 of which solely support electricity
generated from 100 renewable sources1
Because of the number of providers and plans available from which customers can
choose Texas continues to be recognized as the most successful competitive retail market
in North America as demonstrated by its first-place rank for the past eight years in the
Annual Baseline Assessment of Choice in Canada and the United States a scorecard that
compares the retail competitiveness of electric markets in the US states and Canadian
provinces2
The number of REPs serving residential customers and the associated number of
product offerings by transmission and distribution utility (TDU) in the ERCOT grid are
shown in Table 1
1 Public Utility Commission wwwpowertochooseorg
2 Annual Baseline Assessment of Choice in Canada and the United States Distributed Energy
Financial Group July 2015 Available at httpwwwcompetecoalitioncomfilesABACCUS-2015-vfpdf
2 | P a g e
2017 SCOPE OF COMPETITION IN ELECTRIC MARKETS IN TEXAS REPORT
Table 1 Number of REPs and Products Serving Residential Customers September 2016
TDU Service Territory3 Residential
Suppliers
Number of
Products
AEP Central 52 355
AEP North 49 295
CenterPoint 55 400
Oncor 55 390
Sharyland ndash McAllen 14 103
Sharyland Utilities 22 155
TNMP 49 320
2 Retail Prices
Together the REPs in the competitive market serve 6153293 residential
customers 1053032 commercial customers and 4336 industrial customers4 In this
highly competitive retail market 92 of all customers have exercised their ability to switch
REPs since the market opening in 2002 Figure 1 depicts the percentage of customers in
each customer class who have switched REPs at least once since 2002
Figure 1 Percentage of Observable Switching by Customer Class5
3 American Electric Power ndash Texas Central Company (ldquoAEP Centralrdquo) American Electric Power ndash Texas North Company (ldquoAEP Northrdquo) CenterPoint Energy (ldquoCenterPointrdquo) Oncor Electric Delivery Company (ldquoOncorrdquo) Sharyland Utilities (ldquoSharyland ndash McAllenrdquo serves McAllen Texas and ldquoSharyland Utilitiesrdquo serves Stanton Brady and Colorado City) and Texas-New Mexico Power (ldquoTNMPrdquo)
4 ERCOT Provider of Last Resort Counts March 31 2016 Available at
httpwwwercotcomcontentwcmkey_documents_lists89277POLR_Counts_Energy_2016_Reportingx
lsx
5 ERCOT Supplemental Information - Retail Electric Market April 2015ndashMarch 2016 Available
at
httpercotcomcontentwcmkey_documents_lists89277Observed_Selection_of_Electric_Providers_Mar
ch_2016pptpptx
3 | P a g e
2017 SCOPE OF COMPETITION IN ELECTRIC MARKETS IN TEXAS REPORT
The success of the competitive market is highlighted in Table 2 which compares
the last regulated retail rate with the current lowest 12-month fixed retail offering per 1000
kWh in each region adjusted for inflation Since 2001 average retail rates across Texas
have decreased 63 percent
Table 2 Inflation-Adjusted Comparison of Residential Regulated and Competitive Rates
TDU Service
Territory6
Last Regulated
Rate (2001)
centkWh7
Last Regulated
Rate Adjusted for
Inflation
Current
Lowest Fixed
Price8
Percentage
Change
AEP Central 96 131 56 ndash5725
AEP North 100 136 50 ndash6324
CenterPoint 104 141 54 ndash617
Oncor 97 132 45 ndash6591
TNMP 106 144 50 ndash6528
The average lowest available residential price across the competitive market was
51 cents per kilowatt-hour (kWh) in September 2016 and the average across all plans
available in the competitive market in Texas was 98 cents per kWh 9 Moreover rates in
ERCOT have not only decreased since Texasrsquo transition to the competitive market but both fixed and variable rates have continued to be much lower than nationwide averages
of 1345 cents per kWh in July 2016 and 1362 cents per kWh in July 201510
Table 3 compares the current lowest fixed price available for residential service in
each TDU service territory with the average price of plans available and the nationwide
average excluding Texas
6 Sharyland Utilities was formed shortly before the market opening to serve part of McAllen
Texas it is not included in this table because of its limited number of customers at that time In Docket No
21591 Sharyland Utilities committed that its average bundled residential rates would not exceed those of
Central Power amp Light Company (now AEP Central)
7 Association of Electric Companies of Texas Available at httpwwwaectnetinside-the-charts-
prices-available-in-the-competitive-market-today-well-below-the-last-regulated-rate
8 The current lowest fixed price available for a residential plan in each TDU service territory as of
September 2016 for a 12-month plan without time-of-use features prepaid features or a minimum usage
fee for a fixed month-to-month rate for a customer who expects to consume approximately 1000 kWh of
electricity a month Available at wwwpowertochooseorg
9 This average is for a residential customer expecting to consume approximately 1000 kWh of
electricity each month Available at wwwpowertochooseorg
10 The nationwide average is for July 2016 and includes all US states except Texas Source US
Energy Information Administration Average Retail Price of Electricity Electricity Data Browser July
2016 Available at httpwwweiagovelectricitydatacfm
4 | P a g e
2017 SCOPE OF COMPETITION IN ELECTRIC MARKETS IN TEXAS REPORT
Table 3 Current Lowest and Average Residential Plans by TDU Service Territory
TDU Service
Territory
Current Lowest
Fixed Price
(centkWh)11
Current Average
All Available
Plans12
Nationwide
Average13
AEP Central 56 94
1345
AEP North 50 94
CenterPoint 54 91
Oncor 45 83
Sharyland ndash McAllen 56 98
Sharyland Utilities 45 133
TNMP 50 92
3 Customer Complaints
The Commissionrsquos rules permit a customer to file a complaint with the Commission
about their electric service The Commissionrsquos staff works with the customer and electric service provider to resolve the complaints first in an informal complaint process and then
directs the customer to a formal complaint process if the customer is dissatisfied with the
resolution The Commission keeps records of these complaints and evaluates the
complaint statistics as a barometer for analyzing company behavior and its effect on
customers The Commission uses the data to identify any company-specific trends work
with companies to address any issues or otherwise take enforcement action
From September 1 2014 to August 31 2016 the average number of days to resolve
a utility complaint was 18 days The slight decline in the number of electric complaints
received in 2015 through 2016 may be attributed to the mild winter weather which resulted
in lower overall prices as well as the absence of significant disruptions to electric service
Figure 2 shows the total complaints received from September 1 2014 to August 31 2016
11 The current lowest fixed price available for a residential plan in each TDU service territory as of
September 2016 for a 12-month plan without time-of-use features prepaid features or a minimum usage
fee for a fixed month-to-month rate for a customer who expects to consume approximately 1000 kWh of
electricity a month Source wwwpowertochooseorg
12 The average is for a residential customer expecting to consume approximately 1000 kWh of
electricity a month Source wwwpowertochooseorg
13 The nationwide average is for July 2016 and includes all US states except Texas Source US
Energy Information Administration Average Retail Price of Electricity Electricity Data Browser July
2016 Available at httpwwweiagovelectricitydatacfm
5 | P a g e
2017 SCOPE OF COMPETITION IN ELECTRIC MARKETS IN TEXAS REPORT
Figure 2 Total Electric Complaints Received September 2014 ndash August 2016
From September 1 2014 to August 31 2016 the Commission received 4465
electric complaints Billing complaints continue to be the greatest cause of customer
complaints with 42 of all electric complaints concerning billing issues Complaints
relating to the provision of service including customer service and the refusal of service
were the second highest cause of complaints at 15 Quality of service contributed to the
third-leading cause of complaints at 12 Complaints are broken down by category in
Figure 3
6 | P a g e
2017 SCOPE OF COMPETITION IN ELECTRIC MARKETS IN TEXAS REPORT
Figure 3 Electric Complaints Received by Category September 2014 ndash August 2016 14
4 Energy-Efficiency Programs
Energy-efficiency programs in Texas are administered by the TDUs in ERCOT and
the vertically integrated utilities outside of ERCOT pursuant to the Public Utility
Regulatory Act (PURA) sect39905 The utilities recover the cost of the energy-efficiency
programs through a surcharge on electric bills which are adjusted and approved annually
by the Commission Under the energy-efficiency programs TDUs reduced 559369 MWh
of electricity consumption in 2015 exceeding the goal for the year by 40 The energy-
efficiency programs are designed to reduce customersrsquo energy consumption as well as
electric peak demand In 2011 SB 1125 increased the peak demand goal reduction to a
30 growth in demand Once a utility reaches this goal the utility must achieve a
reduction of four-tenths of one percent of the utilityrsquos summer weather-adjusted peak
demand in subsequent years
The 2011 legislation also required that the Commission develop an evaluation
measurement and verification (EMampV) framework to promote effective program design
to provide consistent and streamlined reporting and to retain a third-party contractor to
conduct these activities EMampV efforts for the 2015 program year focused on evaluating
targeted programs for which the associated peak demand and energy savings were most
uncertain A primary component of EMampV is the statewide Technical Reference Manual
(TRM) a single common reference document prepared and maintained by the EMampV
contractor to estimate energy and peak demand savings resulting from the installation of
14 ldquoCrammingrdquo is the practice of adding unauthorized charges for any services to an electric bill without verified consent by the customer ldquoSlammingrdquo is the practice of switching the customer to another provider without authorization
7 | P a g e
2017 SCOPE OF COMPETITION IN ELECTRIC MARKETS IN TEXAS REPORT
energy efficiency measures sponsored by utility-administered programs in Texas In 2015
changes made to the TRM added and updated existing deemed savings values and added
standardized EMampV protocols for determining and verifying energy and demand savings
effective for the 2016 program year Verified demand and energy savings and program
costs for 2015 are shown in Table 4
Table 4 2015 Verified Energy Efficiency Savings15
MW MWh MW MWh
El Paso Electric 1231 22283 1116 19552 $4039278
Entergy Texas 1809 39688 1550 27156 $7023009
SPS 817 14537 549 9627 $3190744
SWEPCO 988 15262 560 9811 $3220359
Non-ERCOT Total 4844 91770 3775 66146 $17473390
AEP Central 4378 68482 1293 22653 $13261480
AEP North 454 12289 426 7464 $2727260
CenterPoint 16849 188255 5883 103069 $35832993
Oncor 11581 178908 6940 121589 $47438836
Sharyland 060 2528 100 1752 $633252
TNMP 866 17452 5770 10109 $4011627
ERCOT Total 34188 467915 15219 266636 $103905448
Grand Total 39033 559685 18994 332782 $121378838
Excludes Statewide EMampV contractor expenses of approximately $3M for review of prior program year
GoalProgram CostUtility
Verified Savings
In 2015 the utilities cumulatively achieved 206 of the demand reduction goal
(226 for utilities in ERCOT) and 168 of the energy reduction goal (175 for utilities
in ERCOT)
5 Customer Education Activities
The Commission engages with residential and small commercial electric customers
about retail electric competition through its ldquoTexas Electric Choicerdquo campaign and also informs customers about energy conservation opportunities through its ldquoPower to Save Texasrdquo campaign In addition to engaging with customers through these two campaigns
Commission staff also respond to customer inquiries and distribute literature about
electricity facts and issues
15 The non-ERCOT utilities within the state of Texas are El Paso Electric Company (ldquoEl Paso Electricrdquo) Entergy Texas Inc (ldquoEntergy Texasrdquo) Southwestern Public Service Company (ldquoSPSrdquo) and Southwestern Electric Power Company (ldquoSWEPCOrdquo)
8 | P a g e
2017 SCOPE OF COMPETITION IN ELECTRIC MARKETS IN TEXAS REPORT
a ldquoPower to Chooserdquo
The Commission educates customers about the evolving marketplace continuing
its ldquoTexas Electric Choicerdquo campaign which began in February 2001 with the goal of educating Texans about the changes and choices in the retail electric market The
PowerToChooseorg website and its Spanish-language counterpart PoderDeEscogerorg
provides a simple one-stop shop portal for Texans who live in a service territory open to
customer choice to enter in their zip code and browse through the numerous plans offered
by the REPs
b ldquoPower to Save Texasrdquo
In addition to the ldquoTexas Electric Choicerdquo campaign and the PowerToChoose website the Commission has also continued its statewide initiative ldquoPower to Save
Texasrdquo together with its parallel Spanish-language initiative ldquoPoder de Ahorrarrdquo which educates Texans about conserving energy during the summer peak times of 3 pm to 7
pm when the demand for electricity tends to be the highest The PowerToSaveTexasorg
website and its Spanish-language counterpart PoderDeAhorrarTexasorg provide Texans
with energy saving tips for homes and businesses
As part of the Power to Save Texas campaign the Commission contracted with
Resource Action Programs (RAP) to develop and implement a middle school energy
conservation outreach program in Hidalgo Harris Dallas and Tarrant counties In the
2015 ndash 2016 school year the program provided an effective energy education program
which strongly supports the Texas Essential Knowledge and Skills (TEKS) curriculum
standards as well as engages students through school challenges and at-home activities
c Campaign Outreach
PowerToChooseorg and its Spanish-language counterpart PoderDeEscogerorg
have proven valuable in educating customers about customer choice in the electricity
market The Commission conducted a number of activities to further promote the statersquos official electric choice website through social media community events trade shows and
expos From September 1 2015 through August 31 2016 nearly a million potential
customers visited the PowerToChooseorg and PoderDeEscogerorg websites Website
statistics are contained in Table 5
Table 5 Website Statistics September 2015 ndash August 2016
PowerToChoosecom Unique Visitors 980473
PoderDeEscogercom Unique Visitors 4652
d Low-IncomeElderly Outreach and Collaboration with Faith- and
Community-Based Organizations
Throughout 2015 and 2016 the Commissionrsquos staff also worked with legislative
offices and faith- and community-based organizations to provide educational materials and
training to help their constituents better understand the deregulated electric market and the
9 | P a g e
2017 SCOPE OF COMPETITION IN ELECTRIC MARKETS IN TEXAS REPORT
Commissionrsquos websites The Commission has actively participated with the Interagency
Coordinating Group (ICG) which was established by the Texas Legislature to expand and
improve relationships between state government and faith- and community-based
organizations Information on customer assistance programs such as LITE-UP Texas was
provided to community organizations such as Legal Aid of Northwest Texas senior
activity centers and religious groups
e Call Center
The Commission has trained its Customer Protection Division staff who are fluent
in both English and Spanish to answer customer calls and to assemble and mail
informational packets comparing electric plans when requested by customers without
Internet access From September 2015 to August 2016 the Customer Protection Division
staff handled 7663 calls from customers requesting assistance with shopping
f Educational Literature
In addition to the educational materials on the Commissionrsquos website the Commission provides brochures fact sheets and other educational materials by mail and
e-mail through a network of community organizations and events and in response to
customer requests to the call center Up-to-date fact sheets are available on the
Commissionrsquos website PowertoChooseorg and PoderDeEscogerorg as part of the
campaignrsquos outreach efforts The fact sheets provide information on a number of current
industry and consumer topics
Throughout 2015 and 2016 campaign educational materials promoting the
agencyrsquos programs including Power to Choose and Power to Save Texas were distributed
at numerous community events and civic town hall events such as Hurst-Euless-Bedford
ldquoBack 2 Schoolrdquo day Dickenson Housing Family Fair Energy Day DFW Family Fair
Earth Day Texas Texas Home and Garden shows in Houston Texas Black Expo National
Night Out events and minor league baseball games
Wholesale Market Development
The Commission engages regularly with ERCOT to oversee market developments
and ensure system supply reliability security and improved price formation and market
outcomes Market design changes made as a result of this working relationship have
created new opportunities for a variety of generation resources to enter the market and
supported the formation of wholesale prices that reflect real-time market conditions more
accurately and therefore improve the efficiency of the market
1 Wholesale Market Prices
Wholesale market prices have fallen in comparison to prices seen in the 2012 ndash 2014 period The ERCOT load-weighted real-time average price of energy in 2015 was
$2677 per Megawatt-hour (MWh) a 34 decrease from the average price in 2014 and a
decrease of 21 from the average seen in 2013
10 | P a g e
2017 SCOPE OF COMPETITION IN ELECTRIC MARKETS IN TEXAS REPORT
Falling wholesale prices are correlated with the current trend of lower natural gas
prices the primary fuel of many of the regionrsquos power plants The average Houston Ship Channel spot price for natural gas was 41 lower in 2015 than in 2014 decreasing from
$437MMBtu in 2014 to $258 in 2015 Through March the average price for 2016 has
fallen to $192MMBtu Natural gas price trends from September 2014 through August
2016 are shown in Figure 4
Figure 4 Monthly Average Natural Gas Prices September 2014 ndash August 2016
Monthly average wholesale electricity prices are shown in Figure 5 Load-
weighted prices are calculated by dividing the price at a load zone by the associated
demand This metric provides a useful proxy for the actual wholesale prices paid by load16
16 It is worth noting that most power in ERCOT is sold through various bilateral arrangements that
are designed to hedge daily real-time market price risk
11 | P a g e
2017 SCOPE OF COMPETITION IN ELECTRIC MARKETS IN TEXAS REPORT
Figure 5 Load-Weighted Average Real-Time Monthly Settlement Point Prices September 2014 ndash August 2016
Another component of the real-time price of electricity is the cost of transmission
congestion Transmission congestion occurs when there is insufficient transmission
capacity to dispatch energy in a least-cost fashion The recent build-out of additional
transmission lines in areas of high congestion has partially relieved the cost burden in these
areas particularly in West Texas where oil and gas production growth rapidly increased
the demand for electricity resulting in relatively higher zonal prices
2 Peak Demand
After the very high peak demand levels during the hot summer of 2011 peak
demand in ERCOT was lower in 2012 through 2014 In 2015 peak demand again
increased though not to 2011 levels with load exceeding 60000 MW for 330 hours and
exceeding 65000 MW for 91 hours as shown in Figure 6 below In 2016 ERCOT
experienced a record week in August which saw the previous record peak demand broken
six times and the ERCOT region hit its all-time peak demand of 71093 MW on August
11 2016
As peak demand has increased the recorded availability of generation supply in the
region during times of high load has decreased slightly Physical Responsive Capability
(PRC) analogous to the amount of reserves available on the system at any given time fell
below 3000 MW for 269 hours in 2015 up slightly from 213 hours in 2014 and 215
hours in 2013 but well below the 371 hours recorded during the 2011 summer
12 | P a g e
2017 SCOPE OF COMPETITION IN ELECTRIC MARKETS IN TEXAS REPORT
Figure 6 High Load Hours in ERCOT 2011 ndash 2016
As shown in Table 6 the ERCOT system peak demand was 69877 MW in 2015
up 5 from the 2014 peak and the 2016 ERCOT system peak demand increased 174
from the peak demand of the previous year
Table 6 ERCOT Peak Demand 2012 ndash 2016
Year
ERCOT Peak
Demand (MW)
Percentage Change
from Prior Year
2012 66548 ndash 2013 67245 105
2014 66454 ndash118
2015 69877 515
2016 71093 174
Figure 7 shows the hourly peak load for each month in ERCOT from January 2014 to
August 2016
13 | P a g e
2017 SCOPE OF COMPETITION IN ELECTRIC MARKETS IN TEXAS REPORT
Figure 7 Monthly Peak Demand in ERCOT January 2014 ndash August 2016
3 Generation Diversity
As electricity consumption has increased in ERCOT the diversity of the systemrsquos generation portfolio has also increased Generators participating in the statersquos renewable energy credit (REC) trading program reported an 11 increase in renewable generation
from 2013 to 2015 rising from 376 million MWh to 469 million MWh with wind
representing 96 of the total renewable mix Landfill gas was the second most prevalent
renewable source representing approximately 12 of all renewable generation in 2015
Energy produced from wind generation was up by 13 in 2015 from 2013 and solar
energy capacity more than doubled from 121 MW in 2013 to 288 MW in 2015 Coal-fired
generation has been steadily shrinking as a proportion of total generation declining from
37 of electricity produced in 2014 to 28 in 2015 Energy use in the ERCOT region by
fuel type for 2015 is shown in Figure 8
14 | P a g e
2017 SCOPE OF COMPETITION IN ELECTRIC MARKETS IN TEXAS REPORT
Figure 8 Energy Use in ERCOT by Resource Type 2015
The Commissionrsquos projects are further described in the following section of this report
15 | P a g e
2017 SCOPE OF COMPETITION IN ELECTRIC MARKETS IN TEXAS REPORT
III SUMMARY OF COMMISSION ACTIVITIES FROM 2015 TO 2016
Introduction
The Commission develops and modifies rules policies and procedures for the
competitive electric market in Texas in response to the technological advances in the
industry and the evolving needs of customers The Commission also continues to carry
out oversight of programs with which the Legislature has tasked it ndash such as energy
efficiency renewable energy and advanced metering infrastructure Within the
ERCOT region the monopoly wires-and-poles companies that provide transmission
and distribution services throughout the grid remain subject to traditional rate
regulation by the Commission The Commission continues to set rates for these
utilities as they are not subject to the forces of market competition This section
provides an overview of the Commissionrsquos activities in its oversight of the wholesale and retail electric markets as well as its governance over regulated electric utilities
Resource Adequacy
Resource adequacy is the long-term ability of the system to serve demand reliably
when consumption is highest given the available installed capacity load resources and
the operational reliability of the system Assessing resource adequacy requires comparing
the systemrsquos forecast installed capacity and load resources against the forecast peak
summer load The difference between the forecast of available generation and load
resources and the forecasted demand for electricity is referred to as an ldquoinstalled capacity
reserve marginrdquo which is an indicator of the ability of the system to meet customer demand
during peak conditions In addition to evaluating the forecast reserve margin assessing
resource adequacy includes evaluating the systemrsquos operational reliability The systemrsquos operational reliability depends on the ability of generators to manage plant operations
successfully as well as the grid operatorrsquos ability to manage the system to avoid or to mitigate load curtailment During 2015 and 2016 the ERCOT system performed well with
respect to resource adequacy The Commission has devoted significant attention to
ensuring that ERCOT maintains an adequate installed capacity reserve margin and a high
level of operational reliability developing a wholesale market design that allows
consumers to continue to receive low-cost and reliable electricity over the long term
1 Capacity Demand and Reserves Report
The Capacity Demand and Reserves (CDR) Report published by ERCOT semi-
annually is a snapshot estimate of long-term supply and demand and the associated annual
reserve margin for peak summer and winter conditions While the CDR Report is not a
forecast of any particular outcome it provides insight into possible resource adequacy
trends
16 | P a g e
2017 SCOPE OF COMPETITION IN ELECTRIC MARKETS IN TEXAS REPORT
The May 2016 CDR Report shows estimated reserve margins well above the
current target reserve margin of 1375 Installed capacity reserve margin estimates taken
from this CDR Report are shown below in Table 7
Table 7 May 2016 Capacity Demand and Reserves Report Forecast
Forecast 2017 2018 2019 2020 2021 2022 2023 2024 2025 2026
Peak Load
(MW)
68548 69409 70795 71420 72098 72792 73482 74168 74864 75704
Total
Capacity
(MW)
80995 87019 87238 87407 87678 87738 87738 87728 87728 87728
Reserve
Margin
182 254 232 224 216 205 194 183 172 159
2 Operating Reserve Demand Curve
In ERCOT the price signals produced by the energy-only wholesale electric market
should provide incentives to promote short-term reliability as well as induce optimal long-
run investment in new resources If the prices are efficient and reflect the full cost of
dispatching resources to meet demand the benefits that accrue to both consumers and
producers can be maximized at the least cost and new generating capacity (or load
resources) should develop to maintain the equilibrium as old resources retire or demand
increases
The Operating Reserve Demand Curve (ORDC) implemented at the Commissionrsquos direction in June 2014 improves price formation by allowing prices to more fully reflect
the value of operating reserves The ORDC assigns an economic value to operating
reserves or the amount of extra capacity available to maintain system reliability on a daily
basis
As part of its ongoing review of resource adequacy in ERCOT the Commission is
currently evaluating the accuracy of the inputs to the ORDC to ensure that its contribution
to price formation appropriately reflects the costs of meeting demand and the underlying
needs of the system
3 Transmission Congestion
Although competitive power producers and regulated transmission providers form
two distinct segments of the market transmission buildout has a direct effect on wholesale
power prices When there is insufficient transmission capacity to dispatch energy in a least-
cost fashion the system operator takes action to ensure that the physical limits of the
transmission system facilities are not violated The re-dispatch of generation because of
transmission limits results in disparate prices at different locations on the system In
comparison to prior years transmission congestion in ERCOT has lessened because of the
large increase in transmission investment and the reduction of high demand related to oil
and gas production in West Texas ERCOT and the Commission continually evaluate the
need for cost-effective additional transmission investment to manage congestion
17 | P a g e
2017 SCOPE OF COMPETITION IN ELECTRIC MARKETS IN TEXAS REPORT
4 Wholesale Market Design Initiatives
While the ERCOT wholesale market has been successful in attracting new resource
investment and also maintaining competitive prices for consumers certain improvements
to the market design could yield additional benefits in terms of efficient price formation
and opportunities for entry of new technology Initiatives already in place in many other
regions such as real-time co-optimization and multi-interval real-time resource dispatch
may allow existing capacity to be used more effectively and create opportunities for the
integration of additional load resources to serve electric demand The Commission
continues to work with ERCOT and interested stakeholders to determine the value of
implementing such enhancements particularly as ERCOTrsquos resource mix changes over time
5 Reliability Standard
In early 2014 the Commission opened a project to review its use of a target installed
capacity reserve margin based on a reliability standard equivalent to one loss-of-load event
every ten years In this project the Commission received written comment from interested
parties conducted a public workshop consulted with independent experts and reviewed
the application of reliability standards in other regions As a result of this review future
reliability metrics to be estimated in ERCOT will include the market equilibrium reserve
margin the economically-optimal reserve margin and the associated levels of expected
unserved energy The Commission believes that publishing these metrics represents an
improvement over reporting a one-event-in-ten-years standard by enhancing insight into
expected outcomes in ERCOTrsquos energy-only market
Non-ERCOT Utilities Market Development Activities
SB 7 the law that introduced retail competition to the Texas market in 1999
granted the Commission authority to delay retail competition in an area where deregulation
would not result in fair competition and reliable service because of the lack of an
independent organization to coordinate the electric system and the concentration of
ownership in the generation sector in some of those areas Consequently SB 7 included
provisions recognizing the difficulty of implementing retail competition in areas outside of
ERCOT Therefore the utilities outside of the ERCOT region remain vertically integrated
owning generation transmission and distribution assets as well as selling power to end-
use customers These vertically integrated utilities remain subject to traditional regulation
including rates set by the Commission and customer choice is not offered in the service
territories of these utilities
The Commission does continue to monitor ongoing activities in the non-ERCOT
portions of the state In 2015 the Legislature granted the Commission the authority to
retain counsel and consulting experts in order to participate in legal proceedings at the
Federal Energy Regulatory Commission (FERC) which has regulatory jurisdiction over
wholesale power sales and transmission rates outside of ERCOT This authority has
18 | P a g e
2017 SCOPE OF COMPETITION IN ELECTRIC MARKETS IN TEXAS REPORT
permitted the Commission to participate more effectively in FERC proceedings affecting
Texasrsquo utilities located outside of ERCOT
1 Southwest Power Pool
The Southwest Power Pool (SPP) is the Regional Transmission Operator (RTO) for
areas of Northeast Texas and the Texas Panhandle In Texas the utilities Southwestern
Electric Power Company (SWEPCO) Southwestern Public Service (SPS) and several
electric cooperatives and municipally owned utilities are in SPP In addition to these areas
of Texas the SPP footprint includes parts of New Mexico Arkansas Missouri Nebraska
Louisiana and all of Kansas and Oklahoma In 2015 SPP became the RTO for the
Integrated System and neighboring areas which includes parts of Iowa Minnesota North
Dakota South Dakota Wyoming and Montana SPP has spent extensive time and
resources over the last two years to integrate these new areas successfully The expansion
added 5000 MW of peak demand 7600 MW of generating capacity and 9500 miles of
transmission lines17
In 2014 SPP launched its new Integrated Marketplace which provides a Day-
Ahead Market a Real-Time Balancing Market and Congestion Hedging Markets
mechanisms similar to those available in ERCOT The implementation of the Integrated
Marketplace resulted in a savings of $422 million in 2015 As a result of the Integrated
Marketplace SPPrsquos planning reserve margin will be reduced from 136 to 12 a change
expected to save about $90 million annually
Chairman Donna L Nelson represents the Commission as a voting member on
SPPrsquos Regional State Committee (RSC) The RSC provides collective state regulatory
agency input on a variety of issues In addition the RSC has authority over the cost
allocation methodologies for transmission upgrades allocation of Financial Transmission
Rights and the approach used for resource adequacy across the SPP region The RSC
regularly meets on a quarterly basis and meets more frequently if necessary
2 Midcontinent Independent System Operator
The Midcontinent Independent System Operator (MISO) is an RTO that serves all
or part of 15 states in the central US one Canadian province and the portion of eastern
Texas served by the vertically integrated utility Entergy Texas Inc MISO provides a Day
Two market which has a variety of functions and services including energy and ancillary
service markets economic dispatch congestion management financial transmission rights
and transmission planning The MISO Independent Market Monitor concluded that the
MISO wholesale markets were competitive in 2015
Like SPP MISO is in the Eastern Interconnection which crosses state boundaries
and is therefore subject to FERC jurisdiction A number of recent FERC proceedings have
17 2015 Southwest Power Pool Annual Report Available at
httpswwwspporgdocuments37800201520southwest20power20pool20annual20reportpdf
19 | P a g e
2017 SCOPE OF COMPETITION IN ELECTRIC MARKETS IN TEXAS REPORT
affected the portion of Texas that is in the MISO footprint The Commission through
outside counsel has been an active party in such FERC proceedings FERC Docket No
ER14-1174 addressed in part a dispute regarding the availability of transmission capacity
under the Joint Operating Agreement between MISO and the SPP Ultimately FERC
approved a settlement agreement under which MISO will compensate SPP and its members
for using their or other entitiesrsquo transmission systems
In a related pending docket at FERC Docket No ER14-1736 parties are addressing
how the cost of these payments will be allocated among MISO market participants Parties
in this proceeding are engaged in settlement discussions In addition in Docket No ER14-
75-000 FERC approved a settlement agreement among the participating Entergy
Operating Companies and their retail regulators to terminate the Entergy System
Agreement effective August 31 2016 The settlement terms prohibit any post-termination
payments that roughly equalize production costs among the operating companies after
December 31 2015 terminate certain specific cross-purchase power agreements between
Entergy Texas and former Entergy Gulf State Louisiana and permit the continuation of
several other purchase power agreements
Commissioner Kenneth W Anderson Jr represents the Commission as a voting
member in the Organization of MISO States (OMS) the purpose of which is to coordinate
regulatory oversight among the states in the MISO region and to make recommendations
to MISO FERC and other entities Commissioner Anderson also represents the
Commission as a voting member of the Entergy Regional State Committee (ERSC) which
has certain FERC-approved authority for five years after the Entergy integration with
regard to cost allocation for Entergy transmission projects and adding transmission projects
to the Entergy construction plan The ERSC meets quarterly
3 Western Electricity Coordinating Council
The Western Electricity Coordinating Council (WECC) is a Regional Entity whose
region includes the area surrounding El Paso and extends from Canada to Mexico
including the provinces of Alberta and British Columbia the northern portion of Baja
California and all or portions of the 14 Western states in between WECC is the Regional
Entity responsible for Bulk Electric System reliability in the Western Interconnection and
associated compliance monitoring and enforcement WECC does not have organized
markets outside of California but is organized into 38 separate balancing authorities
WECC is geographically the largest and most diverse of the eight Regional Entities in the
United States with delegated authority from the North American Electric Reliability
Corporation (NERC) and the Federal Energy Regulatory Commission In Texas El Paso
Electric Company is a member of WECC
Rulemaking Activities
The Commission has continued to adopt new rules and modify existing rules in
order to further the continued successful operation of the competitive retail and wholesale
markets and to comply with statutory changes made to PURA by the Legislature This
20 | P a g e
2017 SCOPE OF COMPETITION IN ELECTRIC MARKETS IN TEXAS REPORT
section of the Report provides a high-level overview of the Commissionrsquos key rulemaking
activities highlighting the market improvements made in 2015 and 2016
1 Cost Recovery and Rate Adjustment
The Commission adopted new rule 16 TAC sect25246 on June 29 2016 to
implement Section Nos 1 through 3 of House Bill 1535 of the 84th Legislature The new
rule only applies to a utility that operates solely outside of ERCOT and allows for the use
of an update period beyond the test year for which the utility initially files estimated
information The rule clarifies that all information originally estimated must be updated
with actual information and also provides requirements for a post-test-year adjustment for
a natural gas-fired plant A non-ERCOT utility also is required to initiate a new base rate
case on or before the four year anniversary of the final order in the utilityrsquos most recent comprehensive base rate case or if the commission determines that the utility has
materially earned more than its authorized rate of return in two consecutive years The rule
also provides requirements and procedures for the relation back of final rates to an effective
date 155 days after the filing of the rate application
2 Changes to Certificates of Convenience and Necessity and CREZ Rule
The Commission conducted a rulemaking to implement changes pursuant to
Legislative mandates in SB 776 SB 933 and HB 1535 of the 84th Legislature SB 776
required municipally owned utilities to apply for a certificate of convenience and necessity
(CCN) before constructing transmission facilities outside the boundaries of the
municipality that owns the municipally owned utility SB 933 also requires persons to
obtain a CCN before interconnecting a tie line into the ERCOT grid HB 1535 requires the
Commission to issue a final order within 181 days for a non-ERCOT utility requesting a
CCN for an existing electric generating facility and 366 days after a non-ERCOT utility
files a CCN for a newly constructed generating facility In addition the Commission also
determined in this rulemaking that all future transmission projects in a Competitive
Renewable Energy Zone (CREZ) must meet the need criteria of PURA sectsect 37056(c)(1)
and (2) rather than being exempt Finally the Commission determined that the CREZ
project established in 2008 was complete following the installation of a second circuit on
a Sharyland line
3 Use of Handheld Device for Enrollment
As the market evolves the Commission evaluates market changes balancing its
desire to encourage customer-focused innovation with its concern for customer protection
against potential abuses In Docket No 44518 the Commission granted a REP a
temporary 12-month waiver from its rules requiring the marketer to obtain telephonic
verification of the customerrsquos desire to switch REPs as well as a waiver from certain authorization disclosure requirements among other stipulations the Commission placed
upon the REP The Commission then opened Project No 45625 to study the issue of REPs
utilizing hand-held devices for customer enrollment more broadly and engage with market
representatives consumer representatives and other stakeholders The Commission
anticipates considering an amendment to its rules in the spring of 2017
21 | P a g e
2017 SCOPE OF COMPETITION IN ELECTRIC MARKETS IN TEXAS REPORT
4 Smart Meter Texas Portal
The electric utilities in Texas that have advanced metering systems (AMS) jointly
own and operate a single web portal known as Smart Meter Texas (SMT)18 SMT fulfills
two requirements imposed by the Commissionrsquos advanced metering rule on a utility with
AMS (1) provide to the retail customer the REP serving the customer and other entities
authorized by the customer access to such retail customerrsquos consumption data and (2)
allow devices at the customerrsquos premises to communicate through a home area network with the advanced meter at the premises SMT also facilitates near real-time on-demand
reads of a customerrsquos meter that aids prepaid service offered by certain REPs
In Project No 42786 Review of Advanced Metering System Web Portal
Commission staff and stakeholders examined options for the long-term operational
structure governance and funding of SMT The Commission determined that ownership
of SMT should remain with the TDUs because they can operate the portal at a lower cost
than transferring the data repository to ERCOT The Commission opened two
rulemakings one to ascertain the appropriate governance performance and funding of
SMT and a second to determine the appropriate access for third parties ensuring that
customers have the freedom to grant and give third parties access to their data if made
knowingly while also securing customer privacy
Sharyland Utilities
In early 2015 customers of Sharyland Utilities the smallest investor-owned
transmission and distribution utility in ERCOT began to file with the Commission a
significant number of complaints regarding high electricity bills In response the
Commission opened Project No 44592 Relating to a Project Regarding Sharyland
Utilities to provide for a more formal process for Commission review of the large number
of complaints As part of this project Commission staff prepared a report to evaluate the
electricity rates and electric bills in the operating area of Sharyland Utilities that was
previously part of Cap Rock Energy
Staffrsquos report found that a number of factors contributed to the comparatively high
bills for many of Sharyland-Cap Rockrsquos customers First Sharylandrsquos small size and its low customer density result in high TDU rates for all customers relative to other TDUs In
particular Staffrsquos report found that Sharyland-Cap Rockrsquos rates for distribution service are
up to three times higher than those of other TDUs in Texas In addition to Sharyland-Cap
Rockrsquos high costs for distribution service higher wholesale transmission costs also
contributed to the rate increases charged to Sharyland-Cap Rockrsquos customers These transmission costs are the result of increased transmission investment in recent years
throughout Texas that has increased transmission costs for all distribution providers
18 The participating Texas TDUs are AEP Texas Central Company and AEP Texas North Company (jointly
ldquoAEPrdquo) CenterPoint Energy Houston Electric LLC (ldquoCenterPointrdquo) Oncor Electric Delivery Company LLC (ldquoOncorrdquo) and Texas-New Mexico Power Company (TNMP) collectively referred to as the ldquoJoint TDUsrdquo Operation of an AMS web portal was addressed in the orders approving particular utilitiesrsquo deployment of AMS and approving surcharges for AMS cost recovery While Sharyland Utilities filed comments in the proceeding it did not
participate as it had not fully completed its AMS deployment at the time
22 | P a g e
2017 SCOPE OF COMPETITION IN ELECTRIC MARKETS IN TEXAS REPORT
including Sharyland Utilities Second the comparatively colder winter of 2014 ndash 2015
which was the time period generally consistent with the timeframe in which the
Commission began receiving complaints appeared to result in higher electricity usage than
normal This combination of high TDU rates and the higher electricity usage led to higher
bills for customers
Staffrsquos report also noted that in Sharyland-Cap Rockrsquos last rate case in 2014 the
approved rates reflected movement towards more cost-based rates for all customers
including some customers that previously had been heavily subsidized by other customers
Additionally in the process of standardizing Sharyland-Cap Rockrsquos customer classification
with the classifications of the other TDUs in Texas some customers may have experienced
a move from one class that previously was paying below-cost rates to another class that
was now paying above-cost rates For some of these customers the combined effects of
the movement towards cost-based rates and the change to a different class may have
contributed to a significant change in the customersrsquo rates Regardless of any cost-shifting
between customer classes Sharylandrsquos rates remain two to three times higher than those of other TDUs in Texas for all customers in all classes
On December 4 2015 the Commission signed an order directing Sharyland to file
an application for a comprehensive rate review by April 30 2016 Sharyland filed its rate
application on April 29 2016 in Docket No 45414 Review of the Rates of Sharyland
Utilities LP On October 10 2016 the Commission ordered Sharyland to file an amended
application as soon as practicable but no later than January 1 2017 to reflect the unique
aspects of the companyrsquos organizational structure as a real estate investment trust (REIT) At the time of publication Sharyland is expected to file its amended application in
December 2016
PowerToChoose Website
As part of its ongoing evaluation of the competitive market the Commission
opened Project No 45730 to evaluate the functionality and usability of its PowerToChoose
website which allows customers to select a REP and an electric plan based on their zip
code In the process the Commission received significant feedback from customers stating
that the Commissionrsquos PowerToChoose website was an important tool that plays a
fundamental role in their shopping process In response to the feedback received from
industry representatives and consumers Commission staff changed how the website sorts
and filters retail electric plans adding a filter to allow customers to unselect plans that
contain minimum usage fees or credits This filter is now a default setting and plans with
minimum usage fees and credits are not shown unless the customer actively selects to
search for such plans In addition Commission staff made other changes to increase the
clarity of the REP complaint rating The Commission continues to evaluate other changes
to improve the customer experience of the PowerToChoose website and provide
transparency for retail electric plans
23 | P a g e
2017 SCOPE OF COMPETITION IN ELECTRIC MARKETS IN TEXAS REPORT
Report on Alternative Ratemaking Mechanisms
In 2015 the Legislature enacted SB 774 which requires the Commission or its
consultant to conduct a study and make a report to the Legislature analyzing the alternative
ratemaking mechanisms adopted by other states In addition SB 774 extended the
authorization for the Periodic Rate Adjustment (PRA) mechanism from 2017 to 2019
which the Legislature had authorized in 2011 (SB 1693) as a version of an alternative
ratemaking mechanism that provides to utilities a means for expedited recovery of
distribution infrastructure costs Pursuant to SB 774 the Commission retained a consultant
to produce the report and the consultantrsquos recommendations included streamlining the ratemaking process to reduce procedural costs providing for a periodic review of the
prudency of the costs and using certain types of alternative ratemaking mechanisms that
decouple the recovery of costs from variations in load The Commission held a public
hearing to receive comments on the report from stakeholders and after consideration of
those comments has provided to the Legislature the consultantrsquos report together with its
own discussion of the report
Request for Purchase of Oncor Electric Delivery Company
In March 2016 the Commission approved with conditions an application by an
investor group led by Hunt Consolidated Inc the owners of Sharyland Utilities to acquire
control of Oncor Electric Delivery Company (Oncor) the largest transmission and
distribution utility in Texas from Oncorrsquos parent company Energy Future Holdings which
is in bankruptcy The Commission approved the request subject to certain conditions
including stipulations regarding the organization of the new entities and treatment of tax
benefits The investor-led group subsequently declined to pursue the transaction that was
approved by the Commission
In September 2016 NextEra Energy which owns Florida Power amp Light received
approval from the United States Bankruptcy Court in Delaware for its plan to purchase
Oncor In October 2016 NextEra Energy filed an application with the Commission in
Docket No 46238 for approval of the proposed transaction The Commission will evaluate
the application to determine if the transaction is in the public interest
Integration of Lubbock Power and Light
In March 2016 the Commission opened Project No 45633 to study and identify
the issues related to the request of Lubbock Power and Light the statersquos third-largest
municipally owned utility to be integrated into ERCOT The Commission is currently
working with stakeholders ERCOT and SPP to determine the cost and benefits of any
potential switch by Lubbock Power and Light into ERCOT and whether such a switch is
in the public interest
24 | P a g e
2017 SCOPE OF COMPETITION IN ELECTRIC MARKETS IN TEXAS REPORT
Desalination Project ERCOT Studies
In 2015 the Legislature passed HB 4097 which directed the Commission and
ERCOT to study whether existing transmission and distribution planning processes are
sufficient to provide adequate infrastructure for seawater desalination projects and to study
the potential for desalination projects to participate in demand response opportunities in
the ERCOT market Pursuant to that direction ERCOT staff have prepared a report on the
feasibility of interconnection of large desalination projects and on opportunities for such
projects to participate in ERCOTrsquos demand response programs which is attached to this Report in Appendix B
Oversight and Enforcement Actions
The Commissionrsquos enforcement of statutes rules and orders applicable to entities
under its jurisdiction serves to protect consumers the electric markets the reliability of the
electric grid and to promote fair competition The Commissionrsquos enforcement efforts in the electric industry focus on violations of PURA the Commissionrsquos rules and ERCOT
protocols
During the period from January 2015 through August 31 2016 the Commission
assessed $3258500 in penalties against electric market participants Table 8 provides a
summary of electric industry Notices of Violation since January 2015 During 2015 and
2016 Commission staff opened 212 investigations for the electric industry and closed 177
investigations
Table 8 Notices of Violations
Violation Type Total Penalty Amount
Retail Market Violations $539000
Service Quality Violations $451500
Wholesale Market Violations $2268000
TOTAL $3258500
In addition to the imposition of administrative penalties the Commission uses other
enforcement mechanisms in exercising its enforcement duties including revoking a
companyrsquos certificate to operate In addition some companies may be required to relinquish a certificate as part of a settlement after enforcement action has proceeded
Table 9 provides a breakdown of the number of certificates revoked or relinquished In
2016 the Commission revoked the certificate of the REP TruSmart Energy
Table 9 Certificates Revoked or Relinquished
Type Number
Certificates Revoked 1
Certificates Relinquished 0
25 | P a g e
2017 SCOPE OF COMPETITION IN ELECTRIC MARKETS IN TEXAS REPORT
The Oversight amp Enforcement division also issues warning letters to companies in
the electric market when it determines that a violation occurred but given the
circumstances surrounding the violation and other mitigating concerns no administrative
penalty is warranted During 2015 and 2016 the Oversight amp Enforcement division issued
50 warning letters Finally the Commission generally seeks to reimburse money directly
to customers when appropriate In 2015 and 2016 the Commission ordered the
reimbursement of $8543596 to Texas electric customers
Table 10 Warning Letters
Warning Letter Type Number
Retail Market Warning Letter 8
Service Quality Warning Letter 1
Wholesale Market Warning Letter 41
TOTAL 50
In addition to its enforcement activities the Commission also enters into voluntary
mitigation plans with generators that request one through a contested case proceeding
pursuant to PURA sect15023(f) and 16 TAC sect25504(e) The Commission entered into one
voluntary mitigation plan during 2015 and 2016 in Docket No 44635
Low-Income Discount System Benefit Fund
The System Benefit Fund (SBF) was originally established in 1999 to fund
discounts to low-income customers customer education activities energy-efficiency and
weatherization and electric market oversight through a nonbypassable surcharge on retail
electric bills HB 1101 of the 84th Legislature provided that the SBF be sunset on
September 1 2017 by which time the SBF is intended to be exhausted In the 2016 Fiscal
Year (FY) $325521250 was appropriated in the SBF to provide a 25ndash31 percent discount
to low-income customers over a 12-month period
To assist the drawdown of the remaining balance HB 1101 authorized the
Commission to use any unexpended SBF balance in FY 2017 to assist low-income
customers The Commission estimates that the remaining SBF balance will be
approximately $17 million by August 31 2017 The Commission has determined that this
amount is insufficient to fund the rate reduction program however the Commission will
spend approximately $100000 to continue automatic enrollment in the program to provide
REPs a list of customers eligible to receive late fee waiver and deposit installment benefits
These two ancillary benefits of the rate reduction program will continue for the duration of
FY 2017
26 | P a g e
2017 SCOPE OF COMPETITION IN ELECTRIC MARKETS IN TEXAS REPORT
Homeland Security
The Commission assesses the efforts of ERCOT and utilities to defend against
mitigate and respond to the variety of risks that the modern electricity system faces The
Commission also meets with ERCOT utilities and governmental entities on an ongoing
basis to discuss preparation for everything from hurricanes and other severe weather to
cyber-threats and threats of physical damage to the grid from accidents or intentional
malfeasance In addition the Commission monitors industry and federal programs that
address homeland security issues
The Commission serves as an information liaison between state government and
electric utilities during emergencies The Commissionrsquos main roles include
Conveying outage and service restoration information from electric utilities to
state government
Conveying service restoration priorities (hospitals water treatment facilities
etc) from state government to electric utilities and
Facilitating the clearance of downed power lines in disaster re-entry areas and
facilitating entry of electric utilities into disaster areas
The Commissionrsquos Emergency Management Response Team (EMRT) provided staff at the
State Operation Center for the May 2015 and April 2016 flooding events in Texas as well
as additional staffing for severe winter weather
Demand Response
ERCOT staff have begun to report annually on the participation of customers in
REP-sponsored demand response programs These programs which have been facilitated
by the deployment of smart meters throughout the competitive areas within ERCOT and
by many municipal and cooperative electric utilities take the form of rebates for reduction
in usage during peak period time-of-use pricing real-time volumetric price compensation
for load reduction and direct control of customer load among other plans
These programs have seen dramatic increases in participation since ERCOT began
to gather this information in 2013 From 2013 to 2014 the number of residential customers
participating in these programs increased from 151793 to 721273 and the number of
commercial and industrial customers participating rose from 30275 to 50205 The
Commission continues to monitor ERCOTrsquos stakeholder process for efforts relating to the integration of demand response
27 | P a g e
2017 SCOPE OF COMPETITION IN ELECTRIC MARKETS IN TEXAS REPORT
IV LEGISLATIVE RECOMMENDATIONS
A Determination of Low-Income Customer Eligibility
In 2015 HB 1101 required that all remaining funds in the System Benefit Fund
(SBF) be expended that the fee that funded the program as a nonbypassable surcharge on
electric bills be set at zero and that the SBF be sunset on September 1 2017 Per the
provisions of HB 1101 the SBF fee was set at zero in September 2016 concluding the
funding for the program The sunset of the SBF program also concluded the relationship
between the Texas Health and Human Services Commission (HHSC) and the Commission
in which the HHSC provided to the Commission eligible electric customers for the SBF
low-income discount Because of the termination of the relationship with HHSC with the
termination of the SBF the Commission will no longer be able to determine easily an
electric customerrsquos eligibility for other low-income programs such as late penalty waivers
and the option of paying an electric deposit over multiple months
The Legislature may wish to consider easing low-income customers access to these
low-income programs by facilitating the process used to determine eligibility The
Commission offers four possible approaches in which the Legislature could continue these
low-income programs
(1) Authorize HSSC to provide identification of eligible low-income customers to the
Commission
(2) Allow retail electric providers (REPs) to provide such low-income programs using
the Low Income Discount Administratorrsquos (LIDA) Telecommunications Lifeline
Service Program list to identify low-income customers
(3) Require REPs to offer such low-income programs with customers self-enrolling
and REPs verifying income eligibility or
(4) Allow REPs to voluntarily provide such low-income programs at their own
discretion
B Outside Counsel for Proceedings before Regional Transmission
Organizations
Regional Transmission Organizations (RTO) manage the power grid across wide
regions of the United States Most of Texas is inside the ERCOT region however there
are significant portions of East Texas and the Panhandle that are in the Midcontinent
Independent System Operator (MISO) and the Southwest Power Pool (SPP) Issues arise
in these other RTOs that have significant impact on Texas ratepayers such as how
transmission infrastructure costs will be shared These tend to be very lengthy and
complicated proceedings that require specialized legal and consulting services
28 | P a g e
2017 SCOPE OF COMPETITION IN ELECTRIC MARKETS IN TEXAS REPORT
PURA sect 394525 currently authorizes the Commission to use outside consultants
auditors engineers or attorneys to represent the Commission in proceedings before the
Federal Energy Regulatory Commission This provision has been an important tool for the
Commission to respond to complex matters in the federal arena to enable it to protect the
public interest in Texas The PUC recommends that the Legislature expand the language
in this statute to include the ability to hire outside assistance for proceedings before other
RTOs to provide those same protections to Texas ratepayers in those areas
C Repeal of Natural Gas and Renewable Energy Mandates
1 Natural Gas
PURA sect 399044 establishes natural gas as ldquothe preferential fuelrdquo in Texas for electricity generation and requires the Commission to adopt rules to establish a system of
natural gas energy trading credits The majority of all new non-renewable electricity
generation constructed since 2000 for Texas has used natural gas as a primary fuel and this
trend is expected to continue in the foreseeable future The thresholds used to trigger the
natural gas energy trading credit system in PURA sect 399044 have not been reached and
they are not expected to be reached in the foreseeable future
Because natural gas-fueled facilities have been the most commonly built new
generation in Texas for many years and are expected to continue to be there is no need to
establish incentives for natural gas generation The PUC recommends that the Legislature
consider repealing PURA sect 399044 because it is no longer necessary
2 Renewable Energy
PURA sect 39904 establishes goals for renewable energy Subsection (a) requires
the installation of 5880 megawatts of renewable energy by 2015 and Subsection (b)
establishes a renewable energy credits trading program to implement the requirement The
5880 megawatts mandates in Subsection (a) was met in 2008 While the Commission
believes the renewable energy trading credit program is needed for retail electric providers
to validate renewable energy marketing claims the Commission believes the 5880
megawatts mandate in Subsection (a) is no longer necessary
D Advisory Opinions
Many regulatory agencies in Texas have authority to issue informal guidance to the
persons they regulate particularly with respect to outlining whether a particular course of
conduct would in the agencyrsquos view be consistent with the laws and regulations that the agency administers19 The issuance of an advisory opinion can provide regulatory clarity
to a company before making investments or conducting operations the permissibility of
which may be unclear under state law The Legislature may want to consider granting the
19 In addition certain federal agencies such as the Federal Communications Commission
Internal Revenue Service Securities and Exchange Commission and Federal Election
Commission have authority to issue advisory opinions
29 | P a g e
2017 SCOPE OF COMPETITION IN ELECTRIC MARKETS IN TEXAS REPORT
Commission the authority to issue advisory opinions In the electric industry providing
clarification to a company concerning issues such as the purchase of assets or the
acquisition of another company could allow it to avoid expensive regulatory proceedings
without impairing the Commissionrsquos authority The following state agencies have statutory authority to issue advisory opinions
Texas Ethics Commission20
Texas Medical Board21
State Board of Dental Examiners22
Texas Board of Nursing23
Texas Board of Professional Engineers24
Texas Lottery Commission and25
Texas Securities Board26
E Administrative
Gross Receipts Assessment
PURA sect 16001 provides for a gross receipts assessment that is used to defray the
expenses incurred by the Commission to administer PURA An assessment of one sixth of
one percent is collected from public utilities electric cooperatives retail electric providers
and interexchange carriersrsquo gross receipts from consumers The funds from this assessment
are remitted to the general revenue fund but currently they have not been explicitly
dedicated to funding of the Commission In contrast similar assessments on water
utilities insurance companies and other regulated entities have traditionally been used to
explicitly fund the underlying regulatory programs at the respective agencies The
Commission is one of four Article VIII agencies that is not designated as self-funded
The Commission recommends that the Legislature designate the Commission as a
self-funded agency whereby the collected assessments would be explicitly dedicated to the
funding of the agency Implementing this recommendation would require the Public Utility
Commission to be included in the Appropriations Limited to Revenue Collections rider
located in the Special Provisions Relating to All Regulatory Agencies section of the
General Appropriations Act Designation as a self-leveling agency would require the
Commission to set the gross receipts assessment at a rate sufficient to generate revenue in
the amount of the agencyrsquos general revenue appropriation each fiscal year which would require a statutory change to PURA sect16001(b) Based upon the Commissionrsquos baseline budget request authorizing the PUCrsquos self-leveling designation would result in an overall
estimated tax reduction of $456 million per year or 774
20 Government Code sect 571091 21 Occupations Code sect 162107 22 Occupations Code sect 258157 23 Occupations Code sect 301607 24 Occupations Code sect 1001601 25 Occupations Code sect 2001059 26 Tex Rev Civ Stat Ann Arts 581-28-1 amp 581-35 7 Tex Admin Code 1012
30 | P a g e
2017 SCOPE OF COMPETITION IN ELECTRIC MARKETS IN TEXAS REPORT
V APPENDICES
31 | P a g e
2017 SCOPE OF COMPETITION IN ELECTRIC MARKETS IN TEXAS REPORT
Appendix A ndash Acronyms
AEP American Electric Power
AMS Advanced Metering System
CenterPoint CenterPoint Energy Houston Electric LLC
DG Distributed Generation
DRG Distributed Renewable Generation
ERCOT Electric Reliability Council of Texas
ERSC Entergy Regional State
ERS Emergency Response Service
ETI Entergy Texas Inc
IMM ERCOT Independent Market Monitor
kWh Kilowatt-hour
LMP Locational Marginal Pricing
LSP Large Service Provider
MISO Midwest Independent System Operator
MMBtu One million British Thermal Unit (BTU)
MW Megawatt
MWh Megawatt-hour
Nodal Texas Nodal Market Design
ORDC Operating Reserve Demand Curve
PGC Power Generation Company
POLR Provider of Last Resort
PURA Public Utility Regulatory Act
REP Retail Electric Provider
RSC Regional State Committee
RTO Regional Transmission Organization
SCED Security Constrained Economic Dispatch
Sharyland Sharyland Utilities LP
SBF System Benefit Fund
SPP Southwest Power Pool
TDU Transmission and Distribution Utility
TNMP Texas-New Mexico Power Company
32 | P a g e
2017 SCOPE OF COMPETITION IN ELECTRIC MARKETS IN TEXAS REPORT
Appendix B ndash ERCOT Desalination Report
This page intentionally left blank
33 | P a g e
ERCOT Public
Study on the Demand Response Potential for Seawater Desalination Projects
ERCOT November 18 2016
Study on the Demand Response Potential for Seawater Desalination Projects ERCOT Public
Executive Summary
In 2015 the 84th Texas Legislature enacted House Bill (HB) 4097 which included several provisions relating to seawater desalination projects including a requirement that the Public Utility Commission of Texas (PUC) and Electric Reliability Council of Texas (ERCOT) study the potential for seawater desalination projects to participate in existing demand response opportunities in ERCOT There are several demand response products in which demand-side resources (ie consumers of electricity) can participate These programs help to preserve system reliability and provide economic benefits to participating demand-side resources Seawater desalination is an energy-intensive process that removes salt and other minerals from salt water to produce fresh water for municipal consumption industrial use or irrigation Participation in demand response could help mitigate electricity costs for future seawater desalination projects in Texas and provide reliability benefits to the grid
There are two main demand response reliability-based services administered by ERCOT participation by demand-side resources in the Ancillary Services market and the Emergency Response Service (ERS) Within the Ancillary Services market the most common service provided by demand-side resources is Responsive Reserve Service (RRS) which requires resources to respond either instantaneously or within 10 minutes in response to unplanned system emergencies ERS is separate from ERCOTrsquos Ancillary Services market and allows demand-side resources and distributed generation to provide reliability services in the event of an energy emergency Resources can qualify for either the 10-minute or 30-minute response time ERS programs
There are several key considerations that will impact a demand-side resourcersquos ability to participate in different demand response opportunities response time recovery time predictability of electrical demand and flexibility of operations Considering these factors together it appears that seawater desalination plants could be designed to meet the requirements for participation in demand response Because the ability to meet the qualification requirements is dependent on the plant design demand response opportunities should be considered early in a projectrsquos development if participation is desirable
Whether project developers will choose to address these requirements will depend on the economic benefits of participation There may be additional costs to design seawater desalination plants to operate in the manner required in order to participate in demand response These include costs associated with additional plant design specifications need for excess capacity and storage to make up for lost production during demand response deployment operational costs resulting from interruptions to plant processes and potential financial penalties if demand response deployment results in failure to meet contract demands The interplay of the benefits of participation and these costs will determine whether it would be beneficial for a future seawater desalination plant to participate in demand response in ERCOT
To date participation of seawater desalination plants in demand response programs has been limited Because the process of seawater desalination is energy-intensive participation in demand response could help to reduce electricity costs while posing a relatively low risk to plant operations As stakeholders in Texas continue to plan for possible future droughts in the region and identify water management strategies consideration of demand response could play a role in mitigating some costs associated with seawater desalination and allow seawater desalination plants to assist with maintaining electric reliability in the region
copy 2016 ERCOT All rights reserved i
Study on the Demand Response Potential for Seawater Desalination Projects ERCOT Public
Table of Contents
1 Introduction 1
2 Seawater Desalination 2
21 Seawater Desalination Plant Operations 2
22 Seawater Desalination Plant Economics 3
3 Demand Response Opportunities in ERCOT 4
31 ERCOT-Dispatched Demand Response 4
311 Ancillary Services Markets 5
312 Emergency Response Service (ERS) 5
32 Non-ERCOT-Dispatched Demand Response 6
321 Four Coincident Peak (4CP) 6
322 LSE or DR Provider Contracted Price Response 6
323 Self-Directed Price Response 6
4 Demand Response Potential for Seawater Desalination 7
41 Operational Considerations for ERCOT-Dispatched Demand Response 7
42 Economic Considerations for ERCOT-Dispatched Demand Response 8
43 Considerations for Non-ERCOT-Dispatched Demand Response 9
5 Conclusion 11
copy 2016 ERCOT All rights reserved ii
Study on the Demand Response Potential for Seawater Desalination Projects ERCOT Public
1 Introduction
In 2015 the 84th Texas Legislature enacted House Bill (HB) 4097 which included several provisions relating to seawater desalination projects including a requirement that the Public Utility Commission of Texas (PUC) and Electric Reliability Council of Texas (ERCOT) study the potential for seawater desalination projects to participate in existing demand response opportunities in ERCOT ERCOT and the PUC initiated this study to fulfill that requirement and evaluated the operational and economic characteristics of seawater desalination plants in light of ERCOTrsquos primary demand response products1
ERCOT is the independent system operator (ISO) for the ERCOT Interconnection which encompasses approximately 90 of demand for electricity in Texas ERCOT is the independent organization established by the Texas Legislature to be responsible for the reliable planning and operation of the electric grid for the ERCOT Interconnection ERCOT also administers and maintains a forward-looking open market to provide affordable and reliable electricity to consumers in Texas In collaboration with market participants ERCOT has developed demand response products and services for customers that have the ability to reduce or modify electricity use in response to instructions or signals These programs help preserve system reliability and provide economic benefits to participating demand-side resources
The process of seawater desalination removes salt and other minerals from salt water to produce fresh water for consumption industrial processes or irrigation The drought-prone Texas climate coupled with projections for increasing water demand in the state has created interest in seawater desalination as a future water source The 2017 Texas State Water Plan includes seawater desalination as a future water management strategy for water users in the state However the seawater desalination process is energy intensive and electricity consumption can be a significant cost driver for these projects To the extent that these plants could participate in demand response it would help to defray these costs Thus there is a potential nexus between seawater desalination projects built in Texas to mitigate drought but which have large electricity requirements and ERCOT demand response opportunities which could help to reduce their electricity costs and provide reliability benefits
This study evaluates the demand response potential of seawater desalination plants based on their operational characteristics and economic drivers The report is organized as follows
Section 2 provides background on typical seawater desalination plant operations and economics
Section 3 describes the current demand response opportunities in ERCOT
Section 4 evaluates the characteristics of seawater desalination plants to determine their potential to participate in demand response opportunities in ERCOT and
Section 5 provides a summary of the conclusions of this study
1 In the course of developing this report ERCOT consulted with several desalination experts with experience with existing or planned seawater desalination plants in the US The technical experts consulted included Jorge Arroyo (Water Management Consultant) Andrew Chastain-Howley (Black amp Veatch) Jonathan Loveland (Black amp Veatch) Ron Parker (Black amp Veatch) John Wolfhope (Freese and Nichols) and Srinivas Veerapaneni (Black amp Veatch)
copy 2016 ERCOT All rights reserved 1
Study on the Demand Response Potential for Seawater Desalination Projects ERCOT Public
2 Seawater Desalination
There are two primary methods for seawater desalination distillation (also referred to as ldquothermalrdquo) and reverse osmosis Distillation uses heat to remove salts and minerals from seawater by boiling water at high pressures In contrast reverse osmosis technology forces saline water through a membrane to separate water from the salts and minerals While both distillation and reverse osmosis are energy intensive distillation requires thermal energy to heat the water and overall has a higher energy requirement whereas reverse osmosis requires primarily electrical energy and overall is less energy intensive ndash though still with significant electricity requirements
Globally most thermal desalination plants are located in the Middle East due to low energy prices in the region Plants located elsewhere including in the US typically use reverse osmosis technology2 There are two large existing seawater desalination plants in the US one in Carlsbad California providing water to the San Diego area and one in Gibsonton Florida providing water to the Tampa Bay area Both plants use reverse osmosis technology In addition there are several desalination projects currently in the planning stages or under development in Texas in the Corpus Christi area that would use reverse osmosis technology For that reason this report focuses on reverse osmosis technology in the evaluation of demand response potential of seawater desalination plants
While there are currently no existing seawater desalination plants in Texas there are several municipal and industrial brackish water desalination plants in the state According to the Texas Water Development Board (TWDB) there are 46 municipal brackish water desalination plants with capacities greater than 0025 million gallons per day (MGD) in Texas representing a total of 123 MGD of capacity3 The desalination of brackish water is typically less expensive compared to seawater due to the lower relative salinity of brackish water This study focuses exclusively on seawater desalination consistent with the requirements of HB 4097 but it should be noted that conclusions may also apply to brackish water desalination though at a different cost and scale
This section provides high-level information on the operations (Section 21) and economics (Section 22) of seawater desalination plants to inform the discussion of their demand response potential in Section 4
21 Seawater Desalination Plant Operations Seawater desalination plants typically range in capacity from less than 5 MGD up to 165 MGD For example the Carlsbad seawater desalination plant has a capacity of approximately 50 MGD and the plant in Tampa Bay has a capacity of approximately 25 MGD The associated electricity consumption ranges between 10 and 15 kWh1000 gallons produced depending on the salinity of the water being processed456 More saline water (eg seawater) requires larger amounts of electricity for desalination Thus a seawater desalination plant would have larger electricity consumption requirements compared to a similarly sized brackish water desalination plant
2 American Water ldquoInnovation Solutions within the Water Industry Desalinationrdquo Available at httpwwwamwatercomfilesInnovationsSolutionsWithinTheWaterIndustryDesalinationpdf 3 Texas Water Development Board ldquoDesalination Factsrdquo Available at httpswwwtwdbtexasgovinnovativewaterdesalfactsasp 4 American Membrane Technology Association April 2016 ldquoMembrane Desalination Power Usage Put in Perspectiverdquo Available at httpwwwamtaorgcomwp-contentuploads7_MembraneDesalinationPowerUsagePutInPerspectivepdf 5 Water Reuse Association November 2011 ldquoSeawater Desalination Power Consumptionrdquo Available at httpswatereuseorgwpshycontentuploads201510Power_consumption_white_paperpdf 6 Ghaffour N TM Missimer and G Amy January 2013 ldquoTechnical review and evaluation of the economics of water desalination Current and future challenges for better water supply sustainabilityrdquo Desalination 309 pp197-207 Available at httpswwwresearchgatenetpublication256693140_Technical_review_and_evaluation_of_the_economics_of_water_desalination_ Current_and_future_challenges_for_better_water_supply_sustainability
copy 2016 ERCOT All rights reserved 2
Study on the Demand Response Potential for Seawater Desalination Projects ERCOT Public
While the two existing seawater desalination plants in the US were co-located with power plants to ease compliance with regulations on water intake and discharge structures and reduce costs many other reverse osmosis desalination plants receive their electricity from the grid However plants may have on-site backup generation in case of a power outage This will vary depending on the size and design of the plant and other factors For example the Carlsbad plant in California does have diesel backup generation to power control systems and flushing systems in the case of a power outage The plant in Tampa Bay was not built with backup power due to potential storm surge risks from hurricanes and other storms The plant does use uninterruptible power supply (UPS) backup to power control systems during power outages
Reverse osmosis plants are typically designed with several ldquotrainsrdquo which consists of a high-pressure pump turbine and reverse osmosis membrane Desalination plants are turned on or off one train at a time in a highly controlled process The process of ramping up or down an individual train under normal operations typically takes one to two hours While plants can be designed to handle immediate shutdowns (ie in a power outage) re-starting a system after an interruption would take this amount of time In addition the saline water must be pretreated (ie filtered) before going through the reverse osmosis train and this can sometimes pose constraints on the flexibility of operations
Demand for water is the key factor driving the level of production at seawater desalination plants Typically the plant will have a contract or contracts with municipal or other water users to deliver desalinated water and is operated to meet that demand Alternatively if the plant is municipally owned it would similarly be operated to meet the level of water demand in conjunction with other available water sources If water demands are close to a plantrsquos full capacity the operatorrsquos flexibility to adjust its electricity consumption as part of demand response may be limited However this does mean that plant operations are fairly predictable on a day-to-day basis which is necessary for participation in demand response
The amount of flexibility in plant operations will also be impacted by the amount of water storage available For example if a plant has sufficient water storage on-site or storage within the customerrsquos distribution system it could provide flexibility for the plant to reduce its operations during peak hours when electricity prices are likely to be highest It would also mitigate the impacts of interruptions to production from demand response deployments
22 Seawater Desalination Plant Economics Seawater desalination is typically more expensive than other sources of water and a major driver of the overall cost is energy costs In 2016 the Carlsbad plant charged rates at between $2131 and $2367 per acre-foot78 This charge is intended to cover both the fixed costs of the plant and the variable costs to produce a unit volume of water Typically half to two thirds of the cost of providing desalinated seawater are accounted for by capital cost recovery with the remainder accounted for by operations and maintenance costs including electricity costs Electricity costs can account for 20shy25 of the total costs of seawater desalination with reverse osmosis technology9
Factors affecting the capital cost of a seawater desalination plant include plant size type of desalination process and pre-post-treatment technologies plant infrastructure (eg piping water storage backup power) and compliance with applicable regulations (eg regulations on intake structures brine byproduct disposal) A significant driver of operating and maintenance costs is membrane replacement Reverse osmosis membranes need to be replaced every few years and
7 Source San Diego County Water Authority ldquoSeawater Desalinationrdquo Available at httpwwwsdcwaorgseawater-desalination 8 Note that 1 acre-foot is approximately 325851 gallons 9 Based on technical input from Black amp Veatch
copy 2016 ERCOT All rights reserved 3
Study on the Demand Response Potential for Seawater Desalination Projects ERCOT Public
the rate at which they are replaced will depend on the salinity of the feedwater and how the plant is operated Treatment and disposal of the salty brine byproduct from desalination may also incur operating costs
Electricity costs will vary depending on a range of factors including the size of the plant type of desalination technology source of electricity and quality of the feedwater As previously noted more saline water requires higher amounts of electricity in desalination and thus the amount of electricity consumption is a key difference between brackish water and seawater desalination As a result electricity costs comprise a significant share of the costs of seawater desalination These costs could potentially be defrayed in part by participation in demand response initiatives
3 Demand Response Opportunities in ERCOT
Broadly speaking demand response can be broken down into two major categories dispatchable or non-dispatchable For purposes of this report we will define dispatchable as those demand response events that are initiated by ERCOT and non-dispatchable as an event not specifically initiated by ERCOT These non-dispatchable events may include decisions made by the end-use customer to alter its consumption pattern or may include contractual obligations with another entity such as the end-use customerrsquos retail electric provider (ldquoREPrdquo) to alter consumption patterns
ERCOTrsquos wholesale market is open to several types of dispatchable demand response which are deployed to maintain system reliability Demand-side resources providing Emergency Response Service (ERS) may offer based on either a 10 or 30-minute response time commonly referred to as the ldquoramp periodrdquo Alternatively demand-side resources may register and qualify as a Load Resource that can provide Reserves in the Ancillary Services market The most common service provided by demand-side resources is Responsive Reserve Service which requires an under-frequency relay that can instantaneously interrupt the load during certain system reliability events Some demand-side resources can also participate in other Ancillary Services as Controllable Load Resources that require sophisticated control systems that allow them to be deployed in a more incremental proportional manner
Non-dispatchable demand response in ERCOT can include a response to avoid transmission costs where rates are based on Four Coincident Peak Pricing (4CP) response to wholesale energy prices initiated by the customer or by a REP or other load-serving entity (ldquoLSErdquo) or utility-managed Load Management programs (LM)
The sections that follow provide a description of both ERCOT-dispatched (Section 31) and nonshyERCOT-dispatched (Section 32) demand response For a more detailed description of opportunities for demand-side resources to participate in demand response in ERCOT see ERCOTrsquos guide Load Participation in the ERCOT Nodal Market10
31 ERCOT-Dispatched Demand Response There are two main demand response reliability-based services administered by ERCOT participation by demand-side resources in the Ancillary Services market and participation in ERS These services are dispatched by ERCOT during system emergencies
10 Available at httpwwwercotcomcontentservicesprogramsloadLoad20Participation20in20the20ERCOT20Nodal20Market_302d oc
copy 2016 ERCOT All rights reserved 4
Study on the Demand Response Potential for Seawater Desalination Projects ERCOT Public
Demand-side resources with demand response capability that can meet a set of performance requirements can be qualified to provide Ancillary Services as Load Resources in the Ancillary Services Market The value of having a Load Resource available to reduce load is equal to the value of having a generator available to increase its generation at a generating plant The providers of operating reserves selected to provide Ancillary Services are eligible for capacity payments regardless of whether the Resource is actually deployed (or curtailed in the case of the Load Resource)
ERCOT holds auctions on a daily basis for each of the following Ancillary Services Regulation Up Regulation Down Responsive Reserve and Non-Spinning Reserve11 Table 1 describes the various Load Resource types and their qualification requirements and eligible services
Table 1 Load Resource Types and Ancillary Services
Service Load Resource Type a Qualification Responsive Reserves (le50 of total Reserve requirement)
Non Controllable Under-Frequency Relay and 10-minute ramp to manual dispatch instruction
Responsive Reserves
Controllable Primary Frequency Response and follow 5-minute dispatch instructions
Regulation-Up Regulation-Down
Controllable Primary Frequency Response and respond to Regulation deployments
Non-Spin Reserves Controllable Follow 5-minute dispatch instructions a A Controllable Load Resource is a Load Resource capable of controllably reducing or increasing consumption under dispatch control by ERCOT
Demand-side resources that agree to reduce load when directed by ERCOT and that meet other metering and operational requirements as specified in the ERCOT Protocols may participate in Ancillary Services market auctions As noted in Table 1 the type of Ancillary Service that a Load Resource may provide will depend upon the demand-side resourcersquos response time and metering system as well as other requirements described in the Protocols In the Responsive Reserve and Non-Spin Reserve markets the Load Resource will receive capacity payments regardless of whether or not the load was actually deployed but the load must be available for deployment at any time while providing the service
ERCOT procures ERS to maintain grid reliability during emergency conditions and reduce the likelihood of the need for rotating outages ERS participants may offer to provide demand response with either a 10-minute ramp period requirement (similar to Load Resources providing Responsive Reserve Service) or a 30-minute ramp period requirement ERS Resources do not have the same telemetry and under-frequency relay requirements as Load Resources
11 Regulation Up and Regulation Down service respond to signals from ERCOT every 4 seconds to respond to changes in system frequency full response has to be provided within 5 minutes Responsive reserves must provide their committed capacity either instantaneously in an under-frequency event (eg due to a generator outage) or in energy scarcity conditions within ten minutes following an instruction from ERCOT Non-spinning reserves must provide their committed capacity within 30 minutes based on economic dispatch instructions Non-spinning reserve is used as replacement reserve to replenish other ancillary services and during energy scarcity
copy 2016 ERCOT All rights reserved 5
Study on the Demand Response Potential for Seawater Desalination Projects ERCOT Public
ERS is procured through a request for proposal (RFP) process three times per year for four-month contract terms each of which is further split into smaller time periods based on business cycles and other factors Demand-side resources may choose to submit offers in all time periods or only in those that best fit their unique circumstances and may vary both the price and demand response capacity offers by time period
Payments for ERS are performed up to 80 days after each four month contract term has ended and are subject to downward revision based upon delivered demand response capacity and the demand-side resourcersquos availability during the contract term
32 Non-ERCOT-Dispatched Demand Response The options listed below are not dispatched by ERCOT but they either are controlled directly by a customer or are dispatchable by another entity such as a demand response provider (ldquoDR Providerrdquo) REP or a transmission and distribution utility
Many industrial customers are subject to transmission charges based upon a Four Coincident Peak (4CP) demand The 4CP demand is determined by averaging the consumerrsquos actual demand during the 15-minute settlement interval with the highest ERCOT demand during each of the four summer months (June through September) This measured 4CP demand serves as the basis for the customerrsquos transmission tariff charges for the following year By correctly predicting the ERCOT system peaks during the summer and curtailing load during those intervals a consumer can help reduce the stress imposed on the electric system during peak periods of consumption and reduce its transmission charges for the following calendar year
In the competitive areas of ERCOT consumers can contract with their REP or a DR Provider to have their load respond to the REPrsquos or DR Providerrsquos instructions The contract will usually outline the parameters of this response ndash at what times and frequency demand response events can be called ramp periods sustained response periods compensation etc Because this response is a contractual matter between the REP or DR Provider and the consumer a great deal of variety can be present in these arrangements For example a consumerrsquos response may be voluntary or required compensation could come in the form of reduced energy prices or rebate payments for each curtailment event consumers might be notified up to a day in advance or could have no notification at all (for automated curtailment)
In areas of ERCOT not open to competition interruptible tariffs may be available These tariffs will usually offer a reduced energy price for defined curtailment obligations
REPs may offer dynamic pricing options or consumers within a municipality or cooperative may have their energy prices determined by a published tariff which also may be structured based upon Time-of-Use (TOU) or have a Critical Peak Pricing (CPP) or Peak Time Rebate (PTR) component Self-directed price response refers to consumers making an independent decision to respond to energy prices contained in a governing tariff or in either the ERCOT Day Ahead or Real Time energy markets
TOU offerings will typically have higher energy prices during normal peak periods ndash for example a TOU tariff may charge one price during Monday through Friday from 2 pm through 8 pm and another price during all other times Customers may choose to reduce consumption during these high priced periods Load reduction can be accomplished by load shifting (loads can be shifted by
copy 2016 ERCOT All rights reserved 6
Study on the Demand Response Potential for Seawater Desalination Projects ERCOT Public
rescheduling certain processes or by utilizing thermal storage) ending certain processes that are no longer economic or through energy efficiency measures
Offerings that incorporate CPP usually have prescribed high prices only during certain defined periods ndash for example when load or prices are expected to reach a certain level Response to CPP may be similar to those employed under TOU tariffs especially if CPP is reached frequently More often CPP is infrequent and as such short-term load curtailment may be the more appropriate response to meet economic objectives
4 Demand Response Potential for Seawater Desalination
This section evaluates whether the operational characteristics and economics of seawater desalination plants would enable them to participate in one or more of the various demand response opportunities in the ERCOT Region To date participation of seawater desalination plants in demand response programs has been limited Neither the plant in Carlsbad nor the plant in Tampa Bay participate in demand response programs in California or Florida respectively However as will be described below it appears that these plants can be designed and operated to meet the requirements for participation in demand response and receive economic benefit from participation in these programs
Section 41 describes the operational parameters that must be met for a demand-side resource to provide ERCOT-dispatched demand response and evaluates the ability of seawater desalination plants to meet these criteria Section 42 discusses the tradeoffs between payments for participation in ERCOT-dispatched demand response and potential additional costs posed to seawater desalination plants Finally Section 43 presents other opportunities for seawater desalination plants to reduce their electricity costs outside of ERCOTrsquos reliability-based services that are open to demand response assets
41 Operational Considerations for ERCOT-Dispatched Demand Response There are several key operational parameters that impact a demand-side resourcersquos ability to participate in different demand response services response time recovery time predictability of electrical demand and flexibility of operations This section discusses each of these considerations as they apply to seawater desalination plants
As discussed in Section 31 one of the differentiating factors between ERCOTrsquos demand response products is the amount of time within which a demand-side resource must respond to a deployment instruction to reduce electricity consumption during an event Participation in RRS requires an automatic response within either half a second (ie instantaneous) based on grid frequency or within 10 minutes via a manual instruction ERS requires a response time of either 10 or 30 minutes As noted in Section 21 the typical time to take a reverse osmosis train on- or off-line is 1-2 hours under normal controlled operations To comply with the response time requirements of RRS or ERS a seawater desalination plant would need to be able to reduce its electricity consumption far more quickly than in normal operations This is an element of plant design that would need to be accounted for in the specifications of the project Considerations include the potential need for on-site backup generation including uninterruptible power supply potential impacts to plant infrastructure (eg piping) reverse osmosis membranes and pretreatment systems
The two large US desalination plants provide illustrative counterpoints in this respect The Carlsbad plant was designed to withstand instantaneous power interruptions and has on-site backup generation including uninterruptible power supply to provide the ability to power control systems and flush the membranes in the event of a power loss In contrast the Tampa Bay plant was not
copy 2016 ERCOT All rights reserved 7
Study on the Demand Response Potential for Seawater Desalination Projects ERCOT Public
designed with on-site backup generation and a loss of power would result in a plant shutdown and may require several days to bring the plant back on-line Thus it appears that it is technically possible for a seawater desalination plant to meet the response time requirements for participation in demand response so long as this factor is considered in the design of the facility
The time it takes a desalination train to return to operations after an event is also a consideration Demand-side resources participating in RRS must be able to come back on-line within three hours and those participating in ERS must return within 10 hours Again it appears that it is technically feasible for desalination plants to meet this requirement so long as this requirement is considered in the plant design
An additional consideration is the predictability of a demand-side resourcersquos electricity consumption Participation in the responsive reserves ancillary service market requires bidding in the day-ahead market and thus a demand-side resource must know with great accuracy (within 95) its electrical demand at least a day ahead of time For ERS auctions are held three times a year for four-month contract periods Thus to participate in ERS a resource must know its forecasted electrical demand several months in advance Because seawater desalination plant operations are driven by contracted demand for water it is likely that a plant operator would have a good idea of the plantrsquos electrical demand days or even weeksmonths in advance especially for summer months when demand is likely to be relatively steady An important consideration however is the salinity of the water which drives the electrical requirements and which can be impacted by recent weather events Similarly reductions in demand for water during non-summer months or wet summer days where demand may be reduced could also impact a plantrsquos ability to predict its electricity demand
Finally a seawater desalination plant must have sufficient flexibility in its day-to-day operations so that it can afford to lose several hours of production when deployed for demand response It should be noted that demand-side resources participating in RRS and ERS are called infrequently demand-side resources providing responsive reserves were deployed one time in 2015 and ERS was not deployed that year However this is an important factor to consider if a plant is operating at close to full capacity and would incur financial penalties if it fails to meet its contract obligations due to a demand response event Including additional storage and building a plant with extra capacity could help to mitigate this risk It should also be noted that a plant operator does not need to commit the full plant capacity to these services but rather can specify an amount of MW that will be committed Thus a plant operator could mitigate issues both with predictability and flexibility of plant operations by committing only a portion of its predicted electrical demand to participate in demand response
Considering these factors together it appears that seawater desalination plants could be designed to meet the operational requirements for participation in ERCOTrsquos demand response services (both RRS and ERS) Because the ability to meet the requirements is dependent on the plant design demand response would need to be considered early in a projectrsquos development if participation is desirable Whether project developers will choose to address these requirements will depend on the economic benefits of participation in demand response which will be discussed in the next section
42 Economic Considerations for ERCOT-Dispatched Demand Response This section describes the economic benefits to demand-side resources from participation in ERCOT-dispatched demand response programs The average price paid for a demand-side resource participating in RRS in 2015 was $1087 per MW per hour and for ERS was $645 per MW per hour for the contract periods during the 2015 program year These payments could provide a significant financial benefit to seawater desalination plants To give a simplified example for a plant with an electrical demand of 10 MW operating at a 100 annual load factor (10 MW times 24 hours times 365 days) the annual benefit would be on the order of $500000 for ERS or $1 million for RRS
copy 2016 ERCOT All rights reserved 8
Study on the Demand Response Potential for Seawater Desalination Projects ERCOT Public
In 2015 demand-side resources providing responsive reserves were deployed one time for a duration of 10 minutes and ERS was not deployed12 The most ERS was ever deployed in a single year was two times in 2011 Thus participation in either program could result in a substantial payment to a seawater desalination plant with a relatively low risk of deployment and associated disruption of plant operations although it is important to note that participation in either ERCOT service subjects demand response resources to annual unannounced testing Other than testing the frequency of deployment will depend on grid conditions and is a risk that should be considered
The financial benefits of participation must be weighed against the costs of designing facilities with the capabilities to operate in this manner These include
bull The costs to design the plant to reduce electrical demand within the required timeframes for demand response and to withstand an instantaneous interruption if not already part of the plant design For example a plant may need to be designed to have backup power generation on-site In addition there could also be costs to restart the system after an interruption
bull The costs to build a plant with excess capacity andor storage to make up for lost production hours when demand response is deployed This will add to the total capital costs of the project Land area constraints should also be considered when considering additional storage as the space requirements for the necessary storage capacity could be significant
bull Costs associated with the impact of interruptions on plant processes (eg more frequent replacement of membranes impacts to pretreatment system or plant infrastructure)
bull Potential financial penalties that would be incurred if deployment as part of demand response were to result in failure to meet contract obligations to supply water
bull The loss of potential benefits in the form of cost avoidance from participation in non-ERCOTshydispatched demand response opportunities (see Section 43) If a plant is committed to RRS or ERS the plant operator would lose the flexibility to take advantage of these other opportunities to reduce their electricity costs
The interplay of these benefits and costs will determine whether it would be beneficial for a future seawater desalination plant to participate in demand response in ERCOT
43 Considerations for Non-ERCOT-Dispatched Demand Response Outside of the reliability-based services administered by ERCOT there are other opportunities for seawater desalination plants to reduce their electricity costs As described in Section 321 seawater desalination plants may be able to reduce the demand charges on their electricity bills through curtailing load during 4CP intervals In addition plant operators may adjust operations in response to real-time electricity prices to take advantage of lower off-peak prices and avoid price spikes (see Sections 322 and 323) All of these opportunities require that the plant have flexibility to reduce production during certain times of the day
In the ERCOT region as noted above a portion of transmission and distribution charges are set based on the peak systemwide 15-minute interval of the four summer months (June through September) referred to as the four coincident peaks (4CP) Large customers can reduce or avoid this charge by reducing electrical consumption during these four peak intervals AEP Central Texas and CenterPoint are the transmission providers covering the majority of the Gulf Coast in Texas13
12 ERCOT June 2016 ldquoLoad Resource Deployment Updaterdquo Available at httpwwwercotcomcontentwcmkey_documents_lists870985_RRS_Load_Resource_Deployment_Updatepdf 13 It is also possible that a seawater desalination plant could be located in an area that as not opted in to competition in which case the plant owner would need to negotiate its electricity charges bilaterally with the Non Opt-In Entity (NOIE)
copy 2016 ERCOT All rights reserved 9
Study on the Demand Response Potential for Seawater Desalination Projects ERCOT Public
Assuming a future seawater desalination plant would be connected at transmission-level voltages the relevant 4CP charges based on the 2016 tariffs accounting for both transmission charges and transmission cost recovery factors would be $41425 per 4CP kW for AEP Central Texas and $41870 per 4CP kVA for CenterPoint14 If a seawater desalination plant has 10 MW of load and is capable of interrupting all of it and successfully does so for all four 4CP intervals the savings based on the 2016 tariffs would be approximately $500000 per year ($41425 times 1000 (kW to MW) times 10 MW times 12 months) Thus a seawater desalination plant that reduces its electricity use during the 4CP intervals could avert some or all of these charges
Another opportunity for seawater desalination plants to reduce their electricity costs is through adjusting operations in response to real-time electricity prices In 2015 the average electricity price in ERCOT was $2677MWh However prices exceeded $50MWh in 254 hours (3 of all hours) $100MWh in 88 hours (1) $200MWh in 40 hours (05) and $300MWh in 21 hours (02) Prices exceeded $3000MWh for 021 hours15 Depending on the desalination plantrsquos exposure to real-time wholesale market prices (via its retail contract) the degree of high prices the plant owner is willing to avoid and grid conditions in a given year reducing unit operations in order to avoid high electricity prices could impact operators for anywhere between a few and several hundred hours out of the year In addition a plant can plan its operations to take advantage of lower electricity prices during off-peak periods (eg at night when generation from wind is high) For example at least one company is marketing a modular desalination unit design intended to take advantage of low prices during periods of high renewables generation and to provide grid reliability services through demand response16
There are several factors to consider regarding these opportunities to reduce electricity costs The plant would need to monitor the ERCOT market or hire a contractor to do so in order to know when to reduce demand for electricity These programs do not impose any requirements on response time as with RRS or ERS and there may be sufficient warning of 4CP intervals or peak pricing to allow the plant operator to plan its operations earlier in the day with sufficient time to ramp down production under controlled conditions However quicker ramping capability may be desirable to respond to electricity price fluctuations
For 4CP because the four intervals used to set demand charges are not known ahead of time it is likely that the plant would need to reduce its demand multiple times per summer to ensure the 4CP intervals are hit impacting production at the facility Timing operations to coincide with off-peak pricing or to avoid price spikes would similarly result in reduced operations during certain hours To offset the lost production hours the plant may need to be designed with extra capacity and water storage capability to maintain the ability to meet its contractual obligations for freshwater delivery Because the period of reduced operations is greater than with ERCOT-dispatched demand response services this need would be greater for a seawater desalination plant reducing load during 4CP intervals or in response to real-time electricity prices and would increase the capital costs of the project It should also be noted that high prices in the ERCOT Region typically but not always occur in summer months when drought conditions are more likely to develop and demand for desalinated water is likely to be highest This may limit the flexibility of the plant to time its electricity consumption to avoid high-priced hours
14 Public Utility Commission of Texas ldquoTransmission and Distribution Rates for Investor Owned Utilitiesrdquo Available at httpwwwpuctexasgovindustryelectricratestdraspx 15 Potomac Economics June 2016 2015 State of the Market Report for the ERCOT Wholesale Electricity Markets Available at httpswwwpotomaceconomicscomindexphpmarkets_monitoredERCOT 16 Sisyan LLC ldquoDemand Response Desalinationrdquo Available at httprenewabledesalinationcomwpshycontentuploads201506Demand-Response-Desalinationpdf
copy 2016 ERCOT All rights reserved 10
Study on the Demand Response Potential for Seawater Desalination Projects ERCOT Public
In addition the plantrsquos ability to participate in demand response would also be limited for those hours it is reducing load as part of 4CP response or in response to real-time prices because the plant would not be able to reduce its electricity consumption if that demand is already committed to another demand response service Thus participating in demand response versus taking advantage of these other opportunities may be to some extent mutually exclusive
5 Conclusion
Based on this analysis it appears that the operational characteristics of seawater desalination plants would allow them to participate in demand response opportunities in ERCOT so long as the necessary operational requirements are considered in the design specifications of the plant Project developers should consider the necessary requirements early in the plant design Whether the economic benefits of participation would provide a sufficient incentive for them to do so will depend on the costs of accommodating those operational requirements and whether there is the flexibility available to operate the plant as necessary under these programs Though most existing seawater desalination plants do not participate in demand response programs it does appear that participation by these plants is possible and could result in a financial benefit Table 2 compares the different demand response opportunities available to demand-side resources in ERCOT
Table 2 Comparison of Demand Response Opportunities Demand Response
Opportunity Requirements for
Participation Impacts to Plant
Operations Financial Benefit Ancillary Services ndash Responsive Reserve Service (RRS)
bull Under-Frequency Relay bull Instantaneous or 10 minute
response time bull Recover load within 3
hours bull Bid in day-ahead market
bull Deployed once in 2015 for 10 minutes bull Subject to annual
unannounced testing
bull $1087 per MW per hour (based on 2015 prices)
Emergency Response Service (ERS)
bull 10 or 30 minute response time bull Recover load within 10
hours bull Four-month contract term
bull Not deployed in 2015 the most times ever deployed in a single year was twice in 2011 bull Subject to annual
unannounced testing
bull $645 per MW per hour (based on 2015 prices)
Four Coincident bull Interval Data Recorder bull Likely plant will need to bull Avoid ~$48000 per 4CP Peak (4CP) (IDR) meter
bull Ability to predict system-wide peak demand hours during summer months
reduce load multiple times per summer to hit 4CP intervals bull Likely to be able to predict
possible 4CP intervals earlier in day
MW per year (based on 2016 tariffs) if successful in reducing during all four summer months
LSE or DR Provider Contracted Price Response
bull Varies based on contractual arrangements
bull Varies based on contractual arrangements
bull Varies based on contractual arrangements
Self-Directed Price bull Retail contract with bull Varies depending on bull Varies depending on Response exposure to real-time
market prices bull Ability to monitor real-time
prices in ERCOT wholesale market
number and severity of pricing events bull May be able to predict
peak pricing events earlier in day
number and severity of pricing events
copy 2016 ERCOT All rights reserved 11
Study on the Demand Response Potential for Seawater Desalination Projects ERCOT Public
Demand response programs in ERCOT provide opportunities for demand-side resources to defray their electricity costs and provide reliability benefits to the ERCOT electric grid Because the process of seawater desalination is energy intensive participation in demand response could help to reduce electricity costs while posing a relatively low risk to plant operations if demand response participation is factored into plant design
Participation in non-ERCOT-dispatched demand response opportunities such as reducing load during 4CP intervals or in response to real-time electricity prices may also help to reduce electricity costs for seawater desalination plants in Texas As stakeholders in Texas continue to plan for possible future droughts in the region and identify water management strategies consideration of demand response could play a role in mitigating some costs associated with seawater desalination and allow seawater desalination plants to assist with maintaining electric reliability in the region
copy 2016 ERCOT All rights reserved 12
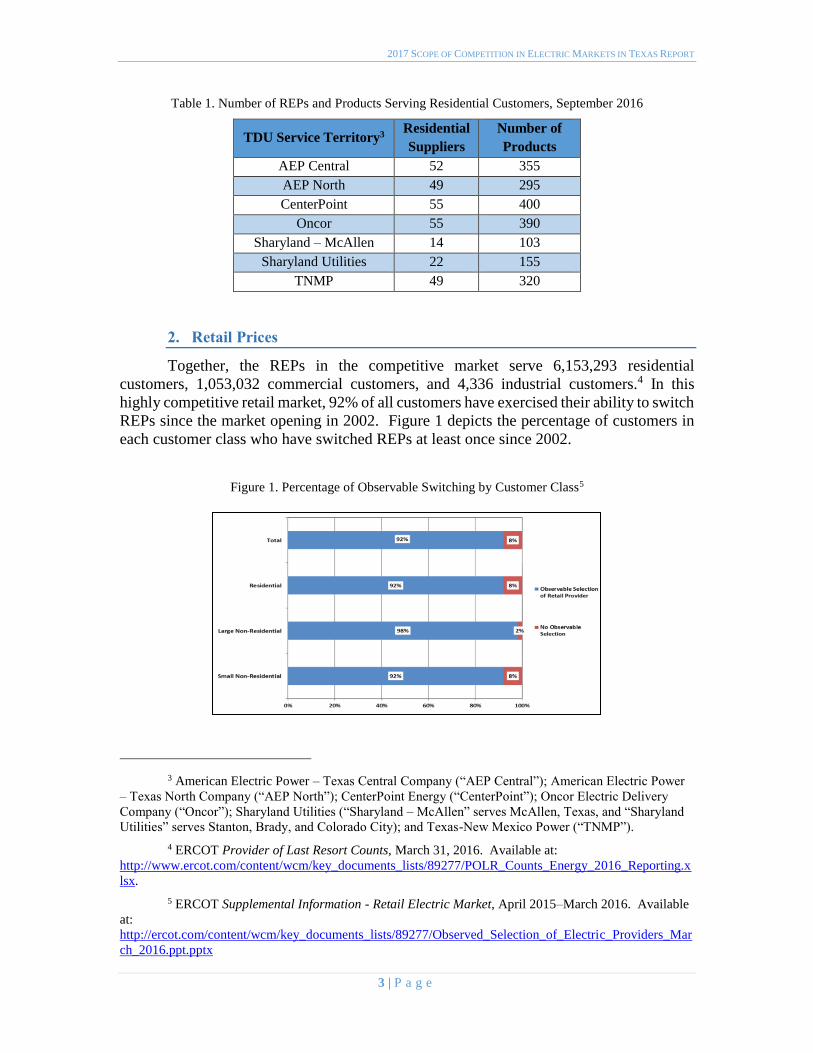
2017 SCOPE OF COMPETITION IN ELECTRIC MARKETS IN TEXAS REPORT
Table 1 Number of REPs and Products Serving Residential Customers September 2016
TDU Service Territory3 Residential
Suppliers
Number of
Products
AEP Central 52 355
AEP North 49 295
CenterPoint 55 400
Oncor 55 390
Sharyland ndash McAllen 14 103
Sharyland Utilities 22 155
TNMP 49 320
2 Retail Prices
Together the REPs in the competitive market serve 6153293 residential
customers 1053032 commercial customers and 4336 industrial customers4 In this
highly competitive retail market 92 of all customers have exercised their ability to switch
REPs since the market opening in 2002 Figure 1 depicts the percentage of customers in
each customer class who have switched REPs at least once since 2002
Figure 1 Percentage of Observable Switching by Customer Class5
3 American Electric Power ndash Texas Central Company (ldquoAEP Centralrdquo) American Electric Power ndash Texas North Company (ldquoAEP Northrdquo) CenterPoint Energy (ldquoCenterPointrdquo) Oncor Electric Delivery Company (ldquoOncorrdquo) Sharyland Utilities (ldquoSharyland ndash McAllenrdquo serves McAllen Texas and ldquoSharyland Utilitiesrdquo serves Stanton Brady and Colorado City) and Texas-New Mexico Power (ldquoTNMPrdquo)
4 ERCOT Provider of Last Resort Counts March 31 2016 Available at
httpwwwercotcomcontentwcmkey_documents_lists89277POLR_Counts_Energy_2016_Reportingx
lsx
5 ERCOT Supplemental Information - Retail Electric Market April 2015ndashMarch 2016 Available
at
httpercotcomcontentwcmkey_documents_lists89277Observed_Selection_of_Electric_Providers_Mar
ch_2016pptpptx
3 | P a g e
2017 SCOPE OF COMPETITION IN ELECTRIC MARKETS IN TEXAS REPORT
The success of the competitive market is highlighted in Table 2 which compares
the last regulated retail rate with the current lowest 12-month fixed retail offering per 1000
kWh in each region adjusted for inflation Since 2001 average retail rates across Texas
have decreased 63 percent
Table 2 Inflation-Adjusted Comparison of Residential Regulated and Competitive Rates
TDU Service
Territory6
Last Regulated
Rate (2001)
centkWh7
Last Regulated
Rate Adjusted for
Inflation
Current
Lowest Fixed
Price8
Percentage
Change
AEP Central 96 131 56 ndash5725
AEP North 100 136 50 ndash6324
CenterPoint 104 141 54 ndash617
Oncor 97 132 45 ndash6591
TNMP 106 144 50 ndash6528
The average lowest available residential price across the competitive market was
51 cents per kilowatt-hour (kWh) in September 2016 and the average across all plans
available in the competitive market in Texas was 98 cents per kWh 9 Moreover rates in
ERCOT have not only decreased since Texasrsquo transition to the competitive market but both fixed and variable rates have continued to be much lower than nationwide averages
of 1345 cents per kWh in July 2016 and 1362 cents per kWh in July 201510
Table 3 compares the current lowest fixed price available for residential service in
each TDU service territory with the average price of plans available and the nationwide
average excluding Texas
6 Sharyland Utilities was formed shortly before the market opening to serve part of McAllen
Texas it is not included in this table because of its limited number of customers at that time In Docket No
21591 Sharyland Utilities committed that its average bundled residential rates would not exceed those of
Central Power amp Light Company (now AEP Central)
7 Association of Electric Companies of Texas Available at httpwwwaectnetinside-the-charts-
prices-available-in-the-competitive-market-today-well-below-the-last-regulated-rate
8 The current lowest fixed price available for a residential plan in each TDU service territory as of
September 2016 for a 12-month plan without time-of-use features prepaid features or a minimum usage
fee for a fixed month-to-month rate for a customer who expects to consume approximately 1000 kWh of
electricity a month Available at wwwpowertochooseorg
9 This average is for a residential customer expecting to consume approximately 1000 kWh of
electricity each month Available at wwwpowertochooseorg
10 The nationwide average is for July 2016 and includes all US states except Texas Source US
Energy Information Administration Average Retail Price of Electricity Electricity Data Browser July
2016 Available at httpwwweiagovelectricitydatacfm
4 | P a g e
2017 SCOPE OF COMPETITION IN ELECTRIC MARKETS IN TEXAS REPORT
Table 3 Current Lowest and Average Residential Plans by TDU Service Territory
TDU Service
Territory
Current Lowest
Fixed Price
(centkWh)11
Current Average
All Available
Plans12
Nationwide
Average13
AEP Central 56 94
1345
AEP North 50 94
CenterPoint 54 91
Oncor 45 83
Sharyland ndash McAllen 56 98
Sharyland Utilities 45 133
TNMP 50 92
3 Customer Complaints
The Commissionrsquos rules permit a customer to file a complaint with the Commission
about their electric service The Commissionrsquos staff works with the customer and electric service provider to resolve the complaints first in an informal complaint process and then
directs the customer to a formal complaint process if the customer is dissatisfied with the
resolution The Commission keeps records of these complaints and evaluates the
complaint statistics as a barometer for analyzing company behavior and its effect on
customers The Commission uses the data to identify any company-specific trends work
with companies to address any issues or otherwise take enforcement action
From September 1 2014 to August 31 2016 the average number of days to resolve
a utility complaint was 18 days The slight decline in the number of electric complaints
received in 2015 through 2016 may be attributed to the mild winter weather which resulted
in lower overall prices as well as the absence of significant disruptions to electric service
Figure 2 shows the total complaints received from September 1 2014 to August 31 2016
11 The current lowest fixed price available for a residential plan in each TDU service territory as of
September 2016 for a 12-month plan without time-of-use features prepaid features or a minimum usage
fee for a fixed month-to-month rate for a customer who expects to consume approximately 1000 kWh of
electricity a month Source wwwpowertochooseorg
12 The average is for a residential customer expecting to consume approximately 1000 kWh of
electricity a month Source wwwpowertochooseorg
13 The nationwide average is for July 2016 and includes all US states except Texas Source US
Energy Information Administration Average Retail Price of Electricity Electricity Data Browser July
2016 Available at httpwwweiagovelectricitydatacfm
5 | P a g e
2017 SCOPE OF COMPETITION IN ELECTRIC MARKETS IN TEXAS REPORT
Figure 2 Total Electric Complaints Received September 2014 ndash August 2016
From September 1 2014 to August 31 2016 the Commission received 4465
electric complaints Billing complaints continue to be the greatest cause of customer
complaints with 42 of all electric complaints concerning billing issues Complaints
relating to the provision of service including customer service and the refusal of service
were the second highest cause of complaints at 15 Quality of service contributed to the
third-leading cause of complaints at 12 Complaints are broken down by category in
Figure 3
6 | P a g e
2017 SCOPE OF COMPETITION IN ELECTRIC MARKETS IN TEXAS REPORT
Figure 3 Electric Complaints Received by Category September 2014 ndash August 2016 14
4 Energy-Efficiency Programs
Energy-efficiency programs in Texas are administered by the TDUs in ERCOT and
the vertically integrated utilities outside of ERCOT pursuant to the Public Utility
Regulatory Act (PURA) sect39905 The utilities recover the cost of the energy-efficiency
programs through a surcharge on electric bills which are adjusted and approved annually
by the Commission Under the energy-efficiency programs TDUs reduced 559369 MWh
of electricity consumption in 2015 exceeding the goal for the year by 40 The energy-
efficiency programs are designed to reduce customersrsquo energy consumption as well as
electric peak demand In 2011 SB 1125 increased the peak demand goal reduction to a
30 growth in demand Once a utility reaches this goal the utility must achieve a
reduction of four-tenths of one percent of the utilityrsquos summer weather-adjusted peak
demand in subsequent years
The 2011 legislation also required that the Commission develop an evaluation
measurement and verification (EMampV) framework to promote effective program design
to provide consistent and streamlined reporting and to retain a third-party contractor to
conduct these activities EMampV efforts for the 2015 program year focused on evaluating
targeted programs for which the associated peak demand and energy savings were most
uncertain A primary component of EMampV is the statewide Technical Reference Manual
(TRM) a single common reference document prepared and maintained by the EMampV
contractor to estimate energy and peak demand savings resulting from the installation of
14 ldquoCrammingrdquo is the practice of adding unauthorized charges for any services to an electric bill without verified consent by the customer ldquoSlammingrdquo is the practice of switching the customer to another provider without authorization
7 | P a g e
2017 SCOPE OF COMPETITION IN ELECTRIC MARKETS IN TEXAS REPORT
energy efficiency measures sponsored by utility-administered programs in Texas In 2015
changes made to the TRM added and updated existing deemed savings values and added
standardized EMampV protocols for determining and verifying energy and demand savings
effective for the 2016 program year Verified demand and energy savings and program
costs for 2015 are shown in Table 4
Table 4 2015 Verified Energy Efficiency Savings15
MW MWh MW MWh
El Paso Electric 1231 22283 1116 19552 $4039278
Entergy Texas 1809 39688 1550 27156 $7023009
SPS 817 14537 549 9627 $3190744
SWEPCO 988 15262 560 9811 $3220359
Non-ERCOT Total 4844 91770 3775 66146 $17473390
AEP Central 4378 68482 1293 22653 $13261480
AEP North 454 12289 426 7464 $2727260
CenterPoint 16849 188255 5883 103069 $35832993
Oncor 11581 178908 6940 121589 $47438836
Sharyland 060 2528 100 1752 $633252
TNMP 866 17452 5770 10109 $4011627
ERCOT Total 34188 467915 15219 266636 $103905448
Grand Total 39033 559685 18994 332782 $121378838
Excludes Statewide EMampV contractor expenses of approximately $3M for review of prior program year
GoalProgram CostUtility
Verified Savings
In 2015 the utilities cumulatively achieved 206 of the demand reduction goal
(226 for utilities in ERCOT) and 168 of the energy reduction goal (175 for utilities
in ERCOT)
5 Customer Education Activities
The Commission engages with residential and small commercial electric customers
about retail electric competition through its ldquoTexas Electric Choicerdquo campaign and also informs customers about energy conservation opportunities through its ldquoPower to Save Texasrdquo campaign In addition to engaging with customers through these two campaigns
Commission staff also respond to customer inquiries and distribute literature about
electricity facts and issues
15 The non-ERCOT utilities within the state of Texas are El Paso Electric Company (ldquoEl Paso Electricrdquo) Entergy Texas Inc (ldquoEntergy Texasrdquo) Southwestern Public Service Company (ldquoSPSrdquo) and Southwestern Electric Power Company (ldquoSWEPCOrdquo)
8 | P a g e
2017 SCOPE OF COMPETITION IN ELECTRIC MARKETS IN TEXAS REPORT
a ldquoPower to Chooserdquo
The Commission educates customers about the evolving marketplace continuing
its ldquoTexas Electric Choicerdquo campaign which began in February 2001 with the goal of educating Texans about the changes and choices in the retail electric market The
PowerToChooseorg website and its Spanish-language counterpart PoderDeEscogerorg
provides a simple one-stop shop portal for Texans who live in a service territory open to
customer choice to enter in their zip code and browse through the numerous plans offered
by the REPs
b ldquoPower to Save Texasrdquo
In addition to the ldquoTexas Electric Choicerdquo campaign and the PowerToChoose website the Commission has also continued its statewide initiative ldquoPower to Save
Texasrdquo together with its parallel Spanish-language initiative ldquoPoder de Ahorrarrdquo which educates Texans about conserving energy during the summer peak times of 3 pm to 7
pm when the demand for electricity tends to be the highest The PowerToSaveTexasorg
website and its Spanish-language counterpart PoderDeAhorrarTexasorg provide Texans
with energy saving tips for homes and businesses
As part of the Power to Save Texas campaign the Commission contracted with
Resource Action Programs (RAP) to develop and implement a middle school energy
conservation outreach program in Hidalgo Harris Dallas and Tarrant counties In the
2015 ndash 2016 school year the program provided an effective energy education program
which strongly supports the Texas Essential Knowledge and Skills (TEKS) curriculum
standards as well as engages students through school challenges and at-home activities
c Campaign Outreach
PowerToChooseorg and its Spanish-language counterpart PoderDeEscogerorg
have proven valuable in educating customers about customer choice in the electricity
market The Commission conducted a number of activities to further promote the statersquos official electric choice website through social media community events trade shows and
expos From September 1 2015 through August 31 2016 nearly a million potential
customers visited the PowerToChooseorg and PoderDeEscogerorg websites Website
statistics are contained in Table 5
Table 5 Website Statistics September 2015 ndash August 2016
PowerToChoosecom Unique Visitors 980473
PoderDeEscogercom Unique Visitors 4652
d Low-IncomeElderly Outreach and Collaboration with Faith- and
Community-Based Organizations
Throughout 2015 and 2016 the Commissionrsquos staff also worked with legislative
offices and faith- and community-based organizations to provide educational materials and
training to help their constituents better understand the deregulated electric market and the
9 | P a g e
2017 SCOPE OF COMPETITION IN ELECTRIC MARKETS IN TEXAS REPORT
Commissionrsquos websites The Commission has actively participated with the Interagency
Coordinating Group (ICG) which was established by the Texas Legislature to expand and
improve relationships between state government and faith- and community-based
organizations Information on customer assistance programs such as LITE-UP Texas was
provided to community organizations such as Legal Aid of Northwest Texas senior
activity centers and religious groups
e Call Center
The Commission has trained its Customer Protection Division staff who are fluent
in both English and Spanish to answer customer calls and to assemble and mail
informational packets comparing electric plans when requested by customers without
Internet access From September 2015 to August 2016 the Customer Protection Division
staff handled 7663 calls from customers requesting assistance with shopping
f Educational Literature
In addition to the educational materials on the Commissionrsquos website the Commission provides brochures fact sheets and other educational materials by mail and
e-mail through a network of community organizations and events and in response to
customer requests to the call center Up-to-date fact sheets are available on the
Commissionrsquos website PowertoChooseorg and PoderDeEscogerorg as part of the
campaignrsquos outreach efforts The fact sheets provide information on a number of current
industry and consumer topics
Throughout 2015 and 2016 campaign educational materials promoting the
agencyrsquos programs including Power to Choose and Power to Save Texas were distributed
at numerous community events and civic town hall events such as Hurst-Euless-Bedford
ldquoBack 2 Schoolrdquo day Dickenson Housing Family Fair Energy Day DFW Family Fair
Earth Day Texas Texas Home and Garden shows in Houston Texas Black Expo National
Night Out events and minor league baseball games
Wholesale Market Development
The Commission engages regularly with ERCOT to oversee market developments
and ensure system supply reliability security and improved price formation and market
outcomes Market design changes made as a result of this working relationship have
created new opportunities for a variety of generation resources to enter the market and
supported the formation of wholesale prices that reflect real-time market conditions more
accurately and therefore improve the efficiency of the market
1 Wholesale Market Prices
Wholesale market prices have fallen in comparison to prices seen in the 2012 ndash 2014 period The ERCOT load-weighted real-time average price of energy in 2015 was
$2677 per Megawatt-hour (MWh) a 34 decrease from the average price in 2014 and a
decrease of 21 from the average seen in 2013
10 | P a g e
2017 SCOPE OF COMPETITION IN ELECTRIC MARKETS IN TEXAS REPORT
Falling wholesale prices are correlated with the current trend of lower natural gas
prices the primary fuel of many of the regionrsquos power plants The average Houston Ship Channel spot price for natural gas was 41 lower in 2015 than in 2014 decreasing from
$437MMBtu in 2014 to $258 in 2015 Through March the average price for 2016 has
fallen to $192MMBtu Natural gas price trends from September 2014 through August
2016 are shown in Figure 4
Figure 4 Monthly Average Natural Gas Prices September 2014 ndash August 2016
Monthly average wholesale electricity prices are shown in Figure 5 Load-
weighted prices are calculated by dividing the price at a load zone by the associated
demand This metric provides a useful proxy for the actual wholesale prices paid by load16
16 It is worth noting that most power in ERCOT is sold through various bilateral arrangements that
are designed to hedge daily real-time market price risk
11 | P a g e
2017 SCOPE OF COMPETITION IN ELECTRIC MARKETS IN TEXAS REPORT
Figure 5 Load-Weighted Average Real-Time Monthly Settlement Point Prices September 2014 ndash August 2016
Another component of the real-time price of electricity is the cost of transmission
congestion Transmission congestion occurs when there is insufficient transmission
capacity to dispatch energy in a least-cost fashion The recent build-out of additional
transmission lines in areas of high congestion has partially relieved the cost burden in these
areas particularly in West Texas where oil and gas production growth rapidly increased
the demand for electricity resulting in relatively higher zonal prices
2 Peak Demand
After the very high peak demand levels during the hot summer of 2011 peak
demand in ERCOT was lower in 2012 through 2014 In 2015 peak demand again
increased though not to 2011 levels with load exceeding 60000 MW for 330 hours and
exceeding 65000 MW for 91 hours as shown in Figure 6 below In 2016 ERCOT
experienced a record week in August which saw the previous record peak demand broken
six times and the ERCOT region hit its all-time peak demand of 71093 MW on August
11 2016
As peak demand has increased the recorded availability of generation supply in the
region during times of high load has decreased slightly Physical Responsive Capability
(PRC) analogous to the amount of reserves available on the system at any given time fell
below 3000 MW for 269 hours in 2015 up slightly from 213 hours in 2014 and 215
hours in 2013 but well below the 371 hours recorded during the 2011 summer
12 | P a g e
2017 SCOPE OF COMPETITION IN ELECTRIC MARKETS IN TEXAS REPORT
Figure 6 High Load Hours in ERCOT 2011 ndash 2016
As shown in Table 6 the ERCOT system peak demand was 69877 MW in 2015
up 5 from the 2014 peak and the 2016 ERCOT system peak demand increased 174
from the peak demand of the previous year
Table 6 ERCOT Peak Demand 2012 ndash 2016
Year
ERCOT Peak
Demand (MW)
Percentage Change
from Prior Year
2012 66548 ndash 2013 67245 105
2014 66454 ndash118
2015 69877 515
2016 71093 174
Figure 7 shows the hourly peak load for each month in ERCOT from January 2014 to
August 2016
13 | P a g e
2017 SCOPE OF COMPETITION IN ELECTRIC MARKETS IN TEXAS REPORT
Figure 7 Monthly Peak Demand in ERCOT January 2014 ndash August 2016
3 Generation Diversity
As electricity consumption has increased in ERCOT the diversity of the systemrsquos generation portfolio has also increased Generators participating in the statersquos renewable energy credit (REC) trading program reported an 11 increase in renewable generation
from 2013 to 2015 rising from 376 million MWh to 469 million MWh with wind
representing 96 of the total renewable mix Landfill gas was the second most prevalent
renewable source representing approximately 12 of all renewable generation in 2015
Energy produced from wind generation was up by 13 in 2015 from 2013 and solar
energy capacity more than doubled from 121 MW in 2013 to 288 MW in 2015 Coal-fired
generation has been steadily shrinking as a proportion of total generation declining from
37 of electricity produced in 2014 to 28 in 2015 Energy use in the ERCOT region by
fuel type for 2015 is shown in Figure 8
14 | P a g e
2017 SCOPE OF COMPETITION IN ELECTRIC MARKETS IN TEXAS REPORT
Figure 8 Energy Use in ERCOT by Resource Type 2015
The Commissionrsquos projects are further described in the following section of this report
15 | P a g e
2017 SCOPE OF COMPETITION IN ELECTRIC MARKETS IN TEXAS REPORT
III SUMMARY OF COMMISSION ACTIVITIES FROM 2015 TO 2016
Introduction
The Commission develops and modifies rules policies and procedures for the
competitive electric market in Texas in response to the technological advances in the
industry and the evolving needs of customers The Commission also continues to carry
out oversight of programs with which the Legislature has tasked it ndash such as energy
efficiency renewable energy and advanced metering infrastructure Within the
ERCOT region the monopoly wires-and-poles companies that provide transmission
and distribution services throughout the grid remain subject to traditional rate
regulation by the Commission The Commission continues to set rates for these
utilities as they are not subject to the forces of market competition This section
provides an overview of the Commissionrsquos activities in its oversight of the wholesale and retail electric markets as well as its governance over regulated electric utilities
Resource Adequacy
Resource adequacy is the long-term ability of the system to serve demand reliably
when consumption is highest given the available installed capacity load resources and
the operational reliability of the system Assessing resource adequacy requires comparing
the systemrsquos forecast installed capacity and load resources against the forecast peak
summer load The difference between the forecast of available generation and load
resources and the forecasted demand for electricity is referred to as an ldquoinstalled capacity
reserve marginrdquo which is an indicator of the ability of the system to meet customer demand
during peak conditions In addition to evaluating the forecast reserve margin assessing
resource adequacy includes evaluating the systemrsquos operational reliability The systemrsquos operational reliability depends on the ability of generators to manage plant operations
successfully as well as the grid operatorrsquos ability to manage the system to avoid or to mitigate load curtailment During 2015 and 2016 the ERCOT system performed well with
respect to resource adequacy The Commission has devoted significant attention to
ensuring that ERCOT maintains an adequate installed capacity reserve margin and a high
level of operational reliability developing a wholesale market design that allows
consumers to continue to receive low-cost and reliable electricity over the long term
1 Capacity Demand and Reserves Report
The Capacity Demand and Reserves (CDR) Report published by ERCOT semi-
annually is a snapshot estimate of long-term supply and demand and the associated annual
reserve margin for peak summer and winter conditions While the CDR Report is not a
forecast of any particular outcome it provides insight into possible resource adequacy
trends
16 | P a g e
2017 SCOPE OF COMPETITION IN ELECTRIC MARKETS IN TEXAS REPORT
The May 2016 CDR Report shows estimated reserve margins well above the
current target reserve margin of 1375 Installed capacity reserve margin estimates taken
from this CDR Report are shown below in Table 7
Table 7 May 2016 Capacity Demand and Reserves Report Forecast
Forecast 2017 2018 2019 2020 2021 2022 2023 2024 2025 2026
Peak Load
(MW)
68548 69409 70795 71420 72098 72792 73482 74168 74864 75704
Total
Capacity
(MW)
80995 87019 87238 87407 87678 87738 87738 87728 87728 87728
Reserve
Margin
182 254 232 224 216 205 194 183 172 159
2 Operating Reserve Demand Curve
In ERCOT the price signals produced by the energy-only wholesale electric market
should provide incentives to promote short-term reliability as well as induce optimal long-
run investment in new resources If the prices are efficient and reflect the full cost of
dispatching resources to meet demand the benefits that accrue to both consumers and
producers can be maximized at the least cost and new generating capacity (or load
resources) should develop to maintain the equilibrium as old resources retire or demand
increases
The Operating Reserve Demand Curve (ORDC) implemented at the Commissionrsquos direction in June 2014 improves price formation by allowing prices to more fully reflect
the value of operating reserves The ORDC assigns an economic value to operating
reserves or the amount of extra capacity available to maintain system reliability on a daily
basis
As part of its ongoing review of resource adequacy in ERCOT the Commission is
currently evaluating the accuracy of the inputs to the ORDC to ensure that its contribution
to price formation appropriately reflects the costs of meeting demand and the underlying
needs of the system
3 Transmission Congestion
Although competitive power producers and regulated transmission providers form
two distinct segments of the market transmission buildout has a direct effect on wholesale
power prices When there is insufficient transmission capacity to dispatch energy in a least-
cost fashion the system operator takes action to ensure that the physical limits of the
transmission system facilities are not violated The re-dispatch of generation because of
transmission limits results in disparate prices at different locations on the system In
comparison to prior years transmission congestion in ERCOT has lessened because of the
large increase in transmission investment and the reduction of high demand related to oil
and gas production in West Texas ERCOT and the Commission continually evaluate the
need for cost-effective additional transmission investment to manage congestion
17 | P a g e
2017 SCOPE OF COMPETITION IN ELECTRIC MARKETS IN TEXAS REPORT
4 Wholesale Market Design Initiatives
While the ERCOT wholesale market has been successful in attracting new resource
investment and also maintaining competitive prices for consumers certain improvements
to the market design could yield additional benefits in terms of efficient price formation
and opportunities for entry of new technology Initiatives already in place in many other
regions such as real-time co-optimization and multi-interval real-time resource dispatch
may allow existing capacity to be used more effectively and create opportunities for the
integration of additional load resources to serve electric demand The Commission
continues to work with ERCOT and interested stakeholders to determine the value of
implementing such enhancements particularly as ERCOTrsquos resource mix changes over time
5 Reliability Standard
In early 2014 the Commission opened a project to review its use of a target installed
capacity reserve margin based on a reliability standard equivalent to one loss-of-load event
every ten years In this project the Commission received written comment from interested
parties conducted a public workshop consulted with independent experts and reviewed
the application of reliability standards in other regions As a result of this review future
reliability metrics to be estimated in ERCOT will include the market equilibrium reserve
margin the economically-optimal reserve margin and the associated levels of expected
unserved energy The Commission believes that publishing these metrics represents an
improvement over reporting a one-event-in-ten-years standard by enhancing insight into
expected outcomes in ERCOTrsquos energy-only market
Non-ERCOT Utilities Market Development Activities
SB 7 the law that introduced retail competition to the Texas market in 1999
granted the Commission authority to delay retail competition in an area where deregulation
would not result in fair competition and reliable service because of the lack of an
independent organization to coordinate the electric system and the concentration of
ownership in the generation sector in some of those areas Consequently SB 7 included
provisions recognizing the difficulty of implementing retail competition in areas outside of
ERCOT Therefore the utilities outside of the ERCOT region remain vertically integrated
owning generation transmission and distribution assets as well as selling power to end-
use customers These vertically integrated utilities remain subject to traditional regulation
including rates set by the Commission and customer choice is not offered in the service
territories of these utilities
The Commission does continue to monitor ongoing activities in the non-ERCOT
portions of the state In 2015 the Legislature granted the Commission the authority to
retain counsel and consulting experts in order to participate in legal proceedings at the
Federal Energy Regulatory Commission (FERC) which has regulatory jurisdiction over
wholesale power sales and transmission rates outside of ERCOT This authority has
18 | P a g e
2017 SCOPE OF COMPETITION IN ELECTRIC MARKETS IN TEXAS REPORT
permitted the Commission to participate more effectively in FERC proceedings affecting
Texasrsquo utilities located outside of ERCOT
1 Southwest Power Pool
The Southwest Power Pool (SPP) is the Regional Transmission Operator (RTO) for
areas of Northeast Texas and the Texas Panhandle In Texas the utilities Southwestern
Electric Power Company (SWEPCO) Southwestern Public Service (SPS) and several
electric cooperatives and municipally owned utilities are in SPP In addition to these areas
of Texas the SPP footprint includes parts of New Mexico Arkansas Missouri Nebraska
Louisiana and all of Kansas and Oklahoma In 2015 SPP became the RTO for the
Integrated System and neighboring areas which includes parts of Iowa Minnesota North
Dakota South Dakota Wyoming and Montana SPP has spent extensive time and
resources over the last two years to integrate these new areas successfully The expansion
added 5000 MW of peak demand 7600 MW of generating capacity and 9500 miles of
transmission lines17
In 2014 SPP launched its new Integrated Marketplace which provides a Day-
Ahead Market a Real-Time Balancing Market and Congestion Hedging Markets
mechanisms similar to those available in ERCOT The implementation of the Integrated
Marketplace resulted in a savings of $422 million in 2015 As a result of the Integrated
Marketplace SPPrsquos planning reserve margin will be reduced from 136 to 12 a change
expected to save about $90 million annually
Chairman Donna L Nelson represents the Commission as a voting member on
SPPrsquos Regional State Committee (RSC) The RSC provides collective state regulatory
agency input on a variety of issues In addition the RSC has authority over the cost
allocation methodologies for transmission upgrades allocation of Financial Transmission
Rights and the approach used for resource adequacy across the SPP region The RSC
regularly meets on a quarterly basis and meets more frequently if necessary
2 Midcontinent Independent System Operator
The Midcontinent Independent System Operator (MISO) is an RTO that serves all
or part of 15 states in the central US one Canadian province and the portion of eastern
Texas served by the vertically integrated utility Entergy Texas Inc MISO provides a Day
Two market which has a variety of functions and services including energy and ancillary
service markets economic dispatch congestion management financial transmission rights
and transmission planning The MISO Independent Market Monitor concluded that the
MISO wholesale markets were competitive in 2015
Like SPP MISO is in the Eastern Interconnection which crosses state boundaries
and is therefore subject to FERC jurisdiction A number of recent FERC proceedings have
17 2015 Southwest Power Pool Annual Report Available at
httpswwwspporgdocuments37800201520southwest20power20pool20annual20reportpdf
19 | P a g e
2017 SCOPE OF COMPETITION IN ELECTRIC MARKETS IN TEXAS REPORT
affected the portion of Texas that is in the MISO footprint The Commission through
outside counsel has been an active party in such FERC proceedings FERC Docket No
ER14-1174 addressed in part a dispute regarding the availability of transmission capacity
under the Joint Operating Agreement between MISO and the SPP Ultimately FERC
approved a settlement agreement under which MISO will compensate SPP and its members
for using their or other entitiesrsquo transmission systems
In a related pending docket at FERC Docket No ER14-1736 parties are addressing
how the cost of these payments will be allocated among MISO market participants Parties
in this proceeding are engaged in settlement discussions In addition in Docket No ER14-
75-000 FERC approved a settlement agreement among the participating Entergy
Operating Companies and their retail regulators to terminate the Entergy System
Agreement effective August 31 2016 The settlement terms prohibit any post-termination
payments that roughly equalize production costs among the operating companies after
December 31 2015 terminate certain specific cross-purchase power agreements between
Entergy Texas and former Entergy Gulf State Louisiana and permit the continuation of
several other purchase power agreements
Commissioner Kenneth W Anderson Jr represents the Commission as a voting
member in the Organization of MISO States (OMS) the purpose of which is to coordinate
regulatory oversight among the states in the MISO region and to make recommendations
to MISO FERC and other entities Commissioner Anderson also represents the
Commission as a voting member of the Entergy Regional State Committee (ERSC) which
has certain FERC-approved authority for five years after the Entergy integration with
regard to cost allocation for Entergy transmission projects and adding transmission projects
to the Entergy construction plan The ERSC meets quarterly
3 Western Electricity Coordinating Council
The Western Electricity Coordinating Council (WECC) is a Regional Entity whose
region includes the area surrounding El Paso and extends from Canada to Mexico
including the provinces of Alberta and British Columbia the northern portion of Baja
California and all or portions of the 14 Western states in between WECC is the Regional
Entity responsible for Bulk Electric System reliability in the Western Interconnection and
associated compliance monitoring and enforcement WECC does not have organized
markets outside of California but is organized into 38 separate balancing authorities
WECC is geographically the largest and most diverse of the eight Regional Entities in the
United States with delegated authority from the North American Electric Reliability
Corporation (NERC) and the Federal Energy Regulatory Commission In Texas El Paso
Electric Company is a member of WECC
Rulemaking Activities
The Commission has continued to adopt new rules and modify existing rules in
order to further the continued successful operation of the competitive retail and wholesale
markets and to comply with statutory changes made to PURA by the Legislature This
20 | P a g e
2017 SCOPE OF COMPETITION IN ELECTRIC MARKETS IN TEXAS REPORT
section of the Report provides a high-level overview of the Commissionrsquos key rulemaking
activities highlighting the market improvements made in 2015 and 2016
1 Cost Recovery and Rate Adjustment
The Commission adopted new rule 16 TAC sect25246 on June 29 2016 to
implement Section Nos 1 through 3 of House Bill 1535 of the 84th Legislature The new
rule only applies to a utility that operates solely outside of ERCOT and allows for the use
of an update period beyond the test year for which the utility initially files estimated
information The rule clarifies that all information originally estimated must be updated
with actual information and also provides requirements for a post-test-year adjustment for
a natural gas-fired plant A non-ERCOT utility also is required to initiate a new base rate
case on or before the four year anniversary of the final order in the utilityrsquos most recent comprehensive base rate case or if the commission determines that the utility has
materially earned more than its authorized rate of return in two consecutive years The rule
also provides requirements and procedures for the relation back of final rates to an effective
date 155 days after the filing of the rate application
2 Changes to Certificates of Convenience and Necessity and CREZ Rule
The Commission conducted a rulemaking to implement changes pursuant to
Legislative mandates in SB 776 SB 933 and HB 1535 of the 84th Legislature SB 776
required municipally owned utilities to apply for a certificate of convenience and necessity
(CCN) before constructing transmission facilities outside the boundaries of the
municipality that owns the municipally owned utility SB 933 also requires persons to
obtain a CCN before interconnecting a tie line into the ERCOT grid HB 1535 requires the
Commission to issue a final order within 181 days for a non-ERCOT utility requesting a
CCN for an existing electric generating facility and 366 days after a non-ERCOT utility
files a CCN for a newly constructed generating facility In addition the Commission also
determined in this rulemaking that all future transmission projects in a Competitive
Renewable Energy Zone (CREZ) must meet the need criteria of PURA sectsect 37056(c)(1)
and (2) rather than being exempt Finally the Commission determined that the CREZ
project established in 2008 was complete following the installation of a second circuit on
a Sharyland line
3 Use of Handheld Device for Enrollment
As the market evolves the Commission evaluates market changes balancing its
desire to encourage customer-focused innovation with its concern for customer protection
against potential abuses In Docket No 44518 the Commission granted a REP a
temporary 12-month waiver from its rules requiring the marketer to obtain telephonic
verification of the customerrsquos desire to switch REPs as well as a waiver from certain authorization disclosure requirements among other stipulations the Commission placed
upon the REP The Commission then opened Project No 45625 to study the issue of REPs
utilizing hand-held devices for customer enrollment more broadly and engage with market
representatives consumer representatives and other stakeholders The Commission
anticipates considering an amendment to its rules in the spring of 2017
21 | P a g e
2017 SCOPE OF COMPETITION IN ELECTRIC MARKETS IN TEXAS REPORT
4 Smart Meter Texas Portal
The electric utilities in Texas that have advanced metering systems (AMS) jointly
own and operate a single web portal known as Smart Meter Texas (SMT)18 SMT fulfills
two requirements imposed by the Commissionrsquos advanced metering rule on a utility with
AMS (1) provide to the retail customer the REP serving the customer and other entities
authorized by the customer access to such retail customerrsquos consumption data and (2)
allow devices at the customerrsquos premises to communicate through a home area network with the advanced meter at the premises SMT also facilitates near real-time on-demand
reads of a customerrsquos meter that aids prepaid service offered by certain REPs
In Project No 42786 Review of Advanced Metering System Web Portal
Commission staff and stakeholders examined options for the long-term operational
structure governance and funding of SMT The Commission determined that ownership
of SMT should remain with the TDUs because they can operate the portal at a lower cost
than transferring the data repository to ERCOT The Commission opened two
rulemakings one to ascertain the appropriate governance performance and funding of
SMT and a second to determine the appropriate access for third parties ensuring that
customers have the freedom to grant and give third parties access to their data if made
knowingly while also securing customer privacy
Sharyland Utilities
In early 2015 customers of Sharyland Utilities the smallest investor-owned
transmission and distribution utility in ERCOT began to file with the Commission a
significant number of complaints regarding high electricity bills In response the
Commission opened Project No 44592 Relating to a Project Regarding Sharyland
Utilities to provide for a more formal process for Commission review of the large number
of complaints As part of this project Commission staff prepared a report to evaluate the
electricity rates and electric bills in the operating area of Sharyland Utilities that was
previously part of Cap Rock Energy
Staffrsquos report found that a number of factors contributed to the comparatively high
bills for many of Sharyland-Cap Rockrsquos customers First Sharylandrsquos small size and its low customer density result in high TDU rates for all customers relative to other TDUs In
particular Staffrsquos report found that Sharyland-Cap Rockrsquos rates for distribution service are
up to three times higher than those of other TDUs in Texas In addition to Sharyland-Cap
Rockrsquos high costs for distribution service higher wholesale transmission costs also
contributed to the rate increases charged to Sharyland-Cap Rockrsquos customers These transmission costs are the result of increased transmission investment in recent years
throughout Texas that has increased transmission costs for all distribution providers
18 The participating Texas TDUs are AEP Texas Central Company and AEP Texas North Company (jointly
ldquoAEPrdquo) CenterPoint Energy Houston Electric LLC (ldquoCenterPointrdquo) Oncor Electric Delivery Company LLC (ldquoOncorrdquo) and Texas-New Mexico Power Company (TNMP) collectively referred to as the ldquoJoint TDUsrdquo Operation of an AMS web portal was addressed in the orders approving particular utilitiesrsquo deployment of AMS and approving surcharges for AMS cost recovery While Sharyland Utilities filed comments in the proceeding it did not
participate as it had not fully completed its AMS deployment at the time
22 | P a g e
2017 SCOPE OF COMPETITION IN ELECTRIC MARKETS IN TEXAS REPORT
including Sharyland Utilities Second the comparatively colder winter of 2014 ndash 2015
which was the time period generally consistent with the timeframe in which the
Commission began receiving complaints appeared to result in higher electricity usage than
normal This combination of high TDU rates and the higher electricity usage led to higher
bills for customers
Staffrsquos report also noted that in Sharyland-Cap Rockrsquos last rate case in 2014 the
approved rates reflected movement towards more cost-based rates for all customers
including some customers that previously had been heavily subsidized by other customers
Additionally in the process of standardizing Sharyland-Cap Rockrsquos customer classification
with the classifications of the other TDUs in Texas some customers may have experienced
a move from one class that previously was paying below-cost rates to another class that
was now paying above-cost rates For some of these customers the combined effects of
the movement towards cost-based rates and the change to a different class may have
contributed to a significant change in the customersrsquo rates Regardless of any cost-shifting
between customer classes Sharylandrsquos rates remain two to three times higher than those of other TDUs in Texas for all customers in all classes
On December 4 2015 the Commission signed an order directing Sharyland to file
an application for a comprehensive rate review by April 30 2016 Sharyland filed its rate
application on April 29 2016 in Docket No 45414 Review of the Rates of Sharyland
Utilities LP On October 10 2016 the Commission ordered Sharyland to file an amended
application as soon as practicable but no later than January 1 2017 to reflect the unique
aspects of the companyrsquos organizational structure as a real estate investment trust (REIT) At the time of publication Sharyland is expected to file its amended application in
December 2016
PowerToChoose Website
As part of its ongoing evaluation of the competitive market the Commission
opened Project No 45730 to evaluate the functionality and usability of its PowerToChoose
website which allows customers to select a REP and an electric plan based on their zip
code In the process the Commission received significant feedback from customers stating
that the Commissionrsquos PowerToChoose website was an important tool that plays a
fundamental role in their shopping process In response to the feedback received from
industry representatives and consumers Commission staff changed how the website sorts
and filters retail electric plans adding a filter to allow customers to unselect plans that
contain minimum usage fees or credits This filter is now a default setting and plans with
minimum usage fees and credits are not shown unless the customer actively selects to
search for such plans In addition Commission staff made other changes to increase the
clarity of the REP complaint rating The Commission continues to evaluate other changes
to improve the customer experience of the PowerToChoose website and provide
transparency for retail electric plans
23 | P a g e
2017 SCOPE OF COMPETITION IN ELECTRIC MARKETS IN TEXAS REPORT
Report on Alternative Ratemaking Mechanisms
In 2015 the Legislature enacted SB 774 which requires the Commission or its
consultant to conduct a study and make a report to the Legislature analyzing the alternative
ratemaking mechanisms adopted by other states In addition SB 774 extended the
authorization for the Periodic Rate Adjustment (PRA) mechanism from 2017 to 2019
which the Legislature had authorized in 2011 (SB 1693) as a version of an alternative
ratemaking mechanism that provides to utilities a means for expedited recovery of
distribution infrastructure costs Pursuant to SB 774 the Commission retained a consultant
to produce the report and the consultantrsquos recommendations included streamlining the ratemaking process to reduce procedural costs providing for a periodic review of the
prudency of the costs and using certain types of alternative ratemaking mechanisms that
decouple the recovery of costs from variations in load The Commission held a public
hearing to receive comments on the report from stakeholders and after consideration of
those comments has provided to the Legislature the consultantrsquos report together with its
own discussion of the report
Request for Purchase of Oncor Electric Delivery Company
In March 2016 the Commission approved with conditions an application by an
investor group led by Hunt Consolidated Inc the owners of Sharyland Utilities to acquire
control of Oncor Electric Delivery Company (Oncor) the largest transmission and
distribution utility in Texas from Oncorrsquos parent company Energy Future Holdings which
is in bankruptcy The Commission approved the request subject to certain conditions
including stipulations regarding the organization of the new entities and treatment of tax
benefits The investor-led group subsequently declined to pursue the transaction that was
approved by the Commission
In September 2016 NextEra Energy which owns Florida Power amp Light received
approval from the United States Bankruptcy Court in Delaware for its plan to purchase
Oncor In October 2016 NextEra Energy filed an application with the Commission in
Docket No 46238 for approval of the proposed transaction The Commission will evaluate
the application to determine if the transaction is in the public interest
Integration of Lubbock Power and Light
In March 2016 the Commission opened Project No 45633 to study and identify
the issues related to the request of Lubbock Power and Light the statersquos third-largest
municipally owned utility to be integrated into ERCOT The Commission is currently
working with stakeholders ERCOT and SPP to determine the cost and benefits of any
potential switch by Lubbock Power and Light into ERCOT and whether such a switch is
in the public interest
24 | P a g e
2017 SCOPE OF COMPETITION IN ELECTRIC MARKETS IN TEXAS REPORT
Desalination Project ERCOT Studies
In 2015 the Legislature passed HB 4097 which directed the Commission and
ERCOT to study whether existing transmission and distribution planning processes are
sufficient to provide adequate infrastructure for seawater desalination projects and to study
the potential for desalination projects to participate in demand response opportunities in
the ERCOT market Pursuant to that direction ERCOT staff have prepared a report on the
feasibility of interconnection of large desalination projects and on opportunities for such
projects to participate in ERCOTrsquos demand response programs which is attached to this Report in Appendix B
Oversight and Enforcement Actions
The Commissionrsquos enforcement of statutes rules and orders applicable to entities
under its jurisdiction serves to protect consumers the electric markets the reliability of the
electric grid and to promote fair competition The Commissionrsquos enforcement efforts in the electric industry focus on violations of PURA the Commissionrsquos rules and ERCOT
protocols
During the period from January 2015 through August 31 2016 the Commission
assessed $3258500 in penalties against electric market participants Table 8 provides a
summary of electric industry Notices of Violation since January 2015 During 2015 and
2016 Commission staff opened 212 investigations for the electric industry and closed 177
investigations
Table 8 Notices of Violations
Violation Type Total Penalty Amount
Retail Market Violations $539000
Service Quality Violations $451500
Wholesale Market Violations $2268000
TOTAL $3258500
In addition to the imposition of administrative penalties the Commission uses other
enforcement mechanisms in exercising its enforcement duties including revoking a
companyrsquos certificate to operate In addition some companies may be required to relinquish a certificate as part of a settlement after enforcement action has proceeded
Table 9 provides a breakdown of the number of certificates revoked or relinquished In
2016 the Commission revoked the certificate of the REP TruSmart Energy
Table 9 Certificates Revoked or Relinquished
Type Number
Certificates Revoked 1
Certificates Relinquished 0
25 | P a g e
2017 SCOPE OF COMPETITION IN ELECTRIC MARKETS IN TEXAS REPORT
The Oversight amp Enforcement division also issues warning letters to companies in
the electric market when it determines that a violation occurred but given the
circumstances surrounding the violation and other mitigating concerns no administrative
penalty is warranted During 2015 and 2016 the Oversight amp Enforcement division issued
50 warning letters Finally the Commission generally seeks to reimburse money directly
to customers when appropriate In 2015 and 2016 the Commission ordered the
reimbursement of $8543596 to Texas electric customers
Table 10 Warning Letters
Warning Letter Type Number
Retail Market Warning Letter 8
Service Quality Warning Letter 1
Wholesale Market Warning Letter 41
TOTAL 50
In addition to its enforcement activities the Commission also enters into voluntary
mitigation plans with generators that request one through a contested case proceeding
pursuant to PURA sect15023(f) and 16 TAC sect25504(e) The Commission entered into one
voluntary mitigation plan during 2015 and 2016 in Docket No 44635
Low-Income Discount System Benefit Fund
The System Benefit Fund (SBF) was originally established in 1999 to fund
discounts to low-income customers customer education activities energy-efficiency and
weatherization and electric market oversight through a nonbypassable surcharge on retail
electric bills HB 1101 of the 84th Legislature provided that the SBF be sunset on
September 1 2017 by which time the SBF is intended to be exhausted In the 2016 Fiscal
Year (FY) $325521250 was appropriated in the SBF to provide a 25ndash31 percent discount
to low-income customers over a 12-month period
To assist the drawdown of the remaining balance HB 1101 authorized the
Commission to use any unexpended SBF balance in FY 2017 to assist low-income
customers The Commission estimates that the remaining SBF balance will be
approximately $17 million by August 31 2017 The Commission has determined that this
amount is insufficient to fund the rate reduction program however the Commission will
spend approximately $100000 to continue automatic enrollment in the program to provide
REPs a list of customers eligible to receive late fee waiver and deposit installment benefits
These two ancillary benefits of the rate reduction program will continue for the duration of
FY 2017
26 | P a g e
2017 SCOPE OF COMPETITION IN ELECTRIC MARKETS IN TEXAS REPORT
Homeland Security
The Commission assesses the efforts of ERCOT and utilities to defend against
mitigate and respond to the variety of risks that the modern electricity system faces The
Commission also meets with ERCOT utilities and governmental entities on an ongoing
basis to discuss preparation for everything from hurricanes and other severe weather to
cyber-threats and threats of physical damage to the grid from accidents or intentional
malfeasance In addition the Commission monitors industry and federal programs that
address homeland security issues
The Commission serves as an information liaison between state government and
electric utilities during emergencies The Commissionrsquos main roles include
Conveying outage and service restoration information from electric utilities to
state government
Conveying service restoration priorities (hospitals water treatment facilities
etc) from state government to electric utilities and
Facilitating the clearance of downed power lines in disaster re-entry areas and
facilitating entry of electric utilities into disaster areas
The Commissionrsquos Emergency Management Response Team (EMRT) provided staff at the
State Operation Center for the May 2015 and April 2016 flooding events in Texas as well
as additional staffing for severe winter weather
Demand Response
ERCOT staff have begun to report annually on the participation of customers in
REP-sponsored demand response programs These programs which have been facilitated
by the deployment of smart meters throughout the competitive areas within ERCOT and
by many municipal and cooperative electric utilities take the form of rebates for reduction
in usage during peak period time-of-use pricing real-time volumetric price compensation
for load reduction and direct control of customer load among other plans
These programs have seen dramatic increases in participation since ERCOT began
to gather this information in 2013 From 2013 to 2014 the number of residential customers
participating in these programs increased from 151793 to 721273 and the number of
commercial and industrial customers participating rose from 30275 to 50205 The
Commission continues to monitor ERCOTrsquos stakeholder process for efforts relating to the integration of demand response
27 | P a g e
2017 SCOPE OF COMPETITION IN ELECTRIC MARKETS IN TEXAS REPORT
IV LEGISLATIVE RECOMMENDATIONS
A Determination of Low-Income Customer Eligibility
In 2015 HB 1101 required that all remaining funds in the System Benefit Fund
(SBF) be expended that the fee that funded the program as a nonbypassable surcharge on
electric bills be set at zero and that the SBF be sunset on September 1 2017 Per the
provisions of HB 1101 the SBF fee was set at zero in September 2016 concluding the
funding for the program The sunset of the SBF program also concluded the relationship
between the Texas Health and Human Services Commission (HHSC) and the Commission
in which the HHSC provided to the Commission eligible electric customers for the SBF
low-income discount Because of the termination of the relationship with HHSC with the
termination of the SBF the Commission will no longer be able to determine easily an
electric customerrsquos eligibility for other low-income programs such as late penalty waivers
and the option of paying an electric deposit over multiple months
The Legislature may wish to consider easing low-income customers access to these
low-income programs by facilitating the process used to determine eligibility The
Commission offers four possible approaches in which the Legislature could continue these
low-income programs
(1) Authorize HSSC to provide identification of eligible low-income customers to the
Commission
(2) Allow retail electric providers (REPs) to provide such low-income programs using
the Low Income Discount Administratorrsquos (LIDA) Telecommunications Lifeline
Service Program list to identify low-income customers
(3) Require REPs to offer such low-income programs with customers self-enrolling
and REPs verifying income eligibility or
(4) Allow REPs to voluntarily provide such low-income programs at their own
discretion
B Outside Counsel for Proceedings before Regional Transmission
Organizations
Regional Transmission Organizations (RTO) manage the power grid across wide
regions of the United States Most of Texas is inside the ERCOT region however there
are significant portions of East Texas and the Panhandle that are in the Midcontinent
Independent System Operator (MISO) and the Southwest Power Pool (SPP) Issues arise
in these other RTOs that have significant impact on Texas ratepayers such as how
transmission infrastructure costs will be shared These tend to be very lengthy and
complicated proceedings that require specialized legal and consulting services
28 | P a g e
2017 SCOPE OF COMPETITION IN ELECTRIC MARKETS IN TEXAS REPORT
PURA sect 394525 currently authorizes the Commission to use outside consultants
auditors engineers or attorneys to represent the Commission in proceedings before the
Federal Energy Regulatory Commission This provision has been an important tool for the
Commission to respond to complex matters in the federal arena to enable it to protect the
public interest in Texas The PUC recommends that the Legislature expand the language
in this statute to include the ability to hire outside assistance for proceedings before other
RTOs to provide those same protections to Texas ratepayers in those areas
C Repeal of Natural Gas and Renewable Energy Mandates
1 Natural Gas
PURA sect 399044 establishes natural gas as ldquothe preferential fuelrdquo in Texas for electricity generation and requires the Commission to adopt rules to establish a system of
natural gas energy trading credits The majority of all new non-renewable electricity
generation constructed since 2000 for Texas has used natural gas as a primary fuel and this
trend is expected to continue in the foreseeable future The thresholds used to trigger the
natural gas energy trading credit system in PURA sect 399044 have not been reached and
they are not expected to be reached in the foreseeable future
Because natural gas-fueled facilities have been the most commonly built new
generation in Texas for many years and are expected to continue to be there is no need to
establish incentives for natural gas generation The PUC recommends that the Legislature
consider repealing PURA sect 399044 because it is no longer necessary
2 Renewable Energy
PURA sect 39904 establishes goals for renewable energy Subsection (a) requires
the installation of 5880 megawatts of renewable energy by 2015 and Subsection (b)
establishes a renewable energy credits trading program to implement the requirement The
5880 megawatts mandates in Subsection (a) was met in 2008 While the Commission
believes the renewable energy trading credit program is needed for retail electric providers
to validate renewable energy marketing claims the Commission believes the 5880
megawatts mandate in Subsection (a) is no longer necessary
D Advisory Opinions
Many regulatory agencies in Texas have authority to issue informal guidance to the
persons they regulate particularly with respect to outlining whether a particular course of
conduct would in the agencyrsquos view be consistent with the laws and regulations that the agency administers19 The issuance of an advisory opinion can provide regulatory clarity
to a company before making investments or conducting operations the permissibility of
which may be unclear under state law The Legislature may want to consider granting the
19 In addition certain federal agencies such as the Federal Communications Commission
Internal Revenue Service Securities and Exchange Commission and Federal Election
Commission have authority to issue advisory opinions
29 | P a g e
2017 SCOPE OF COMPETITION IN ELECTRIC MARKETS IN TEXAS REPORT
Commission the authority to issue advisory opinions In the electric industry providing
clarification to a company concerning issues such as the purchase of assets or the
acquisition of another company could allow it to avoid expensive regulatory proceedings
without impairing the Commissionrsquos authority The following state agencies have statutory authority to issue advisory opinions
Texas Ethics Commission20
Texas Medical Board21
State Board of Dental Examiners22
Texas Board of Nursing23
Texas Board of Professional Engineers24
Texas Lottery Commission and25
Texas Securities Board26
E Administrative
Gross Receipts Assessment
PURA sect 16001 provides for a gross receipts assessment that is used to defray the
expenses incurred by the Commission to administer PURA An assessment of one sixth of
one percent is collected from public utilities electric cooperatives retail electric providers
and interexchange carriersrsquo gross receipts from consumers The funds from this assessment
are remitted to the general revenue fund but currently they have not been explicitly
dedicated to funding of the Commission In contrast similar assessments on water
utilities insurance companies and other regulated entities have traditionally been used to
explicitly fund the underlying regulatory programs at the respective agencies The
Commission is one of four Article VIII agencies that is not designated as self-funded
The Commission recommends that the Legislature designate the Commission as a
self-funded agency whereby the collected assessments would be explicitly dedicated to the
funding of the agency Implementing this recommendation would require the Public Utility
Commission to be included in the Appropriations Limited to Revenue Collections rider
located in the Special Provisions Relating to All Regulatory Agencies section of the
General Appropriations Act Designation as a self-leveling agency would require the
Commission to set the gross receipts assessment at a rate sufficient to generate revenue in
the amount of the agencyrsquos general revenue appropriation each fiscal year which would require a statutory change to PURA sect16001(b) Based upon the Commissionrsquos baseline budget request authorizing the PUCrsquos self-leveling designation would result in an overall
estimated tax reduction of $456 million per year or 774
20 Government Code sect 571091 21 Occupations Code sect 162107 22 Occupations Code sect 258157 23 Occupations Code sect 301607 24 Occupations Code sect 1001601 25 Occupations Code sect 2001059 26 Tex Rev Civ Stat Ann Arts 581-28-1 amp 581-35 7 Tex Admin Code 1012
30 | P a g e
2017 SCOPE OF COMPETITION IN ELECTRIC MARKETS IN TEXAS REPORT
V APPENDICES
31 | P a g e
2017 SCOPE OF COMPETITION IN ELECTRIC MARKETS IN TEXAS REPORT
Appendix A ndash Acronyms
AEP American Electric Power
AMS Advanced Metering System
CenterPoint CenterPoint Energy Houston Electric LLC
DG Distributed Generation
DRG Distributed Renewable Generation
ERCOT Electric Reliability Council of Texas
ERSC Entergy Regional State
ERS Emergency Response Service
ETI Entergy Texas Inc
IMM ERCOT Independent Market Monitor
kWh Kilowatt-hour
LMP Locational Marginal Pricing
LSP Large Service Provider
MISO Midwest Independent System Operator
MMBtu One million British Thermal Unit (BTU)
MW Megawatt
MWh Megawatt-hour
Nodal Texas Nodal Market Design
ORDC Operating Reserve Demand Curve
PGC Power Generation Company
POLR Provider of Last Resort
PURA Public Utility Regulatory Act
REP Retail Electric Provider
RSC Regional State Committee
RTO Regional Transmission Organization
SCED Security Constrained Economic Dispatch
Sharyland Sharyland Utilities LP
SBF System Benefit Fund
SPP Southwest Power Pool
TDU Transmission and Distribution Utility
TNMP Texas-New Mexico Power Company
32 | P a g e
2017 SCOPE OF COMPETITION IN ELECTRIC MARKETS IN TEXAS REPORT
Appendix B ndash ERCOT Desalination Report
This page intentionally left blank
33 | P a g e
ERCOT Public
Study on the Demand Response Potential for Seawater Desalination Projects
ERCOT November 18 2016
Study on the Demand Response Potential for Seawater Desalination Projects ERCOT Public
Executive Summary
In 2015 the 84th Texas Legislature enacted House Bill (HB) 4097 which included several provisions relating to seawater desalination projects including a requirement that the Public Utility Commission of Texas (PUC) and Electric Reliability Council of Texas (ERCOT) study the potential for seawater desalination projects to participate in existing demand response opportunities in ERCOT There are several demand response products in which demand-side resources (ie consumers of electricity) can participate These programs help to preserve system reliability and provide economic benefits to participating demand-side resources Seawater desalination is an energy-intensive process that removes salt and other minerals from salt water to produce fresh water for municipal consumption industrial use or irrigation Participation in demand response could help mitigate electricity costs for future seawater desalination projects in Texas and provide reliability benefits to the grid
There are two main demand response reliability-based services administered by ERCOT participation by demand-side resources in the Ancillary Services market and the Emergency Response Service (ERS) Within the Ancillary Services market the most common service provided by demand-side resources is Responsive Reserve Service (RRS) which requires resources to respond either instantaneously or within 10 minutes in response to unplanned system emergencies ERS is separate from ERCOTrsquos Ancillary Services market and allows demand-side resources and distributed generation to provide reliability services in the event of an energy emergency Resources can qualify for either the 10-minute or 30-minute response time ERS programs
There are several key considerations that will impact a demand-side resourcersquos ability to participate in different demand response opportunities response time recovery time predictability of electrical demand and flexibility of operations Considering these factors together it appears that seawater desalination plants could be designed to meet the requirements for participation in demand response Because the ability to meet the qualification requirements is dependent on the plant design demand response opportunities should be considered early in a projectrsquos development if participation is desirable
Whether project developers will choose to address these requirements will depend on the economic benefits of participation There may be additional costs to design seawater desalination plants to operate in the manner required in order to participate in demand response These include costs associated with additional plant design specifications need for excess capacity and storage to make up for lost production during demand response deployment operational costs resulting from interruptions to plant processes and potential financial penalties if demand response deployment results in failure to meet contract demands The interplay of the benefits of participation and these costs will determine whether it would be beneficial for a future seawater desalination plant to participate in demand response in ERCOT
To date participation of seawater desalination plants in demand response programs has been limited Because the process of seawater desalination is energy-intensive participation in demand response could help to reduce electricity costs while posing a relatively low risk to plant operations As stakeholders in Texas continue to plan for possible future droughts in the region and identify water management strategies consideration of demand response could play a role in mitigating some costs associated with seawater desalination and allow seawater desalination plants to assist with maintaining electric reliability in the region
copy 2016 ERCOT All rights reserved i
Study on the Demand Response Potential for Seawater Desalination Projects ERCOT Public
Table of Contents
1 Introduction 1
2 Seawater Desalination 2
21 Seawater Desalination Plant Operations 2
22 Seawater Desalination Plant Economics 3
3 Demand Response Opportunities in ERCOT 4
31 ERCOT-Dispatched Demand Response 4
311 Ancillary Services Markets 5
312 Emergency Response Service (ERS) 5
32 Non-ERCOT-Dispatched Demand Response 6
321 Four Coincident Peak (4CP) 6
322 LSE or DR Provider Contracted Price Response 6
323 Self-Directed Price Response 6
4 Demand Response Potential for Seawater Desalination 7
41 Operational Considerations for ERCOT-Dispatched Demand Response 7
42 Economic Considerations for ERCOT-Dispatched Demand Response 8
43 Considerations for Non-ERCOT-Dispatched Demand Response 9
5 Conclusion 11
copy 2016 ERCOT All rights reserved ii
Study on the Demand Response Potential for Seawater Desalination Projects ERCOT Public
1 Introduction
In 2015 the 84th Texas Legislature enacted House Bill (HB) 4097 which included several provisions relating to seawater desalination projects including a requirement that the Public Utility Commission of Texas (PUC) and Electric Reliability Council of Texas (ERCOT) study the potential for seawater desalination projects to participate in existing demand response opportunities in ERCOT ERCOT and the PUC initiated this study to fulfill that requirement and evaluated the operational and economic characteristics of seawater desalination plants in light of ERCOTrsquos primary demand response products1
ERCOT is the independent system operator (ISO) for the ERCOT Interconnection which encompasses approximately 90 of demand for electricity in Texas ERCOT is the independent organization established by the Texas Legislature to be responsible for the reliable planning and operation of the electric grid for the ERCOT Interconnection ERCOT also administers and maintains a forward-looking open market to provide affordable and reliable electricity to consumers in Texas In collaboration with market participants ERCOT has developed demand response products and services for customers that have the ability to reduce or modify electricity use in response to instructions or signals These programs help preserve system reliability and provide economic benefits to participating demand-side resources
The process of seawater desalination removes salt and other minerals from salt water to produce fresh water for consumption industrial processes or irrigation The drought-prone Texas climate coupled with projections for increasing water demand in the state has created interest in seawater desalination as a future water source The 2017 Texas State Water Plan includes seawater desalination as a future water management strategy for water users in the state However the seawater desalination process is energy intensive and electricity consumption can be a significant cost driver for these projects To the extent that these plants could participate in demand response it would help to defray these costs Thus there is a potential nexus between seawater desalination projects built in Texas to mitigate drought but which have large electricity requirements and ERCOT demand response opportunities which could help to reduce their electricity costs and provide reliability benefits
This study evaluates the demand response potential of seawater desalination plants based on their operational characteristics and economic drivers The report is organized as follows
Section 2 provides background on typical seawater desalination plant operations and economics
Section 3 describes the current demand response opportunities in ERCOT
Section 4 evaluates the characteristics of seawater desalination plants to determine their potential to participate in demand response opportunities in ERCOT and
Section 5 provides a summary of the conclusions of this study
1 In the course of developing this report ERCOT consulted with several desalination experts with experience with existing or planned seawater desalination plants in the US The technical experts consulted included Jorge Arroyo (Water Management Consultant) Andrew Chastain-Howley (Black amp Veatch) Jonathan Loveland (Black amp Veatch) Ron Parker (Black amp Veatch) John Wolfhope (Freese and Nichols) and Srinivas Veerapaneni (Black amp Veatch)
copy 2016 ERCOT All rights reserved 1
Study on the Demand Response Potential for Seawater Desalination Projects ERCOT Public
2 Seawater Desalination
There are two primary methods for seawater desalination distillation (also referred to as ldquothermalrdquo) and reverse osmosis Distillation uses heat to remove salts and minerals from seawater by boiling water at high pressures In contrast reverse osmosis technology forces saline water through a membrane to separate water from the salts and minerals While both distillation and reverse osmosis are energy intensive distillation requires thermal energy to heat the water and overall has a higher energy requirement whereas reverse osmosis requires primarily electrical energy and overall is less energy intensive ndash though still with significant electricity requirements
Globally most thermal desalination plants are located in the Middle East due to low energy prices in the region Plants located elsewhere including in the US typically use reverse osmosis technology2 There are two large existing seawater desalination plants in the US one in Carlsbad California providing water to the San Diego area and one in Gibsonton Florida providing water to the Tampa Bay area Both plants use reverse osmosis technology In addition there are several desalination projects currently in the planning stages or under development in Texas in the Corpus Christi area that would use reverse osmosis technology For that reason this report focuses on reverse osmosis technology in the evaluation of demand response potential of seawater desalination plants
While there are currently no existing seawater desalination plants in Texas there are several municipal and industrial brackish water desalination plants in the state According to the Texas Water Development Board (TWDB) there are 46 municipal brackish water desalination plants with capacities greater than 0025 million gallons per day (MGD) in Texas representing a total of 123 MGD of capacity3 The desalination of brackish water is typically less expensive compared to seawater due to the lower relative salinity of brackish water This study focuses exclusively on seawater desalination consistent with the requirements of HB 4097 but it should be noted that conclusions may also apply to brackish water desalination though at a different cost and scale
This section provides high-level information on the operations (Section 21) and economics (Section 22) of seawater desalination plants to inform the discussion of their demand response potential in Section 4
21 Seawater Desalination Plant Operations Seawater desalination plants typically range in capacity from less than 5 MGD up to 165 MGD For example the Carlsbad seawater desalination plant has a capacity of approximately 50 MGD and the plant in Tampa Bay has a capacity of approximately 25 MGD The associated electricity consumption ranges between 10 and 15 kWh1000 gallons produced depending on the salinity of the water being processed456 More saline water (eg seawater) requires larger amounts of electricity for desalination Thus a seawater desalination plant would have larger electricity consumption requirements compared to a similarly sized brackish water desalination plant
2 American Water ldquoInnovation Solutions within the Water Industry Desalinationrdquo Available at httpwwwamwatercomfilesInnovationsSolutionsWithinTheWaterIndustryDesalinationpdf 3 Texas Water Development Board ldquoDesalination Factsrdquo Available at httpswwwtwdbtexasgovinnovativewaterdesalfactsasp 4 American Membrane Technology Association April 2016 ldquoMembrane Desalination Power Usage Put in Perspectiverdquo Available at httpwwwamtaorgcomwp-contentuploads7_MembraneDesalinationPowerUsagePutInPerspectivepdf 5 Water Reuse Association November 2011 ldquoSeawater Desalination Power Consumptionrdquo Available at httpswatereuseorgwpshycontentuploads201510Power_consumption_white_paperpdf 6 Ghaffour N TM Missimer and G Amy January 2013 ldquoTechnical review and evaluation of the economics of water desalination Current and future challenges for better water supply sustainabilityrdquo Desalination 309 pp197-207 Available at httpswwwresearchgatenetpublication256693140_Technical_review_and_evaluation_of_the_economics_of_water_desalination_ Current_and_future_challenges_for_better_water_supply_sustainability
copy 2016 ERCOT All rights reserved 2
Study on the Demand Response Potential for Seawater Desalination Projects ERCOT Public
While the two existing seawater desalination plants in the US were co-located with power plants to ease compliance with regulations on water intake and discharge structures and reduce costs many other reverse osmosis desalination plants receive their electricity from the grid However plants may have on-site backup generation in case of a power outage This will vary depending on the size and design of the plant and other factors For example the Carlsbad plant in California does have diesel backup generation to power control systems and flushing systems in the case of a power outage The plant in Tampa Bay was not built with backup power due to potential storm surge risks from hurricanes and other storms The plant does use uninterruptible power supply (UPS) backup to power control systems during power outages
Reverse osmosis plants are typically designed with several ldquotrainsrdquo which consists of a high-pressure pump turbine and reverse osmosis membrane Desalination plants are turned on or off one train at a time in a highly controlled process The process of ramping up or down an individual train under normal operations typically takes one to two hours While plants can be designed to handle immediate shutdowns (ie in a power outage) re-starting a system after an interruption would take this amount of time In addition the saline water must be pretreated (ie filtered) before going through the reverse osmosis train and this can sometimes pose constraints on the flexibility of operations
Demand for water is the key factor driving the level of production at seawater desalination plants Typically the plant will have a contract or contracts with municipal or other water users to deliver desalinated water and is operated to meet that demand Alternatively if the plant is municipally owned it would similarly be operated to meet the level of water demand in conjunction with other available water sources If water demands are close to a plantrsquos full capacity the operatorrsquos flexibility to adjust its electricity consumption as part of demand response may be limited However this does mean that plant operations are fairly predictable on a day-to-day basis which is necessary for participation in demand response
The amount of flexibility in plant operations will also be impacted by the amount of water storage available For example if a plant has sufficient water storage on-site or storage within the customerrsquos distribution system it could provide flexibility for the plant to reduce its operations during peak hours when electricity prices are likely to be highest It would also mitigate the impacts of interruptions to production from demand response deployments
22 Seawater Desalination Plant Economics Seawater desalination is typically more expensive than other sources of water and a major driver of the overall cost is energy costs In 2016 the Carlsbad plant charged rates at between $2131 and $2367 per acre-foot78 This charge is intended to cover both the fixed costs of the plant and the variable costs to produce a unit volume of water Typically half to two thirds of the cost of providing desalinated seawater are accounted for by capital cost recovery with the remainder accounted for by operations and maintenance costs including electricity costs Electricity costs can account for 20shy25 of the total costs of seawater desalination with reverse osmosis technology9
Factors affecting the capital cost of a seawater desalination plant include plant size type of desalination process and pre-post-treatment technologies plant infrastructure (eg piping water storage backup power) and compliance with applicable regulations (eg regulations on intake structures brine byproduct disposal) A significant driver of operating and maintenance costs is membrane replacement Reverse osmosis membranes need to be replaced every few years and
7 Source San Diego County Water Authority ldquoSeawater Desalinationrdquo Available at httpwwwsdcwaorgseawater-desalination 8 Note that 1 acre-foot is approximately 325851 gallons 9 Based on technical input from Black amp Veatch
copy 2016 ERCOT All rights reserved 3
Study on the Demand Response Potential for Seawater Desalination Projects ERCOT Public
the rate at which they are replaced will depend on the salinity of the feedwater and how the plant is operated Treatment and disposal of the salty brine byproduct from desalination may also incur operating costs
Electricity costs will vary depending on a range of factors including the size of the plant type of desalination technology source of electricity and quality of the feedwater As previously noted more saline water requires higher amounts of electricity in desalination and thus the amount of electricity consumption is a key difference between brackish water and seawater desalination As a result electricity costs comprise a significant share of the costs of seawater desalination These costs could potentially be defrayed in part by participation in demand response initiatives
3 Demand Response Opportunities in ERCOT
Broadly speaking demand response can be broken down into two major categories dispatchable or non-dispatchable For purposes of this report we will define dispatchable as those demand response events that are initiated by ERCOT and non-dispatchable as an event not specifically initiated by ERCOT These non-dispatchable events may include decisions made by the end-use customer to alter its consumption pattern or may include contractual obligations with another entity such as the end-use customerrsquos retail electric provider (ldquoREPrdquo) to alter consumption patterns
ERCOTrsquos wholesale market is open to several types of dispatchable demand response which are deployed to maintain system reliability Demand-side resources providing Emergency Response Service (ERS) may offer based on either a 10 or 30-minute response time commonly referred to as the ldquoramp periodrdquo Alternatively demand-side resources may register and qualify as a Load Resource that can provide Reserves in the Ancillary Services market The most common service provided by demand-side resources is Responsive Reserve Service which requires an under-frequency relay that can instantaneously interrupt the load during certain system reliability events Some demand-side resources can also participate in other Ancillary Services as Controllable Load Resources that require sophisticated control systems that allow them to be deployed in a more incremental proportional manner
Non-dispatchable demand response in ERCOT can include a response to avoid transmission costs where rates are based on Four Coincident Peak Pricing (4CP) response to wholesale energy prices initiated by the customer or by a REP or other load-serving entity (ldquoLSErdquo) or utility-managed Load Management programs (LM)
The sections that follow provide a description of both ERCOT-dispatched (Section 31) and nonshyERCOT-dispatched (Section 32) demand response For a more detailed description of opportunities for demand-side resources to participate in demand response in ERCOT see ERCOTrsquos guide Load Participation in the ERCOT Nodal Market10
31 ERCOT-Dispatched Demand Response There are two main demand response reliability-based services administered by ERCOT participation by demand-side resources in the Ancillary Services market and participation in ERS These services are dispatched by ERCOT during system emergencies
10 Available at httpwwwercotcomcontentservicesprogramsloadLoad20Participation20in20the20ERCOT20Nodal20Market_302d oc
copy 2016 ERCOT All rights reserved 4
Study on the Demand Response Potential for Seawater Desalination Projects ERCOT Public
Demand-side resources with demand response capability that can meet a set of performance requirements can be qualified to provide Ancillary Services as Load Resources in the Ancillary Services Market The value of having a Load Resource available to reduce load is equal to the value of having a generator available to increase its generation at a generating plant The providers of operating reserves selected to provide Ancillary Services are eligible for capacity payments regardless of whether the Resource is actually deployed (or curtailed in the case of the Load Resource)
ERCOT holds auctions on a daily basis for each of the following Ancillary Services Regulation Up Regulation Down Responsive Reserve and Non-Spinning Reserve11 Table 1 describes the various Load Resource types and their qualification requirements and eligible services
Table 1 Load Resource Types and Ancillary Services
Service Load Resource Type a Qualification Responsive Reserves (le50 of total Reserve requirement)
Non Controllable Under-Frequency Relay and 10-minute ramp to manual dispatch instruction
Responsive Reserves
Controllable Primary Frequency Response and follow 5-minute dispatch instructions
Regulation-Up Regulation-Down
Controllable Primary Frequency Response and respond to Regulation deployments
Non-Spin Reserves Controllable Follow 5-minute dispatch instructions a A Controllable Load Resource is a Load Resource capable of controllably reducing or increasing consumption under dispatch control by ERCOT
Demand-side resources that agree to reduce load when directed by ERCOT and that meet other metering and operational requirements as specified in the ERCOT Protocols may participate in Ancillary Services market auctions As noted in Table 1 the type of Ancillary Service that a Load Resource may provide will depend upon the demand-side resourcersquos response time and metering system as well as other requirements described in the Protocols In the Responsive Reserve and Non-Spin Reserve markets the Load Resource will receive capacity payments regardless of whether or not the load was actually deployed but the load must be available for deployment at any time while providing the service
ERCOT procures ERS to maintain grid reliability during emergency conditions and reduce the likelihood of the need for rotating outages ERS participants may offer to provide demand response with either a 10-minute ramp period requirement (similar to Load Resources providing Responsive Reserve Service) or a 30-minute ramp period requirement ERS Resources do not have the same telemetry and under-frequency relay requirements as Load Resources
11 Regulation Up and Regulation Down service respond to signals from ERCOT every 4 seconds to respond to changes in system frequency full response has to be provided within 5 minutes Responsive reserves must provide their committed capacity either instantaneously in an under-frequency event (eg due to a generator outage) or in energy scarcity conditions within ten minutes following an instruction from ERCOT Non-spinning reserves must provide their committed capacity within 30 minutes based on economic dispatch instructions Non-spinning reserve is used as replacement reserve to replenish other ancillary services and during energy scarcity
copy 2016 ERCOT All rights reserved 5
Study on the Demand Response Potential for Seawater Desalination Projects ERCOT Public
ERS is procured through a request for proposal (RFP) process three times per year for four-month contract terms each of which is further split into smaller time periods based on business cycles and other factors Demand-side resources may choose to submit offers in all time periods or only in those that best fit their unique circumstances and may vary both the price and demand response capacity offers by time period
Payments for ERS are performed up to 80 days after each four month contract term has ended and are subject to downward revision based upon delivered demand response capacity and the demand-side resourcersquos availability during the contract term
32 Non-ERCOT-Dispatched Demand Response The options listed below are not dispatched by ERCOT but they either are controlled directly by a customer or are dispatchable by another entity such as a demand response provider (ldquoDR Providerrdquo) REP or a transmission and distribution utility
Many industrial customers are subject to transmission charges based upon a Four Coincident Peak (4CP) demand The 4CP demand is determined by averaging the consumerrsquos actual demand during the 15-minute settlement interval with the highest ERCOT demand during each of the four summer months (June through September) This measured 4CP demand serves as the basis for the customerrsquos transmission tariff charges for the following year By correctly predicting the ERCOT system peaks during the summer and curtailing load during those intervals a consumer can help reduce the stress imposed on the electric system during peak periods of consumption and reduce its transmission charges for the following calendar year
In the competitive areas of ERCOT consumers can contract with their REP or a DR Provider to have their load respond to the REPrsquos or DR Providerrsquos instructions The contract will usually outline the parameters of this response ndash at what times and frequency demand response events can be called ramp periods sustained response periods compensation etc Because this response is a contractual matter between the REP or DR Provider and the consumer a great deal of variety can be present in these arrangements For example a consumerrsquos response may be voluntary or required compensation could come in the form of reduced energy prices or rebate payments for each curtailment event consumers might be notified up to a day in advance or could have no notification at all (for automated curtailment)
In areas of ERCOT not open to competition interruptible tariffs may be available These tariffs will usually offer a reduced energy price for defined curtailment obligations
REPs may offer dynamic pricing options or consumers within a municipality or cooperative may have their energy prices determined by a published tariff which also may be structured based upon Time-of-Use (TOU) or have a Critical Peak Pricing (CPP) or Peak Time Rebate (PTR) component Self-directed price response refers to consumers making an independent decision to respond to energy prices contained in a governing tariff or in either the ERCOT Day Ahead or Real Time energy markets
TOU offerings will typically have higher energy prices during normal peak periods ndash for example a TOU tariff may charge one price during Monday through Friday from 2 pm through 8 pm and another price during all other times Customers may choose to reduce consumption during these high priced periods Load reduction can be accomplished by load shifting (loads can be shifted by
copy 2016 ERCOT All rights reserved 6
Study on the Demand Response Potential for Seawater Desalination Projects ERCOT Public
rescheduling certain processes or by utilizing thermal storage) ending certain processes that are no longer economic or through energy efficiency measures
Offerings that incorporate CPP usually have prescribed high prices only during certain defined periods ndash for example when load or prices are expected to reach a certain level Response to CPP may be similar to those employed under TOU tariffs especially if CPP is reached frequently More often CPP is infrequent and as such short-term load curtailment may be the more appropriate response to meet economic objectives
4 Demand Response Potential for Seawater Desalination
This section evaluates whether the operational characteristics and economics of seawater desalination plants would enable them to participate in one or more of the various demand response opportunities in the ERCOT Region To date participation of seawater desalination plants in demand response programs has been limited Neither the plant in Carlsbad nor the plant in Tampa Bay participate in demand response programs in California or Florida respectively However as will be described below it appears that these plants can be designed and operated to meet the requirements for participation in demand response and receive economic benefit from participation in these programs
Section 41 describes the operational parameters that must be met for a demand-side resource to provide ERCOT-dispatched demand response and evaluates the ability of seawater desalination plants to meet these criteria Section 42 discusses the tradeoffs between payments for participation in ERCOT-dispatched demand response and potential additional costs posed to seawater desalination plants Finally Section 43 presents other opportunities for seawater desalination plants to reduce their electricity costs outside of ERCOTrsquos reliability-based services that are open to demand response assets
41 Operational Considerations for ERCOT-Dispatched Demand Response There are several key operational parameters that impact a demand-side resourcersquos ability to participate in different demand response services response time recovery time predictability of electrical demand and flexibility of operations This section discusses each of these considerations as they apply to seawater desalination plants
As discussed in Section 31 one of the differentiating factors between ERCOTrsquos demand response products is the amount of time within which a demand-side resource must respond to a deployment instruction to reduce electricity consumption during an event Participation in RRS requires an automatic response within either half a second (ie instantaneous) based on grid frequency or within 10 minutes via a manual instruction ERS requires a response time of either 10 or 30 minutes As noted in Section 21 the typical time to take a reverse osmosis train on- or off-line is 1-2 hours under normal controlled operations To comply with the response time requirements of RRS or ERS a seawater desalination plant would need to be able to reduce its electricity consumption far more quickly than in normal operations This is an element of plant design that would need to be accounted for in the specifications of the project Considerations include the potential need for on-site backup generation including uninterruptible power supply potential impacts to plant infrastructure (eg piping) reverse osmosis membranes and pretreatment systems
The two large US desalination plants provide illustrative counterpoints in this respect The Carlsbad plant was designed to withstand instantaneous power interruptions and has on-site backup generation including uninterruptible power supply to provide the ability to power control systems and flush the membranes in the event of a power loss In contrast the Tampa Bay plant was not
copy 2016 ERCOT All rights reserved 7
Study on the Demand Response Potential for Seawater Desalination Projects ERCOT Public
designed with on-site backup generation and a loss of power would result in a plant shutdown and may require several days to bring the plant back on-line Thus it appears that it is technically possible for a seawater desalination plant to meet the response time requirements for participation in demand response so long as this factor is considered in the design of the facility
The time it takes a desalination train to return to operations after an event is also a consideration Demand-side resources participating in RRS must be able to come back on-line within three hours and those participating in ERS must return within 10 hours Again it appears that it is technically feasible for desalination plants to meet this requirement so long as this requirement is considered in the plant design
An additional consideration is the predictability of a demand-side resourcersquos electricity consumption Participation in the responsive reserves ancillary service market requires bidding in the day-ahead market and thus a demand-side resource must know with great accuracy (within 95) its electrical demand at least a day ahead of time For ERS auctions are held three times a year for four-month contract periods Thus to participate in ERS a resource must know its forecasted electrical demand several months in advance Because seawater desalination plant operations are driven by contracted demand for water it is likely that a plant operator would have a good idea of the plantrsquos electrical demand days or even weeksmonths in advance especially for summer months when demand is likely to be relatively steady An important consideration however is the salinity of the water which drives the electrical requirements and which can be impacted by recent weather events Similarly reductions in demand for water during non-summer months or wet summer days where demand may be reduced could also impact a plantrsquos ability to predict its electricity demand
Finally a seawater desalination plant must have sufficient flexibility in its day-to-day operations so that it can afford to lose several hours of production when deployed for demand response It should be noted that demand-side resources participating in RRS and ERS are called infrequently demand-side resources providing responsive reserves were deployed one time in 2015 and ERS was not deployed that year However this is an important factor to consider if a plant is operating at close to full capacity and would incur financial penalties if it fails to meet its contract obligations due to a demand response event Including additional storage and building a plant with extra capacity could help to mitigate this risk It should also be noted that a plant operator does not need to commit the full plant capacity to these services but rather can specify an amount of MW that will be committed Thus a plant operator could mitigate issues both with predictability and flexibility of plant operations by committing only a portion of its predicted electrical demand to participate in demand response
Considering these factors together it appears that seawater desalination plants could be designed to meet the operational requirements for participation in ERCOTrsquos demand response services (both RRS and ERS) Because the ability to meet the requirements is dependent on the plant design demand response would need to be considered early in a projectrsquos development if participation is desirable Whether project developers will choose to address these requirements will depend on the economic benefits of participation in demand response which will be discussed in the next section
42 Economic Considerations for ERCOT-Dispatched Demand Response This section describes the economic benefits to demand-side resources from participation in ERCOT-dispatched demand response programs The average price paid for a demand-side resource participating in RRS in 2015 was $1087 per MW per hour and for ERS was $645 per MW per hour for the contract periods during the 2015 program year These payments could provide a significant financial benefit to seawater desalination plants To give a simplified example for a plant with an electrical demand of 10 MW operating at a 100 annual load factor (10 MW times 24 hours times 365 days) the annual benefit would be on the order of $500000 for ERS or $1 million for RRS
copy 2016 ERCOT All rights reserved 8
Study on the Demand Response Potential for Seawater Desalination Projects ERCOT Public
In 2015 demand-side resources providing responsive reserves were deployed one time for a duration of 10 minutes and ERS was not deployed12 The most ERS was ever deployed in a single year was two times in 2011 Thus participation in either program could result in a substantial payment to a seawater desalination plant with a relatively low risk of deployment and associated disruption of plant operations although it is important to note that participation in either ERCOT service subjects demand response resources to annual unannounced testing Other than testing the frequency of deployment will depend on grid conditions and is a risk that should be considered
The financial benefits of participation must be weighed against the costs of designing facilities with the capabilities to operate in this manner These include
bull The costs to design the plant to reduce electrical demand within the required timeframes for demand response and to withstand an instantaneous interruption if not already part of the plant design For example a plant may need to be designed to have backup power generation on-site In addition there could also be costs to restart the system after an interruption
bull The costs to build a plant with excess capacity andor storage to make up for lost production hours when demand response is deployed This will add to the total capital costs of the project Land area constraints should also be considered when considering additional storage as the space requirements for the necessary storage capacity could be significant
bull Costs associated with the impact of interruptions on plant processes (eg more frequent replacement of membranes impacts to pretreatment system or plant infrastructure)
bull Potential financial penalties that would be incurred if deployment as part of demand response were to result in failure to meet contract obligations to supply water
bull The loss of potential benefits in the form of cost avoidance from participation in non-ERCOTshydispatched demand response opportunities (see Section 43) If a plant is committed to RRS or ERS the plant operator would lose the flexibility to take advantage of these other opportunities to reduce their electricity costs
The interplay of these benefits and costs will determine whether it would be beneficial for a future seawater desalination plant to participate in demand response in ERCOT
43 Considerations for Non-ERCOT-Dispatched Demand Response Outside of the reliability-based services administered by ERCOT there are other opportunities for seawater desalination plants to reduce their electricity costs As described in Section 321 seawater desalination plants may be able to reduce the demand charges on their electricity bills through curtailing load during 4CP intervals In addition plant operators may adjust operations in response to real-time electricity prices to take advantage of lower off-peak prices and avoid price spikes (see Sections 322 and 323) All of these opportunities require that the plant have flexibility to reduce production during certain times of the day
In the ERCOT region as noted above a portion of transmission and distribution charges are set based on the peak systemwide 15-minute interval of the four summer months (June through September) referred to as the four coincident peaks (4CP) Large customers can reduce or avoid this charge by reducing electrical consumption during these four peak intervals AEP Central Texas and CenterPoint are the transmission providers covering the majority of the Gulf Coast in Texas13
12 ERCOT June 2016 ldquoLoad Resource Deployment Updaterdquo Available at httpwwwercotcomcontentwcmkey_documents_lists870985_RRS_Load_Resource_Deployment_Updatepdf 13 It is also possible that a seawater desalination plant could be located in an area that as not opted in to competition in which case the plant owner would need to negotiate its electricity charges bilaterally with the Non Opt-In Entity (NOIE)
copy 2016 ERCOT All rights reserved 9
Study on the Demand Response Potential for Seawater Desalination Projects ERCOT Public
Assuming a future seawater desalination plant would be connected at transmission-level voltages the relevant 4CP charges based on the 2016 tariffs accounting for both transmission charges and transmission cost recovery factors would be $41425 per 4CP kW for AEP Central Texas and $41870 per 4CP kVA for CenterPoint14 If a seawater desalination plant has 10 MW of load and is capable of interrupting all of it and successfully does so for all four 4CP intervals the savings based on the 2016 tariffs would be approximately $500000 per year ($41425 times 1000 (kW to MW) times 10 MW times 12 months) Thus a seawater desalination plant that reduces its electricity use during the 4CP intervals could avert some or all of these charges
Another opportunity for seawater desalination plants to reduce their electricity costs is through adjusting operations in response to real-time electricity prices In 2015 the average electricity price in ERCOT was $2677MWh However prices exceeded $50MWh in 254 hours (3 of all hours) $100MWh in 88 hours (1) $200MWh in 40 hours (05) and $300MWh in 21 hours (02) Prices exceeded $3000MWh for 021 hours15 Depending on the desalination plantrsquos exposure to real-time wholesale market prices (via its retail contract) the degree of high prices the plant owner is willing to avoid and grid conditions in a given year reducing unit operations in order to avoid high electricity prices could impact operators for anywhere between a few and several hundred hours out of the year In addition a plant can plan its operations to take advantage of lower electricity prices during off-peak periods (eg at night when generation from wind is high) For example at least one company is marketing a modular desalination unit design intended to take advantage of low prices during periods of high renewables generation and to provide grid reliability services through demand response16
There are several factors to consider regarding these opportunities to reduce electricity costs The plant would need to monitor the ERCOT market or hire a contractor to do so in order to know when to reduce demand for electricity These programs do not impose any requirements on response time as with RRS or ERS and there may be sufficient warning of 4CP intervals or peak pricing to allow the plant operator to plan its operations earlier in the day with sufficient time to ramp down production under controlled conditions However quicker ramping capability may be desirable to respond to electricity price fluctuations
For 4CP because the four intervals used to set demand charges are not known ahead of time it is likely that the plant would need to reduce its demand multiple times per summer to ensure the 4CP intervals are hit impacting production at the facility Timing operations to coincide with off-peak pricing or to avoid price spikes would similarly result in reduced operations during certain hours To offset the lost production hours the plant may need to be designed with extra capacity and water storage capability to maintain the ability to meet its contractual obligations for freshwater delivery Because the period of reduced operations is greater than with ERCOT-dispatched demand response services this need would be greater for a seawater desalination plant reducing load during 4CP intervals or in response to real-time electricity prices and would increase the capital costs of the project It should also be noted that high prices in the ERCOT Region typically but not always occur in summer months when drought conditions are more likely to develop and demand for desalinated water is likely to be highest This may limit the flexibility of the plant to time its electricity consumption to avoid high-priced hours
14 Public Utility Commission of Texas ldquoTransmission and Distribution Rates for Investor Owned Utilitiesrdquo Available at httpwwwpuctexasgovindustryelectricratestdraspx 15 Potomac Economics June 2016 2015 State of the Market Report for the ERCOT Wholesale Electricity Markets Available at httpswwwpotomaceconomicscomindexphpmarkets_monitoredERCOT 16 Sisyan LLC ldquoDemand Response Desalinationrdquo Available at httprenewabledesalinationcomwpshycontentuploads201506Demand-Response-Desalinationpdf
copy 2016 ERCOT All rights reserved 10
Study on the Demand Response Potential for Seawater Desalination Projects ERCOT Public
In addition the plantrsquos ability to participate in demand response would also be limited for those hours it is reducing load as part of 4CP response or in response to real-time prices because the plant would not be able to reduce its electricity consumption if that demand is already committed to another demand response service Thus participating in demand response versus taking advantage of these other opportunities may be to some extent mutually exclusive
5 Conclusion
Based on this analysis it appears that the operational characteristics of seawater desalination plants would allow them to participate in demand response opportunities in ERCOT so long as the necessary operational requirements are considered in the design specifications of the plant Project developers should consider the necessary requirements early in the plant design Whether the economic benefits of participation would provide a sufficient incentive for them to do so will depend on the costs of accommodating those operational requirements and whether there is the flexibility available to operate the plant as necessary under these programs Though most existing seawater desalination plants do not participate in demand response programs it does appear that participation by these plants is possible and could result in a financial benefit Table 2 compares the different demand response opportunities available to demand-side resources in ERCOT
Table 2 Comparison of Demand Response Opportunities Demand Response
Opportunity Requirements for
Participation Impacts to Plant
Operations Financial Benefit Ancillary Services ndash Responsive Reserve Service (RRS)
bull Under-Frequency Relay bull Instantaneous or 10 minute
response time bull Recover load within 3
hours bull Bid in day-ahead market
bull Deployed once in 2015 for 10 minutes bull Subject to annual
unannounced testing
bull $1087 per MW per hour (based on 2015 prices)
Emergency Response Service (ERS)
bull 10 or 30 minute response time bull Recover load within 10
hours bull Four-month contract term
bull Not deployed in 2015 the most times ever deployed in a single year was twice in 2011 bull Subject to annual
unannounced testing
bull $645 per MW per hour (based on 2015 prices)
Four Coincident bull Interval Data Recorder bull Likely plant will need to bull Avoid ~$48000 per 4CP Peak (4CP) (IDR) meter
bull Ability to predict system-wide peak demand hours during summer months
reduce load multiple times per summer to hit 4CP intervals bull Likely to be able to predict
possible 4CP intervals earlier in day
MW per year (based on 2016 tariffs) if successful in reducing during all four summer months
LSE or DR Provider Contracted Price Response
bull Varies based on contractual arrangements
bull Varies based on contractual arrangements
bull Varies based on contractual arrangements
Self-Directed Price bull Retail contract with bull Varies depending on bull Varies depending on Response exposure to real-time
market prices bull Ability to monitor real-time
prices in ERCOT wholesale market
number and severity of pricing events bull May be able to predict
peak pricing events earlier in day
number and severity of pricing events
copy 2016 ERCOT All rights reserved 11
Study on the Demand Response Potential for Seawater Desalination Projects ERCOT Public
Demand response programs in ERCOT provide opportunities for demand-side resources to defray their electricity costs and provide reliability benefits to the ERCOT electric grid Because the process of seawater desalination is energy intensive participation in demand response could help to reduce electricity costs while posing a relatively low risk to plant operations if demand response participation is factored into plant design
Participation in non-ERCOT-dispatched demand response opportunities such as reducing load during 4CP intervals or in response to real-time electricity prices may also help to reduce electricity costs for seawater desalination plants in Texas As stakeholders in Texas continue to plan for possible future droughts in the region and identify water management strategies consideration of demand response could play a role in mitigating some costs associated with seawater desalination and allow seawater desalination plants to assist with maintaining electric reliability in the region
copy 2016 ERCOT All rights reserved 12
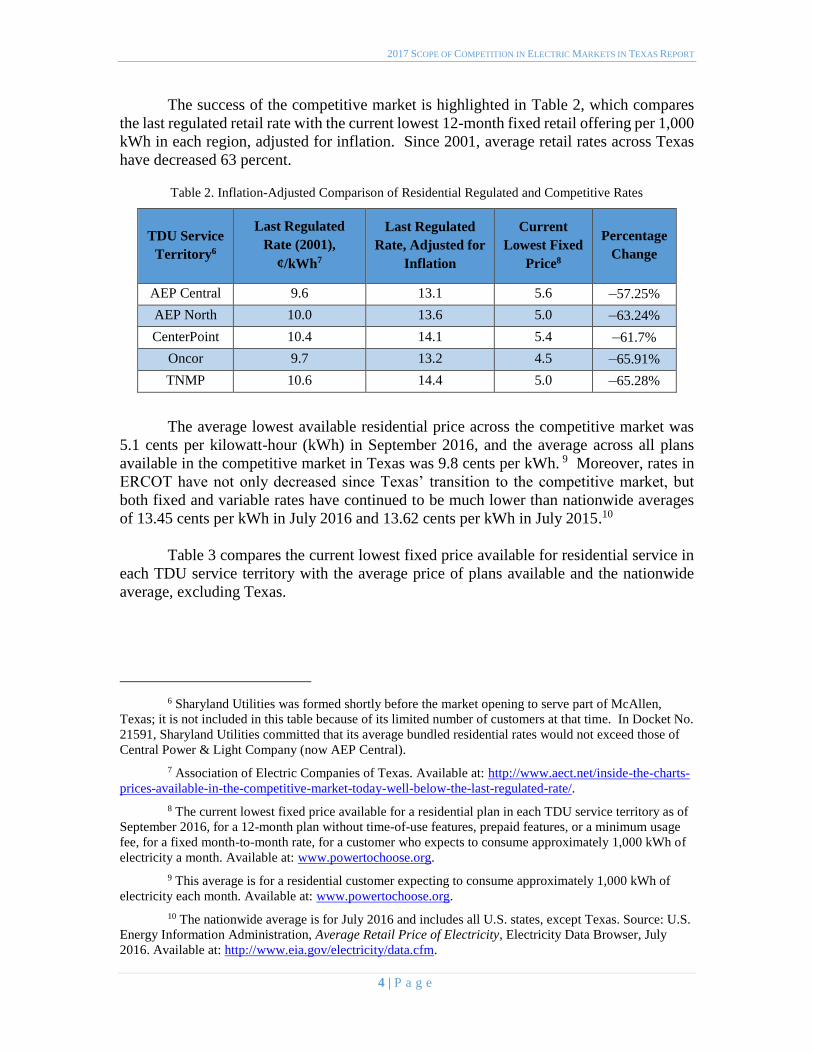
2017 SCOPE OF COMPETITION IN ELECTRIC MARKETS IN TEXAS REPORT
The success of the competitive market is highlighted in Table 2 which compares
the last regulated retail rate with the current lowest 12-month fixed retail offering per 1000
kWh in each region adjusted for inflation Since 2001 average retail rates across Texas
have decreased 63 percent
Table 2 Inflation-Adjusted Comparison of Residential Regulated and Competitive Rates
TDU Service
Territory6
Last Regulated
Rate (2001)
centkWh7
Last Regulated
Rate Adjusted for
Inflation
Current
Lowest Fixed
Price8
Percentage
Change
AEP Central 96 131 56 ndash5725
AEP North 100 136 50 ndash6324
CenterPoint 104 141 54 ndash617
Oncor 97 132 45 ndash6591
TNMP 106 144 50 ndash6528
The average lowest available residential price across the competitive market was
51 cents per kilowatt-hour (kWh) in September 2016 and the average across all plans
available in the competitive market in Texas was 98 cents per kWh 9 Moreover rates in
ERCOT have not only decreased since Texasrsquo transition to the competitive market but both fixed and variable rates have continued to be much lower than nationwide averages
of 1345 cents per kWh in July 2016 and 1362 cents per kWh in July 201510
Table 3 compares the current lowest fixed price available for residential service in
each TDU service territory with the average price of plans available and the nationwide
average excluding Texas
6 Sharyland Utilities was formed shortly before the market opening to serve part of McAllen
Texas it is not included in this table because of its limited number of customers at that time In Docket No
21591 Sharyland Utilities committed that its average bundled residential rates would not exceed those of
Central Power amp Light Company (now AEP Central)
7 Association of Electric Companies of Texas Available at httpwwwaectnetinside-the-charts-
prices-available-in-the-competitive-market-today-well-below-the-last-regulated-rate
8 The current lowest fixed price available for a residential plan in each TDU service territory as of
September 2016 for a 12-month plan without time-of-use features prepaid features or a minimum usage
fee for a fixed month-to-month rate for a customer who expects to consume approximately 1000 kWh of
electricity a month Available at wwwpowertochooseorg
9 This average is for a residential customer expecting to consume approximately 1000 kWh of
electricity each month Available at wwwpowertochooseorg
10 The nationwide average is for July 2016 and includes all US states except Texas Source US
Energy Information Administration Average Retail Price of Electricity Electricity Data Browser July
2016 Available at httpwwweiagovelectricitydatacfm
4 | P a g e
2017 SCOPE OF COMPETITION IN ELECTRIC MARKETS IN TEXAS REPORT
Table 3 Current Lowest and Average Residential Plans by TDU Service Territory
TDU Service
Territory
Current Lowest
Fixed Price
(centkWh)11
Current Average
All Available
Plans12
Nationwide
Average13
AEP Central 56 94
1345
AEP North 50 94
CenterPoint 54 91
Oncor 45 83
Sharyland ndash McAllen 56 98
Sharyland Utilities 45 133
TNMP 50 92
3 Customer Complaints
The Commissionrsquos rules permit a customer to file a complaint with the Commission
about their electric service The Commissionrsquos staff works with the customer and electric service provider to resolve the complaints first in an informal complaint process and then
directs the customer to a formal complaint process if the customer is dissatisfied with the
resolution The Commission keeps records of these complaints and evaluates the
complaint statistics as a barometer for analyzing company behavior and its effect on
customers The Commission uses the data to identify any company-specific trends work
with companies to address any issues or otherwise take enforcement action
From September 1 2014 to August 31 2016 the average number of days to resolve
a utility complaint was 18 days The slight decline in the number of electric complaints
received in 2015 through 2016 may be attributed to the mild winter weather which resulted
in lower overall prices as well as the absence of significant disruptions to electric service
Figure 2 shows the total complaints received from September 1 2014 to August 31 2016
11 The current lowest fixed price available for a residential plan in each TDU service territory as of
September 2016 for a 12-month plan without time-of-use features prepaid features or a minimum usage
fee for a fixed month-to-month rate for a customer who expects to consume approximately 1000 kWh of
electricity a month Source wwwpowertochooseorg
12 The average is for a residential customer expecting to consume approximately 1000 kWh of
electricity a month Source wwwpowertochooseorg
13 The nationwide average is for July 2016 and includes all US states except Texas Source US
Energy Information Administration Average Retail Price of Electricity Electricity Data Browser July
2016 Available at httpwwweiagovelectricitydatacfm
5 | P a g e
2017 SCOPE OF COMPETITION IN ELECTRIC MARKETS IN TEXAS REPORT
Figure 2 Total Electric Complaints Received September 2014 ndash August 2016
From September 1 2014 to August 31 2016 the Commission received 4465
electric complaints Billing complaints continue to be the greatest cause of customer
complaints with 42 of all electric complaints concerning billing issues Complaints
relating to the provision of service including customer service and the refusal of service
were the second highest cause of complaints at 15 Quality of service contributed to the
third-leading cause of complaints at 12 Complaints are broken down by category in
Figure 3
6 | P a g e
2017 SCOPE OF COMPETITION IN ELECTRIC MARKETS IN TEXAS REPORT
Figure 3 Electric Complaints Received by Category September 2014 ndash August 2016 14
4 Energy-Efficiency Programs
Energy-efficiency programs in Texas are administered by the TDUs in ERCOT and
the vertically integrated utilities outside of ERCOT pursuant to the Public Utility
Regulatory Act (PURA) sect39905 The utilities recover the cost of the energy-efficiency
programs through a surcharge on electric bills which are adjusted and approved annually
by the Commission Under the energy-efficiency programs TDUs reduced 559369 MWh
of electricity consumption in 2015 exceeding the goal for the year by 40 The energy-
efficiency programs are designed to reduce customersrsquo energy consumption as well as
electric peak demand In 2011 SB 1125 increased the peak demand goal reduction to a
30 growth in demand Once a utility reaches this goal the utility must achieve a
reduction of four-tenths of one percent of the utilityrsquos summer weather-adjusted peak
demand in subsequent years
The 2011 legislation also required that the Commission develop an evaluation
measurement and verification (EMampV) framework to promote effective program design
to provide consistent and streamlined reporting and to retain a third-party contractor to
conduct these activities EMampV efforts for the 2015 program year focused on evaluating
targeted programs for which the associated peak demand and energy savings were most
uncertain A primary component of EMampV is the statewide Technical Reference Manual
(TRM) a single common reference document prepared and maintained by the EMampV
contractor to estimate energy and peak demand savings resulting from the installation of
14 ldquoCrammingrdquo is the practice of adding unauthorized charges for any services to an electric bill without verified consent by the customer ldquoSlammingrdquo is the practice of switching the customer to another provider without authorization
7 | P a g e
2017 SCOPE OF COMPETITION IN ELECTRIC MARKETS IN TEXAS REPORT
energy efficiency measures sponsored by utility-administered programs in Texas In 2015
changes made to the TRM added and updated existing deemed savings values and added
standardized EMampV protocols for determining and verifying energy and demand savings
effective for the 2016 program year Verified demand and energy savings and program
costs for 2015 are shown in Table 4
Table 4 2015 Verified Energy Efficiency Savings15
MW MWh MW MWh
El Paso Electric 1231 22283 1116 19552 $4039278
Entergy Texas 1809 39688 1550 27156 $7023009
SPS 817 14537 549 9627 $3190744
SWEPCO 988 15262 560 9811 $3220359
Non-ERCOT Total 4844 91770 3775 66146 $17473390
AEP Central 4378 68482 1293 22653 $13261480
AEP North 454 12289 426 7464 $2727260
CenterPoint 16849 188255 5883 103069 $35832993
Oncor 11581 178908 6940 121589 $47438836
Sharyland 060 2528 100 1752 $633252
TNMP 866 17452 5770 10109 $4011627
ERCOT Total 34188 467915 15219 266636 $103905448
Grand Total 39033 559685 18994 332782 $121378838
Excludes Statewide EMampV contractor expenses of approximately $3M for review of prior program year
GoalProgram CostUtility
Verified Savings
In 2015 the utilities cumulatively achieved 206 of the demand reduction goal
(226 for utilities in ERCOT) and 168 of the energy reduction goal (175 for utilities
in ERCOT)
5 Customer Education Activities
The Commission engages with residential and small commercial electric customers
about retail electric competition through its ldquoTexas Electric Choicerdquo campaign and also informs customers about energy conservation opportunities through its ldquoPower to Save Texasrdquo campaign In addition to engaging with customers through these two campaigns
Commission staff also respond to customer inquiries and distribute literature about
electricity facts and issues
15 The non-ERCOT utilities within the state of Texas are El Paso Electric Company (ldquoEl Paso Electricrdquo) Entergy Texas Inc (ldquoEntergy Texasrdquo) Southwestern Public Service Company (ldquoSPSrdquo) and Southwestern Electric Power Company (ldquoSWEPCOrdquo)
8 | P a g e
2017 SCOPE OF COMPETITION IN ELECTRIC MARKETS IN TEXAS REPORT
a ldquoPower to Chooserdquo
The Commission educates customers about the evolving marketplace continuing
its ldquoTexas Electric Choicerdquo campaign which began in February 2001 with the goal of educating Texans about the changes and choices in the retail electric market The
PowerToChooseorg website and its Spanish-language counterpart PoderDeEscogerorg
provides a simple one-stop shop portal for Texans who live in a service territory open to
customer choice to enter in their zip code and browse through the numerous plans offered
by the REPs
b ldquoPower to Save Texasrdquo
In addition to the ldquoTexas Electric Choicerdquo campaign and the PowerToChoose website the Commission has also continued its statewide initiative ldquoPower to Save
Texasrdquo together with its parallel Spanish-language initiative ldquoPoder de Ahorrarrdquo which educates Texans about conserving energy during the summer peak times of 3 pm to 7
pm when the demand for electricity tends to be the highest The PowerToSaveTexasorg
website and its Spanish-language counterpart PoderDeAhorrarTexasorg provide Texans
with energy saving tips for homes and businesses
As part of the Power to Save Texas campaign the Commission contracted with
Resource Action Programs (RAP) to develop and implement a middle school energy
conservation outreach program in Hidalgo Harris Dallas and Tarrant counties In the
2015 ndash 2016 school year the program provided an effective energy education program
which strongly supports the Texas Essential Knowledge and Skills (TEKS) curriculum
standards as well as engages students through school challenges and at-home activities
c Campaign Outreach
PowerToChooseorg and its Spanish-language counterpart PoderDeEscogerorg
have proven valuable in educating customers about customer choice in the electricity
market The Commission conducted a number of activities to further promote the statersquos official electric choice website through social media community events trade shows and
expos From September 1 2015 through August 31 2016 nearly a million potential
customers visited the PowerToChooseorg and PoderDeEscogerorg websites Website
statistics are contained in Table 5
Table 5 Website Statistics September 2015 ndash August 2016
PowerToChoosecom Unique Visitors 980473
PoderDeEscogercom Unique Visitors 4652
d Low-IncomeElderly Outreach and Collaboration with Faith- and
Community-Based Organizations
Throughout 2015 and 2016 the Commissionrsquos staff also worked with legislative
offices and faith- and community-based organizations to provide educational materials and
training to help their constituents better understand the deregulated electric market and the
9 | P a g e
2017 SCOPE OF COMPETITION IN ELECTRIC MARKETS IN TEXAS REPORT
Commissionrsquos websites The Commission has actively participated with the Interagency
Coordinating Group (ICG) which was established by the Texas Legislature to expand and
improve relationships between state government and faith- and community-based
organizations Information on customer assistance programs such as LITE-UP Texas was
provided to community organizations such as Legal Aid of Northwest Texas senior
activity centers and religious groups
e Call Center
The Commission has trained its Customer Protection Division staff who are fluent
in both English and Spanish to answer customer calls and to assemble and mail
informational packets comparing electric plans when requested by customers without
Internet access From September 2015 to August 2016 the Customer Protection Division
staff handled 7663 calls from customers requesting assistance with shopping
f Educational Literature
In addition to the educational materials on the Commissionrsquos website the Commission provides brochures fact sheets and other educational materials by mail and
e-mail through a network of community organizations and events and in response to
customer requests to the call center Up-to-date fact sheets are available on the
Commissionrsquos website PowertoChooseorg and PoderDeEscogerorg as part of the
campaignrsquos outreach efforts The fact sheets provide information on a number of current
industry and consumer topics
Throughout 2015 and 2016 campaign educational materials promoting the
agencyrsquos programs including Power to Choose and Power to Save Texas were distributed
at numerous community events and civic town hall events such as Hurst-Euless-Bedford
ldquoBack 2 Schoolrdquo day Dickenson Housing Family Fair Energy Day DFW Family Fair
Earth Day Texas Texas Home and Garden shows in Houston Texas Black Expo National
Night Out events and minor league baseball games
Wholesale Market Development
The Commission engages regularly with ERCOT to oversee market developments
and ensure system supply reliability security and improved price formation and market
outcomes Market design changes made as a result of this working relationship have
created new opportunities for a variety of generation resources to enter the market and
supported the formation of wholesale prices that reflect real-time market conditions more
accurately and therefore improve the efficiency of the market
1 Wholesale Market Prices
Wholesale market prices have fallen in comparison to prices seen in the 2012 ndash 2014 period The ERCOT load-weighted real-time average price of energy in 2015 was
$2677 per Megawatt-hour (MWh) a 34 decrease from the average price in 2014 and a
decrease of 21 from the average seen in 2013
10 | P a g e
2017 SCOPE OF COMPETITION IN ELECTRIC MARKETS IN TEXAS REPORT
Falling wholesale prices are correlated with the current trend of lower natural gas
prices the primary fuel of many of the regionrsquos power plants The average Houston Ship Channel spot price for natural gas was 41 lower in 2015 than in 2014 decreasing from
$437MMBtu in 2014 to $258 in 2015 Through March the average price for 2016 has
fallen to $192MMBtu Natural gas price trends from September 2014 through August
2016 are shown in Figure 4
Figure 4 Monthly Average Natural Gas Prices September 2014 ndash August 2016
Monthly average wholesale electricity prices are shown in Figure 5 Load-
weighted prices are calculated by dividing the price at a load zone by the associated
demand This metric provides a useful proxy for the actual wholesale prices paid by load16
16 It is worth noting that most power in ERCOT is sold through various bilateral arrangements that
are designed to hedge daily real-time market price risk
11 | P a g e
2017 SCOPE OF COMPETITION IN ELECTRIC MARKETS IN TEXAS REPORT
Figure 5 Load-Weighted Average Real-Time Monthly Settlement Point Prices September 2014 ndash August 2016
Another component of the real-time price of electricity is the cost of transmission
congestion Transmission congestion occurs when there is insufficient transmission
capacity to dispatch energy in a least-cost fashion The recent build-out of additional
transmission lines in areas of high congestion has partially relieved the cost burden in these
areas particularly in West Texas where oil and gas production growth rapidly increased
the demand for electricity resulting in relatively higher zonal prices
2 Peak Demand
After the very high peak demand levels during the hot summer of 2011 peak
demand in ERCOT was lower in 2012 through 2014 In 2015 peak demand again
increased though not to 2011 levels with load exceeding 60000 MW for 330 hours and
exceeding 65000 MW for 91 hours as shown in Figure 6 below In 2016 ERCOT
experienced a record week in August which saw the previous record peak demand broken
six times and the ERCOT region hit its all-time peak demand of 71093 MW on August
11 2016
As peak demand has increased the recorded availability of generation supply in the
region during times of high load has decreased slightly Physical Responsive Capability
(PRC) analogous to the amount of reserves available on the system at any given time fell
below 3000 MW for 269 hours in 2015 up slightly from 213 hours in 2014 and 215
hours in 2013 but well below the 371 hours recorded during the 2011 summer
12 | P a g e
2017 SCOPE OF COMPETITION IN ELECTRIC MARKETS IN TEXAS REPORT
Figure 6 High Load Hours in ERCOT 2011 ndash 2016
As shown in Table 6 the ERCOT system peak demand was 69877 MW in 2015
up 5 from the 2014 peak and the 2016 ERCOT system peak demand increased 174
from the peak demand of the previous year
Table 6 ERCOT Peak Demand 2012 ndash 2016
Year
ERCOT Peak
Demand (MW)
Percentage Change
from Prior Year
2012 66548 ndash 2013 67245 105
2014 66454 ndash118
2015 69877 515
2016 71093 174
Figure 7 shows the hourly peak load for each month in ERCOT from January 2014 to
August 2016
13 | P a g e
2017 SCOPE OF COMPETITION IN ELECTRIC MARKETS IN TEXAS REPORT
Figure 7 Monthly Peak Demand in ERCOT January 2014 ndash August 2016
3 Generation Diversity
As electricity consumption has increased in ERCOT the diversity of the systemrsquos generation portfolio has also increased Generators participating in the statersquos renewable energy credit (REC) trading program reported an 11 increase in renewable generation
from 2013 to 2015 rising from 376 million MWh to 469 million MWh with wind
representing 96 of the total renewable mix Landfill gas was the second most prevalent
renewable source representing approximately 12 of all renewable generation in 2015
Energy produced from wind generation was up by 13 in 2015 from 2013 and solar
energy capacity more than doubled from 121 MW in 2013 to 288 MW in 2015 Coal-fired
generation has been steadily shrinking as a proportion of total generation declining from
37 of electricity produced in 2014 to 28 in 2015 Energy use in the ERCOT region by
fuel type for 2015 is shown in Figure 8
14 | P a g e
2017 SCOPE OF COMPETITION IN ELECTRIC MARKETS IN TEXAS REPORT
Figure 8 Energy Use in ERCOT by Resource Type 2015
The Commissionrsquos projects are further described in the following section of this report
15 | P a g e
2017 SCOPE OF COMPETITION IN ELECTRIC MARKETS IN TEXAS REPORT
III SUMMARY OF COMMISSION ACTIVITIES FROM 2015 TO 2016
Introduction
The Commission develops and modifies rules policies and procedures for the
competitive electric market in Texas in response to the technological advances in the
industry and the evolving needs of customers The Commission also continues to carry
out oversight of programs with which the Legislature has tasked it ndash such as energy
efficiency renewable energy and advanced metering infrastructure Within the
ERCOT region the monopoly wires-and-poles companies that provide transmission
and distribution services throughout the grid remain subject to traditional rate
regulation by the Commission The Commission continues to set rates for these
utilities as they are not subject to the forces of market competition This section
provides an overview of the Commissionrsquos activities in its oversight of the wholesale and retail electric markets as well as its governance over regulated electric utilities
Resource Adequacy
Resource adequacy is the long-term ability of the system to serve demand reliably
when consumption is highest given the available installed capacity load resources and
the operational reliability of the system Assessing resource adequacy requires comparing
the systemrsquos forecast installed capacity and load resources against the forecast peak
summer load The difference between the forecast of available generation and load
resources and the forecasted demand for electricity is referred to as an ldquoinstalled capacity
reserve marginrdquo which is an indicator of the ability of the system to meet customer demand
during peak conditions In addition to evaluating the forecast reserve margin assessing
resource adequacy includes evaluating the systemrsquos operational reliability The systemrsquos operational reliability depends on the ability of generators to manage plant operations
successfully as well as the grid operatorrsquos ability to manage the system to avoid or to mitigate load curtailment During 2015 and 2016 the ERCOT system performed well with
respect to resource adequacy The Commission has devoted significant attention to
ensuring that ERCOT maintains an adequate installed capacity reserve margin and a high
level of operational reliability developing a wholesale market design that allows
consumers to continue to receive low-cost and reliable electricity over the long term
1 Capacity Demand and Reserves Report
The Capacity Demand and Reserves (CDR) Report published by ERCOT semi-
annually is a snapshot estimate of long-term supply and demand and the associated annual
reserve margin for peak summer and winter conditions While the CDR Report is not a
forecast of any particular outcome it provides insight into possible resource adequacy
trends
16 | P a g e
2017 SCOPE OF COMPETITION IN ELECTRIC MARKETS IN TEXAS REPORT
The May 2016 CDR Report shows estimated reserve margins well above the
current target reserve margin of 1375 Installed capacity reserve margin estimates taken
from this CDR Report are shown below in Table 7
Table 7 May 2016 Capacity Demand and Reserves Report Forecast
Forecast 2017 2018 2019 2020 2021 2022 2023 2024 2025 2026
Peak Load
(MW)
68548 69409 70795 71420 72098 72792 73482 74168 74864 75704
Total
Capacity
(MW)
80995 87019 87238 87407 87678 87738 87738 87728 87728 87728
Reserve
Margin
182 254 232 224 216 205 194 183 172 159
2 Operating Reserve Demand Curve
In ERCOT the price signals produced by the energy-only wholesale electric market
should provide incentives to promote short-term reliability as well as induce optimal long-
run investment in new resources If the prices are efficient and reflect the full cost of
dispatching resources to meet demand the benefits that accrue to both consumers and
producers can be maximized at the least cost and new generating capacity (or load
resources) should develop to maintain the equilibrium as old resources retire or demand
increases
The Operating Reserve Demand Curve (ORDC) implemented at the Commissionrsquos direction in June 2014 improves price formation by allowing prices to more fully reflect
the value of operating reserves The ORDC assigns an economic value to operating
reserves or the amount of extra capacity available to maintain system reliability on a daily
basis
As part of its ongoing review of resource adequacy in ERCOT the Commission is
currently evaluating the accuracy of the inputs to the ORDC to ensure that its contribution
to price formation appropriately reflects the costs of meeting demand and the underlying
needs of the system
3 Transmission Congestion
Although competitive power producers and regulated transmission providers form
two distinct segments of the market transmission buildout has a direct effect on wholesale
power prices When there is insufficient transmission capacity to dispatch energy in a least-
cost fashion the system operator takes action to ensure that the physical limits of the
transmission system facilities are not violated The re-dispatch of generation because of
transmission limits results in disparate prices at different locations on the system In
comparison to prior years transmission congestion in ERCOT has lessened because of the
large increase in transmission investment and the reduction of high demand related to oil
and gas production in West Texas ERCOT and the Commission continually evaluate the
need for cost-effective additional transmission investment to manage congestion
17 | P a g e
2017 SCOPE OF COMPETITION IN ELECTRIC MARKETS IN TEXAS REPORT
4 Wholesale Market Design Initiatives
While the ERCOT wholesale market has been successful in attracting new resource
investment and also maintaining competitive prices for consumers certain improvements
to the market design could yield additional benefits in terms of efficient price formation
and opportunities for entry of new technology Initiatives already in place in many other
regions such as real-time co-optimization and multi-interval real-time resource dispatch
may allow existing capacity to be used more effectively and create opportunities for the
integration of additional load resources to serve electric demand The Commission
continues to work with ERCOT and interested stakeholders to determine the value of
implementing such enhancements particularly as ERCOTrsquos resource mix changes over time
5 Reliability Standard
In early 2014 the Commission opened a project to review its use of a target installed
capacity reserve margin based on a reliability standard equivalent to one loss-of-load event
every ten years In this project the Commission received written comment from interested
parties conducted a public workshop consulted with independent experts and reviewed
the application of reliability standards in other regions As a result of this review future
reliability metrics to be estimated in ERCOT will include the market equilibrium reserve
margin the economically-optimal reserve margin and the associated levels of expected
unserved energy The Commission believes that publishing these metrics represents an
improvement over reporting a one-event-in-ten-years standard by enhancing insight into
expected outcomes in ERCOTrsquos energy-only market
Non-ERCOT Utilities Market Development Activities
SB 7 the law that introduced retail competition to the Texas market in 1999
granted the Commission authority to delay retail competition in an area where deregulation
would not result in fair competition and reliable service because of the lack of an
independent organization to coordinate the electric system and the concentration of
ownership in the generation sector in some of those areas Consequently SB 7 included
provisions recognizing the difficulty of implementing retail competition in areas outside of
ERCOT Therefore the utilities outside of the ERCOT region remain vertically integrated
owning generation transmission and distribution assets as well as selling power to end-
use customers These vertically integrated utilities remain subject to traditional regulation
including rates set by the Commission and customer choice is not offered in the service
territories of these utilities
The Commission does continue to monitor ongoing activities in the non-ERCOT
portions of the state In 2015 the Legislature granted the Commission the authority to
retain counsel and consulting experts in order to participate in legal proceedings at the
Federal Energy Regulatory Commission (FERC) which has regulatory jurisdiction over
wholesale power sales and transmission rates outside of ERCOT This authority has
18 | P a g e
2017 SCOPE OF COMPETITION IN ELECTRIC MARKETS IN TEXAS REPORT
permitted the Commission to participate more effectively in FERC proceedings affecting
Texasrsquo utilities located outside of ERCOT
1 Southwest Power Pool
The Southwest Power Pool (SPP) is the Regional Transmission Operator (RTO) for
areas of Northeast Texas and the Texas Panhandle In Texas the utilities Southwestern
Electric Power Company (SWEPCO) Southwestern Public Service (SPS) and several
electric cooperatives and municipally owned utilities are in SPP In addition to these areas
of Texas the SPP footprint includes parts of New Mexico Arkansas Missouri Nebraska
Louisiana and all of Kansas and Oklahoma In 2015 SPP became the RTO for the
Integrated System and neighboring areas which includes parts of Iowa Minnesota North
Dakota South Dakota Wyoming and Montana SPP has spent extensive time and
resources over the last two years to integrate these new areas successfully The expansion
added 5000 MW of peak demand 7600 MW of generating capacity and 9500 miles of
transmission lines17
In 2014 SPP launched its new Integrated Marketplace which provides a Day-
Ahead Market a Real-Time Balancing Market and Congestion Hedging Markets
mechanisms similar to those available in ERCOT The implementation of the Integrated
Marketplace resulted in a savings of $422 million in 2015 As a result of the Integrated
Marketplace SPPrsquos planning reserve margin will be reduced from 136 to 12 a change
expected to save about $90 million annually
Chairman Donna L Nelson represents the Commission as a voting member on
SPPrsquos Regional State Committee (RSC) The RSC provides collective state regulatory
agency input on a variety of issues In addition the RSC has authority over the cost
allocation methodologies for transmission upgrades allocation of Financial Transmission
Rights and the approach used for resource adequacy across the SPP region The RSC
regularly meets on a quarterly basis and meets more frequently if necessary
2 Midcontinent Independent System Operator
The Midcontinent Independent System Operator (MISO) is an RTO that serves all
or part of 15 states in the central US one Canadian province and the portion of eastern
Texas served by the vertically integrated utility Entergy Texas Inc MISO provides a Day
Two market which has a variety of functions and services including energy and ancillary
service markets economic dispatch congestion management financial transmission rights
and transmission planning The MISO Independent Market Monitor concluded that the
MISO wholesale markets were competitive in 2015
Like SPP MISO is in the Eastern Interconnection which crosses state boundaries
and is therefore subject to FERC jurisdiction A number of recent FERC proceedings have
17 2015 Southwest Power Pool Annual Report Available at
httpswwwspporgdocuments37800201520southwest20power20pool20annual20reportpdf
19 | P a g e
2017 SCOPE OF COMPETITION IN ELECTRIC MARKETS IN TEXAS REPORT
affected the portion of Texas that is in the MISO footprint The Commission through
outside counsel has been an active party in such FERC proceedings FERC Docket No
ER14-1174 addressed in part a dispute regarding the availability of transmission capacity
under the Joint Operating Agreement between MISO and the SPP Ultimately FERC
approved a settlement agreement under which MISO will compensate SPP and its members
for using their or other entitiesrsquo transmission systems
In a related pending docket at FERC Docket No ER14-1736 parties are addressing
how the cost of these payments will be allocated among MISO market participants Parties
in this proceeding are engaged in settlement discussions In addition in Docket No ER14-
75-000 FERC approved a settlement agreement among the participating Entergy
Operating Companies and their retail regulators to terminate the Entergy System
Agreement effective August 31 2016 The settlement terms prohibit any post-termination
payments that roughly equalize production costs among the operating companies after
December 31 2015 terminate certain specific cross-purchase power agreements between
Entergy Texas and former Entergy Gulf State Louisiana and permit the continuation of
several other purchase power agreements
Commissioner Kenneth W Anderson Jr represents the Commission as a voting
member in the Organization of MISO States (OMS) the purpose of which is to coordinate
regulatory oversight among the states in the MISO region and to make recommendations
to MISO FERC and other entities Commissioner Anderson also represents the
Commission as a voting member of the Entergy Regional State Committee (ERSC) which
has certain FERC-approved authority for five years after the Entergy integration with
regard to cost allocation for Entergy transmission projects and adding transmission projects
to the Entergy construction plan The ERSC meets quarterly
3 Western Electricity Coordinating Council
The Western Electricity Coordinating Council (WECC) is a Regional Entity whose
region includes the area surrounding El Paso and extends from Canada to Mexico
including the provinces of Alberta and British Columbia the northern portion of Baja
California and all or portions of the 14 Western states in between WECC is the Regional
Entity responsible for Bulk Electric System reliability in the Western Interconnection and
associated compliance monitoring and enforcement WECC does not have organized
markets outside of California but is organized into 38 separate balancing authorities
WECC is geographically the largest and most diverse of the eight Regional Entities in the
United States with delegated authority from the North American Electric Reliability
Corporation (NERC) and the Federal Energy Regulatory Commission In Texas El Paso
Electric Company is a member of WECC
Rulemaking Activities
The Commission has continued to adopt new rules and modify existing rules in
order to further the continued successful operation of the competitive retail and wholesale
markets and to comply with statutory changes made to PURA by the Legislature This
20 | P a g e
2017 SCOPE OF COMPETITION IN ELECTRIC MARKETS IN TEXAS REPORT
section of the Report provides a high-level overview of the Commissionrsquos key rulemaking
activities highlighting the market improvements made in 2015 and 2016
1 Cost Recovery and Rate Adjustment
The Commission adopted new rule 16 TAC sect25246 on June 29 2016 to
implement Section Nos 1 through 3 of House Bill 1535 of the 84th Legislature The new
rule only applies to a utility that operates solely outside of ERCOT and allows for the use
of an update period beyond the test year for which the utility initially files estimated
information The rule clarifies that all information originally estimated must be updated
with actual information and also provides requirements for a post-test-year adjustment for
a natural gas-fired plant A non-ERCOT utility also is required to initiate a new base rate
case on or before the four year anniversary of the final order in the utilityrsquos most recent comprehensive base rate case or if the commission determines that the utility has
materially earned more than its authorized rate of return in two consecutive years The rule
also provides requirements and procedures for the relation back of final rates to an effective
date 155 days after the filing of the rate application
2 Changes to Certificates of Convenience and Necessity and CREZ Rule
The Commission conducted a rulemaking to implement changes pursuant to
Legislative mandates in SB 776 SB 933 and HB 1535 of the 84th Legislature SB 776
required municipally owned utilities to apply for a certificate of convenience and necessity
(CCN) before constructing transmission facilities outside the boundaries of the
municipality that owns the municipally owned utility SB 933 also requires persons to
obtain a CCN before interconnecting a tie line into the ERCOT grid HB 1535 requires the
Commission to issue a final order within 181 days for a non-ERCOT utility requesting a
CCN for an existing electric generating facility and 366 days after a non-ERCOT utility
files a CCN for a newly constructed generating facility In addition the Commission also
determined in this rulemaking that all future transmission projects in a Competitive
Renewable Energy Zone (CREZ) must meet the need criteria of PURA sectsect 37056(c)(1)
and (2) rather than being exempt Finally the Commission determined that the CREZ
project established in 2008 was complete following the installation of a second circuit on
a Sharyland line
3 Use of Handheld Device for Enrollment
As the market evolves the Commission evaluates market changes balancing its
desire to encourage customer-focused innovation with its concern for customer protection
against potential abuses In Docket No 44518 the Commission granted a REP a
temporary 12-month waiver from its rules requiring the marketer to obtain telephonic
verification of the customerrsquos desire to switch REPs as well as a waiver from certain authorization disclosure requirements among other stipulations the Commission placed
upon the REP The Commission then opened Project No 45625 to study the issue of REPs
utilizing hand-held devices for customer enrollment more broadly and engage with market
representatives consumer representatives and other stakeholders The Commission
anticipates considering an amendment to its rules in the spring of 2017
21 | P a g e
2017 SCOPE OF COMPETITION IN ELECTRIC MARKETS IN TEXAS REPORT
4 Smart Meter Texas Portal
The electric utilities in Texas that have advanced metering systems (AMS) jointly
own and operate a single web portal known as Smart Meter Texas (SMT)18 SMT fulfills
two requirements imposed by the Commissionrsquos advanced metering rule on a utility with
AMS (1) provide to the retail customer the REP serving the customer and other entities
authorized by the customer access to such retail customerrsquos consumption data and (2)
allow devices at the customerrsquos premises to communicate through a home area network with the advanced meter at the premises SMT also facilitates near real-time on-demand
reads of a customerrsquos meter that aids prepaid service offered by certain REPs
In Project No 42786 Review of Advanced Metering System Web Portal
Commission staff and stakeholders examined options for the long-term operational
structure governance and funding of SMT The Commission determined that ownership
of SMT should remain with the TDUs because they can operate the portal at a lower cost
than transferring the data repository to ERCOT The Commission opened two
rulemakings one to ascertain the appropriate governance performance and funding of
SMT and a second to determine the appropriate access for third parties ensuring that
customers have the freedom to grant and give third parties access to their data if made
knowingly while also securing customer privacy
Sharyland Utilities
In early 2015 customers of Sharyland Utilities the smallest investor-owned
transmission and distribution utility in ERCOT began to file with the Commission a
significant number of complaints regarding high electricity bills In response the
Commission opened Project No 44592 Relating to a Project Regarding Sharyland
Utilities to provide for a more formal process for Commission review of the large number
of complaints As part of this project Commission staff prepared a report to evaluate the
electricity rates and electric bills in the operating area of Sharyland Utilities that was
previously part of Cap Rock Energy
Staffrsquos report found that a number of factors contributed to the comparatively high
bills for many of Sharyland-Cap Rockrsquos customers First Sharylandrsquos small size and its low customer density result in high TDU rates for all customers relative to other TDUs In
particular Staffrsquos report found that Sharyland-Cap Rockrsquos rates for distribution service are
up to three times higher than those of other TDUs in Texas In addition to Sharyland-Cap
Rockrsquos high costs for distribution service higher wholesale transmission costs also
contributed to the rate increases charged to Sharyland-Cap Rockrsquos customers These transmission costs are the result of increased transmission investment in recent years
throughout Texas that has increased transmission costs for all distribution providers
18 The participating Texas TDUs are AEP Texas Central Company and AEP Texas North Company (jointly
ldquoAEPrdquo) CenterPoint Energy Houston Electric LLC (ldquoCenterPointrdquo) Oncor Electric Delivery Company LLC (ldquoOncorrdquo) and Texas-New Mexico Power Company (TNMP) collectively referred to as the ldquoJoint TDUsrdquo Operation of an AMS web portal was addressed in the orders approving particular utilitiesrsquo deployment of AMS and approving surcharges for AMS cost recovery While Sharyland Utilities filed comments in the proceeding it did not
participate as it had not fully completed its AMS deployment at the time
22 | P a g e
2017 SCOPE OF COMPETITION IN ELECTRIC MARKETS IN TEXAS REPORT
including Sharyland Utilities Second the comparatively colder winter of 2014 ndash 2015
which was the time period generally consistent with the timeframe in which the
Commission began receiving complaints appeared to result in higher electricity usage than
normal This combination of high TDU rates and the higher electricity usage led to higher
bills for customers
Staffrsquos report also noted that in Sharyland-Cap Rockrsquos last rate case in 2014 the
approved rates reflected movement towards more cost-based rates for all customers
including some customers that previously had been heavily subsidized by other customers
Additionally in the process of standardizing Sharyland-Cap Rockrsquos customer classification
with the classifications of the other TDUs in Texas some customers may have experienced
a move from one class that previously was paying below-cost rates to another class that
was now paying above-cost rates For some of these customers the combined effects of
the movement towards cost-based rates and the change to a different class may have
contributed to a significant change in the customersrsquo rates Regardless of any cost-shifting
between customer classes Sharylandrsquos rates remain two to three times higher than those of other TDUs in Texas for all customers in all classes
On December 4 2015 the Commission signed an order directing Sharyland to file
an application for a comprehensive rate review by April 30 2016 Sharyland filed its rate
application on April 29 2016 in Docket No 45414 Review of the Rates of Sharyland
Utilities LP On October 10 2016 the Commission ordered Sharyland to file an amended
application as soon as practicable but no later than January 1 2017 to reflect the unique
aspects of the companyrsquos organizational structure as a real estate investment trust (REIT) At the time of publication Sharyland is expected to file its amended application in
December 2016
PowerToChoose Website
As part of its ongoing evaluation of the competitive market the Commission
opened Project No 45730 to evaluate the functionality and usability of its PowerToChoose
website which allows customers to select a REP and an electric plan based on their zip
code In the process the Commission received significant feedback from customers stating
that the Commissionrsquos PowerToChoose website was an important tool that plays a
fundamental role in their shopping process In response to the feedback received from
industry representatives and consumers Commission staff changed how the website sorts
and filters retail electric plans adding a filter to allow customers to unselect plans that
contain minimum usage fees or credits This filter is now a default setting and plans with
minimum usage fees and credits are not shown unless the customer actively selects to
search for such plans In addition Commission staff made other changes to increase the
clarity of the REP complaint rating The Commission continues to evaluate other changes
to improve the customer experience of the PowerToChoose website and provide
transparency for retail electric plans
23 | P a g e
2017 SCOPE OF COMPETITION IN ELECTRIC MARKETS IN TEXAS REPORT
Report on Alternative Ratemaking Mechanisms
In 2015 the Legislature enacted SB 774 which requires the Commission or its
consultant to conduct a study and make a report to the Legislature analyzing the alternative
ratemaking mechanisms adopted by other states In addition SB 774 extended the
authorization for the Periodic Rate Adjustment (PRA) mechanism from 2017 to 2019
which the Legislature had authorized in 2011 (SB 1693) as a version of an alternative
ratemaking mechanism that provides to utilities a means for expedited recovery of
distribution infrastructure costs Pursuant to SB 774 the Commission retained a consultant
to produce the report and the consultantrsquos recommendations included streamlining the ratemaking process to reduce procedural costs providing for a periodic review of the
prudency of the costs and using certain types of alternative ratemaking mechanisms that
decouple the recovery of costs from variations in load The Commission held a public
hearing to receive comments on the report from stakeholders and after consideration of
those comments has provided to the Legislature the consultantrsquos report together with its
own discussion of the report
Request for Purchase of Oncor Electric Delivery Company
In March 2016 the Commission approved with conditions an application by an
investor group led by Hunt Consolidated Inc the owners of Sharyland Utilities to acquire
control of Oncor Electric Delivery Company (Oncor) the largest transmission and
distribution utility in Texas from Oncorrsquos parent company Energy Future Holdings which
is in bankruptcy The Commission approved the request subject to certain conditions
including stipulations regarding the organization of the new entities and treatment of tax
benefits The investor-led group subsequently declined to pursue the transaction that was
approved by the Commission
In September 2016 NextEra Energy which owns Florida Power amp Light received
approval from the United States Bankruptcy Court in Delaware for its plan to purchase
Oncor In October 2016 NextEra Energy filed an application with the Commission in
Docket No 46238 for approval of the proposed transaction The Commission will evaluate
the application to determine if the transaction is in the public interest
Integration of Lubbock Power and Light
In March 2016 the Commission opened Project No 45633 to study and identify
the issues related to the request of Lubbock Power and Light the statersquos third-largest
municipally owned utility to be integrated into ERCOT The Commission is currently
working with stakeholders ERCOT and SPP to determine the cost and benefits of any
potential switch by Lubbock Power and Light into ERCOT and whether such a switch is
in the public interest
24 | P a g e
2017 SCOPE OF COMPETITION IN ELECTRIC MARKETS IN TEXAS REPORT
Desalination Project ERCOT Studies
In 2015 the Legislature passed HB 4097 which directed the Commission and
ERCOT to study whether existing transmission and distribution planning processes are
sufficient to provide adequate infrastructure for seawater desalination projects and to study
the potential for desalination projects to participate in demand response opportunities in
the ERCOT market Pursuant to that direction ERCOT staff have prepared a report on the
feasibility of interconnection of large desalination projects and on opportunities for such
projects to participate in ERCOTrsquos demand response programs which is attached to this Report in Appendix B
Oversight and Enforcement Actions
The Commissionrsquos enforcement of statutes rules and orders applicable to entities
under its jurisdiction serves to protect consumers the electric markets the reliability of the
electric grid and to promote fair competition The Commissionrsquos enforcement efforts in the electric industry focus on violations of PURA the Commissionrsquos rules and ERCOT
protocols
During the period from January 2015 through August 31 2016 the Commission
assessed $3258500 in penalties against electric market participants Table 8 provides a
summary of electric industry Notices of Violation since January 2015 During 2015 and
2016 Commission staff opened 212 investigations for the electric industry and closed 177
investigations
Table 8 Notices of Violations
Violation Type Total Penalty Amount
Retail Market Violations $539000
Service Quality Violations $451500
Wholesale Market Violations $2268000
TOTAL $3258500
In addition to the imposition of administrative penalties the Commission uses other
enforcement mechanisms in exercising its enforcement duties including revoking a
companyrsquos certificate to operate In addition some companies may be required to relinquish a certificate as part of a settlement after enforcement action has proceeded
Table 9 provides a breakdown of the number of certificates revoked or relinquished In
2016 the Commission revoked the certificate of the REP TruSmart Energy
Table 9 Certificates Revoked or Relinquished
Type Number
Certificates Revoked 1
Certificates Relinquished 0
25 | P a g e
2017 SCOPE OF COMPETITION IN ELECTRIC MARKETS IN TEXAS REPORT
The Oversight amp Enforcement division also issues warning letters to companies in
the electric market when it determines that a violation occurred but given the
circumstances surrounding the violation and other mitigating concerns no administrative
penalty is warranted During 2015 and 2016 the Oversight amp Enforcement division issued
50 warning letters Finally the Commission generally seeks to reimburse money directly
to customers when appropriate In 2015 and 2016 the Commission ordered the
reimbursement of $8543596 to Texas electric customers
Table 10 Warning Letters
Warning Letter Type Number
Retail Market Warning Letter 8
Service Quality Warning Letter 1
Wholesale Market Warning Letter 41
TOTAL 50
In addition to its enforcement activities the Commission also enters into voluntary
mitigation plans with generators that request one through a contested case proceeding
pursuant to PURA sect15023(f) and 16 TAC sect25504(e) The Commission entered into one
voluntary mitigation plan during 2015 and 2016 in Docket No 44635
Low-Income Discount System Benefit Fund
The System Benefit Fund (SBF) was originally established in 1999 to fund
discounts to low-income customers customer education activities energy-efficiency and
weatherization and electric market oversight through a nonbypassable surcharge on retail
electric bills HB 1101 of the 84th Legislature provided that the SBF be sunset on
September 1 2017 by which time the SBF is intended to be exhausted In the 2016 Fiscal
Year (FY) $325521250 was appropriated in the SBF to provide a 25ndash31 percent discount
to low-income customers over a 12-month period
To assist the drawdown of the remaining balance HB 1101 authorized the
Commission to use any unexpended SBF balance in FY 2017 to assist low-income
customers The Commission estimates that the remaining SBF balance will be
approximately $17 million by August 31 2017 The Commission has determined that this
amount is insufficient to fund the rate reduction program however the Commission will
spend approximately $100000 to continue automatic enrollment in the program to provide
REPs a list of customers eligible to receive late fee waiver and deposit installment benefits
These two ancillary benefits of the rate reduction program will continue for the duration of
FY 2017
26 | P a g e
2017 SCOPE OF COMPETITION IN ELECTRIC MARKETS IN TEXAS REPORT
Homeland Security
The Commission assesses the efforts of ERCOT and utilities to defend against
mitigate and respond to the variety of risks that the modern electricity system faces The
Commission also meets with ERCOT utilities and governmental entities on an ongoing
basis to discuss preparation for everything from hurricanes and other severe weather to
cyber-threats and threats of physical damage to the grid from accidents or intentional
malfeasance In addition the Commission monitors industry and federal programs that
address homeland security issues
The Commission serves as an information liaison between state government and
electric utilities during emergencies The Commissionrsquos main roles include
Conveying outage and service restoration information from electric utilities to
state government
Conveying service restoration priorities (hospitals water treatment facilities
etc) from state government to electric utilities and
Facilitating the clearance of downed power lines in disaster re-entry areas and
facilitating entry of electric utilities into disaster areas
The Commissionrsquos Emergency Management Response Team (EMRT) provided staff at the
State Operation Center for the May 2015 and April 2016 flooding events in Texas as well
as additional staffing for severe winter weather
Demand Response
ERCOT staff have begun to report annually on the participation of customers in
REP-sponsored demand response programs These programs which have been facilitated
by the deployment of smart meters throughout the competitive areas within ERCOT and
by many municipal and cooperative electric utilities take the form of rebates for reduction
in usage during peak period time-of-use pricing real-time volumetric price compensation
for load reduction and direct control of customer load among other plans
These programs have seen dramatic increases in participation since ERCOT began
to gather this information in 2013 From 2013 to 2014 the number of residential customers
participating in these programs increased from 151793 to 721273 and the number of
commercial and industrial customers participating rose from 30275 to 50205 The
Commission continues to monitor ERCOTrsquos stakeholder process for efforts relating to the integration of demand response
27 | P a g e
2017 SCOPE OF COMPETITION IN ELECTRIC MARKETS IN TEXAS REPORT
IV LEGISLATIVE RECOMMENDATIONS
A Determination of Low-Income Customer Eligibility
In 2015 HB 1101 required that all remaining funds in the System Benefit Fund
(SBF) be expended that the fee that funded the program as a nonbypassable surcharge on
electric bills be set at zero and that the SBF be sunset on September 1 2017 Per the
provisions of HB 1101 the SBF fee was set at zero in September 2016 concluding the
funding for the program The sunset of the SBF program also concluded the relationship
between the Texas Health and Human Services Commission (HHSC) and the Commission
in which the HHSC provided to the Commission eligible electric customers for the SBF
low-income discount Because of the termination of the relationship with HHSC with the
termination of the SBF the Commission will no longer be able to determine easily an
electric customerrsquos eligibility for other low-income programs such as late penalty waivers
and the option of paying an electric deposit over multiple months
The Legislature may wish to consider easing low-income customers access to these
low-income programs by facilitating the process used to determine eligibility The
Commission offers four possible approaches in which the Legislature could continue these
low-income programs
(1) Authorize HSSC to provide identification of eligible low-income customers to the
Commission
(2) Allow retail electric providers (REPs) to provide such low-income programs using
the Low Income Discount Administratorrsquos (LIDA) Telecommunications Lifeline
Service Program list to identify low-income customers
(3) Require REPs to offer such low-income programs with customers self-enrolling
and REPs verifying income eligibility or
(4) Allow REPs to voluntarily provide such low-income programs at their own
discretion
B Outside Counsel for Proceedings before Regional Transmission
Organizations
Regional Transmission Organizations (RTO) manage the power grid across wide
regions of the United States Most of Texas is inside the ERCOT region however there
are significant portions of East Texas and the Panhandle that are in the Midcontinent
Independent System Operator (MISO) and the Southwest Power Pool (SPP) Issues arise
in these other RTOs that have significant impact on Texas ratepayers such as how
transmission infrastructure costs will be shared These tend to be very lengthy and
complicated proceedings that require specialized legal and consulting services
28 | P a g e
2017 SCOPE OF COMPETITION IN ELECTRIC MARKETS IN TEXAS REPORT
PURA sect 394525 currently authorizes the Commission to use outside consultants
auditors engineers or attorneys to represent the Commission in proceedings before the
Federal Energy Regulatory Commission This provision has been an important tool for the
Commission to respond to complex matters in the federal arena to enable it to protect the
public interest in Texas The PUC recommends that the Legislature expand the language
in this statute to include the ability to hire outside assistance for proceedings before other
RTOs to provide those same protections to Texas ratepayers in those areas
C Repeal of Natural Gas and Renewable Energy Mandates
1 Natural Gas
PURA sect 399044 establishes natural gas as ldquothe preferential fuelrdquo in Texas for electricity generation and requires the Commission to adopt rules to establish a system of
natural gas energy trading credits The majority of all new non-renewable electricity
generation constructed since 2000 for Texas has used natural gas as a primary fuel and this
trend is expected to continue in the foreseeable future The thresholds used to trigger the
natural gas energy trading credit system in PURA sect 399044 have not been reached and
they are not expected to be reached in the foreseeable future
Because natural gas-fueled facilities have been the most commonly built new
generation in Texas for many years and are expected to continue to be there is no need to
establish incentives for natural gas generation The PUC recommends that the Legislature
consider repealing PURA sect 399044 because it is no longer necessary
2 Renewable Energy
PURA sect 39904 establishes goals for renewable energy Subsection (a) requires
the installation of 5880 megawatts of renewable energy by 2015 and Subsection (b)
establishes a renewable energy credits trading program to implement the requirement The
5880 megawatts mandates in Subsection (a) was met in 2008 While the Commission
believes the renewable energy trading credit program is needed for retail electric providers
to validate renewable energy marketing claims the Commission believes the 5880
megawatts mandate in Subsection (a) is no longer necessary
D Advisory Opinions
Many regulatory agencies in Texas have authority to issue informal guidance to the
persons they regulate particularly with respect to outlining whether a particular course of
conduct would in the agencyrsquos view be consistent with the laws and regulations that the agency administers19 The issuance of an advisory opinion can provide regulatory clarity
to a company before making investments or conducting operations the permissibility of
which may be unclear under state law The Legislature may want to consider granting the
19 In addition certain federal agencies such as the Federal Communications Commission
Internal Revenue Service Securities and Exchange Commission and Federal Election
Commission have authority to issue advisory opinions
29 | P a g e
2017 SCOPE OF COMPETITION IN ELECTRIC MARKETS IN TEXAS REPORT
Commission the authority to issue advisory opinions In the electric industry providing
clarification to a company concerning issues such as the purchase of assets or the
acquisition of another company could allow it to avoid expensive regulatory proceedings
without impairing the Commissionrsquos authority The following state agencies have statutory authority to issue advisory opinions
Texas Ethics Commission20
Texas Medical Board21
State Board of Dental Examiners22
Texas Board of Nursing23
Texas Board of Professional Engineers24
Texas Lottery Commission and25
Texas Securities Board26
E Administrative
Gross Receipts Assessment
PURA sect 16001 provides for a gross receipts assessment that is used to defray the
expenses incurred by the Commission to administer PURA An assessment of one sixth of
one percent is collected from public utilities electric cooperatives retail electric providers
and interexchange carriersrsquo gross receipts from consumers The funds from this assessment
are remitted to the general revenue fund but currently they have not been explicitly
dedicated to funding of the Commission In contrast similar assessments on water
utilities insurance companies and other regulated entities have traditionally been used to
explicitly fund the underlying regulatory programs at the respective agencies The
Commission is one of four Article VIII agencies that is not designated as self-funded
The Commission recommends that the Legislature designate the Commission as a
self-funded agency whereby the collected assessments would be explicitly dedicated to the
funding of the agency Implementing this recommendation would require the Public Utility
Commission to be included in the Appropriations Limited to Revenue Collections rider
located in the Special Provisions Relating to All Regulatory Agencies section of the
General Appropriations Act Designation as a self-leveling agency would require the
Commission to set the gross receipts assessment at a rate sufficient to generate revenue in
the amount of the agencyrsquos general revenue appropriation each fiscal year which would require a statutory change to PURA sect16001(b) Based upon the Commissionrsquos baseline budget request authorizing the PUCrsquos self-leveling designation would result in an overall
estimated tax reduction of $456 million per year or 774
20 Government Code sect 571091 21 Occupations Code sect 162107 22 Occupations Code sect 258157 23 Occupations Code sect 301607 24 Occupations Code sect 1001601 25 Occupations Code sect 2001059 26 Tex Rev Civ Stat Ann Arts 581-28-1 amp 581-35 7 Tex Admin Code 1012
30 | P a g e
2017 SCOPE OF COMPETITION IN ELECTRIC MARKETS IN TEXAS REPORT
V APPENDICES
31 | P a g e
2017 SCOPE OF COMPETITION IN ELECTRIC MARKETS IN TEXAS REPORT
Appendix A ndash Acronyms
AEP American Electric Power
AMS Advanced Metering System
CenterPoint CenterPoint Energy Houston Electric LLC
DG Distributed Generation
DRG Distributed Renewable Generation
ERCOT Electric Reliability Council of Texas
ERSC Entergy Regional State
ERS Emergency Response Service
ETI Entergy Texas Inc
IMM ERCOT Independent Market Monitor
kWh Kilowatt-hour
LMP Locational Marginal Pricing
LSP Large Service Provider
MISO Midwest Independent System Operator
MMBtu One million British Thermal Unit (BTU)
MW Megawatt
MWh Megawatt-hour
Nodal Texas Nodal Market Design
ORDC Operating Reserve Demand Curve
PGC Power Generation Company
POLR Provider of Last Resort
PURA Public Utility Regulatory Act
REP Retail Electric Provider
RSC Regional State Committee
RTO Regional Transmission Organization
SCED Security Constrained Economic Dispatch
Sharyland Sharyland Utilities LP
SBF System Benefit Fund
SPP Southwest Power Pool
TDU Transmission and Distribution Utility
TNMP Texas-New Mexico Power Company
32 | P a g e
2017 SCOPE OF COMPETITION IN ELECTRIC MARKETS IN TEXAS REPORT
Appendix B ndash ERCOT Desalination Report
This page intentionally left blank
33 | P a g e
ERCOT Public
Study on the Demand Response Potential for Seawater Desalination Projects
ERCOT November 18 2016
Study on the Demand Response Potential for Seawater Desalination Projects ERCOT Public
Executive Summary
In 2015 the 84th Texas Legislature enacted House Bill (HB) 4097 which included several provisions relating to seawater desalination projects including a requirement that the Public Utility Commission of Texas (PUC) and Electric Reliability Council of Texas (ERCOT) study the potential for seawater desalination projects to participate in existing demand response opportunities in ERCOT There are several demand response products in which demand-side resources (ie consumers of electricity) can participate These programs help to preserve system reliability and provide economic benefits to participating demand-side resources Seawater desalination is an energy-intensive process that removes salt and other minerals from salt water to produce fresh water for municipal consumption industrial use or irrigation Participation in demand response could help mitigate electricity costs for future seawater desalination projects in Texas and provide reliability benefits to the grid
There are two main demand response reliability-based services administered by ERCOT participation by demand-side resources in the Ancillary Services market and the Emergency Response Service (ERS) Within the Ancillary Services market the most common service provided by demand-side resources is Responsive Reserve Service (RRS) which requires resources to respond either instantaneously or within 10 minutes in response to unplanned system emergencies ERS is separate from ERCOTrsquos Ancillary Services market and allows demand-side resources and distributed generation to provide reliability services in the event of an energy emergency Resources can qualify for either the 10-minute or 30-minute response time ERS programs
There are several key considerations that will impact a demand-side resourcersquos ability to participate in different demand response opportunities response time recovery time predictability of electrical demand and flexibility of operations Considering these factors together it appears that seawater desalination plants could be designed to meet the requirements for participation in demand response Because the ability to meet the qualification requirements is dependent on the plant design demand response opportunities should be considered early in a projectrsquos development if participation is desirable
Whether project developers will choose to address these requirements will depend on the economic benefits of participation There may be additional costs to design seawater desalination plants to operate in the manner required in order to participate in demand response These include costs associated with additional plant design specifications need for excess capacity and storage to make up for lost production during demand response deployment operational costs resulting from interruptions to plant processes and potential financial penalties if demand response deployment results in failure to meet contract demands The interplay of the benefits of participation and these costs will determine whether it would be beneficial for a future seawater desalination plant to participate in demand response in ERCOT
To date participation of seawater desalination plants in demand response programs has been limited Because the process of seawater desalination is energy-intensive participation in demand response could help to reduce electricity costs while posing a relatively low risk to plant operations As stakeholders in Texas continue to plan for possible future droughts in the region and identify water management strategies consideration of demand response could play a role in mitigating some costs associated with seawater desalination and allow seawater desalination plants to assist with maintaining electric reliability in the region
copy 2016 ERCOT All rights reserved i
Study on the Demand Response Potential for Seawater Desalination Projects ERCOT Public
Table of Contents
1 Introduction 1
2 Seawater Desalination 2
21 Seawater Desalination Plant Operations 2
22 Seawater Desalination Plant Economics 3
3 Demand Response Opportunities in ERCOT 4
31 ERCOT-Dispatched Demand Response 4
311 Ancillary Services Markets 5
312 Emergency Response Service (ERS) 5
32 Non-ERCOT-Dispatched Demand Response 6
321 Four Coincident Peak (4CP) 6
322 LSE or DR Provider Contracted Price Response 6
323 Self-Directed Price Response 6
4 Demand Response Potential for Seawater Desalination 7
41 Operational Considerations for ERCOT-Dispatched Demand Response 7
42 Economic Considerations for ERCOT-Dispatched Demand Response 8
43 Considerations for Non-ERCOT-Dispatched Demand Response 9
5 Conclusion 11
copy 2016 ERCOT All rights reserved ii
Study on the Demand Response Potential for Seawater Desalination Projects ERCOT Public
1 Introduction
In 2015 the 84th Texas Legislature enacted House Bill (HB) 4097 which included several provisions relating to seawater desalination projects including a requirement that the Public Utility Commission of Texas (PUC) and Electric Reliability Council of Texas (ERCOT) study the potential for seawater desalination projects to participate in existing demand response opportunities in ERCOT ERCOT and the PUC initiated this study to fulfill that requirement and evaluated the operational and economic characteristics of seawater desalination plants in light of ERCOTrsquos primary demand response products1
ERCOT is the independent system operator (ISO) for the ERCOT Interconnection which encompasses approximately 90 of demand for electricity in Texas ERCOT is the independent organization established by the Texas Legislature to be responsible for the reliable planning and operation of the electric grid for the ERCOT Interconnection ERCOT also administers and maintains a forward-looking open market to provide affordable and reliable electricity to consumers in Texas In collaboration with market participants ERCOT has developed demand response products and services for customers that have the ability to reduce or modify electricity use in response to instructions or signals These programs help preserve system reliability and provide economic benefits to participating demand-side resources
The process of seawater desalination removes salt and other minerals from salt water to produce fresh water for consumption industrial processes or irrigation The drought-prone Texas climate coupled with projections for increasing water demand in the state has created interest in seawater desalination as a future water source The 2017 Texas State Water Plan includes seawater desalination as a future water management strategy for water users in the state However the seawater desalination process is energy intensive and electricity consumption can be a significant cost driver for these projects To the extent that these plants could participate in demand response it would help to defray these costs Thus there is a potential nexus between seawater desalination projects built in Texas to mitigate drought but which have large electricity requirements and ERCOT demand response opportunities which could help to reduce their electricity costs and provide reliability benefits
This study evaluates the demand response potential of seawater desalination plants based on their operational characteristics and economic drivers The report is organized as follows
Section 2 provides background on typical seawater desalination plant operations and economics
Section 3 describes the current demand response opportunities in ERCOT
Section 4 evaluates the characteristics of seawater desalination plants to determine their potential to participate in demand response opportunities in ERCOT and
Section 5 provides a summary of the conclusions of this study
1 In the course of developing this report ERCOT consulted with several desalination experts with experience with existing or planned seawater desalination plants in the US The technical experts consulted included Jorge Arroyo (Water Management Consultant) Andrew Chastain-Howley (Black amp Veatch) Jonathan Loveland (Black amp Veatch) Ron Parker (Black amp Veatch) John Wolfhope (Freese and Nichols) and Srinivas Veerapaneni (Black amp Veatch)
copy 2016 ERCOT All rights reserved 1
Study on the Demand Response Potential for Seawater Desalination Projects ERCOT Public
2 Seawater Desalination
There are two primary methods for seawater desalination distillation (also referred to as ldquothermalrdquo) and reverse osmosis Distillation uses heat to remove salts and minerals from seawater by boiling water at high pressures In contrast reverse osmosis technology forces saline water through a membrane to separate water from the salts and minerals While both distillation and reverse osmosis are energy intensive distillation requires thermal energy to heat the water and overall has a higher energy requirement whereas reverse osmosis requires primarily electrical energy and overall is less energy intensive ndash though still with significant electricity requirements
Globally most thermal desalination plants are located in the Middle East due to low energy prices in the region Plants located elsewhere including in the US typically use reverse osmosis technology2 There are two large existing seawater desalination plants in the US one in Carlsbad California providing water to the San Diego area and one in Gibsonton Florida providing water to the Tampa Bay area Both plants use reverse osmosis technology In addition there are several desalination projects currently in the planning stages or under development in Texas in the Corpus Christi area that would use reverse osmosis technology For that reason this report focuses on reverse osmosis technology in the evaluation of demand response potential of seawater desalination plants
While there are currently no existing seawater desalination plants in Texas there are several municipal and industrial brackish water desalination plants in the state According to the Texas Water Development Board (TWDB) there are 46 municipal brackish water desalination plants with capacities greater than 0025 million gallons per day (MGD) in Texas representing a total of 123 MGD of capacity3 The desalination of brackish water is typically less expensive compared to seawater due to the lower relative salinity of brackish water This study focuses exclusively on seawater desalination consistent with the requirements of HB 4097 but it should be noted that conclusions may also apply to brackish water desalination though at a different cost and scale
This section provides high-level information on the operations (Section 21) and economics (Section 22) of seawater desalination plants to inform the discussion of their demand response potential in Section 4
21 Seawater Desalination Plant Operations Seawater desalination plants typically range in capacity from less than 5 MGD up to 165 MGD For example the Carlsbad seawater desalination plant has a capacity of approximately 50 MGD and the plant in Tampa Bay has a capacity of approximately 25 MGD The associated electricity consumption ranges between 10 and 15 kWh1000 gallons produced depending on the salinity of the water being processed456 More saline water (eg seawater) requires larger amounts of electricity for desalination Thus a seawater desalination plant would have larger electricity consumption requirements compared to a similarly sized brackish water desalination plant
2 American Water ldquoInnovation Solutions within the Water Industry Desalinationrdquo Available at httpwwwamwatercomfilesInnovationsSolutionsWithinTheWaterIndustryDesalinationpdf 3 Texas Water Development Board ldquoDesalination Factsrdquo Available at httpswwwtwdbtexasgovinnovativewaterdesalfactsasp 4 American Membrane Technology Association April 2016 ldquoMembrane Desalination Power Usage Put in Perspectiverdquo Available at httpwwwamtaorgcomwp-contentuploads7_MembraneDesalinationPowerUsagePutInPerspectivepdf 5 Water Reuse Association November 2011 ldquoSeawater Desalination Power Consumptionrdquo Available at httpswatereuseorgwpshycontentuploads201510Power_consumption_white_paperpdf 6 Ghaffour N TM Missimer and G Amy January 2013 ldquoTechnical review and evaluation of the economics of water desalination Current and future challenges for better water supply sustainabilityrdquo Desalination 309 pp197-207 Available at httpswwwresearchgatenetpublication256693140_Technical_review_and_evaluation_of_the_economics_of_water_desalination_ Current_and_future_challenges_for_better_water_supply_sustainability
copy 2016 ERCOT All rights reserved 2
Study on the Demand Response Potential for Seawater Desalination Projects ERCOT Public
While the two existing seawater desalination plants in the US were co-located with power plants to ease compliance with regulations on water intake and discharge structures and reduce costs many other reverse osmosis desalination plants receive their electricity from the grid However plants may have on-site backup generation in case of a power outage This will vary depending on the size and design of the plant and other factors For example the Carlsbad plant in California does have diesel backup generation to power control systems and flushing systems in the case of a power outage The plant in Tampa Bay was not built with backup power due to potential storm surge risks from hurricanes and other storms The plant does use uninterruptible power supply (UPS) backup to power control systems during power outages
Reverse osmosis plants are typically designed with several ldquotrainsrdquo which consists of a high-pressure pump turbine and reverse osmosis membrane Desalination plants are turned on or off one train at a time in a highly controlled process The process of ramping up or down an individual train under normal operations typically takes one to two hours While plants can be designed to handle immediate shutdowns (ie in a power outage) re-starting a system after an interruption would take this amount of time In addition the saline water must be pretreated (ie filtered) before going through the reverse osmosis train and this can sometimes pose constraints on the flexibility of operations
Demand for water is the key factor driving the level of production at seawater desalination plants Typically the plant will have a contract or contracts with municipal or other water users to deliver desalinated water and is operated to meet that demand Alternatively if the plant is municipally owned it would similarly be operated to meet the level of water demand in conjunction with other available water sources If water demands are close to a plantrsquos full capacity the operatorrsquos flexibility to adjust its electricity consumption as part of demand response may be limited However this does mean that plant operations are fairly predictable on a day-to-day basis which is necessary for participation in demand response
The amount of flexibility in plant operations will also be impacted by the amount of water storage available For example if a plant has sufficient water storage on-site or storage within the customerrsquos distribution system it could provide flexibility for the plant to reduce its operations during peak hours when electricity prices are likely to be highest It would also mitigate the impacts of interruptions to production from demand response deployments
22 Seawater Desalination Plant Economics Seawater desalination is typically more expensive than other sources of water and a major driver of the overall cost is energy costs In 2016 the Carlsbad plant charged rates at between $2131 and $2367 per acre-foot78 This charge is intended to cover both the fixed costs of the plant and the variable costs to produce a unit volume of water Typically half to two thirds of the cost of providing desalinated seawater are accounted for by capital cost recovery with the remainder accounted for by operations and maintenance costs including electricity costs Electricity costs can account for 20shy25 of the total costs of seawater desalination with reverse osmosis technology9
Factors affecting the capital cost of a seawater desalination plant include plant size type of desalination process and pre-post-treatment technologies plant infrastructure (eg piping water storage backup power) and compliance with applicable regulations (eg regulations on intake structures brine byproduct disposal) A significant driver of operating and maintenance costs is membrane replacement Reverse osmosis membranes need to be replaced every few years and
7 Source San Diego County Water Authority ldquoSeawater Desalinationrdquo Available at httpwwwsdcwaorgseawater-desalination 8 Note that 1 acre-foot is approximately 325851 gallons 9 Based on technical input from Black amp Veatch
copy 2016 ERCOT All rights reserved 3
Study on the Demand Response Potential for Seawater Desalination Projects ERCOT Public
the rate at which they are replaced will depend on the salinity of the feedwater and how the plant is operated Treatment and disposal of the salty brine byproduct from desalination may also incur operating costs
Electricity costs will vary depending on a range of factors including the size of the plant type of desalination technology source of electricity and quality of the feedwater As previously noted more saline water requires higher amounts of electricity in desalination and thus the amount of electricity consumption is a key difference between brackish water and seawater desalination As a result electricity costs comprise a significant share of the costs of seawater desalination These costs could potentially be defrayed in part by participation in demand response initiatives
3 Demand Response Opportunities in ERCOT
Broadly speaking demand response can be broken down into two major categories dispatchable or non-dispatchable For purposes of this report we will define dispatchable as those demand response events that are initiated by ERCOT and non-dispatchable as an event not specifically initiated by ERCOT These non-dispatchable events may include decisions made by the end-use customer to alter its consumption pattern or may include contractual obligations with another entity such as the end-use customerrsquos retail electric provider (ldquoREPrdquo) to alter consumption patterns
ERCOTrsquos wholesale market is open to several types of dispatchable demand response which are deployed to maintain system reliability Demand-side resources providing Emergency Response Service (ERS) may offer based on either a 10 or 30-minute response time commonly referred to as the ldquoramp periodrdquo Alternatively demand-side resources may register and qualify as a Load Resource that can provide Reserves in the Ancillary Services market The most common service provided by demand-side resources is Responsive Reserve Service which requires an under-frequency relay that can instantaneously interrupt the load during certain system reliability events Some demand-side resources can also participate in other Ancillary Services as Controllable Load Resources that require sophisticated control systems that allow them to be deployed in a more incremental proportional manner
Non-dispatchable demand response in ERCOT can include a response to avoid transmission costs where rates are based on Four Coincident Peak Pricing (4CP) response to wholesale energy prices initiated by the customer or by a REP or other load-serving entity (ldquoLSErdquo) or utility-managed Load Management programs (LM)
The sections that follow provide a description of both ERCOT-dispatched (Section 31) and nonshyERCOT-dispatched (Section 32) demand response For a more detailed description of opportunities for demand-side resources to participate in demand response in ERCOT see ERCOTrsquos guide Load Participation in the ERCOT Nodal Market10
31 ERCOT-Dispatched Demand Response There are two main demand response reliability-based services administered by ERCOT participation by demand-side resources in the Ancillary Services market and participation in ERS These services are dispatched by ERCOT during system emergencies
10 Available at httpwwwercotcomcontentservicesprogramsloadLoad20Participation20in20the20ERCOT20Nodal20Market_302d oc
copy 2016 ERCOT All rights reserved 4
Study on the Demand Response Potential for Seawater Desalination Projects ERCOT Public
Demand-side resources with demand response capability that can meet a set of performance requirements can be qualified to provide Ancillary Services as Load Resources in the Ancillary Services Market The value of having a Load Resource available to reduce load is equal to the value of having a generator available to increase its generation at a generating plant The providers of operating reserves selected to provide Ancillary Services are eligible for capacity payments regardless of whether the Resource is actually deployed (or curtailed in the case of the Load Resource)
ERCOT holds auctions on a daily basis for each of the following Ancillary Services Regulation Up Regulation Down Responsive Reserve and Non-Spinning Reserve11 Table 1 describes the various Load Resource types and their qualification requirements and eligible services
Table 1 Load Resource Types and Ancillary Services
Service Load Resource Type a Qualification Responsive Reserves (le50 of total Reserve requirement)
Non Controllable Under-Frequency Relay and 10-minute ramp to manual dispatch instruction
Responsive Reserves
Controllable Primary Frequency Response and follow 5-minute dispatch instructions
Regulation-Up Regulation-Down
Controllable Primary Frequency Response and respond to Regulation deployments
Non-Spin Reserves Controllable Follow 5-minute dispatch instructions a A Controllable Load Resource is a Load Resource capable of controllably reducing or increasing consumption under dispatch control by ERCOT
Demand-side resources that agree to reduce load when directed by ERCOT and that meet other metering and operational requirements as specified in the ERCOT Protocols may participate in Ancillary Services market auctions As noted in Table 1 the type of Ancillary Service that a Load Resource may provide will depend upon the demand-side resourcersquos response time and metering system as well as other requirements described in the Protocols In the Responsive Reserve and Non-Spin Reserve markets the Load Resource will receive capacity payments regardless of whether or not the load was actually deployed but the load must be available for deployment at any time while providing the service
ERCOT procures ERS to maintain grid reliability during emergency conditions and reduce the likelihood of the need for rotating outages ERS participants may offer to provide demand response with either a 10-minute ramp period requirement (similar to Load Resources providing Responsive Reserve Service) or a 30-minute ramp period requirement ERS Resources do not have the same telemetry and under-frequency relay requirements as Load Resources
11 Regulation Up and Regulation Down service respond to signals from ERCOT every 4 seconds to respond to changes in system frequency full response has to be provided within 5 minutes Responsive reserves must provide their committed capacity either instantaneously in an under-frequency event (eg due to a generator outage) or in energy scarcity conditions within ten minutes following an instruction from ERCOT Non-spinning reserves must provide their committed capacity within 30 minutes based on economic dispatch instructions Non-spinning reserve is used as replacement reserve to replenish other ancillary services and during energy scarcity
copy 2016 ERCOT All rights reserved 5
Study on the Demand Response Potential for Seawater Desalination Projects ERCOT Public
ERS is procured through a request for proposal (RFP) process three times per year for four-month contract terms each of which is further split into smaller time periods based on business cycles and other factors Demand-side resources may choose to submit offers in all time periods or only in those that best fit their unique circumstances and may vary both the price and demand response capacity offers by time period
Payments for ERS are performed up to 80 days after each four month contract term has ended and are subject to downward revision based upon delivered demand response capacity and the demand-side resourcersquos availability during the contract term
32 Non-ERCOT-Dispatched Demand Response The options listed below are not dispatched by ERCOT but they either are controlled directly by a customer or are dispatchable by another entity such as a demand response provider (ldquoDR Providerrdquo) REP or a transmission and distribution utility
Many industrial customers are subject to transmission charges based upon a Four Coincident Peak (4CP) demand The 4CP demand is determined by averaging the consumerrsquos actual demand during the 15-minute settlement interval with the highest ERCOT demand during each of the four summer months (June through September) This measured 4CP demand serves as the basis for the customerrsquos transmission tariff charges for the following year By correctly predicting the ERCOT system peaks during the summer and curtailing load during those intervals a consumer can help reduce the stress imposed on the electric system during peak periods of consumption and reduce its transmission charges for the following calendar year
In the competitive areas of ERCOT consumers can contract with their REP or a DR Provider to have their load respond to the REPrsquos or DR Providerrsquos instructions The contract will usually outline the parameters of this response ndash at what times and frequency demand response events can be called ramp periods sustained response periods compensation etc Because this response is a contractual matter between the REP or DR Provider and the consumer a great deal of variety can be present in these arrangements For example a consumerrsquos response may be voluntary or required compensation could come in the form of reduced energy prices or rebate payments for each curtailment event consumers might be notified up to a day in advance or could have no notification at all (for automated curtailment)
In areas of ERCOT not open to competition interruptible tariffs may be available These tariffs will usually offer a reduced energy price for defined curtailment obligations
REPs may offer dynamic pricing options or consumers within a municipality or cooperative may have their energy prices determined by a published tariff which also may be structured based upon Time-of-Use (TOU) or have a Critical Peak Pricing (CPP) or Peak Time Rebate (PTR) component Self-directed price response refers to consumers making an independent decision to respond to energy prices contained in a governing tariff or in either the ERCOT Day Ahead or Real Time energy markets
TOU offerings will typically have higher energy prices during normal peak periods ndash for example a TOU tariff may charge one price during Monday through Friday from 2 pm through 8 pm and another price during all other times Customers may choose to reduce consumption during these high priced periods Load reduction can be accomplished by load shifting (loads can be shifted by
copy 2016 ERCOT All rights reserved 6
Study on the Demand Response Potential for Seawater Desalination Projects ERCOT Public
rescheduling certain processes or by utilizing thermal storage) ending certain processes that are no longer economic or through energy efficiency measures
Offerings that incorporate CPP usually have prescribed high prices only during certain defined periods ndash for example when load or prices are expected to reach a certain level Response to CPP may be similar to those employed under TOU tariffs especially if CPP is reached frequently More often CPP is infrequent and as such short-term load curtailment may be the more appropriate response to meet economic objectives
4 Demand Response Potential for Seawater Desalination
This section evaluates whether the operational characteristics and economics of seawater desalination plants would enable them to participate in one or more of the various demand response opportunities in the ERCOT Region To date participation of seawater desalination plants in demand response programs has been limited Neither the plant in Carlsbad nor the plant in Tampa Bay participate in demand response programs in California or Florida respectively However as will be described below it appears that these plants can be designed and operated to meet the requirements for participation in demand response and receive economic benefit from participation in these programs
Section 41 describes the operational parameters that must be met for a demand-side resource to provide ERCOT-dispatched demand response and evaluates the ability of seawater desalination plants to meet these criteria Section 42 discusses the tradeoffs between payments for participation in ERCOT-dispatched demand response and potential additional costs posed to seawater desalination plants Finally Section 43 presents other opportunities for seawater desalination plants to reduce their electricity costs outside of ERCOTrsquos reliability-based services that are open to demand response assets
41 Operational Considerations for ERCOT-Dispatched Demand Response There are several key operational parameters that impact a demand-side resourcersquos ability to participate in different demand response services response time recovery time predictability of electrical demand and flexibility of operations This section discusses each of these considerations as they apply to seawater desalination plants
As discussed in Section 31 one of the differentiating factors between ERCOTrsquos demand response products is the amount of time within which a demand-side resource must respond to a deployment instruction to reduce electricity consumption during an event Participation in RRS requires an automatic response within either half a second (ie instantaneous) based on grid frequency or within 10 minutes via a manual instruction ERS requires a response time of either 10 or 30 minutes As noted in Section 21 the typical time to take a reverse osmosis train on- or off-line is 1-2 hours under normal controlled operations To comply with the response time requirements of RRS or ERS a seawater desalination plant would need to be able to reduce its electricity consumption far more quickly than in normal operations This is an element of plant design that would need to be accounted for in the specifications of the project Considerations include the potential need for on-site backup generation including uninterruptible power supply potential impacts to plant infrastructure (eg piping) reverse osmosis membranes and pretreatment systems
The two large US desalination plants provide illustrative counterpoints in this respect The Carlsbad plant was designed to withstand instantaneous power interruptions and has on-site backup generation including uninterruptible power supply to provide the ability to power control systems and flush the membranes in the event of a power loss In contrast the Tampa Bay plant was not
copy 2016 ERCOT All rights reserved 7
Study on the Demand Response Potential for Seawater Desalination Projects ERCOT Public
designed with on-site backup generation and a loss of power would result in a plant shutdown and may require several days to bring the plant back on-line Thus it appears that it is technically possible for a seawater desalination plant to meet the response time requirements for participation in demand response so long as this factor is considered in the design of the facility
The time it takes a desalination train to return to operations after an event is also a consideration Demand-side resources participating in RRS must be able to come back on-line within three hours and those participating in ERS must return within 10 hours Again it appears that it is technically feasible for desalination plants to meet this requirement so long as this requirement is considered in the plant design
An additional consideration is the predictability of a demand-side resourcersquos electricity consumption Participation in the responsive reserves ancillary service market requires bidding in the day-ahead market and thus a demand-side resource must know with great accuracy (within 95) its electrical demand at least a day ahead of time For ERS auctions are held three times a year for four-month contract periods Thus to participate in ERS a resource must know its forecasted electrical demand several months in advance Because seawater desalination plant operations are driven by contracted demand for water it is likely that a plant operator would have a good idea of the plantrsquos electrical demand days or even weeksmonths in advance especially for summer months when demand is likely to be relatively steady An important consideration however is the salinity of the water which drives the electrical requirements and which can be impacted by recent weather events Similarly reductions in demand for water during non-summer months or wet summer days where demand may be reduced could also impact a plantrsquos ability to predict its electricity demand
Finally a seawater desalination plant must have sufficient flexibility in its day-to-day operations so that it can afford to lose several hours of production when deployed for demand response It should be noted that demand-side resources participating in RRS and ERS are called infrequently demand-side resources providing responsive reserves were deployed one time in 2015 and ERS was not deployed that year However this is an important factor to consider if a plant is operating at close to full capacity and would incur financial penalties if it fails to meet its contract obligations due to a demand response event Including additional storage and building a plant with extra capacity could help to mitigate this risk It should also be noted that a plant operator does not need to commit the full plant capacity to these services but rather can specify an amount of MW that will be committed Thus a plant operator could mitigate issues both with predictability and flexibility of plant operations by committing only a portion of its predicted electrical demand to participate in demand response
Considering these factors together it appears that seawater desalination plants could be designed to meet the operational requirements for participation in ERCOTrsquos demand response services (both RRS and ERS) Because the ability to meet the requirements is dependent on the plant design demand response would need to be considered early in a projectrsquos development if participation is desirable Whether project developers will choose to address these requirements will depend on the economic benefits of participation in demand response which will be discussed in the next section
42 Economic Considerations for ERCOT-Dispatched Demand Response This section describes the economic benefits to demand-side resources from participation in ERCOT-dispatched demand response programs The average price paid for a demand-side resource participating in RRS in 2015 was $1087 per MW per hour and for ERS was $645 per MW per hour for the contract periods during the 2015 program year These payments could provide a significant financial benefit to seawater desalination plants To give a simplified example for a plant with an electrical demand of 10 MW operating at a 100 annual load factor (10 MW times 24 hours times 365 days) the annual benefit would be on the order of $500000 for ERS or $1 million for RRS
copy 2016 ERCOT All rights reserved 8
Study on the Demand Response Potential for Seawater Desalination Projects ERCOT Public
In 2015 demand-side resources providing responsive reserves were deployed one time for a duration of 10 minutes and ERS was not deployed12 The most ERS was ever deployed in a single year was two times in 2011 Thus participation in either program could result in a substantial payment to a seawater desalination plant with a relatively low risk of deployment and associated disruption of plant operations although it is important to note that participation in either ERCOT service subjects demand response resources to annual unannounced testing Other than testing the frequency of deployment will depend on grid conditions and is a risk that should be considered
The financial benefits of participation must be weighed against the costs of designing facilities with the capabilities to operate in this manner These include
bull The costs to design the plant to reduce electrical demand within the required timeframes for demand response and to withstand an instantaneous interruption if not already part of the plant design For example a plant may need to be designed to have backup power generation on-site In addition there could also be costs to restart the system after an interruption
bull The costs to build a plant with excess capacity andor storage to make up for lost production hours when demand response is deployed This will add to the total capital costs of the project Land area constraints should also be considered when considering additional storage as the space requirements for the necessary storage capacity could be significant
bull Costs associated with the impact of interruptions on plant processes (eg more frequent replacement of membranes impacts to pretreatment system or plant infrastructure)
bull Potential financial penalties that would be incurred if deployment as part of demand response were to result in failure to meet contract obligations to supply water
bull The loss of potential benefits in the form of cost avoidance from participation in non-ERCOTshydispatched demand response opportunities (see Section 43) If a plant is committed to RRS or ERS the plant operator would lose the flexibility to take advantage of these other opportunities to reduce their electricity costs
The interplay of these benefits and costs will determine whether it would be beneficial for a future seawater desalination plant to participate in demand response in ERCOT
43 Considerations for Non-ERCOT-Dispatched Demand Response Outside of the reliability-based services administered by ERCOT there are other opportunities for seawater desalination plants to reduce their electricity costs As described in Section 321 seawater desalination plants may be able to reduce the demand charges on their electricity bills through curtailing load during 4CP intervals In addition plant operators may adjust operations in response to real-time electricity prices to take advantage of lower off-peak prices and avoid price spikes (see Sections 322 and 323) All of these opportunities require that the plant have flexibility to reduce production during certain times of the day
In the ERCOT region as noted above a portion of transmission and distribution charges are set based on the peak systemwide 15-minute interval of the four summer months (June through September) referred to as the four coincident peaks (4CP) Large customers can reduce or avoid this charge by reducing electrical consumption during these four peak intervals AEP Central Texas and CenterPoint are the transmission providers covering the majority of the Gulf Coast in Texas13
12 ERCOT June 2016 ldquoLoad Resource Deployment Updaterdquo Available at httpwwwercotcomcontentwcmkey_documents_lists870985_RRS_Load_Resource_Deployment_Updatepdf 13 It is also possible that a seawater desalination plant could be located in an area that as not opted in to competition in which case the plant owner would need to negotiate its electricity charges bilaterally with the Non Opt-In Entity (NOIE)
copy 2016 ERCOT All rights reserved 9
Study on the Demand Response Potential for Seawater Desalination Projects ERCOT Public
Assuming a future seawater desalination plant would be connected at transmission-level voltages the relevant 4CP charges based on the 2016 tariffs accounting for both transmission charges and transmission cost recovery factors would be $41425 per 4CP kW for AEP Central Texas and $41870 per 4CP kVA for CenterPoint14 If a seawater desalination plant has 10 MW of load and is capable of interrupting all of it and successfully does so for all four 4CP intervals the savings based on the 2016 tariffs would be approximately $500000 per year ($41425 times 1000 (kW to MW) times 10 MW times 12 months) Thus a seawater desalination plant that reduces its electricity use during the 4CP intervals could avert some or all of these charges
Another opportunity for seawater desalination plants to reduce their electricity costs is through adjusting operations in response to real-time electricity prices In 2015 the average electricity price in ERCOT was $2677MWh However prices exceeded $50MWh in 254 hours (3 of all hours) $100MWh in 88 hours (1) $200MWh in 40 hours (05) and $300MWh in 21 hours (02) Prices exceeded $3000MWh for 021 hours15 Depending on the desalination plantrsquos exposure to real-time wholesale market prices (via its retail contract) the degree of high prices the plant owner is willing to avoid and grid conditions in a given year reducing unit operations in order to avoid high electricity prices could impact operators for anywhere between a few and several hundred hours out of the year In addition a plant can plan its operations to take advantage of lower electricity prices during off-peak periods (eg at night when generation from wind is high) For example at least one company is marketing a modular desalination unit design intended to take advantage of low prices during periods of high renewables generation and to provide grid reliability services through demand response16
There are several factors to consider regarding these opportunities to reduce electricity costs The plant would need to monitor the ERCOT market or hire a contractor to do so in order to know when to reduce demand for electricity These programs do not impose any requirements on response time as with RRS or ERS and there may be sufficient warning of 4CP intervals or peak pricing to allow the plant operator to plan its operations earlier in the day with sufficient time to ramp down production under controlled conditions However quicker ramping capability may be desirable to respond to electricity price fluctuations
For 4CP because the four intervals used to set demand charges are not known ahead of time it is likely that the plant would need to reduce its demand multiple times per summer to ensure the 4CP intervals are hit impacting production at the facility Timing operations to coincide with off-peak pricing or to avoid price spikes would similarly result in reduced operations during certain hours To offset the lost production hours the plant may need to be designed with extra capacity and water storage capability to maintain the ability to meet its contractual obligations for freshwater delivery Because the period of reduced operations is greater than with ERCOT-dispatched demand response services this need would be greater for a seawater desalination plant reducing load during 4CP intervals or in response to real-time electricity prices and would increase the capital costs of the project It should also be noted that high prices in the ERCOT Region typically but not always occur in summer months when drought conditions are more likely to develop and demand for desalinated water is likely to be highest This may limit the flexibility of the plant to time its electricity consumption to avoid high-priced hours
14 Public Utility Commission of Texas ldquoTransmission and Distribution Rates for Investor Owned Utilitiesrdquo Available at httpwwwpuctexasgovindustryelectricratestdraspx 15 Potomac Economics June 2016 2015 State of the Market Report for the ERCOT Wholesale Electricity Markets Available at httpswwwpotomaceconomicscomindexphpmarkets_monitoredERCOT 16 Sisyan LLC ldquoDemand Response Desalinationrdquo Available at httprenewabledesalinationcomwpshycontentuploads201506Demand-Response-Desalinationpdf
copy 2016 ERCOT All rights reserved 10
Study on the Demand Response Potential for Seawater Desalination Projects ERCOT Public
In addition the plantrsquos ability to participate in demand response would also be limited for those hours it is reducing load as part of 4CP response or in response to real-time prices because the plant would not be able to reduce its electricity consumption if that demand is already committed to another demand response service Thus participating in demand response versus taking advantage of these other opportunities may be to some extent mutually exclusive
5 Conclusion
Based on this analysis it appears that the operational characteristics of seawater desalination plants would allow them to participate in demand response opportunities in ERCOT so long as the necessary operational requirements are considered in the design specifications of the plant Project developers should consider the necessary requirements early in the plant design Whether the economic benefits of participation would provide a sufficient incentive for them to do so will depend on the costs of accommodating those operational requirements and whether there is the flexibility available to operate the plant as necessary under these programs Though most existing seawater desalination plants do not participate in demand response programs it does appear that participation by these plants is possible and could result in a financial benefit Table 2 compares the different demand response opportunities available to demand-side resources in ERCOT
Table 2 Comparison of Demand Response Opportunities Demand Response
Opportunity Requirements for
Participation Impacts to Plant
Operations Financial Benefit Ancillary Services ndash Responsive Reserve Service (RRS)
bull Under-Frequency Relay bull Instantaneous or 10 minute
response time bull Recover load within 3
hours bull Bid in day-ahead market
bull Deployed once in 2015 for 10 minutes bull Subject to annual
unannounced testing
bull $1087 per MW per hour (based on 2015 prices)
Emergency Response Service (ERS)
bull 10 or 30 minute response time bull Recover load within 10
hours bull Four-month contract term
bull Not deployed in 2015 the most times ever deployed in a single year was twice in 2011 bull Subject to annual
unannounced testing
bull $645 per MW per hour (based on 2015 prices)
Four Coincident bull Interval Data Recorder bull Likely plant will need to bull Avoid ~$48000 per 4CP Peak (4CP) (IDR) meter
bull Ability to predict system-wide peak demand hours during summer months
reduce load multiple times per summer to hit 4CP intervals bull Likely to be able to predict
possible 4CP intervals earlier in day
MW per year (based on 2016 tariffs) if successful in reducing during all four summer months
LSE or DR Provider Contracted Price Response
bull Varies based on contractual arrangements
bull Varies based on contractual arrangements
bull Varies based on contractual arrangements
Self-Directed Price bull Retail contract with bull Varies depending on bull Varies depending on Response exposure to real-time
market prices bull Ability to monitor real-time
prices in ERCOT wholesale market
number and severity of pricing events bull May be able to predict
peak pricing events earlier in day
number and severity of pricing events
copy 2016 ERCOT All rights reserved 11
Study on the Demand Response Potential for Seawater Desalination Projects ERCOT Public
Demand response programs in ERCOT provide opportunities for demand-side resources to defray their electricity costs and provide reliability benefits to the ERCOT electric grid Because the process of seawater desalination is energy intensive participation in demand response could help to reduce electricity costs while posing a relatively low risk to plant operations if demand response participation is factored into plant design
Participation in non-ERCOT-dispatched demand response opportunities such as reducing load during 4CP intervals or in response to real-time electricity prices may also help to reduce electricity costs for seawater desalination plants in Texas As stakeholders in Texas continue to plan for possible future droughts in the region and identify water management strategies consideration of demand response could play a role in mitigating some costs associated with seawater desalination and allow seawater desalination plants to assist with maintaining electric reliability in the region
copy 2016 ERCOT All rights reserved 12
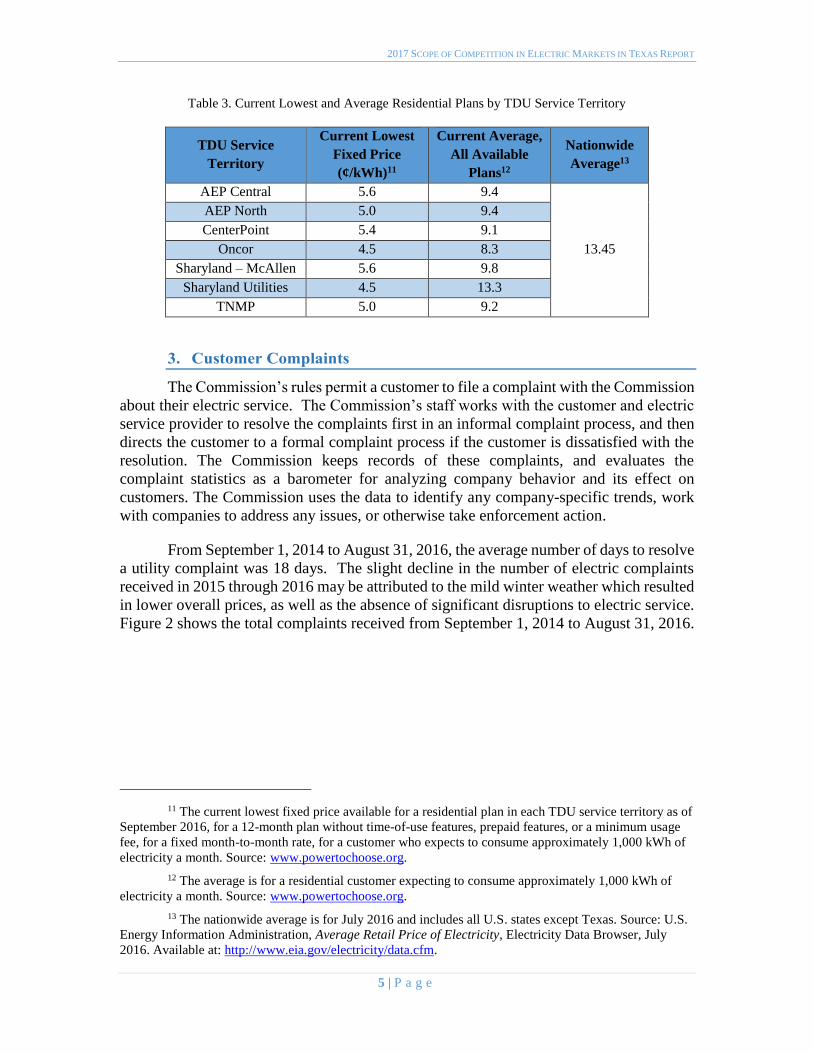
2017 SCOPE OF COMPETITION IN ELECTRIC MARKETS IN TEXAS REPORT
Table 3 Current Lowest and Average Residential Plans by TDU Service Territory
TDU Service
Territory
Current Lowest
Fixed Price
(centkWh)11
Current Average
All Available
Plans12
Nationwide
Average13
AEP Central 56 94
1345
AEP North 50 94
CenterPoint 54 91
Oncor 45 83
Sharyland ndash McAllen 56 98
Sharyland Utilities 45 133
TNMP 50 92
3 Customer Complaints
The Commissionrsquos rules permit a customer to file a complaint with the Commission
about their electric service The Commissionrsquos staff works with the customer and electric service provider to resolve the complaints first in an informal complaint process and then
directs the customer to a formal complaint process if the customer is dissatisfied with the
resolution The Commission keeps records of these complaints and evaluates the
complaint statistics as a barometer for analyzing company behavior and its effect on
customers The Commission uses the data to identify any company-specific trends work
with companies to address any issues or otherwise take enforcement action
From September 1 2014 to August 31 2016 the average number of days to resolve
a utility complaint was 18 days The slight decline in the number of electric complaints
received in 2015 through 2016 may be attributed to the mild winter weather which resulted
in lower overall prices as well as the absence of significant disruptions to electric service
Figure 2 shows the total complaints received from September 1 2014 to August 31 2016
11 The current lowest fixed price available for a residential plan in each TDU service territory as of
September 2016 for a 12-month plan without time-of-use features prepaid features or a minimum usage
fee for a fixed month-to-month rate for a customer who expects to consume approximately 1000 kWh of
electricity a month Source wwwpowertochooseorg
12 The average is for a residential customer expecting to consume approximately 1000 kWh of
electricity a month Source wwwpowertochooseorg
13 The nationwide average is for July 2016 and includes all US states except Texas Source US
Energy Information Administration Average Retail Price of Electricity Electricity Data Browser July
2016 Available at httpwwweiagovelectricitydatacfm
5 | P a g e
2017 SCOPE OF COMPETITION IN ELECTRIC MARKETS IN TEXAS REPORT
Figure 2 Total Electric Complaints Received September 2014 ndash August 2016
From September 1 2014 to August 31 2016 the Commission received 4465
electric complaints Billing complaints continue to be the greatest cause of customer
complaints with 42 of all electric complaints concerning billing issues Complaints
relating to the provision of service including customer service and the refusal of service
were the second highest cause of complaints at 15 Quality of service contributed to the
third-leading cause of complaints at 12 Complaints are broken down by category in
Figure 3
6 | P a g e
2017 SCOPE OF COMPETITION IN ELECTRIC MARKETS IN TEXAS REPORT
Figure 3 Electric Complaints Received by Category September 2014 ndash August 2016 14
4 Energy-Efficiency Programs
Energy-efficiency programs in Texas are administered by the TDUs in ERCOT and
the vertically integrated utilities outside of ERCOT pursuant to the Public Utility
Regulatory Act (PURA) sect39905 The utilities recover the cost of the energy-efficiency
programs through a surcharge on electric bills which are adjusted and approved annually
by the Commission Under the energy-efficiency programs TDUs reduced 559369 MWh
of electricity consumption in 2015 exceeding the goal for the year by 40 The energy-
efficiency programs are designed to reduce customersrsquo energy consumption as well as
electric peak demand In 2011 SB 1125 increased the peak demand goal reduction to a
30 growth in demand Once a utility reaches this goal the utility must achieve a
reduction of four-tenths of one percent of the utilityrsquos summer weather-adjusted peak
demand in subsequent years
The 2011 legislation also required that the Commission develop an evaluation
measurement and verification (EMampV) framework to promote effective program design
to provide consistent and streamlined reporting and to retain a third-party contractor to
conduct these activities EMampV efforts for the 2015 program year focused on evaluating
targeted programs for which the associated peak demand and energy savings were most
uncertain A primary component of EMampV is the statewide Technical Reference Manual
(TRM) a single common reference document prepared and maintained by the EMampV
contractor to estimate energy and peak demand savings resulting from the installation of
14 ldquoCrammingrdquo is the practice of adding unauthorized charges for any services to an electric bill without verified consent by the customer ldquoSlammingrdquo is the practice of switching the customer to another provider without authorization
7 | P a g e
2017 SCOPE OF COMPETITION IN ELECTRIC MARKETS IN TEXAS REPORT
energy efficiency measures sponsored by utility-administered programs in Texas In 2015
changes made to the TRM added and updated existing deemed savings values and added
standardized EMampV protocols for determining and verifying energy and demand savings
effective for the 2016 program year Verified demand and energy savings and program
costs for 2015 are shown in Table 4
Table 4 2015 Verified Energy Efficiency Savings15
MW MWh MW MWh
El Paso Electric 1231 22283 1116 19552 $4039278
Entergy Texas 1809 39688 1550 27156 $7023009
SPS 817 14537 549 9627 $3190744
SWEPCO 988 15262 560 9811 $3220359
Non-ERCOT Total 4844 91770 3775 66146 $17473390
AEP Central 4378 68482 1293 22653 $13261480
AEP North 454 12289 426 7464 $2727260
CenterPoint 16849 188255 5883 103069 $35832993
Oncor 11581 178908 6940 121589 $47438836
Sharyland 060 2528 100 1752 $633252
TNMP 866 17452 5770 10109 $4011627
ERCOT Total 34188 467915 15219 266636 $103905448
Grand Total 39033 559685 18994 332782 $121378838
Excludes Statewide EMampV contractor expenses of approximately $3M for review of prior program year
GoalProgram CostUtility
Verified Savings
In 2015 the utilities cumulatively achieved 206 of the demand reduction goal
(226 for utilities in ERCOT) and 168 of the energy reduction goal (175 for utilities
in ERCOT)
5 Customer Education Activities
The Commission engages with residential and small commercial electric customers
about retail electric competition through its ldquoTexas Electric Choicerdquo campaign and also informs customers about energy conservation opportunities through its ldquoPower to Save Texasrdquo campaign In addition to engaging with customers through these two campaigns
Commission staff also respond to customer inquiries and distribute literature about
electricity facts and issues
15 The non-ERCOT utilities within the state of Texas are El Paso Electric Company (ldquoEl Paso Electricrdquo) Entergy Texas Inc (ldquoEntergy Texasrdquo) Southwestern Public Service Company (ldquoSPSrdquo) and Southwestern Electric Power Company (ldquoSWEPCOrdquo)
8 | P a g e
2017 SCOPE OF COMPETITION IN ELECTRIC MARKETS IN TEXAS REPORT
a ldquoPower to Chooserdquo
The Commission educates customers about the evolving marketplace continuing
its ldquoTexas Electric Choicerdquo campaign which began in February 2001 with the goal of educating Texans about the changes and choices in the retail electric market The
PowerToChooseorg website and its Spanish-language counterpart PoderDeEscogerorg
provides a simple one-stop shop portal for Texans who live in a service territory open to
customer choice to enter in their zip code and browse through the numerous plans offered
by the REPs
b ldquoPower to Save Texasrdquo
In addition to the ldquoTexas Electric Choicerdquo campaign and the PowerToChoose website the Commission has also continued its statewide initiative ldquoPower to Save
Texasrdquo together with its parallel Spanish-language initiative ldquoPoder de Ahorrarrdquo which educates Texans about conserving energy during the summer peak times of 3 pm to 7
pm when the demand for electricity tends to be the highest The PowerToSaveTexasorg
website and its Spanish-language counterpart PoderDeAhorrarTexasorg provide Texans
with energy saving tips for homes and businesses
As part of the Power to Save Texas campaign the Commission contracted with
Resource Action Programs (RAP) to develop and implement a middle school energy
conservation outreach program in Hidalgo Harris Dallas and Tarrant counties In the
2015 ndash 2016 school year the program provided an effective energy education program
which strongly supports the Texas Essential Knowledge and Skills (TEKS) curriculum
standards as well as engages students through school challenges and at-home activities
c Campaign Outreach
PowerToChooseorg and its Spanish-language counterpart PoderDeEscogerorg
have proven valuable in educating customers about customer choice in the electricity
market The Commission conducted a number of activities to further promote the statersquos official electric choice website through social media community events trade shows and
expos From September 1 2015 through August 31 2016 nearly a million potential
customers visited the PowerToChooseorg and PoderDeEscogerorg websites Website
statistics are contained in Table 5
Table 5 Website Statistics September 2015 ndash August 2016
PowerToChoosecom Unique Visitors 980473
PoderDeEscogercom Unique Visitors 4652
d Low-IncomeElderly Outreach and Collaboration with Faith- and
Community-Based Organizations
Throughout 2015 and 2016 the Commissionrsquos staff also worked with legislative
offices and faith- and community-based organizations to provide educational materials and
training to help their constituents better understand the deregulated electric market and the
9 | P a g e
2017 SCOPE OF COMPETITION IN ELECTRIC MARKETS IN TEXAS REPORT
Commissionrsquos websites The Commission has actively participated with the Interagency
Coordinating Group (ICG) which was established by the Texas Legislature to expand and
improve relationships between state government and faith- and community-based
organizations Information on customer assistance programs such as LITE-UP Texas was
provided to community organizations such as Legal Aid of Northwest Texas senior
activity centers and religious groups
e Call Center
The Commission has trained its Customer Protection Division staff who are fluent
in both English and Spanish to answer customer calls and to assemble and mail
informational packets comparing electric plans when requested by customers without
Internet access From September 2015 to August 2016 the Customer Protection Division
staff handled 7663 calls from customers requesting assistance with shopping
f Educational Literature
In addition to the educational materials on the Commissionrsquos website the Commission provides brochures fact sheets and other educational materials by mail and
e-mail through a network of community organizations and events and in response to
customer requests to the call center Up-to-date fact sheets are available on the
Commissionrsquos website PowertoChooseorg and PoderDeEscogerorg as part of the
campaignrsquos outreach efforts The fact sheets provide information on a number of current
industry and consumer topics
Throughout 2015 and 2016 campaign educational materials promoting the
agencyrsquos programs including Power to Choose and Power to Save Texas were distributed
at numerous community events and civic town hall events such as Hurst-Euless-Bedford
ldquoBack 2 Schoolrdquo day Dickenson Housing Family Fair Energy Day DFW Family Fair
Earth Day Texas Texas Home and Garden shows in Houston Texas Black Expo National
Night Out events and minor league baseball games
Wholesale Market Development
The Commission engages regularly with ERCOT to oversee market developments
and ensure system supply reliability security and improved price formation and market
outcomes Market design changes made as a result of this working relationship have
created new opportunities for a variety of generation resources to enter the market and
supported the formation of wholesale prices that reflect real-time market conditions more
accurately and therefore improve the efficiency of the market
1 Wholesale Market Prices
Wholesale market prices have fallen in comparison to prices seen in the 2012 ndash 2014 period The ERCOT load-weighted real-time average price of energy in 2015 was
$2677 per Megawatt-hour (MWh) a 34 decrease from the average price in 2014 and a
decrease of 21 from the average seen in 2013
10 | P a g e
2017 SCOPE OF COMPETITION IN ELECTRIC MARKETS IN TEXAS REPORT
Falling wholesale prices are correlated with the current trend of lower natural gas
prices the primary fuel of many of the regionrsquos power plants The average Houston Ship Channel spot price for natural gas was 41 lower in 2015 than in 2014 decreasing from
$437MMBtu in 2014 to $258 in 2015 Through March the average price for 2016 has
fallen to $192MMBtu Natural gas price trends from September 2014 through August
2016 are shown in Figure 4
Figure 4 Monthly Average Natural Gas Prices September 2014 ndash August 2016
Monthly average wholesale electricity prices are shown in Figure 5 Load-
weighted prices are calculated by dividing the price at a load zone by the associated
demand This metric provides a useful proxy for the actual wholesale prices paid by load16
16 It is worth noting that most power in ERCOT is sold through various bilateral arrangements that
are designed to hedge daily real-time market price risk
11 | P a g e
2017 SCOPE OF COMPETITION IN ELECTRIC MARKETS IN TEXAS REPORT
Figure 5 Load-Weighted Average Real-Time Monthly Settlement Point Prices September 2014 ndash August 2016
Another component of the real-time price of electricity is the cost of transmission
congestion Transmission congestion occurs when there is insufficient transmission
capacity to dispatch energy in a least-cost fashion The recent build-out of additional
transmission lines in areas of high congestion has partially relieved the cost burden in these
areas particularly in West Texas where oil and gas production growth rapidly increased
the demand for electricity resulting in relatively higher zonal prices
2 Peak Demand
After the very high peak demand levels during the hot summer of 2011 peak
demand in ERCOT was lower in 2012 through 2014 In 2015 peak demand again
increased though not to 2011 levels with load exceeding 60000 MW for 330 hours and
exceeding 65000 MW for 91 hours as shown in Figure 6 below In 2016 ERCOT
experienced a record week in August which saw the previous record peak demand broken
six times and the ERCOT region hit its all-time peak demand of 71093 MW on August
11 2016
As peak demand has increased the recorded availability of generation supply in the
region during times of high load has decreased slightly Physical Responsive Capability
(PRC) analogous to the amount of reserves available on the system at any given time fell
below 3000 MW for 269 hours in 2015 up slightly from 213 hours in 2014 and 215
hours in 2013 but well below the 371 hours recorded during the 2011 summer
12 | P a g e
2017 SCOPE OF COMPETITION IN ELECTRIC MARKETS IN TEXAS REPORT
Figure 6 High Load Hours in ERCOT 2011 ndash 2016
As shown in Table 6 the ERCOT system peak demand was 69877 MW in 2015
up 5 from the 2014 peak and the 2016 ERCOT system peak demand increased 174
from the peak demand of the previous year
Table 6 ERCOT Peak Demand 2012 ndash 2016
Year
ERCOT Peak
Demand (MW)
Percentage Change
from Prior Year
2012 66548 ndash 2013 67245 105
2014 66454 ndash118
2015 69877 515
2016 71093 174
Figure 7 shows the hourly peak load for each month in ERCOT from January 2014 to
August 2016
13 | P a g e
2017 SCOPE OF COMPETITION IN ELECTRIC MARKETS IN TEXAS REPORT
Figure 7 Monthly Peak Demand in ERCOT January 2014 ndash August 2016
3 Generation Diversity
As electricity consumption has increased in ERCOT the diversity of the systemrsquos generation portfolio has also increased Generators participating in the statersquos renewable energy credit (REC) trading program reported an 11 increase in renewable generation
from 2013 to 2015 rising from 376 million MWh to 469 million MWh with wind
representing 96 of the total renewable mix Landfill gas was the second most prevalent
renewable source representing approximately 12 of all renewable generation in 2015
Energy produced from wind generation was up by 13 in 2015 from 2013 and solar
energy capacity more than doubled from 121 MW in 2013 to 288 MW in 2015 Coal-fired
generation has been steadily shrinking as a proportion of total generation declining from
37 of electricity produced in 2014 to 28 in 2015 Energy use in the ERCOT region by
fuel type for 2015 is shown in Figure 8
14 | P a g e
2017 SCOPE OF COMPETITION IN ELECTRIC MARKETS IN TEXAS REPORT
Figure 8 Energy Use in ERCOT by Resource Type 2015
The Commissionrsquos projects are further described in the following section of this report
15 | P a g e
2017 SCOPE OF COMPETITION IN ELECTRIC MARKETS IN TEXAS REPORT
III SUMMARY OF COMMISSION ACTIVITIES FROM 2015 TO 2016
Introduction
The Commission develops and modifies rules policies and procedures for the
competitive electric market in Texas in response to the technological advances in the
industry and the evolving needs of customers The Commission also continues to carry
out oversight of programs with which the Legislature has tasked it ndash such as energy
efficiency renewable energy and advanced metering infrastructure Within the
ERCOT region the monopoly wires-and-poles companies that provide transmission
and distribution services throughout the grid remain subject to traditional rate
regulation by the Commission The Commission continues to set rates for these
utilities as they are not subject to the forces of market competition This section
provides an overview of the Commissionrsquos activities in its oversight of the wholesale and retail electric markets as well as its governance over regulated electric utilities
Resource Adequacy
Resource adequacy is the long-term ability of the system to serve demand reliably
when consumption is highest given the available installed capacity load resources and
the operational reliability of the system Assessing resource adequacy requires comparing
the systemrsquos forecast installed capacity and load resources against the forecast peak
summer load The difference between the forecast of available generation and load
resources and the forecasted demand for electricity is referred to as an ldquoinstalled capacity
reserve marginrdquo which is an indicator of the ability of the system to meet customer demand
during peak conditions In addition to evaluating the forecast reserve margin assessing
resource adequacy includes evaluating the systemrsquos operational reliability The systemrsquos operational reliability depends on the ability of generators to manage plant operations
successfully as well as the grid operatorrsquos ability to manage the system to avoid or to mitigate load curtailment During 2015 and 2016 the ERCOT system performed well with
respect to resource adequacy The Commission has devoted significant attention to
ensuring that ERCOT maintains an adequate installed capacity reserve margin and a high
level of operational reliability developing a wholesale market design that allows
consumers to continue to receive low-cost and reliable electricity over the long term
1 Capacity Demand and Reserves Report
The Capacity Demand and Reserves (CDR) Report published by ERCOT semi-
annually is a snapshot estimate of long-term supply and demand and the associated annual
reserve margin for peak summer and winter conditions While the CDR Report is not a
forecast of any particular outcome it provides insight into possible resource adequacy
trends
16 | P a g e
2017 SCOPE OF COMPETITION IN ELECTRIC MARKETS IN TEXAS REPORT
The May 2016 CDR Report shows estimated reserve margins well above the
current target reserve margin of 1375 Installed capacity reserve margin estimates taken
from this CDR Report are shown below in Table 7
Table 7 May 2016 Capacity Demand and Reserves Report Forecast
Forecast 2017 2018 2019 2020 2021 2022 2023 2024 2025 2026
Peak Load
(MW)
68548 69409 70795 71420 72098 72792 73482 74168 74864 75704
Total
Capacity
(MW)
80995 87019 87238 87407 87678 87738 87738 87728 87728 87728
Reserve
Margin
182 254 232 224 216 205 194 183 172 159
2 Operating Reserve Demand Curve
In ERCOT the price signals produced by the energy-only wholesale electric market
should provide incentives to promote short-term reliability as well as induce optimal long-
run investment in new resources If the prices are efficient and reflect the full cost of
dispatching resources to meet demand the benefits that accrue to both consumers and
producers can be maximized at the least cost and new generating capacity (or load
resources) should develop to maintain the equilibrium as old resources retire or demand
increases
The Operating Reserve Demand Curve (ORDC) implemented at the Commissionrsquos direction in June 2014 improves price formation by allowing prices to more fully reflect
the value of operating reserves The ORDC assigns an economic value to operating
reserves or the amount of extra capacity available to maintain system reliability on a daily
basis
As part of its ongoing review of resource adequacy in ERCOT the Commission is
currently evaluating the accuracy of the inputs to the ORDC to ensure that its contribution
to price formation appropriately reflects the costs of meeting demand and the underlying
needs of the system
3 Transmission Congestion
Although competitive power producers and regulated transmission providers form
two distinct segments of the market transmission buildout has a direct effect on wholesale
power prices When there is insufficient transmission capacity to dispatch energy in a least-
cost fashion the system operator takes action to ensure that the physical limits of the
transmission system facilities are not violated The re-dispatch of generation because of
transmission limits results in disparate prices at different locations on the system In
comparison to prior years transmission congestion in ERCOT has lessened because of the
large increase in transmission investment and the reduction of high demand related to oil
and gas production in West Texas ERCOT and the Commission continually evaluate the
need for cost-effective additional transmission investment to manage congestion
17 | P a g e
2017 SCOPE OF COMPETITION IN ELECTRIC MARKETS IN TEXAS REPORT
4 Wholesale Market Design Initiatives
While the ERCOT wholesale market has been successful in attracting new resource
investment and also maintaining competitive prices for consumers certain improvements
to the market design could yield additional benefits in terms of efficient price formation
and opportunities for entry of new technology Initiatives already in place in many other
regions such as real-time co-optimization and multi-interval real-time resource dispatch
may allow existing capacity to be used more effectively and create opportunities for the
integration of additional load resources to serve electric demand The Commission
continues to work with ERCOT and interested stakeholders to determine the value of
implementing such enhancements particularly as ERCOTrsquos resource mix changes over time
5 Reliability Standard
In early 2014 the Commission opened a project to review its use of a target installed
capacity reserve margin based on a reliability standard equivalent to one loss-of-load event
every ten years In this project the Commission received written comment from interested
parties conducted a public workshop consulted with independent experts and reviewed
the application of reliability standards in other regions As a result of this review future
reliability metrics to be estimated in ERCOT will include the market equilibrium reserve
margin the economically-optimal reserve margin and the associated levels of expected
unserved energy The Commission believes that publishing these metrics represents an
improvement over reporting a one-event-in-ten-years standard by enhancing insight into
expected outcomes in ERCOTrsquos energy-only market
Non-ERCOT Utilities Market Development Activities
SB 7 the law that introduced retail competition to the Texas market in 1999
granted the Commission authority to delay retail competition in an area where deregulation
would not result in fair competition and reliable service because of the lack of an
independent organization to coordinate the electric system and the concentration of
ownership in the generation sector in some of those areas Consequently SB 7 included
provisions recognizing the difficulty of implementing retail competition in areas outside of
ERCOT Therefore the utilities outside of the ERCOT region remain vertically integrated
owning generation transmission and distribution assets as well as selling power to end-
use customers These vertically integrated utilities remain subject to traditional regulation
including rates set by the Commission and customer choice is not offered in the service
territories of these utilities
The Commission does continue to monitor ongoing activities in the non-ERCOT
portions of the state In 2015 the Legislature granted the Commission the authority to
retain counsel and consulting experts in order to participate in legal proceedings at the
Federal Energy Regulatory Commission (FERC) which has regulatory jurisdiction over
wholesale power sales and transmission rates outside of ERCOT This authority has
18 | P a g e
2017 SCOPE OF COMPETITION IN ELECTRIC MARKETS IN TEXAS REPORT
permitted the Commission to participate more effectively in FERC proceedings affecting
Texasrsquo utilities located outside of ERCOT
1 Southwest Power Pool
The Southwest Power Pool (SPP) is the Regional Transmission Operator (RTO) for
areas of Northeast Texas and the Texas Panhandle In Texas the utilities Southwestern
Electric Power Company (SWEPCO) Southwestern Public Service (SPS) and several
electric cooperatives and municipally owned utilities are in SPP In addition to these areas
of Texas the SPP footprint includes parts of New Mexico Arkansas Missouri Nebraska
Louisiana and all of Kansas and Oklahoma In 2015 SPP became the RTO for the
Integrated System and neighboring areas which includes parts of Iowa Minnesota North
Dakota South Dakota Wyoming and Montana SPP has spent extensive time and
resources over the last two years to integrate these new areas successfully The expansion
added 5000 MW of peak demand 7600 MW of generating capacity and 9500 miles of
transmission lines17
In 2014 SPP launched its new Integrated Marketplace which provides a Day-
Ahead Market a Real-Time Balancing Market and Congestion Hedging Markets
mechanisms similar to those available in ERCOT The implementation of the Integrated
Marketplace resulted in a savings of $422 million in 2015 As a result of the Integrated
Marketplace SPPrsquos planning reserve margin will be reduced from 136 to 12 a change
expected to save about $90 million annually
Chairman Donna L Nelson represents the Commission as a voting member on
SPPrsquos Regional State Committee (RSC) The RSC provides collective state regulatory
agency input on a variety of issues In addition the RSC has authority over the cost
allocation methodologies for transmission upgrades allocation of Financial Transmission
Rights and the approach used for resource adequacy across the SPP region The RSC
regularly meets on a quarterly basis and meets more frequently if necessary
2 Midcontinent Independent System Operator
The Midcontinent Independent System Operator (MISO) is an RTO that serves all
or part of 15 states in the central US one Canadian province and the portion of eastern
Texas served by the vertically integrated utility Entergy Texas Inc MISO provides a Day
Two market which has a variety of functions and services including energy and ancillary
service markets economic dispatch congestion management financial transmission rights
and transmission planning The MISO Independent Market Monitor concluded that the
MISO wholesale markets were competitive in 2015
Like SPP MISO is in the Eastern Interconnection which crosses state boundaries
and is therefore subject to FERC jurisdiction A number of recent FERC proceedings have
17 2015 Southwest Power Pool Annual Report Available at
httpswwwspporgdocuments37800201520southwest20power20pool20annual20reportpdf
19 | P a g e
2017 SCOPE OF COMPETITION IN ELECTRIC MARKETS IN TEXAS REPORT
affected the portion of Texas that is in the MISO footprint The Commission through
outside counsel has been an active party in such FERC proceedings FERC Docket No
ER14-1174 addressed in part a dispute regarding the availability of transmission capacity
under the Joint Operating Agreement between MISO and the SPP Ultimately FERC
approved a settlement agreement under which MISO will compensate SPP and its members
for using their or other entitiesrsquo transmission systems
In a related pending docket at FERC Docket No ER14-1736 parties are addressing
how the cost of these payments will be allocated among MISO market participants Parties
in this proceeding are engaged in settlement discussions In addition in Docket No ER14-
75-000 FERC approved a settlement agreement among the participating Entergy
Operating Companies and their retail regulators to terminate the Entergy System
Agreement effective August 31 2016 The settlement terms prohibit any post-termination
payments that roughly equalize production costs among the operating companies after
December 31 2015 terminate certain specific cross-purchase power agreements between
Entergy Texas and former Entergy Gulf State Louisiana and permit the continuation of
several other purchase power agreements
Commissioner Kenneth W Anderson Jr represents the Commission as a voting
member in the Organization of MISO States (OMS) the purpose of which is to coordinate
regulatory oversight among the states in the MISO region and to make recommendations
to MISO FERC and other entities Commissioner Anderson also represents the
Commission as a voting member of the Entergy Regional State Committee (ERSC) which
has certain FERC-approved authority for five years after the Entergy integration with
regard to cost allocation for Entergy transmission projects and adding transmission projects
to the Entergy construction plan The ERSC meets quarterly
3 Western Electricity Coordinating Council
The Western Electricity Coordinating Council (WECC) is a Regional Entity whose
region includes the area surrounding El Paso and extends from Canada to Mexico
including the provinces of Alberta and British Columbia the northern portion of Baja
California and all or portions of the 14 Western states in between WECC is the Regional
Entity responsible for Bulk Electric System reliability in the Western Interconnection and
associated compliance monitoring and enforcement WECC does not have organized
markets outside of California but is organized into 38 separate balancing authorities
WECC is geographically the largest and most diverse of the eight Regional Entities in the
United States with delegated authority from the North American Electric Reliability
Corporation (NERC) and the Federal Energy Regulatory Commission In Texas El Paso
Electric Company is a member of WECC
Rulemaking Activities
The Commission has continued to adopt new rules and modify existing rules in
order to further the continued successful operation of the competitive retail and wholesale
markets and to comply with statutory changes made to PURA by the Legislature This
20 | P a g e
2017 SCOPE OF COMPETITION IN ELECTRIC MARKETS IN TEXAS REPORT
section of the Report provides a high-level overview of the Commissionrsquos key rulemaking
activities highlighting the market improvements made in 2015 and 2016
1 Cost Recovery and Rate Adjustment
The Commission adopted new rule 16 TAC sect25246 on June 29 2016 to
implement Section Nos 1 through 3 of House Bill 1535 of the 84th Legislature The new
rule only applies to a utility that operates solely outside of ERCOT and allows for the use
of an update period beyond the test year for which the utility initially files estimated
information The rule clarifies that all information originally estimated must be updated
with actual information and also provides requirements for a post-test-year adjustment for
a natural gas-fired plant A non-ERCOT utility also is required to initiate a new base rate
case on or before the four year anniversary of the final order in the utilityrsquos most recent comprehensive base rate case or if the commission determines that the utility has
materially earned more than its authorized rate of return in two consecutive years The rule
also provides requirements and procedures for the relation back of final rates to an effective
date 155 days after the filing of the rate application
2 Changes to Certificates of Convenience and Necessity and CREZ Rule
The Commission conducted a rulemaking to implement changes pursuant to
Legislative mandates in SB 776 SB 933 and HB 1535 of the 84th Legislature SB 776
required municipally owned utilities to apply for a certificate of convenience and necessity
(CCN) before constructing transmission facilities outside the boundaries of the
municipality that owns the municipally owned utility SB 933 also requires persons to
obtain a CCN before interconnecting a tie line into the ERCOT grid HB 1535 requires the
Commission to issue a final order within 181 days for a non-ERCOT utility requesting a
CCN for an existing electric generating facility and 366 days after a non-ERCOT utility
files a CCN for a newly constructed generating facility In addition the Commission also
determined in this rulemaking that all future transmission projects in a Competitive
Renewable Energy Zone (CREZ) must meet the need criteria of PURA sectsect 37056(c)(1)
and (2) rather than being exempt Finally the Commission determined that the CREZ
project established in 2008 was complete following the installation of a second circuit on
a Sharyland line
3 Use of Handheld Device for Enrollment
As the market evolves the Commission evaluates market changes balancing its
desire to encourage customer-focused innovation with its concern for customer protection
against potential abuses In Docket No 44518 the Commission granted a REP a
temporary 12-month waiver from its rules requiring the marketer to obtain telephonic
verification of the customerrsquos desire to switch REPs as well as a waiver from certain authorization disclosure requirements among other stipulations the Commission placed
upon the REP The Commission then opened Project No 45625 to study the issue of REPs
utilizing hand-held devices for customer enrollment more broadly and engage with market
representatives consumer representatives and other stakeholders The Commission
anticipates considering an amendment to its rules in the spring of 2017
21 | P a g e
2017 SCOPE OF COMPETITION IN ELECTRIC MARKETS IN TEXAS REPORT
4 Smart Meter Texas Portal
The electric utilities in Texas that have advanced metering systems (AMS) jointly
own and operate a single web portal known as Smart Meter Texas (SMT)18 SMT fulfills
two requirements imposed by the Commissionrsquos advanced metering rule on a utility with
AMS (1) provide to the retail customer the REP serving the customer and other entities
authorized by the customer access to such retail customerrsquos consumption data and (2)
allow devices at the customerrsquos premises to communicate through a home area network with the advanced meter at the premises SMT also facilitates near real-time on-demand
reads of a customerrsquos meter that aids prepaid service offered by certain REPs
In Project No 42786 Review of Advanced Metering System Web Portal
Commission staff and stakeholders examined options for the long-term operational
structure governance and funding of SMT The Commission determined that ownership
of SMT should remain with the TDUs because they can operate the portal at a lower cost
than transferring the data repository to ERCOT The Commission opened two
rulemakings one to ascertain the appropriate governance performance and funding of
SMT and a second to determine the appropriate access for third parties ensuring that
customers have the freedom to grant and give third parties access to their data if made
knowingly while also securing customer privacy
Sharyland Utilities
In early 2015 customers of Sharyland Utilities the smallest investor-owned
transmission and distribution utility in ERCOT began to file with the Commission a
significant number of complaints regarding high electricity bills In response the
Commission opened Project No 44592 Relating to a Project Regarding Sharyland
Utilities to provide for a more formal process for Commission review of the large number
of complaints As part of this project Commission staff prepared a report to evaluate the
electricity rates and electric bills in the operating area of Sharyland Utilities that was
previously part of Cap Rock Energy
Staffrsquos report found that a number of factors contributed to the comparatively high
bills for many of Sharyland-Cap Rockrsquos customers First Sharylandrsquos small size and its low customer density result in high TDU rates for all customers relative to other TDUs In
particular Staffrsquos report found that Sharyland-Cap Rockrsquos rates for distribution service are
up to three times higher than those of other TDUs in Texas In addition to Sharyland-Cap
Rockrsquos high costs for distribution service higher wholesale transmission costs also
contributed to the rate increases charged to Sharyland-Cap Rockrsquos customers These transmission costs are the result of increased transmission investment in recent years
throughout Texas that has increased transmission costs for all distribution providers
18 The participating Texas TDUs are AEP Texas Central Company and AEP Texas North Company (jointly
ldquoAEPrdquo) CenterPoint Energy Houston Electric LLC (ldquoCenterPointrdquo) Oncor Electric Delivery Company LLC (ldquoOncorrdquo) and Texas-New Mexico Power Company (TNMP) collectively referred to as the ldquoJoint TDUsrdquo Operation of an AMS web portal was addressed in the orders approving particular utilitiesrsquo deployment of AMS and approving surcharges for AMS cost recovery While Sharyland Utilities filed comments in the proceeding it did not
participate as it had not fully completed its AMS deployment at the time
22 | P a g e
2017 SCOPE OF COMPETITION IN ELECTRIC MARKETS IN TEXAS REPORT
including Sharyland Utilities Second the comparatively colder winter of 2014 ndash 2015
which was the time period generally consistent with the timeframe in which the
Commission began receiving complaints appeared to result in higher electricity usage than
normal This combination of high TDU rates and the higher electricity usage led to higher
bills for customers
Staffrsquos report also noted that in Sharyland-Cap Rockrsquos last rate case in 2014 the
approved rates reflected movement towards more cost-based rates for all customers
including some customers that previously had been heavily subsidized by other customers
Additionally in the process of standardizing Sharyland-Cap Rockrsquos customer classification
with the classifications of the other TDUs in Texas some customers may have experienced
a move from one class that previously was paying below-cost rates to another class that
was now paying above-cost rates For some of these customers the combined effects of
the movement towards cost-based rates and the change to a different class may have
contributed to a significant change in the customersrsquo rates Regardless of any cost-shifting
between customer classes Sharylandrsquos rates remain two to three times higher than those of other TDUs in Texas for all customers in all classes
On December 4 2015 the Commission signed an order directing Sharyland to file
an application for a comprehensive rate review by April 30 2016 Sharyland filed its rate
application on April 29 2016 in Docket No 45414 Review of the Rates of Sharyland
Utilities LP On October 10 2016 the Commission ordered Sharyland to file an amended
application as soon as practicable but no later than January 1 2017 to reflect the unique
aspects of the companyrsquos organizational structure as a real estate investment trust (REIT) At the time of publication Sharyland is expected to file its amended application in
December 2016
PowerToChoose Website
As part of its ongoing evaluation of the competitive market the Commission
opened Project No 45730 to evaluate the functionality and usability of its PowerToChoose
website which allows customers to select a REP and an electric plan based on their zip
code In the process the Commission received significant feedback from customers stating
that the Commissionrsquos PowerToChoose website was an important tool that plays a
fundamental role in their shopping process In response to the feedback received from
industry representatives and consumers Commission staff changed how the website sorts
and filters retail electric plans adding a filter to allow customers to unselect plans that
contain minimum usage fees or credits This filter is now a default setting and plans with
minimum usage fees and credits are not shown unless the customer actively selects to
search for such plans In addition Commission staff made other changes to increase the
clarity of the REP complaint rating The Commission continues to evaluate other changes
to improve the customer experience of the PowerToChoose website and provide
transparency for retail electric plans
23 | P a g e
2017 SCOPE OF COMPETITION IN ELECTRIC MARKETS IN TEXAS REPORT
Report on Alternative Ratemaking Mechanisms
In 2015 the Legislature enacted SB 774 which requires the Commission or its
consultant to conduct a study and make a report to the Legislature analyzing the alternative
ratemaking mechanisms adopted by other states In addition SB 774 extended the
authorization for the Periodic Rate Adjustment (PRA) mechanism from 2017 to 2019
which the Legislature had authorized in 2011 (SB 1693) as a version of an alternative
ratemaking mechanism that provides to utilities a means for expedited recovery of
distribution infrastructure costs Pursuant to SB 774 the Commission retained a consultant
to produce the report and the consultantrsquos recommendations included streamlining the ratemaking process to reduce procedural costs providing for a periodic review of the
prudency of the costs and using certain types of alternative ratemaking mechanisms that
decouple the recovery of costs from variations in load The Commission held a public
hearing to receive comments on the report from stakeholders and after consideration of
those comments has provided to the Legislature the consultantrsquos report together with its
own discussion of the report
Request for Purchase of Oncor Electric Delivery Company
In March 2016 the Commission approved with conditions an application by an
investor group led by Hunt Consolidated Inc the owners of Sharyland Utilities to acquire
control of Oncor Electric Delivery Company (Oncor) the largest transmission and
distribution utility in Texas from Oncorrsquos parent company Energy Future Holdings which
is in bankruptcy The Commission approved the request subject to certain conditions
including stipulations regarding the organization of the new entities and treatment of tax
benefits The investor-led group subsequently declined to pursue the transaction that was
approved by the Commission
In September 2016 NextEra Energy which owns Florida Power amp Light received
approval from the United States Bankruptcy Court in Delaware for its plan to purchase
Oncor In October 2016 NextEra Energy filed an application with the Commission in
Docket No 46238 for approval of the proposed transaction The Commission will evaluate
the application to determine if the transaction is in the public interest
Integration of Lubbock Power and Light
In March 2016 the Commission opened Project No 45633 to study and identify
the issues related to the request of Lubbock Power and Light the statersquos third-largest
municipally owned utility to be integrated into ERCOT The Commission is currently
working with stakeholders ERCOT and SPP to determine the cost and benefits of any
potential switch by Lubbock Power and Light into ERCOT and whether such a switch is
in the public interest
24 | P a g e
2017 SCOPE OF COMPETITION IN ELECTRIC MARKETS IN TEXAS REPORT
Desalination Project ERCOT Studies
In 2015 the Legislature passed HB 4097 which directed the Commission and
ERCOT to study whether existing transmission and distribution planning processes are
sufficient to provide adequate infrastructure for seawater desalination projects and to study
the potential for desalination projects to participate in demand response opportunities in
the ERCOT market Pursuant to that direction ERCOT staff have prepared a report on the
feasibility of interconnection of large desalination projects and on opportunities for such
projects to participate in ERCOTrsquos demand response programs which is attached to this Report in Appendix B
Oversight and Enforcement Actions
The Commissionrsquos enforcement of statutes rules and orders applicable to entities
under its jurisdiction serves to protect consumers the electric markets the reliability of the
electric grid and to promote fair competition The Commissionrsquos enforcement efforts in the electric industry focus on violations of PURA the Commissionrsquos rules and ERCOT
protocols
During the period from January 2015 through August 31 2016 the Commission
assessed $3258500 in penalties against electric market participants Table 8 provides a
summary of electric industry Notices of Violation since January 2015 During 2015 and
2016 Commission staff opened 212 investigations for the electric industry and closed 177
investigations
Table 8 Notices of Violations
Violation Type Total Penalty Amount
Retail Market Violations $539000
Service Quality Violations $451500
Wholesale Market Violations $2268000
TOTAL $3258500
In addition to the imposition of administrative penalties the Commission uses other
enforcement mechanisms in exercising its enforcement duties including revoking a
companyrsquos certificate to operate In addition some companies may be required to relinquish a certificate as part of a settlement after enforcement action has proceeded
Table 9 provides a breakdown of the number of certificates revoked or relinquished In
2016 the Commission revoked the certificate of the REP TruSmart Energy
Table 9 Certificates Revoked or Relinquished
Type Number
Certificates Revoked 1
Certificates Relinquished 0
25 | P a g e
2017 SCOPE OF COMPETITION IN ELECTRIC MARKETS IN TEXAS REPORT
The Oversight amp Enforcement division also issues warning letters to companies in
the electric market when it determines that a violation occurred but given the
circumstances surrounding the violation and other mitigating concerns no administrative
penalty is warranted During 2015 and 2016 the Oversight amp Enforcement division issued
50 warning letters Finally the Commission generally seeks to reimburse money directly
to customers when appropriate In 2015 and 2016 the Commission ordered the
reimbursement of $8543596 to Texas electric customers
Table 10 Warning Letters
Warning Letter Type Number
Retail Market Warning Letter 8
Service Quality Warning Letter 1
Wholesale Market Warning Letter 41
TOTAL 50
In addition to its enforcement activities the Commission also enters into voluntary
mitigation plans with generators that request one through a contested case proceeding
pursuant to PURA sect15023(f) and 16 TAC sect25504(e) The Commission entered into one
voluntary mitigation plan during 2015 and 2016 in Docket No 44635
Low-Income Discount System Benefit Fund
The System Benefit Fund (SBF) was originally established in 1999 to fund
discounts to low-income customers customer education activities energy-efficiency and
weatherization and electric market oversight through a nonbypassable surcharge on retail
electric bills HB 1101 of the 84th Legislature provided that the SBF be sunset on
September 1 2017 by which time the SBF is intended to be exhausted In the 2016 Fiscal
Year (FY) $325521250 was appropriated in the SBF to provide a 25ndash31 percent discount
to low-income customers over a 12-month period
To assist the drawdown of the remaining balance HB 1101 authorized the
Commission to use any unexpended SBF balance in FY 2017 to assist low-income
customers The Commission estimates that the remaining SBF balance will be
approximately $17 million by August 31 2017 The Commission has determined that this
amount is insufficient to fund the rate reduction program however the Commission will
spend approximately $100000 to continue automatic enrollment in the program to provide
REPs a list of customers eligible to receive late fee waiver and deposit installment benefits
These two ancillary benefits of the rate reduction program will continue for the duration of
FY 2017
26 | P a g e
2017 SCOPE OF COMPETITION IN ELECTRIC MARKETS IN TEXAS REPORT
Homeland Security
The Commission assesses the efforts of ERCOT and utilities to defend against
mitigate and respond to the variety of risks that the modern electricity system faces The
Commission also meets with ERCOT utilities and governmental entities on an ongoing
basis to discuss preparation for everything from hurricanes and other severe weather to
cyber-threats and threats of physical damage to the grid from accidents or intentional
malfeasance In addition the Commission monitors industry and federal programs that
address homeland security issues
The Commission serves as an information liaison between state government and
electric utilities during emergencies The Commissionrsquos main roles include
Conveying outage and service restoration information from electric utilities to
state government
Conveying service restoration priorities (hospitals water treatment facilities
etc) from state government to electric utilities and
Facilitating the clearance of downed power lines in disaster re-entry areas and
facilitating entry of electric utilities into disaster areas
The Commissionrsquos Emergency Management Response Team (EMRT) provided staff at the
State Operation Center for the May 2015 and April 2016 flooding events in Texas as well
as additional staffing for severe winter weather
Demand Response
ERCOT staff have begun to report annually on the participation of customers in
REP-sponsored demand response programs These programs which have been facilitated
by the deployment of smart meters throughout the competitive areas within ERCOT and
by many municipal and cooperative electric utilities take the form of rebates for reduction
in usage during peak period time-of-use pricing real-time volumetric price compensation
for load reduction and direct control of customer load among other plans
These programs have seen dramatic increases in participation since ERCOT began
to gather this information in 2013 From 2013 to 2014 the number of residential customers
participating in these programs increased from 151793 to 721273 and the number of
commercial and industrial customers participating rose from 30275 to 50205 The
Commission continues to monitor ERCOTrsquos stakeholder process for efforts relating to the integration of demand response
27 | P a g e
2017 SCOPE OF COMPETITION IN ELECTRIC MARKETS IN TEXAS REPORT
IV LEGISLATIVE RECOMMENDATIONS
A Determination of Low-Income Customer Eligibility
In 2015 HB 1101 required that all remaining funds in the System Benefit Fund
(SBF) be expended that the fee that funded the program as a nonbypassable surcharge on
electric bills be set at zero and that the SBF be sunset on September 1 2017 Per the
provisions of HB 1101 the SBF fee was set at zero in September 2016 concluding the
funding for the program The sunset of the SBF program also concluded the relationship
between the Texas Health and Human Services Commission (HHSC) and the Commission
in which the HHSC provided to the Commission eligible electric customers for the SBF
low-income discount Because of the termination of the relationship with HHSC with the
termination of the SBF the Commission will no longer be able to determine easily an
electric customerrsquos eligibility for other low-income programs such as late penalty waivers
and the option of paying an electric deposit over multiple months
The Legislature may wish to consider easing low-income customers access to these
low-income programs by facilitating the process used to determine eligibility The
Commission offers four possible approaches in which the Legislature could continue these
low-income programs
(1) Authorize HSSC to provide identification of eligible low-income customers to the
Commission
(2) Allow retail electric providers (REPs) to provide such low-income programs using
the Low Income Discount Administratorrsquos (LIDA) Telecommunications Lifeline
Service Program list to identify low-income customers
(3) Require REPs to offer such low-income programs with customers self-enrolling
and REPs verifying income eligibility or
(4) Allow REPs to voluntarily provide such low-income programs at their own
discretion
B Outside Counsel for Proceedings before Regional Transmission
Organizations
Regional Transmission Organizations (RTO) manage the power grid across wide
regions of the United States Most of Texas is inside the ERCOT region however there
are significant portions of East Texas and the Panhandle that are in the Midcontinent
Independent System Operator (MISO) and the Southwest Power Pool (SPP) Issues arise
in these other RTOs that have significant impact on Texas ratepayers such as how
transmission infrastructure costs will be shared These tend to be very lengthy and
complicated proceedings that require specialized legal and consulting services
28 | P a g e
2017 SCOPE OF COMPETITION IN ELECTRIC MARKETS IN TEXAS REPORT
PURA sect 394525 currently authorizes the Commission to use outside consultants
auditors engineers or attorneys to represent the Commission in proceedings before the
Federal Energy Regulatory Commission This provision has been an important tool for the
Commission to respond to complex matters in the federal arena to enable it to protect the
public interest in Texas The PUC recommends that the Legislature expand the language
in this statute to include the ability to hire outside assistance for proceedings before other
RTOs to provide those same protections to Texas ratepayers in those areas
C Repeal of Natural Gas and Renewable Energy Mandates
1 Natural Gas
PURA sect 399044 establishes natural gas as ldquothe preferential fuelrdquo in Texas for electricity generation and requires the Commission to adopt rules to establish a system of
natural gas energy trading credits The majority of all new non-renewable electricity
generation constructed since 2000 for Texas has used natural gas as a primary fuel and this
trend is expected to continue in the foreseeable future The thresholds used to trigger the
natural gas energy trading credit system in PURA sect 399044 have not been reached and
they are not expected to be reached in the foreseeable future
Because natural gas-fueled facilities have been the most commonly built new
generation in Texas for many years and are expected to continue to be there is no need to
establish incentives for natural gas generation The PUC recommends that the Legislature
consider repealing PURA sect 399044 because it is no longer necessary
2 Renewable Energy
PURA sect 39904 establishes goals for renewable energy Subsection (a) requires
the installation of 5880 megawatts of renewable energy by 2015 and Subsection (b)
establishes a renewable energy credits trading program to implement the requirement The
5880 megawatts mandates in Subsection (a) was met in 2008 While the Commission
believes the renewable energy trading credit program is needed for retail electric providers
to validate renewable energy marketing claims the Commission believes the 5880
megawatts mandate in Subsection (a) is no longer necessary
D Advisory Opinions
Many regulatory agencies in Texas have authority to issue informal guidance to the
persons they regulate particularly with respect to outlining whether a particular course of
conduct would in the agencyrsquos view be consistent with the laws and regulations that the agency administers19 The issuance of an advisory opinion can provide regulatory clarity
to a company before making investments or conducting operations the permissibility of
which may be unclear under state law The Legislature may want to consider granting the
19 In addition certain federal agencies such as the Federal Communications Commission
Internal Revenue Service Securities and Exchange Commission and Federal Election
Commission have authority to issue advisory opinions
29 | P a g e
2017 SCOPE OF COMPETITION IN ELECTRIC MARKETS IN TEXAS REPORT
Commission the authority to issue advisory opinions In the electric industry providing
clarification to a company concerning issues such as the purchase of assets or the
acquisition of another company could allow it to avoid expensive regulatory proceedings
without impairing the Commissionrsquos authority The following state agencies have statutory authority to issue advisory opinions
Texas Ethics Commission20
Texas Medical Board21
State Board of Dental Examiners22
Texas Board of Nursing23
Texas Board of Professional Engineers24
Texas Lottery Commission and25
Texas Securities Board26
E Administrative
Gross Receipts Assessment
PURA sect 16001 provides for a gross receipts assessment that is used to defray the
expenses incurred by the Commission to administer PURA An assessment of one sixth of
one percent is collected from public utilities electric cooperatives retail electric providers
and interexchange carriersrsquo gross receipts from consumers The funds from this assessment
are remitted to the general revenue fund but currently they have not been explicitly
dedicated to funding of the Commission In contrast similar assessments on water
utilities insurance companies and other regulated entities have traditionally been used to
explicitly fund the underlying regulatory programs at the respective agencies The
Commission is one of four Article VIII agencies that is not designated as self-funded
The Commission recommends that the Legislature designate the Commission as a
self-funded agency whereby the collected assessments would be explicitly dedicated to the
funding of the agency Implementing this recommendation would require the Public Utility
Commission to be included in the Appropriations Limited to Revenue Collections rider
located in the Special Provisions Relating to All Regulatory Agencies section of the
General Appropriations Act Designation as a self-leveling agency would require the
Commission to set the gross receipts assessment at a rate sufficient to generate revenue in
the amount of the agencyrsquos general revenue appropriation each fiscal year which would require a statutory change to PURA sect16001(b) Based upon the Commissionrsquos baseline budget request authorizing the PUCrsquos self-leveling designation would result in an overall
estimated tax reduction of $456 million per year or 774
20 Government Code sect 571091 21 Occupations Code sect 162107 22 Occupations Code sect 258157 23 Occupations Code sect 301607 24 Occupations Code sect 1001601 25 Occupations Code sect 2001059 26 Tex Rev Civ Stat Ann Arts 581-28-1 amp 581-35 7 Tex Admin Code 1012
30 | P a g e
2017 SCOPE OF COMPETITION IN ELECTRIC MARKETS IN TEXAS REPORT
V APPENDICES
31 | P a g e
2017 SCOPE OF COMPETITION IN ELECTRIC MARKETS IN TEXAS REPORT
Appendix A ndash Acronyms
AEP American Electric Power
AMS Advanced Metering System
CenterPoint CenterPoint Energy Houston Electric LLC
DG Distributed Generation
DRG Distributed Renewable Generation
ERCOT Electric Reliability Council of Texas
ERSC Entergy Regional State
ERS Emergency Response Service
ETI Entergy Texas Inc
IMM ERCOT Independent Market Monitor
kWh Kilowatt-hour
LMP Locational Marginal Pricing
LSP Large Service Provider
MISO Midwest Independent System Operator
MMBtu One million British Thermal Unit (BTU)
MW Megawatt
MWh Megawatt-hour
Nodal Texas Nodal Market Design
ORDC Operating Reserve Demand Curve
PGC Power Generation Company
POLR Provider of Last Resort
PURA Public Utility Regulatory Act
REP Retail Electric Provider
RSC Regional State Committee
RTO Regional Transmission Organization
SCED Security Constrained Economic Dispatch
Sharyland Sharyland Utilities LP
SBF System Benefit Fund
SPP Southwest Power Pool
TDU Transmission and Distribution Utility
TNMP Texas-New Mexico Power Company
32 | P a g e
2017 SCOPE OF COMPETITION IN ELECTRIC MARKETS IN TEXAS REPORT
Appendix B ndash ERCOT Desalination Report
This page intentionally left blank
33 | P a g e
ERCOT Public
Study on the Demand Response Potential for Seawater Desalination Projects
ERCOT November 18 2016
Study on the Demand Response Potential for Seawater Desalination Projects ERCOT Public
Executive Summary
In 2015 the 84th Texas Legislature enacted House Bill (HB) 4097 which included several provisions relating to seawater desalination projects including a requirement that the Public Utility Commission of Texas (PUC) and Electric Reliability Council of Texas (ERCOT) study the potential for seawater desalination projects to participate in existing demand response opportunities in ERCOT There are several demand response products in which demand-side resources (ie consumers of electricity) can participate These programs help to preserve system reliability and provide economic benefits to participating demand-side resources Seawater desalination is an energy-intensive process that removes salt and other minerals from salt water to produce fresh water for municipal consumption industrial use or irrigation Participation in demand response could help mitigate electricity costs for future seawater desalination projects in Texas and provide reliability benefits to the grid
There are two main demand response reliability-based services administered by ERCOT participation by demand-side resources in the Ancillary Services market and the Emergency Response Service (ERS) Within the Ancillary Services market the most common service provided by demand-side resources is Responsive Reserve Service (RRS) which requires resources to respond either instantaneously or within 10 minutes in response to unplanned system emergencies ERS is separate from ERCOTrsquos Ancillary Services market and allows demand-side resources and distributed generation to provide reliability services in the event of an energy emergency Resources can qualify for either the 10-minute or 30-minute response time ERS programs
There are several key considerations that will impact a demand-side resourcersquos ability to participate in different demand response opportunities response time recovery time predictability of electrical demand and flexibility of operations Considering these factors together it appears that seawater desalination plants could be designed to meet the requirements for participation in demand response Because the ability to meet the qualification requirements is dependent on the plant design demand response opportunities should be considered early in a projectrsquos development if participation is desirable
Whether project developers will choose to address these requirements will depend on the economic benefits of participation There may be additional costs to design seawater desalination plants to operate in the manner required in order to participate in demand response These include costs associated with additional plant design specifications need for excess capacity and storage to make up for lost production during demand response deployment operational costs resulting from interruptions to plant processes and potential financial penalties if demand response deployment results in failure to meet contract demands The interplay of the benefits of participation and these costs will determine whether it would be beneficial for a future seawater desalination plant to participate in demand response in ERCOT
To date participation of seawater desalination plants in demand response programs has been limited Because the process of seawater desalination is energy-intensive participation in demand response could help to reduce electricity costs while posing a relatively low risk to plant operations As stakeholders in Texas continue to plan for possible future droughts in the region and identify water management strategies consideration of demand response could play a role in mitigating some costs associated with seawater desalination and allow seawater desalination plants to assist with maintaining electric reliability in the region
copy 2016 ERCOT All rights reserved i
Study on the Demand Response Potential for Seawater Desalination Projects ERCOT Public
Table of Contents
1 Introduction 1
2 Seawater Desalination 2
21 Seawater Desalination Plant Operations 2
22 Seawater Desalination Plant Economics 3
3 Demand Response Opportunities in ERCOT 4
31 ERCOT-Dispatched Demand Response 4
311 Ancillary Services Markets 5
312 Emergency Response Service (ERS) 5
32 Non-ERCOT-Dispatched Demand Response 6
321 Four Coincident Peak (4CP) 6
322 LSE or DR Provider Contracted Price Response 6
323 Self-Directed Price Response 6
4 Demand Response Potential for Seawater Desalination 7
41 Operational Considerations for ERCOT-Dispatched Demand Response 7
42 Economic Considerations for ERCOT-Dispatched Demand Response 8
43 Considerations for Non-ERCOT-Dispatched Demand Response 9
5 Conclusion 11
copy 2016 ERCOT All rights reserved ii
Study on the Demand Response Potential for Seawater Desalination Projects ERCOT Public
1 Introduction
In 2015 the 84th Texas Legislature enacted House Bill (HB) 4097 which included several provisions relating to seawater desalination projects including a requirement that the Public Utility Commission of Texas (PUC) and Electric Reliability Council of Texas (ERCOT) study the potential for seawater desalination projects to participate in existing demand response opportunities in ERCOT ERCOT and the PUC initiated this study to fulfill that requirement and evaluated the operational and economic characteristics of seawater desalination plants in light of ERCOTrsquos primary demand response products1
ERCOT is the independent system operator (ISO) for the ERCOT Interconnection which encompasses approximately 90 of demand for electricity in Texas ERCOT is the independent organization established by the Texas Legislature to be responsible for the reliable planning and operation of the electric grid for the ERCOT Interconnection ERCOT also administers and maintains a forward-looking open market to provide affordable and reliable electricity to consumers in Texas In collaboration with market participants ERCOT has developed demand response products and services for customers that have the ability to reduce or modify electricity use in response to instructions or signals These programs help preserve system reliability and provide economic benefits to participating demand-side resources
The process of seawater desalination removes salt and other minerals from salt water to produce fresh water for consumption industrial processes or irrigation The drought-prone Texas climate coupled with projections for increasing water demand in the state has created interest in seawater desalination as a future water source The 2017 Texas State Water Plan includes seawater desalination as a future water management strategy for water users in the state However the seawater desalination process is energy intensive and electricity consumption can be a significant cost driver for these projects To the extent that these plants could participate in demand response it would help to defray these costs Thus there is a potential nexus between seawater desalination projects built in Texas to mitigate drought but which have large electricity requirements and ERCOT demand response opportunities which could help to reduce their electricity costs and provide reliability benefits
This study evaluates the demand response potential of seawater desalination plants based on their operational characteristics and economic drivers The report is organized as follows
Section 2 provides background on typical seawater desalination plant operations and economics
Section 3 describes the current demand response opportunities in ERCOT
Section 4 evaluates the characteristics of seawater desalination plants to determine their potential to participate in demand response opportunities in ERCOT and
Section 5 provides a summary of the conclusions of this study
1 In the course of developing this report ERCOT consulted with several desalination experts with experience with existing or planned seawater desalination plants in the US The technical experts consulted included Jorge Arroyo (Water Management Consultant) Andrew Chastain-Howley (Black amp Veatch) Jonathan Loveland (Black amp Veatch) Ron Parker (Black amp Veatch) John Wolfhope (Freese and Nichols) and Srinivas Veerapaneni (Black amp Veatch)
copy 2016 ERCOT All rights reserved 1
Study on the Demand Response Potential for Seawater Desalination Projects ERCOT Public
2 Seawater Desalination
There are two primary methods for seawater desalination distillation (also referred to as ldquothermalrdquo) and reverse osmosis Distillation uses heat to remove salts and minerals from seawater by boiling water at high pressures In contrast reverse osmosis technology forces saline water through a membrane to separate water from the salts and minerals While both distillation and reverse osmosis are energy intensive distillation requires thermal energy to heat the water and overall has a higher energy requirement whereas reverse osmosis requires primarily electrical energy and overall is less energy intensive ndash though still with significant electricity requirements
Globally most thermal desalination plants are located in the Middle East due to low energy prices in the region Plants located elsewhere including in the US typically use reverse osmosis technology2 There are two large existing seawater desalination plants in the US one in Carlsbad California providing water to the San Diego area and one in Gibsonton Florida providing water to the Tampa Bay area Both plants use reverse osmosis technology In addition there are several desalination projects currently in the planning stages or under development in Texas in the Corpus Christi area that would use reverse osmosis technology For that reason this report focuses on reverse osmosis technology in the evaluation of demand response potential of seawater desalination plants
While there are currently no existing seawater desalination plants in Texas there are several municipal and industrial brackish water desalination plants in the state According to the Texas Water Development Board (TWDB) there are 46 municipal brackish water desalination plants with capacities greater than 0025 million gallons per day (MGD) in Texas representing a total of 123 MGD of capacity3 The desalination of brackish water is typically less expensive compared to seawater due to the lower relative salinity of brackish water This study focuses exclusively on seawater desalination consistent with the requirements of HB 4097 but it should be noted that conclusions may also apply to brackish water desalination though at a different cost and scale
This section provides high-level information on the operations (Section 21) and economics (Section 22) of seawater desalination plants to inform the discussion of their demand response potential in Section 4
21 Seawater Desalination Plant Operations Seawater desalination plants typically range in capacity from less than 5 MGD up to 165 MGD For example the Carlsbad seawater desalination plant has a capacity of approximately 50 MGD and the plant in Tampa Bay has a capacity of approximately 25 MGD The associated electricity consumption ranges between 10 and 15 kWh1000 gallons produced depending on the salinity of the water being processed456 More saline water (eg seawater) requires larger amounts of electricity for desalination Thus a seawater desalination plant would have larger electricity consumption requirements compared to a similarly sized brackish water desalination plant
2 American Water ldquoInnovation Solutions within the Water Industry Desalinationrdquo Available at httpwwwamwatercomfilesInnovationsSolutionsWithinTheWaterIndustryDesalinationpdf 3 Texas Water Development Board ldquoDesalination Factsrdquo Available at httpswwwtwdbtexasgovinnovativewaterdesalfactsasp 4 American Membrane Technology Association April 2016 ldquoMembrane Desalination Power Usage Put in Perspectiverdquo Available at httpwwwamtaorgcomwp-contentuploads7_MembraneDesalinationPowerUsagePutInPerspectivepdf 5 Water Reuse Association November 2011 ldquoSeawater Desalination Power Consumptionrdquo Available at httpswatereuseorgwpshycontentuploads201510Power_consumption_white_paperpdf 6 Ghaffour N TM Missimer and G Amy January 2013 ldquoTechnical review and evaluation of the economics of water desalination Current and future challenges for better water supply sustainabilityrdquo Desalination 309 pp197-207 Available at httpswwwresearchgatenetpublication256693140_Technical_review_and_evaluation_of_the_economics_of_water_desalination_ Current_and_future_challenges_for_better_water_supply_sustainability
copy 2016 ERCOT All rights reserved 2
Study on the Demand Response Potential for Seawater Desalination Projects ERCOT Public
While the two existing seawater desalination plants in the US were co-located with power plants to ease compliance with regulations on water intake and discharge structures and reduce costs many other reverse osmosis desalination plants receive their electricity from the grid However plants may have on-site backup generation in case of a power outage This will vary depending on the size and design of the plant and other factors For example the Carlsbad plant in California does have diesel backup generation to power control systems and flushing systems in the case of a power outage The plant in Tampa Bay was not built with backup power due to potential storm surge risks from hurricanes and other storms The plant does use uninterruptible power supply (UPS) backup to power control systems during power outages
Reverse osmosis plants are typically designed with several ldquotrainsrdquo which consists of a high-pressure pump turbine and reverse osmosis membrane Desalination plants are turned on or off one train at a time in a highly controlled process The process of ramping up or down an individual train under normal operations typically takes one to two hours While plants can be designed to handle immediate shutdowns (ie in a power outage) re-starting a system after an interruption would take this amount of time In addition the saline water must be pretreated (ie filtered) before going through the reverse osmosis train and this can sometimes pose constraints on the flexibility of operations
Demand for water is the key factor driving the level of production at seawater desalination plants Typically the plant will have a contract or contracts with municipal or other water users to deliver desalinated water and is operated to meet that demand Alternatively if the plant is municipally owned it would similarly be operated to meet the level of water demand in conjunction with other available water sources If water demands are close to a plantrsquos full capacity the operatorrsquos flexibility to adjust its electricity consumption as part of demand response may be limited However this does mean that plant operations are fairly predictable on a day-to-day basis which is necessary for participation in demand response
The amount of flexibility in plant operations will also be impacted by the amount of water storage available For example if a plant has sufficient water storage on-site or storage within the customerrsquos distribution system it could provide flexibility for the plant to reduce its operations during peak hours when electricity prices are likely to be highest It would also mitigate the impacts of interruptions to production from demand response deployments
22 Seawater Desalination Plant Economics Seawater desalination is typically more expensive than other sources of water and a major driver of the overall cost is energy costs In 2016 the Carlsbad plant charged rates at between $2131 and $2367 per acre-foot78 This charge is intended to cover both the fixed costs of the plant and the variable costs to produce a unit volume of water Typically half to two thirds of the cost of providing desalinated seawater are accounted for by capital cost recovery with the remainder accounted for by operations and maintenance costs including electricity costs Electricity costs can account for 20shy25 of the total costs of seawater desalination with reverse osmosis technology9
Factors affecting the capital cost of a seawater desalination plant include plant size type of desalination process and pre-post-treatment technologies plant infrastructure (eg piping water storage backup power) and compliance with applicable regulations (eg regulations on intake structures brine byproduct disposal) A significant driver of operating and maintenance costs is membrane replacement Reverse osmosis membranes need to be replaced every few years and
7 Source San Diego County Water Authority ldquoSeawater Desalinationrdquo Available at httpwwwsdcwaorgseawater-desalination 8 Note that 1 acre-foot is approximately 325851 gallons 9 Based on technical input from Black amp Veatch
copy 2016 ERCOT All rights reserved 3
Study on the Demand Response Potential for Seawater Desalination Projects ERCOT Public
the rate at which they are replaced will depend on the salinity of the feedwater and how the plant is operated Treatment and disposal of the salty brine byproduct from desalination may also incur operating costs
Electricity costs will vary depending on a range of factors including the size of the plant type of desalination technology source of electricity and quality of the feedwater As previously noted more saline water requires higher amounts of electricity in desalination and thus the amount of electricity consumption is a key difference between brackish water and seawater desalination As a result electricity costs comprise a significant share of the costs of seawater desalination These costs could potentially be defrayed in part by participation in demand response initiatives
3 Demand Response Opportunities in ERCOT
Broadly speaking demand response can be broken down into two major categories dispatchable or non-dispatchable For purposes of this report we will define dispatchable as those demand response events that are initiated by ERCOT and non-dispatchable as an event not specifically initiated by ERCOT These non-dispatchable events may include decisions made by the end-use customer to alter its consumption pattern or may include contractual obligations with another entity such as the end-use customerrsquos retail electric provider (ldquoREPrdquo) to alter consumption patterns
ERCOTrsquos wholesale market is open to several types of dispatchable demand response which are deployed to maintain system reliability Demand-side resources providing Emergency Response Service (ERS) may offer based on either a 10 or 30-minute response time commonly referred to as the ldquoramp periodrdquo Alternatively demand-side resources may register and qualify as a Load Resource that can provide Reserves in the Ancillary Services market The most common service provided by demand-side resources is Responsive Reserve Service which requires an under-frequency relay that can instantaneously interrupt the load during certain system reliability events Some demand-side resources can also participate in other Ancillary Services as Controllable Load Resources that require sophisticated control systems that allow them to be deployed in a more incremental proportional manner
Non-dispatchable demand response in ERCOT can include a response to avoid transmission costs where rates are based on Four Coincident Peak Pricing (4CP) response to wholesale energy prices initiated by the customer or by a REP or other load-serving entity (ldquoLSErdquo) or utility-managed Load Management programs (LM)
The sections that follow provide a description of both ERCOT-dispatched (Section 31) and nonshyERCOT-dispatched (Section 32) demand response For a more detailed description of opportunities for demand-side resources to participate in demand response in ERCOT see ERCOTrsquos guide Load Participation in the ERCOT Nodal Market10
31 ERCOT-Dispatched Demand Response There are two main demand response reliability-based services administered by ERCOT participation by demand-side resources in the Ancillary Services market and participation in ERS These services are dispatched by ERCOT during system emergencies
10 Available at httpwwwercotcomcontentservicesprogramsloadLoad20Participation20in20the20ERCOT20Nodal20Market_302d oc
copy 2016 ERCOT All rights reserved 4
Study on the Demand Response Potential for Seawater Desalination Projects ERCOT Public
Demand-side resources with demand response capability that can meet a set of performance requirements can be qualified to provide Ancillary Services as Load Resources in the Ancillary Services Market The value of having a Load Resource available to reduce load is equal to the value of having a generator available to increase its generation at a generating plant The providers of operating reserves selected to provide Ancillary Services are eligible for capacity payments regardless of whether the Resource is actually deployed (or curtailed in the case of the Load Resource)
ERCOT holds auctions on a daily basis for each of the following Ancillary Services Regulation Up Regulation Down Responsive Reserve and Non-Spinning Reserve11 Table 1 describes the various Load Resource types and their qualification requirements and eligible services
Table 1 Load Resource Types and Ancillary Services
Service Load Resource Type a Qualification Responsive Reserves (le50 of total Reserve requirement)
Non Controllable Under-Frequency Relay and 10-minute ramp to manual dispatch instruction
Responsive Reserves
Controllable Primary Frequency Response and follow 5-minute dispatch instructions
Regulation-Up Regulation-Down
Controllable Primary Frequency Response and respond to Regulation deployments
Non-Spin Reserves Controllable Follow 5-minute dispatch instructions a A Controllable Load Resource is a Load Resource capable of controllably reducing or increasing consumption under dispatch control by ERCOT
Demand-side resources that agree to reduce load when directed by ERCOT and that meet other metering and operational requirements as specified in the ERCOT Protocols may participate in Ancillary Services market auctions As noted in Table 1 the type of Ancillary Service that a Load Resource may provide will depend upon the demand-side resourcersquos response time and metering system as well as other requirements described in the Protocols In the Responsive Reserve and Non-Spin Reserve markets the Load Resource will receive capacity payments regardless of whether or not the load was actually deployed but the load must be available for deployment at any time while providing the service
ERCOT procures ERS to maintain grid reliability during emergency conditions and reduce the likelihood of the need for rotating outages ERS participants may offer to provide demand response with either a 10-minute ramp period requirement (similar to Load Resources providing Responsive Reserve Service) or a 30-minute ramp period requirement ERS Resources do not have the same telemetry and under-frequency relay requirements as Load Resources
11 Regulation Up and Regulation Down service respond to signals from ERCOT every 4 seconds to respond to changes in system frequency full response has to be provided within 5 minutes Responsive reserves must provide their committed capacity either instantaneously in an under-frequency event (eg due to a generator outage) or in energy scarcity conditions within ten minutes following an instruction from ERCOT Non-spinning reserves must provide their committed capacity within 30 minutes based on economic dispatch instructions Non-spinning reserve is used as replacement reserve to replenish other ancillary services and during energy scarcity
copy 2016 ERCOT All rights reserved 5
Study on the Demand Response Potential for Seawater Desalination Projects ERCOT Public
ERS is procured through a request for proposal (RFP) process three times per year for four-month contract terms each of which is further split into smaller time periods based on business cycles and other factors Demand-side resources may choose to submit offers in all time periods or only in those that best fit their unique circumstances and may vary both the price and demand response capacity offers by time period
Payments for ERS are performed up to 80 days after each four month contract term has ended and are subject to downward revision based upon delivered demand response capacity and the demand-side resourcersquos availability during the contract term
32 Non-ERCOT-Dispatched Demand Response The options listed below are not dispatched by ERCOT but they either are controlled directly by a customer or are dispatchable by another entity such as a demand response provider (ldquoDR Providerrdquo) REP or a transmission and distribution utility
Many industrial customers are subject to transmission charges based upon a Four Coincident Peak (4CP) demand The 4CP demand is determined by averaging the consumerrsquos actual demand during the 15-minute settlement interval with the highest ERCOT demand during each of the four summer months (June through September) This measured 4CP demand serves as the basis for the customerrsquos transmission tariff charges for the following year By correctly predicting the ERCOT system peaks during the summer and curtailing load during those intervals a consumer can help reduce the stress imposed on the electric system during peak periods of consumption and reduce its transmission charges for the following calendar year
In the competitive areas of ERCOT consumers can contract with their REP or a DR Provider to have their load respond to the REPrsquos or DR Providerrsquos instructions The contract will usually outline the parameters of this response ndash at what times and frequency demand response events can be called ramp periods sustained response periods compensation etc Because this response is a contractual matter between the REP or DR Provider and the consumer a great deal of variety can be present in these arrangements For example a consumerrsquos response may be voluntary or required compensation could come in the form of reduced energy prices or rebate payments for each curtailment event consumers might be notified up to a day in advance or could have no notification at all (for automated curtailment)
In areas of ERCOT not open to competition interruptible tariffs may be available These tariffs will usually offer a reduced energy price for defined curtailment obligations
REPs may offer dynamic pricing options or consumers within a municipality or cooperative may have their energy prices determined by a published tariff which also may be structured based upon Time-of-Use (TOU) or have a Critical Peak Pricing (CPP) or Peak Time Rebate (PTR) component Self-directed price response refers to consumers making an independent decision to respond to energy prices contained in a governing tariff or in either the ERCOT Day Ahead or Real Time energy markets
TOU offerings will typically have higher energy prices during normal peak periods ndash for example a TOU tariff may charge one price during Monday through Friday from 2 pm through 8 pm and another price during all other times Customers may choose to reduce consumption during these high priced periods Load reduction can be accomplished by load shifting (loads can be shifted by
copy 2016 ERCOT All rights reserved 6
Study on the Demand Response Potential for Seawater Desalination Projects ERCOT Public
rescheduling certain processes or by utilizing thermal storage) ending certain processes that are no longer economic or through energy efficiency measures
Offerings that incorporate CPP usually have prescribed high prices only during certain defined periods ndash for example when load or prices are expected to reach a certain level Response to CPP may be similar to those employed under TOU tariffs especially if CPP is reached frequently More often CPP is infrequent and as such short-term load curtailment may be the more appropriate response to meet economic objectives
4 Demand Response Potential for Seawater Desalination
This section evaluates whether the operational characteristics and economics of seawater desalination plants would enable them to participate in one or more of the various demand response opportunities in the ERCOT Region To date participation of seawater desalination plants in demand response programs has been limited Neither the plant in Carlsbad nor the plant in Tampa Bay participate in demand response programs in California or Florida respectively However as will be described below it appears that these plants can be designed and operated to meet the requirements for participation in demand response and receive economic benefit from participation in these programs
Section 41 describes the operational parameters that must be met for a demand-side resource to provide ERCOT-dispatched demand response and evaluates the ability of seawater desalination plants to meet these criteria Section 42 discusses the tradeoffs between payments for participation in ERCOT-dispatched demand response and potential additional costs posed to seawater desalination plants Finally Section 43 presents other opportunities for seawater desalination plants to reduce their electricity costs outside of ERCOTrsquos reliability-based services that are open to demand response assets
41 Operational Considerations for ERCOT-Dispatched Demand Response There are several key operational parameters that impact a demand-side resourcersquos ability to participate in different demand response services response time recovery time predictability of electrical demand and flexibility of operations This section discusses each of these considerations as they apply to seawater desalination plants
As discussed in Section 31 one of the differentiating factors between ERCOTrsquos demand response products is the amount of time within which a demand-side resource must respond to a deployment instruction to reduce electricity consumption during an event Participation in RRS requires an automatic response within either half a second (ie instantaneous) based on grid frequency or within 10 minutes via a manual instruction ERS requires a response time of either 10 or 30 minutes As noted in Section 21 the typical time to take a reverse osmosis train on- or off-line is 1-2 hours under normal controlled operations To comply with the response time requirements of RRS or ERS a seawater desalination plant would need to be able to reduce its electricity consumption far more quickly than in normal operations This is an element of plant design that would need to be accounted for in the specifications of the project Considerations include the potential need for on-site backup generation including uninterruptible power supply potential impacts to plant infrastructure (eg piping) reverse osmosis membranes and pretreatment systems
The two large US desalination plants provide illustrative counterpoints in this respect The Carlsbad plant was designed to withstand instantaneous power interruptions and has on-site backup generation including uninterruptible power supply to provide the ability to power control systems and flush the membranes in the event of a power loss In contrast the Tampa Bay plant was not
copy 2016 ERCOT All rights reserved 7
Study on the Demand Response Potential for Seawater Desalination Projects ERCOT Public
designed with on-site backup generation and a loss of power would result in a plant shutdown and may require several days to bring the plant back on-line Thus it appears that it is technically possible for a seawater desalination plant to meet the response time requirements for participation in demand response so long as this factor is considered in the design of the facility
The time it takes a desalination train to return to operations after an event is also a consideration Demand-side resources participating in RRS must be able to come back on-line within three hours and those participating in ERS must return within 10 hours Again it appears that it is technically feasible for desalination plants to meet this requirement so long as this requirement is considered in the plant design
An additional consideration is the predictability of a demand-side resourcersquos electricity consumption Participation in the responsive reserves ancillary service market requires bidding in the day-ahead market and thus a demand-side resource must know with great accuracy (within 95) its electrical demand at least a day ahead of time For ERS auctions are held three times a year for four-month contract periods Thus to participate in ERS a resource must know its forecasted electrical demand several months in advance Because seawater desalination plant operations are driven by contracted demand for water it is likely that a plant operator would have a good idea of the plantrsquos electrical demand days or even weeksmonths in advance especially for summer months when demand is likely to be relatively steady An important consideration however is the salinity of the water which drives the electrical requirements and which can be impacted by recent weather events Similarly reductions in demand for water during non-summer months or wet summer days where demand may be reduced could also impact a plantrsquos ability to predict its electricity demand
Finally a seawater desalination plant must have sufficient flexibility in its day-to-day operations so that it can afford to lose several hours of production when deployed for demand response It should be noted that demand-side resources participating in RRS and ERS are called infrequently demand-side resources providing responsive reserves were deployed one time in 2015 and ERS was not deployed that year However this is an important factor to consider if a plant is operating at close to full capacity and would incur financial penalties if it fails to meet its contract obligations due to a demand response event Including additional storage and building a plant with extra capacity could help to mitigate this risk It should also be noted that a plant operator does not need to commit the full plant capacity to these services but rather can specify an amount of MW that will be committed Thus a plant operator could mitigate issues both with predictability and flexibility of plant operations by committing only a portion of its predicted electrical demand to participate in demand response
Considering these factors together it appears that seawater desalination plants could be designed to meet the operational requirements for participation in ERCOTrsquos demand response services (both RRS and ERS) Because the ability to meet the requirements is dependent on the plant design demand response would need to be considered early in a projectrsquos development if participation is desirable Whether project developers will choose to address these requirements will depend on the economic benefits of participation in demand response which will be discussed in the next section
42 Economic Considerations for ERCOT-Dispatched Demand Response This section describes the economic benefits to demand-side resources from participation in ERCOT-dispatched demand response programs The average price paid for a demand-side resource participating in RRS in 2015 was $1087 per MW per hour and for ERS was $645 per MW per hour for the contract periods during the 2015 program year These payments could provide a significant financial benefit to seawater desalination plants To give a simplified example for a plant with an electrical demand of 10 MW operating at a 100 annual load factor (10 MW times 24 hours times 365 days) the annual benefit would be on the order of $500000 for ERS or $1 million for RRS
copy 2016 ERCOT All rights reserved 8
Study on the Demand Response Potential for Seawater Desalination Projects ERCOT Public
In 2015 demand-side resources providing responsive reserves were deployed one time for a duration of 10 minutes and ERS was not deployed12 The most ERS was ever deployed in a single year was two times in 2011 Thus participation in either program could result in a substantial payment to a seawater desalination plant with a relatively low risk of deployment and associated disruption of plant operations although it is important to note that participation in either ERCOT service subjects demand response resources to annual unannounced testing Other than testing the frequency of deployment will depend on grid conditions and is a risk that should be considered
The financial benefits of participation must be weighed against the costs of designing facilities with the capabilities to operate in this manner These include
bull The costs to design the plant to reduce electrical demand within the required timeframes for demand response and to withstand an instantaneous interruption if not already part of the plant design For example a plant may need to be designed to have backup power generation on-site In addition there could also be costs to restart the system after an interruption
bull The costs to build a plant with excess capacity andor storage to make up for lost production hours when demand response is deployed This will add to the total capital costs of the project Land area constraints should also be considered when considering additional storage as the space requirements for the necessary storage capacity could be significant
bull Costs associated with the impact of interruptions on plant processes (eg more frequent replacement of membranes impacts to pretreatment system or plant infrastructure)
bull Potential financial penalties that would be incurred if deployment as part of demand response were to result in failure to meet contract obligations to supply water
bull The loss of potential benefits in the form of cost avoidance from participation in non-ERCOTshydispatched demand response opportunities (see Section 43) If a plant is committed to RRS or ERS the plant operator would lose the flexibility to take advantage of these other opportunities to reduce their electricity costs
The interplay of these benefits and costs will determine whether it would be beneficial for a future seawater desalination plant to participate in demand response in ERCOT
43 Considerations for Non-ERCOT-Dispatched Demand Response Outside of the reliability-based services administered by ERCOT there are other opportunities for seawater desalination plants to reduce their electricity costs As described in Section 321 seawater desalination plants may be able to reduce the demand charges on their electricity bills through curtailing load during 4CP intervals In addition plant operators may adjust operations in response to real-time electricity prices to take advantage of lower off-peak prices and avoid price spikes (see Sections 322 and 323) All of these opportunities require that the plant have flexibility to reduce production during certain times of the day
In the ERCOT region as noted above a portion of transmission and distribution charges are set based on the peak systemwide 15-minute interval of the four summer months (June through September) referred to as the four coincident peaks (4CP) Large customers can reduce or avoid this charge by reducing electrical consumption during these four peak intervals AEP Central Texas and CenterPoint are the transmission providers covering the majority of the Gulf Coast in Texas13
12 ERCOT June 2016 ldquoLoad Resource Deployment Updaterdquo Available at httpwwwercotcomcontentwcmkey_documents_lists870985_RRS_Load_Resource_Deployment_Updatepdf 13 It is also possible that a seawater desalination plant could be located in an area that as not opted in to competition in which case the plant owner would need to negotiate its electricity charges bilaterally with the Non Opt-In Entity (NOIE)
copy 2016 ERCOT All rights reserved 9
Study on the Demand Response Potential for Seawater Desalination Projects ERCOT Public
Assuming a future seawater desalination plant would be connected at transmission-level voltages the relevant 4CP charges based on the 2016 tariffs accounting for both transmission charges and transmission cost recovery factors would be $41425 per 4CP kW for AEP Central Texas and $41870 per 4CP kVA for CenterPoint14 If a seawater desalination plant has 10 MW of load and is capable of interrupting all of it and successfully does so for all four 4CP intervals the savings based on the 2016 tariffs would be approximately $500000 per year ($41425 times 1000 (kW to MW) times 10 MW times 12 months) Thus a seawater desalination plant that reduces its electricity use during the 4CP intervals could avert some or all of these charges
Another opportunity for seawater desalination plants to reduce their electricity costs is through adjusting operations in response to real-time electricity prices In 2015 the average electricity price in ERCOT was $2677MWh However prices exceeded $50MWh in 254 hours (3 of all hours) $100MWh in 88 hours (1) $200MWh in 40 hours (05) and $300MWh in 21 hours (02) Prices exceeded $3000MWh for 021 hours15 Depending on the desalination plantrsquos exposure to real-time wholesale market prices (via its retail contract) the degree of high prices the plant owner is willing to avoid and grid conditions in a given year reducing unit operations in order to avoid high electricity prices could impact operators for anywhere between a few and several hundred hours out of the year In addition a plant can plan its operations to take advantage of lower electricity prices during off-peak periods (eg at night when generation from wind is high) For example at least one company is marketing a modular desalination unit design intended to take advantage of low prices during periods of high renewables generation and to provide grid reliability services through demand response16
There are several factors to consider regarding these opportunities to reduce electricity costs The plant would need to monitor the ERCOT market or hire a contractor to do so in order to know when to reduce demand for electricity These programs do not impose any requirements on response time as with RRS or ERS and there may be sufficient warning of 4CP intervals or peak pricing to allow the plant operator to plan its operations earlier in the day with sufficient time to ramp down production under controlled conditions However quicker ramping capability may be desirable to respond to electricity price fluctuations
For 4CP because the four intervals used to set demand charges are not known ahead of time it is likely that the plant would need to reduce its demand multiple times per summer to ensure the 4CP intervals are hit impacting production at the facility Timing operations to coincide with off-peak pricing or to avoid price spikes would similarly result in reduced operations during certain hours To offset the lost production hours the plant may need to be designed with extra capacity and water storage capability to maintain the ability to meet its contractual obligations for freshwater delivery Because the period of reduced operations is greater than with ERCOT-dispatched demand response services this need would be greater for a seawater desalination plant reducing load during 4CP intervals or in response to real-time electricity prices and would increase the capital costs of the project It should also be noted that high prices in the ERCOT Region typically but not always occur in summer months when drought conditions are more likely to develop and demand for desalinated water is likely to be highest This may limit the flexibility of the plant to time its electricity consumption to avoid high-priced hours
14 Public Utility Commission of Texas ldquoTransmission and Distribution Rates for Investor Owned Utilitiesrdquo Available at httpwwwpuctexasgovindustryelectricratestdraspx 15 Potomac Economics June 2016 2015 State of the Market Report for the ERCOT Wholesale Electricity Markets Available at httpswwwpotomaceconomicscomindexphpmarkets_monitoredERCOT 16 Sisyan LLC ldquoDemand Response Desalinationrdquo Available at httprenewabledesalinationcomwpshycontentuploads201506Demand-Response-Desalinationpdf
copy 2016 ERCOT All rights reserved 10
Study on the Demand Response Potential for Seawater Desalination Projects ERCOT Public
In addition the plantrsquos ability to participate in demand response would also be limited for those hours it is reducing load as part of 4CP response or in response to real-time prices because the plant would not be able to reduce its electricity consumption if that demand is already committed to another demand response service Thus participating in demand response versus taking advantage of these other opportunities may be to some extent mutually exclusive
5 Conclusion
Based on this analysis it appears that the operational characteristics of seawater desalination plants would allow them to participate in demand response opportunities in ERCOT so long as the necessary operational requirements are considered in the design specifications of the plant Project developers should consider the necessary requirements early in the plant design Whether the economic benefits of participation would provide a sufficient incentive for them to do so will depend on the costs of accommodating those operational requirements and whether there is the flexibility available to operate the plant as necessary under these programs Though most existing seawater desalination plants do not participate in demand response programs it does appear that participation by these plants is possible and could result in a financial benefit Table 2 compares the different demand response opportunities available to demand-side resources in ERCOT
Table 2 Comparison of Demand Response Opportunities Demand Response
Opportunity Requirements for
Participation Impacts to Plant
Operations Financial Benefit Ancillary Services ndash Responsive Reserve Service (RRS)
bull Under-Frequency Relay bull Instantaneous or 10 minute
response time bull Recover load within 3
hours bull Bid in day-ahead market
bull Deployed once in 2015 for 10 minutes bull Subject to annual
unannounced testing
bull $1087 per MW per hour (based on 2015 prices)
Emergency Response Service (ERS)
bull 10 or 30 minute response time bull Recover load within 10
hours bull Four-month contract term
bull Not deployed in 2015 the most times ever deployed in a single year was twice in 2011 bull Subject to annual
unannounced testing
bull $645 per MW per hour (based on 2015 prices)
Four Coincident bull Interval Data Recorder bull Likely plant will need to bull Avoid ~$48000 per 4CP Peak (4CP) (IDR) meter
bull Ability to predict system-wide peak demand hours during summer months
reduce load multiple times per summer to hit 4CP intervals bull Likely to be able to predict
possible 4CP intervals earlier in day
MW per year (based on 2016 tariffs) if successful in reducing during all four summer months
LSE or DR Provider Contracted Price Response
bull Varies based on contractual arrangements
bull Varies based on contractual arrangements
bull Varies based on contractual arrangements
Self-Directed Price bull Retail contract with bull Varies depending on bull Varies depending on Response exposure to real-time
market prices bull Ability to monitor real-time
prices in ERCOT wholesale market
number and severity of pricing events bull May be able to predict
peak pricing events earlier in day
number and severity of pricing events
copy 2016 ERCOT All rights reserved 11
Study on the Demand Response Potential for Seawater Desalination Projects ERCOT Public
Demand response programs in ERCOT provide opportunities for demand-side resources to defray their electricity costs and provide reliability benefits to the ERCOT electric grid Because the process of seawater desalination is energy intensive participation in demand response could help to reduce electricity costs while posing a relatively low risk to plant operations if demand response participation is factored into plant design
Participation in non-ERCOT-dispatched demand response opportunities such as reducing load during 4CP intervals or in response to real-time electricity prices may also help to reduce electricity costs for seawater desalination plants in Texas As stakeholders in Texas continue to plan for possible future droughts in the region and identify water management strategies consideration of demand response could play a role in mitigating some costs associated with seawater desalination and allow seawater desalination plants to assist with maintaining electric reliability in the region
copy 2016 ERCOT All rights reserved 12
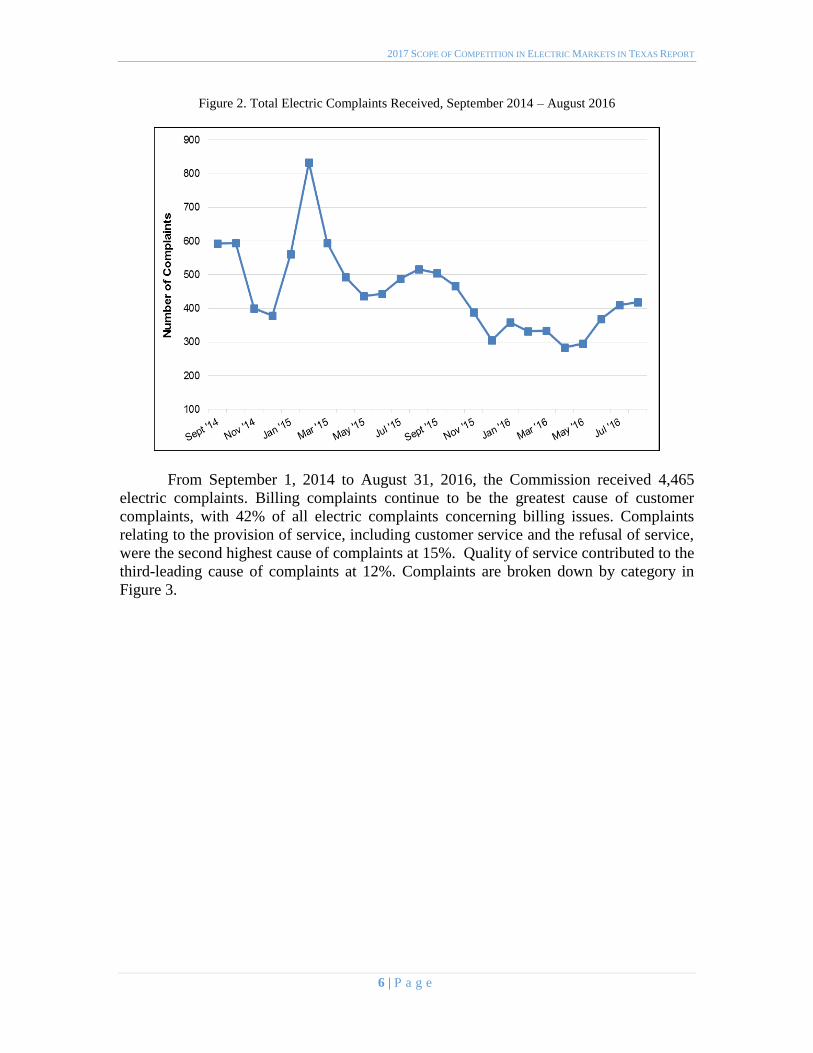
2017 SCOPE OF COMPETITION IN ELECTRIC MARKETS IN TEXAS REPORT
Figure 2 Total Electric Complaints Received September 2014 ndash August 2016
From September 1 2014 to August 31 2016 the Commission received 4465
electric complaints Billing complaints continue to be the greatest cause of customer
complaints with 42 of all electric complaints concerning billing issues Complaints
relating to the provision of service including customer service and the refusal of service
were the second highest cause of complaints at 15 Quality of service contributed to the
third-leading cause of complaints at 12 Complaints are broken down by category in
Figure 3
6 | P a g e
2017 SCOPE OF COMPETITION IN ELECTRIC MARKETS IN TEXAS REPORT
Figure 3 Electric Complaints Received by Category September 2014 ndash August 2016 14
4 Energy-Efficiency Programs
Energy-efficiency programs in Texas are administered by the TDUs in ERCOT and
the vertically integrated utilities outside of ERCOT pursuant to the Public Utility
Regulatory Act (PURA) sect39905 The utilities recover the cost of the energy-efficiency
programs through a surcharge on electric bills which are adjusted and approved annually
by the Commission Under the energy-efficiency programs TDUs reduced 559369 MWh
of electricity consumption in 2015 exceeding the goal for the year by 40 The energy-
efficiency programs are designed to reduce customersrsquo energy consumption as well as
electric peak demand In 2011 SB 1125 increased the peak demand goal reduction to a
30 growth in demand Once a utility reaches this goal the utility must achieve a
reduction of four-tenths of one percent of the utilityrsquos summer weather-adjusted peak
demand in subsequent years
The 2011 legislation also required that the Commission develop an evaluation
measurement and verification (EMampV) framework to promote effective program design
to provide consistent and streamlined reporting and to retain a third-party contractor to
conduct these activities EMampV efforts for the 2015 program year focused on evaluating
targeted programs for which the associated peak demand and energy savings were most
uncertain A primary component of EMampV is the statewide Technical Reference Manual
(TRM) a single common reference document prepared and maintained by the EMampV
contractor to estimate energy and peak demand savings resulting from the installation of
14 ldquoCrammingrdquo is the practice of adding unauthorized charges for any services to an electric bill without verified consent by the customer ldquoSlammingrdquo is the practice of switching the customer to another provider without authorization
7 | P a g e
2017 SCOPE OF COMPETITION IN ELECTRIC MARKETS IN TEXAS REPORT
energy efficiency measures sponsored by utility-administered programs in Texas In 2015
changes made to the TRM added and updated existing deemed savings values and added
standardized EMampV protocols for determining and verifying energy and demand savings
effective for the 2016 program year Verified demand and energy savings and program
costs for 2015 are shown in Table 4
Table 4 2015 Verified Energy Efficiency Savings15
MW MWh MW MWh
El Paso Electric 1231 22283 1116 19552 $4039278
Entergy Texas 1809 39688 1550 27156 $7023009
SPS 817 14537 549 9627 $3190744
SWEPCO 988 15262 560 9811 $3220359
Non-ERCOT Total 4844 91770 3775 66146 $17473390
AEP Central 4378 68482 1293 22653 $13261480
AEP North 454 12289 426 7464 $2727260
CenterPoint 16849 188255 5883 103069 $35832993
Oncor 11581 178908 6940 121589 $47438836
Sharyland 060 2528 100 1752 $633252
TNMP 866 17452 5770 10109 $4011627
ERCOT Total 34188 467915 15219 266636 $103905448
Grand Total 39033 559685 18994 332782 $121378838
Excludes Statewide EMampV contractor expenses of approximately $3M for review of prior program year
GoalProgram CostUtility
Verified Savings
In 2015 the utilities cumulatively achieved 206 of the demand reduction goal
(226 for utilities in ERCOT) and 168 of the energy reduction goal (175 for utilities
in ERCOT)
5 Customer Education Activities
The Commission engages with residential and small commercial electric customers
about retail electric competition through its ldquoTexas Electric Choicerdquo campaign and also informs customers about energy conservation opportunities through its ldquoPower to Save Texasrdquo campaign In addition to engaging with customers through these two campaigns
Commission staff also respond to customer inquiries and distribute literature about
electricity facts and issues
15 The non-ERCOT utilities within the state of Texas are El Paso Electric Company (ldquoEl Paso Electricrdquo) Entergy Texas Inc (ldquoEntergy Texasrdquo) Southwestern Public Service Company (ldquoSPSrdquo) and Southwestern Electric Power Company (ldquoSWEPCOrdquo)
8 | P a g e
2017 SCOPE OF COMPETITION IN ELECTRIC MARKETS IN TEXAS REPORT
a ldquoPower to Chooserdquo
The Commission educates customers about the evolving marketplace continuing
its ldquoTexas Electric Choicerdquo campaign which began in February 2001 with the goal of educating Texans about the changes and choices in the retail electric market The
PowerToChooseorg website and its Spanish-language counterpart PoderDeEscogerorg
provides a simple one-stop shop portal for Texans who live in a service territory open to
customer choice to enter in their zip code and browse through the numerous plans offered
by the REPs
b ldquoPower to Save Texasrdquo
In addition to the ldquoTexas Electric Choicerdquo campaign and the PowerToChoose website the Commission has also continued its statewide initiative ldquoPower to Save
Texasrdquo together with its parallel Spanish-language initiative ldquoPoder de Ahorrarrdquo which educates Texans about conserving energy during the summer peak times of 3 pm to 7
pm when the demand for electricity tends to be the highest The PowerToSaveTexasorg
website and its Spanish-language counterpart PoderDeAhorrarTexasorg provide Texans
with energy saving tips for homes and businesses
As part of the Power to Save Texas campaign the Commission contracted with
Resource Action Programs (RAP) to develop and implement a middle school energy
conservation outreach program in Hidalgo Harris Dallas and Tarrant counties In the
2015 ndash 2016 school year the program provided an effective energy education program
which strongly supports the Texas Essential Knowledge and Skills (TEKS) curriculum
standards as well as engages students through school challenges and at-home activities
c Campaign Outreach
PowerToChooseorg and its Spanish-language counterpart PoderDeEscogerorg
have proven valuable in educating customers about customer choice in the electricity
market The Commission conducted a number of activities to further promote the statersquos official electric choice website through social media community events trade shows and
expos From September 1 2015 through August 31 2016 nearly a million potential
customers visited the PowerToChooseorg and PoderDeEscogerorg websites Website
statistics are contained in Table 5
Table 5 Website Statistics September 2015 ndash August 2016
PowerToChoosecom Unique Visitors 980473
PoderDeEscogercom Unique Visitors 4652
d Low-IncomeElderly Outreach and Collaboration with Faith- and
Community-Based Organizations
Throughout 2015 and 2016 the Commissionrsquos staff also worked with legislative
offices and faith- and community-based organizations to provide educational materials and
training to help their constituents better understand the deregulated electric market and the
9 | P a g e
2017 SCOPE OF COMPETITION IN ELECTRIC MARKETS IN TEXAS REPORT
Commissionrsquos websites The Commission has actively participated with the Interagency
Coordinating Group (ICG) which was established by the Texas Legislature to expand and
improve relationships between state government and faith- and community-based
organizations Information on customer assistance programs such as LITE-UP Texas was
provided to community organizations such as Legal Aid of Northwest Texas senior
activity centers and religious groups
e Call Center
The Commission has trained its Customer Protection Division staff who are fluent
in both English and Spanish to answer customer calls and to assemble and mail
informational packets comparing electric plans when requested by customers without
Internet access From September 2015 to August 2016 the Customer Protection Division
staff handled 7663 calls from customers requesting assistance with shopping
f Educational Literature
In addition to the educational materials on the Commissionrsquos website the Commission provides brochures fact sheets and other educational materials by mail and
e-mail through a network of community organizations and events and in response to
customer requests to the call center Up-to-date fact sheets are available on the
Commissionrsquos website PowertoChooseorg and PoderDeEscogerorg as part of the
campaignrsquos outreach efforts The fact sheets provide information on a number of current
industry and consumer topics
Throughout 2015 and 2016 campaign educational materials promoting the
agencyrsquos programs including Power to Choose and Power to Save Texas were distributed
at numerous community events and civic town hall events such as Hurst-Euless-Bedford
ldquoBack 2 Schoolrdquo day Dickenson Housing Family Fair Energy Day DFW Family Fair
Earth Day Texas Texas Home and Garden shows in Houston Texas Black Expo National
Night Out events and minor league baseball games
Wholesale Market Development
The Commission engages regularly with ERCOT to oversee market developments
and ensure system supply reliability security and improved price formation and market
outcomes Market design changes made as a result of this working relationship have
created new opportunities for a variety of generation resources to enter the market and
supported the formation of wholesale prices that reflect real-time market conditions more
accurately and therefore improve the efficiency of the market
1 Wholesale Market Prices
Wholesale market prices have fallen in comparison to prices seen in the 2012 ndash 2014 period The ERCOT load-weighted real-time average price of energy in 2015 was
$2677 per Megawatt-hour (MWh) a 34 decrease from the average price in 2014 and a
decrease of 21 from the average seen in 2013
10 | P a g e
2017 SCOPE OF COMPETITION IN ELECTRIC MARKETS IN TEXAS REPORT
Falling wholesale prices are correlated with the current trend of lower natural gas
prices the primary fuel of many of the regionrsquos power plants The average Houston Ship Channel spot price for natural gas was 41 lower in 2015 than in 2014 decreasing from
$437MMBtu in 2014 to $258 in 2015 Through March the average price for 2016 has
fallen to $192MMBtu Natural gas price trends from September 2014 through August
2016 are shown in Figure 4
Figure 4 Monthly Average Natural Gas Prices September 2014 ndash August 2016
Monthly average wholesale electricity prices are shown in Figure 5 Load-
weighted prices are calculated by dividing the price at a load zone by the associated
demand This metric provides a useful proxy for the actual wholesale prices paid by load16
16 It is worth noting that most power in ERCOT is sold through various bilateral arrangements that
are designed to hedge daily real-time market price risk
11 | P a g e
2017 SCOPE OF COMPETITION IN ELECTRIC MARKETS IN TEXAS REPORT
Figure 5 Load-Weighted Average Real-Time Monthly Settlement Point Prices September 2014 ndash August 2016
Another component of the real-time price of electricity is the cost of transmission
congestion Transmission congestion occurs when there is insufficient transmission
capacity to dispatch energy in a least-cost fashion The recent build-out of additional
transmission lines in areas of high congestion has partially relieved the cost burden in these
areas particularly in West Texas where oil and gas production growth rapidly increased
the demand for electricity resulting in relatively higher zonal prices
2 Peak Demand
After the very high peak demand levels during the hot summer of 2011 peak
demand in ERCOT was lower in 2012 through 2014 In 2015 peak demand again
increased though not to 2011 levels with load exceeding 60000 MW for 330 hours and
exceeding 65000 MW for 91 hours as shown in Figure 6 below In 2016 ERCOT
experienced a record week in August which saw the previous record peak demand broken
six times and the ERCOT region hit its all-time peak demand of 71093 MW on August
11 2016
As peak demand has increased the recorded availability of generation supply in the
region during times of high load has decreased slightly Physical Responsive Capability
(PRC) analogous to the amount of reserves available on the system at any given time fell
below 3000 MW for 269 hours in 2015 up slightly from 213 hours in 2014 and 215
hours in 2013 but well below the 371 hours recorded during the 2011 summer
12 | P a g e
2017 SCOPE OF COMPETITION IN ELECTRIC MARKETS IN TEXAS REPORT
Figure 6 High Load Hours in ERCOT 2011 ndash 2016
As shown in Table 6 the ERCOT system peak demand was 69877 MW in 2015
up 5 from the 2014 peak and the 2016 ERCOT system peak demand increased 174
from the peak demand of the previous year
Table 6 ERCOT Peak Demand 2012 ndash 2016
Year
ERCOT Peak
Demand (MW)
Percentage Change
from Prior Year
2012 66548 ndash 2013 67245 105
2014 66454 ndash118
2015 69877 515
2016 71093 174
Figure 7 shows the hourly peak load for each month in ERCOT from January 2014 to
August 2016
13 | P a g e
2017 SCOPE OF COMPETITION IN ELECTRIC MARKETS IN TEXAS REPORT
Figure 7 Monthly Peak Demand in ERCOT January 2014 ndash August 2016
3 Generation Diversity
As electricity consumption has increased in ERCOT the diversity of the systemrsquos generation portfolio has also increased Generators participating in the statersquos renewable energy credit (REC) trading program reported an 11 increase in renewable generation
from 2013 to 2015 rising from 376 million MWh to 469 million MWh with wind
representing 96 of the total renewable mix Landfill gas was the second most prevalent
renewable source representing approximately 12 of all renewable generation in 2015
Energy produced from wind generation was up by 13 in 2015 from 2013 and solar
energy capacity more than doubled from 121 MW in 2013 to 288 MW in 2015 Coal-fired
generation has been steadily shrinking as a proportion of total generation declining from
37 of electricity produced in 2014 to 28 in 2015 Energy use in the ERCOT region by
fuel type for 2015 is shown in Figure 8
14 | P a g e
2017 SCOPE OF COMPETITION IN ELECTRIC MARKETS IN TEXAS REPORT
Figure 8 Energy Use in ERCOT by Resource Type 2015
The Commissionrsquos projects are further described in the following section of this report
15 | P a g e
2017 SCOPE OF COMPETITION IN ELECTRIC MARKETS IN TEXAS REPORT
III SUMMARY OF COMMISSION ACTIVITIES FROM 2015 TO 2016
Introduction
The Commission develops and modifies rules policies and procedures for the
competitive electric market in Texas in response to the technological advances in the
industry and the evolving needs of customers The Commission also continues to carry
out oversight of programs with which the Legislature has tasked it ndash such as energy
efficiency renewable energy and advanced metering infrastructure Within the
ERCOT region the monopoly wires-and-poles companies that provide transmission
and distribution services throughout the grid remain subject to traditional rate
regulation by the Commission The Commission continues to set rates for these
utilities as they are not subject to the forces of market competition This section
provides an overview of the Commissionrsquos activities in its oversight of the wholesale and retail electric markets as well as its governance over regulated electric utilities
Resource Adequacy
Resource adequacy is the long-term ability of the system to serve demand reliably
when consumption is highest given the available installed capacity load resources and
the operational reliability of the system Assessing resource adequacy requires comparing
the systemrsquos forecast installed capacity and load resources against the forecast peak
summer load The difference between the forecast of available generation and load
resources and the forecasted demand for electricity is referred to as an ldquoinstalled capacity
reserve marginrdquo which is an indicator of the ability of the system to meet customer demand
during peak conditions In addition to evaluating the forecast reserve margin assessing
resource adequacy includes evaluating the systemrsquos operational reliability The systemrsquos operational reliability depends on the ability of generators to manage plant operations
successfully as well as the grid operatorrsquos ability to manage the system to avoid or to mitigate load curtailment During 2015 and 2016 the ERCOT system performed well with
respect to resource adequacy The Commission has devoted significant attention to
ensuring that ERCOT maintains an adequate installed capacity reserve margin and a high
level of operational reliability developing a wholesale market design that allows
consumers to continue to receive low-cost and reliable electricity over the long term
1 Capacity Demand and Reserves Report
The Capacity Demand and Reserves (CDR) Report published by ERCOT semi-
annually is a snapshot estimate of long-term supply and demand and the associated annual
reserve margin for peak summer and winter conditions While the CDR Report is not a
forecast of any particular outcome it provides insight into possible resource adequacy
trends
16 | P a g e
2017 SCOPE OF COMPETITION IN ELECTRIC MARKETS IN TEXAS REPORT
The May 2016 CDR Report shows estimated reserve margins well above the
current target reserve margin of 1375 Installed capacity reserve margin estimates taken
from this CDR Report are shown below in Table 7
Table 7 May 2016 Capacity Demand and Reserves Report Forecast
Forecast 2017 2018 2019 2020 2021 2022 2023 2024 2025 2026
Peak Load
(MW)
68548 69409 70795 71420 72098 72792 73482 74168 74864 75704
Total
Capacity
(MW)
80995 87019 87238 87407 87678 87738 87738 87728 87728 87728
Reserve
Margin
182 254 232 224 216 205 194 183 172 159
2 Operating Reserve Demand Curve
In ERCOT the price signals produced by the energy-only wholesale electric market
should provide incentives to promote short-term reliability as well as induce optimal long-
run investment in new resources If the prices are efficient and reflect the full cost of
dispatching resources to meet demand the benefits that accrue to both consumers and
producers can be maximized at the least cost and new generating capacity (or load
resources) should develop to maintain the equilibrium as old resources retire or demand
increases
The Operating Reserve Demand Curve (ORDC) implemented at the Commissionrsquos direction in June 2014 improves price formation by allowing prices to more fully reflect
the value of operating reserves The ORDC assigns an economic value to operating
reserves or the amount of extra capacity available to maintain system reliability on a daily
basis
As part of its ongoing review of resource adequacy in ERCOT the Commission is
currently evaluating the accuracy of the inputs to the ORDC to ensure that its contribution
to price formation appropriately reflects the costs of meeting demand and the underlying
needs of the system
3 Transmission Congestion
Although competitive power producers and regulated transmission providers form
two distinct segments of the market transmission buildout has a direct effect on wholesale
power prices When there is insufficient transmission capacity to dispatch energy in a least-
cost fashion the system operator takes action to ensure that the physical limits of the
transmission system facilities are not violated The re-dispatch of generation because of
transmission limits results in disparate prices at different locations on the system In
comparison to prior years transmission congestion in ERCOT has lessened because of the
large increase in transmission investment and the reduction of high demand related to oil
and gas production in West Texas ERCOT and the Commission continually evaluate the
need for cost-effective additional transmission investment to manage congestion
17 | P a g e
2017 SCOPE OF COMPETITION IN ELECTRIC MARKETS IN TEXAS REPORT
4 Wholesale Market Design Initiatives
While the ERCOT wholesale market has been successful in attracting new resource
investment and also maintaining competitive prices for consumers certain improvements
to the market design could yield additional benefits in terms of efficient price formation
and opportunities for entry of new technology Initiatives already in place in many other
regions such as real-time co-optimization and multi-interval real-time resource dispatch
may allow existing capacity to be used more effectively and create opportunities for the
integration of additional load resources to serve electric demand The Commission
continues to work with ERCOT and interested stakeholders to determine the value of
implementing such enhancements particularly as ERCOTrsquos resource mix changes over time
5 Reliability Standard
In early 2014 the Commission opened a project to review its use of a target installed
capacity reserve margin based on a reliability standard equivalent to one loss-of-load event
every ten years In this project the Commission received written comment from interested
parties conducted a public workshop consulted with independent experts and reviewed
the application of reliability standards in other regions As a result of this review future
reliability metrics to be estimated in ERCOT will include the market equilibrium reserve
margin the economically-optimal reserve margin and the associated levels of expected
unserved energy The Commission believes that publishing these metrics represents an
improvement over reporting a one-event-in-ten-years standard by enhancing insight into
expected outcomes in ERCOTrsquos energy-only market
Non-ERCOT Utilities Market Development Activities
SB 7 the law that introduced retail competition to the Texas market in 1999
granted the Commission authority to delay retail competition in an area where deregulation
would not result in fair competition and reliable service because of the lack of an
independent organization to coordinate the electric system and the concentration of
ownership in the generation sector in some of those areas Consequently SB 7 included
provisions recognizing the difficulty of implementing retail competition in areas outside of
ERCOT Therefore the utilities outside of the ERCOT region remain vertically integrated
owning generation transmission and distribution assets as well as selling power to end-
use customers These vertically integrated utilities remain subject to traditional regulation
including rates set by the Commission and customer choice is not offered in the service
territories of these utilities
The Commission does continue to monitor ongoing activities in the non-ERCOT
portions of the state In 2015 the Legislature granted the Commission the authority to
retain counsel and consulting experts in order to participate in legal proceedings at the
Federal Energy Regulatory Commission (FERC) which has regulatory jurisdiction over
wholesale power sales and transmission rates outside of ERCOT This authority has
18 | P a g e
2017 SCOPE OF COMPETITION IN ELECTRIC MARKETS IN TEXAS REPORT
permitted the Commission to participate more effectively in FERC proceedings affecting
Texasrsquo utilities located outside of ERCOT
1 Southwest Power Pool
The Southwest Power Pool (SPP) is the Regional Transmission Operator (RTO) for
areas of Northeast Texas and the Texas Panhandle In Texas the utilities Southwestern
Electric Power Company (SWEPCO) Southwestern Public Service (SPS) and several
electric cooperatives and municipally owned utilities are in SPP In addition to these areas
of Texas the SPP footprint includes parts of New Mexico Arkansas Missouri Nebraska
Louisiana and all of Kansas and Oklahoma In 2015 SPP became the RTO for the
Integrated System and neighboring areas which includes parts of Iowa Minnesota North
Dakota South Dakota Wyoming and Montana SPP has spent extensive time and
resources over the last two years to integrate these new areas successfully The expansion
added 5000 MW of peak demand 7600 MW of generating capacity and 9500 miles of
transmission lines17
In 2014 SPP launched its new Integrated Marketplace which provides a Day-
Ahead Market a Real-Time Balancing Market and Congestion Hedging Markets
mechanisms similar to those available in ERCOT The implementation of the Integrated
Marketplace resulted in a savings of $422 million in 2015 As a result of the Integrated
Marketplace SPPrsquos planning reserve margin will be reduced from 136 to 12 a change
expected to save about $90 million annually
Chairman Donna L Nelson represents the Commission as a voting member on
SPPrsquos Regional State Committee (RSC) The RSC provides collective state regulatory
agency input on a variety of issues In addition the RSC has authority over the cost
allocation methodologies for transmission upgrades allocation of Financial Transmission
Rights and the approach used for resource adequacy across the SPP region The RSC
regularly meets on a quarterly basis and meets more frequently if necessary
2 Midcontinent Independent System Operator
The Midcontinent Independent System Operator (MISO) is an RTO that serves all
or part of 15 states in the central US one Canadian province and the portion of eastern
Texas served by the vertically integrated utility Entergy Texas Inc MISO provides a Day
Two market which has a variety of functions and services including energy and ancillary
service markets economic dispatch congestion management financial transmission rights
and transmission planning The MISO Independent Market Monitor concluded that the
MISO wholesale markets were competitive in 2015
Like SPP MISO is in the Eastern Interconnection which crosses state boundaries
and is therefore subject to FERC jurisdiction A number of recent FERC proceedings have
17 2015 Southwest Power Pool Annual Report Available at
httpswwwspporgdocuments37800201520southwest20power20pool20annual20reportpdf
19 | P a g e
2017 SCOPE OF COMPETITION IN ELECTRIC MARKETS IN TEXAS REPORT
affected the portion of Texas that is in the MISO footprint The Commission through
outside counsel has been an active party in such FERC proceedings FERC Docket No
ER14-1174 addressed in part a dispute regarding the availability of transmission capacity
under the Joint Operating Agreement between MISO and the SPP Ultimately FERC
approved a settlement agreement under which MISO will compensate SPP and its members
for using their or other entitiesrsquo transmission systems
In a related pending docket at FERC Docket No ER14-1736 parties are addressing
how the cost of these payments will be allocated among MISO market participants Parties
in this proceeding are engaged in settlement discussions In addition in Docket No ER14-
75-000 FERC approved a settlement agreement among the participating Entergy
Operating Companies and their retail regulators to terminate the Entergy System
Agreement effective August 31 2016 The settlement terms prohibit any post-termination
payments that roughly equalize production costs among the operating companies after
December 31 2015 terminate certain specific cross-purchase power agreements between
Entergy Texas and former Entergy Gulf State Louisiana and permit the continuation of
several other purchase power agreements
Commissioner Kenneth W Anderson Jr represents the Commission as a voting
member in the Organization of MISO States (OMS) the purpose of which is to coordinate
regulatory oversight among the states in the MISO region and to make recommendations
to MISO FERC and other entities Commissioner Anderson also represents the
Commission as a voting member of the Entergy Regional State Committee (ERSC) which
has certain FERC-approved authority for five years after the Entergy integration with
regard to cost allocation for Entergy transmission projects and adding transmission projects
to the Entergy construction plan The ERSC meets quarterly
3 Western Electricity Coordinating Council
The Western Electricity Coordinating Council (WECC) is a Regional Entity whose
region includes the area surrounding El Paso and extends from Canada to Mexico
including the provinces of Alberta and British Columbia the northern portion of Baja
California and all or portions of the 14 Western states in between WECC is the Regional
Entity responsible for Bulk Electric System reliability in the Western Interconnection and
associated compliance monitoring and enforcement WECC does not have organized
markets outside of California but is organized into 38 separate balancing authorities
WECC is geographically the largest and most diverse of the eight Regional Entities in the
United States with delegated authority from the North American Electric Reliability
Corporation (NERC) and the Federal Energy Regulatory Commission In Texas El Paso
Electric Company is a member of WECC
Rulemaking Activities
The Commission has continued to adopt new rules and modify existing rules in
order to further the continued successful operation of the competitive retail and wholesale
markets and to comply with statutory changes made to PURA by the Legislature This
20 | P a g e
2017 SCOPE OF COMPETITION IN ELECTRIC MARKETS IN TEXAS REPORT
section of the Report provides a high-level overview of the Commissionrsquos key rulemaking
activities highlighting the market improvements made in 2015 and 2016
1 Cost Recovery and Rate Adjustment
The Commission adopted new rule 16 TAC sect25246 on June 29 2016 to
implement Section Nos 1 through 3 of House Bill 1535 of the 84th Legislature The new
rule only applies to a utility that operates solely outside of ERCOT and allows for the use
of an update period beyond the test year for which the utility initially files estimated
information The rule clarifies that all information originally estimated must be updated
with actual information and also provides requirements for a post-test-year adjustment for
a natural gas-fired plant A non-ERCOT utility also is required to initiate a new base rate
case on or before the four year anniversary of the final order in the utilityrsquos most recent comprehensive base rate case or if the commission determines that the utility has
materially earned more than its authorized rate of return in two consecutive years The rule
also provides requirements and procedures for the relation back of final rates to an effective
date 155 days after the filing of the rate application
2 Changes to Certificates of Convenience and Necessity and CREZ Rule
The Commission conducted a rulemaking to implement changes pursuant to
Legislative mandates in SB 776 SB 933 and HB 1535 of the 84th Legislature SB 776
required municipally owned utilities to apply for a certificate of convenience and necessity
(CCN) before constructing transmission facilities outside the boundaries of the
municipality that owns the municipally owned utility SB 933 also requires persons to
obtain a CCN before interconnecting a tie line into the ERCOT grid HB 1535 requires the
Commission to issue a final order within 181 days for a non-ERCOT utility requesting a
CCN for an existing electric generating facility and 366 days after a non-ERCOT utility
files a CCN for a newly constructed generating facility In addition the Commission also
determined in this rulemaking that all future transmission projects in a Competitive
Renewable Energy Zone (CREZ) must meet the need criteria of PURA sectsect 37056(c)(1)
and (2) rather than being exempt Finally the Commission determined that the CREZ
project established in 2008 was complete following the installation of a second circuit on
a Sharyland line
3 Use of Handheld Device for Enrollment
As the market evolves the Commission evaluates market changes balancing its
desire to encourage customer-focused innovation with its concern for customer protection
against potential abuses In Docket No 44518 the Commission granted a REP a
temporary 12-month waiver from its rules requiring the marketer to obtain telephonic
verification of the customerrsquos desire to switch REPs as well as a waiver from certain authorization disclosure requirements among other stipulations the Commission placed
upon the REP The Commission then opened Project No 45625 to study the issue of REPs
utilizing hand-held devices for customer enrollment more broadly and engage with market
representatives consumer representatives and other stakeholders The Commission
anticipates considering an amendment to its rules in the spring of 2017
21 | P a g e
2017 SCOPE OF COMPETITION IN ELECTRIC MARKETS IN TEXAS REPORT
4 Smart Meter Texas Portal
The electric utilities in Texas that have advanced metering systems (AMS) jointly
own and operate a single web portal known as Smart Meter Texas (SMT)18 SMT fulfills
two requirements imposed by the Commissionrsquos advanced metering rule on a utility with
AMS (1) provide to the retail customer the REP serving the customer and other entities
authorized by the customer access to such retail customerrsquos consumption data and (2)
allow devices at the customerrsquos premises to communicate through a home area network with the advanced meter at the premises SMT also facilitates near real-time on-demand
reads of a customerrsquos meter that aids prepaid service offered by certain REPs
In Project No 42786 Review of Advanced Metering System Web Portal
Commission staff and stakeholders examined options for the long-term operational
structure governance and funding of SMT The Commission determined that ownership
of SMT should remain with the TDUs because they can operate the portal at a lower cost
than transferring the data repository to ERCOT The Commission opened two
rulemakings one to ascertain the appropriate governance performance and funding of
SMT and a second to determine the appropriate access for third parties ensuring that
customers have the freedom to grant and give third parties access to their data if made
knowingly while also securing customer privacy
Sharyland Utilities
In early 2015 customers of Sharyland Utilities the smallest investor-owned
transmission and distribution utility in ERCOT began to file with the Commission a
significant number of complaints regarding high electricity bills In response the
Commission opened Project No 44592 Relating to a Project Regarding Sharyland
Utilities to provide for a more formal process for Commission review of the large number
of complaints As part of this project Commission staff prepared a report to evaluate the
electricity rates and electric bills in the operating area of Sharyland Utilities that was
previously part of Cap Rock Energy
Staffrsquos report found that a number of factors contributed to the comparatively high
bills for many of Sharyland-Cap Rockrsquos customers First Sharylandrsquos small size and its low customer density result in high TDU rates for all customers relative to other TDUs In
particular Staffrsquos report found that Sharyland-Cap Rockrsquos rates for distribution service are
up to three times higher than those of other TDUs in Texas In addition to Sharyland-Cap
Rockrsquos high costs for distribution service higher wholesale transmission costs also
contributed to the rate increases charged to Sharyland-Cap Rockrsquos customers These transmission costs are the result of increased transmission investment in recent years
throughout Texas that has increased transmission costs for all distribution providers
18 The participating Texas TDUs are AEP Texas Central Company and AEP Texas North Company (jointly
ldquoAEPrdquo) CenterPoint Energy Houston Electric LLC (ldquoCenterPointrdquo) Oncor Electric Delivery Company LLC (ldquoOncorrdquo) and Texas-New Mexico Power Company (TNMP) collectively referred to as the ldquoJoint TDUsrdquo Operation of an AMS web portal was addressed in the orders approving particular utilitiesrsquo deployment of AMS and approving surcharges for AMS cost recovery While Sharyland Utilities filed comments in the proceeding it did not
participate as it had not fully completed its AMS deployment at the time
22 | P a g e
2017 SCOPE OF COMPETITION IN ELECTRIC MARKETS IN TEXAS REPORT
including Sharyland Utilities Second the comparatively colder winter of 2014 ndash 2015
which was the time period generally consistent with the timeframe in which the
Commission began receiving complaints appeared to result in higher electricity usage than
normal This combination of high TDU rates and the higher electricity usage led to higher
bills for customers
Staffrsquos report also noted that in Sharyland-Cap Rockrsquos last rate case in 2014 the
approved rates reflected movement towards more cost-based rates for all customers
including some customers that previously had been heavily subsidized by other customers
Additionally in the process of standardizing Sharyland-Cap Rockrsquos customer classification
with the classifications of the other TDUs in Texas some customers may have experienced
a move from one class that previously was paying below-cost rates to another class that
was now paying above-cost rates For some of these customers the combined effects of
the movement towards cost-based rates and the change to a different class may have
contributed to a significant change in the customersrsquo rates Regardless of any cost-shifting
between customer classes Sharylandrsquos rates remain two to three times higher than those of other TDUs in Texas for all customers in all classes
On December 4 2015 the Commission signed an order directing Sharyland to file
an application for a comprehensive rate review by April 30 2016 Sharyland filed its rate
application on April 29 2016 in Docket No 45414 Review of the Rates of Sharyland
Utilities LP On October 10 2016 the Commission ordered Sharyland to file an amended
application as soon as practicable but no later than January 1 2017 to reflect the unique
aspects of the companyrsquos organizational structure as a real estate investment trust (REIT) At the time of publication Sharyland is expected to file its amended application in
December 2016
PowerToChoose Website
As part of its ongoing evaluation of the competitive market the Commission
opened Project No 45730 to evaluate the functionality and usability of its PowerToChoose
website which allows customers to select a REP and an electric plan based on their zip
code In the process the Commission received significant feedback from customers stating
that the Commissionrsquos PowerToChoose website was an important tool that plays a
fundamental role in their shopping process In response to the feedback received from
industry representatives and consumers Commission staff changed how the website sorts
and filters retail electric plans adding a filter to allow customers to unselect plans that
contain minimum usage fees or credits This filter is now a default setting and plans with
minimum usage fees and credits are not shown unless the customer actively selects to
search for such plans In addition Commission staff made other changes to increase the
clarity of the REP complaint rating The Commission continues to evaluate other changes
to improve the customer experience of the PowerToChoose website and provide
transparency for retail electric plans
23 | P a g e
2017 SCOPE OF COMPETITION IN ELECTRIC MARKETS IN TEXAS REPORT
Report on Alternative Ratemaking Mechanisms
In 2015 the Legislature enacted SB 774 which requires the Commission or its
consultant to conduct a study and make a report to the Legislature analyzing the alternative
ratemaking mechanisms adopted by other states In addition SB 774 extended the
authorization for the Periodic Rate Adjustment (PRA) mechanism from 2017 to 2019
which the Legislature had authorized in 2011 (SB 1693) as a version of an alternative
ratemaking mechanism that provides to utilities a means for expedited recovery of
distribution infrastructure costs Pursuant to SB 774 the Commission retained a consultant
to produce the report and the consultantrsquos recommendations included streamlining the ratemaking process to reduce procedural costs providing for a periodic review of the
prudency of the costs and using certain types of alternative ratemaking mechanisms that
decouple the recovery of costs from variations in load The Commission held a public
hearing to receive comments on the report from stakeholders and after consideration of
those comments has provided to the Legislature the consultantrsquos report together with its
own discussion of the report
Request for Purchase of Oncor Electric Delivery Company
In March 2016 the Commission approved with conditions an application by an
investor group led by Hunt Consolidated Inc the owners of Sharyland Utilities to acquire
control of Oncor Electric Delivery Company (Oncor) the largest transmission and
distribution utility in Texas from Oncorrsquos parent company Energy Future Holdings which
is in bankruptcy The Commission approved the request subject to certain conditions
including stipulations regarding the organization of the new entities and treatment of tax
benefits The investor-led group subsequently declined to pursue the transaction that was
approved by the Commission
In September 2016 NextEra Energy which owns Florida Power amp Light received
approval from the United States Bankruptcy Court in Delaware for its plan to purchase
Oncor In October 2016 NextEra Energy filed an application with the Commission in
Docket No 46238 for approval of the proposed transaction The Commission will evaluate
the application to determine if the transaction is in the public interest
Integration of Lubbock Power and Light
In March 2016 the Commission opened Project No 45633 to study and identify
the issues related to the request of Lubbock Power and Light the statersquos third-largest
municipally owned utility to be integrated into ERCOT The Commission is currently
working with stakeholders ERCOT and SPP to determine the cost and benefits of any
potential switch by Lubbock Power and Light into ERCOT and whether such a switch is
in the public interest
24 | P a g e
2017 SCOPE OF COMPETITION IN ELECTRIC MARKETS IN TEXAS REPORT
Desalination Project ERCOT Studies
In 2015 the Legislature passed HB 4097 which directed the Commission and
ERCOT to study whether existing transmission and distribution planning processes are
sufficient to provide adequate infrastructure for seawater desalination projects and to study
the potential for desalination projects to participate in demand response opportunities in
the ERCOT market Pursuant to that direction ERCOT staff have prepared a report on the
feasibility of interconnection of large desalination projects and on opportunities for such
projects to participate in ERCOTrsquos demand response programs which is attached to this Report in Appendix B
Oversight and Enforcement Actions
The Commissionrsquos enforcement of statutes rules and orders applicable to entities
under its jurisdiction serves to protect consumers the electric markets the reliability of the
electric grid and to promote fair competition The Commissionrsquos enforcement efforts in the electric industry focus on violations of PURA the Commissionrsquos rules and ERCOT
protocols
During the period from January 2015 through August 31 2016 the Commission
assessed $3258500 in penalties against electric market participants Table 8 provides a
summary of electric industry Notices of Violation since January 2015 During 2015 and
2016 Commission staff opened 212 investigations for the electric industry and closed 177
investigations
Table 8 Notices of Violations
Violation Type Total Penalty Amount
Retail Market Violations $539000
Service Quality Violations $451500
Wholesale Market Violations $2268000
TOTAL $3258500
In addition to the imposition of administrative penalties the Commission uses other
enforcement mechanisms in exercising its enforcement duties including revoking a
companyrsquos certificate to operate In addition some companies may be required to relinquish a certificate as part of a settlement after enforcement action has proceeded
Table 9 provides a breakdown of the number of certificates revoked or relinquished In
2016 the Commission revoked the certificate of the REP TruSmart Energy
Table 9 Certificates Revoked or Relinquished
Type Number
Certificates Revoked 1
Certificates Relinquished 0
25 | P a g e
2017 SCOPE OF COMPETITION IN ELECTRIC MARKETS IN TEXAS REPORT
The Oversight amp Enforcement division also issues warning letters to companies in
the electric market when it determines that a violation occurred but given the
circumstances surrounding the violation and other mitigating concerns no administrative
penalty is warranted During 2015 and 2016 the Oversight amp Enforcement division issued
50 warning letters Finally the Commission generally seeks to reimburse money directly
to customers when appropriate In 2015 and 2016 the Commission ordered the
reimbursement of $8543596 to Texas electric customers
Table 10 Warning Letters
Warning Letter Type Number
Retail Market Warning Letter 8
Service Quality Warning Letter 1
Wholesale Market Warning Letter 41
TOTAL 50
In addition to its enforcement activities the Commission also enters into voluntary
mitigation plans with generators that request one through a contested case proceeding
pursuant to PURA sect15023(f) and 16 TAC sect25504(e) The Commission entered into one
voluntary mitigation plan during 2015 and 2016 in Docket No 44635
Low-Income Discount System Benefit Fund
The System Benefit Fund (SBF) was originally established in 1999 to fund
discounts to low-income customers customer education activities energy-efficiency and
weatherization and electric market oversight through a nonbypassable surcharge on retail
electric bills HB 1101 of the 84th Legislature provided that the SBF be sunset on
September 1 2017 by which time the SBF is intended to be exhausted In the 2016 Fiscal
Year (FY) $325521250 was appropriated in the SBF to provide a 25ndash31 percent discount
to low-income customers over a 12-month period
To assist the drawdown of the remaining balance HB 1101 authorized the
Commission to use any unexpended SBF balance in FY 2017 to assist low-income
customers The Commission estimates that the remaining SBF balance will be
approximately $17 million by August 31 2017 The Commission has determined that this
amount is insufficient to fund the rate reduction program however the Commission will
spend approximately $100000 to continue automatic enrollment in the program to provide
REPs a list of customers eligible to receive late fee waiver and deposit installment benefits
These two ancillary benefits of the rate reduction program will continue for the duration of
FY 2017
26 | P a g e
2017 SCOPE OF COMPETITION IN ELECTRIC MARKETS IN TEXAS REPORT
Homeland Security
The Commission assesses the efforts of ERCOT and utilities to defend against
mitigate and respond to the variety of risks that the modern electricity system faces The
Commission also meets with ERCOT utilities and governmental entities on an ongoing
basis to discuss preparation for everything from hurricanes and other severe weather to
cyber-threats and threats of physical damage to the grid from accidents or intentional
malfeasance In addition the Commission monitors industry and federal programs that
address homeland security issues
The Commission serves as an information liaison between state government and
electric utilities during emergencies The Commissionrsquos main roles include
Conveying outage and service restoration information from electric utilities to
state government
Conveying service restoration priorities (hospitals water treatment facilities
etc) from state government to electric utilities and
Facilitating the clearance of downed power lines in disaster re-entry areas and
facilitating entry of electric utilities into disaster areas
The Commissionrsquos Emergency Management Response Team (EMRT) provided staff at the
State Operation Center for the May 2015 and April 2016 flooding events in Texas as well
as additional staffing for severe winter weather
Demand Response
ERCOT staff have begun to report annually on the participation of customers in
REP-sponsored demand response programs These programs which have been facilitated
by the deployment of smart meters throughout the competitive areas within ERCOT and
by many municipal and cooperative electric utilities take the form of rebates for reduction
in usage during peak period time-of-use pricing real-time volumetric price compensation
for load reduction and direct control of customer load among other plans
These programs have seen dramatic increases in participation since ERCOT began
to gather this information in 2013 From 2013 to 2014 the number of residential customers
participating in these programs increased from 151793 to 721273 and the number of
commercial and industrial customers participating rose from 30275 to 50205 The
Commission continues to monitor ERCOTrsquos stakeholder process for efforts relating to the integration of demand response
27 | P a g e
2017 SCOPE OF COMPETITION IN ELECTRIC MARKETS IN TEXAS REPORT
IV LEGISLATIVE RECOMMENDATIONS
A Determination of Low-Income Customer Eligibility
In 2015 HB 1101 required that all remaining funds in the System Benefit Fund
(SBF) be expended that the fee that funded the program as a nonbypassable surcharge on
electric bills be set at zero and that the SBF be sunset on September 1 2017 Per the
provisions of HB 1101 the SBF fee was set at zero in September 2016 concluding the
funding for the program The sunset of the SBF program also concluded the relationship
between the Texas Health and Human Services Commission (HHSC) and the Commission
in which the HHSC provided to the Commission eligible electric customers for the SBF
low-income discount Because of the termination of the relationship with HHSC with the
termination of the SBF the Commission will no longer be able to determine easily an
electric customerrsquos eligibility for other low-income programs such as late penalty waivers
and the option of paying an electric deposit over multiple months
The Legislature may wish to consider easing low-income customers access to these
low-income programs by facilitating the process used to determine eligibility The
Commission offers four possible approaches in which the Legislature could continue these
low-income programs
(1) Authorize HSSC to provide identification of eligible low-income customers to the
Commission
(2) Allow retail electric providers (REPs) to provide such low-income programs using
the Low Income Discount Administratorrsquos (LIDA) Telecommunications Lifeline
Service Program list to identify low-income customers
(3) Require REPs to offer such low-income programs with customers self-enrolling
and REPs verifying income eligibility or
(4) Allow REPs to voluntarily provide such low-income programs at their own
discretion
B Outside Counsel for Proceedings before Regional Transmission
Organizations
Regional Transmission Organizations (RTO) manage the power grid across wide
regions of the United States Most of Texas is inside the ERCOT region however there
are significant portions of East Texas and the Panhandle that are in the Midcontinent
Independent System Operator (MISO) and the Southwest Power Pool (SPP) Issues arise
in these other RTOs that have significant impact on Texas ratepayers such as how
transmission infrastructure costs will be shared These tend to be very lengthy and
complicated proceedings that require specialized legal and consulting services
28 | P a g e
2017 SCOPE OF COMPETITION IN ELECTRIC MARKETS IN TEXAS REPORT
PURA sect 394525 currently authorizes the Commission to use outside consultants
auditors engineers or attorneys to represent the Commission in proceedings before the
Federal Energy Regulatory Commission This provision has been an important tool for the
Commission to respond to complex matters in the federal arena to enable it to protect the
public interest in Texas The PUC recommends that the Legislature expand the language
in this statute to include the ability to hire outside assistance for proceedings before other
RTOs to provide those same protections to Texas ratepayers in those areas
C Repeal of Natural Gas and Renewable Energy Mandates
1 Natural Gas
PURA sect 399044 establishes natural gas as ldquothe preferential fuelrdquo in Texas for electricity generation and requires the Commission to adopt rules to establish a system of
natural gas energy trading credits The majority of all new non-renewable electricity
generation constructed since 2000 for Texas has used natural gas as a primary fuel and this
trend is expected to continue in the foreseeable future The thresholds used to trigger the
natural gas energy trading credit system in PURA sect 399044 have not been reached and
they are not expected to be reached in the foreseeable future
Because natural gas-fueled facilities have been the most commonly built new
generation in Texas for many years and are expected to continue to be there is no need to
establish incentives for natural gas generation The PUC recommends that the Legislature
consider repealing PURA sect 399044 because it is no longer necessary
2 Renewable Energy
PURA sect 39904 establishes goals for renewable energy Subsection (a) requires
the installation of 5880 megawatts of renewable energy by 2015 and Subsection (b)
establishes a renewable energy credits trading program to implement the requirement The
5880 megawatts mandates in Subsection (a) was met in 2008 While the Commission
believes the renewable energy trading credit program is needed for retail electric providers
to validate renewable energy marketing claims the Commission believes the 5880
megawatts mandate in Subsection (a) is no longer necessary
D Advisory Opinions
Many regulatory agencies in Texas have authority to issue informal guidance to the
persons they regulate particularly with respect to outlining whether a particular course of
conduct would in the agencyrsquos view be consistent with the laws and regulations that the agency administers19 The issuance of an advisory opinion can provide regulatory clarity
to a company before making investments or conducting operations the permissibility of
which may be unclear under state law The Legislature may want to consider granting the
19 In addition certain federal agencies such as the Federal Communications Commission
Internal Revenue Service Securities and Exchange Commission and Federal Election
Commission have authority to issue advisory opinions
29 | P a g e
2017 SCOPE OF COMPETITION IN ELECTRIC MARKETS IN TEXAS REPORT
Commission the authority to issue advisory opinions In the electric industry providing
clarification to a company concerning issues such as the purchase of assets or the
acquisition of another company could allow it to avoid expensive regulatory proceedings
without impairing the Commissionrsquos authority The following state agencies have statutory authority to issue advisory opinions
Texas Ethics Commission20
Texas Medical Board21
State Board of Dental Examiners22
Texas Board of Nursing23
Texas Board of Professional Engineers24
Texas Lottery Commission and25
Texas Securities Board26
E Administrative
Gross Receipts Assessment
PURA sect 16001 provides for a gross receipts assessment that is used to defray the
expenses incurred by the Commission to administer PURA An assessment of one sixth of
one percent is collected from public utilities electric cooperatives retail electric providers
and interexchange carriersrsquo gross receipts from consumers The funds from this assessment
are remitted to the general revenue fund but currently they have not been explicitly
dedicated to funding of the Commission In contrast similar assessments on water
utilities insurance companies and other regulated entities have traditionally been used to
explicitly fund the underlying regulatory programs at the respective agencies The
Commission is one of four Article VIII agencies that is not designated as self-funded
The Commission recommends that the Legislature designate the Commission as a
self-funded agency whereby the collected assessments would be explicitly dedicated to the
funding of the agency Implementing this recommendation would require the Public Utility
Commission to be included in the Appropriations Limited to Revenue Collections rider
located in the Special Provisions Relating to All Regulatory Agencies section of the
General Appropriations Act Designation as a self-leveling agency would require the
Commission to set the gross receipts assessment at a rate sufficient to generate revenue in
the amount of the agencyrsquos general revenue appropriation each fiscal year which would require a statutory change to PURA sect16001(b) Based upon the Commissionrsquos baseline budget request authorizing the PUCrsquos self-leveling designation would result in an overall
estimated tax reduction of $456 million per year or 774
20 Government Code sect 571091 21 Occupations Code sect 162107 22 Occupations Code sect 258157 23 Occupations Code sect 301607 24 Occupations Code sect 1001601 25 Occupations Code sect 2001059 26 Tex Rev Civ Stat Ann Arts 581-28-1 amp 581-35 7 Tex Admin Code 1012
30 | P a g e
2017 SCOPE OF COMPETITION IN ELECTRIC MARKETS IN TEXAS REPORT
V APPENDICES
31 | P a g e
2017 SCOPE OF COMPETITION IN ELECTRIC MARKETS IN TEXAS REPORT
Appendix A ndash Acronyms
AEP American Electric Power
AMS Advanced Metering System
CenterPoint CenterPoint Energy Houston Electric LLC
DG Distributed Generation
DRG Distributed Renewable Generation
ERCOT Electric Reliability Council of Texas
ERSC Entergy Regional State
ERS Emergency Response Service
ETI Entergy Texas Inc
IMM ERCOT Independent Market Monitor
kWh Kilowatt-hour
LMP Locational Marginal Pricing
LSP Large Service Provider
MISO Midwest Independent System Operator
MMBtu One million British Thermal Unit (BTU)
MW Megawatt
MWh Megawatt-hour
Nodal Texas Nodal Market Design
ORDC Operating Reserve Demand Curve
PGC Power Generation Company
POLR Provider of Last Resort
PURA Public Utility Regulatory Act
REP Retail Electric Provider
RSC Regional State Committee
RTO Regional Transmission Organization
SCED Security Constrained Economic Dispatch
Sharyland Sharyland Utilities LP
SBF System Benefit Fund
SPP Southwest Power Pool
TDU Transmission and Distribution Utility
TNMP Texas-New Mexico Power Company
32 | P a g e
2017 SCOPE OF COMPETITION IN ELECTRIC MARKETS IN TEXAS REPORT
Appendix B ndash ERCOT Desalination Report
This page intentionally left blank
33 | P a g e
ERCOT Public
Study on the Demand Response Potential for Seawater Desalination Projects
ERCOT November 18 2016
Study on the Demand Response Potential for Seawater Desalination Projects ERCOT Public
Executive Summary
In 2015 the 84th Texas Legislature enacted House Bill (HB) 4097 which included several provisions relating to seawater desalination projects including a requirement that the Public Utility Commission of Texas (PUC) and Electric Reliability Council of Texas (ERCOT) study the potential for seawater desalination projects to participate in existing demand response opportunities in ERCOT There are several demand response products in which demand-side resources (ie consumers of electricity) can participate These programs help to preserve system reliability and provide economic benefits to participating demand-side resources Seawater desalination is an energy-intensive process that removes salt and other minerals from salt water to produce fresh water for municipal consumption industrial use or irrigation Participation in demand response could help mitigate electricity costs for future seawater desalination projects in Texas and provide reliability benefits to the grid
There are two main demand response reliability-based services administered by ERCOT participation by demand-side resources in the Ancillary Services market and the Emergency Response Service (ERS) Within the Ancillary Services market the most common service provided by demand-side resources is Responsive Reserve Service (RRS) which requires resources to respond either instantaneously or within 10 minutes in response to unplanned system emergencies ERS is separate from ERCOTrsquos Ancillary Services market and allows demand-side resources and distributed generation to provide reliability services in the event of an energy emergency Resources can qualify for either the 10-minute or 30-minute response time ERS programs
There are several key considerations that will impact a demand-side resourcersquos ability to participate in different demand response opportunities response time recovery time predictability of electrical demand and flexibility of operations Considering these factors together it appears that seawater desalination plants could be designed to meet the requirements for participation in demand response Because the ability to meet the qualification requirements is dependent on the plant design demand response opportunities should be considered early in a projectrsquos development if participation is desirable
Whether project developers will choose to address these requirements will depend on the economic benefits of participation There may be additional costs to design seawater desalination plants to operate in the manner required in order to participate in demand response These include costs associated with additional plant design specifications need for excess capacity and storage to make up for lost production during demand response deployment operational costs resulting from interruptions to plant processes and potential financial penalties if demand response deployment results in failure to meet contract demands The interplay of the benefits of participation and these costs will determine whether it would be beneficial for a future seawater desalination plant to participate in demand response in ERCOT
To date participation of seawater desalination plants in demand response programs has been limited Because the process of seawater desalination is energy-intensive participation in demand response could help to reduce electricity costs while posing a relatively low risk to plant operations As stakeholders in Texas continue to plan for possible future droughts in the region and identify water management strategies consideration of demand response could play a role in mitigating some costs associated with seawater desalination and allow seawater desalination plants to assist with maintaining electric reliability in the region
copy 2016 ERCOT All rights reserved i
Study on the Demand Response Potential for Seawater Desalination Projects ERCOT Public
Table of Contents
1 Introduction 1
2 Seawater Desalination 2
21 Seawater Desalination Plant Operations 2
22 Seawater Desalination Plant Economics 3
3 Demand Response Opportunities in ERCOT 4
31 ERCOT-Dispatched Demand Response 4
311 Ancillary Services Markets 5
312 Emergency Response Service (ERS) 5
32 Non-ERCOT-Dispatched Demand Response 6
321 Four Coincident Peak (4CP) 6
322 LSE or DR Provider Contracted Price Response 6
323 Self-Directed Price Response 6
4 Demand Response Potential for Seawater Desalination 7
41 Operational Considerations for ERCOT-Dispatched Demand Response 7
42 Economic Considerations for ERCOT-Dispatched Demand Response 8
43 Considerations for Non-ERCOT-Dispatched Demand Response 9
5 Conclusion 11
copy 2016 ERCOT All rights reserved ii
Study on the Demand Response Potential for Seawater Desalination Projects ERCOT Public
1 Introduction
In 2015 the 84th Texas Legislature enacted House Bill (HB) 4097 which included several provisions relating to seawater desalination projects including a requirement that the Public Utility Commission of Texas (PUC) and Electric Reliability Council of Texas (ERCOT) study the potential for seawater desalination projects to participate in existing demand response opportunities in ERCOT ERCOT and the PUC initiated this study to fulfill that requirement and evaluated the operational and economic characteristics of seawater desalination plants in light of ERCOTrsquos primary demand response products1
ERCOT is the independent system operator (ISO) for the ERCOT Interconnection which encompasses approximately 90 of demand for electricity in Texas ERCOT is the independent organization established by the Texas Legislature to be responsible for the reliable planning and operation of the electric grid for the ERCOT Interconnection ERCOT also administers and maintains a forward-looking open market to provide affordable and reliable electricity to consumers in Texas In collaboration with market participants ERCOT has developed demand response products and services for customers that have the ability to reduce or modify electricity use in response to instructions or signals These programs help preserve system reliability and provide economic benefits to participating demand-side resources
The process of seawater desalination removes salt and other minerals from salt water to produce fresh water for consumption industrial processes or irrigation The drought-prone Texas climate coupled with projections for increasing water demand in the state has created interest in seawater desalination as a future water source The 2017 Texas State Water Plan includes seawater desalination as a future water management strategy for water users in the state However the seawater desalination process is energy intensive and electricity consumption can be a significant cost driver for these projects To the extent that these plants could participate in demand response it would help to defray these costs Thus there is a potential nexus between seawater desalination projects built in Texas to mitigate drought but which have large electricity requirements and ERCOT demand response opportunities which could help to reduce their electricity costs and provide reliability benefits
This study evaluates the demand response potential of seawater desalination plants based on their operational characteristics and economic drivers The report is organized as follows
Section 2 provides background on typical seawater desalination plant operations and economics
Section 3 describes the current demand response opportunities in ERCOT
Section 4 evaluates the characteristics of seawater desalination plants to determine their potential to participate in demand response opportunities in ERCOT and
Section 5 provides a summary of the conclusions of this study
1 In the course of developing this report ERCOT consulted with several desalination experts with experience with existing or planned seawater desalination plants in the US The technical experts consulted included Jorge Arroyo (Water Management Consultant) Andrew Chastain-Howley (Black amp Veatch) Jonathan Loveland (Black amp Veatch) Ron Parker (Black amp Veatch) John Wolfhope (Freese and Nichols) and Srinivas Veerapaneni (Black amp Veatch)
copy 2016 ERCOT All rights reserved 1
Study on the Demand Response Potential for Seawater Desalination Projects ERCOT Public
2 Seawater Desalination
There are two primary methods for seawater desalination distillation (also referred to as ldquothermalrdquo) and reverse osmosis Distillation uses heat to remove salts and minerals from seawater by boiling water at high pressures In contrast reverse osmosis technology forces saline water through a membrane to separate water from the salts and minerals While both distillation and reverse osmosis are energy intensive distillation requires thermal energy to heat the water and overall has a higher energy requirement whereas reverse osmosis requires primarily electrical energy and overall is less energy intensive ndash though still with significant electricity requirements
Globally most thermal desalination plants are located in the Middle East due to low energy prices in the region Plants located elsewhere including in the US typically use reverse osmosis technology2 There are two large existing seawater desalination plants in the US one in Carlsbad California providing water to the San Diego area and one in Gibsonton Florida providing water to the Tampa Bay area Both plants use reverse osmosis technology In addition there are several desalination projects currently in the planning stages or under development in Texas in the Corpus Christi area that would use reverse osmosis technology For that reason this report focuses on reverse osmosis technology in the evaluation of demand response potential of seawater desalination plants
While there are currently no existing seawater desalination plants in Texas there are several municipal and industrial brackish water desalination plants in the state According to the Texas Water Development Board (TWDB) there are 46 municipal brackish water desalination plants with capacities greater than 0025 million gallons per day (MGD) in Texas representing a total of 123 MGD of capacity3 The desalination of brackish water is typically less expensive compared to seawater due to the lower relative salinity of brackish water This study focuses exclusively on seawater desalination consistent with the requirements of HB 4097 but it should be noted that conclusions may also apply to brackish water desalination though at a different cost and scale
This section provides high-level information on the operations (Section 21) and economics (Section 22) of seawater desalination plants to inform the discussion of their demand response potential in Section 4
21 Seawater Desalination Plant Operations Seawater desalination plants typically range in capacity from less than 5 MGD up to 165 MGD For example the Carlsbad seawater desalination plant has a capacity of approximately 50 MGD and the plant in Tampa Bay has a capacity of approximately 25 MGD The associated electricity consumption ranges between 10 and 15 kWh1000 gallons produced depending on the salinity of the water being processed456 More saline water (eg seawater) requires larger amounts of electricity for desalination Thus a seawater desalination plant would have larger electricity consumption requirements compared to a similarly sized brackish water desalination plant
2 American Water ldquoInnovation Solutions within the Water Industry Desalinationrdquo Available at httpwwwamwatercomfilesInnovationsSolutionsWithinTheWaterIndustryDesalinationpdf 3 Texas Water Development Board ldquoDesalination Factsrdquo Available at httpswwwtwdbtexasgovinnovativewaterdesalfactsasp 4 American Membrane Technology Association April 2016 ldquoMembrane Desalination Power Usage Put in Perspectiverdquo Available at httpwwwamtaorgcomwp-contentuploads7_MembraneDesalinationPowerUsagePutInPerspectivepdf 5 Water Reuse Association November 2011 ldquoSeawater Desalination Power Consumptionrdquo Available at httpswatereuseorgwpshycontentuploads201510Power_consumption_white_paperpdf 6 Ghaffour N TM Missimer and G Amy January 2013 ldquoTechnical review and evaluation of the economics of water desalination Current and future challenges for better water supply sustainabilityrdquo Desalination 309 pp197-207 Available at httpswwwresearchgatenetpublication256693140_Technical_review_and_evaluation_of_the_economics_of_water_desalination_ Current_and_future_challenges_for_better_water_supply_sustainability
copy 2016 ERCOT All rights reserved 2
Study on the Demand Response Potential for Seawater Desalination Projects ERCOT Public
While the two existing seawater desalination plants in the US were co-located with power plants to ease compliance with regulations on water intake and discharge structures and reduce costs many other reverse osmosis desalination plants receive their electricity from the grid However plants may have on-site backup generation in case of a power outage This will vary depending on the size and design of the plant and other factors For example the Carlsbad plant in California does have diesel backup generation to power control systems and flushing systems in the case of a power outage The plant in Tampa Bay was not built with backup power due to potential storm surge risks from hurricanes and other storms The plant does use uninterruptible power supply (UPS) backup to power control systems during power outages
Reverse osmosis plants are typically designed with several ldquotrainsrdquo which consists of a high-pressure pump turbine and reverse osmosis membrane Desalination plants are turned on or off one train at a time in a highly controlled process The process of ramping up or down an individual train under normal operations typically takes one to two hours While plants can be designed to handle immediate shutdowns (ie in a power outage) re-starting a system after an interruption would take this amount of time In addition the saline water must be pretreated (ie filtered) before going through the reverse osmosis train and this can sometimes pose constraints on the flexibility of operations
Demand for water is the key factor driving the level of production at seawater desalination plants Typically the plant will have a contract or contracts with municipal or other water users to deliver desalinated water and is operated to meet that demand Alternatively if the plant is municipally owned it would similarly be operated to meet the level of water demand in conjunction with other available water sources If water demands are close to a plantrsquos full capacity the operatorrsquos flexibility to adjust its electricity consumption as part of demand response may be limited However this does mean that plant operations are fairly predictable on a day-to-day basis which is necessary for participation in demand response
The amount of flexibility in plant operations will also be impacted by the amount of water storage available For example if a plant has sufficient water storage on-site or storage within the customerrsquos distribution system it could provide flexibility for the plant to reduce its operations during peak hours when electricity prices are likely to be highest It would also mitigate the impacts of interruptions to production from demand response deployments
22 Seawater Desalination Plant Economics Seawater desalination is typically more expensive than other sources of water and a major driver of the overall cost is energy costs In 2016 the Carlsbad plant charged rates at between $2131 and $2367 per acre-foot78 This charge is intended to cover both the fixed costs of the plant and the variable costs to produce a unit volume of water Typically half to two thirds of the cost of providing desalinated seawater are accounted for by capital cost recovery with the remainder accounted for by operations and maintenance costs including electricity costs Electricity costs can account for 20shy25 of the total costs of seawater desalination with reverse osmosis technology9
Factors affecting the capital cost of a seawater desalination plant include plant size type of desalination process and pre-post-treatment technologies plant infrastructure (eg piping water storage backup power) and compliance with applicable regulations (eg regulations on intake structures brine byproduct disposal) A significant driver of operating and maintenance costs is membrane replacement Reverse osmosis membranes need to be replaced every few years and
7 Source San Diego County Water Authority ldquoSeawater Desalinationrdquo Available at httpwwwsdcwaorgseawater-desalination 8 Note that 1 acre-foot is approximately 325851 gallons 9 Based on technical input from Black amp Veatch
copy 2016 ERCOT All rights reserved 3
Study on the Demand Response Potential for Seawater Desalination Projects ERCOT Public
the rate at which they are replaced will depend on the salinity of the feedwater and how the plant is operated Treatment and disposal of the salty brine byproduct from desalination may also incur operating costs
Electricity costs will vary depending on a range of factors including the size of the plant type of desalination technology source of electricity and quality of the feedwater As previously noted more saline water requires higher amounts of electricity in desalination and thus the amount of electricity consumption is a key difference between brackish water and seawater desalination As a result electricity costs comprise a significant share of the costs of seawater desalination These costs could potentially be defrayed in part by participation in demand response initiatives
3 Demand Response Opportunities in ERCOT
Broadly speaking demand response can be broken down into two major categories dispatchable or non-dispatchable For purposes of this report we will define dispatchable as those demand response events that are initiated by ERCOT and non-dispatchable as an event not specifically initiated by ERCOT These non-dispatchable events may include decisions made by the end-use customer to alter its consumption pattern or may include contractual obligations with another entity such as the end-use customerrsquos retail electric provider (ldquoREPrdquo) to alter consumption patterns
ERCOTrsquos wholesale market is open to several types of dispatchable demand response which are deployed to maintain system reliability Demand-side resources providing Emergency Response Service (ERS) may offer based on either a 10 or 30-minute response time commonly referred to as the ldquoramp periodrdquo Alternatively demand-side resources may register and qualify as a Load Resource that can provide Reserves in the Ancillary Services market The most common service provided by demand-side resources is Responsive Reserve Service which requires an under-frequency relay that can instantaneously interrupt the load during certain system reliability events Some demand-side resources can also participate in other Ancillary Services as Controllable Load Resources that require sophisticated control systems that allow them to be deployed in a more incremental proportional manner
Non-dispatchable demand response in ERCOT can include a response to avoid transmission costs where rates are based on Four Coincident Peak Pricing (4CP) response to wholesale energy prices initiated by the customer or by a REP or other load-serving entity (ldquoLSErdquo) or utility-managed Load Management programs (LM)
The sections that follow provide a description of both ERCOT-dispatched (Section 31) and nonshyERCOT-dispatched (Section 32) demand response For a more detailed description of opportunities for demand-side resources to participate in demand response in ERCOT see ERCOTrsquos guide Load Participation in the ERCOT Nodal Market10
31 ERCOT-Dispatched Demand Response There are two main demand response reliability-based services administered by ERCOT participation by demand-side resources in the Ancillary Services market and participation in ERS These services are dispatched by ERCOT during system emergencies
10 Available at httpwwwercotcomcontentservicesprogramsloadLoad20Participation20in20the20ERCOT20Nodal20Market_302d oc
copy 2016 ERCOT All rights reserved 4
Study on the Demand Response Potential for Seawater Desalination Projects ERCOT Public
Demand-side resources with demand response capability that can meet a set of performance requirements can be qualified to provide Ancillary Services as Load Resources in the Ancillary Services Market The value of having a Load Resource available to reduce load is equal to the value of having a generator available to increase its generation at a generating plant The providers of operating reserves selected to provide Ancillary Services are eligible for capacity payments regardless of whether the Resource is actually deployed (or curtailed in the case of the Load Resource)
ERCOT holds auctions on a daily basis for each of the following Ancillary Services Regulation Up Regulation Down Responsive Reserve and Non-Spinning Reserve11 Table 1 describes the various Load Resource types and their qualification requirements and eligible services
Table 1 Load Resource Types and Ancillary Services
Service Load Resource Type a Qualification Responsive Reserves (le50 of total Reserve requirement)
Non Controllable Under-Frequency Relay and 10-minute ramp to manual dispatch instruction
Responsive Reserves
Controllable Primary Frequency Response and follow 5-minute dispatch instructions
Regulation-Up Regulation-Down
Controllable Primary Frequency Response and respond to Regulation deployments
Non-Spin Reserves Controllable Follow 5-minute dispatch instructions a A Controllable Load Resource is a Load Resource capable of controllably reducing or increasing consumption under dispatch control by ERCOT
Demand-side resources that agree to reduce load when directed by ERCOT and that meet other metering and operational requirements as specified in the ERCOT Protocols may participate in Ancillary Services market auctions As noted in Table 1 the type of Ancillary Service that a Load Resource may provide will depend upon the demand-side resourcersquos response time and metering system as well as other requirements described in the Protocols In the Responsive Reserve and Non-Spin Reserve markets the Load Resource will receive capacity payments regardless of whether or not the load was actually deployed but the load must be available for deployment at any time while providing the service
ERCOT procures ERS to maintain grid reliability during emergency conditions and reduce the likelihood of the need for rotating outages ERS participants may offer to provide demand response with either a 10-minute ramp period requirement (similar to Load Resources providing Responsive Reserve Service) or a 30-minute ramp period requirement ERS Resources do not have the same telemetry and under-frequency relay requirements as Load Resources
11 Regulation Up and Regulation Down service respond to signals from ERCOT every 4 seconds to respond to changes in system frequency full response has to be provided within 5 minutes Responsive reserves must provide their committed capacity either instantaneously in an under-frequency event (eg due to a generator outage) or in energy scarcity conditions within ten minutes following an instruction from ERCOT Non-spinning reserves must provide their committed capacity within 30 minutes based on economic dispatch instructions Non-spinning reserve is used as replacement reserve to replenish other ancillary services and during energy scarcity
copy 2016 ERCOT All rights reserved 5
Study on the Demand Response Potential for Seawater Desalination Projects ERCOT Public
ERS is procured through a request for proposal (RFP) process three times per year for four-month contract terms each of which is further split into smaller time periods based on business cycles and other factors Demand-side resources may choose to submit offers in all time periods or only in those that best fit their unique circumstances and may vary both the price and demand response capacity offers by time period
Payments for ERS are performed up to 80 days after each four month contract term has ended and are subject to downward revision based upon delivered demand response capacity and the demand-side resourcersquos availability during the contract term
32 Non-ERCOT-Dispatched Demand Response The options listed below are not dispatched by ERCOT but they either are controlled directly by a customer or are dispatchable by another entity such as a demand response provider (ldquoDR Providerrdquo) REP or a transmission and distribution utility
Many industrial customers are subject to transmission charges based upon a Four Coincident Peak (4CP) demand The 4CP demand is determined by averaging the consumerrsquos actual demand during the 15-minute settlement interval with the highest ERCOT demand during each of the four summer months (June through September) This measured 4CP demand serves as the basis for the customerrsquos transmission tariff charges for the following year By correctly predicting the ERCOT system peaks during the summer and curtailing load during those intervals a consumer can help reduce the stress imposed on the electric system during peak periods of consumption and reduce its transmission charges for the following calendar year
In the competitive areas of ERCOT consumers can contract with their REP or a DR Provider to have their load respond to the REPrsquos or DR Providerrsquos instructions The contract will usually outline the parameters of this response ndash at what times and frequency demand response events can be called ramp periods sustained response periods compensation etc Because this response is a contractual matter between the REP or DR Provider and the consumer a great deal of variety can be present in these arrangements For example a consumerrsquos response may be voluntary or required compensation could come in the form of reduced energy prices or rebate payments for each curtailment event consumers might be notified up to a day in advance or could have no notification at all (for automated curtailment)
In areas of ERCOT not open to competition interruptible tariffs may be available These tariffs will usually offer a reduced energy price for defined curtailment obligations
REPs may offer dynamic pricing options or consumers within a municipality or cooperative may have their energy prices determined by a published tariff which also may be structured based upon Time-of-Use (TOU) or have a Critical Peak Pricing (CPP) or Peak Time Rebate (PTR) component Self-directed price response refers to consumers making an independent decision to respond to energy prices contained in a governing tariff or in either the ERCOT Day Ahead or Real Time energy markets
TOU offerings will typically have higher energy prices during normal peak periods ndash for example a TOU tariff may charge one price during Monday through Friday from 2 pm through 8 pm and another price during all other times Customers may choose to reduce consumption during these high priced periods Load reduction can be accomplished by load shifting (loads can be shifted by
copy 2016 ERCOT All rights reserved 6
Study on the Demand Response Potential for Seawater Desalination Projects ERCOT Public
rescheduling certain processes or by utilizing thermal storage) ending certain processes that are no longer economic or through energy efficiency measures
Offerings that incorporate CPP usually have prescribed high prices only during certain defined periods ndash for example when load or prices are expected to reach a certain level Response to CPP may be similar to those employed under TOU tariffs especially if CPP is reached frequently More often CPP is infrequent and as such short-term load curtailment may be the more appropriate response to meet economic objectives
4 Demand Response Potential for Seawater Desalination
This section evaluates whether the operational characteristics and economics of seawater desalination plants would enable them to participate in one or more of the various demand response opportunities in the ERCOT Region To date participation of seawater desalination plants in demand response programs has been limited Neither the plant in Carlsbad nor the plant in Tampa Bay participate in demand response programs in California or Florida respectively However as will be described below it appears that these plants can be designed and operated to meet the requirements for participation in demand response and receive economic benefit from participation in these programs
Section 41 describes the operational parameters that must be met for a demand-side resource to provide ERCOT-dispatched demand response and evaluates the ability of seawater desalination plants to meet these criteria Section 42 discusses the tradeoffs between payments for participation in ERCOT-dispatched demand response and potential additional costs posed to seawater desalination plants Finally Section 43 presents other opportunities for seawater desalination plants to reduce their electricity costs outside of ERCOTrsquos reliability-based services that are open to demand response assets
41 Operational Considerations for ERCOT-Dispatched Demand Response There are several key operational parameters that impact a demand-side resourcersquos ability to participate in different demand response services response time recovery time predictability of electrical demand and flexibility of operations This section discusses each of these considerations as they apply to seawater desalination plants
As discussed in Section 31 one of the differentiating factors between ERCOTrsquos demand response products is the amount of time within which a demand-side resource must respond to a deployment instruction to reduce electricity consumption during an event Participation in RRS requires an automatic response within either half a second (ie instantaneous) based on grid frequency or within 10 minutes via a manual instruction ERS requires a response time of either 10 or 30 minutes As noted in Section 21 the typical time to take a reverse osmosis train on- or off-line is 1-2 hours under normal controlled operations To comply with the response time requirements of RRS or ERS a seawater desalination plant would need to be able to reduce its electricity consumption far more quickly than in normal operations This is an element of plant design that would need to be accounted for in the specifications of the project Considerations include the potential need for on-site backup generation including uninterruptible power supply potential impacts to plant infrastructure (eg piping) reverse osmosis membranes and pretreatment systems
The two large US desalination plants provide illustrative counterpoints in this respect The Carlsbad plant was designed to withstand instantaneous power interruptions and has on-site backup generation including uninterruptible power supply to provide the ability to power control systems and flush the membranes in the event of a power loss In contrast the Tampa Bay plant was not
copy 2016 ERCOT All rights reserved 7
Study on the Demand Response Potential for Seawater Desalination Projects ERCOT Public
designed with on-site backup generation and a loss of power would result in a plant shutdown and may require several days to bring the plant back on-line Thus it appears that it is technically possible for a seawater desalination plant to meet the response time requirements for participation in demand response so long as this factor is considered in the design of the facility
The time it takes a desalination train to return to operations after an event is also a consideration Demand-side resources participating in RRS must be able to come back on-line within three hours and those participating in ERS must return within 10 hours Again it appears that it is technically feasible for desalination plants to meet this requirement so long as this requirement is considered in the plant design
An additional consideration is the predictability of a demand-side resourcersquos electricity consumption Participation in the responsive reserves ancillary service market requires bidding in the day-ahead market and thus a demand-side resource must know with great accuracy (within 95) its electrical demand at least a day ahead of time For ERS auctions are held three times a year for four-month contract periods Thus to participate in ERS a resource must know its forecasted electrical demand several months in advance Because seawater desalination plant operations are driven by contracted demand for water it is likely that a plant operator would have a good idea of the plantrsquos electrical demand days or even weeksmonths in advance especially for summer months when demand is likely to be relatively steady An important consideration however is the salinity of the water which drives the electrical requirements and which can be impacted by recent weather events Similarly reductions in demand for water during non-summer months or wet summer days where demand may be reduced could also impact a plantrsquos ability to predict its electricity demand
Finally a seawater desalination plant must have sufficient flexibility in its day-to-day operations so that it can afford to lose several hours of production when deployed for demand response It should be noted that demand-side resources participating in RRS and ERS are called infrequently demand-side resources providing responsive reserves were deployed one time in 2015 and ERS was not deployed that year However this is an important factor to consider if a plant is operating at close to full capacity and would incur financial penalties if it fails to meet its contract obligations due to a demand response event Including additional storage and building a plant with extra capacity could help to mitigate this risk It should also be noted that a plant operator does not need to commit the full plant capacity to these services but rather can specify an amount of MW that will be committed Thus a plant operator could mitigate issues both with predictability and flexibility of plant operations by committing only a portion of its predicted electrical demand to participate in demand response
Considering these factors together it appears that seawater desalination plants could be designed to meet the operational requirements for participation in ERCOTrsquos demand response services (both RRS and ERS) Because the ability to meet the requirements is dependent on the plant design demand response would need to be considered early in a projectrsquos development if participation is desirable Whether project developers will choose to address these requirements will depend on the economic benefits of participation in demand response which will be discussed in the next section
42 Economic Considerations for ERCOT-Dispatched Demand Response This section describes the economic benefits to demand-side resources from participation in ERCOT-dispatched demand response programs The average price paid for a demand-side resource participating in RRS in 2015 was $1087 per MW per hour and for ERS was $645 per MW per hour for the contract periods during the 2015 program year These payments could provide a significant financial benefit to seawater desalination plants To give a simplified example for a plant with an electrical demand of 10 MW operating at a 100 annual load factor (10 MW times 24 hours times 365 days) the annual benefit would be on the order of $500000 for ERS or $1 million for RRS
copy 2016 ERCOT All rights reserved 8
Study on the Demand Response Potential for Seawater Desalination Projects ERCOT Public
In 2015 demand-side resources providing responsive reserves were deployed one time for a duration of 10 minutes and ERS was not deployed12 The most ERS was ever deployed in a single year was two times in 2011 Thus participation in either program could result in a substantial payment to a seawater desalination plant with a relatively low risk of deployment and associated disruption of plant operations although it is important to note that participation in either ERCOT service subjects demand response resources to annual unannounced testing Other than testing the frequency of deployment will depend on grid conditions and is a risk that should be considered
The financial benefits of participation must be weighed against the costs of designing facilities with the capabilities to operate in this manner These include
bull The costs to design the plant to reduce electrical demand within the required timeframes for demand response and to withstand an instantaneous interruption if not already part of the plant design For example a plant may need to be designed to have backup power generation on-site In addition there could also be costs to restart the system after an interruption
bull The costs to build a plant with excess capacity andor storage to make up for lost production hours when demand response is deployed This will add to the total capital costs of the project Land area constraints should also be considered when considering additional storage as the space requirements for the necessary storage capacity could be significant
bull Costs associated with the impact of interruptions on plant processes (eg more frequent replacement of membranes impacts to pretreatment system or plant infrastructure)
bull Potential financial penalties that would be incurred if deployment as part of demand response were to result in failure to meet contract obligations to supply water
bull The loss of potential benefits in the form of cost avoidance from participation in non-ERCOTshydispatched demand response opportunities (see Section 43) If a plant is committed to RRS or ERS the plant operator would lose the flexibility to take advantage of these other opportunities to reduce their electricity costs
The interplay of these benefits and costs will determine whether it would be beneficial for a future seawater desalination plant to participate in demand response in ERCOT
43 Considerations for Non-ERCOT-Dispatched Demand Response Outside of the reliability-based services administered by ERCOT there are other opportunities for seawater desalination plants to reduce their electricity costs As described in Section 321 seawater desalination plants may be able to reduce the demand charges on their electricity bills through curtailing load during 4CP intervals In addition plant operators may adjust operations in response to real-time electricity prices to take advantage of lower off-peak prices and avoid price spikes (see Sections 322 and 323) All of these opportunities require that the plant have flexibility to reduce production during certain times of the day
In the ERCOT region as noted above a portion of transmission and distribution charges are set based on the peak systemwide 15-minute interval of the four summer months (June through September) referred to as the four coincident peaks (4CP) Large customers can reduce or avoid this charge by reducing electrical consumption during these four peak intervals AEP Central Texas and CenterPoint are the transmission providers covering the majority of the Gulf Coast in Texas13
12 ERCOT June 2016 ldquoLoad Resource Deployment Updaterdquo Available at httpwwwercotcomcontentwcmkey_documents_lists870985_RRS_Load_Resource_Deployment_Updatepdf 13 It is also possible that a seawater desalination plant could be located in an area that as not opted in to competition in which case the plant owner would need to negotiate its electricity charges bilaterally with the Non Opt-In Entity (NOIE)
copy 2016 ERCOT All rights reserved 9
Study on the Demand Response Potential for Seawater Desalination Projects ERCOT Public
Assuming a future seawater desalination plant would be connected at transmission-level voltages the relevant 4CP charges based on the 2016 tariffs accounting for both transmission charges and transmission cost recovery factors would be $41425 per 4CP kW for AEP Central Texas and $41870 per 4CP kVA for CenterPoint14 If a seawater desalination plant has 10 MW of load and is capable of interrupting all of it and successfully does so for all four 4CP intervals the savings based on the 2016 tariffs would be approximately $500000 per year ($41425 times 1000 (kW to MW) times 10 MW times 12 months) Thus a seawater desalination plant that reduces its electricity use during the 4CP intervals could avert some or all of these charges
Another opportunity for seawater desalination plants to reduce their electricity costs is through adjusting operations in response to real-time electricity prices In 2015 the average electricity price in ERCOT was $2677MWh However prices exceeded $50MWh in 254 hours (3 of all hours) $100MWh in 88 hours (1) $200MWh in 40 hours (05) and $300MWh in 21 hours (02) Prices exceeded $3000MWh for 021 hours15 Depending on the desalination plantrsquos exposure to real-time wholesale market prices (via its retail contract) the degree of high prices the plant owner is willing to avoid and grid conditions in a given year reducing unit operations in order to avoid high electricity prices could impact operators for anywhere between a few and several hundred hours out of the year In addition a plant can plan its operations to take advantage of lower electricity prices during off-peak periods (eg at night when generation from wind is high) For example at least one company is marketing a modular desalination unit design intended to take advantage of low prices during periods of high renewables generation and to provide grid reliability services through demand response16
There are several factors to consider regarding these opportunities to reduce electricity costs The plant would need to monitor the ERCOT market or hire a contractor to do so in order to know when to reduce demand for electricity These programs do not impose any requirements on response time as with RRS or ERS and there may be sufficient warning of 4CP intervals or peak pricing to allow the plant operator to plan its operations earlier in the day with sufficient time to ramp down production under controlled conditions However quicker ramping capability may be desirable to respond to electricity price fluctuations
For 4CP because the four intervals used to set demand charges are not known ahead of time it is likely that the plant would need to reduce its demand multiple times per summer to ensure the 4CP intervals are hit impacting production at the facility Timing operations to coincide with off-peak pricing or to avoid price spikes would similarly result in reduced operations during certain hours To offset the lost production hours the plant may need to be designed with extra capacity and water storage capability to maintain the ability to meet its contractual obligations for freshwater delivery Because the period of reduced operations is greater than with ERCOT-dispatched demand response services this need would be greater for a seawater desalination plant reducing load during 4CP intervals or in response to real-time electricity prices and would increase the capital costs of the project It should also be noted that high prices in the ERCOT Region typically but not always occur in summer months when drought conditions are more likely to develop and demand for desalinated water is likely to be highest This may limit the flexibility of the plant to time its electricity consumption to avoid high-priced hours
14 Public Utility Commission of Texas ldquoTransmission and Distribution Rates for Investor Owned Utilitiesrdquo Available at httpwwwpuctexasgovindustryelectricratestdraspx 15 Potomac Economics June 2016 2015 State of the Market Report for the ERCOT Wholesale Electricity Markets Available at httpswwwpotomaceconomicscomindexphpmarkets_monitoredERCOT 16 Sisyan LLC ldquoDemand Response Desalinationrdquo Available at httprenewabledesalinationcomwpshycontentuploads201506Demand-Response-Desalinationpdf
copy 2016 ERCOT All rights reserved 10
Study on the Demand Response Potential for Seawater Desalination Projects ERCOT Public
In addition the plantrsquos ability to participate in demand response would also be limited for those hours it is reducing load as part of 4CP response or in response to real-time prices because the plant would not be able to reduce its electricity consumption if that demand is already committed to another demand response service Thus participating in demand response versus taking advantage of these other opportunities may be to some extent mutually exclusive
5 Conclusion
Based on this analysis it appears that the operational characteristics of seawater desalination plants would allow them to participate in demand response opportunities in ERCOT so long as the necessary operational requirements are considered in the design specifications of the plant Project developers should consider the necessary requirements early in the plant design Whether the economic benefits of participation would provide a sufficient incentive for them to do so will depend on the costs of accommodating those operational requirements and whether there is the flexibility available to operate the plant as necessary under these programs Though most existing seawater desalination plants do not participate in demand response programs it does appear that participation by these plants is possible and could result in a financial benefit Table 2 compares the different demand response opportunities available to demand-side resources in ERCOT
Table 2 Comparison of Demand Response Opportunities Demand Response
Opportunity Requirements for
Participation Impacts to Plant
Operations Financial Benefit Ancillary Services ndash Responsive Reserve Service (RRS)
bull Under-Frequency Relay bull Instantaneous or 10 minute
response time bull Recover load within 3
hours bull Bid in day-ahead market
bull Deployed once in 2015 for 10 minutes bull Subject to annual
unannounced testing
bull $1087 per MW per hour (based on 2015 prices)
Emergency Response Service (ERS)
bull 10 or 30 minute response time bull Recover load within 10
hours bull Four-month contract term
bull Not deployed in 2015 the most times ever deployed in a single year was twice in 2011 bull Subject to annual
unannounced testing
bull $645 per MW per hour (based on 2015 prices)
Four Coincident bull Interval Data Recorder bull Likely plant will need to bull Avoid ~$48000 per 4CP Peak (4CP) (IDR) meter
bull Ability to predict system-wide peak demand hours during summer months
reduce load multiple times per summer to hit 4CP intervals bull Likely to be able to predict
possible 4CP intervals earlier in day
MW per year (based on 2016 tariffs) if successful in reducing during all four summer months
LSE or DR Provider Contracted Price Response
bull Varies based on contractual arrangements
bull Varies based on contractual arrangements
bull Varies based on contractual arrangements
Self-Directed Price bull Retail contract with bull Varies depending on bull Varies depending on Response exposure to real-time
market prices bull Ability to monitor real-time
prices in ERCOT wholesale market
number and severity of pricing events bull May be able to predict
peak pricing events earlier in day
number and severity of pricing events
copy 2016 ERCOT All rights reserved 11
Study on the Demand Response Potential for Seawater Desalination Projects ERCOT Public
Demand response programs in ERCOT provide opportunities for demand-side resources to defray their electricity costs and provide reliability benefits to the ERCOT electric grid Because the process of seawater desalination is energy intensive participation in demand response could help to reduce electricity costs while posing a relatively low risk to plant operations if demand response participation is factored into plant design
Participation in non-ERCOT-dispatched demand response opportunities such as reducing load during 4CP intervals or in response to real-time electricity prices may also help to reduce electricity costs for seawater desalination plants in Texas As stakeholders in Texas continue to plan for possible future droughts in the region and identify water management strategies consideration of demand response could play a role in mitigating some costs associated with seawater desalination and allow seawater desalination plants to assist with maintaining electric reliability in the region
copy 2016 ERCOT All rights reserved 12
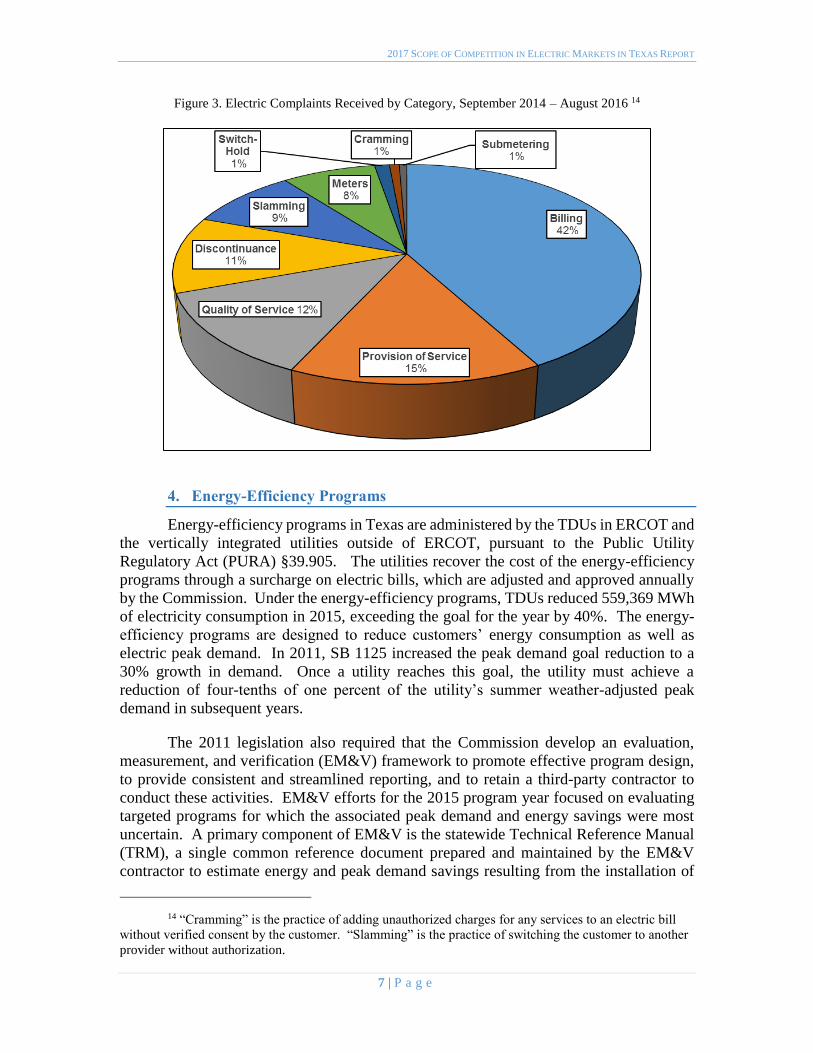
2017 SCOPE OF COMPETITION IN ELECTRIC MARKETS IN TEXAS REPORT
Figure 3 Electric Complaints Received by Category September 2014 ndash August 2016 14
4 Energy-Efficiency Programs
Energy-efficiency programs in Texas are administered by the TDUs in ERCOT and
the vertically integrated utilities outside of ERCOT pursuant to the Public Utility
Regulatory Act (PURA) sect39905 The utilities recover the cost of the energy-efficiency
programs through a surcharge on electric bills which are adjusted and approved annually
by the Commission Under the energy-efficiency programs TDUs reduced 559369 MWh
of electricity consumption in 2015 exceeding the goal for the year by 40 The energy-
efficiency programs are designed to reduce customersrsquo energy consumption as well as
electric peak demand In 2011 SB 1125 increased the peak demand goal reduction to a
30 growth in demand Once a utility reaches this goal the utility must achieve a
reduction of four-tenths of one percent of the utilityrsquos summer weather-adjusted peak
demand in subsequent years
The 2011 legislation also required that the Commission develop an evaluation
measurement and verification (EMampV) framework to promote effective program design
to provide consistent and streamlined reporting and to retain a third-party contractor to
conduct these activities EMampV efforts for the 2015 program year focused on evaluating
targeted programs for which the associated peak demand and energy savings were most
uncertain A primary component of EMampV is the statewide Technical Reference Manual
(TRM) a single common reference document prepared and maintained by the EMampV
contractor to estimate energy and peak demand savings resulting from the installation of
14 ldquoCrammingrdquo is the practice of adding unauthorized charges for any services to an electric bill without verified consent by the customer ldquoSlammingrdquo is the practice of switching the customer to another provider without authorization
7 | P a g e
2017 SCOPE OF COMPETITION IN ELECTRIC MARKETS IN TEXAS REPORT
energy efficiency measures sponsored by utility-administered programs in Texas In 2015
changes made to the TRM added and updated existing deemed savings values and added
standardized EMampV protocols for determining and verifying energy and demand savings
effective for the 2016 program year Verified demand and energy savings and program
costs for 2015 are shown in Table 4
Table 4 2015 Verified Energy Efficiency Savings15
MW MWh MW MWh
El Paso Electric 1231 22283 1116 19552 $4039278
Entergy Texas 1809 39688 1550 27156 $7023009
SPS 817 14537 549 9627 $3190744
SWEPCO 988 15262 560 9811 $3220359
Non-ERCOT Total 4844 91770 3775 66146 $17473390
AEP Central 4378 68482 1293 22653 $13261480
AEP North 454 12289 426 7464 $2727260
CenterPoint 16849 188255 5883 103069 $35832993
Oncor 11581 178908 6940 121589 $47438836
Sharyland 060 2528 100 1752 $633252
TNMP 866 17452 5770 10109 $4011627
ERCOT Total 34188 467915 15219 266636 $103905448
Grand Total 39033 559685 18994 332782 $121378838
Excludes Statewide EMampV contractor expenses of approximately $3M for review of prior program year
GoalProgram CostUtility
Verified Savings
In 2015 the utilities cumulatively achieved 206 of the demand reduction goal
(226 for utilities in ERCOT) and 168 of the energy reduction goal (175 for utilities
in ERCOT)
5 Customer Education Activities
The Commission engages with residential and small commercial electric customers
about retail electric competition through its ldquoTexas Electric Choicerdquo campaign and also informs customers about energy conservation opportunities through its ldquoPower to Save Texasrdquo campaign In addition to engaging with customers through these two campaigns
Commission staff also respond to customer inquiries and distribute literature about
electricity facts and issues
15 The non-ERCOT utilities within the state of Texas are El Paso Electric Company (ldquoEl Paso Electricrdquo) Entergy Texas Inc (ldquoEntergy Texasrdquo) Southwestern Public Service Company (ldquoSPSrdquo) and Southwestern Electric Power Company (ldquoSWEPCOrdquo)
8 | P a g e
2017 SCOPE OF COMPETITION IN ELECTRIC MARKETS IN TEXAS REPORT
a ldquoPower to Chooserdquo
The Commission educates customers about the evolving marketplace continuing
its ldquoTexas Electric Choicerdquo campaign which began in February 2001 with the goal of educating Texans about the changes and choices in the retail electric market The
PowerToChooseorg website and its Spanish-language counterpart PoderDeEscogerorg
provides a simple one-stop shop portal for Texans who live in a service territory open to
customer choice to enter in their zip code and browse through the numerous plans offered
by the REPs
b ldquoPower to Save Texasrdquo
In addition to the ldquoTexas Electric Choicerdquo campaign and the PowerToChoose website the Commission has also continued its statewide initiative ldquoPower to Save
Texasrdquo together with its parallel Spanish-language initiative ldquoPoder de Ahorrarrdquo which educates Texans about conserving energy during the summer peak times of 3 pm to 7
pm when the demand for electricity tends to be the highest The PowerToSaveTexasorg
website and its Spanish-language counterpart PoderDeAhorrarTexasorg provide Texans
with energy saving tips for homes and businesses
As part of the Power to Save Texas campaign the Commission contracted with
Resource Action Programs (RAP) to develop and implement a middle school energy
conservation outreach program in Hidalgo Harris Dallas and Tarrant counties In the
2015 ndash 2016 school year the program provided an effective energy education program
which strongly supports the Texas Essential Knowledge and Skills (TEKS) curriculum
standards as well as engages students through school challenges and at-home activities
c Campaign Outreach
PowerToChooseorg and its Spanish-language counterpart PoderDeEscogerorg
have proven valuable in educating customers about customer choice in the electricity
market The Commission conducted a number of activities to further promote the statersquos official electric choice website through social media community events trade shows and
expos From September 1 2015 through August 31 2016 nearly a million potential
customers visited the PowerToChooseorg and PoderDeEscogerorg websites Website
statistics are contained in Table 5
Table 5 Website Statistics September 2015 ndash August 2016
PowerToChoosecom Unique Visitors 980473
PoderDeEscogercom Unique Visitors 4652
d Low-IncomeElderly Outreach and Collaboration with Faith- and
Community-Based Organizations
Throughout 2015 and 2016 the Commissionrsquos staff also worked with legislative
offices and faith- and community-based organizations to provide educational materials and
training to help their constituents better understand the deregulated electric market and the
9 | P a g e
2017 SCOPE OF COMPETITION IN ELECTRIC MARKETS IN TEXAS REPORT
Commissionrsquos websites The Commission has actively participated with the Interagency
Coordinating Group (ICG) which was established by the Texas Legislature to expand and
improve relationships between state government and faith- and community-based
organizations Information on customer assistance programs such as LITE-UP Texas was
provided to community organizations such as Legal Aid of Northwest Texas senior
activity centers and religious groups
e Call Center
The Commission has trained its Customer Protection Division staff who are fluent
in both English and Spanish to answer customer calls and to assemble and mail
informational packets comparing electric plans when requested by customers without
Internet access From September 2015 to August 2016 the Customer Protection Division
staff handled 7663 calls from customers requesting assistance with shopping
f Educational Literature
In addition to the educational materials on the Commissionrsquos website the Commission provides brochures fact sheets and other educational materials by mail and
e-mail through a network of community organizations and events and in response to
customer requests to the call center Up-to-date fact sheets are available on the
Commissionrsquos website PowertoChooseorg and PoderDeEscogerorg as part of the
campaignrsquos outreach efforts The fact sheets provide information on a number of current
industry and consumer topics
Throughout 2015 and 2016 campaign educational materials promoting the
agencyrsquos programs including Power to Choose and Power to Save Texas were distributed
at numerous community events and civic town hall events such as Hurst-Euless-Bedford
ldquoBack 2 Schoolrdquo day Dickenson Housing Family Fair Energy Day DFW Family Fair
Earth Day Texas Texas Home and Garden shows in Houston Texas Black Expo National
Night Out events and minor league baseball games
Wholesale Market Development
The Commission engages regularly with ERCOT to oversee market developments
and ensure system supply reliability security and improved price formation and market
outcomes Market design changes made as a result of this working relationship have
created new opportunities for a variety of generation resources to enter the market and
supported the formation of wholesale prices that reflect real-time market conditions more
accurately and therefore improve the efficiency of the market
1 Wholesale Market Prices
Wholesale market prices have fallen in comparison to prices seen in the 2012 ndash 2014 period The ERCOT load-weighted real-time average price of energy in 2015 was
$2677 per Megawatt-hour (MWh) a 34 decrease from the average price in 2014 and a
decrease of 21 from the average seen in 2013
10 | P a g e
2017 SCOPE OF COMPETITION IN ELECTRIC MARKETS IN TEXAS REPORT
Falling wholesale prices are correlated with the current trend of lower natural gas
prices the primary fuel of many of the regionrsquos power plants The average Houston Ship Channel spot price for natural gas was 41 lower in 2015 than in 2014 decreasing from
$437MMBtu in 2014 to $258 in 2015 Through March the average price for 2016 has
fallen to $192MMBtu Natural gas price trends from September 2014 through August
2016 are shown in Figure 4
Figure 4 Monthly Average Natural Gas Prices September 2014 ndash August 2016
Monthly average wholesale electricity prices are shown in Figure 5 Load-
weighted prices are calculated by dividing the price at a load zone by the associated
demand This metric provides a useful proxy for the actual wholesale prices paid by load16
16 It is worth noting that most power in ERCOT is sold through various bilateral arrangements that
are designed to hedge daily real-time market price risk
11 | P a g e
2017 SCOPE OF COMPETITION IN ELECTRIC MARKETS IN TEXAS REPORT
Figure 5 Load-Weighted Average Real-Time Monthly Settlement Point Prices September 2014 ndash August 2016
Another component of the real-time price of electricity is the cost of transmission
congestion Transmission congestion occurs when there is insufficient transmission
capacity to dispatch energy in a least-cost fashion The recent build-out of additional
transmission lines in areas of high congestion has partially relieved the cost burden in these
areas particularly in West Texas where oil and gas production growth rapidly increased
the demand for electricity resulting in relatively higher zonal prices
2 Peak Demand
After the very high peak demand levels during the hot summer of 2011 peak
demand in ERCOT was lower in 2012 through 2014 In 2015 peak demand again
increased though not to 2011 levels with load exceeding 60000 MW for 330 hours and
exceeding 65000 MW for 91 hours as shown in Figure 6 below In 2016 ERCOT
experienced a record week in August which saw the previous record peak demand broken
six times and the ERCOT region hit its all-time peak demand of 71093 MW on August
11 2016
As peak demand has increased the recorded availability of generation supply in the
region during times of high load has decreased slightly Physical Responsive Capability
(PRC) analogous to the amount of reserves available on the system at any given time fell
below 3000 MW for 269 hours in 2015 up slightly from 213 hours in 2014 and 215
hours in 2013 but well below the 371 hours recorded during the 2011 summer
12 | P a g e
2017 SCOPE OF COMPETITION IN ELECTRIC MARKETS IN TEXAS REPORT
Figure 6 High Load Hours in ERCOT 2011 ndash 2016
As shown in Table 6 the ERCOT system peak demand was 69877 MW in 2015
up 5 from the 2014 peak and the 2016 ERCOT system peak demand increased 174
from the peak demand of the previous year
Table 6 ERCOT Peak Demand 2012 ndash 2016
Year
ERCOT Peak
Demand (MW)
Percentage Change
from Prior Year
2012 66548 ndash 2013 67245 105
2014 66454 ndash118
2015 69877 515
2016 71093 174
Figure 7 shows the hourly peak load for each month in ERCOT from January 2014 to
August 2016
13 | P a g e
2017 SCOPE OF COMPETITION IN ELECTRIC MARKETS IN TEXAS REPORT
Figure 7 Monthly Peak Demand in ERCOT January 2014 ndash August 2016
3 Generation Diversity
As electricity consumption has increased in ERCOT the diversity of the systemrsquos generation portfolio has also increased Generators participating in the statersquos renewable energy credit (REC) trading program reported an 11 increase in renewable generation
from 2013 to 2015 rising from 376 million MWh to 469 million MWh with wind
representing 96 of the total renewable mix Landfill gas was the second most prevalent
renewable source representing approximately 12 of all renewable generation in 2015
Energy produced from wind generation was up by 13 in 2015 from 2013 and solar
energy capacity more than doubled from 121 MW in 2013 to 288 MW in 2015 Coal-fired
generation has been steadily shrinking as a proportion of total generation declining from
37 of electricity produced in 2014 to 28 in 2015 Energy use in the ERCOT region by
fuel type for 2015 is shown in Figure 8
14 | P a g e
2017 SCOPE OF COMPETITION IN ELECTRIC MARKETS IN TEXAS REPORT
Figure 8 Energy Use in ERCOT by Resource Type 2015
The Commissionrsquos projects are further described in the following section of this report
15 | P a g e
2017 SCOPE OF COMPETITION IN ELECTRIC MARKETS IN TEXAS REPORT
III SUMMARY OF COMMISSION ACTIVITIES FROM 2015 TO 2016
Introduction
The Commission develops and modifies rules policies and procedures for the
competitive electric market in Texas in response to the technological advances in the
industry and the evolving needs of customers The Commission also continues to carry
out oversight of programs with which the Legislature has tasked it ndash such as energy
efficiency renewable energy and advanced metering infrastructure Within the
ERCOT region the monopoly wires-and-poles companies that provide transmission
and distribution services throughout the grid remain subject to traditional rate
regulation by the Commission The Commission continues to set rates for these
utilities as they are not subject to the forces of market competition This section
provides an overview of the Commissionrsquos activities in its oversight of the wholesale and retail electric markets as well as its governance over regulated electric utilities
Resource Adequacy
Resource adequacy is the long-term ability of the system to serve demand reliably
when consumption is highest given the available installed capacity load resources and
the operational reliability of the system Assessing resource adequacy requires comparing
the systemrsquos forecast installed capacity and load resources against the forecast peak
summer load The difference between the forecast of available generation and load
resources and the forecasted demand for electricity is referred to as an ldquoinstalled capacity
reserve marginrdquo which is an indicator of the ability of the system to meet customer demand
during peak conditions In addition to evaluating the forecast reserve margin assessing
resource adequacy includes evaluating the systemrsquos operational reliability The systemrsquos operational reliability depends on the ability of generators to manage plant operations
successfully as well as the grid operatorrsquos ability to manage the system to avoid or to mitigate load curtailment During 2015 and 2016 the ERCOT system performed well with
respect to resource adequacy The Commission has devoted significant attention to
ensuring that ERCOT maintains an adequate installed capacity reserve margin and a high
level of operational reliability developing a wholesale market design that allows
consumers to continue to receive low-cost and reliable electricity over the long term
1 Capacity Demand and Reserves Report
The Capacity Demand and Reserves (CDR) Report published by ERCOT semi-
annually is a snapshot estimate of long-term supply and demand and the associated annual
reserve margin for peak summer and winter conditions While the CDR Report is not a
forecast of any particular outcome it provides insight into possible resource adequacy
trends
16 | P a g e
2017 SCOPE OF COMPETITION IN ELECTRIC MARKETS IN TEXAS REPORT
The May 2016 CDR Report shows estimated reserve margins well above the
current target reserve margin of 1375 Installed capacity reserve margin estimates taken
from this CDR Report are shown below in Table 7
Table 7 May 2016 Capacity Demand and Reserves Report Forecast
Forecast 2017 2018 2019 2020 2021 2022 2023 2024 2025 2026
Peak Load
(MW)
68548 69409 70795 71420 72098 72792 73482 74168 74864 75704
Total
Capacity
(MW)
80995 87019 87238 87407 87678 87738 87738 87728 87728 87728
Reserve
Margin
182 254 232 224 216 205 194 183 172 159
2 Operating Reserve Demand Curve
In ERCOT the price signals produced by the energy-only wholesale electric market
should provide incentives to promote short-term reliability as well as induce optimal long-
run investment in new resources If the prices are efficient and reflect the full cost of
dispatching resources to meet demand the benefits that accrue to both consumers and
producers can be maximized at the least cost and new generating capacity (or load
resources) should develop to maintain the equilibrium as old resources retire or demand
increases
The Operating Reserve Demand Curve (ORDC) implemented at the Commissionrsquos direction in June 2014 improves price formation by allowing prices to more fully reflect
the value of operating reserves The ORDC assigns an economic value to operating
reserves or the amount of extra capacity available to maintain system reliability on a daily
basis
As part of its ongoing review of resource adequacy in ERCOT the Commission is
currently evaluating the accuracy of the inputs to the ORDC to ensure that its contribution
to price formation appropriately reflects the costs of meeting demand and the underlying
needs of the system
3 Transmission Congestion
Although competitive power producers and regulated transmission providers form
two distinct segments of the market transmission buildout has a direct effect on wholesale
power prices When there is insufficient transmission capacity to dispatch energy in a least-
cost fashion the system operator takes action to ensure that the physical limits of the
transmission system facilities are not violated The re-dispatch of generation because of
transmission limits results in disparate prices at different locations on the system In
comparison to prior years transmission congestion in ERCOT has lessened because of the
large increase in transmission investment and the reduction of high demand related to oil
and gas production in West Texas ERCOT and the Commission continually evaluate the
need for cost-effective additional transmission investment to manage congestion
17 | P a g e
2017 SCOPE OF COMPETITION IN ELECTRIC MARKETS IN TEXAS REPORT
4 Wholesale Market Design Initiatives
While the ERCOT wholesale market has been successful in attracting new resource
investment and also maintaining competitive prices for consumers certain improvements
to the market design could yield additional benefits in terms of efficient price formation
and opportunities for entry of new technology Initiatives already in place in many other
regions such as real-time co-optimization and multi-interval real-time resource dispatch
may allow existing capacity to be used more effectively and create opportunities for the
integration of additional load resources to serve electric demand The Commission
continues to work with ERCOT and interested stakeholders to determine the value of
implementing such enhancements particularly as ERCOTrsquos resource mix changes over time
5 Reliability Standard
In early 2014 the Commission opened a project to review its use of a target installed
capacity reserve margin based on a reliability standard equivalent to one loss-of-load event
every ten years In this project the Commission received written comment from interested
parties conducted a public workshop consulted with independent experts and reviewed
the application of reliability standards in other regions As a result of this review future
reliability metrics to be estimated in ERCOT will include the market equilibrium reserve
margin the economically-optimal reserve margin and the associated levels of expected
unserved energy The Commission believes that publishing these metrics represents an
improvement over reporting a one-event-in-ten-years standard by enhancing insight into
expected outcomes in ERCOTrsquos energy-only market
Non-ERCOT Utilities Market Development Activities
SB 7 the law that introduced retail competition to the Texas market in 1999
granted the Commission authority to delay retail competition in an area where deregulation
would not result in fair competition and reliable service because of the lack of an
independent organization to coordinate the electric system and the concentration of
ownership in the generation sector in some of those areas Consequently SB 7 included
provisions recognizing the difficulty of implementing retail competition in areas outside of
ERCOT Therefore the utilities outside of the ERCOT region remain vertically integrated
owning generation transmission and distribution assets as well as selling power to end-
use customers These vertically integrated utilities remain subject to traditional regulation
including rates set by the Commission and customer choice is not offered in the service
territories of these utilities
The Commission does continue to monitor ongoing activities in the non-ERCOT
portions of the state In 2015 the Legislature granted the Commission the authority to
retain counsel and consulting experts in order to participate in legal proceedings at the
Federal Energy Regulatory Commission (FERC) which has regulatory jurisdiction over
wholesale power sales and transmission rates outside of ERCOT This authority has
18 | P a g e
2017 SCOPE OF COMPETITION IN ELECTRIC MARKETS IN TEXAS REPORT
permitted the Commission to participate more effectively in FERC proceedings affecting
Texasrsquo utilities located outside of ERCOT
1 Southwest Power Pool
The Southwest Power Pool (SPP) is the Regional Transmission Operator (RTO) for
areas of Northeast Texas and the Texas Panhandle In Texas the utilities Southwestern
Electric Power Company (SWEPCO) Southwestern Public Service (SPS) and several
electric cooperatives and municipally owned utilities are in SPP In addition to these areas
of Texas the SPP footprint includes parts of New Mexico Arkansas Missouri Nebraska
Louisiana and all of Kansas and Oklahoma In 2015 SPP became the RTO for the
Integrated System and neighboring areas which includes parts of Iowa Minnesota North
Dakota South Dakota Wyoming and Montana SPP has spent extensive time and
resources over the last two years to integrate these new areas successfully The expansion
added 5000 MW of peak demand 7600 MW of generating capacity and 9500 miles of
transmission lines17
In 2014 SPP launched its new Integrated Marketplace which provides a Day-
Ahead Market a Real-Time Balancing Market and Congestion Hedging Markets
mechanisms similar to those available in ERCOT The implementation of the Integrated
Marketplace resulted in a savings of $422 million in 2015 As a result of the Integrated
Marketplace SPPrsquos planning reserve margin will be reduced from 136 to 12 a change
expected to save about $90 million annually
Chairman Donna L Nelson represents the Commission as a voting member on
SPPrsquos Regional State Committee (RSC) The RSC provides collective state regulatory
agency input on a variety of issues In addition the RSC has authority over the cost
allocation methodologies for transmission upgrades allocation of Financial Transmission
Rights and the approach used for resource adequacy across the SPP region The RSC
regularly meets on a quarterly basis and meets more frequently if necessary
2 Midcontinent Independent System Operator
The Midcontinent Independent System Operator (MISO) is an RTO that serves all
or part of 15 states in the central US one Canadian province and the portion of eastern
Texas served by the vertically integrated utility Entergy Texas Inc MISO provides a Day
Two market which has a variety of functions and services including energy and ancillary
service markets economic dispatch congestion management financial transmission rights
and transmission planning The MISO Independent Market Monitor concluded that the
MISO wholesale markets were competitive in 2015
Like SPP MISO is in the Eastern Interconnection which crosses state boundaries
and is therefore subject to FERC jurisdiction A number of recent FERC proceedings have
17 2015 Southwest Power Pool Annual Report Available at
httpswwwspporgdocuments37800201520southwest20power20pool20annual20reportpdf
19 | P a g e
2017 SCOPE OF COMPETITION IN ELECTRIC MARKETS IN TEXAS REPORT
affected the portion of Texas that is in the MISO footprint The Commission through
outside counsel has been an active party in such FERC proceedings FERC Docket No
ER14-1174 addressed in part a dispute regarding the availability of transmission capacity
under the Joint Operating Agreement between MISO and the SPP Ultimately FERC
approved a settlement agreement under which MISO will compensate SPP and its members
for using their or other entitiesrsquo transmission systems
In a related pending docket at FERC Docket No ER14-1736 parties are addressing
how the cost of these payments will be allocated among MISO market participants Parties
in this proceeding are engaged in settlement discussions In addition in Docket No ER14-
75-000 FERC approved a settlement agreement among the participating Entergy
Operating Companies and their retail regulators to terminate the Entergy System
Agreement effective August 31 2016 The settlement terms prohibit any post-termination
payments that roughly equalize production costs among the operating companies after
December 31 2015 terminate certain specific cross-purchase power agreements between
Entergy Texas and former Entergy Gulf State Louisiana and permit the continuation of
several other purchase power agreements
Commissioner Kenneth W Anderson Jr represents the Commission as a voting
member in the Organization of MISO States (OMS) the purpose of which is to coordinate
regulatory oversight among the states in the MISO region and to make recommendations
to MISO FERC and other entities Commissioner Anderson also represents the
Commission as a voting member of the Entergy Regional State Committee (ERSC) which
has certain FERC-approved authority for five years after the Entergy integration with
regard to cost allocation for Entergy transmission projects and adding transmission projects
to the Entergy construction plan The ERSC meets quarterly
3 Western Electricity Coordinating Council
The Western Electricity Coordinating Council (WECC) is a Regional Entity whose
region includes the area surrounding El Paso and extends from Canada to Mexico
including the provinces of Alberta and British Columbia the northern portion of Baja
California and all or portions of the 14 Western states in between WECC is the Regional
Entity responsible for Bulk Electric System reliability in the Western Interconnection and
associated compliance monitoring and enforcement WECC does not have organized
markets outside of California but is organized into 38 separate balancing authorities
WECC is geographically the largest and most diverse of the eight Regional Entities in the
United States with delegated authority from the North American Electric Reliability
Corporation (NERC) and the Federal Energy Regulatory Commission In Texas El Paso
Electric Company is a member of WECC
Rulemaking Activities
The Commission has continued to adopt new rules and modify existing rules in
order to further the continued successful operation of the competitive retail and wholesale
markets and to comply with statutory changes made to PURA by the Legislature This
20 | P a g e
2017 SCOPE OF COMPETITION IN ELECTRIC MARKETS IN TEXAS REPORT
section of the Report provides a high-level overview of the Commissionrsquos key rulemaking
activities highlighting the market improvements made in 2015 and 2016
1 Cost Recovery and Rate Adjustment
The Commission adopted new rule 16 TAC sect25246 on June 29 2016 to
implement Section Nos 1 through 3 of House Bill 1535 of the 84th Legislature The new
rule only applies to a utility that operates solely outside of ERCOT and allows for the use
of an update period beyond the test year for which the utility initially files estimated
information The rule clarifies that all information originally estimated must be updated
with actual information and also provides requirements for a post-test-year adjustment for
a natural gas-fired plant A non-ERCOT utility also is required to initiate a new base rate
case on or before the four year anniversary of the final order in the utilityrsquos most recent comprehensive base rate case or if the commission determines that the utility has
materially earned more than its authorized rate of return in two consecutive years The rule
also provides requirements and procedures for the relation back of final rates to an effective
date 155 days after the filing of the rate application
2 Changes to Certificates of Convenience and Necessity and CREZ Rule
The Commission conducted a rulemaking to implement changes pursuant to
Legislative mandates in SB 776 SB 933 and HB 1535 of the 84th Legislature SB 776
required municipally owned utilities to apply for a certificate of convenience and necessity
(CCN) before constructing transmission facilities outside the boundaries of the
municipality that owns the municipally owned utility SB 933 also requires persons to
obtain a CCN before interconnecting a tie line into the ERCOT grid HB 1535 requires the
Commission to issue a final order within 181 days for a non-ERCOT utility requesting a
CCN for an existing electric generating facility and 366 days after a non-ERCOT utility
files a CCN for a newly constructed generating facility In addition the Commission also
determined in this rulemaking that all future transmission projects in a Competitive
Renewable Energy Zone (CREZ) must meet the need criteria of PURA sectsect 37056(c)(1)
and (2) rather than being exempt Finally the Commission determined that the CREZ
project established in 2008 was complete following the installation of a second circuit on
a Sharyland line
3 Use of Handheld Device for Enrollment
As the market evolves the Commission evaluates market changes balancing its
desire to encourage customer-focused innovation with its concern for customer protection
against potential abuses In Docket No 44518 the Commission granted a REP a
temporary 12-month waiver from its rules requiring the marketer to obtain telephonic
verification of the customerrsquos desire to switch REPs as well as a waiver from certain authorization disclosure requirements among other stipulations the Commission placed
upon the REP The Commission then opened Project No 45625 to study the issue of REPs
utilizing hand-held devices for customer enrollment more broadly and engage with market
representatives consumer representatives and other stakeholders The Commission
anticipates considering an amendment to its rules in the spring of 2017
21 | P a g e
2017 SCOPE OF COMPETITION IN ELECTRIC MARKETS IN TEXAS REPORT
4 Smart Meter Texas Portal
The electric utilities in Texas that have advanced metering systems (AMS) jointly
own and operate a single web portal known as Smart Meter Texas (SMT)18 SMT fulfills
two requirements imposed by the Commissionrsquos advanced metering rule on a utility with
AMS (1) provide to the retail customer the REP serving the customer and other entities
authorized by the customer access to such retail customerrsquos consumption data and (2)
allow devices at the customerrsquos premises to communicate through a home area network with the advanced meter at the premises SMT also facilitates near real-time on-demand
reads of a customerrsquos meter that aids prepaid service offered by certain REPs
In Project No 42786 Review of Advanced Metering System Web Portal
Commission staff and stakeholders examined options for the long-term operational
structure governance and funding of SMT The Commission determined that ownership
of SMT should remain with the TDUs because they can operate the portal at a lower cost
than transferring the data repository to ERCOT The Commission opened two
rulemakings one to ascertain the appropriate governance performance and funding of
SMT and a second to determine the appropriate access for third parties ensuring that
customers have the freedom to grant and give third parties access to their data if made
knowingly while also securing customer privacy
Sharyland Utilities
In early 2015 customers of Sharyland Utilities the smallest investor-owned
transmission and distribution utility in ERCOT began to file with the Commission a
significant number of complaints regarding high electricity bills In response the
Commission opened Project No 44592 Relating to a Project Regarding Sharyland
Utilities to provide for a more formal process for Commission review of the large number
of complaints As part of this project Commission staff prepared a report to evaluate the
electricity rates and electric bills in the operating area of Sharyland Utilities that was
previously part of Cap Rock Energy
Staffrsquos report found that a number of factors contributed to the comparatively high
bills for many of Sharyland-Cap Rockrsquos customers First Sharylandrsquos small size and its low customer density result in high TDU rates for all customers relative to other TDUs In
particular Staffrsquos report found that Sharyland-Cap Rockrsquos rates for distribution service are
up to three times higher than those of other TDUs in Texas In addition to Sharyland-Cap
Rockrsquos high costs for distribution service higher wholesale transmission costs also
contributed to the rate increases charged to Sharyland-Cap Rockrsquos customers These transmission costs are the result of increased transmission investment in recent years
throughout Texas that has increased transmission costs for all distribution providers
18 The participating Texas TDUs are AEP Texas Central Company and AEP Texas North Company (jointly
ldquoAEPrdquo) CenterPoint Energy Houston Electric LLC (ldquoCenterPointrdquo) Oncor Electric Delivery Company LLC (ldquoOncorrdquo) and Texas-New Mexico Power Company (TNMP) collectively referred to as the ldquoJoint TDUsrdquo Operation of an AMS web portal was addressed in the orders approving particular utilitiesrsquo deployment of AMS and approving surcharges for AMS cost recovery While Sharyland Utilities filed comments in the proceeding it did not
participate as it had not fully completed its AMS deployment at the time
22 | P a g e
2017 SCOPE OF COMPETITION IN ELECTRIC MARKETS IN TEXAS REPORT
including Sharyland Utilities Second the comparatively colder winter of 2014 ndash 2015
which was the time period generally consistent with the timeframe in which the
Commission began receiving complaints appeared to result in higher electricity usage than
normal This combination of high TDU rates and the higher electricity usage led to higher
bills for customers
Staffrsquos report also noted that in Sharyland-Cap Rockrsquos last rate case in 2014 the
approved rates reflected movement towards more cost-based rates for all customers
including some customers that previously had been heavily subsidized by other customers
Additionally in the process of standardizing Sharyland-Cap Rockrsquos customer classification
with the classifications of the other TDUs in Texas some customers may have experienced
a move from one class that previously was paying below-cost rates to another class that
was now paying above-cost rates For some of these customers the combined effects of
the movement towards cost-based rates and the change to a different class may have
contributed to a significant change in the customersrsquo rates Regardless of any cost-shifting
between customer classes Sharylandrsquos rates remain two to three times higher than those of other TDUs in Texas for all customers in all classes
On December 4 2015 the Commission signed an order directing Sharyland to file
an application for a comprehensive rate review by April 30 2016 Sharyland filed its rate
application on April 29 2016 in Docket No 45414 Review of the Rates of Sharyland
Utilities LP On October 10 2016 the Commission ordered Sharyland to file an amended
application as soon as practicable but no later than January 1 2017 to reflect the unique
aspects of the companyrsquos organizational structure as a real estate investment trust (REIT) At the time of publication Sharyland is expected to file its amended application in
December 2016
PowerToChoose Website
As part of its ongoing evaluation of the competitive market the Commission
opened Project No 45730 to evaluate the functionality and usability of its PowerToChoose
website which allows customers to select a REP and an electric plan based on their zip
code In the process the Commission received significant feedback from customers stating
that the Commissionrsquos PowerToChoose website was an important tool that plays a
fundamental role in their shopping process In response to the feedback received from
industry representatives and consumers Commission staff changed how the website sorts
and filters retail electric plans adding a filter to allow customers to unselect plans that
contain minimum usage fees or credits This filter is now a default setting and plans with
minimum usage fees and credits are not shown unless the customer actively selects to
search for such plans In addition Commission staff made other changes to increase the
clarity of the REP complaint rating The Commission continues to evaluate other changes
to improve the customer experience of the PowerToChoose website and provide
transparency for retail electric plans
23 | P a g e
2017 SCOPE OF COMPETITION IN ELECTRIC MARKETS IN TEXAS REPORT
Report on Alternative Ratemaking Mechanisms
In 2015 the Legislature enacted SB 774 which requires the Commission or its
consultant to conduct a study and make a report to the Legislature analyzing the alternative
ratemaking mechanisms adopted by other states In addition SB 774 extended the
authorization for the Periodic Rate Adjustment (PRA) mechanism from 2017 to 2019
which the Legislature had authorized in 2011 (SB 1693) as a version of an alternative
ratemaking mechanism that provides to utilities a means for expedited recovery of
distribution infrastructure costs Pursuant to SB 774 the Commission retained a consultant
to produce the report and the consultantrsquos recommendations included streamlining the ratemaking process to reduce procedural costs providing for a periodic review of the
prudency of the costs and using certain types of alternative ratemaking mechanisms that
decouple the recovery of costs from variations in load The Commission held a public
hearing to receive comments on the report from stakeholders and after consideration of
those comments has provided to the Legislature the consultantrsquos report together with its
own discussion of the report
Request for Purchase of Oncor Electric Delivery Company
In March 2016 the Commission approved with conditions an application by an
investor group led by Hunt Consolidated Inc the owners of Sharyland Utilities to acquire
control of Oncor Electric Delivery Company (Oncor) the largest transmission and
distribution utility in Texas from Oncorrsquos parent company Energy Future Holdings which
is in bankruptcy The Commission approved the request subject to certain conditions
including stipulations regarding the organization of the new entities and treatment of tax
benefits The investor-led group subsequently declined to pursue the transaction that was
approved by the Commission
In September 2016 NextEra Energy which owns Florida Power amp Light received
approval from the United States Bankruptcy Court in Delaware for its plan to purchase
Oncor In October 2016 NextEra Energy filed an application with the Commission in
Docket No 46238 for approval of the proposed transaction The Commission will evaluate
the application to determine if the transaction is in the public interest
Integration of Lubbock Power and Light
In March 2016 the Commission opened Project No 45633 to study and identify
the issues related to the request of Lubbock Power and Light the statersquos third-largest
municipally owned utility to be integrated into ERCOT The Commission is currently
working with stakeholders ERCOT and SPP to determine the cost and benefits of any
potential switch by Lubbock Power and Light into ERCOT and whether such a switch is
in the public interest
24 | P a g e
2017 SCOPE OF COMPETITION IN ELECTRIC MARKETS IN TEXAS REPORT
Desalination Project ERCOT Studies
In 2015 the Legislature passed HB 4097 which directed the Commission and
ERCOT to study whether existing transmission and distribution planning processes are
sufficient to provide adequate infrastructure for seawater desalination projects and to study
the potential for desalination projects to participate in demand response opportunities in
the ERCOT market Pursuant to that direction ERCOT staff have prepared a report on the
feasibility of interconnection of large desalination projects and on opportunities for such
projects to participate in ERCOTrsquos demand response programs which is attached to this Report in Appendix B
Oversight and Enforcement Actions
The Commissionrsquos enforcement of statutes rules and orders applicable to entities
under its jurisdiction serves to protect consumers the electric markets the reliability of the
electric grid and to promote fair competition The Commissionrsquos enforcement efforts in the electric industry focus on violations of PURA the Commissionrsquos rules and ERCOT
protocols
During the period from January 2015 through August 31 2016 the Commission
assessed $3258500 in penalties against electric market participants Table 8 provides a
summary of electric industry Notices of Violation since January 2015 During 2015 and
2016 Commission staff opened 212 investigations for the electric industry and closed 177
investigations
Table 8 Notices of Violations
Violation Type Total Penalty Amount
Retail Market Violations $539000
Service Quality Violations $451500
Wholesale Market Violations $2268000
TOTAL $3258500
In addition to the imposition of administrative penalties the Commission uses other
enforcement mechanisms in exercising its enforcement duties including revoking a
companyrsquos certificate to operate In addition some companies may be required to relinquish a certificate as part of a settlement after enforcement action has proceeded
Table 9 provides a breakdown of the number of certificates revoked or relinquished In
2016 the Commission revoked the certificate of the REP TruSmart Energy
Table 9 Certificates Revoked or Relinquished
Type Number
Certificates Revoked 1
Certificates Relinquished 0
25 | P a g e
2017 SCOPE OF COMPETITION IN ELECTRIC MARKETS IN TEXAS REPORT
The Oversight amp Enforcement division also issues warning letters to companies in
the electric market when it determines that a violation occurred but given the
circumstances surrounding the violation and other mitigating concerns no administrative
penalty is warranted During 2015 and 2016 the Oversight amp Enforcement division issued
50 warning letters Finally the Commission generally seeks to reimburse money directly
to customers when appropriate In 2015 and 2016 the Commission ordered the
reimbursement of $8543596 to Texas electric customers
Table 10 Warning Letters
Warning Letter Type Number
Retail Market Warning Letter 8
Service Quality Warning Letter 1
Wholesale Market Warning Letter 41
TOTAL 50
In addition to its enforcement activities the Commission also enters into voluntary
mitigation plans with generators that request one through a contested case proceeding
pursuant to PURA sect15023(f) and 16 TAC sect25504(e) The Commission entered into one
voluntary mitigation plan during 2015 and 2016 in Docket No 44635
Low-Income Discount System Benefit Fund
The System Benefit Fund (SBF) was originally established in 1999 to fund
discounts to low-income customers customer education activities energy-efficiency and
weatherization and electric market oversight through a nonbypassable surcharge on retail
electric bills HB 1101 of the 84th Legislature provided that the SBF be sunset on
September 1 2017 by which time the SBF is intended to be exhausted In the 2016 Fiscal
Year (FY) $325521250 was appropriated in the SBF to provide a 25ndash31 percent discount
to low-income customers over a 12-month period
To assist the drawdown of the remaining balance HB 1101 authorized the
Commission to use any unexpended SBF balance in FY 2017 to assist low-income
customers The Commission estimates that the remaining SBF balance will be
approximately $17 million by August 31 2017 The Commission has determined that this
amount is insufficient to fund the rate reduction program however the Commission will
spend approximately $100000 to continue automatic enrollment in the program to provide
REPs a list of customers eligible to receive late fee waiver and deposit installment benefits
These two ancillary benefits of the rate reduction program will continue for the duration of
FY 2017
26 | P a g e
2017 SCOPE OF COMPETITION IN ELECTRIC MARKETS IN TEXAS REPORT
Homeland Security
The Commission assesses the efforts of ERCOT and utilities to defend against
mitigate and respond to the variety of risks that the modern electricity system faces The
Commission also meets with ERCOT utilities and governmental entities on an ongoing
basis to discuss preparation for everything from hurricanes and other severe weather to
cyber-threats and threats of physical damage to the grid from accidents or intentional
malfeasance In addition the Commission monitors industry and federal programs that
address homeland security issues
The Commission serves as an information liaison between state government and
electric utilities during emergencies The Commissionrsquos main roles include
Conveying outage and service restoration information from electric utilities to
state government
Conveying service restoration priorities (hospitals water treatment facilities
etc) from state government to electric utilities and
Facilitating the clearance of downed power lines in disaster re-entry areas and
facilitating entry of electric utilities into disaster areas
The Commissionrsquos Emergency Management Response Team (EMRT) provided staff at the
State Operation Center for the May 2015 and April 2016 flooding events in Texas as well
as additional staffing for severe winter weather
Demand Response
ERCOT staff have begun to report annually on the participation of customers in
REP-sponsored demand response programs These programs which have been facilitated
by the deployment of smart meters throughout the competitive areas within ERCOT and
by many municipal and cooperative electric utilities take the form of rebates for reduction
in usage during peak period time-of-use pricing real-time volumetric price compensation
for load reduction and direct control of customer load among other plans
These programs have seen dramatic increases in participation since ERCOT began
to gather this information in 2013 From 2013 to 2014 the number of residential customers
participating in these programs increased from 151793 to 721273 and the number of
commercial and industrial customers participating rose from 30275 to 50205 The
Commission continues to monitor ERCOTrsquos stakeholder process for efforts relating to the integration of demand response
27 | P a g e
2017 SCOPE OF COMPETITION IN ELECTRIC MARKETS IN TEXAS REPORT
IV LEGISLATIVE RECOMMENDATIONS
A Determination of Low-Income Customer Eligibility
In 2015 HB 1101 required that all remaining funds in the System Benefit Fund
(SBF) be expended that the fee that funded the program as a nonbypassable surcharge on
electric bills be set at zero and that the SBF be sunset on September 1 2017 Per the
provisions of HB 1101 the SBF fee was set at zero in September 2016 concluding the
funding for the program The sunset of the SBF program also concluded the relationship
between the Texas Health and Human Services Commission (HHSC) and the Commission
in which the HHSC provided to the Commission eligible electric customers for the SBF
low-income discount Because of the termination of the relationship with HHSC with the
termination of the SBF the Commission will no longer be able to determine easily an
electric customerrsquos eligibility for other low-income programs such as late penalty waivers
and the option of paying an electric deposit over multiple months
The Legislature may wish to consider easing low-income customers access to these
low-income programs by facilitating the process used to determine eligibility The
Commission offers four possible approaches in which the Legislature could continue these
low-income programs
(1) Authorize HSSC to provide identification of eligible low-income customers to the
Commission
(2) Allow retail electric providers (REPs) to provide such low-income programs using
the Low Income Discount Administratorrsquos (LIDA) Telecommunications Lifeline
Service Program list to identify low-income customers
(3) Require REPs to offer such low-income programs with customers self-enrolling
and REPs verifying income eligibility or
(4) Allow REPs to voluntarily provide such low-income programs at their own
discretion
B Outside Counsel for Proceedings before Regional Transmission
Organizations
Regional Transmission Organizations (RTO) manage the power grid across wide
regions of the United States Most of Texas is inside the ERCOT region however there
are significant portions of East Texas and the Panhandle that are in the Midcontinent
Independent System Operator (MISO) and the Southwest Power Pool (SPP) Issues arise
in these other RTOs that have significant impact on Texas ratepayers such as how
transmission infrastructure costs will be shared These tend to be very lengthy and
complicated proceedings that require specialized legal and consulting services
28 | P a g e
2017 SCOPE OF COMPETITION IN ELECTRIC MARKETS IN TEXAS REPORT
PURA sect 394525 currently authorizes the Commission to use outside consultants
auditors engineers or attorneys to represent the Commission in proceedings before the
Federal Energy Regulatory Commission This provision has been an important tool for the
Commission to respond to complex matters in the federal arena to enable it to protect the
public interest in Texas The PUC recommends that the Legislature expand the language
in this statute to include the ability to hire outside assistance for proceedings before other
RTOs to provide those same protections to Texas ratepayers in those areas
C Repeal of Natural Gas and Renewable Energy Mandates
1 Natural Gas
PURA sect 399044 establishes natural gas as ldquothe preferential fuelrdquo in Texas for electricity generation and requires the Commission to adopt rules to establish a system of
natural gas energy trading credits The majority of all new non-renewable electricity
generation constructed since 2000 for Texas has used natural gas as a primary fuel and this
trend is expected to continue in the foreseeable future The thresholds used to trigger the
natural gas energy trading credit system in PURA sect 399044 have not been reached and
they are not expected to be reached in the foreseeable future
Because natural gas-fueled facilities have been the most commonly built new
generation in Texas for many years and are expected to continue to be there is no need to
establish incentives for natural gas generation The PUC recommends that the Legislature
consider repealing PURA sect 399044 because it is no longer necessary
2 Renewable Energy
PURA sect 39904 establishes goals for renewable energy Subsection (a) requires
the installation of 5880 megawatts of renewable energy by 2015 and Subsection (b)
establishes a renewable energy credits trading program to implement the requirement The
5880 megawatts mandates in Subsection (a) was met in 2008 While the Commission
believes the renewable energy trading credit program is needed for retail electric providers
to validate renewable energy marketing claims the Commission believes the 5880
megawatts mandate in Subsection (a) is no longer necessary
D Advisory Opinions
Many regulatory agencies in Texas have authority to issue informal guidance to the
persons they regulate particularly with respect to outlining whether a particular course of
conduct would in the agencyrsquos view be consistent with the laws and regulations that the agency administers19 The issuance of an advisory opinion can provide regulatory clarity
to a company before making investments or conducting operations the permissibility of
which may be unclear under state law The Legislature may want to consider granting the
19 In addition certain federal agencies such as the Federal Communications Commission
Internal Revenue Service Securities and Exchange Commission and Federal Election
Commission have authority to issue advisory opinions
29 | P a g e
2017 SCOPE OF COMPETITION IN ELECTRIC MARKETS IN TEXAS REPORT
Commission the authority to issue advisory opinions In the electric industry providing
clarification to a company concerning issues such as the purchase of assets or the
acquisition of another company could allow it to avoid expensive regulatory proceedings
without impairing the Commissionrsquos authority The following state agencies have statutory authority to issue advisory opinions
Texas Ethics Commission20
Texas Medical Board21
State Board of Dental Examiners22
Texas Board of Nursing23
Texas Board of Professional Engineers24
Texas Lottery Commission and25
Texas Securities Board26
E Administrative
Gross Receipts Assessment
PURA sect 16001 provides for a gross receipts assessment that is used to defray the
expenses incurred by the Commission to administer PURA An assessment of one sixth of
one percent is collected from public utilities electric cooperatives retail electric providers
and interexchange carriersrsquo gross receipts from consumers The funds from this assessment
are remitted to the general revenue fund but currently they have not been explicitly
dedicated to funding of the Commission In contrast similar assessments on water
utilities insurance companies and other regulated entities have traditionally been used to
explicitly fund the underlying regulatory programs at the respective agencies The
Commission is one of four Article VIII agencies that is not designated as self-funded
The Commission recommends that the Legislature designate the Commission as a
self-funded agency whereby the collected assessments would be explicitly dedicated to the
funding of the agency Implementing this recommendation would require the Public Utility
Commission to be included in the Appropriations Limited to Revenue Collections rider
located in the Special Provisions Relating to All Regulatory Agencies section of the
General Appropriations Act Designation as a self-leveling agency would require the
Commission to set the gross receipts assessment at a rate sufficient to generate revenue in
the amount of the agencyrsquos general revenue appropriation each fiscal year which would require a statutory change to PURA sect16001(b) Based upon the Commissionrsquos baseline budget request authorizing the PUCrsquos self-leveling designation would result in an overall
estimated tax reduction of $456 million per year or 774
20 Government Code sect 571091 21 Occupations Code sect 162107 22 Occupations Code sect 258157 23 Occupations Code sect 301607 24 Occupations Code sect 1001601 25 Occupations Code sect 2001059 26 Tex Rev Civ Stat Ann Arts 581-28-1 amp 581-35 7 Tex Admin Code 1012
30 | P a g e
2017 SCOPE OF COMPETITION IN ELECTRIC MARKETS IN TEXAS REPORT
V APPENDICES
31 | P a g e
2017 SCOPE OF COMPETITION IN ELECTRIC MARKETS IN TEXAS REPORT
Appendix A ndash Acronyms
AEP American Electric Power
AMS Advanced Metering System
CenterPoint CenterPoint Energy Houston Electric LLC
DG Distributed Generation
DRG Distributed Renewable Generation
ERCOT Electric Reliability Council of Texas
ERSC Entergy Regional State
ERS Emergency Response Service
ETI Entergy Texas Inc
IMM ERCOT Independent Market Monitor
kWh Kilowatt-hour
LMP Locational Marginal Pricing
LSP Large Service Provider
MISO Midwest Independent System Operator
MMBtu One million British Thermal Unit (BTU)
MW Megawatt
MWh Megawatt-hour
Nodal Texas Nodal Market Design
ORDC Operating Reserve Demand Curve
PGC Power Generation Company
POLR Provider of Last Resort
PURA Public Utility Regulatory Act
REP Retail Electric Provider
RSC Regional State Committee
RTO Regional Transmission Organization
SCED Security Constrained Economic Dispatch
Sharyland Sharyland Utilities LP
SBF System Benefit Fund
SPP Southwest Power Pool
TDU Transmission and Distribution Utility
TNMP Texas-New Mexico Power Company
32 | P a g e
2017 SCOPE OF COMPETITION IN ELECTRIC MARKETS IN TEXAS REPORT
Appendix B ndash ERCOT Desalination Report
This page intentionally left blank
33 | P a g e
ERCOT Public
Study on the Demand Response Potential for Seawater Desalination Projects
ERCOT November 18 2016
Study on the Demand Response Potential for Seawater Desalination Projects ERCOT Public
Executive Summary
In 2015 the 84th Texas Legislature enacted House Bill (HB) 4097 which included several provisions relating to seawater desalination projects including a requirement that the Public Utility Commission of Texas (PUC) and Electric Reliability Council of Texas (ERCOT) study the potential for seawater desalination projects to participate in existing demand response opportunities in ERCOT There are several demand response products in which demand-side resources (ie consumers of electricity) can participate These programs help to preserve system reliability and provide economic benefits to participating demand-side resources Seawater desalination is an energy-intensive process that removes salt and other minerals from salt water to produce fresh water for municipal consumption industrial use or irrigation Participation in demand response could help mitigate electricity costs for future seawater desalination projects in Texas and provide reliability benefits to the grid
There are two main demand response reliability-based services administered by ERCOT participation by demand-side resources in the Ancillary Services market and the Emergency Response Service (ERS) Within the Ancillary Services market the most common service provided by demand-side resources is Responsive Reserve Service (RRS) which requires resources to respond either instantaneously or within 10 minutes in response to unplanned system emergencies ERS is separate from ERCOTrsquos Ancillary Services market and allows demand-side resources and distributed generation to provide reliability services in the event of an energy emergency Resources can qualify for either the 10-minute or 30-minute response time ERS programs
There are several key considerations that will impact a demand-side resourcersquos ability to participate in different demand response opportunities response time recovery time predictability of electrical demand and flexibility of operations Considering these factors together it appears that seawater desalination plants could be designed to meet the requirements for participation in demand response Because the ability to meet the qualification requirements is dependent on the plant design demand response opportunities should be considered early in a projectrsquos development if participation is desirable
Whether project developers will choose to address these requirements will depend on the economic benefits of participation There may be additional costs to design seawater desalination plants to operate in the manner required in order to participate in demand response These include costs associated with additional plant design specifications need for excess capacity and storage to make up for lost production during demand response deployment operational costs resulting from interruptions to plant processes and potential financial penalties if demand response deployment results in failure to meet contract demands The interplay of the benefits of participation and these costs will determine whether it would be beneficial for a future seawater desalination plant to participate in demand response in ERCOT
To date participation of seawater desalination plants in demand response programs has been limited Because the process of seawater desalination is energy-intensive participation in demand response could help to reduce electricity costs while posing a relatively low risk to plant operations As stakeholders in Texas continue to plan for possible future droughts in the region and identify water management strategies consideration of demand response could play a role in mitigating some costs associated with seawater desalination and allow seawater desalination plants to assist with maintaining electric reliability in the region
copy 2016 ERCOT All rights reserved i
Study on the Demand Response Potential for Seawater Desalination Projects ERCOT Public
Table of Contents
1 Introduction 1
2 Seawater Desalination 2
21 Seawater Desalination Plant Operations 2
22 Seawater Desalination Plant Economics 3
3 Demand Response Opportunities in ERCOT 4
31 ERCOT-Dispatched Demand Response 4
311 Ancillary Services Markets 5
312 Emergency Response Service (ERS) 5
32 Non-ERCOT-Dispatched Demand Response 6
321 Four Coincident Peak (4CP) 6
322 LSE or DR Provider Contracted Price Response 6
323 Self-Directed Price Response 6
4 Demand Response Potential for Seawater Desalination 7
41 Operational Considerations for ERCOT-Dispatched Demand Response 7
42 Economic Considerations for ERCOT-Dispatched Demand Response 8
43 Considerations for Non-ERCOT-Dispatched Demand Response 9
5 Conclusion 11
copy 2016 ERCOT All rights reserved ii
Study on the Demand Response Potential for Seawater Desalination Projects ERCOT Public
1 Introduction
In 2015 the 84th Texas Legislature enacted House Bill (HB) 4097 which included several provisions relating to seawater desalination projects including a requirement that the Public Utility Commission of Texas (PUC) and Electric Reliability Council of Texas (ERCOT) study the potential for seawater desalination projects to participate in existing demand response opportunities in ERCOT ERCOT and the PUC initiated this study to fulfill that requirement and evaluated the operational and economic characteristics of seawater desalination plants in light of ERCOTrsquos primary demand response products1
ERCOT is the independent system operator (ISO) for the ERCOT Interconnection which encompasses approximately 90 of demand for electricity in Texas ERCOT is the independent organization established by the Texas Legislature to be responsible for the reliable planning and operation of the electric grid for the ERCOT Interconnection ERCOT also administers and maintains a forward-looking open market to provide affordable and reliable electricity to consumers in Texas In collaboration with market participants ERCOT has developed demand response products and services for customers that have the ability to reduce or modify electricity use in response to instructions or signals These programs help preserve system reliability and provide economic benefits to participating demand-side resources
The process of seawater desalination removes salt and other minerals from salt water to produce fresh water for consumption industrial processes or irrigation The drought-prone Texas climate coupled with projections for increasing water demand in the state has created interest in seawater desalination as a future water source The 2017 Texas State Water Plan includes seawater desalination as a future water management strategy for water users in the state However the seawater desalination process is energy intensive and electricity consumption can be a significant cost driver for these projects To the extent that these plants could participate in demand response it would help to defray these costs Thus there is a potential nexus between seawater desalination projects built in Texas to mitigate drought but which have large electricity requirements and ERCOT demand response opportunities which could help to reduce their electricity costs and provide reliability benefits
This study evaluates the demand response potential of seawater desalination plants based on their operational characteristics and economic drivers The report is organized as follows
Section 2 provides background on typical seawater desalination plant operations and economics
Section 3 describes the current demand response opportunities in ERCOT
Section 4 evaluates the characteristics of seawater desalination plants to determine their potential to participate in demand response opportunities in ERCOT and
Section 5 provides a summary of the conclusions of this study
1 In the course of developing this report ERCOT consulted with several desalination experts with experience with existing or planned seawater desalination plants in the US The technical experts consulted included Jorge Arroyo (Water Management Consultant) Andrew Chastain-Howley (Black amp Veatch) Jonathan Loveland (Black amp Veatch) Ron Parker (Black amp Veatch) John Wolfhope (Freese and Nichols) and Srinivas Veerapaneni (Black amp Veatch)
copy 2016 ERCOT All rights reserved 1
Study on the Demand Response Potential for Seawater Desalination Projects ERCOT Public
2 Seawater Desalination
There are two primary methods for seawater desalination distillation (also referred to as ldquothermalrdquo) and reverse osmosis Distillation uses heat to remove salts and minerals from seawater by boiling water at high pressures In contrast reverse osmosis technology forces saline water through a membrane to separate water from the salts and minerals While both distillation and reverse osmosis are energy intensive distillation requires thermal energy to heat the water and overall has a higher energy requirement whereas reverse osmosis requires primarily electrical energy and overall is less energy intensive ndash though still with significant electricity requirements
Globally most thermal desalination plants are located in the Middle East due to low energy prices in the region Plants located elsewhere including in the US typically use reverse osmosis technology2 There are two large existing seawater desalination plants in the US one in Carlsbad California providing water to the San Diego area and one in Gibsonton Florida providing water to the Tampa Bay area Both plants use reverse osmosis technology In addition there are several desalination projects currently in the planning stages or under development in Texas in the Corpus Christi area that would use reverse osmosis technology For that reason this report focuses on reverse osmosis technology in the evaluation of demand response potential of seawater desalination plants
While there are currently no existing seawater desalination plants in Texas there are several municipal and industrial brackish water desalination plants in the state According to the Texas Water Development Board (TWDB) there are 46 municipal brackish water desalination plants with capacities greater than 0025 million gallons per day (MGD) in Texas representing a total of 123 MGD of capacity3 The desalination of brackish water is typically less expensive compared to seawater due to the lower relative salinity of brackish water This study focuses exclusively on seawater desalination consistent with the requirements of HB 4097 but it should be noted that conclusions may also apply to brackish water desalination though at a different cost and scale
This section provides high-level information on the operations (Section 21) and economics (Section 22) of seawater desalination plants to inform the discussion of their demand response potential in Section 4
21 Seawater Desalination Plant Operations Seawater desalination plants typically range in capacity from less than 5 MGD up to 165 MGD For example the Carlsbad seawater desalination plant has a capacity of approximately 50 MGD and the plant in Tampa Bay has a capacity of approximately 25 MGD The associated electricity consumption ranges between 10 and 15 kWh1000 gallons produced depending on the salinity of the water being processed456 More saline water (eg seawater) requires larger amounts of electricity for desalination Thus a seawater desalination plant would have larger electricity consumption requirements compared to a similarly sized brackish water desalination plant
2 American Water ldquoInnovation Solutions within the Water Industry Desalinationrdquo Available at httpwwwamwatercomfilesInnovationsSolutionsWithinTheWaterIndustryDesalinationpdf 3 Texas Water Development Board ldquoDesalination Factsrdquo Available at httpswwwtwdbtexasgovinnovativewaterdesalfactsasp 4 American Membrane Technology Association April 2016 ldquoMembrane Desalination Power Usage Put in Perspectiverdquo Available at httpwwwamtaorgcomwp-contentuploads7_MembraneDesalinationPowerUsagePutInPerspectivepdf 5 Water Reuse Association November 2011 ldquoSeawater Desalination Power Consumptionrdquo Available at httpswatereuseorgwpshycontentuploads201510Power_consumption_white_paperpdf 6 Ghaffour N TM Missimer and G Amy January 2013 ldquoTechnical review and evaluation of the economics of water desalination Current and future challenges for better water supply sustainabilityrdquo Desalination 309 pp197-207 Available at httpswwwresearchgatenetpublication256693140_Technical_review_and_evaluation_of_the_economics_of_water_desalination_ Current_and_future_challenges_for_better_water_supply_sustainability
copy 2016 ERCOT All rights reserved 2
Study on the Demand Response Potential for Seawater Desalination Projects ERCOT Public
While the two existing seawater desalination plants in the US were co-located with power plants to ease compliance with regulations on water intake and discharge structures and reduce costs many other reverse osmosis desalination plants receive their electricity from the grid However plants may have on-site backup generation in case of a power outage This will vary depending on the size and design of the plant and other factors For example the Carlsbad plant in California does have diesel backup generation to power control systems and flushing systems in the case of a power outage The plant in Tampa Bay was not built with backup power due to potential storm surge risks from hurricanes and other storms The plant does use uninterruptible power supply (UPS) backup to power control systems during power outages
Reverse osmosis plants are typically designed with several ldquotrainsrdquo which consists of a high-pressure pump turbine and reverse osmosis membrane Desalination plants are turned on or off one train at a time in a highly controlled process The process of ramping up or down an individual train under normal operations typically takes one to two hours While plants can be designed to handle immediate shutdowns (ie in a power outage) re-starting a system after an interruption would take this amount of time In addition the saline water must be pretreated (ie filtered) before going through the reverse osmosis train and this can sometimes pose constraints on the flexibility of operations
Demand for water is the key factor driving the level of production at seawater desalination plants Typically the plant will have a contract or contracts with municipal or other water users to deliver desalinated water and is operated to meet that demand Alternatively if the plant is municipally owned it would similarly be operated to meet the level of water demand in conjunction with other available water sources If water demands are close to a plantrsquos full capacity the operatorrsquos flexibility to adjust its electricity consumption as part of demand response may be limited However this does mean that plant operations are fairly predictable on a day-to-day basis which is necessary for participation in demand response
The amount of flexibility in plant operations will also be impacted by the amount of water storage available For example if a plant has sufficient water storage on-site or storage within the customerrsquos distribution system it could provide flexibility for the plant to reduce its operations during peak hours when electricity prices are likely to be highest It would also mitigate the impacts of interruptions to production from demand response deployments
22 Seawater Desalination Plant Economics Seawater desalination is typically more expensive than other sources of water and a major driver of the overall cost is energy costs In 2016 the Carlsbad plant charged rates at between $2131 and $2367 per acre-foot78 This charge is intended to cover both the fixed costs of the plant and the variable costs to produce a unit volume of water Typically half to two thirds of the cost of providing desalinated seawater are accounted for by capital cost recovery with the remainder accounted for by operations and maintenance costs including electricity costs Electricity costs can account for 20shy25 of the total costs of seawater desalination with reverse osmosis technology9
Factors affecting the capital cost of a seawater desalination plant include plant size type of desalination process and pre-post-treatment technologies plant infrastructure (eg piping water storage backup power) and compliance with applicable regulations (eg regulations on intake structures brine byproduct disposal) A significant driver of operating and maintenance costs is membrane replacement Reverse osmosis membranes need to be replaced every few years and
7 Source San Diego County Water Authority ldquoSeawater Desalinationrdquo Available at httpwwwsdcwaorgseawater-desalination 8 Note that 1 acre-foot is approximately 325851 gallons 9 Based on technical input from Black amp Veatch
copy 2016 ERCOT All rights reserved 3
Study on the Demand Response Potential for Seawater Desalination Projects ERCOT Public
the rate at which they are replaced will depend on the salinity of the feedwater and how the plant is operated Treatment and disposal of the salty brine byproduct from desalination may also incur operating costs
Electricity costs will vary depending on a range of factors including the size of the plant type of desalination technology source of electricity and quality of the feedwater As previously noted more saline water requires higher amounts of electricity in desalination and thus the amount of electricity consumption is a key difference between brackish water and seawater desalination As a result electricity costs comprise a significant share of the costs of seawater desalination These costs could potentially be defrayed in part by participation in demand response initiatives
3 Demand Response Opportunities in ERCOT
Broadly speaking demand response can be broken down into two major categories dispatchable or non-dispatchable For purposes of this report we will define dispatchable as those demand response events that are initiated by ERCOT and non-dispatchable as an event not specifically initiated by ERCOT These non-dispatchable events may include decisions made by the end-use customer to alter its consumption pattern or may include contractual obligations with another entity such as the end-use customerrsquos retail electric provider (ldquoREPrdquo) to alter consumption patterns
ERCOTrsquos wholesale market is open to several types of dispatchable demand response which are deployed to maintain system reliability Demand-side resources providing Emergency Response Service (ERS) may offer based on either a 10 or 30-minute response time commonly referred to as the ldquoramp periodrdquo Alternatively demand-side resources may register and qualify as a Load Resource that can provide Reserves in the Ancillary Services market The most common service provided by demand-side resources is Responsive Reserve Service which requires an under-frequency relay that can instantaneously interrupt the load during certain system reliability events Some demand-side resources can also participate in other Ancillary Services as Controllable Load Resources that require sophisticated control systems that allow them to be deployed in a more incremental proportional manner
Non-dispatchable demand response in ERCOT can include a response to avoid transmission costs where rates are based on Four Coincident Peak Pricing (4CP) response to wholesale energy prices initiated by the customer or by a REP or other load-serving entity (ldquoLSErdquo) or utility-managed Load Management programs (LM)
The sections that follow provide a description of both ERCOT-dispatched (Section 31) and nonshyERCOT-dispatched (Section 32) demand response For a more detailed description of opportunities for demand-side resources to participate in demand response in ERCOT see ERCOTrsquos guide Load Participation in the ERCOT Nodal Market10
31 ERCOT-Dispatched Demand Response There are two main demand response reliability-based services administered by ERCOT participation by demand-side resources in the Ancillary Services market and participation in ERS These services are dispatched by ERCOT during system emergencies
10 Available at httpwwwercotcomcontentservicesprogramsloadLoad20Participation20in20the20ERCOT20Nodal20Market_302d oc
copy 2016 ERCOT All rights reserved 4
Study on the Demand Response Potential for Seawater Desalination Projects ERCOT Public
Demand-side resources with demand response capability that can meet a set of performance requirements can be qualified to provide Ancillary Services as Load Resources in the Ancillary Services Market The value of having a Load Resource available to reduce load is equal to the value of having a generator available to increase its generation at a generating plant The providers of operating reserves selected to provide Ancillary Services are eligible for capacity payments regardless of whether the Resource is actually deployed (or curtailed in the case of the Load Resource)
ERCOT holds auctions on a daily basis for each of the following Ancillary Services Regulation Up Regulation Down Responsive Reserve and Non-Spinning Reserve11 Table 1 describes the various Load Resource types and their qualification requirements and eligible services
Table 1 Load Resource Types and Ancillary Services
Service Load Resource Type a Qualification Responsive Reserves (le50 of total Reserve requirement)
Non Controllable Under-Frequency Relay and 10-minute ramp to manual dispatch instruction
Responsive Reserves
Controllable Primary Frequency Response and follow 5-minute dispatch instructions
Regulation-Up Regulation-Down
Controllable Primary Frequency Response and respond to Regulation deployments
Non-Spin Reserves Controllable Follow 5-minute dispatch instructions a A Controllable Load Resource is a Load Resource capable of controllably reducing or increasing consumption under dispatch control by ERCOT
Demand-side resources that agree to reduce load when directed by ERCOT and that meet other metering and operational requirements as specified in the ERCOT Protocols may participate in Ancillary Services market auctions As noted in Table 1 the type of Ancillary Service that a Load Resource may provide will depend upon the demand-side resourcersquos response time and metering system as well as other requirements described in the Protocols In the Responsive Reserve and Non-Spin Reserve markets the Load Resource will receive capacity payments regardless of whether or not the load was actually deployed but the load must be available for deployment at any time while providing the service
ERCOT procures ERS to maintain grid reliability during emergency conditions and reduce the likelihood of the need for rotating outages ERS participants may offer to provide demand response with either a 10-minute ramp period requirement (similar to Load Resources providing Responsive Reserve Service) or a 30-minute ramp period requirement ERS Resources do not have the same telemetry and under-frequency relay requirements as Load Resources
11 Regulation Up and Regulation Down service respond to signals from ERCOT every 4 seconds to respond to changes in system frequency full response has to be provided within 5 minutes Responsive reserves must provide their committed capacity either instantaneously in an under-frequency event (eg due to a generator outage) or in energy scarcity conditions within ten minutes following an instruction from ERCOT Non-spinning reserves must provide their committed capacity within 30 minutes based on economic dispatch instructions Non-spinning reserve is used as replacement reserve to replenish other ancillary services and during energy scarcity
copy 2016 ERCOT All rights reserved 5
Study on the Demand Response Potential for Seawater Desalination Projects ERCOT Public
ERS is procured through a request for proposal (RFP) process three times per year for four-month contract terms each of which is further split into smaller time periods based on business cycles and other factors Demand-side resources may choose to submit offers in all time periods or only in those that best fit their unique circumstances and may vary both the price and demand response capacity offers by time period
Payments for ERS are performed up to 80 days after each four month contract term has ended and are subject to downward revision based upon delivered demand response capacity and the demand-side resourcersquos availability during the contract term
32 Non-ERCOT-Dispatched Demand Response The options listed below are not dispatched by ERCOT but they either are controlled directly by a customer or are dispatchable by another entity such as a demand response provider (ldquoDR Providerrdquo) REP or a transmission and distribution utility
Many industrial customers are subject to transmission charges based upon a Four Coincident Peak (4CP) demand The 4CP demand is determined by averaging the consumerrsquos actual demand during the 15-minute settlement interval with the highest ERCOT demand during each of the four summer months (June through September) This measured 4CP demand serves as the basis for the customerrsquos transmission tariff charges for the following year By correctly predicting the ERCOT system peaks during the summer and curtailing load during those intervals a consumer can help reduce the stress imposed on the electric system during peak periods of consumption and reduce its transmission charges for the following calendar year
In the competitive areas of ERCOT consumers can contract with their REP or a DR Provider to have their load respond to the REPrsquos or DR Providerrsquos instructions The contract will usually outline the parameters of this response ndash at what times and frequency demand response events can be called ramp periods sustained response periods compensation etc Because this response is a contractual matter between the REP or DR Provider and the consumer a great deal of variety can be present in these arrangements For example a consumerrsquos response may be voluntary or required compensation could come in the form of reduced energy prices or rebate payments for each curtailment event consumers might be notified up to a day in advance or could have no notification at all (for automated curtailment)
In areas of ERCOT not open to competition interruptible tariffs may be available These tariffs will usually offer a reduced energy price for defined curtailment obligations
REPs may offer dynamic pricing options or consumers within a municipality or cooperative may have their energy prices determined by a published tariff which also may be structured based upon Time-of-Use (TOU) or have a Critical Peak Pricing (CPP) or Peak Time Rebate (PTR) component Self-directed price response refers to consumers making an independent decision to respond to energy prices contained in a governing tariff or in either the ERCOT Day Ahead or Real Time energy markets
TOU offerings will typically have higher energy prices during normal peak periods ndash for example a TOU tariff may charge one price during Monday through Friday from 2 pm through 8 pm and another price during all other times Customers may choose to reduce consumption during these high priced periods Load reduction can be accomplished by load shifting (loads can be shifted by
copy 2016 ERCOT All rights reserved 6
Study on the Demand Response Potential for Seawater Desalination Projects ERCOT Public
rescheduling certain processes or by utilizing thermal storage) ending certain processes that are no longer economic or through energy efficiency measures
Offerings that incorporate CPP usually have prescribed high prices only during certain defined periods ndash for example when load or prices are expected to reach a certain level Response to CPP may be similar to those employed under TOU tariffs especially if CPP is reached frequently More often CPP is infrequent and as such short-term load curtailment may be the more appropriate response to meet economic objectives
4 Demand Response Potential for Seawater Desalination
This section evaluates whether the operational characteristics and economics of seawater desalination plants would enable them to participate in one or more of the various demand response opportunities in the ERCOT Region To date participation of seawater desalination plants in demand response programs has been limited Neither the plant in Carlsbad nor the plant in Tampa Bay participate in demand response programs in California or Florida respectively However as will be described below it appears that these plants can be designed and operated to meet the requirements for participation in demand response and receive economic benefit from participation in these programs
Section 41 describes the operational parameters that must be met for a demand-side resource to provide ERCOT-dispatched demand response and evaluates the ability of seawater desalination plants to meet these criteria Section 42 discusses the tradeoffs between payments for participation in ERCOT-dispatched demand response and potential additional costs posed to seawater desalination plants Finally Section 43 presents other opportunities for seawater desalination plants to reduce their electricity costs outside of ERCOTrsquos reliability-based services that are open to demand response assets
41 Operational Considerations for ERCOT-Dispatched Demand Response There are several key operational parameters that impact a demand-side resourcersquos ability to participate in different demand response services response time recovery time predictability of electrical demand and flexibility of operations This section discusses each of these considerations as they apply to seawater desalination plants
As discussed in Section 31 one of the differentiating factors between ERCOTrsquos demand response products is the amount of time within which a demand-side resource must respond to a deployment instruction to reduce electricity consumption during an event Participation in RRS requires an automatic response within either half a second (ie instantaneous) based on grid frequency or within 10 minutes via a manual instruction ERS requires a response time of either 10 or 30 minutes As noted in Section 21 the typical time to take a reverse osmosis train on- or off-line is 1-2 hours under normal controlled operations To comply with the response time requirements of RRS or ERS a seawater desalination plant would need to be able to reduce its electricity consumption far more quickly than in normal operations This is an element of plant design that would need to be accounted for in the specifications of the project Considerations include the potential need for on-site backup generation including uninterruptible power supply potential impacts to plant infrastructure (eg piping) reverse osmosis membranes and pretreatment systems
The two large US desalination plants provide illustrative counterpoints in this respect The Carlsbad plant was designed to withstand instantaneous power interruptions and has on-site backup generation including uninterruptible power supply to provide the ability to power control systems and flush the membranes in the event of a power loss In contrast the Tampa Bay plant was not
copy 2016 ERCOT All rights reserved 7
Study on the Demand Response Potential for Seawater Desalination Projects ERCOT Public
designed with on-site backup generation and a loss of power would result in a plant shutdown and may require several days to bring the plant back on-line Thus it appears that it is technically possible for a seawater desalination plant to meet the response time requirements for participation in demand response so long as this factor is considered in the design of the facility
The time it takes a desalination train to return to operations after an event is also a consideration Demand-side resources participating in RRS must be able to come back on-line within three hours and those participating in ERS must return within 10 hours Again it appears that it is technically feasible for desalination plants to meet this requirement so long as this requirement is considered in the plant design
An additional consideration is the predictability of a demand-side resourcersquos electricity consumption Participation in the responsive reserves ancillary service market requires bidding in the day-ahead market and thus a demand-side resource must know with great accuracy (within 95) its electrical demand at least a day ahead of time For ERS auctions are held three times a year for four-month contract periods Thus to participate in ERS a resource must know its forecasted electrical demand several months in advance Because seawater desalination plant operations are driven by contracted demand for water it is likely that a plant operator would have a good idea of the plantrsquos electrical demand days or even weeksmonths in advance especially for summer months when demand is likely to be relatively steady An important consideration however is the salinity of the water which drives the electrical requirements and which can be impacted by recent weather events Similarly reductions in demand for water during non-summer months or wet summer days where demand may be reduced could also impact a plantrsquos ability to predict its electricity demand
Finally a seawater desalination plant must have sufficient flexibility in its day-to-day operations so that it can afford to lose several hours of production when deployed for demand response It should be noted that demand-side resources participating in RRS and ERS are called infrequently demand-side resources providing responsive reserves were deployed one time in 2015 and ERS was not deployed that year However this is an important factor to consider if a plant is operating at close to full capacity and would incur financial penalties if it fails to meet its contract obligations due to a demand response event Including additional storage and building a plant with extra capacity could help to mitigate this risk It should also be noted that a plant operator does not need to commit the full plant capacity to these services but rather can specify an amount of MW that will be committed Thus a plant operator could mitigate issues both with predictability and flexibility of plant operations by committing only a portion of its predicted electrical demand to participate in demand response
Considering these factors together it appears that seawater desalination plants could be designed to meet the operational requirements for participation in ERCOTrsquos demand response services (both RRS and ERS) Because the ability to meet the requirements is dependent on the plant design demand response would need to be considered early in a projectrsquos development if participation is desirable Whether project developers will choose to address these requirements will depend on the economic benefits of participation in demand response which will be discussed in the next section
42 Economic Considerations for ERCOT-Dispatched Demand Response This section describes the economic benefits to demand-side resources from participation in ERCOT-dispatched demand response programs The average price paid for a demand-side resource participating in RRS in 2015 was $1087 per MW per hour and for ERS was $645 per MW per hour for the contract periods during the 2015 program year These payments could provide a significant financial benefit to seawater desalination plants To give a simplified example for a plant with an electrical demand of 10 MW operating at a 100 annual load factor (10 MW times 24 hours times 365 days) the annual benefit would be on the order of $500000 for ERS or $1 million for RRS
copy 2016 ERCOT All rights reserved 8
Study on the Demand Response Potential for Seawater Desalination Projects ERCOT Public
In 2015 demand-side resources providing responsive reserves were deployed one time for a duration of 10 minutes and ERS was not deployed12 The most ERS was ever deployed in a single year was two times in 2011 Thus participation in either program could result in a substantial payment to a seawater desalination plant with a relatively low risk of deployment and associated disruption of plant operations although it is important to note that participation in either ERCOT service subjects demand response resources to annual unannounced testing Other than testing the frequency of deployment will depend on grid conditions and is a risk that should be considered
The financial benefits of participation must be weighed against the costs of designing facilities with the capabilities to operate in this manner These include
bull The costs to design the plant to reduce electrical demand within the required timeframes for demand response and to withstand an instantaneous interruption if not already part of the plant design For example a plant may need to be designed to have backup power generation on-site In addition there could also be costs to restart the system after an interruption
bull The costs to build a plant with excess capacity andor storage to make up for lost production hours when demand response is deployed This will add to the total capital costs of the project Land area constraints should also be considered when considering additional storage as the space requirements for the necessary storage capacity could be significant
bull Costs associated with the impact of interruptions on plant processes (eg more frequent replacement of membranes impacts to pretreatment system or plant infrastructure)
bull Potential financial penalties that would be incurred if deployment as part of demand response were to result in failure to meet contract obligations to supply water
bull The loss of potential benefits in the form of cost avoidance from participation in non-ERCOTshydispatched demand response opportunities (see Section 43) If a plant is committed to RRS or ERS the plant operator would lose the flexibility to take advantage of these other opportunities to reduce their electricity costs
The interplay of these benefits and costs will determine whether it would be beneficial for a future seawater desalination plant to participate in demand response in ERCOT
43 Considerations for Non-ERCOT-Dispatched Demand Response Outside of the reliability-based services administered by ERCOT there are other opportunities for seawater desalination plants to reduce their electricity costs As described in Section 321 seawater desalination plants may be able to reduce the demand charges on their electricity bills through curtailing load during 4CP intervals In addition plant operators may adjust operations in response to real-time electricity prices to take advantage of lower off-peak prices and avoid price spikes (see Sections 322 and 323) All of these opportunities require that the plant have flexibility to reduce production during certain times of the day
In the ERCOT region as noted above a portion of transmission and distribution charges are set based on the peak systemwide 15-minute interval of the four summer months (June through September) referred to as the four coincident peaks (4CP) Large customers can reduce or avoid this charge by reducing electrical consumption during these four peak intervals AEP Central Texas and CenterPoint are the transmission providers covering the majority of the Gulf Coast in Texas13
12 ERCOT June 2016 ldquoLoad Resource Deployment Updaterdquo Available at httpwwwercotcomcontentwcmkey_documents_lists870985_RRS_Load_Resource_Deployment_Updatepdf 13 It is also possible that a seawater desalination plant could be located in an area that as not opted in to competition in which case the plant owner would need to negotiate its electricity charges bilaterally with the Non Opt-In Entity (NOIE)
copy 2016 ERCOT All rights reserved 9
Study on the Demand Response Potential for Seawater Desalination Projects ERCOT Public
Assuming a future seawater desalination plant would be connected at transmission-level voltages the relevant 4CP charges based on the 2016 tariffs accounting for both transmission charges and transmission cost recovery factors would be $41425 per 4CP kW for AEP Central Texas and $41870 per 4CP kVA for CenterPoint14 If a seawater desalination plant has 10 MW of load and is capable of interrupting all of it and successfully does so for all four 4CP intervals the savings based on the 2016 tariffs would be approximately $500000 per year ($41425 times 1000 (kW to MW) times 10 MW times 12 months) Thus a seawater desalination plant that reduces its electricity use during the 4CP intervals could avert some or all of these charges
Another opportunity for seawater desalination plants to reduce their electricity costs is through adjusting operations in response to real-time electricity prices In 2015 the average electricity price in ERCOT was $2677MWh However prices exceeded $50MWh in 254 hours (3 of all hours) $100MWh in 88 hours (1) $200MWh in 40 hours (05) and $300MWh in 21 hours (02) Prices exceeded $3000MWh for 021 hours15 Depending on the desalination plantrsquos exposure to real-time wholesale market prices (via its retail contract) the degree of high prices the plant owner is willing to avoid and grid conditions in a given year reducing unit operations in order to avoid high electricity prices could impact operators for anywhere between a few and several hundred hours out of the year In addition a plant can plan its operations to take advantage of lower electricity prices during off-peak periods (eg at night when generation from wind is high) For example at least one company is marketing a modular desalination unit design intended to take advantage of low prices during periods of high renewables generation and to provide grid reliability services through demand response16
There are several factors to consider regarding these opportunities to reduce electricity costs The plant would need to monitor the ERCOT market or hire a contractor to do so in order to know when to reduce demand for electricity These programs do not impose any requirements on response time as with RRS or ERS and there may be sufficient warning of 4CP intervals or peak pricing to allow the plant operator to plan its operations earlier in the day with sufficient time to ramp down production under controlled conditions However quicker ramping capability may be desirable to respond to electricity price fluctuations
For 4CP because the four intervals used to set demand charges are not known ahead of time it is likely that the plant would need to reduce its demand multiple times per summer to ensure the 4CP intervals are hit impacting production at the facility Timing operations to coincide with off-peak pricing or to avoid price spikes would similarly result in reduced operations during certain hours To offset the lost production hours the plant may need to be designed with extra capacity and water storage capability to maintain the ability to meet its contractual obligations for freshwater delivery Because the period of reduced operations is greater than with ERCOT-dispatched demand response services this need would be greater for a seawater desalination plant reducing load during 4CP intervals or in response to real-time electricity prices and would increase the capital costs of the project It should also be noted that high prices in the ERCOT Region typically but not always occur in summer months when drought conditions are more likely to develop and demand for desalinated water is likely to be highest This may limit the flexibility of the plant to time its electricity consumption to avoid high-priced hours
14 Public Utility Commission of Texas ldquoTransmission and Distribution Rates for Investor Owned Utilitiesrdquo Available at httpwwwpuctexasgovindustryelectricratestdraspx 15 Potomac Economics June 2016 2015 State of the Market Report for the ERCOT Wholesale Electricity Markets Available at httpswwwpotomaceconomicscomindexphpmarkets_monitoredERCOT 16 Sisyan LLC ldquoDemand Response Desalinationrdquo Available at httprenewabledesalinationcomwpshycontentuploads201506Demand-Response-Desalinationpdf
copy 2016 ERCOT All rights reserved 10
Study on the Demand Response Potential for Seawater Desalination Projects ERCOT Public
In addition the plantrsquos ability to participate in demand response would also be limited for those hours it is reducing load as part of 4CP response or in response to real-time prices because the plant would not be able to reduce its electricity consumption if that demand is already committed to another demand response service Thus participating in demand response versus taking advantage of these other opportunities may be to some extent mutually exclusive
5 Conclusion
Based on this analysis it appears that the operational characteristics of seawater desalination plants would allow them to participate in demand response opportunities in ERCOT so long as the necessary operational requirements are considered in the design specifications of the plant Project developers should consider the necessary requirements early in the plant design Whether the economic benefits of participation would provide a sufficient incentive for them to do so will depend on the costs of accommodating those operational requirements and whether there is the flexibility available to operate the plant as necessary under these programs Though most existing seawater desalination plants do not participate in demand response programs it does appear that participation by these plants is possible and could result in a financial benefit Table 2 compares the different demand response opportunities available to demand-side resources in ERCOT
Table 2 Comparison of Demand Response Opportunities Demand Response
Opportunity Requirements for
Participation Impacts to Plant
Operations Financial Benefit Ancillary Services ndash Responsive Reserve Service (RRS)
bull Under-Frequency Relay bull Instantaneous or 10 minute
response time bull Recover load within 3
hours bull Bid in day-ahead market
bull Deployed once in 2015 for 10 minutes bull Subject to annual
unannounced testing
bull $1087 per MW per hour (based on 2015 prices)
Emergency Response Service (ERS)
bull 10 or 30 minute response time bull Recover load within 10
hours bull Four-month contract term
bull Not deployed in 2015 the most times ever deployed in a single year was twice in 2011 bull Subject to annual
unannounced testing
bull $645 per MW per hour (based on 2015 prices)
Four Coincident bull Interval Data Recorder bull Likely plant will need to bull Avoid ~$48000 per 4CP Peak (4CP) (IDR) meter
bull Ability to predict system-wide peak demand hours during summer months
reduce load multiple times per summer to hit 4CP intervals bull Likely to be able to predict
possible 4CP intervals earlier in day
MW per year (based on 2016 tariffs) if successful in reducing during all four summer months
LSE or DR Provider Contracted Price Response
bull Varies based on contractual arrangements
bull Varies based on contractual arrangements
bull Varies based on contractual arrangements
Self-Directed Price bull Retail contract with bull Varies depending on bull Varies depending on Response exposure to real-time
market prices bull Ability to monitor real-time
prices in ERCOT wholesale market
number and severity of pricing events bull May be able to predict
peak pricing events earlier in day
number and severity of pricing events
copy 2016 ERCOT All rights reserved 11
Study on the Demand Response Potential for Seawater Desalination Projects ERCOT Public
Demand response programs in ERCOT provide opportunities for demand-side resources to defray their electricity costs and provide reliability benefits to the ERCOT electric grid Because the process of seawater desalination is energy intensive participation in demand response could help to reduce electricity costs while posing a relatively low risk to plant operations if demand response participation is factored into plant design
Participation in non-ERCOT-dispatched demand response opportunities such as reducing load during 4CP intervals or in response to real-time electricity prices may also help to reduce electricity costs for seawater desalination plants in Texas As stakeholders in Texas continue to plan for possible future droughts in the region and identify water management strategies consideration of demand response could play a role in mitigating some costs associated with seawater desalination and allow seawater desalination plants to assist with maintaining electric reliability in the region
copy 2016 ERCOT All rights reserved 12
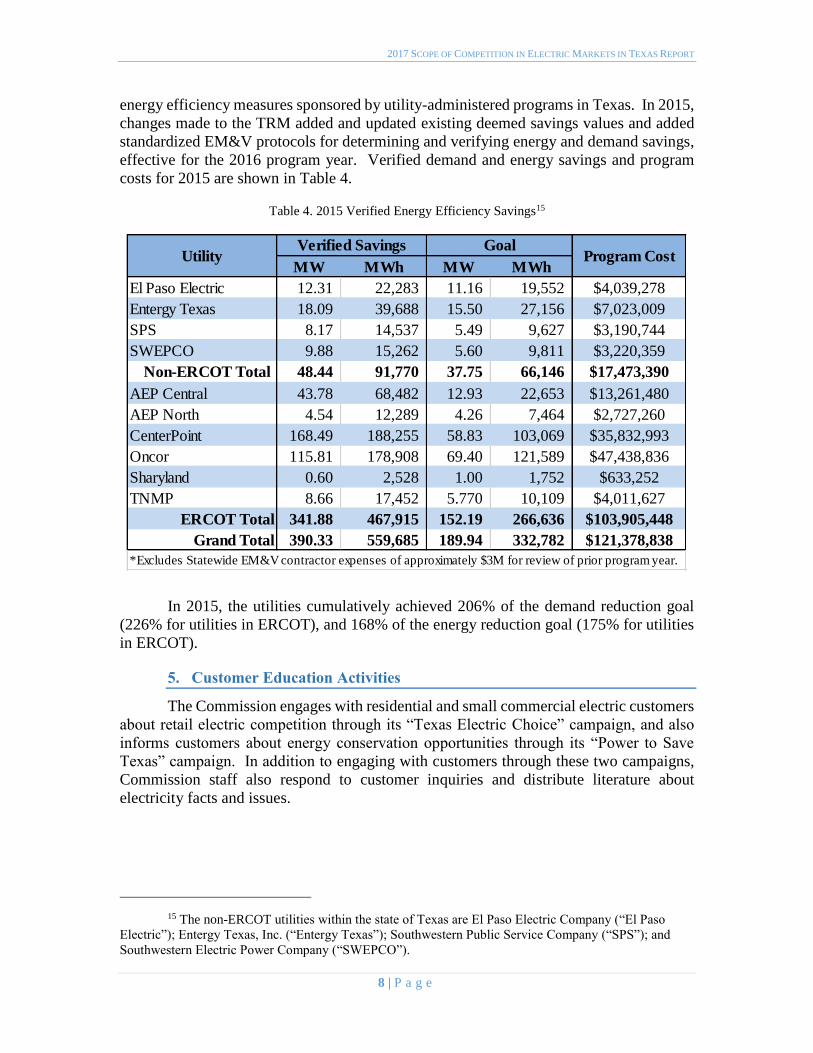
2017 SCOPE OF COMPETITION IN ELECTRIC MARKETS IN TEXAS REPORT
a ldquoPower to Chooserdquo
The Commission educates customers about the evolving marketplace continuing
its ldquoTexas Electric Choicerdquo campaign which began in February 2001 with the goal of educating Texans about the changes and choices in the retail electric market The
PowerToChooseorg website and its Spanish-language counterpart PoderDeEscogerorg
provides a simple one-stop shop portal for Texans who live in a service territory open to
customer choice to enter in their zip code and browse through the numerous plans offered
by the REPs
b ldquoPower to Save Texasrdquo
In addition to the ldquoTexas Electric Choicerdquo campaign and the PowerToChoose website the Commission has also continued its statewide initiative ldquoPower to Save
Texasrdquo together with its parallel Spanish-language initiative ldquoPoder de Ahorrarrdquo which educates Texans about conserving energy during the summer peak times of 3 pm to 7
pm when the demand for electricity tends to be the highest The PowerToSaveTexasorg
website and its Spanish-language counterpart PoderDeAhorrarTexasorg provide Texans
with energy saving tips for homes and businesses
As part of the Power to Save Texas campaign the Commission contracted with
Resource Action Programs (RAP) to develop and implement a middle school energy
conservation outreach program in Hidalgo Harris Dallas and Tarrant counties In the
2015 ndash 2016 school year the program provided an effective energy education program
which strongly supports the Texas Essential Knowledge and Skills (TEKS) curriculum
standards as well as engages students through school challenges and at-home activities
c Campaign Outreach
PowerToChooseorg and its Spanish-language counterpart PoderDeEscogerorg
have proven valuable in educating customers about customer choice in the electricity
market The Commission conducted a number of activities to further promote the statersquos official electric choice website through social media community events trade shows and
expos From September 1 2015 through August 31 2016 nearly a million potential
customers visited the PowerToChooseorg and PoderDeEscogerorg websites Website
statistics are contained in Table 5
Table 5 Website Statistics September 2015 ndash August 2016
PowerToChoosecom Unique Visitors 980473
PoderDeEscogercom Unique Visitors 4652
d Low-IncomeElderly Outreach and Collaboration with Faith- and
Community-Based Organizations
Throughout 2015 and 2016 the Commissionrsquos staff also worked with legislative
offices and faith- and community-based organizations to provide educational materials and
training to help their constituents better understand the deregulated electric market and the
9 | P a g e
2017 SCOPE OF COMPETITION IN ELECTRIC MARKETS IN TEXAS REPORT
Commissionrsquos websites The Commission has actively participated with the Interagency
Coordinating Group (ICG) which was established by the Texas Legislature to expand and
improve relationships between state government and faith- and community-based
organizations Information on customer assistance programs such as LITE-UP Texas was
provided to community organizations such as Legal Aid of Northwest Texas senior
activity centers and religious groups
e Call Center
The Commission has trained its Customer Protection Division staff who are fluent
in both English and Spanish to answer customer calls and to assemble and mail
informational packets comparing electric plans when requested by customers without
Internet access From September 2015 to August 2016 the Customer Protection Division
staff handled 7663 calls from customers requesting assistance with shopping
f Educational Literature
In addition to the educational materials on the Commissionrsquos website the Commission provides brochures fact sheets and other educational materials by mail and
e-mail through a network of community organizations and events and in response to
customer requests to the call center Up-to-date fact sheets are available on the
Commissionrsquos website PowertoChooseorg and PoderDeEscogerorg as part of the
campaignrsquos outreach efforts The fact sheets provide information on a number of current
industry and consumer topics
Throughout 2015 and 2016 campaign educational materials promoting the
agencyrsquos programs including Power to Choose and Power to Save Texas were distributed
at numerous community events and civic town hall events such as Hurst-Euless-Bedford
ldquoBack 2 Schoolrdquo day Dickenson Housing Family Fair Energy Day DFW Family Fair
Earth Day Texas Texas Home and Garden shows in Houston Texas Black Expo National
Night Out events and minor league baseball games
Wholesale Market Development
The Commission engages regularly with ERCOT to oversee market developments
and ensure system supply reliability security and improved price formation and market
outcomes Market design changes made as a result of this working relationship have
created new opportunities for a variety of generation resources to enter the market and
supported the formation of wholesale prices that reflect real-time market conditions more
accurately and therefore improve the efficiency of the market
1 Wholesale Market Prices
Wholesale market prices have fallen in comparison to prices seen in the 2012 ndash 2014 period The ERCOT load-weighted real-time average price of energy in 2015 was
$2677 per Megawatt-hour (MWh) a 34 decrease from the average price in 2014 and a
decrease of 21 from the average seen in 2013
10 | P a g e
2017 SCOPE OF COMPETITION IN ELECTRIC MARKETS IN TEXAS REPORT
Falling wholesale prices are correlated with the current trend of lower natural gas
prices the primary fuel of many of the regionrsquos power plants The average Houston Ship Channel spot price for natural gas was 41 lower in 2015 than in 2014 decreasing from
$437MMBtu in 2014 to $258 in 2015 Through March the average price for 2016 has
fallen to $192MMBtu Natural gas price trends from September 2014 through August
2016 are shown in Figure 4
Figure 4 Monthly Average Natural Gas Prices September 2014 ndash August 2016
Monthly average wholesale electricity prices are shown in Figure 5 Load-
weighted prices are calculated by dividing the price at a load zone by the associated
demand This metric provides a useful proxy for the actual wholesale prices paid by load16
16 It is worth noting that most power in ERCOT is sold through various bilateral arrangements that
are designed to hedge daily real-time market price risk
11 | P a g e
2017 SCOPE OF COMPETITION IN ELECTRIC MARKETS IN TEXAS REPORT
Figure 5 Load-Weighted Average Real-Time Monthly Settlement Point Prices September 2014 ndash August 2016
Another component of the real-time price of electricity is the cost of transmission
congestion Transmission congestion occurs when there is insufficient transmission
capacity to dispatch energy in a least-cost fashion The recent build-out of additional
transmission lines in areas of high congestion has partially relieved the cost burden in these
areas particularly in West Texas where oil and gas production growth rapidly increased
the demand for electricity resulting in relatively higher zonal prices
2 Peak Demand
After the very high peak demand levels during the hot summer of 2011 peak
demand in ERCOT was lower in 2012 through 2014 In 2015 peak demand again
increased though not to 2011 levels with load exceeding 60000 MW for 330 hours and
exceeding 65000 MW for 91 hours as shown in Figure 6 below In 2016 ERCOT
experienced a record week in August which saw the previous record peak demand broken
six times and the ERCOT region hit its all-time peak demand of 71093 MW on August
11 2016
As peak demand has increased the recorded availability of generation supply in the
region during times of high load has decreased slightly Physical Responsive Capability
(PRC) analogous to the amount of reserves available on the system at any given time fell
below 3000 MW for 269 hours in 2015 up slightly from 213 hours in 2014 and 215
hours in 2013 but well below the 371 hours recorded during the 2011 summer
12 | P a g e
2017 SCOPE OF COMPETITION IN ELECTRIC MARKETS IN TEXAS REPORT
Figure 6 High Load Hours in ERCOT 2011 ndash 2016
As shown in Table 6 the ERCOT system peak demand was 69877 MW in 2015
up 5 from the 2014 peak and the 2016 ERCOT system peak demand increased 174
from the peak demand of the previous year
Table 6 ERCOT Peak Demand 2012 ndash 2016
Year
ERCOT Peak
Demand (MW)
Percentage Change
from Prior Year
2012 66548 ndash 2013 67245 105
2014 66454 ndash118
2015 69877 515
2016 71093 174
Figure 7 shows the hourly peak load for each month in ERCOT from January 2014 to
August 2016
13 | P a g e
2017 SCOPE OF COMPETITION IN ELECTRIC MARKETS IN TEXAS REPORT
Figure 7 Monthly Peak Demand in ERCOT January 2014 ndash August 2016
3 Generation Diversity
As electricity consumption has increased in ERCOT the diversity of the systemrsquos generation portfolio has also increased Generators participating in the statersquos renewable energy credit (REC) trading program reported an 11 increase in renewable generation
from 2013 to 2015 rising from 376 million MWh to 469 million MWh with wind
representing 96 of the total renewable mix Landfill gas was the second most prevalent
renewable source representing approximately 12 of all renewable generation in 2015
Energy produced from wind generation was up by 13 in 2015 from 2013 and solar
energy capacity more than doubled from 121 MW in 2013 to 288 MW in 2015 Coal-fired
generation has been steadily shrinking as a proportion of total generation declining from
37 of electricity produced in 2014 to 28 in 2015 Energy use in the ERCOT region by
fuel type for 2015 is shown in Figure 8
14 | P a g e
2017 SCOPE OF COMPETITION IN ELECTRIC MARKETS IN TEXAS REPORT
Figure 8 Energy Use in ERCOT by Resource Type 2015
The Commissionrsquos projects are further described in the following section of this report
15 | P a g e
2017 SCOPE OF COMPETITION IN ELECTRIC MARKETS IN TEXAS REPORT
III SUMMARY OF COMMISSION ACTIVITIES FROM 2015 TO 2016
Introduction
The Commission develops and modifies rules policies and procedures for the
competitive electric market in Texas in response to the technological advances in the
industry and the evolving needs of customers The Commission also continues to carry
out oversight of programs with which the Legislature has tasked it ndash such as energy
efficiency renewable energy and advanced metering infrastructure Within the
ERCOT region the monopoly wires-and-poles companies that provide transmission
and distribution services throughout the grid remain subject to traditional rate
regulation by the Commission The Commission continues to set rates for these
utilities as they are not subject to the forces of market competition This section
provides an overview of the Commissionrsquos activities in its oversight of the wholesale and retail electric markets as well as its governance over regulated electric utilities
Resource Adequacy
Resource adequacy is the long-term ability of the system to serve demand reliably
when consumption is highest given the available installed capacity load resources and
the operational reliability of the system Assessing resource adequacy requires comparing
the systemrsquos forecast installed capacity and load resources against the forecast peak
summer load The difference between the forecast of available generation and load
resources and the forecasted demand for electricity is referred to as an ldquoinstalled capacity
reserve marginrdquo which is an indicator of the ability of the system to meet customer demand
during peak conditions In addition to evaluating the forecast reserve margin assessing
resource adequacy includes evaluating the systemrsquos operational reliability The systemrsquos operational reliability depends on the ability of generators to manage plant operations
successfully as well as the grid operatorrsquos ability to manage the system to avoid or to mitigate load curtailment During 2015 and 2016 the ERCOT system performed well with
respect to resource adequacy The Commission has devoted significant attention to
ensuring that ERCOT maintains an adequate installed capacity reserve margin and a high
level of operational reliability developing a wholesale market design that allows
consumers to continue to receive low-cost and reliable electricity over the long term
1 Capacity Demand and Reserves Report
The Capacity Demand and Reserves (CDR) Report published by ERCOT semi-
annually is a snapshot estimate of long-term supply and demand and the associated annual
reserve margin for peak summer and winter conditions While the CDR Report is not a
forecast of any particular outcome it provides insight into possible resource adequacy
trends
16 | P a g e
2017 SCOPE OF COMPETITION IN ELECTRIC MARKETS IN TEXAS REPORT
The May 2016 CDR Report shows estimated reserve margins well above the
current target reserve margin of 1375 Installed capacity reserve margin estimates taken
from this CDR Report are shown below in Table 7
Table 7 May 2016 Capacity Demand and Reserves Report Forecast
Forecast 2017 2018 2019 2020 2021 2022 2023 2024 2025 2026
Peak Load
(MW)
68548 69409 70795 71420 72098 72792 73482 74168 74864 75704
Total
Capacity
(MW)
80995 87019 87238 87407 87678 87738 87738 87728 87728 87728
Reserve
Margin
182 254 232 224 216 205 194 183 172 159
2 Operating Reserve Demand Curve
In ERCOT the price signals produced by the energy-only wholesale electric market
should provide incentives to promote short-term reliability as well as induce optimal long-
run investment in new resources If the prices are efficient and reflect the full cost of
dispatching resources to meet demand the benefits that accrue to both consumers and
producers can be maximized at the least cost and new generating capacity (or load
resources) should develop to maintain the equilibrium as old resources retire or demand
increases
The Operating Reserve Demand Curve (ORDC) implemented at the Commissionrsquos direction in June 2014 improves price formation by allowing prices to more fully reflect
the value of operating reserves The ORDC assigns an economic value to operating
reserves or the amount of extra capacity available to maintain system reliability on a daily
basis
As part of its ongoing review of resource adequacy in ERCOT the Commission is
currently evaluating the accuracy of the inputs to the ORDC to ensure that its contribution
to price formation appropriately reflects the costs of meeting demand and the underlying
needs of the system
3 Transmission Congestion
Although competitive power producers and regulated transmission providers form
two distinct segments of the market transmission buildout has a direct effect on wholesale
power prices When there is insufficient transmission capacity to dispatch energy in a least-
cost fashion the system operator takes action to ensure that the physical limits of the
transmission system facilities are not violated The re-dispatch of generation because of
transmission limits results in disparate prices at different locations on the system In
comparison to prior years transmission congestion in ERCOT has lessened because of the
large increase in transmission investment and the reduction of high demand related to oil
and gas production in West Texas ERCOT and the Commission continually evaluate the
need for cost-effective additional transmission investment to manage congestion
17 | P a g e
2017 SCOPE OF COMPETITION IN ELECTRIC MARKETS IN TEXAS REPORT
4 Wholesale Market Design Initiatives
While the ERCOT wholesale market has been successful in attracting new resource
investment and also maintaining competitive prices for consumers certain improvements
to the market design could yield additional benefits in terms of efficient price formation
and opportunities for entry of new technology Initiatives already in place in many other
regions such as real-time co-optimization and multi-interval real-time resource dispatch
may allow existing capacity to be used more effectively and create opportunities for the
integration of additional load resources to serve electric demand The Commission
continues to work with ERCOT and interested stakeholders to determine the value of
implementing such enhancements particularly as ERCOTrsquos resource mix changes over time
5 Reliability Standard
In early 2014 the Commission opened a project to review its use of a target installed
capacity reserve margin based on a reliability standard equivalent to one loss-of-load event
every ten years In this project the Commission received written comment from interested
parties conducted a public workshop consulted with independent experts and reviewed
the application of reliability standards in other regions As a result of this review future
reliability metrics to be estimated in ERCOT will include the market equilibrium reserve
margin the economically-optimal reserve margin and the associated levels of expected
unserved energy The Commission believes that publishing these metrics represents an
improvement over reporting a one-event-in-ten-years standard by enhancing insight into
expected outcomes in ERCOTrsquos energy-only market
Non-ERCOT Utilities Market Development Activities
SB 7 the law that introduced retail competition to the Texas market in 1999
granted the Commission authority to delay retail competition in an area where deregulation
would not result in fair competition and reliable service because of the lack of an
independent organization to coordinate the electric system and the concentration of
ownership in the generation sector in some of those areas Consequently SB 7 included
provisions recognizing the difficulty of implementing retail competition in areas outside of
ERCOT Therefore the utilities outside of the ERCOT region remain vertically integrated
owning generation transmission and distribution assets as well as selling power to end-
use customers These vertically integrated utilities remain subject to traditional regulation
including rates set by the Commission and customer choice is not offered in the service
territories of these utilities
The Commission does continue to monitor ongoing activities in the non-ERCOT
portions of the state In 2015 the Legislature granted the Commission the authority to
retain counsel and consulting experts in order to participate in legal proceedings at the
Federal Energy Regulatory Commission (FERC) which has regulatory jurisdiction over
wholesale power sales and transmission rates outside of ERCOT This authority has
18 | P a g e
2017 SCOPE OF COMPETITION IN ELECTRIC MARKETS IN TEXAS REPORT
permitted the Commission to participate more effectively in FERC proceedings affecting
Texasrsquo utilities located outside of ERCOT
1 Southwest Power Pool
The Southwest Power Pool (SPP) is the Regional Transmission Operator (RTO) for
areas of Northeast Texas and the Texas Panhandle In Texas the utilities Southwestern
Electric Power Company (SWEPCO) Southwestern Public Service (SPS) and several
electric cooperatives and municipally owned utilities are in SPP In addition to these areas
of Texas the SPP footprint includes parts of New Mexico Arkansas Missouri Nebraska
Louisiana and all of Kansas and Oklahoma In 2015 SPP became the RTO for the
Integrated System and neighboring areas which includes parts of Iowa Minnesota North
Dakota South Dakota Wyoming and Montana SPP has spent extensive time and
resources over the last two years to integrate these new areas successfully The expansion
added 5000 MW of peak demand 7600 MW of generating capacity and 9500 miles of
transmission lines17
In 2014 SPP launched its new Integrated Marketplace which provides a Day-
Ahead Market a Real-Time Balancing Market and Congestion Hedging Markets
mechanisms similar to those available in ERCOT The implementation of the Integrated
Marketplace resulted in a savings of $422 million in 2015 As a result of the Integrated
Marketplace SPPrsquos planning reserve margin will be reduced from 136 to 12 a change
expected to save about $90 million annually
Chairman Donna L Nelson represents the Commission as a voting member on
SPPrsquos Regional State Committee (RSC) The RSC provides collective state regulatory
agency input on a variety of issues In addition the RSC has authority over the cost
allocation methodologies for transmission upgrades allocation of Financial Transmission
Rights and the approach used for resource adequacy across the SPP region The RSC
regularly meets on a quarterly basis and meets more frequently if necessary
2 Midcontinent Independent System Operator
The Midcontinent Independent System Operator (MISO) is an RTO that serves all
or part of 15 states in the central US one Canadian province and the portion of eastern
Texas served by the vertically integrated utility Entergy Texas Inc MISO provides a Day
Two market which has a variety of functions and services including energy and ancillary
service markets economic dispatch congestion management financial transmission rights
and transmission planning The MISO Independent Market Monitor concluded that the
MISO wholesale markets were competitive in 2015
Like SPP MISO is in the Eastern Interconnection which crosses state boundaries
and is therefore subject to FERC jurisdiction A number of recent FERC proceedings have
17 2015 Southwest Power Pool Annual Report Available at
httpswwwspporgdocuments37800201520southwest20power20pool20annual20reportpdf
19 | P a g e
2017 SCOPE OF COMPETITION IN ELECTRIC MARKETS IN TEXAS REPORT
affected the portion of Texas that is in the MISO footprint The Commission through
outside counsel has been an active party in such FERC proceedings FERC Docket No
ER14-1174 addressed in part a dispute regarding the availability of transmission capacity
under the Joint Operating Agreement between MISO and the SPP Ultimately FERC
approved a settlement agreement under which MISO will compensate SPP and its members
for using their or other entitiesrsquo transmission systems
In a related pending docket at FERC Docket No ER14-1736 parties are addressing
how the cost of these payments will be allocated among MISO market participants Parties
in this proceeding are engaged in settlement discussions In addition in Docket No ER14-
75-000 FERC approved a settlement agreement among the participating Entergy
Operating Companies and their retail regulators to terminate the Entergy System
Agreement effective August 31 2016 The settlement terms prohibit any post-termination
payments that roughly equalize production costs among the operating companies after
December 31 2015 terminate certain specific cross-purchase power agreements between
Entergy Texas and former Entergy Gulf State Louisiana and permit the continuation of
several other purchase power agreements
Commissioner Kenneth W Anderson Jr represents the Commission as a voting
member in the Organization of MISO States (OMS) the purpose of which is to coordinate
regulatory oversight among the states in the MISO region and to make recommendations
to MISO FERC and other entities Commissioner Anderson also represents the
Commission as a voting member of the Entergy Regional State Committee (ERSC) which
has certain FERC-approved authority for five years after the Entergy integration with
regard to cost allocation for Entergy transmission projects and adding transmission projects
to the Entergy construction plan The ERSC meets quarterly
3 Western Electricity Coordinating Council
The Western Electricity Coordinating Council (WECC) is a Regional Entity whose
region includes the area surrounding El Paso and extends from Canada to Mexico
including the provinces of Alberta and British Columbia the northern portion of Baja
California and all or portions of the 14 Western states in between WECC is the Regional
Entity responsible for Bulk Electric System reliability in the Western Interconnection and
associated compliance monitoring and enforcement WECC does not have organized
markets outside of California but is organized into 38 separate balancing authorities
WECC is geographically the largest and most diverse of the eight Regional Entities in the
United States with delegated authority from the North American Electric Reliability
Corporation (NERC) and the Federal Energy Regulatory Commission In Texas El Paso
Electric Company is a member of WECC
Rulemaking Activities
The Commission has continued to adopt new rules and modify existing rules in
order to further the continued successful operation of the competitive retail and wholesale
markets and to comply with statutory changes made to PURA by the Legislature This
20 | P a g e
2017 SCOPE OF COMPETITION IN ELECTRIC MARKETS IN TEXAS REPORT
section of the Report provides a high-level overview of the Commissionrsquos key rulemaking
activities highlighting the market improvements made in 2015 and 2016
1 Cost Recovery and Rate Adjustment
The Commission adopted new rule 16 TAC sect25246 on June 29 2016 to
implement Section Nos 1 through 3 of House Bill 1535 of the 84th Legislature The new
rule only applies to a utility that operates solely outside of ERCOT and allows for the use
of an update period beyond the test year for which the utility initially files estimated
information The rule clarifies that all information originally estimated must be updated
with actual information and also provides requirements for a post-test-year adjustment for
a natural gas-fired plant A non-ERCOT utility also is required to initiate a new base rate
case on or before the four year anniversary of the final order in the utilityrsquos most recent comprehensive base rate case or if the commission determines that the utility has
materially earned more than its authorized rate of return in two consecutive years The rule
also provides requirements and procedures for the relation back of final rates to an effective
date 155 days after the filing of the rate application
2 Changes to Certificates of Convenience and Necessity and CREZ Rule
The Commission conducted a rulemaking to implement changes pursuant to
Legislative mandates in SB 776 SB 933 and HB 1535 of the 84th Legislature SB 776
required municipally owned utilities to apply for a certificate of convenience and necessity
(CCN) before constructing transmission facilities outside the boundaries of the
municipality that owns the municipally owned utility SB 933 also requires persons to
obtain a CCN before interconnecting a tie line into the ERCOT grid HB 1535 requires the
Commission to issue a final order within 181 days for a non-ERCOT utility requesting a
CCN for an existing electric generating facility and 366 days after a non-ERCOT utility
files a CCN for a newly constructed generating facility In addition the Commission also
determined in this rulemaking that all future transmission projects in a Competitive
Renewable Energy Zone (CREZ) must meet the need criteria of PURA sectsect 37056(c)(1)
and (2) rather than being exempt Finally the Commission determined that the CREZ
project established in 2008 was complete following the installation of a second circuit on
a Sharyland line
3 Use of Handheld Device for Enrollment
As the market evolves the Commission evaluates market changes balancing its
desire to encourage customer-focused innovation with its concern for customer protection
against potential abuses In Docket No 44518 the Commission granted a REP a
temporary 12-month waiver from its rules requiring the marketer to obtain telephonic
verification of the customerrsquos desire to switch REPs as well as a waiver from certain authorization disclosure requirements among other stipulations the Commission placed
upon the REP The Commission then opened Project No 45625 to study the issue of REPs
utilizing hand-held devices for customer enrollment more broadly and engage with market
representatives consumer representatives and other stakeholders The Commission
anticipates considering an amendment to its rules in the spring of 2017
21 | P a g e
2017 SCOPE OF COMPETITION IN ELECTRIC MARKETS IN TEXAS REPORT
4 Smart Meter Texas Portal
The electric utilities in Texas that have advanced metering systems (AMS) jointly
own and operate a single web portal known as Smart Meter Texas (SMT)18 SMT fulfills
two requirements imposed by the Commissionrsquos advanced metering rule on a utility with
AMS (1) provide to the retail customer the REP serving the customer and other entities
authorized by the customer access to such retail customerrsquos consumption data and (2)
allow devices at the customerrsquos premises to communicate through a home area network with the advanced meter at the premises SMT also facilitates near real-time on-demand
reads of a customerrsquos meter that aids prepaid service offered by certain REPs
In Project No 42786 Review of Advanced Metering System Web Portal
Commission staff and stakeholders examined options for the long-term operational
structure governance and funding of SMT The Commission determined that ownership
of SMT should remain with the TDUs because they can operate the portal at a lower cost
than transferring the data repository to ERCOT The Commission opened two
rulemakings one to ascertain the appropriate governance performance and funding of
SMT and a second to determine the appropriate access for third parties ensuring that
customers have the freedom to grant and give third parties access to their data if made
knowingly while also securing customer privacy
Sharyland Utilities
In early 2015 customers of Sharyland Utilities the smallest investor-owned
transmission and distribution utility in ERCOT began to file with the Commission a
significant number of complaints regarding high electricity bills In response the
Commission opened Project No 44592 Relating to a Project Regarding Sharyland
Utilities to provide for a more formal process for Commission review of the large number
of complaints As part of this project Commission staff prepared a report to evaluate the
electricity rates and electric bills in the operating area of Sharyland Utilities that was
previously part of Cap Rock Energy
Staffrsquos report found that a number of factors contributed to the comparatively high
bills for many of Sharyland-Cap Rockrsquos customers First Sharylandrsquos small size and its low customer density result in high TDU rates for all customers relative to other TDUs In
particular Staffrsquos report found that Sharyland-Cap Rockrsquos rates for distribution service are
up to three times higher than those of other TDUs in Texas In addition to Sharyland-Cap
Rockrsquos high costs for distribution service higher wholesale transmission costs also
contributed to the rate increases charged to Sharyland-Cap Rockrsquos customers These transmission costs are the result of increased transmission investment in recent years
throughout Texas that has increased transmission costs for all distribution providers
18 The participating Texas TDUs are AEP Texas Central Company and AEP Texas North Company (jointly
ldquoAEPrdquo) CenterPoint Energy Houston Electric LLC (ldquoCenterPointrdquo) Oncor Electric Delivery Company LLC (ldquoOncorrdquo) and Texas-New Mexico Power Company (TNMP) collectively referred to as the ldquoJoint TDUsrdquo Operation of an AMS web portal was addressed in the orders approving particular utilitiesrsquo deployment of AMS and approving surcharges for AMS cost recovery While Sharyland Utilities filed comments in the proceeding it did not
participate as it had not fully completed its AMS deployment at the time
22 | P a g e
2017 SCOPE OF COMPETITION IN ELECTRIC MARKETS IN TEXAS REPORT
including Sharyland Utilities Second the comparatively colder winter of 2014 ndash 2015
which was the time period generally consistent with the timeframe in which the
Commission began receiving complaints appeared to result in higher electricity usage than
normal This combination of high TDU rates and the higher electricity usage led to higher
bills for customers
Staffrsquos report also noted that in Sharyland-Cap Rockrsquos last rate case in 2014 the
approved rates reflected movement towards more cost-based rates for all customers
including some customers that previously had been heavily subsidized by other customers
Additionally in the process of standardizing Sharyland-Cap Rockrsquos customer classification
with the classifications of the other TDUs in Texas some customers may have experienced
a move from one class that previously was paying below-cost rates to another class that
was now paying above-cost rates For some of these customers the combined effects of
the movement towards cost-based rates and the change to a different class may have
contributed to a significant change in the customersrsquo rates Regardless of any cost-shifting
between customer classes Sharylandrsquos rates remain two to three times higher than those of other TDUs in Texas for all customers in all classes
On December 4 2015 the Commission signed an order directing Sharyland to file
an application for a comprehensive rate review by April 30 2016 Sharyland filed its rate
application on April 29 2016 in Docket No 45414 Review of the Rates of Sharyland
Utilities LP On October 10 2016 the Commission ordered Sharyland to file an amended
application as soon as practicable but no later than January 1 2017 to reflect the unique
aspects of the companyrsquos organizational structure as a real estate investment trust (REIT) At the time of publication Sharyland is expected to file its amended application in
December 2016
PowerToChoose Website
As part of its ongoing evaluation of the competitive market the Commission
opened Project No 45730 to evaluate the functionality and usability of its PowerToChoose
website which allows customers to select a REP and an electric plan based on their zip
code In the process the Commission received significant feedback from customers stating
that the Commissionrsquos PowerToChoose website was an important tool that plays a
fundamental role in their shopping process In response to the feedback received from
industry representatives and consumers Commission staff changed how the website sorts
and filters retail electric plans adding a filter to allow customers to unselect plans that
contain minimum usage fees or credits This filter is now a default setting and plans with
minimum usage fees and credits are not shown unless the customer actively selects to
search for such plans In addition Commission staff made other changes to increase the
clarity of the REP complaint rating The Commission continues to evaluate other changes
to improve the customer experience of the PowerToChoose website and provide
transparency for retail electric plans
23 | P a g e
2017 SCOPE OF COMPETITION IN ELECTRIC MARKETS IN TEXAS REPORT
Report on Alternative Ratemaking Mechanisms
In 2015 the Legislature enacted SB 774 which requires the Commission or its
consultant to conduct a study and make a report to the Legislature analyzing the alternative
ratemaking mechanisms adopted by other states In addition SB 774 extended the
authorization for the Periodic Rate Adjustment (PRA) mechanism from 2017 to 2019
which the Legislature had authorized in 2011 (SB 1693) as a version of an alternative
ratemaking mechanism that provides to utilities a means for expedited recovery of
distribution infrastructure costs Pursuant to SB 774 the Commission retained a consultant
to produce the report and the consultantrsquos recommendations included streamlining the ratemaking process to reduce procedural costs providing for a periodic review of the
prudency of the costs and using certain types of alternative ratemaking mechanisms that
decouple the recovery of costs from variations in load The Commission held a public
hearing to receive comments on the report from stakeholders and after consideration of
those comments has provided to the Legislature the consultantrsquos report together with its
own discussion of the report
Request for Purchase of Oncor Electric Delivery Company
In March 2016 the Commission approved with conditions an application by an
investor group led by Hunt Consolidated Inc the owners of Sharyland Utilities to acquire
control of Oncor Electric Delivery Company (Oncor) the largest transmission and
distribution utility in Texas from Oncorrsquos parent company Energy Future Holdings which
is in bankruptcy The Commission approved the request subject to certain conditions
including stipulations regarding the organization of the new entities and treatment of tax
benefits The investor-led group subsequently declined to pursue the transaction that was
approved by the Commission
In September 2016 NextEra Energy which owns Florida Power amp Light received
approval from the United States Bankruptcy Court in Delaware for its plan to purchase
Oncor In October 2016 NextEra Energy filed an application with the Commission in
Docket No 46238 for approval of the proposed transaction The Commission will evaluate
the application to determine if the transaction is in the public interest
Integration of Lubbock Power and Light
In March 2016 the Commission opened Project No 45633 to study and identify
the issues related to the request of Lubbock Power and Light the statersquos third-largest
municipally owned utility to be integrated into ERCOT The Commission is currently
working with stakeholders ERCOT and SPP to determine the cost and benefits of any
potential switch by Lubbock Power and Light into ERCOT and whether such a switch is
in the public interest
24 | P a g e
2017 SCOPE OF COMPETITION IN ELECTRIC MARKETS IN TEXAS REPORT
Desalination Project ERCOT Studies
In 2015 the Legislature passed HB 4097 which directed the Commission and
ERCOT to study whether existing transmission and distribution planning processes are
sufficient to provide adequate infrastructure for seawater desalination projects and to study
the potential for desalination projects to participate in demand response opportunities in
the ERCOT market Pursuant to that direction ERCOT staff have prepared a report on the
feasibility of interconnection of large desalination projects and on opportunities for such
projects to participate in ERCOTrsquos demand response programs which is attached to this Report in Appendix B
Oversight and Enforcement Actions
The Commissionrsquos enforcement of statutes rules and orders applicable to entities
under its jurisdiction serves to protect consumers the electric markets the reliability of the
electric grid and to promote fair competition The Commissionrsquos enforcement efforts in the electric industry focus on violations of PURA the Commissionrsquos rules and ERCOT
protocols
During the period from January 2015 through August 31 2016 the Commission
assessed $3258500 in penalties against electric market participants Table 8 provides a
summary of electric industry Notices of Violation since January 2015 During 2015 and
2016 Commission staff opened 212 investigations for the electric industry and closed 177
investigations
Table 8 Notices of Violations
Violation Type Total Penalty Amount
Retail Market Violations $539000
Service Quality Violations $451500
Wholesale Market Violations $2268000
TOTAL $3258500
In addition to the imposition of administrative penalties the Commission uses other
enforcement mechanisms in exercising its enforcement duties including revoking a
companyrsquos certificate to operate In addition some companies may be required to relinquish a certificate as part of a settlement after enforcement action has proceeded
Table 9 provides a breakdown of the number of certificates revoked or relinquished In
2016 the Commission revoked the certificate of the REP TruSmart Energy
Table 9 Certificates Revoked or Relinquished
Type Number
Certificates Revoked 1
Certificates Relinquished 0
25 | P a g e
2017 SCOPE OF COMPETITION IN ELECTRIC MARKETS IN TEXAS REPORT
The Oversight amp Enforcement division also issues warning letters to companies in
the electric market when it determines that a violation occurred but given the
circumstances surrounding the violation and other mitigating concerns no administrative
penalty is warranted During 2015 and 2016 the Oversight amp Enforcement division issued
50 warning letters Finally the Commission generally seeks to reimburse money directly
to customers when appropriate In 2015 and 2016 the Commission ordered the
reimbursement of $8543596 to Texas electric customers
Table 10 Warning Letters
Warning Letter Type Number
Retail Market Warning Letter 8
Service Quality Warning Letter 1
Wholesale Market Warning Letter 41
TOTAL 50
In addition to its enforcement activities the Commission also enters into voluntary
mitigation plans with generators that request one through a contested case proceeding
pursuant to PURA sect15023(f) and 16 TAC sect25504(e) The Commission entered into one
voluntary mitigation plan during 2015 and 2016 in Docket No 44635
Low-Income Discount System Benefit Fund
The System Benefit Fund (SBF) was originally established in 1999 to fund
discounts to low-income customers customer education activities energy-efficiency and
weatherization and electric market oversight through a nonbypassable surcharge on retail
electric bills HB 1101 of the 84th Legislature provided that the SBF be sunset on
September 1 2017 by which time the SBF is intended to be exhausted In the 2016 Fiscal
Year (FY) $325521250 was appropriated in the SBF to provide a 25ndash31 percent discount
to low-income customers over a 12-month period
To assist the drawdown of the remaining balance HB 1101 authorized the
Commission to use any unexpended SBF balance in FY 2017 to assist low-income
customers The Commission estimates that the remaining SBF balance will be
approximately $17 million by August 31 2017 The Commission has determined that this
amount is insufficient to fund the rate reduction program however the Commission will
spend approximately $100000 to continue automatic enrollment in the program to provide
REPs a list of customers eligible to receive late fee waiver and deposit installment benefits
These two ancillary benefits of the rate reduction program will continue for the duration of
FY 2017
26 | P a g e
2017 SCOPE OF COMPETITION IN ELECTRIC MARKETS IN TEXAS REPORT
Homeland Security
The Commission assesses the efforts of ERCOT and utilities to defend against
mitigate and respond to the variety of risks that the modern electricity system faces The
Commission also meets with ERCOT utilities and governmental entities on an ongoing
basis to discuss preparation for everything from hurricanes and other severe weather to
cyber-threats and threats of physical damage to the grid from accidents or intentional
malfeasance In addition the Commission monitors industry and federal programs that
address homeland security issues
The Commission serves as an information liaison between state government and
electric utilities during emergencies The Commissionrsquos main roles include
Conveying outage and service restoration information from electric utilities to
state government
Conveying service restoration priorities (hospitals water treatment facilities
etc) from state government to electric utilities and
Facilitating the clearance of downed power lines in disaster re-entry areas and
facilitating entry of electric utilities into disaster areas
The Commissionrsquos Emergency Management Response Team (EMRT) provided staff at the
State Operation Center for the May 2015 and April 2016 flooding events in Texas as well
as additional staffing for severe winter weather
Demand Response
ERCOT staff have begun to report annually on the participation of customers in
REP-sponsored demand response programs These programs which have been facilitated
by the deployment of smart meters throughout the competitive areas within ERCOT and
by many municipal and cooperative electric utilities take the form of rebates for reduction
in usage during peak period time-of-use pricing real-time volumetric price compensation
for load reduction and direct control of customer load among other plans
These programs have seen dramatic increases in participation since ERCOT began
to gather this information in 2013 From 2013 to 2014 the number of residential customers
participating in these programs increased from 151793 to 721273 and the number of
commercial and industrial customers participating rose from 30275 to 50205 The
Commission continues to monitor ERCOTrsquos stakeholder process for efforts relating to the integration of demand response
27 | P a g e
2017 SCOPE OF COMPETITION IN ELECTRIC MARKETS IN TEXAS REPORT
IV LEGISLATIVE RECOMMENDATIONS
A Determination of Low-Income Customer Eligibility
In 2015 HB 1101 required that all remaining funds in the System Benefit Fund
(SBF) be expended that the fee that funded the program as a nonbypassable surcharge on
electric bills be set at zero and that the SBF be sunset on September 1 2017 Per the
provisions of HB 1101 the SBF fee was set at zero in September 2016 concluding the
funding for the program The sunset of the SBF program also concluded the relationship
between the Texas Health and Human Services Commission (HHSC) and the Commission
in which the HHSC provided to the Commission eligible electric customers for the SBF
low-income discount Because of the termination of the relationship with HHSC with the
termination of the SBF the Commission will no longer be able to determine easily an
electric customerrsquos eligibility for other low-income programs such as late penalty waivers
and the option of paying an electric deposit over multiple months
The Legislature may wish to consider easing low-income customers access to these
low-income programs by facilitating the process used to determine eligibility The
Commission offers four possible approaches in which the Legislature could continue these
low-income programs
(1) Authorize HSSC to provide identification of eligible low-income customers to the
Commission
(2) Allow retail electric providers (REPs) to provide such low-income programs using
the Low Income Discount Administratorrsquos (LIDA) Telecommunications Lifeline
Service Program list to identify low-income customers
(3) Require REPs to offer such low-income programs with customers self-enrolling
and REPs verifying income eligibility or
(4) Allow REPs to voluntarily provide such low-income programs at their own
discretion
B Outside Counsel for Proceedings before Regional Transmission
Organizations
Regional Transmission Organizations (RTO) manage the power grid across wide
regions of the United States Most of Texas is inside the ERCOT region however there
are significant portions of East Texas and the Panhandle that are in the Midcontinent
Independent System Operator (MISO) and the Southwest Power Pool (SPP) Issues arise
in these other RTOs that have significant impact on Texas ratepayers such as how
transmission infrastructure costs will be shared These tend to be very lengthy and
complicated proceedings that require specialized legal and consulting services
28 | P a g e
2017 SCOPE OF COMPETITION IN ELECTRIC MARKETS IN TEXAS REPORT
PURA sect 394525 currently authorizes the Commission to use outside consultants
auditors engineers or attorneys to represent the Commission in proceedings before the
Federal Energy Regulatory Commission This provision has been an important tool for the
Commission to respond to complex matters in the federal arena to enable it to protect the
public interest in Texas The PUC recommends that the Legislature expand the language
in this statute to include the ability to hire outside assistance for proceedings before other
RTOs to provide those same protections to Texas ratepayers in those areas
C Repeal of Natural Gas and Renewable Energy Mandates
1 Natural Gas
PURA sect 399044 establishes natural gas as ldquothe preferential fuelrdquo in Texas for electricity generation and requires the Commission to adopt rules to establish a system of
natural gas energy trading credits The majority of all new non-renewable electricity
generation constructed since 2000 for Texas has used natural gas as a primary fuel and this
trend is expected to continue in the foreseeable future The thresholds used to trigger the
natural gas energy trading credit system in PURA sect 399044 have not been reached and
they are not expected to be reached in the foreseeable future
Because natural gas-fueled facilities have been the most commonly built new
generation in Texas for many years and are expected to continue to be there is no need to
establish incentives for natural gas generation The PUC recommends that the Legislature
consider repealing PURA sect 399044 because it is no longer necessary
2 Renewable Energy
PURA sect 39904 establishes goals for renewable energy Subsection (a) requires
the installation of 5880 megawatts of renewable energy by 2015 and Subsection (b)
establishes a renewable energy credits trading program to implement the requirement The
5880 megawatts mandates in Subsection (a) was met in 2008 While the Commission
believes the renewable energy trading credit program is needed for retail electric providers
to validate renewable energy marketing claims the Commission believes the 5880
megawatts mandate in Subsection (a) is no longer necessary
D Advisory Opinions
Many regulatory agencies in Texas have authority to issue informal guidance to the
persons they regulate particularly with respect to outlining whether a particular course of
conduct would in the agencyrsquos view be consistent with the laws and regulations that the agency administers19 The issuance of an advisory opinion can provide regulatory clarity
to a company before making investments or conducting operations the permissibility of
which may be unclear under state law The Legislature may want to consider granting the
19 In addition certain federal agencies such as the Federal Communications Commission
Internal Revenue Service Securities and Exchange Commission and Federal Election
Commission have authority to issue advisory opinions
29 | P a g e
2017 SCOPE OF COMPETITION IN ELECTRIC MARKETS IN TEXAS REPORT
Commission the authority to issue advisory opinions In the electric industry providing
clarification to a company concerning issues such as the purchase of assets or the
acquisition of another company could allow it to avoid expensive regulatory proceedings
without impairing the Commissionrsquos authority The following state agencies have statutory authority to issue advisory opinions
Texas Ethics Commission20
Texas Medical Board21
State Board of Dental Examiners22
Texas Board of Nursing23
Texas Board of Professional Engineers24
Texas Lottery Commission and25
Texas Securities Board26
E Administrative
Gross Receipts Assessment
PURA sect 16001 provides for a gross receipts assessment that is used to defray the
expenses incurred by the Commission to administer PURA An assessment of one sixth of
one percent is collected from public utilities electric cooperatives retail electric providers
and interexchange carriersrsquo gross receipts from consumers The funds from this assessment
are remitted to the general revenue fund but currently they have not been explicitly
dedicated to funding of the Commission In contrast similar assessments on water
utilities insurance companies and other regulated entities have traditionally been used to
explicitly fund the underlying regulatory programs at the respective agencies The
Commission is one of four Article VIII agencies that is not designated as self-funded
The Commission recommends that the Legislature designate the Commission as a
self-funded agency whereby the collected assessments would be explicitly dedicated to the
funding of the agency Implementing this recommendation would require the Public Utility
Commission to be included in the Appropriations Limited to Revenue Collections rider
located in the Special Provisions Relating to All Regulatory Agencies section of the
General Appropriations Act Designation as a self-leveling agency would require the
Commission to set the gross receipts assessment at a rate sufficient to generate revenue in
the amount of the agencyrsquos general revenue appropriation each fiscal year which would require a statutory change to PURA sect16001(b) Based upon the Commissionrsquos baseline budget request authorizing the PUCrsquos self-leveling designation would result in an overall
estimated tax reduction of $456 million per year or 774
20 Government Code sect 571091 21 Occupations Code sect 162107 22 Occupations Code sect 258157 23 Occupations Code sect 301607 24 Occupations Code sect 1001601 25 Occupations Code sect 2001059 26 Tex Rev Civ Stat Ann Arts 581-28-1 amp 581-35 7 Tex Admin Code 1012
30 | P a g e
2017 SCOPE OF COMPETITION IN ELECTRIC MARKETS IN TEXAS REPORT
V APPENDICES
31 | P a g e
2017 SCOPE OF COMPETITION IN ELECTRIC MARKETS IN TEXAS REPORT
Appendix A ndash Acronyms
AEP American Electric Power
AMS Advanced Metering System
CenterPoint CenterPoint Energy Houston Electric LLC
DG Distributed Generation
DRG Distributed Renewable Generation
ERCOT Electric Reliability Council of Texas
ERSC Entergy Regional State
ERS Emergency Response Service
ETI Entergy Texas Inc
IMM ERCOT Independent Market Monitor
kWh Kilowatt-hour
LMP Locational Marginal Pricing
LSP Large Service Provider
MISO Midwest Independent System Operator
MMBtu One million British Thermal Unit (BTU)
MW Megawatt
MWh Megawatt-hour
Nodal Texas Nodal Market Design
ORDC Operating Reserve Demand Curve
PGC Power Generation Company
POLR Provider of Last Resort
PURA Public Utility Regulatory Act
REP Retail Electric Provider
RSC Regional State Committee
RTO Regional Transmission Organization
SCED Security Constrained Economic Dispatch
Sharyland Sharyland Utilities LP
SBF System Benefit Fund
SPP Southwest Power Pool
TDU Transmission and Distribution Utility
TNMP Texas-New Mexico Power Company
32 | P a g e
2017 SCOPE OF COMPETITION IN ELECTRIC MARKETS IN TEXAS REPORT
Appendix B ndash ERCOT Desalination Report
This page intentionally left blank
33 | P a g e
ERCOT Public
Study on the Demand Response Potential for Seawater Desalination Projects
ERCOT November 18 2016
Study on the Demand Response Potential for Seawater Desalination Projects ERCOT Public
Executive Summary
In 2015 the 84th Texas Legislature enacted House Bill (HB) 4097 which included several provisions relating to seawater desalination projects including a requirement that the Public Utility Commission of Texas (PUC) and Electric Reliability Council of Texas (ERCOT) study the potential for seawater desalination projects to participate in existing demand response opportunities in ERCOT There are several demand response products in which demand-side resources (ie consumers of electricity) can participate These programs help to preserve system reliability and provide economic benefits to participating demand-side resources Seawater desalination is an energy-intensive process that removes salt and other minerals from salt water to produce fresh water for municipal consumption industrial use or irrigation Participation in demand response could help mitigate electricity costs for future seawater desalination projects in Texas and provide reliability benefits to the grid
There are two main demand response reliability-based services administered by ERCOT participation by demand-side resources in the Ancillary Services market and the Emergency Response Service (ERS) Within the Ancillary Services market the most common service provided by demand-side resources is Responsive Reserve Service (RRS) which requires resources to respond either instantaneously or within 10 minutes in response to unplanned system emergencies ERS is separate from ERCOTrsquos Ancillary Services market and allows demand-side resources and distributed generation to provide reliability services in the event of an energy emergency Resources can qualify for either the 10-minute or 30-minute response time ERS programs
There are several key considerations that will impact a demand-side resourcersquos ability to participate in different demand response opportunities response time recovery time predictability of electrical demand and flexibility of operations Considering these factors together it appears that seawater desalination plants could be designed to meet the requirements for participation in demand response Because the ability to meet the qualification requirements is dependent on the plant design demand response opportunities should be considered early in a projectrsquos development if participation is desirable
Whether project developers will choose to address these requirements will depend on the economic benefits of participation There may be additional costs to design seawater desalination plants to operate in the manner required in order to participate in demand response These include costs associated with additional plant design specifications need for excess capacity and storage to make up for lost production during demand response deployment operational costs resulting from interruptions to plant processes and potential financial penalties if demand response deployment results in failure to meet contract demands The interplay of the benefits of participation and these costs will determine whether it would be beneficial for a future seawater desalination plant to participate in demand response in ERCOT
To date participation of seawater desalination plants in demand response programs has been limited Because the process of seawater desalination is energy-intensive participation in demand response could help to reduce electricity costs while posing a relatively low risk to plant operations As stakeholders in Texas continue to plan for possible future droughts in the region and identify water management strategies consideration of demand response could play a role in mitigating some costs associated with seawater desalination and allow seawater desalination plants to assist with maintaining electric reliability in the region
copy 2016 ERCOT All rights reserved i
Study on the Demand Response Potential for Seawater Desalination Projects ERCOT Public
Table of Contents
1 Introduction 1
2 Seawater Desalination 2
21 Seawater Desalination Plant Operations 2
22 Seawater Desalination Plant Economics 3
3 Demand Response Opportunities in ERCOT 4
31 ERCOT-Dispatched Demand Response 4
311 Ancillary Services Markets 5
312 Emergency Response Service (ERS) 5
32 Non-ERCOT-Dispatched Demand Response 6
321 Four Coincident Peak (4CP) 6
322 LSE or DR Provider Contracted Price Response 6
323 Self-Directed Price Response 6
4 Demand Response Potential for Seawater Desalination 7
41 Operational Considerations for ERCOT-Dispatched Demand Response 7
42 Economic Considerations for ERCOT-Dispatched Demand Response 8
43 Considerations for Non-ERCOT-Dispatched Demand Response 9
5 Conclusion 11
copy 2016 ERCOT All rights reserved ii
Study on the Demand Response Potential for Seawater Desalination Projects ERCOT Public
1 Introduction
In 2015 the 84th Texas Legislature enacted House Bill (HB) 4097 which included several provisions relating to seawater desalination projects including a requirement that the Public Utility Commission of Texas (PUC) and Electric Reliability Council of Texas (ERCOT) study the potential for seawater desalination projects to participate in existing demand response opportunities in ERCOT ERCOT and the PUC initiated this study to fulfill that requirement and evaluated the operational and economic characteristics of seawater desalination plants in light of ERCOTrsquos primary demand response products1
ERCOT is the independent system operator (ISO) for the ERCOT Interconnection which encompasses approximately 90 of demand for electricity in Texas ERCOT is the independent organization established by the Texas Legislature to be responsible for the reliable planning and operation of the electric grid for the ERCOT Interconnection ERCOT also administers and maintains a forward-looking open market to provide affordable and reliable electricity to consumers in Texas In collaboration with market participants ERCOT has developed demand response products and services for customers that have the ability to reduce or modify electricity use in response to instructions or signals These programs help preserve system reliability and provide economic benefits to participating demand-side resources
The process of seawater desalination removes salt and other minerals from salt water to produce fresh water for consumption industrial processes or irrigation The drought-prone Texas climate coupled with projections for increasing water demand in the state has created interest in seawater desalination as a future water source The 2017 Texas State Water Plan includes seawater desalination as a future water management strategy for water users in the state However the seawater desalination process is energy intensive and electricity consumption can be a significant cost driver for these projects To the extent that these plants could participate in demand response it would help to defray these costs Thus there is a potential nexus between seawater desalination projects built in Texas to mitigate drought but which have large electricity requirements and ERCOT demand response opportunities which could help to reduce their electricity costs and provide reliability benefits
This study evaluates the demand response potential of seawater desalination plants based on their operational characteristics and economic drivers The report is organized as follows
Section 2 provides background on typical seawater desalination plant operations and economics
Section 3 describes the current demand response opportunities in ERCOT
Section 4 evaluates the characteristics of seawater desalination plants to determine their potential to participate in demand response opportunities in ERCOT and
Section 5 provides a summary of the conclusions of this study
1 In the course of developing this report ERCOT consulted with several desalination experts with experience with existing or planned seawater desalination plants in the US The technical experts consulted included Jorge Arroyo (Water Management Consultant) Andrew Chastain-Howley (Black amp Veatch) Jonathan Loveland (Black amp Veatch) Ron Parker (Black amp Veatch) John Wolfhope (Freese and Nichols) and Srinivas Veerapaneni (Black amp Veatch)
copy 2016 ERCOT All rights reserved 1
Study on the Demand Response Potential for Seawater Desalination Projects ERCOT Public
2 Seawater Desalination
There are two primary methods for seawater desalination distillation (also referred to as ldquothermalrdquo) and reverse osmosis Distillation uses heat to remove salts and minerals from seawater by boiling water at high pressures In contrast reverse osmosis technology forces saline water through a membrane to separate water from the salts and minerals While both distillation and reverse osmosis are energy intensive distillation requires thermal energy to heat the water and overall has a higher energy requirement whereas reverse osmosis requires primarily electrical energy and overall is less energy intensive ndash though still with significant electricity requirements
Globally most thermal desalination plants are located in the Middle East due to low energy prices in the region Plants located elsewhere including in the US typically use reverse osmosis technology2 There are two large existing seawater desalination plants in the US one in Carlsbad California providing water to the San Diego area and one in Gibsonton Florida providing water to the Tampa Bay area Both plants use reverse osmosis technology In addition there are several desalination projects currently in the planning stages or under development in Texas in the Corpus Christi area that would use reverse osmosis technology For that reason this report focuses on reverse osmosis technology in the evaluation of demand response potential of seawater desalination plants
While there are currently no existing seawater desalination plants in Texas there are several municipal and industrial brackish water desalination plants in the state According to the Texas Water Development Board (TWDB) there are 46 municipal brackish water desalination plants with capacities greater than 0025 million gallons per day (MGD) in Texas representing a total of 123 MGD of capacity3 The desalination of brackish water is typically less expensive compared to seawater due to the lower relative salinity of brackish water This study focuses exclusively on seawater desalination consistent with the requirements of HB 4097 but it should be noted that conclusions may also apply to brackish water desalination though at a different cost and scale
This section provides high-level information on the operations (Section 21) and economics (Section 22) of seawater desalination plants to inform the discussion of their demand response potential in Section 4
21 Seawater Desalination Plant Operations Seawater desalination plants typically range in capacity from less than 5 MGD up to 165 MGD For example the Carlsbad seawater desalination plant has a capacity of approximately 50 MGD and the plant in Tampa Bay has a capacity of approximately 25 MGD The associated electricity consumption ranges between 10 and 15 kWh1000 gallons produced depending on the salinity of the water being processed456 More saline water (eg seawater) requires larger amounts of electricity for desalination Thus a seawater desalination plant would have larger electricity consumption requirements compared to a similarly sized brackish water desalination plant
2 American Water ldquoInnovation Solutions within the Water Industry Desalinationrdquo Available at httpwwwamwatercomfilesInnovationsSolutionsWithinTheWaterIndustryDesalinationpdf 3 Texas Water Development Board ldquoDesalination Factsrdquo Available at httpswwwtwdbtexasgovinnovativewaterdesalfactsasp 4 American Membrane Technology Association April 2016 ldquoMembrane Desalination Power Usage Put in Perspectiverdquo Available at httpwwwamtaorgcomwp-contentuploads7_MembraneDesalinationPowerUsagePutInPerspectivepdf 5 Water Reuse Association November 2011 ldquoSeawater Desalination Power Consumptionrdquo Available at httpswatereuseorgwpshycontentuploads201510Power_consumption_white_paperpdf 6 Ghaffour N TM Missimer and G Amy January 2013 ldquoTechnical review and evaluation of the economics of water desalination Current and future challenges for better water supply sustainabilityrdquo Desalination 309 pp197-207 Available at httpswwwresearchgatenetpublication256693140_Technical_review_and_evaluation_of_the_economics_of_water_desalination_ Current_and_future_challenges_for_better_water_supply_sustainability
copy 2016 ERCOT All rights reserved 2
Study on the Demand Response Potential for Seawater Desalination Projects ERCOT Public
While the two existing seawater desalination plants in the US were co-located with power plants to ease compliance with regulations on water intake and discharge structures and reduce costs many other reverse osmosis desalination plants receive their electricity from the grid However plants may have on-site backup generation in case of a power outage This will vary depending on the size and design of the plant and other factors For example the Carlsbad plant in California does have diesel backup generation to power control systems and flushing systems in the case of a power outage The plant in Tampa Bay was not built with backup power due to potential storm surge risks from hurricanes and other storms The plant does use uninterruptible power supply (UPS) backup to power control systems during power outages
Reverse osmosis plants are typically designed with several ldquotrainsrdquo which consists of a high-pressure pump turbine and reverse osmosis membrane Desalination plants are turned on or off one train at a time in a highly controlled process The process of ramping up or down an individual train under normal operations typically takes one to two hours While plants can be designed to handle immediate shutdowns (ie in a power outage) re-starting a system after an interruption would take this amount of time In addition the saline water must be pretreated (ie filtered) before going through the reverse osmosis train and this can sometimes pose constraints on the flexibility of operations
Demand for water is the key factor driving the level of production at seawater desalination plants Typically the plant will have a contract or contracts with municipal or other water users to deliver desalinated water and is operated to meet that demand Alternatively if the plant is municipally owned it would similarly be operated to meet the level of water demand in conjunction with other available water sources If water demands are close to a plantrsquos full capacity the operatorrsquos flexibility to adjust its electricity consumption as part of demand response may be limited However this does mean that plant operations are fairly predictable on a day-to-day basis which is necessary for participation in demand response
The amount of flexibility in plant operations will also be impacted by the amount of water storage available For example if a plant has sufficient water storage on-site or storage within the customerrsquos distribution system it could provide flexibility for the plant to reduce its operations during peak hours when electricity prices are likely to be highest It would also mitigate the impacts of interruptions to production from demand response deployments
22 Seawater Desalination Plant Economics Seawater desalination is typically more expensive than other sources of water and a major driver of the overall cost is energy costs In 2016 the Carlsbad plant charged rates at between $2131 and $2367 per acre-foot78 This charge is intended to cover both the fixed costs of the plant and the variable costs to produce a unit volume of water Typically half to two thirds of the cost of providing desalinated seawater are accounted for by capital cost recovery with the remainder accounted for by operations and maintenance costs including electricity costs Electricity costs can account for 20shy25 of the total costs of seawater desalination with reverse osmosis technology9
Factors affecting the capital cost of a seawater desalination plant include plant size type of desalination process and pre-post-treatment technologies plant infrastructure (eg piping water storage backup power) and compliance with applicable regulations (eg regulations on intake structures brine byproduct disposal) A significant driver of operating and maintenance costs is membrane replacement Reverse osmosis membranes need to be replaced every few years and
7 Source San Diego County Water Authority ldquoSeawater Desalinationrdquo Available at httpwwwsdcwaorgseawater-desalination 8 Note that 1 acre-foot is approximately 325851 gallons 9 Based on technical input from Black amp Veatch
copy 2016 ERCOT All rights reserved 3
Study on the Demand Response Potential for Seawater Desalination Projects ERCOT Public
the rate at which they are replaced will depend on the salinity of the feedwater and how the plant is operated Treatment and disposal of the salty brine byproduct from desalination may also incur operating costs
Electricity costs will vary depending on a range of factors including the size of the plant type of desalination technology source of electricity and quality of the feedwater As previously noted more saline water requires higher amounts of electricity in desalination and thus the amount of electricity consumption is a key difference between brackish water and seawater desalination As a result electricity costs comprise a significant share of the costs of seawater desalination These costs could potentially be defrayed in part by participation in demand response initiatives
3 Demand Response Opportunities in ERCOT
Broadly speaking demand response can be broken down into two major categories dispatchable or non-dispatchable For purposes of this report we will define dispatchable as those demand response events that are initiated by ERCOT and non-dispatchable as an event not specifically initiated by ERCOT These non-dispatchable events may include decisions made by the end-use customer to alter its consumption pattern or may include contractual obligations with another entity such as the end-use customerrsquos retail electric provider (ldquoREPrdquo) to alter consumption patterns
ERCOTrsquos wholesale market is open to several types of dispatchable demand response which are deployed to maintain system reliability Demand-side resources providing Emergency Response Service (ERS) may offer based on either a 10 or 30-minute response time commonly referred to as the ldquoramp periodrdquo Alternatively demand-side resources may register and qualify as a Load Resource that can provide Reserves in the Ancillary Services market The most common service provided by demand-side resources is Responsive Reserve Service which requires an under-frequency relay that can instantaneously interrupt the load during certain system reliability events Some demand-side resources can also participate in other Ancillary Services as Controllable Load Resources that require sophisticated control systems that allow them to be deployed in a more incremental proportional manner
Non-dispatchable demand response in ERCOT can include a response to avoid transmission costs where rates are based on Four Coincident Peak Pricing (4CP) response to wholesale energy prices initiated by the customer or by a REP or other load-serving entity (ldquoLSErdquo) or utility-managed Load Management programs (LM)
The sections that follow provide a description of both ERCOT-dispatched (Section 31) and nonshyERCOT-dispatched (Section 32) demand response For a more detailed description of opportunities for demand-side resources to participate in demand response in ERCOT see ERCOTrsquos guide Load Participation in the ERCOT Nodal Market10
31 ERCOT-Dispatched Demand Response There are two main demand response reliability-based services administered by ERCOT participation by demand-side resources in the Ancillary Services market and participation in ERS These services are dispatched by ERCOT during system emergencies
10 Available at httpwwwercotcomcontentservicesprogramsloadLoad20Participation20in20the20ERCOT20Nodal20Market_302d oc
copy 2016 ERCOT All rights reserved 4
Study on the Demand Response Potential for Seawater Desalination Projects ERCOT Public
Demand-side resources with demand response capability that can meet a set of performance requirements can be qualified to provide Ancillary Services as Load Resources in the Ancillary Services Market The value of having a Load Resource available to reduce load is equal to the value of having a generator available to increase its generation at a generating plant The providers of operating reserves selected to provide Ancillary Services are eligible for capacity payments regardless of whether the Resource is actually deployed (or curtailed in the case of the Load Resource)
ERCOT holds auctions on a daily basis for each of the following Ancillary Services Regulation Up Regulation Down Responsive Reserve and Non-Spinning Reserve11 Table 1 describes the various Load Resource types and their qualification requirements and eligible services
Table 1 Load Resource Types and Ancillary Services
Service Load Resource Type a Qualification Responsive Reserves (le50 of total Reserve requirement)
Non Controllable Under-Frequency Relay and 10-minute ramp to manual dispatch instruction
Responsive Reserves
Controllable Primary Frequency Response and follow 5-minute dispatch instructions
Regulation-Up Regulation-Down
Controllable Primary Frequency Response and respond to Regulation deployments
Non-Spin Reserves Controllable Follow 5-minute dispatch instructions a A Controllable Load Resource is a Load Resource capable of controllably reducing or increasing consumption under dispatch control by ERCOT
Demand-side resources that agree to reduce load when directed by ERCOT and that meet other metering and operational requirements as specified in the ERCOT Protocols may participate in Ancillary Services market auctions As noted in Table 1 the type of Ancillary Service that a Load Resource may provide will depend upon the demand-side resourcersquos response time and metering system as well as other requirements described in the Protocols In the Responsive Reserve and Non-Spin Reserve markets the Load Resource will receive capacity payments regardless of whether or not the load was actually deployed but the load must be available for deployment at any time while providing the service
ERCOT procures ERS to maintain grid reliability during emergency conditions and reduce the likelihood of the need for rotating outages ERS participants may offer to provide demand response with either a 10-minute ramp period requirement (similar to Load Resources providing Responsive Reserve Service) or a 30-minute ramp period requirement ERS Resources do not have the same telemetry and under-frequency relay requirements as Load Resources
11 Regulation Up and Regulation Down service respond to signals from ERCOT every 4 seconds to respond to changes in system frequency full response has to be provided within 5 minutes Responsive reserves must provide their committed capacity either instantaneously in an under-frequency event (eg due to a generator outage) or in energy scarcity conditions within ten minutes following an instruction from ERCOT Non-spinning reserves must provide their committed capacity within 30 minutes based on economic dispatch instructions Non-spinning reserve is used as replacement reserve to replenish other ancillary services and during energy scarcity
copy 2016 ERCOT All rights reserved 5
Study on the Demand Response Potential for Seawater Desalination Projects ERCOT Public
ERS is procured through a request for proposal (RFP) process three times per year for four-month contract terms each of which is further split into smaller time periods based on business cycles and other factors Demand-side resources may choose to submit offers in all time periods or only in those that best fit their unique circumstances and may vary both the price and demand response capacity offers by time period
Payments for ERS are performed up to 80 days after each four month contract term has ended and are subject to downward revision based upon delivered demand response capacity and the demand-side resourcersquos availability during the contract term
32 Non-ERCOT-Dispatched Demand Response The options listed below are not dispatched by ERCOT but they either are controlled directly by a customer or are dispatchable by another entity such as a demand response provider (ldquoDR Providerrdquo) REP or a transmission and distribution utility
Many industrial customers are subject to transmission charges based upon a Four Coincident Peak (4CP) demand The 4CP demand is determined by averaging the consumerrsquos actual demand during the 15-minute settlement interval with the highest ERCOT demand during each of the four summer months (June through September) This measured 4CP demand serves as the basis for the customerrsquos transmission tariff charges for the following year By correctly predicting the ERCOT system peaks during the summer and curtailing load during those intervals a consumer can help reduce the stress imposed on the electric system during peak periods of consumption and reduce its transmission charges for the following calendar year
In the competitive areas of ERCOT consumers can contract with their REP or a DR Provider to have their load respond to the REPrsquos or DR Providerrsquos instructions The contract will usually outline the parameters of this response ndash at what times and frequency demand response events can be called ramp periods sustained response periods compensation etc Because this response is a contractual matter between the REP or DR Provider and the consumer a great deal of variety can be present in these arrangements For example a consumerrsquos response may be voluntary or required compensation could come in the form of reduced energy prices or rebate payments for each curtailment event consumers might be notified up to a day in advance or could have no notification at all (for automated curtailment)
In areas of ERCOT not open to competition interruptible tariffs may be available These tariffs will usually offer a reduced energy price for defined curtailment obligations
REPs may offer dynamic pricing options or consumers within a municipality or cooperative may have their energy prices determined by a published tariff which also may be structured based upon Time-of-Use (TOU) or have a Critical Peak Pricing (CPP) or Peak Time Rebate (PTR) component Self-directed price response refers to consumers making an independent decision to respond to energy prices contained in a governing tariff or in either the ERCOT Day Ahead or Real Time energy markets
TOU offerings will typically have higher energy prices during normal peak periods ndash for example a TOU tariff may charge one price during Monday through Friday from 2 pm through 8 pm and another price during all other times Customers may choose to reduce consumption during these high priced periods Load reduction can be accomplished by load shifting (loads can be shifted by
copy 2016 ERCOT All rights reserved 6
Study on the Demand Response Potential for Seawater Desalination Projects ERCOT Public
rescheduling certain processes or by utilizing thermal storage) ending certain processes that are no longer economic or through energy efficiency measures
Offerings that incorporate CPP usually have prescribed high prices only during certain defined periods ndash for example when load or prices are expected to reach a certain level Response to CPP may be similar to those employed under TOU tariffs especially if CPP is reached frequently More often CPP is infrequent and as such short-term load curtailment may be the more appropriate response to meet economic objectives
4 Demand Response Potential for Seawater Desalination
This section evaluates whether the operational characteristics and economics of seawater desalination plants would enable them to participate in one or more of the various demand response opportunities in the ERCOT Region To date participation of seawater desalination plants in demand response programs has been limited Neither the plant in Carlsbad nor the plant in Tampa Bay participate in demand response programs in California or Florida respectively However as will be described below it appears that these plants can be designed and operated to meet the requirements for participation in demand response and receive economic benefit from participation in these programs
Section 41 describes the operational parameters that must be met for a demand-side resource to provide ERCOT-dispatched demand response and evaluates the ability of seawater desalination plants to meet these criteria Section 42 discusses the tradeoffs between payments for participation in ERCOT-dispatched demand response and potential additional costs posed to seawater desalination plants Finally Section 43 presents other opportunities for seawater desalination plants to reduce their electricity costs outside of ERCOTrsquos reliability-based services that are open to demand response assets
41 Operational Considerations for ERCOT-Dispatched Demand Response There are several key operational parameters that impact a demand-side resourcersquos ability to participate in different demand response services response time recovery time predictability of electrical demand and flexibility of operations This section discusses each of these considerations as they apply to seawater desalination plants
As discussed in Section 31 one of the differentiating factors between ERCOTrsquos demand response products is the amount of time within which a demand-side resource must respond to a deployment instruction to reduce electricity consumption during an event Participation in RRS requires an automatic response within either half a second (ie instantaneous) based on grid frequency or within 10 minutes via a manual instruction ERS requires a response time of either 10 or 30 minutes As noted in Section 21 the typical time to take a reverse osmosis train on- or off-line is 1-2 hours under normal controlled operations To comply with the response time requirements of RRS or ERS a seawater desalination plant would need to be able to reduce its electricity consumption far more quickly than in normal operations This is an element of plant design that would need to be accounted for in the specifications of the project Considerations include the potential need for on-site backup generation including uninterruptible power supply potential impacts to plant infrastructure (eg piping) reverse osmosis membranes and pretreatment systems
The two large US desalination plants provide illustrative counterpoints in this respect The Carlsbad plant was designed to withstand instantaneous power interruptions and has on-site backup generation including uninterruptible power supply to provide the ability to power control systems and flush the membranes in the event of a power loss In contrast the Tampa Bay plant was not
copy 2016 ERCOT All rights reserved 7
Study on the Demand Response Potential for Seawater Desalination Projects ERCOT Public
designed with on-site backup generation and a loss of power would result in a plant shutdown and may require several days to bring the plant back on-line Thus it appears that it is technically possible for a seawater desalination plant to meet the response time requirements for participation in demand response so long as this factor is considered in the design of the facility
The time it takes a desalination train to return to operations after an event is also a consideration Demand-side resources participating in RRS must be able to come back on-line within three hours and those participating in ERS must return within 10 hours Again it appears that it is technically feasible for desalination plants to meet this requirement so long as this requirement is considered in the plant design
An additional consideration is the predictability of a demand-side resourcersquos electricity consumption Participation in the responsive reserves ancillary service market requires bidding in the day-ahead market and thus a demand-side resource must know with great accuracy (within 95) its electrical demand at least a day ahead of time For ERS auctions are held three times a year for four-month contract periods Thus to participate in ERS a resource must know its forecasted electrical demand several months in advance Because seawater desalination plant operations are driven by contracted demand for water it is likely that a plant operator would have a good idea of the plantrsquos electrical demand days or even weeksmonths in advance especially for summer months when demand is likely to be relatively steady An important consideration however is the salinity of the water which drives the electrical requirements and which can be impacted by recent weather events Similarly reductions in demand for water during non-summer months or wet summer days where demand may be reduced could also impact a plantrsquos ability to predict its electricity demand
Finally a seawater desalination plant must have sufficient flexibility in its day-to-day operations so that it can afford to lose several hours of production when deployed for demand response It should be noted that demand-side resources participating in RRS and ERS are called infrequently demand-side resources providing responsive reserves were deployed one time in 2015 and ERS was not deployed that year However this is an important factor to consider if a plant is operating at close to full capacity and would incur financial penalties if it fails to meet its contract obligations due to a demand response event Including additional storage and building a plant with extra capacity could help to mitigate this risk It should also be noted that a plant operator does not need to commit the full plant capacity to these services but rather can specify an amount of MW that will be committed Thus a plant operator could mitigate issues both with predictability and flexibility of plant operations by committing only a portion of its predicted electrical demand to participate in demand response
Considering these factors together it appears that seawater desalination plants could be designed to meet the operational requirements for participation in ERCOTrsquos demand response services (both RRS and ERS) Because the ability to meet the requirements is dependent on the plant design demand response would need to be considered early in a projectrsquos development if participation is desirable Whether project developers will choose to address these requirements will depend on the economic benefits of participation in demand response which will be discussed in the next section
42 Economic Considerations for ERCOT-Dispatched Demand Response This section describes the economic benefits to demand-side resources from participation in ERCOT-dispatched demand response programs The average price paid for a demand-side resource participating in RRS in 2015 was $1087 per MW per hour and for ERS was $645 per MW per hour for the contract periods during the 2015 program year These payments could provide a significant financial benefit to seawater desalination plants To give a simplified example for a plant with an electrical demand of 10 MW operating at a 100 annual load factor (10 MW times 24 hours times 365 days) the annual benefit would be on the order of $500000 for ERS or $1 million for RRS
copy 2016 ERCOT All rights reserved 8
Study on the Demand Response Potential for Seawater Desalination Projects ERCOT Public
In 2015 demand-side resources providing responsive reserves were deployed one time for a duration of 10 minutes and ERS was not deployed12 The most ERS was ever deployed in a single year was two times in 2011 Thus participation in either program could result in a substantial payment to a seawater desalination plant with a relatively low risk of deployment and associated disruption of plant operations although it is important to note that participation in either ERCOT service subjects demand response resources to annual unannounced testing Other than testing the frequency of deployment will depend on grid conditions and is a risk that should be considered
The financial benefits of participation must be weighed against the costs of designing facilities with the capabilities to operate in this manner These include
bull The costs to design the plant to reduce electrical demand within the required timeframes for demand response and to withstand an instantaneous interruption if not already part of the plant design For example a plant may need to be designed to have backup power generation on-site In addition there could also be costs to restart the system after an interruption
bull The costs to build a plant with excess capacity andor storage to make up for lost production hours when demand response is deployed This will add to the total capital costs of the project Land area constraints should also be considered when considering additional storage as the space requirements for the necessary storage capacity could be significant
bull Costs associated with the impact of interruptions on plant processes (eg more frequent replacement of membranes impacts to pretreatment system or plant infrastructure)
bull Potential financial penalties that would be incurred if deployment as part of demand response were to result in failure to meet contract obligations to supply water
bull The loss of potential benefits in the form of cost avoidance from participation in non-ERCOTshydispatched demand response opportunities (see Section 43) If a plant is committed to RRS or ERS the plant operator would lose the flexibility to take advantage of these other opportunities to reduce their electricity costs
The interplay of these benefits and costs will determine whether it would be beneficial for a future seawater desalination plant to participate in demand response in ERCOT
43 Considerations for Non-ERCOT-Dispatched Demand Response Outside of the reliability-based services administered by ERCOT there are other opportunities for seawater desalination plants to reduce their electricity costs As described in Section 321 seawater desalination plants may be able to reduce the demand charges on their electricity bills through curtailing load during 4CP intervals In addition plant operators may adjust operations in response to real-time electricity prices to take advantage of lower off-peak prices and avoid price spikes (see Sections 322 and 323) All of these opportunities require that the plant have flexibility to reduce production during certain times of the day
In the ERCOT region as noted above a portion of transmission and distribution charges are set based on the peak systemwide 15-minute interval of the four summer months (June through September) referred to as the four coincident peaks (4CP) Large customers can reduce or avoid this charge by reducing electrical consumption during these four peak intervals AEP Central Texas and CenterPoint are the transmission providers covering the majority of the Gulf Coast in Texas13
12 ERCOT June 2016 ldquoLoad Resource Deployment Updaterdquo Available at httpwwwercotcomcontentwcmkey_documents_lists870985_RRS_Load_Resource_Deployment_Updatepdf 13 It is also possible that a seawater desalination plant could be located in an area that as not opted in to competition in which case the plant owner would need to negotiate its electricity charges bilaterally with the Non Opt-In Entity (NOIE)
copy 2016 ERCOT All rights reserved 9
Study on the Demand Response Potential for Seawater Desalination Projects ERCOT Public
Assuming a future seawater desalination plant would be connected at transmission-level voltages the relevant 4CP charges based on the 2016 tariffs accounting for both transmission charges and transmission cost recovery factors would be $41425 per 4CP kW for AEP Central Texas and $41870 per 4CP kVA for CenterPoint14 If a seawater desalination plant has 10 MW of load and is capable of interrupting all of it and successfully does so for all four 4CP intervals the savings based on the 2016 tariffs would be approximately $500000 per year ($41425 times 1000 (kW to MW) times 10 MW times 12 months) Thus a seawater desalination plant that reduces its electricity use during the 4CP intervals could avert some or all of these charges
Another opportunity for seawater desalination plants to reduce their electricity costs is through adjusting operations in response to real-time electricity prices In 2015 the average electricity price in ERCOT was $2677MWh However prices exceeded $50MWh in 254 hours (3 of all hours) $100MWh in 88 hours (1) $200MWh in 40 hours (05) and $300MWh in 21 hours (02) Prices exceeded $3000MWh for 021 hours15 Depending on the desalination plantrsquos exposure to real-time wholesale market prices (via its retail contract) the degree of high prices the plant owner is willing to avoid and grid conditions in a given year reducing unit operations in order to avoid high electricity prices could impact operators for anywhere between a few and several hundred hours out of the year In addition a plant can plan its operations to take advantage of lower electricity prices during off-peak periods (eg at night when generation from wind is high) For example at least one company is marketing a modular desalination unit design intended to take advantage of low prices during periods of high renewables generation and to provide grid reliability services through demand response16
There are several factors to consider regarding these opportunities to reduce electricity costs The plant would need to monitor the ERCOT market or hire a contractor to do so in order to know when to reduce demand for electricity These programs do not impose any requirements on response time as with RRS or ERS and there may be sufficient warning of 4CP intervals or peak pricing to allow the plant operator to plan its operations earlier in the day with sufficient time to ramp down production under controlled conditions However quicker ramping capability may be desirable to respond to electricity price fluctuations
For 4CP because the four intervals used to set demand charges are not known ahead of time it is likely that the plant would need to reduce its demand multiple times per summer to ensure the 4CP intervals are hit impacting production at the facility Timing operations to coincide with off-peak pricing or to avoid price spikes would similarly result in reduced operations during certain hours To offset the lost production hours the plant may need to be designed with extra capacity and water storage capability to maintain the ability to meet its contractual obligations for freshwater delivery Because the period of reduced operations is greater than with ERCOT-dispatched demand response services this need would be greater for a seawater desalination plant reducing load during 4CP intervals or in response to real-time electricity prices and would increase the capital costs of the project It should also be noted that high prices in the ERCOT Region typically but not always occur in summer months when drought conditions are more likely to develop and demand for desalinated water is likely to be highest This may limit the flexibility of the plant to time its electricity consumption to avoid high-priced hours
14 Public Utility Commission of Texas ldquoTransmission and Distribution Rates for Investor Owned Utilitiesrdquo Available at httpwwwpuctexasgovindustryelectricratestdraspx 15 Potomac Economics June 2016 2015 State of the Market Report for the ERCOT Wholesale Electricity Markets Available at httpswwwpotomaceconomicscomindexphpmarkets_monitoredERCOT 16 Sisyan LLC ldquoDemand Response Desalinationrdquo Available at httprenewabledesalinationcomwpshycontentuploads201506Demand-Response-Desalinationpdf
copy 2016 ERCOT All rights reserved 10
Study on the Demand Response Potential for Seawater Desalination Projects ERCOT Public
In addition the plantrsquos ability to participate in demand response would also be limited for those hours it is reducing load as part of 4CP response or in response to real-time prices because the plant would not be able to reduce its electricity consumption if that demand is already committed to another demand response service Thus participating in demand response versus taking advantage of these other opportunities may be to some extent mutually exclusive
5 Conclusion
Based on this analysis it appears that the operational characteristics of seawater desalination plants would allow them to participate in demand response opportunities in ERCOT so long as the necessary operational requirements are considered in the design specifications of the plant Project developers should consider the necessary requirements early in the plant design Whether the economic benefits of participation would provide a sufficient incentive for them to do so will depend on the costs of accommodating those operational requirements and whether there is the flexibility available to operate the plant as necessary under these programs Though most existing seawater desalination plants do not participate in demand response programs it does appear that participation by these plants is possible and could result in a financial benefit Table 2 compares the different demand response opportunities available to demand-side resources in ERCOT
Table 2 Comparison of Demand Response Opportunities Demand Response
Opportunity Requirements for
Participation Impacts to Plant
Operations Financial Benefit Ancillary Services ndash Responsive Reserve Service (RRS)
bull Under-Frequency Relay bull Instantaneous or 10 minute
response time bull Recover load within 3
hours bull Bid in day-ahead market
bull Deployed once in 2015 for 10 minutes bull Subject to annual
unannounced testing
bull $1087 per MW per hour (based on 2015 prices)
Emergency Response Service (ERS)
bull 10 or 30 minute response time bull Recover load within 10
hours bull Four-month contract term
bull Not deployed in 2015 the most times ever deployed in a single year was twice in 2011 bull Subject to annual
unannounced testing
bull $645 per MW per hour (based on 2015 prices)
Four Coincident bull Interval Data Recorder bull Likely plant will need to bull Avoid ~$48000 per 4CP Peak (4CP) (IDR) meter
bull Ability to predict system-wide peak demand hours during summer months
reduce load multiple times per summer to hit 4CP intervals bull Likely to be able to predict
possible 4CP intervals earlier in day
MW per year (based on 2016 tariffs) if successful in reducing during all four summer months
LSE or DR Provider Contracted Price Response
bull Varies based on contractual arrangements
bull Varies based on contractual arrangements
bull Varies based on contractual arrangements
Self-Directed Price bull Retail contract with bull Varies depending on bull Varies depending on Response exposure to real-time
market prices bull Ability to monitor real-time
prices in ERCOT wholesale market
number and severity of pricing events bull May be able to predict
peak pricing events earlier in day
number and severity of pricing events
copy 2016 ERCOT All rights reserved 11
Study on the Demand Response Potential for Seawater Desalination Projects ERCOT Public
Demand response programs in ERCOT provide opportunities for demand-side resources to defray their electricity costs and provide reliability benefits to the ERCOT electric grid Because the process of seawater desalination is energy intensive participation in demand response could help to reduce electricity costs while posing a relatively low risk to plant operations if demand response participation is factored into plant design
Participation in non-ERCOT-dispatched demand response opportunities such as reducing load during 4CP intervals or in response to real-time electricity prices may also help to reduce electricity costs for seawater desalination plants in Texas As stakeholders in Texas continue to plan for possible future droughts in the region and identify water management strategies consideration of demand response could play a role in mitigating some costs associated with seawater desalination and allow seawater desalination plants to assist with maintaining electric reliability in the region
copy 2016 ERCOT All rights reserved 12
2017 SCOPE OF COMPETITION IN ELECTRIC MARKETS IN TEXAS REPORT
Commissionrsquos websites The Commission has actively participated with the Interagency
Coordinating Group (ICG) which was established by the Texas Legislature to expand and
improve relationships between state government and faith- and community-based
organizations Information on customer assistance programs such as LITE-UP Texas was
provided to community organizations such as Legal Aid of Northwest Texas senior
activity centers and religious groups
e Call Center
The Commission has trained its Customer Protection Division staff who are fluent
in both English and Spanish to answer customer calls and to assemble and mail
informational packets comparing electric plans when requested by customers without
Internet access From September 2015 to August 2016 the Customer Protection Division
staff handled 7663 calls from customers requesting assistance with shopping
f Educational Literature
In addition to the educational materials on the Commissionrsquos website the Commission provides brochures fact sheets and other educational materials by mail and
e-mail through a network of community organizations and events and in response to
customer requests to the call center Up-to-date fact sheets are available on the
Commissionrsquos website PowertoChooseorg and PoderDeEscogerorg as part of the
campaignrsquos outreach efforts The fact sheets provide information on a number of current
industry and consumer topics
Throughout 2015 and 2016 campaign educational materials promoting the
agencyrsquos programs including Power to Choose and Power to Save Texas were distributed
at numerous community events and civic town hall events such as Hurst-Euless-Bedford
ldquoBack 2 Schoolrdquo day Dickenson Housing Family Fair Energy Day DFW Family Fair
Earth Day Texas Texas Home and Garden shows in Houston Texas Black Expo National
Night Out events and minor league baseball games
Wholesale Market Development
The Commission engages regularly with ERCOT to oversee market developments
and ensure system supply reliability security and improved price formation and market
outcomes Market design changes made as a result of this working relationship have
created new opportunities for a variety of generation resources to enter the market and
supported the formation of wholesale prices that reflect real-time market conditions more
accurately and therefore improve the efficiency of the market
1 Wholesale Market Prices
Wholesale market prices have fallen in comparison to prices seen in the 2012 ndash 2014 period The ERCOT load-weighted real-time average price of energy in 2015 was
$2677 per Megawatt-hour (MWh) a 34 decrease from the average price in 2014 and a
decrease of 21 from the average seen in 2013
10 | P a g e
2017 SCOPE OF COMPETITION IN ELECTRIC MARKETS IN TEXAS REPORT
Falling wholesale prices are correlated with the current trend of lower natural gas
prices the primary fuel of many of the regionrsquos power plants The average Houston Ship Channel spot price for natural gas was 41 lower in 2015 than in 2014 decreasing from
$437MMBtu in 2014 to $258 in 2015 Through March the average price for 2016 has
fallen to $192MMBtu Natural gas price trends from September 2014 through August
2016 are shown in Figure 4
Figure 4 Monthly Average Natural Gas Prices September 2014 ndash August 2016
Monthly average wholesale electricity prices are shown in Figure 5 Load-
weighted prices are calculated by dividing the price at a load zone by the associated
demand This metric provides a useful proxy for the actual wholesale prices paid by load16
16 It is worth noting that most power in ERCOT is sold through various bilateral arrangements that
are designed to hedge daily real-time market price risk
11 | P a g e
2017 SCOPE OF COMPETITION IN ELECTRIC MARKETS IN TEXAS REPORT
Figure 5 Load-Weighted Average Real-Time Monthly Settlement Point Prices September 2014 ndash August 2016
Another component of the real-time price of electricity is the cost of transmission
congestion Transmission congestion occurs when there is insufficient transmission
capacity to dispatch energy in a least-cost fashion The recent build-out of additional
transmission lines in areas of high congestion has partially relieved the cost burden in these
areas particularly in West Texas where oil and gas production growth rapidly increased
the demand for electricity resulting in relatively higher zonal prices
2 Peak Demand
After the very high peak demand levels during the hot summer of 2011 peak
demand in ERCOT was lower in 2012 through 2014 In 2015 peak demand again
increased though not to 2011 levels with load exceeding 60000 MW for 330 hours and
exceeding 65000 MW for 91 hours as shown in Figure 6 below In 2016 ERCOT
experienced a record week in August which saw the previous record peak demand broken
six times and the ERCOT region hit its all-time peak demand of 71093 MW on August
11 2016
As peak demand has increased the recorded availability of generation supply in the
region during times of high load has decreased slightly Physical Responsive Capability
(PRC) analogous to the amount of reserves available on the system at any given time fell
below 3000 MW for 269 hours in 2015 up slightly from 213 hours in 2014 and 215
hours in 2013 but well below the 371 hours recorded during the 2011 summer
12 | P a g e
2017 SCOPE OF COMPETITION IN ELECTRIC MARKETS IN TEXAS REPORT
Figure 6 High Load Hours in ERCOT 2011 ndash 2016
As shown in Table 6 the ERCOT system peak demand was 69877 MW in 2015
up 5 from the 2014 peak and the 2016 ERCOT system peak demand increased 174
from the peak demand of the previous year
Table 6 ERCOT Peak Demand 2012 ndash 2016
Year
ERCOT Peak
Demand (MW)
Percentage Change
from Prior Year
2012 66548 ndash 2013 67245 105
2014 66454 ndash118
2015 69877 515
2016 71093 174
Figure 7 shows the hourly peak load for each month in ERCOT from January 2014 to
August 2016
13 | P a g e
2017 SCOPE OF COMPETITION IN ELECTRIC MARKETS IN TEXAS REPORT
Figure 7 Monthly Peak Demand in ERCOT January 2014 ndash August 2016
3 Generation Diversity
As electricity consumption has increased in ERCOT the diversity of the systemrsquos generation portfolio has also increased Generators participating in the statersquos renewable energy credit (REC) trading program reported an 11 increase in renewable generation
from 2013 to 2015 rising from 376 million MWh to 469 million MWh with wind
representing 96 of the total renewable mix Landfill gas was the second most prevalent
renewable source representing approximately 12 of all renewable generation in 2015
Energy produced from wind generation was up by 13 in 2015 from 2013 and solar
energy capacity more than doubled from 121 MW in 2013 to 288 MW in 2015 Coal-fired
generation has been steadily shrinking as a proportion of total generation declining from
37 of electricity produced in 2014 to 28 in 2015 Energy use in the ERCOT region by
fuel type for 2015 is shown in Figure 8
14 | P a g e
2017 SCOPE OF COMPETITION IN ELECTRIC MARKETS IN TEXAS REPORT
Figure 8 Energy Use in ERCOT by Resource Type 2015
The Commissionrsquos projects are further described in the following section of this report
15 | P a g e
2017 SCOPE OF COMPETITION IN ELECTRIC MARKETS IN TEXAS REPORT
III SUMMARY OF COMMISSION ACTIVITIES FROM 2015 TO 2016
Introduction
The Commission develops and modifies rules policies and procedures for the
competitive electric market in Texas in response to the technological advances in the
industry and the evolving needs of customers The Commission also continues to carry
out oversight of programs with which the Legislature has tasked it ndash such as energy
efficiency renewable energy and advanced metering infrastructure Within the
ERCOT region the monopoly wires-and-poles companies that provide transmission
and distribution services throughout the grid remain subject to traditional rate
regulation by the Commission The Commission continues to set rates for these
utilities as they are not subject to the forces of market competition This section
provides an overview of the Commissionrsquos activities in its oversight of the wholesale and retail electric markets as well as its governance over regulated electric utilities
Resource Adequacy
Resource adequacy is the long-term ability of the system to serve demand reliably
when consumption is highest given the available installed capacity load resources and
the operational reliability of the system Assessing resource adequacy requires comparing
the systemrsquos forecast installed capacity and load resources against the forecast peak
summer load The difference between the forecast of available generation and load
resources and the forecasted demand for electricity is referred to as an ldquoinstalled capacity
reserve marginrdquo which is an indicator of the ability of the system to meet customer demand
during peak conditions In addition to evaluating the forecast reserve margin assessing
resource adequacy includes evaluating the systemrsquos operational reliability The systemrsquos operational reliability depends on the ability of generators to manage plant operations
successfully as well as the grid operatorrsquos ability to manage the system to avoid or to mitigate load curtailment During 2015 and 2016 the ERCOT system performed well with
respect to resource adequacy The Commission has devoted significant attention to
ensuring that ERCOT maintains an adequate installed capacity reserve margin and a high
level of operational reliability developing a wholesale market design that allows
consumers to continue to receive low-cost and reliable electricity over the long term
1 Capacity Demand and Reserves Report
The Capacity Demand and Reserves (CDR) Report published by ERCOT semi-
annually is a snapshot estimate of long-term supply and demand and the associated annual
reserve margin for peak summer and winter conditions While the CDR Report is not a
forecast of any particular outcome it provides insight into possible resource adequacy
trends
16 | P a g e
2017 SCOPE OF COMPETITION IN ELECTRIC MARKETS IN TEXAS REPORT
The May 2016 CDR Report shows estimated reserve margins well above the
current target reserve margin of 1375 Installed capacity reserve margin estimates taken
from this CDR Report are shown below in Table 7
Table 7 May 2016 Capacity Demand and Reserves Report Forecast
Forecast 2017 2018 2019 2020 2021 2022 2023 2024 2025 2026
Peak Load
(MW)
68548 69409 70795 71420 72098 72792 73482 74168 74864 75704
Total
Capacity
(MW)
80995 87019 87238 87407 87678 87738 87738 87728 87728 87728
Reserve
Margin
182 254 232 224 216 205 194 183 172 159
2 Operating Reserve Demand Curve
In ERCOT the price signals produced by the energy-only wholesale electric market
should provide incentives to promote short-term reliability as well as induce optimal long-
run investment in new resources If the prices are efficient and reflect the full cost of
dispatching resources to meet demand the benefits that accrue to both consumers and
producers can be maximized at the least cost and new generating capacity (or load
resources) should develop to maintain the equilibrium as old resources retire or demand
increases
The Operating Reserve Demand Curve (ORDC) implemented at the Commissionrsquos direction in June 2014 improves price formation by allowing prices to more fully reflect
the value of operating reserves The ORDC assigns an economic value to operating
reserves or the amount of extra capacity available to maintain system reliability on a daily
basis
As part of its ongoing review of resource adequacy in ERCOT the Commission is
currently evaluating the accuracy of the inputs to the ORDC to ensure that its contribution
to price formation appropriately reflects the costs of meeting demand and the underlying
needs of the system
3 Transmission Congestion
Although competitive power producers and regulated transmission providers form
two distinct segments of the market transmission buildout has a direct effect on wholesale
power prices When there is insufficient transmission capacity to dispatch energy in a least-
cost fashion the system operator takes action to ensure that the physical limits of the
transmission system facilities are not violated The re-dispatch of generation because of
transmission limits results in disparate prices at different locations on the system In
comparison to prior years transmission congestion in ERCOT has lessened because of the
large increase in transmission investment and the reduction of high demand related to oil
and gas production in West Texas ERCOT and the Commission continually evaluate the
need for cost-effective additional transmission investment to manage congestion
17 | P a g e
2017 SCOPE OF COMPETITION IN ELECTRIC MARKETS IN TEXAS REPORT
4 Wholesale Market Design Initiatives
While the ERCOT wholesale market has been successful in attracting new resource
investment and also maintaining competitive prices for consumers certain improvements
to the market design could yield additional benefits in terms of efficient price formation
and opportunities for entry of new technology Initiatives already in place in many other
regions such as real-time co-optimization and multi-interval real-time resource dispatch
may allow existing capacity to be used more effectively and create opportunities for the
integration of additional load resources to serve electric demand The Commission
continues to work with ERCOT and interested stakeholders to determine the value of
implementing such enhancements particularly as ERCOTrsquos resource mix changes over time
5 Reliability Standard
In early 2014 the Commission opened a project to review its use of a target installed
capacity reserve margin based on a reliability standard equivalent to one loss-of-load event
every ten years In this project the Commission received written comment from interested
parties conducted a public workshop consulted with independent experts and reviewed
the application of reliability standards in other regions As a result of this review future
reliability metrics to be estimated in ERCOT will include the market equilibrium reserve
margin the economically-optimal reserve margin and the associated levels of expected
unserved energy The Commission believes that publishing these metrics represents an
improvement over reporting a one-event-in-ten-years standard by enhancing insight into
expected outcomes in ERCOTrsquos energy-only market
Non-ERCOT Utilities Market Development Activities
SB 7 the law that introduced retail competition to the Texas market in 1999
granted the Commission authority to delay retail competition in an area where deregulation
would not result in fair competition and reliable service because of the lack of an
independent organization to coordinate the electric system and the concentration of
ownership in the generation sector in some of those areas Consequently SB 7 included
provisions recognizing the difficulty of implementing retail competition in areas outside of
ERCOT Therefore the utilities outside of the ERCOT region remain vertically integrated
owning generation transmission and distribution assets as well as selling power to end-
use customers These vertically integrated utilities remain subject to traditional regulation
including rates set by the Commission and customer choice is not offered in the service
territories of these utilities
The Commission does continue to monitor ongoing activities in the non-ERCOT
portions of the state In 2015 the Legislature granted the Commission the authority to
retain counsel and consulting experts in order to participate in legal proceedings at the
Federal Energy Regulatory Commission (FERC) which has regulatory jurisdiction over
wholesale power sales and transmission rates outside of ERCOT This authority has
18 | P a g e
2017 SCOPE OF COMPETITION IN ELECTRIC MARKETS IN TEXAS REPORT
permitted the Commission to participate more effectively in FERC proceedings affecting
Texasrsquo utilities located outside of ERCOT
1 Southwest Power Pool
The Southwest Power Pool (SPP) is the Regional Transmission Operator (RTO) for
areas of Northeast Texas and the Texas Panhandle In Texas the utilities Southwestern
Electric Power Company (SWEPCO) Southwestern Public Service (SPS) and several
electric cooperatives and municipally owned utilities are in SPP In addition to these areas
of Texas the SPP footprint includes parts of New Mexico Arkansas Missouri Nebraska
Louisiana and all of Kansas and Oklahoma In 2015 SPP became the RTO for the
Integrated System and neighboring areas which includes parts of Iowa Minnesota North
Dakota South Dakota Wyoming and Montana SPP has spent extensive time and
resources over the last two years to integrate these new areas successfully The expansion
added 5000 MW of peak demand 7600 MW of generating capacity and 9500 miles of
transmission lines17
In 2014 SPP launched its new Integrated Marketplace which provides a Day-
Ahead Market a Real-Time Balancing Market and Congestion Hedging Markets
mechanisms similar to those available in ERCOT The implementation of the Integrated
Marketplace resulted in a savings of $422 million in 2015 As a result of the Integrated
Marketplace SPPrsquos planning reserve margin will be reduced from 136 to 12 a change
expected to save about $90 million annually
Chairman Donna L Nelson represents the Commission as a voting member on
SPPrsquos Regional State Committee (RSC) The RSC provides collective state regulatory
agency input on a variety of issues In addition the RSC has authority over the cost
allocation methodologies for transmission upgrades allocation of Financial Transmission
Rights and the approach used for resource adequacy across the SPP region The RSC
regularly meets on a quarterly basis and meets more frequently if necessary
2 Midcontinent Independent System Operator
The Midcontinent Independent System Operator (MISO) is an RTO that serves all
or part of 15 states in the central US one Canadian province and the portion of eastern
Texas served by the vertically integrated utility Entergy Texas Inc MISO provides a Day
Two market which has a variety of functions and services including energy and ancillary
service markets economic dispatch congestion management financial transmission rights
and transmission planning The MISO Independent Market Monitor concluded that the
MISO wholesale markets were competitive in 2015
Like SPP MISO is in the Eastern Interconnection which crosses state boundaries
and is therefore subject to FERC jurisdiction A number of recent FERC proceedings have
17 2015 Southwest Power Pool Annual Report Available at
httpswwwspporgdocuments37800201520southwest20power20pool20annual20reportpdf
19 | P a g e
2017 SCOPE OF COMPETITION IN ELECTRIC MARKETS IN TEXAS REPORT
affected the portion of Texas that is in the MISO footprint The Commission through
outside counsel has been an active party in such FERC proceedings FERC Docket No
ER14-1174 addressed in part a dispute regarding the availability of transmission capacity
under the Joint Operating Agreement between MISO and the SPP Ultimately FERC
approved a settlement agreement under which MISO will compensate SPP and its members
for using their or other entitiesrsquo transmission systems
In a related pending docket at FERC Docket No ER14-1736 parties are addressing
how the cost of these payments will be allocated among MISO market participants Parties
in this proceeding are engaged in settlement discussions In addition in Docket No ER14-
75-000 FERC approved a settlement agreement among the participating Entergy
Operating Companies and their retail regulators to terminate the Entergy System
Agreement effective August 31 2016 The settlement terms prohibit any post-termination
payments that roughly equalize production costs among the operating companies after
December 31 2015 terminate certain specific cross-purchase power agreements between
Entergy Texas and former Entergy Gulf State Louisiana and permit the continuation of
several other purchase power agreements
Commissioner Kenneth W Anderson Jr represents the Commission as a voting
member in the Organization of MISO States (OMS) the purpose of which is to coordinate
regulatory oversight among the states in the MISO region and to make recommendations
to MISO FERC and other entities Commissioner Anderson also represents the
Commission as a voting member of the Entergy Regional State Committee (ERSC) which
has certain FERC-approved authority for five years after the Entergy integration with
regard to cost allocation for Entergy transmission projects and adding transmission projects
to the Entergy construction plan The ERSC meets quarterly
3 Western Electricity Coordinating Council
The Western Electricity Coordinating Council (WECC) is a Regional Entity whose
region includes the area surrounding El Paso and extends from Canada to Mexico
including the provinces of Alberta and British Columbia the northern portion of Baja
California and all or portions of the 14 Western states in between WECC is the Regional
Entity responsible for Bulk Electric System reliability in the Western Interconnection and
associated compliance monitoring and enforcement WECC does not have organized
markets outside of California but is organized into 38 separate balancing authorities
WECC is geographically the largest and most diverse of the eight Regional Entities in the
United States with delegated authority from the North American Electric Reliability
Corporation (NERC) and the Federal Energy Regulatory Commission In Texas El Paso
Electric Company is a member of WECC
Rulemaking Activities
The Commission has continued to adopt new rules and modify existing rules in
order to further the continued successful operation of the competitive retail and wholesale
markets and to comply with statutory changes made to PURA by the Legislature This
20 | P a g e
2017 SCOPE OF COMPETITION IN ELECTRIC MARKETS IN TEXAS REPORT
section of the Report provides a high-level overview of the Commissionrsquos key rulemaking
activities highlighting the market improvements made in 2015 and 2016
1 Cost Recovery and Rate Adjustment
The Commission adopted new rule 16 TAC sect25246 on June 29 2016 to
implement Section Nos 1 through 3 of House Bill 1535 of the 84th Legislature The new
rule only applies to a utility that operates solely outside of ERCOT and allows for the use
of an update period beyond the test year for which the utility initially files estimated
information The rule clarifies that all information originally estimated must be updated
with actual information and also provides requirements for a post-test-year adjustment for
a natural gas-fired plant A non-ERCOT utility also is required to initiate a new base rate
case on or before the four year anniversary of the final order in the utilityrsquos most recent comprehensive base rate case or if the commission determines that the utility has
materially earned more than its authorized rate of return in two consecutive years The rule
also provides requirements and procedures for the relation back of final rates to an effective
date 155 days after the filing of the rate application
2 Changes to Certificates of Convenience and Necessity and CREZ Rule
The Commission conducted a rulemaking to implement changes pursuant to
Legislative mandates in SB 776 SB 933 and HB 1535 of the 84th Legislature SB 776
required municipally owned utilities to apply for a certificate of convenience and necessity
(CCN) before constructing transmission facilities outside the boundaries of the
municipality that owns the municipally owned utility SB 933 also requires persons to
obtain a CCN before interconnecting a tie line into the ERCOT grid HB 1535 requires the
Commission to issue a final order within 181 days for a non-ERCOT utility requesting a
CCN for an existing electric generating facility and 366 days after a non-ERCOT utility
files a CCN for a newly constructed generating facility In addition the Commission also
determined in this rulemaking that all future transmission projects in a Competitive
Renewable Energy Zone (CREZ) must meet the need criteria of PURA sectsect 37056(c)(1)
and (2) rather than being exempt Finally the Commission determined that the CREZ
project established in 2008 was complete following the installation of a second circuit on
a Sharyland line
3 Use of Handheld Device for Enrollment
As the market evolves the Commission evaluates market changes balancing its
desire to encourage customer-focused innovation with its concern for customer protection
against potential abuses In Docket No 44518 the Commission granted a REP a
temporary 12-month waiver from its rules requiring the marketer to obtain telephonic
verification of the customerrsquos desire to switch REPs as well as a waiver from certain authorization disclosure requirements among other stipulations the Commission placed
upon the REP The Commission then opened Project No 45625 to study the issue of REPs
utilizing hand-held devices for customer enrollment more broadly and engage with market
representatives consumer representatives and other stakeholders The Commission
anticipates considering an amendment to its rules in the spring of 2017
21 | P a g e
2017 SCOPE OF COMPETITION IN ELECTRIC MARKETS IN TEXAS REPORT
4 Smart Meter Texas Portal
The electric utilities in Texas that have advanced metering systems (AMS) jointly
own and operate a single web portal known as Smart Meter Texas (SMT)18 SMT fulfills
two requirements imposed by the Commissionrsquos advanced metering rule on a utility with
AMS (1) provide to the retail customer the REP serving the customer and other entities
authorized by the customer access to such retail customerrsquos consumption data and (2)
allow devices at the customerrsquos premises to communicate through a home area network with the advanced meter at the premises SMT also facilitates near real-time on-demand
reads of a customerrsquos meter that aids prepaid service offered by certain REPs
In Project No 42786 Review of Advanced Metering System Web Portal
Commission staff and stakeholders examined options for the long-term operational
structure governance and funding of SMT The Commission determined that ownership
of SMT should remain with the TDUs because they can operate the portal at a lower cost
than transferring the data repository to ERCOT The Commission opened two
rulemakings one to ascertain the appropriate governance performance and funding of
SMT and a second to determine the appropriate access for third parties ensuring that
customers have the freedom to grant and give third parties access to their data if made
knowingly while also securing customer privacy
Sharyland Utilities
In early 2015 customers of Sharyland Utilities the smallest investor-owned
transmission and distribution utility in ERCOT began to file with the Commission a
significant number of complaints regarding high electricity bills In response the
Commission opened Project No 44592 Relating to a Project Regarding Sharyland
Utilities to provide for a more formal process for Commission review of the large number
of complaints As part of this project Commission staff prepared a report to evaluate the
electricity rates and electric bills in the operating area of Sharyland Utilities that was
previously part of Cap Rock Energy
Staffrsquos report found that a number of factors contributed to the comparatively high
bills for many of Sharyland-Cap Rockrsquos customers First Sharylandrsquos small size and its low customer density result in high TDU rates for all customers relative to other TDUs In
particular Staffrsquos report found that Sharyland-Cap Rockrsquos rates for distribution service are
up to three times higher than those of other TDUs in Texas In addition to Sharyland-Cap
Rockrsquos high costs for distribution service higher wholesale transmission costs also
contributed to the rate increases charged to Sharyland-Cap Rockrsquos customers These transmission costs are the result of increased transmission investment in recent years
throughout Texas that has increased transmission costs for all distribution providers
18 The participating Texas TDUs are AEP Texas Central Company and AEP Texas North Company (jointly
ldquoAEPrdquo) CenterPoint Energy Houston Electric LLC (ldquoCenterPointrdquo) Oncor Electric Delivery Company LLC (ldquoOncorrdquo) and Texas-New Mexico Power Company (TNMP) collectively referred to as the ldquoJoint TDUsrdquo Operation of an AMS web portal was addressed in the orders approving particular utilitiesrsquo deployment of AMS and approving surcharges for AMS cost recovery While Sharyland Utilities filed comments in the proceeding it did not
participate as it had not fully completed its AMS deployment at the time
22 | P a g e
2017 SCOPE OF COMPETITION IN ELECTRIC MARKETS IN TEXAS REPORT
including Sharyland Utilities Second the comparatively colder winter of 2014 ndash 2015
which was the time period generally consistent with the timeframe in which the
Commission began receiving complaints appeared to result in higher electricity usage than
normal This combination of high TDU rates and the higher electricity usage led to higher
bills for customers
Staffrsquos report also noted that in Sharyland-Cap Rockrsquos last rate case in 2014 the
approved rates reflected movement towards more cost-based rates for all customers
including some customers that previously had been heavily subsidized by other customers
Additionally in the process of standardizing Sharyland-Cap Rockrsquos customer classification
with the classifications of the other TDUs in Texas some customers may have experienced
a move from one class that previously was paying below-cost rates to another class that
was now paying above-cost rates For some of these customers the combined effects of
the movement towards cost-based rates and the change to a different class may have
contributed to a significant change in the customersrsquo rates Regardless of any cost-shifting
between customer classes Sharylandrsquos rates remain two to three times higher than those of other TDUs in Texas for all customers in all classes
On December 4 2015 the Commission signed an order directing Sharyland to file
an application for a comprehensive rate review by April 30 2016 Sharyland filed its rate
application on April 29 2016 in Docket No 45414 Review of the Rates of Sharyland
Utilities LP On October 10 2016 the Commission ordered Sharyland to file an amended
application as soon as practicable but no later than January 1 2017 to reflect the unique
aspects of the companyrsquos organizational structure as a real estate investment trust (REIT) At the time of publication Sharyland is expected to file its amended application in
December 2016
PowerToChoose Website
As part of its ongoing evaluation of the competitive market the Commission
opened Project No 45730 to evaluate the functionality and usability of its PowerToChoose
website which allows customers to select a REP and an electric plan based on their zip
code In the process the Commission received significant feedback from customers stating
that the Commissionrsquos PowerToChoose website was an important tool that plays a
fundamental role in their shopping process In response to the feedback received from
industry representatives and consumers Commission staff changed how the website sorts
and filters retail electric plans adding a filter to allow customers to unselect plans that
contain minimum usage fees or credits This filter is now a default setting and plans with
minimum usage fees and credits are not shown unless the customer actively selects to
search for such plans In addition Commission staff made other changes to increase the
clarity of the REP complaint rating The Commission continues to evaluate other changes
to improve the customer experience of the PowerToChoose website and provide
transparency for retail electric plans
23 | P a g e
2017 SCOPE OF COMPETITION IN ELECTRIC MARKETS IN TEXAS REPORT
Report on Alternative Ratemaking Mechanisms
In 2015 the Legislature enacted SB 774 which requires the Commission or its
consultant to conduct a study and make a report to the Legislature analyzing the alternative
ratemaking mechanisms adopted by other states In addition SB 774 extended the
authorization for the Periodic Rate Adjustment (PRA) mechanism from 2017 to 2019
which the Legislature had authorized in 2011 (SB 1693) as a version of an alternative
ratemaking mechanism that provides to utilities a means for expedited recovery of
distribution infrastructure costs Pursuant to SB 774 the Commission retained a consultant
to produce the report and the consultantrsquos recommendations included streamlining the ratemaking process to reduce procedural costs providing for a periodic review of the
prudency of the costs and using certain types of alternative ratemaking mechanisms that
decouple the recovery of costs from variations in load The Commission held a public
hearing to receive comments on the report from stakeholders and after consideration of
those comments has provided to the Legislature the consultantrsquos report together with its
own discussion of the report
Request for Purchase of Oncor Electric Delivery Company
In March 2016 the Commission approved with conditions an application by an
investor group led by Hunt Consolidated Inc the owners of Sharyland Utilities to acquire
control of Oncor Electric Delivery Company (Oncor) the largest transmission and
distribution utility in Texas from Oncorrsquos parent company Energy Future Holdings which
is in bankruptcy The Commission approved the request subject to certain conditions
including stipulations regarding the organization of the new entities and treatment of tax
benefits The investor-led group subsequently declined to pursue the transaction that was
approved by the Commission
In September 2016 NextEra Energy which owns Florida Power amp Light received
approval from the United States Bankruptcy Court in Delaware for its plan to purchase
Oncor In October 2016 NextEra Energy filed an application with the Commission in
Docket No 46238 for approval of the proposed transaction The Commission will evaluate
the application to determine if the transaction is in the public interest
Integration of Lubbock Power and Light
In March 2016 the Commission opened Project No 45633 to study and identify
the issues related to the request of Lubbock Power and Light the statersquos third-largest
municipally owned utility to be integrated into ERCOT The Commission is currently
working with stakeholders ERCOT and SPP to determine the cost and benefits of any
potential switch by Lubbock Power and Light into ERCOT and whether such a switch is
in the public interest
24 | P a g e
2017 SCOPE OF COMPETITION IN ELECTRIC MARKETS IN TEXAS REPORT
Desalination Project ERCOT Studies
In 2015 the Legislature passed HB 4097 which directed the Commission and
ERCOT to study whether existing transmission and distribution planning processes are
sufficient to provide adequate infrastructure for seawater desalination projects and to study
the potential for desalination projects to participate in demand response opportunities in
the ERCOT market Pursuant to that direction ERCOT staff have prepared a report on the
feasibility of interconnection of large desalination projects and on opportunities for such
projects to participate in ERCOTrsquos demand response programs which is attached to this Report in Appendix B
Oversight and Enforcement Actions
The Commissionrsquos enforcement of statutes rules and orders applicable to entities
under its jurisdiction serves to protect consumers the electric markets the reliability of the
electric grid and to promote fair competition The Commissionrsquos enforcement efforts in the electric industry focus on violations of PURA the Commissionrsquos rules and ERCOT
protocols
During the period from January 2015 through August 31 2016 the Commission
assessed $3258500 in penalties against electric market participants Table 8 provides a
summary of electric industry Notices of Violation since January 2015 During 2015 and
2016 Commission staff opened 212 investigations for the electric industry and closed 177
investigations
Table 8 Notices of Violations
Violation Type Total Penalty Amount
Retail Market Violations $539000
Service Quality Violations $451500
Wholesale Market Violations $2268000
TOTAL $3258500
In addition to the imposition of administrative penalties the Commission uses other
enforcement mechanisms in exercising its enforcement duties including revoking a
companyrsquos certificate to operate In addition some companies may be required to relinquish a certificate as part of a settlement after enforcement action has proceeded
Table 9 provides a breakdown of the number of certificates revoked or relinquished In
2016 the Commission revoked the certificate of the REP TruSmart Energy
Table 9 Certificates Revoked or Relinquished
Type Number
Certificates Revoked 1
Certificates Relinquished 0
25 | P a g e
2017 SCOPE OF COMPETITION IN ELECTRIC MARKETS IN TEXAS REPORT
The Oversight amp Enforcement division also issues warning letters to companies in
the electric market when it determines that a violation occurred but given the
circumstances surrounding the violation and other mitigating concerns no administrative
penalty is warranted During 2015 and 2016 the Oversight amp Enforcement division issued
50 warning letters Finally the Commission generally seeks to reimburse money directly
to customers when appropriate In 2015 and 2016 the Commission ordered the
reimbursement of $8543596 to Texas electric customers
Table 10 Warning Letters
Warning Letter Type Number
Retail Market Warning Letter 8
Service Quality Warning Letter 1
Wholesale Market Warning Letter 41
TOTAL 50
In addition to its enforcement activities the Commission also enters into voluntary
mitigation plans with generators that request one through a contested case proceeding
pursuant to PURA sect15023(f) and 16 TAC sect25504(e) The Commission entered into one
voluntary mitigation plan during 2015 and 2016 in Docket No 44635
Low-Income Discount System Benefit Fund
The System Benefit Fund (SBF) was originally established in 1999 to fund
discounts to low-income customers customer education activities energy-efficiency and
weatherization and electric market oversight through a nonbypassable surcharge on retail
electric bills HB 1101 of the 84th Legislature provided that the SBF be sunset on
September 1 2017 by which time the SBF is intended to be exhausted In the 2016 Fiscal
Year (FY) $325521250 was appropriated in the SBF to provide a 25ndash31 percent discount
to low-income customers over a 12-month period
To assist the drawdown of the remaining balance HB 1101 authorized the
Commission to use any unexpended SBF balance in FY 2017 to assist low-income
customers The Commission estimates that the remaining SBF balance will be
approximately $17 million by August 31 2017 The Commission has determined that this
amount is insufficient to fund the rate reduction program however the Commission will
spend approximately $100000 to continue automatic enrollment in the program to provide
REPs a list of customers eligible to receive late fee waiver and deposit installment benefits
These two ancillary benefits of the rate reduction program will continue for the duration of
FY 2017
26 | P a g e
2017 SCOPE OF COMPETITION IN ELECTRIC MARKETS IN TEXAS REPORT
Homeland Security
The Commission assesses the efforts of ERCOT and utilities to defend against
mitigate and respond to the variety of risks that the modern electricity system faces The
Commission also meets with ERCOT utilities and governmental entities on an ongoing
basis to discuss preparation for everything from hurricanes and other severe weather to
cyber-threats and threats of physical damage to the grid from accidents or intentional
malfeasance In addition the Commission monitors industry and federal programs that
address homeland security issues
The Commission serves as an information liaison between state government and
electric utilities during emergencies The Commissionrsquos main roles include
Conveying outage and service restoration information from electric utilities to
state government
Conveying service restoration priorities (hospitals water treatment facilities
etc) from state government to electric utilities and
Facilitating the clearance of downed power lines in disaster re-entry areas and
facilitating entry of electric utilities into disaster areas
The Commissionrsquos Emergency Management Response Team (EMRT) provided staff at the
State Operation Center for the May 2015 and April 2016 flooding events in Texas as well
as additional staffing for severe winter weather
Demand Response
ERCOT staff have begun to report annually on the participation of customers in
REP-sponsored demand response programs These programs which have been facilitated
by the deployment of smart meters throughout the competitive areas within ERCOT and
by many municipal and cooperative electric utilities take the form of rebates for reduction
in usage during peak period time-of-use pricing real-time volumetric price compensation
for load reduction and direct control of customer load among other plans
These programs have seen dramatic increases in participation since ERCOT began
to gather this information in 2013 From 2013 to 2014 the number of residential customers
participating in these programs increased from 151793 to 721273 and the number of
commercial and industrial customers participating rose from 30275 to 50205 The
Commission continues to monitor ERCOTrsquos stakeholder process for efforts relating to the integration of demand response
27 | P a g e
2017 SCOPE OF COMPETITION IN ELECTRIC MARKETS IN TEXAS REPORT
IV LEGISLATIVE RECOMMENDATIONS
A Determination of Low-Income Customer Eligibility
In 2015 HB 1101 required that all remaining funds in the System Benefit Fund
(SBF) be expended that the fee that funded the program as a nonbypassable surcharge on
electric bills be set at zero and that the SBF be sunset on September 1 2017 Per the
provisions of HB 1101 the SBF fee was set at zero in September 2016 concluding the
funding for the program The sunset of the SBF program also concluded the relationship
between the Texas Health and Human Services Commission (HHSC) and the Commission
in which the HHSC provided to the Commission eligible electric customers for the SBF
low-income discount Because of the termination of the relationship with HHSC with the
termination of the SBF the Commission will no longer be able to determine easily an
electric customerrsquos eligibility for other low-income programs such as late penalty waivers
and the option of paying an electric deposit over multiple months
The Legislature may wish to consider easing low-income customers access to these
low-income programs by facilitating the process used to determine eligibility The
Commission offers four possible approaches in which the Legislature could continue these
low-income programs
(1) Authorize HSSC to provide identification of eligible low-income customers to the
Commission
(2) Allow retail electric providers (REPs) to provide such low-income programs using
the Low Income Discount Administratorrsquos (LIDA) Telecommunications Lifeline
Service Program list to identify low-income customers
(3) Require REPs to offer such low-income programs with customers self-enrolling
and REPs verifying income eligibility or
(4) Allow REPs to voluntarily provide such low-income programs at their own
discretion
B Outside Counsel for Proceedings before Regional Transmission
Organizations
Regional Transmission Organizations (RTO) manage the power grid across wide
regions of the United States Most of Texas is inside the ERCOT region however there
are significant portions of East Texas and the Panhandle that are in the Midcontinent
Independent System Operator (MISO) and the Southwest Power Pool (SPP) Issues arise
in these other RTOs that have significant impact on Texas ratepayers such as how
transmission infrastructure costs will be shared These tend to be very lengthy and
complicated proceedings that require specialized legal and consulting services
28 | P a g e
2017 SCOPE OF COMPETITION IN ELECTRIC MARKETS IN TEXAS REPORT
PURA sect 394525 currently authorizes the Commission to use outside consultants
auditors engineers or attorneys to represent the Commission in proceedings before the
Federal Energy Regulatory Commission This provision has been an important tool for the
Commission to respond to complex matters in the federal arena to enable it to protect the
public interest in Texas The PUC recommends that the Legislature expand the language
in this statute to include the ability to hire outside assistance for proceedings before other
RTOs to provide those same protections to Texas ratepayers in those areas
C Repeal of Natural Gas and Renewable Energy Mandates
1 Natural Gas
PURA sect 399044 establishes natural gas as ldquothe preferential fuelrdquo in Texas for electricity generation and requires the Commission to adopt rules to establish a system of
natural gas energy trading credits The majority of all new non-renewable electricity
generation constructed since 2000 for Texas has used natural gas as a primary fuel and this
trend is expected to continue in the foreseeable future The thresholds used to trigger the
natural gas energy trading credit system in PURA sect 399044 have not been reached and
they are not expected to be reached in the foreseeable future
Because natural gas-fueled facilities have been the most commonly built new
generation in Texas for many years and are expected to continue to be there is no need to
establish incentives for natural gas generation The PUC recommends that the Legislature
consider repealing PURA sect 399044 because it is no longer necessary
2 Renewable Energy
PURA sect 39904 establishes goals for renewable energy Subsection (a) requires
the installation of 5880 megawatts of renewable energy by 2015 and Subsection (b)
establishes a renewable energy credits trading program to implement the requirement The
5880 megawatts mandates in Subsection (a) was met in 2008 While the Commission
believes the renewable energy trading credit program is needed for retail electric providers
to validate renewable energy marketing claims the Commission believes the 5880
megawatts mandate in Subsection (a) is no longer necessary
D Advisory Opinions
Many regulatory agencies in Texas have authority to issue informal guidance to the
persons they regulate particularly with respect to outlining whether a particular course of
conduct would in the agencyrsquos view be consistent with the laws and regulations that the agency administers19 The issuance of an advisory opinion can provide regulatory clarity
to a company before making investments or conducting operations the permissibility of
which may be unclear under state law The Legislature may want to consider granting the
19 In addition certain federal agencies such as the Federal Communications Commission
Internal Revenue Service Securities and Exchange Commission and Federal Election
Commission have authority to issue advisory opinions
29 | P a g e
2017 SCOPE OF COMPETITION IN ELECTRIC MARKETS IN TEXAS REPORT
Commission the authority to issue advisory opinions In the electric industry providing
clarification to a company concerning issues such as the purchase of assets or the
acquisition of another company could allow it to avoid expensive regulatory proceedings
without impairing the Commissionrsquos authority The following state agencies have statutory authority to issue advisory opinions
Texas Ethics Commission20
Texas Medical Board21
State Board of Dental Examiners22
Texas Board of Nursing23
Texas Board of Professional Engineers24
Texas Lottery Commission and25
Texas Securities Board26
E Administrative
Gross Receipts Assessment
PURA sect 16001 provides for a gross receipts assessment that is used to defray the
expenses incurred by the Commission to administer PURA An assessment of one sixth of
one percent is collected from public utilities electric cooperatives retail electric providers
and interexchange carriersrsquo gross receipts from consumers The funds from this assessment
are remitted to the general revenue fund but currently they have not been explicitly
dedicated to funding of the Commission In contrast similar assessments on water
utilities insurance companies and other regulated entities have traditionally been used to
explicitly fund the underlying regulatory programs at the respective agencies The
Commission is one of four Article VIII agencies that is not designated as self-funded
The Commission recommends that the Legislature designate the Commission as a
self-funded agency whereby the collected assessments would be explicitly dedicated to the
funding of the agency Implementing this recommendation would require the Public Utility
Commission to be included in the Appropriations Limited to Revenue Collections rider
located in the Special Provisions Relating to All Regulatory Agencies section of the
General Appropriations Act Designation as a self-leveling agency would require the
Commission to set the gross receipts assessment at a rate sufficient to generate revenue in
the amount of the agencyrsquos general revenue appropriation each fiscal year which would require a statutory change to PURA sect16001(b) Based upon the Commissionrsquos baseline budget request authorizing the PUCrsquos self-leveling designation would result in an overall
estimated tax reduction of $456 million per year or 774
20 Government Code sect 571091 21 Occupations Code sect 162107 22 Occupations Code sect 258157 23 Occupations Code sect 301607 24 Occupations Code sect 1001601 25 Occupations Code sect 2001059 26 Tex Rev Civ Stat Ann Arts 581-28-1 amp 581-35 7 Tex Admin Code 1012
30 | P a g e
2017 SCOPE OF COMPETITION IN ELECTRIC MARKETS IN TEXAS REPORT
V APPENDICES
31 | P a g e
2017 SCOPE OF COMPETITION IN ELECTRIC MARKETS IN TEXAS REPORT
Appendix A ndash Acronyms
AEP American Electric Power
AMS Advanced Metering System
CenterPoint CenterPoint Energy Houston Electric LLC
DG Distributed Generation
DRG Distributed Renewable Generation
ERCOT Electric Reliability Council of Texas
ERSC Entergy Regional State
ERS Emergency Response Service
ETI Entergy Texas Inc
IMM ERCOT Independent Market Monitor
kWh Kilowatt-hour
LMP Locational Marginal Pricing
LSP Large Service Provider
MISO Midwest Independent System Operator
MMBtu One million British Thermal Unit (BTU)
MW Megawatt
MWh Megawatt-hour
Nodal Texas Nodal Market Design
ORDC Operating Reserve Demand Curve
PGC Power Generation Company
POLR Provider of Last Resort
PURA Public Utility Regulatory Act
REP Retail Electric Provider
RSC Regional State Committee
RTO Regional Transmission Organization
SCED Security Constrained Economic Dispatch
Sharyland Sharyland Utilities LP
SBF System Benefit Fund
SPP Southwest Power Pool
TDU Transmission and Distribution Utility
TNMP Texas-New Mexico Power Company
32 | P a g e
2017 SCOPE OF COMPETITION IN ELECTRIC MARKETS IN TEXAS REPORT
Appendix B ndash ERCOT Desalination Report
This page intentionally left blank
33 | P a g e
ERCOT Public
Study on the Demand Response Potential for Seawater Desalination Projects
ERCOT November 18 2016
Study on the Demand Response Potential for Seawater Desalination Projects ERCOT Public
Executive Summary
In 2015 the 84th Texas Legislature enacted House Bill (HB) 4097 which included several provisions relating to seawater desalination projects including a requirement that the Public Utility Commission of Texas (PUC) and Electric Reliability Council of Texas (ERCOT) study the potential for seawater desalination projects to participate in existing demand response opportunities in ERCOT There are several demand response products in which demand-side resources (ie consumers of electricity) can participate These programs help to preserve system reliability and provide economic benefits to participating demand-side resources Seawater desalination is an energy-intensive process that removes salt and other minerals from salt water to produce fresh water for municipal consumption industrial use or irrigation Participation in demand response could help mitigate electricity costs for future seawater desalination projects in Texas and provide reliability benefits to the grid
There are two main demand response reliability-based services administered by ERCOT participation by demand-side resources in the Ancillary Services market and the Emergency Response Service (ERS) Within the Ancillary Services market the most common service provided by demand-side resources is Responsive Reserve Service (RRS) which requires resources to respond either instantaneously or within 10 minutes in response to unplanned system emergencies ERS is separate from ERCOTrsquos Ancillary Services market and allows demand-side resources and distributed generation to provide reliability services in the event of an energy emergency Resources can qualify for either the 10-minute or 30-minute response time ERS programs
There are several key considerations that will impact a demand-side resourcersquos ability to participate in different demand response opportunities response time recovery time predictability of electrical demand and flexibility of operations Considering these factors together it appears that seawater desalination plants could be designed to meet the requirements for participation in demand response Because the ability to meet the qualification requirements is dependent on the plant design demand response opportunities should be considered early in a projectrsquos development if participation is desirable
Whether project developers will choose to address these requirements will depend on the economic benefits of participation There may be additional costs to design seawater desalination plants to operate in the manner required in order to participate in demand response These include costs associated with additional plant design specifications need for excess capacity and storage to make up for lost production during demand response deployment operational costs resulting from interruptions to plant processes and potential financial penalties if demand response deployment results in failure to meet contract demands The interplay of the benefits of participation and these costs will determine whether it would be beneficial for a future seawater desalination plant to participate in demand response in ERCOT
To date participation of seawater desalination plants in demand response programs has been limited Because the process of seawater desalination is energy-intensive participation in demand response could help to reduce electricity costs while posing a relatively low risk to plant operations As stakeholders in Texas continue to plan for possible future droughts in the region and identify water management strategies consideration of demand response could play a role in mitigating some costs associated with seawater desalination and allow seawater desalination plants to assist with maintaining electric reliability in the region
copy 2016 ERCOT All rights reserved i
Study on the Demand Response Potential for Seawater Desalination Projects ERCOT Public
Table of Contents
1 Introduction 1
2 Seawater Desalination 2
21 Seawater Desalination Plant Operations 2
22 Seawater Desalination Plant Economics 3
3 Demand Response Opportunities in ERCOT 4
31 ERCOT-Dispatched Demand Response 4
311 Ancillary Services Markets 5
312 Emergency Response Service (ERS) 5
32 Non-ERCOT-Dispatched Demand Response 6
321 Four Coincident Peak (4CP) 6
322 LSE or DR Provider Contracted Price Response 6
323 Self-Directed Price Response 6
4 Demand Response Potential for Seawater Desalination 7
41 Operational Considerations for ERCOT-Dispatched Demand Response 7
42 Economic Considerations for ERCOT-Dispatched Demand Response 8
43 Considerations for Non-ERCOT-Dispatched Demand Response 9
5 Conclusion 11
copy 2016 ERCOT All rights reserved ii
Study on the Demand Response Potential for Seawater Desalination Projects ERCOT Public
1 Introduction
In 2015 the 84th Texas Legislature enacted House Bill (HB) 4097 which included several provisions relating to seawater desalination projects including a requirement that the Public Utility Commission of Texas (PUC) and Electric Reliability Council of Texas (ERCOT) study the potential for seawater desalination projects to participate in existing demand response opportunities in ERCOT ERCOT and the PUC initiated this study to fulfill that requirement and evaluated the operational and economic characteristics of seawater desalination plants in light of ERCOTrsquos primary demand response products1
ERCOT is the independent system operator (ISO) for the ERCOT Interconnection which encompasses approximately 90 of demand for electricity in Texas ERCOT is the independent organization established by the Texas Legislature to be responsible for the reliable planning and operation of the electric grid for the ERCOT Interconnection ERCOT also administers and maintains a forward-looking open market to provide affordable and reliable electricity to consumers in Texas In collaboration with market participants ERCOT has developed demand response products and services for customers that have the ability to reduce or modify electricity use in response to instructions or signals These programs help preserve system reliability and provide economic benefits to participating demand-side resources
The process of seawater desalination removes salt and other minerals from salt water to produce fresh water for consumption industrial processes or irrigation The drought-prone Texas climate coupled with projections for increasing water demand in the state has created interest in seawater desalination as a future water source The 2017 Texas State Water Plan includes seawater desalination as a future water management strategy for water users in the state However the seawater desalination process is energy intensive and electricity consumption can be a significant cost driver for these projects To the extent that these plants could participate in demand response it would help to defray these costs Thus there is a potential nexus between seawater desalination projects built in Texas to mitigate drought but which have large electricity requirements and ERCOT demand response opportunities which could help to reduce their electricity costs and provide reliability benefits
This study evaluates the demand response potential of seawater desalination plants based on their operational characteristics and economic drivers The report is organized as follows
Section 2 provides background on typical seawater desalination plant operations and economics
Section 3 describes the current demand response opportunities in ERCOT
Section 4 evaluates the characteristics of seawater desalination plants to determine their potential to participate in demand response opportunities in ERCOT and
Section 5 provides a summary of the conclusions of this study
1 In the course of developing this report ERCOT consulted with several desalination experts with experience with existing or planned seawater desalination plants in the US The technical experts consulted included Jorge Arroyo (Water Management Consultant) Andrew Chastain-Howley (Black amp Veatch) Jonathan Loveland (Black amp Veatch) Ron Parker (Black amp Veatch) John Wolfhope (Freese and Nichols) and Srinivas Veerapaneni (Black amp Veatch)
copy 2016 ERCOT All rights reserved 1
Study on the Demand Response Potential for Seawater Desalination Projects ERCOT Public
2 Seawater Desalination
There are two primary methods for seawater desalination distillation (also referred to as ldquothermalrdquo) and reverse osmosis Distillation uses heat to remove salts and minerals from seawater by boiling water at high pressures In contrast reverse osmosis technology forces saline water through a membrane to separate water from the salts and minerals While both distillation and reverse osmosis are energy intensive distillation requires thermal energy to heat the water and overall has a higher energy requirement whereas reverse osmosis requires primarily electrical energy and overall is less energy intensive ndash though still with significant electricity requirements
Globally most thermal desalination plants are located in the Middle East due to low energy prices in the region Plants located elsewhere including in the US typically use reverse osmosis technology2 There are two large existing seawater desalination plants in the US one in Carlsbad California providing water to the San Diego area and one in Gibsonton Florida providing water to the Tampa Bay area Both plants use reverse osmosis technology In addition there are several desalination projects currently in the planning stages or under development in Texas in the Corpus Christi area that would use reverse osmosis technology For that reason this report focuses on reverse osmosis technology in the evaluation of demand response potential of seawater desalination plants
While there are currently no existing seawater desalination plants in Texas there are several municipal and industrial brackish water desalination plants in the state According to the Texas Water Development Board (TWDB) there are 46 municipal brackish water desalination plants with capacities greater than 0025 million gallons per day (MGD) in Texas representing a total of 123 MGD of capacity3 The desalination of brackish water is typically less expensive compared to seawater due to the lower relative salinity of brackish water This study focuses exclusively on seawater desalination consistent with the requirements of HB 4097 but it should be noted that conclusions may also apply to brackish water desalination though at a different cost and scale
This section provides high-level information on the operations (Section 21) and economics (Section 22) of seawater desalination plants to inform the discussion of their demand response potential in Section 4
21 Seawater Desalination Plant Operations Seawater desalination plants typically range in capacity from less than 5 MGD up to 165 MGD For example the Carlsbad seawater desalination plant has a capacity of approximately 50 MGD and the plant in Tampa Bay has a capacity of approximately 25 MGD The associated electricity consumption ranges between 10 and 15 kWh1000 gallons produced depending on the salinity of the water being processed456 More saline water (eg seawater) requires larger amounts of electricity for desalination Thus a seawater desalination plant would have larger electricity consumption requirements compared to a similarly sized brackish water desalination plant
2 American Water ldquoInnovation Solutions within the Water Industry Desalinationrdquo Available at httpwwwamwatercomfilesInnovationsSolutionsWithinTheWaterIndustryDesalinationpdf 3 Texas Water Development Board ldquoDesalination Factsrdquo Available at httpswwwtwdbtexasgovinnovativewaterdesalfactsasp 4 American Membrane Technology Association April 2016 ldquoMembrane Desalination Power Usage Put in Perspectiverdquo Available at httpwwwamtaorgcomwp-contentuploads7_MembraneDesalinationPowerUsagePutInPerspectivepdf 5 Water Reuse Association November 2011 ldquoSeawater Desalination Power Consumptionrdquo Available at httpswatereuseorgwpshycontentuploads201510Power_consumption_white_paperpdf 6 Ghaffour N TM Missimer and G Amy January 2013 ldquoTechnical review and evaluation of the economics of water desalination Current and future challenges for better water supply sustainabilityrdquo Desalination 309 pp197-207 Available at httpswwwresearchgatenetpublication256693140_Technical_review_and_evaluation_of_the_economics_of_water_desalination_ Current_and_future_challenges_for_better_water_supply_sustainability
copy 2016 ERCOT All rights reserved 2
Study on the Demand Response Potential for Seawater Desalination Projects ERCOT Public
While the two existing seawater desalination plants in the US were co-located with power plants to ease compliance with regulations on water intake and discharge structures and reduce costs many other reverse osmosis desalination plants receive their electricity from the grid However plants may have on-site backup generation in case of a power outage This will vary depending on the size and design of the plant and other factors For example the Carlsbad plant in California does have diesel backup generation to power control systems and flushing systems in the case of a power outage The plant in Tampa Bay was not built with backup power due to potential storm surge risks from hurricanes and other storms The plant does use uninterruptible power supply (UPS) backup to power control systems during power outages
Reverse osmosis plants are typically designed with several ldquotrainsrdquo which consists of a high-pressure pump turbine and reverse osmosis membrane Desalination plants are turned on or off one train at a time in a highly controlled process The process of ramping up or down an individual train under normal operations typically takes one to two hours While plants can be designed to handle immediate shutdowns (ie in a power outage) re-starting a system after an interruption would take this amount of time In addition the saline water must be pretreated (ie filtered) before going through the reverse osmosis train and this can sometimes pose constraints on the flexibility of operations
Demand for water is the key factor driving the level of production at seawater desalination plants Typically the plant will have a contract or contracts with municipal or other water users to deliver desalinated water and is operated to meet that demand Alternatively if the plant is municipally owned it would similarly be operated to meet the level of water demand in conjunction with other available water sources If water demands are close to a plantrsquos full capacity the operatorrsquos flexibility to adjust its electricity consumption as part of demand response may be limited However this does mean that plant operations are fairly predictable on a day-to-day basis which is necessary for participation in demand response
The amount of flexibility in plant operations will also be impacted by the amount of water storage available For example if a plant has sufficient water storage on-site or storage within the customerrsquos distribution system it could provide flexibility for the plant to reduce its operations during peak hours when electricity prices are likely to be highest It would also mitigate the impacts of interruptions to production from demand response deployments
22 Seawater Desalination Plant Economics Seawater desalination is typically more expensive than other sources of water and a major driver of the overall cost is energy costs In 2016 the Carlsbad plant charged rates at between $2131 and $2367 per acre-foot78 This charge is intended to cover both the fixed costs of the plant and the variable costs to produce a unit volume of water Typically half to two thirds of the cost of providing desalinated seawater are accounted for by capital cost recovery with the remainder accounted for by operations and maintenance costs including electricity costs Electricity costs can account for 20shy25 of the total costs of seawater desalination with reverse osmosis technology9
Factors affecting the capital cost of a seawater desalination plant include plant size type of desalination process and pre-post-treatment technologies plant infrastructure (eg piping water storage backup power) and compliance with applicable regulations (eg regulations on intake structures brine byproduct disposal) A significant driver of operating and maintenance costs is membrane replacement Reverse osmosis membranes need to be replaced every few years and
7 Source San Diego County Water Authority ldquoSeawater Desalinationrdquo Available at httpwwwsdcwaorgseawater-desalination 8 Note that 1 acre-foot is approximately 325851 gallons 9 Based on technical input from Black amp Veatch
copy 2016 ERCOT All rights reserved 3
Study on the Demand Response Potential for Seawater Desalination Projects ERCOT Public
the rate at which they are replaced will depend on the salinity of the feedwater and how the plant is operated Treatment and disposal of the salty brine byproduct from desalination may also incur operating costs
Electricity costs will vary depending on a range of factors including the size of the plant type of desalination technology source of electricity and quality of the feedwater As previously noted more saline water requires higher amounts of electricity in desalination and thus the amount of electricity consumption is a key difference between brackish water and seawater desalination As a result electricity costs comprise a significant share of the costs of seawater desalination These costs could potentially be defrayed in part by participation in demand response initiatives
3 Demand Response Opportunities in ERCOT
Broadly speaking demand response can be broken down into two major categories dispatchable or non-dispatchable For purposes of this report we will define dispatchable as those demand response events that are initiated by ERCOT and non-dispatchable as an event not specifically initiated by ERCOT These non-dispatchable events may include decisions made by the end-use customer to alter its consumption pattern or may include contractual obligations with another entity such as the end-use customerrsquos retail electric provider (ldquoREPrdquo) to alter consumption patterns
ERCOTrsquos wholesale market is open to several types of dispatchable demand response which are deployed to maintain system reliability Demand-side resources providing Emergency Response Service (ERS) may offer based on either a 10 or 30-minute response time commonly referred to as the ldquoramp periodrdquo Alternatively demand-side resources may register and qualify as a Load Resource that can provide Reserves in the Ancillary Services market The most common service provided by demand-side resources is Responsive Reserve Service which requires an under-frequency relay that can instantaneously interrupt the load during certain system reliability events Some demand-side resources can also participate in other Ancillary Services as Controllable Load Resources that require sophisticated control systems that allow them to be deployed in a more incremental proportional manner
Non-dispatchable demand response in ERCOT can include a response to avoid transmission costs where rates are based on Four Coincident Peak Pricing (4CP) response to wholesale energy prices initiated by the customer or by a REP or other load-serving entity (ldquoLSErdquo) or utility-managed Load Management programs (LM)
The sections that follow provide a description of both ERCOT-dispatched (Section 31) and nonshyERCOT-dispatched (Section 32) demand response For a more detailed description of opportunities for demand-side resources to participate in demand response in ERCOT see ERCOTrsquos guide Load Participation in the ERCOT Nodal Market10
31 ERCOT-Dispatched Demand Response There are two main demand response reliability-based services administered by ERCOT participation by demand-side resources in the Ancillary Services market and participation in ERS These services are dispatched by ERCOT during system emergencies
10 Available at httpwwwercotcomcontentservicesprogramsloadLoad20Participation20in20the20ERCOT20Nodal20Market_302d oc
copy 2016 ERCOT All rights reserved 4
Study on the Demand Response Potential for Seawater Desalination Projects ERCOT Public
Demand-side resources with demand response capability that can meet a set of performance requirements can be qualified to provide Ancillary Services as Load Resources in the Ancillary Services Market The value of having a Load Resource available to reduce load is equal to the value of having a generator available to increase its generation at a generating plant The providers of operating reserves selected to provide Ancillary Services are eligible for capacity payments regardless of whether the Resource is actually deployed (or curtailed in the case of the Load Resource)
ERCOT holds auctions on a daily basis for each of the following Ancillary Services Regulation Up Regulation Down Responsive Reserve and Non-Spinning Reserve11 Table 1 describes the various Load Resource types and their qualification requirements and eligible services
Table 1 Load Resource Types and Ancillary Services
Service Load Resource Type a Qualification Responsive Reserves (le50 of total Reserve requirement)
Non Controllable Under-Frequency Relay and 10-minute ramp to manual dispatch instruction
Responsive Reserves
Controllable Primary Frequency Response and follow 5-minute dispatch instructions
Regulation-Up Regulation-Down
Controllable Primary Frequency Response and respond to Regulation deployments
Non-Spin Reserves Controllable Follow 5-minute dispatch instructions a A Controllable Load Resource is a Load Resource capable of controllably reducing or increasing consumption under dispatch control by ERCOT
Demand-side resources that agree to reduce load when directed by ERCOT and that meet other metering and operational requirements as specified in the ERCOT Protocols may participate in Ancillary Services market auctions As noted in Table 1 the type of Ancillary Service that a Load Resource may provide will depend upon the demand-side resourcersquos response time and metering system as well as other requirements described in the Protocols In the Responsive Reserve and Non-Spin Reserve markets the Load Resource will receive capacity payments regardless of whether or not the load was actually deployed but the load must be available for deployment at any time while providing the service
ERCOT procures ERS to maintain grid reliability during emergency conditions and reduce the likelihood of the need for rotating outages ERS participants may offer to provide demand response with either a 10-minute ramp period requirement (similar to Load Resources providing Responsive Reserve Service) or a 30-minute ramp period requirement ERS Resources do not have the same telemetry and under-frequency relay requirements as Load Resources
11 Regulation Up and Regulation Down service respond to signals from ERCOT every 4 seconds to respond to changes in system frequency full response has to be provided within 5 minutes Responsive reserves must provide their committed capacity either instantaneously in an under-frequency event (eg due to a generator outage) or in energy scarcity conditions within ten minutes following an instruction from ERCOT Non-spinning reserves must provide their committed capacity within 30 minutes based on economic dispatch instructions Non-spinning reserve is used as replacement reserve to replenish other ancillary services and during energy scarcity
copy 2016 ERCOT All rights reserved 5
Study on the Demand Response Potential for Seawater Desalination Projects ERCOT Public
ERS is procured through a request for proposal (RFP) process three times per year for four-month contract terms each of which is further split into smaller time periods based on business cycles and other factors Demand-side resources may choose to submit offers in all time periods or only in those that best fit their unique circumstances and may vary both the price and demand response capacity offers by time period
Payments for ERS are performed up to 80 days after each four month contract term has ended and are subject to downward revision based upon delivered demand response capacity and the demand-side resourcersquos availability during the contract term
32 Non-ERCOT-Dispatched Demand Response The options listed below are not dispatched by ERCOT but they either are controlled directly by a customer or are dispatchable by another entity such as a demand response provider (ldquoDR Providerrdquo) REP or a transmission and distribution utility
Many industrial customers are subject to transmission charges based upon a Four Coincident Peak (4CP) demand The 4CP demand is determined by averaging the consumerrsquos actual demand during the 15-minute settlement interval with the highest ERCOT demand during each of the four summer months (June through September) This measured 4CP demand serves as the basis for the customerrsquos transmission tariff charges for the following year By correctly predicting the ERCOT system peaks during the summer and curtailing load during those intervals a consumer can help reduce the stress imposed on the electric system during peak periods of consumption and reduce its transmission charges for the following calendar year
In the competitive areas of ERCOT consumers can contract with their REP or a DR Provider to have their load respond to the REPrsquos or DR Providerrsquos instructions The contract will usually outline the parameters of this response ndash at what times and frequency demand response events can be called ramp periods sustained response periods compensation etc Because this response is a contractual matter between the REP or DR Provider and the consumer a great deal of variety can be present in these arrangements For example a consumerrsquos response may be voluntary or required compensation could come in the form of reduced energy prices or rebate payments for each curtailment event consumers might be notified up to a day in advance or could have no notification at all (for automated curtailment)
In areas of ERCOT not open to competition interruptible tariffs may be available These tariffs will usually offer a reduced energy price for defined curtailment obligations
REPs may offer dynamic pricing options or consumers within a municipality or cooperative may have their energy prices determined by a published tariff which also may be structured based upon Time-of-Use (TOU) or have a Critical Peak Pricing (CPP) or Peak Time Rebate (PTR) component Self-directed price response refers to consumers making an independent decision to respond to energy prices contained in a governing tariff or in either the ERCOT Day Ahead or Real Time energy markets
TOU offerings will typically have higher energy prices during normal peak periods ndash for example a TOU tariff may charge one price during Monday through Friday from 2 pm through 8 pm and another price during all other times Customers may choose to reduce consumption during these high priced periods Load reduction can be accomplished by load shifting (loads can be shifted by
copy 2016 ERCOT All rights reserved 6
Study on the Demand Response Potential for Seawater Desalination Projects ERCOT Public
rescheduling certain processes or by utilizing thermal storage) ending certain processes that are no longer economic or through energy efficiency measures
Offerings that incorporate CPP usually have prescribed high prices only during certain defined periods ndash for example when load or prices are expected to reach a certain level Response to CPP may be similar to those employed under TOU tariffs especially if CPP is reached frequently More often CPP is infrequent and as such short-term load curtailment may be the more appropriate response to meet economic objectives
4 Demand Response Potential for Seawater Desalination
This section evaluates whether the operational characteristics and economics of seawater desalination plants would enable them to participate in one or more of the various demand response opportunities in the ERCOT Region To date participation of seawater desalination plants in demand response programs has been limited Neither the plant in Carlsbad nor the plant in Tampa Bay participate in demand response programs in California or Florida respectively However as will be described below it appears that these plants can be designed and operated to meet the requirements for participation in demand response and receive economic benefit from participation in these programs
Section 41 describes the operational parameters that must be met for a demand-side resource to provide ERCOT-dispatched demand response and evaluates the ability of seawater desalination plants to meet these criteria Section 42 discusses the tradeoffs between payments for participation in ERCOT-dispatched demand response and potential additional costs posed to seawater desalination plants Finally Section 43 presents other opportunities for seawater desalination plants to reduce their electricity costs outside of ERCOTrsquos reliability-based services that are open to demand response assets
41 Operational Considerations for ERCOT-Dispatched Demand Response There are several key operational parameters that impact a demand-side resourcersquos ability to participate in different demand response services response time recovery time predictability of electrical demand and flexibility of operations This section discusses each of these considerations as they apply to seawater desalination plants
As discussed in Section 31 one of the differentiating factors between ERCOTrsquos demand response products is the amount of time within which a demand-side resource must respond to a deployment instruction to reduce electricity consumption during an event Participation in RRS requires an automatic response within either half a second (ie instantaneous) based on grid frequency or within 10 minutes via a manual instruction ERS requires a response time of either 10 or 30 minutes As noted in Section 21 the typical time to take a reverse osmosis train on- or off-line is 1-2 hours under normal controlled operations To comply with the response time requirements of RRS or ERS a seawater desalination plant would need to be able to reduce its electricity consumption far more quickly than in normal operations This is an element of plant design that would need to be accounted for in the specifications of the project Considerations include the potential need for on-site backup generation including uninterruptible power supply potential impacts to plant infrastructure (eg piping) reverse osmosis membranes and pretreatment systems
The two large US desalination plants provide illustrative counterpoints in this respect The Carlsbad plant was designed to withstand instantaneous power interruptions and has on-site backup generation including uninterruptible power supply to provide the ability to power control systems and flush the membranes in the event of a power loss In contrast the Tampa Bay plant was not
copy 2016 ERCOT All rights reserved 7
Study on the Demand Response Potential for Seawater Desalination Projects ERCOT Public
designed with on-site backup generation and a loss of power would result in a plant shutdown and may require several days to bring the plant back on-line Thus it appears that it is technically possible for a seawater desalination plant to meet the response time requirements for participation in demand response so long as this factor is considered in the design of the facility
The time it takes a desalination train to return to operations after an event is also a consideration Demand-side resources participating in RRS must be able to come back on-line within three hours and those participating in ERS must return within 10 hours Again it appears that it is technically feasible for desalination plants to meet this requirement so long as this requirement is considered in the plant design
An additional consideration is the predictability of a demand-side resourcersquos electricity consumption Participation in the responsive reserves ancillary service market requires bidding in the day-ahead market and thus a demand-side resource must know with great accuracy (within 95) its electrical demand at least a day ahead of time For ERS auctions are held three times a year for four-month contract periods Thus to participate in ERS a resource must know its forecasted electrical demand several months in advance Because seawater desalination plant operations are driven by contracted demand for water it is likely that a plant operator would have a good idea of the plantrsquos electrical demand days or even weeksmonths in advance especially for summer months when demand is likely to be relatively steady An important consideration however is the salinity of the water which drives the electrical requirements and which can be impacted by recent weather events Similarly reductions in demand for water during non-summer months or wet summer days where demand may be reduced could also impact a plantrsquos ability to predict its electricity demand
Finally a seawater desalination plant must have sufficient flexibility in its day-to-day operations so that it can afford to lose several hours of production when deployed for demand response It should be noted that demand-side resources participating in RRS and ERS are called infrequently demand-side resources providing responsive reserves were deployed one time in 2015 and ERS was not deployed that year However this is an important factor to consider if a plant is operating at close to full capacity and would incur financial penalties if it fails to meet its contract obligations due to a demand response event Including additional storage and building a plant with extra capacity could help to mitigate this risk It should also be noted that a plant operator does not need to commit the full plant capacity to these services but rather can specify an amount of MW that will be committed Thus a plant operator could mitigate issues both with predictability and flexibility of plant operations by committing only a portion of its predicted electrical demand to participate in demand response
Considering these factors together it appears that seawater desalination plants could be designed to meet the operational requirements for participation in ERCOTrsquos demand response services (both RRS and ERS) Because the ability to meet the requirements is dependent on the plant design demand response would need to be considered early in a projectrsquos development if participation is desirable Whether project developers will choose to address these requirements will depend on the economic benefits of participation in demand response which will be discussed in the next section
42 Economic Considerations for ERCOT-Dispatched Demand Response This section describes the economic benefits to demand-side resources from participation in ERCOT-dispatched demand response programs The average price paid for a demand-side resource participating in RRS in 2015 was $1087 per MW per hour and for ERS was $645 per MW per hour for the contract periods during the 2015 program year These payments could provide a significant financial benefit to seawater desalination plants To give a simplified example for a plant with an electrical demand of 10 MW operating at a 100 annual load factor (10 MW times 24 hours times 365 days) the annual benefit would be on the order of $500000 for ERS or $1 million for RRS
copy 2016 ERCOT All rights reserved 8
Study on the Demand Response Potential for Seawater Desalination Projects ERCOT Public
In 2015 demand-side resources providing responsive reserves were deployed one time for a duration of 10 minutes and ERS was not deployed12 The most ERS was ever deployed in a single year was two times in 2011 Thus participation in either program could result in a substantial payment to a seawater desalination plant with a relatively low risk of deployment and associated disruption of plant operations although it is important to note that participation in either ERCOT service subjects demand response resources to annual unannounced testing Other than testing the frequency of deployment will depend on grid conditions and is a risk that should be considered
The financial benefits of participation must be weighed against the costs of designing facilities with the capabilities to operate in this manner These include
bull The costs to design the plant to reduce electrical demand within the required timeframes for demand response and to withstand an instantaneous interruption if not already part of the plant design For example a plant may need to be designed to have backup power generation on-site In addition there could also be costs to restart the system after an interruption
bull The costs to build a plant with excess capacity andor storage to make up for lost production hours when demand response is deployed This will add to the total capital costs of the project Land area constraints should also be considered when considering additional storage as the space requirements for the necessary storage capacity could be significant
bull Costs associated with the impact of interruptions on plant processes (eg more frequent replacement of membranes impacts to pretreatment system or plant infrastructure)
bull Potential financial penalties that would be incurred if deployment as part of demand response were to result in failure to meet contract obligations to supply water
bull The loss of potential benefits in the form of cost avoidance from participation in non-ERCOTshydispatched demand response opportunities (see Section 43) If a plant is committed to RRS or ERS the plant operator would lose the flexibility to take advantage of these other opportunities to reduce their electricity costs
The interplay of these benefits and costs will determine whether it would be beneficial for a future seawater desalination plant to participate in demand response in ERCOT
43 Considerations for Non-ERCOT-Dispatched Demand Response Outside of the reliability-based services administered by ERCOT there are other opportunities for seawater desalination plants to reduce their electricity costs As described in Section 321 seawater desalination plants may be able to reduce the demand charges on their electricity bills through curtailing load during 4CP intervals In addition plant operators may adjust operations in response to real-time electricity prices to take advantage of lower off-peak prices and avoid price spikes (see Sections 322 and 323) All of these opportunities require that the plant have flexibility to reduce production during certain times of the day
In the ERCOT region as noted above a portion of transmission and distribution charges are set based on the peak systemwide 15-minute interval of the four summer months (June through September) referred to as the four coincident peaks (4CP) Large customers can reduce or avoid this charge by reducing electrical consumption during these four peak intervals AEP Central Texas and CenterPoint are the transmission providers covering the majority of the Gulf Coast in Texas13
12 ERCOT June 2016 ldquoLoad Resource Deployment Updaterdquo Available at httpwwwercotcomcontentwcmkey_documents_lists870985_RRS_Load_Resource_Deployment_Updatepdf 13 It is also possible that a seawater desalination plant could be located in an area that as not opted in to competition in which case the plant owner would need to negotiate its electricity charges bilaterally with the Non Opt-In Entity (NOIE)
copy 2016 ERCOT All rights reserved 9
Study on the Demand Response Potential for Seawater Desalination Projects ERCOT Public
Assuming a future seawater desalination plant would be connected at transmission-level voltages the relevant 4CP charges based on the 2016 tariffs accounting for both transmission charges and transmission cost recovery factors would be $41425 per 4CP kW for AEP Central Texas and $41870 per 4CP kVA for CenterPoint14 If a seawater desalination plant has 10 MW of load and is capable of interrupting all of it and successfully does so for all four 4CP intervals the savings based on the 2016 tariffs would be approximately $500000 per year ($41425 times 1000 (kW to MW) times 10 MW times 12 months) Thus a seawater desalination plant that reduces its electricity use during the 4CP intervals could avert some or all of these charges
Another opportunity for seawater desalination plants to reduce their electricity costs is through adjusting operations in response to real-time electricity prices In 2015 the average electricity price in ERCOT was $2677MWh However prices exceeded $50MWh in 254 hours (3 of all hours) $100MWh in 88 hours (1) $200MWh in 40 hours (05) and $300MWh in 21 hours (02) Prices exceeded $3000MWh for 021 hours15 Depending on the desalination plantrsquos exposure to real-time wholesale market prices (via its retail contract) the degree of high prices the plant owner is willing to avoid and grid conditions in a given year reducing unit operations in order to avoid high electricity prices could impact operators for anywhere between a few and several hundred hours out of the year In addition a plant can plan its operations to take advantage of lower electricity prices during off-peak periods (eg at night when generation from wind is high) For example at least one company is marketing a modular desalination unit design intended to take advantage of low prices during periods of high renewables generation and to provide grid reliability services through demand response16
There are several factors to consider regarding these opportunities to reduce electricity costs The plant would need to monitor the ERCOT market or hire a contractor to do so in order to know when to reduce demand for electricity These programs do not impose any requirements on response time as with RRS or ERS and there may be sufficient warning of 4CP intervals or peak pricing to allow the plant operator to plan its operations earlier in the day with sufficient time to ramp down production under controlled conditions However quicker ramping capability may be desirable to respond to electricity price fluctuations
For 4CP because the four intervals used to set demand charges are not known ahead of time it is likely that the plant would need to reduce its demand multiple times per summer to ensure the 4CP intervals are hit impacting production at the facility Timing operations to coincide with off-peak pricing or to avoid price spikes would similarly result in reduced operations during certain hours To offset the lost production hours the plant may need to be designed with extra capacity and water storage capability to maintain the ability to meet its contractual obligations for freshwater delivery Because the period of reduced operations is greater than with ERCOT-dispatched demand response services this need would be greater for a seawater desalination plant reducing load during 4CP intervals or in response to real-time electricity prices and would increase the capital costs of the project It should also be noted that high prices in the ERCOT Region typically but not always occur in summer months when drought conditions are more likely to develop and demand for desalinated water is likely to be highest This may limit the flexibility of the plant to time its electricity consumption to avoid high-priced hours
14 Public Utility Commission of Texas ldquoTransmission and Distribution Rates for Investor Owned Utilitiesrdquo Available at httpwwwpuctexasgovindustryelectricratestdraspx 15 Potomac Economics June 2016 2015 State of the Market Report for the ERCOT Wholesale Electricity Markets Available at httpswwwpotomaceconomicscomindexphpmarkets_monitoredERCOT 16 Sisyan LLC ldquoDemand Response Desalinationrdquo Available at httprenewabledesalinationcomwpshycontentuploads201506Demand-Response-Desalinationpdf
copy 2016 ERCOT All rights reserved 10
Study on the Demand Response Potential for Seawater Desalination Projects ERCOT Public
In addition the plantrsquos ability to participate in demand response would also be limited for those hours it is reducing load as part of 4CP response or in response to real-time prices because the plant would not be able to reduce its electricity consumption if that demand is already committed to another demand response service Thus participating in demand response versus taking advantage of these other opportunities may be to some extent mutually exclusive
5 Conclusion
Based on this analysis it appears that the operational characteristics of seawater desalination plants would allow them to participate in demand response opportunities in ERCOT so long as the necessary operational requirements are considered in the design specifications of the plant Project developers should consider the necessary requirements early in the plant design Whether the economic benefits of participation would provide a sufficient incentive for them to do so will depend on the costs of accommodating those operational requirements and whether there is the flexibility available to operate the plant as necessary under these programs Though most existing seawater desalination plants do not participate in demand response programs it does appear that participation by these plants is possible and could result in a financial benefit Table 2 compares the different demand response opportunities available to demand-side resources in ERCOT
Table 2 Comparison of Demand Response Opportunities Demand Response
Opportunity Requirements for
Participation Impacts to Plant
Operations Financial Benefit Ancillary Services ndash Responsive Reserve Service (RRS)
bull Under-Frequency Relay bull Instantaneous or 10 minute
response time bull Recover load within 3
hours bull Bid in day-ahead market
bull Deployed once in 2015 for 10 minutes bull Subject to annual
unannounced testing
bull $1087 per MW per hour (based on 2015 prices)
Emergency Response Service (ERS)
bull 10 or 30 minute response time bull Recover load within 10
hours bull Four-month contract term
bull Not deployed in 2015 the most times ever deployed in a single year was twice in 2011 bull Subject to annual
unannounced testing
bull $645 per MW per hour (based on 2015 prices)
Four Coincident bull Interval Data Recorder bull Likely plant will need to bull Avoid ~$48000 per 4CP Peak (4CP) (IDR) meter
bull Ability to predict system-wide peak demand hours during summer months
reduce load multiple times per summer to hit 4CP intervals bull Likely to be able to predict
possible 4CP intervals earlier in day
MW per year (based on 2016 tariffs) if successful in reducing during all four summer months
LSE or DR Provider Contracted Price Response
bull Varies based on contractual arrangements
bull Varies based on contractual arrangements
bull Varies based on contractual arrangements
Self-Directed Price bull Retail contract with bull Varies depending on bull Varies depending on Response exposure to real-time
market prices bull Ability to monitor real-time
prices in ERCOT wholesale market
number and severity of pricing events bull May be able to predict
peak pricing events earlier in day
number and severity of pricing events
copy 2016 ERCOT All rights reserved 11
Study on the Demand Response Potential for Seawater Desalination Projects ERCOT Public
Demand response programs in ERCOT provide opportunities for demand-side resources to defray their electricity costs and provide reliability benefits to the ERCOT electric grid Because the process of seawater desalination is energy intensive participation in demand response could help to reduce electricity costs while posing a relatively low risk to plant operations if demand response participation is factored into plant design
Participation in non-ERCOT-dispatched demand response opportunities such as reducing load during 4CP intervals or in response to real-time electricity prices may also help to reduce electricity costs for seawater desalination plants in Texas As stakeholders in Texas continue to plan for possible future droughts in the region and identify water management strategies consideration of demand response could play a role in mitigating some costs associated with seawater desalination and allow seawater desalination plants to assist with maintaining electric reliability in the region
copy 2016 ERCOT All rights reserved 12
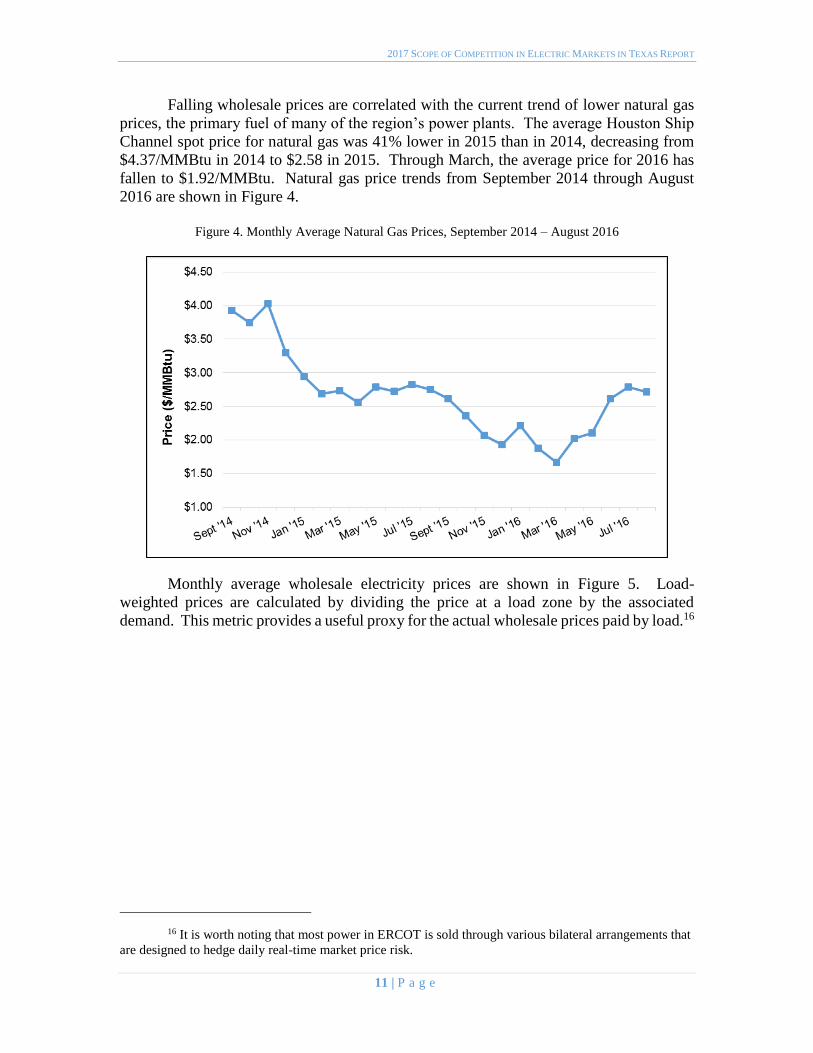
2017 SCOPE OF COMPETITION IN ELECTRIC MARKETS IN TEXAS REPORT
Falling wholesale prices are correlated with the current trend of lower natural gas
prices the primary fuel of many of the regionrsquos power plants The average Houston Ship Channel spot price for natural gas was 41 lower in 2015 than in 2014 decreasing from
$437MMBtu in 2014 to $258 in 2015 Through March the average price for 2016 has
fallen to $192MMBtu Natural gas price trends from September 2014 through August
2016 are shown in Figure 4
Figure 4 Monthly Average Natural Gas Prices September 2014 ndash August 2016
Monthly average wholesale electricity prices are shown in Figure 5 Load-
weighted prices are calculated by dividing the price at a load zone by the associated
demand This metric provides a useful proxy for the actual wholesale prices paid by load16
16 It is worth noting that most power in ERCOT is sold through various bilateral arrangements that
are designed to hedge daily real-time market price risk
11 | P a g e
2017 SCOPE OF COMPETITION IN ELECTRIC MARKETS IN TEXAS REPORT
Figure 5 Load-Weighted Average Real-Time Monthly Settlement Point Prices September 2014 ndash August 2016
Another component of the real-time price of electricity is the cost of transmission
congestion Transmission congestion occurs when there is insufficient transmission
capacity to dispatch energy in a least-cost fashion The recent build-out of additional
transmission lines in areas of high congestion has partially relieved the cost burden in these
areas particularly in West Texas where oil and gas production growth rapidly increased
the demand for electricity resulting in relatively higher zonal prices
2 Peak Demand
After the very high peak demand levels during the hot summer of 2011 peak
demand in ERCOT was lower in 2012 through 2014 In 2015 peak demand again
increased though not to 2011 levels with load exceeding 60000 MW for 330 hours and
exceeding 65000 MW for 91 hours as shown in Figure 6 below In 2016 ERCOT
experienced a record week in August which saw the previous record peak demand broken
six times and the ERCOT region hit its all-time peak demand of 71093 MW on August
11 2016
As peak demand has increased the recorded availability of generation supply in the
region during times of high load has decreased slightly Physical Responsive Capability
(PRC) analogous to the amount of reserves available on the system at any given time fell
below 3000 MW for 269 hours in 2015 up slightly from 213 hours in 2014 and 215
hours in 2013 but well below the 371 hours recorded during the 2011 summer
12 | P a g e
2017 SCOPE OF COMPETITION IN ELECTRIC MARKETS IN TEXAS REPORT
Figure 6 High Load Hours in ERCOT 2011 ndash 2016
As shown in Table 6 the ERCOT system peak demand was 69877 MW in 2015
up 5 from the 2014 peak and the 2016 ERCOT system peak demand increased 174
from the peak demand of the previous year
Table 6 ERCOT Peak Demand 2012 ndash 2016
Year
ERCOT Peak
Demand (MW)
Percentage Change
from Prior Year
2012 66548 ndash 2013 67245 105
2014 66454 ndash118
2015 69877 515
2016 71093 174
Figure 7 shows the hourly peak load for each month in ERCOT from January 2014 to
August 2016
13 | P a g e
2017 SCOPE OF COMPETITION IN ELECTRIC MARKETS IN TEXAS REPORT
Figure 7 Monthly Peak Demand in ERCOT January 2014 ndash August 2016
3 Generation Diversity
As electricity consumption has increased in ERCOT the diversity of the systemrsquos generation portfolio has also increased Generators participating in the statersquos renewable energy credit (REC) trading program reported an 11 increase in renewable generation
from 2013 to 2015 rising from 376 million MWh to 469 million MWh with wind
representing 96 of the total renewable mix Landfill gas was the second most prevalent
renewable source representing approximately 12 of all renewable generation in 2015
Energy produced from wind generation was up by 13 in 2015 from 2013 and solar
energy capacity more than doubled from 121 MW in 2013 to 288 MW in 2015 Coal-fired
generation has been steadily shrinking as a proportion of total generation declining from
37 of electricity produced in 2014 to 28 in 2015 Energy use in the ERCOT region by
fuel type for 2015 is shown in Figure 8
14 | P a g e
2017 SCOPE OF COMPETITION IN ELECTRIC MARKETS IN TEXAS REPORT
Figure 8 Energy Use in ERCOT by Resource Type 2015
The Commissionrsquos projects are further described in the following section of this report
15 | P a g e
2017 SCOPE OF COMPETITION IN ELECTRIC MARKETS IN TEXAS REPORT
III SUMMARY OF COMMISSION ACTIVITIES FROM 2015 TO 2016
Introduction
The Commission develops and modifies rules policies and procedures for the
competitive electric market in Texas in response to the technological advances in the
industry and the evolving needs of customers The Commission also continues to carry
out oversight of programs with which the Legislature has tasked it ndash such as energy
efficiency renewable energy and advanced metering infrastructure Within the
ERCOT region the monopoly wires-and-poles companies that provide transmission
and distribution services throughout the grid remain subject to traditional rate
regulation by the Commission The Commission continues to set rates for these
utilities as they are not subject to the forces of market competition This section
provides an overview of the Commissionrsquos activities in its oversight of the wholesale and retail electric markets as well as its governance over regulated electric utilities
Resource Adequacy
Resource adequacy is the long-term ability of the system to serve demand reliably
when consumption is highest given the available installed capacity load resources and
the operational reliability of the system Assessing resource adequacy requires comparing
the systemrsquos forecast installed capacity and load resources against the forecast peak
summer load The difference between the forecast of available generation and load
resources and the forecasted demand for electricity is referred to as an ldquoinstalled capacity
reserve marginrdquo which is an indicator of the ability of the system to meet customer demand
during peak conditions In addition to evaluating the forecast reserve margin assessing
resource adequacy includes evaluating the systemrsquos operational reliability The systemrsquos operational reliability depends on the ability of generators to manage plant operations
successfully as well as the grid operatorrsquos ability to manage the system to avoid or to mitigate load curtailment During 2015 and 2016 the ERCOT system performed well with
respect to resource adequacy The Commission has devoted significant attention to
ensuring that ERCOT maintains an adequate installed capacity reserve margin and a high
level of operational reliability developing a wholesale market design that allows
consumers to continue to receive low-cost and reliable electricity over the long term
1 Capacity Demand and Reserves Report
The Capacity Demand and Reserves (CDR) Report published by ERCOT semi-
annually is a snapshot estimate of long-term supply and demand and the associated annual
reserve margin for peak summer and winter conditions While the CDR Report is not a
forecast of any particular outcome it provides insight into possible resource adequacy
trends
16 | P a g e
2017 SCOPE OF COMPETITION IN ELECTRIC MARKETS IN TEXAS REPORT
The May 2016 CDR Report shows estimated reserve margins well above the
current target reserve margin of 1375 Installed capacity reserve margin estimates taken
from this CDR Report are shown below in Table 7
Table 7 May 2016 Capacity Demand and Reserves Report Forecast
Forecast 2017 2018 2019 2020 2021 2022 2023 2024 2025 2026
Peak Load
(MW)
68548 69409 70795 71420 72098 72792 73482 74168 74864 75704
Total
Capacity
(MW)
80995 87019 87238 87407 87678 87738 87738 87728 87728 87728
Reserve
Margin
182 254 232 224 216 205 194 183 172 159
2 Operating Reserve Demand Curve
In ERCOT the price signals produced by the energy-only wholesale electric market
should provide incentives to promote short-term reliability as well as induce optimal long-
run investment in new resources If the prices are efficient and reflect the full cost of
dispatching resources to meet demand the benefits that accrue to both consumers and
producers can be maximized at the least cost and new generating capacity (or load
resources) should develop to maintain the equilibrium as old resources retire or demand
increases
The Operating Reserve Demand Curve (ORDC) implemented at the Commissionrsquos direction in June 2014 improves price formation by allowing prices to more fully reflect
the value of operating reserves The ORDC assigns an economic value to operating
reserves or the amount of extra capacity available to maintain system reliability on a daily
basis
As part of its ongoing review of resource adequacy in ERCOT the Commission is
currently evaluating the accuracy of the inputs to the ORDC to ensure that its contribution
to price formation appropriately reflects the costs of meeting demand and the underlying
needs of the system
3 Transmission Congestion
Although competitive power producers and regulated transmission providers form
two distinct segments of the market transmission buildout has a direct effect on wholesale
power prices When there is insufficient transmission capacity to dispatch energy in a least-
cost fashion the system operator takes action to ensure that the physical limits of the
transmission system facilities are not violated The re-dispatch of generation because of
transmission limits results in disparate prices at different locations on the system In
comparison to prior years transmission congestion in ERCOT has lessened because of the
large increase in transmission investment and the reduction of high demand related to oil
and gas production in West Texas ERCOT and the Commission continually evaluate the
need for cost-effective additional transmission investment to manage congestion
17 | P a g e
2017 SCOPE OF COMPETITION IN ELECTRIC MARKETS IN TEXAS REPORT
4 Wholesale Market Design Initiatives
While the ERCOT wholesale market has been successful in attracting new resource
investment and also maintaining competitive prices for consumers certain improvements
to the market design could yield additional benefits in terms of efficient price formation
and opportunities for entry of new technology Initiatives already in place in many other
regions such as real-time co-optimization and multi-interval real-time resource dispatch
may allow existing capacity to be used more effectively and create opportunities for the
integration of additional load resources to serve electric demand The Commission
continues to work with ERCOT and interested stakeholders to determine the value of
implementing such enhancements particularly as ERCOTrsquos resource mix changes over time
5 Reliability Standard
In early 2014 the Commission opened a project to review its use of a target installed
capacity reserve margin based on a reliability standard equivalent to one loss-of-load event
every ten years In this project the Commission received written comment from interested
parties conducted a public workshop consulted with independent experts and reviewed
the application of reliability standards in other regions As a result of this review future
reliability metrics to be estimated in ERCOT will include the market equilibrium reserve
margin the economically-optimal reserve margin and the associated levels of expected
unserved energy The Commission believes that publishing these metrics represents an
improvement over reporting a one-event-in-ten-years standard by enhancing insight into
expected outcomes in ERCOTrsquos energy-only market
Non-ERCOT Utilities Market Development Activities
SB 7 the law that introduced retail competition to the Texas market in 1999
granted the Commission authority to delay retail competition in an area where deregulation
would not result in fair competition and reliable service because of the lack of an
independent organization to coordinate the electric system and the concentration of
ownership in the generation sector in some of those areas Consequently SB 7 included
provisions recognizing the difficulty of implementing retail competition in areas outside of
ERCOT Therefore the utilities outside of the ERCOT region remain vertically integrated
owning generation transmission and distribution assets as well as selling power to end-
use customers These vertically integrated utilities remain subject to traditional regulation
including rates set by the Commission and customer choice is not offered in the service
territories of these utilities
The Commission does continue to monitor ongoing activities in the non-ERCOT
portions of the state In 2015 the Legislature granted the Commission the authority to
retain counsel and consulting experts in order to participate in legal proceedings at the
Federal Energy Regulatory Commission (FERC) which has regulatory jurisdiction over
wholesale power sales and transmission rates outside of ERCOT This authority has
18 | P a g e
2017 SCOPE OF COMPETITION IN ELECTRIC MARKETS IN TEXAS REPORT
permitted the Commission to participate more effectively in FERC proceedings affecting
Texasrsquo utilities located outside of ERCOT
1 Southwest Power Pool
The Southwest Power Pool (SPP) is the Regional Transmission Operator (RTO) for
areas of Northeast Texas and the Texas Panhandle In Texas the utilities Southwestern
Electric Power Company (SWEPCO) Southwestern Public Service (SPS) and several
electric cooperatives and municipally owned utilities are in SPP In addition to these areas
of Texas the SPP footprint includes parts of New Mexico Arkansas Missouri Nebraska
Louisiana and all of Kansas and Oklahoma In 2015 SPP became the RTO for the
Integrated System and neighboring areas which includes parts of Iowa Minnesota North
Dakota South Dakota Wyoming and Montana SPP has spent extensive time and
resources over the last two years to integrate these new areas successfully The expansion
added 5000 MW of peak demand 7600 MW of generating capacity and 9500 miles of
transmission lines17
In 2014 SPP launched its new Integrated Marketplace which provides a Day-
Ahead Market a Real-Time Balancing Market and Congestion Hedging Markets
mechanisms similar to those available in ERCOT The implementation of the Integrated
Marketplace resulted in a savings of $422 million in 2015 As a result of the Integrated
Marketplace SPPrsquos planning reserve margin will be reduced from 136 to 12 a change
expected to save about $90 million annually
Chairman Donna L Nelson represents the Commission as a voting member on
SPPrsquos Regional State Committee (RSC) The RSC provides collective state regulatory
agency input on a variety of issues In addition the RSC has authority over the cost
allocation methodologies for transmission upgrades allocation of Financial Transmission
Rights and the approach used for resource adequacy across the SPP region The RSC
regularly meets on a quarterly basis and meets more frequently if necessary
2 Midcontinent Independent System Operator
The Midcontinent Independent System Operator (MISO) is an RTO that serves all
or part of 15 states in the central US one Canadian province and the portion of eastern
Texas served by the vertically integrated utility Entergy Texas Inc MISO provides a Day
Two market which has a variety of functions and services including energy and ancillary
service markets economic dispatch congestion management financial transmission rights
and transmission planning The MISO Independent Market Monitor concluded that the
MISO wholesale markets were competitive in 2015
Like SPP MISO is in the Eastern Interconnection which crosses state boundaries
and is therefore subject to FERC jurisdiction A number of recent FERC proceedings have
17 2015 Southwest Power Pool Annual Report Available at
httpswwwspporgdocuments37800201520southwest20power20pool20annual20reportpdf
19 | P a g e
2017 SCOPE OF COMPETITION IN ELECTRIC MARKETS IN TEXAS REPORT
affected the portion of Texas that is in the MISO footprint The Commission through
outside counsel has been an active party in such FERC proceedings FERC Docket No
ER14-1174 addressed in part a dispute regarding the availability of transmission capacity
under the Joint Operating Agreement between MISO and the SPP Ultimately FERC
approved a settlement agreement under which MISO will compensate SPP and its members
for using their or other entitiesrsquo transmission systems
In a related pending docket at FERC Docket No ER14-1736 parties are addressing
how the cost of these payments will be allocated among MISO market participants Parties
in this proceeding are engaged in settlement discussions In addition in Docket No ER14-
75-000 FERC approved a settlement agreement among the participating Entergy
Operating Companies and their retail regulators to terminate the Entergy System
Agreement effective August 31 2016 The settlement terms prohibit any post-termination
payments that roughly equalize production costs among the operating companies after
December 31 2015 terminate certain specific cross-purchase power agreements between
Entergy Texas and former Entergy Gulf State Louisiana and permit the continuation of
several other purchase power agreements
Commissioner Kenneth W Anderson Jr represents the Commission as a voting
member in the Organization of MISO States (OMS) the purpose of which is to coordinate
regulatory oversight among the states in the MISO region and to make recommendations
to MISO FERC and other entities Commissioner Anderson also represents the
Commission as a voting member of the Entergy Regional State Committee (ERSC) which
has certain FERC-approved authority for five years after the Entergy integration with
regard to cost allocation for Entergy transmission projects and adding transmission projects
to the Entergy construction plan The ERSC meets quarterly
3 Western Electricity Coordinating Council
The Western Electricity Coordinating Council (WECC) is a Regional Entity whose
region includes the area surrounding El Paso and extends from Canada to Mexico
including the provinces of Alberta and British Columbia the northern portion of Baja
California and all or portions of the 14 Western states in between WECC is the Regional
Entity responsible for Bulk Electric System reliability in the Western Interconnection and
associated compliance monitoring and enforcement WECC does not have organized
markets outside of California but is organized into 38 separate balancing authorities
WECC is geographically the largest and most diverse of the eight Regional Entities in the
United States with delegated authority from the North American Electric Reliability
Corporation (NERC) and the Federal Energy Regulatory Commission In Texas El Paso
Electric Company is a member of WECC
Rulemaking Activities
The Commission has continued to adopt new rules and modify existing rules in
order to further the continued successful operation of the competitive retail and wholesale
markets and to comply with statutory changes made to PURA by the Legislature This
20 | P a g e
2017 SCOPE OF COMPETITION IN ELECTRIC MARKETS IN TEXAS REPORT
section of the Report provides a high-level overview of the Commissionrsquos key rulemaking
activities highlighting the market improvements made in 2015 and 2016
1 Cost Recovery and Rate Adjustment
The Commission adopted new rule 16 TAC sect25246 on June 29 2016 to
implement Section Nos 1 through 3 of House Bill 1535 of the 84th Legislature The new
rule only applies to a utility that operates solely outside of ERCOT and allows for the use
of an update period beyond the test year for which the utility initially files estimated
information The rule clarifies that all information originally estimated must be updated
with actual information and also provides requirements for a post-test-year adjustment for
a natural gas-fired plant A non-ERCOT utility also is required to initiate a new base rate
case on or before the four year anniversary of the final order in the utilityrsquos most recent comprehensive base rate case or if the commission determines that the utility has
materially earned more than its authorized rate of return in two consecutive years The rule
also provides requirements and procedures for the relation back of final rates to an effective
date 155 days after the filing of the rate application
2 Changes to Certificates of Convenience and Necessity and CREZ Rule
The Commission conducted a rulemaking to implement changes pursuant to
Legislative mandates in SB 776 SB 933 and HB 1535 of the 84th Legislature SB 776
required municipally owned utilities to apply for a certificate of convenience and necessity
(CCN) before constructing transmission facilities outside the boundaries of the
municipality that owns the municipally owned utility SB 933 also requires persons to
obtain a CCN before interconnecting a tie line into the ERCOT grid HB 1535 requires the
Commission to issue a final order within 181 days for a non-ERCOT utility requesting a
CCN for an existing electric generating facility and 366 days after a non-ERCOT utility
files a CCN for a newly constructed generating facility In addition the Commission also
determined in this rulemaking that all future transmission projects in a Competitive
Renewable Energy Zone (CREZ) must meet the need criteria of PURA sectsect 37056(c)(1)
and (2) rather than being exempt Finally the Commission determined that the CREZ
project established in 2008 was complete following the installation of a second circuit on
a Sharyland line
3 Use of Handheld Device for Enrollment
As the market evolves the Commission evaluates market changes balancing its
desire to encourage customer-focused innovation with its concern for customer protection
against potential abuses In Docket No 44518 the Commission granted a REP a
temporary 12-month waiver from its rules requiring the marketer to obtain telephonic
verification of the customerrsquos desire to switch REPs as well as a waiver from certain authorization disclosure requirements among other stipulations the Commission placed
upon the REP The Commission then opened Project No 45625 to study the issue of REPs
utilizing hand-held devices for customer enrollment more broadly and engage with market
representatives consumer representatives and other stakeholders The Commission
anticipates considering an amendment to its rules in the spring of 2017
21 | P a g e
2017 SCOPE OF COMPETITION IN ELECTRIC MARKETS IN TEXAS REPORT
4 Smart Meter Texas Portal
The electric utilities in Texas that have advanced metering systems (AMS) jointly
own and operate a single web portal known as Smart Meter Texas (SMT)18 SMT fulfills
two requirements imposed by the Commissionrsquos advanced metering rule on a utility with
AMS (1) provide to the retail customer the REP serving the customer and other entities
authorized by the customer access to such retail customerrsquos consumption data and (2)
allow devices at the customerrsquos premises to communicate through a home area network with the advanced meter at the premises SMT also facilitates near real-time on-demand
reads of a customerrsquos meter that aids prepaid service offered by certain REPs
In Project No 42786 Review of Advanced Metering System Web Portal
Commission staff and stakeholders examined options for the long-term operational
structure governance and funding of SMT The Commission determined that ownership
of SMT should remain with the TDUs because they can operate the portal at a lower cost
than transferring the data repository to ERCOT The Commission opened two
rulemakings one to ascertain the appropriate governance performance and funding of
SMT and a second to determine the appropriate access for third parties ensuring that
customers have the freedom to grant and give third parties access to their data if made
knowingly while also securing customer privacy
Sharyland Utilities
In early 2015 customers of Sharyland Utilities the smallest investor-owned
transmission and distribution utility in ERCOT began to file with the Commission a
significant number of complaints regarding high electricity bills In response the
Commission opened Project No 44592 Relating to a Project Regarding Sharyland
Utilities to provide for a more formal process for Commission review of the large number
of complaints As part of this project Commission staff prepared a report to evaluate the
electricity rates and electric bills in the operating area of Sharyland Utilities that was
previously part of Cap Rock Energy
Staffrsquos report found that a number of factors contributed to the comparatively high
bills for many of Sharyland-Cap Rockrsquos customers First Sharylandrsquos small size and its low customer density result in high TDU rates for all customers relative to other TDUs In
particular Staffrsquos report found that Sharyland-Cap Rockrsquos rates for distribution service are
up to three times higher than those of other TDUs in Texas In addition to Sharyland-Cap
Rockrsquos high costs for distribution service higher wholesale transmission costs also
contributed to the rate increases charged to Sharyland-Cap Rockrsquos customers These transmission costs are the result of increased transmission investment in recent years
throughout Texas that has increased transmission costs for all distribution providers
18 The participating Texas TDUs are AEP Texas Central Company and AEP Texas North Company (jointly
ldquoAEPrdquo) CenterPoint Energy Houston Electric LLC (ldquoCenterPointrdquo) Oncor Electric Delivery Company LLC (ldquoOncorrdquo) and Texas-New Mexico Power Company (TNMP) collectively referred to as the ldquoJoint TDUsrdquo Operation of an AMS web portal was addressed in the orders approving particular utilitiesrsquo deployment of AMS and approving surcharges for AMS cost recovery While Sharyland Utilities filed comments in the proceeding it did not
participate as it had not fully completed its AMS deployment at the time
22 | P a g e
2017 SCOPE OF COMPETITION IN ELECTRIC MARKETS IN TEXAS REPORT
including Sharyland Utilities Second the comparatively colder winter of 2014 ndash 2015
which was the time period generally consistent with the timeframe in which the
Commission began receiving complaints appeared to result in higher electricity usage than
normal This combination of high TDU rates and the higher electricity usage led to higher
bills for customers
Staffrsquos report also noted that in Sharyland-Cap Rockrsquos last rate case in 2014 the
approved rates reflected movement towards more cost-based rates for all customers
including some customers that previously had been heavily subsidized by other customers
Additionally in the process of standardizing Sharyland-Cap Rockrsquos customer classification
with the classifications of the other TDUs in Texas some customers may have experienced
a move from one class that previously was paying below-cost rates to another class that
was now paying above-cost rates For some of these customers the combined effects of
the movement towards cost-based rates and the change to a different class may have
contributed to a significant change in the customersrsquo rates Regardless of any cost-shifting
between customer classes Sharylandrsquos rates remain two to three times higher than those of other TDUs in Texas for all customers in all classes
On December 4 2015 the Commission signed an order directing Sharyland to file
an application for a comprehensive rate review by April 30 2016 Sharyland filed its rate
application on April 29 2016 in Docket No 45414 Review of the Rates of Sharyland
Utilities LP On October 10 2016 the Commission ordered Sharyland to file an amended
application as soon as practicable but no later than January 1 2017 to reflect the unique
aspects of the companyrsquos organizational structure as a real estate investment trust (REIT) At the time of publication Sharyland is expected to file its amended application in
December 2016
PowerToChoose Website
As part of its ongoing evaluation of the competitive market the Commission
opened Project No 45730 to evaluate the functionality and usability of its PowerToChoose
website which allows customers to select a REP and an electric plan based on their zip
code In the process the Commission received significant feedback from customers stating
that the Commissionrsquos PowerToChoose website was an important tool that plays a
fundamental role in their shopping process In response to the feedback received from
industry representatives and consumers Commission staff changed how the website sorts
and filters retail electric plans adding a filter to allow customers to unselect plans that
contain minimum usage fees or credits This filter is now a default setting and plans with
minimum usage fees and credits are not shown unless the customer actively selects to
search for such plans In addition Commission staff made other changes to increase the
clarity of the REP complaint rating The Commission continues to evaluate other changes
to improve the customer experience of the PowerToChoose website and provide
transparency for retail electric plans
23 | P a g e
2017 SCOPE OF COMPETITION IN ELECTRIC MARKETS IN TEXAS REPORT
Report on Alternative Ratemaking Mechanisms
In 2015 the Legislature enacted SB 774 which requires the Commission or its
consultant to conduct a study and make a report to the Legislature analyzing the alternative
ratemaking mechanisms adopted by other states In addition SB 774 extended the
authorization for the Periodic Rate Adjustment (PRA) mechanism from 2017 to 2019
which the Legislature had authorized in 2011 (SB 1693) as a version of an alternative
ratemaking mechanism that provides to utilities a means for expedited recovery of
distribution infrastructure costs Pursuant to SB 774 the Commission retained a consultant
to produce the report and the consultantrsquos recommendations included streamlining the ratemaking process to reduce procedural costs providing for a periodic review of the
prudency of the costs and using certain types of alternative ratemaking mechanisms that
decouple the recovery of costs from variations in load The Commission held a public
hearing to receive comments on the report from stakeholders and after consideration of
those comments has provided to the Legislature the consultantrsquos report together with its
own discussion of the report
Request for Purchase of Oncor Electric Delivery Company
In March 2016 the Commission approved with conditions an application by an
investor group led by Hunt Consolidated Inc the owners of Sharyland Utilities to acquire
control of Oncor Electric Delivery Company (Oncor) the largest transmission and
distribution utility in Texas from Oncorrsquos parent company Energy Future Holdings which
is in bankruptcy The Commission approved the request subject to certain conditions
including stipulations regarding the organization of the new entities and treatment of tax
benefits The investor-led group subsequently declined to pursue the transaction that was
approved by the Commission
In September 2016 NextEra Energy which owns Florida Power amp Light received
approval from the United States Bankruptcy Court in Delaware for its plan to purchase
Oncor In October 2016 NextEra Energy filed an application with the Commission in
Docket No 46238 for approval of the proposed transaction The Commission will evaluate
the application to determine if the transaction is in the public interest
Integration of Lubbock Power and Light
In March 2016 the Commission opened Project No 45633 to study and identify
the issues related to the request of Lubbock Power and Light the statersquos third-largest
municipally owned utility to be integrated into ERCOT The Commission is currently
working with stakeholders ERCOT and SPP to determine the cost and benefits of any
potential switch by Lubbock Power and Light into ERCOT and whether such a switch is
in the public interest
24 | P a g e
2017 SCOPE OF COMPETITION IN ELECTRIC MARKETS IN TEXAS REPORT
Desalination Project ERCOT Studies
In 2015 the Legislature passed HB 4097 which directed the Commission and
ERCOT to study whether existing transmission and distribution planning processes are
sufficient to provide adequate infrastructure for seawater desalination projects and to study
the potential for desalination projects to participate in demand response opportunities in
the ERCOT market Pursuant to that direction ERCOT staff have prepared a report on the
feasibility of interconnection of large desalination projects and on opportunities for such
projects to participate in ERCOTrsquos demand response programs which is attached to this Report in Appendix B
Oversight and Enforcement Actions
The Commissionrsquos enforcement of statutes rules and orders applicable to entities
under its jurisdiction serves to protect consumers the electric markets the reliability of the
electric grid and to promote fair competition The Commissionrsquos enforcement efforts in the electric industry focus on violations of PURA the Commissionrsquos rules and ERCOT
protocols
During the period from January 2015 through August 31 2016 the Commission
assessed $3258500 in penalties against electric market participants Table 8 provides a
summary of electric industry Notices of Violation since January 2015 During 2015 and
2016 Commission staff opened 212 investigations for the electric industry and closed 177
investigations
Table 8 Notices of Violations
Violation Type Total Penalty Amount
Retail Market Violations $539000
Service Quality Violations $451500
Wholesale Market Violations $2268000
TOTAL $3258500
In addition to the imposition of administrative penalties the Commission uses other
enforcement mechanisms in exercising its enforcement duties including revoking a
companyrsquos certificate to operate In addition some companies may be required to relinquish a certificate as part of a settlement after enforcement action has proceeded
Table 9 provides a breakdown of the number of certificates revoked or relinquished In
2016 the Commission revoked the certificate of the REP TruSmart Energy
Table 9 Certificates Revoked or Relinquished
Type Number
Certificates Revoked 1
Certificates Relinquished 0
25 | P a g e
2017 SCOPE OF COMPETITION IN ELECTRIC MARKETS IN TEXAS REPORT
The Oversight amp Enforcement division also issues warning letters to companies in
the electric market when it determines that a violation occurred but given the
circumstances surrounding the violation and other mitigating concerns no administrative
penalty is warranted During 2015 and 2016 the Oversight amp Enforcement division issued
50 warning letters Finally the Commission generally seeks to reimburse money directly
to customers when appropriate In 2015 and 2016 the Commission ordered the
reimbursement of $8543596 to Texas electric customers
Table 10 Warning Letters
Warning Letter Type Number
Retail Market Warning Letter 8
Service Quality Warning Letter 1
Wholesale Market Warning Letter 41
TOTAL 50
In addition to its enforcement activities the Commission also enters into voluntary
mitigation plans with generators that request one through a contested case proceeding
pursuant to PURA sect15023(f) and 16 TAC sect25504(e) The Commission entered into one
voluntary mitigation plan during 2015 and 2016 in Docket No 44635
Low-Income Discount System Benefit Fund
The System Benefit Fund (SBF) was originally established in 1999 to fund
discounts to low-income customers customer education activities energy-efficiency and
weatherization and electric market oversight through a nonbypassable surcharge on retail
electric bills HB 1101 of the 84th Legislature provided that the SBF be sunset on
September 1 2017 by which time the SBF is intended to be exhausted In the 2016 Fiscal
Year (FY) $325521250 was appropriated in the SBF to provide a 25ndash31 percent discount
to low-income customers over a 12-month period
To assist the drawdown of the remaining balance HB 1101 authorized the
Commission to use any unexpended SBF balance in FY 2017 to assist low-income
customers The Commission estimates that the remaining SBF balance will be
approximately $17 million by August 31 2017 The Commission has determined that this
amount is insufficient to fund the rate reduction program however the Commission will
spend approximately $100000 to continue automatic enrollment in the program to provide
REPs a list of customers eligible to receive late fee waiver and deposit installment benefits
These two ancillary benefits of the rate reduction program will continue for the duration of
FY 2017
26 | P a g e
2017 SCOPE OF COMPETITION IN ELECTRIC MARKETS IN TEXAS REPORT
Homeland Security
The Commission assesses the efforts of ERCOT and utilities to defend against
mitigate and respond to the variety of risks that the modern electricity system faces The
Commission also meets with ERCOT utilities and governmental entities on an ongoing
basis to discuss preparation for everything from hurricanes and other severe weather to
cyber-threats and threats of physical damage to the grid from accidents or intentional
malfeasance In addition the Commission monitors industry and federal programs that
address homeland security issues
The Commission serves as an information liaison between state government and
electric utilities during emergencies The Commissionrsquos main roles include
Conveying outage and service restoration information from electric utilities to
state government
Conveying service restoration priorities (hospitals water treatment facilities
etc) from state government to electric utilities and
Facilitating the clearance of downed power lines in disaster re-entry areas and
facilitating entry of electric utilities into disaster areas
The Commissionrsquos Emergency Management Response Team (EMRT) provided staff at the
State Operation Center for the May 2015 and April 2016 flooding events in Texas as well
as additional staffing for severe winter weather
Demand Response
ERCOT staff have begun to report annually on the participation of customers in
REP-sponsored demand response programs These programs which have been facilitated
by the deployment of smart meters throughout the competitive areas within ERCOT and
by many municipal and cooperative electric utilities take the form of rebates for reduction
in usage during peak period time-of-use pricing real-time volumetric price compensation
for load reduction and direct control of customer load among other plans
These programs have seen dramatic increases in participation since ERCOT began
to gather this information in 2013 From 2013 to 2014 the number of residential customers
participating in these programs increased from 151793 to 721273 and the number of
commercial and industrial customers participating rose from 30275 to 50205 The
Commission continues to monitor ERCOTrsquos stakeholder process for efforts relating to the integration of demand response
27 | P a g e
2017 SCOPE OF COMPETITION IN ELECTRIC MARKETS IN TEXAS REPORT
IV LEGISLATIVE RECOMMENDATIONS
A Determination of Low-Income Customer Eligibility
In 2015 HB 1101 required that all remaining funds in the System Benefit Fund
(SBF) be expended that the fee that funded the program as a nonbypassable surcharge on
electric bills be set at zero and that the SBF be sunset on September 1 2017 Per the
provisions of HB 1101 the SBF fee was set at zero in September 2016 concluding the
funding for the program The sunset of the SBF program also concluded the relationship
between the Texas Health and Human Services Commission (HHSC) and the Commission
in which the HHSC provided to the Commission eligible electric customers for the SBF
low-income discount Because of the termination of the relationship with HHSC with the
termination of the SBF the Commission will no longer be able to determine easily an
electric customerrsquos eligibility for other low-income programs such as late penalty waivers
and the option of paying an electric deposit over multiple months
The Legislature may wish to consider easing low-income customers access to these
low-income programs by facilitating the process used to determine eligibility The
Commission offers four possible approaches in which the Legislature could continue these
low-income programs
(1) Authorize HSSC to provide identification of eligible low-income customers to the
Commission
(2) Allow retail electric providers (REPs) to provide such low-income programs using
the Low Income Discount Administratorrsquos (LIDA) Telecommunications Lifeline
Service Program list to identify low-income customers
(3) Require REPs to offer such low-income programs with customers self-enrolling
and REPs verifying income eligibility or
(4) Allow REPs to voluntarily provide such low-income programs at their own
discretion
B Outside Counsel for Proceedings before Regional Transmission
Organizations
Regional Transmission Organizations (RTO) manage the power grid across wide
regions of the United States Most of Texas is inside the ERCOT region however there
are significant portions of East Texas and the Panhandle that are in the Midcontinent
Independent System Operator (MISO) and the Southwest Power Pool (SPP) Issues arise
in these other RTOs that have significant impact on Texas ratepayers such as how
transmission infrastructure costs will be shared These tend to be very lengthy and
complicated proceedings that require specialized legal and consulting services
28 | P a g e
2017 SCOPE OF COMPETITION IN ELECTRIC MARKETS IN TEXAS REPORT
PURA sect 394525 currently authorizes the Commission to use outside consultants
auditors engineers or attorneys to represent the Commission in proceedings before the
Federal Energy Regulatory Commission This provision has been an important tool for the
Commission to respond to complex matters in the federal arena to enable it to protect the
public interest in Texas The PUC recommends that the Legislature expand the language
in this statute to include the ability to hire outside assistance for proceedings before other
RTOs to provide those same protections to Texas ratepayers in those areas
C Repeal of Natural Gas and Renewable Energy Mandates
1 Natural Gas
PURA sect 399044 establishes natural gas as ldquothe preferential fuelrdquo in Texas for electricity generation and requires the Commission to adopt rules to establish a system of
natural gas energy trading credits The majority of all new non-renewable electricity
generation constructed since 2000 for Texas has used natural gas as a primary fuel and this
trend is expected to continue in the foreseeable future The thresholds used to trigger the
natural gas energy trading credit system in PURA sect 399044 have not been reached and
they are not expected to be reached in the foreseeable future
Because natural gas-fueled facilities have been the most commonly built new
generation in Texas for many years and are expected to continue to be there is no need to
establish incentives for natural gas generation The PUC recommends that the Legislature
consider repealing PURA sect 399044 because it is no longer necessary
2 Renewable Energy
PURA sect 39904 establishes goals for renewable energy Subsection (a) requires
the installation of 5880 megawatts of renewable energy by 2015 and Subsection (b)
establishes a renewable energy credits trading program to implement the requirement The
5880 megawatts mandates in Subsection (a) was met in 2008 While the Commission
believes the renewable energy trading credit program is needed for retail electric providers
to validate renewable energy marketing claims the Commission believes the 5880
megawatts mandate in Subsection (a) is no longer necessary
D Advisory Opinions
Many regulatory agencies in Texas have authority to issue informal guidance to the
persons they regulate particularly with respect to outlining whether a particular course of
conduct would in the agencyrsquos view be consistent with the laws and regulations that the agency administers19 The issuance of an advisory opinion can provide regulatory clarity
to a company before making investments or conducting operations the permissibility of
which may be unclear under state law The Legislature may want to consider granting the
19 In addition certain federal agencies such as the Federal Communications Commission
Internal Revenue Service Securities and Exchange Commission and Federal Election
Commission have authority to issue advisory opinions
29 | P a g e
2017 SCOPE OF COMPETITION IN ELECTRIC MARKETS IN TEXAS REPORT
Commission the authority to issue advisory opinions In the electric industry providing
clarification to a company concerning issues such as the purchase of assets or the
acquisition of another company could allow it to avoid expensive regulatory proceedings
without impairing the Commissionrsquos authority The following state agencies have statutory authority to issue advisory opinions
Texas Ethics Commission20
Texas Medical Board21
State Board of Dental Examiners22
Texas Board of Nursing23
Texas Board of Professional Engineers24
Texas Lottery Commission and25
Texas Securities Board26
E Administrative
Gross Receipts Assessment
PURA sect 16001 provides for a gross receipts assessment that is used to defray the
expenses incurred by the Commission to administer PURA An assessment of one sixth of
one percent is collected from public utilities electric cooperatives retail electric providers
and interexchange carriersrsquo gross receipts from consumers The funds from this assessment
are remitted to the general revenue fund but currently they have not been explicitly
dedicated to funding of the Commission In contrast similar assessments on water
utilities insurance companies and other regulated entities have traditionally been used to
explicitly fund the underlying regulatory programs at the respective agencies The
Commission is one of four Article VIII agencies that is not designated as self-funded
The Commission recommends that the Legislature designate the Commission as a
self-funded agency whereby the collected assessments would be explicitly dedicated to the
funding of the agency Implementing this recommendation would require the Public Utility
Commission to be included in the Appropriations Limited to Revenue Collections rider
located in the Special Provisions Relating to All Regulatory Agencies section of the
General Appropriations Act Designation as a self-leveling agency would require the
Commission to set the gross receipts assessment at a rate sufficient to generate revenue in
the amount of the agencyrsquos general revenue appropriation each fiscal year which would require a statutory change to PURA sect16001(b) Based upon the Commissionrsquos baseline budget request authorizing the PUCrsquos self-leveling designation would result in an overall
estimated tax reduction of $456 million per year or 774
20 Government Code sect 571091 21 Occupations Code sect 162107 22 Occupations Code sect 258157 23 Occupations Code sect 301607 24 Occupations Code sect 1001601 25 Occupations Code sect 2001059 26 Tex Rev Civ Stat Ann Arts 581-28-1 amp 581-35 7 Tex Admin Code 1012
30 | P a g e
2017 SCOPE OF COMPETITION IN ELECTRIC MARKETS IN TEXAS REPORT
V APPENDICES
31 | P a g e
2017 SCOPE OF COMPETITION IN ELECTRIC MARKETS IN TEXAS REPORT
Appendix A ndash Acronyms
AEP American Electric Power
AMS Advanced Metering System
CenterPoint CenterPoint Energy Houston Electric LLC
DG Distributed Generation
DRG Distributed Renewable Generation
ERCOT Electric Reliability Council of Texas
ERSC Entergy Regional State
ERS Emergency Response Service
ETI Entergy Texas Inc
IMM ERCOT Independent Market Monitor
kWh Kilowatt-hour
LMP Locational Marginal Pricing
LSP Large Service Provider
MISO Midwest Independent System Operator
MMBtu One million British Thermal Unit (BTU)
MW Megawatt
MWh Megawatt-hour
Nodal Texas Nodal Market Design
ORDC Operating Reserve Demand Curve
PGC Power Generation Company
POLR Provider of Last Resort
PURA Public Utility Regulatory Act
REP Retail Electric Provider
RSC Regional State Committee
RTO Regional Transmission Organization
SCED Security Constrained Economic Dispatch
Sharyland Sharyland Utilities LP
SBF System Benefit Fund
SPP Southwest Power Pool
TDU Transmission and Distribution Utility
TNMP Texas-New Mexico Power Company
32 | P a g e
2017 SCOPE OF COMPETITION IN ELECTRIC MARKETS IN TEXAS REPORT
Appendix B ndash ERCOT Desalination Report
This page intentionally left blank
33 | P a g e
ERCOT Public
Study on the Demand Response Potential for Seawater Desalination Projects
ERCOT November 18 2016
Study on the Demand Response Potential for Seawater Desalination Projects ERCOT Public
Executive Summary
In 2015 the 84th Texas Legislature enacted House Bill (HB) 4097 which included several provisions relating to seawater desalination projects including a requirement that the Public Utility Commission of Texas (PUC) and Electric Reliability Council of Texas (ERCOT) study the potential for seawater desalination projects to participate in existing demand response opportunities in ERCOT There are several demand response products in which demand-side resources (ie consumers of electricity) can participate These programs help to preserve system reliability and provide economic benefits to participating demand-side resources Seawater desalination is an energy-intensive process that removes salt and other minerals from salt water to produce fresh water for municipal consumption industrial use or irrigation Participation in demand response could help mitigate electricity costs for future seawater desalination projects in Texas and provide reliability benefits to the grid
There are two main demand response reliability-based services administered by ERCOT participation by demand-side resources in the Ancillary Services market and the Emergency Response Service (ERS) Within the Ancillary Services market the most common service provided by demand-side resources is Responsive Reserve Service (RRS) which requires resources to respond either instantaneously or within 10 minutes in response to unplanned system emergencies ERS is separate from ERCOTrsquos Ancillary Services market and allows demand-side resources and distributed generation to provide reliability services in the event of an energy emergency Resources can qualify for either the 10-minute or 30-minute response time ERS programs
There are several key considerations that will impact a demand-side resourcersquos ability to participate in different demand response opportunities response time recovery time predictability of electrical demand and flexibility of operations Considering these factors together it appears that seawater desalination plants could be designed to meet the requirements for participation in demand response Because the ability to meet the qualification requirements is dependent on the plant design demand response opportunities should be considered early in a projectrsquos development if participation is desirable
Whether project developers will choose to address these requirements will depend on the economic benefits of participation There may be additional costs to design seawater desalination plants to operate in the manner required in order to participate in demand response These include costs associated with additional plant design specifications need for excess capacity and storage to make up for lost production during demand response deployment operational costs resulting from interruptions to plant processes and potential financial penalties if demand response deployment results in failure to meet contract demands The interplay of the benefits of participation and these costs will determine whether it would be beneficial for a future seawater desalination plant to participate in demand response in ERCOT
To date participation of seawater desalination plants in demand response programs has been limited Because the process of seawater desalination is energy-intensive participation in demand response could help to reduce electricity costs while posing a relatively low risk to plant operations As stakeholders in Texas continue to plan for possible future droughts in the region and identify water management strategies consideration of demand response could play a role in mitigating some costs associated with seawater desalination and allow seawater desalination plants to assist with maintaining electric reliability in the region
copy 2016 ERCOT All rights reserved i
Study on the Demand Response Potential for Seawater Desalination Projects ERCOT Public
Table of Contents
1 Introduction 1
2 Seawater Desalination 2
21 Seawater Desalination Plant Operations 2
22 Seawater Desalination Plant Economics 3
3 Demand Response Opportunities in ERCOT 4
31 ERCOT-Dispatched Demand Response 4
311 Ancillary Services Markets 5
312 Emergency Response Service (ERS) 5
32 Non-ERCOT-Dispatched Demand Response 6
321 Four Coincident Peak (4CP) 6
322 LSE or DR Provider Contracted Price Response 6
323 Self-Directed Price Response 6
4 Demand Response Potential for Seawater Desalination 7
41 Operational Considerations for ERCOT-Dispatched Demand Response 7
42 Economic Considerations for ERCOT-Dispatched Demand Response 8
43 Considerations for Non-ERCOT-Dispatched Demand Response 9
5 Conclusion 11
copy 2016 ERCOT All rights reserved ii
Study on the Demand Response Potential for Seawater Desalination Projects ERCOT Public
1 Introduction
In 2015 the 84th Texas Legislature enacted House Bill (HB) 4097 which included several provisions relating to seawater desalination projects including a requirement that the Public Utility Commission of Texas (PUC) and Electric Reliability Council of Texas (ERCOT) study the potential for seawater desalination projects to participate in existing demand response opportunities in ERCOT ERCOT and the PUC initiated this study to fulfill that requirement and evaluated the operational and economic characteristics of seawater desalination plants in light of ERCOTrsquos primary demand response products1
ERCOT is the independent system operator (ISO) for the ERCOT Interconnection which encompasses approximately 90 of demand for electricity in Texas ERCOT is the independent organization established by the Texas Legislature to be responsible for the reliable planning and operation of the electric grid for the ERCOT Interconnection ERCOT also administers and maintains a forward-looking open market to provide affordable and reliable electricity to consumers in Texas In collaboration with market participants ERCOT has developed demand response products and services for customers that have the ability to reduce or modify electricity use in response to instructions or signals These programs help preserve system reliability and provide economic benefits to participating demand-side resources
The process of seawater desalination removes salt and other minerals from salt water to produce fresh water for consumption industrial processes or irrigation The drought-prone Texas climate coupled with projections for increasing water demand in the state has created interest in seawater desalination as a future water source The 2017 Texas State Water Plan includes seawater desalination as a future water management strategy for water users in the state However the seawater desalination process is energy intensive and electricity consumption can be a significant cost driver for these projects To the extent that these plants could participate in demand response it would help to defray these costs Thus there is a potential nexus between seawater desalination projects built in Texas to mitigate drought but which have large electricity requirements and ERCOT demand response opportunities which could help to reduce their electricity costs and provide reliability benefits
This study evaluates the demand response potential of seawater desalination plants based on their operational characteristics and economic drivers The report is organized as follows
Section 2 provides background on typical seawater desalination plant operations and economics
Section 3 describes the current demand response opportunities in ERCOT
Section 4 evaluates the characteristics of seawater desalination plants to determine their potential to participate in demand response opportunities in ERCOT and
Section 5 provides a summary of the conclusions of this study
1 In the course of developing this report ERCOT consulted with several desalination experts with experience with existing or planned seawater desalination plants in the US The technical experts consulted included Jorge Arroyo (Water Management Consultant) Andrew Chastain-Howley (Black amp Veatch) Jonathan Loveland (Black amp Veatch) Ron Parker (Black amp Veatch) John Wolfhope (Freese and Nichols) and Srinivas Veerapaneni (Black amp Veatch)
copy 2016 ERCOT All rights reserved 1
Study on the Demand Response Potential for Seawater Desalination Projects ERCOT Public
2 Seawater Desalination
There are two primary methods for seawater desalination distillation (also referred to as ldquothermalrdquo) and reverse osmosis Distillation uses heat to remove salts and minerals from seawater by boiling water at high pressures In contrast reverse osmosis technology forces saline water through a membrane to separate water from the salts and minerals While both distillation and reverse osmosis are energy intensive distillation requires thermal energy to heat the water and overall has a higher energy requirement whereas reverse osmosis requires primarily electrical energy and overall is less energy intensive ndash though still with significant electricity requirements
Globally most thermal desalination plants are located in the Middle East due to low energy prices in the region Plants located elsewhere including in the US typically use reverse osmosis technology2 There are two large existing seawater desalination plants in the US one in Carlsbad California providing water to the San Diego area and one in Gibsonton Florida providing water to the Tampa Bay area Both plants use reverse osmosis technology In addition there are several desalination projects currently in the planning stages or under development in Texas in the Corpus Christi area that would use reverse osmosis technology For that reason this report focuses on reverse osmosis technology in the evaluation of demand response potential of seawater desalination plants
While there are currently no existing seawater desalination plants in Texas there are several municipal and industrial brackish water desalination plants in the state According to the Texas Water Development Board (TWDB) there are 46 municipal brackish water desalination plants with capacities greater than 0025 million gallons per day (MGD) in Texas representing a total of 123 MGD of capacity3 The desalination of brackish water is typically less expensive compared to seawater due to the lower relative salinity of brackish water This study focuses exclusively on seawater desalination consistent with the requirements of HB 4097 but it should be noted that conclusions may also apply to brackish water desalination though at a different cost and scale
This section provides high-level information on the operations (Section 21) and economics (Section 22) of seawater desalination plants to inform the discussion of their demand response potential in Section 4
21 Seawater Desalination Plant Operations Seawater desalination plants typically range in capacity from less than 5 MGD up to 165 MGD For example the Carlsbad seawater desalination plant has a capacity of approximately 50 MGD and the plant in Tampa Bay has a capacity of approximately 25 MGD The associated electricity consumption ranges between 10 and 15 kWh1000 gallons produced depending on the salinity of the water being processed456 More saline water (eg seawater) requires larger amounts of electricity for desalination Thus a seawater desalination plant would have larger electricity consumption requirements compared to a similarly sized brackish water desalination plant
2 American Water ldquoInnovation Solutions within the Water Industry Desalinationrdquo Available at httpwwwamwatercomfilesInnovationsSolutionsWithinTheWaterIndustryDesalinationpdf 3 Texas Water Development Board ldquoDesalination Factsrdquo Available at httpswwwtwdbtexasgovinnovativewaterdesalfactsasp 4 American Membrane Technology Association April 2016 ldquoMembrane Desalination Power Usage Put in Perspectiverdquo Available at httpwwwamtaorgcomwp-contentuploads7_MembraneDesalinationPowerUsagePutInPerspectivepdf 5 Water Reuse Association November 2011 ldquoSeawater Desalination Power Consumptionrdquo Available at httpswatereuseorgwpshycontentuploads201510Power_consumption_white_paperpdf 6 Ghaffour N TM Missimer and G Amy January 2013 ldquoTechnical review and evaluation of the economics of water desalination Current and future challenges for better water supply sustainabilityrdquo Desalination 309 pp197-207 Available at httpswwwresearchgatenetpublication256693140_Technical_review_and_evaluation_of_the_economics_of_water_desalination_ Current_and_future_challenges_for_better_water_supply_sustainability
copy 2016 ERCOT All rights reserved 2
Study on the Demand Response Potential for Seawater Desalination Projects ERCOT Public
While the two existing seawater desalination plants in the US were co-located with power plants to ease compliance with regulations on water intake and discharge structures and reduce costs many other reverse osmosis desalination plants receive their electricity from the grid However plants may have on-site backup generation in case of a power outage This will vary depending on the size and design of the plant and other factors For example the Carlsbad plant in California does have diesel backup generation to power control systems and flushing systems in the case of a power outage The plant in Tampa Bay was not built with backup power due to potential storm surge risks from hurricanes and other storms The plant does use uninterruptible power supply (UPS) backup to power control systems during power outages
Reverse osmosis plants are typically designed with several ldquotrainsrdquo which consists of a high-pressure pump turbine and reverse osmosis membrane Desalination plants are turned on or off one train at a time in a highly controlled process The process of ramping up or down an individual train under normal operations typically takes one to two hours While plants can be designed to handle immediate shutdowns (ie in a power outage) re-starting a system after an interruption would take this amount of time In addition the saline water must be pretreated (ie filtered) before going through the reverse osmosis train and this can sometimes pose constraints on the flexibility of operations
Demand for water is the key factor driving the level of production at seawater desalination plants Typically the plant will have a contract or contracts with municipal or other water users to deliver desalinated water and is operated to meet that demand Alternatively if the plant is municipally owned it would similarly be operated to meet the level of water demand in conjunction with other available water sources If water demands are close to a plantrsquos full capacity the operatorrsquos flexibility to adjust its electricity consumption as part of demand response may be limited However this does mean that plant operations are fairly predictable on a day-to-day basis which is necessary for participation in demand response
The amount of flexibility in plant operations will also be impacted by the amount of water storage available For example if a plant has sufficient water storage on-site or storage within the customerrsquos distribution system it could provide flexibility for the plant to reduce its operations during peak hours when electricity prices are likely to be highest It would also mitigate the impacts of interruptions to production from demand response deployments
22 Seawater Desalination Plant Economics Seawater desalination is typically more expensive than other sources of water and a major driver of the overall cost is energy costs In 2016 the Carlsbad plant charged rates at between $2131 and $2367 per acre-foot78 This charge is intended to cover both the fixed costs of the plant and the variable costs to produce a unit volume of water Typically half to two thirds of the cost of providing desalinated seawater are accounted for by capital cost recovery with the remainder accounted for by operations and maintenance costs including electricity costs Electricity costs can account for 20shy25 of the total costs of seawater desalination with reverse osmosis technology9
Factors affecting the capital cost of a seawater desalination plant include plant size type of desalination process and pre-post-treatment technologies plant infrastructure (eg piping water storage backup power) and compliance with applicable regulations (eg regulations on intake structures brine byproduct disposal) A significant driver of operating and maintenance costs is membrane replacement Reverse osmosis membranes need to be replaced every few years and
7 Source San Diego County Water Authority ldquoSeawater Desalinationrdquo Available at httpwwwsdcwaorgseawater-desalination 8 Note that 1 acre-foot is approximately 325851 gallons 9 Based on technical input from Black amp Veatch
copy 2016 ERCOT All rights reserved 3
Study on the Demand Response Potential for Seawater Desalination Projects ERCOT Public
the rate at which they are replaced will depend on the salinity of the feedwater and how the plant is operated Treatment and disposal of the salty brine byproduct from desalination may also incur operating costs
Electricity costs will vary depending on a range of factors including the size of the plant type of desalination technology source of electricity and quality of the feedwater As previously noted more saline water requires higher amounts of electricity in desalination and thus the amount of electricity consumption is a key difference between brackish water and seawater desalination As a result electricity costs comprise a significant share of the costs of seawater desalination These costs could potentially be defrayed in part by participation in demand response initiatives
3 Demand Response Opportunities in ERCOT
Broadly speaking demand response can be broken down into two major categories dispatchable or non-dispatchable For purposes of this report we will define dispatchable as those demand response events that are initiated by ERCOT and non-dispatchable as an event not specifically initiated by ERCOT These non-dispatchable events may include decisions made by the end-use customer to alter its consumption pattern or may include contractual obligations with another entity such as the end-use customerrsquos retail electric provider (ldquoREPrdquo) to alter consumption patterns
ERCOTrsquos wholesale market is open to several types of dispatchable demand response which are deployed to maintain system reliability Demand-side resources providing Emergency Response Service (ERS) may offer based on either a 10 or 30-minute response time commonly referred to as the ldquoramp periodrdquo Alternatively demand-side resources may register and qualify as a Load Resource that can provide Reserves in the Ancillary Services market The most common service provided by demand-side resources is Responsive Reserve Service which requires an under-frequency relay that can instantaneously interrupt the load during certain system reliability events Some demand-side resources can also participate in other Ancillary Services as Controllable Load Resources that require sophisticated control systems that allow them to be deployed in a more incremental proportional manner
Non-dispatchable demand response in ERCOT can include a response to avoid transmission costs where rates are based on Four Coincident Peak Pricing (4CP) response to wholesale energy prices initiated by the customer or by a REP or other load-serving entity (ldquoLSErdquo) or utility-managed Load Management programs (LM)
The sections that follow provide a description of both ERCOT-dispatched (Section 31) and nonshyERCOT-dispatched (Section 32) demand response For a more detailed description of opportunities for demand-side resources to participate in demand response in ERCOT see ERCOTrsquos guide Load Participation in the ERCOT Nodal Market10
31 ERCOT-Dispatched Demand Response There are two main demand response reliability-based services administered by ERCOT participation by demand-side resources in the Ancillary Services market and participation in ERS These services are dispatched by ERCOT during system emergencies
10 Available at httpwwwercotcomcontentservicesprogramsloadLoad20Participation20in20the20ERCOT20Nodal20Market_302d oc
copy 2016 ERCOT All rights reserved 4
Study on the Demand Response Potential for Seawater Desalination Projects ERCOT Public
Demand-side resources with demand response capability that can meet a set of performance requirements can be qualified to provide Ancillary Services as Load Resources in the Ancillary Services Market The value of having a Load Resource available to reduce load is equal to the value of having a generator available to increase its generation at a generating plant The providers of operating reserves selected to provide Ancillary Services are eligible for capacity payments regardless of whether the Resource is actually deployed (or curtailed in the case of the Load Resource)
ERCOT holds auctions on a daily basis for each of the following Ancillary Services Regulation Up Regulation Down Responsive Reserve and Non-Spinning Reserve11 Table 1 describes the various Load Resource types and their qualification requirements and eligible services
Table 1 Load Resource Types and Ancillary Services
Service Load Resource Type a Qualification Responsive Reserves (le50 of total Reserve requirement)
Non Controllable Under-Frequency Relay and 10-minute ramp to manual dispatch instruction
Responsive Reserves
Controllable Primary Frequency Response and follow 5-minute dispatch instructions
Regulation-Up Regulation-Down
Controllable Primary Frequency Response and respond to Regulation deployments
Non-Spin Reserves Controllable Follow 5-minute dispatch instructions a A Controllable Load Resource is a Load Resource capable of controllably reducing or increasing consumption under dispatch control by ERCOT
Demand-side resources that agree to reduce load when directed by ERCOT and that meet other metering and operational requirements as specified in the ERCOT Protocols may participate in Ancillary Services market auctions As noted in Table 1 the type of Ancillary Service that a Load Resource may provide will depend upon the demand-side resourcersquos response time and metering system as well as other requirements described in the Protocols In the Responsive Reserve and Non-Spin Reserve markets the Load Resource will receive capacity payments regardless of whether or not the load was actually deployed but the load must be available for deployment at any time while providing the service
ERCOT procures ERS to maintain grid reliability during emergency conditions and reduce the likelihood of the need for rotating outages ERS participants may offer to provide demand response with either a 10-minute ramp period requirement (similar to Load Resources providing Responsive Reserve Service) or a 30-minute ramp period requirement ERS Resources do not have the same telemetry and under-frequency relay requirements as Load Resources
11 Regulation Up and Regulation Down service respond to signals from ERCOT every 4 seconds to respond to changes in system frequency full response has to be provided within 5 minutes Responsive reserves must provide their committed capacity either instantaneously in an under-frequency event (eg due to a generator outage) or in energy scarcity conditions within ten minutes following an instruction from ERCOT Non-spinning reserves must provide their committed capacity within 30 minutes based on economic dispatch instructions Non-spinning reserve is used as replacement reserve to replenish other ancillary services and during energy scarcity
copy 2016 ERCOT All rights reserved 5
Study on the Demand Response Potential for Seawater Desalination Projects ERCOT Public
ERS is procured through a request for proposal (RFP) process three times per year for four-month contract terms each of which is further split into smaller time periods based on business cycles and other factors Demand-side resources may choose to submit offers in all time periods or only in those that best fit their unique circumstances and may vary both the price and demand response capacity offers by time period
Payments for ERS are performed up to 80 days after each four month contract term has ended and are subject to downward revision based upon delivered demand response capacity and the demand-side resourcersquos availability during the contract term
32 Non-ERCOT-Dispatched Demand Response The options listed below are not dispatched by ERCOT but they either are controlled directly by a customer or are dispatchable by another entity such as a demand response provider (ldquoDR Providerrdquo) REP or a transmission and distribution utility
Many industrial customers are subject to transmission charges based upon a Four Coincident Peak (4CP) demand The 4CP demand is determined by averaging the consumerrsquos actual demand during the 15-minute settlement interval with the highest ERCOT demand during each of the four summer months (June through September) This measured 4CP demand serves as the basis for the customerrsquos transmission tariff charges for the following year By correctly predicting the ERCOT system peaks during the summer and curtailing load during those intervals a consumer can help reduce the stress imposed on the electric system during peak periods of consumption and reduce its transmission charges for the following calendar year
In the competitive areas of ERCOT consumers can contract with their REP or a DR Provider to have their load respond to the REPrsquos or DR Providerrsquos instructions The contract will usually outline the parameters of this response ndash at what times and frequency demand response events can be called ramp periods sustained response periods compensation etc Because this response is a contractual matter between the REP or DR Provider and the consumer a great deal of variety can be present in these arrangements For example a consumerrsquos response may be voluntary or required compensation could come in the form of reduced energy prices or rebate payments for each curtailment event consumers might be notified up to a day in advance or could have no notification at all (for automated curtailment)
In areas of ERCOT not open to competition interruptible tariffs may be available These tariffs will usually offer a reduced energy price for defined curtailment obligations
REPs may offer dynamic pricing options or consumers within a municipality or cooperative may have their energy prices determined by a published tariff which also may be structured based upon Time-of-Use (TOU) or have a Critical Peak Pricing (CPP) or Peak Time Rebate (PTR) component Self-directed price response refers to consumers making an independent decision to respond to energy prices contained in a governing tariff or in either the ERCOT Day Ahead or Real Time energy markets
TOU offerings will typically have higher energy prices during normal peak periods ndash for example a TOU tariff may charge one price during Monday through Friday from 2 pm through 8 pm and another price during all other times Customers may choose to reduce consumption during these high priced periods Load reduction can be accomplished by load shifting (loads can be shifted by
copy 2016 ERCOT All rights reserved 6
Study on the Demand Response Potential for Seawater Desalination Projects ERCOT Public
rescheduling certain processes or by utilizing thermal storage) ending certain processes that are no longer economic or through energy efficiency measures
Offerings that incorporate CPP usually have prescribed high prices only during certain defined periods ndash for example when load or prices are expected to reach a certain level Response to CPP may be similar to those employed under TOU tariffs especially if CPP is reached frequently More often CPP is infrequent and as such short-term load curtailment may be the more appropriate response to meet economic objectives
4 Demand Response Potential for Seawater Desalination
This section evaluates whether the operational characteristics and economics of seawater desalination plants would enable them to participate in one or more of the various demand response opportunities in the ERCOT Region To date participation of seawater desalination plants in demand response programs has been limited Neither the plant in Carlsbad nor the plant in Tampa Bay participate in demand response programs in California or Florida respectively However as will be described below it appears that these plants can be designed and operated to meet the requirements for participation in demand response and receive economic benefit from participation in these programs
Section 41 describes the operational parameters that must be met for a demand-side resource to provide ERCOT-dispatched demand response and evaluates the ability of seawater desalination plants to meet these criteria Section 42 discusses the tradeoffs between payments for participation in ERCOT-dispatched demand response and potential additional costs posed to seawater desalination plants Finally Section 43 presents other opportunities for seawater desalination plants to reduce their electricity costs outside of ERCOTrsquos reliability-based services that are open to demand response assets
41 Operational Considerations for ERCOT-Dispatched Demand Response There are several key operational parameters that impact a demand-side resourcersquos ability to participate in different demand response services response time recovery time predictability of electrical demand and flexibility of operations This section discusses each of these considerations as they apply to seawater desalination plants
As discussed in Section 31 one of the differentiating factors between ERCOTrsquos demand response products is the amount of time within which a demand-side resource must respond to a deployment instruction to reduce electricity consumption during an event Participation in RRS requires an automatic response within either half a second (ie instantaneous) based on grid frequency or within 10 minutes via a manual instruction ERS requires a response time of either 10 or 30 minutes As noted in Section 21 the typical time to take a reverse osmosis train on- or off-line is 1-2 hours under normal controlled operations To comply with the response time requirements of RRS or ERS a seawater desalination plant would need to be able to reduce its electricity consumption far more quickly than in normal operations This is an element of plant design that would need to be accounted for in the specifications of the project Considerations include the potential need for on-site backup generation including uninterruptible power supply potential impacts to plant infrastructure (eg piping) reverse osmosis membranes and pretreatment systems
The two large US desalination plants provide illustrative counterpoints in this respect The Carlsbad plant was designed to withstand instantaneous power interruptions and has on-site backup generation including uninterruptible power supply to provide the ability to power control systems and flush the membranes in the event of a power loss In contrast the Tampa Bay plant was not
copy 2016 ERCOT All rights reserved 7
Study on the Demand Response Potential for Seawater Desalination Projects ERCOT Public
designed with on-site backup generation and a loss of power would result in a plant shutdown and may require several days to bring the plant back on-line Thus it appears that it is technically possible for a seawater desalination plant to meet the response time requirements for participation in demand response so long as this factor is considered in the design of the facility
The time it takes a desalination train to return to operations after an event is also a consideration Demand-side resources participating in RRS must be able to come back on-line within three hours and those participating in ERS must return within 10 hours Again it appears that it is technically feasible for desalination plants to meet this requirement so long as this requirement is considered in the plant design
An additional consideration is the predictability of a demand-side resourcersquos electricity consumption Participation in the responsive reserves ancillary service market requires bidding in the day-ahead market and thus a demand-side resource must know with great accuracy (within 95) its electrical demand at least a day ahead of time For ERS auctions are held three times a year for four-month contract periods Thus to participate in ERS a resource must know its forecasted electrical demand several months in advance Because seawater desalination plant operations are driven by contracted demand for water it is likely that a plant operator would have a good idea of the plantrsquos electrical demand days or even weeksmonths in advance especially for summer months when demand is likely to be relatively steady An important consideration however is the salinity of the water which drives the electrical requirements and which can be impacted by recent weather events Similarly reductions in demand for water during non-summer months or wet summer days where demand may be reduced could also impact a plantrsquos ability to predict its electricity demand
Finally a seawater desalination plant must have sufficient flexibility in its day-to-day operations so that it can afford to lose several hours of production when deployed for demand response It should be noted that demand-side resources participating in RRS and ERS are called infrequently demand-side resources providing responsive reserves were deployed one time in 2015 and ERS was not deployed that year However this is an important factor to consider if a plant is operating at close to full capacity and would incur financial penalties if it fails to meet its contract obligations due to a demand response event Including additional storage and building a plant with extra capacity could help to mitigate this risk It should also be noted that a plant operator does not need to commit the full plant capacity to these services but rather can specify an amount of MW that will be committed Thus a plant operator could mitigate issues both with predictability and flexibility of plant operations by committing only a portion of its predicted electrical demand to participate in demand response
Considering these factors together it appears that seawater desalination plants could be designed to meet the operational requirements for participation in ERCOTrsquos demand response services (both RRS and ERS) Because the ability to meet the requirements is dependent on the plant design demand response would need to be considered early in a projectrsquos development if participation is desirable Whether project developers will choose to address these requirements will depend on the economic benefits of participation in demand response which will be discussed in the next section
42 Economic Considerations for ERCOT-Dispatched Demand Response This section describes the economic benefits to demand-side resources from participation in ERCOT-dispatched demand response programs The average price paid for a demand-side resource participating in RRS in 2015 was $1087 per MW per hour and for ERS was $645 per MW per hour for the contract periods during the 2015 program year These payments could provide a significant financial benefit to seawater desalination plants To give a simplified example for a plant with an electrical demand of 10 MW operating at a 100 annual load factor (10 MW times 24 hours times 365 days) the annual benefit would be on the order of $500000 for ERS or $1 million for RRS
copy 2016 ERCOT All rights reserved 8
Study on the Demand Response Potential for Seawater Desalination Projects ERCOT Public
In 2015 demand-side resources providing responsive reserves were deployed one time for a duration of 10 minutes and ERS was not deployed12 The most ERS was ever deployed in a single year was two times in 2011 Thus participation in either program could result in a substantial payment to a seawater desalination plant with a relatively low risk of deployment and associated disruption of plant operations although it is important to note that participation in either ERCOT service subjects demand response resources to annual unannounced testing Other than testing the frequency of deployment will depend on grid conditions and is a risk that should be considered
The financial benefits of participation must be weighed against the costs of designing facilities with the capabilities to operate in this manner These include
bull The costs to design the plant to reduce electrical demand within the required timeframes for demand response and to withstand an instantaneous interruption if not already part of the plant design For example a plant may need to be designed to have backup power generation on-site In addition there could also be costs to restart the system after an interruption
bull The costs to build a plant with excess capacity andor storage to make up for lost production hours when demand response is deployed This will add to the total capital costs of the project Land area constraints should also be considered when considering additional storage as the space requirements for the necessary storage capacity could be significant
bull Costs associated with the impact of interruptions on plant processes (eg more frequent replacement of membranes impacts to pretreatment system or plant infrastructure)
bull Potential financial penalties that would be incurred if deployment as part of demand response were to result in failure to meet contract obligations to supply water
bull The loss of potential benefits in the form of cost avoidance from participation in non-ERCOTshydispatched demand response opportunities (see Section 43) If a plant is committed to RRS or ERS the plant operator would lose the flexibility to take advantage of these other opportunities to reduce their electricity costs
The interplay of these benefits and costs will determine whether it would be beneficial for a future seawater desalination plant to participate in demand response in ERCOT
43 Considerations for Non-ERCOT-Dispatched Demand Response Outside of the reliability-based services administered by ERCOT there are other opportunities for seawater desalination plants to reduce their electricity costs As described in Section 321 seawater desalination plants may be able to reduce the demand charges on their electricity bills through curtailing load during 4CP intervals In addition plant operators may adjust operations in response to real-time electricity prices to take advantage of lower off-peak prices and avoid price spikes (see Sections 322 and 323) All of these opportunities require that the plant have flexibility to reduce production during certain times of the day
In the ERCOT region as noted above a portion of transmission and distribution charges are set based on the peak systemwide 15-minute interval of the four summer months (June through September) referred to as the four coincident peaks (4CP) Large customers can reduce or avoid this charge by reducing electrical consumption during these four peak intervals AEP Central Texas and CenterPoint are the transmission providers covering the majority of the Gulf Coast in Texas13
12 ERCOT June 2016 ldquoLoad Resource Deployment Updaterdquo Available at httpwwwercotcomcontentwcmkey_documents_lists870985_RRS_Load_Resource_Deployment_Updatepdf 13 It is also possible that a seawater desalination plant could be located in an area that as not opted in to competition in which case the plant owner would need to negotiate its electricity charges bilaterally with the Non Opt-In Entity (NOIE)
copy 2016 ERCOT All rights reserved 9
Study on the Demand Response Potential for Seawater Desalination Projects ERCOT Public
Assuming a future seawater desalination plant would be connected at transmission-level voltages the relevant 4CP charges based on the 2016 tariffs accounting for both transmission charges and transmission cost recovery factors would be $41425 per 4CP kW for AEP Central Texas and $41870 per 4CP kVA for CenterPoint14 If a seawater desalination plant has 10 MW of load and is capable of interrupting all of it and successfully does so for all four 4CP intervals the savings based on the 2016 tariffs would be approximately $500000 per year ($41425 times 1000 (kW to MW) times 10 MW times 12 months) Thus a seawater desalination plant that reduces its electricity use during the 4CP intervals could avert some or all of these charges
Another opportunity for seawater desalination plants to reduce their electricity costs is through adjusting operations in response to real-time electricity prices In 2015 the average electricity price in ERCOT was $2677MWh However prices exceeded $50MWh in 254 hours (3 of all hours) $100MWh in 88 hours (1) $200MWh in 40 hours (05) and $300MWh in 21 hours (02) Prices exceeded $3000MWh for 021 hours15 Depending on the desalination plantrsquos exposure to real-time wholesale market prices (via its retail contract) the degree of high prices the plant owner is willing to avoid and grid conditions in a given year reducing unit operations in order to avoid high electricity prices could impact operators for anywhere between a few and several hundred hours out of the year In addition a plant can plan its operations to take advantage of lower electricity prices during off-peak periods (eg at night when generation from wind is high) For example at least one company is marketing a modular desalination unit design intended to take advantage of low prices during periods of high renewables generation and to provide grid reliability services through demand response16
There are several factors to consider regarding these opportunities to reduce electricity costs The plant would need to monitor the ERCOT market or hire a contractor to do so in order to know when to reduce demand for electricity These programs do not impose any requirements on response time as with RRS or ERS and there may be sufficient warning of 4CP intervals or peak pricing to allow the plant operator to plan its operations earlier in the day with sufficient time to ramp down production under controlled conditions However quicker ramping capability may be desirable to respond to electricity price fluctuations
For 4CP because the four intervals used to set demand charges are not known ahead of time it is likely that the plant would need to reduce its demand multiple times per summer to ensure the 4CP intervals are hit impacting production at the facility Timing operations to coincide with off-peak pricing or to avoid price spikes would similarly result in reduced operations during certain hours To offset the lost production hours the plant may need to be designed with extra capacity and water storage capability to maintain the ability to meet its contractual obligations for freshwater delivery Because the period of reduced operations is greater than with ERCOT-dispatched demand response services this need would be greater for a seawater desalination plant reducing load during 4CP intervals or in response to real-time electricity prices and would increase the capital costs of the project It should also be noted that high prices in the ERCOT Region typically but not always occur in summer months when drought conditions are more likely to develop and demand for desalinated water is likely to be highest This may limit the flexibility of the plant to time its electricity consumption to avoid high-priced hours
14 Public Utility Commission of Texas ldquoTransmission and Distribution Rates for Investor Owned Utilitiesrdquo Available at httpwwwpuctexasgovindustryelectricratestdraspx 15 Potomac Economics June 2016 2015 State of the Market Report for the ERCOT Wholesale Electricity Markets Available at httpswwwpotomaceconomicscomindexphpmarkets_monitoredERCOT 16 Sisyan LLC ldquoDemand Response Desalinationrdquo Available at httprenewabledesalinationcomwpshycontentuploads201506Demand-Response-Desalinationpdf
copy 2016 ERCOT All rights reserved 10
Study on the Demand Response Potential for Seawater Desalination Projects ERCOT Public
In addition the plantrsquos ability to participate in demand response would also be limited for those hours it is reducing load as part of 4CP response or in response to real-time prices because the plant would not be able to reduce its electricity consumption if that demand is already committed to another demand response service Thus participating in demand response versus taking advantage of these other opportunities may be to some extent mutually exclusive
5 Conclusion
Based on this analysis it appears that the operational characteristics of seawater desalination plants would allow them to participate in demand response opportunities in ERCOT so long as the necessary operational requirements are considered in the design specifications of the plant Project developers should consider the necessary requirements early in the plant design Whether the economic benefits of participation would provide a sufficient incentive for them to do so will depend on the costs of accommodating those operational requirements and whether there is the flexibility available to operate the plant as necessary under these programs Though most existing seawater desalination plants do not participate in demand response programs it does appear that participation by these plants is possible and could result in a financial benefit Table 2 compares the different demand response opportunities available to demand-side resources in ERCOT
Table 2 Comparison of Demand Response Opportunities Demand Response
Opportunity Requirements for
Participation Impacts to Plant
Operations Financial Benefit Ancillary Services ndash Responsive Reserve Service (RRS)
bull Under-Frequency Relay bull Instantaneous or 10 minute
response time bull Recover load within 3
hours bull Bid in day-ahead market
bull Deployed once in 2015 for 10 minutes bull Subject to annual
unannounced testing
bull $1087 per MW per hour (based on 2015 prices)
Emergency Response Service (ERS)
bull 10 or 30 minute response time bull Recover load within 10
hours bull Four-month contract term
bull Not deployed in 2015 the most times ever deployed in a single year was twice in 2011 bull Subject to annual
unannounced testing
bull $645 per MW per hour (based on 2015 prices)
Four Coincident bull Interval Data Recorder bull Likely plant will need to bull Avoid ~$48000 per 4CP Peak (4CP) (IDR) meter
bull Ability to predict system-wide peak demand hours during summer months
reduce load multiple times per summer to hit 4CP intervals bull Likely to be able to predict
possible 4CP intervals earlier in day
MW per year (based on 2016 tariffs) if successful in reducing during all four summer months
LSE or DR Provider Contracted Price Response
bull Varies based on contractual arrangements
bull Varies based on contractual arrangements
bull Varies based on contractual arrangements
Self-Directed Price bull Retail contract with bull Varies depending on bull Varies depending on Response exposure to real-time
market prices bull Ability to monitor real-time
prices in ERCOT wholesale market
number and severity of pricing events bull May be able to predict
peak pricing events earlier in day
number and severity of pricing events
copy 2016 ERCOT All rights reserved 11
Study on the Demand Response Potential for Seawater Desalination Projects ERCOT Public
Demand response programs in ERCOT provide opportunities for demand-side resources to defray their electricity costs and provide reliability benefits to the ERCOT electric grid Because the process of seawater desalination is energy intensive participation in demand response could help to reduce electricity costs while posing a relatively low risk to plant operations if demand response participation is factored into plant design
Participation in non-ERCOT-dispatched demand response opportunities such as reducing load during 4CP intervals or in response to real-time electricity prices may also help to reduce electricity costs for seawater desalination plants in Texas As stakeholders in Texas continue to plan for possible future droughts in the region and identify water management strategies consideration of demand response could play a role in mitigating some costs associated with seawater desalination and allow seawater desalination plants to assist with maintaining electric reliability in the region
copy 2016 ERCOT All rights reserved 12
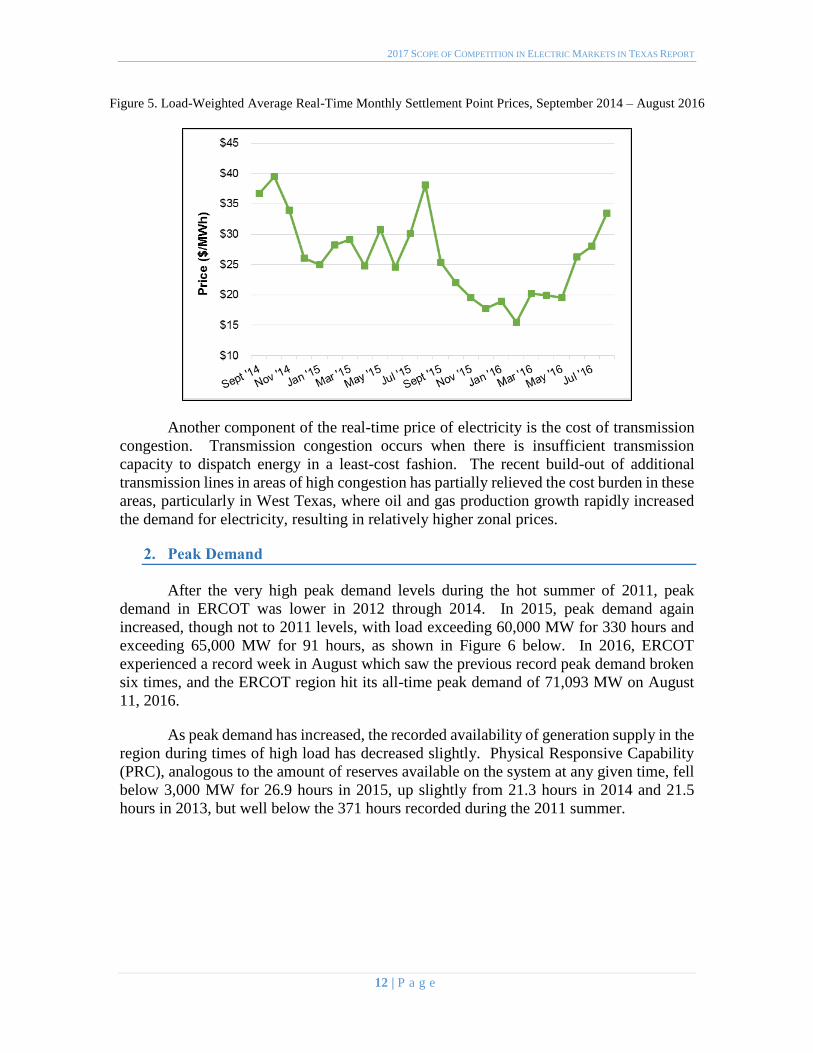
2017 SCOPE OF COMPETITION IN ELECTRIC MARKETS IN TEXAS REPORT
Figure 5 Load-Weighted Average Real-Time Monthly Settlement Point Prices September 2014 ndash August 2016
Another component of the real-time price of electricity is the cost of transmission
congestion Transmission congestion occurs when there is insufficient transmission
capacity to dispatch energy in a least-cost fashion The recent build-out of additional
transmission lines in areas of high congestion has partially relieved the cost burden in these
areas particularly in West Texas where oil and gas production growth rapidly increased
the demand for electricity resulting in relatively higher zonal prices
2 Peak Demand
After the very high peak demand levels during the hot summer of 2011 peak
demand in ERCOT was lower in 2012 through 2014 In 2015 peak demand again
increased though not to 2011 levels with load exceeding 60000 MW for 330 hours and
exceeding 65000 MW for 91 hours as shown in Figure 6 below In 2016 ERCOT
experienced a record week in August which saw the previous record peak demand broken
six times and the ERCOT region hit its all-time peak demand of 71093 MW on August
11 2016
As peak demand has increased the recorded availability of generation supply in the
region during times of high load has decreased slightly Physical Responsive Capability
(PRC) analogous to the amount of reserves available on the system at any given time fell
below 3000 MW for 269 hours in 2015 up slightly from 213 hours in 2014 and 215
hours in 2013 but well below the 371 hours recorded during the 2011 summer
12 | P a g e
2017 SCOPE OF COMPETITION IN ELECTRIC MARKETS IN TEXAS REPORT
Figure 6 High Load Hours in ERCOT 2011 ndash 2016
As shown in Table 6 the ERCOT system peak demand was 69877 MW in 2015
up 5 from the 2014 peak and the 2016 ERCOT system peak demand increased 174
from the peak demand of the previous year
Table 6 ERCOT Peak Demand 2012 ndash 2016
Year
ERCOT Peak
Demand (MW)
Percentage Change
from Prior Year
2012 66548 ndash 2013 67245 105
2014 66454 ndash118
2015 69877 515
2016 71093 174
Figure 7 shows the hourly peak load for each month in ERCOT from January 2014 to
August 2016
13 | P a g e
2017 SCOPE OF COMPETITION IN ELECTRIC MARKETS IN TEXAS REPORT
Figure 7 Monthly Peak Demand in ERCOT January 2014 ndash August 2016
3 Generation Diversity
As electricity consumption has increased in ERCOT the diversity of the systemrsquos generation portfolio has also increased Generators participating in the statersquos renewable energy credit (REC) trading program reported an 11 increase in renewable generation
from 2013 to 2015 rising from 376 million MWh to 469 million MWh with wind
representing 96 of the total renewable mix Landfill gas was the second most prevalent
renewable source representing approximately 12 of all renewable generation in 2015
Energy produced from wind generation was up by 13 in 2015 from 2013 and solar
energy capacity more than doubled from 121 MW in 2013 to 288 MW in 2015 Coal-fired
generation has been steadily shrinking as a proportion of total generation declining from
37 of electricity produced in 2014 to 28 in 2015 Energy use in the ERCOT region by
fuel type for 2015 is shown in Figure 8
14 | P a g e
2017 SCOPE OF COMPETITION IN ELECTRIC MARKETS IN TEXAS REPORT
Figure 8 Energy Use in ERCOT by Resource Type 2015
The Commissionrsquos projects are further described in the following section of this report
15 | P a g e
2017 SCOPE OF COMPETITION IN ELECTRIC MARKETS IN TEXAS REPORT
III SUMMARY OF COMMISSION ACTIVITIES FROM 2015 TO 2016
Introduction
The Commission develops and modifies rules policies and procedures for the
competitive electric market in Texas in response to the technological advances in the
industry and the evolving needs of customers The Commission also continues to carry
out oversight of programs with which the Legislature has tasked it ndash such as energy
efficiency renewable energy and advanced metering infrastructure Within the
ERCOT region the monopoly wires-and-poles companies that provide transmission
and distribution services throughout the grid remain subject to traditional rate
regulation by the Commission The Commission continues to set rates for these
utilities as they are not subject to the forces of market competition This section
provides an overview of the Commissionrsquos activities in its oversight of the wholesale and retail electric markets as well as its governance over regulated electric utilities
Resource Adequacy
Resource adequacy is the long-term ability of the system to serve demand reliably
when consumption is highest given the available installed capacity load resources and
the operational reliability of the system Assessing resource adequacy requires comparing
the systemrsquos forecast installed capacity and load resources against the forecast peak
summer load The difference between the forecast of available generation and load
resources and the forecasted demand for electricity is referred to as an ldquoinstalled capacity
reserve marginrdquo which is an indicator of the ability of the system to meet customer demand
during peak conditions In addition to evaluating the forecast reserve margin assessing
resource adequacy includes evaluating the systemrsquos operational reliability The systemrsquos operational reliability depends on the ability of generators to manage plant operations
successfully as well as the grid operatorrsquos ability to manage the system to avoid or to mitigate load curtailment During 2015 and 2016 the ERCOT system performed well with
respect to resource adequacy The Commission has devoted significant attention to
ensuring that ERCOT maintains an adequate installed capacity reserve margin and a high
level of operational reliability developing a wholesale market design that allows
consumers to continue to receive low-cost and reliable electricity over the long term
1 Capacity Demand and Reserves Report
The Capacity Demand and Reserves (CDR) Report published by ERCOT semi-
annually is a snapshot estimate of long-term supply and demand and the associated annual
reserve margin for peak summer and winter conditions While the CDR Report is not a
forecast of any particular outcome it provides insight into possible resource adequacy
trends
16 | P a g e
2017 SCOPE OF COMPETITION IN ELECTRIC MARKETS IN TEXAS REPORT
The May 2016 CDR Report shows estimated reserve margins well above the
current target reserve margin of 1375 Installed capacity reserve margin estimates taken
from this CDR Report are shown below in Table 7
Table 7 May 2016 Capacity Demand and Reserves Report Forecast
Forecast 2017 2018 2019 2020 2021 2022 2023 2024 2025 2026
Peak Load
(MW)
68548 69409 70795 71420 72098 72792 73482 74168 74864 75704
Total
Capacity
(MW)
80995 87019 87238 87407 87678 87738 87738 87728 87728 87728
Reserve
Margin
182 254 232 224 216 205 194 183 172 159
2 Operating Reserve Demand Curve
In ERCOT the price signals produced by the energy-only wholesale electric market
should provide incentives to promote short-term reliability as well as induce optimal long-
run investment in new resources If the prices are efficient and reflect the full cost of
dispatching resources to meet demand the benefits that accrue to both consumers and
producers can be maximized at the least cost and new generating capacity (or load
resources) should develop to maintain the equilibrium as old resources retire or demand
increases
The Operating Reserve Demand Curve (ORDC) implemented at the Commissionrsquos direction in June 2014 improves price formation by allowing prices to more fully reflect
the value of operating reserves The ORDC assigns an economic value to operating
reserves or the amount of extra capacity available to maintain system reliability on a daily
basis
As part of its ongoing review of resource adequacy in ERCOT the Commission is
currently evaluating the accuracy of the inputs to the ORDC to ensure that its contribution
to price formation appropriately reflects the costs of meeting demand and the underlying
needs of the system
3 Transmission Congestion
Although competitive power producers and regulated transmission providers form
two distinct segments of the market transmission buildout has a direct effect on wholesale
power prices When there is insufficient transmission capacity to dispatch energy in a least-
cost fashion the system operator takes action to ensure that the physical limits of the
transmission system facilities are not violated The re-dispatch of generation because of
transmission limits results in disparate prices at different locations on the system In
comparison to prior years transmission congestion in ERCOT has lessened because of the
large increase in transmission investment and the reduction of high demand related to oil
and gas production in West Texas ERCOT and the Commission continually evaluate the
need for cost-effective additional transmission investment to manage congestion
17 | P a g e
2017 SCOPE OF COMPETITION IN ELECTRIC MARKETS IN TEXAS REPORT
4 Wholesale Market Design Initiatives
While the ERCOT wholesale market has been successful in attracting new resource
investment and also maintaining competitive prices for consumers certain improvements
to the market design could yield additional benefits in terms of efficient price formation
and opportunities for entry of new technology Initiatives already in place in many other
regions such as real-time co-optimization and multi-interval real-time resource dispatch
may allow existing capacity to be used more effectively and create opportunities for the
integration of additional load resources to serve electric demand The Commission
continues to work with ERCOT and interested stakeholders to determine the value of
implementing such enhancements particularly as ERCOTrsquos resource mix changes over time
5 Reliability Standard
In early 2014 the Commission opened a project to review its use of a target installed
capacity reserve margin based on a reliability standard equivalent to one loss-of-load event
every ten years In this project the Commission received written comment from interested
parties conducted a public workshop consulted with independent experts and reviewed
the application of reliability standards in other regions As a result of this review future
reliability metrics to be estimated in ERCOT will include the market equilibrium reserve
margin the economically-optimal reserve margin and the associated levels of expected
unserved energy The Commission believes that publishing these metrics represents an
improvement over reporting a one-event-in-ten-years standard by enhancing insight into
expected outcomes in ERCOTrsquos energy-only market
Non-ERCOT Utilities Market Development Activities
SB 7 the law that introduced retail competition to the Texas market in 1999
granted the Commission authority to delay retail competition in an area where deregulation
would not result in fair competition and reliable service because of the lack of an
independent organization to coordinate the electric system and the concentration of
ownership in the generation sector in some of those areas Consequently SB 7 included
provisions recognizing the difficulty of implementing retail competition in areas outside of
ERCOT Therefore the utilities outside of the ERCOT region remain vertically integrated
owning generation transmission and distribution assets as well as selling power to end-
use customers These vertically integrated utilities remain subject to traditional regulation
including rates set by the Commission and customer choice is not offered in the service
territories of these utilities
The Commission does continue to monitor ongoing activities in the non-ERCOT
portions of the state In 2015 the Legislature granted the Commission the authority to
retain counsel and consulting experts in order to participate in legal proceedings at the
Federal Energy Regulatory Commission (FERC) which has regulatory jurisdiction over
wholesale power sales and transmission rates outside of ERCOT This authority has
18 | P a g e
2017 SCOPE OF COMPETITION IN ELECTRIC MARKETS IN TEXAS REPORT
permitted the Commission to participate more effectively in FERC proceedings affecting
Texasrsquo utilities located outside of ERCOT
1 Southwest Power Pool
The Southwest Power Pool (SPP) is the Regional Transmission Operator (RTO) for
areas of Northeast Texas and the Texas Panhandle In Texas the utilities Southwestern
Electric Power Company (SWEPCO) Southwestern Public Service (SPS) and several
electric cooperatives and municipally owned utilities are in SPP In addition to these areas
of Texas the SPP footprint includes parts of New Mexico Arkansas Missouri Nebraska
Louisiana and all of Kansas and Oklahoma In 2015 SPP became the RTO for the
Integrated System and neighboring areas which includes parts of Iowa Minnesota North
Dakota South Dakota Wyoming and Montana SPP has spent extensive time and
resources over the last two years to integrate these new areas successfully The expansion
added 5000 MW of peak demand 7600 MW of generating capacity and 9500 miles of
transmission lines17
In 2014 SPP launched its new Integrated Marketplace which provides a Day-
Ahead Market a Real-Time Balancing Market and Congestion Hedging Markets
mechanisms similar to those available in ERCOT The implementation of the Integrated
Marketplace resulted in a savings of $422 million in 2015 As a result of the Integrated
Marketplace SPPrsquos planning reserve margin will be reduced from 136 to 12 a change
expected to save about $90 million annually
Chairman Donna L Nelson represents the Commission as a voting member on
SPPrsquos Regional State Committee (RSC) The RSC provides collective state regulatory
agency input on a variety of issues In addition the RSC has authority over the cost
allocation methodologies for transmission upgrades allocation of Financial Transmission
Rights and the approach used for resource adequacy across the SPP region The RSC
regularly meets on a quarterly basis and meets more frequently if necessary
2 Midcontinent Independent System Operator
The Midcontinent Independent System Operator (MISO) is an RTO that serves all
or part of 15 states in the central US one Canadian province and the portion of eastern
Texas served by the vertically integrated utility Entergy Texas Inc MISO provides a Day
Two market which has a variety of functions and services including energy and ancillary
service markets economic dispatch congestion management financial transmission rights
and transmission planning The MISO Independent Market Monitor concluded that the
MISO wholesale markets were competitive in 2015
Like SPP MISO is in the Eastern Interconnection which crosses state boundaries
and is therefore subject to FERC jurisdiction A number of recent FERC proceedings have
17 2015 Southwest Power Pool Annual Report Available at
httpswwwspporgdocuments37800201520southwest20power20pool20annual20reportpdf
19 | P a g e
2017 SCOPE OF COMPETITION IN ELECTRIC MARKETS IN TEXAS REPORT
affected the portion of Texas that is in the MISO footprint The Commission through
outside counsel has been an active party in such FERC proceedings FERC Docket No
ER14-1174 addressed in part a dispute regarding the availability of transmission capacity
under the Joint Operating Agreement between MISO and the SPP Ultimately FERC
approved a settlement agreement under which MISO will compensate SPP and its members
for using their or other entitiesrsquo transmission systems
In a related pending docket at FERC Docket No ER14-1736 parties are addressing
how the cost of these payments will be allocated among MISO market participants Parties
in this proceeding are engaged in settlement discussions In addition in Docket No ER14-
75-000 FERC approved a settlement agreement among the participating Entergy
Operating Companies and their retail regulators to terminate the Entergy System
Agreement effective August 31 2016 The settlement terms prohibit any post-termination
payments that roughly equalize production costs among the operating companies after
December 31 2015 terminate certain specific cross-purchase power agreements between
Entergy Texas and former Entergy Gulf State Louisiana and permit the continuation of
several other purchase power agreements
Commissioner Kenneth W Anderson Jr represents the Commission as a voting
member in the Organization of MISO States (OMS) the purpose of which is to coordinate
regulatory oversight among the states in the MISO region and to make recommendations
to MISO FERC and other entities Commissioner Anderson also represents the
Commission as a voting member of the Entergy Regional State Committee (ERSC) which
has certain FERC-approved authority for five years after the Entergy integration with
regard to cost allocation for Entergy transmission projects and adding transmission projects
to the Entergy construction plan The ERSC meets quarterly
3 Western Electricity Coordinating Council
The Western Electricity Coordinating Council (WECC) is a Regional Entity whose
region includes the area surrounding El Paso and extends from Canada to Mexico
including the provinces of Alberta and British Columbia the northern portion of Baja
California and all or portions of the 14 Western states in between WECC is the Regional
Entity responsible for Bulk Electric System reliability in the Western Interconnection and
associated compliance monitoring and enforcement WECC does not have organized
markets outside of California but is organized into 38 separate balancing authorities
WECC is geographically the largest and most diverse of the eight Regional Entities in the
United States with delegated authority from the North American Electric Reliability
Corporation (NERC) and the Federal Energy Regulatory Commission In Texas El Paso
Electric Company is a member of WECC
Rulemaking Activities
The Commission has continued to adopt new rules and modify existing rules in
order to further the continued successful operation of the competitive retail and wholesale
markets and to comply with statutory changes made to PURA by the Legislature This
20 | P a g e
2017 SCOPE OF COMPETITION IN ELECTRIC MARKETS IN TEXAS REPORT
section of the Report provides a high-level overview of the Commissionrsquos key rulemaking
activities highlighting the market improvements made in 2015 and 2016
1 Cost Recovery and Rate Adjustment
The Commission adopted new rule 16 TAC sect25246 on June 29 2016 to
implement Section Nos 1 through 3 of House Bill 1535 of the 84th Legislature The new
rule only applies to a utility that operates solely outside of ERCOT and allows for the use
of an update period beyond the test year for which the utility initially files estimated
information The rule clarifies that all information originally estimated must be updated
with actual information and also provides requirements for a post-test-year adjustment for
a natural gas-fired plant A non-ERCOT utility also is required to initiate a new base rate
case on or before the four year anniversary of the final order in the utilityrsquos most recent comprehensive base rate case or if the commission determines that the utility has
materially earned more than its authorized rate of return in two consecutive years The rule
also provides requirements and procedures for the relation back of final rates to an effective
date 155 days after the filing of the rate application
2 Changes to Certificates of Convenience and Necessity and CREZ Rule
The Commission conducted a rulemaking to implement changes pursuant to
Legislative mandates in SB 776 SB 933 and HB 1535 of the 84th Legislature SB 776
required municipally owned utilities to apply for a certificate of convenience and necessity
(CCN) before constructing transmission facilities outside the boundaries of the
municipality that owns the municipally owned utility SB 933 also requires persons to
obtain a CCN before interconnecting a tie line into the ERCOT grid HB 1535 requires the
Commission to issue a final order within 181 days for a non-ERCOT utility requesting a
CCN for an existing electric generating facility and 366 days after a non-ERCOT utility
files a CCN for a newly constructed generating facility In addition the Commission also
determined in this rulemaking that all future transmission projects in a Competitive
Renewable Energy Zone (CREZ) must meet the need criteria of PURA sectsect 37056(c)(1)
and (2) rather than being exempt Finally the Commission determined that the CREZ
project established in 2008 was complete following the installation of a second circuit on
a Sharyland line
3 Use of Handheld Device for Enrollment
As the market evolves the Commission evaluates market changes balancing its
desire to encourage customer-focused innovation with its concern for customer protection
against potential abuses In Docket No 44518 the Commission granted a REP a
temporary 12-month waiver from its rules requiring the marketer to obtain telephonic
verification of the customerrsquos desire to switch REPs as well as a waiver from certain authorization disclosure requirements among other stipulations the Commission placed
upon the REP The Commission then opened Project No 45625 to study the issue of REPs
utilizing hand-held devices for customer enrollment more broadly and engage with market
representatives consumer representatives and other stakeholders The Commission
anticipates considering an amendment to its rules in the spring of 2017
21 | P a g e
2017 SCOPE OF COMPETITION IN ELECTRIC MARKETS IN TEXAS REPORT
4 Smart Meter Texas Portal
The electric utilities in Texas that have advanced metering systems (AMS) jointly
own and operate a single web portal known as Smart Meter Texas (SMT)18 SMT fulfills
two requirements imposed by the Commissionrsquos advanced metering rule on a utility with
AMS (1) provide to the retail customer the REP serving the customer and other entities
authorized by the customer access to such retail customerrsquos consumption data and (2)
allow devices at the customerrsquos premises to communicate through a home area network with the advanced meter at the premises SMT also facilitates near real-time on-demand
reads of a customerrsquos meter that aids prepaid service offered by certain REPs
In Project No 42786 Review of Advanced Metering System Web Portal
Commission staff and stakeholders examined options for the long-term operational
structure governance and funding of SMT The Commission determined that ownership
of SMT should remain with the TDUs because they can operate the portal at a lower cost
than transferring the data repository to ERCOT The Commission opened two
rulemakings one to ascertain the appropriate governance performance and funding of
SMT and a second to determine the appropriate access for third parties ensuring that
customers have the freedom to grant and give third parties access to their data if made
knowingly while also securing customer privacy
Sharyland Utilities
In early 2015 customers of Sharyland Utilities the smallest investor-owned
transmission and distribution utility in ERCOT began to file with the Commission a
significant number of complaints regarding high electricity bills In response the
Commission opened Project No 44592 Relating to a Project Regarding Sharyland
Utilities to provide for a more formal process for Commission review of the large number
of complaints As part of this project Commission staff prepared a report to evaluate the
electricity rates and electric bills in the operating area of Sharyland Utilities that was
previously part of Cap Rock Energy
Staffrsquos report found that a number of factors contributed to the comparatively high
bills for many of Sharyland-Cap Rockrsquos customers First Sharylandrsquos small size and its low customer density result in high TDU rates for all customers relative to other TDUs In
particular Staffrsquos report found that Sharyland-Cap Rockrsquos rates for distribution service are
up to three times higher than those of other TDUs in Texas In addition to Sharyland-Cap
Rockrsquos high costs for distribution service higher wholesale transmission costs also
contributed to the rate increases charged to Sharyland-Cap Rockrsquos customers These transmission costs are the result of increased transmission investment in recent years
throughout Texas that has increased transmission costs for all distribution providers
18 The participating Texas TDUs are AEP Texas Central Company and AEP Texas North Company (jointly
ldquoAEPrdquo) CenterPoint Energy Houston Electric LLC (ldquoCenterPointrdquo) Oncor Electric Delivery Company LLC (ldquoOncorrdquo) and Texas-New Mexico Power Company (TNMP) collectively referred to as the ldquoJoint TDUsrdquo Operation of an AMS web portal was addressed in the orders approving particular utilitiesrsquo deployment of AMS and approving surcharges for AMS cost recovery While Sharyland Utilities filed comments in the proceeding it did not
participate as it had not fully completed its AMS deployment at the time
22 | P a g e
2017 SCOPE OF COMPETITION IN ELECTRIC MARKETS IN TEXAS REPORT
including Sharyland Utilities Second the comparatively colder winter of 2014 ndash 2015
which was the time period generally consistent with the timeframe in which the
Commission began receiving complaints appeared to result in higher electricity usage than
normal This combination of high TDU rates and the higher electricity usage led to higher
bills for customers
Staffrsquos report also noted that in Sharyland-Cap Rockrsquos last rate case in 2014 the
approved rates reflected movement towards more cost-based rates for all customers
including some customers that previously had been heavily subsidized by other customers
Additionally in the process of standardizing Sharyland-Cap Rockrsquos customer classification
with the classifications of the other TDUs in Texas some customers may have experienced
a move from one class that previously was paying below-cost rates to another class that
was now paying above-cost rates For some of these customers the combined effects of
the movement towards cost-based rates and the change to a different class may have
contributed to a significant change in the customersrsquo rates Regardless of any cost-shifting
between customer classes Sharylandrsquos rates remain two to three times higher than those of other TDUs in Texas for all customers in all classes
On December 4 2015 the Commission signed an order directing Sharyland to file
an application for a comprehensive rate review by April 30 2016 Sharyland filed its rate
application on April 29 2016 in Docket No 45414 Review of the Rates of Sharyland
Utilities LP On October 10 2016 the Commission ordered Sharyland to file an amended
application as soon as practicable but no later than January 1 2017 to reflect the unique
aspects of the companyrsquos organizational structure as a real estate investment trust (REIT) At the time of publication Sharyland is expected to file its amended application in
December 2016
PowerToChoose Website
As part of its ongoing evaluation of the competitive market the Commission
opened Project No 45730 to evaluate the functionality and usability of its PowerToChoose
website which allows customers to select a REP and an electric plan based on their zip
code In the process the Commission received significant feedback from customers stating
that the Commissionrsquos PowerToChoose website was an important tool that plays a
fundamental role in their shopping process In response to the feedback received from
industry representatives and consumers Commission staff changed how the website sorts
and filters retail electric plans adding a filter to allow customers to unselect plans that
contain minimum usage fees or credits This filter is now a default setting and plans with
minimum usage fees and credits are not shown unless the customer actively selects to
search for such plans In addition Commission staff made other changes to increase the
clarity of the REP complaint rating The Commission continues to evaluate other changes
to improve the customer experience of the PowerToChoose website and provide
transparency for retail electric plans
23 | P a g e
2017 SCOPE OF COMPETITION IN ELECTRIC MARKETS IN TEXAS REPORT
Report on Alternative Ratemaking Mechanisms
In 2015 the Legislature enacted SB 774 which requires the Commission or its
consultant to conduct a study and make a report to the Legislature analyzing the alternative
ratemaking mechanisms adopted by other states In addition SB 774 extended the
authorization for the Periodic Rate Adjustment (PRA) mechanism from 2017 to 2019
which the Legislature had authorized in 2011 (SB 1693) as a version of an alternative
ratemaking mechanism that provides to utilities a means for expedited recovery of
distribution infrastructure costs Pursuant to SB 774 the Commission retained a consultant
to produce the report and the consultantrsquos recommendations included streamlining the ratemaking process to reduce procedural costs providing for a periodic review of the
prudency of the costs and using certain types of alternative ratemaking mechanisms that
decouple the recovery of costs from variations in load The Commission held a public
hearing to receive comments on the report from stakeholders and after consideration of
those comments has provided to the Legislature the consultantrsquos report together with its
own discussion of the report
Request for Purchase of Oncor Electric Delivery Company
In March 2016 the Commission approved with conditions an application by an
investor group led by Hunt Consolidated Inc the owners of Sharyland Utilities to acquire
control of Oncor Electric Delivery Company (Oncor) the largest transmission and
distribution utility in Texas from Oncorrsquos parent company Energy Future Holdings which
is in bankruptcy The Commission approved the request subject to certain conditions
including stipulations regarding the organization of the new entities and treatment of tax
benefits The investor-led group subsequently declined to pursue the transaction that was
approved by the Commission
In September 2016 NextEra Energy which owns Florida Power amp Light received
approval from the United States Bankruptcy Court in Delaware for its plan to purchase
Oncor In October 2016 NextEra Energy filed an application with the Commission in
Docket No 46238 for approval of the proposed transaction The Commission will evaluate
the application to determine if the transaction is in the public interest
Integration of Lubbock Power and Light
In March 2016 the Commission opened Project No 45633 to study and identify
the issues related to the request of Lubbock Power and Light the statersquos third-largest
municipally owned utility to be integrated into ERCOT The Commission is currently
working with stakeholders ERCOT and SPP to determine the cost and benefits of any
potential switch by Lubbock Power and Light into ERCOT and whether such a switch is
in the public interest
24 | P a g e
2017 SCOPE OF COMPETITION IN ELECTRIC MARKETS IN TEXAS REPORT
Desalination Project ERCOT Studies
In 2015 the Legislature passed HB 4097 which directed the Commission and
ERCOT to study whether existing transmission and distribution planning processes are
sufficient to provide adequate infrastructure for seawater desalination projects and to study
the potential for desalination projects to participate in demand response opportunities in
the ERCOT market Pursuant to that direction ERCOT staff have prepared a report on the
feasibility of interconnection of large desalination projects and on opportunities for such
projects to participate in ERCOTrsquos demand response programs which is attached to this Report in Appendix B
Oversight and Enforcement Actions
The Commissionrsquos enforcement of statutes rules and orders applicable to entities
under its jurisdiction serves to protect consumers the electric markets the reliability of the
electric grid and to promote fair competition The Commissionrsquos enforcement efforts in the electric industry focus on violations of PURA the Commissionrsquos rules and ERCOT
protocols
During the period from January 2015 through August 31 2016 the Commission
assessed $3258500 in penalties against electric market participants Table 8 provides a
summary of electric industry Notices of Violation since January 2015 During 2015 and
2016 Commission staff opened 212 investigations for the electric industry and closed 177
investigations
Table 8 Notices of Violations
Violation Type Total Penalty Amount
Retail Market Violations $539000
Service Quality Violations $451500
Wholesale Market Violations $2268000
TOTAL $3258500
In addition to the imposition of administrative penalties the Commission uses other
enforcement mechanisms in exercising its enforcement duties including revoking a
companyrsquos certificate to operate In addition some companies may be required to relinquish a certificate as part of a settlement after enforcement action has proceeded
Table 9 provides a breakdown of the number of certificates revoked or relinquished In
2016 the Commission revoked the certificate of the REP TruSmart Energy
Table 9 Certificates Revoked or Relinquished
Type Number
Certificates Revoked 1
Certificates Relinquished 0
25 | P a g e
2017 SCOPE OF COMPETITION IN ELECTRIC MARKETS IN TEXAS REPORT
The Oversight amp Enforcement division also issues warning letters to companies in
the electric market when it determines that a violation occurred but given the
circumstances surrounding the violation and other mitigating concerns no administrative
penalty is warranted During 2015 and 2016 the Oversight amp Enforcement division issued
50 warning letters Finally the Commission generally seeks to reimburse money directly
to customers when appropriate In 2015 and 2016 the Commission ordered the
reimbursement of $8543596 to Texas electric customers
Table 10 Warning Letters
Warning Letter Type Number
Retail Market Warning Letter 8
Service Quality Warning Letter 1
Wholesale Market Warning Letter 41
TOTAL 50
In addition to its enforcement activities the Commission also enters into voluntary
mitigation plans with generators that request one through a contested case proceeding
pursuant to PURA sect15023(f) and 16 TAC sect25504(e) The Commission entered into one
voluntary mitigation plan during 2015 and 2016 in Docket No 44635
Low-Income Discount System Benefit Fund
The System Benefit Fund (SBF) was originally established in 1999 to fund
discounts to low-income customers customer education activities energy-efficiency and
weatherization and electric market oversight through a nonbypassable surcharge on retail
electric bills HB 1101 of the 84th Legislature provided that the SBF be sunset on
September 1 2017 by which time the SBF is intended to be exhausted In the 2016 Fiscal
Year (FY) $325521250 was appropriated in the SBF to provide a 25ndash31 percent discount
to low-income customers over a 12-month period
To assist the drawdown of the remaining balance HB 1101 authorized the
Commission to use any unexpended SBF balance in FY 2017 to assist low-income
customers The Commission estimates that the remaining SBF balance will be
approximately $17 million by August 31 2017 The Commission has determined that this
amount is insufficient to fund the rate reduction program however the Commission will
spend approximately $100000 to continue automatic enrollment in the program to provide
REPs a list of customers eligible to receive late fee waiver and deposit installment benefits
These two ancillary benefits of the rate reduction program will continue for the duration of
FY 2017
26 | P a g e
2017 SCOPE OF COMPETITION IN ELECTRIC MARKETS IN TEXAS REPORT
Homeland Security
The Commission assesses the efforts of ERCOT and utilities to defend against
mitigate and respond to the variety of risks that the modern electricity system faces The
Commission also meets with ERCOT utilities and governmental entities on an ongoing
basis to discuss preparation for everything from hurricanes and other severe weather to
cyber-threats and threats of physical damage to the grid from accidents or intentional
malfeasance In addition the Commission monitors industry and federal programs that
address homeland security issues
The Commission serves as an information liaison between state government and
electric utilities during emergencies The Commissionrsquos main roles include
Conveying outage and service restoration information from electric utilities to
state government
Conveying service restoration priorities (hospitals water treatment facilities
etc) from state government to electric utilities and
Facilitating the clearance of downed power lines in disaster re-entry areas and
facilitating entry of electric utilities into disaster areas
The Commissionrsquos Emergency Management Response Team (EMRT) provided staff at the
State Operation Center for the May 2015 and April 2016 flooding events in Texas as well
as additional staffing for severe winter weather
Demand Response
ERCOT staff have begun to report annually on the participation of customers in
REP-sponsored demand response programs These programs which have been facilitated
by the deployment of smart meters throughout the competitive areas within ERCOT and
by many municipal and cooperative electric utilities take the form of rebates for reduction
in usage during peak period time-of-use pricing real-time volumetric price compensation
for load reduction and direct control of customer load among other plans
These programs have seen dramatic increases in participation since ERCOT began
to gather this information in 2013 From 2013 to 2014 the number of residential customers
participating in these programs increased from 151793 to 721273 and the number of
commercial and industrial customers participating rose from 30275 to 50205 The
Commission continues to monitor ERCOTrsquos stakeholder process for efforts relating to the integration of demand response
27 | P a g e
2017 SCOPE OF COMPETITION IN ELECTRIC MARKETS IN TEXAS REPORT
IV LEGISLATIVE RECOMMENDATIONS
A Determination of Low-Income Customer Eligibility
In 2015 HB 1101 required that all remaining funds in the System Benefit Fund
(SBF) be expended that the fee that funded the program as a nonbypassable surcharge on
electric bills be set at zero and that the SBF be sunset on September 1 2017 Per the
provisions of HB 1101 the SBF fee was set at zero in September 2016 concluding the
funding for the program The sunset of the SBF program also concluded the relationship
between the Texas Health and Human Services Commission (HHSC) and the Commission
in which the HHSC provided to the Commission eligible electric customers for the SBF
low-income discount Because of the termination of the relationship with HHSC with the
termination of the SBF the Commission will no longer be able to determine easily an
electric customerrsquos eligibility for other low-income programs such as late penalty waivers
and the option of paying an electric deposit over multiple months
The Legislature may wish to consider easing low-income customers access to these
low-income programs by facilitating the process used to determine eligibility The
Commission offers four possible approaches in which the Legislature could continue these
low-income programs
(1) Authorize HSSC to provide identification of eligible low-income customers to the
Commission
(2) Allow retail electric providers (REPs) to provide such low-income programs using
the Low Income Discount Administratorrsquos (LIDA) Telecommunications Lifeline
Service Program list to identify low-income customers
(3) Require REPs to offer such low-income programs with customers self-enrolling
and REPs verifying income eligibility or
(4) Allow REPs to voluntarily provide such low-income programs at their own
discretion
B Outside Counsel for Proceedings before Regional Transmission
Organizations
Regional Transmission Organizations (RTO) manage the power grid across wide
regions of the United States Most of Texas is inside the ERCOT region however there
are significant portions of East Texas and the Panhandle that are in the Midcontinent
Independent System Operator (MISO) and the Southwest Power Pool (SPP) Issues arise
in these other RTOs that have significant impact on Texas ratepayers such as how
transmission infrastructure costs will be shared These tend to be very lengthy and
complicated proceedings that require specialized legal and consulting services
28 | P a g e
2017 SCOPE OF COMPETITION IN ELECTRIC MARKETS IN TEXAS REPORT
PURA sect 394525 currently authorizes the Commission to use outside consultants
auditors engineers or attorneys to represent the Commission in proceedings before the
Federal Energy Regulatory Commission This provision has been an important tool for the
Commission to respond to complex matters in the federal arena to enable it to protect the
public interest in Texas The PUC recommends that the Legislature expand the language
in this statute to include the ability to hire outside assistance for proceedings before other
RTOs to provide those same protections to Texas ratepayers in those areas
C Repeal of Natural Gas and Renewable Energy Mandates
1 Natural Gas
PURA sect 399044 establishes natural gas as ldquothe preferential fuelrdquo in Texas for electricity generation and requires the Commission to adopt rules to establish a system of
natural gas energy trading credits The majority of all new non-renewable electricity
generation constructed since 2000 for Texas has used natural gas as a primary fuel and this
trend is expected to continue in the foreseeable future The thresholds used to trigger the
natural gas energy trading credit system in PURA sect 399044 have not been reached and
they are not expected to be reached in the foreseeable future
Because natural gas-fueled facilities have been the most commonly built new
generation in Texas for many years and are expected to continue to be there is no need to
establish incentives for natural gas generation The PUC recommends that the Legislature
consider repealing PURA sect 399044 because it is no longer necessary
2 Renewable Energy
PURA sect 39904 establishes goals for renewable energy Subsection (a) requires
the installation of 5880 megawatts of renewable energy by 2015 and Subsection (b)
establishes a renewable energy credits trading program to implement the requirement The
5880 megawatts mandates in Subsection (a) was met in 2008 While the Commission
believes the renewable energy trading credit program is needed for retail electric providers
to validate renewable energy marketing claims the Commission believes the 5880
megawatts mandate in Subsection (a) is no longer necessary
D Advisory Opinions
Many regulatory agencies in Texas have authority to issue informal guidance to the
persons they regulate particularly with respect to outlining whether a particular course of
conduct would in the agencyrsquos view be consistent with the laws and regulations that the agency administers19 The issuance of an advisory opinion can provide regulatory clarity
to a company before making investments or conducting operations the permissibility of
which may be unclear under state law The Legislature may want to consider granting the
19 In addition certain federal agencies such as the Federal Communications Commission
Internal Revenue Service Securities and Exchange Commission and Federal Election
Commission have authority to issue advisory opinions
29 | P a g e
2017 SCOPE OF COMPETITION IN ELECTRIC MARKETS IN TEXAS REPORT
Commission the authority to issue advisory opinions In the electric industry providing
clarification to a company concerning issues such as the purchase of assets or the
acquisition of another company could allow it to avoid expensive regulatory proceedings
without impairing the Commissionrsquos authority The following state agencies have statutory authority to issue advisory opinions
Texas Ethics Commission20
Texas Medical Board21
State Board of Dental Examiners22
Texas Board of Nursing23
Texas Board of Professional Engineers24
Texas Lottery Commission and25
Texas Securities Board26
E Administrative
Gross Receipts Assessment
PURA sect 16001 provides for a gross receipts assessment that is used to defray the
expenses incurred by the Commission to administer PURA An assessment of one sixth of
one percent is collected from public utilities electric cooperatives retail electric providers
and interexchange carriersrsquo gross receipts from consumers The funds from this assessment
are remitted to the general revenue fund but currently they have not been explicitly
dedicated to funding of the Commission In contrast similar assessments on water
utilities insurance companies and other regulated entities have traditionally been used to
explicitly fund the underlying regulatory programs at the respective agencies The
Commission is one of four Article VIII agencies that is not designated as self-funded
The Commission recommends that the Legislature designate the Commission as a
self-funded agency whereby the collected assessments would be explicitly dedicated to the
funding of the agency Implementing this recommendation would require the Public Utility
Commission to be included in the Appropriations Limited to Revenue Collections rider
located in the Special Provisions Relating to All Regulatory Agencies section of the
General Appropriations Act Designation as a self-leveling agency would require the
Commission to set the gross receipts assessment at a rate sufficient to generate revenue in
the amount of the agencyrsquos general revenue appropriation each fiscal year which would require a statutory change to PURA sect16001(b) Based upon the Commissionrsquos baseline budget request authorizing the PUCrsquos self-leveling designation would result in an overall
estimated tax reduction of $456 million per year or 774
20 Government Code sect 571091 21 Occupations Code sect 162107 22 Occupations Code sect 258157 23 Occupations Code sect 301607 24 Occupations Code sect 1001601 25 Occupations Code sect 2001059 26 Tex Rev Civ Stat Ann Arts 581-28-1 amp 581-35 7 Tex Admin Code 1012
30 | P a g e
2017 SCOPE OF COMPETITION IN ELECTRIC MARKETS IN TEXAS REPORT
V APPENDICES
31 | P a g e
2017 SCOPE OF COMPETITION IN ELECTRIC MARKETS IN TEXAS REPORT
Appendix A ndash Acronyms
AEP American Electric Power
AMS Advanced Metering System
CenterPoint CenterPoint Energy Houston Electric LLC
DG Distributed Generation
DRG Distributed Renewable Generation
ERCOT Electric Reliability Council of Texas
ERSC Entergy Regional State
ERS Emergency Response Service
ETI Entergy Texas Inc
IMM ERCOT Independent Market Monitor
kWh Kilowatt-hour
LMP Locational Marginal Pricing
LSP Large Service Provider
MISO Midwest Independent System Operator
MMBtu One million British Thermal Unit (BTU)
MW Megawatt
MWh Megawatt-hour
Nodal Texas Nodal Market Design
ORDC Operating Reserve Demand Curve
PGC Power Generation Company
POLR Provider of Last Resort
PURA Public Utility Regulatory Act
REP Retail Electric Provider
RSC Regional State Committee
RTO Regional Transmission Organization
SCED Security Constrained Economic Dispatch
Sharyland Sharyland Utilities LP
SBF System Benefit Fund
SPP Southwest Power Pool
TDU Transmission and Distribution Utility
TNMP Texas-New Mexico Power Company
32 | P a g e
2017 SCOPE OF COMPETITION IN ELECTRIC MARKETS IN TEXAS REPORT
Appendix B ndash ERCOT Desalination Report
This page intentionally left blank
33 | P a g e
ERCOT Public
Study on the Demand Response Potential for Seawater Desalination Projects
ERCOT November 18 2016
Study on the Demand Response Potential for Seawater Desalination Projects ERCOT Public
Executive Summary
In 2015 the 84th Texas Legislature enacted House Bill (HB) 4097 which included several provisions relating to seawater desalination projects including a requirement that the Public Utility Commission of Texas (PUC) and Electric Reliability Council of Texas (ERCOT) study the potential for seawater desalination projects to participate in existing demand response opportunities in ERCOT There are several demand response products in which demand-side resources (ie consumers of electricity) can participate These programs help to preserve system reliability and provide economic benefits to participating demand-side resources Seawater desalination is an energy-intensive process that removes salt and other minerals from salt water to produce fresh water for municipal consumption industrial use or irrigation Participation in demand response could help mitigate electricity costs for future seawater desalination projects in Texas and provide reliability benefits to the grid
There are two main demand response reliability-based services administered by ERCOT participation by demand-side resources in the Ancillary Services market and the Emergency Response Service (ERS) Within the Ancillary Services market the most common service provided by demand-side resources is Responsive Reserve Service (RRS) which requires resources to respond either instantaneously or within 10 minutes in response to unplanned system emergencies ERS is separate from ERCOTrsquos Ancillary Services market and allows demand-side resources and distributed generation to provide reliability services in the event of an energy emergency Resources can qualify for either the 10-minute or 30-minute response time ERS programs
There are several key considerations that will impact a demand-side resourcersquos ability to participate in different demand response opportunities response time recovery time predictability of electrical demand and flexibility of operations Considering these factors together it appears that seawater desalination plants could be designed to meet the requirements for participation in demand response Because the ability to meet the qualification requirements is dependent on the plant design demand response opportunities should be considered early in a projectrsquos development if participation is desirable
Whether project developers will choose to address these requirements will depend on the economic benefits of participation There may be additional costs to design seawater desalination plants to operate in the manner required in order to participate in demand response These include costs associated with additional plant design specifications need for excess capacity and storage to make up for lost production during demand response deployment operational costs resulting from interruptions to plant processes and potential financial penalties if demand response deployment results in failure to meet contract demands The interplay of the benefits of participation and these costs will determine whether it would be beneficial for a future seawater desalination plant to participate in demand response in ERCOT
To date participation of seawater desalination plants in demand response programs has been limited Because the process of seawater desalination is energy-intensive participation in demand response could help to reduce electricity costs while posing a relatively low risk to plant operations As stakeholders in Texas continue to plan for possible future droughts in the region and identify water management strategies consideration of demand response could play a role in mitigating some costs associated with seawater desalination and allow seawater desalination plants to assist with maintaining electric reliability in the region
copy 2016 ERCOT All rights reserved i
Study on the Demand Response Potential for Seawater Desalination Projects ERCOT Public
Table of Contents
1 Introduction 1
2 Seawater Desalination 2
21 Seawater Desalination Plant Operations 2
22 Seawater Desalination Plant Economics 3
3 Demand Response Opportunities in ERCOT 4
31 ERCOT-Dispatched Demand Response 4
311 Ancillary Services Markets 5
312 Emergency Response Service (ERS) 5
32 Non-ERCOT-Dispatched Demand Response 6
321 Four Coincident Peak (4CP) 6
322 LSE or DR Provider Contracted Price Response 6
323 Self-Directed Price Response 6
4 Demand Response Potential for Seawater Desalination 7
41 Operational Considerations for ERCOT-Dispatched Demand Response 7
42 Economic Considerations for ERCOT-Dispatched Demand Response 8
43 Considerations for Non-ERCOT-Dispatched Demand Response 9
5 Conclusion 11
copy 2016 ERCOT All rights reserved ii
Study on the Demand Response Potential for Seawater Desalination Projects ERCOT Public
1 Introduction
In 2015 the 84th Texas Legislature enacted House Bill (HB) 4097 which included several provisions relating to seawater desalination projects including a requirement that the Public Utility Commission of Texas (PUC) and Electric Reliability Council of Texas (ERCOT) study the potential for seawater desalination projects to participate in existing demand response opportunities in ERCOT ERCOT and the PUC initiated this study to fulfill that requirement and evaluated the operational and economic characteristics of seawater desalination plants in light of ERCOTrsquos primary demand response products1
ERCOT is the independent system operator (ISO) for the ERCOT Interconnection which encompasses approximately 90 of demand for electricity in Texas ERCOT is the independent organization established by the Texas Legislature to be responsible for the reliable planning and operation of the electric grid for the ERCOT Interconnection ERCOT also administers and maintains a forward-looking open market to provide affordable and reliable electricity to consumers in Texas In collaboration with market participants ERCOT has developed demand response products and services for customers that have the ability to reduce or modify electricity use in response to instructions or signals These programs help preserve system reliability and provide economic benefits to participating demand-side resources
The process of seawater desalination removes salt and other minerals from salt water to produce fresh water for consumption industrial processes or irrigation The drought-prone Texas climate coupled with projections for increasing water demand in the state has created interest in seawater desalination as a future water source The 2017 Texas State Water Plan includes seawater desalination as a future water management strategy for water users in the state However the seawater desalination process is energy intensive and electricity consumption can be a significant cost driver for these projects To the extent that these plants could participate in demand response it would help to defray these costs Thus there is a potential nexus between seawater desalination projects built in Texas to mitigate drought but which have large electricity requirements and ERCOT demand response opportunities which could help to reduce their electricity costs and provide reliability benefits
This study evaluates the demand response potential of seawater desalination plants based on their operational characteristics and economic drivers The report is organized as follows
Section 2 provides background on typical seawater desalination plant operations and economics
Section 3 describes the current demand response opportunities in ERCOT
Section 4 evaluates the characteristics of seawater desalination plants to determine their potential to participate in demand response opportunities in ERCOT and
Section 5 provides a summary of the conclusions of this study
1 In the course of developing this report ERCOT consulted with several desalination experts with experience with existing or planned seawater desalination plants in the US The technical experts consulted included Jorge Arroyo (Water Management Consultant) Andrew Chastain-Howley (Black amp Veatch) Jonathan Loveland (Black amp Veatch) Ron Parker (Black amp Veatch) John Wolfhope (Freese and Nichols) and Srinivas Veerapaneni (Black amp Veatch)
copy 2016 ERCOT All rights reserved 1
Study on the Demand Response Potential for Seawater Desalination Projects ERCOT Public
2 Seawater Desalination
There are two primary methods for seawater desalination distillation (also referred to as ldquothermalrdquo) and reverse osmosis Distillation uses heat to remove salts and minerals from seawater by boiling water at high pressures In contrast reverse osmosis technology forces saline water through a membrane to separate water from the salts and minerals While both distillation and reverse osmosis are energy intensive distillation requires thermal energy to heat the water and overall has a higher energy requirement whereas reverse osmosis requires primarily electrical energy and overall is less energy intensive ndash though still with significant electricity requirements
Globally most thermal desalination plants are located in the Middle East due to low energy prices in the region Plants located elsewhere including in the US typically use reverse osmosis technology2 There are two large existing seawater desalination plants in the US one in Carlsbad California providing water to the San Diego area and one in Gibsonton Florida providing water to the Tampa Bay area Both plants use reverse osmosis technology In addition there are several desalination projects currently in the planning stages or under development in Texas in the Corpus Christi area that would use reverse osmosis technology For that reason this report focuses on reverse osmosis technology in the evaluation of demand response potential of seawater desalination plants
While there are currently no existing seawater desalination plants in Texas there are several municipal and industrial brackish water desalination plants in the state According to the Texas Water Development Board (TWDB) there are 46 municipal brackish water desalination plants with capacities greater than 0025 million gallons per day (MGD) in Texas representing a total of 123 MGD of capacity3 The desalination of brackish water is typically less expensive compared to seawater due to the lower relative salinity of brackish water This study focuses exclusively on seawater desalination consistent with the requirements of HB 4097 but it should be noted that conclusions may also apply to brackish water desalination though at a different cost and scale
This section provides high-level information on the operations (Section 21) and economics (Section 22) of seawater desalination plants to inform the discussion of their demand response potential in Section 4
21 Seawater Desalination Plant Operations Seawater desalination plants typically range in capacity from less than 5 MGD up to 165 MGD For example the Carlsbad seawater desalination plant has a capacity of approximately 50 MGD and the plant in Tampa Bay has a capacity of approximately 25 MGD The associated electricity consumption ranges between 10 and 15 kWh1000 gallons produced depending on the salinity of the water being processed456 More saline water (eg seawater) requires larger amounts of electricity for desalination Thus a seawater desalination plant would have larger electricity consumption requirements compared to a similarly sized brackish water desalination plant
2 American Water ldquoInnovation Solutions within the Water Industry Desalinationrdquo Available at httpwwwamwatercomfilesInnovationsSolutionsWithinTheWaterIndustryDesalinationpdf 3 Texas Water Development Board ldquoDesalination Factsrdquo Available at httpswwwtwdbtexasgovinnovativewaterdesalfactsasp 4 American Membrane Technology Association April 2016 ldquoMembrane Desalination Power Usage Put in Perspectiverdquo Available at httpwwwamtaorgcomwp-contentuploads7_MembraneDesalinationPowerUsagePutInPerspectivepdf 5 Water Reuse Association November 2011 ldquoSeawater Desalination Power Consumptionrdquo Available at httpswatereuseorgwpshycontentuploads201510Power_consumption_white_paperpdf 6 Ghaffour N TM Missimer and G Amy January 2013 ldquoTechnical review and evaluation of the economics of water desalination Current and future challenges for better water supply sustainabilityrdquo Desalination 309 pp197-207 Available at httpswwwresearchgatenetpublication256693140_Technical_review_and_evaluation_of_the_economics_of_water_desalination_ Current_and_future_challenges_for_better_water_supply_sustainability
copy 2016 ERCOT All rights reserved 2
Study on the Demand Response Potential for Seawater Desalination Projects ERCOT Public
While the two existing seawater desalination plants in the US were co-located with power plants to ease compliance with regulations on water intake and discharge structures and reduce costs many other reverse osmosis desalination plants receive their electricity from the grid However plants may have on-site backup generation in case of a power outage This will vary depending on the size and design of the plant and other factors For example the Carlsbad plant in California does have diesel backup generation to power control systems and flushing systems in the case of a power outage The plant in Tampa Bay was not built with backup power due to potential storm surge risks from hurricanes and other storms The plant does use uninterruptible power supply (UPS) backup to power control systems during power outages
Reverse osmosis plants are typically designed with several ldquotrainsrdquo which consists of a high-pressure pump turbine and reverse osmosis membrane Desalination plants are turned on or off one train at a time in a highly controlled process The process of ramping up or down an individual train under normal operations typically takes one to two hours While plants can be designed to handle immediate shutdowns (ie in a power outage) re-starting a system after an interruption would take this amount of time In addition the saline water must be pretreated (ie filtered) before going through the reverse osmosis train and this can sometimes pose constraints on the flexibility of operations
Demand for water is the key factor driving the level of production at seawater desalination plants Typically the plant will have a contract or contracts with municipal or other water users to deliver desalinated water and is operated to meet that demand Alternatively if the plant is municipally owned it would similarly be operated to meet the level of water demand in conjunction with other available water sources If water demands are close to a plantrsquos full capacity the operatorrsquos flexibility to adjust its electricity consumption as part of demand response may be limited However this does mean that plant operations are fairly predictable on a day-to-day basis which is necessary for participation in demand response
The amount of flexibility in plant operations will also be impacted by the amount of water storage available For example if a plant has sufficient water storage on-site or storage within the customerrsquos distribution system it could provide flexibility for the plant to reduce its operations during peak hours when electricity prices are likely to be highest It would also mitigate the impacts of interruptions to production from demand response deployments
22 Seawater Desalination Plant Economics Seawater desalination is typically more expensive than other sources of water and a major driver of the overall cost is energy costs In 2016 the Carlsbad plant charged rates at between $2131 and $2367 per acre-foot78 This charge is intended to cover both the fixed costs of the plant and the variable costs to produce a unit volume of water Typically half to two thirds of the cost of providing desalinated seawater are accounted for by capital cost recovery with the remainder accounted for by operations and maintenance costs including electricity costs Electricity costs can account for 20shy25 of the total costs of seawater desalination with reverse osmosis technology9
Factors affecting the capital cost of a seawater desalination plant include plant size type of desalination process and pre-post-treatment technologies plant infrastructure (eg piping water storage backup power) and compliance with applicable regulations (eg regulations on intake structures brine byproduct disposal) A significant driver of operating and maintenance costs is membrane replacement Reverse osmosis membranes need to be replaced every few years and
7 Source San Diego County Water Authority ldquoSeawater Desalinationrdquo Available at httpwwwsdcwaorgseawater-desalination 8 Note that 1 acre-foot is approximately 325851 gallons 9 Based on technical input from Black amp Veatch
copy 2016 ERCOT All rights reserved 3
Study on the Demand Response Potential for Seawater Desalination Projects ERCOT Public
the rate at which they are replaced will depend on the salinity of the feedwater and how the plant is operated Treatment and disposal of the salty brine byproduct from desalination may also incur operating costs
Electricity costs will vary depending on a range of factors including the size of the plant type of desalination technology source of electricity and quality of the feedwater As previously noted more saline water requires higher amounts of electricity in desalination and thus the amount of electricity consumption is a key difference between brackish water and seawater desalination As a result electricity costs comprise a significant share of the costs of seawater desalination These costs could potentially be defrayed in part by participation in demand response initiatives
3 Demand Response Opportunities in ERCOT
Broadly speaking demand response can be broken down into two major categories dispatchable or non-dispatchable For purposes of this report we will define dispatchable as those demand response events that are initiated by ERCOT and non-dispatchable as an event not specifically initiated by ERCOT These non-dispatchable events may include decisions made by the end-use customer to alter its consumption pattern or may include contractual obligations with another entity such as the end-use customerrsquos retail electric provider (ldquoREPrdquo) to alter consumption patterns
ERCOTrsquos wholesale market is open to several types of dispatchable demand response which are deployed to maintain system reliability Demand-side resources providing Emergency Response Service (ERS) may offer based on either a 10 or 30-minute response time commonly referred to as the ldquoramp periodrdquo Alternatively demand-side resources may register and qualify as a Load Resource that can provide Reserves in the Ancillary Services market The most common service provided by demand-side resources is Responsive Reserve Service which requires an under-frequency relay that can instantaneously interrupt the load during certain system reliability events Some demand-side resources can also participate in other Ancillary Services as Controllable Load Resources that require sophisticated control systems that allow them to be deployed in a more incremental proportional manner
Non-dispatchable demand response in ERCOT can include a response to avoid transmission costs where rates are based on Four Coincident Peak Pricing (4CP) response to wholesale energy prices initiated by the customer or by a REP or other load-serving entity (ldquoLSErdquo) or utility-managed Load Management programs (LM)
The sections that follow provide a description of both ERCOT-dispatched (Section 31) and nonshyERCOT-dispatched (Section 32) demand response For a more detailed description of opportunities for demand-side resources to participate in demand response in ERCOT see ERCOTrsquos guide Load Participation in the ERCOT Nodal Market10
31 ERCOT-Dispatched Demand Response There are two main demand response reliability-based services administered by ERCOT participation by demand-side resources in the Ancillary Services market and participation in ERS These services are dispatched by ERCOT during system emergencies
10 Available at httpwwwercotcomcontentservicesprogramsloadLoad20Participation20in20the20ERCOT20Nodal20Market_302d oc
copy 2016 ERCOT All rights reserved 4
Study on the Demand Response Potential for Seawater Desalination Projects ERCOT Public
Demand-side resources with demand response capability that can meet a set of performance requirements can be qualified to provide Ancillary Services as Load Resources in the Ancillary Services Market The value of having a Load Resource available to reduce load is equal to the value of having a generator available to increase its generation at a generating plant The providers of operating reserves selected to provide Ancillary Services are eligible for capacity payments regardless of whether the Resource is actually deployed (or curtailed in the case of the Load Resource)
ERCOT holds auctions on a daily basis for each of the following Ancillary Services Regulation Up Regulation Down Responsive Reserve and Non-Spinning Reserve11 Table 1 describes the various Load Resource types and their qualification requirements and eligible services
Table 1 Load Resource Types and Ancillary Services
Service Load Resource Type a Qualification Responsive Reserves (le50 of total Reserve requirement)
Non Controllable Under-Frequency Relay and 10-minute ramp to manual dispatch instruction
Responsive Reserves
Controllable Primary Frequency Response and follow 5-minute dispatch instructions
Regulation-Up Regulation-Down
Controllable Primary Frequency Response and respond to Regulation deployments
Non-Spin Reserves Controllable Follow 5-minute dispatch instructions a A Controllable Load Resource is a Load Resource capable of controllably reducing or increasing consumption under dispatch control by ERCOT
Demand-side resources that agree to reduce load when directed by ERCOT and that meet other metering and operational requirements as specified in the ERCOT Protocols may participate in Ancillary Services market auctions As noted in Table 1 the type of Ancillary Service that a Load Resource may provide will depend upon the demand-side resourcersquos response time and metering system as well as other requirements described in the Protocols In the Responsive Reserve and Non-Spin Reserve markets the Load Resource will receive capacity payments regardless of whether or not the load was actually deployed but the load must be available for deployment at any time while providing the service
ERCOT procures ERS to maintain grid reliability during emergency conditions and reduce the likelihood of the need for rotating outages ERS participants may offer to provide demand response with either a 10-minute ramp period requirement (similar to Load Resources providing Responsive Reserve Service) or a 30-minute ramp period requirement ERS Resources do not have the same telemetry and under-frequency relay requirements as Load Resources
11 Regulation Up and Regulation Down service respond to signals from ERCOT every 4 seconds to respond to changes in system frequency full response has to be provided within 5 minutes Responsive reserves must provide their committed capacity either instantaneously in an under-frequency event (eg due to a generator outage) or in energy scarcity conditions within ten minutes following an instruction from ERCOT Non-spinning reserves must provide their committed capacity within 30 minutes based on economic dispatch instructions Non-spinning reserve is used as replacement reserve to replenish other ancillary services and during energy scarcity
copy 2016 ERCOT All rights reserved 5
Study on the Demand Response Potential for Seawater Desalination Projects ERCOT Public
ERS is procured through a request for proposal (RFP) process three times per year for four-month contract terms each of which is further split into smaller time periods based on business cycles and other factors Demand-side resources may choose to submit offers in all time periods or only in those that best fit their unique circumstances and may vary both the price and demand response capacity offers by time period
Payments for ERS are performed up to 80 days after each four month contract term has ended and are subject to downward revision based upon delivered demand response capacity and the demand-side resourcersquos availability during the contract term
32 Non-ERCOT-Dispatched Demand Response The options listed below are not dispatched by ERCOT but they either are controlled directly by a customer or are dispatchable by another entity such as a demand response provider (ldquoDR Providerrdquo) REP or a transmission and distribution utility
Many industrial customers are subject to transmission charges based upon a Four Coincident Peak (4CP) demand The 4CP demand is determined by averaging the consumerrsquos actual demand during the 15-minute settlement interval with the highest ERCOT demand during each of the four summer months (June through September) This measured 4CP demand serves as the basis for the customerrsquos transmission tariff charges for the following year By correctly predicting the ERCOT system peaks during the summer and curtailing load during those intervals a consumer can help reduce the stress imposed on the electric system during peak periods of consumption and reduce its transmission charges for the following calendar year
In the competitive areas of ERCOT consumers can contract with their REP or a DR Provider to have their load respond to the REPrsquos or DR Providerrsquos instructions The contract will usually outline the parameters of this response ndash at what times and frequency demand response events can be called ramp periods sustained response periods compensation etc Because this response is a contractual matter between the REP or DR Provider and the consumer a great deal of variety can be present in these arrangements For example a consumerrsquos response may be voluntary or required compensation could come in the form of reduced energy prices or rebate payments for each curtailment event consumers might be notified up to a day in advance or could have no notification at all (for automated curtailment)
In areas of ERCOT not open to competition interruptible tariffs may be available These tariffs will usually offer a reduced energy price for defined curtailment obligations
REPs may offer dynamic pricing options or consumers within a municipality or cooperative may have their energy prices determined by a published tariff which also may be structured based upon Time-of-Use (TOU) or have a Critical Peak Pricing (CPP) or Peak Time Rebate (PTR) component Self-directed price response refers to consumers making an independent decision to respond to energy prices contained in a governing tariff or in either the ERCOT Day Ahead or Real Time energy markets
TOU offerings will typically have higher energy prices during normal peak periods ndash for example a TOU tariff may charge one price during Monday through Friday from 2 pm through 8 pm and another price during all other times Customers may choose to reduce consumption during these high priced periods Load reduction can be accomplished by load shifting (loads can be shifted by
copy 2016 ERCOT All rights reserved 6
Study on the Demand Response Potential for Seawater Desalination Projects ERCOT Public
rescheduling certain processes or by utilizing thermal storage) ending certain processes that are no longer economic or through energy efficiency measures
Offerings that incorporate CPP usually have prescribed high prices only during certain defined periods ndash for example when load or prices are expected to reach a certain level Response to CPP may be similar to those employed under TOU tariffs especially if CPP is reached frequently More often CPP is infrequent and as such short-term load curtailment may be the more appropriate response to meet economic objectives
4 Demand Response Potential for Seawater Desalination
This section evaluates whether the operational characteristics and economics of seawater desalination plants would enable them to participate in one or more of the various demand response opportunities in the ERCOT Region To date participation of seawater desalination plants in demand response programs has been limited Neither the plant in Carlsbad nor the plant in Tampa Bay participate in demand response programs in California or Florida respectively However as will be described below it appears that these plants can be designed and operated to meet the requirements for participation in demand response and receive economic benefit from participation in these programs
Section 41 describes the operational parameters that must be met for a demand-side resource to provide ERCOT-dispatched demand response and evaluates the ability of seawater desalination plants to meet these criteria Section 42 discusses the tradeoffs between payments for participation in ERCOT-dispatched demand response and potential additional costs posed to seawater desalination plants Finally Section 43 presents other opportunities for seawater desalination plants to reduce their electricity costs outside of ERCOTrsquos reliability-based services that are open to demand response assets
41 Operational Considerations for ERCOT-Dispatched Demand Response There are several key operational parameters that impact a demand-side resourcersquos ability to participate in different demand response services response time recovery time predictability of electrical demand and flexibility of operations This section discusses each of these considerations as they apply to seawater desalination plants
As discussed in Section 31 one of the differentiating factors between ERCOTrsquos demand response products is the amount of time within which a demand-side resource must respond to a deployment instruction to reduce electricity consumption during an event Participation in RRS requires an automatic response within either half a second (ie instantaneous) based on grid frequency or within 10 minutes via a manual instruction ERS requires a response time of either 10 or 30 minutes As noted in Section 21 the typical time to take a reverse osmosis train on- or off-line is 1-2 hours under normal controlled operations To comply with the response time requirements of RRS or ERS a seawater desalination plant would need to be able to reduce its electricity consumption far more quickly than in normal operations This is an element of plant design that would need to be accounted for in the specifications of the project Considerations include the potential need for on-site backup generation including uninterruptible power supply potential impacts to plant infrastructure (eg piping) reverse osmosis membranes and pretreatment systems
The two large US desalination plants provide illustrative counterpoints in this respect The Carlsbad plant was designed to withstand instantaneous power interruptions and has on-site backup generation including uninterruptible power supply to provide the ability to power control systems and flush the membranes in the event of a power loss In contrast the Tampa Bay plant was not
copy 2016 ERCOT All rights reserved 7
Study on the Demand Response Potential for Seawater Desalination Projects ERCOT Public
designed with on-site backup generation and a loss of power would result in a plant shutdown and may require several days to bring the plant back on-line Thus it appears that it is technically possible for a seawater desalination plant to meet the response time requirements for participation in demand response so long as this factor is considered in the design of the facility
The time it takes a desalination train to return to operations after an event is also a consideration Demand-side resources participating in RRS must be able to come back on-line within three hours and those participating in ERS must return within 10 hours Again it appears that it is technically feasible for desalination plants to meet this requirement so long as this requirement is considered in the plant design
An additional consideration is the predictability of a demand-side resourcersquos electricity consumption Participation in the responsive reserves ancillary service market requires bidding in the day-ahead market and thus a demand-side resource must know with great accuracy (within 95) its electrical demand at least a day ahead of time For ERS auctions are held three times a year for four-month contract periods Thus to participate in ERS a resource must know its forecasted electrical demand several months in advance Because seawater desalination plant operations are driven by contracted demand for water it is likely that a plant operator would have a good idea of the plantrsquos electrical demand days or even weeksmonths in advance especially for summer months when demand is likely to be relatively steady An important consideration however is the salinity of the water which drives the electrical requirements and which can be impacted by recent weather events Similarly reductions in demand for water during non-summer months or wet summer days where demand may be reduced could also impact a plantrsquos ability to predict its electricity demand
Finally a seawater desalination plant must have sufficient flexibility in its day-to-day operations so that it can afford to lose several hours of production when deployed for demand response It should be noted that demand-side resources participating in RRS and ERS are called infrequently demand-side resources providing responsive reserves were deployed one time in 2015 and ERS was not deployed that year However this is an important factor to consider if a plant is operating at close to full capacity and would incur financial penalties if it fails to meet its contract obligations due to a demand response event Including additional storage and building a plant with extra capacity could help to mitigate this risk It should also be noted that a plant operator does not need to commit the full plant capacity to these services but rather can specify an amount of MW that will be committed Thus a plant operator could mitigate issues both with predictability and flexibility of plant operations by committing only a portion of its predicted electrical demand to participate in demand response
Considering these factors together it appears that seawater desalination plants could be designed to meet the operational requirements for participation in ERCOTrsquos demand response services (both RRS and ERS) Because the ability to meet the requirements is dependent on the plant design demand response would need to be considered early in a projectrsquos development if participation is desirable Whether project developers will choose to address these requirements will depend on the economic benefits of participation in demand response which will be discussed in the next section
42 Economic Considerations for ERCOT-Dispatched Demand Response This section describes the economic benefits to demand-side resources from participation in ERCOT-dispatched demand response programs The average price paid for a demand-side resource participating in RRS in 2015 was $1087 per MW per hour and for ERS was $645 per MW per hour for the contract periods during the 2015 program year These payments could provide a significant financial benefit to seawater desalination plants To give a simplified example for a plant with an electrical demand of 10 MW operating at a 100 annual load factor (10 MW times 24 hours times 365 days) the annual benefit would be on the order of $500000 for ERS or $1 million for RRS
copy 2016 ERCOT All rights reserved 8
Study on the Demand Response Potential for Seawater Desalination Projects ERCOT Public
In 2015 demand-side resources providing responsive reserves were deployed one time for a duration of 10 minutes and ERS was not deployed12 The most ERS was ever deployed in a single year was two times in 2011 Thus participation in either program could result in a substantial payment to a seawater desalination plant with a relatively low risk of deployment and associated disruption of plant operations although it is important to note that participation in either ERCOT service subjects demand response resources to annual unannounced testing Other than testing the frequency of deployment will depend on grid conditions and is a risk that should be considered
The financial benefits of participation must be weighed against the costs of designing facilities with the capabilities to operate in this manner These include
bull The costs to design the plant to reduce electrical demand within the required timeframes for demand response and to withstand an instantaneous interruption if not already part of the plant design For example a plant may need to be designed to have backup power generation on-site In addition there could also be costs to restart the system after an interruption
bull The costs to build a plant with excess capacity andor storage to make up for lost production hours when demand response is deployed This will add to the total capital costs of the project Land area constraints should also be considered when considering additional storage as the space requirements for the necessary storage capacity could be significant
bull Costs associated with the impact of interruptions on plant processes (eg more frequent replacement of membranes impacts to pretreatment system or plant infrastructure)
bull Potential financial penalties that would be incurred if deployment as part of demand response were to result in failure to meet contract obligations to supply water
bull The loss of potential benefits in the form of cost avoidance from participation in non-ERCOTshydispatched demand response opportunities (see Section 43) If a plant is committed to RRS or ERS the plant operator would lose the flexibility to take advantage of these other opportunities to reduce their electricity costs
The interplay of these benefits and costs will determine whether it would be beneficial for a future seawater desalination plant to participate in demand response in ERCOT
43 Considerations for Non-ERCOT-Dispatched Demand Response Outside of the reliability-based services administered by ERCOT there are other opportunities for seawater desalination plants to reduce their electricity costs As described in Section 321 seawater desalination plants may be able to reduce the demand charges on their electricity bills through curtailing load during 4CP intervals In addition plant operators may adjust operations in response to real-time electricity prices to take advantage of lower off-peak prices and avoid price spikes (see Sections 322 and 323) All of these opportunities require that the plant have flexibility to reduce production during certain times of the day
In the ERCOT region as noted above a portion of transmission and distribution charges are set based on the peak systemwide 15-minute interval of the four summer months (June through September) referred to as the four coincident peaks (4CP) Large customers can reduce or avoid this charge by reducing electrical consumption during these four peak intervals AEP Central Texas and CenterPoint are the transmission providers covering the majority of the Gulf Coast in Texas13
12 ERCOT June 2016 ldquoLoad Resource Deployment Updaterdquo Available at httpwwwercotcomcontentwcmkey_documents_lists870985_RRS_Load_Resource_Deployment_Updatepdf 13 It is also possible that a seawater desalination plant could be located in an area that as not opted in to competition in which case the plant owner would need to negotiate its electricity charges bilaterally with the Non Opt-In Entity (NOIE)
copy 2016 ERCOT All rights reserved 9
Study on the Demand Response Potential for Seawater Desalination Projects ERCOT Public
Assuming a future seawater desalination plant would be connected at transmission-level voltages the relevant 4CP charges based on the 2016 tariffs accounting for both transmission charges and transmission cost recovery factors would be $41425 per 4CP kW for AEP Central Texas and $41870 per 4CP kVA for CenterPoint14 If a seawater desalination plant has 10 MW of load and is capable of interrupting all of it and successfully does so for all four 4CP intervals the savings based on the 2016 tariffs would be approximately $500000 per year ($41425 times 1000 (kW to MW) times 10 MW times 12 months) Thus a seawater desalination plant that reduces its electricity use during the 4CP intervals could avert some or all of these charges
Another opportunity for seawater desalination plants to reduce their electricity costs is through adjusting operations in response to real-time electricity prices In 2015 the average electricity price in ERCOT was $2677MWh However prices exceeded $50MWh in 254 hours (3 of all hours) $100MWh in 88 hours (1) $200MWh in 40 hours (05) and $300MWh in 21 hours (02) Prices exceeded $3000MWh for 021 hours15 Depending on the desalination plantrsquos exposure to real-time wholesale market prices (via its retail contract) the degree of high prices the plant owner is willing to avoid and grid conditions in a given year reducing unit operations in order to avoid high electricity prices could impact operators for anywhere between a few and several hundred hours out of the year In addition a plant can plan its operations to take advantage of lower electricity prices during off-peak periods (eg at night when generation from wind is high) For example at least one company is marketing a modular desalination unit design intended to take advantage of low prices during periods of high renewables generation and to provide grid reliability services through demand response16
There are several factors to consider regarding these opportunities to reduce electricity costs The plant would need to monitor the ERCOT market or hire a contractor to do so in order to know when to reduce demand for electricity These programs do not impose any requirements on response time as with RRS or ERS and there may be sufficient warning of 4CP intervals or peak pricing to allow the plant operator to plan its operations earlier in the day with sufficient time to ramp down production under controlled conditions However quicker ramping capability may be desirable to respond to electricity price fluctuations
For 4CP because the four intervals used to set demand charges are not known ahead of time it is likely that the plant would need to reduce its demand multiple times per summer to ensure the 4CP intervals are hit impacting production at the facility Timing operations to coincide with off-peak pricing or to avoid price spikes would similarly result in reduced operations during certain hours To offset the lost production hours the plant may need to be designed with extra capacity and water storage capability to maintain the ability to meet its contractual obligations for freshwater delivery Because the period of reduced operations is greater than with ERCOT-dispatched demand response services this need would be greater for a seawater desalination plant reducing load during 4CP intervals or in response to real-time electricity prices and would increase the capital costs of the project It should also be noted that high prices in the ERCOT Region typically but not always occur in summer months when drought conditions are more likely to develop and demand for desalinated water is likely to be highest This may limit the flexibility of the plant to time its electricity consumption to avoid high-priced hours
14 Public Utility Commission of Texas ldquoTransmission and Distribution Rates for Investor Owned Utilitiesrdquo Available at httpwwwpuctexasgovindustryelectricratestdraspx 15 Potomac Economics June 2016 2015 State of the Market Report for the ERCOT Wholesale Electricity Markets Available at httpswwwpotomaceconomicscomindexphpmarkets_monitoredERCOT 16 Sisyan LLC ldquoDemand Response Desalinationrdquo Available at httprenewabledesalinationcomwpshycontentuploads201506Demand-Response-Desalinationpdf
copy 2016 ERCOT All rights reserved 10
Study on the Demand Response Potential for Seawater Desalination Projects ERCOT Public
In addition the plantrsquos ability to participate in demand response would also be limited for those hours it is reducing load as part of 4CP response or in response to real-time prices because the plant would not be able to reduce its electricity consumption if that demand is already committed to another demand response service Thus participating in demand response versus taking advantage of these other opportunities may be to some extent mutually exclusive
5 Conclusion
Based on this analysis it appears that the operational characteristics of seawater desalination plants would allow them to participate in demand response opportunities in ERCOT so long as the necessary operational requirements are considered in the design specifications of the plant Project developers should consider the necessary requirements early in the plant design Whether the economic benefits of participation would provide a sufficient incentive for them to do so will depend on the costs of accommodating those operational requirements and whether there is the flexibility available to operate the plant as necessary under these programs Though most existing seawater desalination plants do not participate in demand response programs it does appear that participation by these plants is possible and could result in a financial benefit Table 2 compares the different demand response opportunities available to demand-side resources in ERCOT
Table 2 Comparison of Demand Response Opportunities Demand Response
Opportunity Requirements for
Participation Impacts to Plant
Operations Financial Benefit Ancillary Services ndash Responsive Reserve Service (RRS)
bull Under-Frequency Relay bull Instantaneous or 10 minute
response time bull Recover load within 3
hours bull Bid in day-ahead market
bull Deployed once in 2015 for 10 minutes bull Subject to annual
unannounced testing
bull $1087 per MW per hour (based on 2015 prices)
Emergency Response Service (ERS)
bull 10 or 30 minute response time bull Recover load within 10
hours bull Four-month contract term
bull Not deployed in 2015 the most times ever deployed in a single year was twice in 2011 bull Subject to annual
unannounced testing
bull $645 per MW per hour (based on 2015 prices)
Four Coincident bull Interval Data Recorder bull Likely plant will need to bull Avoid ~$48000 per 4CP Peak (4CP) (IDR) meter
bull Ability to predict system-wide peak demand hours during summer months
reduce load multiple times per summer to hit 4CP intervals bull Likely to be able to predict
possible 4CP intervals earlier in day
MW per year (based on 2016 tariffs) if successful in reducing during all four summer months
LSE or DR Provider Contracted Price Response
bull Varies based on contractual arrangements
bull Varies based on contractual arrangements
bull Varies based on contractual arrangements
Self-Directed Price bull Retail contract with bull Varies depending on bull Varies depending on Response exposure to real-time
market prices bull Ability to monitor real-time
prices in ERCOT wholesale market
number and severity of pricing events bull May be able to predict
peak pricing events earlier in day
number and severity of pricing events
copy 2016 ERCOT All rights reserved 11
Study on the Demand Response Potential for Seawater Desalination Projects ERCOT Public
Demand response programs in ERCOT provide opportunities for demand-side resources to defray their electricity costs and provide reliability benefits to the ERCOT electric grid Because the process of seawater desalination is energy intensive participation in demand response could help to reduce electricity costs while posing a relatively low risk to plant operations if demand response participation is factored into plant design
Participation in non-ERCOT-dispatched demand response opportunities such as reducing load during 4CP intervals or in response to real-time electricity prices may also help to reduce electricity costs for seawater desalination plants in Texas As stakeholders in Texas continue to plan for possible future droughts in the region and identify water management strategies consideration of demand response could play a role in mitigating some costs associated with seawater desalination and allow seawater desalination plants to assist with maintaining electric reliability in the region
copy 2016 ERCOT All rights reserved 12
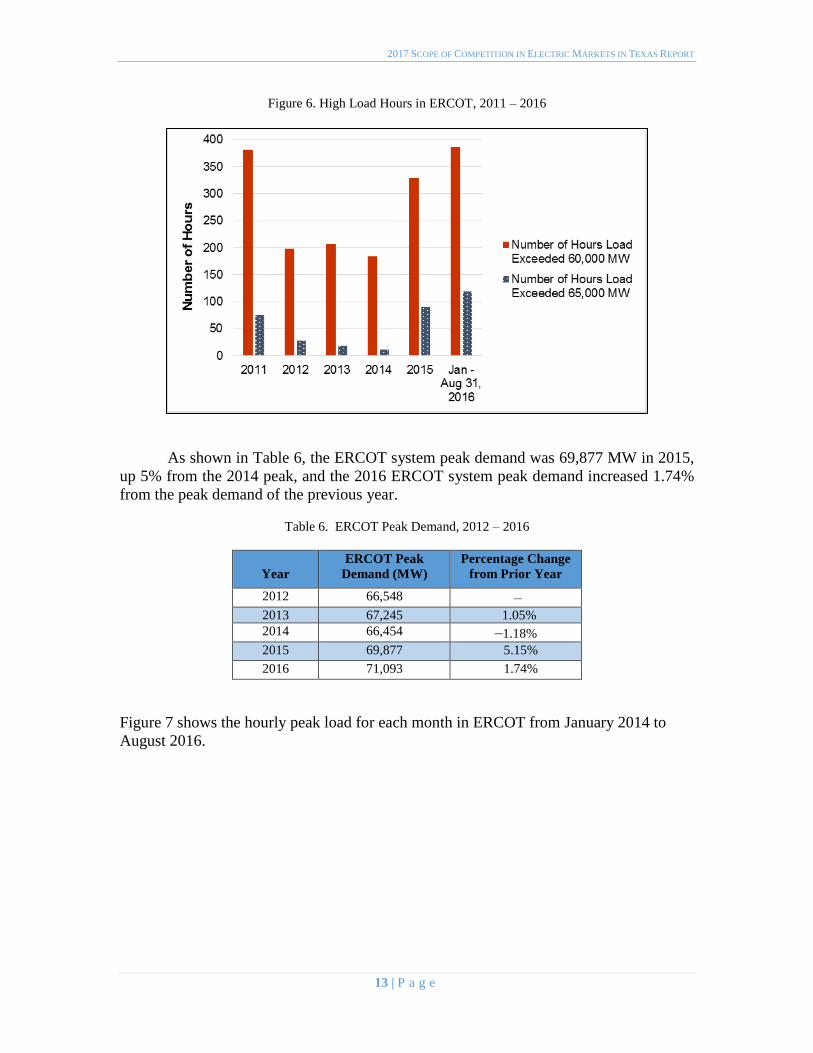
2017 SCOPE OF COMPETITION IN ELECTRIC MARKETS IN TEXAS REPORT
Figure 6 High Load Hours in ERCOT 2011 ndash 2016
As shown in Table 6 the ERCOT system peak demand was 69877 MW in 2015
up 5 from the 2014 peak and the 2016 ERCOT system peak demand increased 174
from the peak demand of the previous year
Table 6 ERCOT Peak Demand 2012 ndash 2016
Year
ERCOT Peak
Demand (MW)
Percentage Change
from Prior Year
2012 66548 ndash 2013 67245 105
2014 66454 ndash118
2015 69877 515
2016 71093 174
Figure 7 shows the hourly peak load for each month in ERCOT from January 2014 to
August 2016
13 | P a g e
2017 SCOPE OF COMPETITION IN ELECTRIC MARKETS IN TEXAS REPORT
Figure 7 Monthly Peak Demand in ERCOT January 2014 ndash August 2016
3 Generation Diversity
As electricity consumption has increased in ERCOT the diversity of the systemrsquos generation portfolio has also increased Generators participating in the statersquos renewable energy credit (REC) trading program reported an 11 increase in renewable generation
from 2013 to 2015 rising from 376 million MWh to 469 million MWh with wind
representing 96 of the total renewable mix Landfill gas was the second most prevalent
renewable source representing approximately 12 of all renewable generation in 2015
Energy produced from wind generation was up by 13 in 2015 from 2013 and solar
energy capacity more than doubled from 121 MW in 2013 to 288 MW in 2015 Coal-fired
generation has been steadily shrinking as a proportion of total generation declining from
37 of electricity produced in 2014 to 28 in 2015 Energy use in the ERCOT region by
fuel type for 2015 is shown in Figure 8
14 | P a g e
2017 SCOPE OF COMPETITION IN ELECTRIC MARKETS IN TEXAS REPORT
Figure 8 Energy Use in ERCOT by Resource Type 2015
The Commissionrsquos projects are further described in the following section of this report
15 | P a g e
2017 SCOPE OF COMPETITION IN ELECTRIC MARKETS IN TEXAS REPORT
III SUMMARY OF COMMISSION ACTIVITIES FROM 2015 TO 2016
Introduction
The Commission develops and modifies rules policies and procedures for the
competitive electric market in Texas in response to the technological advances in the
industry and the evolving needs of customers The Commission also continues to carry
out oversight of programs with which the Legislature has tasked it ndash such as energy
efficiency renewable energy and advanced metering infrastructure Within the
ERCOT region the monopoly wires-and-poles companies that provide transmission
and distribution services throughout the grid remain subject to traditional rate
regulation by the Commission The Commission continues to set rates for these
utilities as they are not subject to the forces of market competition This section
provides an overview of the Commissionrsquos activities in its oversight of the wholesale and retail electric markets as well as its governance over regulated electric utilities
Resource Adequacy
Resource adequacy is the long-term ability of the system to serve demand reliably
when consumption is highest given the available installed capacity load resources and
the operational reliability of the system Assessing resource adequacy requires comparing
the systemrsquos forecast installed capacity and load resources against the forecast peak
summer load The difference between the forecast of available generation and load
resources and the forecasted demand for electricity is referred to as an ldquoinstalled capacity
reserve marginrdquo which is an indicator of the ability of the system to meet customer demand
during peak conditions In addition to evaluating the forecast reserve margin assessing
resource adequacy includes evaluating the systemrsquos operational reliability The systemrsquos operational reliability depends on the ability of generators to manage plant operations
successfully as well as the grid operatorrsquos ability to manage the system to avoid or to mitigate load curtailment During 2015 and 2016 the ERCOT system performed well with
respect to resource adequacy The Commission has devoted significant attention to
ensuring that ERCOT maintains an adequate installed capacity reserve margin and a high
level of operational reliability developing a wholesale market design that allows
consumers to continue to receive low-cost and reliable electricity over the long term
1 Capacity Demand and Reserves Report
The Capacity Demand and Reserves (CDR) Report published by ERCOT semi-
annually is a snapshot estimate of long-term supply and demand and the associated annual
reserve margin for peak summer and winter conditions While the CDR Report is not a
forecast of any particular outcome it provides insight into possible resource adequacy
trends
16 | P a g e
2017 SCOPE OF COMPETITION IN ELECTRIC MARKETS IN TEXAS REPORT
The May 2016 CDR Report shows estimated reserve margins well above the
current target reserve margin of 1375 Installed capacity reserve margin estimates taken
from this CDR Report are shown below in Table 7
Table 7 May 2016 Capacity Demand and Reserves Report Forecast
Forecast 2017 2018 2019 2020 2021 2022 2023 2024 2025 2026
Peak Load
(MW)
68548 69409 70795 71420 72098 72792 73482 74168 74864 75704
Total
Capacity
(MW)
80995 87019 87238 87407 87678 87738 87738 87728 87728 87728
Reserve
Margin
182 254 232 224 216 205 194 183 172 159
2 Operating Reserve Demand Curve
In ERCOT the price signals produced by the energy-only wholesale electric market
should provide incentives to promote short-term reliability as well as induce optimal long-
run investment in new resources If the prices are efficient and reflect the full cost of
dispatching resources to meet demand the benefits that accrue to both consumers and
producers can be maximized at the least cost and new generating capacity (or load
resources) should develop to maintain the equilibrium as old resources retire or demand
increases
The Operating Reserve Demand Curve (ORDC) implemented at the Commissionrsquos direction in June 2014 improves price formation by allowing prices to more fully reflect
the value of operating reserves The ORDC assigns an economic value to operating
reserves or the amount of extra capacity available to maintain system reliability on a daily
basis
As part of its ongoing review of resource adequacy in ERCOT the Commission is
currently evaluating the accuracy of the inputs to the ORDC to ensure that its contribution
to price formation appropriately reflects the costs of meeting demand and the underlying
needs of the system
3 Transmission Congestion
Although competitive power producers and regulated transmission providers form
two distinct segments of the market transmission buildout has a direct effect on wholesale
power prices When there is insufficient transmission capacity to dispatch energy in a least-
cost fashion the system operator takes action to ensure that the physical limits of the
transmission system facilities are not violated The re-dispatch of generation because of
transmission limits results in disparate prices at different locations on the system In
comparison to prior years transmission congestion in ERCOT has lessened because of the
large increase in transmission investment and the reduction of high demand related to oil
and gas production in West Texas ERCOT and the Commission continually evaluate the
need for cost-effective additional transmission investment to manage congestion
17 | P a g e
2017 SCOPE OF COMPETITION IN ELECTRIC MARKETS IN TEXAS REPORT
4 Wholesale Market Design Initiatives
While the ERCOT wholesale market has been successful in attracting new resource
investment and also maintaining competitive prices for consumers certain improvements
to the market design could yield additional benefits in terms of efficient price formation
and opportunities for entry of new technology Initiatives already in place in many other
regions such as real-time co-optimization and multi-interval real-time resource dispatch
may allow existing capacity to be used more effectively and create opportunities for the
integration of additional load resources to serve electric demand The Commission
continues to work with ERCOT and interested stakeholders to determine the value of
implementing such enhancements particularly as ERCOTrsquos resource mix changes over time
5 Reliability Standard
In early 2014 the Commission opened a project to review its use of a target installed
capacity reserve margin based on a reliability standard equivalent to one loss-of-load event
every ten years In this project the Commission received written comment from interested
parties conducted a public workshop consulted with independent experts and reviewed
the application of reliability standards in other regions As a result of this review future
reliability metrics to be estimated in ERCOT will include the market equilibrium reserve
margin the economically-optimal reserve margin and the associated levels of expected
unserved energy The Commission believes that publishing these metrics represents an
improvement over reporting a one-event-in-ten-years standard by enhancing insight into
expected outcomes in ERCOTrsquos energy-only market
Non-ERCOT Utilities Market Development Activities
SB 7 the law that introduced retail competition to the Texas market in 1999
granted the Commission authority to delay retail competition in an area where deregulation
would not result in fair competition and reliable service because of the lack of an
independent organization to coordinate the electric system and the concentration of
ownership in the generation sector in some of those areas Consequently SB 7 included
provisions recognizing the difficulty of implementing retail competition in areas outside of
ERCOT Therefore the utilities outside of the ERCOT region remain vertically integrated
owning generation transmission and distribution assets as well as selling power to end-
use customers These vertically integrated utilities remain subject to traditional regulation
including rates set by the Commission and customer choice is not offered in the service
territories of these utilities
The Commission does continue to monitor ongoing activities in the non-ERCOT
portions of the state In 2015 the Legislature granted the Commission the authority to
retain counsel and consulting experts in order to participate in legal proceedings at the
Federal Energy Regulatory Commission (FERC) which has regulatory jurisdiction over
wholesale power sales and transmission rates outside of ERCOT This authority has
18 | P a g e
2017 SCOPE OF COMPETITION IN ELECTRIC MARKETS IN TEXAS REPORT
permitted the Commission to participate more effectively in FERC proceedings affecting
Texasrsquo utilities located outside of ERCOT
1 Southwest Power Pool
The Southwest Power Pool (SPP) is the Regional Transmission Operator (RTO) for
areas of Northeast Texas and the Texas Panhandle In Texas the utilities Southwestern
Electric Power Company (SWEPCO) Southwestern Public Service (SPS) and several
electric cooperatives and municipally owned utilities are in SPP In addition to these areas
of Texas the SPP footprint includes parts of New Mexico Arkansas Missouri Nebraska
Louisiana and all of Kansas and Oklahoma In 2015 SPP became the RTO for the
Integrated System and neighboring areas which includes parts of Iowa Minnesota North
Dakota South Dakota Wyoming and Montana SPP has spent extensive time and
resources over the last two years to integrate these new areas successfully The expansion
added 5000 MW of peak demand 7600 MW of generating capacity and 9500 miles of
transmission lines17
In 2014 SPP launched its new Integrated Marketplace which provides a Day-
Ahead Market a Real-Time Balancing Market and Congestion Hedging Markets
mechanisms similar to those available in ERCOT The implementation of the Integrated
Marketplace resulted in a savings of $422 million in 2015 As a result of the Integrated
Marketplace SPPrsquos planning reserve margin will be reduced from 136 to 12 a change
expected to save about $90 million annually
Chairman Donna L Nelson represents the Commission as a voting member on
SPPrsquos Regional State Committee (RSC) The RSC provides collective state regulatory
agency input on a variety of issues In addition the RSC has authority over the cost
allocation methodologies for transmission upgrades allocation of Financial Transmission
Rights and the approach used for resource adequacy across the SPP region The RSC
regularly meets on a quarterly basis and meets more frequently if necessary
2 Midcontinent Independent System Operator
The Midcontinent Independent System Operator (MISO) is an RTO that serves all
or part of 15 states in the central US one Canadian province and the portion of eastern
Texas served by the vertically integrated utility Entergy Texas Inc MISO provides a Day
Two market which has a variety of functions and services including energy and ancillary
service markets economic dispatch congestion management financial transmission rights
and transmission planning The MISO Independent Market Monitor concluded that the
MISO wholesale markets were competitive in 2015
Like SPP MISO is in the Eastern Interconnection which crosses state boundaries
and is therefore subject to FERC jurisdiction A number of recent FERC proceedings have
17 2015 Southwest Power Pool Annual Report Available at
httpswwwspporgdocuments37800201520southwest20power20pool20annual20reportpdf
19 | P a g e
2017 SCOPE OF COMPETITION IN ELECTRIC MARKETS IN TEXAS REPORT
affected the portion of Texas that is in the MISO footprint The Commission through
outside counsel has been an active party in such FERC proceedings FERC Docket No
ER14-1174 addressed in part a dispute regarding the availability of transmission capacity
under the Joint Operating Agreement between MISO and the SPP Ultimately FERC
approved a settlement agreement under which MISO will compensate SPP and its members
for using their or other entitiesrsquo transmission systems
In a related pending docket at FERC Docket No ER14-1736 parties are addressing
how the cost of these payments will be allocated among MISO market participants Parties
in this proceeding are engaged in settlement discussions In addition in Docket No ER14-
75-000 FERC approved a settlement agreement among the participating Entergy
Operating Companies and their retail regulators to terminate the Entergy System
Agreement effective August 31 2016 The settlement terms prohibit any post-termination
payments that roughly equalize production costs among the operating companies after
December 31 2015 terminate certain specific cross-purchase power agreements between
Entergy Texas and former Entergy Gulf State Louisiana and permit the continuation of
several other purchase power agreements
Commissioner Kenneth W Anderson Jr represents the Commission as a voting
member in the Organization of MISO States (OMS) the purpose of which is to coordinate
regulatory oversight among the states in the MISO region and to make recommendations
to MISO FERC and other entities Commissioner Anderson also represents the
Commission as a voting member of the Entergy Regional State Committee (ERSC) which
has certain FERC-approved authority for five years after the Entergy integration with
regard to cost allocation for Entergy transmission projects and adding transmission projects
to the Entergy construction plan The ERSC meets quarterly
3 Western Electricity Coordinating Council
The Western Electricity Coordinating Council (WECC) is a Regional Entity whose
region includes the area surrounding El Paso and extends from Canada to Mexico
including the provinces of Alberta and British Columbia the northern portion of Baja
California and all or portions of the 14 Western states in between WECC is the Regional
Entity responsible for Bulk Electric System reliability in the Western Interconnection and
associated compliance monitoring and enforcement WECC does not have organized
markets outside of California but is organized into 38 separate balancing authorities
WECC is geographically the largest and most diverse of the eight Regional Entities in the
United States with delegated authority from the North American Electric Reliability
Corporation (NERC) and the Federal Energy Regulatory Commission In Texas El Paso
Electric Company is a member of WECC
Rulemaking Activities
The Commission has continued to adopt new rules and modify existing rules in
order to further the continued successful operation of the competitive retail and wholesale
markets and to comply with statutory changes made to PURA by the Legislature This
20 | P a g e
2017 SCOPE OF COMPETITION IN ELECTRIC MARKETS IN TEXAS REPORT
section of the Report provides a high-level overview of the Commissionrsquos key rulemaking
activities highlighting the market improvements made in 2015 and 2016
1 Cost Recovery and Rate Adjustment
The Commission adopted new rule 16 TAC sect25246 on June 29 2016 to
implement Section Nos 1 through 3 of House Bill 1535 of the 84th Legislature The new
rule only applies to a utility that operates solely outside of ERCOT and allows for the use
of an update period beyond the test year for which the utility initially files estimated
information The rule clarifies that all information originally estimated must be updated
with actual information and also provides requirements for a post-test-year adjustment for
a natural gas-fired plant A non-ERCOT utility also is required to initiate a new base rate
case on or before the four year anniversary of the final order in the utilityrsquos most recent comprehensive base rate case or if the commission determines that the utility has
materially earned more than its authorized rate of return in two consecutive years The rule
also provides requirements and procedures for the relation back of final rates to an effective
date 155 days after the filing of the rate application
2 Changes to Certificates of Convenience and Necessity and CREZ Rule
The Commission conducted a rulemaking to implement changes pursuant to
Legislative mandates in SB 776 SB 933 and HB 1535 of the 84th Legislature SB 776
required municipally owned utilities to apply for a certificate of convenience and necessity
(CCN) before constructing transmission facilities outside the boundaries of the
municipality that owns the municipally owned utility SB 933 also requires persons to
obtain a CCN before interconnecting a tie line into the ERCOT grid HB 1535 requires the
Commission to issue a final order within 181 days for a non-ERCOT utility requesting a
CCN for an existing electric generating facility and 366 days after a non-ERCOT utility
files a CCN for a newly constructed generating facility In addition the Commission also
determined in this rulemaking that all future transmission projects in a Competitive
Renewable Energy Zone (CREZ) must meet the need criteria of PURA sectsect 37056(c)(1)
and (2) rather than being exempt Finally the Commission determined that the CREZ
project established in 2008 was complete following the installation of a second circuit on
a Sharyland line
3 Use of Handheld Device for Enrollment
As the market evolves the Commission evaluates market changes balancing its
desire to encourage customer-focused innovation with its concern for customer protection
against potential abuses In Docket No 44518 the Commission granted a REP a
temporary 12-month waiver from its rules requiring the marketer to obtain telephonic
verification of the customerrsquos desire to switch REPs as well as a waiver from certain authorization disclosure requirements among other stipulations the Commission placed
upon the REP The Commission then opened Project No 45625 to study the issue of REPs
utilizing hand-held devices for customer enrollment more broadly and engage with market
representatives consumer representatives and other stakeholders The Commission
anticipates considering an amendment to its rules in the spring of 2017
21 | P a g e
2017 SCOPE OF COMPETITION IN ELECTRIC MARKETS IN TEXAS REPORT
4 Smart Meter Texas Portal
The electric utilities in Texas that have advanced metering systems (AMS) jointly
own and operate a single web portal known as Smart Meter Texas (SMT)18 SMT fulfills
two requirements imposed by the Commissionrsquos advanced metering rule on a utility with
AMS (1) provide to the retail customer the REP serving the customer and other entities
authorized by the customer access to such retail customerrsquos consumption data and (2)
allow devices at the customerrsquos premises to communicate through a home area network with the advanced meter at the premises SMT also facilitates near real-time on-demand
reads of a customerrsquos meter that aids prepaid service offered by certain REPs
In Project No 42786 Review of Advanced Metering System Web Portal
Commission staff and stakeholders examined options for the long-term operational
structure governance and funding of SMT The Commission determined that ownership
of SMT should remain with the TDUs because they can operate the portal at a lower cost
than transferring the data repository to ERCOT The Commission opened two
rulemakings one to ascertain the appropriate governance performance and funding of
SMT and a second to determine the appropriate access for third parties ensuring that
customers have the freedom to grant and give third parties access to their data if made
knowingly while also securing customer privacy
Sharyland Utilities
In early 2015 customers of Sharyland Utilities the smallest investor-owned
transmission and distribution utility in ERCOT began to file with the Commission a
significant number of complaints regarding high electricity bills In response the
Commission opened Project No 44592 Relating to a Project Regarding Sharyland
Utilities to provide for a more formal process for Commission review of the large number
of complaints As part of this project Commission staff prepared a report to evaluate the
electricity rates and electric bills in the operating area of Sharyland Utilities that was
previously part of Cap Rock Energy
Staffrsquos report found that a number of factors contributed to the comparatively high
bills for many of Sharyland-Cap Rockrsquos customers First Sharylandrsquos small size and its low customer density result in high TDU rates for all customers relative to other TDUs In
particular Staffrsquos report found that Sharyland-Cap Rockrsquos rates for distribution service are
up to three times higher than those of other TDUs in Texas In addition to Sharyland-Cap
Rockrsquos high costs for distribution service higher wholesale transmission costs also
contributed to the rate increases charged to Sharyland-Cap Rockrsquos customers These transmission costs are the result of increased transmission investment in recent years
throughout Texas that has increased transmission costs for all distribution providers
18 The participating Texas TDUs are AEP Texas Central Company and AEP Texas North Company (jointly
ldquoAEPrdquo) CenterPoint Energy Houston Electric LLC (ldquoCenterPointrdquo) Oncor Electric Delivery Company LLC (ldquoOncorrdquo) and Texas-New Mexico Power Company (TNMP) collectively referred to as the ldquoJoint TDUsrdquo Operation of an AMS web portal was addressed in the orders approving particular utilitiesrsquo deployment of AMS and approving surcharges for AMS cost recovery While Sharyland Utilities filed comments in the proceeding it did not
participate as it had not fully completed its AMS deployment at the time
22 | P a g e
2017 SCOPE OF COMPETITION IN ELECTRIC MARKETS IN TEXAS REPORT
including Sharyland Utilities Second the comparatively colder winter of 2014 ndash 2015
which was the time period generally consistent with the timeframe in which the
Commission began receiving complaints appeared to result in higher electricity usage than
normal This combination of high TDU rates and the higher electricity usage led to higher
bills for customers
Staffrsquos report also noted that in Sharyland-Cap Rockrsquos last rate case in 2014 the
approved rates reflected movement towards more cost-based rates for all customers
including some customers that previously had been heavily subsidized by other customers
Additionally in the process of standardizing Sharyland-Cap Rockrsquos customer classification
with the classifications of the other TDUs in Texas some customers may have experienced
a move from one class that previously was paying below-cost rates to another class that
was now paying above-cost rates For some of these customers the combined effects of
the movement towards cost-based rates and the change to a different class may have
contributed to a significant change in the customersrsquo rates Regardless of any cost-shifting
between customer classes Sharylandrsquos rates remain two to three times higher than those of other TDUs in Texas for all customers in all classes
On December 4 2015 the Commission signed an order directing Sharyland to file
an application for a comprehensive rate review by April 30 2016 Sharyland filed its rate
application on April 29 2016 in Docket No 45414 Review of the Rates of Sharyland
Utilities LP On October 10 2016 the Commission ordered Sharyland to file an amended
application as soon as practicable but no later than January 1 2017 to reflect the unique
aspects of the companyrsquos organizational structure as a real estate investment trust (REIT) At the time of publication Sharyland is expected to file its amended application in
December 2016
PowerToChoose Website
As part of its ongoing evaluation of the competitive market the Commission
opened Project No 45730 to evaluate the functionality and usability of its PowerToChoose
website which allows customers to select a REP and an electric plan based on their zip
code In the process the Commission received significant feedback from customers stating
that the Commissionrsquos PowerToChoose website was an important tool that plays a
fundamental role in their shopping process In response to the feedback received from
industry representatives and consumers Commission staff changed how the website sorts
and filters retail electric plans adding a filter to allow customers to unselect plans that
contain minimum usage fees or credits This filter is now a default setting and plans with
minimum usage fees and credits are not shown unless the customer actively selects to
search for such plans In addition Commission staff made other changes to increase the
clarity of the REP complaint rating The Commission continues to evaluate other changes
to improve the customer experience of the PowerToChoose website and provide
transparency for retail electric plans
23 | P a g e
2017 SCOPE OF COMPETITION IN ELECTRIC MARKETS IN TEXAS REPORT
Report on Alternative Ratemaking Mechanisms
In 2015 the Legislature enacted SB 774 which requires the Commission or its
consultant to conduct a study and make a report to the Legislature analyzing the alternative
ratemaking mechanisms adopted by other states In addition SB 774 extended the
authorization for the Periodic Rate Adjustment (PRA) mechanism from 2017 to 2019
which the Legislature had authorized in 2011 (SB 1693) as a version of an alternative
ratemaking mechanism that provides to utilities a means for expedited recovery of
distribution infrastructure costs Pursuant to SB 774 the Commission retained a consultant
to produce the report and the consultantrsquos recommendations included streamlining the ratemaking process to reduce procedural costs providing for a periodic review of the
prudency of the costs and using certain types of alternative ratemaking mechanisms that
decouple the recovery of costs from variations in load The Commission held a public
hearing to receive comments on the report from stakeholders and after consideration of
those comments has provided to the Legislature the consultantrsquos report together with its
own discussion of the report
Request for Purchase of Oncor Electric Delivery Company
In March 2016 the Commission approved with conditions an application by an
investor group led by Hunt Consolidated Inc the owners of Sharyland Utilities to acquire
control of Oncor Electric Delivery Company (Oncor) the largest transmission and
distribution utility in Texas from Oncorrsquos parent company Energy Future Holdings which
is in bankruptcy The Commission approved the request subject to certain conditions
including stipulations regarding the organization of the new entities and treatment of tax
benefits The investor-led group subsequently declined to pursue the transaction that was
approved by the Commission
In September 2016 NextEra Energy which owns Florida Power amp Light received
approval from the United States Bankruptcy Court in Delaware for its plan to purchase
Oncor In October 2016 NextEra Energy filed an application with the Commission in
Docket No 46238 for approval of the proposed transaction The Commission will evaluate
the application to determine if the transaction is in the public interest
Integration of Lubbock Power and Light
In March 2016 the Commission opened Project No 45633 to study and identify
the issues related to the request of Lubbock Power and Light the statersquos third-largest
municipally owned utility to be integrated into ERCOT The Commission is currently
working with stakeholders ERCOT and SPP to determine the cost and benefits of any
potential switch by Lubbock Power and Light into ERCOT and whether such a switch is
in the public interest
24 | P a g e
2017 SCOPE OF COMPETITION IN ELECTRIC MARKETS IN TEXAS REPORT
Desalination Project ERCOT Studies
In 2015 the Legislature passed HB 4097 which directed the Commission and
ERCOT to study whether existing transmission and distribution planning processes are
sufficient to provide adequate infrastructure for seawater desalination projects and to study
the potential for desalination projects to participate in demand response opportunities in
the ERCOT market Pursuant to that direction ERCOT staff have prepared a report on the
feasibility of interconnection of large desalination projects and on opportunities for such
projects to participate in ERCOTrsquos demand response programs which is attached to this Report in Appendix B
Oversight and Enforcement Actions
The Commissionrsquos enforcement of statutes rules and orders applicable to entities
under its jurisdiction serves to protect consumers the electric markets the reliability of the
electric grid and to promote fair competition The Commissionrsquos enforcement efforts in the electric industry focus on violations of PURA the Commissionrsquos rules and ERCOT
protocols
During the period from January 2015 through August 31 2016 the Commission
assessed $3258500 in penalties against electric market participants Table 8 provides a
summary of electric industry Notices of Violation since January 2015 During 2015 and
2016 Commission staff opened 212 investigations for the electric industry and closed 177
investigations
Table 8 Notices of Violations
Violation Type Total Penalty Amount
Retail Market Violations $539000
Service Quality Violations $451500
Wholesale Market Violations $2268000
TOTAL $3258500
In addition to the imposition of administrative penalties the Commission uses other
enforcement mechanisms in exercising its enforcement duties including revoking a
companyrsquos certificate to operate In addition some companies may be required to relinquish a certificate as part of a settlement after enforcement action has proceeded
Table 9 provides a breakdown of the number of certificates revoked or relinquished In
2016 the Commission revoked the certificate of the REP TruSmart Energy
Table 9 Certificates Revoked or Relinquished
Type Number
Certificates Revoked 1
Certificates Relinquished 0
25 | P a g e
2017 SCOPE OF COMPETITION IN ELECTRIC MARKETS IN TEXAS REPORT
The Oversight amp Enforcement division also issues warning letters to companies in
the electric market when it determines that a violation occurred but given the
circumstances surrounding the violation and other mitigating concerns no administrative
penalty is warranted During 2015 and 2016 the Oversight amp Enforcement division issued
50 warning letters Finally the Commission generally seeks to reimburse money directly
to customers when appropriate In 2015 and 2016 the Commission ordered the
reimbursement of $8543596 to Texas electric customers
Table 10 Warning Letters
Warning Letter Type Number
Retail Market Warning Letter 8
Service Quality Warning Letter 1
Wholesale Market Warning Letter 41
TOTAL 50
In addition to its enforcement activities the Commission also enters into voluntary
mitigation plans with generators that request one through a contested case proceeding
pursuant to PURA sect15023(f) and 16 TAC sect25504(e) The Commission entered into one
voluntary mitigation plan during 2015 and 2016 in Docket No 44635
Low-Income Discount System Benefit Fund
The System Benefit Fund (SBF) was originally established in 1999 to fund
discounts to low-income customers customer education activities energy-efficiency and
weatherization and electric market oversight through a nonbypassable surcharge on retail
electric bills HB 1101 of the 84th Legislature provided that the SBF be sunset on
September 1 2017 by which time the SBF is intended to be exhausted In the 2016 Fiscal
Year (FY) $325521250 was appropriated in the SBF to provide a 25ndash31 percent discount
to low-income customers over a 12-month period
To assist the drawdown of the remaining balance HB 1101 authorized the
Commission to use any unexpended SBF balance in FY 2017 to assist low-income
customers The Commission estimates that the remaining SBF balance will be
approximately $17 million by August 31 2017 The Commission has determined that this
amount is insufficient to fund the rate reduction program however the Commission will
spend approximately $100000 to continue automatic enrollment in the program to provide
REPs a list of customers eligible to receive late fee waiver and deposit installment benefits
These two ancillary benefits of the rate reduction program will continue for the duration of
FY 2017
26 | P a g e
2017 SCOPE OF COMPETITION IN ELECTRIC MARKETS IN TEXAS REPORT
Homeland Security
The Commission assesses the efforts of ERCOT and utilities to defend against
mitigate and respond to the variety of risks that the modern electricity system faces The
Commission also meets with ERCOT utilities and governmental entities on an ongoing
basis to discuss preparation for everything from hurricanes and other severe weather to
cyber-threats and threats of physical damage to the grid from accidents or intentional
malfeasance In addition the Commission monitors industry and federal programs that
address homeland security issues
The Commission serves as an information liaison between state government and
electric utilities during emergencies The Commissionrsquos main roles include
Conveying outage and service restoration information from electric utilities to
state government
Conveying service restoration priorities (hospitals water treatment facilities
etc) from state government to electric utilities and
Facilitating the clearance of downed power lines in disaster re-entry areas and
facilitating entry of electric utilities into disaster areas
The Commissionrsquos Emergency Management Response Team (EMRT) provided staff at the
State Operation Center for the May 2015 and April 2016 flooding events in Texas as well
as additional staffing for severe winter weather
Demand Response
ERCOT staff have begun to report annually on the participation of customers in
REP-sponsored demand response programs These programs which have been facilitated
by the deployment of smart meters throughout the competitive areas within ERCOT and
by many municipal and cooperative electric utilities take the form of rebates for reduction
in usage during peak period time-of-use pricing real-time volumetric price compensation
for load reduction and direct control of customer load among other plans
These programs have seen dramatic increases in participation since ERCOT began
to gather this information in 2013 From 2013 to 2014 the number of residential customers
participating in these programs increased from 151793 to 721273 and the number of
commercial and industrial customers participating rose from 30275 to 50205 The
Commission continues to monitor ERCOTrsquos stakeholder process for efforts relating to the integration of demand response
27 | P a g e
2017 SCOPE OF COMPETITION IN ELECTRIC MARKETS IN TEXAS REPORT
IV LEGISLATIVE RECOMMENDATIONS
A Determination of Low-Income Customer Eligibility
In 2015 HB 1101 required that all remaining funds in the System Benefit Fund
(SBF) be expended that the fee that funded the program as a nonbypassable surcharge on
electric bills be set at zero and that the SBF be sunset on September 1 2017 Per the
provisions of HB 1101 the SBF fee was set at zero in September 2016 concluding the
funding for the program The sunset of the SBF program also concluded the relationship
between the Texas Health and Human Services Commission (HHSC) and the Commission
in which the HHSC provided to the Commission eligible electric customers for the SBF
low-income discount Because of the termination of the relationship with HHSC with the
termination of the SBF the Commission will no longer be able to determine easily an
electric customerrsquos eligibility for other low-income programs such as late penalty waivers
and the option of paying an electric deposit over multiple months
The Legislature may wish to consider easing low-income customers access to these
low-income programs by facilitating the process used to determine eligibility The
Commission offers four possible approaches in which the Legislature could continue these
low-income programs
(1) Authorize HSSC to provide identification of eligible low-income customers to the
Commission
(2) Allow retail electric providers (REPs) to provide such low-income programs using
the Low Income Discount Administratorrsquos (LIDA) Telecommunications Lifeline
Service Program list to identify low-income customers
(3) Require REPs to offer such low-income programs with customers self-enrolling
and REPs verifying income eligibility or
(4) Allow REPs to voluntarily provide such low-income programs at their own
discretion
B Outside Counsel for Proceedings before Regional Transmission
Organizations
Regional Transmission Organizations (RTO) manage the power grid across wide
regions of the United States Most of Texas is inside the ERCOT region however there
are significant portions of East Texas and the Panhandle that are in the Midcontinent
Independent System Operator (MISO) and the Southwest Power Pool (SPP) Issues arise
in these other RTOs that have significant impact on Texas ratepayers such as how
transmission infrastructure costs will be shared These tend to be very lengthy and
complicated proceedings that require specialized legal and consulting services
28 | P a g e
2017 SCOPE OF COMPETITION IN ELECTRIC MARKETS IN TEXAS REPORT
PURA sect 394525 currently authorizes the Commission to use outside consultants
auditors engineers or attorneys to represent the Commission in proceedings before the
Federal Energy Regulatory Commission This provision has been an important tool for the
Commission to respond to complex matters in the federal arena to enable it to protect the
public interest in Texas The PUC recommends that the Legislature expand the language
in this statute to include the ability to hire outside assistance for proceedings before other
RTOs to provide those same protections to Texas ratepayers in those areas
C Repeal of Natural Gas and Renewable Energy Mandates
1 Natural Gas
PURA sect 399044 establishes natural gas as ldquothe preferential fuelrdquo in Texas for electricity generation and requires the Commission to adopt rules to establish a system of
natural gas energy trading credits The majority of all new non-renewable electricity
generation constructed since 2000 for Texas has used natural gas as a primary fuel and this
trend is expected to continue in the foreseeable future The thresholds used to trigger the
natural gas energy trading credit system in PURA sect 399044 have not been reached and
they are not expected to be reached in the foreseeable future
Because natural gas-fueled facilities have been the most commonly built new
generation in Texas for many years and are expected to continue to be there is no need to
establish incentives for natural gas generation The PUC recommends that the Legislature
consider repealing PURA sect 399044 because it is no longer necessary
2 Renewable Energy
PURA sect 39904 establishes goals for renewable energy Subsection (a) requires
the installation of 5880 megawatts of renewable energy by 2015 and Subsection (b)
establishes a renewable energy credits trading program to implement the requirement The
5880 megawatts mandates in Subsection (a) was met in 2008 While the Commission
believes the renewable energy trading credit program is needed for retail electric providers
to validate renewable energy marketing claims the Commission believes the 5880
megawatts mandate in Subsection (a) is no longer necessary
D Advisory Opinions
Many regulatory agencies in Texas have authority to issue informal guidance to the
persons they regulate particularly with respect to outlining whether a particular course of
conduct would in the agencyrsquos view be consistent with the laws and regulations that the agency administers19 The issuance of an advisory opinion can provide regulatory clarity
to a company before making investments or conducting operations the permissibility of
which may be unclear under state law The Legislature may want to consider granting the
19 In addition certain federal agencies such as the Federal Communications Commission
Internal Revenue Service Securities and Exchange Commission and Federal Election
Commission have authority to issue advisory opinions
29 | P a g e
2017 SCOPE OF COMPETITION IN ELECTRIC MARKETS IN TEXAS REPORT
Commission the authority to issue advisory opinions In the electric industry providing
clarification to a company concerning issues such as the purchase of assets or the
acquisition of another company could allow it to avoid expensive regulatory proceedings
without impairing the Commissionrsquos authority The following state agencies have statutory authority to issue advisory opinions
Texas Ethics Commission20
Texas Medical Board21
State Board of Dental Examiners22
Texas Board of Nursing23
Texas Board of Professional Engineers24
Texas Lottery Commission and25
Texas Securities Board26
E Administrative
Gross Receipts Assessment
PURA sect 16001 provides for a gross receipts assessment that is used to defray the
expenses incurred by the Commission to administer PURA An assessment of one sixth of
one percent is collected from public utilities electric cooperatives retail electric providers
and interexchange carriersrsquo gross receipts from consumers The funds from this assessment
are remitted to the general revenue fund but currently they have not been explicitly
dedicated to funding of the Commission In contrast similar assessments on water
utilities insurance companies and other regulated entities have traditionally been used to
explicitly fund the underlying regulatory programs at the respective agencies The
Commission is one of four Article VIII agencies that is not designated as self-funded
The Commission recommends that the Legislature designate the Commission as a
self-funded agency whereby the collected assessments would be explicitly dedicated to the
funding of the agency Implementing this recommendation would require the Public Utility
Commission to be included in the Appropriations Limited to Revenue Collections rider
located in the Special Provisions Relating to All Regulatory Agencies section of the
General Appropriations Act Designation as a self-leveling agency would require the
Commission to set the gross receipts assessment at a rate sufficient to generate revenue in
the amount of the agencyrsquos general revenue appropriation each fiscal year which would require a statutory change to PURA sect16001(b) Based upon the Commissionrsquos baseline budget request authorizing the PUCrsquos self-leveling designation would result in an overall
estimated tax reduction of $456 million per year or 774
20 Government Code sect 571091 21 Occupations Code sect 162107 22 Occupations Code sect 258157 23 Occupations Code sect 301607 24 Occupations Code sect 1001601 25 Occupations Code sect 2001059 26 Tex Rev Civ Stat Ann Arts 581-28-1 amp 581-35 7 Tex Admin Code 1012
30 | P a g e
2017 SCOPE OF COMPETITION IN ELECTRIC MARKETS IN TEXAS REPORT
V APPENDICES
31 | P a g e
2017 SCOPE OF COMPETITION IN ELECTRIC MARKETS IN TEXAS REPORT
Appendix A ndash Acronyms
AEP American Electric Power
AMS Advanced Metering System
CenterPoint CenterPoint Energy Houston Electric LLC
DG Distributed Generation
DRG Distributed Renewable Generation
ERCOT Electric Reliability Council of Texas
ERSC Entergy Regional State
ERS Emergency Response Service
ETI Entergy Texas Inc
IMM ERCOT Independent Market Monitor
kWh Kilowatt-hour
LMP Locational Marginal Pricing
LSP Large Service Provider
MISO Midwest Independent System Operator
MMBtu One million British Thermal Unit (BTU)
MW Megawatt
MWh Megawatt-hour
Nodal Texas Nodal Market Design
ORDC Operating Reserve Demand Curve
PGC Power Generation Company
POLR Provider of Last Resort
PURA Public Utility Regulatory Act
REP Retail Electric Provider
RSC Regional State Committee
RTO Regional Transmission Organization
SCED Security Constrained Economic Dispatch
Sharyland Sharyland Utilities LP
SBF System Benefit Fund
SPP Southwest Power Pool
TDU Transmission and Distribution Utility
TNMP Texas-New Mexico Power Company
32 | P a g e
2017 SCOPE OF COMPETITION IN ELECTRIC MARKETS IN TEXAS REPORT
Appendix B ndash ERCOT Desalination Report
This page intentionally left blank
33 | P a g e
ERCOT Public
Study on the Demand Response Potential for Seawater Desalination Projects
ERCOT November 18 2016
Study on the Demand Response Potential for Seawater Desalination Projects ERCOT Public
Executive Summary
In 2015 the 84th Texas Legislature enacted House Bill (HB) 4097 which included several provisions relating to seawater desalination projects including a requirement that the Public Utility Commission of Texas (PUC) and Electric Reliability Council of Texas (ERCOT) study the potential for seawater desalination projects to participate in existing demand response opportunities in ERCOT There are several demand response products in which demand-side resources (ie consumers of electricity) can participate These programs help to preserve system reliability and provide economic benefits to participating demand-side resources Seawater desalination is an energy-intensive process that removes salt and other minerals from salt water to produce fresh water for municipal consumption industrial use or irrigation Participation in demand response could help mitigate electricity costs for future seawater desalination projects in Texas and provide reliability benefits to the grid
There are two main demand response reliability-based services administered by ERCOT participation by demand-side resources in the Ancillary Services market and the Emergency Response Service (ERS) Within the Ancillary Services market the most common service provided by demand-side resources is Responsive Reserve Service (RRS) which requires resources to respond either instantaneously or within 10 minutes in response to unplanned system emergencies ERS is separate from ERCOTrsquos Ancillary Services market and allows demand-side resources and distributed generation to provide reliability services in the event of an energy emergency Resources can qualify for either the 10-minute or 30-minute response time ERS programs
There are several key considerations that will impact a demand-side resourcersquos ability to participate in different demand response opportunities response time recovery time predictability of electrical demand and flexibility of operations Considering these factors together it appears that seawater desalination plants could be designed to meet the requirements for participation in demand response Because the ability to meet the qualification requirements is dependent on the plant design demand response opportunities should be considered early in a projectrsquos development if participation is desirable
Whether project developers will choose to address these requirements will depend on the economic benefits of participation There may be additional costs to design seawater desalination plants to operate in the manner required in order to participate in demand response These include costs associated with additional plant design specifications need for excess capacity and storage to make up for lost production during demand response deployment operational costs resulting from interruptions to plant processes and potential financial penalties if demand response deployment results in failure to meet contract demands The interplay of the benefits of participation and these costs will determine whether it would be beneficial for a future seawater desalination plant to participate in demand response in ERCOT
To date participation of seawater desalination plants in demand response programs has been limited Because the process of seawater desalination is energy-intensive participation in demand response could help to reduce electricity costs while posing a relatively low risk to plant operations As stakeholders in Texas continue to plan for possible future droughts in the region and identify water management strategies consideration of demand response could play a role in mitigating some costs associated with seawater desalination and allow seawater desalination plants to assist with maintaining electric reliability in the region
copy 2016 ERCOT All rights reserved i
Study on the Demand Response Potential for Seawater Desalination Projects ERCOT Public
Table of Contents
1 Introduction 1
2 Seawater Desalination 2
21 Seawater Desalination Plant Operations 2
22 Seawater Desalination Plant Economics 3
3 Demand Response Opportunities in ERCOT 4
31 ERCOT-Dispatched Demand Response 4
311 Ancillary Services Markets 5
312 Emergency Response Service (ERS) 5
32 Non-ERCOT-Dispatched Demand Response 6
321 Four Coincident Peak (4CP) 6
322 LSE or DR Provider Contracted Price Response 6
323 Self-Directed Price Response 6
4 Demand Response Potential for Seawater Desalination 7
41 Operational Considerations for ERCOT-Dispatched Demand Response 7
42 Economic Considerations for ERCOT-Dispatched Demand Response 8
43 Considerations for Non-ERCOT-Dispatched Demand Response 9
5 Conclusion 11
copy 2016 ERCOT All rights reserved ii
Study on the Demand Response Potential for Seawater Desalination Projects ERCOT Public
1 Introduction
In 2015 the 84th Texas Legislature enacted House Bill (HB) 4097 which included several provisions relating to seawater desalination projects including a requirement that the Public Utility Commission of Texas (PUC) and Electric Reliability Council of Texas (ERCOT) study the potential for seawater desalination projects to participate in existing demand response opportunities in ERCOT ERCOT and the PUC initiated this study to fulfill that requirement and evaluated the operational and economic characteristics of seawater desalination plants in light of ERCOTrsquos primary demand response products1
ERCOT is the independent system operator (ISO) for the ERCOT Interconnection which encompasses approximately 90 of demand for electricity in Texas ERCOT is the independent organization established by the Texas Legislature to be responsible for the reliable planning and operation of the electric grid for the ERCOT Interconnection ERCOT also administers and maintains a forward-looking open market to provide affordable and reliable electricity to consumers in Texas In collaboration with market participants ERCOT has developed demand response products and services for customers that have the ability to reduce or modify electricity use in response to instructions or signals These programs help preserve system reliability and provide economic benefits to participating demand-side resources
The process of seawater desalination removes salt and other minerals from salt water to produce fresh water for consumption industrial processes or irrigation The drought-prone Texas climate coupled with projections for increasing water demand in the state has created interest in seawater desalination as a future water source The 2017 Texas State Water Plan includes seawater desalination as a future water management strategy for water users in the state However the seawater desalination process is energy intensive and electricity consumption can be a significant cost driver for these projects To the extent that these plants could participate in demand response it would help to defray these costs Thus there is a potential nexus between seawater desalination projects built in Texas to mitigate drought but which have large electricity requirements and ERCOT demand response opportunities which could help to reduce their electricity costs and provide reliability benefits
This study evaluates the demand response potential of seawater desalination plants based on their operational characteristics and economic drivers The report is organized as follows
Section 2 provides background on typical seawater desalination plant operations and economics
Section 3 describes the current demand response opportunities in ERCOT
Section 4 evaluates the characteristics of seawater desalination plants to determine their potential to participate in demand response opportunities in ERCOT and
Section 5 provides a summary of the conclusions of this study
1 In the course of developing this report ERCOT consulted with several desalination experts with experience with existing or planned seawater desalination plants in the US The technical experts consulted included Jorge Arroyo (Water Management Consultant) Andrew Chastain-Howley (Black amp Veatch) Jonathan Loveland (Black amp Veatch) Ron Parker (Black amp Veatch) John Wolfhope (Freese and Nichols) and Srinivas Veerapaneni (Black amp Veatch)
copy 2016 ERCOT All rights reserved 1
Study on the Demand Response Potential for Seawater Desalination Projects ERCOT Public
2 Seawater Desalination
There are two primary methods for seawater desalination distillation (also referred to as ldquothermalrdquo) and reverse osmosis Distillation uses heat to remove salts and minerals from seawater by boiling water at high pressures In contrast reverse osmosis technology forces saline water through a membrane to separate water from the salts and minerals While both distillation and reverse osmosis are energy intensive distillation requires thermal energy to heat the water and overall has a higher energy requirement whereas reverse osmosis requires primarily electrical energy and overall is less energy intensive ndash though still with significant electricity requirements
Globally most thermal desalination plants are located in the Middle East due to low energy prices in the region Plants located elsewhere including in the US typically use reverse osmosis technology2 There are two large existing seawater desalination plants in the US one in Carlsbad California providing water to the San Diego area and one in Gibsonton Florida providing water to the Tampa Bay area Both plants use reverse osmosis technology In addition there are several desalination projects currently in the planning stages or under development in Texas in the Corpus Christi area that would use reverse osmosis technology For that reason this report focuses on reverse osmosis technology in the evaluation of demand response potential of seawater desalination plants
While there are currently no existing seawater desalination plants in Texas there are several municipal and industrial brackish water desalination plants in the state According to the Texas Water Development Board (TWDB) there are 46 municipal brackish water desalination plants with capacities greater than 0025 million gallons per day (MGD) in Texas representing a total of 123 MGD of capacity3 The desalination of brackish water is typically less expensive compared to seawater due to the lower relative salinity of brackish water This study focuses exclusively on seawater desalination consistent with the requirements of HB 4097 but it should be noted that conclusions may also apply to brackish water desalination though at a different cost and scale
This section provides high-level information on the operations (Section 21) and economics (Section 22) of seawater desalination plants to inform the discussion of their demand response potential in Section 4
21 Seawater Desalination Plant Operations Seawater desalination plants typically range in capacity from less than 5 MGD up to 165 MGD For example the Carlsbad seawater desalination plant has a capacity of approximately 50 MGD and the plant in Tampa Bay has a capacity of approximately 25 MGD The associated electricity consumption ranges between 10 and 15 kWh1000 gallons produced depending on the salinity of the water being processed456 More saline water (eg seawater) requires larger amounts of electricity for desalination Thus a seawater desalination plant would have larger electricity consumption requirements compared to a similarly sized brackish water desalination plant
2 American Water ldquoInnovation Solutions within the Water Industry Desalinationrdquo Available at httpwwwamwatercomfilesInnovationsSolutionsWithinTheWaterIndustryDesalinationpdf 3 Texas Water Development Board ldquoDesalination Factsrdquo Available at httpswwwtwdbtexasgovinnovativewaterdesalfactsasp 4 American Membrane Technology Association April 2016 ldquoMembrane Desalination Power Usage Put in Perspectiverdquo Available at httpwwwamtaorgcomwp-contentuploads7_MembraneDesalinationPowerUsagePutInPerspectivepdf 5 Water Reuse Association November 2011 ldquoSeawater Desalination Power Consumptionrdquo Available at httpswatereuseorgwpshycontentuploads201510Power_consumption_white_paperpdf 6 Ghaffour N TM Missimer and G Amy January 2013 ldquoTechnical review and evaluation of the economics of water desalination Current and future challenges for better water supply sustainabilityrdquo Desalination 309 pp197-207 Available at httpswwwresearchgatenetpublication256693140_Technical_review_and_evaluation_of_the_economics_of_water_desalination_ Current_and_future_challenges_for_better_water_supply_sustainability
copy 2016 ERCOT All rights reserved 2
Study on the Demand Response Potential for Seawater Desalination Projects ERCOT Public
While the two existing seawater desalination plants in the US were co-located with power plants to ease compliance with regulations on water intake and discharge structures and reduce costs many other reverse osmosis desalination plants receive their electricity from the grid However plants may have on-site backup generation in case of a power outage This will vary depending on the size and design of the plant and other factors For example the Carlsbad plant in California does have diesel backup generation to power control systems and flushing systems in the case of a power outage The plant in Tampa Bay was not built with backup power due to potential storm surge risks from hurricanes and other storms The plant does use uninterruptible power supply (UPS) backup to power control systems during power outages
Reverse osmosis plants are typically designed with several ldquotrainsrdquo which consists of a high-pressure pump turbine and reverse osmosis membrane Desalination plants are turned on or off one train at a time in a highly controlled process The process of ramping up or down an individual train under normal operations typically takes one to two hours While plants can be designed to handle immediate shutdowns (ie in a power outage) re-starting a system after an interruption would take this amount of time In addition the saline water must be pretreated (ie filtered) before going through the reverse osmosis train and this can sometimes pose constraints on the flexibility of operations
Demand for water is the key factor driving the level of production at seawater desalination plants Typically the plant will have a contract or contracts with municipal or other water users to deliver desalinated water and is operated to meet that demand Alternatively if the plant is municipally owned it would similarly be operated to meet the level of water demand in conjunction with other available water sources If water demands are close to a plantrsquos full capacity the operatorrsquos flexibility to adjust its electricity consumption as part of demand response may be limited However this does mean that plant operations are fairly predictable on a day-to-day basis which is necessary for participation in demand response
The amount of flexibility in plant operations will also be impacted by the amount of water storage available For example if a plant has sufficient water storage on-site or storage within the customerrsquos distribution system it could provide flexibility for the plant to reduce its operations during peak hours when electricity prices are likely to be highest It would also mitigate the impacts of interruptions to production from demand response deployments
22 Seawater Desalination Plant Economics Seawater desalination is typically more expensive than other sources of water and a major driver of the overall cost is energy costs In 2016 the Carlsbad plant charged rates at between $2131 and $2367 per acre-foot78 This charge is intended to cover both the fixed costs of the plant and the variable costs to produce a unit volume of water Typically half to two thirds of the cost of providing desalinated seawater are accounted for by capital cost recovery with the remainder accounted for by operations and maintenance costs including electricity costs Electricity costs can account for 20shy25 of the total costs of seawater desalination with reverse osmosis technology9
Factors affecting the capital cost of a seawater desalination plant include plant size type of desalination process and pre-post-treatment technologies plant infrastructure (eg piping water storage backup power) and compliance with applicable regulations (eg regulations on intake structures brine byproduct disposal) A significant driver of operating and maintenance costs is membrane replacement Reverse osmosis membranes need to be replaced every few years and
7 Source San Diego County Water Authority ldquoSeawater Desalinationrdquo Available at httpwwwsdcwaorgseawater-desalination 8 Note that 1 acre-foot is approximately 325851 gallons 9 Based on technical input from Black amp Veatch
copy 2016 ERCOT All rights reserved 3
Study on the Demand Response Potential for Seawater Desalination Projects ERCOT Public
the rate at which they are replaced will depend on the salinity of the feedwater and how the plant is operated Treatment and disposal of the salty brine byproduct from desalination may also incur operating costs
Electricity costs will vary depending on a range of factors including the size of the plant type of desalination technology source of electricity and quality of the feedwater As previously noted more saline water requires higher amounts of electricity in desalination and thus the amount of electricity consumption is a key difference between brackish water and seawater desalination As a result electricity costs comprise a significant share of the costs of seawater desalination These costs could potentially be defrayed in part by participation in demand response initiatives
3 Demand Response Opportunities in ERCOT
Broadly speaking demand response can be broken down into two major categories dispatchable or non-dispatchable For purposes of this report we will define dispatchable as those demand response events that are initiated by ERCOT and non-dispatchable as an event not specifically initiated by ERCOT These non-dispatchable events may include decisions made by the end-use customer to alter its consumption pattern or may include contractual obligations with another entity such as the end-use customerrsquos retail electric provider (ldquoREPrdquo) to alter consumption patterns
ERCOTrsquos wholesale market is open to several types of dispatchable demand response which are deployed to maintain system reliability Demand-side resources providing Emergency Response Service (ERS) may offer based on either a 10 or 30-minute response time commonly referred to as the ldquoramp periodrdquo Alternatively demand-side resources may register and qualify as a Load Resource that can provide Reserves in the Ancillary Services market The most common service provided by demand-side resources is Responsive Reserve Service which requires an under-frequency relay that can instantaneously interrupt the load during certain system reliability events Some demand-side resources can also participate in other Ancillary Services as Controllable Load Resources that require sophisticated control systems that allow them to be deployed in a more incremental proportional manner
Non-dispatchable demand response in ERCOT can include a response to avoid transmission costs where rates are based on Four Coincident Peak Pricing (4CP) response to wholesale energy prices initiated by the customer or by a REP or other load-serving entity (ldquoLSErdquo) or utility-managed Load Management programs (LM)
The sections that follow provide a description of both ERCOT-dispatched (Section 31) and nonshyERCOT-dispatched (Section 32) demand response For a more detailed description of opportunities for demand-side resources to participate in demand response in ERCOT see ERCOTrsquos guide Load Participation in the ERCOT Nodal Market10
31 ERCOT-Dispatched Demand Response There are two main demand response reliability-based services administered by ERCOT participation by demand-side resources in the Ancillary Services market and participation in ERS These services are dispatched by ERCOT during system emergencies
10 Available at httpwwwercotcomcontentservicesprogramsloadLoad20Participation20in20the20ERCOT20Nodal20Market_302d oc
copy 2016 ERCOT All rights reserved 4
Study on the Demand Response Potential for Seawater Desalination Projects ERCOT Public
Demand-side resources with demand response capability that can meet a set of performance requirements can be qualified to provide Ancillary Services as Load Resources in the Ancillary Services Market The value of having a Load Resource available to reduce load is equal to the value of having a generator available to increase its generation at a generating plant The providers of operating reserves selected to provide Ancillary Services are eligible for capacity payments regardless of whether the Resource is actually deployed (or curtailed in the case of the Load Resource)
ERCOT holds auctions on a daily basis for each of the following Ancillary Services Regulation Up Regulation Down Responsive Reserve and Non-Spinning Reserve11 Table 1 describes the various Load Resource types and their qualification requirements and eligible services
Table 1 Load Resource Types and Ancillary Services
Service Load Resource Type a Qualification Responsive Reserves (le50 of total Reserve requirement)
Non Controllable Under-Frequency Relay and 10-minute ramp to manual dispatch instruction
Responsive Reserves
Controllable Primary Frequency Response and follow 5-minute dispatch instructions
Regulation-Up Regulation-Down
Controllable Primary Frequency Response and respond to Regulation deployments
Non-Spin Reserves Controllable Follow 5-minute dispatch instructions a A Controllable Load Resource is a Load Resource capable of controllably reducing or increasing consumption under dispatch control by ERCOT
Demand-side resources that agree to reduce load when directed by ERCOT and that meet other metering and operational requirements as specified in the ERCOT Protocols may participate in Ancillary Services market auctions As noted in Table 1 the type of Ancillary Service that a Load Resource may provide will depend upon the demand-side resourcersquos response time and metering system as well as other requirements described in the Protocols In the Responsive Reserve and Non-Spin Reserve markets the Load Resource will receive capacity payments regardless of whether or not the load was actually deployed but the load must be available for deployment at any time while providing the service
ERCOT procures ERS to maintain grid reliability during emergency conditions and reduce the likelihood of the need for rotating outages ERS participants may offer to provide demand response with either a 10-minute ramp period requirement (similar to Load Resources providing Responsive Reserve Service) or a 30-minute ramp period requirement ERS Resources do not have the same telemetry and under-frequency relay requirements as Load Resources
11 Regulation Up and Regulation Down service respond to signals from ERCOT every 4 seconds to respond to changes in system frequency full response has to be provided within 5 minutes Responsive reserves must provide their committed capacity either instantaneously in an under-frequency event (eg due to a generator outage) or in energy scarcity conditions within ten minutes following an instruction from ERCOT Non-spinning reserves must provide their committed capacity within 30 minutes based on economic dispatch instructions Non-spinning reserve is used as replacement reserve to replenish other ancillary services and during energy scarcity
copy 2016 ERCOT All rights reserved 5
Study on the Demand Response Potential for Seawater Desalination Projects ERCOT Public
ERS is procured through a request for proposal (RFP) process three times per year for four-month contract terms each of which is further split into smaller time periods based on business cycles and other factors Demand-side resources may choose to submit offers in all time periods or only in those that best fit their unique circumstances and may vary both the price and demand response capacity offers by time period
Payments for ERS are performed up to 80 days after each four month contract term has ended and are subject to downward revision based upon delivered demand response capacity and the demand-side resourcersquos availability during the contract term
32 Non-ERCOT-Dispatched Demand Response The options listed below are not dispatched by ERCOT but they either are controlled directly by a customer or are dispatchable by another entity such as a demand response provider (ldquoDR Providerrdquo) REP or a transmission and distribution utility
Many industrial customers are subject to transmission charges based upon a Four Coincident Peak (4CP) demand The 4CP demand is determined by averaging the consumerrsquos actual demand during the 15-minute settlement interval with the highest ERCOT demand during each of the four summer months (June through September) This measured 4CP demand serves as the basis for the customerrsquos transmission tariff charges for the following year By correctly predicting the ERCOT system peaks during the summer and curtailing load during those intervals a consumer can help reduce the stress imposed on the electric system during peak periods of consumption and reduce its transmission charges for the following calendar year
In the competitive areas of ERCOT consumers can contract with their REP or a DR Provider to have their load respond to the REPrsquos or DR Providerrsquos instructions The contract will usually outline the parameters of this response ndash at what times and frequency demand response events can be called ramp periods sustained response periods compensation etc Because this response is a contractual matter between the REP or DR Provider and the consumer a great deal of variety can be present in these arrangements For example a consumerrsquos response may be voluntary or required compensation could come in the form of reduced energy prices or rebate payments for each curtailment event consumers might be notified up to a day in advance or could have no notification at all (for automated curtailment)
In areas of ERCOT not open to competition interruptible tariffs may be available These tariffs will usually offer a reduced energy price for defined curtailment obligations
REPs may offer dynamic pricing options or consumers within a municipality or cooperative may have their energy prices determined by a published tariff which also may be structured based upon Time-of-Use (TOU) or have a Critical Peak Pricing (CPP) or Peak Time Rebate (PTR) component Self-directed price response refers to consumers making an independent decision to respond to energy prices contained in a governing tariff or in either the ERCOT Day Ahead or Real Time energy markets
TOU offerings will typically have higher energy prices during normal peak periods ndash for example a TOU tariff may charge one price during Monday through Friday from 2 pm through 8 pm and another price during all other times Customers may choose to reduce consumption during these high priced periods Load reduction can be accomplished by load shifting (loads can be shifted by
copy 2016 ERCOT All rights reserved 6
Study on the Demand Response Potential for Seawater Desalination Projects ERCOT Public
rescheduling certain processes or by utilizing thermal storage) ending certain processes that are no longer economic or through energy efficiency measures
Offerings that incorporate CPP usually have prescribed high prices only during certain defined periods ndash for example when load or prices are expected to reach a certain level Response to CPP may be similar to those employed under TOU tariffs especially if CPP is reached frequently More often CPP is infrequent and as such short-term load curtailment may be the more appropriate response to meet economic objectives
4 Demand Response Potential for Seawater Desalination
This section evaluates whether the operational characteristics and economics of seawater desalination plants would enable them to participate in one or more of the various demand response opportunities in the ERCOT Region To date participation of seawater desalination plants in demand response programs has been limited Neither the plant in Carlsbad nor the plant in Tampa Bay participate in demand response programs in California or Florida respectively However as will be described below it appears that these plants can be designed and operated to meet the requirements for participation in demand response and receive economic benefit from participation in these programs
Section 41 describes the operational parameters that must be met for a demand-side resource to provide ERCOT-dispatched demand response and evaluates the ability of seawater desalination plants to meet these criteria Section 42 discusses the tradeoffs between payments for participation in ERCOT-dispatched demand response and potential additional costs posed to seawater desalination plants Finally Section 43 presents other opportunities for seawater desalination plants to reduce their electricity costs outside of ERCOTrsquos reliability-based services that are open to demand response assets
41 Operational Considerations for ERCOT-Dispatched Demand Response There are several key operational parameters that impact a demand-side resourcersquos ability to participate in different demand response services response time recovery time predictability of electrical demand and flexibility of operations This section discusses each of these considerations as they apply to seawater desalination plants
As discussed in Section 31 one of the differentiating factors between ERCOTrsquos demand response products is the amount of time within which a demand-side resource must respond to a deployment instruction to reduce electricity consumption during an event Participation in RRS requires an automatic response within either half a second (ie instantaneous) based on grid frequency or within 10 minutes via a manual instruction ERS requires a response time of either 10 or 30 minutes As noted in Section 21 the typical time to take a reverse osmosis train on- or off-line is 1-2 hours under normal controlled operations To comply with the response time requirements of RRS or ERS a seawater desalination plant would need to be able to reduce its electricity consumption far more quickly than in normal operations This is an element of plant design that would need to be accounted for in the specifications of the project Considerations include the potential need for on-site backup generation including uninterruptible power supply potential impacts to plant infrastructure (eg piping) reverse osmosis membranes and pretreatment systems
The two large US desalination plants provide illustrative counterpoints in this respect The Carlsbad plant was designed to withstand instantaneous power interruptions and has on-site backup generation including uninterruptible power supply to provide the ability to power control systems and flush the membranes in the event of a power loss In contrast the Tampa Bay plant was not
copy 2016 ERCOT All rights reserved 7
Study on the Demand Response Potential for Seawater Desalination Projects ERCOT Public
designed with on-site backup generation and a loss of power would result in a plant shutdown and may require several days to bring the plant back on-line Thus it appears that it is technically possible for a seawater desalination plant to meet the response time requirements for participation in demand response so long as this factor is considered in the design of the facility
The time it takes a desalination train to return to operations after an event is also a consideration Demand-side resources participating in RRS must be able to come back on-line within three hours and those participating in ERS must return within 10 hours Again it appears that it is technically feasible for desalination plants to meet this requirement so long as this requirement is considered in the plant design
An additional consideration is the predictability of a demand-side resourcersquos electricity consumption Participation in the responsive reserves ancillary service market requires bidding in the day-ahead market and thus a demand-side resource must know with great accuracy (within 95) its electrical demand at least a day ahead of time For ERS auctions are held three times a year for four-month contract periods Thus to participate in ERS a resource must know its forecasted electrical demand several months in advance Because seawater desalination plant operations are driven by contracted demand for water it is likely that a plant operator would have a good idea of the plantrsquos electrical demand days or even weeksmonths in advance especially for summer months when demand is likely to be relatively steady An important consideration however is the salinity of the water which drives the electrical requirements and which can be impacted by recent weather events Similarly reductions in demand for water during non-summer months or wet summer days where demand may be reduced could also impact a plantrsquos ability to predict its electricity demand
Finally a seawater desalination plant must have sufficient flexibility in its day-to-day operations so that it can afford to lose several hours of production when deployed for demand response It should be noted that demand-side resources participating in RRS and ERS are called infrequently demand-side resources providing responsive reserves were deployed one time in 2015 and ERS was not deployed that year However this is an important factor to consider if a plant is operating at close to full capacity and would incur financial penalties if it fails to meet its contract obligations due to a demand response event Including additional storage and building a plant with extra capacity could help to mitigate this risk It should also be noted that a plant operator does not need to commit the full plant capacity to these services but rather can specify an amount of MW that will be committed Thus a plant operator could mitigate issues both with predictability and flexibility of plant operations by committing only a portion of its predicted electrical demand to participate in demand response
Considering these factors together it appears that seawater desalination plants could be designed to meet the operational requirements for participation in ERCOTrsquos demand response services (both RRS and ERS) Because the ability to meet the requirements is dependent on the plant design demand response would need to be considered early in a projectrsquos development if participation is desirable Whether project developers will choose to address these requirements will depend on the economic benefits of participation in demand response which will be discussed in the next section
42 Economic Considerations for ERCOT-Dispatched Demand Response This section describes the economic benefits to demand-side resources from participation in ERCOT-dispatched demand response programs The average price paid for a demand-side resource participating in RRS in 2015 was $1087 per MW per hour and for ERS was $645 per MW per hour for the contract periods during the 2015 program year These payments could provide a significant financial benefit to seawater desalination plants To give a simplified example for a plant with an electrical demand of 10 MW operating at a 100 annual load factor (10 MW times 24 hours times 365 days) the annual benefit would be on the order of $500000 for ERS or $1 million for RRS
copy 2016 ERCOT All rights reserved 8
Study on the Demand Response Potential for Seawater Desalination Projects ERCOT Public
In 2015 demand-side resources providing responsive reserves were deployed one time for a duration of 10 minutes and ERS was not deployed12 The most ERS was ever deployed in a single year was two times in 2011 Thus participation in either program could result in a substantial payment to a seawater desalination plant with a relatively low risk of deployment and associated disruption of plant operations although it is important to note that participation in either ERCOT service subjects demand response resources to annual unannounced testing Other than testing the frequency of deployment will depend on grid conditions and is a risk that should be considered
The financial benefits of participation must be weighed against the costs of designing facilities with the capabilities to operate in this manner These include
bull The costs to design the plant to reduce electrical demand within the required timeframes for demand response and to withstand an instantaneous interruption if not already part of the plant design For example a plant may need to be designed to have backup power generation on-site In addition there could also be costs to restart the system after an interruption
bull The costs to build a plant with excess capacity andor storage to make up for lost production hours when demand response is deployed This will add to the total capital costs of the project Land area constraints should also be considered when considering additional storage as the space requirements for the necessary storage capacity could be significant
bull Costs associated with the impact of interruptions on plant processes (eg more frequent replacement of membranes impacts to pretreatment system or plant infrastructure)
bull Potential financial penalties that would be incurred if deployment as part of demand response were to result in failure to meet contract obligations to supply water
bull The loss of potential benefits in the form of cost avoidance from participation in non-ERCOTshydispatched demand response opportunities (see Section 43) If a plant is committed to RRS or ERS the plant operator would lose the flexibility to take advantage of these other opportunities to reduce their electricity costs
The interplay of these benefits and costs will determine whether it would be beneficial for a future seawater desalination plant to participate in demand response in ERCOT
43 Considerations for Non-ERCOT-Dispatched Demand Response Outside of the reliability-based services administered by ERCOT there are other opportunities for seawater desalination plants to reduce their electricity costs As described in Section 321 seawater desalination plants may be able to reduce the demand charges on their electricity bills through curtailing load during 4CP intervals In addition plant operators may adjust operations in response to real-time electricity prices to take advantage of lower off-peak prices and avoid price spikes (see Sections 322 and 323) All of these opportunities require that the plant have flexibility to reduce production during certain times of the day
In the ERCOT region as noted above a portion of transmission and distribution charges are set based on the peak systemwide 15-minute interval of the four summer months (June through September) referred to as the four coincident peaks (4CP) Large customers can reduce or avoid this charge by reducing electrical consumption during these four peak intervals AEP Central Texas and CenterPoint are the transmission providers covering the majority of the Gulf Coast in Texas13
12 ERCOT June 2016 ldquoLoad Resource Deployment Updaterdquo Available at httpwwwercotcomcontentwcmkey_documents_lists870985_RRS_Load_Resource_Deployment_Updatepdf 13 It is also possible that a seawater desalination plant could be located in an area that as not opted in to competition in which case the plant owner would need to negotiate its electricity charges bilaterally with the Non Opt-In Entity (NOIE)
copy 2016 ERCOT All rights reserved 9
Study on the Demand Response Potential for Seawater Desalination Projects ERCOT Public
Assuming a future seawater desalination plant would be connected at transmission-level voltages the relevant 4CP charges based on the 2016 tariffs accounting for both transmission charges and transmission cost recovery factors would be $41425 per 4CP kW for AEP Central Texas and $41870 per 4CP kVA for CenterPoint14 If a seawater desalination plant has 10 MW of load and is capable of interrupting all of it and successfully does so for all four 4CP intervals the savings based on the 2016 tariffs would be approximately $500000 per year ($41425 times 1000 (kW to MW) times 10 MW times 12 months) Thus a seawater desalination plant that reduces its electricity use during the 4CP intervals could avert some or all of these charges
Another opportunity for seawater desalination plants to reduce their electricity costs is through adjusting operations in response to real-time electricity prices In 2015 the average electricity price in ERCOT was $2677MWh However prices exceeded $50MWh in 254 hours (3 of all hours) $100MWh in 88 hours (1) $200MWh in 40 hours (05) and $300MWh in 21 hours (02) Prices exceeded $3000MWh for 021 hours15 Depending on the desalination plantrsquos exposure to real-time wholesale market prices (via its retail contract) the degree of high prices the plant owner is willing to avoid and grid conditions in a given year reducing unit operations in order to avoid high electricity prices could impact operators for anywhere between a few and several hundred hours out of the year In addition a plant can plan its operations to take advantage of lower electricity prices during off-peak periods (eg at night when generation from wind is high) For example at least one company is marketing a modular desalination unit design intended to take advantage of low prices during periods of high renewables generation and to provide grid reliability services through demand response16
There are several factors to consider regarding these opportunities to reduce electricity costs The plant would need to monitor the ERCOT market or hire a contractor to do so in order to know when to reduce demand for electricity These programs do not impose any requirements on response time as with RRS or ERS and there may be sufficient warning of 4CP intervals or peak pricing to allow the plant operator to plan its operations earlier in the day with sufficient time to ramp down production under controlled conditions However quicker ramping capability may be desirable to respond to electricity price fluctuations
For 4CP because the four intervals used to set demand charges are not known ahead of time it is likely that the plant would need to reduce its demand multiple times per summer to ensure the 4CP intervals are hit impacting production at the facility Timing operations to coincide with off-peak pricing or to avoid price spikes would similarly result in reduced operations during certain hours To offset the lost production hours the plant may need to be designed with extra capacity and water storage capability to maintain the ability to meet its contractual obligations for freshwater delivery Because the period of reduced operations is greater than with ERCOT-dispatched demand response services this need would be greater for a seawater desalination plant reducing load during 4CP intervals or in response to real-time electricity prices and would increase the capital costs of the project It should also be noted that high prices in the ERCOT Region typically but not always occur in summer months when drought conditions are more likely to develop and demand for desalinated water is likely to be highest This may limit the flexibility of the plant to time its electricity consumption to avoid high-priced hours
14 Public Utility Commission of Texas ldquoTransmission and Distribution Rates for Investor Owned Utilitiesrdquo Available at httpwwwpuctexasgovindustryelectricratestdraspx 15 Potomac Economics June 2016 2015 State of the Market Report for the ERCOT Wholesale Electricity Markets Available at httpswwwpotomaceconomicscomindexphpmarkets_monitoredERCOT 16 Sisyan LLC ldquoDemand Response Desalinationrdquo Available at httprenewabledesalinationcomwpshycontentuploads201506Demand-Response-Desalinationpdf
copy 2016 ERCOT All rights reserved 10
Study on the Demand Response Potential for Seawater Desalination Projects ERCOT Public
In addition the plantrsquos ability to participate in demand response would also be limited for those hours it is reducing load as part of 4CP response or in response to real-time prices because the plant would not be able to reduce its electricity consumption if that demand is already committed to another demand response service Thus participating in demand response versus taking advantage of these other opportunities may be to some extent mutually exclusive
5 Conclusion
Based on this analysis it appears that the operational characteristics of seawater desalination plants would allow them to participate in demand response opportunities in ERCOT so long as the necessary operational requirements are considered in the design specifications of the plant Project developers should consider the necessary requirements early in the plant design Whether the economic benefits of participation would provide a sufficient incentive for them to do so will depend on the costs of accommodating those operational requirements and whether there is the flexibility available to operate the plant as necessary under these programs Though most existing seawater desalination plants do not participate in demand response programs it does appear that participation by these plants is possible and could result in a financial benefit Table 2 compares the different demand response opportunities available to demand-side resources in ERCOT
Table 2 Comparison of Demand Response Opportunities Demand Response
Opportunity Requirements for
Participation Impacts to Plant
Operations Financial Benefit Ancillary Services ndash Responsive Reserve Service (RRS)
bull Under-Frequency Relay bull Instantaneous or 10 minute
response time bull Recover load within 3
hours bull Bid in day-ahead market
bull Deployed once in 2015 for 10 minutes bull Subject to annual
unannounced testing
bull $1087 per MW per hour (based on 2015 prices)
Emergency Response Service (ERS)
bull 10 or 30 minute response time bull Recover load within 10
hours bull Four-month contract term
bull Not deployed in 2015 the most times ever deployed in a single year was twice in 2011 bull Subject to annual
unannounced testing
bull $645 per MW per hour (based on 2015 prices)
Four Coincident bull Interval Data Recorder bull Likely plant will need to bull Avoid ~$48000 per 4CP Peak (4CP) (IDR) meter
bull Ability to predict system-wide peak demand hours during summer months
reduce load multiple times per summer to hit 4CP intervals bull Likely to be able to predict
possible 4CP intervals earlier in day
MW per year (based on 2016 tariffs) if successful in reducing during all four summer months
LSE or DR Provider Contracted Price Response
bull Varies based on contractual arrangements
bull Varies based on contractual arrangements
bull Varies based on contractual arrangements
Self-Directed Price bull Retail contract with bull Varies depending on bull Varies depending on Response exposure to real-time
market prices bull Ability to monitor real-time
prices in ERCOT wholesale market
number and severity of pricing events bull May be able to predict
peak pricing events earlier in day
number and severity of pricing events
copy 2016 ERCOT All rights reserved 11
Study on the Demand Response Potential for Seawater Desalination Projects ERCOT Public
Demand response programs in ERCOT provide opportunities for demand-side resources to defray their electricity costs and provide reliability benefits to the ERCOT electric grid Because the process of seawater desalination is energy intensive participation in demand response could help to reduce electricity costs while posing a relatively low risk to plant operations if demand response participation is factored into plant design
Participation in non-ERCOT-dispatched demand response opportunities such as reducing load during 4CP intervals or in response to real-time electricity prices may also help to reduce electricity costs for seawater desalination plants in Texas As stakeholders in Texas continue to plan for possible future droughts in the region and identify water management strategies consideration of demand response could play a role in mitigating some costs associated with seawater desalination and allow seawater desalination plants to assist with maintaining electric reliability in the region
copy 2016 ERCOT All rights reserved 12
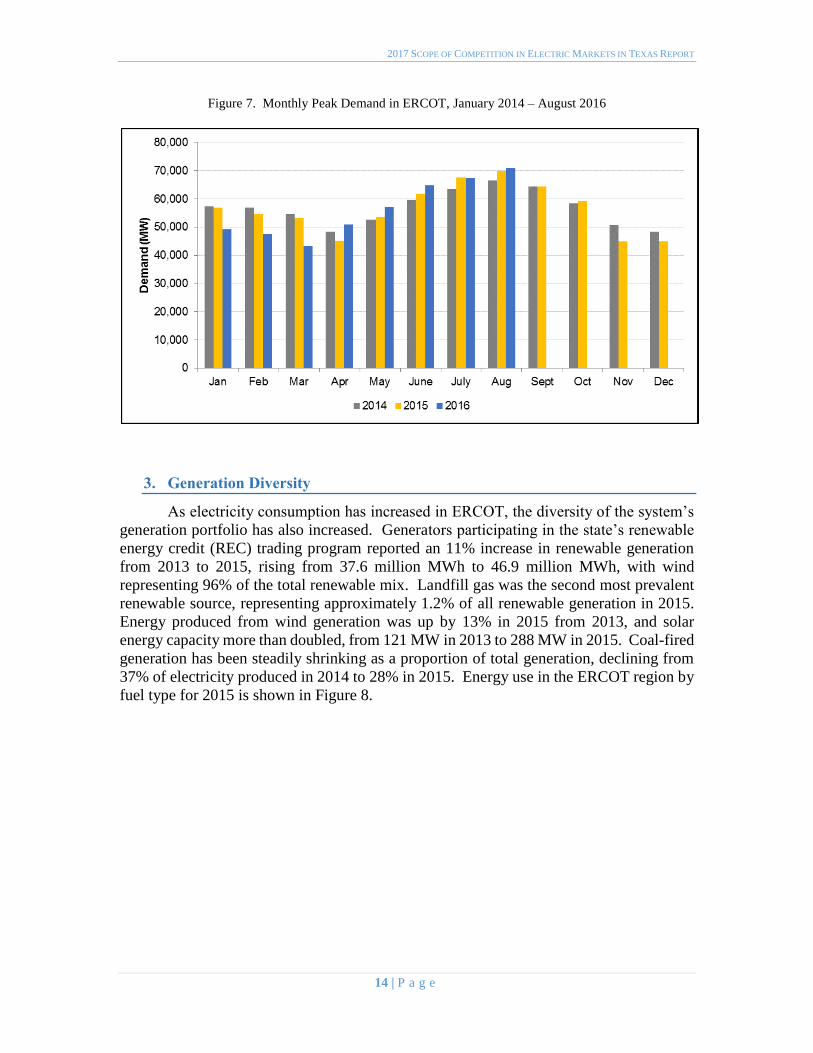
2017 SCOPE OF COMPETITION IN ELECTRIC MARKETS IN TEXAS REPORT
Figure 7 Monthly Peak Demand in ERCOT January 2014 ndash August 2016
3 Generation Diversity
As electricity consumption has increased in ERCOT the diversity of the systemrsquos generation portfolio has also increased Generators participating in the statersquos renewable energy credit (REC) trading program reported an 11 increase in renewable generation
from 2013 to 2015 rising from 376 million MWh to 469 million MWh with wind
representing 96 of the total renewable mix Landfill gas was the second most prevalent
renewable source representing approximately 12 of all renewable generation in 2015
Energy produced from wind generation was up by 13 in 2015 from 2013 and solar
energy capacity more than doubled from 121 MW in 2013 to 288 MW in 2015 Coal-fired
generation has been steadily shrinking as a proportion of total generation declining from
37 of electricity produced in 2014 to 28 in 2015 Energy use in the ERCOT region by
fuel type for 2015 is shown in Figure 8
14 | P a g e
2017 SCOPE OF COMPETITION IN ELECTRIC MARKETS IN TEXAS REPORT
Figure 8 Energy Use in ERCOT by Resource Type 2015
The Commissionrsquos projects are further described in the following section of this report
15 | P a g e
2017 SCOPE OF COMPETITION IN ELECTRIC MARKETS IN TEXAS REPORT
III SUMMARY OF COMMISSION ACTIVITIES FROM 2015 TO 2016
Introduction
The Commission develops and modifies rules policies and procedures for the
competitive electric market in Texas in response to the technological advances in the
industry and the evolving needs of customers The Commission also continues to carry
out oversight of programs with which the Legislature has tasked it ndash such as energy
efficiency renewable energy and advanced metering infrastructure Within the
ERCOT region the monopoly wires-and-poles companies that provide transmission
and distribution services throughout the grid remain subject to traditional rate
regulation by the Commission The Commission continues to set rates for these
utilities as they are not subject to the forces of market competition This section
provides an overview of the Commissionrsquos activities in its oversight of the wholesale and retail electric markets as well as its governance over regulated electric utilities
Resource Adequacy
Resource adequacy is the long-term ability of the system to serve demand reliably
when consumption is highest given the available installed capacity load resources and
the operational reliability of the system Assessing resource adequacy requires comparing
the systemrsquos forecast installed capacity and load resources against the forecast peak
summer load The difference between the forecast of available generation and load
resources and the forecasted demand for electricity is referred to as an ldquoinstalled capacity
reserve marginrdquo which is an indicator of the ability of the system to meet customer demand
during peak conditions In addition to evaluating the forecast reserve margin assessing
resource adequacy includes evaluating the systemrsquos operational reliability The systemrsquos operational reliability depends on the ability of generators to manage plant operations
successfully as well as the grid operatorrsquos ability to manage the system to avoid or to mitigate load curtailment During 2015 and 2016 the ERCOT system performed well with
respect to resource adequacy The Commission has devoted significant attention to
ensuring that ERCOT maintains an adequate installed capacity reserve margin and a high
level of operational reliability developing a wholesale market design that allows
consumers to continue to receive low-cost and reliable electricity over the long term
1 Capacity Demand and Reserves Report
The Capacity Demand and Reserves (CDR) Report published by ERCOT semi-
annually is a snapshot estimate of long-term supply and demand and the associated annual
reserve margin for peak summer and winter conditions While the CDR Report is not a
forecast of any particular outcome it provides insight into possible resource adequacy
trends
16 | P a g e
2017 SCOPE OF COMPETITION IN ELECTRIC MARKETS IN TEXAS REPORT
The May 2016 CDR Report shows estimated reserve margins well above the
current target reserve margin of 1375 Installed capacity reserve margin estimates taken
from this CDR Report are shown below in Table 7
Table 7 May 2016 Capacity Demand and Reserves Report Forecast
Forecast 2017 2018 2019 2020 2021 2022 2023 2024 2025 2026
Peak Load
(MW)
68548 69409 70795 71420 72098 72792 73482 74168 74864 75704
Total
Capacity
(MW)
80995 87019 87238 87407 87678 87738 87738 87728 87728 87728
Reserve
Margin
182 254 232 224 216 205 194 183 172 159
2 Operating Reserve Demand Curve
In ERCOT the price signals produced by the energy-only wholesale electric market
should provide incentives to promote short-term reliability as well as induce optimal long-
run investment in new resources If the prices are efficient and reflect the full cost of
dispatching resources to meet demand the benefits that accrue to both consumers and
producers can be maximized at the least cost and new generating capacity (or load
resources) should develop to maintain the equilibrium as old resources retire or demand
increases
The Operating Reserve Demand Curve (ORDC) implemented at the Commissionrsquos direction in June 2014 improves price formation by allowing prices to more fully reflect
the value of operating reserves The ORDC assigns an economic value to operating
reserves or the amount of extra capacity available to maintain system reliability on a daily
basis
As part of its ongoing review of resource adequacy in ERCOT the Commission is
currently evaluating the accuracy of the inputs to the ORDC to ensure that its contribution
to price formation appropriately reflects the costs of meeting demand and the underlying
needs of the system
3 Transmission Congestion
Although competitive power producers and regulated transmission providers form
two distinct segments of the market transmission buildout has a direct effect on wholesale
power prices When there is insufficient transmission capacity to dispatch energy in a least-
cost fashion the system operator takes action to ensure that the physical limits of the
transmission system facilities are not violated The re-dispatch of generation because of
transmission limits results in disparate prices at different locations on the system In
comparison to prior years transmission congestion in ERCOT has lessened because of the
large increase in transmission investment and the reduction of high demand related to oil
and gas production in West Texas ERCOT and the Commission continually evaluate the
need for cost-effective additional transmission investment to manage congestion
17 | P a g e
2017 SCOPE OF COMPETITION IN ELECTRIC MARKETS IN TEXAS REPORT
4 Wholesale Market Design Initiatives
While the ERCOT wholesale market has been successful in attracting new resource
investment and also maintaining competitive prices for consumers certain improvements
to the market design could yield additional benefits in terms of efficient price formation
and opportunities for entry of new technology Initiatives already in place in many other
regions such as real-time co-optimization and multi-interval real-time resource dispatch
may allow existing capacity to be used more effectively and create opportunities for the
integration of additional load resources to serve electric demand The Commission
continues to work with ERCOT and interested stakeholders to determine the value of
implementing such enhancements particularly as ERCOTrsquos resource mix changes over time
5 Reliability Standard
In early 2014 the Commission opened a project to review its use of a target installed
capacity reserve margin based on a reliability standard equivalent to one loss-of-load event
every ten years In this project the Commission received written comment from interested
parties conducted a public workshop consulted with independent experts and reviewed
the application of reliability standards in other regions As a result of this review future
reliability metrics to be estimated in ERCOT will include the market equilibrium reserve
margin the economically-optimal reserve margin and the associated levels of expected
unserved energy The Commission believes that publishing these metrics represents an
improvement over reporting a one-event-in-ten-years standard by enhancing insight into
expected outcomes in ERCOTrsquos energy-only market
Non-ERCOT Utilities Market Development Activities
SB 7 the law that introduced retail competition to the Texas market in 1999
granted the Commission authority to delay retail competition in an area where deregulation
would not result in fair competition and reliable service because of the lack of an
independent organization to coordinate the electric system and the concentration of
ownership in the generation sector in some of those areas Consequently SB 7 included
provisions recognizing the difficulty of implementing retail competition in areas outside of
ERCOT Therefore the utilities outside of the ERCOT region remain vertically integrated
owning generation transmission and distribution assets as well as selling power to end-
use customers These vertically integrated utilities remain subject to traditional regulation
including rates set by the Commission and customer choice is not offered in the service
territories of these utilities
The Commission does continue to monitor ongoing activities in the non-ERCOT
portions of the state In 2015 the Legislature granted the Commission the authority to
retain counsel and consulting experts in order to participate in legal proceedings at the
Federal Energy Regulatory Commission (FERC) which has regulatory jurisdiction over
wholesale power sales and transmission rates outside of ERCOT This authority has
18 | P a g e
2017 SCOPE OF COMPETITION IN ELECTRIC MARKETS IN TEXAS REPORT
permitted the Commission to participate more effectively in FERC proceedings affecting
Texasrsquo utilities located outside of ERCOT
1 Southwest Power Pool
The Southwest Power Pool (SPP) is the Regional Transmission Operator (RTO) for
areas of Northeast Texas and the Texas Panhandle In Texas the utilities Southwestern
Electric Power Company (SWEPCO) Southwestern Public Service (SPS) and several
electric cooperatives and municipally owned utilities are in SPP In addition to these areas
of Texas the SPP footprint includes parts of New Mexico Arkansas Missouri Nebraska
Louisiana and all of Kansas and Oklahoma In 2015 SPP became the RTO for the
Integrated System and neighboring areas which includes parts of Iowa Minnesota North
Dakota South Dakota Wyoming and Montana SPP has spent extensive time and
resources over the last two years to integrate these new areas successfully The expansion
added 5000 MW of peak demand 7600 MW of generating capacity and 9500 miles of
transmission lines17
In 2014 SPP launched its new Integrated Marketplace which provides a Day-
Ahead Market a Real-Time Balancing Market and Congestion Hedging Markets
mechanisms similar to those available in ERCOT The implementation of the Integrated
Marketplace resulted in a savings of $422 million in 2015 As a result of the Integrated
Marketplace SPPrsquos planning reserve margin will be reduced from 136 to 12 a change
expected to save about $90 million annually
Chairman Donna L Nelson represents the Commission as a voting member on
SPPrsquos Regional State Committee (RSC) The RSC provides collective state regulatory
agency input on a variety of issues In addition the RSC has authority over the cost
allocation methodologies for transmission upgrades allocation of Financial Transmission
Rights and the approach used for resource adequacy across the SPP region The RSC
regularly meets on a quarterly basis and meets more frequently if necessary
2 Midcontinent Independent System Operator
The Midcontinent Independent System Operator (MISO) is an RTO that serves all
or part of 15 states in the central US one Canadian province and the portion of eastern
Texas served by the vertically integrated utility Entergy Texas Inc MISO provides a Day
Two market which has a variety of functions and services including energy and ancillary
service markets economic dispatch congestion management financial transmission rights
and transmission planning The MISO Independent Market Monitor concluded that the
MISO wholesale markets were competitive in 2015
Like SPP MISO is in the Eastern Interconnection which crosses state boundaries
and is therefore subject to FERC jurisdiction A number of recent FERC proceedings have
17 2015 Southwest Power Pool Annual Report Available at
httpswwwspporgdocuments37800201520southwest20power20pool20annual20reportpdf
19 | P a g e
2017 SCOPE OF COMPETITION IN ELECTRIC MARKETS IN TEXAS REPORT
affected the portion of Texas that is in the MISO footprint The Commission through
outside counsel has been an active party in such FERC proceedings FERC Docket No
ER14-1174 addressed in part a dispute regarding the availability of transmission capacity
under the Joint Operating Agreement between MISO and the SPP Ultimately FERC
approved a settlement agreement under which MISO will compensate SPP and its members
for using their or other entitiesrsquo transmission systems
In a related pending docket at FERC Docket No ER14-1736 parties are addressing
how the cost of these payments will be allocated among MISO market participants Parties
in this proceeding are engaged in settlement discussions In addition in Docket No ER14-
75-000 FERC approved a settlement agreement among the participating Entergy
Operating Companies and their retail regulators to terminate the Entergy System
Agreement effective August 31 2016 The settlement terms prohibit any post-termination
payments that roughly equalize production costs among the operating companies after
December 31 2015 terminate certain specific cross-purchase power agreements between
Entergy Texas and former Entergy Gulf State Louisiana and permit the continuation of
several other purchase power agreements
Commissioner Kenneth W Anderson Jr represents the Commission as a voting
member in the Organization of MISO States (OMS) the purpose of which is to coordinate
regulatory oversight among the states in the MISO region and to make recommendations
to MISO FERC and other entities Commissioner Anderson also represents the
Commission as a voting member of the Entergy Regional State Committee (ERSC) which
has certain FERC-approved authority for five years after the Entergy integration with
regard to cost allocation for Entergy transmission projects and adding transmission projects
to the Entergy construction plan The ERSC meets quarterly
3 Western Electricity Coordinating Council
The Western Electricity Coordinating Council (WECC) is a Regional Entity whose
region includes the area surrounding El Paso and extends from Canada to Mexico
including the provinces of Alberta and British Columbia the northern portion of Baja
California and all or portions of the 14 Western states in between WECC is the Regional
Entity responsible for Bulk Electric System reliability in the Western Interconnection and
associated compliance monitoring and enforcement WECC does not have organized
markets outside of California but is organized into 38 separate balancing authorities
WECC is geographically the largest and most diverse of the eight Regional Entities in the
United States with delegated authority from the North American Electric Reliability
Corporation (NERC) and the Federal Energy Regulatory Commission In Texas El Paso
Electric Company is a member of WECC
Rulemaking Activities
The Commission has continued to adopt new rules and modify existing rules in
order to further the continued successful operation of the competitive retail and wholesale
markets and to comply with statutory changes made to PURA by the Legislature This
20 | P a g e
2017 SCOPE OF COMPETITION IN ELECTRIC MARKETS IN TEXAS REPORT
section of the Report provides a high-level overview of the Commissionrsquos key rulemaking
activities highlighting the market improvements made in 2015 and 2016
1 Cost Recovery and Rate Adjustment
The Commission adopted new rule 16 TAC sect25246 on June 29 2016 to
implement Section Nos 1 through 3 of House Bill 1535 of the 84th Legislature The new
rule only applies to a utility that operates solely outside of ERCOT and allows for the use
of an update period beyond the test year for which the utility initially files estimated
information The rule clarifies that all information originally estimated must be updated
with actual information and also provides requirements for a post-test-year adjustment for
a natural gas-fired plant A non-ERCOT utility also is required to initiate a new base rate
case on or before the four year anniversary of the final order in the utilityrsquos most recent comprehensive base rate case or if the commission determines that the utility has
materially earned more than its authorized rate of return in two consecutive years The rule
also provides requirements and procedures for the relation back of final rates to an effective
date 155 days after the filing of the rate application
2 Changes to Certificates of Convenience and Necessity and CREZ Rule
The Commission conducted a rulemaking to implement changes pursuant to
Legislative mandates in SB 776 SB 933 and HB 1535 of the 84th Legislature SB 776
required municipally owned utilities to apply for a certificate of convenience and necessity
(CCN) before constructing transmission facilities outside the boundaries of the
municipality that owns the municipally owned utility SB 933 also requires persons to
obtain a CCN before interconnecting a tie line into the ERCOT grid HB 1535 requires the
Commission to issue a final order within 181 days for a non-ERCOT utility requesting a
CCN for an existing electric generating facility and 366 days after a non-ERCOT utility
files a CCN for a newly constructed generating facility In addition the Commission also
determined in this rulemaking that all future transmission projects in a Competitive
Renewable Energy Zone (CREZ) must meet the need criteria of PURA sectsect 37056(c)(1)
and (2) rather than being exempt Finally the Commission determined that the CREZ
project established in 2008 was complete following the installation of a second circuit on
a Sharyland line
3 Use of Handheld Device for Enrollment
As the market evolves the Commission evaluates market changes balancing its
desire to encourage customer-focused innovation with its concern for customer protection
against potential abuses In Docket No 44518 the Commission granted a REP a
temporary 12-month waiver from its rules requiring the marketer to obtain telephonic
verification of the customerrsquos desire to switch REPs as well as a waiver from certain authorization disclosure requirements among other stipulations the Commission placed
upon the REP The Commission then opened Project No 45625 to study the issue of REPs
utilizing hand-held devices for customer enrollment more broadly and engage with market
representatives consumer representatives and other stakeholders The Commission
anticipates considering an amendment to its rules in the spring of 2017
21 | P a g e
2017 SCOPE OF COMPETITION IN ELECTRIC MARKETS IN TEXAS REPORT
4 Smart Meter Texas Portal
The electric utilities in Texas that have advanced metering systems (AMS) jointly
own and operate a single web portal known as Smart Meter Texas (SMT)18 SMT fulfills
two requirements imposed by the Commissionrsquos advanced metering rule on a utility with
AMS (1) provide to the retail customer the REP serving the customer and other entities
authorized by the customer access to such retail customerrsquos consumption data and (2)
allow devices at the customerrsquos premises to communicate through a home area network with the advanced meter at the premises SMT also facilitates near real-time on-demand
reads of a customerrsquos meter that aids prepaid service offered by certain REPs
In Project No 42786 Review of Advanced Metering System Web Portal
Commission staff and stakeholders examined options for the long-term operational
structure governance and funding of SMT The Commission determined that ownership
of SMT should remain with the TDUs because they can operate the portal at a lower cost
than transferring the data repository to ERCOT The Commission opened two
rulemakings one to ascertain the appropriate governance performance and funding of
SMT and a second to determine the appropriate access for third parties ensuring that
customers have the freedom to grant and give third parties access to their data if made
knowingly while also securing customer privacy
Sharyland Utilities
In early 2015 customers of Sharyland Utilities the smallest investor-owned
transmission and distribution utility in ERCOT began to file with the Commission a
significant number of complaints regarding high electricity bills In response the
Commission opened Project No 44592 Relating to a Project Regarding Sharyland
Utilities to provide for a more formal process for Commission review of the large number
of complaints As part of this project Commission staff prepared a report to evaluate the
electricity rates and electric bills in the operating area of Sharyland Utilities that was
previously part of Cap Rock Energy
Staffrsquos report found that a number of factors contributed to the comparatively high
bills for many of Sharyland-Cap Rockrsquos customers First Sharylandrsquos small size and its low customer density result in high TDU rates for all customers relative to other TDUs In
particular Staffrsquos report found that Sharyland-Cap Rockrsquos rates for distribution service are
up to three times higher than those of other TDUs in Texas In addition to Sharyland-Cap
Rockrsquos high costs for distribution service higher wholesale transmission costs also
contributed to the rate increases charged to Sharyland-Cap Rockrsquos customers These transmission costs are the result of increased transmission investment in recent years
throughout Texas that has increased transmission costs for all distribution providers
18 The participating Texas TDUs are AEP Texas Central Company and AEP Texas North Company (jointly
ldquoAEPrdquo) CenterPoint Energy Houston Electric LLC (ldquoCenterPointrdquo) Oncor Electric Delivery Company LLC (ldquoOncorrdquo) and Texas-New Mexico Power Company (TNMP) collectively referred to as the ldquoJoint TDUsrdquo Operation of an AMS web portal was addressed in the orders approving particular utilitiesrsquo deployment of AMS and approving surcharges for AMS cost recovery While Sharyland Utilities filed comments in the proceeding it did not
participate as it had not fully completed its AMS deployment at the time
22 | P a g e
2017 SCOPE OF COMPETITION IN ELECTRIC MARKETS IN TEXAS REPORT
including Sharyland Utilities Second the comparatively colder winter of 2014 ndash 2015
which was the time period generally consistent with the timeframe in which the
Commission began receiving complaints appeared to result in higher electricity usage than
normal This combination of high TDU rates and the higher electricity usage led to higher
bills for customers
Staffrsquos report also noted that in Sharyland-Cap Rockrsquos last rate case in 2014 the
approved rates reflected movement towards more cost-based rates for all customers
including some customers that previously had been heavily subsidized by other customers
Additionally in the process of standardizing Sharyland-Cap Rockrsquos customer classification
with the classifications of the other TDUs in Texas some customers may have experienced
a move from one class that previously was paying below-cost rates to another class that
was now paying above-cost rates For some of these customers the combined effects of
the movement towards cost-based rates and the change to a different class may have
contributed to a significant change in the customersrsquo rates Regardless of any cost-shifting
between customer classes Sharylandrsquos rates remain two to three times higher than those of other TDUs in Texas for all customers in all classes
On December 4 2015 the Commission signed an order directing Sharyland to file
an application for a comprehensive rate review by April 30 2016 Sharyland filed its rate
application on April 29 2016 in Docket No 45414 Review of the Rates of Sharyland
Utilities LP On October 10 2016 the Commission ordered Sharyland to file an amended
application as soon as practicable but no later than January 1 2017 to reflect the unique
aspects of the companyrsquos organizational structure as a real estate investment trust (REIT) At the time of publication Sharyland is expected to file its amended application in
December 2016
PowerToChoose Website
As part of its ongoing evaluation of the competitive market the Commission
opened Project No 45730 to evaluate the functionality and usability of its PowerToChoose
website which allows customers to select a REP and an electric plan based on their zip
code In the process the Commission received significant feedback from customers stating
that the Commissionrsquos PowerToChoose website was an important tool that plays a
fundamental role in their shopping process In response to the feedback received from
industry representatives and consumers Commission staff changed how the website sorts
and filters retail electric plans adding a filter to allow customers to unselect plans that
contain minimum usage fees or credits This filter is now a default setting and plans with
minimum usage fees and credits are not shown unless the customer actively selects to
search for such plans In addition Commission staff made other changes to increase the
clarity of the REP complaint rating The Commission continues to evaluate other changes
to improve the customer experience of the PowerToChoose website and provide
transparency for retail electric plans
23 | P a g e
2017 SCOPE OF COMPETITION IN ELECTRIC MARKETS IN TEXAS REPORT
Report on Alternative Ratemaking Mechanisms
In 2015 the Legislature enacted SB 774 which requires the Commission or its
consultant to conduct a study and make a report to the Legislature analyzing the alternative
ratemaking mechanisms adopted by other states In addition SB 774 extended the
authorization for the Periodic Rate Adjustment (PRA) mechanism from 2017 to 2019
which the Legislature had authorized in 2011 (SB 1693) as a version of an alternative
ratemaking mechanism that provides to utilities a means for expedited recovery of
distribution infrastructure costs Pursuant to SB 774 the Commission retained a consultant
to produce the report and the consultantrsquos recommendations included streamlining the ratemaking process to reduce procedural costs providing for a periodic review of the
prudency of the costs and using certain types of alternative ratemaking mechanisms that
decouple the recovery of costs from variations in load The Commission held a public
hearing to receive comments on the report from stakeholders and after consideration of
those comments has provided to the Legislature the consultantrsquos report together with its
own discussion of the report
Request for Purchase of Oncor Electric Delivery Company
In March 2016 the Commission approved with conditions an application by an
investor group led by Hunt Consolidated Inc the owners of Sharyland Utilities to acquire
control of Oncor Electric Delivery Company (Oncor) the largest transmission and
distribution utility in Texas from Oncorrsquos parent company Energy Future Holdings which
is in bankruptcy The Commission approved the request subject to certain conditions
including stipulations regarding the organization of the new entities and treatment of tax
benefits The investor-led group subsequently declined to pursue the transaction that was
approved by the Commission
In September 2016 NextEra Energy which owns Florida Power amp Light received
approval from the United States Bankruptcy Court in Delaware for its plan to purchase
Oncor In October 2016 NextEra Energy filed an application with the Commission in
Docket No 46238 for approval of the proposed transaction The Commission will evaluate
the application to determine if the transaction is in the public interest
Integration of Lubbock Power and Light
In March 2016 the Commission opened Project No 45633 to study and identify
the issues related to the request of Lubbock Power and Light the statersquos third-largest
municipally owned utility to be integrated into ERCOT The Commission is currently
working with stakeholders ERCOT and SPP to determine the cost and benefits of any
potential switch by Lubbock Power and Light into ERCOT and whether such a switch is
in the public interest
24 | P a g e
2017 SCOPE OF COMPETITION IN ELECTRIC MARKETS IN TEXAS REPORT
Desalination Project ERCOT Studies
In 2015 the Legislature passed HB 4097 which directed the Commission and
ERCOT to study whether existing transmission and distribution planning processes are
sufficient to provide adequate infrastructure for seawater desalination projects and to study
the potential for desalination projects to participate in demand response opportunities in
the ERCOT market Pursuant to that direction ERCOT staff have prepared a report on the
feasibility of interconnection of large desalination projects and on opportunities for such
projects to participate in ERCOTrsquos demand response programs which is attached to this Report in Appendix B
Oversight and Enforcement Actions
The Commissionrsquos enforcement of statutes rules and orders applicable to entities
under its jurisdiction serves to protect consumers the electric markets the reliability of the
electric grid and to promote fair competition The Commissionrsquos enforcement efforts in the electric industry focus on violations of PURA the Commissionrsquos rules and ERCOT
protocols
During the period from January 2015 through August 31 2016 the Commission
assessed $3258500 in penalties against electric market participants Table 8 provides a
summary of electric industry Notices of Violation since January 2015 During 2015 and
2016 Commission staff opened 212 investigations for the electric industry and closed 177
investigations
Table 8 Notices of Violations
Violation Type Total Penalty Amount
Retail Market Violations $539000
Service Quality Violations $451500
Wholesale Market Violations $2268000
TOTAL $3258500
In addition to the imposition of administrative penalties the Commission uses other
enforcement mechanisms in exercising its enforcement duties including revoking a
companyrsquos certificate to operate In addition some companies may be required to relinquish a certificate as part of a settlement after enforcement action has proceeded
Table 9 provides a breakdown of the number of certificates revoked or relinquished In
2016 the Commission revoked the certificate of the REP TruSmart Energy
Table 9 Certificates Revoked or Relinquished
Type Number
Certificates Revoked 1
Certificates Relinquished 0
25 | P a g e
2017 SCOPE OF COMPETITION IN ELECTRIC MARKETS IN TEXAS REPORT
The Oversight amp Enforcement division also issues warning letters to companies in
the electric market when it determines that a violation occurred but given the
circumstances surrounding the violation and other mitigating concerns no administrative
penalty is warranted During 2015 and 2016 the Oversight amp Enforcement division issued
50 warning letters Finally the Commission generally seeks to reimburse money directly
to customers when appropriate In 2015 and 2016 the Commission ordered the
reimbursement of $8543596 to Texas electric customers
Table 10 Warning Letters
Warning Letter Type Number
Retail Market Warning Letter 8
Service Quality Warning Letter 1
Wholesale Market Warning Letter 41
TOTAL 50
In addition to its enforcement activities the Commission also enters into voluntary
mitigation plans with generators that request one through a contested case proceeding
pursuant to PURA sect15023(f) and 16 TAC sect25504(e) The Commission entered into one
voluntary mitigation plan during 2015 and 2016 in Docket No 44635
Low-Income Discount System Benefit Fund
The System Benefit Fund (SBF) was originally established in 1999 to fund
discounts to low-income customers customer education activities energy-efficiency and
weatherization and electric market oversight through a nonbypassable surcharge on retail
electric bills HB 1101 of the 84th Legislature provided that the SBF be sunset on
September 1 2017 by which time the SBF is intended to be exhausted In the 2016 Fiscal
Year (FY) $325521250 was appropriated in the SBF to provide a 25ndash31 percent discount
to low-income customers over a 12-month period
To assist the drawdown of the remaining balance HB 1101 authorized the
Commission to use any unexpended SBF balance in FY 2017 to assist low-income
customers The Commission estimates that the remaining SBF balance will be
approximately $17 million by August 31 2017 The Commission has determined that this
amount is insufficient to fund the rate reduction program however the Commission will
spend approximately $100000 to continue automatic enrollment in the program to provide
REPs a list of customers eligible to receive late fee waiver and deposit installment benefits
These two ancillary benefits of the rate reduction program will continue for the duration of
FY 2017
26 | P a g e
2017 SCOPE OF COMPETITION IN ELECTRIC MARKETS IN TEXAS REPORT
Homeland Security
The Commission assesses the efforts of ERCOT and utilities to defend against
mitigate and respond to the variety of risks that the modern electricity system faces The
Commission also meets with ERCOT utilities and governmental entities on an ongoing
basis to discuss preparation for everything from hurricanes and other severe weather to
cyber-threats and threats of physical damage to the grid from accidents or intentional
malfeasance In addition the Commission monitors industry and federal programs that
address homeland security issues
The Commission serves as an information liaison between state government and
electric utilities during emergencies The Commissionrsquos main roles include
Conveying outage and service restoration information from electric utilities to
state government
Conveying service restoration priorities (hospitals water treatment facilities
etc) from state government to electric utilities and
Facilitating the clearance of downed power lines in disaster re-entry areas and
facilitating entry of electric utilities into disaster areas
The Commissionrsquos Emergency Management Response Team (EMRT) provided staff at the
State Operation Center for the May 2015 and April 2016 flooding events in Texas as well
as additional staffing for severe winter weather
Demand Response
ERCOT staff have begun to report annually on the participation of customers in
REP-sponsored demand response programs These programs which have been facilitated
by the deployment of smart meters throughout the competitive areas within ERCOT and
by many municipal and cooperative electric utilities take the form of rebates for reduction
in usage during peak period time-of-use pricing real-time volumetric price compensation
for load reduction and direct control of customer load among other plans
These programs have seen dramatic increases in participation since ERCOT began
to gather this information in 2013 From 2013 to 2014 the number of residential customers
participating in these programs increased from 151793 to 721273 and the number of
commercial and industrial customers participating rose from 30275 to 50205 The
Commission continues to monitor ERCOTrsquos stakeholder process for efforts relating to the integration of demand response
27 | P a g e
2017 SCOPE OF COMPETITION IN ELECTRIC MARKETS IN TEXAS REPORT
IV LEGISLATIVE RECOMMENDATIONS
A Determination of Low-Income Customer Eligibility
In 2015 HB 1101 required that all remaining funds in the System Benefit Fund
(SBF) be expended that the fee that funded the program as a nonbypassable surcharge on
electric bills be set at zero and that the SBF be sunset on September 1 2017 Per the
provisions of HB 1101 the SBF fee was set at zero in September 2016 concluding the
funding for the program The sunset of the SBF program also concluded the relationship
between the Texas Health and Human Services Commission (HHSC) and the Commission
in which the HHSC provided to the Commission eligible electric customers for the SBF
low-income discount Because of the termination of the relationship with HHSC with the
termination of the SBF the Commission will no longer be able to determine easily an
electric customerrsquos eligibility for other low-income programs such as late penalty waivers
and the option of paying an electric deposit over multiple months
The Legislature may wish to consider easing low-income customers access to these
low-income programs by facilitating the process used to determine eligibility The
Commission offers four possible approaches in which the Legislature could continue these
low-income programs
(1) Authorize HSSC to provide identification of eligible low-income customers to the
Commission
(2) Allow retail electric providers (REPs) to provide such low-income programs using
the Low Income Discount Administratorrsquos (LIDA) Telecommunications Lifeline
Service Program list to identify low-income customers
(3) Require REPs to offer such low-income programs with customers self-enrolling
and REPs verifying income eligibility or
(4) Allow REPs to voluntarily provide such low-income programs at their own
discretion
B Outside Counsel for Proceedings before Regional Transmission
Organizations
Regional Transmission Organizations (RTO) manage the power grid across wide
regions of the United States Most of Texas is inside the ERCOT region however there
are significant portions of East Texas and the Panhandle that are in the Midcontinent
Independent System Operator (MISO) and the Southwest Power Pool (SPP) Issues arise
in these other RTOs that have significant impact on Texas ratepayers such as how
transmission infrastructure costs will be shared These tend to be very lengthy and
complicated proceedings that require specialized legal and consulting services
28 | P a g e
2017 SCOPE OF COMPETITION IN ELECTRIC MARKETS IN TEXAS REPORT
PURA sect 394525 currently authorizes the Commission to use outside consultants
auditors engineers or attorneys to represent the Commission in proceedings before the
Federal Energy Regulatory Commission This provision has been an important tool for the
Commission to respond to complex matters in the federal arena to enable it to protect the
public interest in Texas The PUC recommends that the Legislature expand the language
in this statute to include the ability to hire outside assistance for proceedings before other
RTOs to provide those same protections to Texas ratepayers in those areas
C Repeal of Natural Gas and Renewable Energy Mandates
1 Natural Gas
PURA sect 399044 establishes natural gas as ldquothe preferential fuelrdquo in Texas for electricity generation and requires the Commission to adopt rules to establish a system of
natural gas energy trading credits The majority of all new non-renewable electricity
generation constructed since 2000 for Texas has used natural gas as a primary fuel and this
trend is expected to continue in the foreseeable future The thresholds used to trigger the
natural gas energy trading credit system in PURA sect 399044 have not been reached and
they are not expected to be reached in the foreseeable future
Because natural gas-fueled facilities have been the most commonly built new
generation in Texas for many years and are expected to continue to be there is no need to
establish incentives for natural gas generation The PUC recommends that the Legislature
consider repealing PURA sect 399044 because it is no longer necessary
2 Renewable Energy
PURA sect 39904 establishes goals for renewable energy Subsection (a) requires
the installation of 5880 megawatts of renewable energy by 2015 and Subsection (b)
establishes a renewable energy credits trading program to implement the requirement The
5880 megawatts mandates in Subsection (a) was met in 2008 While the Commission
believes the renewable energy trading credit program is needed for retail electric providers
to validate renewable energy marketing claims the Commission believes the 5880
megawatts mandate in Subsection (a) is no longer necessary
D Advisory Opinions
Many regulatory agencies in Texas have authority to issue informal guidance to the
persons they regulate particularly with respect to outlining whether a particular course of
conduct would in the agencyrsquos view be consistent with the laws and regulations that the agency administers19 The issuance of an advisory opinion can provide regulatory clarity
to a company before making investments or conducting operations the permissibility of
which may be unclear under state law The Legislature may want to consider granting the
19 In addition certain federal agencies such as the Federal Communications Commission
Internal Revenue Service Securities and Exchange Commission and Federal Election
Commission have authority to issue advisory opinions
29 | P a g e
2017 SCOPE OF COMPETITION IN ELECTRIC MARKETS IN TEXAS REPORT
Commission the authority to issue advisory opinions In the electric industry providing
clarification to a company concerning issues such as the purchase of assets or the
acquisition of another company could allow it to avoid expensive regulatory proceedings
without impairing the Commissionrsquos authority The following state agencies have statutory authority to issue advisory opinions
Texas Ethics Commission20
Texas Medical Board21
State Board of Dental Examiners22
Texas Board of Nursing23
Texas Board of Professional Engineers24
Texas Lottery Commission and25
Texas Securities Board26
E Administrative
Gross Receipts Assessment
PURA sect 16001 provides for a gross receipts assessment that is used to defray the
expenses incurred by the Commission to administer PURA An assessment of one sixth of
one percent is collected from public utilities electric cooperatives retail electric providers
and interexchange carriersrsquo gross receipts from consumers The funds from this assessment
are remitted to the general revenue fund but currently they have not been explicitly
dedicated to funding of the Commission In contrast similar assessments on water
utilities insurance companies and other regulated entities have traditionally been used to
explicitly fund the underlying regulatory programs at the respective agencies The
Commission is one of four Article VIII agencies that is not designated as self-funded
The Commission recommends that the Legislature designate the Commission as a
self-funded agency whereby the collected assessments would be explicitly dedicated to the
funding of the agency Implementing this recommendation would require the Public Utility
Commission to be included in the Appropriations Limited to Revenue Collections rider
located in the Special Provisions Relating to All Regulatory Agencies section of the
General Appropriations Act Designation as a self-leveling agency would require the
Commission to set the gross receipts assessment at a rate sufficient to generate revenue in
the amount of the agencyrsquos general revenue appropriation each fiscal year which would require a statutory change to PURA sect16001(b) Based upon the Commissionrsquos baseline budget request authorizing the PUCrsquos self-leveling designation would result in an overall
estimated tax reduction of $456 million per year or 774
20 Government Code sect 571091 21 Occupations Code sect 162107 22 Occupations Code sect 258157 23 Occupations Code sect 301607 24 Occupations Code sect 1001601 25 Occupations Code sect 2001059 26 Tex Rev Civ Stat Ann Arts 581-28-1 amp 581-35 7 Tex Admin Code 1012
30 | P a g e
2017 SCOPE OF COMPETITION IN ELECTRIC MARKETS IN TEXAS REPORT
V APPENDICES
31 | P a g e
2017 SCOPE OF COMPETITION IN ELECTRIC MARKETS IN TEXAS REPORT
Appendix A ndash Acronyms
AEP American Electric Power
AMS Advanced Metering System
CenterPoint CenterPoint Energy Houston Electric LLC
DG Distributed Generation
DRG Distributed Renewable Generation
ERCOT Electric Reliability Council of Texas
ERSC Entergy Regional State
ERS Emergency Response Service
ETI Entergy Texas Inc
IMM ERCOT Independent Market Monitor
kWh Kilowatt-hour
LMP Locational Marginal Pricing
LSP Large Service Provider
MISO Midwest Independent System Operator
MMBtu One million British Thermal Unit (BTU)
MW Megawatt
MWh Megawatt-hour
Nodal Texas Nodal Market Design
ORDC Operating Reserve Demand Curve
PGC Power Generation Company
POLR Provider of Last Resort
PURA Public Utility Regulatory Act
REP Retail Electric Provider
RSC Regional State Committee
RTO Regional Transmission Organization
SCED Security Constrained Economic Dispatch
Sharyland Sharyland Utilities LP
SBF System Benefit Fund
SPP Southwest Power Pool
TDU Transmission and Distribution Utility
TNMP Texas-New Mexico Power Company
32 | P a g e
2017 SCOPE OF COMPETITION IN ELECTRIC MARKETS IN TEXAS REPORT
Appendix B ndash ERCOT Desalination Report
This page intentionally left blank
33 | P a g e
ERCOT Public
Study on the Demand Response Potential for Seawater Desalination Projects
ERCOT November 18 2016
Study on the Demand Response Potential for Seawater Desalination Projects ERCOT Public
Executive Summary
In 2015 the 84th Texas Legislature enacted House Bill (HB) 4097 which included several provisions relating to seawater desalination projects including a requirement that the Public Utility Commission of Texas (PUC) and Electric Reliability Council of Texas (ERCOT) study the potential for seawater desalination projects to participate in existing demand response opportunities in ERCOT There are several demand response products in which demand-side resources (ie consumers of electricity) can participate These programs help to preserve system reliability and provide economic benefits to participating demand-side resources Seawater desalination is an energy-intensive process that removes salt and other minerals from salt water to produce fresh water for municipal consumption industrial use or irrigation Participation in demand response could help mitigate electricity costs for future seawater desalination projects in Texas and provide reliability benefits to the grid
There are two main demand response reliability-based services administered by ERCOT participation by demand-side resources in the Ancillary Services market and the Emergency Response Service (ERS) Within the Ancillary Services market the most common service provided by demand-side resources is Responsive Reserve Service (RRS) which requires resources to respond either instantaneously or within 10 minutes in response to unplanned system emergencies ERS is separate from ERCOTrsquos Ancillary Services market and allows demand-side resources and distributed generation to provide reliability services in the event of an energy emergency Resources can qualify for either the 10-minute or 30-minute response time ERS programs
There are several key considerations that will impact a demand-side resourcersquos ability to participate in different demand response opportunities response time recovery time predictability of electrical demand and flexibility of operations Considering these factors together it appears that seawater desalination plants could be designed to meet the requirements for participation in demand response Because the ability to meet the qualification requirements is dependent on the plant design demand response opportunities should be considered early in a projectrsquos development if participation is desirable
Whether project developers will choose to address these requirements will depend on the economic benefits of participation There may be additional costs to design seawater desalination plants to operate in the manner required in order to participate in demand response These include costs associated with additional plant design specifications need for excess capacity and storage to make up for lost production during demand response deployment operational costs resulting from interruptions to plant processes and potential financial penalties if demand response deployment results in failure to meet contract demands The interplay of the benefits of participation and these costs will determine whether it would be beneficial for a future seawater desalination plant to participate in demand response in ERCOT
To date participation of seawater desalination plants in demand response programs has been limited Because the process of seawater desalination is energy-intensive participation in demand response could help to reduce electricity costs while posing a relatively low risk to plant operations As stakeholders in Texas continue to plan for possible future droughts in the region and identify water management strategies consideration of demand response could play a role in mitigating some costs associated with seawater desalination and allow seawater desalination plants to assist with maintaining electric reliability in the region
copy 2016 ERCOT All rights reserved i
Study on the Demand Response Potential for Seawater Desalination Projects ERCOT Public
Table of Contents
1 Introduction 1
2 Seawater Desalination 2
21 Seawater Desalination Plant Operations 2
22 Seawater Desalination Plant Economics 3
3 Demand Response Opportunities in ERCOT 4
31 ERCOT-Dispatched Demand Response 4
311 Ancillary Services Markets 5
312 Emergency Response Service (ERS) 5
32 Non-ERCOT-Dispatched Demand Response 6
321 Four Coincident Peak (4CP) 6
322 LSE or DR Provider Contracted Price Response 6
323 Self-Directed Price Response 6
4 Demand Response Potential for Seawater Desalination 7
41 Operational Considerations for ERCOT-Dispatched Demand Response 7
42 Economic Considerations for ERCOT-Dispatched Demand Response 8
43 Considerations for Non-ERCOT-Dispatched Demand Response 9
5 Conclusion 11
copy 2016 ERCOT All rights reserved ii
Study on the Demand Response Potential for Seawater Desalination Projects ERCOT Public
1 Introduction
In 2015 the 84th Texas Legislature enacted House Bill (HB) 4097 which included several provisions relating to seawater desalination projects including a requirement that the Public Utility Commission of Texas (PUC) and Electric Reliability Council of Texas (ERCOT) study the potential for seawater desalination projects to participate in existing demand response opportunities in ERCOT ERCOT and the PUC initiated this study to fulfill that requirement and evaluated the operational and economic characteristics of seawater desalination plants in light of ERCOTrsquos primary demand response products1
ERCOT is the independent system operator (ISO) for the ERCOT Interconnection which encompasses approximately 90 of demand for electricity in Texas ERCOT is the independent organization established by the Texas Legislature to be responsible for the reliable planning and operation of the electric grid for the ERCOT Interconnection ERCOT also administers and maintains a forward-looking open market to provide affordable and reliable electricity to consumers in Texas In collaboration with market participants ERCOT has developed demand response products and services for customers that have the ability to reduce or modify electricity use in response to instructions or signals These programs help preserve system reliability and provide economic benefits to participating demand-side resources
The process of seawater desalination removes salt and other minerals from salt water to produce fresh water for consumption industrial processes or irrigation The drought-prone Texas climate coupled with projections for increasing water demand in the state has created interest in seawater desalination as a future water source The 2017 Texas State Water Plan includes seawater desalination as a future water management strategy for water users in the state However the seawater desalination process is energy intensive and electricity consumption can be a significant cost driver for these projects To the extent that these plants could participate in demand response it would help to defray these costs Thus there is a potential nexus between seawater desalination projects built in Texas to mitigate drought but which have large electricity requirements and ERCOT demand response opportunities which could help to reduce their electricity costs and provide reliability benefits
This study evaluates the demand response potential of seawater desalination plants based on their operational characteristics and economic drivers The report is organized as follows
Section 2 provides background on typical seawater desalination plant operations and economics
Section 3 describes the current demand response opportunities in ERCOT
Section 4 evaluates the characteristics of seawater desalination plants to determine their potential to participate in demand response opportunities in ERCOT and
Section 5 provides a summary of the conclusions of this study
1 In the course of developing this report ERCOT consulted with several desalination experts with experience with existing or planned seawater desalination plants in the US The technical experts consulted included Jorge Arroyo (Water Management Consultant) Andrew Chastain-Howley (Black amp Veatch) Jonathan Loveland (Black amp Veatch) Ron Parker (Black amp Veatch) John Wolfhope (Freese and Nichols) and Srinivas Veerapaneni (Black amp Veatch)
copy 2016 ERCOT All rights reserved 1
Study on the Demand Response Potential for Seawater Desalination Projects ERCOT Public
2 Seawater Desalination
There are two primary methods for seawater desalination distillation (also referred to as ldquothermalrdquo) and reverse osmosis Distillation uses heat to remove salts and minerals from seawater by boiling water at high pressures In contrast reverse osmosis technology forces saline water through a membrane to separate water from the salts and minerals While both distillation and reverse osmosis are energy intensive distillation requires thermal energy to heat the water and overall has a higher energy requirement whereas reverse osmosis requires primarily electrical energy and overall is less energy intensive ndash though still with significant electricity requirements
Globally most thermal desalination plants are located in the Middle East due to low energy prices in the region Plants located elsewhere including in the US typically use reverse osmosis technology2 There are two large existing seawater desalination plants in the US one in Carlsbad California providing water to the San Diego area and one in Gibsonton Florida providing water to the Tampa Bay area Both plants use reverse osmosis technology In addition there are several desalination projects currently in the planning stages or under development in Texas in the Corpus Christi area that would use reverse osmosis technology For that reason this report focuses on reverse osmosis technology in the evaluation of demand response potential of seawater desalination plants
While there are currently no existing seawater desalination plants in Texas there are several municipal and industrial brackish water desalination plants in the state According to the Texas Water Development Board (TWDB) there are 46 municipal brackish water desalination plants with capacities greater than 0025 million gallons per day (MGD) in Texas representing a total of 123 MGD of capacity3 The desalination of brackish water is typically less expensive compared to seawater due to the lower relative salinity of brackish water This study focuses exclusively on seawater desalination consistent with the requirements of HB 4097 but it should be noted that conclusions may also apply to brackish water desalination though at a different cost and scale
This section provides high-level information on the operations (Section 21) and economics (Section 22) of seawater desalination plants to inform the discussion of their demand response potential in Section 4
21 Seawater Desalination Plant Operations Seawater desalination plants typically range in capacity from less than 5 MGD up to 165 MGD For example the Carlsbad seawater desalination plant has a capacity of approximately 50 MGD and the plant in Tampa Bay has a capacity of approximately 25 MGD The associated electricity consumption ranges between 10 and 15 kWh1000 gallons produced depending on the salinity of the water being processed456 More saline water (eg seawater) requires larger amounts of electricity for desalination Thus a seawater desalination plant would have larger electricity consumption requirements compared to a similarly sized brackish water desalination plant
2 American Water ldquoInnovation Solutions within the Water Industry Desalinationrdquo Available at httpwwwamwatercomfilesInnovationsSolutionsWithinTheWaterIndustryDesalinationpdf 3 Texas Water Development Board ldquoDesalination Factsrdquo Available at httpswwwtwdbtexasgovinnovativewaterdesalfactsasp 4 American Membrane Technology Association April 2016 ldquoMembrane Desalination Power Usage Put in Perspectiverdquo Available at httpwwwamtaorgcomwp-contentuploads7_MembraneDesalinationPowerUsagePutInPerspectivepdf 5 Water Reuse Association November 2011 ldquoSeawater Desalination Power Consumptionrdquo Available at httpswatereuseorgwpshycontentuploads201510Power_consumption_white_paperpdf 6 Ghaffour N TM Missimer and G Amy January 2013 ldquoTechnical review and evaluation of the economics of water desalination Current and future challenges for better water supply sustainabilityrdquo Desalination 309 pp197-207 Available at httpswwwresearchgatenetpublication256693140_Technical_review_and_evaluation_of_the_economics_of_water_desalination_ Current_and_future_challenges_for_better_water_supply_sustainability
copy 2016 ERCOT All rights reserved 2
Study on the Demand Response Potential for Seawater Desalination Projects ERCOT Public
While the two existing seawater desalination plants in the US were co-located with power plants to ease compliance with regulations on water intake and discharge structures and reduce costs many other reverse osmosis desalination plants receive their electricity from the grid However plants may have on-site backup generation in case of a power outage This will vary depending on the size and design of the plant and other factors For example the Carlsbad plant in California does have diesel backup generation to power control systems and flushing systems in the case of a power outage The plant in Tampa Bay was not built with backup power due to potential storm surge risks from hurricanes and other storms The plant does use uninterruptible power supply (UPS) backup to power control systems during power outages
Reverse osmosis plants are typically designed with several ldquotrainsrdquo which consists of a high-pressure pump turbine and reverse osmosis membrane Desalination plants are turned on or off one train at a time in a highly controlled process The process of ramping up or down an individual train under normal operations typically takes one to two hours While plants can be designed to handle immediate shutdowns (ie in a power outage) re-starting a system after an interruption would take this amount of time In addition the saline water must be pretreated (ie filtered) before going through the reverse osmosis train and this can sometimes pose constraints on the flexibility of operations
Demand for water is the key factor driving the level of production at seawater desalination plants Typically the plant will have a contract or contracts with municipal or other water users to deliver desalinated water and is operated to meet that demand Alternatively if the plant is municipally owned it would similarly be operated to meet the level of water demand in conjunction with other available water sources If water demands are close to a plantrsquos full capacity the operatorrsquos flexibility to adjust its electricity consumption as part of demand response may be limited However this does mean that plant operations are fairly predictable on a day-to-day basis which is necessary for participation in demand response
The amount of flexibility in plant operations will also be impacted by the amount of water storage available For example if a plant has sufficient water storage on-site or storage within the customerrsquos distribution system it could provide flexibility for the plant to reduce its operations during peak hours when electricity prices are likely to be highest It would also mitigate the impacts of interruptions to production from demand response deployments
22 Seawater Desalination Plant Economics Seawater desalination is typically more expensive than other sources of water and a major driver of the overall cost is energy costs In 2016 the Carlsbad plant charged rates at between $2131 and $2367 per acre-foot78 This charge is intended to cover both the fixed costs of the plant and the variable costs to produce a unit volume of water Typically half to two thirds of the cost of providing desalinated seawater are accounted for by capital cost recovery with the remainder accounted for by operations and maintenance costs including electricity costs Electricity costs can account for 20shy25 of the total costs of seawater desalination with reverse osmosis technology9
Factors affecting the capital cost of a seawater desalination plant include plant size type of desalination process and pre-post-treatment technologies plant infrastructure (eg piping water storage backup power) and compliance with applicable regulations (eg regulations on intake structures brine byproduct disposal) A significant driver of operating and maintenance costs is membrane replacement Reverse osmosis membranes need to be replaced every few years and
7 Source San Diego County Water Authority ldquoSeawater Desalinationrdquo Available at httpwwwsdcwaorgseawater-desalination 8 Note that 1 acre-foot is approximately 325851 gallons 9 Based on technical input from Black amp Veatch
copy 2016 ERCOT All rights reserved 3
Study on the Demand Response Potential for Seawater Desalination Projects ERCOT Public
the rate at which they are replaced will depend on the salinity of the feedwater and how the plant is operated Treatment and disposal of the salty brine byproduct from desalination may also incur operating costs
Electricity costs will vary depending on a range of factors including the size of the plant type of desalination technology source of electricity and quality of the feedwater As previously noted more saline water requires higher amounts of electricity in desalination and thus the amount of electricity consumption is a key difference between brackish water and seawater desalination As a result electricity costs comprise a significant share of the costs of seawater desalination These costs could potentially be defrayed in part by participation in demand response initiatives
3 Demand Response Opportunities in ERCOT
Broadly speaking demand response can be broken down into two major categories dispatchable or non-dispatchable For purposes of this report we will define dispatchable as those demand response events that are initiated by ERCOT and non-dispatchable as an event not specifically initiated by ERCOT These non-dispatchable events may include decisions made by the end-use customer to alter its consumption pattern or may include contractual obligations with another entity such as the end-use customerrsquos retail electric provider (ldquoREPrdquo) to alter consumption patterns
ERCOTrsquos wholesale market is open to several types of dispatchable demand response which are deployed to maintain system reliability Demand-side resources providing Emergency Response Service (ERS) may offer based on either a 10 or 30-minute response time commonly referred to as the ldquoramp periodrdquo Alternatively demand-side resources may register and qualify as a Load Resource that can provide Reserves in the Ancillary Services market The most common service provided by demand-side resources is Responsive Reserve Service which requires an under-frequency relay that can instantaneously interrupt the load during certain system reliability events Some demand-side resources can also participate in other Ancillary Services as Controllable Load Resources that require sophisticated control systems that allow them to be deployed in a more incremental proportional manner
Non-dispatchable demand response in ERCOT can include a response to avoid transmission costs where rates are based on Four Coincident Peak Pricing (4CP) response to wholesale energy prices initiated by the customer or by a REP or other load-serving entity (ldquoLSErdquo) or utility-managed Load Management programs (LM)
The sections that follow provide a description of both ERCOT-dispatched (Section 31) and nonshyERCOT-dispatched (Section 32) demand response For a more detailed description of opportunities for demand-side resources to participate in demand response in ERCOT see ERCOTrsquos guide Load Participation in the ERCOT Nodal Market10
31 ERCOT-Dispatched Demand Response There are two main demand response reliability-based services administered by ERCOT participation by demand-side resources in the Ancillary Services market and participation in ERS These services are dispatched by ERCOT during system emergencies
10 Available at httpwwwercotcomcontentservicesprogramsloadLoad20Participation20in20the20ERCOT20Nodal20Market_302d oc
copy 2016 ERCOT All rights reserved 4
Study on the Demand Response Potential for Seawater Desalination Projects ERCOT Public
Demand-side resources with demand response capability that can meet a set of performance requirements can be qualified to provide Ancillary Services as Load Resources in the Ancillary Services Market The value of having a Load Resource available to reduce load is equal to the value of having a generator available to increase its generation at a generating plant The providers of operating reserves selected to provide Ancillary Services are eligible for capacity payments regardless of whether the Resource is actually deployed (or curtailed in the case of the Load Resource)
ERCOT holds auctions on a daily basis for each of the following Ancillary Services Regulation Up Regulation Down Responsive Reserve and Non-Spinning Reserve11 Table 1 describes the various Load Resource types and their qualification requirements and eligible services
Table 1 Load Resource Types and Ancillary Services
Service Load Resource Type a Qualification Responsive Reserves (le50 of total Reserve requirement)
Non Controllable Under-Frequency Relay and 10-minute ramp to manual dispatch instruction
Responsive Reserves
Controllable Primary Frequency Response and follow 5-minute dispatch instructions
Regulation-Up Regulation-Down
Controllable Primary Frequency Response and respond to Regulation deployments
Non-Spin Reserves Controllable Follow 5-minute dispatch instructions a A Controllable Load Resource is a Load Resource capable of controllably reducing or increasing consumption under dispatch control by ERCOT
Demand-side resources that agree to reduce load when directed by ERCOT and that meet other metering and operational requirements as specified in the ERCOT Protocols may participate in Ancillary Services market auctions As noted in Table 1 the type of Ancillary Service that a Load Resource may provide will depend upon the demand-side resourcersquos response time and metering system as well as other requirements described in the Protocols In the Responsive Reserve and Non-Spin Reserve markets the Load Resource will receive capacity payments regardless of whether or not the load was actually deployed but the load must be available for deployment at any time while providing the service
ERCOT procures ERS to maintain grid reliability during emergency conditions and reduce the likelihood of the need for rotating outages ERS participants may offer to provide demand response with either a 10-minute ramp period requirement (similar to Load Resources providing Responsive Reserve Service) or a 30-minute ramp period requirement ERS Resources do not have the same telemetry and under-frequency relay requirements as Load Resources
11 Regulation Up and Regulation Down service respond to signals from ERCOT every 4 seconds to respond to changes in system frequency full response has to be provided within 5 minutes Responsive reserves must provide their committed capacity either instantaneously in an under-frequency event (eg due to a generator outage) or in energy scarcity conditions within ten minutes following an instruction from ERCOT Non-spinning reserves must provide their committed capacity within 30 minutes based on economic dispatch instructions Non-spinning reserve is used as replacement reserve to replenish other ancillary services and during energy scarcity
copy 2016 ERCOT All rights reserved 5
Study on the Demand Response Potential for Seawater Desalination Projects ERCOT Public
ERS is procured through a request for proposal (RFP) process three times per year for four-month contract terms each of which is further split into smaller time periods based on business cycles and other factors Demand-side resources may choose to submit offers in all time periods or only in those that best fit their unique circumstances and may vary both the price and demand response capacity offers by time period
Payments for ERS are performed up to 80 days after each four month contract term has ended and are subject to downward revision based upon delivered demand response capacity and the demand-side resourcersquos availability during the contract term
32 Non-ERCOT-Dispatched Demand Response The options listed below are not dispatched by ERCOT but they either are controlled directly by a customer or are dispatchable by another entity such as a demand response provider (ldquoDR Providerrdquo) REP or a transmission and distribution utility
Many industrial customers are subject to transmission charges based upon a Four Coincident Peak (4CP) demand The 4CP demand is determined by averaging the consumerrsquos actual demand during the 15-minute settlement interval with the highest ERCOT demand during each of the four summer months (June through September) This measured 4CP demand serves as the basis for the customerrsquos transmission tariff charges for the following year By correctly predicting the ERCOT system peaks during the summer and curtailing load during those intervals a consumer can help reduce the stress imposed on the electric system during peak periods of consumption and reduce its transmission charges for the following calendar year
In the competitive areas of ERCOT consumers can contract with their REP or a DR Provider to have their load respond to the REPrsquos or DR Providerrsquos instructions The contract will usually outline the parameters of this response ndash at what times and frequency demand response events can be called ramp periods sustained response periods compensation etc Because this response is a contractual matter between the REP or DR Provider and the consumer a great deal of variety can be present in these arrangements For example a consumerrsquos response may be voluntary or required compensation could come in the form of reduced energy prices or rebate payments for each curtailment event consumers might be notified up to a day in advance or could have no notification at all (for automated curtailment)
In areas of ERCOT not open to competition interruptible tariffs may be available These tariffs will usually offer a reduced energy price for defined curtailment obligations
REPs may offer dynamic pricing options or consumers within a municipality or cooperative may have their energy prices determined by a published tariff which also may be structured based upon Time-of-Use (TOU) or have a Critical Peak Pricing (CPP) or Peak Time Rebate (PTR) component Self-directed price response refers to consumers making an independent decision to respond to energy prices contained in a governing tariff or in either the ERCOT Day Ahead or Real Time energy markets
TOU offerings will typically have higher energy prices during normal peak periods ndash for example a TOU tariff may charge one price during Monday through Friday from 2 pm through 8 pm and another price during all other times Customers may choose to reduce consumption during these high priced periods Load reduction can be accomplished by load shifting (loads can be shifted by
copy 2016 ERCOT All rights reserved 6
Study on the Demand Response Potential for Seawater Desalination Projects ERCOT Public
rescheduling certain processes or by utilizing thermal storage) ending certain processes that are no longer economic or through energy efficiency measures
Offerings that incorporate CPP usually have prescribed high prices only during certain defined periods ndash for example when load or prices are expected to reach a certain level Response to CPP may be similar to those employed under TOU tariffs especially if CPP is reached frequently More often CPP is infrequent and as such short-term load curtailment may be the more appropriate response to meet economic objectives
4 Demand Response Potential for Seawater Desalination
This section evaluates whether the operational characteristics and economics of seawater desalination plants would enable them to participate in one or more of the various demand response opportunities in the ERCOT Region To date participation of seawater desalination plants in demand response programs has been limited Neither the plant in Carlsbad nor the plant in Tampa Bay participate in demand response programs in California or Florida respectively However as will be described below it appears that these plants can be designed and operated to meet the requirements for participation in demand response and receive economic benefit from participation in these programs
Section 41 describes the operational parameters that must be met for a demand-side resource to provide ERCOT-dispatched demand response and evaluates the ability of seawater desalination plants to meet these criteria Section 42 discusses the tradeoffs between payments for participation in ERCOT-dispatched demand response and potential additional costs posed to seawater desalination plants Finally Section 43 presents other opportunities for seawater desalination plants to reduce their electricity costs outside of ERCOTrsquos reliability-based services that are open to demand response assets
41 Operational Considerations for ERCOT-Dispatched Demand Response There are several key operational parameters that impact a demand-side resourcersquos ability to participate in different demand response services response time recovery time predictability of electrical demand and flexibility of operations This section discusses each of these considerations as they apply to seawater desalination plants
As discussed in Section 31 one of the differentiating factors between ERCOTrsquos demand response products is the amount of time within which a demand-side resource must respond to a deployment instruction to reduce electricity consumption during an event Participation in RRS requires an automatic response within either half a second (ie instantaneous) based on grid frequency or within 10 minutes via a manual instruction ERS requires a response time of either 10 or 30 minutes As noted in Section 21 the typical time to take a reverse osmosis train on- or off-line is 1-2 hours under normal controlled operations To comply with the response time requirements of RRS or ERS a seawater desalination plant would need to be able to reduce its electricity consumption far more quickly than in normal operations This is an element of plant design that would need to be accounted for in the specifications of the project Considerations include the potential need for on-site backup generation including uninterruptible power supply potential impacts to plant infrastructure (eg piping) reverse osmosis membranes and pretreatment systems
The two large US desalination plants provide illustrative counterpoints in this respect The Carlsbad plant was designed to withstand instantaneous power interruptions and has on-site backup generation including uninterruptible power supply to provide the ability to power control systems and flush the membranes in the event of a power loss In contrast the Tampa Bay plant was not
copy 2016 ERCOT All rights reserved 7
Study on the Demand Response Potential for Seawater Desalination Projects ERCOT Public
designed with on-site backup generation and a loss of power would result in a plant shutdown and may require several days to bring the plant back on-line Thus it appears that it is technically possible for a seawater desalination plant to meet the response time requirements for participation in demand response so long as this factor is considered in the design of the facility
The time it takes a desalination train to return to operations after an event is also a consideration Demand-side resources participating in RRS must be able to come back on-line within three hours and those participating in ERS must return within 10 hours Again it appears that it is technically feasible for desalination plants to meet this requirement so long as this requirement is considered in the plant design
An additional consideration is the predictability of a demand-side resourcersquos electricity consumption Participation in the responsive reserves ancillary service market requires bidding in the day-ahead market and thus a demand-side resource must know with great accuracy (within 95) its electrical demand at least a day ahead of time For ERS auctions are held three times a year for four-month contract periods Thus to participate in ERS a resource must know its forecasted electrical demand several months in advance Because seawater desalination plant operations are driven by contracted demand for water it is likely that a plant operator would have a good idea of the plantrsquos electrical demand days or even weeksmonths in advance especially for summer months when demand is likely to be relatively steady An important consideration however is the salinity of the water which drives the electrical requirements and which can be impacted by recent weather events Similarly reductions in demand for water during non-summer months or wet summer days where demand may be reduced could also impact a plantrsquos ability to predict its electricity demand
Finally a seawater desalination plant must have sufficient flexibility in its day-to-day operations so that it can afford to lose several hours of production when deployed for demand response It should be noted that demand-side resources participating in RRS and ERS are called infrequently demand-side resources providing responsive reserves were deployed one time in 2015 and ERS was not deployed that year However this is an important factor to consider if a plant is operating at close to full capacity and would incur financial penalties if it fails to meet its contract obligations due to a demand response event Including additional storage and building a plant with extra capacity could help to mitigate this risk It should also be noted that a plant operator does not need to commit the full plant capacity to these services but rather can specify an amount of MW that will be committed Thus a plant operator could mitigate issues both with predictability and flexibility of plant operations by committing only a portion of its predicted electrical demand to participate in demand response
Considering these factors together it appears that seawater desalination plants could be designed to meet the operational requirements for participation in ERCOTrsquos demand response services (both RRS and ERS) Because the ability to meet the requirements is dependent on the plant design demand response would need to be considered early in a projectrsquos development if participation is desirable Whether project developers will choose to address these requirements will depend on the economic benefits of participation in demand response which will be discussed in the next section
42 Economic Considerations for ERCOT-Dispatched Demand Response This section describes the economic benefits to demand-side resources from participation in ERCOT-dispatched demand response programs The average price paid for a demand-side resource participating in RRS in 2015 was $1087 per MW per hour and for ERS was $645 per MW per hour for the contract periods during the 2015 program year These payments could provide a significant financial benefit to seawater desalination plants To give a simplified example for a plant with an electrical demand of 10 MW operating at a 100 annual load factor (10 MW times 24 hours times 365 days) the annual benefit would be on the order of $500000 for ERS or $1 million for RRS
copy 2016 ERCOT All rights reserved 8
Study on the Demand Response Potential for Seawater Desalination Projects ERCOT Public
In 2015 demand-side resources providing responsive reserves were deployed one time for a duration of 10 minutes and ERS was not deployed12 The most ERS was ever deployed in a single year was two times in 2011 Thus participation in either program could result in a substantial payment to a seawater desalination plant with a relatively low risk of deployment and associated disruption of plant operations although it is important to note that participation in either ERCOT service subjects demand response resources to annual unannounced testing Other than testing the frequency of deployment will depend on grid conditions and is a risk that should be considered
The financial benefits of participation must be weighed against the costs of designing facilities with the capabilities to operate in this manner These include
bull The costs to design the plant to reduce electrical demand within the required timeframes for demand response and to withstand an instantaneous interruption if not already part of the plant design For example a plant may need to be designed to have backup power generation on-site In addition there could also be costs to restart the system after an interruption
bull The costs to build a plant with excess capacity andor storage to make up for lost production hours when demand response is deployed This will add to the total capital costs of the project Land area constraints should also be considered when considering additional storage as the space requirements for the necessary storage capacity could be significant
bull Costs associated with the impact of interruptions on plant processes (eg more frequent replacement of membranes impacts to pretreatment system or plant infrastructure)
bull Potential financial penalties that would be incurred if deployment as part of demand response were to result in failure to meet contract obligations to supply water
bull The loss of potential benefits in the form of cost avoidance from participation in non-ERCOTshydispatched demand response opportunities (see Section 43) If a plant is committed to RRS or ERS the plant operator would lose the flexibility to take advantage of these other opportunities to reduce their electricity costs
The interplay of these benefits and costs will determine whether it would be beneficial for a future seawater desalination plant to participate in demand response in ERCOT
43 Considerations for Non-ERCOT-Dispatched Demand Response Outside of the reliability-based services administered by ERCOT there are other opportunities for seawater desalination plants to reduce their electricity costs As described in Section 321 seawater desalination plants may be able to reduce the demand charges on their electricity bills through curtailing load during 4CP intervals In addition plant operators may adjust operations in response to real-time electricity prices to take advantage of lower off-peak prices and avoid price spikes (see Sections 322 and 323) All of these opportunities require that the plant have flexibility to reduce production during certain times of the day
In the ERCOT region as noted above a portion of transmission and distribution charges are set based on the peak systemwide 15-minute interval of the four summer months (June through September) referred to as the four coincident peaks (4CP) Large customers can reduce or avoid this charge by reducing electrical consumption during these four peak intervals AEP Central Texas and CenterPoint are the transmission providers covering the majority of the Gulf Coast in Texas13
12 ERCOT June 2016 ldquoLoad Resource Deployment Updaterdquo Available at httpwwwercotcomcontentwcmkey_documents_lists870985_RRS_Load_Resource_Deployment_Updatepdf 13 It is also possible that a seawater desalination plant could be located in an area that as not opted in to competition in which case the plant owner would need to negotiate its electricity charges bilaterally with the Non Opt-In Entity (NOIE)
copy 2016 ERCOT All rights reserved 9
Study on the Demand Response Potential for Seawater Desalination Projects ERCOT Public
Assuming a future seawater desalination plant would be connected at transmission-level voltages the relevant 4CP charges based on the 2016 tariffs accounting for both transmission charges and transmission cost recovery factors would be $41425 per 4CP kW for AEP Central Texas and $41870 per 4CP kVA for CenterPoint14 If a seawater desalination plant has 10 MW of load and is capable of interrupting all of it and successfully does so for all four 4CP intervals the savings based on the 2016 tariffs would be approximately $500000 per year ($41425 times 1000 (kW to MW) times 10 MW times 12 months) Thus a seawater desalination plant that reduces its electricity use during the 4CP intervals could avert some or all of these charges
Another opportunity for seawater desalination plants to reduce their electricity costs is through adjusting operations in response to real-time electricity prices In 2015 the average electricity price in ERCOT was $2677MWh However prices exceeded $50MWh in 254 hours (3 of all hours) $100MWh in 88 hours (1) $200MWh in 40 hours (05) and $300MWh in 21 hours (02) Prices exceeded $3000MWh for 021 hours15 Depending on the desalination plantrsquos exposure to real-time wholesale market prices (via its retail contract) the degree of high prices the plant owner is willing to avoid and grid conditions in a given year reducing unit operations in order to avoid high electricity prices could impact operators for anywhere between a few and several hundred hours out of the year In addition a plant can plan its operations to take advantage of lower electricity prices during off-peak periods (eg at night when generation from wind is high) For example at least one company is marketing a modular desalination unit design intended to take advantage of low prices during periods of high renewables generation and to provide grid reliability services through demand response16
There are several factors to consider regarding these opportunities to reduce electricity costs The plant would need to monitor the ERCOT market or hire a contractor to do so in order to know when to reduce demand for electricity These programs do not impose any requirements on response time as with RRS or ERS and there may be sufficient warning of 4CP intervals or peak pricing to allow the plant operator to plan its operations earlier in the day with sufficient time to ramp down production under controlled conditions However quicker ramping capability may be desirable to respond to electricity price fluctuations
For 4CP because the four intervals used to set demand charges are not known ahead of time it is likely that the plant would need to reduce its demand multiple times per summer to ensure the 4CP intervals are hit impacting production at the facility Timing operations to coincide with off-peak pricing or to avoid price spikes would similarly result in reduced operations during certain hours To offset the lost production hours the plant may need to be designed with extra capacity and water storage capability to maintain the ability to meet its contractual obligations for freshwater delivery Because the period of reduced operations is greater than with ERCOT-dispatched demand response services this need would be greater for a seawater desalination plant reducing load during 4CP intervals or in response to real-time electricity prices and would increase the capital costs of the project It should also be noted that high prices in the ERCOT Region typically but not always occur in summer months when drought conditions are more likely to develop and demand for desalinated water is likely to be highest This may limit the flexibility of the plant to time its electricity consumption to avoid high-priced hours
14 Public Utility Commission of Texas ldquoTransmission and Distribution Rates for Investor Owned Utilitiesrdquo Available at httpwwwpuctexasgovindustryelectricratestdraspx 15 Potomac Economics June 2016 2015 State of the Market Report for the ERCOT Wholesale Electricity Markets Available at httpswwwpotomaceconomicscomindexphpmarkets_monitoredERCOT 16 Sisyan LLC ldquoDemand Response Desalinationrdquo Available at httprenewabledesalinationcomwpshycontentuploads201506Demand-Response-Desalinationpdf
copy 2016 ERCOT All rights reserved 10
Study on the Demand Response Potential for Seawater Desalination Projects ERCOT Public
In addition the plantrsquos ability to participate in demand response would also be limited for those hours it is reducing load as part of 4CP response or in response to real-time prices because the plant would not be able to reduce its electricity consumption if that demand is already committed to another demand response service Thus participating in demand response versus taking advantage of these other opportunities may be to some extent mutually exclusive
5 Conclusion
Based on this analysis it appears that the operational characteristics of seawater desalination plants would allow them to participate in demand response opportunities in ERCOT so long as the necessary operational requirements are considered in the design specifications of the plant Project developers should consider the necessary requirements early in the plant design Whether the economic benefits of participation would provide a sufficient incentive for them to do so will depend on the costs of accommodating those operational requirements and whether there is the flexibility available to operate the plant as necessary under these programs Though most existing seawater desalination plants do not participate in demand response programs it does appear that participation by these plants is possible and could result in a financial benefit Table 2 compares the different demand response opportunities available to demand-side resources in ERCOT
Table 2 Comparison of Demand Response Opportunities Demand Response
Opportunity Requirements for
Participation Impacts to Plant
Operations Financial Benefit Ancillary Services ndash Responsive Reserve Service (RRS)
bull Under-Frequency Relay bull Instantaneous or 10 minute
response time bull Recover load within 3
hours bull Bid in day-ahead market
bull Deployed once in 2015 for 10 minutes bull Subject to annual
unannounced testing
bull $1087 per MW per hour (based on 2015 prices)
Emergency Response Service (ERS)
bull 10 or 30 minute response time bull Recover load within 10
hours bull Four-month contract term
bull Not deployed in 2015 the most times ever deployed in a single year was twice in 2011 bull Subject to annual
unannounced testing
bull $645 per MW per hour (based on 2015 prices)
Four Coincident bull Interval Data Recorder bull Likely plant will need to bull Avoid ~$48000 per 4CP Peak (4CP) (IDR) meter
bull Ability to predict system-wide peak demand hours during summer months
reduce load multiple times per summer to hit 4CP intervals bull Likely to be able to predict
possible 4CP intervals earlier in day
MW per year (based on 2016 tariffs) if successful in reducing during all four summer months
LSE or DR Provider Contracted Price Response
bull Varies based on contractual arrangements
bull Varies based on contractual arrangements
bull Varies based on contractual arrangements
Self-Directed Price bull Retail contract with bull Varies depending on bull Varies depending on Response exposure to real-time
market prices bull Ability to monitor real-time
prices in ERCOT wholesale market
number and severity of pricing events bull May be able to predict
peak pricing events earlier in day
number and severity of pricing events
copy 2016 ERCOT All rights reserved 11
Study on the Demand Response Potential for Seawater Desalination Projects ERCOT Public
Demand response programs in ERCOT provide opportunities for demand-side resources to defray their electricity costs and provide reliability benefits to the ERCOT electric grid Because the process of seawater desalination is energy intensive participation in demand response could help to reduce electricity costs while posing a relatively low risk to plant operations if demand response participation is factored into plant design
Participation in non-ERCOT-dispatched demand response opportunities such as reducing load during 4CP intervals or in response to real-time electricity prices may also help to reduce electricity costs for seawater desalination plants in Texas As stakeholders in Texas continue to plan for possible future droughts in the region and identify water management strategies consideration of demand response could play a role in mitigating some costs associated with seawater desalination and allow seawater desalination plants to assist with maintaining electric reliability in the region
copy 2016 ERCOT All rights reserved 12
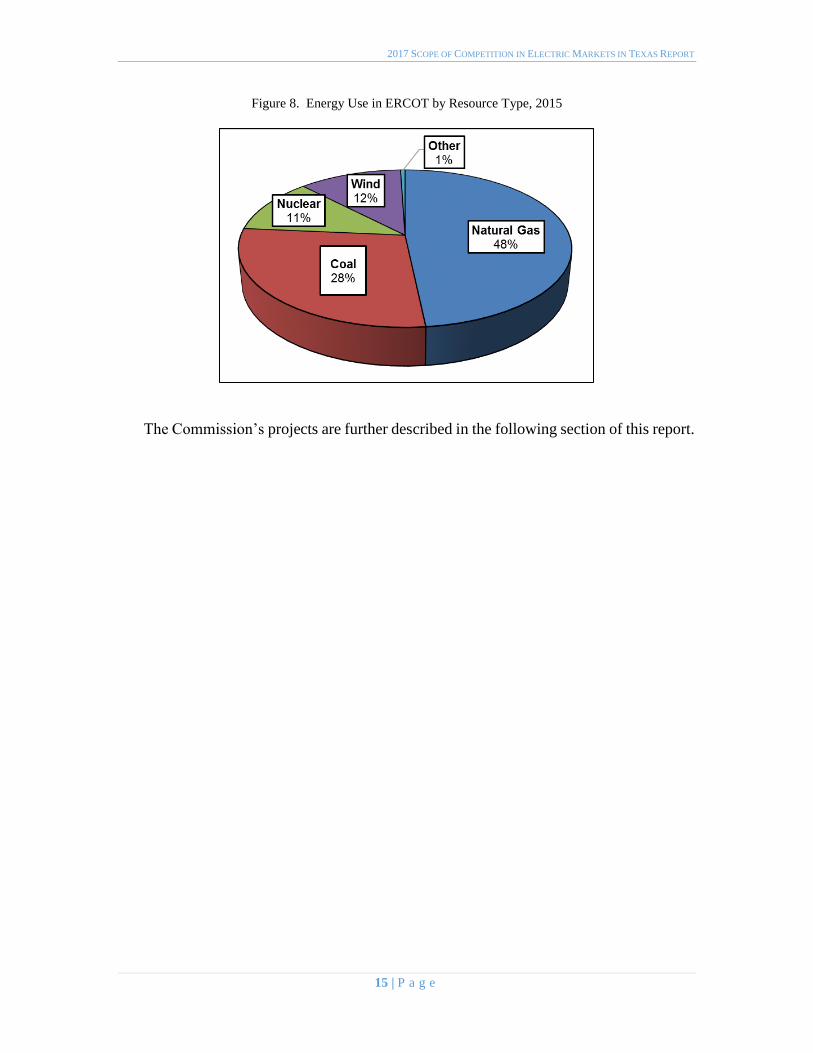
2017 SCOPE OF COMPETITION IN ELECTRIC MARKETS IN TEXAS REPORT
Figure 8 Energy Use in ERCOT by Resource Type 2015
The Commissionrsquos projects are further described in the following section of this report
15 | P a g e
2017 SCOPE OF COMPETITION IN ELECTRIC MARKETS IN TEXAS REPORT
III SUMMARY OF COMMISSION ACTIVITIES FROM 2015 TO 2016
Introduction
The Commission develops and modifies rules policies and procedures for the
competitive electric market in Texas in response to the technological advances in the
industry and the evolving needs of customers The Commission also continues to carry
out oversight of programs with which the Legislature has tasked it ndash such as energy
efficiency renewable energy and advanced metering infrastructure Within the
ERCOT region the monopoly wires-and-poles companies that provide transmission
and distribution services throughout the grid remain subject to traditional rate
regulation by the Commission The Commission continues to set rates for these
utilities as they are not subject to the forces of market competition This section
provides an overview of the Commissionrsquos activities in its oversight of the wholesale and retail electric markets as well as its governance over regulated electric utilities
Resource Adequacy
Resource adequacy is the long-term ability of the system to serve demand reliably
when consumption is highest given the available installed capacity load resources and
the operational reliability of the system Assessing resource adequacy requires comparing
the systemrsquos forecast installed capacity and load resources against the forecast peak
summer load The difference between the forecast of available generation and load
resources and the forecasted demand for electricity is referred to as an ldquoinstalled capacity
reserve marginrdquo which is an indicator of the ability of the system to meet customer demand
during peak conditions In addition to evaluating the forecast reserve margin assessing
resource adequacy includes evaluating the systemrsquos operational reliability The systemrsquos operational reliability depends on the ability of generators to manage plant operations
successfully as well as the grid operatorrsquos ability to manage the system to avoid or to mitigate load curtailment During 2015 and 2016 the ERCOT system performed well with
respect to resource adequacy The Commission has devoted significant attention to
ensuring that ERCOT maintains an adequate installed capacity reserve margin and a high
level of operational reliability developing a wholesale market design that allows
consumers to continue to receive low-cost and reliable electricity over the long term
1 Capacity Demand and Reserves Report
The Capacity Demand and Reserves (CDR) Report published by ERCOT semi-
annually is a snapshot estimate of long-term supply and demand and the associated annual
reserve margin for peak summer and winter conditions While the CDR Report is not a
forecast of any particular outcome it provides insight into possible resource adequacy
trends
16 | P a g e
2017 SCOPE OF COMPETITION IN ELECTRIC MARKETS IN TEXAS REPORT
The May 2016 CDR Report shows estimated reserve margins well above the
current target reserve margin of 1375 Installed capacity reserve margin estimates taken
from this CDR Report are shown below in Table 7
Table 7 May 2016 Capacity Demand and Reserves Report Forecast
Forecast 2017 2018 2019 2020 2021 2022 2023 2024 2025 2026
Peak Load
(MW)
68548 69409 70795 71420 72098 72792 73482 74168 74864 75704
Total
Capacity
(MW)
80995 87019 87238 87407 87678 87738 87738 87728 87728 87728
Reserve
Margin
182 254 232 224 216 205 194 183 172 159
2 Operating Reserve Demand Curve
In ERCOT the price signals produced by the energy-only wholesale electric market
should provide incentives to promote short-term reliability as well as induce optimal long-
run investment in new resources If the prices are efficient and reflect the full cost of
dispatching resources to meet demand the benefits that accrue to both consumers and
producers can be maximized at the least cost and new generating capacity (or load
resources) should develop to maintain the equilibrium as old resources retire or demand
increases
The Operating Reserve Demand Curve (ORDC) implemented at the Commissionrsquos direction in June 2014 improves price formation by allowing prices to more fully reflect
the value of operating reserves The ORDC assigns an economic value to operating
reserves or the amount of extra capacity available to maintain system reliability on a daily
basis
As part of its ongoing review of resource adequacy in ERCOT the Commission is
currently evaluating the accuracy of the inputs to the ORDC to ensure that its contribution
to price formation appropriately reflects the costs of meeting demand and the underlying
needs of the system
3 Transmission Congestion
Although competitive power producers and regulated transmission providers form
two distinct segments of the market transmission buildout has a direct effect on wholesale
power prices When there is insufficient transmission capacity to dispatch energy in a least-
cost fashion the system operator takes action to ensure that the physical limits of the
transmission system facilities are not violated The re-dispatch of generation because of
transmission limits results in disparate prices at different locations on the system In
comparison to prior years transmission congestion in ERCOT has lessened because of the
large increase in transmission investment and the reduction of high demand related to oil
and gas production in West Texas ERCOT and the Commission continually evaluate the
need for cost-effective additional transmission investment to manage congestion
17 | P a g e
2017 SCOPE OF COMPETITION IN ELECTRIC MARKETS IN TEXAS REPORT
4 Wholesale Market Design Initiatives
While the ERCOT wholesale market has been successful in attracting new resource
investment and also maintaining competitive prices for consumers certain improvements
to the market design could yield additional benefits in terms of efficient price formation
and opportunities for entry of new technology Initiatives already in place in many other
regions such as real-time co-optimization and multi-interval real-time resource dispatch
may allow existing capacity to be used more effectively and create opportunities for the
integration of additional load resources to serve electric demand The Commission
continues to work with ERCOT and interested stakeholders to determine the value of
implementing such enhancements particularly as ERCOTrsquos resource mix changes over time
5 Reliability Standard
In early 2014 the Commission opened a project to review its use of a target installed
capacity reserve margin based on a reliability standard equivalent to one loss-of-load event
every ten years In this project the Commission received written comment from interested
parties conducted a public workshop consulted with independent experts and reviewed
the application of reliability standards in other regions As a result of this review future
reliability metrics to be estimated in ERCOT will include the market equilibrium reserve
margin the economically-optimal reserve margin and the associated levels of expected
unserved energy The Commission believes that publishing these metrics represents an
improvement over reporting a one-event-in-ten-years standard by enhancing insight into
expected outcomes in ERCOTrsquos energy-only market
Non-ERCOT Utilities Market Development Activities
SB 7 the law that introduced retail competition to the Texas market in 1999
granted the Commission authority to delay retail competition in an area where deregulation
would not result in fair competition and reliable service because of the lack of an
independent organization to coordinate the electric system and the concentration of
ownership in the generation sector in some of those areas Consequently SB 7 included
provisions recognizing the difficulty of implementing retail competition in areas outside of
ERCOT Therefore the utilities outside of the ERCOT region remain vertically integrated
owning generation transmission and distribution assets as well as selling power to end-
use customers These vertically integrated utilities remain subject to traditional regulation
including rates set by the Commission and customer choice is not offered in the service
territories of these utilities
The Commission does continue to monitor ongoing activities in the non-ERCOT
portions of the state In 2015 the Legislature granted the Commission the authority to
retain counsel and consulting experts in order to participate in legal proceedings at the
Federal Energy Regulatory Commission (FERC) which has regulatory jurisdiction over
wholesale power sales and transmission rates outside of ERCOT This authority has
18 | P a g e
2017 SCOPE OF COMPETITION IN ELECTRIC MARKETS IN TEXAS REPORT
permitted the Commission to participate more effectively in FERC proceedings affecting
Texasrsquo utilities located outside of ERCOT
1 Southwest Power Pool
The Southwest Power Pool (SPP) is the Regional Transmission Operator (RTO) for
areas of Northeast Texas and the Texas Panhandle In Texas the utilities Southwestern
Electric Power Company (SWEPCO) Southwestern Public Service (SPS) and several
electric cooperatives and municipally owned utilities are in SPP In addition to these areas
of Texas the SPP footprint includes parts of New Mexico Arkansas Missouri Nebraska
Louisiana and all of Kansas and Oklahoma In 2015 SPP became the RTO for the
Integrated System and neighboring areas which includes parts of Iowa Minnesota North
Dakota South Dakota Wyoming and Montana SPP has spent extensive time and
resources over the last two years to integrate these new areas successfully The expansion
added 5000 MW of peak demand 7600 MW of generating capacity and 9500 miles of
transmission lines17
In 2014 SPP launched its new Integrated Marketplace which provides a Day-
Ahead Market a Real-Time Balancing Market and Congestion Hedging Markets
mechanisms similar to those available in ERCOT The implementation of the Integrated
Marketplace resulted in a savings of $422 million in 2015 As a result of the Integrated
Marketplace SPPrsquos planning reserve margin will be reduced from 136 to 12 a change
expected to save about $90 million annually
Chairman Donna L Nelson represents the Commission as a voting member on
SPPrsquos Regional State Committee (RSC) The RSC provides collective state regulatory
agency input on a variety of issues In addition the RSC has authority over the cost
allocation methodologies for transmission upgrades allocation of Financial Transmission
Rights and the approach used for resource adequacy across the SPP region The RSC
regularly meets on a quarterly basis and meets more frequently if necessary
2 Midcontinent Independent System Operator
The Midcontinent Independent System Operator (MISO) is an RTO that serves all
or part of 15 states in the central US one Canadian province and the portion of eastern
Texas served by the vertically integrated utility Entergy Texas Inc MISO provides a Day
Two market which has a variety of functions and services including energy and ancillary
service markets economic dispatch congestion management financial transmission rights
and transmission planning The MISO Independent Market Monitor concluded that the
MISO wholesale markets were competitive in 2015
Like SPP MISO is in the Eastern Interconnection which crosses state boundaries
and is therefore subject to FERC jurisdiction A number of recent FERC proceedings have
17 2015 Southwest Power Pool Annual Report Available at
httpswwwspporgdocuments37800201520southwest20power20pool20annual20reportpdf
19 | P a g e
2017 SCOPE OF COMPETITION IN ELECTRIC MARKETS IN TEXAS REPORT
affected the portion of Texas that is in the MISO footprint The Commission through
outside counsel has been an active party in such FERC proceedings FERC Docket No
ER14-1174 addressed in part a dispute regarding the availability of transmission capacity
under the Joint Operating Agreement between MISO and the SPP Ultimately FERC
approved a settlement agreement under which MISO will compensate SPP and its members
for using their or other entitiesrsquo transmission systems
In a related pending docket at FERC Docket No ER14-1736 parties are addressing
how the cost of these payments will be allocated among MISO market participants Parties
in this proceeding are engaged in settlement discussions In addition in Docket No ER14-
75-000 FERC approved a settlement agreement among the participating Entergy
Operating Companies and their retail regulators to terminate the Entergy System
Agreement effective August 31 2016 The settlement terms prohibit any post-termination
payments that roughly equalize production costs among the operating companies after
December 31 2015 terminate certain specific cross-purchase power agreements between
Entergy Texas and former Entergy Gulf State Louisiana and permit the continuation of
several other purchase power agreements
Commissioner Kenneth W Anderson Jr represents the Commission as a voting
member in the Organization of MISO States (OMS) the purpose of which is to coordinate
regulatory oversight among the states in the MISO region and to make recommendations
to MISO FERC and other entities Commissioner Anderson also represents the
Commission as a voting member of the Entergy Regional State Committee (ERSC) which
has certain FERC-approved authority for five years after the Entergy integration with
regard to cost allocation for Entergy transmission projects and adding transmission projects
to the Entergy construction plan The ERSC meets quarterly
3 Western Electricity Coordinating Council
The Western Electricity Coordinating Council (WECC) is a Regional Entity whose
region includes the area surrounding El Paso and extends from Canada to Mexico
including the provinces of Alberta and British Columbia the northern portion of Baja
California and all or portions of the 14 Western states in between WECC is the Regional
Entity responsible for Bulk Electric System reliability in the Western Interconnection and
associated compliance monitoring and enforcement WECC does not have organized
markets outside of California but is organized into 38 separate balancing authorities
WECC is geographically the largest and most diverse of the eight Regional Entities in the
United States with delegated authority from the North American Electric Reliability
Corporation (NERC) and the Federal Energy Regulatory Commission In Texas El Paso
Electric Company is a member of WECC
Rulemaking Activities
The Commission has continued to adopt new rules and modify existing rules in
order to further the continued successful operation of the competitive retail and wholesale
markets and to comply with statutory changes made to PURA by the Legislature This
20 | P a g e
2017 SCOPE OF COMPETITION IN ELECTRIC MARKETS IN TEXAS REPORT
section of the Report provides a high-level overview of the Commissionrsquos key rulemaking
activities highlighting the market improvements made in 2015 and 2016
1 Cost Recovery and Rate Adjustment
The Commission adopted new rule 16 TAC sect25246 on June 29 2016 to
implement Section Nos 1 through 3 of House Bill 1535 of the 84th Legislature The new
rule only applies to a utility that operates solely outside of ERCOT and allows for the use
of an update period beyond the test year for which the utility initially files estimated
information The rule clarifies that all information originally estimated must be updated
with actual information and also provides requirements for a post-test-year adjustment for
a natural gas-fired plant A non-ERCOT utility also is required to initiate a new base rate
case on or before the four year anniversary of the final order in the utilityrsquos most recent comprehensive base rate case or if the commission determines that the utility has
materially earned more than its authorized rate of return in two consecutive years The rule
also provides requirements and procedures for the relation back of final rates to an effective
date 155 days after the filing of the rate application
2 Changes to Certificates of Convenience and Necessity and CREZ Rule
The Commission conducted a rulemaking to implement changes pursuant to
Legislative mandates in SB 776 SB 933 and HB 1535 of the 84th Legislature SB 776
required municipally owned utilities to apply for a certificate of convenience and necessity
(CCN) before constructing transmission facilities outside the boundaries of the
municipality that owns the municipally owned utility SB 933 also requires persons to
obtain a CCN before interconnecting a tie line into the ERCOT grid HB 1535 requires the
Commission to issue a final order within 181 days for a non-ERCOT utility requesting a
CCN for an existing electric generating facility and 366 days after a non-ERCOT utility
files a CCN for a newly constructed generating facility In addition the Commission also
determined in this rulemaking that all future transmission projects in a Competitive
Renewable Energy Zone (CREZ) must meet the need criteria of PURA sectsect 37056(c)(1)
and (2) rather than being exempt Finally the Commission determined that the CREZ
project established in 2008 was complete following the installation of a second circuit on
a Sharyland line
3 Use of Handheld Device for Enrollment
As the market evolves the Commission evaluates market changes balancing its
desire to encourage customer-focused innovation with its concern for customer protection
against potential abuses In Docket No 44518 the Commission granted a REP a
temporary 12-month waiver from its rules requiring the marketer to obtain telephonic
verification of the customerrsquos desire to switch REPs as well as a waiver from certain authorization disclosure requirements among other stipulations the Commission placed
upon the REP The Commission then opened Project No 45625 to study the issue of REPs
utilizing hand-held devices for customer enrollment more broadly and engage with market
representatives consumer representatives and other stakeholders The Commission
anticipates considering an amendment to its rules in the spring of 2017
21 | P a g e
2017 SCOPE OF COMPETITION IN ELECTRIC MARKETS IN TEXAS REPORT
4 Smart Meter Texas Portal
The electric utilities in Texas that have advanced metering systems (AMS) jointly
own and operate a single web portal known as Smart Meter Texas (SMT)18 SMT fulfills
two requirements imposed by the Commissionrsquos advanced metering rule on a utility with
AMS (1) provide to the retail customer the REP serving the customer and other entities
authorized by the customer access to such retail customerrsquos consumption data and (2)
allow devices at the customerrsquos premises to communicate through a home area network with the advanced meter at the premises SMT also facilitates near real-time on-demand
reads of a customerrsquos meter that aids prepaid service offered by certain REPs
In Project No 42786 Review of Advanced Metering System Web Portal
Commission staff and stakeholders examined options for the long-term operational
structure governance and funding of SMT The Commission determined that ownership
of SMT should remain with the TDUs because they can operate the portal at a lower cost
than transferring the data repository to ERCOT The Commission opened two
rulemakings one to ascertain the appropriate governance performance and funding of
SMT and a second to determine the appropriate access for third parties ensuring that
customers have the freedom to grant and give third parties access to their data if made
knowingly while also securing customer privacy
Sharyland Utilities
In early 2015 customers of Sharyland Utilities the smallest investor-owned
transmission and distribution utility in ERCOT began to file with the Commission a
significant number of complaints regarding high electricity bills In response the
Commission opened Project No 44592 Relating to a Project Regarding Sharyland
Utilities to provide for a more formal process for Commission review of the large number
of complaints As part of this project Commission staff prepared a report to evaluate the
electricity rates and electric bills in the operating area of Sharyland Utilities that was
previously part of Cap Rock Energy
Staffrsquos report found that a number of factors contributed to the comparatively high
bills for many of Sharyland-Cap Rockrsquos customers First Sharylandrsquos small size and its low customer density result in high TDU rates for all customers relative to other TDUs In
particular Staffrsquos report found that Sharyland-Cap Rockrsquos rates for distribution service are
up to three times higher than those of other TDUs in Texas In addition to Sharyland-Cap
Rockrsquos high costs for distribution service higher wholesale transmission costs also
contributed to the rate increases charged to Sharyland-Cap Rockrsquos customers These transmission costs are the result of increased transmission investment in recent years
throughout Texas that has increased transmission costs for all distribution providers
18 The participating Texas TDUs are AEP Texas Central Company and AEP Texas North Company (jointly
ldquoAEPrdquo) CenterPoint Energy Houston Electric LLC (ldquoCenterPointrdquo) Oncor Electric Delivery Company LLC (ldquoOncorrdquo) and Texas-New Mexico Power Company (TNMP) collectively referred to as the ldquoJoint TDUsrdquo Operation of an AMS web portal was addressed in the orders approving particular utilitiesrsquo deployment of AMS and approving surcharges for AMS cost recovery While Sharyland Utilities filed comments in the proceeding it did not
participate as it had not fully completed its AMS deployment at the time
22 | P a g e
2017 SCOPE OF COMPETITION IN ELECTRIC MARKETS IN TEXAS REPORT
including Sharyland Utilities Second the comparatively colder winter of 2014 ndash 2015
which was the time period generally consistent with the timeframe in which the
Commission began receiving complaints appeared to result in higher electricity usage than
normal This combination of high TDU rates and the higher electricity usage led to higher
bills for customers
Staffrsquos report also noted that in Sharyland-Cap Rockrsquos last rate case in 2014 the
approved rates reflected movement towards more cost-based rates for all customers
including some customers that previously had been heavily subsidized by other customers
Additionally in the process of standardizing Sharyland-Cap Rockrsquos customer classification
with the classifications of the other TDUs in Texas some customers may have experienced
a move from one class that previously was paying below-cost rates to another class that
was now paying above-cost rates For some of these customers the combined effects of
the movement towards cost-based rates and the change to a different class may have
contributed to a significant change in the customersrsquo rates Regardless of any cost-shifting
between customer classes Sharylandrsquos rates remain two to three times higher than those of other TDUs in Texas for all customers in all classes
On December 4 2015 the Commission signed an order directing Sharyland to file
an application for a comprehensive rate review by April 30 2016 Sharyland filed its rate
application on April 29 2016 in Docket No 45414 Review of the Rates of Sharyland
Utilities LP On October 10 2016 the Commission ordered Sharyland to file an amended
application as soon as practicable but no later than January 1 2017 to reflect the unique
aspects of the companyrsquos organizational structure as a real estate investment trust (REIT) At the time of publication Sharyland is expected to file its amended application in
December 2016
PowerToChoose Website
As part of its ongoing evaluation of the competitive market the Commission
opened Project No 45730 to evaluate the functionality and usability of its PowerToChoose
website which allows customers to select a REP and an electric plan based on their zip
code In the process the Commission received significant feedback from customers stating
that the Commissionrsquos PowerToChoose website was an important tool that plays a
fundamental role in their shopping process In response to the feedback received from
industry representatives and consumers Commission staff changed how the website sorts
and filters retail electric plans adding a filter to allow customers to unselect plans that
contain minimum usage fees or credits This filter is now a default setting and plans with
minimum usage fees and credits are not shown unless the customer actively selects to
search for such plans In addition Commission staff made other changes to increase the
clarity of the REP complaint rating The Commission continues to evaluate other changes
to improve the customer experience of the PowerToChoose website and provide
transparency for retail electric plans
23 | P a g e
2017 SCOPE OF COMPETITION IN ELECTRIC MARKETS IN TEXAS REPORT
Report on Alternative Ratemaking Mechanisms
In 2015 the Legislature enacted SB 774 which requires the Commission or its
consultant to conduct a study and make a report to the Legislature analyzing the alternative
ratemaking mechanisms adopted by other states In addition SB 774 extended the
authorization for the Periodic Rate Adjustment (PRA) mechanism from 2017 to 2019
which the Legislature had authorized in 2011 (SB 1693) as a version of an alternative
ratemaking mechanism that provides to utilities a means for expedited recovery of
distribution infrastructure costs Pursuant to SB 774 the Commission retained a consultant
to produce the report and the consultantrsquos recommendations included streamlining the ratemaking process to reduce procedural costs providing for a periodic review of the
prudency of the costs and using certain types of alternative ratemaking mechanisms that
decouple the recovery of costs from variations in load The Commission held a public
hearing to receive comments on the report from stakeholders and after consideration of
those comments has provided to the Legislature the consultantrsquos report together with its
own discussion of the report
Request for Purchase of Oncor Electric Delivery Company
In March 2016 the Commission approved with conditions an application by an
investor group led by Hunt Consolidated Inc the owners of Sharyland Utilities to acquire
control of Oncor Electric Delivery Company (Oncor) the largest transmission and
distribution utility in Texas from Oncorrsquos parent company Energy Future Holdings which
is in bankruptcy The Commission approved the request subject to certain conditions
including stipulations regarding the organization of the new entities and treatment of tax
benefits The investor-led group subsequently declined to pursue the transaction that was
approved by the Commission
In September 2016 NextEra Energy which owns Florida Power amp Light received
approval from the United States Bankruptcy Court in Delaware for its plan to purchase
Oncor In October 2016 NextEra Energy filed an application with the Commission in
Docket No 46238 for approval of the proposed transaction The Commission will evaluate
the application to determine if the transaction is in the public interest
Integration of Lubbock Power and Light
In March 2016 the Commission opened Project No 45633 to study and identify
the issues related to the request of Lubbock Power and Light the statersquos third-largest
municipally owned utility to be integrated into ERCOT The Commission is currently
working with stakeholders ERCOT and SPP to determine the cost and benefits of any
potential switch by Lubbock Power and Light into ERCOT and whether such a switch is
in the public interest
24 | P a g e
2017 SCOPE OF COMPETITION IN ELECTRIC MARKETS IN TEXAS REPORT
Desalination Project ERCOT Studies
In 2015 the Legislature passed HB 4097 which directed the Commission and
ERCOT to study whether existing transmission and distribution planning processes are
sufficient to provide adequate infrastructure for seawater desalination projects and to study
the potential for desalination projects to participate in demand response opportunities in
the ERCOT market Pursuant to that direction ERCOT staff have prepared a report on the
feasibility of interconnection of large desalination projects and on opportunities for such
projects to participate in ERCOTrsquos demand response programs which is attached to this Report in Appendix B
Oversight and Enforcement Actions
The Commissionrsquos enforcement of statutes rules and orders applicable to entities
under its jurisdiction serves to protect consumers the electric markets the reliability of the
electric grid and to promote fair competition The Commissionrsquos enforcement efforts in the electric industry focus on violations of PURA the Commissionrsquos rules and ERCOT
protocols
During the period from January 2015 through August 31 2016 the Commission
assessed $3258500 in penalties against electric market participants Table 8 provides a
summary of electric industry Notices of Violation since January 2015 During 2015 and
2016 Commission staff opened 212 investigations for the electric industry and closed 177
investigations
Table 8 Notices of Violations
Violation Type Total Penalty Amount
Retail Market Violations $539000
Service Quality Violations $451500
Wholesale Market Violations $2268000
TOTAL $3258500
In addition to the imposition of administrative penalties the Commission uses other
enforcement mechanisms in exercising its enforcement duties including revoking a
companyrsquos certificate to operate In addition some companies may be required to relinquish a certificate as part of a settlement after enforcement action has proceeded
Table 9 provides a breakdown of the number of certificates revoked or relinquished In
2016 the Commission revoked the certificate of the REP TruSmart Energy
Table 9 Certificates Revoked or Relinquished
Type Number
Certificates Revoked 1
Certificates Relinquished 0
25 | P a g e
2017 SCOPE OF COMPETITION IN ELECTRIC MARKETS IN TEXAS REPORT
The Oversight amp Enforcement division also issues warning letters to companies in
the electric market when it determines that a violation occurred but given the
circumstances surrounding the violation and other mitigating concerns no administrative
penalty is warranted During 2015 and 2016 the Oversight amp Enforcement division issued
50 warning letters Finally the Commission generally seeks to reimburse money directly
to customers when appropriate In 2015 and 2016 the Commission ordered the
reimbursement of $8543596 to Texas electric customers
Table 10 Warning Letters
Warning Letter Type Number
Retail Market Warning Letter 8
Service Quality Warning Letter 1
Wholesale Market Warning Letter 41
TOTAL 50
In addition to its enforcement activities the Commission also enters into voluntary
mitigation plans with generators that request one through a contested case proceeding
pursuant to PURA sect15023(f) and 16 TAC sect25504(e) The Commission entered into one
voluntary mitigation plan during 2015 and 2016 in Docket No 44635
Low-Income Discount System Benefit Fund
The System Benefit Fund (SBF) was originally established in 1999 to fund
discounts to low-income customers customer education activities energy-efficiency and
weatherization and electric market oversight through a nonbypassable surcharge on retail
electric bills HB 1101 of the 84th Legislature provided that the SBF be sunset on
September 1 2017 by which time the SBF is intended to be exhausted In the 2016 Fiscal
Year (FY) $325521250 was appropriated in the SBF to provide a 25ndash31 percent discount
to low-income customers over a 12-month period
To assist the drawdown of the remaining balance HB 1101 authorized the
Commission to use any unexpended SBF balance in FY 2017 to assist low-income
customers The Commission estimates that the remaining SBF balance will be
approximately $17 million by August 31 2017 The Commission has determined that this
amount is insufficient to fund the rate reduction program however the Commission will
spend approximately $100000 to continue automatic enrollment in the program to provide
REPs a list of customers eligible to receive late fee waiver and deposit installment benefits
These two ancillary benefits of the rate reduction program will continue for the duration of
FY 2017
26 | P a g e
2017 SCOPE OF COMPETITION IN ELECTRIC MARKETS IN TEXAS REPORT
Homeland Security
The Commission assesses the efforts of ERCOT and utilities to defend against
mitigate and respond to the variety of risks that the modern electricity system faces The
Commission also meets with ERCOT utilities and governmental entities on an ongoing
basis to discuss preparation for everything from hurricanes and other severe weather to
cyber-threats and threats of physical damage to the grid from accidents or intentional
malfeasance In addition the Commission monitors industry and federal programs that
address homeland security issues
The Commission serves as an information liaison between state government and
electric utilities during emergencies The Commissionrsquos main roles include
Conveying outage and service restoration information from electric utilities to
state government
Conveying service restoration priorities (hospitals water treatment facilities
etc) from state government to electric utilities and
Facilitating the clearance of downed power lines in disaster re-entry areas and
facilitating entry of electric utilities into disaster areas
The Commissionrsquos Emergency Management Response Team (EMRT) provided staff at the
State Operation Center for the May 2015 and April 2016 flooding events in Texas as well
as additional staffing for severe winter weather
Demand Response
ERCOT staff have begun to report annually on the participation of customers in
REP-sponsored demand response programs These programs which have been facilitated
by the deployment of smart meters throughout the competitive areas within ERCOT and
by many municipal and cooperative electric utilities take the form of rebates for reduction
in usage during peak period time-of-use pricing real-time volumetric price compensation
for load reduction and direct control of customer load among other plans
These programs have seen dramatic increases in participation since ERCOT began
to gather this information in 2013 From 2013 to 2014 the number of residential customers
participating in these programs increased from 151793 to 721273 and the number of
commercial and industrial customers participating rose from 30275 to 50205 The
Commission continues to monitor ERCOTrsquos stakeholder process for efforts relating to the integration of demand response
27 | P a g e
2017 SCOPE OF COMPETITION IN ELECTRIC MARKETS IN TEXAS REPORT
IV LEGISLATIVE RECOMMENDATIONS
A Determination of Low-Income Customer Eligibility
In 2015 HB 1101 required that all remaining funds in the System Benefit Fund
(SBF) be expended that the fee that funded the program as a nonbypassable surcharge on
electric bills be set at zero and that the SBF be sunset on September 1 2017 Per the
provisions of HB 1101 the SBF fee was set at zero in September 2016 concluding the
funding for the program The sunset of the SBF program also concluded the relationship
between the Texas Health and Human Services Commission (HHSC) and the Commission
in which the HHSC provided to the Commission eligible electric customers for the SBF
low-income discount Because of the termination of the relationship with HHSC with the
termination of the SBF the Commission will no longer be able to determine easily an
electric customerrsquos eligibility for other low-income programs such as late penalty waivers
and the option of paying an electric deposit over multiple months
The Legislature may wish to consider easing low-income customers access to these
low-income programs by facilitating the process used to determine eligibility The
Commission offers four possible approaches in which the Legislature could continue these
low-income programs
(1) Authorize HSSC to provide identification of eligible low-income customers to the
Commission
(2) Allow retail electric providers (REPs) to provide such low-income programs using
the Low Income Discount Administratorrsquos (LIDA) Telecommunications Lifeline
Service Program list to identify low-income customers
(3) Require REPs to offer such low-income programs with customers self-enrolling
and REPs verifying income eligibility or
(4) Allow REPs to voluntarily provide such low-income programs at their own
discretion
B Outside Counsel for Proceedings before Regional Transmission
Organizations
Regional Transmission Organizations (RTO) manage the power grid across wide
regions of the United States Most of Texas is inside the ERCOT region however there
are significant portions of East Texas and the Panhandle that are in the Midcontinent
Independent System Operator (MISO) and the Southwest Power Pool (SPP) Issues arise
in these other RTOs that have significant impact on Texas ratepayers such as how
transmission infrastructure costs will be shared These tend to be very lengthy and
complicated proceedings that require specialized legal and consulting services
28 | P a g e
2017 SCOPE OF COMPETITION IN ELECTRIC MARKETS IN TEXAS REPORT
PURA sect 394525 currently authorizes the Commission to use outside consultants
auditors engineers or attorneys to represent the Commission in proceedings before the
Federal Energy Regulatory Commission This provision has been an important tool for the
Commission to respond to complex matters in the federal arena to enable it to protect the
public interest in Texas The PUC recommends that the Legislature expand the language
in this statute to include the ability to hire outside assistance for proceedings before other
RTOs to provide those same protections to Texas ratepayers in those areas
C Repeal of Natural Gas and Renewable Energy Mandates
1 Natural Gas
PURA sect 399044 establishes natural gas as ldquothe preferential fuelrdquo in Texas for electricity generation and requires the Commission to adopt rules to establish a system of
natural gas energy trading credits The majority of all new non-renewable electricity
generation constructed since 2000 for Texas has used natural gas as a primary fuel and this
trend is expected to continue in the foreseeable future The thresholds used to trigger the
natural gas energy trading credit system in PURA sect 399044 have not been reached and
they are not expected to be reached in the foreseeable future
Because natural gas-fueled facilities have been the most commonly built new
generation in Texas for many years and are expected to continue to be there is no need to
establish incentives for natural gas generation The PUC recommends that the Legislature
consider repealing PURA sect 399044 because it is no longer necessary
2 Renewable Energy
PURA sect 39904 establishes goals for renewable energy Subsection (a) requires
the installation of 5880 megawatts of renewable energy by 2015 and Subsection (b)
establishes a renewable energy credits trading program to implement the requirement The
5880 megawatts mandates in Subsection (a) was met in 2008 While the Commission
believes the renewable energy trading credit program is needed for retail electric providers
to validate renewable energy marketing claims the Commission believes the 5880
megawatts mandate in Subsection (a) is no longer necessary
D Advisory Opinions
Many regulatory agencies in Texas have authority to issue informal guidance to the
persons they regulate particularly with respect to outlining whether a particular course of
conduct would in the agencyrsquos view be consistent with the laws and regulations that the agency administers19 The issuance of an advisory opinion can provide regulatory clarity
to a company before making investments or conducting operations the permissibility of
which may be unclear under state law The Legislature may want to consider granting the
19 In addition certain federal agencies such as the Federal Communications Commission
Internal Revenue Service Securities and Exchange Commission and Federal Election
Commission have authority to issue advisory opinions
29 | P a g e
2017 SCOPE OF COMPETITION IN ELECTRIC MARKETS IN TEXAS REPORT
Commission the authority to issue advisory opinions In the electric industry providing
clarification to a company concerning issues such as the purchase of assets or the
acquisition of another company could allow it to avoid expensive regulatory proceedings
without impairing the Commissionrsquos authority The following state agencies have statutory authority to issue advisory opinions
Texas Ethics Commission20
Texas Medical Board21
State Board of Dental Examiners22
Texas Board of Nursing23
Texas Board of Professional Engineers24
Texas Lottery Commission and25
Texas Securities Board26
E Administrative
Gross Receipts Assessment
PURA sect 16001 provides for a gross receipts assessment that is used to defray the
expenses incurred by the Commission to administer PURA An assessment of one sixth of
one percent is collected from public utilities electric cooperatives retail electric providers
and interexchange carriersrsquo gross receipts from consumers The funds from this assessment
are remitted to the general revenue fund but currently they have not been explicitly
dedicated to funding of the Commission In contrast similar assessments on water
utilities insurance companies and other regulated entities have traditionally been used to
explicitly fund the underlying regulatory programs at the respective agencies The
Commission is one of four Article VIII agencies that is not designated as self-funded
The Commission recommends that the Legislature designate the Commission as a
self-funded agency whereby the collected assessments would be explicitly dedicated to the
funding of the agency Implementing this recommendation would require the Public Utility
Commission to be included in the Appropriations Limited to Revenue Collections rider
located in the Special Provisions Relating to All Regulatory Agencies section of the
General Appropriations Act Designation as a self-leveling agency would require the
Commission to set the gross receipts assessment at a rate sufficient to generate revenue in
the amount of the agencyrsquos general revenue appropriation each fiscal year which would require a statutory change to PURA sect16001(b) Based upon the Commissionrsquos baseline budget request authorizing the PUCrsquos self-leveling designation would result in an overall
estimated tax reduction of $456 million per year or 774
20 Government Code sect 571091 21 Occupations Code sect 162107 22 Occupations Code sect 258157 23 Occupations Code sect 301607 24 Occupations Code sect 1001601 25 Occupations Code sect 2001059 26 Tex Rev Civ Stat Ann Arts 581-28-1 amp 581-35 7 Tex Admin Code 1012
30 | P a g e
2017 SCOPE OF COMPETITION IN ELECTRIC MARKETS IN TEXAS REPORT
V APPENDICES
31 | P a g e
2017 SCOPE OF COMPETITION IN ELECTRIC MARKETS IN TEXAS REPORT
Appendix A ndash Acronyms
AEP American Electric Power
AMS Advanced Metering System
CenterPoint CenterPoint Energy Houston Electric LLC
DG Distributed Generation
DRG Distributed Renewable Generation
ERCOT Electric Reliability Council of Texas
ERSC Entergy Regional State
ERS Emergency Response Service
ETI Entergy Texas Inc
IMM ERCOT Independent Market Monitor
kWh Kilowatt-hour
LMP Locational Marginal Pricing
LSP Large Service Provider
MISO Midwest Independent System Operator
MMBtu One million British Thermal Unit (BTU)
MW Megawatt
MWh Megawatt-hour
Nodal Texas Nodal Market Design
ORDC Operating Reserve Demand Curve
PGC Power Generation Company
POLR Provider of Last Resort
PURA Public Utility Regulatory Act
REP Retail Electric Provider
RSC Regional State Committee
RTO Regional Transmission Organization
SCED Security Constrained Economic Dispatch
Sharyland Sharyland Utilities LP
SBF System Benefit Fund
SPP Southwest Power Pool
TDU Transmission and Distribution Utility
TNMP Texas-New Mexico Power Company
32 | P a g e
2017 SCOPE OF COMPETITION IN ELECTRIC MARKETS IN TEXAS REPORT
Appendix B ndash ERCOT Desalination Report
This page intentionally left blank
33 | P a g e
ERCOT Public
Study on the Demand Response Potential for Seawater Desalination Projects
ERCOT November 18 2016
Study on the Demand Response Potential for Seawater Desalination Projects ERCOT Public
Executive Summary
In 2015 the 84th Texas Legislature enacted House Bill (HB) 4097 which included several provisions relating to seawater desalination projects including a requirement that the Public Utility Commission of Texas (PUC) and Electric Reliability Council of Texas (ERCOT) study the potential for seawater desalination projects to participate in existing demand response opportunities in ERCOT There are several demand response products in which demand-side resources (ie consumers of electricity) can participate These programs help to preserve system reliability and provide economic benefits to participating demand-side resources Seawater desalination is an energy-intensive process that removes salt and other minerals from salt water to produce fresh water for municipal consumption industrial use or irrigation Participation in demand response could help mitigate electricity costs for future seawater desalination projects in Texas and provide reliability benefits to the grid
There are two main demand response reliability-based services administered by ERCOT participation by demand-side resources in the Ancillary Services market and the Emergency Response Service (ERS) Within the Ancillary Services market the most common service provided by demand-side resources is Responsive Reserve Service (RRS) which requires resources to respond either instantaneously or within 10 minutes in response to unplanned system emergencies ERS is separate from ERCOTrsquos Ancillary Services market and allows demand-side resources and distributed generation to provide reliability services in the event of an energy emergency Resources can qualify for either the 10-minute or 30-minute response time ERS programs
There are several key considerations that will impact a demand-side resourcersquos ability to participate in different demand response opportunities response time recovery time predictability of electrical demand and flexibility of operations Considering these factors together it appears that seawater desalination plants could be designed to meet the requirements for participation in demand response Because the ability to meet the qualification requirements is dependent on the plant design demand response opportunities should be considered early in a projectrsquos development if participation is desirable
Whether project developers will choose to address these requirements will depend on the economic benefits of participation There may be additional costs to design seawater desalination plants to operate in the manner required in order to participate in demand response These include costs associated with additional plant design specifications need for excess capacity and storage to make up for lost production during demand response deployment operational costs resulting from interruptions to plant processes and potential financial penalties if demand response deployment results in failure to meet contract demands The interplay of the benefits of participation and these costs will determine whether it would be beneficial for a future seawater desalination plant to participate in demand response in ERCOT
To date participation of seawater desalination plants in demand response programs has been limited Because the process of seawater desalination is energy-intensive participation in demand response could help to reduce electricity costs while posing a relatively low risk to plant operations As stakeholders in Texas continue to plan for possible future droughts in the region and identify water management strategies consideration of demand response could play a role in mitigating some costs associated with seawater desalination and allow seawater desalination plants to assist with maintaining electric reliability in the region
copy 2016 ERCOT All rights reserved i
Study on the Demand Response Potential for Seawater Desalination Projects ERCOT Public
Table of Contents
1 Introduction 1
2 Seawater Desalination 2
21 Seawater Desalination Plant Operations 2
22 Seawater Desalination Plant Economics 3
3 Demand Response Opportunities in ERCOT 4
31 ERCOT-Dispatched Demand Response 4
311 Ancillary Services Markets 5
312 Emergency Response Service (ERS) 5
32 Non-ERCOT-Dispatched Demand Response 6
321 Four Coincident Peak (4CP) 6
322 LSE or DR Provider Contracted Price Response 6
323 Self-Directed Price Response 6
4 Demand Response Potential for Seawater Desalination 7
41 Operational Considerations for ERCOT-Dispatched Demand Response 7
42 Economic Considerations for ERCOT-Dispatched Demand Response 8
43 Considerations for Non-ERCOT-Dispatched Demand Response 9
5 Conclusion 11
copy 2016 ERCOT All rights reserved ii
Study on the Demand Response Potential for Seawater Desalination Projects ERCOT Public
1 Introduction
In 2015 the 84th Texas Legislature enacted House Bill (HB) 4097 which included several provisions relating to seawater desalination projects including a requirement that the Public Utility Commission of Texas (PUC) and Electric Reliability Council of Texas (ERCOT) study the potential for seawater desalination projects to participate in existing demand response opportunities in ERCOT ERCOT and the PUC initiated this study to fulfill that requirement and evaluated the operational and economic characteristics of seawater desalination plants in light of ERCOTrsquos primary demand response products1
ERCOT is the independent system operator (ISO) for the ERCOT Interconnection which encompasses approximately 90 of demand for electricity in Texas ERCOT is the independent organization established by the Texas Legislature to be responsible for the reliable planning and operation of the electric grid for the ERCOT Interconnection ERCOT also administers and maintains a forward-looking open market to provide affordable and reliable electricity to consumers in Texas In collaboration with market participants ERCOT has developed demand response products and services for customers that have the ability to reduce or modify electricity use in response to instructions or signals These programs help preserve system reliability and provide economic benefits to participating demand-side resources
The process of seawater desalination removes salt and other minerals from salt water to produce fresh water for consumption industrial processes or irrigation The drought-prone Texas climate coupled with projections for increasing water demand in the state has created interest in seawater desalination as a future water source The 2017 Texas State Water Plan includes seawater desalination as a future water management strategy for water users in the state However the seawater desalination process is energy intensive and electricity consumption can be a significant cost driver for these projects To the extent that these plants could participate in demand response it would help to defray these costs Thus there is a potential nexus between seawater desalination projects built in Texas to mitigate drought but which have large electricity requirements and ERCOT demand response opportunities which could help to reduce their electricity costs and provide reliability benefits
This study evaluates the demand response potential of seawater desalination plants based on their operational characteristics and economic drivers The report is organized as follows
Section 2 provides background on typical seawater desalination plant operations and economics
Section 3 describes the current demand response opportunities in ERCOT
Section 4 evaluates the characteristics of seawater desalination plants to determine their potential to participate in demand response opportunities in ERCOT and
Section 5 provides a summary of the conclusions of this study
1 In the course of developing this report ERCOT consulted with several desalination experts with experience with existing or planned seawater desalination plants in the US The technical experts consulted included Jorge Arroyo (Water Management Consultant) Andrew Chastain-Howley (Black amp Veatch) Jonathan Loveland (Black amp Veatch) Ron Parker (Black amp Veatch) John Wolfhope (Freese and Nichols) and Srinivas Veerapaneni (Black amp Veatch)
copy 2016 ERCOT All rights reserved 1
Study on the Demand Response Potential for Seawater Desalination Projects ERCOT Public
2 Seawater Desalination
There are two primary methods for seawater desalination distillation (also referred to as ldquothermalrdquo) and reverse osmosis Distillation uses heat to remove salts and minerals from seawater by boiling water at high pressures In contrast reverse osmosis technology forces saline water through a membrane to separate water from the salts and minerals While both distillation and reverse osmosis are energy intensive distillation requires thermal energy to heat the water and overall has a higher energy requirement whereas reverse osmosis requires primarily electrical energy and overall is less energy intensive ndash though still with significant electricity requirements
Globally most thermal desalination plants are located in the Middle East due to low energy prices in the region Plants located elsewhere including in the US typically use reverse osmosis technology2 There are two large existing seawater desalination plants in the US one in Carlsbad California providing water to the San Diego area and one in Gibsonton Florida providing water to the Tampa Bay area Both plants use reverse osmosis technology In addition there are several desalination projects currently in the planning stages or under development in Texas in the Corpus Christi area that would use reverse osmosis technology For that reason this report focuses on reverse osmosis technology in the evaluation of demand response potential of seawater desalination plants
While there are currently no existing seawater desalination plants in Texas there are several municipal and industrial brackish water desalination plants in the state According to the Texas Water Development Board (TWDB) there are 46 municipal brackish water desalination plants with capacities greater than 0025 million gallons per day (MGD) in Texas representing a total of 123 MGD of capacity3 The desalination of brackish water is typically less expensive compared to seawater due to the lower relative salinity of brackish water This study focuses exclusively on seawater desalination consistent with the requirements of HB 4097 but it should be noted that conclusions may also apply to brackish water desalination though at a different cost and scale
This section provides high-level information on the operations (Section 21) and economics (Section 22) of seawater desalination plants to inform the discussion of their demand response potential in Section 4
21 Seawater Desalination Plant Operations Seawater desalination plants typically range in capacity from less than 5 MGD up to 165 MGD For example the Carlsbad seawater desalination plant has a capacity of approximately 50 MGD and the plant in Tampa Bay has a capacity of approximately 25 MGD The associated electricity consumption ranges between 10 and 15 kWh1000 gallons produced depending on the salinity of the water being processed456 More saline water (eg seawater) requires larger amounts of electricity for desalination Thus a seawater desalination plant would have larger electricity consumption requirements compared to a similarly sized brackish water desalination plant
2 American Water ldquoInnovation Solutions within the Water Industry Desalinationrdquo Available at httpwwwamwatercomfilesInnovationsSolutionsWithinTheWaterIndustryDesalinationpdf 3 Texas Water Development Board ldquoDesalination Factsrdquo Available at httpswwwtwdbtexasgovinnovativewaterdesalfactsasp 4 American Membrane Technology Association April 2016 ldquoMembrane Desalination Power Usage Put in Perspectiverdquo Available at httpwwwamtaorgcomwp-contentuploads7_MembraneDesalinationPowerUsagePutInPerspectivepdf 5 Water Reuse Association November 2011 ldquoSeawater Desalination Power Consumptionrdquo Available at httpswatereuseorgwpshycontentuploads201510Power_consumption_white_paperpdf 6 Ghaffour N TM Missimer and G Amy January 2013 ldquoTechnical review and evaluation of the economics of water desalination Current and future challenges for better water supply sustainabilityrdquo Desalination 309 pp197-207 Available at httpswwwresearchgatenetpublication256693140_Technical_review_and_evaluation_of_the_economics_of_water_desalination_ Current_and_future_challenges_for_better_water_supply_sustainability
copy 2016 ERCOT All rights reserved 2
Study on the Demand Response Potential for Seawater Desalination Projects ERCOT Public
While the two existing seawater desalination plants in the US were co-located with power plants to ease compliance with regulations on water intake and discharge structures and reduce costs many other reverse osmosis desalination plants receive their electricity from the grid However plants may have on-site backup generation in case of a power outage This will vary depending on the size and design of the plant and other factors For example the Carlsbad plant in California does have diesel backup generation to power control systems and flushing systems in the case of a power outage The plant in Tampa Bay was not built with backup power due to potential storm surge risks from hurricanes and other storms The plant does use uninterruptible power supply (UPS) backup to power control systems during power outages
Reverse osmosis plants are typically designed with several ldquotrainsrdquo which consists of a high-pressure pump turbine and reverse osmosis membrane Desalination plants are turned on or off one train at a time in a highly controlled process The process of ramping up or down an individual train under normal operations typically takes one to two hours While plants can be designed to handle immediate shutdowns (ie in a power outage) re-starting a system after an interruption would take this amount of time In addition the saline water must be pretreated (ie filtered) before going through the reverse osmosis train and this can sometimes pose constraints on the flexibility of operations
Demand for water is the key factor driving the level of production at seawater desalination plants Typically the plant will have a contract or contracts with municipal or other water users to deliver desalinated water and is operated to meet that demand Alternatively if the plant is municipally owned it would similarly be operated to meet the level of water demand in conjunction with other available water sources If water demands are close to a plantrsquos full capacity the operatorrsquos flexibility to adjust its electricity consumption as part of demand response may be limited However this does mean that plant operations are fairly predictable on a day-to-day basis which is necessary for participation in demand response
The amount of flexibility in plant operations will also be impacted by the amount of water storage available For example if a plant has sufficient water storage on-site or storage within the customerrsquos distribution system it could provide flexibility for the plant to reduce its operations during peak hours when electricity prices are likely to be highest It would also mitigate the impacts of interruptions to production from demand response deployments
22 Seawater Desalination Plant Economics Seawater desalination is typically more expensive than other sources of water and a major driver of the overall cost is energy costs In 2016 the Carlsbad plant charged rates at between $2131 and $2367 per acre-foot78 This charge is intended to cover both the fixed costs of the plant and the variable costs to produce a unit volume of water Typically half to two thirds of the cost of providing desalinated seawater are accounted for by capital cost recovery with the remainder accounted for by operations and maintenance costs including electricity costs Electricity costs can account for 20shy25 of the total costs of seawater desalination with reverse osmosis technology9
Factors affecting the capital cost of a seawater desalination plant include plant size type of desalination process and pre-post-treatment technologies plant infrastructure (eg piping water storage backup power) and compliance with applicable regulations (eg regulations on intake structures brine byproduct disposal) A significant driver of operating and maintenance costs is membrane replacement Reverse osmosis membranes need to be replaced every few years and
7 Source San Diego County Water Authority ldquoSeawater Desalinationrdquo Available at httpwwwsdcwaorgseawater-desalination 8 Note that 1 acre-foot is approximately 325851 gallons 9 Based on technical input from Black amp Veatch
copy 2016 ERCOT All rights reserved 3
Study on the Demand Response Potential for Seawater Desalination Projects ERCOT Public
the rate at which they are replaced will depend on the salinity of the feedwater and how the plant is operated Treatment and disposal of the salty brine byproduct from desalination may also incur operating costs
Electricity costs will vary depending on a range of factors including the size of the plant type of desalination technology source of electricity and quality of the feedwater As previously noted more saline water requires higher amounts of electricity in desalination and thus the amount of electricity consumption is a key difference between brackish water and seawater desalination As a result electricity costs comprise a significant share of the costs of seawater desalination These costs could potentially be defrayed in part by participation in demand response initiatives
3 Demand Response Opportunities in ERCOT
Broadly speaking demand response can be broken down into two major categories dispatchable or non-dispatchable For purposes of this report we will define dispatchable as those demand response events that are initiated by ERCOT and non-dispatchable as an event not specifically initiated by ERCOT These non-dispatchable events may include decisions made by the end-use customer to alter its consumption pattern or may include contractual obligations with another entity such as the end-use customerrsquos retail electric provider (ldquoREPrdquo) to alter consumption patterns
ERCOTrsquos wholesale market is open to several types of dispatchable demand response which are deployed to maintain system reliability Demand-side resources providing Emergency Response Service (ERS) may offer based on either a 10 or 30-minute response time commonly referred to as the ldquoramp periodrdquo Alternatively demand-side resources may register and qualify as a Load Resource that can provide Reserves in the Ancillary Services market The most common service provided by demand-side resources is Responsive Reserve Service which requires an under-frequency relay that can instantaneously interrupt the load during certain system reliability events Some demand-side resources can also participate in other Ancillary Services as Controllable Load Resources that require sophisticated control systems that allow them to be deployed in a more incremental proportional manner
Non-dispatchable demand response in ERCOT can include a response to avoid transmission costs where rates are based on Four Coincident Peak Pricing (4CP) response to wholesale energy prices initiated by the customer or by a REP or other load-serving entity (ldquoLSErdquo) or utility-managed Load Management programs (LM)
The sections that follow provide a description of both ERCOT-dispatched (Section 31) and nonshyERCOT-dispatched (Section 32) demand response For a more detailed description of opportunities for demand-side resources to participate in demand response in ERCOT see ERCOTrsquos guide Load Participation in the ERCOT Nodal Market10
31 ERCOT-Dispatched Demand Response There are two main demand response reliability-based services administered by ERCOT participation by demand-side resources in the Ancillary Services market and participation in ERS These services are dispatched by ERCOT during system emergencies
10 Available at httpwwwercotcomcontentservicesprogramsloadLoad20Participation20in20the20ERCOT20Nodal20Market_302d oc
copy 2016 ERCOT All rights reserved 4
Study on the Demand Response Potential for Seawater Desalination Projects ERCOT Public
Demand-side resources with demand response capability that can meet a set of performance requirements can be qualified to provide Ancillary Services as Load Resources in the Ancillary Services Market The value of having a Load Resource available to reduce load is equal to the value of having a generator available to increase its generation at a generating plant The providers of operating reserves selected to provide Ancillary Services are eligible for capacity payments regardless of whether the Resource is actually deployed (or curtailed in the case of the Load Resource)
ERCOT holds auctions on a daily basis for each of the following Ancillary Services Regulation Up Regulation Down Responsive Reserve and Non-Spinning Reserve11 Table 1 describes the various Load Resource types and their qualification requirements and eligible services
Table 1 Load Resource Types and Ancillary Services
Service Load Resource Type a Qualification Responsive Reserves (le50 of total Reserve requirement)
Non Controllable Under-Frequency Relay and 10-minute ramp to manual dispatch instruction
Responsive Reserves
Controllable Primary Frequency Response and follow 5-minute dispatch instructions
Regulation-Up Regulation-Down
Controllable Primary Frequency Response and respond to Regulation deployments
Non-Spin Reserves Controllable Follow 5-minute dispatch instructions a A Controllable Load Resource is a Load Resource capable of controllably reducing or increasing consumption under dispatch control by ERCOT
Demand-side resources that agree to reduce load when directed by ERCOT and that meet other metering and operational requirements as specified in the ERCOT Protocols may participate in Ancillary Services market auctions As noted in Table 1 the type of Ancillary Service that a Load Resource may provide will depend upon the demand-side resourcersquos response time and metering system as well as other requirements described in the Protocols In the Responsive Reserve and Non-Spin Reserve markets the Load Resource will receive capacity payments regardless of whether or not the load was actually deployed but the load must be available for deployment at any time while providing the service
ERCOT procures ERS to maintain grid reliability during emergency conditions and reduce the likelihood of the need for rotating outages ERS participants may offer to provide demand response with either a 10-minute ramp period requirement (similar to Load Resources providing Responsive Reserve Service) or a 30-minute ramp period requirement ERS Resources do not have the same telemetry and under-frequency relay requirements as Load Resources
11 Regulation Up and Regulation Down service respond to signals from ERCOT every 4 seconds to respond to changes in system frequency full response has to be provided within 5 minutes Responsive reserves must provide their committed capacity either instantaneously in an under-frequency event (eg due to a generator outage) or in energy scarcity conditions within ten minutes following an instruction from ERCOT Non-spinning reserves must provide their committed capacity within 30 minutes based on economic dispatch instructions Non-spinning reserve is used as replacement reserve to replenish other ancillary services and during energy scarcity
copy 2016 ERCOT All rights reserved 5
Study on the Demand Response Potential for Seawater Desalination Projects ERCOT Public
ERS is procured through a request for proposal (RFP) process three times per year for four-month contract terms each of which is further split into smaller time periods based on business cycles and other factors Demand-side resources may choose to submit offers in all time periods or only in those that best fit their unique circumstances and may vary both the price and demand response capacity offers by time period
Payments for ERS are performed up to 80 days after each four month contract term has ended and are subject to downward revision based upon delivered demand response capacity and the demand-side resourcersquos availability during the contract term
32 Non-ERCOT-Dispatched Demand Response The options listed below are not dispatched by ERCOT but they either are controlled directly by a customer or are dispatchable by another entity such as a demand response provider (ldquoDR Providerrdquo) REP or a transmission and distribution utility
Many industrial customers are subject to transmission charges based upon a Four Coincident Peak (4CP) demand The 4CP demand is determined by averaging the consumerrsquos actual demand during the 15-minute settlement interval with the highest ERCOT demand during each of the four summer months (June through September) This measured 4CP demand serves as the basis for the customerrsquos transmission tariff charges for the following year By correctly predicting the ERCOT system peaks during the summer and curtailing load during those intervals a consumer can help reduce the stress imposed on the electric system during peak periods of consumption and reduce its transmission charges for the following calendar year
In the competitive areas of ERCOT consumers can contract with their REP or a DR Provider to have their load respond to the REPrsquos or DR Providerrsquos instructions The contract will usually outline the parameters of this response ndash at what times and frequency demand response events can be called ramp periods sustained response periods compensation etc Because this response is a contractual matter between the REP or DR Provider and the consumer a great deal of variety can be present in these arrangements For example a consumerrsquos response may be voluntary or required compensation could come in the form of reduced energy prices or rebate payments for each curtailment event consumers might be notified up to a day in advance or could have no notification at all (for automated curtailment)
In areas of ERCOT not open to competition interruptible tariffs may be available These tariffs will usually offer a reduced energy price for defined curtailment obligations
REPs may offer dynamic pricing options or consumers within a municipality or cooperative may have their energy prices determined by a published tariff which also may be structured based upon Time-of-Use (TOU) or have a Critical Peak Pricing (CPP) or Peak Time Rebate (PTR) component Self-directed price response refers to consumers making an independent decision to respond to energy prices contained in a governing tariff or in either the ERCOT Day Ahead or Real Time energy markets
TOU offerings will typically have higher energy prices during normal peak periods ndash for example a TOU tariff may charge one price during Monday through Friday from 2 pm through 8 pm and another price during all other times Customers may choose to reduce consumption during these high priced periods Load reduction can be accomplished by load shifting (loads can be shifted by
copy 2016 ERCOT All rights reserved 6
Study on the Demand Response Potential for Seawater Desalination Projects ERCOT Public
rescheduling certain processes or by utilizing thermal storage) ending certain processes that are no longer economic or through energy efficiency measures
Offerings that incorporate CPP usually have prescribed high prices only during certain defined periods ndash for example when load or prices are expected to reach a certain level Response to CPP may be similar to those employed under TOU tariffs especially if CPP is reached frequently More often CPP is infrequent and as such short-term load curtailment may be the more appropriate response to meet economic objectives
4 Demand Response Potential for Seawater Desalination
This section evaluates whether the operational characteristics and economics of seawater desalination plants would enable them to participate in one or more of the various demand response opportunities in the ERCOT Region To date participation of seawater desalination plants in demand response programs has been limited Neither the plant in Carlsbad nor the plant in Tampa Bay participate in demand response programs in California or Florida respectively However as will be described below it appears that these plants can be designed and operated to meet the requirements for participation in demand response and receive economic benefit from participation in these programs
Section 41 describes the operational parameters that must be met for a demand-side resource to provide ERCOT-dispatched demand response and evaluates the ability of seawater desalination plants to meet these criteria Section 42 discusses the tradeoffs between payments for participation in ERCOT-dispatched demand response and potential additional costs posed to seawater desalination plants Finally Section 43 presents other opportunities for seawater desalination plants to reduce their electricity costs outside of ERCOTrsquos reliability-based services that are open to demand response assets
41 Operational Considerations for ERCOT-Dispatched Demand Response There are several key operational parameters that impact a demand-side resourcersquos ability to participate in different demand response services response time recovery time predictability of electrical demand and flexibility of operations This section discusses each of these considerations as they apply to seawater desalination plants
As discussed in Section 31 one of the differentiating factors between ERCOTrsquos demand response products is the amount of time within which a demand-side resource must respond to a deployment instruction to reduce electricity consumption during an event Participation in RRS requires an automatic response within either half a second (ie instantaneous) based on grid frequency or within 10 minutes via a manual instruction ERS requires a response time of either 10 or 30 minutes As noted in Section 21 the typical time to take a reverse osmosis train on- or off-line is 1-2 hours under normal controlled operations To comply with the response time requirements of RRS or ERS a seawater desalination plant would need to be able to reduce its electricity consumption far more quickly than in normal operations This is an element of plant design that would need to be accounted for in the specifications of the project Considerations include the potential need for on-site backup generation including uninterruptible power supply potential impacts to plant infrastructure (eg piping) reverse osmosis membranes and pretreatment systems
The two large US desalination plants provide illustrative counterpoints in this respect The Carlsbad plant was designed to withstand instantaneous power interruptions and has on-site backup generation including uninterruptible power supply to provide the ability to power control systems and flush the membranes in the event of a power loss In contrast the Tampa Bay plant was not
copy 2016 ERCOT All rights reserved 7
Study on the Demand Response Potential for Seawater Desalination Projects ERCOT Public
designed with on-site backup generation and a loss of power would result in a plant shutdown and may require several days to bring the plant back on-line Thus it appears that it is technically possible for a seawater desalination plant to meet the response time requirements for participation in demand response so long as this factor is considered in the design of the facility
The time it takes a desalination train to return to operations after an event is also a consideration Demand-side resources participating in RRS must be able to come back on-line within three hours and those participating in ERS must return within 10 hours Again it appears that it is technically feasible for desalination plants to meet this requirement so long as this requirement is considered in the plant design
An additional consideration is the predictability of a demand-side resourcersquos electricity consumption Participation in the responsive reserves ancillary service market requires bidding in the day-ahead market and thus a demand-side resource must know with great accuracy (within 95) its electrical demand at least a day ahead of time For ERS auctions are held three times a year for four-month contract periods Thus to participate in ERS a resource must know its forecasted electrical demand several months in advance Because seawater desalination plant operations are driven by contracted demand for water it is likely that a plant operator would have a good idea of the plantrsquos electrical demand days or even weeksmonths in advance especially for summer months when demand is likely to be relatively steady An important consideration however is the salinity of the water which drives the electrical requirements and which can be impacted by recent weather events Similarly reductions in demand for water during non-summer months or wet summer days where demand may be reduced could also impact a plantrsquos ability to predict its electricity demand
Finally a seawater desalination plant must have sufficient flexibility in its day-to-day operations so that it can afford to lose several hours of production when deployed for demand response It should be noted that demand-side resources participating in RRS and ERS are called infrequently demand-side resources providing responsive reserves were deployed one time in 2015 and ERS was not deployed that year However this is an important factor to consider if a plant is operating at close to full capacity and would incur financial penalties if it fails to meet its contract obligations due to a demand response event Including additional storage and building a plant with extra capacity could help to mitigate this risk It should also be noted that a plant operator does not need to commit the full plant capacity to these services but rather can specify an amount of MW that will be committed Thus a plant operator could mitigate issues both with predictability and flexibility of plant operations by committing only a portion of its predicted electrical demand to participate in demand response
Considering these factors together it appears that seawater desalination plants could be designed to meet the operational requirements for participation in ERCOTrsquos demand response services (both RRS and ERS) Because the ability to meet the requirements is dependent on the plant design demand response would need to be considered early in a projectrsquos development if participation is desirable Whether project developers will choose to address these requirements will depend on the economic benefits of participation in demand response which will be discussed in the next section
42 Economic Considerations for ERCOT-Dispatched Demand Response This section describes the economic benefits to demand-side resources from participation in ERCOT-dispatched demand response programs The average price paid for a demand-side resource participating in RRS in 2015 was $1087 per MW per hour and for ERS was $645 per MW per hour for the contract periods during the 2015 program year These payments could provide a significant financial benefit to seawater desalination plants To give a simplified example for a plant with an electrical demand of 10 MW operating at a 100 annual load factor (10 MW times 24 hours times 365 days) the annual benefit would be on the order of $500000 for ERS or $1 million for RRS
copy 2016 ERCOT All rights reserved 8
Study on the Demand Response Potential for Seawater Desalination Projects ERCOT Public
In 2015 demand-side resources providing responsive reserves were deployed one time for a duration of 10 minutes and ERS was not deployed12 The most ERS was ever deployed in a single year was two times in 2011 Thus participation in either program could result in a substantial payment to a seawater desalination plant with a relatively low risk of deployment and associated disruption of plant operations although it is important to note that participation in either ERCOT service subjects demand response resources to annual unannounced testing Other than testing the frequency of deployment will depend on grid conditions and is a risk that should be considered
The financial benefits of participation must be weighed against the costs of designing facilities with the capabilities to operate in this manner These include
bull The costs to design the plant to reduce electrical demand within the required timeframes for demand response and to withstand an instantaneous interruption if not already part of the plant design For example a plant may need to be designed to have backup power generation on-site In addition there could also be costs to restart the system after an interruption
bull The costs to build a plant with excess capacity andor storage to make up for lost production hours when demand response is deployed This will add to the total capital costs of the project Land area constraints should also be considered when considering additional storage as the space requirements for the necessary storage capacity could be significant
bull Costs associated with the impact of interruptions on plant processes (eg more frequent replacement of membranes impacts to pretreatment system or plant infrastructure)
bull Potential financial penalties that would be incurred if deployment as part of demand response were to result in failure to meet contract obligations to supply water
bull The loss of potential benefits in the form of cost avoidance from participation in non-ERCOTshydispatched demand response opportunities (see Section 43) If a plant is committed to RRS or ERS the plant operator would lose the flexibility to take advantage of these other opportunities to reduce their electricity costs
The interplay of these benefits and costs will determine whether it would be beneficial for a future seawater desalination plant to participate in demand response in ERCOT
43 Considerations for Non-ERCOT-Dispatched Demand Response Outside of the reliability-based services administered by ERCOT there are other opportunities for seawater desalination plants to reduce their electricity costs As described in Section 321 seawater desalination plants may be able to reduce the demand charges on their electricity bills through curtailing load during 4CP intervals In addition plant operators may adjust operations in response to real-time electricity prices to take advantage of lower off-peak prices and avoid price spikes (see Sections 322 and 323) All of these opportunities require that the plant have flexibility to reduce production during certain times of the day
In the ERCOT region as noted above a portion of transmission and distribution charges are set based on the peak systemwide 15-minute interval of the four summer months (June through September) referred to as the four coincident peaks (4CP) Large customers can reduce or avoid this charge by reducing electrical consumption during these four peak intervals AEP Central Texas and CenterPoint are the transmission providers covering the majority of the Gulf Coast in Texas13
12 ERCOT June 2016 ldquoLoad Resource Deployment Updaterdquo Available at httpwwwercotcomcontentwcmkey_documents_lists870985_RRS_Load_Resource_Deployment_Updatepdf 13 It is also possible that a seawater desalination plant could be located in an area that as not opted in to competition in which case the plant owner would need to negotiate its electricity charges bilaterally with the Non Opt-In Entity (NOIE)
copy 2016 ERCOT All rights reserved 9
Study on the Demand Response Potential for Seawater Desalination Projects ERCOT Public
Assuming a future seawater desalination plant would be connected at transmission-level voltages the relevant 4CP charges based on the 2016 tariffs accounting for both transmission charges and transmission cost recovery factors would be $41425 per 4CP kW for AEP Central Texas and $41870 per 4CP kVA for CenterPoint14 If a seawater desalination plant has 10 MW of load and is capable of interrupting all of it and successfully does so for all four 4CP intervals the savings based on the 2016 tariffs would be approximately $500000 per year ($41425 times 1000 (kW to MW) times 10 MW times 12 months) Thus a seawater desalination plant that reduces its electricity use during the 4CP intervals could avert some or all of these charges
Another opportunity for seawater desalination plants to reduce their electricity costs is through adjusting operations in response to real-time electricity prices In 2015 the average electricity price in ERCOT was $2677MWh However prices exceeded $50MWh in 254 hours (3 of all hours) $100MWh in 88 hours (1) $200MWh in 40 hours (05) and $300MWh in 21 hours (02) Prices exceeded $3000MWh for 021 hours15 Depending on the desalination plantrsquos exposure to real-time wholesale market prices (via its retail contract) the degree of high prices the plant owner is willing to avoid and grid conditions in a given year reducing unit operations in order to avoid high electricity prices could impact operators for anywhere between a few and several hundred hours out of the year In addition a plant can plan its operations to take advantage of lower electricity prices during off-peak periods (eg at night when generation from wind is high) For example at least one company is marketing a modular desalination unit design intended to take advantage of low prices during periods of high renewables generation and to provide grid reliability services through demand response16
There are several factors to consider regarding these opportunities to reduce electricity costs The plant would need to monitor the ERCOT market or hire a contractor to do so in order to know when to reduce demand for electricity These programs do not impose any requirements on response time as with RRS or ERS and there may be sufficient warning of 4CP intervals or peak pricing to allow the plant operator to plan its operations earlier in the day with sufficient time to ramp down production under controlled conditions However quicker ramping capability may be desirable to respond to electricity price fluctuations
For 4CP because the four intervals used to set demand charges are not known ahead of time it is likely that the plant would need to reduce its demand multiple times per summer to ensure the 4CP intervals are hit impacting production at the facility Timing operations to coincide with off-peak pricing or to avoid price spikes would similarly result in reduced operations during certain hours To offset the lost production hours the plant may need to be designed with extra capacity and water storage capability to maintain the ability to meet its contractual obligations for freshwater delivery Because the period of reduced operations is greater than with ERCOT-dispatched demand response services this need would be greater for a seawater desalination plant reducing load during 4CP intervals or in response to real-time electricity prices and would increase the capital costs of the project It should also be noted that high prices in the ERCOT Region typically but not always occur in summer months when drought conditions are more likely to develop and demand for desalinated water is likely to be highest This may limit the flexibility of the plant to time its electricity consumption to avoid high-priced hours
14 Public Utility Commission of Texas ldquoTransmission and Distribution Rates for Investor Owned Utilitiesrdquo Available at httpwwwpuctexasgovindustryelectricratestdraspx 15 Potomac Economics June 2016 2015 State of the Market Report for the ERCOT Wholesale Electricity Markets Available at httpswwwpotomaceconomicscomindexphpmarkets_monitoredERCOT 16 Sisyan LLC ldquoDemand Response Desalinationrdquo Available at httprenewabledesalinationcomwpshycontentuploads201506Demand-Response-Desalinationpdf
copy 2016 ERCOT All rights reserved 10
Study on the Demand Response Potential for Seawater Desalination Projects ERCOT Public
In addition the plantrsquos ability to participate in demand response would also be limited for those hours it is reducing load as part of 4CP response or in response to real-time prices because the plant would not be able to reduce its electricity consumption if that demand is already committed to another demand response service Thus participating in demand response versus taking advantage of these other opportunities may be to some extent mutually exclusive
5 Conclusion
Based on this analysis it appears that the operational characteristics of seawater desalination plants would allow them to participate in demand response opportunities in ERCOT so long as the necessary operational requirements are considered in the design specifications of the plant Project developers should consider the necessary requirements early in the plant design Whether the economic benefits of participation would provide a sufficient incentive for them to do so will depend on the costs of accommodating those operational requirements and whether there is the flexibility available to operate the plant as necessary under these programs Though most existing seawater desalination plants do not participate in demand response programs it does appear that participation by these plants is possible and could result in a financial benefit Table 2 compares the different demand response opportunities available to demand-side resources in ERCOT
Table 2 Comparison of Demand Response Opportunities Demand Response
Opportunity Requirements for
Participation Impacts to Plant
Operations Financial Benefit Ancillary Services ndash Responsive Reserve Service (RRS)
bull Under-Frequency Relay bull Instantaneous or 10 minute
response time bull Recover load within 3
hours bull Bid in day-ahead market
bull Deployed once in 2015 for 10 minutes bull Subject to annual
unannounced testing
bull $1087 per MW per hour (based on 2015 prices)
Emergency Response Service (ERS)
bull 10 or 30 minute response time bull Recover load within 10
hours bull Four-month contract term
bull Not deployed in 2015 the most times ever deployed in a single year was twice in 2011 bull Subject to annual
unannounced testing
bull $645 per MW per hour (based on 2015 prices)
Four Coincident bull Interval Data Recorder bull Likely plant will need to bull Avoid ~$48000 per 4CP Peak (4CP) (IDR) meter
bull Ability to predict system-wide peak demand hours during summer months
reduce load multiple times per summer to hit 4CP intervals bull Likely to be able to predict
possible 4CP intervals earlier in day
MW per year (based on 2016 tariffs) if successful in reducing during all four summer months
LSE or DR Provider Contracted Price Response
bull Varies based on contractual arrangements
bull Varies based on contractual arrangements
bull Varies based on contractual arrangements
Self-Directed Price bull Retail contract with bull Varies depending on bull Varies depending on Response exposure to real-time
market prices bull Ability to monitor real-time
prices in ERCOT wholesale market
number and severity of pricing events bull May be able to predict
peak pricing events earlier in day
number and severity of pricing events
copy 2016 ERCOT All rights reserved 11
Study on the Demand Response Potential for Seawater Desalination Projects ERCOT Public
Demand response programs in ERCOT provide opportunities for demand-side resources to defray their electricity costs and provide reliability benefits to the ERCOT electric grid Because the process of seawater desalination is energy intensive participation in demand response could help to reduce electricity costs while posing a relatively low risk to plant operations if demand response participation is factored into plant design
Participation in non-ERCOT-dispatched demand response opportunities such as reducing load during 4CP intervals or in response to real-time electricity prices may also help to reduce electricity costs for seawater desalination plants in Texas As stakeholders in Texas continue to plan for possible future droughts in the region and identify water management strategies consideration of demand response could play a role in mitigating some costs associated with seawater desalination and allow seawater desalination plants to assist with maintaining electric reliability in the region
copy 2016 ERCOT All rights reserved 12
2017 SCOPE OF COMPETITION IN ELECTRIC MARKETS IN TEXAS REPORT
III SUMMARY OF COMMISSION ACTIVITIES FROM 2015 TO 2016
Introduction
The Commission develops and modifies rules policies and procedures for the
competitive electric market in Texas in response to the technological advances in the
industry and the evolving needs of customers The Commission also continues to carry
out oversight of programs with which the Legislature has tasked it ndash such as energy
efficiency renewable energy and advanced metering infrastructure Within the
ERCOT region the monopoly wires-and-poles companies that provide transmission
and distribution services throughout the grid remain subject to traditional rate
regulation by the Commission The Commission continues to set rates for these
utilities as they are not subject to the forces of market competition This section
provides an overview of the Commissionrsquos activities in its oversight of the wholesale and retail electric markets as well as its governance over regulated electric utilities
Resource Adequacy
Resource adequacy is the long-term ability of the system to serve demand reliably
when consumption is highest given the available installed capacity load resources and
the operational reliability of the system Assessing resource adequacy requires comparing
the systemrsquos forecast installed capacity and load resources against the forecast peak
summer load The difference between the forecast of available generation and load
resources and the forecasted demand for electricity is referred to as an ldquoinstalled capacity
reserve marginrdquo which is an indicator of the ability of the system to meet customer demand
during peak conditions In addition to evaluating the forecast reserve margin assessing
resource adequacy includes evaluating the systemrsquos operational reliability The systemrsquos operational reliability depends on the ability of generators to manage plant operations
successfully as well as the grid operatorrsquos ability to manage the system to avoid or to mitigate load curtailment During 2015 and 2016 the ERCOT system performed well with
respect to resource adequacy The Commission has devoted significant attention to
ensuring that ERCOT maintains an adequate installed capacity reserve margin and a high
level of operational reliability developing a wholesale market design that allows
consumers to continue to receive low-cost and reliable electricity over the long term
1 Capacity Demand and Reserves Report
The Capacity Demand and Reserves (CDR) Report published by ERCOT semi-
annually is a snapshot estimate of long-term supply and demand and the associated annual
reserve margin for peak summer and winter conditions While the CDR Report is not a
forecast of any particular outcome it provides insight into possible resource adequacy
trends
16 | P a g e
2017 SCOPE OF COMPETITION IN ELECTRIC MARKETS IN TEXAS REPORT
The May 2016 CDR Report shows estimated reserve margins well above the
current target reserve margin of 1375 Installed capacity reserve margin estimates taken
from this CDR Report are shown below in Table 7
Table 7 May 2016 Capacity Demand and Reserves Report Forecast
Forecast 2017 2018 2019 2020 2021 2022 2023 2024 2025 2026
Peak Load
(MW)
68548 69409 70795 71420 72098 72792 73482 74168 74864 75704
Total
Capacity
(MW)
80995 87019 87238 87407 87678 87738 87738 87728 87728 87728
Reserve
Margin
182 254 232 224 216 205 194 183 172 159
2 Operating Reserve Demand Curve
In ERCOT the price signals produced by the energy-only wholesale electric market
should provide incentives to promote short-term reliability as well as induce optimal long-
run investment in new resources If the prices are efficient and reflect the full cost of
dispatching resources to meet demand the benefits that accrue to both consumers and
producers can be maximized at the least cost and new generating capacity (or load
resources) should develop to maintain the equilibrium as old resources retire or demand
increases
The Operating Reserve Demand Curve (ORDC) implemented at the Commissionrsquos direction in June 2014 improves price formation by allowing prices to more fully reflect
the value of operating reserves The ORDC assigns an economic value to operating
reserves or the amount of extra capacity available to maintain system reliability on a daily
basis
As part of its ongoing review of resource adequacy in ERCOT the Commission is
currently evaluating the accuracy of the inputs to the ORDC to ensure that its contribution
to price formation appropriately reflects the costs of meeting demand and the underlying
needs of the system
3 Transmission Congestion
Although competitive power producers and regulated transmission providers form
two distinct segments of the market transmission buildout has a direct effect on wholesale
power prices When there is insufficient transmission capacity to dispatch energy in a least-
cost fashion the system operator takes action to ensure that the physical limits of the
transmission system facilities are not violated The re-dispatch of generation because of
transmission limits results in disparate prices at different locations on the system In
comparison to prior years transmission congestion in ERCOT has lessened because of the
large increase in transmission investment and the reduction of high demand related to oil
and gas production in West Texas ERCOT and the Commission continually evaluate the
need for cost-effective additional transmission investment to manage congestion
17 | P a g e
2017 SCOPE OF COMPETITION IN ELECTRIC MARKETS IN TEXAS REPORT
4 Wholesale Market Design Initiatives
While the ERCOT wholesale market has been successful in attracting new resource
investment and also maintaining competitive prices for consumers certain improvements
to the market design could yield additional benefits in terms of efficient price formation
and opportunities for entry of new technology Initiatives already in place in many other
regions such as real-time co-optimization and multi-interval real-time resource dispatch
may allow existing capacity to be used more effectively and create opportunities for the
integration of additional load resources to serve electric demand The Commission
continues to work with ERCOT and interested stakeholders to determine the value of
implementing such enhancements particularly as ERCOTrsquos resource mix changes over time
5 Reliability Standard
In early 2014 the Commission opened a project to review its use of a target installed
capacity reserve margin based on a reliability standard equivalent to one loss-of-load event
every ten years In this project the Commission received written comment from interested
parties conducted a public workshop consulted with independent experts and reviewed
the application of reliability standards in other regions As a result of this review future
reliability metrics to be estimated in ERCOT will include the market equilibrium reserve
margin the economically-optimal reserve margin and the associated levels of expected
unserved energy The Commission believes that publishing these metrics represents an
improvement over reporting a one-event-in-ten-years standard by enhancing insight into
expected outcomes in ERCOTrsquos energy-only market
Non-ERCOT Utilities Market Development Activities
SB 7 the law that introduced retail competition to the Texas market in 1999
granted the Commission authority to delay retail competition in an area where deregulation
would not result in fair competition and reliable service because of the lack of an
independent organization to coordinate the electric system and the concentration of
ownership in the generation sector in some of those areas Consequently SB 7 included
provisions recognizing the difficulty of implementing retail competition in areas outside of
ERCOT Therefore the utilities outside of the ERCOT region remain vertically integrated
owning generation transmission and distribution assets as well as selling power to end-
use customers These vertically integrated utilities remain subject to traditional regulation
including rates set by the Commission and customer choice is not offered in the service
territories of these utilities
The Commission does continue to monitor ongoing activities in the non-ERCOT
portions of the state In 2015 the Legislature granted the Commission the authority to
retain counsel and consulting experts in order to participate in legal proceedings at the
Federal Energy Regulatory Commission (FERC) which has regulatory jurisdiction over
wholesale power sales and transmission rates outside of ERCOT This authority has
18 | P a g e
2017 SCOPE OF COMPETITION IN ELECTRIC MARKETS IN TEXAS REPORT
permitted the Commission to participate more effectively in FERC proceedings affecting
Texasrsquo utilities located outside of ERCOT
1 Southwest Power Pool
The Southwest Power Pool (SPP) is the Regional Transmission Operator (RTO) for
areas of Northeast Texas and the Texas Panhandle In Texas the utilities Southwestern
Electric Power Company (SWEPCO) Southwestern Public Service (SPS) and several
electric cooperatives and municipally owned utilities are in SPP In addition to these areas
of Texas the SPP footprint includes parts of New Mexico Arkansas Missouri Nebraska
Louisiana and all of Kansas and Oklahoma In 2015 SPP became the RTO for the
Integrated System and neighboring areas which includes parts of Iowa Minnesota North
Dakota South Dakota Wyoming and Montana SPP has spent extensive time and
resources over the last two years to integrate these new areas successfully The expansion
added 5000 MW of peak demand 7600 MW of generating capacity and 9500 miles of
transmission lines17
In 2014 SPP launched its new Integrated Marketplace which provides a Day-
Ahead Market a Real-Time Balancing Market and Congestion Hedging Markets
mechanisms similar to those available in ERCOT The implementation of the Integrated
Marketplace resulted in a savings of $422 million in 2015 As a result of the Integrated
Marketplace SPPrsquos planning reserve margin will be reduced from 136 to 12 a change
expected to save about $90 million annually
Chairman Donna L Nelson represents the Commission as a voting member on
SPPrsquos Regional State Committee (RSC) The RSC provides collective state regulatory
agency input on a variety of issues In addition the RSC has authority over the cost
allocation methodologies for transmission upgrades allocation of Financial Transmission
Rights and the approach used for resource adequacy across the SPP region The RSC
regularly meets on a quarterly basis and meets more frequently if necessary
2 Midcontinent Independent System Operator
The Midcontinent Independent System Operator (MISO) is an RTO that serves all
or part of 15 states in the central US one Canadian province and the portion of eastern
Texas served by the vertically integrated utility Entergy Texas Inc MISO provides a Day
Two market which has a variety of functions and services including energy and ancillary
service markets economic dispatch congestion management financial transmission rights
and transmission planning The MISO Independent Market Monitor concluded that the
MISO wholesale markets were competitive in 2015
Like SPP MISO is in the Eastern Interconnection which crosses state boundaries
and is therefore subject to FERC jurisdiction A number of recent FERC proceedings have
17 2015 Southwest Power Pool Annual Report Available at
httpswwwspporgdocuments37800201520southwest20power20pool20annual20reportpdf
19 | P a g e
2017 SCOPE OF COMPETITION IN ELECTRIC MARKETS IN TEXAS REPORT
affected the portion of Texas that is in the MISO footprint The Commission through
outside counsel has been an active party in such FERC proceedings FERC Docket No
ER14-1174 addressed in part a dispute regarding the availability of transmission capacity
under the Joint Operating Agreement between MISO and the SPP Ultimately FERC
approved a settlement agreement under which MISO will compensate SPP and its members
for using their or other entitiesrsquo transmission systems
In a related pending docket at FERC Docket No ER14-1736 parties are addressing
how the cost of these payments will be allocated among MISO market participants Parties
in this proceeding are engaged in settlement discussions In addition in Docket No ER14-
75-000 FERC approved a settlement agreement among the participating Entergy
Operating Companies and their retail regulators to terminate the Entergy System
Agreement effective August 31 2016 The settlement terms prohibit any post-termination
payments that roughly equalize production costs among the operating companies after
December 31 2015 terminate certain specific cross-purchase power agreements between
Entergy Texas and former Entergy Gulf State Louisiana and permit the continuation of
several other purchase power agreements
Commissioner Kenneth W Anderson Jr represents the Commission as a voting
member in the Organization of MISO States (OMS) the purpose of which is to coordinate
regulatory oversight among the states in the MISO region and to make recommendations
to MISO FERC and other entities Commissioner Anderson also represents the
Commission as a voting member of the Entergy Regional State Committee (ERSC) which
has certain FERC-approved authority for five years after the Entergy integration with
regard to cost allocation for Entergy transmission projects and adding transmission projects
to the Entergy construction plan The ERSC meets quarterly
3 Western Electricity Coordinating Council
The Western Electricity Coordinating Council (WECC) is a Regional Entity whose
region includes the area surrounding El Paso and extends from Canada to Mexico
including the provinces of Alberta and British Columbia the northern portion of Baja
California and all or portions of the 14 Western states in between WECC is the Regional
Entity responsible for Bulk Electric System reliability in the Western Interconnection and
associated compliance monitoring and enforcement WECC does not have organized
markets outside of California but is organized into 38 separate balancing authorities
WECC is geographically the largest and most diverse of the eight Regional Entities in the
United States with delegated authority from the North American Electric Reliability
Corporation (NERC) and the Federal Energy Regulatory Commission In Texas El Paso
Electric Company is a member of WECC
Rulemaking Activities
The Commission has continued to adopt new rules and modify existing rules in
order to further the continued successful operation of the competitive retail and wholesale
markets and to comply with statutory changes made to PURA by the Legislature This
20 | P a g e
2017 SCOPE OF COMPETITION IN ELECTRIC MARKETS IN TEXAS REPORT
section of the Report provides a high-level overview of the Commissionrsquos key rulemaking
activities highlighting the market improvements made in 2015 and 2016
1 Cost Recovery and Rate Adjustment
The Commission adopted new rule 16 TAC sect25246 on June 29 2016 to
implement Section Nos 1 through 3 of House Bill 1535 of the 84th Legislature The new
rule only applies to a utility that operates solely outside of ERCOT and allows for the use
of an update period beyond the test year for which the utility initially files estimated
information The rule clarifies that all information originally estimated must be updated
with actual information and also provides requirements for a post-test-year adjustment for
a natural gas-fired plant A non-ERCOT utility also is required to initiate a new base rate
case on or before the four year anniversary of the final order in the utilityrsquos most recent comprehensive base rate case or if the commission determines that the utility has
materially earned more than its authorized rate of return in two consecutive years The rule
also provides requirements and procedures for the relation back of final rates to an effective
date 155 days after the filing of the rate application
2 Changes to Certificates of Convenience and Necessity and CREZ Rule
The Commission conducted a rulemaking to implement changes pursuant to
Legislative mandates in SB 776 SB 933 and HB 1535 of the 84th Legislature SB 776
required municipally owned utilities to apply for a certificate of convenience and necessity
(CCN) before constructing transmission facilities outside the boundaries of the
municipality that owns the municipally owned utility SB 933 also requires persons to
obtain a CCN before interconnecting a tie line into the ERCOT grid HB 1535 requires the
Commission to issue a final order within 181 days for a non-ERCOT utility requesting a
CCN for an existing electric generating facility and 366 days after a non-ERCOT utility
files a CCN for a newly constructed generating facility In addition the Commission also
determined in this rulemaking that all future transmission projects in a Competitive
Renewable Energy Zone (CREZ) must meet the need criteria of PURA sectsect 37056(c)(1)
and (2) rather than being exempt Finally the Commission determined that the CREZ
project established in 2008 was complete following the installation of a second circuit on
a Sharyland line
3 Use of Handheld Device for Enrollment
As the market evolves the Commission evaluates market changes balancing its
desire to encourage customer-focused innovation with its concern for customer protection
against potential abuses In Docket No 44518 the Commission granted a REP a
temporary 12-month waiver from its rules requiring the marketer to obtain telephonic
verification of the customerrsquos desire to switch REPs as well as a waiver from certain authorization disclosure requirements among other stipulations the Commission placed
upon the REP The Commission then opened Project No 45625 to study the issue of REPs
utilizing hand-held devices for customer enrollment more broadly and engage with market
representatives consumer representatives and other stakeholders The Commission
anticipates considering an amendment to its rules in the spring of 2017
21 | P a g e
2017 SCOPE OF COMPETITION IN ELECTRIC MARKETS IN TEXAS REPORT
4 Smart Meter Texas Portal
The electric utilities in Texas that have advanced metering systems (AMS) jointly
own and operate a single web portal known as Smart Meter Texas (SMT)18 SMT fulfills
two requirements imposed by the Commissionrsquos advanced metering rule on a utility with
AMS (1) provide to the retail customer the REP serving the customer and other entities
authorized by the customer access to such retail customerrsquos consumption data and (2)
allow devices at the customerrsquos premises to communicate through a home area network with the advanced meter at the premises SMT also facilitates near real-time on-demand
reads of a customerrsquos meter that aids prepaid service offered by certain REPs
In Project No 42786 Review of Advanced Metering System Web Portal
Commission staff and stakeholders examined options for the long-term operational
structure governance and funding of SMT The Commission determined that ownership
of SMT should remain with the TDUs because they can operate the portal at a lower cost
than transferring the data repository to ERCOT The Commission opened two
rulemakings one to ascertain the appropriate governance performance and funding of
SMT and a second to determine the appropriate access for third parties ensuring that
customers have the freedom to grant and give third parties access to their data if made
knowingly while also securing customer privacy
Sharyland Utilities
In early 2015 customers of Sharyland Utilities the smallest investor-owned
transmission and distribution utility in ERCOT began to file with the Commission a
significant number of complaints regarding high electricity bills In response the
Commission opened Project No 44592 Relating to a Project Regarding Sharyland
Utilities to provide for a more formal process for Commission review of the large number
of complaints As part of this project Commission staff prepared a report to evaluate the
electricity rates and electric bills in the operating area of Sharyland Utilities that was
previously part of Cap Rock Energy
Staffrsquos report found that a number of factors contributed to the comparatively high
bills for many of Sharyland-Cap Rockrsquos customers First Sharylandrsquos small size and its low customer density result in high TDU rates for all customers relative to other TDUs In
particular Staffrsquos report found that Sharyland-Cap Rockrsquos rates for distribution service are
up to three times higher than those of other TDUs in Texas In addition to Sharyland-Cap
Rockrsquos high costs for distribution service higher wholesale transmission costs also
contributed to the rate increases charged to Sharyland-Cap Rockrsquos customers These transmission costs are the result of increased transmission investment in recent years
throughout Texas that has increased transmission costs for all distribution providers
18 The participating Texas TDUs are AEP Texas Central Company and AEP Texas North Company (jointly
ldquoAEPrdquo) CenterPoint Energy Houston Electric LLC (ldquoCenterPointrdquo) Oncor Electric Delivery Company LLC (ldquoOncorrdquo) and Texas-New Mexico Power Company (TNMP) collectively referred to as the ldquoJoint TDUsrdquo Operation of an AMS web portal was addressed in the orders approving particular utilitiesrsquo deployment of AMS and approving surcharges for AMS cost recovery While Sharyland Utilities filed comments in the proceeding it did not
participate as it had not fully completed its AMS deployment at the time
22 | P a g e
2017 SCOPE OF COMPETITION IN ELECTRIC MARKETS IN TEXAS REPORT
including Sharyland Utilities Second the comparatively colder winter of 2014 ndash 2015
which was the time period generally consistent with the timeframe in which the
Commission began receiving complaints appeared to result in higher electricity usage than
normal This combination of high TDU rates and the higher electricity usage led to higher
bills for customers
Staffrsquos report also noted that in Sharyland-Cap Rockrsquos last rate case in 2014 the
approved rates reflected movement towards more cost-based rates for all customers
including some customers that previously had been heavily subsidized by other customers
Additionally in the process of standardizing Sharyland-Cap Rockrsquos customer classification
with the classifications of the other TDUs in Texas some customers may have experienced
a move from one class that previously was paying below-cost rates to another class that
was now paying above-cost rates For some of these customers the combined effects of
the movement towards cost-based rates and the change to a different class may have
contributed to a significant change in the customersrsquo rates Regardless of any cost-shifting
between customer classes Sharylandrsquos rates remain two to three times higher than those of other TDUs in Texas for all customers in all classes
On December 4 2015 the Commission signed an order directing Sharyland to file
an application for a comprehensive rate review by April 30 2016 Sharyland filed its rate
application on April 29 2016 in Docket No 45414 Review of the Rates of Sharyland
Utilities LP On October 10 2016 the Commission ordered Sharyland to file an amended
application as soon as practicable but no later than January 1 2017 to reflect the unique
aspects of the companyrsquos organizational structure as a real estate investment trust (REIT) At the time of publication Sharyland is expected to file its amended application in
December 2016
PowerToChoose Website
As part of its ongoing evaluation of the competitive market the Commission
opened Project No 45730 to evaluate the functionality and usability of its PowerToChoose
website which allows customers to select a REP and an electric plan based on their zip
code In the process the Commission received significant feedback from customers stating
that the Commissionrsquos PowerToChoose website was an important tool that plays a
fundamental role in their shopping process In response to the feedback received from
industry representatives and consumers Commission staff changed how the website sorts
and filters retail electric plans adding a filter to allow customers to unselect plans that
contain minimum usage fees or credits This filter is now a default setting and plans with
minimum usage fees and credits are not shown unless the customer actively selects to
search for such plans In addition Commission staff made other changes to increase the
clarity of the REP complaint rating The Commission continues to evaluate other changes
to improve the customer experience of the PowerToChoose website and provide
transparency for retail electric plans
23 | P a g e
2017 SCOPE OF COMPETITION IN ELECTRIC MARKETS IN TEXAS REPORT
Report on Alternative Ratemaking Mechanisms
In 2015 the Legislature enacted SB 774 which requires the Commission or its
consultant to conduct a study and make a report to the Legislature analyzing the alternative
ratemaking mechanisms adopted by other states In addition SB 774 extended the
authorization for the Periodic Rate Adjustment (PRA) mechanism from 2017 to 2019
which the Legislature had authorized in 2011 (SB 1693) as a version of an alternative
ratemaking mechanism that provides to utilities a means for expedited recovery of
distribution infrastructure costs Pursuant to SB 774 the Commission retained a consultant
to produce the report and the consultantrsquos recommendations included streamlining the ratemaking process to reduce procedural costs providing for a periodic review of the
prudency of the costs and using certain types of alternative ratemaking mechanisms that
decouple the recovery of costs from variations in load The Commission held a public
hearing to receive comments on the report from stakeholders and after consideration of
those comments has provided to the Legislature the consultantrsquos report together with its
own discussion of the report
Request for Purchase of Oncor Electric Delivery Company
In March 2016 the Commission approved with conditions an application by an
investor group led by Hunt Consolidated Inc the owners of Sharyland Utilities to acquire
control of Oncor Electric Delivery Company (Oncor) the largest transmission and
distribution utility in Texas from Oncorrsquos parent company Energy Future Holdings which
is in bankruptcy The Commission approved the request subject to certain conditions
including stipulations regarding the organization of the new entities and treatment of tax
benefits The investor-led group subsequently declined to pursue the transaction that was
approved by the Commission
In September 2016 NextEra Energy which owns Florida Power amp Light received
approval from the United States Bankruptcy Court in Delaware for its plan to purchase
Oncor In October 2016 NextEra Energy filed an application with the Commission in
Docket No 46238 for approval of the proposed transaction The Commission will evaluate
the application to determine if the transaction is in the public interest
Integration of Lubbock Power and Light
In March 2016 the Commission opened Project No 45633 to study and identify
the issues related to the request of Lubbock Power and Light the statersquos third-largest
municipally owned utility to be integrated into ERCOT The Commission is currently
working with stakeholders ERCOT and SPP to determine the cost and benefits of any
potential switch by Lubbock Power and Light into ERCOT and whether such a switch is
in the public interest
24 | P a g e
2017 SCOPE OF COMPETITION IN ELECTRIC MARKETS IN TEXAS REPORT
Desalination Project ERCOT Studies
In 2015 the Legislature passed HB 4097 which directed the Commission and
ERCOT to study whether existing transmission and distribution planning processes are
sufficient to provide adequate infrastructure for seawater desalination projects and to study
the potential for desalination projects to participate in demand response opportunities in
the ERCOT market Pursuant to that direction ERCOT staff have prepared a report on the
feasibility of interconnection of large desalination projects and on opportunities for such
projects to participate in ERCOTrsquos demand response programs which is attached to this Report in Appendix B
Oversight and Enforcement Actions
The Commissionrsquos enforcement of statutes rules and orders applicable to entities
under its jurisdiction serves to protect consumers the electric markets the reliability of the
electric grid and to promote fair competition The Commissionrsquos enforcement efforts in the electric industry focus on violations of PURA the Commissionrsquos rules and ERCOT
protocols
During the period from January 2015 through August 31 2016 the Commission
assessed $3258500 in penalties against electric market participants Table 8 provides a
summary of electric industry Notices of Violation since January 2015 During 2015 and
2016 Commission staff opened 212 investigations for the electric industry and closed 177
investigations
Table 8 Notices of Violations
Violation Type Total Penalty Amount
Retail Market Violations $539000
Service Quality Violations $451500
Wholesale Market Violations $2268000
TOTAL $3258500
In addition to the imposition of administrative penalties the Commission uses other
enforcement mechanisms in exercising its enforcement duties including revoking a
companyrsquos certificate to operate In addition some companies may be required to relinquish a certificate as part of a settlement after enforcement action has proceeded
Table 9 provides a breakdown of the number of certificates revoked or relinquished In
2016 the Commission revoked the certificate of the REP TruSmart Energy
Table 9 Certificates Revoked or Relinquished
Type Number
Certificates Revoked 1
Certificates Relinquished 0
25 | P a g e
2017 SCOPE OF COMPETITION IN ELECTRIC MARKETS IN TEXAS REPORT
The Oversight amp Enforcement division also issues warning letters to companies in
the electric market when it determines that a violation occurred but given the
circumstances surrounding the violation and other mitigating concerns no administrative
penalty is warranted During 2015 and 2016 the Oversight amp Enforcement division issued
50 warning letters Finally the Commission generally seeks to reimburse money directly
to customers when appropriate In 2015 and 2016 the Commission ordered the
reimbursement of $8543596 to Texas electric customers
Table 10 Warning Letters
Warning Letter Type Number
Retail Market Warning Letter 8
Service Quality Warning Letter 1
Wholesale Market Warning Letter 41
TOTAL 50
In addition to its enforcement activities the Commission also enters into voluntary
mitigation plans with generators that request one through a contested case proceeding
pursuant to PURA sect15023(f) and 16 TAC sect25504(e) The Commission entered into one
voluntary mitigation plan during 2015 and 2016 in Docket No 44635
Low-Income Discount System Benefit Fund
The System Benefit Fund (SBF) was originally established in 1999 to fund
discounts to low-income customers customer education activities energy-efficiency and
weatherization and electric market oversight through a nonbypassable surcharge on retail
electric bills HB 1101 of the 84th Legislature provided that the SBF be sunset on
September 1 2017 by which time the SBF is intended to be exhausted In the 2016 Fiscal
Year (FY) $325521250 was appropriated in the SBF to provide a 25ndash31 percent discount
to low-income customers over a 12-month period
To assist the drawdown of the remaining balance HB 1101 authorized the
Commission to use any unexpended SBF balance in FY 2017 to assist low-income
customers The Commission estimates that the remaining SBF balance will be
approximately $17 million by August 31 2017 The Commission has determined that this
amount is insufficient to fund the rate reduction program however the Commission will
spend approximately $100000 to continue automatic enrollment in the program to provide
REPs a list of customers eligible to receive late fee waiver and deposit installment benefits
These two ancillary benefits of the rate reduction program will continue for the duration of
FY 2017
26 | P a g e
2017 SCOPE OF COMPETITION IN ELECTRIC MARKETS IN TEXAS REPORT
Homeland Security
The Commission assesses the efforts of ERCOT and utilities to defend against
mitigate and respond to the variety of risks that the modern electricity system faces The
Commission also meets with ERCOT utilities and governmental entities on an ongoing
basis to discuss preparation for everything from hurricanes and other severe weather to
cyber-threats and threats of physical damage to the grid from accidents or intentional
malfeasance In addition the Commission monitors industry and federal programs that
address homeland security issues
The Commission serves as an information liaison between state government and
electric utilities during emergencies The Commissionrsquos main roles include
Conveying outage and service restoration information from electric utilities to
state government
Conveying service restoration priorities (hospitals water treatment facilities
etc) from state government to electric utilities and
Facilitating the clearance of downed power lines in disaster re-entry areas and
facilitating entry of electric utilities into disaster areas
The Commissionrsquos Emergency Management Response Team (EMRT) provided staff at the
State Operation Center for the May 2015 and April 2016 flooding events in Texas as well
as additional staffing for severe winter weather
Demand Response
ERCOT staff have begun to report annually on the participation of customers in
REP-sponsored demand response programs These programs which have been facilitated
by the deployment of smart meters throughout the competitive areas within ERCOT and
by many municipal and cooperative electric utilities take the form of rebates for reduction
in usage during peak period time-of-use pricing real-time volumetric price compensation
for load reduction and direct control of customer load among other plans
These programs have seen dramatic increases in participation since ERCOT began
to gather this information in 2013 From 2013 to 2014 the number of residential customers
participating in these programs increased from 151793 to 721273 and the number of
commercial and industrial customers participating rose from 30275 to 50205 The
Commission continues to monitor ERCOTrsquos stakeholder process for efforts relating to the integration of demand response
27 | P a g e
2017 SCOPE OF COMPETITION IN ELECTRIC MARKETS IN TEXAS REPORT
IV LEGISLATIVE RECOMMENDATIONS
A Determination of Low-Income Customer Eligibility
In 2015 HB 1101 required that all remaining funds in the System Benefit Fund
(SBF) be expended that the fee that funded the program as a nonbypassable surcharge on
electric bills be set at zero and that the SBF be sunset on September 1 2017 Per the
provisions of HB 1101 the SBF fee was set at zero in September 2016 concluding the
funding for the program The sunset of the SBF program also concluded the relationship
between the Texas Health and Human Services Commission (HHSC) and the Commission
in which the HHSC provided to the Commission eligible electric customers for the SBF
low-income discount Because of the termination of the relationship with HHSC with the
termination of the SBF the Commission will no longer be able to determine easily an
electric customerrsquos eligibility for other low-income programs such as late penalty waivers
and the option of paying an electric deposit over multiple months
The Legislature may wish to consider easing low-income customers access to these
low-income programs by facilitating the process used to determine eligibility The
Commission offers four possible approaches in which the Legislature could continue these
low-income programs
(1) Authorize HSSC to provide identification of eligible low-income customers to the
Commission
(2) Allow retail electric providers (REPs) to provide such low-income programs using
the Low Income Discount Administratorrsquos (LIDA) Telecommunications Lifeline
Service Program list to identify low-income customers
(3) Require REPs to offer such low-income programs with customers self-enrolling
and REPs verifying income eligibility or
(4) Allow REPs to voluntarily provide such low-income programs at their own
discretion
B Outside Counsel for Proceedings before Regional Transmission
Organizations
Regional Transmission Organizations (RTO) manage the power grid across wide
regions of the United States Most of Texas is inside the ERCOT region however there
are significant portions of East Texas and the Panhandle that are in the Midcontinent
Independent System Operator (MISO) and the Southwest Power Pool (SPP) Issues arise
in these other RTOs that have significant impact on Texas ratepayers such as how
transmission infrastructure costs will be shared These tend to be very lengthy and
complicated proceedings that require specialized legal and consulting services
28 | P a g e
2017 SCOPE OF COMPETITION IN ELECTRIC MARKETS IN TEXAS REPORT
PURA sect 394525 currently authorizes the Commission to use outside consultants
auditors engineers or attorneys to represent the Commission in proceedings before the
Federal Energy Regulatory Commission This provision has been an important tool for the
Commission to respond to complex matters in the federal arena to enable it to protect the
public interest in Texas The PUC recommends that the Legislature expand the language
in this statute to include the ability to hire outside assistance for proceedings before other
RTOs to provide those same protections to Texas ratepayers in those areas
C Repeal of Natural Gas and Renewable Energy Mandates
1 Natural Gas
PURA sect 399044 establishes natural gas as ldquothe preferential fuelrdquo in Texas for electricity generation and requires the Commission to adopt rules to establish a system of
natural gas energy trading credits The majority of all new non-renewable electricity
generation constructed since 2000 for Texas has used natural gas as a primary fuel and this
trend is expected to continue in the foreseeable future The thresholds used to trigger the
natural gas energy trading credit system in PURA sect 399044 have not been reached and
they are not expected to be reached in the foreseeable future
Because natural gas-fueled facilities have been the most commonly built new
generation in Texas for many years and are expected to continue to be there is no need to
establish incentives for natural gas generation The PUC recommends that the Legislature
consider repealing PURA sect 399044 because it is no longer necessary
2 Renewable Energy
PURA sect 39904 establishes goals for renewable energy Subsection (a) requires
the installation of 5880 megawatts of renewable energy by 2015 and Subsection (b)
establishes a renewable energy credits trading program to implement the requirement The
5880 megawatts mandates in Subsection (a) was met in 2008 While the Commission
believes the renewable energy trading credit program is needed for retail electric providers
to validate renewable energy marketing claims the Commission believes the 5880
megawatts mandate in Subsection (a) is no longer necessary
D Advisory Opinions
Many regulatory agencies in Texas have authority to issue informal guidance to the
persons they regulate particularly with respect to outlining whether a particular course of
conduct would in the agencyrsquos view be consistent with the laws and regulations that the agency administers19 The issuance of an advisory opinion can provide regulatory clarity
to a company before making investments or conducting operations the permissibility of
which may be unclear under state law The Legislature may want to consider granting the
19 In addition certain federal agencies such as the Federal Communications Commission
Internal Revenue Service Securities and Exchange Commission and Federal Election
Commission have authority to issue advisory opinions
29 | P a g e
2017 SCOPE OF COMPETITION IN ELECTRIC MARKETS IN TEXAS REPORT
Commission the authority to issue advisory opinions In the electric industry providing
clarification to a company concerning issues such as the purchase of assets or the
acquisition of another company could allow it to avoid expensive regulatory proceedings
without impairing the Commissionrsquos authority The following state agencies have statutory authority to issue advisory opinions
Texas Ethics Commission20
Texas Medical Board21
State Board of Dental Examiners22
Texas Board of Nursing23
Texas Board of Professional Engineers24
Texas Lottery Commission and25
Texas Securities Board26
E Administrative
Gross Receipts Assessment
PURA sect 16001 provides for a gross receipts assessment that is used to defray the
expenses incurred by the Commission to administer PURA An assessment of one sixth of
one percent is collected from public utilities electric cooperatives retail electric providers
and interexchange carriersrsquo gross receipts from consumers The funds from this assessment
are remitted to the general revenue fund but currently they have not been explicitly
dedicated to funding of the Commission In contrast similar assessments on water
utilities insurance companies and other regulated entities have traditionally been used to
explicitly fund the underlying regulatory programs at the respective agencies The
Commission is one of four Article VIII agencies that is not designated as self-funded
The Commission recommends that the Legislature designate the Commission as a
self-funded agency whereby the collected assessments would be explicitly dedicated to the
funding of the agency Implementing this recommendation would require the Public Utility
Commission to be included in the Appropriations Limited to Revenue Collections rider
located in the Special Provisions Relating to All Regulatory Agencies section of the
General Appropriations Act Designation as a self-leveling agency would require the
Commission to set the gross receipts assessment at a rate sufficient to generate revenue in
the amount of the agencyrsquos general revenue appropriation each fiscal year which would require a statutory change to PURA sect16001(b) Based upon the Commissionrsquos baseline budget request authorizing the PUCrsquos self-leveling designation would result in an overall
estimated tax reduction of $456 million per year or 774
20 Government Code sect 571091 21 Occupations Code sect 162107 22 Occupations Code sect 258157 23 Occupations Code sect 301607 24 Occupations Code sect 1001601 25 Occupations Code sect 2001059 26 Tex Rev Civ Stat Ann Arts 581-28-1 amp 581-35 7 Tex Admin Code 1012
30 | P a g e
2017 SCOPE OF COMPETITION IN ELECTRIC MARKETS IN TEXAS REPORT
V APPENDICES
31 | P a g e
2017 SCOPE OF COMPETITION IN ELECTRIC MARKETS IN TEXAS REPORT
Appendix A ndash Acronyms
AEP American Electric Power
AMS Advanced Metering System
CenterPoint CenterPoint Energy Houston Electric LLC
DG Distributed Generation
DRG Distributed Renewable Generation
ERCOT Electric Reliability Council of Texas
ERSC Entergy Regional State
ERS Emergency Response Service
ETI Entergy Texas Inc
IMM ERCOT Independent Market Monitor
kWh Kilowatt-hour
LMP Locational Marginal Pricing
LSP Large Service Provider
MISO Midwest Independent System Operator
MMBtu One million British Thermal Unit (BTU)
MW Megawatt
MWh Megawatt-hour
Nodal Texas Nodal Market Design
ORDC Operating Reserve Demand Curve
PGC Power Generation Company
POLR Provider of Last Resort
PURA Public Utility Regulatory Act
REP Retail Electric Provider
RSC Regional State Committee
RTO Regional Transmission Organization
SCED Security Constrained Economic Dispatch
Sharyland Sharyland Utilities LP
SBF System Benefit Fund
SPP Southwest Power Pool
TDU Transmission and Distribution Utility
TNMP Texas-New Mexico Power Company
32 | P a g e
2017 SCOPE OF COMPETITION IN ELECTRIC MARKETS IN TEXAS REPORT
Appendix B ndash ERCOT Desalination Report
This page intentionally left blank
33 | P a g e
ERCOT Public
Study on the Demand Response Potential for Seawater Desalination Projects
ERCOT November 18 2016
Study on the Demand Response Potential for Seawater Desalination Projects ERCOT Public
Executive Summary
In 2015 the 84th Texas Legislature enacted House Bill (HB) 4097 which included several provisions relating to seawater desalination projects including a requirement that the Public Utility Commission of Texas (PUC) and Electric Reliability Council of Texas (ERCOT) study the potential for seawater desalination projects to participate in existing demand response opportunities in ERCOT There are several demand response products in which demand-side resources (ie consumers of electricity) can participate These programs help to preserve system reliability and provide economic benefits to participating demand-side resources Seawater desalination is an energy-intensive process that removes salt and other minerals from salt water to produce fresh water for municipal consumption industrial use or irrigation Participation in demand response could help mitigate electricity costs for future seawater desalination projects in Texas and provide reliability benefits to the grid
There are two main demand response reliability-based services administered by ERCOT participation by demand-side resources in the Ancillary Services market and the Emergency Response Service (ERS) Within the Ancillary Services market the most common service provided by demand-side resources is Responsive Reserve Service (RRS) which requires resources to respond either instantaneously or within 10 minutes in response to unplanned system emergencies ERS is separate from ERCOTrsquos Ancillary Services market and allows demand-side resources and distributed generation to provide reliability services in the event of an energy emergency Resources can qualify for either the 10-minute or 30-minute response time ERS programs
There are several key considerations that will impact a demand-side resourcersquos ability to participate in different demand response opportunities response time recovery time predictability of electrical demand and flexibility of operations Considering these factors together it appears that seawater desalination plants could be designed to meet the requirements for participation in demand response Because the ability to meet the qualification requirements is dependent on the plant design demand response opportunities should be considered early in a projectrsquos development if participation is desirable
Whether project developers will choose to address these requirements will depend on the economic benefits of participation There may be additional costs to design seawater desalination plants to operate in the manner required in order to participate in demand response These include costs associated with additional plant design specifications need for excess capacity and storage to make up for lost production during demand response deployment operational costs resulting from interruptions to plant processes and potential financial penalties if demand response deployment results in failure to meet contract demands The interplay of the benefits of participation and these costs will determine whether it would be beneficial for a future seawater desalination plant to participate in demand response in ERCOT
To date participation of seawater desalination plants in demand response programs has been limited Because the process of seawater desalination is energy-intensive participation in demand response could help to reduce electricity costs while posing a relatively low risk to plant operations As stakeholders in Texas continue to plan for possible future droughts in the region and identify water management strategies consideration of demand response could play a role in mitigating some costs associated with seawater desalination and allow seawater desalination plants to assist with maintaining electric reliability in the region
copy 2016 ERCOT All rights reserved i
Study on the Demand Response Potential for Seawater Desalination Projects ERCOT Public
Table of Contents
1 Introduction 1
2 Seawater Desalination 2
21 Seawater Desalination Plant Operations 2
22 Seawater Desalination Plant Economics 3
3 Demand Response Opportunities in ERCOT 4
31 ERCOT-Dispatched Demand Response 4
311 Ancillary Services Markets 5
312 Emergency Response Service (ERS) 5
32 Non-ERCOT-Dispatched Demand Response 6
321 Four Coincident Peak (4CP) 6
322 LSE or DR Provider Contracted Price Response 6
323 Self-Directed Price Response 6
4 Demand Response Potential for Seawater Desalination 7
41 Operational Considerations for ERCOT-Dispatched Demand Response 7
42 Economic Considerations for ERCOT-Dispatched Demand Response 8
43 Considerations for Non-ERCOT-Dispatched Demand Response 9
5 Conclusion 11
copy 2016 ERCOT All rights reserved ii
Study on the Demand Response Potential for Seawater Desalination Projects ERCOT Public
1 Introduction
In 2015 the 84th Texas Legislature enacted House Bill (HB) 4097 which included several provisions relating to seawater desalination projects including a requirement that the Public Utility Commission of Texas (PUC) and Electric Reliability Council of Texas (ERCOT) study the potential for seawater desalination projects to participate in existing demand response opportunities in ERCOT ERCOT and the PUC initiated this study to fulfill that requirement and evaluated the operational and economic characteristics of seawater desalination plants in light of ERCOTrsquos primary demand response products1
ERCOT is the independent system operator (ISO) for the ERCOT Interconnection which encompasses approximately 90 of demand for electricity in Texas ERCOT is the independent organization established by the Texas Legislature to be responsible for the reliable planning and operation of the electric grid for the ERCOT Interconnection ERCOT also administers and maintains a forward-looking open market to provide affordable and reliable electricity to consumers in Texas In collaboration with market participants ERCOT has developed demand response products and services for customers that have the ability to reduce or modify electricity use in response to instructions or signals These programs help preserve system reliability and provide economic benefits to participating demand-side resources
The process of seawater desalination removes salt and other minerals from salt water to produce fresh water for consumption industrial processes or irrigation The drought-prone Texas climate coupled with projections for increasing water demand in the state has created interest in seawater desalination as a future water source The 2017 Texas State Water Plan includes seawater desalination as a future water management strategy for water users in the state However the seawater desalination process is energy intensive and electricity consumption can be a significant cost driver for these projects To the extent that these plants could participate in demand response it would help to defray these costs Thus there is a potential nexus between seawater desalination projects built in Texas to mitigate drought but which have large electricity requirements and ERCOT demand response opportunities which could help to reduce their electricity costs and provide reliability benefits
This study evaluates the demand response potential of seawater desalination plants based on their operational characteristics and economic drivers The report is organized as follows
Section 2 provides background on typical seawater desalination plant operations and economics
Section 3 describes the current demand response opportunities in ERCOT
Section 4 evaluates the characteristics of seawater desalination plants to determine their potential to participate in demand response opportunities in ERCOT and
Section 5 provides a summary of the conclusions of this study
1 In the course of developing this report ERCOT consulted with several desalination experts with experience with existing or planned seawater desalination plants in the US The technical experts consulted included Jorge Arroyo (Water Management Consultant) Andrew Chastain-Howley (Black amp Veatch) Jonathan Loveland (Black amp Veatch) Ron Parker (Black amp Veatch) John Wolfhope (Freese and Nichols) and Srinivas Veerapaneni (Black amp Veatch)
copy 2016 ERCOT All rights reserved 1
Study on the Demand Response Potential for Seawater Desalination Projects ERCOT Public
2 Seawater Desalination
There are two primary methods for seawater desalination distillation (also referred to as ldquothermalrdquo) and reverse osmosis Distillation uses heat to remove salts and minerals from seawater by boiling water at high pressures In contrast reverse osmosis technology forces saline water through a membrane to separate water from the salts and minerals While both distillation and reverse osmosis are energy intensive distillation requires thermal energy to heat the water and overall has a higher energy requirement whereas reverse osmosis requires primarily electrical energy and overall is less energy intensive ndash though still with significant electricity requirements
Globally most thermal desalination plants are located in the Middle East due to low energy prices in the region Plants located elsewhere including in the US typically use reverse osmosis technology2 There are two large existing seawater desalination plants in the US one in Carlsbad California providing water to the San Diego area and one in Gibsonton Florida providing water to the Tampa Bay area Both plants use reverse osmosis technology In addition there are several desalination projects currently in the planning stages or under development in Texas in the Corpus Christi area that would use reverse osmosis technology For that reason this report focuses on reverse osmosis technology in the evaluation of demand response potential of seawater desalination plants
While there are currently no existing seawater desalination plants in Texas there are several municipal and industrial brackish water desalination plants in the state According to the Texas Water Development Board (TWDB) there are 46 municipal brackish water desalination plants with capacities greater than 0025 million gallons per day (MGD) in Texas representing a total of 123 MGD of capacity3 The desalination of brackish water is typically less expensive compared to seawater due to the lower relative salinity of brackish water This study focuses exclusively on seawater desalination consistent with the requirements of HB 4097 but it should be noted that conclusions may also apply to brackish water desalination though at a different cost and scale
This section provides high-level information on the operations (Section 21) and economics (Section 22) of seawater desalination plants to inform the discussion of their demand response potential in Section 4
21 Seawater Desalination Plant Operations Seawater desalination plants typically range in capacity from less than 5 MGD up to 165 MGD For example the Carlsbad seawater desalination plant has a capacity of approximately 50 MGD and the plant in Tampa Bay has a capacity of approximately 25 MGD The associated electricity consumption ranges between 10 and 15 kWh1000 gallons produced depending on the salinity of the water being processed456 More saline water (eg seawater) requires larger amounts of electricity for desalination Thus a seawater desalination plant would have larger electricity consumption requirements compared to a similarly sized brackish water desalination plant
2 American Water ldquoInnovation Solutions within the Water Industry Desalinationrdquo Available at httpwwwamwatercomfilesInnovationsSolutionsWithinTheWaterIndustryDesalinationpdf 3 Texas Water Development Board ldquoDesalination Factsrdquo Available at httpswwwtwdbtexasgovinnovativewaterdesalfactsasp 4 American Membrane Technology Association April 2016 ldquoMembrane Desalination Power Usage Put in Perspectiverdquo Available at httpwwwamtaorgcomwp-contentuploads7_MembraneDesalinationPowerUsagePutInPerspectivepdf 5 Water Reuse Association November 2011 ldquoSeawater Desalination Power Consumptionrdquo Available at httpswatereuseorgwpshycontentuploads201510Power_consumption_white_paperpdf 6 Ghaffour N TM Missimer and G Amy January 2013 ldquoTechnical review and evaluation of the economics of water desalination Current and future challenges for better water supply sustainabilityrdquo Desalination 309 pp197-207 Available at httpswwwresearchgatenetpublication256693140_Technical_review_and_evaluation_of_the_economics_of_water_desalination_ Current_and_future_challenges_for_better_water_supply_sustainability
copy 2016 ERCOT All rights reserved 2
Study on the Demand Response Potential for Seawater Desalination Projects ERCOT Public
While the two existing seawater desalination plants in the US were co-located with power plants to ease compliance with regulations on water intake and discharge structures and reduce costs many other reverse osmosis desalination plants receive their electricity from the grid However plants may have on-site backup generation in case of a power outage This will vary depending on the size and design of the plant and other factors For example the Carlsbad plant in California does have diesel backup generation to power control systems and flushing systems in the case of a power outage The plant in Tampa Bay was not built with backup power due to potential storm surge risks from hurricanes and other storms The plant does use uninterruptible power supply (UPS) backup to power control systems during power outages
Reverse osmosis plants are typically designed with several ldquotrainsrdquo which consists of a high-pressure pump turbine and reverse osmosis membrane Desalination plants are turned on or off one train at a time in a highly controlled process The process of ramping up or down an individual train under normal operations typically takes one to two hours While plants can be designed to handle immediate shutdowns (ie in a power outage) re-starting a system after an interruption would take this amount of time In addition the saline water must be pretreated (ie filtered) before going through the reverse osmosis train and this can sometimes pose constraints on the flexibility of operations
Demand for water is the key factor driving the level of production at seawater desalination plants Typically the plant will have a contract or contracts with municipal or other water users to deliver desalinated water and is operated to meet that demand Alternatively if the plant is municipally owned it would similarly be operated to meet the level of water demand in conjunction with other available water sources If water demands are close to a plantrsquos full capacity the operatorrsquos flexibility to adjust its electricity consumption as part of demand response may be limited However this does mean that plant operations are fairly predictable on a day-to-day basis which is necessary for participation in demand response
The amount of flexibility in plant operations will also be impacted by the amount of water storage available For example if a plant has sufficient water storage on-site or storage within the customerrsquos distribution system it could provide flexibility for the plant to reduce its operations during peak hours when electricity prices are likely to be highest It would also mitigate the impacts of interruptions to production from demand response deployments
22 Seawater Desalination Plant Economics Seawater desalination is typically more expensive than other sources of water and a major driver of the overall cost is energy costs In 2016 the Carlsbad plant charged rates at between $2131 and $2367 per acre-foot78 This charge is intended to cover both the fixed costs of the plant and the variable costs to produce a unit volume of water Typically half to two thirds of the cost of providing desalinated seawater are accounted for by capital cost recovery with the remainder accounted for by operations and maintenance costs including electricity costs Electricity costs can account for 20shy25 of the total costs of seawater desalination with reverse osmosis technology9
Factors affecting the capital cost of a seawater desalination plant include plant size type of desalination process and pre-post-treatment technologies plant infrastructure (eg piping water storage backup power) and compliance with applicable regulations (eg regulations on intake structures brine byproduct disposal) A significant driver of operating and maintenance costs is membrane replacement Reverse osmosis membranes need to be replaced every few years and
7 Source San Diego County Water Authority ldquoSeawater Desalinationrdquo Available at httpwwwsdcwaorgseawater-desalination 8 Note that 1 acre-foot is approximately 325851 gallons 9 Based on technical input from Black amp Veatch
copy 2016 ERCOT All rights reserved 3
Study on the Demand Response Potential for Seawater Desalination Projects ERCOT Public
the rate at which they are replaced will depend on the salinity of the feedwater and how the plant is operated Treatment and disposal of the salty brine byproduct from desalination may also incur operating costs
Electricity costs will vary depending on a range of factors including the size of the plant type of desalination technology source of electricity and quality of the feedwater As previously noted more saline water requires higher amounts of electricity in desalination and thus the amount of electricity consumption is a key difference between brackish water and seawater desalination As a result electricity costs comprise a significant share of the costs of seawater desalination These costs could potentially be defrayed in part by participation in demand response initiatives
3 Demand Response Opportunities in ERCOT
Broadly speaking demand response can be broken down into two major categories dispatchable or non-dispatchable For purposes of this report we will define dispatchable as those demand response events that are initiated by ERCOT and non-dispatchable as an event not specifically initiated by ERCOT These non-dispatchable events may include decisions made by the end-use customer to alter its consumption pattern or may include contractual obligations with another entity such as the end-use customerrsquos retail electric provider (ldquoREPrdquo) to alter consumption patterns
ERCOTrsquos wholesale market is open to several types of dispatchable demand response which are deployed to maintain system reliability Demand-side resources providing Emergency Response Service (ERS) may offer based on either a 10 or 30-minute response time commonly referred to as the ldquoramp periodrdquo Alternatively demand-side resources may register and qualify as a Load Resource that can provide Reserves in the Ancillary Services market The most common service provided by demand-side resources is Responsive Reserve Service which requires an under-frequency relay that can instantaneously interrupt the load during certain system reliability events Some demand-side resources can also participate in other Ancillary Services as Controllable Load Resources that require sophisticated control systems that allow them to be deployed in a more incremental proportional manner
Non-dispatchable demand response in ERCOT can include a response to avoid transmission costs where rates are based on Four Coincident Peak Pricing (4CP) response to wholesale energy prices initiated by the customer or by a REP or other load-serving entity (ldquoLSErdquo) or utility-managed Load Management programs (LM)
The sections that follow provide a description of both ERCOT-dispatched (Section 31) and nonshyERCOT-dispatched (Section 32) demand response For a more detailed description of opportunities for demand-side resources to participate in demand response in ERCOT see ERCOTrsquos guide Load Participation in the ERCOT Nodal Market10
31 ERCOT-Dispatched Demand Response There are two main demand response reliability-based services administered by ERCOT participation by demand-side resources in the Ancillary Services market and participation in ERS These services are dispatched by ERCOT during system emergencies
10 Available at httpwwwercotcomcontentservicesprogramsloadLoad20Participation20in20the20ERCOT20Nodal20Market_302d oc
copy 2016 ERCOT All rights reserved 4
Study on the Demand Response Potential for Seawater Desalination Projects ERCOT Public
Demand-side resources with demand response capability that can meet a set of performance requirements can be qualified to provide Ancillary Services as Load Resources in the Ancillary Services Market The value of having a Load Resource available to reduce load is equal to the value of having a generator available to increase its generation at a generating plant The providers of operating reserves selected to provide Ancillary Services are eligible for capacity payments regardless of whether the Resource is actually deployed (or curtailed in the case of the Load Resource)
ERCOT holds auctions on a daily basis for each of the following Ancillary Services Regulation Up Regulation Down Responsive Reserve and Non-Spinning Reserve11 Table 1 describes the various Load Resource types and their qualification requirements and eligible services
Table 1 Load Resource Types and Ancillary Services
Service Load Resource Type a Qualification Responsive Reserves (le50 of total Reserve requirement)
Non Controllable Under-Frequency Relay and 10-minute ramp to manual dispatch instruction
Responsive Reserves
Controllable Primary Frequency Response and follow 5-minute dispatch instructions
Regulation-Up Regulation-Down
Controllable Primary Frequency Response and respond to Regulation deployments
Non-Spin Reserves Controllable Follow 5-minute dispatch instructions a A Controllable Load Resource is a Load Resource capable of controllably reducing or increasing consumption under dispatch control by ERCOT
Demand-side resources that agree to reduce load when directed by ERCOT and that meet other metering and operational requirements as specified in the ERCOT Protocols may participate in Ancillary Services market auctions As noted in Table 1 the type of Ancillary Service that a Load Resource may provide will depend upon the demand-side resourcersquos response time and metering system as well as other requirements described in the Protocols In the Responsive Reserve and Non-Spin Reserve markets the Load Resource will receive capacity payments regardless of whether or not the load was actually deployed but the load must be available for deployment at any time while providing the service
ERCOT procures ERS to maintain grid reliability during emergency conditions and reduce the likelihood of the need for rotating outages ERS participants may offer to provide demand response with either a 10-minute ramp period requirement (similar to Load Resources providing Responsive Reserve Service) or a 30-minute ramp period requirement ERS Resources do not have the same telemetry and under-frequency relay requirements as Load Resources
11 Regulation Up and Regulation Down service respond to signals from ERCOT every 4 seconds to respond to changes in system frequency full response has to be provided within 5 minutes Responsive reserves must provide their committed capacity either instantaneously in an under-frequency event (eg due to a generator outage) or in energy scarcity conditions within ten minutes following an instruction from ERCOT Non-spinning reserves must provide their committed capacity within 30 minutes based on economic dispatch instructions Non-spinning reserve is used as replacement reserve to replenish other ancillary services and during energy scarcity
copy 2016 ERCOT All rights reserved 5
Study on the Demand Response Potential for Seawater Desalination Projects ERCOT Public
ERS is procured through a request for proposal (RFP) process three times per year for four-month contract terms each of which is further split into smaller time periods based on business cycles and other factors Demand-side resources may choose to submit offers in all time periods or only in those that best fit their unique circumstances and may vary both the price and demand response capacity offers by time period
Payments for ERS are performed up to 80 days after each four month contract term has ended and are subject to downward revision based upon delivered demand response capacity and the demand-side resourcersquos availability during the contract term
32 Non-ERCOT-Dispatched Demand Response The options listed below are not dispatched by ERCOT but they either are controlled directly by a customer or are dispatchable by another entity such as a demand response provider (ldquoDR Providerrdquo) REP or a transmission and distribution utility
Many industrial customers are subject to transmission charges based upon a Four Coincident Peak (4CP) demand The 4CP demand is determined by averaging the consumerrsquos actual demand during the 15-minute settlement interval with the highest ERCOT demand during each of the four summer months (June through September) This measured 4CP demand serves as the basis for the customerrsquos transmission tariff charges for the following year By correctly predicting the ERCOT system peaks during the summer and curtailing load during those intervals a consumer can help reduce the stress imposed on the electric system during peak periods of consumption and reduce its transmission charges for the following calendar year
In the competitive areas of ERCOT consumers can contract with their REP or a DR Provider to have their load respond to the REPrsquos or DR Providerrsquos instructions The contract will usually outline the parameters of this response ndash at what times and frequency demand response events can be called ramp periods sustained response periods compensation etc Because this response is a contractual matter between the REP or DR Provider and the consumer a great deal of variety can be present in these arrangements For example a consumerrsquos response may be voluntary or required compensation could come in the form of reduced energy prices or rebate payments for each curtailment event consumers might be notified up to a day in advance or could have no notification at all (for automated curtailment)
In areas of ERCOT not open to competition interruptible tariffs may be available These tariffs will usually offer a reduced energy price for defined curtailment obligations
REPs may offer dynamic pricing options or consumers within a municipality or cooperative may have their energy prices determined by a published tariff which also may be structured based upon Time-of-Use (TOU) or have a Critical Peak Pricing (CPP) or Peak Time Rebate (PTR) component Self-directed price response refers to consumers making an independent decision to respond to energy prices contained in a governing tariff or in either the ERCOT Day Ahead or Real Time energy markets
TOU offerings will typically have higher energy prices during normal peak periods ndash for example a TOU tariff may charge one price during Monday through Friday from 2 pm through 8 pm and another price during all other times Customers may choose to reduce consumption during these high priced periods Load reduction can be accomplished by load shifting (loads can be shifted by
copy 2016 ERCOT All rights reserved 6
Study on the Demand Response Potential for Seawater Desalination Projects ERCOT Public
rescheduling certain processes or by utilizing thermal storage) ending certain processes that are no longer economic or through energy efficiency measures
Offerings that incorporate CPP usually have prescribed high prices only during certain defined periods ndash for example when load or prices are expected to reach a certain level Response to CPP may be similar to those employed under TOU tariffs especially if CPP is reached frequently More often CPP is infrequent and as such short-term load curtailment may be the more appropriate response to meet economic objectives
4 Demand Response Potential for Seawater Desalination
This section evaluates whether the operational characteristics and economics of seawater desalination plants would enable them to participate in one or more of the various demand response opportunities in the ERCOT Region To date participation of seawater desalination plants in demand response programs has been limited Neither the plant in Carlsbad nor the plant in Tampa Bay participate in demand response programs in California or Florida respectively However as will be described below it appears that these plants can be designed and operated to meet the requirements for participation in demand response and receive economic benefit from participation in these programs
Section 41 describes the operational parameters that must be met for a demand-side resource to provide ERCOT-dispatched demand response and evaluates the ability of seawater desalination plants to meet these criteria Section 42 discusses the tradeoffs between payments for participation in ERCOT-dispatched demand response and potential additional costs posed to seawater desalination plants Finally Section 43 presents other opportunities for seawater desalination plants to reduce their electricity costs outside of ERCOTrsquos reliability-based services that are open to demand response assets
41 Operational Considerations for ERCOT-Dispatched Demand Response There are several key operational parameters that impact a demand-side resourcersquos ability to participate in different demand response services response time recovery time predictability of electrical demand and flexibility of operations This section discusses each of these considerations as they apply to seawater desalination plants
As discussed in Section 31 one of the differentiating factors between ERCOTrsquos demand response products is the amount of time within which a demand-side resource must respond to a deployment instruction to reduce electricity consumption during an event Participation in RRS requires an automatic response within either half a second (ie instantaneous) based on grid frequency or within 10 minutes via a manual instruction ERS requires a response time of either 10 or 30 minutes As noted in Section 21 the typical time to take a reverse osmosis train on- or off-line is 1-2 hours under normal controlled operations To comply with the response time requirements of RRS or ERS a seawater desalination plant would need to be able to reduce its electricity consumption far more quickly than in normal operations This is an element of plant design that would need to be accounted for in the specifications of the project Considerations include the potential need for on-site backup generation including uninterruptible power supply potential impacts to plant infrastructure (eg piping) reverse osmosis membranes and pretreatment systems
The two large US desalination plants provide illustrative counterpoints in this respect The Carlsbad plant was designed to withstand instantaneous power interruptions and has on-site backup generation including uninterruptible power supply to provide the ability to power control systems and flush the membranes in the event of a power loss In contrast the Tampa Bay plant was not
copy 2016 ERCOT All rights reserved 7
Study on the Demand Response Potential for Seawater Desalination Projects ERCOT Public
designed with on-site backup generation and a loss of power would result in a plant shutdown and may require several days to bring the plant back on-line Thus it appears that it is technically possible for a seawater desalination plant to meet the response time requirements for participation in demand response so long as this factor is considered in the design of the facility
The time it takes a desalination train to return to operations after an event is also a consideration Demand-side resources participating in RRS must be able to come back on-line within three hours and those participating in ERS must return within 10 hours Again it appears that it is technically feasible for desalination plants to meet this requirement so long as this requirement is considered in the plant design
An additional consideration is the predictability of a demand-side resourcersquos electricity consumption Participation in the responsive reserves ancillary service market requires bidding in the day-ahead market and thus a demand-side resource must know with great accuracy (within 95) its electrical demand at least a day ahead of time For ERS auctions are held three times a year for four-month contract periods Thus to participate in ERS a resource must know its forecasted electrical demand several months in advance Because seawater desalination plant operations are driven by contracted demand for water it is likely that a plant operator would have a good idea of the plantrsquos electrical demand days or even weeksmonths in advance especially for summer months when demand is likely to be relatively steady An important consideration however is the salinity of the water which drives the electrical requirements and which can be impacted by recent weather events Similarly reductions in demand for water during non-summer months or wet summer days where demand may be reduced could also impact a plantrsquos ability to predict its electricity demand
Finally a seawater desalination plant must have sufficient flexibility in its day-to-day operations so that it can afford to lose several hours of production when deployed for demand response It should be noted that demand-side resources participating in RRS and ERS are called infrequently demand-side resources providing responsive reserves were deployed one time in 2015 and ERS was not deployed that year However this is an important factor to consider if a plant is operating at close to full capacity and would incur financial penalties if it fails to meet its contract obligations due to a demand response event Including additional storage and building a plant with extra capacity could help to mitigate this risk It should also be noted that a plant operator does not need to commit the full plant capacity to these services but rather can specify an amount of MW that will be committed Thus a plant operator could mitigate issues both with predictability and flexibility of plant operations by committing only a portion of its predicted electrical demand to participate in demand response
Considering these factors together it appears that seawater desalination plants could be designed to meet the operational requirements for participation in ERCOTrsquos demand response services (both RRS and ERS) Because the ability to meet the requirements is dependent on the plant design demand response would need to be considered early in a projectrsquos development if participation is desirable Whether project developers will choose to address these requirements will depend on the economic benefits of participation in demand response which will be discussed in the next section
42 Economic Considerations for ERCOT-Dispatched Demand Response This section describes the economic benefits to demand-side resources from participation in ERCOT-dispatched demand response programs The average price paid for a demand-side resource participating in RRS in 2015 was $1087 per MW per hour and for ERS was $645 per MW per hour for the contract periods during the 2015 program year These payments could provide a significant financial benefit to seawater desalination plants To give a simplified example for a plant with an electrical demand of 10 MW operating at a 100 annual load factor (10 MW times 24 hours times 365 days) the annual benefit would be on the order of $500000 for ERS or $1 million for RRS
copy 2016 ERCOT All rights reserved 8
Study on the Demand Response Potential for Seawater Desalination Projects ERCOT Public
In 2015 demand-side resources providing responsive reserves were deployed one time for a duration of 10 minutes and ERS was not deployed12 The most ERS was ever deployed in a single year was two times in 2011 Thus participation in either program could result in a substantial payment to a seawater desalination plant with a relatively low risk of deployment and associated disruption of plant operations although it is important to note that participation in either ERCOT service subjects demand response resources to annual unannounced testing Other than testing the frequency of deployment will depend on grid conditions and is a risk that should be considered
The financial benefits of participation must be weighed against the costs of designing facilities with the capabilities to operate in this manner These include
bull The costs to design the plant to reduce electrical demand within the required timeframes for demand response and to withstand an instantaneous interruption if not already part of the plant design For example a plant may need to be designed to have backup power generation on-site In addition there could also be costs to restart the system after an interruption
bull The costs to build a plant with excess capacity andor storage to make up for lost production hours when demand response is deployed This will add to the total capital costs of the project Land area constraints should also be considered when considering additional storage as the space requirements for the necessary storage capacity could be significant
bull Costs associated with the impact of interruptions on plant processes (eg more frequent replacement of membranes impacts to pretreatment system or plant infrastructure)
bull Potential financial penalties that would be incurred if deployment as part of demand response were to result in failure to meet contract obligations to supply water
bull The loss of potential benefits in the form of cost avoidance from participation in non-ERCOTshydispatched demand response opportunities (see Section 43) If a plant is committed to RRS or ERS the plant operator would lose the flexibility to take advantage of these other opportunities to reduce their electricity costs
The interplay of these benefits and costs will determine whether it would be beneficial for a future seawater desalination plant to participate in demand response in ERCOT
43 Considerations for Non-ERCOT-Dispatched Demand Response Outside of the reliability-based services administered by ERCOT there are other opportunities for seawater desalination plants to reduce their electricity costs As described in Section 321 seawater desalination plants may be able to reduce the demand charges on their electricity bills through curtailing load during 4CP intervals In addition plant operators may adjust operations in response to real-time electricity prices to take advantage of lower off-peak prices and avoid price spikes (see Sections 322 and 323) All of these opportunities require that the plant have flexibility to reduce production during certain times of the day
In the ERCOT region as noted above a portion of transmission and distribution charges are set based on the peak systemwide 15-minute interval of the four summer months (June through September) referred to as the four coincident peaks (4CP) Large customers can reduce or avoid this charge by reducing electrical consumption during these four peak intervals AEP Central Texas and CenterPoint are the transmission providers covering the majority of the Gulf Coast in Texas13
12 ERCOT June 2016 ldquoLoad Resource Deployment Updaterdquo Available at httpwwwercotcomcontentwcmkey_documents_lists870985_RRS_Load_Resource_Deployment_Updatepdf 13 It is also possible that a seawater desalination plant could be located in an area that as not opted in to competition in which case the plant owner would need to negotiate its electricity charges bilaterally with the Non Opt-In Entity (NOIE)
copy 2016 ERCOT All rights reserved 9
Study on the Demand Response Potential for Seawater Desalination Projects ERCOT Public
Assuming a future seawater desalination plant would be connected at transmission-level voltages the relevant 4CP charges based on the 2016 tariffs accounting for both transmission charges and transmission cost recovery factors would be $41425 per 4CP kW for AEP Central Texas and $41870 per 4CP kVA for CenterPoint14 If a seawater desalination plant has 10 MW of load and is capable of interrupting all of it and successfully does so for all four 4CP intervals the savings based on the 2016 tariffs would be approximately $500000 per year ($41425 times 1000 (kW to MW) times 10 MW times 12 months) Thus a seawater desalination plant that reduces its electricity use during the 4CP intervals could avert some or all of these charges
Another opportunity for seawater desalination plants to reduce their electricity costs is through adjusting operations in response to real-time electricity prices In 2015 the average electricity price in ERCOT was $2677MWh However prices exceeded $50MWh in 254 hours (3 of all hours) $100MWh in 88 hours (1) $200MWh in 40 hours (05) and $300MWh in 21 hours (02) Prices exceeded $3000MWh for 021 hours15 Depending on the desalination plantrsquos exposure to real-time wholesale market prices (via its retail contract) the degree of high prices the plant owner is willing to avoid and grid conditions in a given year reducing unit operations in order to avoid high electricity prices could impact operators for anywhere between a few and several hundred hours out of the year In addition a plant can plan its operations to take advantage of lower electricity prices during off-peak periods (eg at night when generation from wind is high) For example at least one company is marketing a modular desalination unit design intended to take advantage of low prices during periods of high renewables generation and to provide grid reliability services through demand response16
There are several factors to consider regarding these opportunities to reduce electricity costs The plant would need to monitor the ERCOT market or hire a contractor to do so in order to know when to reduce demand for electricity These programs do not impose any requirements on response time as with RRS or ERS and there may be sufficient warning of 4CP intervals or peak pricing to allow the plant operator to plan its operations earlier in the day with sufficient time to ramp down production under controlled conditions However quicker ramping capability may be desirable to respond to electricity price fluctuations
For 4CP because the four intervals used to set demand charges are not known ahead of time it is likely that the plant would need to reduce its demand multiple times per summer to ensure the 4CP intervals are hit impacting production at the facility Timing operations to coincide with off-peak pricing or to avoid price spikes would similarly result in reduced operations during certain hours To offset the lost production hours the plant may need to be designed with extra capacity and water storage capability to maintain the ability to meet its contractual obligations for freshwater delivery Because the period of reduced operations is greater than with ERCOT-dispatched demand response services this need would be greater for a seawater desalination plant reducing load during 4CP intervals or in response to real-time electricity prices and would increase the capital costs of the project It should also be noted that high prices in the ERCOT Region typically but not always occur in summer months when drought conditions are more likely to develop and demand for desalinated water is likely to be highest This may limit the flexibility of the plant to time its electricity consumption to avoid high-priced hours
14 Public Utility Commission of Texas ldquoTransmission and Distribution Rates for Investor Owned Utilitiesrdquo Available at httpwwwpuctexasgovindustryelectricratestdraspx 15 Potomac Economics June 2016 2015 State of the Market Report for the ERCOT Wholesale Electricity Markets Available at httpswwwpotomaceconomicscomindexphpmarkets_monitoredERCOT 16 Sisyan LLC ldquoDemand Response Desalinationrdquo Available at httprenewabledesalinationcomwpshycontentuploads201506Demand-Response-Desalinationpdf
copy 2016 ERCOT All rights reserved 10
Study on the Demand Response Potential for Seawater Desalination Projects ERCOT Public
In addition the plantrsquos ability to participate in demand response would also be limited for those hours it is reducing load as part of 4CP response or in response to real-time prices because the plant would not be able to reduce its electricity consumption if that demand is already committed to another demand response service Thus participating in demand response versus taking advantage of these other opportunities may be to some extent mutually exclusive
5 Conclusion
Based on this analysis it appears that the operational characteristics of seawater desalination plants would allow them to participate in demand response opportunities in ERCOT so long as the necessary operational requirements are considered in the design specifications of the plant Project developers should consider the necessary requirements early in the plant design Whether the economic benefits of participation would provide a sufficient incentive for them to do so will depend on the costs of accommodating those operational requirements and whether there is the flexibility available to operate the plant as necessary under these programs Though most existing seawater desalination plants do not participate in demand response programs it does appear that participation by these plants is possible and could result in a financial benefit Table 2 compares the different demand response opportunities available to demand-side resources in ERCOT
Table 2 Comparison of Demand Response Opportunities Demand Response
Opportunity Requirements for
Participation Impacts to Plant
Operations Financial Benefit Ancillary Services ndash Responsive Reserve Service (RRS)
bull Under-Frequency Relay bull Instantaneous or 10 minute
response time bull Recover load within 3
hours bull Bid in day-ahead market
bull Deployed once in 2015 for 10 minutes bull Subject to annual
unannounced testing
bull $1087 per MW per hour (based on 2015 prices)
Emergency Response Service (ERS)
bull 10 or 30 minute response time bull Recover load within 10
hours bull Four-month contract term
bull Not deployed in 2015 the most times ever deployed in a single year was twice in 2011 bull Subject to annual
unannounced testing
bull $645 per MW per hour (based on 2015 prices)
Four Coincident bull Interval Data Recorder bull Likely plant will need to bull Avoid ~$48000 per 4CP Peak (4CP) (IDR) meter
bull Ability to predict system-wide peak demand hours during summer months
reduce load multiple times per summer to hit 4CP intervals bull Likely to be able to predict
possible 4CP intervals earlier in day
MW per year (based on 2016 tariffs) if successful in reducing during all four summer months
LSE or DR Provider Contracted Price Response
bull Varies based on contractual arrangements
bull Varies based on contractual arrangements
bull Varies based on contractual arrangements
Self-Directed Price bull Retail contract with bull Varies depending on bull Varies depending on Response exposure to real-time
market prices bull Ability to monitor real-time
prices in ERCOT wholesale market
number and severity of pricing events bull May be able to predict
peak pricing events earlier in day
number and severity of pricing events
copy 2016 ERCOT All rights reserved 11
Study on the Demand Response Potential for Seawater Desalination Projects ERCOT Public
Demand response programs in ERCOT provide opportunities for demand-side resources to defray their electricity costs and provide reliability benefits to the ERCOT electric grid Because the process of seawater desalination is energy intensive participation in demand response could help to reduce electricity costs while posing a relatively low risk to plant operations if demand response participation is factored into plant design
Participation in non-ERCOT-dispatched demand response opportunities such as reducing load during 4CP intervals or in response to real-time electricity prices may also help to reduce electricity costs for seawater desalination plants in Texas As stakeholders in Texas continue to plan for possible future droughts in the region and identify water management strategies consideration of demand response could play a role in mitigating some costs associated with seawater desalination and allow seawater desalination plants to assist with maintaining electric reliability in the region
copy 2016 ERCOT All rights reserved 12
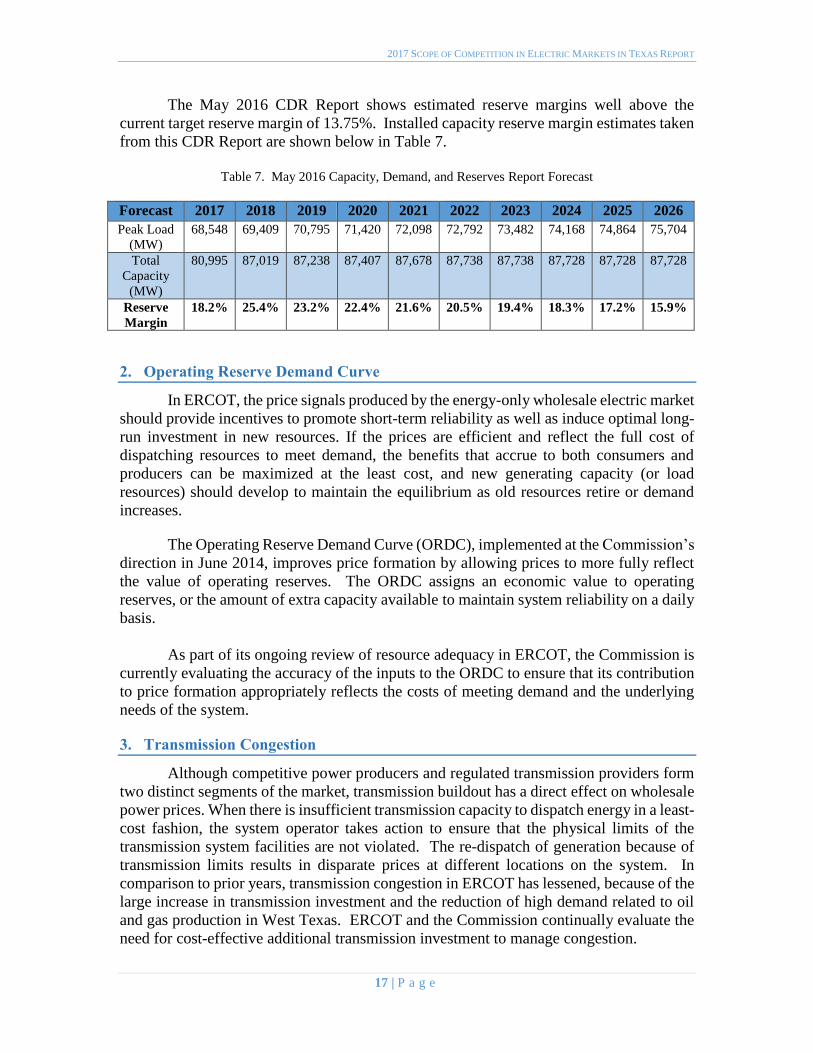
2017 SCOPE OF COMPETITION IN ELECTRIC MARKETS IN TEXAS REPORT
The May 2016 CDR Report shows estimated reserve margins well above the
current target reserve margin of 1375 Installed capacity reserve margin estimates taken
from this CDR Report are shown below in Table 7
Table 7 May 2016 Capacity Demand and Reserves Report Forecast
Forecast 2017 2018 2019 2020 2021 2022 2023 2024 2025 2026
Peak Load
(MW)
68548 69409 70795 71420 72098 72792 73482 74168 74864 75704
Total
Capacity
(MW)
80995 87019 87238 87407 87678 87738 87738 87728 87728 87728
Reserve
Margin
182 254 232 224 216 205 194 183 172 159
2 Operating Reserve Demand Curve
In ERCOT the price signals produced by the energy-only wholesale electric market
should provide incentives to promote short-term reliability as well as induce optimal long-
run investment in new resources If the prices are efficient and reflect the full cost of
dispatching resources to meet demand the benefits that accrue to both consumers and
producers can be maximized at the least cost and new generating capacity (or load
resources) should develop to maintain the equilibrium as old resources retire or demand
increases
The Operating Reserve Demand Curve (ORDC) implemented at the Commissionrsquos direction in June 2014 improves price formation by allowing prices to more fully reflect
the value of operating reserves The ORDC assigns an economic value to operating
reserves or the amount of extra capacity available to maintain system reliability on a daily
basis
As part of its ongoing review of resource adequacy in ERCOT the Commission is
currently evaluating the accuracy of the inputs to the ORDC to ensure that its contribution
to price formation appropriately reflects the costs of meeting demand and the underlying
needs of the system
3 Transmission Congestion
Although competitive power producers and regulated transmission providers form
two distinct segments of the market transmission buildout has a direct effect on wholesale
power prices When there is insufficient transmission capacity to dispatch energy in a least-
cost fashion the system operator takes action to ensure that the physical limits of the
transmission system facilities are not violated The re-dispatch of generation because of
transmission limits results in disparate prices at different locations on the system In
comparison to prior years transmission congestion in ERCOT has lessened because of the
large increase in transmission investment and the reduction of high demand related to oil
and gas production in West Texas ERCOT and the Commission continually evaluate the
need for cost-effective additional transmission investment to manage congestion
17 | P a g e
2017 SCOPE OF COMPETITION IN ELECTRIC MARKETS IN TEXAS REPORT
4 Wholesale Market Design Initiatives
While the ERCOT wholesale market has been successful in attracting new resource
investment and also maintaining competitive prices for consumers certain improvements
to the market design could yield additional benefits in terms of efficient price formation
and opportunities for entry of new technology Initiatives already in place in many other
regions such as real-time co-optimization and multi-interval real-time resource dispatch
may allow existing capacity to be used more effectively and create opportunities for the
integration of additional load resources to serve electric demand The Commission
continues to work with ERCOT and interested stakeholders to determine the value of
implementing such enhancements particularly as ERCOTrsquos resource mix changes over time
5 Reliability Standard
In early 2014 the Commission opened a project to review its use of a target installed
capacity reserve margin based on a reliability standard equivalent to one loss-of-load event
every ten years In this project the Commission received written comment from interested
parties conducted a public workshop consulted with independent experts and reviewed
the application of reliability standards in other regions As a result of this review future
reliability metrics to be estimated in ERCOT will include the market equilibrium reserve
margin the economically-optimal reserve margin and the associated levels of expected
unserved energy The Commission believes that publishing these metrics represents an
improvement over reporting a one-event-in-ten-years standard by enhancing insight into
expected outcomes in ERCOTrsquos energy-only market
Non-ERCOT Utilities Market Development Activities
SB 7 the law that introduced retail competition to the Texas market in 1999
granted the Commission authority to delay retail competition in an area where deregulation
would not result in fair competition and reliable service because of the lack of an
independent organization to coordinate the electric system and the concentration of
ownership in the generation sector in some of those areas Consequently SB 7 included
provisions recognizing the difficulty of implementing retail competition in areas outside of
ERCOT Therefore the utilities outside of the ERCOT region remain vertically integrated
owning generation transmission and distribution assets as well as selling power to end-
use customers These vertically integrated utilities remain subject to traditional regulation
including rates set by the Commission and customer choice is not offered in the service
territories of these utilities
The Commission does continue to monitor ongoing activities in the non-ERCOT
portions of the state In 2015 the Legislature granted the Commission the authority to
retain counsel and consulting experts in order to participate in legal proceedings at the
Federal Energy Regulatory Commission (FERC) which has regulatory jurisdiction over
wholesale power sales and transmission rates outside of ERCOT This authority has
18 | P a g e
2017 SCOPE OF COMPETITION IN ELECTRIC MARKETS IN TEXAS REPORT
permitted the Commission to participate more effectively in FERC proceedings affecting
Texasrsquo utilities located outside of ERCOT
1 Southwest Power Pool
The Southwest Power Pool (SPP) is the Regional Transmission Operator (RTO) for
areas of Northeast Texas and the Texas Panhandle In Texas the utilities Southwestern
Electric Power Company (SWEPCO) Southwestern Public Service (SPS) and several
electric cooperatives and municipally owned utilities are in SPP In addition to these areas
of Texas the SPP footprint includes parts of New Mexico Arkansas Missouri Nebraska
Louisiana and all of Kansas and Oklahoma In 2015 SPP became the RTO for the
Integrated System and neighboring areas which includes parts of Iowa Minnesota North
Dakota South Dakota Wyoming and Montana SPP has spent extensive time and
resources over the last two years to integrate these new areas successfully The expansion
added 5000 MW of peak demand 7600 MW of generating capacity and 9500 miles of
transmission lines17
In 2014 SPP launched its new Integrated Marketplace which provides a Day-
Ahead Market a Real-Time Balancing Market and Congestion Hedging Markets
mechanisms similar to those available in ERCOT The implementation of the Integrated
Marketplace resulted in a savings of $422 million in 2015 As a result of the Integrated
Marketplace SPPrsquos planning reserve margin will be reduced from 136 to 12 a change
expected to save about $90 million annually
Chairman Donna L Nelson represents the Commission as a voting member on
SPPrsquos Regional State Committee (RSC) The RSC provides collective state regulatory
agency input on a variety of issues In addition the RSC has authority over the cost
allocation methodologies for transmission upgrades allocation of Financial Transmission
Rights and the approach used for resource adequacy across the SPP region The RSC
regularly meets on a quarterly basis and meets more frequently if necessary
2 Midcontinent Independent System Operator
The Midcontinent Independent System Operator (MISO) is an RTO that serves all
or part of 15 states in the central US one Canadian province and the portion of eastern
Texas served by the vertically integrated utility Entergy Texas Inc MISO provides a Day
Two market which has a variety of functions and services including energy and ancillary
service markets economic dispatch congestion management financial transmission rights
and transmission planning The MISO Independent Market Monitor concluded that the
MISO wholesale markets were competitive in 2015
Like SPP MISO is in the Eastern Interconnection which crosses state boundaries
and is therefore subject to FERC jurisdiction A number of recent FERC proceedings have
17 2015 Southwest Power Pool Annual Report Available at
httpswwwspporgdocuments37800201520southwest20power20pool20annual20reportpdf
19 | P a g e
2017 SCOPE OF COMPETITION IN ELECTRIC MARKETS IN TEXAS REPORT
affected the portion of Texas that is in the MISO footprint The Commission through
outside counsel has been an active party in such FERC proceedings FERC Docket No
ER14-1174 addressed in part a dispute regarding the availability of transmission capacity
under the Joint Operating Agreement between MISO and the SPP Ultimately FERC
approved a settlement agreement under which MISO will compensate SPP and its members
for using their or other entitiesrsquo transmission systems
In a related pending docket at FERC Docket No ER14-1736 parties are addressing
how the cost of these payments will be allocated among MISO market participants Parties
in this proceeding are engaged in settlement discussions In addition in Docket No ER14-
75-000 FERC approved a settlement agreement among the participating Entergy
Operating Companies and their retail regulators to terminate the Entergy System
Agreement effective August 31 2016 The settlement terms prohibit any post-termination
payments that roughly equalize production costs among the operating companies after
December 31 2015 terminate certain specific cross-purchase power agreements between
Entergy Texas and former Entergy Gulf State Louisiana and permit the continuation of
several other purchase power agreements
Commissioner Kenneth W Anderson Jr represents the Commission as a voting
member in the Organization of MISO States (OMS) the purpose of which is to coordinate
regulatory oversight among the states in the MISO region and to make recommendations
to MISO FERC and other entities Commissioner Anderson also represents the
Commission as a voting member of the Entergy Regional State Committee (ERSC) which
has certain FERC-approved authority for five years after the Entergy integration with
regard to cost allocation for Entergy transmission projects and adding transmission projects
to the Entergy construction plan The ERSC meets quarterly
3 Western Electricity Coordinating Council
The Western Electricity Coordinating Council (WECC) is a Regional Entity whose
region includes the area surrounding El Paso and extends from Canada to Mexico
including the provinces of Alberta and British Columbia the northern portion of Baja
California and all or portions of the 14 Western states in between WECC is the Regional
Entity responsible for Bulk Electric System reliability in the Western Interconnection and
associated compliance monitoring and enforcement WECC does not have organized
markets outside of California but is organized into 38 separate balancing authorities
WECC is geographically the largest and most diverse of the eight Regional Entities in the
United States with delegated authority from the North American Electric Reliability
Corporation (NERC) and the Federal Energy Regulatory Commission In Texas El Paso
Electric Company is a member of WECC
Rulemaking Activities
The Commission has continued to adopt new rules and modify existing rules in
order to further the continued successful operation of the competitive retail and wholesale
markets and to comply with statutory changes made to PURA by the Legislature This
20 | P a g e
2017 SCOPE OF COMPETITION IN ELECTRIC MARKETS IN TEXAS REPORT
section of the Report provides a high-level overview of the Commissionrsquos key rulemaking
activities highlighting the market improvements made in 2015 and 2016
1 Cost Recovery and Rate Adjustment
The Commission adopted new rule 16 TAC sect25246 on June 29 2016 to
implement Section Nos 1 through 3 of House Bill 1535 of the 84th Legislature The new
rule only applies to a utility that operates solely outside of ERCOT and allows for the use
of an update period beyond the test year for which the utility initially files estimated
information The rule clarifies that all information originally estimated must be updated
with actual information and also provides requirements for a post-test-year adjustment for
a natural gas-fired plant A non-ERCOT utility also is required to initiate a new base rate
case on or before the four year anniversary of the final order in the utilityrsquos most recent comprehensive base rate case or if the commission determines that the utility has
materially earned more than its authorized rate of return in two consecutive years The rule
also provides requirements and procedures for the relation back of final rates to an effective
date 155 days after the filing of the rate application
2 Changes to Certificates of Convenience and Necessity and CREZ Rule
The Commission conducted a rulemaking to implement changes pursuant to
Legislative mandates in SB 776 SB 933 and HB 1535 of the 84th Legislature SB 776
required municipally owned utilities to apply for a certificate of convenience and necessity
(CCN) before constructing transmission facilities outside the boundaries of the
municipality that owns the municipally owned utility SB 933 also requires persons to
obtain a CCN before interconnecting a tie line into the ERCOT grid HB 1535 requires the
Commission to issue a final order within 181 days for a non-ERCOT utility requesting a
CCN for an existing electric generating facility and 366 days after a non-ERCOT utility
files a CCN for a newly constructed generating facility In addition the Commission also
determined in this rulemaking that all future transmission projects in a Competitive
Renewable Energy Zone (CREZ) must meet the need criteria of PURA sectsect 37056(c)(1)
and (2) rather than being exempt Finally the Commission determined that the CREZ
project established in 2008 was complete following the installation of a second circuit on
a Sharyland line
3 Use of Handheld Device for Enrollment
As the market evolves the Commission evaluates market changes balancing its
desire to encourage customer-focused innovation with its concern for customer protection
against potential abuses In Docket No 44518 the Commission granted a REP a
temporary 12-month waiver from its rules requiring the marketer to obtain telephonic
verification of the customerrsquos desire to switch REPs as well as a waiver from certain authorization disclosure requirements among other stipulations the Commission placed
upon the REP The Commission then opened Project No 45625 to study the issue of REPs
utilizing hand-held devices for customer enrollment more broadly and engage with market
representatives consumer representatives and other stakeholders The Commission
anticipates considering an amendment to its rules in the spring of 2017
21 | P a g e
2017 SCOPE OF COMPETITION IN ELECTRIC MARKETS IN TEXAS REPORT
4 Smart Meter Texas Portal
The electric utilities in Texas that have advanced metering systems (AMS) jointly
own and operate a single web portal known as Smart Meter Texas (SMT)18 SMT fulfills
two requirements imposed by the Commissionrsquos advanced metering rule on a utility with
AMS (1) provide to the retail customer the REP serving the customer and other entities
authorized by the customer access to such retail customerrsquos consumption data and (2)
allow devices at the customerrsquos premises to communicate through a home area network with the advanced meter at the premises SMT also facilitates near real-time on-demand
reads of a customerrsquos meter that aids prepaid service offered by certain REPs
In Project No 42786 Review of Advanced Metering System Web Portal
Commission staff and stakeholders examined options for the long-term operational
structure governance and funding of SMT The Commission determined that ownership
of SMT should remain with the TDUs because they can operate the portal at a lower cost
than transferring the data repository to ERCOT The Commission opened two
rulemakings one to ascertain the appropriate governance performance and funding of
SMT and a second to determine the appropriate access for third parties ensuring that
customers have the freedom to grant and give third parties access to their data if made
knowingly while also securing customer privacy
Sharyland Utilities
In early 2015 customers of Sharyland Utilities the smallest investor-owned
transmission and distribution utility in ERCOT began to file with the Commission a
significant number of complaints regarding high electricity bills In response the
Commission opened Project No 44592 Relating to a Project Regarding Sharyland
Utilities to provide for a more formal process for Commission review of the large number
of complaints As part of this project Commission staff prepared a report to evaluate the
electricity rates and electric bills in the operating area of Sharyland Utilities that was
previously part of Cap Rock Energy
Staffrsquos report found that a number of factors contributed to the comparatively high
bills for many of Sharyland-Cap Rockrsquos customers First Sharylandrsquos small size and its low customer density result in high TDU rates for all customers relative to other TDUs In
particular Staffrsquos report found that Sharyland-Cap Rockrsquos rates for distribution service are
up to three times higher than those of other TDUs in Texas In addition to Sharyland-Cap
Rockrsquos high costs for distribution service higher wholesale transmission costs also
contributed to the rate increases charged to Sharyland-Cap Rockrsquos customers These transmission costs are the result of increased transmission investment in recent years
throughout Texas that has increased transmission costs for all distribution providers
18 The participating Texas TDUs are AEP Texas Central Company and AEP Texas North Company (jointly
ldquoAEPrdquo) CenterPoint Energy Houston Electric LLC (ldquoCenterPointrdquo) Oncor Electric Delivery Company LLC (ldquoOncorrdquo) and Texas-New Mexico Power Company (TNMP) collectively referred to as the ldquoJoint TDUsrdquo Operation of an AMS web portal was addressed in the orders approving particular utilitiesrsquo deployment of AMS and approving surcharges for AMS cost recovery While Sharyland Utilities filed comments in the proceeding it did not
participate as it had not fully completed its AMS deployment at the time
22 | P a g e
2017 SCOPE OF COMPETITION IN ELECTRIC MARKETS IN TEXAS REPORT
including Sharyland Utilities Second the comparatively colder winter of 2014 ndash 2015
which was the time period generally consistent with the timeframe in which the
Commission began receiving complaints appeared to result in higher electricity usage than
normal This combination of high TDU rates and the higher electricity usage led to higher
bills for customers
Staffrsquos report also noted that in Sharyland-Cap Rockrsquos last rate case in 2014 the
approved rates reflected movement towards more cost-based rates for all customers
including some customers that previously had been heavily subsidized by other customers
Additionally in the process of standardizing Sharyland-Cap Rockrsquos customer classification
with the classifications of the other TDUs in Texas some customers may have experienced
a move from one class that previously was paying below-cost rates to another class that
was now paying above-cost rates For some of these customers the combined effects of
the movement towards cost-based rates and the change to a different class may have
contributed to a significant change in the customersrsquo rates Regardless of any cost-shifting
between customer classes Sharylandrsquos rates remain two to three times higher than those of other TDUs in Texas for all customers in all classes
On December 4 2015 the Commission signed an order directing Sharyland to file
an application for a comprehensive rate review by April 30 2016 Sharyland filed its rate
application on April 29 2016 in Docket No 45414 Review of the Rates of Sharyland
Utilities LP On October 10 2016 the Commission ordered Sharyland to file an amended
application as soon as practicable but no later than January 1 2017 to reflect the unique
aspects of the companyrsquos organizational structure as a real estate investment trust (REIT) At the time of publication Sharyland is expected to file its amended application in
December 2016
PowerToChoose Website
As part of its ongoing evaluation of the competitive market the Commission
opened Project No 45730 to evaluate the functionality and usability of its PowerToChoose
website which allows customers to select a REP and an electric plan based on their zip
code In the process the Commission received significant feedback from customers stating
that the Commissionrsquos PowerToChoose website was an important tool that plays a
fundamental role in their shopping process In response to the feedback received from
industry representatives and consumers Commission staff changed how the website sorts
and filters retail electric plans adding a filter to allow customers to unselect plans that
contain minimum usage fees or credits This filter is now a default setting and plans with
minimum usage fees and credits are not shown unless the customer actively selects to
search for such plans In addition Commission staff made other changes to increase the
clarity of the REP complaint rating The Commission continues to evaluate other changes
to improve the customer experience of the PowerToChoose website and provide
transparency for retail electric plans
23 | P a g e
2017 SCOPE OF COMPETITION IN ELECTRIC MARKETS IN TEXAS REPORT
Report on Alternative Ratemaking Mechanisms
In 2015 the Legislature enacted SB 774 which requires the Commission or its
consultant to conduct a study and make a report to the Legislature analyzing the alternative
ratemaking mechanisms adopted by other states In addition SB 774 extended the
authorization for the Periodic Rate Adjustment (PRA) mechanism from 2017 to 2019
which the Legislature had authorized in 2011 (SB 1693) as a version of an alternative
ratemaking mechanism that provides to utilities a means for expedited recovery of
distribution infrastructure costs Pursuant to SB 774 the Commission retained a consultant
to produce the report and the consultantrsquos recommendations included streamlining the ratemaking process to reduce procedural costs providing for a periodic review of the
prudency of the costs and using certain types of alternative ratemaking mechanisms that
decouple the recovery of costs from variations in load The Commission held a public
hearing to receive comments on the report from stakeholders and after consideration of
those comments has provided to the Legislature the consultantrsquos report together with its
own discussion of the report
Request for Purchase of Oncor Electric Delivery Company
In March 2016 the Commission approved with conditions an application by an
investor group led by Hunt Consolidated Inc the owners of Sharyland Utilities to acquire
control of Oncor Electric Delivery Company (Oncor) the largest transmission and
distribution utility in Texas from Oncorrsquos parent company Energy Future Holdings which
is in bankruptcy The Commission approved the request subject to certain conditions
including stipulations regarding the organization of the new entities and treatment of tax
benefits The investor-led group subsequently declined to pursue the transaction that was
approved by the Commission
In September 2016 NextEra Energy which owns Florida Power amp Light received
approval from the United States Bankruptcy Court in Delaware for its plan to purchase
Oncor In October 2016 NextEra Energy filed an application with the Commission in
Docket No 46238 for approval of the proposed transaction The Commission will evaluate
the application to determine if the transaction is in the public interest
Integration of Lubbock Power and Light
In March 2016 the Commission opened Project No 45633 to study and identify
the issues related to the request of Lubbock Power and Light the statersquos third-largest
municipally owned utility to be integrated into ERCOT The Commission is currently
working with stakeholders ERCOT and SPP to determine the cost and benefits of any
potential switch by Lubbock Power and Light into ERCOT and whether such a switch is
in the public interest
24 | P a g e
2017 SCOPE OF COMPETITION IN ELECTRIC MARKETS IN TEXAS REPORT
Desalination Project ERCOT Studies
In 2015 the Legislature passed HB 4097 which directed the Commission and
ERCOT to study whether existing transmission and distribution planning processes are
sufficient to provide adequate infrastructure for seawater desalination projects and to study
the potential for desalination projects to participate in demand response opportunities in
the ERCOT market Pursuant to that direction ERCOT staff have prepared a report on the
feasibility of interconnection of large desalination projects and on opportunities for such
projects to participate in ERCOTrsquos demand response programs which is attached to this Report in Appendix B
Oversight and Enforcement Actions
The Commissionrsquos enforcement of statutes rules and orders applicable to entities
under its jurisdiction serves to protect consumers the electric markets the reliability of the
electric grid and to promote fair competition The Commissionrsquos enforcement efforts in the electric industry focus on violations of PURA the Commissionrsquos rules and ERCOT
protocols
During the period from January 2015 through August 31 2016 the Commission
assessed $3258500 in penalties against electric market participants Table 8 provides a
summary of electric industry Notices of Violation since January 2015 During 2015 and
2016 Commission staff opened 212 investigations for the electric industry and closed 177
investigations
Table 8 Notices of Violations
Violation Type Total Penalty Amount
Retail Market Violations $539000
Service Quality Violations $451500
Wholesale Market Violations $2268000
TOTAL $3258500
In addition to the imposition of administrative penalties the Commission uses other
enforcement mechanisms in exercising its enforcement duties including revoking a
companyrsquos certificate to operate In addition some companies may be required to relinquish a certificate as part of a settlement after enforcement action has proceeded
Table 9 provides a breakdown of the number of certificates revoked or relinquished In
2016 the Commission revoked the certificate of the REP TruSmart Energy
Table 9 Certificates Revoked or Relinquished
Type Number
Certificates Revoked 1
Certificates Relinquished 0
25 | P a g e
2017 SCOPE OF COMPETITION IN ELECTRIC MARKETS IN TEXAS REPORT
The Oversight amp Enforcement division also issues warning letters to companies in
the electric market when it determines that a violation occurred but given the
circumstances surrounding the violation and other mitigating concerns no administrative
penalty is warranted During 2015 and 2016 the Oversight amp Enforcement division issued
50 warning letters Finally the Commission generally seeks to reimburse money directly
to customers when appropriate In 2015 and 2016 the Commission ordered the
reimbursement of $8543596 to Texas electric customers
Table 10 Warning Letters
Warning Letter Type Number
Retail Market Warning Letter 8
Service Quality Warning Letter 1
Wholesale Market Warning Letter 41
TOTAL 50
In addition to its enforcement activities the Commission also enters into voluntary
mitigation plans with generators that request one through a contested case proceeding
pursuant to PURA sect15023(f) and 16 TAC sect25504(e) The Commission entered into one
voluntary mitigation plan during 2015 and 2016 in Docket No 44635
Low-Income Discount System Benefit Fund
The System Benefit Fund (SBF) was originally established in 1999 to fund
discounts to low-income customers customer education activities energy-efficiency and
weatherization and electric market oversight through a nonbypassable surcharge on retail
electric bills HB 1101 of the 84th Legislature provided that the SBF be sunset on
September 1 2017 by which time the SBF is intended to be exhausted In the 2016 Fiscal
Year (FY) $325521250 was appropriated in the SBF to provide a 25ndash31 percent discount
to low-income customers over a 12-month period
To assist the drawdown of the remaining balance HB 1101 authorized the
Commission to use any unexpended SBF balance in FY 2017 to assist low-income
customers The Commission estimates that the remaining SBF balance will be
approximately $17 million by August 31 2017 The Commission has determined that this
amount is insufficient to fund the rate reduction program however the Commission will
spend approximately $100000 to continue automatic enrollment in the program to provide
REPs a list of customers eligible to receive late fee waiver and deposit installment benefits
These two ancillary benefits of the rate reduction program will continue for the duration of
FY 2017
26 | P a g e
2017 SCOPE OF COMPETITION IN ELECTRIC MARKETS IN TEXAS REPORT
Homeland Security
The Commission assesses the efforts of ERCOT and utilities to defend against
mitigate and respond to the variety of risks that the modern electricity system faces The
Commission also meets with ERCOT utilities and governmental entities on an ongoing
basis to discuss preparation for everything from hurricanes and other severe weather to
cyber-threats and threats of physical damage to the grid from accidents or intentional
malfeasance In addition the Commission monitors industry and federal programs that
address homeland security issues
The Commission serves as an information liaison between state government and
electric utilities during emergencies The Commissionrsquos main roles include
Conveying outage and service restoration information from electric utilities to
state government
Conveying service restoration priorities (hospitals water treatment facilities
etc) from state government to electric utilities and
Facilitating the clearance of downed power lines in disaster re-entry areas and
facilitating entry of electric utilities into disaster areas
The Commissionrsquos Emergency Management Response Team (EMRT) provided staff at the
State Operation Center for the May 2015 and April 2016 flooding events in Texas as well
as additional staffing for severe winter weather
Demand Response
ERCOT staff have begun to report annually on the participation of customers in
REP-sponsored demand response programs These programs which have been facilitated
by the deployment of smart meters throughout the competitive areas within ERCOT and
by many municipal and cooperative electric utilities take the form of rebates for reduction
in usage during peak period time-of-use pricing real-time volumetric price compensation
for load reduction and direct control of customer load among other plans
These programs have seen dramatic increases in participation since ERCOT began
to gather this information in 2013 From 2013 to 2014 the number of residential customers
participating in these programs increased from 151793 to 721273 and the number of
commercial and industrial customers participating rose from 30275 to 50205 The
Commission continues to monitor ERCOTrsquos stakeholder process for efforts relating to the integration of demand response
27 | P a g e
2017 SCOPE OF COMPETITION IN ELECTRIC MARKETS IN TEXAS REPORT
IV LEGISLATIVE RECOMMENDATIONS
A Determination of Low-Income Customer Eligibility
In 2015 HB 1101 required that all remaining funds in the System Benefit Fund
(SBF) be expended that the fee that funded the program as a nonbypassable surcharge on
electric bills be set at zero and that the SBF be sunset on September 1 2017 Per the
provisions of HB 1101 the SBF fee was set at zero in September 2016 concluding the
funding for the program The sunset of the SBF program also concluded the relationship
between the Texas Health and Human Services Commission (HHSC) and the Commission
in which the HHSC provided to the Commission eligible electric customers for the SBF
low-income discount Because of the termination of the relationship with HHSC with the
termination of the SBF the Commission will no longer be able to determine easily an
electric customerrsquos eligibility for other low-income programs such as late penalty waivers
and the option of paying an electric deposit over multiple months
The Legislature may wish to consider easing low-income customers access to these
low-income programs by facilitating the process used to determine eligibility The
Commission offers four possible approaches in which the Legislature could continue these
low-income programs
(1) Authorize HSSC to provide identification of eligible low-income customers to the
Commission
(2) Allow retail electric providers (REPs) to provide such low-income programs using
the Low Income Discount Administratorrsquos (LIDA) Telecommunications Lifeline
Service Program list to identify low-income customers
(3) Require REPs to offer such low-income programs with customers self-enrolling
and REPs verifying income eligibility or
(4) Allow REPs to voluntarily provide such low-income programs at their own
discretion
B Outside Counsel for Proceedings before Regional Transmission
Organizations
Regional Transmission Organizations (RTO) manage the power grid across wide
regions of the United States Most of Texas is inside the ERCOT region however there
are significant portions of East Texas and the Panhandle that are in the Midcontinent
Independent System Operator (MISO) and the Southwest Power Pool (SPP) Issues arise
in these other RTOs that have significant impact on Texas ratepayers such as how
transmission infrastructure costs will be shared These tend to be very lengthy and
complicated proceedings that require specialized legal and consulting services
28 | P a g e
2017 SCOPE OF COMPETITION IN ELECTRIC MARKETS IN TEXAS REPORT
PURA sect 394525 currently authorizes the Commission to use outside consultants
auditors engineers or attorneys to represent the Commission in proceedings before the
Federal Energy Regulatory Commission This provision has been an important tool for the
Commission to respond to complex matters in the federal arena to enable it to protect the
public interest in Texas The PUC recommends that the Legislature expand the language
in this statute to include the ability to hire outside assistance for proceedings before other
RTOs to provide those same protections to Texas ratepayers in those areas
C Repeal of Natural Gas and Renewable Energy Mandates
1 Natural Gas
PURA sect 399044 establishes natural gas as ldquothe preferential fuelrdquo in Texas for electricity generation and requires the Commission to adopt rules to establish a system of
natural gas energy trading credits The majority of all new non-renewable electricity
generation constructed since 2000 for Texas has used natural gas as a primary fuel and this
trend is expected to continue in the foreseeable future The thresholds used to trigger the
natural gas energy trading credit system in PURA sect 399044 have not been reached and
they are not expected to be reached in the foreseeable future
Because natural gas-fueled facilities have been the most commonly built new
generation in Texas for many years and are expected to continue to be there is no need to
establish incentives for natural gas generation The PUC recommends that the Legislature
consider repealing PURA sect 399044 because it is no longer necessary
2 Renewable Energy
PURA sect 39904 establishes goals for renewable energy Subsection (a) requires
the installation of 5880 megawatts of renewable energy by 2015 and Subsection (b)
establishes a renewable energy credits trading program to implement the requirement The
5880 megawatts mandates in Subsection (a) was met in 2008 While the Commission
believes the renewable energy trading credit program is needed for retail electric providers
to validate renewable energy marketing claims the Commission believes the 5880
megawatts mandate in Subsection (a) is no longer necessary
D Advisory Opinions
Many regulatory agencies in Texas have authority to issue informal guidance to the
persons they regulate particularly with respect to outlining whether a particular course of
conduct would in the agencyrsquos view be consistent with the laws and regulations that the agency administers19 The issuance of an advisory opinion can provide regulatory clarity
to a company before making investments or conducting operations the permissibility of
which may be unclear under state law The Legislature may want to consider granting the
19 In addition certain federal agencies such as the Federal Communications Commission
Internal Revenue Service Securities and Exchange Commission and Federal Election
Commission have authority to issue advisory opinions
29 | P a g e
2017 SCOPE OF COMPETITION IN ELECTRIC MARKETS IN TEXAS REPORT
Commission the authority to issue advisory opinions In the electric industry providing
clarification to a company concerning issues such as the purchase of assets or the
acquisition of another company could allow it to avoid expensive regulatory proceedings
without impairing the Commissionrsquos authority The following state agencies have statutory authority to issue advisory opinions
Texas Ethics Commission20
Texas Medical Board21
State Board of Dental Examiners22
Texas Board of Nursing23
Texas Board of Professional Engineers24
Texas Lottery Commission and25
Texas Securities Board26
E Administrative
Gross Receipts Assessment
PURA sect 16001 provides for a gross receipts assessment that is used to defray the
expenses incurred by the Commission to administer PURA An assessment of one sixth of
one percent is collected from public utilities electric cooperatives retail electric providers
and interexchange carriersrsquo gross receipts from consumers The funds from this assessment
are remitted to the general revenue fund but currently they have not been explicitly
dedicated to funding of the Commission In contrast similar assessments on water
utilities insurance companies and other regulated entities have traditionally been used to
explicitly fund the underlying regulatory programs at the respective agencies The
Commission is one of four Article VIII agencies that is not designated as self-funded
The Commission recommends that the Legislature designate the Commission as a
self-funded agency whereby the collected assessments would be explicitly dedicated to the
funding of the agency Implementing this recommendation would require the Public Utility
Commission to be included in the Appropriations Limited to Revenue Collections rider
located in the Special Provisions Relating to All Regulatory Agencies section of the
General Appropriations Act Designation as a self-leveling agency would require the
Commission to set the gross receipts assessment at a rate sufficient to generate revenue in
the amount of the agencyrsquos general revenue appropriation each fiscal year which would require a statutory change to PURA sect16001(b) Based upon the Commissionrsquos baseline budget request authorizing the PUCrsquos self-leveling designation would result in an overall
estimated tax reduction of $456 million per year or 774
20 Government Code sect 571091 21 Occupations Code sect 162107 22 Occupations Code sect 258157 23 Occupations Code sect 301607 24 Occupations Code sect 1001601 25 Occupations Code sect 2001059 26 Tex Rev Civ Stat Ann Arts 581-28-1 amp 581-35 7 Tex Admin Code 1012
30 | P a g e
2017 SCOPE OF COMPETITION IN ELECTRIC MARKETS IN TEXAS REPORT
V APPENDICES
31 | P a g e
2017 SCOPE OF COMPETITION IN ELECTRIC MARKETS IN TEXAS REPORT
Appendix A ndash Acronyms
AEP American Electric Power
AMS Advanced Metering System
CenterPoint CenterPoint Energy Houston Electric LLC
DG Distributed Generation
DRG Distributed Renewable Generation
ERCOT Electric Reliability Council of Texas
ERSC Entergy Regional State
ERS Emergency Response Service
ETI Entergy Texas Inc
IMM ERCOT Independent Market Monitor
kWh Kilowatt-hour
LMP Locational Marginal Pricing
LSP Large Service Provider
MISO Midwest Independent System Operator
MMBtu One million British Thermal Unit (BTU)
MW Megawatt
MWh Megawatt-hour
Nodal Texas Nodal Market Design
ORDC Operating Reserve Demand Curve
PGC Power Generation Company
POLR Provider of Last Resort
PURA Public Utility Regulatory Act
REP Retail Electric Provider
RSC Regional State Committee
RTO Regional Transmission Organization
SCED Security Constrained Economic Dispatch
Sharyland Sharyland Utilities LP
SBF System Benefit Fund
SPP Southwest Power Pool
TDU Transmission and Distribution Utility
TNMP Texas-New Mexico Power Company
32 | P a g e
2017 SCOPE OF COMPETITION IN ELECTRIC MARKETS IN TEXAS REPORT
Appendix B ndash ERCOT Desalination Report
This page intentionally left blank
33 | P a g e
ERCOT Public
Study on the Demand Response Potential for Seawater Desalination Projects
ERCOT November 18 2016
Study on the Demand Response Potential for Seawater Desalination Projects ERCOT Public
Executive Summary
In 2015 the 84th Texas Legislature enacted House Bill (HB) 4097 which included several provisions relating to seawater desalination projects including a requirement that the Public Utility Commission of Texas (PUC) and Electric Reliability Council of Texas (ERCOT) study the potential for seawater desalination projects to participate in existing demand response opportunities in ERCOT There are several demand response products in which demand-side resources (ie consumers of electricity) can participate These programs help to preserve system reliability and provide economic benefits to participating demand-side resources Seawater desalination is an energy-intensive process that removes salt and other minerals from salt water to produce fresh water for municipal consumption industrial use or irrigation Participation in demand response could help mitigate electricity costs for future seawater desalination projects in Texas and provide reliability benefits to the grid
There are two main demand response reliability-based services administered by ERCOT participation by demand-side resources in the Ancillary Services market and the Emergency Response Service (ERS) Within the Ancillary Services market the most common service provided by demand-side resources is Responsive Reserve Service (RRS) which requires resources to respond either instantaneously or within 10 minutes in response to unplanned system emergencies ERS is separate from ERCOTrsquos Ancillary Services market and allows demand-side resources and distributed generation to provide reliability services in the event of an energy emergency Resources can qualify for either the 10-minute or 30-minute response time ERS programs
There are several key considerations that will impact a demand-side resourcersquos ability to participate in different demand response opportunities response time recovery time predictability of electrical demand and flexibility of operations Considering these factors together it appears that seawater desalination plants could be designed to meet the requirements for participation in demand response Because the ability to meet the qualification requirements is dependent on the plant design demand response opportunities should be considered early in a projectrsquos development if participation is desirable
Whether project developers will choose to address these requirements will depend on the economic benefits of participation There may be additional costs to design seawater desalination plants to operate in the manner required in order to participate in demand response These include costs associated with additional plant design specifications need for excess capacity and storage to make up for lost production during demand response deployment operational costs resulting from interruptions to plant processes and potential financial penalties if demand response deployment results in failure to meet contract demands The interplay of the benefits of participation and these costs will determine whether it would be beneficial for a future seawater desalination plant to participate in demand response in ERCOT
To date participation of seawater desalination plants in demand response programs has been limited Because the process of seawater desalination is energy-intensive participation in demand response could help to reduce electricity costs while posing a relatively low risk to plant operations As stakeholders in Texas continue to plan for possible future droughts in the region and identify water management strategies consideration of demand response could play a role in mitigating some costs associated with seawater desalination and allow seawater desalination plants to assist with maintaining electric reliability in the region
copy 2016 ERCOT All rights reserved i
Study on the Demand Response Potential for Seawater Desalination Projects ERCOT Public
Table of Contents
1 Introduction 1
2 Seawater Desalination 2
21 Seawater Desalination Plant Operations 2
22 Seawater Desalination Plant Economics 3
3 Demand Response Opportunities in ERCOT 4
31 ERCOT-Dispatched Demand Response 4
311 Ancillary Services Markets 5
312 Emergency Response Service (ERS) 5
32 Non-ERCOT-Dispatched Demand Response 6
321 Four Coincident Peak (4CP) 6
322 LSE or DR Provider Contracted Price Response 6
323 Self-Directed Price Response 6
4 Demand Response Potential for Seawater Desalination 7
41 Operational Considerations for ERCOT-Dispatched Demand Response 7
42 Economic Considerations for ERCOT-Dispatched Demand Response 8
43 Considerations for Non-ERCOT-Dispatched Demand Response 9
5 Conclusion 11
copy 2016 ERCOT All rights reserved ii
Study on the Demand Response Potential for Seawater Desalination Projects ERCOT Public
1 Introduction
In 2015 the 84th Texas Legislature enacted House Bill (HB) 4097 which included several provisions relating to seawater desalination projects including a requirement that the Public Utility Commission of Texas (PUC) and Electric Reliability Council of Texas (ERCOT) study the potential for seawater desalination projects to participate in existing demand response opportunities in ERCOT ERCOT and the PUC initiated this study to fulfill that requirement and evaluated the operational and economic characteristics of seawater desalination plants in light of ERCOTrsquos primary demand response products1
ERCOT is the independent system operator (ISO) for the ERCOT Interconnection which encompasses approximately 90 of demand for electricity in Texas ERCOT is the independent organization established by the Texas Legislature to be responsible for the reliable planning and operation of the electric grid for the ERCOT Interconnection ERCOT also administers and maintains a forward-looking open market to provide affordable and reliable electricity to consumers in Texas In collaboration with market participants ERCOT has developed demand response products and services for customers that have the ability to reduce or modify electricity use in response to instructions or signals These programs help preserve system reliability and provide economic benefits to participating demand-side resources
The process of seawater desalination removes salt and other minerals from salt water to produce fresh water for consumption industrial processes or irrigation The drought-prone Texas climate coupled with projections for increasing water demand in the state has created interest in seawater desalination as a future water source The 2017 Texas State Water Plan includes seawater desalination as a future water management strategy for water users in the state However the seawater desalination process is energy intensive and electricity consumption can be a significant cost driver for these projects To the extent that these plants could participate in demand response it would help to defray these costs Thus there is a potential nexus between seawater desalination projects built in Texas to mitigate drought but which have large electricity requirements and ERCOT demand response opportunities which could help to reduce their electricity costs and provide reliability benefits
This study evaluates the demand response potential of seawater desalination plants based on their operational characteristics and economic drivers The report is organized as follows
Section 2 provides background on typical seawater desalination plant operations and economics
Section 3 describes the current demand response opportunities in ERCOT
Section 4 evaluates the characteristics of seawater desalination plants to determine their potential to participate in demand response opportunities in ERCOT and
Section 5 provides a summary of the conclusions of this study
1 In the course of developing this report ERCOT consulted with several desalination experts with experience with existing or planned seawater desalination plants in the US The technical experts consulted included Jorge Arroyo (Water Management Consultant) Andrew Chastain-Howley (Black amp Veatch) Jonathan Loveland (Black amp Veatch) Ron Parker (Black amp Veatch) John Wolfhope (Freese and Nichols) and Srinivas Veerapaneni (Black amp Veatch)
copy 2016 ERCOT All rights reserved 1
Study on the Demand Response Potential for Seawater Desalination Projects ERCOT Public
2 Seawater Desalination
There are two primary methods for seawater desalination distillation (also referred to as ldquothermalrdquo) and reverse osmosis Distillation uses heat to remove salts and minerals from seawater by boiling water at high pressures In contrast reverse osmosis technology forces saline water through a membrane to separate water from the salts and minerals While both distillation and reverse osmosis are energy intensive distillation requires thermal energy to heat the water and overall has a higher energy requirement whereas reverse osmosis requires primarily electrical energy and overall is less energy intensive ndash though still with significant electricity requirements
Globally most thermal desalination plants are located in the Middle East due to low energy prices in the region Plants located elsewhere including in the US typically use reverse osmosis technology2 There are two large existing seawater desalination plants in the US one in Carlsbad California providing water to the San Diego area and one in Gibsonton Florida providing water to the Tampa Bay area Both plants use reverse osmosis technology In addition there are several desalination projects currently in the planning stages or under development in Texas in the Corpus Christi area that would use reverse osmosis technology For that reason this report focuses on reverse osmosis technology in the evaluation of demand response potential of seawater desalination plants
While there are currently no existing seawater desalination plants in Texas there are several municipal and industrial brackish water desalination plants in the state According to the Texas Water Development Board (TWDB) there are 46 municipal brackish water desalination plants with capacities greater than 0025 million gallons per day (MGD) in Texas representing a total of 123 MGD of capacity3 The desalination of brackish water is typically less expensive compared to seawater due to the lower relative salinity of brackish water This study focuses exclusively on seawater desalination consistent with the requirements of HB 4097 but it should be noted that conclusions may also apply to brackish water desalination though at a different cost and scale
This section provides high-level information on the operations (Section 21) and economics (Section 22) of seawater desalination plants to inform the discussion of their demand response potential in Section 4
21 Seawater Desalination Plant Operations Seawater desalination plants typically range in capacity from less than 5 MGD up to 165 MGD For example the Carlsbad seawater desalination plant has a capacity of approximately 50 MGD and the plant in Tampa Bay has a capacity of approximately 25 MGD The associated electricity consumption ranges between 10 and 15 kWh1000 gallons produced depending on the salinity of the water being processed456 More saline water (eg seawater) requires larger amounts of electricity for desalination Thus a seawater desalination plant would have larger electricity consumption requirements compared to a similarly sized brackish water desalination plant
2 American Water ldquoInnovation Solutions within the Water Industry Desalinationrdquo Available at httpwwwamwatercomfilesInnovationsSolutionsWithinTheWaterIndustryDesalinationpdf 3 Texas Water Development Board ldquoDesalination Factsrdquo Available at httpswwwtwdbtexasgovinnovativewaterdesalfactsasp 4 American Membrane Technology Association April 2016 ldquoMembrane Desalination Power Usage Put in Perspectiverdquo Available at httpwwwamtaorgcomwp-contentuploads7_MembraneDesalinationPowerUsagePutInPerspectivepdf 5 Water Reuse Association November 2011 ldquoSeawater Desalination Power Consumptionrdquo Available at httpswatereuseorgwpshycontentuploads201510Power_consumption_white_paperpdf 6 Ghaffour N TM Missimer and G Amy January 2013 ldquoTechnical review and evaluation of the economics of water desalination Current and future challenges for better water supply sustainabilityrdquo Desalination 309 pp197-207 Available at httpswwwresearchgatenetpublication256693140_Technical_review_and_evaluation_of_the_economics_of_water_desalination_ Current_and_future_challenges_for_better_water_supply_sustainability
copy 2016 ERCOT All rights reserved 2
Study on the Demand Response Potential for Seawater Desalination Projects ERCOT Public
While the two existing seawater desalination plants in the US were co-located with power plants to ease compliance with regulations on water intake and discharge structures and reduce costs many other reverse osmosis desalination plants receive their electricity from the grid However plants may have on-site backup generation in case of a power outage This will vary depending on the size and design of the plant and other factors For example the Carlsbad plant in California does have diesel backup generation to power control systems and flushing systems in the case of a power outage The plant in Tampa Bay was not built with backup power due to potential storm surge risks from hurricanes and other storms The plant does use uninterruptible power supply (UPS) backup to power control systems during power outages
Reverse osmosis plants are typically designed with several ldquotrainsrdquo which consists of a high-pressure pump turbine and reverse osmosis membrane Desalination plants are turned on or off one train at a time in a highly controlled process The process of ramping up or down an individual train under normal operations typically takes one to two hours While plants can be designed to handle immediate shutdowns (ie in a power outage) re-starting a system after an interruption would take this amount of time In addition the saline water must be pretreated (ie filtered) before going through the reverse osmosis train and this can sometimes pose constraints on the flexibility of operations
Demand for water is the key factor driving the level of production at seawater desalination plants Typically the plant will have a contract or contracts with municipal or other water users to deliver desalinated water and is operated to meet that demand Alternatively if the plant is municipally owned it would similarly be operated to meet the level of water demand in conjunction with other available water sources If water demands are close to a plantrsquos full capacity the operatorrsquos flexibility to adjust its electricity consumption as part of demand response may be limited However this does mean that plant operations are fairly predictable on a day-to-day basis which is necessary for participation in demand response
The amount of flexibility in plant operations will also be impacted by the amount of water storage available For example if a plant has sufficient water storage on-site or storage within the customerrsquos distribution system it could provide flexibility for the plant to reduce its operations during peak hours when electricity prices are likely to be highest It would also mitigate the impacts of interruptions to production from demand response deployments
22 Seawater Desalination Plant Economics Seawater desalination is typically more expensive than other sources of water and a major driver of the overall cost is energy costs In 2016 the Carlsbad plant charged rates at between $2131 and $2367 per acre-foot78 This charge is intended to cover both the fixed costs of the plant and the variable costs to produce a unit volume of water Typically half to two thirds of the cost of providing desalinated seawater are accounted for by capital cost recovery with the remainder accounted for by operations and maintenance costs including electricity costs Electricity costs can account for 20shy25 of the total costs of seawater desalination with reverse osmosis technology9
Factors affecting the capital cost of a seawater desalination plant include plant size type of desalination process and pre-post-treatment technologies plant infrastructure (eg piping water storage backup power) and compliance with applicable regulations (eg regulations on intake structures brine byproduct disposal) A significant driver of operating and maintenance costs is membrane replacement Reverse osmosis membranes need to be replaced every few years and
7 Source San Diego County Water Authority ldquoSeawater Desalinationrdquo Available at httpwwwsdcwaorgseawater-desalination 8 Note that 1 acre-foot is approximately 325851 gallons 9 Based on technical input from Black amp Veatch
copy 2016 ERCOT All rights reserved 3
Study on the Demand Response Potential for Seawater Desalination Projects ERCOT Public
the rate at which they are replaced will depend on the salinity of the feedwater and how the plant is operated Treatment and disposal of the salty brine byproduct from desalination may also incur operating costs
Electricity costs will vary depending on a range of factors including the size of the plant type of desalination technology source of electricity and quality of the feedwater As previously noted more saline water requires higher amounts of electricity in desalination and thus the amount of electricity consumption is a key difference between brackish water and seawater desalination As a result electricity costs comprise a significant share of the costs of seawater desalination These costs could potentially be defrayed in part by participation in demand response initiatives
3 Demand Response Opportunities in ERCOT
Broadly speaking demand response can be broken down into two major categories dispatchable or non-dispatchable For purposes of this report we will define dispatchable as those demand response events that are initiated by ERCOT and non-dispatchable as an event not specifically initiated by ERCOT These non-dispatchable events may include decisions made by the end-use customer to alter its consumption pattern or may include contractual obligations with another entity such as the end-use customerrsquos retail electric provider (ldquoREPrdquo) to alter consumption patterns
ERCOTrsquos wholesale market is open to several types of dispatchable demand response which are deployed to maintain system reliability Demand-side resources providing Emergency Response Service (ERS) may offer based on either a 10 or 30-minute response time commonly referred to as the ldquoramp periodrdquo Alternatively demand-side resources may register and qualify as a Load Resource that can provide Reserves in the Ancillary Services market The most common service provided by demand-side resources is Responsive Reserve Service which requires an under-frequency relay that can instantaneously interrupt the load during certain system reliability events Some demand-side resources can also participate in other Ancillary Services as Controllable Load Resources that require sophisticated control systems that allow them to be deployed in a more incremental proportional manner
Non-dispatchable demand response in ERCOT can include a response to avoid transmission costs where rates are based on Four Coincident Peak Pricing (4CP) response to wholesale energy prices initiated by the customer or by a REP or other load-serving entity (ldquoLSErdquo) or utility-managed Load Management programs (LM)
The sections that follow provide a description of both ERCOT-dispatched (Section 31) and nonshyERCOT-dispatched (Section 32) demand response For a more detailed description of opportunities for demand-side resources to participate in demand response in ERCOT see ERCOTrsquos guide Load Participation in the ERCOT Nodal Market10
31 ERCOT-Dispatched Demand Response There are two main demand response reliability-based services administered by ERCOT participation by demand-side resources in the Ancillary Services market and participation in ERS These services are dispatched by ERCOT during system emergencies
10 Available at httpwwwercotcomcontentservicesprogramsloadLoad20Participation20in20the20ERCOT20Nodal20Market_302d oc
copy 2016 ERCOT All rights reserved 4
Study on the Demand Response Potential for Seawater Desalination Projects ERCOT Public
Demand-side resources with demand response capability that can meet a set of performance requirements can be qualified to provide Ancillary Services as Load Resources in the Ancillary Services Market The value of having a Load Resource available to reduce load is equal to the value of having a generator available to increase its generation at a generating plant The providers of operating reserves selected to provide Ancillary Services are eligible for capacity payments regardless of whether the Resource is actually deployed (or curtailed in the case of the Load Resource)
ERCOT holds auctions on a daily basis for each of the following Ancillary Services Regulation Up Regulation Down Responsive Reserve and Non-Spinning Reserve11 Table 1 describes the various Load Resource types and their qualification requirements and eligible services
Table 1 Load Resource Types and Ancillary Services
Service Load Resource Type a Qualification Responsive Reserves (le50 of total Reserve requirement)
Non Controllable Under-Frequency Relay and 10-minute ramp to manual dispatch instruction
Responsive Reserves
Controllable Primary Frequency Response and follow 5-minute dispatch instructions
Regulation-Up Regulation-Down
Controllable Primary Frequency Response and respond to Regulation deployments
Non-Spin Reserves Controllable Follow 5-minute dispatch instructions a A Controllable Load Resource is a Load Resource capable of controllably reducing or increasing consumption under dispatch control by ERCOT
Demand-side resources that agree to reduce load when directed by ERCOT and that meet other metering and operational requirements as specified in the ERCOT Protocols may participate in Ancillary Services market auctions As noted in Table 1 the type of Ancillary Service that a Load Resource may provide will depend upon the demand-side resourcersquos response time and metering system as well as other requirements described in the Protocols In the Responsive Reserve and Non-Spin Reserve markets the Load Resource will receive capacity payments regardless of whether or not the load was actually deployed but the load must be available for deployment at any time while providing the service
ERCOT procures ERS to maintain grid reliability during emergency conditions and reduce the likelihood of the need for rotating outages ERS participants may offer to provide demand response with either a 10-minute ramp period requirement (similar to Load Resources providing Responsive Reserve Service) or a 30-minute ramp period requirement ERS Resources do not have the same telemetry and under-frequency relay requirements as Load Resources
11 Regulation Up and Regulation Down service respond to signals from ERCOT every 4 seconds to respond to changes in system frequency full response has to be provided within 5 minutes Responsive reserves must provide their committed capacity either instantaneously in an under-frequency event (eg due to a generator outage) or in energy scarcity conditions within ten minutes following an instruction from ERCOT Non-spinning reserves must provide their committed capacity within 30 minutes based on economic dispatch instructions Non-spinning reserve is used as replacement reserve to replenish other ancillary services and during energy scarcity
copy 2016 ERCOT All rights reserved 5
Study on the Demand Response Potential for Seawater Desalination Projects ERCOT Public
ERS is procured through a request for proposal (RFP) process three times per year for four-month contract terms each of which is further split into smaller time periods based on business cycles and other factors Demand-side resources may choose to submit offers in all time periods or only in those that best fit their unique circumstances and may vary both the price and demand response capacity offers by time period
Payments for ERS are performed up to 80 days after each four month contract term has ended and are subject to downward revision based upon delivered demand response capacity and the demand-side resourcersquos availability during the contract term
32 Non-ERCOT-Dispatched Demand Response The options listed below are not dispatched by ERCOT but they either are controlled directly by a customer or are dispatchable by another entity such as a demand response provider (ldquoDR Providerrdquo) REP or a transmission and distribution utility
Many industrial customers are subject to transmission charges based upon a Four Coincident Peak (4CP) demand The 4CP demand is determined by averaging the consumerrsquos actual demand during the 15-minute settlement interval with the highest ERCOT demand during each of the four summer months (June through September) This measured 4CP demand serves as the basis for the customerrsquos transmission tariff charges for the following year By correctly predicting the ERCOT system peaks during the summer and curtailing load during those intervals a consumer can help reduce the stress imposed on the electric system during peak periods of consumption and reduce its transmission charges for the following calendar year
In the competitive areas of ERCOT consumers can contract with their REP or a DR Provider to have their load respond to the REPrsquos or DR Providerrsquos instructions The contract will usually outline the parameters of this response ndash at what times and frequency demand response events can be called ramp periods sustained response periods compensation etc Because this response is a contractual matter between the REP or DR Provider and the consumer a great deal of variety can be present in these arrangements For example a consumerrsquos response may be voluntary or required compensation could come in the form of reduced energy prices or rebate payments for each curtailment event consumers might be notified up to a day in advance or could have no notification at all (for automated curtailment)
In areas of ERCOT not open to competition interruptible tariffs may be available These tariffs will usually offer a reduced energy price for defined curtailment obligations
REPs may offer dynamic pricing options or consumers within a municipality or cooperative may have their energy prices determined by a published tariff which also may be structured based upon Time-of-Use (TOU) or have a Critical Peak Pricing (CPP) or Peak Time Rebate (PTR) component Self-directed price response refers to consumers making an independent decision to respond to energy prices contained in a governing tariff or in either the ERCOT Day Ahead or Real Time energy markets
TOU offerings will typically have higher energy prices during normal peak periods ndash for example a TOU tariff may charge one price during Monday through Friday from 2 pm through 8 pm and another price during all other times Customers may choose to reduce consumption during these high priced periods Load reduction can be accomplished by load shifting (loads can be shifted by
copy 2016 ERCOT All rights reserved 6
Study on the Demand Response Potential for Seawater Desalination Projects ERCOT Public
rescheduling certain processes or by utilizing thermal storage) ending certain processes that are no longer economic or through energy efficiency measures
Offerings that incorporate CPP usually have prescribed high prices only during certain defined periods ndash for example when load or prices are expected to reach a certain level Response to CPP may be similar to those employed under TOU tariffs especially if CPP is reached frequently More often CPP is infrequent and as such short-term load curtailment may be the more appropriate response to meet economic objectives
4 Demand Response Potential for Seawater Desalination
This section evaluates whether the operational characteristics and economics of seawater desalination plants would enable them to participate in one or more of the various demand response opportunities in the ERCOT Region To date participation of seawater desalination plants in demand response programs has been limited Neither the plant in Carlsbad nor the plant in Tampa Bay participate in demand response programs in California or Florida respectively However as will be described below it appears that these plants can be designed and operated to meet the requirements for participation in demand response and receive economic benefit from participation in these programs
Section 41 describes the operational parameters that must be met for a demand-side resource to provide ERCOT-dispatched demand response and evaluates the ability of seawater desalination plants to meet these criteria Section 42 discusses the tradeoffs between payments for participation in ERCOT-dispatched demand response and potential additional costs posed to seawater desalination plants Finally Section 43 presents other opportunities for seawater desalination plants to reduce their electricity costs outside of ERCOTrsquos reliability-based services that are open to demand response assets
41 Operational Considerations for ERCOT-Dispatched Demand Response There are several key operational parameters that impact a demand-side resourcersquos ability to participate in different demand response services response time recovery time predictability of electrical demand and flexibility of operations This section discusses each of these considerations as they apply to seawater desalination plants
As discussed in Section 31 one of the differentiating factors between ERCOTrsquos demand response products is the amount of time within which a demand-side resource must respond to a deployment instruction to reduce electricity consumption during an event Participation in RRS requires an automatic response within either half a second (ie instantaneous) based on grid frequency or within 10 minutes via a manual instruction ERS requires a response time of either 10 or 30 minutes As noted in Section 21 the typical time to take a reverse osmosis train on- or off-line is 1-2 hours under normal controlled operations To comply with the response time requirements of RRS or ERS a seawater desalination plant would need to be able to reduce its electricity consumption far more quickly than in normal operations This is an element of plant design that would need to be accounted for in the specifications of the project Considerations include the potential need for on-site backup generation including uninterruptible power supply potential impacts to plant infrastructure (eg piping) reverse osmosis membranes and pretreatment systems
The two large US desalination plants provide illustrative counterpoints in this respect The Carlsbad plant was designed to withstand instantaneous power interruptions and has on-site backup generation including uninterruptible power supply to provide the ability to power control systems and flush the membranes in the event of a power loss In contrast the Tampa Bay plant was not
copy 2016 ERCOT All rights reserved 7
Study on the Demand Response Potential for Seawater Desalination Projects ERCOT Public
designed with on-site backup generation and a loss of power would result in a plant shutdown and may require several days to bring the plant back on-line Thus it appears that it is technically possible for a seawater desalination plant to meet the response time requirements for participation in demand response so long as this factor is considered in the design of the facility
The time it takes a desalination train to return to operations after an event is also a consideration Demand-side resources participating in RRS must be able to come back on-line within three hours and those participating in ERS must return within 10 hours Again it appears that it is technically feasible for desalination plants to meet this requirement so long as this requirement is considered in the plant design
An additional consideration is the predictability of a demand-side resourcersquos electricity consumption Participation in the responsive reserves ancillary service market requires bidding in the day-ahead market and thus a demand-side resource must know with great accuracy (within 95) its electrical demand at least a day ahead of time For ERS auctions are held three times a year for four-month contract periods Thus to participate in ERS a resource must know its forecasted electrical demand several months in advance Because seawater desalination plant operations are driven by contracted demand for water it is likely that a plant operator would have a good idea of the plantrsquos electrical demand days or even weeksmonths in advance especially for summer months when demand is likely to be relatively steady An important consideration however is the salinity of the water which drives the electrical requirements and which can be impacted by recent weather events Similarly reductions in demand for water during non-summer months or wet summer days where demand may be reduced could also impact a plantrsquos ability to predict its electricity demand
Finally a seawater desalination plant must have sufficient flexibility in its day-to-day operations so that it can afford to lose several hours of production when deployed for demand response It should be noted that demand-side resources participating in RRS and ERS are called infrequently demand-side resources providing responsive reserves were deployed one time in 2015 and ERS was not deployed that year However this is an important factor to consider if a plant is operating at close to full capacity and would incur financial penalties if it fails to meet its contract obligations due to a demand response event Including additional storage and building a plant with extra capacity could help to mitigate this risk It should also be noted that a plant operator does not need to commit the full plant capacity to these services but rather can specify an amount of MW that will be committed Thus a plant operator could mitigate issues both with predictability and flexibility of plant operations by committing only a portion of its predicted electrical demand to participate in demand response
Considering these factors together it appears that seawater desalination plants could be designed to meet the operational requirements for participation in ERCOTrsquos demand response services (both RRS and ERS) Because the ability to meet the requirements is dependent on the plant design demand response would need to be considered early in a projectrsquos development if participation is desirable Whether project developers will choose to address these requirements will depend on the economic benefits of participation in demand response which will be discussed in the next section
42 Economic Considerations for ERCOT-Dispatched Demand Response This section describes the economic benefits to demand-side resources from participation in ERCOT-dispatched demand response programs The average price paid for a demand-side resource participating in RRS in 2015 was $1087 per MW per hour and for ERS was $645 per MW per hour for the contract periods during the 2015 program year These payments could provide a significant financial benefit to seawater desalination plants To give a simplified example for a plant with an electrical demand of 10 MW operating at a 100 annual load factor (10 MW times 24 hours times 365 days) the annual benefit would be on the order of $500000 for ERS or $1 million for RRS
copy 2016 ERCOT All rights reserved 8
Study on the Demand Response Potential for Seawater Desalination Projects ERCOT Public
In 2015 demand-side resources providing responsive reserves were deployed one time for a duration of 10 minutes and ERS was not deployed12 The most ERS was ever deployed in a single year was two times in 2011 Thus participation in either program could result in a substantial payment to a seawater desalination plant with a relatively low risk of deployment and associated disruption of plant operations although it is important to note that participation in either ERCOT service subjects demand response resources to annual unannounced testing Other than testing the frequency of deployment will depend on grid conditions and is a risk that should be considered
The financial benefits of participation must be weighed against the costs of designing facilities with the capabilities to operate in this manner These include
bull The costs to design the plant to reduce electrical demand within the required timeframes for demand response and to withstand an instantaneous interruption if not already part of the plant design For example a plant may need to be designed to have backup power generation on-site In addition there could also be costs to restart the system after an interruption
bull The costs to build a plant with excess capacity andor storage to make up for lost production hours when demand response is deployed This will add to the total capital costs of the project Land area constraints should also be considered when considering additional storage as the space requirements for the necessary storage capacity could be significant
bull Costs associated with the impact of interruptions on plant processes (eg more frequent replacement of membranes impacts to pretreatment system or plant infrastructure)
bull Potential financial penalties that would be incurred if deployment as part of demand response were to result in failure to meet contract obligations to supply water
bull The loss of potential benefits in the form of cost avoidance from participation in non-ERCOTshydispatched demand response opportunities (see Section 43) If a plant is committed to RRS or ERS the plant operator would lose the flexibility to take advantage of these other opportunities to reduce their electricity costs
The interplay of these benefits and costs will determine whether it would be beneficial for a future seawater desalination plant to participate in demand response in ERCOT
43 Considerations for Non-ERCOT-Dispatched Demand Response Outside of the reliability-based services administered by ERCOT there are other opportunities for seawater desalination plants to reduce their electricity costs As described in Section 321 seawater desalination plants may be able to reduce the demand charges on their electricity bills through curtailing load during 4CP intervals In addition plant operators may adjust operations in response to real-time electricity prices to take advantage of lower off-peak prices and avoid price spikes (see Sections 322 and 323) All of these opportunities require that the plant have flexibility to reduce production during certain times of the day
In the ERCOT region as noted above a portion of transmission and distribution charges are set based on the peak systemwide 15-minute interval of the four summer months (June through September) referred to as the four coincident peaks (4CP) Large customers can reduce or avoid this charge by reducing electrical consumption during these four peak intervals AEP Central Texas and CenterPoint are the transmission providers covering the majority of the Gulf Coast in Texas13
12 ERCOT June 2016 ldquoLoad Resource Deployment Updaterdquo Available at httpwwwercotcomcontentwcmkey_documents_lists870985_RRS_Load_Resource_Deployment_Updatepdf 13 It is also possible that a seawater desalination plant could be located in an area that as not opted in to competition in which case the plant owner would need to negotiate its electricity charges bilaterally with the Non Opt-In Entity (NOIE)
copy 2016 ERCOT All rights reserved 9
Study on the Demand Response Potential for Seawater Desalination Projects ERCOT Public
Assuming a future seawater desalination plant would be connected at transmission-level voltages the relevant 4CP charges based on the 2016 tariffs accounting for both transmission charges and transmission cost recovery factors would be $41425 per 4CP kW for AEP Central Texas and $41870 per 4CP kVA for CenterPoint14 If a seawater desalination plant has 10 MW of load and is capable of interrupting all of it and successfully does so for all four 4CP intervals the savings based on the 2016 tariffs would be approximately $500000 per year ($41425 times 1000 (kW to MW) times 10 MW times 12 months) Thus a seawater desalination plant that reduces its electricity use during the 4CP intervals could avert some or all of these charges
Another opportunity for seawater desalination plants to reduce their electricity costs is through adjusting operations in response to real-time electricity prices In 2015 the average electricity price in ERCOT was $2677MWh However prices exceeded $50MWh in 254 hours (3 of all hours) $100MWh in 88 hours (1) $200MWh in 40 hours (05) and $300MWh in 21 hours (02) Prices exceeded $3000MWh for 021 hours15 Depending on the desalination plantrsquos exposure to real-time wholesale market prices (via its retail contract) the degree of high prices the plant owner is willing to avoid and grid conditions in a given year reducing unit operations in order to avoid high electricity prices could impact operators for anywhere between a few and several hundred hours out of the year In addition a plant can plan its operations to take advantage of lower electricity prices during off-peak periods (eg at night when generation from wind is high) For example at least one company is marketing a modular desalination unit design intended to take advantage of low prices during periods of high renewables generation and to provide grid reliability services through demand response16
There are several factors to consider regarding these opportunities to reduce electricity costs The plant would need to monitor the ERCOT market or hire a contractor to do so in order to know when to reduce demand for electricity These programs do not impose any requirements on response time as with RRS or ERS and there may be sufficient warning of 4CP intervals or peak pricing to allow the plant operator to plan its operations earlier in the day with sufficient time to ramp down production under controlled conditions However quicker ramping capability may be desirable to respond to electricity price fluctuations
For 4CP because the four intervals used to set demand charges are not known ahead of time it is likely that the plant would need to reduce its demand multiple times per summer to ensure the 4CP intervals are hit impacting production at the facility Timing operations to coincide with off-peak pricing or to avoid price spikes would similarly result in reduced operations during certain hours To offset the lost production hours the plant may need to be designed with extra capacity and water storage capability to maintain the ability to meet its contractual obligations for freshwater delivery Because the period of reduced operations is greater than with ERCOT-dispatched demand response services this need would be greater for a seawater desalination plant reducing load during 4CP intervals or in response to real-time electricity prices and would increase the capital costs of the project It should also be noted that high prices in the ERCOT Region typically but not always occur in summer months when drought conditions are more likely to develop and demand for desalinated water is likely to be highest This may limit the flexibility of the plant to time its electricity consumption to avoid high-priced hours
14 Public Utility Commission of Texas ldquoTransmission and Distribution Rates for Investor Owned Utilitiesrdquo Available at httpwwwpuctexasgovindustryelectricratestdraspx 15 Potomac Economics June 2016 2015 State of the Market Report for the ERCOT Wholesale Electricity Markets Available at httpswwwpotomaceconomicscomindexphpmarkets_monitoredERCOT 16 Sisyan LLC ldquoDemand Response Desalinationrdquo Available at httprenewabledesalinationcomwpshycontentuploads201506Demand-Response-Desalinationpdf
copy 2016 ERCOT All rights reserved 10
Study on the Demand Response Potential for Seawater Desalination Projects ERCOT Public
In addition the plantrsquos ability to participate in demand response would also be limited for those hours it is reducing load as part of 4CP response or in response to real-time prices because the plant would not be able to reduce its electricity consumption if that demand is already committed to another demand response service Thus participating in demand response versus taking advantage of these other opportunities may be to some extent mutually exclusive
5 Conclusion
Based on this analysis it appears that the operational characteristics of seawater desalination plants would allow them to participate in demand response opportunities in ERCOT so long as the necessary operational requirements are considered in the design specifications of the plant Project developers should consider the necessary requirements early in the plant design Whether the economic benefits of participation would provide a sufficient incentive for them to do so will depend on the costs of accommodating those operational requirements and whether there is the flexibility available to operate the plant as necessary under these programs Though most existing seawater desalination plants do not participate in demand response programs it does appear that participation by these plants is possible and could result in a financial benefit Table 2 compares the different demand response opportunities available to demand-side resources in ERCOT
Table 2 Comparison of Demand Response Opportunities Demand Response
Opportunity Requirements for
Participation Impacts to Plant
Operations Financial Benefit Ancillary Services ndash Responsive Reserve Service (RRS)
bull Under-Frequency Relay bull Instantaneous or 10 minute
response time bull Recover load within 3
hours bull Bid in day-ahead market
bull Deployed once in 2015 for 10 minutes bull Subject to annual
unannounced testing
bull $1087 per MW per hour (based on 2015 prices)
Emergency Response Service (ERS)
bull 10 or 30 minute response time bull Recover load within 10
hours bull Four-month contract term
bull Not deployed in 2015 the most times ever deployed in a single year was twice in 2011 bull Subject to annual
unannounced testing
bull $645 per MW per hour (based on 2015 prices)
Four Coincident bull Interval Data Recorder bull Likely plant will need to bull Avoid ~$48000 per 4CP Peak (4CP) (IDR) meter
bull Ability to predict system-wide peak demand hours during summer months
reduce load multiple times per summer to hit 4CP intervals bull Likely to be able to predict
possible 4CP intervals earlier in day
MW per year (based on 2016 tariffs) if successful in reducing during all four summer months
LSE or DR Provider Contracted Price Response
bull Varies based on contractual arrangements
bull Varies based on contractual arrangements
bull Varies based on contractual arrangements
Self-Directed Price bull Retail contract with bull Varies depending on bull Varies depending on Response exposure to real-time
market prices bull Ability to monitor real-time
prices in ERCOT wholesale market
number and severity of pricing events bull May be able to predict
peak pricing events earlier in day
number and severity of pricing events
copy 2016 ERCOT All rights reserved 11
Study on the Demand Response Potential for Seawater Desalination Projects ERCOT Public
Demand response programs in ERCOT provide opportunities for demand-side resources to defray their electricity costs and provide reliability benefits to the ERCOT electric grid Because the process of seawater desalination is energy intensive participation in demand response could help to reduce electricity costs while posing a relatively low risk to plant operations if demand response participation is factored into plant design
Participation in non-ERCOT-dispatched demand response opportunities such as reducing load during 4CP intervals or in response to real-time electricity prices may also help to reduce electricity costs for seawater desalination plants in Texas As stakeholders in Texas continue to plan for possible future droughts in the region and identify water management strategies consideration of demand response could play a role in mitigating some costs associated with seawater desalination and allow seawater desalination plants to assist with maintaining electric reliability in the region
copy 2016 ERCOT All rights reserved 12
2017 SCOPE OF COMPETITION IN ELECTRIC MARKETS IN TEXAS REPORT
Report on Alternative Ratemaking Mechanisms
In 2015 the Legislature enacted SB 774 which requires the Commission or its
consultant to conduct a study and make a report to the Legislature analyzing the alternative
ratemaking mechanisms adopted by other states In addition SB 774 extended the
authorization for the Periodic Rate Adjustment (PRA) mechanism from 2017 to 2019
which the Legislature had authorized in 2011 (SB 1693) as a version of an alternative
ratemaking mechanism that provides to utilities a means for expedited recovery of
distribution infrastructure costs Pursuant to SB 774 the Commission retained a consultant
to produce the report and the consultantrsquos recommendations included streamlining the ratemaking process to reduce procedural costs providing for a periodic review of the
prudency of the costs and using certain types of alternative ratemaking mechanisms that
decouple the recovery of costs from variations in load The Commission held a public
hearing to receive comments on the report from stakeholders and after consideration of
those comments has provided to the Legislature the consultantrsquos report together with its
own discussion of the report
Request for Purchase of Oncor Electric Delivery Company
In March 2016 the Commission approved with conditions an application by an
investor group led by Hunt Consolidated Inc the owners of Sharyland Utilities to acquire
control of Oncor Electric Delivery Company (Oncor) the largest transmission and
distribution utility in Texas from Oncorrsquos parent company Energy Future Holdings which
is in bankruptcy The Commission approved the request subject to certain conditions
including stipulations regarding the organization of the new entities and treatment of tax
benefits The investor-led group subsequently declined to pursue the transaction that was
approved by the Commission
In September 2016 NextEra Energy which owns Florida Power amp Light received
approval from the United States Bankruptcy Court in Delaware for its plan to purchase
Oncor In October 2016 NextEra Energy filed an application with the Commission in
Docket No 46238 for approval of the proposed transaction The Commission will evaluate
the application to determine if the transaction is in the public interest
Integration of Lubbock Power and Light
In March 2016 the Commission opened Project No 45633 to study and identify
the issues related to the request of Lubbock Power and Light the statersquos third-largest
municipally owned utility to be integrated into ERCOT The Commission is currently
working with stakeholders ERCOT and SPP to determine the cost and benefits of any
potential switch by Lubbock Power and Light into ERCOT and whether such a switch is
in the public interest
24 | P a g e
2017 SCOPE OF COMPETITION IN ELECTRIC MARKETS IN TEXAS REPORT
Desalination Project ERCOT Studies
In 2015 the Legislature passed HB 4097 which directed the Commission and
ERCOT to study whether existing transmission and distribution planning processes are
sufficient to provide adequate infrastructure for seawater desalination projects and to study
the potential for desalination projects to participate in demand response opportunities in
the ERCOT market Pursuant to that direction ERCOT staff have prepared a report on the
feasibility of interconnection of large desalination projects and on opportunities for such
projects to participate in ERCOTrsquos demand response programs which is attached to this Report in Appendix B
Oversight and Enforcement Actions
The Commissionrsquos enforcement of statutes rules and orders applicable to entities
under its jurisdiction serves to protect consumers the electric markets the reliability of the
electric grid and to promote fair competition The Commissionrsquos enforcement efforts in the electric industry focus on violations of PURA the Commissionrsquos rules and ERCOT
protocols
During the period from January 2015 through August 31 2016 the Commission
assessed $3258500 in penalties against electric market participants Table 8 provides a
summary of electric industry Notices of Violation since January 2015 During 2015 and
2016 Commission staff opened 212 investigations for the electric industry and closed 177
investigations
Table 8 Notices of Violations
Violation Type Total Penalty Amount
Retail Market Violations $539000
Service Quality Violations $451500
Wholesale Market Violations $2268000
TOTAL $3258500
In addition to the imposition of administrative penalties the Commission uses other
enforcement mechanisms in exercising its enforcement duties including revoking a
companyrsquos certificate to operate In addition some companies may be required to relinquish a certificate as part of a settlement after enforcement action has proceeded
Table 9 provides a breakdown of the number of certificates revoked or relinquished In
2016 the Commission revoked the certificate of the REP TruSmart Energy
Table 9 Certificates Revoked or Relinquished
Type Number
Certificates Revoked 1
Certificates Relinquished 0
25 | P a g e
2017 SCOPE OF COMPETITION IN ELECTRIC MARKETS IN TEXAS REPORT
The Oversight amp Enforcement division also issues warning letters to companies in
the electric market when it determines that a violation occurred but given the
circumstances surrounding the violation and other mitigating concerns no administrative
penalty is warranted During 2015 and 2016 the Oversight amp Enforcement division issued
50 warning letters Finally the Commission generally seeks to reimburse money directly
to customers when appropriate In 2015 and 2016 the Commission ordered the
reimbursement of $8543596 to Texas electric customers
Table 10 Warning Letters
Warning Letter Type Number
Retail Market Warning Letter 8
Service Quality Warning Letter 1
Wholesale Market Warning Letter 41
TOTAL 50
In addition to its enforcement activities the Commission also enters into voluntary
mitigation plans with generators that request one through a contested case proceeding
pursuant to PURA sect15023(f) and 16 TAC sect25504(e) The Commission entered into one
voluntary mitigation plan during 2015 and 2016 in Docket No 44635
Low-Income Discount System Benefit Fund
The System Benefit Fund (SBF) was originally established in 1999 to fund
discounts to low-income customers customer education activities energy-efficiency and
weatherization and electric market oversight through a nonbypassable surcharge on retail
electric bills HB 1101 of the 84th Legislature provided that the SBF be sunset on
September 1 2017 by which time the SBF is intended to be exhausted In the 2016 Fiscal
Year (FY) $325521250 was appropriated in the SBF to provide a 25ndash31 percent discount
to low-income customers over a 12-month period
To assist the drawdown of the remaining balance HB 1101 authorized the
Commission to use any unexpended SBF balance in FY 2017 to assist low-income
customers The Commission estimates that the remaining SBF balance will be
approximately $17 million by August 31 2017 The Commission has determined that this
amount is insufficient to fund the rate reduction program however the Commission will
spend approximately $100000 to continue automatic enrollment in the program to provide
REPs a list of customers eligible to receive late fee waiver and deposit installment benefits
These two ancillary benefits of the rate reduction program will continue for the duration of
FY 2017
26 | P a g e
2017 SCOPE OF COMPETITION IN ELECTRIC MARKETS IN TEXAS REPORT
Homeland Security
The Commission assesses the efforts of ERCOT and utilities to defend against
mitigate and respond to the variety of risks that the modern electricity system faces The
Commission also meets with ERCOT utilities and governmental entities on an ongoing
basis to discuss preparation for everything from hurricanes and other severe weather to
cyber-threats and threats of physical damage to the grid from accidents or intentional
malfeasance In addition the Commission monitors industry and federal programs that
address homeland security issues
The Commission serves as an information liaison between state government and
electric utilities during emergencies The Commissionrsquos main roles include
Conveying outage and service restoration information from electric utilities to
state government
Conveying service restoration priorities (hospitals water treatment facilities
etc) from state government to electric utilities and
Facilitating the clearance of downed power lines in disaster re-entry areas and
facilitating entry of electric utilities into disaster areas
The Commissionrsquos Emergency Management Response Team (EMRT) provided staff at the
State Operation Center for the May 2015 and April 2016 flooding events in Texas as well
as additional staffing for severe winter weather
Demand Response
ERCOT staff have begun to report annually on the participation of customers in
REP-sponsored demand response programs These programs which have been facilitated
by the deployment of smart meters throughout the competitive areas within ERCOT and
by many municipal and cooperative electric utilities take the form of rebates for reduction
in usage during peak period time-of-use pricing real-time volumetric price compensation
for load reduction and direct control of customer load among other plans
These programs have seen dramatic increases in participation since ERCOT began
to gather this information in 2013 From 2013 to 2014 the number of residential customers
participating in these programs increased from 151793 to 721273 and the number of
commercial and industrial customers participating rose from 30275 to 50205 The
Commission continues to monitor ERCOTrsquos stakeholder process for efforts relating to the integration of demand response
27 | P a g e
2017 SCOPE OF COMPETITION IN ELECTRIC MARKETS IN TEXAS REPORT
IV LEGISLATIVE RECOMMENDATIONS
A Determination of Low-Income Customer Eligibility
In 2015 HB 1101 required that all remaining funds in the System Benefit Fund
(SBF) be expended that the fee that funded the program as a nonbypassable surcharge on
electric bills be set at zero and that the SBF be sunset on September 1 2017 Per the
provisions of HB 1101 the SBF fee was set at zero in September 2016 concluding the
funding for the program The sunset of the SBF program also concluded the relationship
between the Texas Health and Human Services Commission (HHSC) and the Commission
in which the HHSC provided to the Commission eligible electric customers for the SBF
low-income discount Because of the termination of the relationship with HHSC with the
termination of the SBF the Commission will no longer be able to determine easily an
electric customerrsquos eligibility for other low-income programs such as late penalty waivers
and the option of paying an electric deposit over multiple months
The Legislature may wish to consider easing low-income customers access to these
low-income programs by facilitating the process used to determine eligibility The
Commission offers four possible approaches in which the Legislature could continue these
low-income programs
(1) Authorize HSSC to provide identification of eligible low-income customers to the
Commission
(2) Allow retail electric providers (REPs) to provide such low-income programs using
the Low Income Discount Administratorrsquos (LIDA) Telecommunications Lifeline
Service Program list to identify low-income customers
(3) Require REPs to offer such low-income programs with customers self-enrolling
and REPs verifying income eligibility or
(4) Allow REPs to voluntarily provide such low-income programs at their own
discretion
B Outside Counsel for Proceedings before Regional Transmission
Organizations
Regional Transmission Organizations (RTO) manage the power grid across wide
regions of the United States Most of Texas is inside the ERCOT region however there
are significant portions of East Texas and the Panhandle that are in the Midcontinent
Independent System Operator (MISO) and the Southwest Power Pool (SPP) Issues arise
in these other RTOs that have significant impact on Texas ratepayers such as how
transmission infrastructure costs will be shared These tend to be very lengthy and
complicated proceedings that require specialized legal and consulting services
28 | P a g e
2017 SCOPE OF COMPETITION IN ELECTRIC MARKETS IN TEXAS REPORT
PURA sect 394525 currently authorizes the Commission to use outside consultants
auditors engineers or attorneys to represent the Commission in proceedings before the
Federal Energy Regulatory Commission This provision has been an important tool for the
Commission to respond to complex matters in the federal arena to enable it to protect the
public interest in Texas The PUC recommends that the Legislature expand the language
in this statute to include the ability to hire outside assistance for proceedings before other
RTOs to provide those same protections to Texas ratepayers in those areas
C Repeal of Natural Gas and Renewable Energy Mandates
1 Natural Gas
PURA sect 399044 establishes natural gas as ldquothe preferential fuelrdquo in Texas for electricity generation and requires the Commission to adopt rules to establish a system of
natural gas energy trading credits The majority of all new non-renewable electricity
generation constructed since 2000 for Texas has used natural gas as a primary fuel and this
trend is expected to continue in the foreseeable future The thresholds used to trigger the
natural gas energy trading credit system in PURA sect 399044 have not been reached and
they are not expected to be reached in the foreseeable future
Because natural gas-fueled facilities have been the most commonly built new
generation in Texas for many years and are expected to continue to be there is no need to
establish incentives for natural gas generation The PUC recommends that the Legislature
consider repealing PURA sect 399044 because it is no longer necessary
2 Renewable Energy
PURA sect 39904 establishes goals for renewable energy Subsection (a) requires
the installation of 5880 megawatts of renewable energy by 2015 and Subsection (b)
establishes a renewable energy credits trading program to implement the requirement The
5880 megawatts mandates in Subsection (a) was met in 2008 While the Commission
believes the renewable energy trading credit program is needed for retail electric providers
to validate renewable energy marketing claims the Commission believes the 5880
megawatts mandate in Subsection (a) is no longer necessary
D Advisory Opinions
Many regulatory agencies in Texas have authority to issue informal guidance to the
persons they regulate particularly with respect to outlining whether a particular course of
conduct would in the agencyrsquos view be consistent with the laws and regulations that the agency administers19 The issuance of an advisory opinion can provide regulatory clarity
to a company before making investments or conducting operations the permissibility of
which may be unclear under state law The Legislature may want to consider granting the
19 In addition certain federal agencies such as the Federal Communications Commission
Internal Revenue Service Securities and Exchange Commission and Federal Election
Commission have authority to issue advisory opinions
29 | P a g e
2017 SCOPE OF COMPETITION IN ELECTRIC MARKETS IN TEXAS REPORT
Commission the authority to issue advisory opinions In the electric industry providing
clarification to a company concerning issues such as the purchase of assets or the
acquisition of another company could allow it to avoid expensive regulatory proceedings
without impairing the Commissionrsquos authority The following state agencies have statutory authority to issue advisory opinions
Texas Ethics Commission20
Texas Medical Board21
State Board of Dental Examiners22
Texas Board of Nursing23
Texas Board of Professional Engineers24
Texas Lottery Commission and25
Texas Securities Board26
E Administrative
Gross Receipts Assessment
PURA sect 16001 provides for a gross receipts assessment that is used to defray the
expenses incurred by the Commission to administer PURA An assessment of one sixth of
one percent is collected from public utilities electric cooperatives retail electric providers
and interexchange carriersrsquo gross receipts from consumers The funds from this assessment
are remitted to the general revenue fund but currently they have not been explicitly
dedicated to funding of the Commission In contrast similar assessments on water
utilities insurance companies and other regulated entities have traditionally been used to
explicitly fund the underlying regulatory programs at the respective agencies The
Commission is one of four Article VIII agencies that is not designated as self-funded
The Commission recommends that the Legislature designate the Commission as a
self-funded agency whereby the collected assessments would be explicitly dedicated to the
funding of the agency Implementing this recommendation would require the Public Utility
Commission to be included in the Appropriations Limited to Revenue Collections rider
located in the Special Provisions Relating to All Regulatory Agencies section of the
General Appropriations Act Designation as a self-leveling agency would require the
Commission to set the gross receipts assessment at a rate sufficient to generate revenue in
the amount of the agencyrsquos general revenue appropriation each fiscal year which would require a statutory change to PURA sect16001(b) Based upon the Commissionrsquos baseline budget request authorizing the PUCrsquos self-leveling designation would result in an overall
estimated tax reduction of $456 million per year or 774
20 Government Code sect 571091 21 Occupations Code sect 162107 22 Occupations Code sect 258157 23 Occupations Code sect 301607 24 Occupations Code sect 1001601 25 Occupations Code sect 2001059 26 Tex Rev Civ Stat Ann Arts 581-28-1 amp 581-35 7 Tex Admin Code 1012
30 | P a g e
2017 SCOPE OF COMPETITION IN ELECTRIC MARKETS IN TEXAS REPORT
V APPENDICES
31 | P a g e
2017 SCOPE OF COMPETITION IN ELECTRIC MARKETS IN TEXAS REPORT
Appendix A ndash Acronyms
AEP American Electric Power
AMS Advanced Metering System
CenterPoint CenterPoint Energy Houston Electric LLC
DG Distributed Generation
DRG Distributed Renewable Generation
ERCOT Electric Reliability Council of Texas
ERSC Entergy Regional State
ERS Emergency Response Service
ETI Entergy Texas Inc
IMM ERCOT Independent Market Monitor
kWh Kilowatt-hour
LMP Locational Marginal Pricing
LSP Large Service Provider
MISO Midwest Independent System Operator
MMBtu One million British Thermal Unit (BTU)
MW Megawatt
MWh Megawatt-hour
Nodal Texas Nodal Market Design
ORDC Operating Reserve Demand Curve
PGC Power Generation Company
POLR Provider of Last Resort
PURA Public Utility Regulatory Act
REP Retail Electric Provider
RSC Regional State Committee
RTO Regional Transmission Organization
SCED Security Constrained Economic Dispatch
Sharyland Sharyland Utilities LP
SBF System Benefit Fund
SPP Southwest Power Pool
TDU Transmission and Distribution Utility
TNMP Texas-New Mexico Power Company
32 | P a g e
2017 SCOPE OF COMPETITION IN ELECTRIC MARKETS IN TEXAS REPORT
Appendix B ndash ERCOT Desalination Report
This page intentionally left blank
33 | P a g e
ERCOT Public
Study on the Demand Response Potential for Seawater Desalination Projects
ERCOT November 18 2016
Study on the Demand Response Potential for Seawater Desalination Projects ERCOT Public
Executive Summary
In 2015 the 84th Texas Legislature enacted House Bill (HB) 4097 which included several provisions relating to seawater desalination projects including a requirement that the Public Utility Commission of Texas (PUC) and Electric Reliability Council of Texas (ERCOT) study the potential for seawater desalination projects to participate in existing demand response opportunities in ERCOT There are several demand response products in which demand-side resources (ie consumers of electricity) can participate These programs help to preserve system reliability and provide economic benefits to participating demand-side resources Seawater desalination is an energy-intensive process that removes salt and other minerals from salt water to produce fresh water for municipal consumption industrial use or irrigation Participation in demand response could help mitigate electricity costs for future seawater desalination projects in Texas and provide reliability benefits to the grid
There are two main demand response reliability-based services administered by ERCOT participation by demand-side resources in the Ancillary Services market and the Emergency Response Service (ERS) Within the Ancillary Services market the most common service provided by demand-side resources is Responsive Reserve Service (RRS) which requires resources to respond either instantaneously or within 10 minutes in response to unplanned system emergencies ERS is separate from ERCOTrsquos Ancillary Services market and allows demand-side resources and distributed generation to provide reliability services in the event of an energy emergency Resources can qualify for either the 10-minute or 30-minute response time ERS programs
There are several key considerations that will impact a demand-side resourcersquos ability to participate in different demand response opportunities response time recovery time predictability of electrical demand and flexibility of operations Considering these factors together it appears that seawater desalination plants could be designed to meet the requirements for participation in demand response Because the ability to meet the qualification requirements is dependent on the plant design demand response opportunities should be considered early in a projectrsquos development if participation is desirable
Whether project developers will choose to address these requirements will depend on the economic benefits of participation There may be additional costs to design seawater desalination plants to operate in the manner required in order to participate in demand response These include costs associated with additional plant design specifications need for excess capacity and storage to make up for lost production during demand response deployment operational costs resulting from interruptions to plant processes and potential financial penalties if demand response deployment results in failure to meet contract demands The interplay of the benefits of participation and these costs will determine whether it would be beneficial for a future seawater desalination plant to participate in demand response in ERCOT
To date participation of seawater desalination plants in demand response programs has been limited Because the process of seawater desalination is energy-intensive participation in demand response could help to reduce electricity costs while posing a relatively low risk to plant operations As stakeholders in Texas continue to plan for possible future droughts in the region and identify water management strategies consideration of demand response could play a role in mitigating some costs associated with seawater desalination and allow seawater desalination plants to assist with maintaining electric reliability in the region
copy 2016 ERCOT All rights reserved i
Study on the Demand Response Potential for Seawater Desalination Projects ERCOT Public
Table of Contents
1 Introduction 1
2 Seawater Desalination 2
21 Seawater Desalination Plant Operations 2
22 Seawater Desalination Plant Economics 3
3 Demand Response Opportunities in ERCOT 4
31 ERCOT-Dispatched Demand Response 4
311 Ancillary Services Markets 5
312 Emergency Response Service (ERS) 5
32 Non-ERCOT-Dispatched Demand Response 6
321 Four Coincident Peak (4CP) 6
322 LSE or DR Provider Contracted Price Response 6
323 Self-Directed Price Response 6
4 Demand Response Potential for Seawater Desalination 7
41 Operational Considerations for ERCOT-Dispatched Demand Response 7
42 Economic Considerations for ERCOT-Dispatched Demand Response 8
43 Considerations for Non-ERCOT-Dispatched Demand Response 9
5 Conclusion 11
copy 2016 ERCOT All rights reserved ii
Study on the Demand Response Potential for Seawater Desalination Projects ERCOT Public
1 Introduction
In 2015 the 84th Texas Legislature enacted House Bill (HB) 4097 which included several provisions relating to seawater desalination projects including a requirement that the Public Utility Commission of Texas (PUC) and Electric Reliability Council of Texas (ERCOT) study the potential for seawater desalination projects to participate in existing demand response opportunities in ERCOT ERCOT and the PUC initiated this study to fulfill that requirement and evaluated the operational and economic characteristics of seawater desalination plants in light of ERCOTrsquos primary demand response products1
ERCOT is the independent system operator (ISO) for the ERCOT Interconnection which encompasses approximately 90 of demand for electricity in Texas ERCOT is the independent organization established by the Texas Legislature to be responsible for the reliable planning and operation of the electric grid for the ERCOT Interconnection ERCOT also administers and maintains a forward-looking open market to provide affordable and reliable electricity to consumers in Texas In collaboration with market participants ERCOT has developed demand response products and services for customers that have the ability to reduce or modify electricity use in response to instructions or signals These programs help preserve system reliability and provide economic benefits to participating demand-side resources
The process of seawater desalination removes salt and other minerals from salt water to produce fresh water for consumption industrial processes or irrigation The drought-prone Texas climate coupled with projections for increasing water demand in the state has created interest in seawater desalination as a future water source The 2017 Texas State Water Plan includes seawater desalination as a future water management strategy for water users in the state However the seawater desalination process is energy intensive and electricity consumption can be a significant cost driver for these projects To the extent that these plants could participate in demand response it would help to defray these costs Thus there is a potential nexus between seawater desalination projects built in Texas to mitigate drought but which have large electricity requirements and ERCOT demand response opportunities which could help to reduce their electricity costs and provide reliability benefits
This study evaluates the demand response potential of seawater desalination plants based on their operational characteristics and economic drivers The report is organized as follows
Section 2 provides background on typical seawater desalination plant operations and economics
Section 3 describes the current demand response opportunities in ERCOT
Section 4 evaluates the characteristics of seawater desalination plants to determine their potential to participate in demand response opportunities in ERCOT and
Section 5 provides a summary of the conclusions of this study
1 In the course of developing this report ERCOT consulted with several desalination experts with experience with existing or planned seawater desalination plants in the US The technical experts consulted included Jorge Arroyo (Water Management Consultant) Andrew Chastain-Howley (Black amp Veatch) Jonathan Loveland (Black amp Veatch) Ron Parker (Black amp Veatch) John Wolfhope (Freese and Nichols) and Srinivas Veerapaneni (Black amp Veatch)
copy 2016 ERCOT All rights reserved 1
Study on the Demand Response Potential for Seawater Desalination Projects ERCOT Public
2 Seawater Desalination
There are two primary methods for seawater desalination distillation (also referred to as ldquothermalrdquo) and reverse osmosis Distillation uses heat to remove salts and minerals from seawater by boiling water at high pressures In contrast reverse osmosis technology forces saline water through a membrane to separate water from the salts and minerals While both distillation and reverse osmosis are energy intensive distillation requires thermal energy to heat the water and overall has a higher energy requirement whereas reverse osmosis requires primarily electrical energy and overall is less energy intensive ndash though still with significant electricity requirements
Globally most thermal desalination plants are located in the Middle East due to low energy prices in the region Plants located elsewhere including in the US typically use reverse osmosis technology2 There are two large existing seawater desalination plants in the US one in Carlsbad California providing water to the San Diego area and one in Gibsonton Florida providing water to the Tampa Bay area Both plants use reverse osmosis technology In addition there are several desalination projects currently in the planning stages or under development in Texas in the Corpus Christi area that would use reverse osmosis technology For that reason this report focuses on reverse osmosis technology in the evaluation of demand response potential of seawater desalination plants
While there are currently no existing seawater desalination plants in Texas there are several municipal and industrial brackish water desalination plants in the state According to the Texas Water Development Board (TWDB) there are 46 municipal brackish water desalination plants with capacities greater than 0025 million gallons per day (MGD) in Texas representing a total of 123 MGD of capacity3 The desalination of brackish water is typically less expensive compared to seawater due to the lower relative salinity of brackish water This study focuses exclusively on seawater desalination consistent with the requirements of HB 4097 but it should be noted that conclusions may also apply to brackish water desalination though at a different cost and scale
This section provides high-level information on the operations (Section 21) and economics (Section 22) of seawater desalination plants to inform the discussion of their demand response potential in Section 4
21 Seawater Desalination Plant Operations Seawater desalination plants typically range in capacity from less than 5 MGD up to 165 MGD For example the Carlsbad seawater desalination plant has a capacity of approximately 50 MGD and the plant in Tampa Bay has a capacity of approximately 25 MGD The associated electricity consumption ranges between 10 and 15 kWh1000 gallons produced depending on the salinity of the water being processed456 More saline water (eg seawater) requires larger amounts of electricity for desalination Thus a seawater desalination plant would have larger electricity consumption requirements compared to a similarly sized brackish water desalination plant
2 American Water ldquoInnovation Solutions within the Water Industry Desalinationrdquo Available at httpwwwamwatercomfilesInnovationsSolutionsWithinTheWaterIndustryDesalinationpdf 3 Texas Water Development Board ldquoDesalination Factsrdquo Available at httpswwwtwdbtexasgovinnovativewaterdesalfactsasp 4 American Membrane Technology Association April 2016 ldquoMembrane Desalination Power Usage Put in Perspectiverdquo Available at httpwwwamtaorgcomwp-contentuploads7_MembraneDesalinationPowerUsagePutInPerspectivepdf 5 Water Reuse Association November 2011 ldquoSeawater Desalination Power Consumptionrdquo Available at httpswatereuseorgwpshycontentuploads201510Power_consumption_white_paperpdf 6 Ghaffour N TM Missimer and G Amy January 2013 ldquoTechnical review and evaluation of the economics of water desalination Current and future challenges for better water supply sustainabilityrdquo Desalination 309 pp197-207 Available at httpswwwresearchgatenetpublication256693140_Technical_review_and_evaluation_of_the_economics_of_water_desalination_ Current_and_future_challenges_for_better_water_supply_sustainability
copy 2016 ERCOT All rights reserved 2
Study on the Demand Response Potential for Seawater Desalination Projects ERCOT Public
While the two existing seawater desalination plants in the US were co-located with power plants to ease compliance with regulations on water intake and discharge structures and reduce costs many other reverse osmosis desalination plants receive their electricity from the grid However plants may have on-site backup generation in case of a power outage This will vary depending on the size and design of the plant and other factors For example the Carlsbad plant in California does have diesel backup generation to power control systems and flushing systems in the case of a power outage The plant in Tampa Bay was not built with backup power due to potential storm surge risks from hurricanes and other storms The plant does use uninterruptible power supply (UPS) backup to power control systems during power outages
Reverse osmosis plants are typically designed with several ldquotrainsrdquo which consists of a high-pressure pump turbine and reverse osmosis membrane Desalination plants are turned on or off one train at a time in a highly controlled process The process of ramping up or down an individual train under normal operations typically takes one to two hours While plants can be designed to handle immediate shutdowns (ie in a power outage) re-starting a system after an interruption would take this amount of time In addition the saline water must be pretreated (ie filtered) before going through the reverse osmosis train and this can sometimes pose constraints on the flexibility of operations
Demand for water is the key factor driving the level of production at seawater desalination plants Typically the plant will have a contract or contracts with municipal or other water users to deliver desalinated water and is operated to meet that demand Alternatively if the plant is municipally owned it would similarly be operated to meet the level of water demand in conjunction with other available water sources If water demands are close to a plantrsquos full capacity the operatorrsquos flexibility to adjust its electricity consumption as part of demand response may be limited However this does mean that plant operations are fairly predictable on a day-to-day basis which is necessary for participation in demand response
The amount of flexibility in plant operations will also be impacted by the amount of water storage available For example if a plant has sufficient water storage on-site or storage within the customerrsquos distribution system it could provide flexibility for the plant to reduce its operations during peak hours when electricity prices are likely to be highest It would also mitigate the impacts of interruptions to production from demand response deployments
22 Seawater Desalination Plant Economics Seawater desalination is typically more expensive than other sources of water and a major driver of the overall cost is energy costs In 2016 the Carlsbad plant charged rates at between $2131 and $2367 per acre-foot78 This charge is intended to cover both the fixed costs of the plant and the variable costs to produce a unit volume of water Typically half to two thirds of the cost of providing desalinated seawater are accounted for by capital cost recovery with the remainder accounted for by operations and maintenance costs including electricity costs Electricity costs can account for 20shy25 of the total costs of seawater desalination with reverse osmosis technology9
Factors affecting the capital cost of a seawater desalination plant include plant size type of desalination process and pre-post-treatment technologies plant infrastructure (eg piping water storage backup power) and compliance with applicable regulations (eg regulations on intake structures brine byproduct disposal) A significant driver of operating and maintenance costs is membrane replacement Reverse osmosis membranes need to be replaced every few years and
7 Source San Diego County Water Authority ldquoSeawater Desalinationrdquo Available at httpwwwsdcwaorgseawater-desalination 8 Note that 1 acre-foot is approximately 325851 gallons 9 Based on technical input from Black amp Veatch
copy 2016 ERCOT All rights reserved 3
Study on the Demand Response Potential for Seawater Desalination Projects ERCOT Public
the rate at which they are replaced will depend on the salinity of the feedwater and how the plant is operated Treatment and disposal of the salty brine byproduct from desalination may also incur operating costs
Electricity costs will vary depending on a range of factors including the size of the plant type of desalination technology source of electricity and quality of the feedwater As previously noted more saline water requires higher amounts of electricity in desalination and thus the amount of electricity consumption is a key difference between brackish water and seawater desalination As a result electricity costs comprise a significant share of the costs of seawater desalination These costs could potentially be defrayed in part by participation in demand response initiatives
3 Demand Response Opportunities in ERCOT
Broadly speaking demand response can be broken down into two major categories dispatchable or non-dispatchable For purposes of this report we will define dispatchable as those demand response events that are initiated by ERCOT and non-dispatchable as an event not specifically initiated by ERCOT These non-dispatchable events may include decisions made by the end-use customer to alter its consumption pattern or may include contractual obligations with another entity such as the end-use customerrsquos retail electric provider (ldquoREPrdquo) to alter consumption patterns
ERCOTrsquos wholesale market is open to several types of dispatchable demand response which are deployed to maintain system reliability Demand-side resources providing Emergency Response Service (ERS) may offer based on either a 10 or 30-minute response time commonly referred to as the ldquoramp periodrdquo Alternatively demand-side resources may register and qualify as a Load Resource that can provide Reserves in the Ancillary Services market The most common service provided by demand-side resources is Responsive Reserve Service which requires an under-frequency relay that can instantaneously interrupt the load during certain system reliability events Some demand-side resources can also participate in other Ancillary Services as Controllable Load Resources that require sophisticated control systems that allow them to be deployed in a more incremental proportional manner
Non-dispatchable demand response in ERCOT can include a response to avoid transmission costs where rates are based on Four Coincident Peak Pricing (4CP) response to wholesale energy prices initiated by the customer or by a REP or other load-serving entity (ldquoLSErdquo) or utility-managed Load Management programs (LM)
The sections that follow provide a description of both ERCOT-dispatched (Section 31) and nonshyERCOT-dispatched (Section 32) demand response For a more detailed description of opportunities for demand-side resources to participate in demand response in ERCOT see ERCOTrsquos guide Load Participation in the ERCOT Nodal Market10
31 ERCOT-Dispatched Demand Response There are two main demand response reliability-based services administered by ERCOT participation by demand-side resources in the Ancillary Services market and participation in ERS These services are dispatched by ERCOT during system emergencies
10 Available at httpwwwercotcomcontentservicesprogramsloadLoad20Participation20in20the20ERCOT20Nodal20Market_302d oc
copy 2016 ERCOT All rights reserved 4
Study on the Demand Response Potential for Seawater Desalination Projects ERCOT Public
Demand-side resources with demand response capability that can meet a set of performance requirements can be qualified to provide Ancillary Services as Load Resources in the Ancillary Services Market The value of having a Load Resource available to reduce load is equal to the value of having a generator available to increase its generation at a generating plant The providers of operating reserves selected to provide Ancillary Services are eligible for capacity payments regardless of whether the Resource is actually deployed (or curtailed in the case of the Load Resource)
ERCOT holds auctions on a daily basis for each of the following Ancillary Services Regulation Up Regulation Down Responsive Reserve and Non-Spinning Reserve11 Table 1 describes the various Load Resource types and their qualification requirements and eligible services
Table 1 Load Resource Types and Ancillary Services
Service Load Resource Type a Qualification Responsive Reserves (le50 of total Reserve requirement)
Non Controllable Under-Frequency Relay and 10-minute ramp to manual dispatch instruction
Responsive Reserves
Controllable Primary Frequency Response and follow 5-minute dispatch instructions
Regulation-Up Regulation-Down
Controllable Primary Frequency Response and respond to Regulation deployments
Non-Spin Reserves Controllable Follow 5-minute dispatch instructions a A Controllable Load Resource is a Load Resource capable of controllably reducing or increasing consumption under dispatch control by ERCOT
Demand-side resources that agree to reduce load when directed by ERCOT and that meet other metering and operational requirements as specified in the ERCOT Protocols may participate in Ancillary Services market auctions As noted in Table 1 the type of Ancillary Service that a Load Resource may provide will depend upon the demand-side resourcersquos response time and metering system as well as other requirements described in the Protocols In the Responsive Reserve and Non-Spin Reserve markets the Load Resource will receive capacity payments regardless of whether or not the load was actually deployed but the load must be available for deployment at any time while providing the service
ERCOT procures ERS to maintain grid reliability during emergency conditions and reduce the likelihood of the need for rotating outages ERS participants may offer to provide demand response with either a 10-minute ramp period requirement (similar to Load Resources providing Responsive Reserve Service) or a 30-minute ramp period requirement ERS Resources do not have the same telemetry and under-frequency relay requirements as Load Resources
11 Regulation Up and Regulation Down service respond to signals from ERCOT every 4 seconds to respond to changes in system frequency full response has to be provided within 5 minutes Responsive reserves must provide their committed capacity either instantaneously in an under-frequency event (eg due to a generator outage) or in energy scarcity conditions within ten minutes following an instruction from ERCOT Non-spinning reserves must provide their committed capacity within 30 minutes based on economic dispatch instructions Non-spinning reserve is used as replacement reserve to replenish other ancillary services and during energy scarcity
copy 2016 ERCOT All rights reserved 5
Study on the Demand Response Potential for Seawater Desalination Projects ERCOT Public
ERS is procured through a request for proposal (RFP) process three times per year for four-month contract terms each of which is further split into smaller time periods based on business cycles and other factors Demand-side resources may choose to submit offers in all time periods or only in those that best fit their unique circumstances and may vary both the price and demand response capacity offers by time period
Payments for ERS are performed up to 80 days after each four month contract term has ended and are subject to downward revision based upon delivered demand response capacity and the demand-side resourcersquos availability during the contract term
32 Non-ERCOT-Dispatched Demand Response The options listed below are not dispatched by ERCOT but they either are controlled directly by a customer or are dispatchable by another entity such as a demand response provider (ldquoDR Providerrdquo) REP or a transmission and distribution utility
Many industrial customers are subject to transmission charges based upon a Four Coincident Peak (4CP) demand The 4CP demand is determined by averaging the consumerrsquos actual demand during the 15-minute settlement interval with the highest ERCOT demand during each of the four summer months (June through September) This measured 4CP demand serves as the basis for the customerrsquos transmission tariff charges for the following year By correctly predicting the ERCOT system peaks during the summer and curtailing load during those intervals a consumer can help reduce the stress imposed on the electric system during peak periods of consumption and reduce its transmission charges for the following calendar year
In the competitive areas of ERCOT consumers can contract with their REP or a DR Provider to have their load respond to the REPrsquos or DR Providerrsquos instructions The contract will usually outline the parameters of this response ndash at what times and frequency demand response events can be called ramp periods sustained response periods compensation etc Because this response is a contractual matter between the REP or DR Provider and the consumer a great deal of variety can be present in these arrangements For example a consumerrsquos response may be voluntary or required compensation could come in the form of reduced energy prices or rebate payments for each curtailment event consumers might be notified up to a day in advance or could have no notification at all (for automated curtailment)
In areas of ERCOT not open to competition interruptible tariffs may be available These tariffs will usually offer a reduced energy price for defined curtailment obligations
REPs may offer dynamic pricing options or consumers within a municipality or cooperative may have their energy prices determined by a published tariff which also may be structured based upon Time-of-Use (TOU) or have a Critical Peak Pricing (CPP) or Peak Time Rebate (PTR) component Self-directed price response refers to consumers making an independent decision to respond to energy prices contained in a governing tariff or in either the ERCOT Day Ahead or Real Time energy markets
TOU offerings will typically have higher energy prices during normal peak periods ndash for example a TOU tariff may charge one price during Monday through Friday from 2 pm through 8 pm and another price during all other times Customers may choose to reduce consumption during these high priced periods Load reduction can be accomplished by load shifting (loads can be shifted by
copy 2016 ERCOT All rights reserved 6
Study on the Demand Response Potential for Seawater Desalination Projects ERCOT Public
rescheduling certain processes or by utilizing thermal storage) ending certain processes that are no longer economic or through energy efficiency measures
Offerings that incorporate CPP usually have prescribed high prices only during certain defined periods ndash for example when load or prices are expected to reach a certain level Response to CPP may be similar to those employed under TOU tariffs especially if CPP is reached frequently More often CPP is infrequent and as such short-term load curtailment may be the more appropriate response to meet economic objectives
4 Demand Response Potential for Seawater Desalination
This section evaluates whether the operational characteristics and economics of seawater desalination plants would enable them to participate in one or more of the various demand response opportunities in the ERCOT Region To date participation of seawater desalination plants in demand response programs has been limited Neither the plant in Carlsbad nor the plant in Tampa Bay participate in demand response programs in California or Florida respectively However as will be described below it appears that these plants can be designed and operated to meet the requirements for participation in demand response and receive economic benefit from participation in these programs
Section 41 describes the operational parameters that must be met for a demand-side resource to provide ERCOT-dispatched demand response and evaluates the ability of seawater desalination plants to meet these criteria Section 42 discusses the tradeoffs between payments for participation in ERCOT-dispatched demand response and potential additional costs posed to seawater desalination plants Finally Section 43 presents other opportunities for seawater desalination plants to reduce their electricity costs outside of ERCOTrsquos reliability-based services that are open to demand response assets
41 Operational Considerations for ERCOT-Dispatched Demand Response There are several key operational parameters that impact a demand-side resourcersquos ability to participate in different demand response services response time recovery time predictability of electrical demand and flexibility of operations This section discusses each of these considerations as they apply to seawater desalination plants
As discussed in Section 31 one of the differentiating factors between ERCOTrsquos demand response products is the amount of time within which a demand-side resource must respond to a deployment instruction to reduce electricity consumption during an event Participation in RRS requires an automatic response within either half a second (ie instantaneous) based on grid frequency or within 10 minutes via a manual instruction ERS requires a response time of either 10 or 30 minutes As noted in Section 21 the typical time to take a reverse osmosis train on- or off-line is 1-2 hours under normal controlled operations To comply with the response time requirements of RRS or ERS a seawater desalination plant would need to be able to reduce its electricity consumption far more quickly than in normal operations This is an element of plant design that would need to be accounted for in the specifications of the project Considerations include the potential need for on-site backup generation including uninterruptible power supply potential impacts to plant infrastructure (eg piping) reverse osmosis membranes and pretreatment systems
The two large US desalination plants provide illustrative counterpoints in this respect The Carlsbad plant was designed to withstand instantaneous power interruptions and has on-site backup generation including uninterruptible power supply to provide the ability to power control systems and flush the membranes in the event of a power loss In contrast the Tampa Bay plant was not
copy 2016 ERCOT All rights reserved 7
Study on the Demand Response Potential for Seawater Desalination Projects ERCOT Public
designed with on-site backup generation and a loss of power would result in a plant shutdown and may require several days to bring the plant back on-line Thus it appears that it is technically possible for a seawater desalination plant to meet the response time requirements for participation in demand response so long as this factor is considered in the design of the facility
The time it takes a desalination train to return to operations after an event is also a consideration Demand-side resources participating in RRS must be able to come back on-line within three hours and those participating in ERS must return within 10 hours Again it appears that it is technically feasible for desalination plants to meet this requirement so long as this requirement is considered in the plant design
An additional consideration is the predictability of a demand-side resourcersquos electricity consumption Participation in the responsive reserves ancillary service market requires bidding in the day-ahead market and thus a demand-side resource must know with great accuracy (within 95) its electrical demand at least a day ahead of time For ERS auctions are held three times a year for four-month contract periods Thus to participate in ERS a resource must know its forecasted electrical demand several months in advance Because seawater desalination plant operations are driven by contracted demand for water it is likely that a plant operator would have a good idea of the plantrsquos electrical demand days or even weeksmonths in advance especially for summer months when demand is likely to be relatively steady An important consideration however is the salinity of the water which drives the electrical requirements and which can be impacted by recent weather events Similarly reductions in demand for water during non-summer months or wet summer days where demand may be reduced could also impact a plantrsquos ability to predict its electricity demand
Finally a seawater desalination plant must have sufficient flexibility in its day-to-day operations so that it can afford to lose several hours of production when deployed for demand response It should be noted that demand-side resources participating in RRS and ERS are called infrequently demand-side resources providing responsive reserves were deployed one time in 2015 and ERS was not deployed that year However this is an important factor to consider if a plant is operating at close to full capacity and would incur financial penalties if it fails to meet its contract obligations due to a demand response event Including additional storage and building a plant with extra capacity could help to mitigate this risk It should also be noted that a plant operator does not need to commit the full plant capacity to these services but rather can specify an amount of MW that will be committed Thus a plant operator could mitigate issues both with predictability and flexibility of plant operations by committing only a portion of its predicted electrical demand to participate in demand response
Considering these factors together it appears that seawater desalination plants could be designed to meet the operational requirements for participation in ERCOTrsquos demand response services (both RRS and ERS) Because the ability to meet the requirements is dependent on the plant design demand response would need to be considered early in a projectrsquos development if participation is desirable Whether project developers will choose to address these requirements will depend on the economic benefits of participation in demand response which will be discussed in the next section
42 Economic Considerations for ERCOT-Dispatched Demand Response This section describes the economic benefits to demand-side resources from participation in ERCOT-dispatched demand response programs The average price paid for a demand-side resource participating in RRS in 2015 was $1087 per MW per hour and for ERS was $645 per MW per hour for the contract periods during the 2015 program year These payments could provide a significant financial benefit to seawater desalination plants To give a simplified example for a plant with an electrical demand of 10 MW operating at a 100 annual load factor (10 MW times 24 hours times 365 days) the annual benefit would be on the order of $500000 for ERS or $1 million for RRS
copy 2016 ERCOT All rights reserved 8
Study on the Demand Response Potential for Seawater Desalination Projects ERCOT Public
In 2015 demand-side resources providing responsive reserves were deployed one time for a duration of 10 minutes and ERS was not deployed12 The most ERS was ever deployed in a single year was two times in 2011 Thus participation in either program could result in a substantial payment to a seawater desalination plant with a relatively low risk of deployment and associated disruption of plant operations although it is important to note that participation in either ERCOT service subjects demand response resources to annual unannounced testing Other than testing the frequency of deployment will depend on grid conditions and is a risk that should be considered
The financial benefits of participation must be weighed against the costs of designing facilities with the capabilities to operate in this manner These include
bull The costs to design the plant to reduce electrical demand within the required timeframes for demand response and to withstand an instantaneous interruption if not already part of the plant design For example a plant may need to be designed to have backup power generation on-site In addition there could also be costs to restart the system after an interruption
bull The costs to build a plant with excess capacity andor storage to make up for lost production hours when demand response is deployed This will add to the total capital costs of the project Land area constraints should also be considered when considering additional storage as the space requirements for the necessary storage capacity could be significant
bull Costs associated with the impact of interruptions on plant processes (eg more frequent replacement of membranes impacts to pretreatment system or plant infrastructure)
bull Potential financial penalties that would be incurred if deployment as part of demand response were to result in failure to meet contract obligations to supply water
bull The loss of potential benefits in the form of cost avoidance from participation in non-ERCOTshydispatched demand response opportunities (see Section 43) If a plant is committed to RRS or ERS the plant operator would lose the flexibility to take advantage of these other opportunities to reduce their electricity costs
The interplay of these benefits and costs will determine whether it would be beneficial for a future seawater desalination plant to participate in demand response in ERCOT
43 Considerations for Non-ERCOT-Dispatched Demand Response Outside of the reliability-based services administered by ERCOT there are other opportunities for seawater desalination plants to reduce their electricity costs As described in Section 321 seawater desalination plants may be able to reduce the demand charges on their electricity bills through curtailing load during 4CP intervals In addition plant operators may adjust operations in response to real-time electricity prices to take advantage of lower off-peak prices and avoid price spikes (see Sections 322 and 323) All of these opportunities require that the plant have flexibility to reduce production during certain times of the day
In the ERCOT region as noted above a portion of transmission and distribution charges are set based on the peak systemwide 15-minute interval of the four summer months (June through September) referred to as the four coincident peaks (4CP) Large customers can reduce or avoid this charge by reducing electrical consumption during these four peak intervals AEP Central Texas and CenterPoint are the transmission providers covering the majority of the Gulf Coast in Texas13
12 ERCOT June 2016 ldquoLoad Resource Deployment Updaterdquo Available at httpwwwercotcomcontentwcmkey_documents_lists870985_RRS_Load_Resource_Deployment_Updatepdf 13 It is also possible that a seawater desalination plant could be located in an area that as not opted in to competition in which case the plant owner would need to negotiate its electricity charges bilaterally with the Non Opt-In Entity (NOIE)
copy 2016 ERCOT All rights reserved 9
Study on the Demand Response Potential for Seawater Desalination Projects ERCOT Public
Assuming a future seawater desalination plant would be connected at transmission-level voltages the relevant 4CP charges based on the 2016 tariffs accounting for both transmission charges and transmission cost recovery factors would be $41425 per 4CP kW for AEP Central Texas and $41870 per 4CP kVA for CenterPoint14 If a seawater desalination plant has 10 MW of load and is capable of interrupting all of it and successfully does so for all four 4CP intervals the savings based on the 2016 tariffs would be approximately $500000 per year ($41425 times 1000 (kW to MW) times 10 MW times 12 months) Thus a seawater desalination plant that reduces its electricity use during the 4CP intervals could avert some or all of these charges
Another opportunity for seawater desalination plants to reduce their electricity costs is through adjusting operations in response to real-time electricity prices In 2015 the average electricity price in ERCOT was $2677MWh However prices exceeded $50MWh in 254 hours (3 of all hours) $100MWh in 88 hours (1) $200MWh in 40 hours (05) and $300MWh in 21 hours (02) Prices exceeded $3000MWh for 021 hours15 Depending on the desalination plantrsquos exposure to real-time wholesale market prices (via its retail contract) the degree of high prices the plant owner is willing to avoid and grid conditions in a given year reducing unit operations in order to avoid high electricity prices could impact operators for anywhere between a few and several hundred hours out of the year In addition a plant can plan its operations to take advantage of lower electricity prices during off-peak periods (eg at night when generation from wind is high) For example at least one company is marketing a modular desalination unit design intended to take advantage of low prices during periods of high renewables generation and to provide grid reliability services through demand response16
There are several factors to consider regarding these opportunities to reduce electricity costs The plant would need to monitor the ERCOT market or hire a contractor to do so in order to know when to reduce demand for electricity These programs do not impose any requirements on response time as with RRS or ERS and there may be sufficient warning of 4CP intervals or peak pricing to allow the plant operator to plan its operations earlier in the day with sufficient time to ramp down production under controlled conditions However quicker ramping capability may be desirable to respond to electricity price fluctuations
For 4CP because the four intervals used to set demand charges are not known ahead of time it is likely that the plant would need to reduce its demand multiple times per summer to ensure the 4CP intervals are hit impacting production at the facility Timing operations to coincide with off-peak pricing or to avoid price spikes would similarly result in reduced operations during certain hours To offset the lost production hours the plant may need to be designed with extra capacity and water storage capability to maintain the ability to meet its contractual obligations for freshwater delivery Because the period of reduced operations is greater than with ERCOT-dispatched demand response services this need would be greater for a seawater desalination plant reducing load during 4CP intervals or in response to real-time electricity prices and would increase the capital costs of the project It should also be noted that high prices in the ERCOT Region typically but not always occur in summer months when drought conditions are more likely to develop and demand for desalinated water is likely to be highest This may limit the flexibility of the plant to time its electricity consumption to avoid high-priced hours
14 Public Utility Commission of Texas ldquoTransmission and Distribution Rates for Investor Owned Utilitiesrdquo Available at httpwwwpuctexasgovindustryelectricratestdraspx 15 Potomac Economics June 2016 2015 State of the Market Report for the ERCOT Wholesale Electricity Markets Available at httpswwwpotomaceconomicscomindexphpmarkets_monitoredERCOT 16 Sisyan LLC ldquoDemand Response Desalinationrdquo Available at httprenewabledesalinationcomwpshycontentuploads201506Demand-Response-Desalinationpdf
copy 2016 ERCOT All rights reserved 10
Study on the Demand Response Potential for Seawater Desalination Projects ERCOT Public
In addition the plantrsquos ability to participate in demand response would also be limited for those hours it is reducing load as part of 4CP response or in response to real-time prices because the plant would not be able to reduce its electricity consumption if that demand is already committed to another demand response service Thus participating in demand response versus taking advantage of these other opportunities may be to some extent mutually exclusive
5 Conclusion
Based on this analysis it appears that the operational characteristics of seawater desalination plants would allow them to participate in demand response opportunities in ERCOT so long as the necessary operational requirements are considered in the design specifications of the plant Project developers should consider the necessary requirements early in the plant design Whether the economic benefits of participation would provide a sufficient incentive for them to do so will depend on the costs of accommodating those operational requirements and whether there is the flexibility available to operate the plant as necessary under these programs Though most existing seawater desalination plants do not participate in demand response programs it does appear that participation by these plants is possible and could result in a financial benefit Table 2 compares the different demand response opportunities available to demand-side resources in ERCOT
Table 2 Comparison of Demand Response Opportunities Demand Response
Opportunity Requirements for
Participation Impacts to Plant
Operations Financial Benefit Ancillary Services ndash Responsive Reserve Service (RRS)
bull Under-Frequency Relay bull Instantaneous or 10 minute
response time bull Recover load within 3
hours bull Bid in day-ahead market
bull Deployed once in 2015 for 10 minutes bull Subject to annual
unannounced testing
bull $1087 per MW per hour (based on 2015 prices)
Emergency Response Service (ERS)
bull 10 or 30 minute response time bull Recover load within 10
hours bull Four-month contract term
bull Not deployed in 2015 the most times ever deployed in a single year was twice in 2011 bull Subject to annual
unannounced testing
bull $645 per MW per hour (based on 2015 prices)
Four Coincident bull Interval Data Recorder bull Likely plant will need to bull Avoid ~$48000 per 4CP Peak (4CP) (IDR) meter
bull Ability to predict system-wide peak demand hours during summer months
reduce load multiple times per summer to hit 4CP intervals bull Likely to be able to predict
possible 4CP intervals earlier in day
MW per year (based on 2016 tariffs) if successful in reducing during all four summer months
LSE or DR Provider Contracted Price Response
bull Varies based on contractual arrangements
bull Varies based on contractual arrangements
bull Varies based on contractual arrangements
Self-Directed Price bull Retail contract with bull Varies depending on bull Varies depending on Response exposure to real-time
market prices bull Ability to monitor real-time
prices in ERCOT wholesale market
number and severity of pricing events bull May be able to predict
peak pricing events earlier in day
number and severity of pricing events
copy 2016 ERCOT All rights reserved 11
Study on the Demand Response Potential for Seawater Desalination Projects ERCOT Public
Demand response programs in ERCOT provide opportunities for demand-side resources to defray their electricity costs and provide reliability benefits to the ERCOT electric grid Because the process of seawater desalination is energy intensive participation in demand response could help to reduce electricity costs while posing a relatively low risk to plant operations if demand response participation is factored into plant design
Participation in non-ERCOT-dispatched demand response opportunities such as reducing load during 4CP intervals or in response to real-time electricity prices may also help to reduce electricity costs for seawater desalination plants in Texas As stakeholders in Texas continue to plan for possible future droughts in the region and identify water management strategies consideration of demand response could play a role in mitigating some costs associated with seawater desalination and allow seawater desalination plants to assist with maintaining electric reliability in the region
copy 2016 ERCOT All rights reserved 12
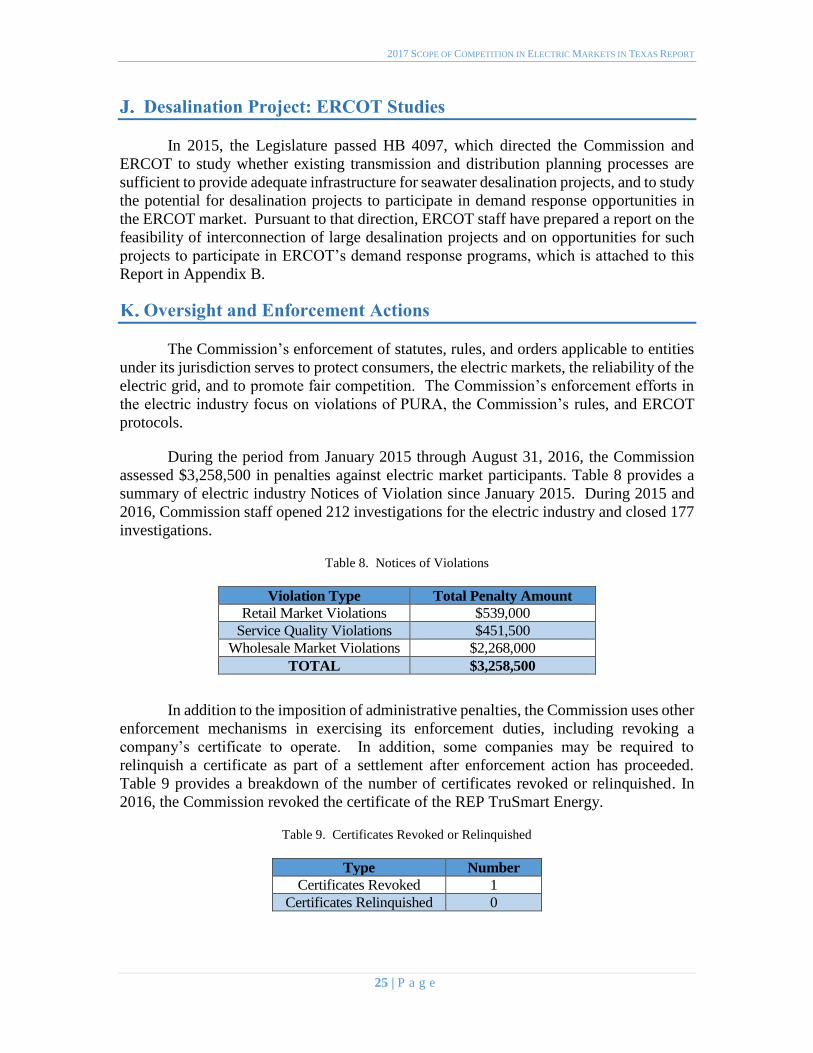
2017 SCOPE OF COMPETITION IN ELECTRIC MARKETS IN TEXAS REPORT
Desalination Project ERCOT Studies
In 2015 the Legislature passed HB 4097 which directed the Commission and
ERCOT to study whether existing transmission and distribution planning processes are
sufficient to provide adequate infrastructure for seawater desalination projects and to study
the potential for desalination projects to participate in demand response opportunities in
the ERCOT market Pursuant to that direction ERCOT staff have prepared a report on the
feasibility of interconnection of large desalination projects and on opportunities for such
projects to participate in ERCOTrsquos demand response programs which is attached to this Report in Appendix B
Oversight and Enforcement Actions
The Commissionrsquos enforcement of statutes rules and orders applicable to entities
under its jurisdiction serves to protect consumers the electric markets the reliability of the
electric grid and to promote fair competition The Commissionrsquos enforcement efforts in the electric industry focus on violations of PURA the Commissionrsquos rules and ERCOT
protocols
During the period from January 2015 through August 31 2016 the Commission
assessed $3258500 in penalties against electric market participants Table 8 provides a
summary of electric industry Notices of Violation since January 2015 During 2015 and
2016 Commission staff opened 212 investigations for the electric industry and closed 177
investigations
Table 8 Notices of Violations
Violation Type Total Penalty Amount
Retail Market Violations $539000
Service Quality Violations $451500
Wholesale Market Violations $2268000
TOTAL $3258500
In addition to the imposition of administrative penalties the Commission uses other
enforcement mechanisms in exercising its enforcement duties including revoking a
companyrsquos certificate to operate In addition some companies may be required to relinquish a certificate as part of a settlement after enforcement action has proceeded
Table 9 provides a breakdown of the number of certificates revoked or relinquished In
2016 the Commission revoked the certificate of the REP TruSmart Energy
Table 9 Certificates Revoked or Relinquished
Type Number
Certificates Revoked 1
Certificates Relinquished 0
25 | P a g e
2017 SCOPE OF COMPETITION IN ELECTRIC MARKETS IN TEXAS REPORT
The Oversight amp Enforcement division also issues warning letters to companies in
the electric market when it determines that a violation occurred but given the
circumstances surrounding the violation and other mitigating concerns no administrative
penalty is warranted During 2015 and 2016 the Oversight amp Enforcement division issued
50 warning letters Finally the Commission generally seeks to reimburse money directly
to customers when appropriate In 2015 and 2016 the Commission ordered the
reimbursement of $8543596 to Texas electric customers
Table 10 Warning Letters
Warning Letter Type Number
Retail Market Warning Letter 8
Service Quality Warning Letter 1
Wholesale Market Warning Letter 41
TOTAL 50
In addition to its enforcement activities the Commission also enters into voluntary
mitigation plans with generators that request one through a contested case proceeding
pursuant to PURA sect15023(f) and 16 TAC sect25504(e) The Commission entered into one
voluntary mitigation plan during 2015 and 2016 in Docket No 44635
Low-Income Discount System Benefit Fund
The System Benefit Fund (SBF) was originally established in 1999 to fund
discounts to low-income customers customer education activities energy-efficiency and
weatherization and electric market oversight through a nonbypassable surcharge on retail
electric bills HB 1101 of the 84th Legislature provided that the SBF be sunset on
September 1 2017 by which time the SBF is intended to be exhausted In the 2016 Fiscal
Year (FY) $325521250 was appropriated in the SBF to provide a 25ndash31 percent discount
to low-income customers over a 12-month period
To assist the drawdown of the remaining balance HB 1101 authorized the
Commission to use any unexpended SBF balance in FY 2017 to assist low-income
customers The Commission estimates that the remaining SBF balance will be
approximately $17 million by August 31 2017 The Commission has determined that this
amount is insufficient to fund the rate reduction program however the Commission will
spend approximately $100000 to continue automatic enrollment in the program to provide
REPs a list of customers eligible to receive late fee waiver and deposit installment benefits
These two ancillary benefits of the rate reduction program will continue for the duration of
FY 2017
26 | P a g e
2017 SCOPE OF COMPETITION IN ELECTRIC MARKETS IN TEXAS REPORT
Homeland Security
The Commission assesses the efforts of ERCOT and utilities to defend against
mitigate and respond to the variety of risks that the modern electricity system faces The
Commission also meets with ERCOT utilities and governmental entities on an ongoing
basis to discuss preparation for everything from hurricanes and other severe weather to
cyber-threats and threats of physical damage to the grid from accidents or intentional
malfeasance In addition the Commission monitors industry and federal programs that
address homeland security issues
The Commission serves as an information liaison between state government and
electric utilities during emergencies The Commissionrsquos main roles include
Conveying outage and service restoration information from electric utilities to
state government
Conveying service restoration priorities (hospitals water treatment facilities
etc) from state government to electric utilities and
Facilitating the clearance of downed power lines in disaster re-entry areas and
facilitating entry of electric utilities into disaster areas
The Commissionrsquos Emergency Management Response Team (EMRT) provided staff at the
State Operation Center for the May 2015 and April 2016 flooding events in Texas as well
as additional staffing for severe winter weather
Demand Response
ERCOT staff have begun to report annually on the participation of customers in
REP-sponsored demand response programs These programs which have been facilitated
by the deployment of smart meters throughout the competitive areas within ERCOT and
by many municipal and cooperative electric utilities take the form of rebates for reduction
in usage during peak period time-of-use pricing real-time volumetric price compensation
for load reduction and direct control of customer load among other plans
These programs have seen dramatic increases in participation since ERCOT began
to gather this information in 2013 From 2013 to 2014 the number of residential customers
participating in these programs increased from 151793 to 721273 and the number of
commercial and industrial customers participating rose from 30275 to 50205 The
Commission continues to monitor ERCOTrsquos stakeholder process for efforts relating to the integration of demand response
27 | P a g e
2017 SCOPE OF COMPETITION IN ELECTRIC MARKETS IN TEXAS REPORT
IV LEGISLATIVE RECOMMENDATIONS
A Determination of Low-Income Customer Eligibility
In 2015 HB 1101 required that all remaining funds in the System Benefit Fund
(SBF) be expended that the fee that funded the program as a nonbypassable surcharge on
electric bills be set at zero and that the SBF be sunset on September 1 2017 Per the
provisions of HB 1101 the SBF fee was set at zero in September 2016 concluding the
funding for the program The sunset of the SBF program also concluded the relationship
between the Texas Health and Human Services Commission (HHSC) and the Commission
in which the HHSC provided to the Commission eligible electric customers for the SBF
low-income discount Because of the termination of the relationship with HHSC with the
termination of the SBF the Commission will no longer be able to determine easily an
electric customerrsquos eligibility for other low-income programs such as late penalty waivers
and the option of paying an electric deposit over multiple months
The Legislature may wish to consider easing low-income customers access to these
low-income programs by facilitating the process used to determine eligibility The
Commission offers four possible approaches in which the Legislature could continue these
low-income programs
(1) Authorize HSSC to provide identification of eligible low-income customers to the
Commission
(2) Allow retail electric providers (REPs) to provide such low-income programs using
the Low Income Discount Administratorrsquos (LIDA) Telecommunications Lifeline
Service Program list to identify low-income customers
(3) Require REPs to offer such low-income programs with customers self-enrolling
and REPs verifying income eligibility or
(4) Allow REPs to voluntarily provide such low-income programs at their own
discretion
B Outside Counsel for Proceedings before Regional Transmission
Organizations
Regional Transmission Organizations (RTO) manage the power grid across wide
regions of the United States Most of Texas is inside the ERCOT region however there
are significant portions of East Texas and the Panhandle that are in the Midcontinent
Independent System Operator (MISO) and the Southwest Power Pool (SPP) Issues arise
in these other RTOs that have significant impact on Texas ratepayers such as how
transmission infrastructure costs will be shared These tend to be very lengthy and
complicated proceedings that require specialized legal and consulting services
28 | P a g e
2017 SCOPE OF COMPETITION IN ELECTRIC MARKETS IN TEXAS REPORT
PURA sect 394525 currently authorizes the Commission to use outside consultants
auditors engineers or attorneys to represent the Commission in proceedings before the
Federal Energy Regulatory Commission This provision has been an important tool for the
Commission to respond to complex matters in the federal arena to enable it to protect the
public interest in Texas The PUC recommends that the Legislature expand the language
in this statute to include the ability to hire outside assistance for proceedings before other
RTOs to provide those same protections to Texas ratepayers in those areas
C Repeal of Natural Gas and Renewable Energy Mandates
1 Natural Gas
PURA sect 399044 establishes natural gas as ldquothe preferential fuelrdquo in Texas for electricity generation and requires the Commission to adopt rules to establish a system of
natural gas energy trading credits The majority of all new non-renewable electricity
generation constructed since 2000 for Texas has used natural gas as a primary fuel and this
trend is expected to continue in the foreseeable future The thresholds used to trigger the
natural gas energy trading credit system in PURA sect 399044 have not been reached and
they are not expected to be reached in the foreseeable future
Because natural gas-fueled facilities have been the most commonly built new
generation in Texas for many years and are expected to continue to be there is no need to
establish incentives for natural gas generation The PUC recommends that the Legislature
consider repealing PURA sect 399044 because it is no longer necessary
2 Renewable Energy
PURA sect 39904 establishes goals for renewable energy Subsection (a) requires
the installation of 5880 megawatts of renewable energy by 2015 and Subsection (b)
establishes a renewable energy credits trading program to implement the requirement The
5880 megawatts mandates in Subsection (a) was met in 2008 While the Commission
believes the renewable energy trading credit program is needed for retail electric providers
to validate renewable energy marketing claims the Commission believes the 5880
megawatts mandate in Subsection (a) is no longer necessary
D Advisory Opinions
Many regulatory agencies in Texas have authority to issue informal guidance to the
persons they regulate particularly with respect to outlining whether a particular course of
conduct would in the agencyrsquos view be consistent with the laws and regulations that the agency administers19 The issuance of an advisory opinion can provide regulatory clarity
to a company before making investments or conducting operations the permissibility of
which may be unclear under state law The Legislature may want to consider granting the
19 In addition certain federal agencies such as the Federal Communications Commission
Internal Revenue Service Securities and Exchange Commission and Federal Election
Commission have authority to issue advisory opinions
29 | P a g e
2017 SCOPE OF COMPETITION IN ELECTRIC MARKETS IN TEXAS REPORT
Commission the authority to issue advisory opinions In the electric industry providing
clarification to a company concerning issues such as the purchase of assets or the
acquisition of another company could allow it to avoid expensive regulatory proceedings
without impairing the Commissionrsquos authority The following state agencies have statutory authority to issue advisory opinions
Texas Ethics Commission20
Texas Medical Board21
State Board of Dental Examiners22
Texas Board of Nursing23
Texas Board of Professional Engineers24
Texas Lottery Commission and25
Texas Securities Board26
E Administrative
Gross Receipts Assessment
PURA sect 16001 provides for a gross receipts assessment that is used to defray the
expenses incurred by the Commission to administer PURA An assessment of one sixth of
one percent is collected from public utilities electric cooperatives retail electric providers
and interexchange carriersrsquo gross receipts from consumers The funds from this assessment
are remitted to the general revenue fund but currently they have not been explicitly
dedicated to funding of the Commission In contrast similar assessments on water
utilities insurance companies and other regulated entities have traditionally been used to
explicitly fund the underlying regulatory programs at the respective agencies The
Commission is one of four Article VIII agencies that is not designated as self-funded
The Commission recommends that the Legislature designate the Commission as a
self-funded agency whereby the collected assessments would be explicitly dedicated to the
funding of the agency Implementing this recommendation would require the Public Utility
Commission to be included in the Appropriations Limited to Revenue Collections rider
located in the Special Provisions Relating to All Regulatory Agencies section of the
General Appropriations Act Designation as a self-leveling agency would require the
Commission to set the gross receipts assessment at a rate sufficient to generate revenue in
the amount of the agencyrsquos general revenue appropriation each fiscal year which would require a statutory change to PURA sect16001(b) Based upon the Commissionrsquos baseline budget request authorizing the PUCrsquos self-leveling designation would result in an overall
estimated tax reduction of $456 million per year or 774
20 Government Code sect 571091 21 Occupations Code sect 162107 22 Occupations Code sect 258157 23 Occupations Code sect 301607 24 Occupations Code sect 1001601 25 Occupations Code sect 2001059 26 Tex Rev Civ Stat Ann Arts 581-28-1 amp 581-35 7 Tex Admin Code 1012
30 | P a g e
2017 SCOPE OF COMPETITION IN ELECTRIC MARKETS IN TEXAS REPORT
V APPENDICES
31 | P a g e
2017 SCOPE OF COMPETITION IN ELECTRIC MARKETS IN TEXAS REPORT
Appendix A ndash Acronyms
AEP American Electric Power
AMS Advanced Metering System
CenterPoint CenterPoint Energy Houston Electric LLC
DG Distributed Generation
DRG Distributed Renewable Generation
ERCOT Electric Reliability Council of Texas
ERSC Entergy Regional State
ERS Emergency Response Service
ETI Entergy Texas Inc
IMM ERCOT Independent Market Monitor
kWh Kilowatt-hour
LMP Locational Marginal Pricing
LSP Large Service Provider
MISO Midwest Independent System Operator
MMBtu One million British Thermal Unit (BTU)
MW Megawatt
MWh Megawatt-hour
Nodal Texas Nodal Market Design
ORDC Operating Reserve Demand Curve
PGC Power Generation Company
POLR Provider of Last Resort
PURA Public Utility Regulatory Act
REP Retail Electric Provider
RSC Regional State Committee
RTO Regional Transmission Organization
SCED Security Constrained Economic Dispatch
Sharyland Sharyland Utilities LP
SBF System Benefit Fund
SPP Southwest Power Pool
TDU Transmission and Distribution Utility
TNMP Texas-New Mexico Power Company
32 | P a g e
2017 SCOPE OF COMPETITION IN ELECTRIC MARKETS IN TEXAS REPORT
Appendix B ndash ERCOT Desalination Report
This page intentionally left blank
33 | P a g e
ERCOT Public
Study on the Demand Response Potential for Seawater Desalination Projects
ERCOT November 18 2016
Study on the Demand Response Potential for Seawater Desalination Projects ERCOT Public
Executive Summary
In 2015 the 84th Texas Legislature enacted House Bill (HB) 4097 which included several provisions relating to seawater desalination projects including a requirement that the Public Utility Commission of Texas (PUC) and Electric Reliability Council of Texas (ERCOT) study the potential for seawater desalination projects to participate in existing demand response opportunities in ERCOT There are several demand response products in which demand-side resources (ie consumers of electricity) can participate These programs help to preserve system reliability and provide economic benefits to participating demand-side resources Seawater desalination is an energy-intensive process that removes salt and other minerals from salt water to produce fresh water for municipal consumption industrial use or irrigation Participation in demand response could help mitigate electricity costs for future seawater desalination projects in Texas and provide reliability benefits to the grid
There are two main demand response reliability-based services administered by ERCOT participation by demand-side resources in the Ancillary Services market and the Emergency Response Service (ERS) Within the Ancillary Services market the most common service provided by demand-side resources is Responsive Reserve Service (RRS) which requires resources to respond either instantaneously or within 10 minutes in response to unplanned system emergencies ERS is separate from ERCOTrsquos Ancillary Services market and allows demand-side resources and distributed generation to provide reliability services in the event of an energy emergency Resources can qualify for either the 10-minute or 30-minute response time ERS programs
There are several key considerations that will impact a demand-side resourcersquos ability to participate in different demand response opportunities response time recovery time predictability of electrical demand and flexibility of operations Considering these factors together it appears that seawater desalination plants could be designed to meet the requirements for participation in demand response Because the ability to meet the qualification requirements is dependent on the plant design demand response opportunities should be considered early in a projectrsquos development if participation is desirable
Whether project developers will choose to address these requirements will depend on the economic benefits of participation There may be additional costs to design seawater desalination plants to operate in the manner required in order to participate in demand response These include costs associated with additional plant design specifications need for excess capacity and storage to make up for lost production during demand response deployment operational costs resulting from interruptions to plant processes and potential financial penalties if demand response deployment results in failure to meet contract demands The interplay of the benefits of participation and these costs will determine whether it would be beneficial for a future seawater desalination plant to participate in demand response in ERCOT
To date participation of seawater desalination plants in demand response programs has been limited Because the process of seawater desalination is energy-intensive participation in demand response could help to reduce electricity costs while posing a relatively low risk to plant operations As stakeholders in Texas continue to plan for possible future droughts in the region and identify water management strategies consideration of demand response could play a role in mitigating some costs associated with seawater desalination and allow seawater desalination plants to assist with maintaining electric reliability in the region
copy 2016 ERCOT All rights reserved i
Study on the Demand Response Potential for Seawater Desalination Projects ERCOT Public
Table of Contents
1 Introduction 1
2 Seawater Desalination 2
21 Seawater Desalination Plant Operations 2
22 Seawater Desalination Plant Economics 3
3 Demand Response Opportunities in ERCOT 4
31 ERCOT-Dispatched Demand Response 4
311 Ancillary Services Markets 5
312 Emergency Response Service (ERS) 5
32 Non-ERCOT-Dispatched Demand Response 6
321 Four Coincident Peak (4CP) 6
322 LSE or DR Provider Contracted Price Response 6
323 Self-Directed Price Response 6
4 Demand Response Potential for Seawater Desalination 7
41 Operational Considerations for ERCOT-Dispatched Demand Response 7
42 Economic Considerations for ERCOT-Dispatched Demand Response 8
43 Considerations for Non-ERCOT-Dispatched Demand Response 9
5 Conclusion 11
copy 2016 ERCOT All rights reserved ii
Study on the Demand Response Potential for Seawater Desalination Projects ERCOT Public
1 Introduction
In 2015 the 84th Texas Legislature enacted House Bill (HB) 4097 which included several provisions relating to seawater desalination projects including a requirement that the Public Utility Commission of Texas (PUC) and Electric Reliability Council of Texas (ERCOT) study the potential for seawater desalination projects to participate in existing demand response opportunities in ERCOT ERCOT and the PUC initiated this study to fulfill that requirement and evaluated the operational and economic characteristics of seawater desalination plants in light of ERCOTrsquos primary demand response products1
ERCOT is the independent system operator (ISO) for the ERCOT Interconnection which encompasses approximately 90 of demand for electricity in Texas ERCOT is the independent organization established by the Texas Legislature to be responsible for the reliable planning and operation of the electric grid for the ERCOT Interconnection ERCOT also administers and maintains a forward-looking open market to provide affordable and reliable electricity to consumers in Texas In collaboration with market participants ERCOT has developed demand response products and services for customers that have the ability to reduce or modify electricity use in response to instructions or signals These programs help preserve system reliability and provide economic benefits to participating demand-side resources
The process of seawater desalination removes salt and other minerals from salt water to produce fresh water for consumption industrial processes or irrigation The drought-prone Texas climate coupled with projections for increasing water demand in the state has created interest in seawater desalination as a future water source The 2017 Texas State Water Plan includes seawater desalination as a future water management strategy for water users in the state However the seawater desalination process is energy intensive and electricity consumption can be a significant cost driver for these projects To the extent that these plants could participate in demand response it would help to defray these costs Thus there is a potential nexus between seawater desalination projects built in Texas to mitigate drought but which have large electricity requirements and ERCOT demand response opportunities which could help to reduce their electricity costs and provide reliability benefits
This study evaluates the demand response potential of seawater desalination plants based on their operational characteristics and economic drivers The report is organized as follows
Section 2 provides background on typical seawater desalination plant operations and economics
Section 3 describes the current demand response opportunities in ERCOT
Section 4 evaluates the characteristics of seawater desalination plants to determine their potential to participate in demand response opportunities in ERCOT and
Section 5 provides a summary of the conclusions of this study
1 In the course of developing this report ERCOT consulted with several desalination experts with experience with existing or planned seawater desalination plants in the US The technical experts consulted included Jorge Arroyo (Water Management Consultant) Andrew Chastain-Howley (Black amp Veatch) Jonathan Loveland (Black amp Veatch) Ron Parker (Black amp Veatch) John Wolfhope (Freese and Nichols) and Srinivas Veerapaneni (Black amp Veatch)
copy 2016 ERCOT All rights reserved 1
Study on the Demand Response Potential for Seawater Desalination Projects ERCOT Public
2 Seawater Desalination
There are two primary methods for seawater desalination distillation (also referred to as ldquothermalrdquo) and reverse osmosis Distillation uses heat to remove salts and minerals from seawater by boiling water at high pressures In contrast reverse osmosis technology forces saline water through a membrane to separate water from the salts and minerals While both distillation and reverse osmosis are energy intensive distillation requires thermal energy to heat the water and overall has a higher energy requirement whereas reverse osmosis requires primarily electrical energy and overall is less energy intensive ndash though still with significant electricity requirements
Globally most thermal desalination plants are located in the Middle East due to low energy prices in the region Plants located elsewhere including in the US typically use reverse osmosis technology2 There are two large existing seawater desalination plants in the US one in Carlsbad California providing water to the San Diego area and one in Gibsonton Florida providing water to the Tampa Bay area Both plants use reverse osmosis technology In addition there are several desalination projects currently in the planning stages or under development in Texas in the Corpus Christi area that would use reverse osmosis technology For that reason this report focuses on reverse osmosis technology in the evaluation of demand response potential of seawater desalination plants
While there are currently no existing seawater desalination plants in Texas there are several municipal and industrial brackish water desalination plants in the state According to the Texas Water Development Board (TWDB) there are 46 municipal brackish water desalination plants with capacities greater than 0025 million gallons per day (MGD) in Texas representing a total of 123 MGD of capacity3 The desalination of brackish water is typically less expensive compared to seawater due to the lower relative salinity of brackish water This study focuses exclusively on seawater desalination consistent with the requirements of HB 4097 but it should be noted that conclusions may also apply to brackish water desalination though at a different cost and scale
This section provides high-level information on the operations (Section 21) and economics (Section 22) of seawater desalination plants to inform the discussion of their demand response potential in Section 4
21 Seawater Desalination Plant Operations Seawater desalination plants typically range in capacity from less than 5 MGD up to 165 MGD For example the Carlsbad seawater desalination plant has a capacity of approximately 50 MGD and the plant in Tampa Bay has a capacity of approximately 25 MGD The associated electricity consumption ranges between 10 and 15 kWh1000 gallons produced depending on the salinity of the water being processed456 More saline water (eg seawater) requires larger amounts of electricity for desalination Thus a seawater desalination plant would have larger electricity consumption requirements compared to a similarly sized brackish water desalination plant
2 American Water ldquoInnovation Solutions within the Water Industry Desalinationrdquo Available at httpwwwamwatercomfilesInnovationsSolutionsWithinTheWaterIndustryDesalinationpdf 3 Texas Water Development Board ldquoDesalination Factsrdquo Available at httpswwwtwdbtexasgovinnovativewaterdesalfactsasp 4 American Membrane Technology Association April 2016 ldquoMembrane Desalination Power Usage Put in Perspectiverdquo Available at httpwwwamtaorgcomwp-contentuploads7_MembraneDesalinationPowerUsagePutInPerspectivepdf 5 Water Reuse Association November 2011 ldquoSeawater Desalination Power Consumptionrdquo Available at httpswatereuseorgwpshycontentuploads201510Power_consumption_white_paperpdf 6 Ghaffour N TM Missimer and G Amy January 2013 ldquoTechnical review and evaluation of the economics of water desalination Current and future challenges for better water supply sustainabilityrdquo Desalination 309 pp197-207 Available at httpswwwresearchgatenetpublication256693140_Technical_review_and_evaluation_of_the_economics_of_water_desalination_ Current_and_future_challenges_for_better_water_supply_sustainability
copy 2016 ERCOT All rights reserved 2
Study on the Demand Response Potential for Seawater Desalination Projects ERCOT Public
While the two existing seawater desalination plants in the US were co-located with power plants to ease compliance with regulations on water intake and discharge structures and reduce costs many other reverse osmosis desalination plants receive their electricity from the grid However plants may have on-site backup generation in case of a power outage This will vary depending on the size and design of the plant and other factors For example the Carlsbad plant in California does have diesel backup generation to power control systems and flushing systems in the case of a power outage The plant in Tampa Bay was not built with backup power due to potential storm surge risks from hurricanes and other storms The plant does use uninterruptible power supply (UPS) backup to power control systems during power outages
Reverse osmosis plants are typically designed with several ldquotrainsrdquo which consists of a high-pressure pump turbine and reverse osmosis membrane Desalination plants are turned on or off one train at a time in a highly controlled process The process of ramping up or down an individual train under normal operations typically takes one to two hours While plants can be designed to handle immediate shutdowns (ie in a power outage) re-starting a system after an interruption would take this amount of time In addition the saline water must be pretreated (ie filtered) before going through the reverse osmosis train and this can sometimes pose constraints on the flexibility of operations
Demand for water is the key factor driving the level of production at seawater desalination plants Typically the plant will have a contract or contracts with municipal or other water users to deliver desalinated water and is operated to meet that demand Alternatively if the plant is municipally owned it would similarly be operated to meet the level of water demand in conjunction with other available water sources If water demands are close to a plantrsquos full capacity the operatorrsquos flexibility to adjust its electricity consumption as part of demand response may be limited However this does mean that plant operations are fairly predictable on a day-to-day basis which is necessary for participation in demand response
The amount of flexibility in plant operations will also be impacted by the amount of water storage available For example if a plant has sufficient water storage on-site or storage within the customerrsquos distribution system it could provide flexibility for the plant to reduce its operations during peak hours when electricity prices are likely to be highest It would also mitigate the impacts of interruptions to production from demand response deployments
22 Seawater Desalination Plant Economics Seawater desalination is typically more expensive than other sources of water and a major driver of the overall cost is energy costs In 2016 the Carlsbad plant charged rates at between $2131 and $2367 per acre-foot78 This charge is intended to cover both the fixed costs of the plant and the variable costs to produce a unit volume of water Typically half to two thirds of the cost of providing desalinated seawater are accounted for by capital cost recovery with the remainder accounted for by operations and maintenance costs including electricity costs Electricity costs can account for 20shy25 of the total costs of seawater desalination with reverse osmosis technology9
Factors affecting the capital cost of a seawater desalination plant include plant size type of desalination process and pre-post-treatment technologies plant infrastructure (eg piping water storage backup power) and compliance with applicable regulations (eg regulations on intake structures brine byproduct disposal) A significant driver of operating and maintenance costs is membrane replacement Reverse osmosis membranes need to be replaced every few years and
7 Source San Diego County Water Authority ldquoSeawater Desalinationrdquo Available at httpwwwsdcwaorgseawater-desalination 8 Note that 1 acre-foot is approximately 325851 gallons 9 Based on technical input from Black amp Veatch
copy 2016 ERCOT All rights reserved 3
Study on the Demand Response Potential for Seawater Desalination Projects ERCOT Public
the rate at which they are replaced will depend on the salinity of the feedwater and how the plant is operated Treatment and disposal of the salty brine byproduct from desalination may also incur operating costs
Electricity costs will vary depending on a range of factors including the size of the plant type of desalination technology source of electricity and quality of the feedwater As previously noted more saline water requires higher amounts of electricity in desalination and thus the amount of electricity consumption is a key difference between brackish water and seawater desalination As a result electricity costs comprise a significant share of the costs of seawater desalination These costs could potentially be defrayed in part by participation in demand response initiatives
3 Demand Response Opportunities in ERCOT
Broadly speaking demand response can be broken down into two major categories dispatchable or non-dispatchable For purposes of this report we will define dispatchable as those demand response events that are initiated by ERCOT and non-dispatchable as an event not specifically initiated by ERCOT These non-dispatchable events may include decisions made by the end-use customer to alter its consumption pattern or may include contractual obligations with another entity such as the end-use customerrsquos retail electric provider (ldquoREPrdquo) to alter consumption patterns
ERCOTrsquos wholesale market is open to several types of dispatchable demand response which are deployed to maintain system reliability Demand-side resources providing Emergency Response Service (ERS) may offer based on either a 10 or 30-minute response time commonly referred to as the ldquoramp periodrdquo Alternatively demand-side resources may register and qualify as a Load Resource that can provide Reserves in the Ancillary Services market The most common service provided by demand-side resources is Responsive Reserve Service which requires an under-frequency relay that can instantaneously interrupt the load during certain system reliability events Some demand-side resources can also participate in other Ancillary Services as Controllable Load Resources that require sophisticated control systems that allow them to be deployed in a more incremental proportional manner
Non-dispatchable demand response in ERCOT can include a response to avoid transmission costs where rates are based on Four Coincident Peak Pricing (4CP) response to wholesale energy prices initiated by the customer or by a REP or other load-serving entity (ldquoLSErdquo) or utility-managed Load Management programs (LM)
The sections that follow provide a description of both ERCOT-dispatched (Section 31) and nonshyERCOT-dispatched (Section 32) demand response For a more detailed description of opportunities for demand-side resources to participate in demand response in ERCOT see ERCOTrsquos guide Load Participation in the ERCOT Nodal Market10
31 ERCOT-Dispatched Demand Response There are two main demand response reliability-based services administered by ERCOT participation by demand-side resources in the Ancillary Services market and participation in ERS These services are dispatched by ERCOT during system emergencies
10 Available at httpwwwercotcomcontentservicesprogramsloadLoad20Participation20in20the20ERCOT20Nodal20Market_302d oc
copy 2016 ERCOT All rights reserved 4
Study on the Demand Response Potential for Seawater Desalination Projects ERCOT Public
Demand-side resources with demand response capability that can meet a set of performance requirements can be qualified to provide Ancillary Services as Load Resources in the Ancillary Services Market The value of having a Load Resource available to reduce load is equal to the value of having a generator available to increase its generation at a generating plant The providers of operating reserves selected to provide Ancillary Services are eligible for capacity payments regardless of whether the Resource is actually deployed (or curtailed in the case of the Load Resource)
ERCOT holds auctions on a daily basis for each of the following Ancillary Services Regulation Up Regulation Down Responsive Reserve and Non-Spinning Reserve11 Table 1 describes the various Load Resource types and their qualification requirements and eligible services
Table 1 Load Resource Types and Ancillary Services
Service Load Resource Type a Qualification Responsive Reserves (le50 of total Reserve requirement)
Non Controllable Under-Frequency Relay and 10-minute ramp to manual dispatch instruction
Responsive Reserves
Controllable Primary Frequency Response and follow 5-minute dispatch instructions
Regulation-Up Regulation-Down
Controllable Primary Frequency Response and respond to Regulation deployments
Non-Spin Reserves Controllable Follow 5-minute dispatch instructions a A Controllable Load Resource is a Load Resource capable of controllably reducing or increasing consumption under dispatch control by ERCOT
Demand-side resources that agree to reduce load when directed by ERCOT and that meet other metering and operational requirements as specified in the ERCOT Protocols may participate in Ancillary Services market auctions As noted in Table 1 the type of Ancillary Service that a Load Resource may provide will depend upon the demand-side resourcersquos response time and metering system as well as other requirements described in the Protocols In the Responsive Reserve and Non-Spin Reserve markets the Load Resource will receive capacity payments regardless of whether or not the load was actually deployed but the load must be available for deployment at any time while providing the service
ERCOT procures ERS to maintain grid reliability during emergency conditions and reduce the likelihood of the need for rotating outages ERS participants may offer to provide demand response with either a 10-minute ramp period requirement (similar to Load Resources providing Responsive Reserve Service) or a 30-minute ramp period requirement ERS Resources do not have the same telemetry and under-frequency relay requirements as Load Resources
11 Regulation Up and Regulation Down service respond to signals from ERCOT every 4 seconds to respond to changes in system frequency full response has to be provided within 5 minutes Responsive reserves must provide their committed capacity either instantaneously in an under-frequency event (eg due to a generator outage) or in energy scarcity conditions within ten minutes following an instruction from ERCOT Non-spinning reserves must provide their committed capacity within 30 minutes based on economic dispatch instructions Non-spinning reserve is used as replacement reserve to replenish other ancillary services and during energy scarcity
copy 2016 ERCOT All rights reserved 5
Study on the Demand Response Potential for Seawater Desalination Projects ERCOT Public
ERS is procured through a request for proposal (RFP) process three times per year for four-month contract terms each of which is further split into smaller time periods based on business cycles and other factors Demand-side resources may choose to submit offers in all time periods or only in those that best fit their unique circumstances and may vary both the price and demand response capacity offers by time period
Payments for ERS are performed up to 80 days after each four month contract term has ended and are subject to downward revision based upon delivered demand response capacity and the demand-side resourcersquos availability during the contract term
32 Non-ERCOT-Dispatched Demand Response The options listed below are not dispatched by ERCOT but they either are controlled directly by a customer or are dispatchable by another entity such as a demand response provider (ldquoDR Providerrdquo) REP or a transmission and distribution utility
Many industrial customers are subject to transmission charges based upon a Four Coincident Peak (4CP) demand The 4CP demand is determined by averaging the consumerrsquos actual demand during the 15-minute settlement interval with the highest ERCOT demand during each of the four summer months (June through September) This measured 4CP demand serves as the basis for the customerrsquos transmission tariff charges for the following year By correctly predicting the ERCOT system peaks during the summer and curtailing load during those intervals a consumer can help reduce the stress imposed on the electric system during peak periods of consumption and reduce its transmission charges for the following calendar year
In the competitive areas of ERCOT consumers can contract with their REP or a DR Provider to have their load respond to the REPrsquos or DR Providerrsquos instructions The contract will usually outline the parameters of this response ndash at what times and frequency demand response events can be called ramp periods sustained response periods compensation etc Because this response is a contractual matter between the REP or DR Provider and the consumer a great deal of variety can be present in these arrangements For example a consumerrsquos response may be voluntary or required compensation could come in the form of reduced energy prices or rebate payments for each curtailment event consumers might be notified up to a day in advance or could have no notification at all (for automated curtailment)
In areas of ERCOT not open to competition interruptible tariffs may be available These tariffs will usually offer a reduced energy price for defined curtailment obligations
REPs may offer dynamic pricing options or consumers within a municipality or cooperative may have their energy prices determined by a published tariff which also may be structured based upon Time-of-Use (TOU) or have a Critical Peak Pricing (CPP) or Peak Time Rebate (PTR) component Self-directed price response refers to consumers making an independent decision to respond to energy prices contained in a governing tariff or in either the ERCOT Day Ahead or Real Time energy markets
TOU offerings will typically have higher energy prices during normal peak periods ndash for example a TOU tariff may charge one price during Monday through Friday from 2 pm through 8 pm and another price during all other times Customers may choose to reduce consumption during these high priced periods Load reduction can be accomplished by load shifting (loads can be shifted by
copy 2016 ERCOT All rights reserved 6
Study on the Demand Response Potential for Seawater Desalination Projects ERCOT Public
rescheduling certain processes or by utilizing thermal storage) ending certain processes that are no longer economic or through energy efficiency measures
Offerings that incorporate CPP usually have prescribed high prices only during certain defined periods ndash for example when load or prices are expected to reach a certain level Response to CPP may be similar to those employed under TOU tariffs especially if CPP is reached frequently More often CPP is infrequent and as such short-term load curtailment may be the more appropriate response to meet economic objectives
4 Demand Response Potential for Seawater Desalination
This section evaluates whether the operational characteristics and economics of seawater desalination plants would enable them to participate in one or more of the various demand response opportunities in the ERCOT Region To date participation of seawater desalination plants in demand response programs has been limited Neither the plant in Carlsbad nor the plant in Tampa Bay participate in demand response programs in California or Florida respectively However as will be described below it appears that these plants can be designed and operated to meet the requirements for participation in demand response and receive economic benefit from participation in these programs
Section 41 describes the operational parameters that must be met for a demand-side resource to provide ERCOT-dispatched demand response and evaluates the ability of seawater desalination plants to meet these criteria Section 42 discusses the tradeoffs between payments for participation in ERCOT-dispatched demand response and potential additional costs posed to seawater desalination plants Finally Section 43 presents other opportunities for seawater desalination plants to reduce their electricity costs outside of ERCOTrsquos reliability-based services that are open to demand response assets
41 Operational Considerations for ERCOT-Dispatched Demand Response There are several key operational parameters that impact a demand-side resourcersquos ability to participate in different demand response services response time recovery time predictability of electrical demand and flexibility of operations This section discusses each of these considerations as they apply to seawater desalination plants
As discussed in Section 31 one of the differentiating factors between ERCOTrsquos demand response products is the amount of time within which a demand-side resource must respond to a deployment instruction to reduce electricity consumption during an event Participation in RRS requires an automatic response within either half a second (ie instantaneous) based on grid frequency or within 10 minutes via a manual instruction ERS requires a response time of either 10 or 30 minutes As noted in Section 21 the typical time to take a reverse osmosis train on- or off-line is 1-2 hours under normal controlled operations To comply with the response time requirements of RRS or ERS a seawater desalination plant would need to be able to reduce its electricity consumption far more quickly than in normal operations This is an element of plant design that would need to be accounted for in the specifications of the project Considerations include the potential need for on-site backup generation including uninterruptible power supply potential impacts to plant infrastructure (eg piping) reverse osmosis membranes and pretreatment systems
The two large US desalination plants provide illustrative counterpoints in this respect The Carlsbad plant was designed to withstand instantaneous power interruptions and has on-site backup generation including uninterruptible power supply to provide the ability to power control systems and flush the membranes in the event of a power loss In contrast the Tampa Bay plant was not
copy 2016 ERCOT All rights reserved 7
Study on the Demand Response Potential for Seawater Desalination Projects ERCOT Public
designed with on-site backup generation and a loss of power would result in a plant shutdown and may require several days to bring the plant back on-line Thus it appears that it is technically possible for a seawater desalination plant to meet the response time requirements for participation in demand response so long as this factor is considered in the design of the facility
The time it takes a desalination train to return to operations after an event is also a consideration Demand-side resources participating in RRS must be able to come back on-line within three hours and those participating in ERS must return within 10 hours Again it appears that it is technically feasible for desalination plants to meet this requirement so long as this requirement is considered in the plant design
An additional consideration is the predictability of a demand-side resourcersquos electricity consumption Participation in the responsive reserves ancillary service market requires bidding in the day-ahead market and thus a demand-side resource must know with great accuracy (within 95) its electrical demand at least a day ahead of time For ERS auctions are held three times a year for four-month contract periods Thus to participate in ERS a resource must know its forecasted electrical demand several months in advance Because seawater desalination plant operations are driven by contracted demand for water it is likely that a plant operator would have a good idea of the plantrsquos electrical demand days or even weeksmonths in advance especially for summer months when demand is likely to be relatively steady An important consideration however is the salinity of the water which drives the electrical requirements and which can be impacted by recent weather events Similarly reductions in demand for water during non-summer months or wet summer days where demand may be reduced could also impact a plantrsquos ability to predict its electricity demand
Finally a seawater desalination plant must have sufficient flexibility in its day-to-day operations so that it can afford to lose several hours of production when deployed for demand response It should be noted that demand-side resources participating in RRS and ERS are called infrequently demand-side resources providing responsive reserves were deployed one time in 2015 and ERS was not deployed that year However this is an important factor to consider if a plant is operating at close to full capacity and would incur financial penalties if it fails to meet its contract obligations due to a demand response event Including additional storage and building a plant with extra capacity could help to mitigate this risk It should also be noted that a plant operator does not need to commit the full plant capacity to these services but rather can specify an amount of MW that will be committed Thus a plant operator could mitigate issues both with predictability and flexibility of plant operations by committing only a portion of its predicted electrical demand to participate in demand response
Considering these factors together it appears that seawater desalination plants could be designed to meet the operational requirements for participation in ERCOTrsquos demand response services (both RRS and ERS) Because the ability to meet the requirements is dependent on the plant design demand response would need to be considered early in a projectrsquos development if participation is desirable Whether project developers will choose to address these requirements will depend on the economic benefits of participation in demand response which will be discussed in the next section
42 Economic Considerations for ERCOT-Dispatched Demand Response This section describes the economic benefits to demand-side resources from participation in ERCOT-dispatched demand response programs The average price paid for a demand-side resource participating in RRS in 2015 was $1087 per MW per hour and for ERS was $645 per MW per hour for the contract periods during the 2015 program year These payments could provide a significant financial benefit to seawater desalination plants To give a simplified example for a plant with an electrical demand of 10 MW operating at a 100 annual load factor (10 MW times 24 hours times 365 days) the annual benefit would be on the order of $500000 for ERS or $1 million for RRS
copy 2016 ERCOT All rights reserved 8
Study on the Demand Response Potential for Seawater Desalination Projects ERCOT Public
In 2015 demand-side resources providing responsive reserves were deployed one time for a duration of 10 minutes and ERS was not deployed12 The most ERS was ever deployed in a single year was two times in 2011 Thus participation in either program could result in a substantial payment to a seawater desalination plant with a relatively low risk of deployment and associated disruption of plant operations although it is important to note that participation in either ERCOT service subjects demand response resources to annual unannounced testing Other than testing the frequency of deployment will depend on grid conditions and is a risk that should be considered
The financial benefits of participation must be weighed against the costs of designing facilities with the capabilities to operate in this manner These include
bull The costs to design the plant to reduce electrical demand within the required timeframes for demand response and to withstand an instantaneous interruption if not already part of the plant design For example a plant may need to be designed to have backup power generation on-site In addition there could also be costs to restart the system after an interruption
bull The costs to build a plant with excess capacity andor storage to make up for lost production hours when demand response is deployed This will add to the total capital costs of the project Land area constraints should also be considered when considering additional storage as the space requirements for the necessary storage capacity could be significant
bull Costs associated with the impact of interruptions on plant processes (eg more frequent replacement of membranes impacts to pretreatment system or plant infrastructure)
bull Potential financial penalties that would be incurred if deployment as part of demand response were to result in failure to meet contract obligations to supply water
bull The loss of potential benefits in the form of cost avoidance from participation in non-ERCOTshydispatched demand response opportunities (see Section 43) If a plant is committed to RRS or ERS the plant operator would lose the flexibility to take advantage of these other opportunities to reduce their electricity costs
The interplay of these benefits and costs will determine whether it would be beneficial for a future seawater desalination plant to participate in demand response in ERCOT
43 Considerations for Non-ERCOT-Dispatched Demand Response Outside of the reliability-based services administered by ERCOT there are other opportunities for seawater desalination plants to reduce their electricity costs As described in Section 321 seawater desalination plants may be able to reduce the demand charges on their electricity bills through curtailing load during 4CP intervals In addition plant operators may adjust operations in response to real-time electricity prices to take advantage of lower off-peak prices and avoid price spikes (see Sections 322 and 323) All of these opportunities require that the plant have flexibility to reduce production during certain times of the day
In the ERCOT region as noted above a portion of transmission and distribution charges are set based on the peak systemwide 15-minute interval of the four summer months (June through September) referred to as the four coincident peaks (4CP) Large customers can reduce or avoid this charge by reducing electrical consumption during these four peak intervals AEP Central Texas and CenterPoint are the transmission providers covering the majority of the Gulf Coast in Texas13
12 ERCOT June 2016 ldquoLoad Resource Deployment Updaterdquo Available at httpwwwercotcomcontentwcmkey_documents_lists870985_RRS_Load_Resource_Deployment_Updatepdf 13 It is also possible that a seawater desalination plant could be located in an area that as not opted in to competition in which case the plant owner would need to negotiate its electricity charges bilaterally with the Non Opt-In Entity (NOIE)
copy 2016 ERCOT All rights reserved 9
Study on the Demand Response Potential for Seawater Desalination Projects ERCOT Public
Assuming a future seawater desalination plant would be connected at transmission-level voltages the relevant 4CP charges based on the 2016 tariffs accounting for both transmission charges and transmission cost recovery factors would be $41425 per 4CP kW for AEP Central Texas and $41870 per 4CP kVA for CenterPoint14 If a seawater desalination plant has 10 MW of load and is capable of interrupting all of it and successfully does so for all four 4CP intervals the savings based on the 2016 tariffs would be approximately $500000 per year ($41425 times 1000 (kW to MW) times 10 MW times 12 months) Thus a seawater desalination plant that reduces its electricity use during the 4CP intervals could avert some or all of these charges
Another opportunity for seawater desalination plants to reduce their electricity costs is through adjusting operations in response to real-time electricity prices In 2015 the average electricity price in ERCOT was $2677MWh However prices exceeded $50MWh in 254 hours (3 of all hours) $100MWh in 88 hours (1) $200MWh in 40 hours (05) and $300MWh in 21 hours (02) Prices exceeded $3000MWh for 021 hours15 Depending on the desalination plantrsquos exposure to real-time wholesale market prices (via its retail contract) the degree of high prices the plant owner is willing to avoid and grid conditions in a given year reducing unit operations in order to avoid high electricity prices could impact operators for anywhere between a few and several hundred hours out of the year In addition a plant can plan its operations to take advantage of lower electricity prices during off-peak periods (eg at night when generation from wind is high) For example at least one company is marketing a modular desalination unit design intended to take advantage of low prices during periods of high renewables generation and to provide grid reliability services through demand response16
There are several factors to consider regarding these opportunities to reduce electricity costs The plant would need to monitor the ERCOT market or hire a contractor to do so in order to know when to reduce demand for electricity These programs do not impose any requirements on response time as with RRS or ERS and there may be sufficient warning of 4CP intervals or peak pricing to allow the plant operator to plan its operations earlier in the day with sufficient time to ramp down production under controlled conditions However quicker ramping capability may be desirable to respond to electricity price fluctuations
For 4CP because the four intervals used to set demand charges are not known ahead of time it is likely that the plant would need to reduce its demand multiple times per summer to ensure the 4CP intervals are hit impacting production at the facility Timing operations to coincide with off-peak pricing or to avoid price spikes would similarly result in reduced operations during certain hours To offset the lost production hours the plant may need to be designed with extra capacity and water storage capability to maintain the ability to meet its contractual obligations for freshwater delivery Because the period of reduced operations is greater than with ERCOT-dispatched demand response services this need would be greater for a seawater desalination plant reducing load during 4CP intervals or in response to real-time electricity prices and would increase the capital costs of the project It should also be noted that high prices in the ERCOT Region typically but not always occur in summer months when drought conditions are more likely to develop and demand for desalinated water is likely to be highest This may limit the flexibility of the plant to time its electricity consumption to avoid high-priced hours
14 Public Utility Commission of Texas ldquoTransmission and Distribution Rates for Investor Owned Utilitiesrdquo Available at httpwwwpuctexasgovindustryelectricratestdraspx 15 Potomac Economics June 2016 2015 State of the Market Report for the ERCOT Wholesale Electricity Markets Available at httpswwwpotomaceconomicscomindexphpmarkets_monitoredERCOT 16 Sisyan LLC ldquoDemand Response Desalinationrdquo Available at httprenewabledesalinationcomwpshycontentuploads201506Demand-Response-Desalinationpdf
copy 2016 ERCOT All rights reserved 10
Study on the Demand Response Potential for Seawater Desalination Projects ERCOT Public
In addition the plantrsquos ability to participate in demand response would also be limited for those hours it is reducing load as part of 4CP response or in response to real-time prices because the plant would not be able to reduce its electricity consumption if that demand is already committed to another demand response service Thus participating in demand response versus taking advantage of these other opportunities may be to some extent mutually exclusive
5 Conclusion
Based on this analysis it appears that the operational characteristics of seawater desalination plants would allow them to participate in demand response opportunities in ERCOT so long as the necessary operational requirements are considered in the design specifications of the plant Project developers should consider the necessary requirements early in the plant design Whether the economic benefits of participation would provide a sufficient incentive for them to do so will depend on the costs of accommodating those operational requirements and whether there is the flexibility available to operate the plant as necessary under these programs Though most existing seawater desalination plants do not participate in demand response programs it does appear that participation by these plants is possible and could result in a financial benefit Table 2 compares the different demand response opportunities available to demand-side resources in ERCOT
Table 2 Comparison of Demand Response Opportunities Demand Response
Opportunity Requirements for
Participation Impacts to Plant
Operations Financial Benefit Ancillary Services ndash Responsive Reserve Service (RRS)
bull Under-Frequency Relay bull Instantaneous or 10 minute
response time bull Recover load within 3
hours bull Bid in day-ahead market
bull Deployed once in 2015 for 10 minutes bull Subject to annual
unannounced testing
bull $1087 per MW per hour (based on 2015 prices)
Emergency Response Service (ERS)
bull 10 or 30 minute response time bull Recover load within 10
hours bull Four-month contract term
bull Not deployed in 2015 the most times ever deployed in a single year was twice in 2011 bull Subject to annual
unannounced testing
bull $645 per MW per hour (based on 2015 prices)
Four Coincident bull Interval Data Recorder bull Likely plant will need to bull Avoid ~$48000 per 4CP Peak (4CP) (IDR) meter
bull Ability to predict system-wide peak demand hours during summer months
reduce load multiple times per summer to hit 4CP intervals bull Likely to be able to predict
possible 4CP intervals earlier in day
MW per year (based on 2016 tariffs) if successful in reducing during all four summer months
LSE or DR Provider Contracted Price Response
bull Varies based on contractual arrangements
bull Varies based on contractual arrangements
bull Varies based on contractual arrangements
Self-Directed Price bull Retail contract with bull Varies depending on bull Varies depending on Response exposure to real-time
market prices bull Ability to monitor real-time
prices in ERCOT wholesale market
number and severity of pricing events bull May be able to predict
peak pricing events earlier in day
number and severity of pricing events
copy 2016 ERCOT All rights reserved 11
Study on the Demand Response Potential for Seawater Desalination Projects ERCOT Public
Demand response programs in ERCOT provide opportunities for demand-side resources to defray their electricity costs and provide reliability benefits to the ERCOT electric grid Because the process of seawater desalination is energy intensive participation in demand response could help to reduce electricity costs while posing a relatively low risk to plant operations if demand response participation is factored into plant design
Participation in non-ERCOT-dispatched demand response opportunities such as reducing load during 4CP intervals or in response to real-time electricity prices may also help to reduce electricity costs for seawater desalination plants in Texas As stakeholders in Texas continue to plan for possible future droughts in the region and identify water management strategies consideration of demand response could play a role in mitigating some costs associated with seawater desalination and allow seawater desalination plants to assist with maintaining electric reliability in the region
copy 2016 ERCOT All rights reserved 12
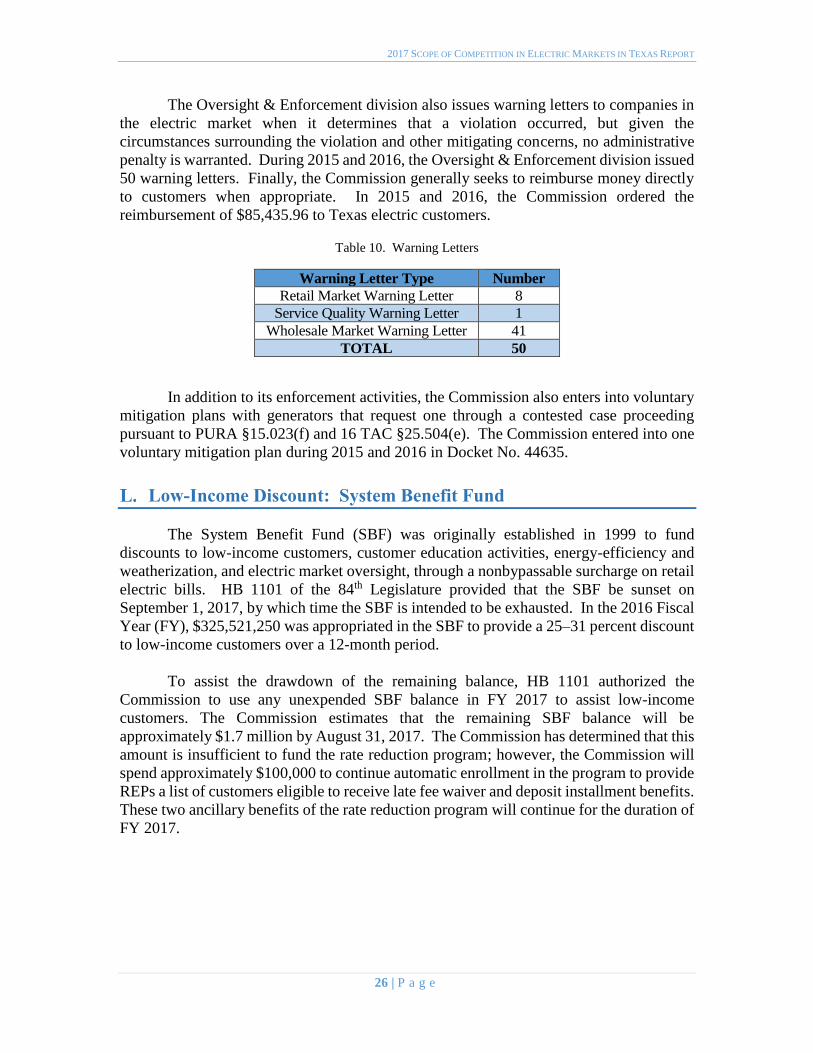
2017 SCOPE OF COMPETITION IN ELECTRIC MARKETS IN TEXAS REPORT
The Oversight amp Enforcement division also issues warning letters to companies in
the electric market when it determines that a violation occurred but given the
circumstances surrounding the violation and other mitigating concerns no administrative
penalty is warranted During 2015 and 2016 the Oversight amp Enforcement division issued
50 warning letters Finally the Commission generally seeks to reimburse money directly
to customers when appropriate In 2015 and 2016 the Commission ordered the
reimbursement of $8543596 to Texas electric customers
Table 10 Warning Letters
Warning Letter Type Number
Retail Market Warning Letter 8
Service Quality Warning Letter 1
Wholesale Market Warning Letter 41
TOTAL 50
In addition to its enforcement activities the Commission also enters into voluntary
mitigation plans with generators that request one through a contested case proceeding
pursuant to PURA sect15023(f) and 16 TAC sect25504(e) The Commission entered into one
voluntary mitigation plan during 2015 and 2016 in Docket No 44635
Low-Income Discount System Benefit Fund
The System Benefit Fund (SBF) was originally established in 1999 to fund
discounts to low-income customers customer education activities energy-efficiency and
weatherization and electric market oversight through a nonbypassable surcharge on retail
electric bills HB 1101 of the 84th Legislature provided that the SBF be sunset on
September 1 2017 by which time the SBF is intended to be exhausted In the 2016 Fiscal
Year (FY) $325521250 was appropriated in the SBF to provide a 25ndash31 percent discount
to low-income customers over a 12-month period
To assist the drawdown of the remaining balance HB 1101 authorized the
Commission to use any unexpended SBF balance in FY 2017 to assist low-income
customers The Commission estimates that the remaining SBF balance will be
approximately $17 million by August 31 2017 The Commission has determined that this
amount is insufficient to fund the rate reduction program however the Commission will
spend approximately $100000 to continue automatic enrollment in the program to provide
REPs a list of customers eligible to receive late fee waiver and deposit installment benefits
These two ancillary benefits of the rate reduction program will continue for the duration of
FY 2017
26 | P a g e
2017 SCOPE OF COMPETITION IN ELECTRIC MARKETS IN TEXAS REPORT
Homeland Security
The Commission assesses the efforts of ERCOT and utilities to defend against
mitigate and respond to the variety of risks that the modern electricity system faces The
Commission also meets with ERCOT utilities and governmental entities on an ongoing
basis to discuss preparation for everything from hurricanes and other severe weather to
cyber-threats and threats of physical damage to the grid from accidents or intentional
malfeasance In addition the Commission monitors industry and federal programs that
address homeland security issues
The Commission serves as an information liaison between state government and
electric utilities during emergencies The Commissionrsquos main roles include
Conveying outage and service restoration information from electric utilities to
state government
Conveying service restoration priorities (hospitals water treatment facilities
etc) from state government to electric utilities and
Facilitating the clearance of downed power lines in disaster re-entry areas and
facilitating entry of electric utilities into disaster areas
The Commissionrsquos Emergency Management Response Team (EMRT) provided staff at the
State Operation Center for the May 2015 and April 2016 flooding events in Texas as well
as additional staffing for severe winter weather
Demand Response
ERCOT staff have begun to report annually on the participation of customers in
REP-sponsored demand response programs These programs which have been facilitated
by the deployment of smart meters throughout the competitive areas within ERCOT and
by many municipal and cooperative electric utilities take the form of rebates for reduction
in usage during peak period time-of-use pricing real-time volumetric price compensation
for load reduction and direct control of customer load among other plans
These programs have seen dramatic increases in participation since ERCOT began
to gather this information in 2013 From 2013 to 2014 the number of residential customers
participating in these programs increased from 151793 to 721273 and the number of
commercial and industrial customers participating rose from 30275 to 50205 The
Commission continues to monitor ERCOTrsquos stakeholder process for efforts relating to the integration of demand response
27 | P a g e
2017 SCOPE OF COMPETITION IN ELECTRIC MARKETS IN TEXAS REPORT
IV LEGISLATIVE RECOMMENDATIONS
A Determination of Low-Income Customer Eligibility
In 2015 HB 1101 required that all remaining funds in the System Benefit Fund
(SBF) be expended that the fee that funded the program as a nonbypassable surcharge on
electric bills be set at zero and that the SBF be sunset on September 1 2017 Per the
provisions of HB 1101 the SBF fee was set at zero in September 2016 concluding the
funding for the program The sunset of the SBF program also concluded the relationship
between the Texas Health and Human Services Commission (HHSC) and the Commission
in which the HHSC provided to the Commission eligible electric customers for the SBF
low-income discount Because of the termination of the relationship with HHSC with the
termination of the SBF the Commission will no longer be able to determine easily an
electric customerrsquos eligibility for other low-income programs such as late penalty waivers
and the option of paying an electric deposit over multiple months
The Legislature may wish to consider easing low-income customers access to these
low-income programs by facilitating the process used to determine eligibility The
Commission offers four possible approaches in which the Legislature could continue these
low-income programs
(1) Authorize HSSC to provide identification of eligible low-income customers to the
Commission
(2) Allow retail electric providers (REPs) to provide such low-income programs using
the Low Income Discount Administratorrsquos (LIDA) Telecommunications Lifeline
Service Program list to identify low-income customers
(3) Require REPs to offer such low-income programs with customers self-enrolling
and REPs verifying income eligibility or
(4) Allow REPs to voluntarily provide such low-income programs at their own
discretion
B Outside Counsel for Proceedings before Regional Transmission
Organizations
Regional Transmission Organizations (RTO) manage the power grid across wide
regions of the United States Most of Texas is inside the ERCOT region however there
are significant portions of East Texas and the Panhandle that are in the Midcontinent
Independent System Operator (MISO) and the Southwest Power Pool (SPP) Issues arise
in these other RTOs that have significant impact on Texas ratepayers such as how
transmission infrastructure costs will be shared These tend to be very lengthy and
complicated proceedings that require specialized legal and consulting services
28 | P a g e
2017 SCOPE OF COMPETITION IN ELECTRIC MARKETS IN TEXAS REPORT
PURA sect 394525 currently authorizes the Commission to use outside consultants
auditors engineers or attorneys to represent the Commission in proceedings before the
Federal Energy Regulatory Commission This provision has been an important tool for the
Commission to respond to complex matters in the federal arena to enable it to protect the
public interest in Texas The PUC recommends that the Legislature expand the language
in this statute to include the ability to hire outside assistance for proceedings before other
RTOs to provide those same protections to Texas ratepayers in those areas
C Repeal of Natural Gas and Renewable Energy Mandates
1 Natural Gas
PURA sect 399044 establishes natural gas as ldquothe preferential fuelrdquo in Texas for electricity generation and requires the Commission to adopt rules to establish a system of
natural gas energy trading credits The majority of all new non-renewable electricity
generation constructed since 2000 for Texas has used natural gas as a primary fuel and this
trend is expected to continue in the foreseeable future The thresholds used to trigger the
natural gas energy trading credit system in PURA sect 399044 have not been reached and
they are not expected to be reached in the foreseeable future
Because natural gas-fueled facilities have been the most commonly built new
generation in Texas for many years and are expected to continue to be there is no need to
establish incentives for natural gas generation The PUC recommends that the Legislature
consider repealing PURA sect 399044 because it is no longer necessary
2 Renewable Energy
PURA sect 39904 establishes goals for renewable energy Subsection (a) requires
the installation of 5880 megawatts of renewable energy by 2015 and Subsection (b)
establishes a renewable energy credits trading program to implement the requirement The
5880 megawatts mandates in Subsection (a) was met in 2008 While the Commission
believes the renewable energy trading credit program is needed for retail electric providers
to validate renewable energy marketing claims the Commission believes the 5880
megawatts mandate in Subsection (a) is no longer necessary
D Advisory Opinions
Many regulatory agencies in Texas have authority to issue informal guidance to the
persons they regulate particularly with respect to outlining whether a particular course of
conduct would in the agencyrsquos view be consistent with the laws and regulations that the agency administers19 The issuance of an advisory opinion can provide regulatory clarity
to a company before making investments or conducting operations the permissibility of
which may be unclear under state law The Legislature may want to consider granting the
19 In addition certain federal agencies such as the Federal Communications Commission
Internal Revenue Service Securities and Exchange Commission and Federal Election
Commission have authority to issue advisory opinions
29 | P a g e
2017 SCOPE OF COMPETITION IN ELECTRIC MARKETS IN TEXAS REPORT
Commission the authority to issue advisory opinions In the electric industry providing
clarification to a company concerning issues such as the purchase of assets or the
acquisition of another company could allow it to avoid expensive regulatory proceedings
without impairing the Commissionrsquos authority The following state agencies have statutory authority to issue advisory opinions
Texas Ethics Commission20
Texas Medical Board21
State Board of Dental Examiners22
Texas Board of Nursing23
Texas Board of Professional Engineers24
Texas Lottery Commission and25
Texas Securities Board26
E Administrative
Gross Receipts Assessment
PURA sect 16001 provides for a gross receipts assessment that is used to defray the
expenses incurred by the Commission to administer PURA An assessment of one sixth of
one percent is collected from public utilities electric cooperatives retail electric providers
and interexchange carriersrsquo gross receipts from consumers The funds from this assessment
are remitted to the general revenue fund but currently they have not been explicitly
dedicated to funding of the Commission In contrast similar assessments on water
utilities insurance companies and other regulated entities have traditionally been used to
explicitly fund the underlying regulatory programs at the respective agencies The
Commission is one of four Article VIII agencies that is not designated as self-funded
The Commission recommends that the Legislature designate the Commission as a
self-funded agency whereby the collected assessments would be explicitly dedicated to the
funding of the agency Implementing this recommendation would require the Public Utility
Commission to be included in the Appropriations Limited to Revenue Collections rider
located in the Special Provisions Relating to All Regulatory Agencies section of the
General Appropriations Act Designation as a self-leveling agency would require the
Commission to set the gross receipts assessment at a rate sufficient to generate revenue in
the amount of the agencyrsquos general revenue appropriation each fiscal year which would require a statutory change to PURA sect16001(b) Based upon the Commissionrsquos baseline budget request authorizing the PUCrsquos self-leveling designation would result in an overall
estimated tax reduction of $456 million per year or 774
20 Government Code sect 571091 21 Occupations Code sect 162107 22 Occupations Code sect 258157 23 Occupations Code sect 301607 24 Occupations Code sect 1001601 25 Occupations Code sect 2001059 26 Tex Rev Civ Stat Ann Arts 581-28-1 amp 581-35 7 Tex Admin Code 1012
30 | P a g e
2017 SCOPE OF COMPETITION IN ELECTRIC MARKETS IN TEXAS REPORT
V APPENDICES
31 | P a g e
2017 SCOPE OF COMPETITION IN ELECTRIC MARKETS IN TEXAS REPORT
Appendix A ndash Acronyms
AEP American Electric Power
AMS Advanced Metering System
CenterPoint CenterPoint Energy Houston Electric LLC
DG Distributed Generation
DRG Distributed Renewable Generation
ERCOT Electric Reliability Council of Texas
ERSC Entergy Regional State
ERS Emergency Response Service
ETI Entergy Texas Inc
IMM ERCOT Independent Market Monitor
kWh Kilowatt-hour
LMP Locational Marginal Pricing
LSP Large Service Provider
MISO Midwest Independent System Operator
MMBtu One million British Thermal Unit (BTU)
MW Megawatt
MWh Megawatt-hour
Nodal Texas Nodal Market Design
ORDC Operating Reserve Demand Curve
PGC Power Generation Company
POLR Provider of Last Resort
PURA Public Utility Regulatory Act
REP Retail Electric Provider
RSC Regional State Committee
RTO Regional Transmission Organization
SCED Security Constrained Economic Dispatch
Sharyland Sharyland Utilities LP
SBF System Benefit Fund
SPP Southwest Power Pool
TDU Transmission and Distribution Utility
TNMP Texas-New Mexico Power Company
32 | P a g e
2017 SCOPE OF COMPETITION IN ELECTRIC MARKETS IN TEXAS REPORT
Appendix B ndash ERCOT Desalination Report
This page intentionally left blank
33 | P a g e
ERCOT Public
Study on the Demand Response Potential for Seawater Desalination Projects
ERCOT November 18 2016
Study on the Demand Response Potential for Seawater Desalination Projects ERCOT Public
Executive Summary
In 2015 the 84th Texas Legislature enacted House Bill (HB) 4097 which included several provisions relating to seawater desalination projects including a requirement that the Public Utility Commission of Texas (PUC) and Electric Reliability Council of Texas (ERCOT) study the potential for seawater desalination projects to participate in existing demand response opportunities in ERCOT There are several demand response products in which demand-side resources (ie consumers of electricity) can participate These programs help to preserve system reliability and provide economic benefits to participating demand-side resources Seawater desalination is an energy-intensive process that removes salt and other minerals from salt water to produce fresh water for municipal consumption industrial use or irrigation Participation in demand response could help mitigate electricity costs for future seawater desalination projects in Texas and provide reliability benefits to the grid
There are two main demand response reliability-based services administered by ERCOT participation by demand-side resources in the Ancillary Services market and the Emergency Response Service (ERS) Within the Ancillary Services market the most common service provided by demand-side resources is Responsive Reserve Service (RRS) which requires resources to respond either instantaneously or within 10 minutes in response to unplanned system emergencies ERS is separate from ERCOTrsquos Ancillary Services market and allows demand-side resources and distributed generation to provide reliability services in the event of an energy emergency Resources can qualify for either the 10-minute or 30-minute response time ERS programs
There are several key considerations that will impact a demand-side resourcersquos ability to participate in different demand response opportunities response time recovery time predictability of electrical demand and flexibility of operations Considering these factors together it appears that seawater desalination plants could be designed to meet the requirements for participation in demand response Because the ability to meet the qualification requirements is dependent on the plant design demand response opportunities should be considered early in a projectrsquos development if participation is desirable
Whether project developers will choose to address these requirements will depend on the economic benefits of participation There may be additional costs to design seawater desalination plants to operate in the manner required in order to participate in demand response These include costs associated with additional plant design specifications need for excess capacity and storage to make up for lost production during demand response deployment operational costs resulting from interruptions to plant processes and potential financial penalties if demand response deployment results in failure to meet contract demands The interplay of the benefits of participation and these costs will determine whether it would be beneficial for a future seawater desalination plant to participate in demand response in ERCOT
To date participation of seawater desalination plants in demand response programs has been limited Because the process of seawater desalination is energy-intensive participation in demand response could help to reduce electricity costs while posing a relatively low risk to plant operations As stakeholders in Texas continue to plan for possible future droughts in the region and identify water management strategies consideration of demand response could play a role in mitigating some costs associated with seawater desalination and allow seawater desalination plants to assist with maintaining electric reliability in the region
copy 2016 ERCOT All rights reserved i
Study on the Demand Response Potential for Seawater Desalination Projects ERCOT Public
Table of Contents
1 Introduction 1
2 Seawater Desalination 2
21 Seawater Desalination Plant Operations 2
22 Seawater Desalination Plant Economics 3
3 Demand Response Opportunities in ERCOT 4
31 ERCOT-Dispatched Demand Response 4
311 Ancillary Services Markets 5
312 Emergency Response Service (ERS) 5
32 Non-ERCOT-Dispatched Demand Response 6
321 Four Coincident Peak (4CP) 6
322 LSE or DR Provider Contracted Price Response 6
323 Self-Directed Price Response 6
4 Demand Response Potential for Seawater Desalination 7
41 Operational Considerations for ERCOT-Dispatched Demand Response 7
42 Economic Considerations for ERCOT-Dispatched Demand Response 8
43 Considerations for Non-ERCOT-Dispatched Demand Response 9
5 Conclusion 11
copy 2016 ERCOT All rights reserved ii
Study on the Demand Response Potential for Seawater Desalination Projects ERCOT Public
1 Introduction
In 2015 the 84th Texas Legislature enacted House Bill (HB) 4097 which included several provisions relating to seawater desalination projects including a requirement that the Public Utility Commission of Texas (PUC) and Electric Reliability Council of Texas (ERCOT) study the potential for seawater desalination projects to participate in existing demand response opportunities in ERCOT ERCOT and the PUC initiated this study to fulfill that requirement and evaluated the operational and economic characteristics of seawater desalination plants in light of ERCOTrsquos primary demand response products1
ERCOT is the independent system operator (ISO) for the ERCOT Interconnection which encompasses approximately 90 of demand for electricity in Texas ERCOT is the independent organization established by the Texas Legislature to be responsible for the reliable planning and operation of the electric grid for the ERCOT Interconnection ERCOT also administers and maintains a forward-looking open market to provide affordable and reliable electricity to consumers in Texas In collaboration with market participants ERCOT has developed demand response products and services for customers that have the ability to reduce or modify electricity use in response to instructions or signals These programs help preserve system reliability and provide economic benefits to participating demand-side resources
The process of seawater desalination removes salt and other minerals from salt water to produce fresh water for consumption industrial processes or irrigation The drought-prone Texas climate coupled with projections for increasing water demand in the state has created interest in seawater desalination as a future water source The 2017 Texas State Water Plan includes seawater desalination as a future water management strategy for water users in the state However the seawater desalination process is energy intensive and electricity consumption can be a significant cost driver for these projects To the extent that these plants could participate in demand response it would help to defray these costs Thus there is a potential nexus between seawater desalination projects built in Texas to mitigate drought but which have large electricity requirements and ERCOT demand response opportunities which could help to reduce their electricity costs and provide reliability benefits
This study evaluates the demand response potential of seawater desalination plants based on their operational characteristics and economic drivers The report is organized as follows
Section 2 provides background on typical seawater desalination plant operations and economics
Section 3 describes the current demand response opportunities in ERCOT
Section 4 evaluates the characteristics of seawater desalination plants to determine their potential to participate in demand response opportunities in ERCOT and
Section 5 provides a summary of the conclusions of this study
1 In the course of developing this report ERCOT consulted with several desalination experts with experience with existing or planned seawater desalination plants in the US The technical experts consulted included Jorge Arroyo (Water Management Consultant) Andrew Chastain-Howley (Black amp Veatch) Jonathan Loveland (Black amp Veatch) Ron Parker (Black amp Veatch) John Wolfhope (Freese and Nichols) and Srinivas Veerapaneni (Black amp Veatch)
copy 2016 ERCOT All rights reserved 1
Study on the Demand Response Potential for Seawater Desalination Projects ERCOT Public
2 Seawater Desalination
There are two primary methods for seawater desalination distillation (also referred to as ldquothermalrdquo) and reverse osmosis Distillation uses heat to remove salts and minerals from seawater by boiling water at high pressures In contrast reverse osmosis technology forces saline water through a membrane to separate water from the salts and minerals While both distillation and reverse osmosis are energy intensive distillation requires thermal energy to heat the water and overall has a higher energy requirement whereas reverse osmosis requires primarily electrical energy and overall is less energy intensive ndash though still with significant electricity requirements
Globally most thermal desalination plants are located in the Middle East due to low energy prices in the region Plants located elsewhere including in the US typically use reverse osmosis technology2 There are two large existing seawater desalination plants in the US one in Carlsbad California providing water to the San Diego area and one in Gibsonton Florida providing water to the Tampa Bay area Both plants use reverse osmosis technology In addition there are several desalination projects currently in the planning stages or under development in Texas in the Corpus Christi area that would use reverse osmosis technology For that reason this report focuses on reverse osmosis technology in the evaluation of demand response potential of seawater desalination plants
While there are currently no existing seawater desalination plants in Texas there are several municipal and industrial brackish water desalination plants in the state According to the Texas Water Development Board (TWDB) there are 46 municipal brackish water desalination plants with capacities greater than 0025 million gallons per day (MGD) in Texas representing a total of 123 MGD of capacity3 The desalination of brackish water is typically less expensive compared to seawater due to the lower relative salinity of brackish water This study focuses exclusively on seawater desalination consistent with the requirements of HB 4097 but it should be noted that conclusions may also apply to brackish water desalination though at a different cost and scale
This section provides high-level information on the operations (Section 21) and economics (Section 22) of seawater desalination plants to inform the discussion of their demand response potential in Section 4
21 Seawater Desalination Plant Operations Seawater desalination plants typically range in capacity from less than 5 MGD up to 165 MGD For example the Carlsbad seawater desalination plant has a capacity of approximately 50 MGD and the plant in Tampa Bay has a capacity of approximately 25 MGD The associated electricity consumption ranges between 10 and 15 kWh1000 gallons produced depending on the salinity of the water being processed456 More saline water (eg seawater) requires larger amounts of electricity for desalination Thus a seawater desalination plant would have larger electricity consumption requirements compared to a similarly sized brackish water desalination plant
2 American Water ldquoInnovation Solutions within the Water Industry Desalinationrdquo Available at httpwwwamwatercomfilesInnovationsSolutionsWithinTheWaterIndustryDesalinationpdf 3 Texas Water Development Board ldquoDesalination Factsrdquo Available at httpswwwtwdbtexasgovinnovativewaterdesalfactsasp 4 American Membrane Technology Association April 2016 ldquoMembrane Desalination Power Usage Put in Perspectiverdquo Available at httpwwwamtaorgcomwp-contentuploads7_MembraneDesalinationPowerUsagePutInPerspectivepdf 5 Water Reuse Association November 2011 ldquoSeawater Desalination Power Consumptionrdquo Available at httpswatereuseorgwpshycontentuploads201510Power_consumption_white_paperpdf 6 Ghaffour N TM Missimer and G Amy January 2013 ldquoTechnical review and evaluation of the economics of water desalination Current and future challenges for better water supply sustainabilityrdquo Desalination 309 pp197-207 Available at httpswwwresearchgatenetpublication256693140_Technical_review_and_evaluation_of_the_economics_of_water_desalination_ Current_and_future_challenges_for_better_water_supply_sustainability
copy 2016 ERCOT All rights reserved 2
Study on the Demand Response Potential for Seawater Desalination Projects ERCOT Public
While the two existing seawater desalination plants in the US were co-located with power plants to ease compliance with regulations on water intake and discharge structures and reduce costs many other reverse osmosis desalination plants receive their electricity from the grid However plants may have on-site backup generation in case of a power outage This will vary depending on the size and design of the plant and other factors For example the Carlsbad plant in California does have diesel backup generation to power control systems and flushing systems in the case of a power outage The plant in Tampa Bay was not built with backup power due to potential storm surge risks from hurricanes and other storms The plant does use uninterruptible power supply (UPS) backup to power control systems during power outages
Reverse osmosis plants are typically designed with several ldquotrainsrdquo which consists of a high-pressure pump turbine and reverse osmosis membrane Desalination plants are turned on or off one train at a time in a highly controlled process The process of ramping up or down an individual train under normal operations typically takes one to two hours While plants can be designed to handle immediate shutdowns (ie in a power outage) re-starting a system after an interruption would take this amount of time In addition the saline water must be pretreated (ie filtered) before going through the reverse osmosis train and this can sometimes pose constraints on the flexibility of operations
Demand for water is the key factor driving the level of production at seawater desalination plants Typically the plant will have a contract or contracts with municipal or other water users to deliver desalinated water and is operated to meet that demand Alternatively if the plant is municipally owned it would similarly be operated to meet the level of water demand in conjunction with other available water sources If water demands are close to a plantrsquos full capacity the operatorrsquos flexibility to adjust its electricity consumption as part of demand response may be limited However this does mean that plant operations are fairly predictable on a day-to-day basis which is necessary for participation in demand response
The amount of flexibility in plant operations will also be impacted by the amount of water storage available For example if a plant has sufficient water storage on-site or storage within the customerrsquos distribution system it could provide flexibility for the plant to reduce its operations during peak hours when electricity prices are likely to be highest It would also mitigate the impacts of interruptions to production from demand response deployments
22 Seawater Desalination Plant Economics Seawater desalination is typically more expensive than other sources of water and a major driver of the overall cost is energy costs In 2016 the Carlsbad plant charged rates at between $2131 and $2367 per acre-foot78 This charge is intended to cover both the fixed costs of the plant and the variable costs to produce a unit volume of water Typically half to two thirds of the cost of providing desalinated seawater are accounted for by capital cost recovery with the remainder accounted for by operations and maintenance costs including electricity costs Electricity costs can account for 20shy25 of the total costs of seawater desalination with reverse osmosis technology9
Factors affecting the capital cost of a seawater desalination plant include plant size type of desalination process and pre-post-treatment technologies plant infrastructure (eg piping water storage backup power) and compliance with applicable regulations (eg regulations on intake structures brine byproduct disposal) A significant driver of operating and maintenance costs is membrane replacement Reverse osmosis membranes need to be replaced every few years and
7 Source San Diego County Water Authority ldquoSeawater Desalinationrdquo Available at httpwwwsdcwaorgseawater-desalination 8 Note that 1 acre-foot is approximately 325851 gallons 9 Based on technical input from Black amp Veatch
copy 2016 ERCOT All rights reserved 3
Study on the Demand Response Potential for Seawater Desalination Projects ERCOT Public
the rate at which they are replaced will depend on the salinity of the feedwater and how the plant is operated Treatment and disposal of the salty brine byproduct from desalination may also incur operating costs
Electricity costs will vary depending on a range of factors including the size of the plant type of desalination technology source of electricity and quality of the feedwater As previously noted more saline water requires higher amounts of electricity in desalination and thus the amount of electricity consumption is a key difference between brackish water and seawater desalination As a result electricity costs comprise a significant share of the costs of seawater desalination These costs could potentially be defrayed in part by participation in demand response initiatives
3 Demand Response Opportunities in ERCOT
Broadly speaking demand response can be broken down into two major categories dispatchable or non-dispatchable For purposes of this report we will define dispatchable as those demand response events that are initiated by ERCOT and non-dispatchable as an event not specifically initiated by ERCOT These non-dispatchable events may include decisions made by the end-use customer to alter its consumption pattern or may include contractual obligations with another entity such as the end-use customerrsquos retail electric provider (ldquoREPrdquo) to alter consumption patterns
ERCOTrsquos wholesale market is open to several types of dispatchable demand response which are deployed to maintain system reliability Demand-side resources providing Emergency Response Service (ERS) may offer based on either a 10 or 30-minute response time commonly referred to as the ldquoramp periodrdquo Alternatively demand-side resources may register and qualify as a Load Resource that can provide Reserves in the Ancillary Services market The most common service provided by demand-side resources is Responsive Reserve Service which requires an under-frequency relay that can instantaneously interrupt the load during certain system reliability events Some demand-side resources can also participate in other Ancillary Services as Controllable Load Resources that require sophisticated control systems that allow them to be deployed in a more incremental proportional manner
Non-dispatchable demand response in ERCOT can include a response to avoid transmission costs where rates are based on Four Coincident Peak Pricing (4CP) response to wholesale energy prices initiated by the customer or by a REP or other load-serving entity (ldquoLSErdquo) or utility-managed Load Management programs (LM)
The sections that follow provide a description of both ERCOT-dispatched (Section 31) and nonshyERCOT-dispatched (Section 32) demand response For a more detailed description of opportunities for demand-side resources to participate in demand response in ERCOT see ERCOTrsquos guide Load Participation in the ERCOT Nodal Market10
31 ERCOT-Dispatched Demand Response There are two main demand response reliability-based services administered by ERCOT participation by demand-side resources in the Ancillary Services market and participation in ERS These services are dispatched by ERCOT during system emergencies
10 Available at httpwwwercotcomcontentservicesprogramsloadLoad20Participation20in20the20ERCOT20Nodal20Market_302d oc
copy 2016 ERCOT All rights reserved 4
Study on the Demand Response Potential for Seawater Desalination Projects ERCOT Public
Demand-side resources with demand response capability that can meet a set of performance requirements can be qualified to provide Ancillary Services as Load Resources in the Ancillary Services Market The value of having a Load Resource available to reduce load is equal to the value of having a generator available to increase its generation at a generating plant The providers of operating reserves selected to provide Ancillary Services are eligible for capacity payments regardless of whether the Resource is actually deployed (or curtailed in the case of the Load Resource)
ERCOT holds auctions on a daily basis for each of the following Ancillary Services Regulation Up Regulation Down Responsive Reserve and Non-Spinning Reserve11 Table 1 describes the various Load Resource types and their qualification requirements and eligible services
Table 1 Load Resource Types and Ancillary Services
Service Load Resource Type a Qualification Responsive Reserves (le50 of total Reserve requirement)
Non Controllable Under-Frequency Relay and 10-minute ramp to manual dispatch instruction
Responsive Reserves
Controllable Primary Frequency Response and follow 5-minute dispatch instructions
Regulation-Up Regulation-Down
Controllable Primary Frequency Response and respond to Regulation deployments
Non-Spin Reserves Controllable Follow 5-minute dispatch instructions a A Controllable Load Resource is a Load Resource capable of controllably reducing or increasing consumption under dispatch control by ERCOT
Demand-side resources that agree to reduce load when directed by ERCOT and that meet other metering and operational requirements as specified in the ERCOT Protocols may participate in Ancillary Services market auctions As noted in Table 1 the type of Ancillary Service that a Load Resource may provide will depend upon the demand-side resourcersquos response time and metering system as well as other requirements described in the Protocols In the Responsive Reserve and Non-Spin Reserve markets the Load Resource will receive capacity payments regardless of whether or not the load was actually deployed but the load must be available for deployment at any time while providing the service
ERCOT procures ERS to maintain grid reliability during emergency conditions and reduce the likelihood of the need for rotating outages ERS participants may offer to provide demand response with either a 10-minute ramp period requirement (similar to Load Resources providing Responsive Reserve Service) or a 30-minute ramp period requirement ERS Resources do not have the same telemetry and under-frequency relay requirements as Load Resources
11 Regulation Up and Regulation Down service respond to signals from ERCOT every 4 seconds to respond to changes in system frequency full response has to be provided within 5 minutes Responsive reserves must provide their committed capacity either instantaneously in an under-frequency event (eg due to a generator outage) or in energy scarcity conditions within ten minutes following an instruction from ERCOT Non-spinning reserves must provide their committed capacity within 30 minutes based on economic dispatch instructions Non-spinning reserve is used as replacement reserve to replenish other ancillary services and during energy scarcity
copy 2016 ERCOT All rights reserved 5
Study on the Demand Response Potential for Seawater Desalination Projects ERCOT Public
ERS is procured through a request for proposal (RFP) process three times per year for four-month contract terms each of which is further split into smaller time periods based on business cycles and other factors Demand-side resources may choose to submit offers in all time periods or only in those that best fit their unique circumstances and may vary both the price and demand response capacity offers by time period
Payments for ERS are performed up to 80 days after each four month contract term has ended and are subject to downward revision based upon delivered demand response capacity and the demand-side resourcersquos availability during the contract term
32 Non-ERCOT-Dispatched Demand Response The options listed below are not dispatched by ERCOT but they either are controlled directly by a customer or are dispatchable by another entity such as a demand response provider (ldquoDR Providerrdquo) REP or a transmission and distribution utility
Many industrial customers are subject to transmission charges based upon a Four Coincident Peak (4CP) demand The 4CP demand is determined by averaging the consumerrsquos actual demand during the 15-minute settlement interval with the highest ERCOT demand during each of the four summer months (June through September) This measured 4CP demand serves as the basis for the customerrsquos transmission tariff charges for the following year By correctly predicting the ERCOT system peaks during the summer and curtailing load during those intervals a consumer can help reduce the stress imposed on the electric system during peak periods of consumption and reduce its transmission charges for the following calendar year
In the competitive areas of ERCOT consumers can contract with their REP or a DR Provider to have their load respond to the REPrsquos or DR Providerrsquos instructions The contract will usually outline the parameters of this response ndash at what times and frequency demand response events can be called ramp periods sustained response periods compensation etc Because this response is a contractual matter between the REP or DR Provider and the consumer a great deal of variety can be present in these arrangements For example a consumerrsquos response may be voluntary or required compensation could come in the form of reduced energy prices or rebate payments for each curtailment event consumers might be notified up to a day in advance or could have no notification at all (for automated curtailment)
In areas of ERCOT not open to competition interruptible tariffs may be available These tariffs will usually offer a reduced energy price for defined curtailment obligations
REPs may offer dynamic pricing options or consumers within a municipality or cooperative may have their energy prices determined by a published tariff which also may be structured based upon Time-of-Use (TOU) or have a Critical Peak Pricing (CPP) or Peak Time Rebate (PTR) component Self-directed price response refers to consumers making an independent decision to respond to energy prices contained in a governing tariff or in either the ERCOT Day Ahead or Real Time energy markets
TOU offerings will typically have higher energy prices during normal peak periods ndash for example a TOU tariff may charge one price during Monday through Friday from 2 pm through 8 pm and another price during all other times Customers may choose to reduce consumption during these high priced periods Load reduction can be accomplished by load shifting (loads can be shifted by
copy 2016 ERCOT All rights reserved 6
Study on the Demand Response Potential for Seawater Desalination Projects ERCOT Public
rescheduling certain processes or by utilizing thermal storage) ending certain processes that are no longer economic or through energy efficiency measures
Offerings that incorporate CPP usually have prescribed high prices only during certain defined periods ndash for example when load or prices are expected to reach a certain level Response to CPP may be similar to those employed under TOU tariffs especially if CPP is reached frequently More often CPP is infrequent and as such short-term load curtailment may be the more appropriate response to meet economic objectives
4 Demand Response Potential for Seawater Desalination
This section evaluates whether the operational characteristics and economics of seawater desalination plants would enable them to participate in one or more of the various demand response opportunities in the ERCOT Region To date participation of seawater desalination plants in demand response programs has been limited Neither the plant in Carlsbad nor the plant in Tampa Bay participate in demand response programs in California or Florida respectively However as will be described below it appears that these plants can be designed and operated to meet the requirements for participation in demand response and receive economic benefit from participation in these programs
Section 41 describes the operational parameters that must be met for a demand-side resource to provide ERCOT-dispatched demand response and evaluates the ability of seawater desalination plants to meet these criteria Section 42 discusses the tradeoffs between payments for participation in ERCOT-dispatched demand response and potential additional costs posed to seawater desalination plants Finally Section 43 presents other opportunities for seawater desalination plants to reduce their electricity costs outside of ERCOTrsquos reliability-based services that are open to demand response assets
41 Operational Considerations for ERCOT-Dispatched Demand Response There are several key operational parameters that impact a demand-side resourcersquos ability to participate in different demand response services response time recovery time predictability of electrical demand and flexibility of operations This section discusses each of these considerations as they apply to seawater desalination plants
As discussed in Section 31 one of the differentiating factors between ERCOTrsquos demand response products is the amount of time within which a demand-side resource must respond to a deployment instruction to reduce electricity consumption during an event Participation in RRS requires an automatic response within either half a second (ie instantaneous) based on grid frequency or within 10 minutes via a manual instruction ERS requires a response time of either 10 or 30 minutes As noted in Section 21 the typical time to take a reverse osmosis train on- or off-line is 1-2 hours under normal controlled operations To comply with the response time requirements of RRS or ERS a seawater desalination plant would need to be able to reduce its electricity consumption far more quickly than in normal operations This is an element of plant design that would need to be accounted for in the specifications of the project Considerations include the potential need for on-site backup generation including uninterruptible power supply potential impacts to plant infrastructure (eg piping) reverse osmosis membranes and pretreatment systems
The two large US desalination plants provide illustrative counterpoints in this respect The Carlsbad plant was designed to withstand instantaneous power interruptions and has on-site backup generation including uninterruptible power supply to provide the ability to power control systems and flush the membranes in the event of a power loss In contrast the Tampa Bay plant was not
copy 2016 ERCOT All rights reserved 7
Study on the Demand Response Potential for Seawater Desalination Projects ERCOT Public
designed with on-site backup generation and a loss of power would result in a plant shutdown and may require several days to bring the plant back on-line Thus it appears that it is technically possible for a seawater desalination plant to meet the response time requirements for participation in demand response so long as this factor is considered in the design of the facility
The time it takes a desalination train to return to operations after an event is also a consideration Demand-side resources participating in RRS must be able to come back on-line within three hours and those participating in ERS must return within 10 hours Again it appears that it is technically feasible for desalination plants to meet this requirement so long as this requirement is considered in the plant design
An additional consideration is the predictability of a demand-side resourcersquos electricity consumption Participation in the responsive reserves ancillary service market requires bidding in the day-ahead market and thus a demand-side resource must know with great accuracy (within 95) its electrical demand at least a day ahead of time For ERS auctions are held three times a year for four-month contract periods Thus to participate in ERS a resource must know its forecasted electrical demand several months in advance Because seawater desalination plant operations are driven by contracted demand for water it is likely that a plant operator would have a good idea of the plantrsquos electrical demand days or even weeksmonths in advance especially for summer months when demand is likely to be relatively steady An important consideration however is the salinity of the water which drives the electrical requirements and which can be impacted by recent weather events Similarly reductions in demand for water during non-summer months or wet summer days where demand may be reduced could also impact a plantrsquos ability to predict its electricity demand
Finally a seawater desalination plant must have sufficient flexibility in its day-to-day operations so that it can afford to lose several hours of production when deployed for demand response It should be noted that demand-side resources participating in RRS and ERS are called infrequently demand-side resources providing responsive reserves were deployed one time in 2015 and ERS was not deployed that year However this is an important factor to consider if a plant is operating at close to full capacity and would incur financial penalties if it fails to meet its contract obligations due to a demand response event Including additional storage and building a plant with extra capacity could help to mitigate this risk It should also be noted that a plant operator does not need to commit the full plant capacity to these services but rather can specify an amount of MW that will be committed Thus a plant operator could mitigate issues both with predictability and flexibility of plant operations by committing only a portion of its predicted electrical demand to participate in demand response
Considering these factors together it appears that seawater desalination plants could be designed to meet the operational requirements for participation in ERCOTrsquos demand response services (both RRS and ERS) Because the ability to meet the requirements is dependent on the plant design demand response would need to be considered early in a projectrsquos development if participation is desirable Whether project developers will choose to address these requirements will depend on the economic benefits of participation in demand response which will be discussed in the next section
42 Economic Considerations for ERCOT-Dispatched Demand Response This section describes the economic benefits to demand-side resources from participation in ERCOT-dispatched demand response programs The average price paid for a demand-side resource participating in RRS in 2015 was $1087 per MW per hour and for ERS was $645 per MW per hour for the contract periods during the 2015 program year These payments could provide a significant financial benefit to seawater desalination plants To give a simplified example for a plant with an electrical demand of 10 MW operating at a 100 annual load factor (10 MW times 24 hours times 365 days) the annual benefit would be on the order of $500000 for ERS or $1 million for RRS
copy 2016 ERCOT All rights reserved 8
Study on the Demand Response Potential for Seawater Desalination Projects ERCOT Public
In 2015 demand-side resources providing responsive reserves were deployed one time for a duration of 10 minutes and ERS was not deployed12 The most ERS was ever deployed in a single year was two times in 2011 Thus participation in either program could result in a substantial payment to a seawater desalination plant with a relatively low risk of deployment and associated disruption of plant operations although it is important to note that participation in either ERCOT service subjects demand response resources to annual unannounced testing Other than testing the frequency of deployment will depend on grid conditions and is a risk that should be considered
The financial benefits of participation must be weighed against the costs of designing facilities with the capabilities to operate in this manner These include
bull The costs to design the plant to reduce electrical demand within the required timeframes for demand response and to withstand an instantaneous interruption if not already part of the plant design For example a plant may need to be designed to have backup power generation on-site In addition there could also be costs to restart the system after an interruption
bull The costs to build a plant with excess capacity andor storage to make up for lost production hours when demand response is deployed This will add to the total capital costs of the project Land area constraints should also be considered when considering additional storage as the space requirements for the necessary storage capacity could be significant
bull Costs associated with the impact of interruptions on plant processes (eg more frequent replacement of membranes impacts to pretreatment system or plant infrastructure)
bull Potential financial penalties that would be incurred if deployment as part of demand response were to result in failure to meet contract obligations to supply water
bull The loss of potential benefits in the form of cost avoidance from participation in non-ERCOTshydispatched demand response opportunities (see Section 43) If a plant is committed to RRS or ERS the plant operator would lose the flexibility to take advantage of these other opportunities to reduce their electricity costs
The interplay of these benefits and costs will determine whether it would be beneficial for a future seawater desalination plant to participate in demand response in ERCOT
43 Considerations for Non-ERCOT-Dispatched Demand Response Outside of the reliability-based services administered by ERCOT there are other opportunities for seawater desalination plants to reduce their electricity costs As described in Section 321 seawater desalination plants may be able to reduce the demand charges on their electricity bills through curtailing load during 4CP intervals In addition plant operators may adjust operations in response to real-time electricity prices to take advantage of lower off-peak prices and avoid price spikes (see Sections 322 and 323) All of these opportunities require that the plant have flexibility to reduce production during certain times of the day
In the ERCOT region as noted above a portion of transmission and distribution charges are set based on the peak systemwide 15-minute interval of the four summer months (June through September) referred to as the four coincident peaks (4CP) Large customers can reduce or avoid this charge by reducing electrical consumption during these four peak intervals AEP Central Texas and CenterPoint are the transmission providers covering the majority of the Gulf Coast in Texas13
12 ERCOT June 2016 ldquoLoad Resource Deployment Updaterdquo Available at httpwwwercotcomcontentwcmkey_documents_lists870985_RRS_Load_Resource_Deployment_Updatepdf 13 It is also possible that a seawater desalination plant could be located in an area that as not opted in to competition in which case the plant owner would need to negotiate its electricity charges bilaterally with the Non Opt-In Entity (NOIE)
copy 2016 ERCOT All rights reserved 9
Study on the Demand Response Potential for Seawater Desalination Projects ERCOT Public
Assuming a future seawater desalination plant would be connected at transmission-level voltages the relevant 4CP charges based on the 2016 tariffs accounting for both transmission charges and transmission cost recovery factors would be $41425 per 4CP kW for AEP Central Texas and $41870 per 4CP kVA for CenterPoint14 If a seawater desalination plant has 10 MW of load and is capable of interrupting all of it and successfully does so for all four 4CP intervals the savings based on the 2016 tariffs would be approximately $500000 per year ($41425 times 1000 (kW to MW) times 10 MW times 12 months) Thus a seawater desalination plant that reduces its electricity use during the 4CP intervals could avert some or all of these charges
Another opportunity for seawater desalination plants to reduce their electricity costs is through adjusting operations in response to real-time electricity prices In 2015 the average electricity price in ERCOT was $2677MWh However prices exceeded $50MWh in 254 hours (3 of all hours) $100MWh in 88 hours (1) $200MWh in 40 hours (05) and $300MWh in 21 hours (02) Prices exceeded $3000MWh for 021 hours15 Depending on the desalination plantrsquos exposure to real-time wholesale market prices (via its retail contract) the degree of high prices the plant owner is willing to avoid and grid conditions in a given year reducing unit operations in order to avoid high electricity prices could impact operators for anywhere between a few and several hundred hours out of the year In addition a plant can plan its operations to take advantage of lower electricity prices during off-peak periods (eg at night when generation from wind is high) For example at least one company is marketing a modular desalination unit design intended to take advantage of low prices during periods of high renewables generation and to provide grid reliability services through demand response16
There are several factors to consider regarding these opportunities to reduce electricity costs The plant would need to monitor the ERCOT market or hire a contractor to do so in order to know when to reduce demand for electricity These programs do not impose any requirements on response time as with RRS or ERS and there may be sufficient warning of 4CP intervals or peak pricing to allow the plant operator to plan its operations earlier in the day with sufficient time to ramp down production under controlled conditions However quicker ramping capability may be desirable to respond to electricity price fluctuations
For 4CP because the four intervals used to set demand charges are not known ahead of time it is likely that the plant would need to reduce its demand multiple times per summer to ensure the 4CP intervals are hit impacting production at the facility Timing operations to coincide with off-peak pricing or to avoid price spikes would similarly result in reduced operations during certain hours To offset the lost production hours the plant may need to be designed with extra capacity and water storage capability to maintain the ability to meet its contractual obligations for freshwater delivery Because the period of reduced operations is greater than with ERCOT-dispatched demand response services this need would be greater for a seawater desalination plant reducing load during 4CP intervals or in response to real-time electricity prices and would increase the capital costs of the project It should also be noted that high prices in the ERCOT Region typically but not always occur in summer months when drought conditions are more likely to develop and demand for desalinated water is likely to be highest This may limit the flexibility of the plant to time its electricity consumption to avoid high-priced hours
14 Public Utility Commission of Texas ldquoTransmission and Distribution Rates for Investor Owned Utilitiesrdquo Available at httpwwwpuctexasgovindustryelectricratestdraspx 15 Potomac Economics June 2016 2015 State of the Market Report for the ERCOT Wholesale Electricity Markets Available at httpswwwpotomaceconomicscomindexphpmarkets_monitoredERCOT 16 Sisyan LLC ldquoDemand Response Desalinationrdquo Available at httprenewabledesalinationcomwpshycontentuploads201506Demand-Response-Desalinationpdf
copy 2016 ERCOT All rights reserved 10
Study on the Demand Response Potential for Seawater Desalination Projects ERCOT Public
In addition the plantrsquos ability to participate in demand response would also be limited for those hours it is reducing load as part of 4CP response or in response to real-time prices because the plant would not be able to reduce its electricity consumption if that demand is already committed to another demand response service Thus participating in demand response versus taking advantage of these other opportunities may be to some extent mutually exclusive
5 Conclusion
Based on this analysis it appears that the operational characteristics of seawater desalination plants would allow them to participate in demand response opportunities in ERCOT so long as the necessary operational requirements are considered in the design specifications of the plant Project developers should consider the necessary requirements early in the plant design Whether the economic benefits of participation would provide a sufficient incentive for them to do so will depend on the costs of accommodating those operational requirements and whether there is the flexibility available to operate the plant as necessary under these programs Though most existing seawater desalination plants do not participate in demand response programs it does appear that participation by these plants is possible and could result in a financial benefit Table 2 compares the different demand response opportunities available to demand-side resources in ERCOT
Table 2 Comparison of Demand Response Opportunities Demand Response
Opportunity Requirements for
Participation Impacts to Plant
Operations Financial Benefit Ancillary Services ndash Responsive Reserve Service (RRS)
bull Under-Frequency Relay bull Instantaneous or 10 minute
response time bull Recover load within 3
hours bull Bid in day-ahead market
bull Deployed once in 2015 for 10 minutes bull Subject to annual
unannounced testing
bull $1087 per MW per hour (based on 2015 prices)
Emergency Response Service (ERS)
bull 10 or 30 minute response time bull Recover load within 10
hours bull Four-month contract term
bull Not deployed in 2015 the most times ever deployed in a single year was twice in 2011 bull Subject to annual
unannounced testing
bull $645 per MW per hour (based on 2015 prices)
Four Coincident bull Interval Data Recorder bull Likely plant will need to bull Avoid ~$48000 per 4CP Peak (4CP) (IDR) meter
bull Ability to predict system-wide peak demand hours during summer months
reduce load multiple times per summer to hit 4CP intervals bull Likely to be able to predict
possible 4CP intervals earlier in day
MW per year (based on 2016 tariffs) if successful in reducing during all four summer months
LSE or DR Provider Contracted Price Response
bull Varies based on contractual arrangements
bull Varies based on contractual arrangements
bull Varies based on contractual arrangements
Self-Directed Price bull Retail contract with bull Varies depending on bull Varies depending on Response exposure to real-time
market prices bull Ability to monitor real-time
prices in ERCOT wholesale market
number and severity of pricing events bull May be able to predict
peak pricing events earlier in day
number and severity of pricing events
copy 2016 ERCOT All rights reserved 11
Study on the Demand Response Potential for Seawater Desalination Projects ERCOT Public
Demand response programs in ERCOT provide opportunities for demand-side resources to defray their electricity costs and provide reliability benefits to the ERCOT electric grid Because the process of seawater desalination is energy intensive participation in demand response could help to reduce electricity costs while posing a relatively low risk to plant operations if demand response participation is factored into plant design
Participation in non-ERCOT-dispatched demand response opportunities such as reducing load during 4CP intervals or in response to real-time electricity prices may also help to reduce electricity costs for seawater desalination plants in Texas As stakeholders in Texas continue to plan for possible future droughts in the region and identify water management strategies consideration of demand response could play a role in mitigating some costs associated with seawater desalination and allow seawater desalination plants to assist with maintaining electric reliability in the region
copy 2016 ERCOT All rights reserved 12
2017 SCOPE OF COMPETITION IN ELECTRIC MARKETS IN TEXAS REPORT
Commission the authority to issue advisory opinions In the electric industry providing
clarification to a company concerning issues such as the purchase of assets or the
acquisition of another company could allow it to avoid expensive regulatory proceedings
without impairing the Commissionrsquos authority The following state agencies have statutory authority to issue advisory opinions
Texas Ethics Commission20
Texas Medical Board21
State Board of Dental Examiners22
Texas Board of Nursing23
Texas Board of Professional Engineers24
Texas Lottery Commission and25
Texas Securities Board26
E Administrative
Gross Receipts Assessment
PURA sect 16001 provides for a gross receipts assessment that is used to defray the
expenses incurred by the Commission to administer PURA An assessment of one sixth of
one percent is collected from public utilities electric cooperatives retail electric providers
and interexchange carriersrsquo gross receipts from consumers The funds from this assessment
are remitted to the general revenue fund but currently they have not been explicitly
dedicated to funding of the Commission In contrast similar assessments on water
utilities insurance companies and other regulated entities have traditionally been used to
explicitly fund the underlying regulatory programs at the respective agencies The
Commission is one of four Article VIII agencies that is not designated as self-funded
The Commission recommends that the Legislature designate the Commission as a
self-funded agency whereby the collected assessments would be explicitly dedicated to the
funding of the agency Implementing this recommendation would require the Public Utility
Commission to be included in the Appropriations Limited to Revenue Collections rider
located in the Special Provisions Relating to All Regulatory Agencies section of the
General Appropriations Act Designation as a self-leveling agency would require the
Commission to set the gross receipts assessment at a rate sufficient to generate revenue in
the amount of the agencyrsquos general revenue appropriation each fiscal year which would require a statutory change to PURA sect16001(b) Based upon the Commissionrsquos baseline budget request authorizing the PUCrsquos self-leveling designation would result in an overall
estimated tax reduction of $456 million per year or 774
20 Government Code sect 571091 21 Occupations Code sect 162107 22 Occupations Code sect 258157 23 Occupations Code sect 301607 24 Occupations Code sect 1001601 25 Occupations Code sect 2001059 26 Tex Rev Civ Stat Ann Arts 581-28-1 amp 581-35 7 Tex Admin Code 1012
30 | P a g e
2017 SCOPE OF COMPETITION IN ELECTRIC MARKETS IN TEXAS REPORT
V APPENDICES
31 | P a g e
2017 SCOPE OF COMPETITION IN ELECTRIC MARKETS IN TEXAS REPORT
Appendix A ndash Acronyms
AEP American Electric Power
AMS Advanced Metering System
CenterPoint CenterPoint Energy Houston Electric LLC
DG Distributed Generation
DRG Distributed Renewable Generation
ERCOT Electric Reliability Council of Texas
ERSC Entergy Regional State
ERS Emergency Response Service
ETI Entergy Texas Inc
IMM ERCOT Independent Market Monitor
kWh Kilowatt-hour
LMP Locational Marginal Pricing
LSP Large Service Provider
MISO Midwest Independent System Operator
MMBtu One million British Thermal Unit (BTU)
MW Megawatt
MWh Megawatt-hour
Nodal Texas Nodal Market Design
ORDC Operating Reserve Demand Curve
PGC Power Generation Company
POLR Provider of Last Resort
PURA Public Utility Regulatory Act
REP Retail Electric Provider
RSC Regional State Committee
RTO Regional Transmission Organization
SCED Security Constrained Economic Dispatch
Sharyland Sharyland Utilities LP
SBF System Benefit Fund
SPP Southwest Power Pool
TDU Transmission and Distribution Utility
TNMP Texas-New Mexico Power Company
32 | P a g e
2017 SCOPE OF COMPETITION IN ELECTRIC MARKETS IN TEXAS REPORT
Appendix B ndash ERCOT Desalination Report
This page intentionally left blank
33 | P a g e
ERCOT Public
Study on the Demand Response Potential for Seawater Desalination Projects
ERCOT November 18 2016
Study on the Demand Response Potential for Seawater Desalination Projects ERCOT Public
Executive Summary
In 2015 the 84th Texas Legislature enacted House Bill (HB) 4097 which included several provisions relating to seawater desalination projects including a requirement that the Public Utility Commission of Texas (PUC) and Electric Reliability Council of Texas (ERCOT) study the potential for seawater desalination projects to participate in existing demand response opportunities in ERCOT There are several demand response products in which demand-side resources (ie consumers of electricity) can participate These programs help to preserve system reliability and provide economic benefits to participating demand-side resources Seawater desalination is an energy-intensive process that removes salt and other minerals from salt water to produce fresh water for municipal consumption industrial use or irrigation Participation in demand response could help mitigate electricity costs for future seawater desalination projects in Texas and provide reliability benefits to the grid
There are two main demand response reliability-based services administered by ERCOT participation by demand-side resources in the Ancillary Services market and the Emergency Response Service (ERS) Within the Ancillary Services market the most common service provided by demand-side resources is Responsive Reserve Service (RRS) which requires resources to respond either instantaneously or within 10 minutes in response to unplanned system emergencies ERS is separate from ERCOTrsquos Ancillary Services market and allows demand-side resources and distributed generation to provide reliability services in the event of an energy emergency Resources can qualify for either the 10-minute or 30-minute response time ERS programs
There are several key considerations that will impact a demand-side resourcersquos ability to participate in different demand response opportunities response time recovery time predictability of electrical demand and flexibility of operations Considering these factors together it appears that seawater desalination plants could be designed to meet the requirements for participation in demand response Because the ability to meet the qualification requirements is dependent on the plant design demand response opportunities should be considered early in a projectrsquos development if participation is desirable
Whether project developers will choose to address these requirements will depend on the economic benefits of participation There may be additional costs to design seawater desalination plants to operate in the manner required in order to participate in demand response These include costs associated with additional plant design specifications need for excess capacity and storage to make up for lost production during demand response deployment operational costs resulting from interruptions to plant processes and potential financial penalties if demand response deployment results in failure to meet contract demands The interplay of the benefits of participation and these costs will determine whether it would be beneficial for a future seawater desalination plant to participate in demand response in ERCOT
To date participation of seawater desalination plants in demand response programs has been limited Because the process of seawater desalination is energy-intensive participation in demand response could help to reduce electricity costs while posing a relatively low risk to plant operations As stakeholders in Texas continue to plan for possible future droughts in the region and identify water management strategies consideration of demand response could play a role in mitigating some costs associated with seawater desalination and allow seawater desalination plants to assist with maintaining electric reliability in the region
copy 2016 ERCOT All rights reserved i
Study on the Demand Response Potential for Seawater Desalination Projects ERCOT Public
Table of Contents
1 Introduction 1
2 Seawater Desalination 2
21 Seawater Desalination Plant Operations 2
22 Seawater Desalination Plant Economics 3
3 Demand Response Opportunities in ERCOT 4
31 ERCOT-Dispatched Demand Response 4
311 Ancillary Services Markets 5
312 Emergency Response Service (ERS) 5
32 Non-ERCOT-Dispatched Demand Response 6
321 Four Coincident Peak (4CP) 6
322 LSE or DR Provider Contracted Price Response 6
323 Self-Directed Price Response 6
4 Demand Response Potential for Seawater Desalination 7
41 Operational Considerations for ERCOT-Dispatched Demand Response 7
42 Economic Considerations for ERCOT-Dispatched Demand Response 8
43 Considerations for Non-ERCOT-Dispatched Demand Response 9
5 Conclusion 11
copy 2016 ERCOT All rights reserved ii
Study on the Demand Response Potential for Seawater Desalination Projects ERCOT Public
1 Introduction
In 2015 the 84th Texas Legislature enacted House Bill (HB) 4097 which included several provisions relating to seawater desalination projects including a requirement that the Public Utility Commission of Texas (PUC) and Electric Reliability Council of Texas (ERCOT) study the potential for seawater desalination projects to participate in existing demand response opportunities in ERCOT ERCOT and the PUC initiated this study to fulfill that requirement and evaluated the operational and economic characteristics of seawater desalination plants in light of ERCOTrsquos primary demand response products1
ERCOT is the independent system operator (ISO) for the ERCOT Interconnection which encompasses approximately 90 of demand for electricity in Texas ERCOT is the independent organization established by the Texas Legislature to be responsible for the reliable planning and operation of the electric grid for the ERCOT Interconnection ERCOT also administers and maintains a forward-looking open market to provide affordable and reliable electricity to consumers in Texas In collaboration with market participants ERCOT has developed demand response products and services for customers that have the ability to reduce or modify electricity use in response to instructions or signals These programs help preserve system reliability and provide economic benefits to participating demand-side resources
The process of seawater desalination removes salt and other minerals from salt water to produce fresh water for consumption industrial processes or irrigation The drought-prone Texas climate coupled with projections for increasing water demand in the state has created interest in seawater desalination as a future water source The 2017 Texas State Water Plan includes seawater desalination as a future water management strategy for water users in the state However the seawater desalination process is energy intensive and electricity consumption can be a significant cost driver for these projects To the extent that these plants could participate in demand response it would help to defray these costs Thus there is a potential nexus between seawater desalination projects built in Texas to mitigate drought but which have large electricity requirements and ERCOT demand response opportunities which could help to reduce their electricity costs and provide reliability benefits
This study evaluates the demand response potential of seawater desalination plants based on their operational characteristics and economic drivers The report is organized as follows
Section 2 provides background on typical seawater desalination plant operations and economics
Section 3 describes the current demand response opportunities in ERCOT
Section 4 evaluates the characteristics of seawater desalination plants to determine their potential to participate in demand response opportunities in ERCOT and
Section 5 provides a summary of the conclusions of this study
1 In the course of developing this report ERCOT consulted with several desalination experts with experience with existing or planned seawater desalination plants in the US The technical experts consulted included Jorge Arroyo (Water Management Consultant) Andrew Chastain-Howley (Black amp Veatch) Jonathan Loveland (Black amp Veatch) Ron Parker (Black amp Veatch) John Wolfhope (Freese and Nichols) and Srinivas Veerapaneni (Black amp Veatch)
copy 2016 ERCOT All rights reserved 1
Study on the Demand Response Potential for Seawater Desalination Projects ERCOT Public
2 Seawater Desalination
There are two primary methods for seawater desalination distillation (also referred to as ldquothermalrdquo) and reverse osmosis Distillation uses heat to remove salts and minerals from seawater by boiling water at high pressures In contrast reverse osmosis technology forces saline water through a membrane to separate water from the salts and minerals While both distillation and reverse osmosis are energy intensive distillation requires thermal energy to heat the water and overall has a higher energy requirement whereas reverse osmosis requires primarily electrical energy and overall is less energy intensive ndash though still with significant electricity requirements
Globally most thermal desalination plants are located in the Middle East due to low energy prices in the region Plants located elsewhere including in the US typically use reverse osmosis technology2 There are two large existing seawater desalination plants in the US one in Carlsbad California providing water to the San Diego area and one in Gibsonton Florida providing water to the Tampa Bay area Both plants use reverse osmosis technology In addition there are several desalination projects currently in the planning stages or under development in Texas in the Corpus Christi area that would use reverse osmosis technology For that reason this report focuses on reverse osmosis technology in the evaluation of demand response potential of seawater desalination plants
While there are currently no existing seawater desalination plants in Texas there are several municipal and industrial brackish water desalination plants in the state According to the Texas Water Development Board (TWDB) there are 46 municipal brackish water desalination plants with capacities greater than 0025 million gallons per day (MGD) in Texas representing a total of 123 MGD of capacity3 The desalination of brackish water is typically less expensive compared to seawater due to the lower relative salinity of brackish water This study focuses exclusively on seawater desalination consistent with the requirements of HB 4097 but it should be noted that conclusions may also apply to brackish water desalination though at a different cost and scale
This section provides high-level information on the operations (Section 21) and economics (Section 22) of seawater desalination plants to inform the discussion of their demand response potential in Section 4
21 Seawater Desalination Plant Operations Seawater desalination plants typically range in capacity from less than 5 MGD up to 165 MGD For example the Carlsbad seawater desalination plant has a capacity of approximately 50 MGD and the plant in Tampa Bay has a capacity of approximately 25 MGD The associated electricity consumption ranges between 10 and 15 kWh1000 gallons produced depending on the salinity of the water being processed456 More saline water (eg seawater) requires larger amounts of electricity for desalination Thus a seawater desalination plant would have larger electricity consumption requirements compared to a similarly sized brackish water desalination plant
2 American Water ldquoInnovation Solutions within the Water Industry Desalinationrdquo Available at httpwwwamwatercomfilesInnovationsSolutionsWithinTheWaterIndustryDesalinationpdf 3 Texas Water Development Board ldquoDesalination Factsrdquo Available at httpswwwtwdbtexasgovinnovativewaterdesalfactsasp 4 American Membrane Technology Association April 2016 ldquoMembrane Desalination Power Usage Put in Perspectiverdquo Available at httpwwwamtaorgcomwp-contentuploads7_MembraneDesalinationPowerUsagePutInPerspectivepdf 5 Water Reuse Association November 2011 ldquoSeawater Desalination Power Consumptionrdquo Available at httpswatereuseorgwpshycontentuploads201510Power_consumption_white_paperpdf 6 Ghaffour N TM Missimer and G Amy January 2013 ldquoTechnical review and evaluation of the economics of water desalination Current and future challenges for better water supply sustainabilityrdquo Desalination 309 pp197-207 Available at httpswwwresearchgatenetpublication256693140_Technical_review_and_evaluation_of_the_economics_of_water_desalination_ Current_and_future_challenges_for_better_water_supply_sustainability
copy 2016 ERCOT All rights reserved 2
Study on the Demand Response Potential for Seawater Desalination Projects ERCOT Public
While the two existing seawater desalination plants in the US were co-located with power plants to ease compliance with regulations on water intake and discharge structures and reduce costs many other reverse osmosis desalination plants receive their electricity from the grid However plants may have on-site backup generation in case of a power outage This will vary depending on the size and design of the plant and other factors For example the Carlsbad plant in California does have diesel backup generation to power control systems and flushing systems in the case of a power outage The plant in Tampa Bay was not built with backup power due to potential storm surge risks from hurricanes and other storms The plant does use uninterruptible power supply (UPS) backup to power control systems during power outages
Reverse osmosis plants are typically designed with several ldquotrainsrdquo which consists of a high-pressure pump turbine and reverse osmosis membrane Desalination plants are turned on or off one train at a time in a highly controlled process The process of ramping up or down an individual train under normal operations typically takes one to two hours While plants can be designed to handle immediate shutdowns (ie in a power outage) re-starting a system after an interruption would take this amount of time In addition the saline water must be pretreated (ie filtered) before going through the reverse osmosis train and this can sometimes pose constraints on the flexibility of operations
Demand for water is the key factor driving the level of production at seawater desalination plants Typically the plant will have a contract or contracts with municipal or other water users to deliver desalinated water and is operated to meet that demand Alternatively if the plant is municipally owned it would similarly be operated to meet the level of water demand in conjunction with other available water sources If water demands are close to a plantrsquos full capacity the operatorrsquos flexibility to adjust its electricity consumption as part of demand response may be limited However this does mean that plant operations are fairly predictable on a day-to-day basis which is necessary for participation in demand response
The amount of flexibility in plant operations will also be impacted by the amount of water storage available For example if a plant has sufficient water storage on-site or storage within the customerrsquos distribution system it could provide flexibility for the plant to reduce its operations during peak hours when electricity prices are likely to be highest It would also mitigate the impacts of interruptions to production from demand response deployments
22 Seawater Desalination Plant Economics Seawater desalination is typically more expensive than other sources of water and a major driver of the overall cost is energy costs In 2016 the Carlsbad plant charged rates at between $2131 and $2367 per acre-foot78 This charge is intended to cover both the fixed costs of the plant and the variable costs to produce a unit volume of water Typically half to two thirds of the cost of providing desalinated seawater are accounted for by capital cost recovery with the remainder accounted for by operations and maintenance costs including electricity costs Electricity costs can account for 20shy25 of the total costs of seawater desalination with reverse osmosis technology9
Factors affecting the capital cost of a seawater desalination plant include plant size type of desalination process and pre-post-treatment technologies plant infrastructure (eg piping water storage backup power) and compliance with applicable regulations (eg regulations on intake structures brine byproduct disposal) A significant driver of operating and maintenance costs is membrane replacement Reverse osmosis membranes need to be replaced every few years and
7 Source San Diego County Water Authority ldquoSeawater Desalinationrdquo Available at httpwwwsdcwaorgseawater-desalination 8 Note that 1 acre-foot is approximately 325851 gallons 9 Based on technical input from Black amp Veatch
copy 2016 ERCOT All rights reserved 3
Study on the Demand Response Potential for Seawater Desalination Projects ERCOT Public
the rate at which they are replaced will depend on the salinity of the feedwater and how the plant is operated Treatment and disposal of the salty brine byproduct from desalination may also incur operating costs
Electricity costs will vary depending on a range of factors including the size of the plant type of desalination technology source of electricity and quality of the feedwater As previously noted more saline water requires higher amounts of electricity in desalination and thus the amount of electricity consumption is a key difference between brackish water and seawater desalination As a result electricity costs comprise a significant share of the costs of seawater desalination These costs could potentially be defrayed in part by participation in demand response initiatives
3 Demand Response Opportunities in ERCOT
Broadly speaking demand response can be broken down into two major categories dispatchable or non-dispatchable For purposes of this report we will define dispatchable as those demand response events that are initiated by ERCOT and non-dispatchable as an event not specifically initiated by ERCOT These non-dispatchable events may include decisions made by the end-use customer to alter its consumption pattern or may include contractual obligations with another entity such as the end-use customerrsquos retail electric provider (ldquoREPrdquo) to alter consumption patterns
ERCOTrsquos wholesale market is open to several types of dispatchable demand response which are deployed to maintain system reliability Demand-side resources providing Emergency Response Service (ERS) may offer based on either a 10 or 30-minute response time commonly referred to as the ldquoramp periodrdquo Alternatively demand-side resources may register and qualify as a Load Resource that can provide Reserves in the Ancillary Services market The most common service provided by demand-side resources is Responsive Reserve Service which requires an under-frequency relay that can instantaneously interrupt the load during certain system reliability events Some demand-side resources can also participate in other Ancillary Services as Controllable Load Resources that require sophisticated control systems that allow them to be deployed in a more incremental proportional manner
Non-dispatchable demand response in ERCOT can include a response to avoid transmission costs where rates are based on Four Coincident Peak Pricing (4CP) response to wholesale energy prices initiated by the customer or by a REP or other load-serving entity (ldquoLSErdquo) or utility-managed Load Management programs (LM)
The sections that follow provide a description of both ERCOT-dispatched (Section 31) and nonshyERCOT-dispatched (Section 32) demand response For a more detailed description of opportunities for demand-side resources to participate in demand response in ERCOT see ERCOTrsquos guide Load Participation in the ERCOT Nodal Market10
31 ERCOT-Dispatched Demand Response There are two main demand response reliability-based services administered by ERCOT participation by demand-side resources in the Ancillary Services market and participation in ERS These services are dispatched by ERCOT during system emergencies
10 Available at httpwwwercotcomcontentservicesprogramsloadLoad20Participation20in20the20ERCOT20Nodal20Market_302d oc
copy 2016 ERCOT All rights reserved 4
Study on the Demand Response Potential for Seawater Desalination Projects ERCOT Public
Demand-side resources with demand response capability that can meet a set of performance requirements can be qualified to provide Ancillary Services as Load Resources in the Ancillary Services Market The value of having a Load Resource available to reduce load is equal to the value of having a generator available to increase its generation at a generating plant The providers of operating reserves selected to provide Ancillary Services are eligible for capacity payments regardless of whether the Resource is actually deployed (or curtailed in the case of the Load Resource)
ERCOT holds auctions on a daily basis for each of the following Ancillary Services Regulation Up Regulation Down Responsive Reserve and Non-Spinning Reserve11 Table 1 describes the various Load Resource types and their qualification requirements and eligible services
Table 1 Load Resource Types and Ancillary Services
Service Load Resource Type a Qualification Responsive Reserves (le50 of total Reserve requirement)
Non Controllable Under-Frequency Relay and 10-minute ramp to manual dispatch instruction
Responsive Reserves
Controllable Primary Frequency Response and follow 5-minute dispatch instructions
Regulation-Up Regulation-Down
Controllable Primary Frequency Response and respond to Regulation deployments
Non-Spin Reserves Controllable Follow 5-minute dispatch instructions a A Controllable Load Resource is a Load Resource capable of controllably reducing or increasing consumption under dispatch control by ERCOT
Demand-side resources that agree to reduce load when directed by ERCOT and that meet other metering and operational requirements as specified in the ERCOT Protocols may participate in Ancillary Services market auctions As noted in Table 1 the type of Ancillary Service that a Load Resource may provide will depend upon the demand-side resourcersquos response time and metering system as well as other requirements described in the Protocols In the Responsive Reserve and Non-Spin Reserve markets the Load Resource will receive capacity payments regardless of whether or not the load was actually deployed but the load must be available for deployment at any time while providing the service
ERCOT procures ERS to maintain grid reliability during emergency conditions and reduce the likelihood of the need for rotating outages ERS participants may offer to provide demand response with either a 10-minute ramp period requirement (similar to Load Resources providing Responsive Reserve Service) or a 30-minute ramp period requirement ERS Resources do not have the same telemetry and under-frequency relay requirements as Load Resources
11 Regulation Up and Regulation Down service respond to signals from ERCOT every 4 seconds to respond to changes in system frequency full response has to be provided within 5 minutes Responsive reserves must provide their committed capacity either instantaneously in an under-frequency event (eg due to a generator outage) or in energy scarcity conditions within ten minutes following an instruction from ERCOT Non-spinning reserves must provide their committed capacity within 30 minutes based on economic dispatch instructions Non-spinning reserve is used as replacement reserve to replenish other ancillary services and during energy scarcity
copy 2016 ERCOT All rights reserved 5
Study on the Demand Response Potential for Seawater Desalination Projects ERCOT Public
ERS is procured through a request for proposal (RFP) process three times per year for four-month contract terms each of which is further split into smaller time periods based on business cycles and other factors Demand-side resources may choose to submit offers in all time periods or only in those that best fit their unique circumstances and may vary both the price and demand response capacity offers by time period
Payments for ERS are performed up to 80 days after each four month contract term has ended and are subject to downward revision based upon delivered demand response capacity and the demand-side resourcersquos availability during the contract term
32 Non-ERCOT-Dispatched Demand Response The options listed below are not dispatched by ERCOT but they either are controlled directly by a customer or are dispatchable by another entity such as a demand response provider (ldquoDR Providerrdquo) REP or a transmission and distribution utility
Many industrial customers are subject to transmission charges based upon a Four Coincident Peak (4CP) demand The 4CP demand is determined by averaging the consumerrsquos actual demand during the 15-minute settlement interval with the highest ERCOT demand during each of the four summer months (June through September) This measured 4CP demand serves as the basis for the customerrsquos transmission tariff charges for the following year By correctly predicting the ERCOT system peaks during the summer and curtailing load during those intervals a consumer can help reduce the stress imposed on the electric system during peak periods of consumption and reduce its transmission charges for the following calendar year
In the competitive areas of ERCOT consumers can contract with their REP or a DR Provider to have their load respond to the REPrsquos or DR Providerrsquos instructions The contract will usually outline the parameters of this response ndash at what times and frequency demand response events can be called ramp periods sustained response periods compensation etc Because this response is a contractual matter between the REP or DR Provider and the consumer a great deal of variety can be present in these arrangements For example a consumerrsquos response may be voluntary or required compensation could come in the form of reduced energy prices or rebate payments for each curtailment event consumers might be notified up to a day in advance or could have no notification at all (for automated curtailment)
In areas of ERCOT not open to competition interruptible tariffs may be available These tariffs will usually offer a reduced energy price for defined curtailment obligations
REPs may offer dynamic pricing options or consumers within a municipality or cooperative may have their energy prices determined by a published tariff which also may be structured based upon Time-of-Use (TOU) or have a Critical Peak Pricing (CPP) or Peak Time Rebate (PTR) component Self-directed price response refers to consumers making an independent decision to respond to energy prices contained in a governing tariff or in either the ERCOT Day Ahead or Real Time energy markets
TOU offerings will typically have higher energy prices during normal peak periods ndash for example a TOU tariff may charge one price during Monday through Friday from 2 pm through 8 pm and another price during all other times Customers may choose to reduce consumption during these high priced periods Load reduction can be accomplished by load shifting (loads can be shifted by
copy 2016 ERCOT All rights reserved 6
Study on the Demand Response Potential for Seawater Desalination Projects ERCOT Public
rescheduling certain processes or by utilizing thermal storage) ending certain processes that are no longer economic or through energy efficiency measures
Offerings that incorporate CPP usually have prescribed high prices only during certain defined periods ndash for example when load or prices are expected to reach a certain level Response to CPP may be similar to those employed under TOU tariffs especially if CPP is reached frequently More often CPP is infrequent and as such short-term load curtailment may be the more appropriate response to meet economic objectives
4 Demand Response Potential for Seawater Desalination
This section evaluates whether the operational characteristics and economics of seawater desalination plants would enable them to participate in one or more of the various demand response opportunities in the ERCOT Region To date participation of seawater desalination plants in demand response programs has been limited Neither the plant in Carlsbad nor the plant in Tampa Bay participate in demand response programs in California or Florida respectively However as will be described below it appears that these plants can be designed and operated to meet the requirements for participation in demand response and receive economic benefit from participation in these programs
Section 41 describes the operational parameters that must be met for a demand-side resource to provide ERCOT-dispatched demand response and evaluates the ability of seawater desalination plants to meet these criteria Section 42 discusses the tradeoffs between payments for participation in ERCOT-dispatched demand response and potential additional costs posed to seawater desalination plants Finally Section 43 presents other opportunities for seawater desalination plants to reduce their electricity costs outside of ERCOTrsquos reliability-based services that are open to demand response assets
41 Operational Considerations for ERCOT-Dispatched Demand Response There are several key operational parameters that impact a demand-side resourcersquos ability to participate in different demand response services response time recovery time predictability of electrical demand and flexibility of operations This section discusses each of these considerations as they apply to seawater desalination plants
As discussed in Section 31 one of the differentiating factors between ERCOTrsquos demand response products is the amount of time within which a demand-side resource must respond to a deployment instruction to reduce electricity consumption during an event Participation in RRS requires an automatic response within either half a second (ie instantaneous) based on grid frequency or within 10 minutes via a manual instruction ERS requires a response time of either 10 or 30 minutes As noted in Section 21 the typical time to take a reverse osmosis train on- or off-line is 1-2 hours under normal controlled operations To comply with the response time requirements of RRS or ERS a seawater desalination plant would need to be able to reduce its electricity consumption far more quickly than in normal operations This is an element of plant design that would need to be accounted for in the specifications of the project Considerations include the potential need for on-site backup generation including uninterruptible power supply potential impacts to plant infrastructure (eg piping) reverse osmosis membranes and pretreatment systems
The two large US desalination plants provide illustrative counterpoints in this respect The Carlsbad plant was designed to withstand instantaneous power interruptions and has on-site backup generation including uninterruptible power supply to provide the ability to power control systems and flush the membranes in the event of a power loss In contrast the Tampa Bay plant was not
copy 2016 ERCOT All rights reserved 7
Study on the Demand Response Potential for Seawater Desalination Projects ERCOT Public
designed with on-site backup generation and a loss of power would result in a plant shutdown and may require several days to bring the plant back on-line Thus it appears that it is technically possible for a seawater desalination plant to meet the response time requirements for participation in demand response so long as this factor is considered in the design of the facility
The time it takes a desalination train to return to operations after an event is also a consideration Demand-side resources participating in RRS must be able to come back on-line within three hours and those participating in ERS must return within 10 hours Again it appears that it is technically feasible for desalination plants to meet this requirement so long as this requirement is considered in the plant design
An additional consideration is the predictability of a demand-side resourcersquos electricity consumption Participation in the responsive reserves ancillary service market requires bidding in the day-ahead market and thus a demand-side resource must know with great accuracy (within 95) its electrical demand at least a day ahead of time For ERS auctions are held three times a year for four-month contract periods Thus to participate in ERS a resource must know its forecasted electrical demand several months in advance Because seawater desalination plant operations are driven by contracted demand for water it is likely that a plant operator would have a good idea of the plantrsquos electrical demand days or even weeksmonths in advance especially for summer months when demand is likely to be relatively steady An important consideration however is the salinity of the water which drives the electrical requirements and which can be impacted by recent weather events Similarly reductions in demand for water during non-summer months or wet summer days where demand may be reduced could also impact a plantrsquos ability to predict its electricity demand
Finally a seawater desalination plant must have sufficient flexibility in its day-to-day operations so that it can afford to lose several hours of production when deployed for demand response It should be noted that demand-side resources participating in RRS and ERS are called infrequently demand-side resources providing responsive reserves were deployed one time in 2015 and ERS was not deployed that year However this is an important factor to consider if a plant is operating at close to full capacity and would incur financial penalties if it fails to meet its contract obligations due to a demand response event Including additional storage and building a plant with extra capacity could help to mitigate this risk It should also be noted that a plant operator does not need to commit the full plant capacity to these services but rather can specify an amount of MW that will be committed Thus a plant operator could mitigate issues both with predictability and flexibility of plant operations by committing only a portion of its predicted electrical demand to participate in demand response
Considering these factors together it appears that seawater desalination plants could be designed to meet the operational requirements for participation in ERCOTrsquos demand response services (both RRS and ERS) Because the ability to meet the requirements is dependent on the plant design demand response would need to be considered early in a projectrsquos development if participation is desirable Whether project developers will choose to address these requirements will depend on the economic benefits of participation in demand response which will be discussed in the next section
42 Economic Considerations for ERCOT-Dispatched Demand Response This section describes the economic benefits to demand-side resources from participation in ERCOT-dispatched demand response programs The average price paid for a demand-side resource participating in RRS in 2015 was $1087 per MW per hour and for ERS was $645 per MW per hour for the contract periods during the 2015 program year These payments could provide a significant financial benefit to seawater desalination plants To give a simplified example for a plant with an electrical demand of 10 MW operating at a 100 annual load factor (10 MW times 24 hours times 365 days) the annual benefit would be on the order of $500000 for ERS or $1 million for RRS
copy 2016 ERCOT All rights reserved 8
Study on the Demand Response Potential for Seawater Desalination Projects ERCOT Public
In 2015 demand-side resources providing responsive reserves were deployed one time for a duration of 10 minutes and ERS was not deployed12 The most ERS was ever deployed in a single year was two times in 2011 Thus participation in either program could result in a substantial payment to a seawater desalination plant with a relatively low risk of deployment and associated disruption of plant operations although it is important to note that participation in either ERCOT service subjects demand response resources to annual unannounced testing Other than testing the frequency of deployment will depend on grid conditions and is a risk that should be considered
The financial benefits of participation must be weighed against the costs of designing facilities with the capabilities to operate in this manner These include
bull The costs to design the plant to reduce electrical demand within the required timeframes for demand response and to withstand an instantaneous interruption if not already part of the plant design For example a plant may need to be designed to have backup power generation on-site In addition there could also be costs to restart the system after an interruption
bull The costs to build a plant with excess capacity andor storage to make up for lost production hours when demand response is deployed This will add to the total capital costs of the project Land area constraints should also be considered when considering additional storage as the space requirements for the necessary storage capacity could be significant
bull Costs associated with the impact of interruptions on plant processes (eg more frequent replacement of membranes impacts to pretreatment system or plant infrastructure)
bull Potential financial penalties that would be incurred if deployment as part of demand response were to result in failure to meet contract obligations to supply water
bull The loss of potential benefits in the form of cost avoidance from participation in non-ERCOTshydispatched demand response opportunities (see Section 43) If a plant is committed to RRS or ERS the plant operator would lose the flexibility to take advantage of these other opportunities to reduce their electricity costs
The interplay of these benefits and costs will determine whether it would be beneficial for a future seawater desalination plant to participate in demand response in ERCOT
43 Considerations for Non-ERCOT-Dispatched Demand Response Outside of the reliability-based services administered by ERCOT there are other opportunities for seawater desalination plants to reduce their electricity costs As described in Section 321 seawater desalination plants may be able to reduce the demand charges on their electricity bills through curtailing load during 4CP intervals In addition plant operators may adjust operations in response to real-time electricity prices to take advantage of lower off-peak prices and avoid price spikes (see Sections 322 and 323) All of these opportunities require that the plant have flexibility to reduce production during certain times of the day
In the ERCOT region as noted above a portion of transmission and distribution charges are set based on the peak systemwide 15-minute interval of the four summer months (June through September) referred to as the four coincident peaks (4CP) Large customers can reduce or avoid this charge by reducing electrical consumption during these four peak intervals AEP Central Texas and CenterPoint are the transmission providers covering the majority of the Gulf Coast in Texas13
12 ERCOT June 2016 ldquoLoad Resource Deployment Updaterdquo Available at httpwwwercotcomcontentwcmkey_documents_lists870985_RRS_Load_Resource_Deployment_Updatepdf 13 It is also possible that a seawater desalination plant could be located in an area that as not opted in to competition in which case the plant owner would need to negotiate its electricity charges bilaterally with the Non Opt-In Entity (NOIE)
copy 2016 ERCOT All rights reserved 9
Study on the Demand Response Potential for Seawater Desalination Projects ERCOT Public
Assuming a future seawater desalination plant would be connected at transmission-level voltages the relevant 4CP charges based on the 2016 tariffs accounting for both transmission charges and transmission cost recovery factors would be $41425 per 4CP kW for AEP Central Texas and $41870 per 4CP kVA for CenterPoint14 If a seawater desalination plant has 10 MW of load and is capable of interrupting all of it and successfully does so for all four 4CP intervals the savings based on the 2016 tariffs would be approximately $500000 per year ($41425 times 1000 (kW to MW) times 10 MW times 12 months) Thus a seawater desalination plant that reduces its electricity use during the 4CP intervals could avert some or all of these charges
Another opportunity for seawater desalination plants to reduce their electricity costs is through adjusting operations in response to real-time electricity prices In 2015 the average electricity price in ERCOT was $2677MWh However prices exceeded $50MWh in 254 hours (3 of all hours) $100MWh in 88 hours (1) $200MWh in 40 hours (05) and $300MWh in 21 hours (02) Prices exceeded $3000MWh for 021 hours15 Depending on the desalination plantrsquos exposure to real-time wholesale market prices (via its retail contract) the degree of high prices the plant owner is willing to avoid and grid conditions in a given year reducing unit operations in order to avoid high electricity prices could impact operators for anywhere between a few and several hundred hours out of the year In addition a plant can plan its operations to take advantage of lower electricity prices during off-peak periods (eg at night when generation from wind is high) For example at least one company is marketing a modular desalination unit design intended to take advantage of low prices during periods of high renewables generation and to provide grid reliability services through demand response16
There are several factors to consider regarding these opportunities to reduce electricity costs The plant would need to monitor the ERCOT market or hire a contractor to do so in order to know when to reduce demand for electricity These programs do not impose any requirements on response time as with RRS or ERS and there may be sufficient warning of 4CP intervals or peak pricing to allow the plant operator to plan its operations earlier in the day with sufficient time to ramp down production under controlled conditions However quicker ramping capability may be desirable to respond to electricity price fluctuations
For 4CP because the four intervals used to set demand charges are not known ahead of time it is likely that the plant would need to reduce its demand multiple times per summer to ensure the 4CP intervals are hit impacting production at the facility Timing operations to coincide with off-peak pricing or to avoid price spikes would similarly result in reduced operations during certain hours To offset the lost production hours the plant may need to be designed with extra capacity and water storage capability to maintain the ability to meet its contractual obligations for freshwater delivery Because the period of reduced operations is greater than with ERCOT-dispatched demand response services this need would be greater for a seawater desalination plant reducing load during 4CP intervals or in response to real-time electricity prices and would increase the capital costs of the project It should also be noted that high prices in the ERCOT Region typically but not always occur in summer months when drought conditions are more likely to develop and demand for desalinated water is likely to be highest This may limit the flexibility of the plant to time its electricity consumption to avoid high-priced hours
14 Public Utility Commission of Texas ldquoTransmission and Distribution Rates for Investor Owned Utilitiesrdquo Available at httpwwwpuctexasgovindustryelectricratestdraspx 15 Potomac Economics June 2016 2015 State of the Market Report for the ERCOT Wholesale Electricity Markets Available at httpswwwpotomaceconomicscomindexphpmarkets_monitoredERCOT 16 Sisyan LLC ldquoDemand Response Desalinationrdquo Available at httprenewabledesalinationcomwpshycontentuploads201506Demand-Response-Desalinationpdf
copy 2016 ERCOT All rights reserved 10
Study on the Demand Response Potential for Seawater Desalination Projects ERCOT Public
In addition the plantrsquos ability to participate in demand response would also be limited for those hours it is reducing load as part of 4CP response or in response to real-time prices because the plant would not be able to reduce its electricity consumption if that demand is already committed to another demand response service Thus participating in demand response versus taking advantage of these other opportunities may be to some extent mutually exclusive
5 Conclusion
Based on this analysis it appears that the operational characteristics of seawater desalination plants would allow them to participate in demand response opportunities in ERCOT so long as the necessary operational requirements are considered in the design specifications of the plant Project developers should consider the necessary requirements early in the plant design Whether the economic benefits of participation would provide a sufficient incentive for them to do so will depend on the costs of accommodating those operational requirements and whether there is the flexibility available to operate the plant as necessary under these programs Though most existing seawater desalination plants do not participate in demand response programs it does appear that participation by these plants is possible and could result in a financial benefit Table 2 compares the different demand response opportunities available to demand-side resources in ERCOT
Table 2 Comparison of Demand Response Opportunities Demand Response
Opportunity Requirements for
Participation Impacts to Plant
Operations Financial Benefit Ancillary Services ndash Responsive Reserve Service (RRS)
bull Under-Frequency Relay bull Instantaneous or 10 minute
response time bull Recover load within 3
hours bull Bid in day-ahead market
bull Deployed once in 2015 for 10 minutes bull Subject to annual
unannounced testing
bull $1087 per MW per hour (based on 2015 prices)
Emergency Response Service (ERS)
bull 10 or 30 minute response time bull Recover load within 10
hours bull Four-month contract term
bull Not deployed in 2015 the most times ever deployed in a single year was twice in 2011 bull Subject to annual
unannounced testing
bull $645 per MW per hour (based on 2015 prices)
Four Coincident bull Interval Data Recorder bull Likely plant will need to bull Avoid ~$48000 per 4CP Peak (4CP) (IDR) meter
bull Ability to predict system-wide peak demand hours during summer months
reduce load multiple times per summer to hit 4CP intervals bull Likely to be able to predict
possible 4CP intervals earlier in day
MW per year (based on 2016 tariffs) if successful in reducing during all four summer months
LSE or DR Provider Contracted Price Response
bull Varies based on contractual arrangements
bull Varies based on contractual arrangements
bull Varies based on contractual arrangements
Self-Directed Price bull Retail contract with bull Varies depending on bull Varies depending on Response exposure to real-time
market prices bull Ability to monitor real-time
prices in ERCOT wholesale market
number and severity of pricing events bull May be able to predict
peak pricing events earlier in day
number and severity of pricing events
copy 2016 ERCOT All rights reserved 11
Study on the Demand Response Potential for Seawater Desalination Projects ERCOT Public
Demand response programs in ERCOT provide opportunities for demand-side resources to defray their electricity costs and provide reliability benefits to the ERCOT electric grid Because the process of seawater desalination is energy intensive participation in demand response could help to reduce electricity costs while posing a relatively low risk to plant operations if demand response participation is factored into plant design
Participation in non-ERCOT-dispatched demand response opportunities such as reducing load during 4CP intervals or in response to real-time electricity prices may also help to reduce electricity costs for seawater desalination plants in Texas As stakeholders in Texas continue to plan for possible future droughts in the region and identify water management strategies consideration of demand response could play a role in mitigating some costs associated with seawater desalination and allow seawater desalination plants to assist with maintaining electric reliability in the region
copy 2016 ERCOT All rights reserved 12

2017 SCOPE OF COMPETITION IN ELECTRIC MARKETS IN TEXAS REPORT
Appendix A ndash Acronyms
AEP American Electric Power
AMS Advanced Metering System
CenterPoint CenterPoint Energy Houston Electric LLC
DG Distributed Generation
DRG Distributed Renewable Generation
ERCOT Electric Reliability Council of Texas
ERSC Entergy Regional State
ERS Emergency Response Service
ETI Entergy Texas Inc
IMM ERCOT Independent Market Monitor
kWh Kilowatt-hour
LMP Locational Marginal Pricing
LSP Large Service Provider
MISO Midwest Independent System Operator
MMBtu One million British Thermal Unit (BTU)
MW Megawatt
MWh Megawatt-hour
Nodal Texas Nodal Market Design
ORDC Operating Reserve Demand Curve
PGC Power Generation Company
POLR Provider of Last Resort
PURA Public Utility Regulatory Act
REP Retail Electric Provider
RSC Regional State Committee
RTO Regional Transmission Organization
SCED Security Constrained Economic Dispatch
Sharyland Sharyland Utilities LP
SBF System Benefit Fund
SPP Southwest Power Pool
TDU Transmission and Distribution Utility
TNMP Texas-New Mexico Power Company
32 | P a g e
2017 SCOPE OF COMPETITION IN ELECTRIC MARKETS IN TEXAS REPORT
Appendix B ndash ERCOT Desalination Report
This page intentionally left blank
33 | P a g e
ERCOT Public
Study on the Demand Response Potential for Seawater Desalination Projects
ERCOT November 18 2016
Study on the Demand Response Potential for Seawater Desalination Projects ERCOT Public
Executive Summary
In 2015 the 84th Texas Legislature enacted House Bill (HB) 4097 which included several provisions relating to seawater desalination projects including a requirement that the Public Utility Commission of Texas (PUC) and Electric Reliability Council of Texas (ERCOT) study the potential for seawater desalination projects to participate in existing demand response opportunities in ERCOT There are several demand response products in which demand-side resources (ie consumers of electricity) can participate These programs help to preserve system reliability and provide economic benefits to participating demand-side resources Seawater desalination is an energy-intensive process that removes salt and other minerals from salt water to produce fresh water for municipal consumption industrial use or irrigation Participation in demand response could help mitigate electricity costs for future seawater desalination projects in Texas and provide reliability benefits to the grid
There are two main demand response reliability-based services administered by ERCOT participation by demand-side resources in the Ancillary Services market and the Emergency Response Service (ERS) Within the Ancillary Services market the most common service provided by demand-side resources is Responsive Reserve Service (RRS) which requires resources to respond either instantaneously or within 10 minutes in response to unplanned system emergencies ERS is separate from ERCOTrsquos Ancillary Services market and allows demand-side resources and distributed generation to provide reliability services in the event of an energy emergency Resources can qualify for either the 10-minute or 30-minute response time ERS programs
There are several key considerations that will impact a demand-side resourcersquos ability to participate in different demand response opportunities response time recovery time predictability of electrical demand and flexibility of operations Considering these factors together it appears that seawater desalination plants could be designed to meet the requirements for participation in demand response Because the ability to meet the qualification requirements is dependent on the plant design demand response opportunities should be considered early in a projectrsquos development if participation is desirable
Whether project developers will choose to address these requirements will depend on the economic benefits of participation There may be additional costs to design seawater desalination plants to operate in the manner required in order to participate in demand response These include costs associated with additional plant design specifications need for excess capacity and storage to make up for lost production during demand response deployment operational costs resulting from interruptions to plant processes and potential financial penalties if demand response deployment results in failure to meet contract demands The interplay of the benefits of participation and these costs will determine whether it would be beneficial for a future seawater desalination plant to participate in demand response in ERCOT
To date participation of seawater desalination plants in demand response programs has been limited Because the process of seawater desalination is energy-intensive participation in demand response could help to reduce electricity costs while posing a relatively low risk to plant operations As stakeholders in Texas continue to plan for possible future droughts in the region and identify water management strategies consideration of demand response could play a role in mitigating some costs associated with seawater desalination and allow seawater desalination plants to assist with maintaining electric reliability in the region
copy 2016 ERCOT All rights reserved i
Study on the Demand Response Potential for Seawater Desalination Projects ERCOT Public
Table of Contents
1 Introduction 1
2 Seawater Desalination 2
21 Seawater Desalination Plant Operations 2
22 Seawater Desalination Plant Economics 3
3 Demand Response Opportunities in ERCOT 4
31 ERCOT-Dispatched Demand Response 4
311 Ancillary Services Markets 5
312 Emergency Response Service (ERS) 5
32 Non-ERCOT-Dispatched Demand Response 6
321 Four Coincident Peak (4CP) 6
322 LSE or DR Provider Contracted Price Response 6
323 Self-Directed Price Response 6
4 Demand Response Potential for Seawater Desalination 7
41 Operational Considerations for ERCOT-Dispatched Demand Response 7
42 Economic Considerations for ERCOT-Dispatched Demand Response 8
43 Considerations for Non-ERCOT-Dispatched Demand Response 9
5 Conclusion 11
copy 2016 ERCOT All rights reserved ii
Study on the Demand Response Potential for Seawater Desalination Projects ERCOT Public
1 Introduction
In 2015 the 84th Texas Legislature enacted House Bill (HB) 4097 which included several provisions relating to seawater desalination projects including a requirement that the Public Utility Commission of Texas (PUC) and Electric Reliability Council of Texas (ERCOT) study the potential for seawater desalination projects to participate in existing demand response opportunities in ERCOT ERCOT and the PUC initiated this study to fulfill that requirement and evaluated the operational and economic characteristics of seawater desalination plants in light of ERCOTrsquos primary demand response products1
ERCOT is the independent system operator (ISO) for the ERCOT Interconnection which encompasses approximately 90 of demand for electricity in Texas ERCOT is the independent organization established by the Texas Legislature to be responsible for the reliable planning and operation of the electric grid for the ERCOT Interconnection ERCOT also administers and maintains a forward-looking open market to provide affordable and reliable electricity to consumers in Texas In collaboration with market participants ERCOT has developed demand response products and services for customers that have the ability to reduce or modify electricity use in response to instructions or signals These programs help preserve system reliability and provide economic benefits to participating demand-side resources
The process of seawater desalination removes salt and other minerals from salt water to produce fresh water for consumption industrial processes or irrigation The drought-prone Texas climate coupled with projections for increasing water demand in the state has created interest in seawater desalination as a future water source The 2017 Texas State Water Plan includes seawater desalination as a future water management strategy for water users in the state However the seawater desalination process is energy intensive and electricity consumption can be a significant cost driver for these projects To the extent that these plants could participate in demand response it would help to defray these costs Thus there is a potential nexus between seawater desalination projects built in Texas to mitigate drought but which have large electricity requirements and ERCOT demand response opportunities which could help to reduce their electricity costs and provide reliability benefits
This study evaluates the demand response potential of seawater desalination plants based on their operational characteristics and economic drivers The report is organized as follows
Section 2 provides background on typical seawater desalination plant operations and economics
Section 3 describes the current demand response opportunities in ERCOT
Section 4 evaluates the characteristics of seawater desalination plants to determine their potential to participate in demand response opportunities in ERCOT and
Section 5 provides a summary of the conclusions of this study
1 In the course of developing this report ERCOT consulted with several desalination experts with experience with existing or planned seawater desalination plants in the US The technical experts consulted included Jorge Arroyo (Water Management Consultant) Andrew Chastain-Howley (Black amp Veatch) Jonathan Loveland (Black amp Veatch) Ron Parker (Black amp Veatch) John Wolfhope (Freese and Nichols) and Srinivas Veerapaneni (Black amp Veatch)
copy 2016 ERCOT All rights reserved 1
Study on the Demand Response Potential for Seawater Desalination Projects ERCOT Public
2 Seawater Desalination
There are two primary methods for seawater desalination distillation (also referred to as ldquothermalrdquo) and reverse osmosis Distillation uses heat to remove salts and minerals from seawater by boiling water at high pressures In contrast reverse osmosis technology forces saline water through a membrane to separate water from the salts and minerals While both distillation and reverse osmosis are energy intensive distillation requires thermal energy to heat the water and overall has a higher energy requirement whereas reverse osmosis requires primarily electrical energy and overall is less energy intensive ndash though still with significant electricity requirements
Globally most thermal desalination plants are located in the Middle East due to low energy prices in the region Plants located elsewhere including in the US typically use reverse osmosis technology2 There are two large existing seawater desalination plants in the US one in Carlsbad California providing water to the San Diego area and one in Gibsonton Florida providing water to the Tampa Bay area Both plants use reverse osmosis technology In addition there are several desalination projects currently in the planning stages or under development in Texas in the Corpus Christi area that would use reverse osmosis technology For that reason this report focuses on reverse osmosis technology in the evaluation of demand response potential of seawater desalination plants
While there are currently no existing seawater desalination plants in Texas there are several municipal and industrial brackish water desalination plants in the state According to the Texas Water Development Board (TWDB) there are 46 municipal brackish water desalination plants with capacities greater than 0025 million gallons per day (MGD) in Texas representing a total of 123 MGD of capacity3 The desalination of brackish water is typically less expensive compared to seawater due to the lower relative salinity of brackish water This study focuses exclusively on seawater desalination consistent with the requirements of HB 4097 but it should be noted that conclusions may also apply to brackish water desalination though at a different cost and scale
This section provides high-level information on the operations (Section 21) and economics (Section 22) of seawater desalination plants to inform the discussion of their demand response potential in Section 4
21 Seawater Desalination Plant Operations Seawater desalination plants typically range in capacity from less than 5 MGD up to 165 MGD For example the Carlsbad seawater desalination plant has a capacity of approximately 50 MGD and the plant in Tampa Bay has a capacity of approximately 25 MGD The associated electricity consumption ranges between 10 and 15 kWh1000 gallons produced depending on the salinity of the water being processed456 More saline water (eg seawater) requires larger amounts of electricity for desalination Thus a seawater desalination plant would have larger electricity consumption requirements compared to a similarly sized brackish water desalination plant
2 American Water ldquoInnovation Solutions within the Water Industry Desalinationrdquo Available at httpwwwamwatercomfilesInnovationsSolutionsWithinTheWaterIndustryDesalinationpdf 3 Texas Water Development Board ldquoDesalination Factsrdquo Available at httpswwwtwdbtexasgovinnovativewaterdesalfactsasp 4 American Membrane Technology Association April 2016 ldquoMembrane Desalination Power Usage Put in Perspectiverdquo Available at httpwwwamtaorgcomwp-contentuploads7_MembraneDesalinationPowerUsagePutInPerspectivepdf 5 Water Reuse Association November 2011 ldquoSeawater Desalination Power Consumptionrdquo Available at httpswatereuseorgwpshycontentuploads201510Power_consumption_white_paperpdf 6 Ghaffour N TM Missimer and G Amy January 2013 ldquoTechnical review and evaluation of the economics of water desalination Current and future challenges for better water supply sustainabilityrdquo Desalination 309 pp197-207 Available at httpswwwresearchgatenetpublication256693140_Technical_review_and_evaluation_of_the_economics_of_water_desalination_ Current_and_future_challenges_for_better_water_supply_sustainability
copy 2016 ERCOT All rights reserved 2
Study on the Demand Response Potential for Seawater Desalination Projects ERCOT Public
While the two existing seawater desalination plants in the US were co-located with power plants to ease compliance with regulations on water intake and discharge structures and reduce costs many other reverse osmosis desalination plants receive their electricity from the grid However plants may have on-site backup generation in case of a power outage This will vary depending on the size and design of the plant and other factors For example the Carlsbad plant in California does have diesel backup generation to power control systems and flushing systems in the case of a power outage The plant in Tampa Bay was not built with backup power due to potential storm surge risks from hurricanes and other storms The plant does use uninterruptible power supply (UPS) backup to power control systems during power outages
Reverse osmosis plants are typically designed with several ldquotrainsrdquo which consists of a high-pressure pump turbine and reverse osmosis membrane Desalination plants are turned on or off one train at a time in a highly controlled process The process of ramping up or down an individual train under normal operations typically takes one to two hours While plants can be designed to handle immediate shutdowns (ie in a power outage) re-starting a system after an interruption would take this amount of time In addition the saline water must be pretreated (ie filtered) before going through the reverse osmosis train and this can sometimes pose constraints on the flexibility of operations
Demand for water is the key factor driving the level of production at seawater desalination plants Typically the plant will have a contract or contracts with municipal or other water users to deliver desalinated water and is operated to meet that demand Alternatively if the plant is municipally owned it would similarly be operated to meet the level of water demand in conjunction with other available water sources If water demands are close to a plantrsquos full capacity the operatorrsquos flexibility to adjust its electricity consumption as part of demand response may be limited However this does mean that plant operations are fairly predictable on a day-to-day basis which is necessary for participation in demand response
The amount of flexibility in plant operations will also be impacted by the amount of water storage available For example if a plant has sufficient water storage on-site or storage within the customerrsquos distribution system it could provide flexibility for the plant to reduce its operations during peak hours when electricity prices are likely to be highest It would also mitigate the impacts of interruptions to production from demand response deployments
22 Seawater Desalination Plant Economics Seawater desalination is typically more expensive than other sources of water and a major driver of the overall cost is energy costs In 2016 the Carlsbad plant charged rates at between $2131 and $2367 per acre-foot78 This charge is intended to cover both the fixed costs of the plant and the variable costs to produce a unit volume of water Typically half to two thirds of the cost of providing desalinated seawater are accounted for by capital cost recovery with the remainder accounted for by operations and maintenance costs including electricity costs Electricity costs can account for 20shy25 of the total costs of seawater desalination with reverse osmosis technology9
Factors affecting the capital cost of a seawater desalination plant include plant size type of desalination process and pre-post-treatment technologies plant infrastructure (eg piping water storage backup power) and compliance with applicable regulations (eg regulations on intake structures brine byproduct disposal) A significant driver of operating and maintenance costs is membrane replacement Reverse osmosis membranes need to be replaced every few years and
7 Source San Diego County Water Authority ldquoSeawater Desalinationrdquo Available at httpwwwsdcwaorgseawater-desalination 8 Note that 1 acre-foot is approximately 325851 gallons 9 Based on technical input from Black amp Veatch
copy 2016 ERCOT All rights reserved 3
Study on the Demand Response Potential for Seawater Desalination Projects ERCOT Public
the rate at which they are replaced will depend on the salinity of the feedwater and how the plant is operated Treatment and disposal of the salty brine byproduct from desalination may also incur operating costs
Electricity costs will vary depending on a range of factors including the size of the plant type of desalination technology source of electricity and quality of the feedwater As previously noted more saline water requires higher amounts of electricity in desalination and thus the amount of electricity consumption is a key difference between brackish water and seawater desalination As a result electricity costs comprise a significant share of the costs of seawater desalination These costs could potentially be defrayed in part by participation in demand response initiatives
3 Demand Response Opportunities in ERCOT
Broadly speaking demand response can be broken down into two major categories dispatchable or non-dispatchable For purposes of this report we will define dispatchable as those demand response events that are initiated by ERCOT and non-dispatchable as an event not specifically initiated by ERCOT These non-dispatchable events may include decisions made by the end-use customer to alter its consumption pattern or may include contractual obligations with another entity such as the end-use customerrsquos retail electric provider (ldquoREPrdquo) to alter consumption patterns
ERCOTrsquos wholesale market is open to several types of dispatchable demand response which are deployed to maintain system reliability Demand-side resources providing Emergency Response Service (ERS) may offer based on either a 10 or 30-minute response time commonly referred to as the ldquoramp periodrdquo Alternatively demand-side resources may register and qualify as a Load Resource that can provide Reserves in the Ancillary Services market The most common service provided by demand-side resources is Responsive Reserve Service which requires an under-frequency relay that can instantaneously interrupt the load during certain system reliability events Some demand-side resources can also participate in other Ancillary Services as Controllable Load Resources that require sophisticated control systems that allow them to be deployed in a more incremental proportional manner
Non-dispatchable demand response in ERCOT can include a response to avoid transmission costs where rates are based on Four Coincident Peak Pricing (4CP) response to wholesale energy prices initiated by the customer or by a REP or other load-serving entity (ldquoLSErdquo) or utility-managed Load Management programs (LM)
The sections that follow provide a description of both ERCOT-dispatched (Section 31) and nonshyERCOT-dispatched (Section 32) demand response For a more detailed description of opportunities for demand-side resources to participate in demand response in ERCOT see ERCOTrsquos guide Load Participation in the ERCOT Nodal Market10
31 ERCOT-Dispatched Demand Response There are two main demand response reliability-based services administered by ERCOT participation by demand-side resources in the Ancillary Services market and participation in ERS These services are dispatched by ERCOT during system emergencies
10 Available at httpwwwercotcomcontentservicesprogramsloadLoad20Participation20in20the20ERCOT20Nodal20Market_302d oc
copy 2016 ERCOT All rights reserved 4
Study on the Demand Response Potential for Seawater Desalination Projects ERCOT Public
Demand-side resources with demand response capability that can meet a set of performance requirements can be qualified to provide Ancillary Services as Load Resources in the Ancillary Services Market The value of having a Load Resource available to reduce load is equal to the value of having a generator available to increase its generation at a generating plant The providers of operating reserves selected to provide Ancillary Services are eligible for capacity payments regardless of whether the Resource is actually deployed (or curtailed in the case of the Load Resource)
ERCOT holds auctions on a daily basis for each of the following Ancillary Services Regulation Up Regulation Down Responsive Reserve and Non-Spinning Reserve11 Table 1 describes the various Load Resource types and their qualification requirements and eligible services
Table 1 Load Resource Types and Ancillary Services
Service Load Resource Type a Qualification Responsive Reserves (le50 of total Reserve requirement)
Non Controllable Under-Frequency Relay and 10-minute ramp to manual dispatch instruction
Responsive Reserves
Controllable Primary Frequency Response and follow 5-minute dispatch instructions
Regulation-Up Regulation-Down
Controllable Primary Frequency Response and respond to Regulation deployments
Non-Spin Reserves Controllable Follow 5-minute dispatch instructions a A Controllable Load Resource is a Load Resource capable of controllably reducing or increasing consumption under dispatch control by ERCOT
Demand-side resources that agree to reduce load when directed by ERCOT and that meet other metering and operational requirements as specified in the ERCOT Protocols may participate in Ancillary Services market auctions As noted in Table 1 the type of Ancillary Service that a Load Resource may provide will depend upon the demand-side resourcersquos response time and metering system as well as other requirements described in the Protocols In the Responsive Reserve and Non-Spin Reserve markets the Load Resource will receive capacity payments regardless of whether or not the load was actually deployed but the load must be available for deployment at any time while providing the service
ERCOT procures ERS to maintain grid reliability during emergency conditions and reduce the likelihood of the need for rotating outages ERS participants may offer to provide demand response with either a 10-minute ramp period requirement (similar to Load Resources providing Responsive Reserve Service) or a 30-minute ramp period requirement ERS Resources do not have the same telemetry and under-frequency relay requirements as Load Resources
11 Regulation Up and Regulation Down service respond to signals from ERCOT every 4 seconds to respond to changes in system frequency full response has to be provided within 5 minutes Responsive reserves must provide their committed capacity either instantaneously in an under-frequency event (eg due to a generator outage) or in energy scarcity conditions within ten minutes following an instruction from ERCOT Non-spinning reserves must provide their committed capacity within 30 minutes based on economic dispatch instructions Non-spinning reserve is used as replacement reserve to replenish other ancillary services and during energy scarcity
copy 2016 ERCOT All rights reserved 5
Study on the Demand Response Potential for Seawater Desalination Projects ERCOT Public
ERS is procured through a request for proposal (RFP) process three times per year for four-month contract terms each of which is further split into smaller time periods based on business cycles and other factors Demand-side resources may choose to submit offers in all time periods or only in those that best fit their unique circumstances and may vary both the price and demand response capacity offers by time period
Payments for ERS are performed up to 80 days after each four month contract term has ended and are subject to downward revision based upon delivered demand response capacity and the demand-side resourcersquos availability during the contract term
32 Non-ERCOT-Dispatched Demand Response The options listed below are not dispatched by ERCOT but they either are controlled directly by a customer or are dispatchable by another entity such as a demand response provider (ldquoDR Providerrdquo) REP or a transmission and distribution utility
Many industrial customers are subject to transmission charges based upon a Four Coincident Peak (4CP) demand The 4CP demand is determined by averaging the consumerrsquos actual demand during the 15-minute settlement interval with the highest ERCOT demand during each of the four summer months (June through September) This measured 4CP demand serves as the basis for the customerrsquos transmission tariff charges for the following year By correctly predicting the ERCOT system peaks during the summer and curtailing load during those intervals a consumer can help reduce the stress imposed on the electric system during peak periods of consumption and reduce its transmission charges for the following calendar year
In the competitive areas of ERCOT consumers can contract with their REP or a DR Provider to have their load respond to the REPrsquos or DR Providerrsquos instructions The contract will usually outline the parameters of this response ndash at what times and frequency demand response events can be called ramp periods sustained response periods compensation etc Because this response is a contractual matter between the REP or DR Provider and the consumer a great deal of variety can be present in these arrangements For example a consumerrsquos response may be voluntary or required compensation could come in the form of reduced energy prices or rebate payments for each curtailment event consumers might be notified up to a day in advance or could have no notification at all (for automated curtailment)
In areas of ERCOT not open to competition interruptible tariffs may be available These tariffs will usually offer a reduced energy price for defined curtailment obligations
REPs may offer dynamic pricing options or consumers within a municipality or cooperative may have their energy prices determined by a published tariff which also may be structured based upon Time-of-Use (TOU) or have a Critical Peak Pricing (CPP) or Peak Time Rebate (PTR) component Self-directed price response refers to consumers making an independent decision to respond to energy prices contained in a governing tariff or in either the ERCOT Day Ahead or Real Time energy markets
TOU offerings will typically have higher energy prices during normal peak periods ndash for example a TOU tariff may charge one price during Monday through Friday from 2 pm through 8 pm and another price during all other times Customers may choose to reduce consumption during these high priced periods Load reduction can be accomplished by load shifting (loads can be shifted by
copy 2016 ERCOT All rights reserved 6
Study on the Demand Response Potential for Seawater Desalination Projects ERCOT Public
rescheduling certain processes or by utilizing thermal storage) ending certain processes that are no longer economic or through energy efficiency measures
Offerings that incorporate CPP usually have prescribed high prices only during certain defined periods ndash for example when load or prices are expected to reach a certain level Response to CPP may be similar to those employed under TOU tariffs especially if CPP is reached frequently More often CPP is infrequent and as such short-term load curtailment may be the more appropriate response to meet economic objectives
4 Demand Response Potential for Seawater Desalination
This section evaluates whether the operational characteristics and economics of seawater desalination plants would enable them to participate in one or more of the various demand response opportunities in the ERCOT Region To date participation of seawater desalination plants in demand response programs has been limited Neither the plant in Carlsbad nor the plant in Tampa Bay participate in demand response programs in California or Florida respectively However as will be described below it appears that these plants can be designed and operated to meet the requirements for participation in demand response and receive economic benefit from participation in these programs
Section 41 describes the operational parameters that must be met for a demand-side resource to provide ERCOT-dispatched demand response and evaluates the ability of seawater desalination plants to meet these criteria Section 42 discusses the tradeoffs between payments for participation in ERCOT-dispatched demand response and potential additional costs posed to seawater desalination plants Finally Section 43 presents other opportunities for seawater desalination plants to reduce their electricity costs outside of ERCOTrsquos reliability-based services that are open to demand response assets
41 Operational Considerations for ERCOT-Dispatched Demand Response There are several key operational parameters that impact a demand-side resourcersquos ability to participate in different demand response services response time recovery time predictability of electrical demand and flexibility of operations This section discusses each of these considerations as they apply to seawater desalination plants
As discussed in Section 31 one of the differentiating factors between ERCOTrsquos demand response products is the amount of time within which a demand-side resource must respond to a deployment instruction to reduce electricity consumption during an event Participation in RRS requires an automatic response within either half a second (ie instantaneous) based on grid frequency or within 10 minutes via a manual instruction ERS requires a response time of either 10 or 30 minutes As noted in Section 21 the typical time to take a reverse osmosis train on- or off-line is 1-2 hours under normal controlled operations To comply with the response time requirements of RRS or ERS a seawater desalination plant would need to be able to reduce its electricity consumption far more quickly than in normal operations This is an element of plant design that would need to be accounted for in the specifications of the project Considerations include the potential need for on-site backup generation including uninterruptible power supply potential impacts to plant infrastructure (eg piping) reverse osmosis membranes and pretreatment systems
The two large US desalination plants provide illustrative counterpoints in this respect The Carlsbad plant was designed to withstand instantaneous power interruptions and has on-site backup generation including uninterruptible power supply to provide the ability to power control systems and flush the membranes in the event of a power loss In contrast the Tampa Bay plant was not
copy 2016 ERCOT All rights reserved 7
Study on the Demand Response Potential for Seawater Desalination Projects ERCOT Public
designed with on-site backup generation and a loss of power would result in a plant shutdown and may require several days to bring the plant back on-line Thus it appears that it is technically possible for a seawater desalination plant to meet the response time requirements for participation in demand response so long as this factor is considered in the design of the facility
The time it takes a desalination train to return to operations after an event is also a consideration Demand-side resources participating in RRS must be able to come back on-line within three hours and those participating in ERS must return within 10 hours Again it appears that it is technically feasible for desalination plants to meet this requirement so long as this requirement is considered in the plant design
An additional consideration is the predictability of a demand-side resourcersquos electricity consumption Participation in the responsive reserves ancillary service market requires bidding in the day-ahead market and thus a demand-side resource must know with great accuracy (within 95) its electrical demand at least a day ahead of time For ERS auctions are held three times a year for four-month contract periods Thus to participate in ERS a resource must know its forecasted electrical demand several months in advance Because seawater desalination plant operations are driven by contracted demand for water it is likely that a plant operator would have a good idea of the plantrsquos electrical demand days or even weeksmonths in advance especially for summer months when demand is likely to be relatively steady An important consideration however is the salinity of the water which drives the electrical requirements and which can be impacted by recent weather events Similarly reductions in demand for water during non-summer months or wet summer days where demand may be reduced could also impact a plantrsquos ability to predict its electricity demand
Finally a seawater desalination plant must have sufficient flexibility in its day-to-day operations so that it can afford to lose several hours of production when deployed for demand response It should be noted that demand-side resources participating in RRS and ERS are called infrequently demand-side resources providing responsive reserves were deployed one time in 2015 and ERS was not deployed that year However this is an important factor to consider if a plant is operating at close to full capacity and would incur financial penalties if it fails to meet its contract obligations due to a demand response event Including additional storage and building a plant with extra capacity could help to mitigate this risk It should also be noted that a plant operator does not need to commit the full plant capacity to these services but rather can specify an amount of MW that will be committed Thus a plant operator could mitigate issues both with predictability and flexibility of plant operations by committing only a portion of its predicted electrical demand to participate in demand response
Considering these factors together it appears that seawater desalination plants could be designed to meet the operational requirements for participation in ERCOTrsquos demand response services (both RRS and ERS) Because the ability to meet the requirements is dependent on the plant design demand response would need to be considered early in a projectrsquos development if participation is desirable Whether project developers will choose to address these requirements will depend on the economic benefits of participation in demand response which will be discussed in the next section
42 Economic Considerations for ERCOT-Dispatched Demand Response This section describes the economic benefits to demand-side resources from participation in ERCOT-dispatched demand response programs The average price paid for a demand-side resource participating in RRS in 2015 was $1087 per MW per hour and for ERS was $645 per MW per hour for the contract periods during the 2015 program year These payments could provide a significant financial benefit to seawater desalination plants To give a simplified example for a plant with an electrical demand of 10 MW operating at a 100 annual load factor (10 MW times 24 hours times 365 days) the annual benefit would be on the order of $500000 for ERS or $1 million for RRS
copy 2016 ERCOT All rights reserved 8
Study on the Demand Response Potential for Seawater Desalination Projects ERCOT Public
In 2015 demand-side resources providing responsive reserves were deployed one time for a duration of 10 minutes and ERS was not deployed12 The most ERS was ever deployed in a single year was two times in 2011 Thus participation in either program could result in a substantial payment to a seawater desalination plant with a relatively low risk of deployment and associated disruption of plant operations although it is important to note that participation in either ERCOT service subjects demand response resources to annual unannounced testing Other than testing the frequency of deployment will depend on grid conditions and is a risk that should be considered
The financial benefits of participation must be weighed against the costs of designing facilities with the capabilities to operate in this manner These include
bull The costs to design the plant to reduce electrical demand within the required timeframes for demand response and to withstand an instantaneous interruption if not already part of the plant design For example a plant may need to be designed to have backup power generation on-site In addition there could also be costs to restart the system after an interruption
bull The costs to build a plant with excess capacity andor storage to make up for lost production hours when demand response is deployed This will add to the total capital costs of the project Land area constraints should also be considered when considering additional storage as the space requirements for the necessary storage capacity could be significant
bull Costs associated with the impact of interruptions on plant processes (eg more frequent replacement of membranes impacts to pretreatment system or plant infrastructure)
bull Potential financial penalties that would be incurred if deployment as part of demand response were to result in failure to meet contract obligations to supply water
bull The loss of potential benefits in the form of cost avoidance from participation in non-ERCOTshydispatched demand response opportunities (see Section 43) If a plant is committed to RRS or ERS the plant operator would lose the flexibility to take advantage of these other opportunities to reduce their electricity costs
The interplay of these benefits and costs will determine whether it would be beneficial for a future seawater desalination plant to participate in demand response in ERCOT
43 Considerations for Non-ERCOT-Dispatched Demand Response Outside of the reliability-based services administered by ERCOT there are other opportunities for seawater desalination plants to reduce their electricity costs As described in Section 321 seawater desalination plants may be able to reduce the demand charges on their electricity bills through curtailing load during 4CP intervals In addition plant operators may adjust operations in response to real-time electricity prices to take advantage of lower off-peak prices and avoid price spikes (see Sections 322 and 323) All of these opportunities require that the plant have flexibility to reduce production during certain times of the day
In the ERCOT region as noted above a portion of transmission and distribution charges are set based on the peak systemwide 15-minute interval of the four summer months (June through September) referred to as the four coincident peaks (4CP) Large customers can reduce or avoid this charge by reducing electrical consumption during these four peak intervals AEP Central Texas and CenterPoint are the transmission providers covering the majority of the Gulf Coast in Texas13
12 ERCOT June 2016 ldquoLoad Resource Deployment Updaterdquo Available at httpwwwercotcomcontentwcmkey_documents_lists870985_RRS_Load_Resource_Deployment_Updatepdf 13 It is also possible that a seawater desalination plant could be located in an area that as not opted in to competition in which case the plant owner would need to negotiate its electricity charges bilaterally with the Non Opt-In Entity (NOIE)
copy 2016 ERCOT All rights reserved 9
Study on the Demand Response Potential for Seawater Desalination Projects ERCOT Public
Assuming a future seawater desalination plant would be connected at transmission-level voltages the relevant 4CP charges based on the 2016 tariffs accounting for both transmission charges and transmission cost recovery factors would be $41425 per 4CP kW for AEP Central Texas and $41870 per 4CP kVA for CenterPoint14 If a seawater desalination plant has 10 MW of load and is capable of interrupting all of it and successfully does so for all four 4CP intervals the savings based on the 2016 tariffs would be approximately $500000 per year ($41425 times 1000 (kW to MW) times 10 MW times 12 months) Thus a seawater desalination plant that reduces its electricity use during the 4CP intervals could avert some or all of these charges
Another opportunity for seawater desalination plants to reduce their electricity costs is through adjusting operations in response to real-time electricity prices In 2015 the average electricity price in ERCOT was $2677MWh However prices exceeded $50MWh in 254 hours (3 of all hours) $100MWh in 88 hours (1) $200MWh in 40 hours (05) and $300MWh in 21 hours (02) Prices exceeded $3000MWh for 021 hours15 Depending on the desalination plantrsquos exposure to real-time wholesale market prices (via its retail contract) the degree of high prices the plant owner is willing to avoid and grid conditions in a given year reducing unit operations in order to avoid high electricity prices could impact operators for anywhere between a few and several hundred hours out of the year In addition a plant can plan its operations to take advantage of lower electricity prices during off-peak periods (eg at night when generation from wind is high) For example at least one company is marketing a modular desalination unit design intended to take advantage of low prices during periods of high renewables generation and to provide grid reliability services through demand response16
There are several factors to consider regarding these opportunities to reduce electricity costs The plant would need to monitor the ERCOT market or hire a contractor to do so in order to know when to reduce demand for electricity These programs do not impose any requirements on response time as with RRS or ERS and there may be sufficient warning of 4CP intervals or peak pricing to allow the plant operator to plan its operations earlier in the day with sufficient time to ramp down production under controlled conditions However quicker ramping capability may be desirable to respond to electricity price fluctuations
For 4CP because the four intervals used to set demand charges are not known ahead of time it is likely that the plant would need to reduce its demand multiple times per summer to ensure the 4CP intervals are hit impacting production at the facility Timing operations to coincide with off-peak pricing or to avoid price spikes would similarly result in reduced operations during certain hours To offset the lost production hours the plant may need to be designed with extra capacity and water storage capability to maintain the ability to meet its contractual obligations for freshwater delivery Because the period of reduced operations is greater than with ERCOT-dispatched demand response services this need would be greater for a seawater desalination plant reducing load during 4CP intervals or in response to real-time electricity prices and would increase the capital costs of the project It should also be noted that high prices in the ERCOT Region typically but not always occur in summer months when drought conditions are more likely to develop and demand for desalinated water is likely to be highest This may limit the flexibility of the plant to time its electricity consumption to avoid high-priced hours
14 Public Utility Commission of Texas ldquoTransmission and Distribution Rates for Investor Owned Utilitiesrdquo Available at httpwwwpuctexasgovindustryelectricratestdraspx 15 Potomac Economics June 2016 2015 State of the Market Report for the ERCOT Wholesale Electricity Markets Available at httpswwwpotomaceconomicscomindexphpmarkets_monitoredERCOT 16 Sisyan LLC ldquoDemand Response Desalinationrdquo Available at httprenewabledesalinationcomwpshycontentuploads201506Demand-Response-Desalinationpdf
copy 2016 ERCOT All rights reserved 10
Study on the Demand Response Potential for Seawater Desalination Projects ERCOT Public
In addition the plantrsquos ability to participate in demand response would also be limited for those hours it is reducing load as part of 4CP response or in response to real-time prices because the plant would not be able to reduce its electricity consumption if that demand is already committed to another demand response service Thus participating in demand response versus taking advantage of these other opportunities may be to some extent mutually exclusive
5 Conclusion
Based on this analysis it appears that the operational characteristics of seawater desalination plants would allow them to participate in demand response opportunities in ERCOT so long as the necessary operational requirements are considered in the design specifications of the plant Project developers should consider the necessary requirements early in the plant design Whether the economic benefits of participation would provide a sufficient incentive for them to do so will depend on the costs of accommodating those operational requirements and whether there is the flexibility available to operate the plant as necessary under these programs Though most existing seawater desalination plants do not participate in demand response programs it does appear that participation by these plants is possible and could result in a financial benefit Table 2 compares the different demand response opportunities available to demand-side resources in ERCOT
Table 2 Comparison of Demand Response Opportunities Demand Response
Opportunity Requirements for
Participation Impacts to Plant
Operations Financial Benefit Ancillary Services ndash Responsive Reserve Service (RRS)
bull Under-Frequency Relay bull Instantaneous or 10 minute
response time bull Recover load within 3
hours bull Bid in day-ahead market
bull Deployed once in 2015 for 10 minutes bull Subject to annual
unannounced testing
bull $1087 per MW per hour (based on 2015 prices)
Emergency Response Service (ERS)
bull 10 or 30 minute response time bull Recover load within 10
hours bull Four-month contract term
bull Not deployed in 2015 the most times ever deployed in a single year was twice in 2011 bull Subject to annual
unannounced testing
bull $645 per MW per hour (based on 2015 prices)
Four Coincident bull Interval Data Recorder bull Likely plant will need to bull Avoid ~$48000 per 4CP Peak (4CP) (IDR) meter
bull Ability to predict system-wide peak demand hours during summer months
reduce load multiple times per summer to hit 4CP intervals bull Likely to be able to predict
possible 4CP intervals earlier in day
MW per year (based on 2016 tariffs) if successful in reducing during all four summer months
LSE or DR Provider Contracted Price Response
bull Varies based on contractual arrangements
bull Varies based on contractual arrangements
bull Varies based on contractual arrangements
Self-Directed Price bull Retail contract with bull Varies depending on bull Varies depending on Response exposure to real-time
market prices bull Ability to monitor real-time
prices in ERCOT wholesale market
number and severity of pricing events bull May be able to predict
peak pricing events earlier in day
number and severity of pricing events
copy 2016 ERCOT All rights reserved 11
Study on the Demand Response Potential for Seawater Desalination Projects ERCOT Public
Demand response programs in ERCOT provide opportunities for demand-side resources to defray their electricity costs and provide reliability benefits to the ERCOT electric grid Because the process of seawater desalination is energy intensive participation in demand response could help to reduce electricity costs while posing a relatively low risk to plant operations if demand response participation is factored into plant design
Participation in non-ERCOT-dispatched demand response opportunities such as reducing load during 4CP intervals or in response to real-time electricity prices may also help to reduce electricity costs for seawater desalination plants in Texas As stakeholders in Texas continue to plan for possible future droughts in the region and identify water management strategies consideration of demand response could play a role in mitigating some costs associated with seawater desalination and allow seawater desalination plants to assist with maintaining electric reliability in the region
copy 2016 ERCOT All rights reserved 12
Study on the Demand Response Potential for Seawater Desalination Projects ERCOT Public
2 Seawater Desalination
There are two primary methods for seawater desalination distillation (also referred to as ldquothermalrdquo) and reverse osmosis Distillation uses heat to remove salts and minerals from seawater by boiling water at high pressures In contrast reverse osmosis technology forces saline water through a membrane to separate water from the salts and minerals While both distillation and reverse osmosis are energy intensive distillation requires thermal energy to heat the water and overall has a higher energy requirement whereas reverse osmosis requires primarily electrical energy and overall is less energy intensive ndash though still with significant electricity requirements
Globally most thermal desalination plants are located in the Middle East due to low energy prices in the region Plants located elsewhere including in the US typically use reverse osmosis technology2 There are two large existing seawater desalination plants in the US one in Carlsbad California providing water to the San Diego area and one in Gibsonton Florida providing water to the Tampa Bay area Both plants use reverse osmosis technology In addition there are several desalination projects currently in the planning stages or under development in Texas in the Corpus Christi area that would use reverse osmosis technology For that reason this report focuses on reverse osmosis technology in the evaluation of demand response potential of seawater desalination plants
While there are currently no existing seawater desalination plants in Texas there are several municipal and industrial brackish water desalination plants in the state According to the Texas Water Development Board (TWDB) there are 46 municipal brackish water desalination plants with capacities greater than 0025 million gallons per day (MGD) in Texas representing a total of 123 MGD of capacity3 The desalination of brackish water is typically less expensive compared to seawater due to the lower relative salinity of brackish water This study focuses exclusively on seawater desalination consistent with the requirements of HB 4097 but it should be noted that conclusions may also apply to brackish water desalination though at a different cost and scale
This section provides high-level information on the operations (Section 21) and economics (Section 22) of seawater desalination plants to inform the discussion of their demand response potential in Section 4
21 Seawater Desalination Plant Operations Seawater desalination plants typically range in capacity from less than 5 MGD up to 165 MGD For example the Carlsbad seawater desalination plant has a capacity of approximately 50 MGD and the plant in Tampa Bay has a capacity of approximately 25 MGD The associated electricity consumption ranges between 10 and 15 kWh1000 gallons produced depending on the salinity of the water being processed456 More saline water (eg seawater) requires larger amounts of electricity for desalination Thus a seawater desalination plant would have larger electricity consumption requirements compared to a similarly sized brackish water desalination plant
2 American Water ldquoInnovation Solutions within the Water Industry Desalinationrdquo Available at httpwwwamwatercomfilesInnovationsSolutionsWithinTheWaterIndustryDesalinationpdf 3 Texas Water Development Board ldquoDesalination Factsrdquo Available at httpswwwtwdbtexasgovinnovativewaterdesalfactsasp 4 American Membrane Technology Association April 2016 ldquoMembrane Desalination Power Usage Put in Perspectiverdquo Available at httpwwwamtaorgcomwp-contentuploads7_MembraneDesalinationPowerUsagePutInPerspectivepdf 5 Water Reuse Association November 2011 ldquoSeawater Desalination Power Consumptionrdquo Available at httpswatereuseorgwpshycontentuploads201510Power_consumption_white_paperpdf 6 Ghaffour N TM Missimer and G Amy January 2013 ldquoTechnical review and evaluation of the economics of water desalination Current and future challenges for better water supply sustainabilityrdquo Desalination 309 pp197-207 Available at httpswwwresearchgatenetpublication256693140_Technical_review_and_evaluation_of_the_economics_of_water_desalination_ Current_and_future_challenges_for_better_water_supply_sustainability
copy 2016 ERCOT All rights reserved 2
Study on the Demand Response Potential for Seawater Desalination Projects ERCOT Public
While the two existing seawater desalination plants in the US were co-located with power plants to ease compliance with regulations on water intake and discharge structures and reduce costs many other reverse osmosis desalination plants receive their electricity from the grid However plants may have on-site backup generation in case of a power outage This will vary depending on the size and design of the plant and other factors For example the Carlsbad plant in California does have diesel backup generation to power control systems and flushing systems in the case of a power outage The plant in Tampa Bay was not built with backup power due to potential storm surge risks from hurricanes and other storms The plant does use uninterruptible power supply (UPS) backup to power control systems during power outages
Reverse osmosis plants are typically designed with several ldquotrainsrdquo which consists of a high-pressure pump turbine and reverse osmosis membrane Desalination plants are turned on or off one train at a time in a highly controlled process The process of ramping up or down an individual train under normal operations typically takes one to two hours While plants can be designed to handle immediate shutdowns (ie in a power outage) re-starting a system after an interruption would take this amount of time In addition the saline water must be pretreated (ie filtered) before going through the reverse osmosis train and this can sometimes pose constraints on the flexibility of operations
Demand for water is the key factor driving the level of production at seawater desalination plants Typically the plant will have a contract or contracts with municipal or other water users to deliver desalinated water and is operated to meet that demand Alternatively if the plant is municipally owned it would similarly be operated to meet the level of water demand in conjunction with other available water sources If water demands are close to a plantrsquos full capacity the operatorrsquos flexibility to adjust its electricity consumption as part of demand response may be limited However this does mean that plant operations are fairly predictable on a day-to-day basis which is necessary for participation in demand response
The amount of flexibility in plant operations will also be impacted by the amount of water storage available For example if a plant has sufficient water storage on-site or storage within the customerrsquos distribution system it could provide flexibility for the plant to reduce its operations during peak hours when electricity prices are likely to be highest It would also mitigate the impacts of interruptions to production from demand response deployments
22 Seawater Desalination Plant Economics Seawater desalination is typically more expensive than other sources of water and a major driver of the overall cost is energy costs In 2016 the Carlsbad plant charged rates at between $2131 and $2367 per acre-foot78 This charge is intended to cover both the fixed costs of the plant and the variable costs to produce a unit volume of water Typically half to two thirds of the cost of providing desalinated seawater are accounted for by capital cost recovery with the remainder accounted for by operations and maintenance costs including electricity costs Electricity costs can account for 20shy25 of the total costs of seawater desalination with reverse osmosis technology9
Factors affecting the capital cost of a seawater desalination plant include plant size type of desalination process and pre-post-treatment technologies plant infrastructure (eg piping water storage backup power) and compliance with applicable regulations (eg regulations on intake structures brine byproduct disposal) A significant driver of operating and maintenance costs is membrane replacement Reverse osmosis membranes need to be replaced every few years and
7 Source San Diego County Water Authority ldquoSeawater Desalinationrdquo Available at httpwwwsdcwaorgseawater-desalination 8 Note that 1 acre-foot is approximately 325851 gallons 9 Based on technical input from Black amp Veatch
copy 2016 ERCOT All rights reserved 3
Study on the Demand Response Potential for Seawater Desalination Projects ERCOT Public
the rate at which they are replaced will depend on the salinity of the feedwater and how the plant is operated Treatment and disposal of the salty brine byproduct from desalination may also incur operating costs
Electricity costs will vary depending on a range of factors including the size of the plant type of desalination technology source of electricity and quality of the feedwater As previously noted more saline water requires higher amounts of electricity in desalination and thus the amount of electricity consumption is a key difference between brackish water and seawater desalination As a result electricity costs comprise a significant share of the costs of seawater desalination These costs could potentially be defrayed in part by participation in demand response initiatives
3 Demand Response Opportunities in ERCOT
Broadly speaking demand response can be broken down into two major categories dispatchable or non-dispatchable For purposes of this report we will define dispatchable as those demand response events that are initiated by ERCOT and non-dispatchable as an event not specifically initiated by ERCOT These non-dispatchable events may include decisions made by the end-use customer to alter its consumption pattern or may include contractual obligations with another entity such as the end-use customerrsquos retail electric provider (ldquoREPrdquo) to alter consumption patterns
ERCOTrsquos wholesale market is open to several types of dispatchable demand response which are deployed to maintain system reliability Demand-side resources providing Emergency Response Service (ERS) may offer based on either a 10 or 30-minute response time commonly referred to as the ldquoramp periodrdquo Alternatively demand-side resources may register and qualify as a Load Resource that can provide Reserves in the Ancillary Services market The most common service provided by demand-side resources is Responsive Reserve Service which requires an under-frequency relay that can instantaneously interrupt the load during certain system reliability events Some demand-side resources can also participate in other Ancillary Services as Controllable Load Resources that require sophisticated control systems that allow them to be deployed in a more incremental proportional manner
Non-dispatchable demand response in ERCOT can include a response to avoid transmission costs where rates are based on Four Coincident Peak Pricing (4CP) response to wholesale energy prices initiated by the customer or by a REP or other load-serving entity (ldquoLSErdquo) or utility-managed Load Management programs (LM)
The sections that follow provide a description of both ERCOT-dispatched (Section 31) and nonshyERCOT-dispatched (Section 32) demand response For a more detailed description of opportunities for demand-side resources to participate in demand response in ERCOT see ERCOTrsquos guide Load Participation in the ERCOT Nodal Market10
31 ERCOT-Dispatched Demand Response There are two main demand response reliability-based services administered by ERCOT participation by demand-side resources in the Ancillary Services market and participation in ERS These services are dispatched by ERCOT during system emergencies
10 Available at httpwwwercotcomcontentservicesprogramsloadLoad20Participation20in20the20ERCOT20Nodal20Market_302d oc
copy 2016 ERCOT All rights reserved 4
Study on the Demand Response Potential for Seawater Desalination Projects ERCOT Public
Demand-side resources with demand response capability that can meet a set of performance requirements can be qualified to provide Ancillary Services as Load Resources in the Ancillary Services Market The value of having a Load Resource available to reduce load is equal to the value of having a generator available to increase its generation at a generating plant The providers of operating reserves selected to provide Ancillary Services are eligible for capacity payments regardless of whether the Resource is actually deployed (or curtailed in the case of the Load Resource)
ERCOT holds auctions on a daily basis for each of the following Ancillary Services Regulation Up Regulation Down Responsive Reserve and Non-Spinning Reserve11 Table 1 describes the various Load Resource types and their qualification requirements and eligible services
Table 1 Load Resource Types and Ancillary Services
Service Load Resource Type a Qualification Responsive Reserves (le50 of total Reserve requirement)
Non Controllable Under-Frequency Relay and 10-minute ramp to manual dispatch instruction
Responsive Reserves
Controllable Primary Frequency Response and follow 5-minute dispatch instructions
Regulation-Up Regulation-Down
Controllable Primary Frequency Response and respond to Regulation deployments
Non-Spin Reserves Controllable Follow 5-minute dispatch instructions a A Controllable Load Resource is a Load Resource capable of controllably reducing or increasing consumption under dispatch control by ERCOT
Demand-side resources that agree to reduce load when directed by ERCOT and that meet other metering and operational requirements as specified in the ERCOT Protocols may participate in Ancillary Services market auctions As noted in Table 1 the type of Ancillary Service that a Load Resource may provide will depend upon the demand-side resourcersquos response time and metering system as well as other requirements described in the Protocols In the Responsive Reserve and Non-Spin Reserve markets the Load Resource will receive capacity payments regardless of whether or not the load was actually deployed but the load must be available for deployment at any time while providing the service
ERCOT procures ERS to maintain grid reliability during emergency conditions and reduce the likelihood of the need for rotating outages ERS participants may offer to provide demand response with either a 10-minute ramp period requirement (similar to Load Resources providing Responsive Reserve Service) or a 30-minute ramp period requirement ERS Resources do not have the same telemetry and under-frequency relay requirements as Load Resources
11 Regulation Up and Regulation Down service respond to signals from ERCOT every 4 seconds to respond to changes in system frequency full response has to be provided within 5 minutes Responsive reserves must provide their committed capacity either instantaneously in an under-frequency event (eg due to a generator outage) or in energy scarcity conditions within ten minutes following an instruction from ERCOT Non-spinning reserves must provide their committed capacity within 30 minutes based on economic dispatch instructions Non-spinning reserve is used as replacement reserve to replenish other ancillary services and during energy scarcity
copy 2016 ERCOT All rights reserved 5
Study on the Demand Response Potential for Seawater Desalination Projects ERCOT Public
ERS is procured through a request for proposal (RFP) process three times per year for four-month contract terms each of which is further split into smaller time periods based on business cycles and other factors Demand-side resources may choose to submit offers in all time periods or only in those that best fit their unique circumstances and may vary both the price and demand response capacity offers by time period
Payments for ERS are performed up to 80 days after each four month contract term has ended and are subject to downward revision based upon delivered demand response capacity and the demand-side resourcersquos availability during the contract term
32 Non-ERCOT-Dispatched Demand Response The options listed below are not dispatched by ERCOT but they either are controlled directly by a customer or are dispatchable by another entity such as a demand response provider (ldquoDR Providerrdquo) REP or a transmission and distribution utility
Many industrial customers are subject to transmission charges based upon a Four Coincident Peak (4CP) demand The 4CP demand is determined by averaging the consumerrsquos actual demand during the 15-minute settlement interval with the highest ERCOT demand during each of the four summer months (June through September) This measured 4CP demand serves as the basis for the customerrsquos transmission tariff charges for the following year By correctly predicting the ERCOT system peaks during the summer and curtailing load during those intervals a consumer can help reduce the stress imposed on the electric system during peak periods of consumption and reduce its transmission charges for the following calendar year
In the competitive areas of ERCOT consumers can contract with their REP or a DR Provider to have their load respond to the REPrsquos or DR Providerrsquos instructions The contract will usually outline the parameters of this response ndash at what times and frequency demand response events can be called ramp periods sustained response periods compensation etc Because this response is a contractual matter between the REP or DR Provider and the consumer a great deal of variety can be present in these arrangements For example a consumerrsquos response may be voluntary or required compensation could come in the form of reduced energy prices or rebate payments for each curtailment event consumers might be notified up to a day in advance or could have no notification at all (for automated curtailment)
In areas of ERCOT not open to competition interruptible tariffs may be available These tariffs will usually offer a reduced energy price for defined curtailment obligations
REPs may offer dynamic pricing options or consumers within a municipality or cooperative may have their energy prices determined by a published tariff which also may be structured based upon Time-of-Use (TOU) or have a Critical Peak Pricing (CPP) or Peak Time Rebate (PTR) component Self-directed price response refers to consumers making an independent decision to respond to energy prices contained in a governing tariff or in either the ERCOT Day Ahead or Real Time energy markets
TOU offerings will typically have higher energy prices during normal peak periods ndash for example a TOU tariff may charge one price during Monday through Friday from 2 pm through 8 pm and another price during all other times Customers may choose to reduce consumption during these high priced periods Load reduction can be accomplished by load shifting (loads can be shifted by
copy 2016 ERCOT All rights reserved 6
Study on the Demand Response Potential for Seawater Desalination Projects ERCOT Public
rescheduling certain processes or by utilizing thermal storage) ending certain processes that are no longer economic or through energy efficiency measures
Offerings that incorporate CPP usually have prescribed high prices only during certain defined periods ndash for example when load or prices are expected to reach a certain level Response to CPP may be similar to those employed under TOU tariffs especially if CPP is reached frequently More often CPP is infrequent and as such short-term load curtailment may be the more appropriate response to meet economic objectives
4 Demand Response Potential for Seawater Desalination
This section evaluates whether the operational characteristics and economics of seawater desalination plants would enable them to participate in one or more of the various demand response opportunities in the ERCOT Region To date participation of seawater desalination plants in demand response programs has been limited Neither the plant in Carlsbad nor the plant in Tampa Bay participate in demand response programs in California or Florida respectively However as will be described below it appears that these plants can be designed and operated to meet the requirements for participation in demand response and receive economic benefit from participation in these programs
Section 41 describes the operational parameters that must be met for a demand-side resource to provide ERCOT-dispatched demand response and evaluates the ability of seawater desalination plants to meet these criteria Section 42 discusses the tradeoffs between payments for participation in ERCOT-dispatched demand response and potential additional costs posed to seawater desalination plants Finally Section 43 presents other opportunities for seawater desalination plants to reduce their electricity costs outside of ERCOTrsquos reliability-based services that are open to demand response assets
41 Operational Considerations for ERCOT-Dispatched Demand Response There are several key operational parameters that impact a demand-side resourcersquos ability to participate in different demand response services response time recovery time predictability of electrical demand and flexibility of operations This section discusses each of these considerations as they apply to seawater desalination plants
As discussed in Section 31 one of the differentiating factors between ERCOTrsquos demand response products is the amount of time within which a demand-side resource must respond to a deployment instruction to reduce electricity consumption during an event Participation in RRS requires an automatic response within either half a second (ie instantaneous) based on grid frequency or within 10 minutes via a manual instruction ERS requires a response time of either 10 or 30 minutes As noted in Section 21 the typical time to take a reverse osmosis train on- or off-line is 1-2 hours under normal controlled operations To comply with the response time requirements of RRS or ERS a seawater desalination plant would need to be able to reduce its electricity consumption far more quickly than in normal operations This is an element of plant design that would need to be accounted for in the specifications of the project Considerations include the potential need for on-site backup generation including uninterruptible power supply potential impacts to plant infrastructure (eg piping) reverse osmosis membranes and pretreatment systems
The two large US desalination plants provide illustrative counterpoints in this respect The Carlsbad plant was designed to withstand instantaneous power interruptions and has on-site backup generation including uninterruptible power supply to provide the ability to power control systems and flush the membranes in the event of a power loss In contrast the Tampa Bay plant was not
copy 2016 ERCOT All rights reserved 7
Study on the Demand Response Potential for Seawater Desalination Projects ERCOT Public
designed with on-site backup generation and a loss of power would result in a plant shutdown and may require several days to bring the plant back on-line Thus it appears that it is technically possible for a seawater desalination plant to meet the response time requirements for participation in demand response so long as this factor is considered in the design of the facility
The time it takes a desalination train to return to operations after an event is also a consideration Demand-side resources participating in RRS must be able to come back on-line within three hours and those participating in ERS must return within 10 hours Again it appears that it is technically feasible for desalination plants to meet this requirement so long as this requirement is considered in the plant design
An additional consideration is the predictability of a demand-side resourcersquos electricity consumption Participation in the responsive reserves ancillary service market requires bidding in the day-ahead market and thus a demand-side resource must know with great accuracy (within 95) its electrical demand at least a day ahead of time For ERS auctions are held three times a year for four-month contract periods Thus to participate in ERS a resource must know its forecasted electrical demand several months in advance Because seawater desalination plant operations are driven by contracted demand for water it is likely that a plant operator would have a good idea of the plantrsquos electrical demand days or even weeksmonths in advance especially for summer months when demand is likely to be relatively steady An important consideration however is the salinity of the water which drives the electrical requirements and which can be impacted by recent weather events Similarly reductions in demand for water during non-summer months or wet summer days where demand may be reduced could also impact a plantrsquos ability to predict its electricity demand
Finally a seawater desalination plant must have sufficient flexibility in its day-to-day operations so that it can afford to lose several hours of production when deployed for demand response It should be noted that demand-side resources participating in RRS and ERS are called infrequently demand-side resources providing responsive reserves were deployed one time in 2015 and ERS was not deployed that year However this is an important factor to consider if a plant is operating at close to full capacity and would incur financial penalties if it fails to meet its contract obligations due to a demand response event Including additional storage and building a plant with extra capacity could help to mitigate this risk It should also be noted that a plant operator does not need to commit the full plant capacity to these services but rather can specify an amount of MW that will be committed Thus a plant operator could mitigate issues both with predictability and flexibility of plant operations by committing only a portion of its predicted electrical demand to participate in demand response
Considering these factors together it appears that seawater desalination plants could be designed to meet the operational requirements for participation in ERCOTrsquos demand response services (both RRS and ERS) Because the ability to meet the requirements is dependent on the plant design demand response would need to be considered early in a projectrsquos development if participation is desirable Whether project developers will choose to address these requirements will depend on the economic benefits of participation in demand response which will be discussed in the next section
42 Economic Considerations for ERCOT-Dispatched Demand Response This section describes the economic benefits to demand-side resources from participation in ERCOT-dispatched demand response programs The average price paid for a demand-side resource participating in RRS in 2015 was $1087 per MW per hour and for ERS was $645 per MW per hour for the contract periods during the 2015 program year These payments could provide a significant financial benefit to seawater desalination plants To give a simplified example for a plant with an electrical demand of 10 MW operating at a 100 annual load factor (10 MW times 24 hours times 365 days) the annual benefit would be on the order of $500000 for ERS or $1 million for RRS
copy 2016 ERCOT All rights reserved 8
Study on the Demand Response Potential for Seawater Desalination Projects ERCOT Public
In 2015 demand-side resources providing responsive reserves were deployed one time for a duration of 10 minutes and ERS was not deployed12 The most ERS was ever deployed in a single year was two times in 2011 Thus participation in either program could result in a substantial payment to a seawater desalination plant with a relatively low risk of deployment and associated disruption of plant operations although it is important to note that participation in either ERCOT service subjects demand response resources to annual unannounced testing Other than testing the frequency of deployment will depend on grid conditions and is a risk that should be considered
The financial benefits of participation must be weighed against the costs of designing facilities with the capabilities to operate in this manner These include
bull The costs to design the plant to reduce electrical demand within the required timeframes for demand response and to withstand an instantaneous interruption if not already part of the plant design For example a plant may need to be designed to have backup power generation on-site In addition there could also be costs to restart the system after an interruption
bull The costs to build a plant with excess capacity andor storage to make up for lost production hours when demand response is deployed This will add to the total capital costs of the project Land area constraints should also be considered when considering additional storage as the space requirements for the necessary storage capacity could be significant
bull Costs associated with the impact of interruptions on plant processes (eg more frequent replacement of membranes impacts to pretreatment system or plant infrastructure)
bull Potential financial penalties that would be incurred if deployment as part of demand response were to result in failure to meet contract obligations to supply water
bull The loss of potential benefits in the form of cost avoidance from participation in non-ERCOTshydispatched demand response opportunities (see Section 43) If a plant is committed to RRS or ERS the plant operator would lose the flexibility to take advantage of these other opportunities to reduce their electricity costs
The interplay of these benefits and costs will determine whether it would be beneficial for a future seawater desalination plant to participate in demand response in ERCOT
43 Considerations for Non-ERCOT-Dispatched Demand Response Outside of the reliability-based services administered by ERCOT there are other opportunities for seawater desalination plants to reduce their electricity costs As described in Section 321 seawater desalination plants may be able to reduce the demand charges on their electricity bills through curtailing load during 4CP intervals In addition plant operators may adjust operations in response to real-time electricity prices to take advantage of lower off-peak prices and avoid price spikes (see Sections 322 and 323) All of these opportunities require that the plant have flexibility to reduce production during certain times of the day
In the ERCOT region as noted above a portion of transmission and distribution charges are set based on the peak systemwide 15-minute interval of the four summer months (June through September) referred to as the four coincident peaks (4CP) Large customers can reduce or avoid this charge by reducing electrical consumption during these four peak intervals AEP Central Texas and CenterPoint are the transmission providers covering the majority of the Gulf Coast in Texas13
12 ERCOT June 2016 ldquoLoad Resource Deployment Updaterdquo Available at httpwwwercotcomcontentwcmkey_documents_lists870985_RRS_Load_Resource_Deployment_Updatepdf 13 It is also possible that a seawater desalination plant could be located in an area that as not opted in to competition in which case the plant owner would need to negotiate its electricity charges bilaterally with the Non Opt-In Entity (NOIE)
copy 2016 ERCOT All rights reserved 9
Study on the Demand Response Potential for Seawater Desalination Projects ERCOT Public
Assuming a future seawater desalination plant would be connected at transmission-level voltages the relevant 4CP charges based on the 2016 tariffs accounting for both transmission charges and transmission cost recovery factors would be $41425 per 4CP kW for AEP Central Texas and $41870 per 4CP kVA for CenterPoint14 If a seawater desalination plant has 10 MW of load and is capable of interrupting all of it and successfully does so for all four 4CP intervals the savings based on the 2016 tariffs would be approximately $500000 per year ($41425 times 1000 (kW to MW) times 10 MW times 12 months) Thus a seawater desalination plant that reduces its electricity use during the 4CP intervals could avert some or all of these charges
Another opportunity for seawater desalination plants to reduce their electricity costs is through adjusting operations in response to real-time electricity prices In 2015 the average electricity price in ERCOT was $2677MWh However prices exceeded $50MWh in 254 hours (3 of all hours) $100MWh in 88 hours (1) $200MWh in 40 hours (05) and $300MWh in 21 hours (02) Prices exceeded $3000MWh for 021 hours15 Depending on the desalination plantrsquos exposure to real-time wholesale market prices (via its retail contract) the degree of high prices the plant owner is willing to avoid and grid conditions in a given year reducing unit operations in order to avoid high electricity prices could impact operators for anywhere between a few and several hundred hours out of the year In addition a plant can plan its operations to take advantage of lower electricity prices during off-peak periods (eg at night when generation from wind is high) For example at least one company is marketing a modular desalination unit design intended to take advantage of low prices during periods of high renewables generation and to provide grid reliability services through demand response16
There are several factors to consider regarding these opportunities to reduce electricity costs The plant would need to monitor the ERCOT market or hire a contractor to do so in order to know when to reduce demand for electricity These programs do not impose any requirements on response time as with RRS or ERS and there may be sufficient warning of 4CP intervals or peak pricing to allow the plant operator to plan its operations earlier in the day with sufficient time to ramp down production under controlled conditions However quicker ramping capability may be desirable to respond to electricity price fluctuations
For 4CP because the four intervals used to set demand charges are not known ahead of time it is likely that the plant would need to reduce its demand multiple times per summer to ensure the 4CP intervals are hit impacting production at the facility Timing operations to coincide with off-peak pricing or to avoid price spikes would similarly result in reduced operations during certain hours To offset the lost production hours the plant may need to be designed with extra capacity and water storage capability to maintain the ability to meet its contractual obligations for freshwater delivery Because the period of reduced operations is greater than with ERCOT-dispatched demand response services this need would be greater for a seawater desalination plant reducing load during 4CP intervals or in response to real-time electricity prices and would increase the capital costs of the project It should also be noted that high prices in the ERCOT Region typically but not always occur in summer months when drought conditions are more likely to develop and demand for desalinated water is likely to be highest This may limit the flexibility of the plant to time its electricity consumption to avoid high-priced hours
14 Public Utility Commission of Texas ldquoTransmission and Distribution Rates for Investor Owned Utilitiesrdquo Available at httpwwwpuctexasgovindustryelectricratestdraspx 15 Potomac Economics June 2016 2015 State of the Market Report for the ERCOT Wholesale Electricity Markets Available at httpswwwpotomaceconomicscomindexphpmarkets_monitoredERCOT 16 Sisyan LLC ldquoDemand Response Desalinationrdquo Available at httprenewabledesalinationcomwpshycontentuploads201506Demand-Response-Desalinationpdf
copy 2016 ERCOT All rights reserved 10
Study on the Demand Response Potential for Seawater Desalination Projects ERCOT Public
In addition the plantrsquos ability to participate in demand response would also be limited for those hours it is reducing load as part of 4CP response or in response to real-time prices because the plant would not be able to reduce its electricity consumption if that demand is already committed to another demand response service Thus participating in demand response versus taking advantage of these other opportunities may be to some extent mutually exclusive
5 Conclusion
Based on this analysis it appears that the operational characteristics of seawater desalination plants would allow them to participate in demand response opportunities in ERCOT so long as the necessary operational requirements are considered in the design specifications of the plant Project developers should consider the necessary requirements early in the plant design Whether the economic benefits of participation would provide a sufficient incentive for them to do so will depend on the costs of accommodating those operational requirements and whether there is the flexibility available to operate the plant as necessary under these programs Though most existing seawater desalination plants do not participate in demand response programs it does appear that participation by these plants is possible and could result in a financial benefit Table 2 compares the different demand response opportunities available to demand-side resources in ERCOT
Table 2 Comparison of Demand Response Opportunities Demand Response
Opportunity Requirements for
Participation Impacts to Plant
Operations Financial Benefit Ancillary Services ndash Responsive Reserve Service (RRS)
bull Under-Frequency Relay bull Instantaneous or 10 minute
response time bull Recover load within 3
hours bull Bid in day-ahead market
bull Deployed once in 2015 for 10 minutes bull Subject to annual
unannounced testing
bull $1087 per MW per hour (based on 2015 prices)
Emergency Response Service (ERS)
bull 10 or 30 minute response time bull Recover load within 10
hours bull Four-month contract term
bull Not deployed in 2015 the most times ever deployed in a single year was twice in 2011 bull Subject to annual
unannounced testing
bull $645 per MW per hour (based on 2015 prices)
Four Coincident bull Interval Data Recorder bull Likely plant will need to bull Avoid ~$48000 per 4CP Peak (4CP) (IDR) meter
bull Ability to predict system-wide peak demand hours during summer months
reduce load multiple times per summer to hit 4CP intervals bull Likely to be able to predict
possible 4CP intervals earlier in day
MW per year (based on 2016 tariffs) if successful in reducing during all four summer months
LSE or DR Provider Contracted Price Response
bull Varies based on contractual arrangements
bull Varies based on contractual arrangements
bull Varies based on contractual arrangements
Self-Directed Price bull Retail contract with bull Varies depending on bull Varies depending on Response exposure to real-time
market prices bull Ability to monitor real-time
prices in ERCOT wholesale market
number and severity of pricing events bull May be able to predict
peak pricing events earlier in day
number and severity of pricing events
copy 2016 ERCOT All rights reserved 11
Study on the Demand Response Potential for Seawater Desalination Projects ERCOT Public
Demand response programs in ERCOT provide opportunities for demand-side resources to defray their electricity costs and provide reliability benefits to the ERCOT electric grid Because the process of seawater desalination is energy intensive participation in demand response could help to reduce electricity costs while posing a relatively low risk to plant operations if demand response participation is factored into plant design
Participation in non-ERCOT-dispatched demand response opportunities such as reducing load during 4CP intervals or in response to real-time electricity prices may also help to reduce electricity costs for seawater desalination plants in Texas As stakeholders in Texas continue to plan for possible future droughts in the region and identify water management strategies consideration of demand response could play a role in mitigating some costs associated with seawater desalination and allow seawater desalination plants to assist with maintaining electric reliability in the region
copy 2016 ERCOT All rights reserved 12

Study on the Demand Response Potential for Seawater Desalination Projects ERCOT Public
While the two existing seawater desalination plants in the US were co-located with power plants to ease compliance with regulations on water intake and discharge structures and reduce costs many other reverse osmosis desalination plants receive their electricity from the grid However plants may have on-site backup generation in case of a power outage This will vary depending on the size and design of the plant and other factors For example the Carlsbad plant in California does have diesel backup generation to power control systems and flushing systems in the case of a power outage The plant in Tampa Bay was not built with backup power due to potential storm surge risks from hurricanes and other storms The plant does use uninterruptible power supply (UPS) backup to power control systems during power outages
Reverse osmosis plants are typically designed with several ldquotrainsrdquo which consists of a high-pressure pump turbine and reverse osmosis membrane Desalination plants are turned on or off one train at a time in a highly controlled process The process of ramping up or down an individual train under normal operations typically takes one to two hours While plants can be designed to handle immediate shutdowns (ie in a power outage) re-starting a system after an interruption would take this amount of time In addition the saline water must be pretreated (ie filtered) before going through the reverse osmosis train and this can sometimes pose constraints on the flexibility of operations
Demand for water is the key factor driving the level of production at seawater desalination plants Typically the plant will have a contract or contracts with municipal or other water users to deliver desalinated water and is operated to meet that demand Alternatively if the plant is municipally owned it would similarly be operated to meet the level of water demand in conjunction with other available water sources If water demands are close to a plantrsquos full capacity the operatorrsquos flexibility to adjust its electricity consumption as part of demand response may be limited However this does mean that plant operations are fairly predictable on a day-to-day basis which is necessary for participation in demand response
The amount of flexibility in plant operations will also be impacted by the amount of water storage available For example if a plant has sufficient water storage on-site or storage within the customerrsquos distribution system it could provide flexibility for the plant to reduce its operations during peak hours when electricity prices are likely to be highest It would also mitigate the impacts of interruptions to production from demand response deployments
22 Seawater Desalination Plant Economics Seawater desalination is typically more expensive than other sources of water and a major driver of the overall cost is energy costs In 2016 the Carlsbad plant charged rates at between $2131 and $2367 per acre-foot78 This charge is intended to cover both the fixed costs of the plant and the variable costs to produce a unit volume of water Typically half to two thirds of the cost of providing desalinated seawater are accounted for by capital cost recovery with the remainder accounted for by operations and maintenance costs including electricity costs Electricity costs can account for 20shy25 of the total costs of seawater desalination with reverse osmosis technology9
Factors affecting the capital cost of a seawater desalination plant include plant size type of desalination process and pre-post-treatment technologies plant infrastructure (eg piping water storage backup power) and compliance with applicable regulations (eg regulations on intake structures brine byproduct disposal) A significant driver of operating and maintenance costs is membrane replacement Reverse osmosis membranes need to be replaced every few years and
7 Source San Diego County Water Authority ldquoSeawater Desalinationrdquo Available at httpwwwsdcwaorgseawater-desalination 8 Note that 1 acre-foot is approximately 325851 gallons 9 Based on technical input from Black amp Veatch
copy 2016 ERCOT All rights reserved 3
Study on the Demand Response Potential for Seawater Desalination Projects ERCOT Public
the rate at which they are replaced will depend on the salinity of the feedwater and how the plant is operated Treatment and disposal of the salty brine byproduct from desalination may also incur operating costs
Electricity costs will vary depending on a range of factors including the size of the plant type of desalination technology source of electricity and quality of the feedwater As previously noted more saline water requires higher amounts of electricity in desalination and thus the amount of electricity consumption is a key difference between brackish water and seawater desalination As a result electricity costs comprise a significant share of the costs of seawater desalination These costs could potentially be defrayed in part by participation in demand response initiatives
3 Demand Response Opportunities in ERCOT
Broadly speaking demand response can be broken down into two major categories dispatchable or non-dispatchable For purposes of this report we will define dispatchable as those demand response events that are initiated by ERCOT and non-dispatchable as an event not specifically initiated by ERCOT These non-dispatchable events may include decisions made by the end-use customer to alter its consumption pattern or may include contractual obligations with another entity such as the end-use customerrsquos retail electric provider (ldquoREPrdquo) to alter consumption patterns
ERCOTrsquos wholesale market is open to several types of dispatchable demand response which are deployed to maintain system reliability Demand-side resources providing Emergency Response Service (ERS) may offer based on either a 10 or 30-minute response time commonly referred to as the ldquoramp periodrdquo Alternatively demand-side resources may register and qualify as a Load Resource that can provide Reserves in the Ancillary Services market The most common service provided by demand-side resources is Responsive Reserve Service which requires an under-frequency relay that can instantaneously interrupt the load during certain system reliability events Some demand-side resources can also participate in other Ancillary Services as Controllable Load Resources that require sophisticated control systems that allow them to be deployed in a more incremental proportional manner
Non-dispatchable demand response in ERCOT can include a response to avoid transmission costs where rates are based on Four Coincident Peak Pricing (4CP) response to wholesale energy prices initiated by the customer or by a REP or other load-serving entity (ldquoLSErdquo) or utility-managed Load Management programs (LM)
The sections that follow provide a description of both ERCOT-dispatched (Section 31) and nonshyERCOT-dispatched (Section 32) demand response For a more detailed description of opportunities for demand-side resources to participate in demand response in ERCOT see ERCOTrsquos guide Load Participation in the ERCOT Nodal Market10
31 ERCOT-Dispatched Demand Response There are two main demand response reliability-based services administered by ERCOT participation by demand-side resources in the Ancillary Services market and participation in ERS These services are dispatched by ERCOT during system emergencies
10 Available at httpwwwercotcomcontentservicesprogramsloadLoad20Participation20in20the20ERCOT20Nodal20Market_302d oc
copy 2016 ERCOT All rights reserved 4
Study on the Demand Response Potential for Seawater Desalination Projects ERCOT Public
Demand-side resources with demand response capability that can meet a set of performance requirements can be qualified to provide Ancillary Services as Load Resources in the Ancillary Services Market The value of having a Load Resource available to reduce load is equal to the value of having a generator available to increase its generation at a generating plant The providers of operating reserves selected to provide Ancillary Services are eligible for capacity payments regardless of whether the Resource is actually deployed (or curtailed in the case of the Load Resource)
ERCOT holds auctions on a daily basis for each of the following Ancillary Services Regulation Up Regulation Down Responsive Reserve and Non-Spinning Reserve11 Table 1 describes the various Load Resource types and their qualification requirements and eligible services
Table 1 Load Resource Types and Ancillary Services
Service Load Resource Type a Qualification Responsive Reserves (le50 of total Reserve requirement)
Non Controllable Under-Frequency Relay and 10-minute ramp to manual dispatch instruction
Responsive Reserves
Controllable Primary Frequency Response and follow 5-minute dispatch instructions
Regulation-Up Regulation-Down
Controllable Primary Frequency Response and respond to Regulation deployments
Non-Spin Reserves Controllable Follow 5-minute dispatch instructions a A Controllable Load Resource is a Load Resource capable of controllably reducing or increasing consumption under dispatch control by ERCOT
Demand-side resources that agree to reduce load when directed by ERCOT and that meet other metering and operational requirements as specified in the ERCOT Protocols may participate in Ancillary Services market auctions As noted in Table 1 the type of Ancillary Service that a Load Resource may provide will depend upon the demand-side resourcersquos response time and metering system as well as other requirements described in the Protocols In the Responsive Reserve and Non-Spin Reserve markets the Load Resource will receive capacity payments regardless of whether or not the load was actually deployed but the load must be available for deployment at any time while providing the service
ERCOT procures ERS to maintain grid reliability during emergency conditions and reduce the likelihood of the need for rotating outages ERS participants may offer to provide demand response with either a 10-minute ramp period requirement (similar to Load Resources providing Responsive Reserve Service) or a 30-minute ramp period requirement ERS Resources do not have the same telemetry and under-frequency relay requirements as Load Resources
11 Regulation Up and Regulation Down service respond to signals from ERCOT every 4 seconds to respond to changes in system frequency full response has to be provided within 5 minutes Responsive reserves must provide their committed capacity either instantaneously in an under-frequency event (eg due to a generator outage) or in energy scarcity conditions within ten minutes following an instruction from ERCOT Non-spinning reserves must provide their committed capacity within 30 minutes based on economic dispatch instructions Non-spinning reserve is used as replacement reserve to replenish other ancillary services and during energy scarcity
copy 2016 ERCOT All rights reserved 5
Study on the Demand Response Potential for Seawater Desalination Projects ERCOT Public
ERS is procured through a request for proposal (RFP) process three times per year for four-month contract terms each of which is further split into smaller time periods based on business cycles and other factors Demand-side resources may choose to submit offers in all time periods or only in those that best fit their unique circumstances and may vary both the price and demand response capacity offers by time period
Payments for ERS are performed up to 80 days after each four month contract term has ended and are subject to downward revision based upon delivered demand response capacity and the demand-side resourcersquos availability during the contract term
32 Non-ERCOT-Dispatched Demand Response The options listed below are not dispatched by ERCOT but they either are controlled directly by a customer or are dispatchable by another entity such as a demand response provider (ldquoDR Providerrdquo) REP or a transmission and distribution utility
Many industrial customers are subject to transmission charges based upon a Four Coincident Peak (4CP) demand The 4CP demand is determined by averaging the consumerrsquos actual demand during the 15-minute settlement interval with the highest ERCOT demand during each of the four summer months (June through September) This measured 4CP demand serves as the basis for the customerrsquos transmission tariff charges for the following year By correctly predicting the ERCOT system peaks during the summer and curtailing load during those intervals a consumer can help reduce the stress imposed on the electric system during peak periods of consumption and reduce its transmission charges for the following calendar year
In the competitive areas of ERCOT consumers can contract with their REP or a DR Provider to have their load respond to the REPrsquos or DR Providerrsquos instructions The contract will usually outline the parameters of this response ndash at what times and frequency demand response events can be called ramp periods sustained response periods compensation etc Because this response is a contractual matter between the REP or DR Provider and the consumer a great deal of variety can be present in these arrangements For example a consumerrsquos response may be voluntary or required compensation could come in the form of reduced energy prices or rebate payments for each curtailment event consumers might be notified up to a day in advance or could have no notification at all (for automated curtailment)
In areas of ERCOT not open to competition interruptible tariffs may be available These tariffs will usually offer a reduced energy price for defined curtailment obligations
REPs may offer dynamic pricing options or consumers within a municipality or cooperative may have their energy prices determined by a published tariff which also may be structured based upon Time-of-Use (TOU) or have a Critical Peak Pricing (CPP) or Peak Time Rebate (PTR) component Self-directed price response refers to consumers making an independent decision to respond to energy prices contained in a governing tariff or in either the ERCOT Day Ahead or Real Time energy markets
TOU offerings will typically have higher energy prices during normal peak periods ndash for example a TOU tariff may charge one price during Monday through Friday from 2 pm through 8 pm and another price during all other times Customers may choose to reduce consumption during these high priced periods Load reduction can be accomplished by load shifting (loads can be shifted by
copy 2016 ERCOT All rights reserved 6
Study on the Demand Response Potential for Seawater Desalination Projects ERCOT Public
rescheduling certain processes or by utilizing thermal storage) ending certain processes that are no longer economic or through energy efficiency measures
Offerings that incorporate CPP usually have prescribed high prices only during certain defined periods ndash for example when load or prices are expected to reach a certain level Response to CPP may be similar to those employed under TOU tariffs especially if CPP is reached frequently More often CPP is infrequent and as such short-term load curtailment may be the more appropriate response to meet economic objectives
4 Demand Response Potential for Seawater Desalination
This section evaluates whether the operational characteristics and economics of seawater desalination plants would enable them to participate in one or more of the various demand response opportunities in the ERCOT Region To date participation of seawater desalination plants in demand response programs has been limited Neither the plant in Carlsbad nor the plant in Tampa Bay participate in demand response programs in California or Florida respectively However as will be described below it appears that these plants can be designed and operated to meet the requirements for participation in demand response and receive economic benefit from participation in these programs
Section 41 describes the operational parameters that must be met for a demand-side resource to provide ERCOT-dispatched demand response and evaluates the ability of seawater desalination plants to meet these criteria Section 42 discusses the tradeoffs between payments for participation in ERCOT-dispatched demand response and potential additional costs posed to seawater desalination plants Finally Section 43 presents other opportunities for seawater desalination plants to reduce their electricity costs outside of ERCOTrsquos reliability-based services that are open to demand response assets
41 Operational Considerations for ERCOT-Dispatched Demand Response There are several key operational parameters that impact a demand-side resourcersquos ability to participate in different demand response services response time recovery time predictability of electrical demand and flexibility of operations This section discusses each of these considerations as they apply to seawater desalination plants
As discussed in Section 31 one of the differentiating factors between ERCOTrsquos demand response products is the amount of time within which a demand-side resource must respond to a deployment instruction to reduce electricity consumption during an event Participation in RRS requires an automatic response within either half a second (ie instantaneous) based on grid frequency or within 10 minutes via a manual instruction ERS requires a response time of either 10 or 30 minutes As noted in Section 21 the typical time to take a reverse osmosis train on- or off-line is 1-2 hours under normal controlled operations To comply with the response time requirements of RRS or ERS a seawater desalination plant would need to be able to reduce its electricity consumption far more quickly than in normal operations This is an element of plant design that would need to be accounted for in the specifications of the project Considerations include the potential need for on-site backup generation including uninterruptible power supply potential impacts to plant infrastructure (eg piping) reverse osmosis membranes and pretreatment systems
The two large US desalination plants provide illustrative counterpoints in this respect The Carlsbad plant was designed to withstand instantaneous power interruptions and has on-site backup generation including uninterruptible power supply to provide the ability to power control systems and flush the membranes in the event of a power loss In contrast the Tampa Bay plant was not
copy 2016 ERCOT All rights reserved 7
Study on the Demand Response Potential for Seawater Desalination Projects ERCOT Public
designed with on-site backup generation and a loss of power would result in a plant shutdown and may require several days to bring the plant back on-line Thus it appears that it is technically possible for a seawater desalination plant to meet the response time requirements for participation in demand response so long as this factor is considered in the design of the facility
The time it takes a desalination train to return to operations after an event is also a consideration Demand-side resources participating in RRS must be able to come back on-line within three hours and those participating in ERS must return within 10 hours Again it appears that it is technically feasible for desalination plants to meet this requirement so long as this requirement is considered in the plant design
An additional consideration is the predictability of a demand-side resourcersquos electricity consumption Participation in the responsive reserves ancillary service market requires bidding in the day-ahead market and thus a demand-side resource must know with great accuracy (within 95) its electrical demand at least a day ahead of time For ERS auctions are held three times a year for four-month contract periods Thus to participate in ERS a resource must know its forecasted electrical demand several months in advance Because seawater desalination plant operations are driven by contracted demand for water it is likely that a plant operator would have a good idea of the plantrsquos electrical demand days or even weeksmonths in advance especially for summer months when demand is likely to be relatively steady An important consideration however is the salinity of the water which drives the electrical requirements and which can be impacted by recent weather events Similarly reductions in demand for water during non-summer months or wet summer days where demand may be reduced could also impact a plantrsquos ability to predict its electricity demand
Finally a seawater desalination plant must have sufficient flexibility in its day-to-day operations so that it can afford to lose several hours of production when deployed for demand response It should be noted that demand-side resources participating in RRS and ERS are called infrequently demand-side resources providing responsive reserves were deployed one time in 2015 and ERS was not deployed that year However this is an important factor to consider if a plant is operating at close to full capacity and would incur financial penalties if it fails to meet its contract obligations due to a demand response event Including additional storage and building a plant with extra capacity could help to mitigate this risk It should also be noted that a plant operator does not need to commit the full plant capacity to these services but rather can specify an amount of MW that will be committed Thus a plant operator could mitigate issues both with predictability and flexibility of plant operations by committing only a portion of its predicted electrical demand to participate in demand response
Considering these factors together it appears that seawater desalination plants could be designed to meet the operational requirements for participation in ERCOTrsquos demand response services (both RRS and ERS) Because the ability to meet the requirements is dependent on the plant design demand response would need to be considered early in a projectrsquos development if participation is desirable Whether project developers will choose to address these requirements will depend on the economic benefits of participation in demand response which will be discussed in the next section
42 Economic Considerations for ERCOT-Dispatched Demand Response This section describes the economic benefits to demand-side resources from participation in ERCOT-dispatched demand response programs The average price paid for a demand-side resource participating in RRS in 2015 was $1087 per MW per hour and for ERS was $645 per MW per hour for the contract periods during the 2015 program year These payments could provide a significant financial benefit to seawater desalination plants To give a simplified example for a plant with an electrical demand of 10 MW operating at a 100 annual load factor (10 MW times 24 hours times 365 days) the annual benefit would be on the order of $500000 for ERS or $1 million for RRS
copy 2016 ERCOT All rights reserved 8
Study on the Demand Response Potential for Seawater Desalination Projects ERCOT Public
In 2015 demand-side resources providing responsive reserves were deployed one time for a duration of 10 minutes and ERS was not deployed12 The most ERS was ever deployed in a single year was two times in 2011 Thus participation in either program could result in a substantial payment to a seawater desalination plant with a relatively low risk of deployment and associated disruption of plant operations although it is important to note that participation in either ERCOT service subjects demand response resources to annual unannounced testing Other than testing the frequency of deployment will depend on grid conditions and is a risk that should be considered
The financial benefits of participation must be weighed against the costs of designing facilities with the capabilities to operate in this manner These include
bull The costs to design the plant to reduce electrical demand within the required timeframes for demand response and to withstand an instantaneous interruption if not already part of the plant design For example a plant may need to be designed to have backup power generation on-site In addition there could also be costs to restart the system after an interruption
bull The costs to build a plant with excess capacity andor storage to make up for lost production hours when demand response is deployed This will add to the total capital costs of the project Land area constraints should also be considered when considering additional storage as the space requirements for the necessary storage capacity could be significant
bull Costs associated with the impact of interruptions on plant processes (eg more frequent replacement of membranes impacts to pretreatment system or plant infrastructure)
bull Potential financial penalties that would be incurred if deployment as part of demand response were to result in failure to meet contract obligations to supply water
bull The loss of potential benefits in the form of cost avoidance from participation in non-ERCOTshydispatched demand response opportunities (see Section 43) If a plant is committed to RRS or ERS the plant operator would lose the flexibility to take advantage of these other opportunities to reduce their electricity costs
The interplay of these benefits and costs will determine whether it would be beneficial for a future seawater desalination plant to participate in demand response in ERCOT
43 Considerations for Non-ERCOT-Dispatched Demand Response Outside of the reliability-based services administered by ERCOT there are other opportunities for seawater desalination plants to reduce their electricity costs As described in Section 321 seawater desalination plants may be able to reduce the demand charges on their electricity bills through curtailing load during 4CP intervals In addition plant operators may adjust operations in response to real-time electricity prices to take advantage of lower off-peak prices and avoid price spikes (see Sections 322 and 323) All of these opportunities require that the plant have flexibility to reduce production during certain times of the day
In the ERCOT region as noted above a portion of transmission and distribution charges are set based on the peak systemwide 15-minute interval of the four summer months (June through September) referred to as the four coincident peaks (4CP) Large customers can reduce or avoid this charge by reducing electrical consumption during these four peak intervals AEP Central Texas and CenterPoint are the transmission providers covering the majority of the Gulf Coast in Texas13
12 ERCOT June 2016 ldquoLoad Resource Deployment Updaterdquo Available at httpwwwercotcomcontentwcmkey_documents_lists870985_RRS_Load_Resource_Deployment_Updatepdf 13 It is also possible that a seawater desalination plant could be located in an area that as not opted in to competition in which case the plant owner would need to negotiate its electricity charges bilaterally with the Non Opt-In Entity (NOIE)
copy 2016 ERCOT All rights reserved 9
Study on the Demand Response Potential for Seawater Desalination Projects ERCOT Public
Assuming a future seawater desalination plant would be connected at transmission-level voltages the relevant 4CP charges based on the 2016 tariffs accounting for both transmission charges and transmission cost recovery factors would be $41425 per 4CP kW for AEP Central Texas and $41870 per 4CP kVA for CenterPoint14 If a seawater desalination plant has 10 MW of load and is capable of interrupting all of it and successfully does so for all four 4CP intervals the savings based on the 2016 tariffs would be approximately $500000 per year ($41425 times 1000 (kW to MW) times 10 MW times 12 months) Thus a seawater desalination plant that reduces its electricity use during the 4CP intervals could avert some or all of these charges
Another opportunity for seawater desalination plants to reduce their electricity costs is through adjusting operations in response to real-time electricity prices In 2015 the average electricity price in ERCOT was $2677MWh However prices exceeded $50MWh in 254 hours (3 of all hours) $100MWh in 88 hours (1) $200MWh in 40 hours (05) and $300MWh in 21 hours (02) Prices exceeded $3000MWh for 021 hours15 Depending on the desalination plantrsquos exposure to real-time wholesale market prices (via its retail contract) the degree of high prices the plant owner is willing to avoid and grid conditions in a given year reducing unit operations in order to avoid high electricity prices could impact operators for anywhere between a few and several hundred hours out of the year In addition a plant can plan its operations to take advantage of lower electricity prices during off-peak periods (eg at night when generation from wind is high) For example at least one company is marketing a modular desalination unit design intended to take advantage of low prices during periods of high renewables generation and to provide grid reliability services through demand response16
There are several factors to consider regarding these opportunities to reduce electricity costs The plant would need to monitor the ERCOT market or hire a contractor to do so in order to know when to reduce demand for electricity These programs do not impose any requirements on response time as with RRS or ERS and there may be sufficient warning of 4CP intervals or peak pricing to allow the plant operator to plan its operations earlier in the day with sufficient time to ramp down production under controlled conditions However quicker ramping capability may be desirable to respond to electricity price fluctuations
For 4CP because the four intervals used to set demand charges are not known ahead of time it is likely that the plant would need to reduce its demand multiple times per summer to ensure the 4CP intervals are hit impacting production at the facility Timing operations to coincide with off-peak pricing or to avoid price spikes would similarly result in reduced operations during certain hours To offset the lost production hours the plant may need to be designed with extra capacity and water storage capability to maintain the ability to meet its contractual obligations for freshwater delivery Because the period of reduced operations is greater than with ERCOT-dispatched demand response services this need would be greater for a seawater desalination plant reducing load during 4CP intervals or in response to real-time electricity prices and would increase the capital costs of the project It should also be noted that high prices in the ERCOT Region typically but not always occur in summer months when drought conditions are more likely to develop and demand for desalinated water is likely to be highest This may limit the flexibility of the plant to time its electricity consumption to avoid high-priced hours
14 Public Utility Commission of Texas ldquoTransmission and Distribution Rates for Investor Owned Utilitiesrdquo Available at httpwwwpuctexasgovindustryelectricratestdraspx 15 Potomac Economics June 2016 2015 State of the Market Report for the ERCOT Wholesale Electricity Markets Available at httpswwwpotomaceconomicscomindexphpmarkets_monitoredERCOT 16 Sisyan LLC ldquoDemand Response Desalinationrdquo Available at httprenewabledesalinationcomwpshycontentuploads201506Demand-Response-Desalinationpdf
copy 2016 ERCOT All rights reserved 10
Study on the Demand Response Potential for Seawater Desalination Projects ERCOT Public
In addition the plantrsquos ability to participate in demand response would also be limited for those hours it is reducing load as part of 4CP response or in response to real-time prices because the plant would not be able to reduce its electricity consumption if that demand is already committed to another demand response service Thus participating in demand response versus taking advantage of these other opportunities may be to some extent mutually exclusive
5 Conclusion
Based on this analysis it appears that the operational characteristics of seawater desalination plants would allow them to participate in demand response opportunities in ERCOT so long as the necessary operational requirements are considered in the design specifications of the plant Project developers should consider the necessary requirements early in the plant design Whether the economic benefits of participation would provide a sufficient incentive for them to do so will depend on the costs of accommodating those operational requirements and whether there is the flexibility available to operate the plant as necessary under these programs Though most existing seawater desalination plants do not participate in demand response programs it does appear that participation by these plants is possible and could result in a financial benefit Table 2 compares the different demand response opportunities available to demand-side resources in ERCOT
Table 2 Comparison of Demand Response Opportunities Demand Response
Opportunity Requirements for
Participation Impacts to Plant
Operations Financial Benefit Ancillary Services ndash Responsive Reserve Service (RRS)
bull Under-Frequency Relay bull Instantaneous or 10 minute
response time bull Recover load within 3
hours bull Bid in day-ahead market
bull Deployed once in 2015 for 10 minutes bull Subject to annual
unannounced testing
bull $1087 per MW per hour (based on 2015 prices)
Emergency Response Service (ERS)
bull 10 or 30 minute response time bull Recover load within 10
hours bull Four-month contract term
bull Not deployed in 2015 the most times ever deployed in a single year was twice in 2011 bull Subject to annual
unannounced testing
bull $645 per MW per hour (based on 2015 prices)
Four Coincident bull Interval Data Recorder bull Likely plant will need to bull Avoid ~$48000 per 4CP Peak (4CP) (IDR) meter
bull Ability to predict system-wide peak demand hours during summer months
reduce load multiple times per summer to hit 4CP intervals bull Likely to be able to predict
possible 4CP intervals earlier in day
MW per year (based on 2016 tariffs) if successful in reducing during all four summer months
LSE or DR Provider Contracted Price Response
bull Varies based on contractual arrangements
bull Varies based on contractual arrangements
bull Varies based on contractual arrangements
Self-Directed Price bull Retail contract with bull Varies depending on bull Varies depending on Response exposure to real-time
market prices bull Ability to monitor real-time
prices in ERCOT wholesale market
number and severity of pricing events bull May be able to predict
peak pricing events earlier in day
number and severity of pricing events
copy 2016 ERCOT All rights reserved 11
Study on the Demand Response Potential for Seawater Desalination Projects ERCOT Public
Demand response programs in ERCOT provide opportunities for demand-side resources to defray their electricity costs and provide reliability benefits to the ERCOT electric grid Because the process of seawater desalination is energy intensive participation in demand response could help to reduce electricity costs while posing a relatively low risk to plant operations if demand response participation is factored into plant design
Participation in non-ERCOT-dispatched demand response opportunities such as reducing load during 4CP intervals or in response to real-time electricity prices may also help to reduce electricity costs for seawater desalination plants in Texas As stakeholders in Texas continue to plan for possible future droughts in the region and identify water management strategies consideration of demand response could play a role in mitigating some costs associated with seawater desalination and allow seawater desalination plants to assist with maintaining electric reliability in the region
copy 2016 ERCOT All rights reserved 12
Study on the Demand Response Potential for Seawater Desalination Projects ERCOT Public
the rate at which they are replaced will depend on the salinity of the feedwater and how the plant is operated Treatment and disposal of the salty brine byproduct from desalination may also incur operating costs
Electricity costs will vary depending on a range of factors including the size of the plant type of desalination technology source of electricity and quality of the feedwater As previously noted more saline water requires higher amounts of electricity in desalination and thus the amount of electricity consumption is a key difference between brackish water and seawater desalination As a result electricity costs comprise a significant share of the costs of seawater desalination These costs could potentially be defrayed in part by participation in demand response initiatives
3 Demand Response Opportunities in ERCOT
Broadly speaking demand response can be broken down into two major categories dispatchable or non-dispatchable For purposes of this report we will define dispatchable as those demand response events that are initiated by ERCOT and non-dispatchable as an event not specifically initiated by ERCOT These non-dispatchable events may include decisions made by the end-use customer to alter its consumption pattern or may include contractual obligations with another entity such as the end-use customerrsquos retail electric provider (ldquoREPrdquo) to alter consumption patterns
ERCOTrsquos wholesale market is open to several types of dispatchable demand response which are deployed to maintain system reliability Demand-side resources providing Emergency Response Service (ERS) may offer based on either a 10 or 30-minute response time commonly referred to as the ldquoramp periodrdquo Alternatively demand-side resources may register and qualify as a Load Resource that can provide Reserves in the Ancillary Services market The most common service provided by demand-side resources is Responsive Reserve Service which requires an under-frequency relay that can instantaneously interrupt the load during certain system reliability events Some demand-side resources can also participate in other Ancillary Services as Controllable Load Resources that require sophisticated control systems that allow them to be deployed in a more incremental proportional manner
Non-dispatchable demand response in ERCOT can include a response to avoid transmission costs where rates are based on Four Coincident Peak Pricing (4CP) response to wholesale energy prices initiated by the customer or by a REP or other load-serving entity (ldquoLSErdquo) or utility-managed Load Management programs (LM)
The sections that follow provide a description of both ERCOT-dispatched (Section 31) and nonshyERCOT-dispatched (Section 32) demand response For a more detailed description of opportunities for demand-side resources to participate in demand response in ERCOT see ERCOTrsquos guide Load Participation in the ERCOT Nodal Market10
31 ERCOT-Dispatched Demand Response There are two main demand response reliability-based services administered by ERCOT participation by demand-side resources in the Ancillary Services market and participation in ERS These services are dispatched by ERCOT during system emergencies
10 Available at httpwwwercotcomcontentservicesprogramsloadLoad20Participation20in20the20ERCOT20Nodal20Market_302d oc
copy 2016 ERCOT All rights reserved 4
Study on the Demand Response Potential for Seawater Desalination Projects ERCOT Public
Demand-side resources with demand response capability that can meet a set of performance requirements can be qualified to provide Ancillary Services as Load Resources in the Ancillary Services Market The value of having a Load Resource available to reduce load is equal to the value of having a generator available to increase its generation at a generating plant The providers of operating reserves selected to provide Ancillary Services are eligible for capacity payments regardless of whether the Resource is actually deployed (or curtailed in the case of the Load Resource)
ERCOT holds auctions on a daily basis for each of the following Ancillary Services Regulation Up Regulation Down Responsive Reserve and Non-Spinning Reserve11 Table 1 describes the various Load Resource types and their qualification requirements and eligible services
Table 1 Load Resource Types and Ancillary Services
Service Load Resource Type a Qualification Responsive Reserves (le50 of total Reserve requirement)
Non Controllable Under-Frequency Relay and 10-minute ramp to manual dispatch instruction
Responsive Reserves
Controllable Primary Frequency Response and follow 5-minute dispatch instructions
Regulation-Up Regulation-Down
Controllable Primary Frequency Response and respond to Regulation deployments
Non-Spin Reserves Controllable Follow 5-minute dispatch instructions a A Controllable Load Resource is a Load Resource capable of controllably reducing or increasing consumption under dispatch control by ERCOT
Demand-side resources that agree to reduce load when directed by ERCOT and that meet other metering and operational requirements as specified in the ERCOT Protocols may participate in Ancillary Services market auctions As noted in Table 1 the type of Ancillary Service that a Load Resource may provide will depend upon the demand-side resourcersquos response time and metering system as well as other requirements described in the Protocols In the Responsive Reserve and Non-Spin Reserve markets the Load Resource will receive capacity payments regardless of whether or not the load was actually deployed but the load must be available for deployment at any time while providing the service
ERCOT procures ERS to maintain grid reliability during emergency conditions and reduce the likelihood of the need for rotating outages ERS participants may offer to provide demand response with either a 10-minute ramp period requirement (similar to Load Resources providing Responsive Reserve Service) or a 30-minute ramp period requirement ERS Resources do not have the same telemetry and under-frequency relay requirements as Load Resources
11 Regulation Up and Regulation Down service respond to signals from ERCOT every 4 seconds to respond to changes in system frequency full response has to be provided within 5 minutes Responsive reserves must provide their committed capacity either instantaneously in an under-frequency event (eg due to a generator outage) or in energy scarcity conditions within ten minutes following an instruction from ERCOT Non-spinning reserves must provide their committed capacity within 30 minutes based on economic dispatch instructions Non-spinning reserve is used as replacement reserve to replenish other ancillary services and during energy scarcity
copy 2016 ERCOT All rights reserved 5
Study on the Demand Response Potential for Seawater Desalination Projects ERCOT Public
ERS is procured through a request for proposal (RFP) process three times per year for four-month contract terms each of which is further split into smaller time periods based on business cycles and other factors Demand-side resources may choose to submit offers in all time periods or only in those that best fit their unique circumstances and may vary both the price and demand response capacity offers by time period
Payments for ERS are performed up to 80 days after each four month contract term has ended and are subject to downward revision based upon delivered demand response capacity and the demand-side resourcersquos availability during the contract term
32 Non-ERCOT-Dispatched Demand Response The options listed below are not dispatched by ERCOT but they either are controlled directly by a customer or are dispatchable by another entity such as a demand response provider (ldquoDR Providerrdquo) REP or a transmission and distribution utility
Many industrial customers are subject to transmission charges based upon a Four Coincident Peak (4CP) demand The 4CP demand is determined by averaging the consumerrsquos actual demand during the 15-minute settlement interval with the highest ERCOT demand during each of the four summer months (June through September) This measured 4CP demand serves as the basis for the customerrsquos transmission tariff charges for the following year By correctly predicting the ERCOT system peaks during the summer and curtailing load during those intervals a consumer can help reduce the stress imposed on the electric system during peak periods of consumption and reduce its transmission charges for the following calendar year
In the competitive areas of ERCOT consumers can contract with their REP or a DR Provider to have their load respond to the REPrsquos or DR Providerrsquos instructions The contract will usually outline the parameters of this response ndash at what times and frequency demand response events can be called ramp periods sustained response periods compensation etc Because this response is a contractual matter between the REP or DR Provider and the consumer a great deal of variety can be present in these arrangements For example a consumerrsquos response may be voluntary or required compensation could come in the form of reduced energy prices or rebate payments for each curtailment event consumers might be notified up to a day in advance or could have no notification at all (for automated curtailment)
In areas of ERCOT not open to competition interruptible tariffs may be available These tariffs will usually offer a reduced energy price for defined curtailment obligations
REPs may offer dynamic pricing options or consumers within a municipality or cooperative may have their energy prices determined by a published tariff which also may be structured based upon Time-of-Use (TOU) or have a Critical Peak Pricing (CPP) or Peak Time Rebate (PTR) component Self-directed price response refers to consumers making an independent decision to respond to energy prices contained in a governing tariff or in either the ERCOT Day Ahead or Real Time energy markets
TOU offerings will typically have higher energy prices during normal peak periods ndash for example a TOU tariff may charge one price during Monday through Friday from 2 pm through 8 pm and another price during all other times Customers may choose to reduce consumption during these high priced periods Load reduction can be accomplished by load shifting (loads can be shifted by
copy 2016 ERCOT All rights reserved 6
Study on the Demand Response Potential for Seawater Desalination Projects ERCOT Public
rescheduling certain processes or by utilizing thermal storage) ending certain processes that are no longer economic or through energy efficiency measures
Offerings that incorporate CPP usually have prescribed high prices only during certain defined periods ndash for example when load or prices are expected to reach a certain level Response to CPP may be similar to those employed under TOU tariffs especially if CPP is reached frequently More often CPP is infrequent and as such short-term load curtailment may be the more appropriate response to meet economic objectives
4 Demand Response Potential for Seawater Desalination
This section evaluates whether the operational characteristics and economics of seawater desalination plants would enable them to participate in one or more of the various demand response opportunities in the ERCOT Region To date participation of seawater desalination plants in demand response programs has been limited Neither the plant in Carlsbad nor the plant in Tampa Bay participate in demand response programs in California or Florida respectively However as will be described below it appears that these plants can be designed and operated to meet the requirements for participation in demand response and receive economic benefit from participation in these programs
Section 41 describes the operational parameters that must be met for a demand-side resource to provide ERCOT-dispatched demand response and evaluates the ability of seawater desalination plants to meet these criteria Section 42 discusses the tradeoffs between payments for participation in ERCOT-dispatched demand response and potential additional costs posed to seawater desalination plants Finally Section 43 presents other opportunities for seawater desalination plants to reduce their electricity costs outside of ERCOTrsquos reliability-based services that are open to demand response assets
41 Operational Considerations for ERCOT-Dispatched Demand Response There are several key operational parameters that impact a demand-side resourcersquos ability to participate in different demand response services response time recovery time predictability of electrical demand and flexibility of operations This section discusses each of these considerations as they apply to seawater desalination plants
As discussed in Section 31 one of the differentiating factors between ERCOTrsquos demand response products is the amount of time within which a demand-side resource must respond to a deployment instruction to reduce electricity consumption during an event Participation in RRS requires an automatic response within either half a second (ie instantaneous) based on grid frequency or within 10 minutes via a manual instruction ERS requires a response time of either 10 or 30 minutes As noted in Section 21 the typical time to take a reverse osmosis train on- or off-line is 1-2 hours under normal controlled operations To comply with the response time requirements of RRS or ERS a seawater desalination plant would need to be able to reduce its electricity consumption far more quickly than in normal operations This is an element of plant design that would need to be accounted for in the specifications of the project Considerations include the potential need for on-site backup generation including uninterruptible power supply potential impacts to plant infrastructure (eg piping) reverse osmosis membranes and pretreatment systems
The two large US desalination plants provide illustrative counterpoints in this respect The Carlsbad plant was designed to withstand instantaneous power interruptions and has on-site backup generation including uninterruptible power supply to provide the ability to power control systems and flush the membranes in the event of a power loss In contrast the Tampa Bay plant was not
copy 2016 ERCOT All rights reserved 7
Study on the Demand Response Potential for Seawater Desalination Projects ERCOT Public
designed with on-site backup generation and a loss of power would result in a plant shutdown and may require several days to bring the plant back on-line Thus it appears that it is technically possible for a seawater desalination plant to meet the response time requirements for participation in demand response so long as this factor is considered in the design of the facility
The time it takes a desalination train to return to operations after an event is also a consideration Demand-side resources participating in RRS must be able to come back on-line within three hours and those participating in ERS must return within 10 hours Again it appears that it is technically feasible for desalination plants to meet this requirement so long as this requirement is considered in the plant design
An additional consideration is the predictability of a demand-side resourcersquos electricity consumption Participation in the responsive reserves ancillary service market requires bidding in the day-ahead market and thus a demand-side resource must know with great accuracy (within 95) its electrical demand at least a day ahead of time For ERS auctions are held three times a year for four-month contract periods Thus to participate in ERS a resource must know its forecasted electrical demand several months in advance Because seawater desalination plant operations are driven by contracted demand for water it is likely that a plant operator would have a good idea of the plantrsquos electrical demand days or even weeksmonths in advance especially for summer months when demand is likely to be relatively steady An important consideration however is the salinity of the water which drives the electrical requirements and which can be impacted by recent weather events Similarly reductions in demand for water during non-summer months or wet summer days where demand may be reduced could also impact a plantrsquos ability to predict its electricity demand
Finally a seawater desalination plant must have sufficient flexibility in its day-to-day operations so that it can afford to lose several hours of production when deployed for demand response It should be noted that demand-side resources participating in RRS and ERS are called infrequently demand-side resources providing responsive reserves were deployed one time in 2015 and ERS was not deployed that year However this is an important factor to consider if a plant is operating at close to full capacity and would incur financial penalties if it fails to meet its contract obligations due to a demand response event Including additional storage and building a plant with extra capacity could help to mitigate this risk It should also be noted that a plant operator does not need to commit the full plant capacity to these services but rather can specify an amount of MW that will be committed Thus a plant operator could mitigate issues both with predictability and flexibility of plant operations by committing only a portion of its predicted electrical demand to participate in demand response
Considering these factors together it appears that seawater desalination plants could be designed to meet the operational requirements for participation in ERCOTrsquos demand response services (both RRS and ERS) Because the ability to meet the requirements is dependent on the plant design demand response would need to be considered early in a projectrsquos development if participation is desirable Whether project developers will choose to address these requirements will depend on the economic benefits of participation in demand response which will be discussed in the next section
42 Economic Considerations for ERCOT-Dispatched Demand Response This section describes the economic benefits to demand-side resources from participation in ERCOT-dispatched demand response programs The average price paid for a demand-side resource participating in RRS in 2015 was $1087 per MW per hour and for ERS was $645 per MW per hour for the contract periods during the 2015 program year These payments could provide a significant financial benefit to seawater desalination plants To give a simplified example for a plant with an electrical demand of 10 MW operating at a 100 annual load factor (10 MW times 24 hours times 365 days) the annual benefit would be on the order of $500000 for ERS or $1 million for RRS
copy 2016 ERCOT All rights reserved 8
Study on the Demand Response Potential for Seawater Desalination Projects ERCOT Public
In 2015 demand-side resources providing responsive reserves were deployed one time for a duration of 10 minutes and ERS was not deployed12 The most ERS was ever deployed in a single year was two times in 2011 Thus participation in either program could result in a substantial payment to a seawater desalination plant with a relatively low risk of deployment and associated disruption of plant operations although it is important to note that participation in either ERCOT service subjects demand response resources to annual unannounced testing Other than testing the frequency of deployment will depend on grid conditions and is a risk that should be considered
The financial benefits of participation must be weighed against the costs of designing facilities with the capabilities to operate in this manner These include
bull The costs to design the plant to reduce electrical demand within the required timeframes for demand response and to withstand an instantaneous interruption if not already part of the plant design For example a plant may need to be designed to have backup power generation on-site In addition there could also be costs to restart the system after an interruption
bull The costs to build a plant with excess capacity andor storage to make up for lost production hours when demand response is deployed This will add to the total capital costs of the project Land area constraints should also be considered when considering additional storage as the space requirements for the necessary storage capacity could be significant
bull Costs associated with the impact of interruptions on plant processes (eg more frequent replacement of membranes impacts to pretreatment system or plant infrastructure)
bull Potential financial penalties that would be incurred if deployment as part of demand response were to result in failure to meet contract obligations to supply water
bull The loss of potential benefits in the form of cost avoidance from participation in non-ERCOTshydispatched demand response opportunities (see Section 43) If a plant is committed to RRS or ERS the plant operator would lose the flexibility to take advantage of these other opportunities to reduce their electricity costs
The interplay of these benefits and costs will determine whether it would be beneficial for a future seawater desalination plant to participate in demand response in ERCOT
43 Considerations for Non-ERCOT-Dispatched Demand Response Outside of the reliability-based services administered by ERCOT there are other opportunities for seawater desalination plants to reduce their electricity costs As described in Section 321 seawater desalination plants may be able to reduce the demand charges on their electricity bills through curtailing load during 4CP intervals In addition plant operators may adjust operations in response to real-time electricity prices to take advantage of lower off-peak prices and avoid price spikes (see Sections 322 and 323) All of these opportunities require that the plant have flexibility to reduce production during certain times of the day
In the ERCOT region as noted above a portion of transmission and distribution charges are set based on the peak systemwide 15-minute interval of the four summer months (June through September) referred to as the four coincident peaks (4CP) Large customers can reduce or avoid this charge by reducing electrical consumption during these four peak intervals AEP Central Texas and CenterPoint are the transmission providers covering the majority of the Gulf Coast in Texas13
12 ERCOT June 2016 ldquoLoad Resource Deployment Updaterdquo Available at httpwwwercotcomcontentwcmkey_documents_lists870985_RRS_Load_Resource_Deployment_Updatepdf 13 It is also possible that a seawater desalination plant could be located in an area that as not opted in to competition in which case the plant owner would need to negotiate its electricity charges bilaterally with the Non Opt-In Entity (NOIE)
copy 2016 ERCOT All rights reserved 9
Study on the Demand Response Potential for Seawater Desalination Projects ERCOT Public
Assuming a future seawater desalination plant would be connected at transmission-level voltages the relevant 4CP charges based on the 2016 tariffs accounting for both transmission charges and transmission cost recovery factors would be $41425 per 4CP kW for AEP Central Texas and $41870 per 4CP kVA for CenterPoint14 If a seawater desalination plant has 10 MW of load and is capable of interrupting all of it and successfully does so for all four 4CP intervals the savings based on the 2016 tariffs would be approximately $500000 per year ($41425 times 1000 (kW to MW) times 10 MW times 12 months) Thus a seawater desalination plant that reduces its electricity use during the 4CP intervals could avert some or all of these charges
Another opportunity for seawater desalination plants to reduce their electricity costs is through adjusting operations in response to real-time electricity prices In 2015 the average electricity price in ERCOT was $2677MWh However prices exceeded $50MWh in 254 hours (3 of all hours) $100MWh in 88 hours (1) $200MWh in 40 hours (05) and $300MWh in 21 hours (02) Prices exceeded $3000MWh for 021 hours15 Depending on the desalination plantrsquos exposure to real-time wholesale market prices (via its retail contract) the degree of high prices the plant owner is willing to avoid and grid conditions in a given year reducing unit operations in order to avoid high electricity prices could impact operators for anywhere between a few and several hundred hours out of the year In addition a plant can plan its operations to take advantage of lower electricity prices during off-peak periods (eg at night when generation from wind is high) For example at least one company is marketing a modular desalination unit design intended to take advantage of low prices during periods of high renewables generation and to provide grid reliability services through demand response16
There are several factors to consider regarding these opportunities to reduce electricity costs The plant would need to monitor the ERCOT market or hire a contractor to do so in order to know when to reduce demand for electricity These programs do not impose any requirements on response time as with RRS or ERS and there may be sufficient warning of 4CP intervals or peak pricing to allow the plant operator to plan its operations earlier in the day with sufficient time to ramp down production under controlled conditions However quicker ramping capability may be desirable to respond to electricity price fluctuations
For 4CP because the four intervals used to set demand charges are not known ahead of time it is likely that the plant would need to reduce its demand multiple times per summer to ensure the 4CP intervals are hit impacting production at the facility Timing operations to coincide with off-peak pricing or to avoid price spikes would similarly result in reduced operations during certain hours To offset the lost production hours the plant may need to be designed with extra capacity and water storage capability to maintain the ability to meet its contractual obligations for freshwater delivery Because the period of reduced operations is greater than with ERCOT-dispatched demand response services this need would be greater for a seawater desalination plant reducing load during 4CP intervals or in response to real-time electricity prices and would increase the capital costs of the project It should also be noted that high prices in the ERCOT Region typically but not always occur in summer months when drought conditions are more likely to develop and demand for desalinated water is likely to be highest This may limit the flexibility of the plant to time its electricity consumption to avoid high-priced hours
14 Public Utility Commission of Texas ldquoTransmission and Distribution Rates for Investor Owned Utilitiesrdquo Available at httpwwwpuctexasgovindustryelectricratestdraspx 15 Potomac Economics June 2016 2015 State of the Market Report for the ERCOT Wholesale Electricity Markets Available at httpswwwpotomaceconomicscomindexphpmarkets_monitoredERCOT 16 Sisyan LLC ldquoDemand Response Desalinationrdquo Available at httprenewabledesalinationcomwpshycontentuploads201506Demand-Response-Desalinationpdf
copy 2016 ERCOT All rights reserved 10
Study on the Demand Response Potential for Seawater Desalination Projects ERCOT Public
In addition the plantrsquos ability to participate in demand response would also be limited for those hours it is reducing load as part of 4CP response or in response to real-time prices because the plant would not be able to reduce its electricity consumption if that demand is already committed to another demand response service Thus participating in demand response versus taking advantage of these other opportunities may be to some extent mutually exclusive
5 Conclusion
Based on this analysis it appears that the operational characteristics of seawater desalination plants would allow them to participate in demand response opportunities in ERCOT so long as the necessary operational requirements are considered in the design specifications of the plant Project developers should consider the necessary requirements early in the plant design Whether the economic benefits of participation would provide a sufficient incentive for them to do so will depend on the costs of accommodating those operational requirements and whether there is the flexibility available to operate the plant as necessary under these programs Though most existing seawater desalination plants do not participate in demand response programs it does appear that participation by these plants is possible and could result in a financial benefit Table 2 compares the different demand response opportunities available to demand-side resources in ERCOT
Table 2 Comparison of Demand Response Opportunities Demand Response
Opportunity Requirements for
Participation Impacts to Plant
Operations Financial Benefit Ancillary Services ndash Responsive Reserve Service (RRS)
bull Under-Frequency Relay bull Instantaneous or 10 minute
response time bull Recover load within 3
hours bull Bid in day-ahead market
bull Deployed once in 2015 for 10 minutes bull Subject to annual
unannounced testing
bull $1087 per MW per hour (based on 2015 prices)
Emergency Response Service (ERS)
bull 10 or 30 minute response time bull Recover load within 10
hours bull Four-month contract term
bull Not deployed in 2015 the most times ever deployed in a single year was twice in 2011 bull Subject to annual
unannounced testing
bull $645 per MW per hour (based on 2015 prices)
Four Coincident bull Interval Data Recorder bull Likely plant will need to bull Avoid ~$48000 per 4CP Peak (4CP) (IDR) meter
bull Ability to predict system-wide peak demand hours during summer months
reduce load multiple times per summer to hit 4CP intervals bull Likely to be able to predict
possible 4CP intervals earlier in day
MW per year (based on 2016 tariffs) if successful in reducing during all four summer months
LSE or DR Provider Contracted Price Response
bull Varies based on contractual arrangements
bull Varies based on contractual arrangements
bull Varies based on contractual arrangements
Self-Directed Price bull Retail contract with bull Varies depending on bull Varies depending on Response exposure to real-time
market prices bull Ability to monitor real-time
prices in ERCOT wholesale market
number and severity of pricing events bull May be able to predict
peak pricing events earlier in day
number and severity of pricing events
copy 2016 ERCOT All rights reserved 11
Study on the Demand Response Potential for Seawater Desalination Projects ERCOT Public
Demand response programs in ERCOT provide opportunities for demand-side resources to defray their electricity costs and provide reliability benefits to the ERCOT electric grid Because the process of seawater desalination is energy intensive participation in demand response could help to reduce electricity costs while posing a relatively low risk to plant operations if demand response participation is factored into plant design
Participation in non-ERCOT-dispatched demand response opportunities such as reducing load during 4CP intervals or in response to real-time electricity prices may also help to reduce electricity costs for seawater desalination plants in Texas As stakeholders in Texas continue to plan for possible future droughts in the region and identify water management strategies consideration of demand response could play a role in mitigating some costs associated with seawater desalination and allow seawater desalination plants to assist with maintaining electric reliability in the region
copy 2016 ERCOT All rights reserved 12
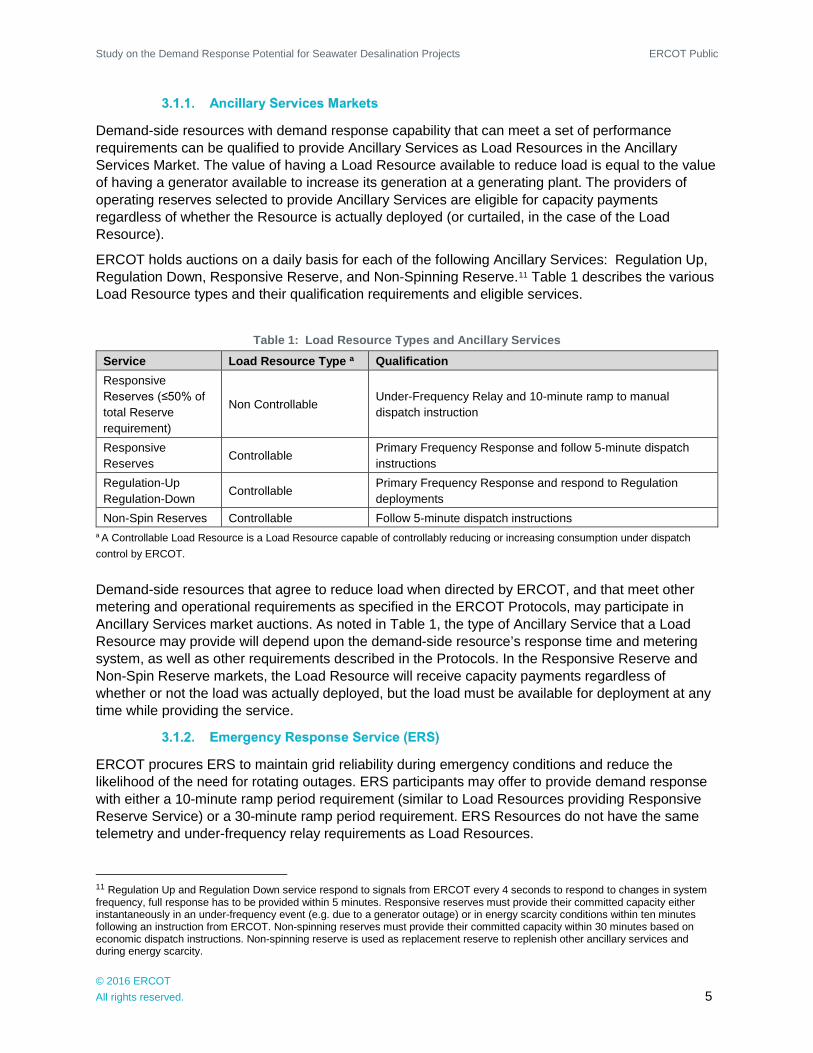
Study on the Demand Response Potential for Seawater Desalination Projects ERCOT Public
Demand-side resources with demand response capability that can meet a set of performance requirements can be qualified to provide Ancillary Services as Load Resources in the Ancillary Services Market The value of having a Load Resource available to reduce load is equal to the value of having a generator available to increase its generation at a generating plant The providers of operating reserves selected to provide Ancillary Services are eligible for capacity payments regardless of whether the Resource is actually deployed (or curtailed in the case of the Load Resource)
ERCOT holds auctions on a daily basis for each of the following Ancillary Services Regulation Up Regulation Down Responsive Reserve and Non-Spinning Reserve11 Table 1 describes the various Load Resource types and their qualification requirements and eligible services
Table 1 Load Resource Types and Ancillary Services
Service Load Resource Type a Qualification Responsive Reserves (le50 of total Reserve requirement)
Non Controllable Under-Frequency Relay and 10-minute ramp to manual dispatch instruction
Responsive Reserves
Controllable Primary Frequency Response and follow 5-minute dispatch instructions
Regulation-Up Regulation-Down
Controllable Primary Frequency Response and respond to Regulation deployments
Non-Spin Reserves Controllable Follow 5-minute dispatch instructions a A Controllable Load Resource is a Load Resource capable of controllably reducing or increasing consumption under dispatch control by ERCOT
Demand-side resources that agree to reduce load when directed by ERCOT and that meet other metering and operational requirements as specified in the ERCOT Protocols may participate in Ancillary Services market auctions As noted in Table 1 the type of Ancillary Service that a Load Resource may provide will depend upon the demand-side resourcersquos response time and metering system as well as other requirements described in the Protocols In the Responsive Reserve and Non-Spin Reserve markets the Load Resource will receive capacity payments regardless of whether or not the load was actually deployed but the load must be available for deployment at any time while providing the service
ERCOT procures ERS to maintain grid reliability during emergency conditions and reduce the likelihood of the need for rotating outages ERS participants may offer to provide demand response with either a 10-minute ramp period requirement (similar to Load Resources providing Responsive Reserve Service) or a 30-minute ramp period requirement ERS Resources do not have the same telemetry and under-frequency relay requirements as Load Resources
11 Regulation Up and Regulation Down service respond to signals from ERCOT every 4 seconds to respond to changes in system frequency full response has to be provided within 5 minutes Responsive reserves must provide their committed capacity either instantaneously in an under-frequency event (eg due to a generator outage) or in energy scarcity conditions within ten minutes following an instruction from ERCOT Non-spinning reserves must provide their committed capacity within 30 minutes based on economic dispatch instructions Non-spinning reserve is used as replacement reserve to replenish other ancillary services and during energy scarcity
copy 2016 ERCOT All rights reserved 5
Study on the Demand Response Potential for Seawater Desalination Projects ERCOT Public
ERS is procured through a request for proposal (RFP) process three times per year for four-month contract terms each of which is further split into smaller time periods based on business cycles and other factors Demand-side resources may choose to submit offers in all time periods or only in those that best fit their unique circumstances and may vary both the price and demand response capacity offers by time period
Payments for ERS are performed up to 80 days after each four month contract term has ended and are subject to downward revision based upon delivered demand response capacity and the demand-side resourcersquos availability during the contract term
32 Non-ERCOT-Dispatched Demand Response The options listed below are not dispatched by ERCOT but they either are controlled directly by a customer or are dispatchable by another entity such as a demand response provider (ldquoDR Providerrdquo) REP or a transmission and distribution utility
Many industrial customers are subject to transmission charges based upon a Four Coincident Peak (4CP) demand The 4CP demand is determined by averaging the consumerrsquos actual demand during the 15-minute settlement interval with the highest ERCOT demand during each of the four summer months (June through September) This measured 4CP demand serves as the basis for the customerrsquos transmission tariff charges for the following year By correctly predicting the ERCOT system peaks during the summer and curtailing load during those intervals a consumer can help reduce the stress imposed on the electric system during peak periods of consumption and reduce its transmission charges for the following calendar year
In the competitive areas of ERCOT consumers can contract with their REP or a DR Provider to have their load respond to the REPrsquos or DR Providerrsquos instructions The contract will usually outline the parameters of this response ndash at what times and frequency demand response events can be called ramp periods sustained response periods compensation etc Because this response is a contractual matter between the REP or DR Provider and the consumer a great deal of variety can be present in these arrangements For example a consumerrsquos response may be voluntary or required compensation could come in the form of reduced energy prices or rebate payments for each curtailment event consumers might be notified up to a day in advance or could have no notification at all (for automated curtailment)
In areas of ERCOT not open to competition interruptible tariffs may be available These tariffs will usually offer a reduced energy price for defined curtailment obligations
REPs may offer dynamic pricing options or consumers within a municipality or cooperative may have their energy prices determined by a published tariff which also may be structured based upon Time-of-Use (TOU) or have a Critical Peak Pricing (CPP) or Peak Time Rebate (PTR) component Self-directed price response refers to consumers making an independent decision to respond to energy prices contained in a governing tariff or in either the ERCOT Day Ahead or Real Time energy markets
TOU offerings will typically have higher energy prices during normal peak periods ndash for example a TOU tariff may charge one price during Monday through Friday from 2 pm through 8 pm and another price during all other times Customers may choose to reduce consumption during these high priced periods Load reduction can be accomplished by load shifting (loads can be shifted by
copy 2016 ERCOT All rights reserved 6
Study on the Demand Response Potential for Seawater Desalination Projects ERCOT Public
rescheduling certain processes or by utilizing thermal storage) ending certain processes that are no longer economic or through energy efficiency measures
Offerings that incorporate CPP usually have prescribed high prices only during certain defined periods ndash for example when load or prices are expected to reach a certain level Response to CPP may be similar to those employed under TOU tariffs especially if CPP is reached frequently More often CPP is infrequent and as such short-term load curtailment may be the more appropriate response to meet economic objectives
4 Demand Response Potential for Seawater Desalination
This section evaluates whether the operational characteristics and economics of seawater desalination plants would enable them to participate in one or more of the various demand response opportunities in the ERCOT Region To date participation of seawater desalination plants in demand response programs has been limited Neither the plant in Carlsbad nor the plant in Tampa Bay participate in demand response programs in California or Florida respectively However as will be described below it appears that these plants can be designed and operated to meet the requirements for participation in demand response and receive economic benefit from participation in these programs
Section 41 describes the operational parameters that must be met for a demand-side resource to provide ERCOT-dispatched demand response and evaluates the ability of seawater desalination plants to meet these criteria Section 42 discusses the tradeoffs between payments for participation in ERCOT-dispatched demand response and potential additional costs posed to seawater desalination plants Finally Section 43 presents other opportunities for seawater desalination plants to reduce their electricity costs outside of ERCOTrsquos reliability-based services that are open to demand response assets
41 Operational Considerations for ERCOT-Dispatched Demand Response There are several key operational parameters that impact a demand-side resourcersquos ability to participate in different demand response services response time recovery time predictability of electrical demand and flexibility of operations This section discusses each of these considerations as they apply to seawater desalination plants
As discussed in Section 31 one of the differentiating factors between ERCOTrsquos demand response products is the amount of time within which a demand-side resource must respond to a deployment instruction to reduce electricity consumption during an event Participation in RRS requires an automatic response within either half a second (ie instantaneous) based on grid frequency or within 10 minutes via a manual instruction ERS requires a response time of either 10 or 30 minutes As noted in Section 21 the typical time to take a reverse osmosis train on- or off-line is 1-2 hours under normal controlled operations To comply with the response time requirements of RRS or ERS a seawater desalination plant would need to be able to reduce its electricity consumption far more quickly than in normal operations This is an element of plant design that would need to be accounted for in the specifications of the project Considerations include the potential need for on-site backup generation including uninterruptible power supply potential impacts to plant infrastructure (eg piping) reverse osmosis membranes and pretreatment systems
The two large US desalination plants provide illustrative counterpoints in this respect The Carlsbad plant was designed to withstand instantaneous power interruptions and has on-site backup generation including uninterruptible power supply to provide the ability to power control systems and flush the membranes in the event of a power loss In contrast the Tampa Bay plant was not
copy 2016 ERCOT All rights reserved 7
Study on the Demand Response Potential for Seawater Desalination Projects ERCOT Public
designed with on-site backup generation and a loss of power would result in a plant shutdown and may require several days to bring the plant back on-line Thus it appears that it is technically possible for a seawater desalination plant to meet the response time requirements for participation in demand response so long as this factor is considered in the design of the facility
The time it takes a desalination train to return to operations after an event is also a consideration Demand-side resources participating in RRS must be able to come back on-line within three hours and those participating in ERS must return within 10 hours Again it appears that it is technically feasible for desalination plants to meet this requirement so long as this requirement is considered in the plant design
An additional consideration is the predictability of a demand-side resourcersquos electricity consumption Participation in the responsive reserves ancillary service market requires bidding in the day-ahead market and thus a demand-side resource must know with great accuracy (within 95) its electrical demand at least a day ahead of time For ERS auctions are held three times a year for four-month contract periods Thus to participate in ERS a resource must know its forecasted electrical demand several months in advance Because seawater desalination plant operations are driven by contracted demand for water it is likely that a plant operator would have a good idea of the plantrsquos electrical demand days or even weeksmonths in advance especially for summer months when demand is likely to be relatively steady An important consideration however is the salinity of the water which drives the electrical requirements and which can be impacted by recent weather events Similarly reductions in demand for water during non-summer months or wet summer days where demand may be reduced could also impact a plantrsquos ability to predict its electricity demand
Finally a seawater desalination plant must have sufficient flexibility in its day-to-day operations so that it can afford to lose several hours of production when deployed for demand response It should be noted that demand-side resources participating in RRS and ERS are called infrequently demand-side resources providing responsive reserves were deployed one time in 2015 and ERS was not deployed that year However this is an important factor to consider if a plant is operating at close to full capacity and would incur financial penalties if it fails to meet its contract obligations due to a demand response event Including additional storage and building a plant with extra capacity could help to mitigate this risk It should also be noted that a plant operator does not need to commit the full plant capacity to these services but rather can specify an amount of MW that will be committed Thus a plant operator could mitigate issues both with predictability and flexibility of plant operations by committing only a portion of its predicted electrical demand to participate in demand response
Considering these factors together it appears that seawater desalination plants could be designed to meet the operational requirements for participation in ERCOTrsquos demand response services (both RRS and ERS) Because the ability to meet the requirements is dependent on the plant design demand response would need to be considered early in a projectrsquos development if participation is desirable Whether project developers will choose to address these requirements will depend on the economic benefits of participation in demand response which will be discussed in the next section
42 Economic Considerations for ERCOT-Dispatched Demand Response This section describes the economic benefits to demand-side resources from participation in ERCOT-dispatched demand response programs The average price paid for a demand-side resource participating in RRS in 2015 was $1087 per MW per hour and for ERS was $645 per MW per hour for the contract periods during the 2015 program year These payments could provide a significant financial benefit to seawater desalination plants To give a simplified example for a plant with an electrical demand of 10 MW operating at a 100 annual load factor (10 MW times 24 hours times 365 days) the annual benefit would be on the order of $500000 for ERS or $1 million for RRS
copy 2016 ERCOT All rights reserved 8
Study on the Demand Response Potential for Seawater Desalination Projects ERCOT Public
In 2015 demand-side resources providing responsive reserves were deployed one time for a duration of 10 minutes and ERS was not deployed12 The most ERS was ever deployed in a single year was two times in 2011 Thus participation in either program could result in a substantial payment to a seawater desalination plant with a relatively low risk of deployment and associated disruption of plant operations although it is important to note that participation in either ERCOT service subjects demand response resources to annual unannounced testing Other than testing the frequency of deployment will depend on grid conditions and is a risk that should be considered
The financial benefits of participation must be weighed against the costs of designing facilities with the capabilities to operate in this manner These include
bull The costs to design the plant to reduce electrical demand within the required timeframes for demand response and to withstand an instantaneous interruption if not already part of the plant design For example a plant may need to be designed to have backup power generation on-site In addition there could also be costs to restart the system after an interruption
bull The costs to build a plant with excess capacity andor storage to make up for lost production hours when demand response is deployed This will add to the total capital costs of the project Land area constraints should also be considered when considering additional storage as the space requirements for the necessary storage capacity could be significant
bull Costs associated with the impact of interruptions on plant processes (eg more frequent replacement of membranes impacts to pretreatment system or plant infrastructure)
bull Potential financial penalties that would be incurred if deployment as part of demand response were to result in failure to meet contract obligations to supply water
bull The loss of potential benefits in the form of cost avoidance from participation in non-ERCOTshydispatched demand response opportunities (see Section 43) If a plant is committed to RRS or ERS the plant operator would lose the flexibility to take advantage of these other opportunities to reduce their electricity costs
The interplay of these benefits and costs will determine whether it would be beneficial for a future seawater desalination plant to participate in demand response in ERCOT
43 Considerations for Non-ERCOT-Dispatched Demand Response Outside of the reliability-based services administered by ERCOT there are other opportunities for seawater desalination plants to reduce their electricity costs As described in Section 321 seawater desalination plants may be able to reduce the demand charges on their electricity bills through curtailing load during 4CP intervals In addition plant operators may adjust operations in response to real-time electricity prices to take advantage of lower off-peak prices and avoid price spikes (see Sections 322 and 323) All of these opportunities require that the plant have flexibility to reduce production during certain times of the day
In the ERCOT region as noted above a portion of transmission and distribution charges are set based on the peak systemwide 15-minute interval of the four summer months (June through September) referred to as the four coincident peaks (4CP) Large customers can reduce or avoid this charge by reducing electrical consumption during these four peak intervals AEP Central Texas and CenterPoint are the transmission providers covering the majority of the Gulf Coast in Texas13
12 ERCOT June 2016 ldquoLoad Resource Deployment Updaterdquo Available at httpwwwercotcomcontentwcmkey_documents_lists870985_RRS_Load_Resource_Deployment_Updatepdf 13 It is also possible that a seawater desalination plant could be located in an area that as not opted in to competition in which case the plant owner would need to negotiate its electricity charges bilaterally with the Non Opt-In Entity (NOIE)
copy 2016 ERCOT All rights reserved 9
Study on the Demand Response Potential for Seawater Desalination Projects ERCOT Public
Assuming a future seawater desalination plant would be connected at transmission-level voltages the relevant 4CP charges based on the 2016 tariffs accounting for both transmission charges and transmission cost recovery factors would be $41425 per 4CP kW for AEP Central Texas and $41870 per 4CP kVA for CenterPoint14 If a seawater desalination plant has 10 MW of load and is capable of interrupting all of it and successfully does so for all four 4CP intervals the savings based on the 2016 tariffs would be approximately $500000 per year ($41425 times 1000 (kW to MW) times 10 MW times 12 months) Thus a seawater desalination plant that reduces its electricity use during the 4CP intervals could avert some or all of these charges
Another opportunity for seawater desalination plants to reduce their electricity costs is through adjusting operations in response to real-time electricity prices In 2015 the average electricity price in ERCOT was $2677MWh However prices exceeded $50MWh in 254 hours (3 of all hours) $100MWh in 88 hours (1) $200MWh in 40 hours (05) and $300MWh in 21 hours (02) Prices exceeded $3000MWh for 021 hours15 Depending on the desalination plantrsquos exposure to real-time wholesale market prices (via its retail contract) the degree of high prices the plant owner is willing to avoid and grid conditions in a given year reducing unit operations in order to avoid high electricity prices could impact operators for anywhere between a few and several hundred hours out of the year In addition a plant can plan its operations to take advantage of lower electricity prices during off-peak periods (eg at night when generation from wind is high) For example at least one company is marketing a modular desalination unit design intended to take advantage of low prices during periods of high renewables generation and to provide grid reliability services through demand response16
There are several factors to consider regarding these opportunities to reduce electricity costs The plant would need to monitor the ERCOT market or hire a contractor to do so in order to know when to reduce demand for electricity These programs do not impose any requirements on response time as with RRS or ERS and there may be sufficient warning of 4CP intervals or peak pricing to allow the plant operator to plan its operations earlier in the day with sufficient time to ramp down production under controlled conditions However quicker ramping capability may be desirable to respond to electricity price fluctuations
For 4CP because the four intervals used to set demand charges are not known ahead of time it is likely that the plant would need to reduce its demand multiple times per summer to ensure the 4CP intervals are hit impacting production at the facility Timing operations to coincide with off-peak pricing or to avoid price spikes would similarly result in reduced operations during certain hours To offset the lost production hours the plant may need to be designed with extra capacity and water storage capability to maintain the ability to meet its contractual obligations for freshwater delivery Because the period of reduced operations is greater than with ERCOT-dispatched demand response services this need would be greater for a seawater desalination plant reducing load during 4CP intervals or in response to real-time electricity prices and would increase the capital costs of the project It should also be noted that high prices in the ERCOT Region typically but not always occur in summer months when drought conditions are more likely to develop and demand for desalinated water is likely to be highest This may limit the flexibility of the plant to time its electricity consumption to avoid high-priced hours
14 Public Utility Commission of Texas ldquoTransmission and Distribution Rates for Investor Owned Utilitiesrdquo Available at httpwwwpuctexasgovindustryelectricratestdraspx 15 Potomac Economics June 2016 2015 State of the Market Report for the ERCOT Wholesale Electricity Markets Available at httpswwwpotomaceconomicscomindexphpmarkets_monitoredERCOT 16 Sisyan LLC ldquoDemand Response Desalinationrdquo Available at httprenewabledesalinationcomwpshycontentuploads201506Demand-Response-Desalinationpdf
copy 2016 ERCOT All rights reserved 10
Study on the Demand Response Potential for Seawater Desalination Projects ERCOT Public
In addition the plantrsquos ability to participate in demand response would also be limited for those hours it is reducing load as part of 4CP response or in response to real-time prices because the plant would not be able to reduce its electricity consumption if that demand is already committed to another demand response service Thus participating in demand response versus taking advantage of these other opportunities may be to some extent mutually exclusive
5 Conclusion
Based on this analysis it appears that the operational characteristics of seawater desalination plants would allow them to participate in demand response opportunities in ERCOT so long as the necessary operational requirements are considered in the design specifications of the plant Project developers should consider the necessary requirements early in the plant design Whether the economic benefits of participation would provide a sufficient incentive for them to do so will depend on the costs of accommodating those operational requirements and whether there is the flexibility available to operate the plant as necessary under these programs Though most existing seawater desalination plants do not participate in demand response programs it does appear that participation by these plants is possible and could result in a financial benefit Table 2 compares the different demand response opportunities available to demand-side resources in ERCOT
Table 2 Comparison of Demand Response Opportunities Demand Response
Opportunity Requirements for
Participation Impacts to Plant
Operations Financial Benefit Ancillary Services ndash Responsive Reserve Service (RRS)
bull Under-Frequency Relay bull Instantaneous or 10 minute
response time bull Recover load within 3
hours bull Bid in day-ahead market
bull Deployed once in 2015 for 10 minutes bull Subject to annual
unannounced testing
bull $1087 per MW per hour (based on 2015 prices)
Emergency Response Service (ERS)
bull 10 or 30 minute response time bull Recover load within 10
hours bull Four-month contract term
bull Not deployed in 2015 the most times ever deployed in a single year was twice in 2011 bull Subject to annual
unannounced testing
bull $645 per MW per hour (based on 2015 prices)
Four Coincident bull Interval Data Recorder bull Likely plant will need to bull Avoid ~$48000 per 4CP Peak (4CP) (IDR) meter
bull Ability to predict system-wide peak demand hours during summer months
reduce load multiple times per summer to hit 4CP intervals bull Likely to be able to predict
possible 4CP intervals earlier in day
MW per year (based on 2016 tariffs) if successful in reducing during all four summer months
LSE or DR Provider Contracted Price Response
bull Varies based on contractual arrangements
bull Varies based on contractual arrangements
bull Varies based on contractual arrangements
Self-Directed Price bull Retail contract with bull Varies depending on bull Varies depending on Response exposure to real-time
market prices bull Ability to monitor real-time
prices in ERCOT wholesale market
number and severity of pricing events bull May be able to predict
peak pricing events earlier in day
number and severity of pricing events
copy 2016 ERCOT All rights reserved 11
Study on the Demand Response Potential for Seawater Desalination Projects ERCOT Public
Demand response programs in ERCOT provide opportunities for demand-side resources to defray their electricity costs and provide reliability benefits to the ERCOT electric grid Because the process of seawater desalination is energy intensive participation in demand response could help to reduce electricity costs while posing a relatively low risk to plant operations if demand response participation is factored into plant design
Participation in non-ERCOT-dispatched demand response opportunities such as reducing load during 4CP intervals or in response to real-time electricity prices may also help to reduce electricity costs for seawater desalination plants in Texas As stakeholders in Texas continue to plan for possible future droughts in the region and identify water management strategies consideration of demand response could play a role in mitigating some costs associated with seawater desalination and allow seawater desalination plants to assist with maintaining electric reliability in the region
copy 2016 ERCOT All rights reserved 12
Study on the Demand Response Potential for Seawater Desalination Projects ERCOT Public
ERS is procured through a request for proposal (RFP) process three times per year for four-month contract terms each of which is further split into smaller time periods based on business cycles and other factors Demand-side resources may choose to submit offers in all time periods or only in those that best fit their unique circumstances and may vary both the price and demand response capacity offers by time period
Payments for ERS are performed up to 80 days after each four month contract term has ended and are subject to downward revision based upon delivered demand response capacity and the demand-side resourcersquos availability during the contract term
32 Non-ERCOT-Dispatched Demand Response The options listed below are not dispatched by ERCOT but they either are controlled directly by a customer or are dispatchable by another entity such as a demand response provider (ldquoDR Providerrdquo) REP or a transmission and distribution utility
Many industrial customers are subject to transmission charges based upon a Four Coincident Peak (4CP) demand The 4CP demand is determined by averaging the consumerrsquos actual demand during the 15-minute settlement interval with the highest ERCOT demand during each of the four summer months (June through September) This measured 4CP demand serves as the basis for the customerrsquos transmission tariff charges for the following year By correctly predicting the ERCOT system peaks during the summer and curtailing load during those intervals a consumer can help reduce the stress imposed on the electric system during peak periods of consumption and reduce its transmission charges for the following calendar year
In the competitive areas of ERCOT consumers can contract with their REP or a DR Provider to have their load respond to the REPrsquos or DR Providerrsquos instructions The contract will usually outline the parameters of this response ndash at what times and frequency demand response events can be called ramp periods sustained response periods compensation etc Because this response is a contractual matter between the REP or DR Provider and the consumer a great deal of variety can be present in these arrangements For example a consumerrsquos response may be voluntary or required compensation could come in the form of reduced energy prices or rebate payments for each curtailment event consumers might be notified up to a day in advance or could have no notification at all (for automated curtailment)
In areas of ERCOT not open to competition interruptible tariffs may be available These tariffs will usually offer a reduced energy price for defined curtailment obligations
REPs may offer dynamic pricing options or consumers within a municipality or cooperative may have their energy prices determined by a published tariff which also may be structured based upon Time-of-Use (TOU) or have a Critical Peak Pricing (CPP) or Peak Time Rebate (PTR) component Self-directed price response refers to consumers making an independent decision to respond to energy prices contained in a governing tariff or in either the ERCOT Day Ahead or Real Time energy markets
TOU offerings will typically have higher energy prices during normal peak periods ndash for example a TOU tariff may charge one price during Monday through Friday from 2 pm through 8 pm and another price during all other times Customers may choose to reduce consumption during these high priced periods Load reduction can be accomplished by load shifting (loads can be shifted by
copy 2016 ERCOT All rights reserved 6
Study on the Demand Response Potential for Seawater Desalination Projects ERCOT Public
rescheduling certain processes or by utilizing thermal storage) ending certain processes that are no longer economic or through energy efficiency measures
Offerings that incorporate CPP usually have prescribed high prices only during certain defined periods ndash for example when load or prices are expected to reach a certain level Response to CPP may be similar to those employed under TOU tariffs especially if CPP is reached frequently More often CPP is infrequent and as such short-term load curtailment may be the more appropriate response to meet economic objectives
4 Demand Response Potential for Seawater Desalination
This section evaluates whether the operational characteristics and economics of seawater desalination plants would enable them to participate in one or more of the various demand response opportunities in the ERCOT Region To date participation of seawater desalination plants in demand response programs has been limited Neither the plant in Carlsbad nor the plant in Tampa Bay participate in demand response programs in California or Florida respectively However as will be described below it appears that these plants can be designed and operated to meet the requirements for participation in demand response and receive economic benefit from participation in these programs
Section 41 describes the operational parameters that must be met for a demand-side resource to provide ERCOT-dispatched demand response and evaluates the ability of seawater desalination plants to meet these criteria Section 42 discusses the tradeoffs between payments for participation in ERCOT-dispatched demand response and potential additional costs posed to seawater desalination plants Finally Section 43 presents other opportunities for seawater desalination plants to reduce their electricity costs outside of ERCOTrsquos reliability-based services that are open to demand response assets
41 Operational Considerations for ERCOT-Dispatched Demand Response There are several key operational parameters that impact a demand-side resourcersquos ability to participate in different demand response services response time recovery time predictability of electrical demand and flexibility of operations This section discusses each of these considerations as they apply to seawater desalination plants
As discussed in Section 31 one of the differentiating factors between ERCOTrsquos demand response products is the amount of time within which a demand-side resource must respond to a deployment instruction to reduce electricity consumption during an event Participation in RRS requires an automatic response within either half a second (ie instantaneous) based on grid frequency or within 10 minutes via a manual instruction ERS requires a response time of either 10 or 30 minutes As noted in Section 21 the typical time to take a reverse osmosis train on- or off-line is 1-2 hours under normal controlled operations To comply with the response time requirements of RRS or ERS a seawater desalination plant would need to be able to reduce its electricity consumption far more quickly than in normal operations This is an element of plant design that would need to be accounted for in the specifications of the project Considerations include the potential need for on-site backup generation including uninterruptible power supply potential impacts to plant infrastructure (eg piping) reverse osmosis membranes and pretreatment systems
The two large US desalination plants provide illustrative counterpoints in this respect The Carlsbad plant was designed to withstand instantaneous power interruptions and has on-site backup generation including uninterruptible power supply to provide the ability to power control systems and flush the membranes in the event of a power loss In contrast the Tampa Bay plant was not
copy 2016 ERCOT All rights reserved 7
Study on the Demand Response Potential for Seawater Desalination Projects ERCOT Public
designed with on-site backup generation and a loss of power would result in a plant shutdown and may require several days to bring the plant back on-line Thus it appears that it is technically possible for a seawater desalination plant to meet the response time requirements for participation in demand response so long as this factor is considered in the design of the facility
The time it takes a desalination train to return to operations after an event is also a consideration Demand-side resources participating in RRS must be able to come back on-line within three hours and those participating in ERS must return within 10 hours Again it appears that it is technically feasible for desalination plants to meet this requirement so long as this requirement is considered in the plant design
An additional consideration is the predictability of a demand-side resourcersquos electricity consumption Participation in the responsive reserves ancillary service market requires bidding in the day-ahead market and thus a demand-side resource must know with great accuracy (within 95) its electrical demand at least a day ahead of time For ERS auctions are held three times a year for four-month contract periods Thus to participate in ERS a resource must know its forecasted electrical demand several months in advance Because seawater desalination plant operations are driven by contracted demand for water it is likely that a plant operator would have a good idea of the plantrsquos electrical demand days or even weeksmonths in advance especially for summer months when demand is likely to be relatively steady An important consideration however is the salinity of the water which drives the electrical requirements and which can be impacted by recent weather events Similarly reductions in demand for water during non-summer months or wet summer days where demand may be reduced could also impact a plantrsquos ability to predict its electricity demand
Finally a seawater desalination plant must have sufficient flexibility in its day-to-day operations so that it can afford to lose several hours of production when deployed for demand response It should be noted that demand-side resources participating in RRS and ERS are called infrequently demand-side resources providing responsive reserves were deployed one time in 2015 and ERS was not deployed that year However this is an important factor to consider if a plant is operating at close to full capacity and would incur financial penalties if it fails to meet its contract obligations due to a demand response event Including additional storage and building a plant with extra capacity could help to mitigate this risk It should also be noted that a plant operator does not need to commit the full plant capacity to these services but rather can specify an amount of MW that will be committed Thus a plant operator could mitigate issues both with predictability and flexibility of plant operations by committing only a portion of its predicted electrical demand to participate in demand response
Considering these factors together it appears that seawater desalination plants could be designed to meet the operational requirements for participation in ERCOTrsquos demand response services (both RRS and ERS) Because the ability to meet the requirements is dependent on the plant design demand response would need to be considered early in a projectrsquos development if participation is desirable Whether project developers will choose to address these requirements will depend on the economic benefits of participation in demand response which will be discussed in the next section
42 Economic Considerations for ERCOT-Dispatched Demand Response This section describes the economic benefits to demand-side resources from participation in ERCOT-dispatched demand response programs The average price paid for a demand-side resource participating in RRS in 2015 was $1087 per MW per hour and for ERS was $645 per MW per hour for the contract periods during the 2015 program year These payments could provide a significant financial benefit to seawater desalination plants To give a simplified example for a plant with an electrical demand of 10 MW operating at a 100 annual load factor (10 MW times 24 hours times 365 days) the annual benefit would be on the order of $500000 for ERS or $1 million for RRS
copy 2016 ERCOT All rights reserved 8
Study on the Demand Response Potential for Seawater Desalination Projects ERCOT Public
In 2015 demand-side resources providing responsive reserves were deployed one time for a duration of 10 minutes and ERS was not deployed12 The most ERS was ever deployed in a single year was two times in 2011 Thus participation in either program could result in a substantial payment to a seawater desalination plant with a relatively low risk of deployment and associated disruption of plant operations although it is important to note that participation in either ERCOT service subjects demand response resources to annual unannounced testing Other than testing the frequency of deployment will depend on grid conditions and is a risk that should be considered
The financial benefits of participation must be weighed against the costs of designing facilities with the capabilities to operate in this manner These include
bull The costs to design the plant to reduce electrical demand within the required timeframes for demand response and to withstand an instantaneous interruption if not already part of the plant design For example a plant may need to be designed to have backup power generation on-site In addition there could also be costs to restart the system after an interruption
bull The costs to build a plant with excess capacity andor storage to make up for lost production hours when demand response is deployed This will add to the total capital costs of the project Land area constraints should also be considered when considering additional storage as the space requirements for the necessary storage capacity could be significant
bull Costs associated with the impact of interruptions on plant processes (eg more frequent replacement of membranes impacts to pretreatment system or plant infrastructure)
bull Potential financial penalties that would be incurred if deployment as part of demand response were to result in failure to meet contract obligations to supply water
bull The loss of potential benefits in the form of cost avoidance from participation in non-ERCOTshydispatched demand response opportunities (see Section 43) If a plant is committed to RRS or ERS the plant operator would lose the flexibility to take advantage of these other opportunities to reduce their electricity costs
The interplay of these benefits and costs will determine whether it would be beneficial for a future seawater desalination plant to participate in demand response in ERCOT
43 Considerations for Non-ERCOT-Dispatched Demand Response Outside of the reliability-based services administered by ERCOT there are other opportunities for seawater desalination plants to reduce their electricity costs As described in Section 321 seawater desalination plants may be able to reduce the demand charges on their electricity bills through curtailing load during 4CP intervals In addition plant operators may adjust operations in response to real-time electricity prices to take advantage of lower off-peak prices and avoid price spikes (see Sections 322 and 323) All of these opportunities require that the plant have flexibility to reduce production during certain times of the day
In the ERCOT region as noted above a portion of transmission and distribution charges are set based on the peak systemwide 15-minute interval of the four summer months (June through September) referred to as the four coincident peaks (4CP) Large customers can reduce or avoid this charge by reducing electrical consumption during these four peak intervals AEP Central Texas and CenterPoint are the transmission providers covering the majority of the Gulf Coast in Texas13
12 ERCOT June 2016 ldquoLoad Resource Deployment Updaterdquo Available at httpwwwercotcomcontentwcmkey_documents_lists870985_RRS_Load_Resource_Deployment_Updatepdf 13 It is also possible that a seawater desalination plant could be located in an area that as not opted in to competition in which case the plant owner would need to negotiate its electricity charges bilaterally with the Non Opt-In Entity (NOIE)
copy 2016 ERCOT All rights reserved 9
Study on the Demand Response Potential for Seawater Desalination Projects ERCOT Public
Assuming a future seawater desalination plant would be connected at transmission-level voltages the relevant 4CP charges based on the 2016 tariffs accounting for both transmission charges and transmission cost recovery factors would be $41425 per 4CP kW for AEP Central Texas and $41870 per 4CP kVA for CenterPoint14 If a seawater desalination plant has 10 MW of load and is capable of interrupting all of it and successfully does so for all four 4CP intervals the savings based on the 2016 tariffs would be approximately $500000 per year ($41425 times 1000 (kW to MW) times 10 MW times 12 months) Thus a seawater desalination plant that reduces its electricity use during the 4CP intervals could avert some or all of these charges
Another opportunity for seawater desalination plants to reduce their electricity costs is through adjusting operations in response to real-time electricity prices In 2015 the average electricity price in ERCOT was $2677MWh However prices exceeded $50MWh in 254 hours (3 of all hours) $100MWh in 88 hours (1) $200MWh in 40 hours (05) and $300MWh in 21 hours (02) Prices exceeded $3000MWh for 021 hours15 Depending on the desalination plantrsquos exposure to real-time wholesale market prices (via its retail contract) the degree of high prices the plant owner is willing to avoid and grid conditions in a given year reducing unit operations in order to avoid high electricity prices could impact operators for anywhere between a few and several hundred hours out of the year In addition a plant can plan its operations to take advantage of lower electricity prices during off-peak periods (eg at night when generation from wind is high) For example at least one company is marketing a modular desalination unit design intended to take advantage of low prices during periods of high renewables generation and to provide grid reliability services through demand response16
There are several factors to consider regarding these opportunities to reduce electricity costs The plant would need to monitor the ERCOT market or hire a contractor to do so in order to know when to reduce demand for electricity These programs do not impose any requirements on response time as with RRS or ERS and there may be sufficient warning of 4CP intervals or peak pricing to allow the plant operator to plan its operations earlier in the day with sufficient time to ramp down production under controlled conditions However quicker ramping capability may be desirable to respond to electricity price fluctuations
For 4CP because the four intervals used to set demand charges are not known ahead of time it is likely that the plant would need to reduce its demand multiple times per summer to ensure the 4CP intervals are hit impacting production at the facility Timing operations to coincide with off-peak pricing or to avoid price spikes would similarly result in reduced operations during certain hours To offset the lost production hours the plant may need to be designed with extra capacity and water storage capability to maintain the ability to meet its contractual obligations for freshwater delivery Because the period of reduced operations is greater than with ERCOT-dispatched demand response services this need would be greater for a seawater desalination plant reducing load during 4CP intervals or in response to real-time electricity prices and would increase the capital costs of the project It should also be noted that high prices in the ERCOT Region typically but not always occur in summer months when drought conditions are more likely to develop and demand for desalinated water is likely to be highest This may limit the flexibility of the plant to time its electricity consumption to avoid high-priced hours
14 Public Utility Commission of Texas ldquoTransmission and Distribution Rates for Investor Owned Utilitiesrdquo Available at httpwwwpuctexasgovindustryelectricratestdraspx 15 Potomac Economics June 2016 2015 State of the Market Report for the ERCOT Wholesale Electricity Markets Available at httpswwwpotomaceconomicscomindexphpmarkets_monitoredERCOT 16 Sisyan LLC ldquoDemand Response Desalinationrdquo Available at httprenewabledesalinationcomwpshycontentuploads201506Demand-Response-Desalinationpdf
copy 2016 ERCOT All rights reserved 10
Study on the Demand Response Potential for Seawater Desalination Projects ERCOT Public
In addition the plantrsquos ability to participate in demand response would also be limited for those hours it is reducing load as part of 4CP response or in response to real-time prices because the plant would not be able to reduce its electricity consumption if that demand is already committed to another demand response service Thus participating in demand response versus taking advantage of these other opportunities may be to some extent mutually exclusive
5 Conclusion
Based on this analysis it appears that the operational characteristics of seawater desalination plants would allow them to participate in demand response opportunities in ERCOT so long as the necessary operational requirements are considered in the design specifications of the plant Project developers should consider the necessary requirements early in the plant design Whether the economic benefits of participation would provide a sufficient incentive for them to do so will depend on the costs of accommodating those operational requirements and whether there is the flexibility available to operate the plant as necessary under these programs Though most existing seawater desalination plants do not participate in demand response programs it does appear that participation by these plants is possible and could result in a financial benefit Table 2 compares the different demand response opportunities available to demand-side resources in ERCOT
Table 2 Comparison of Demand Response Opportunities Demand Response
Opportunity Requirements for
Participation Impacts to Plant
Operations Financial Benefit Ancillary Services ndash Responsive Reserve Service (RRS)
bull Under-Frequency Relay bull Instantaneous or 10 minute
response time bull Recover load within 3
hours bull Bid in day-ahead market
bull Deployed once in 2015 for 10 minutes bull Subject to annual
unannounced testing
bull $1087 per MW per hour (based on 2015 prices)
Emergency Response Service (ERS)
bull 10 or 30 minute response time bull Recover load within 10
hours bull Four-month contract term
bull Not deployed in 2015 the most times ever deployed in a single year was twice in 2011 bull Subject to annual
unannounced testing
bull $645 per MW per hour (based on 2015 prices)
Four Coincident bull Interval Data Recorder bull Likely plant will need to bull Avoid ~$48000 per 4CP Peak (4CP) (IDR) meter
bull Ability to predict system-wide peak demand hours during summer months
reduce load multiple times per summer to hit 4CP intervals bull Likely to be able to predict
possible 4CP intervals earlier in day
MW per year (based on 2016 tariffs) if successful in reducing during all four summer months
LSE or DR Provider Contracted Price Response
bull Varies based on contractual arrangements
bull Varies based on contractual arrangements
bull Varies based on contractual arrangements
Self-Directed Price bull Retail contract with bull Varies depending on bull Varies depending on Response exposure to real-time
market prices bull Ability to monitor real-time
prices in ERCOT wholesale market
number and severity of pricing events bull May be able to predict
peak pricing events earlier in day
number and severity of pricing events
copy 2016 ERCOT All rights reserved 11
Study on the Demand Response Potential for Seawater Desalination Projects ERCOT Public
Demand response programs in ERCOT provide opportunities for demand-side resources to defray their electricity costs and provide reliability benefits to the ERCOT electric grid Because the process of seawater desalination is energy intensive participation in demand response could help to reduce electricity costs while posing a relatively low risk to plant operations if demand response participation is factored into plant design
Participation in non-ERCOT-dispatched demand response opportunities such as reducing load during 4CP intervals or in response to real-time electricity prices may also help to reduce electricity costs for seawater desalination plants in Texas As stakeholders in Texas continue to plan for possible future droughts in the region and identify water management strategies consideration of demand response could play a role in mitigating some costs associated with seawater desalination and allow seawater desalination plants to assist with maintaining electric reliability in the region
copy 2016 ERCOT All rights reserved 12

Study on the Demand Response Potential for Seawater Desalination Projects ERCOT Public
rescheduling certain processes or by utilizing thermal storage) ending certain processes that are no longer economic or through energy efficiency measures
Offerings that incorporate CPP usually have prescribed high prices only during certain defined periods ndash for example when load or prices are expected to reach a certain level Response to CPP may be similar to those employed under TOU tariffs especially if CPP is reached frequently More often CPP is infrequent and as such short-term load curtailment may be the more appropriate response to meet economic objectives
4 Demand Response Potential for Seawater Desalination
This section evaluates whether the operational characteristics and economics of seawater desalination plants would enable them to participate in one or more of the various demand response opportunities in the ERCOT Region To date participation of seawater desalination plants in demand response programs has been limited Neither the plant in Carlsbad nor the plant in Tampa Bay participate in demand response programs in California or Florida respectively However as will be described below it appears that these plants can be designed and operated to meet the requirements for participation in demand response and receive economic benefit from participation in these programs
Section 41 describes the operational parameters that must be met for a demand-side resource to provide ERCOT-dispatched demand response and evaluates the ability of seawater desalination plants to meet these criteria Section 42 discusses the tradeoffs between payments for participation in ERCOT-dispatched demand response and potential additional costs posed to seawater desalination plants Finally Section 43 presents other opportunities for seawater desalination plants to reduce their electricity costs outside of ERCOTrsquos reliability-based services that are open to demand response assets
41 Operational Considerations for ERCOT-Dispatched Demand Response There are several key operational parameters that impact a demand-side resourcersquos ability to participate in different demand response services response time recovery time predictability of electrical demand and flexibility of operations This section discusses each of these considerations as they apply to seawater desalination plants
As discussed in Section 31 one of the differentiating factors between ERCOTrsquos demand response products is the amount of time within which a demand-side resource must respond to a deployment instruction to reduce electricity consumption during an event Participation in RRS requires an automatic response within either half a second (ie instantaneous) based on grid frequency or within 10 minutes via a manual instruction ERS requires a response time of either 10 or 30 minutes As noted in Section 21 the typical time to take a reverse osmosis train on- or off-line is 1-2 hours under normal controlled operations To comply with the response time requirements of RRS or ERS a seawater desalination plant would need to be able to reduce its electricity consumption far more quickly than in normal operations This is an element of plant design that would need to be accounted for in the specifications of the project Considerations include the potential need for on-site backup generation including uninterruptible power supply potential impacts to plant infrastructure (eg piping) reverse osmosis membranes and pretreatment systems
The two large US desalination plants provide illustrative counterpoints in this respect The Carlsbad plant was designed to withstand instantaneous power interruptions and has on-site backup generation including uninterruptible power supply to provide the ability to power control systems and flush the membranes in the event of a power loss In contrast the Tampa Bay plant was not
copy 2016 ERCOT All rights reserved 7
Study on the Demand Response Potential for Seawater Desalination Projects ERCOT Public
designed with on-site backup generation and a loss of power would result in a plant shutdown and may require several days to bring the plant back on-line Thus it appears that it is technically possible for a seawater desalination plant to meet the response time requirements for participation in demand response so long as this factor is considered in the design of the facility
The time it takes a desalination train to return to operations after an event is also a consideration Demand-side resources participating in RRS must be able to come back on-line within three hours and those participating in ERS must return within 10 hours Again it appears that it is technically feasible for desalination plants to meet this requirement so long as this requirement is considered in the plant design
An additional consideration is the predictability of a demand-side resourcersquos electricity consumption Participation in the responsive reserves ancillary service market requires bidding in the day-ahead market and thus a demand-side resource must know with great accuracy (within 95) its electrical demand at least a day ahead of time For ERS auctions are held three times a year for four-month contract periods Thus to participate in ERS a resource must know its forecasted electrical demand several months in advance Because seawater desalination plant operations are driven by contracted demand for water it is likely that a plant operator would have a good idea of the plantrsquos electrical demand days or even weeksmonths in advance especially for summer months when demand is likely to be relatively steady An important consideration however is the salinity of the water which drives the electrical requirements and which can be impacted by recent weather events Similarly reductions in demand for water during non-summer months or wet summer days where demand may be reduced could also impact a plantrsquos ability to predict its electricity demand
Finally a seawater desalination plant must have sufficient flexibility in its day-to-day operations so that it can afford to lose several hours of production when deployed for demand response It should be noted that demand-side resources participating in RRS and ERS are called infrequently demand-side resources providing responsive reserves were deployed one time in 2015 and ERS was not deployed that year However this is an important factor to consider if a plant is operating at close to full capacity and would incur financial penalties if it fails to meet its contract obligations due to a demand response event Including additional storage and building a plant with extra capacity could help to mitigate this risk It should also be noted that a plant operator does not need to commit the full plant capacity to these services but rather can specify an amount of MW that will be committed Thus a plant operator could mitigate issues both with predictability and flexibility of plant operations by committing only a portion of its predicted electrical demand to participate in demand response
Considering these factors together it appears that seawater desalination plants could be designed to meet the operational requirements for participation in ERCOTrsquos demand response services (both RRS and ERS) Because the ability to meet the requirements is dependent on the plant design demand response would need to be considered early in a projectrsquos development if participation is desirable Whether project developers will choose to address these requirements will depend on the economic benefits of participation in demand response which will be discussed in the next section
42 Economic Considerations for ERCOT-Dispatched Demand Response This section describes the economic benefits to demand-side resources from participation in ERCOT-dispatched demand response programs The average price paid for a demand-side resource participating in RRS in 2015 was $1087 per MW per hour and for ERS was $645 per MW per hour for the contract periods during the 2015 program year These payments could provide a significant financial benefit to seawater desalination plants To give a simplified example for a plant with an electrical demand of 10 MW operating at a 100 annual load factor (10 MW times 24 hours times 365 days) the annual benefit would be on the order of $500000 for ERS or $1 million for RRS
copy 2016 ERCOT All rights reserved 8
Study on the Demand Response Potential for Seawater Desalination Projects ERCOT Public
In 2015 demand-side resources providing responsive reserves were deployed one time for a duration of 10 minutes and ERS was not deployed12 The most ERS was ever deployed in a single year was two times in 2011 Thus participation in either program could result in a substantial payment to a seawater desalination plant with a relatively low risk of deployment and associated disruption of plant operations although it is important to note that participation in either ERCOT service subjects demand response resources to annual unannounced testing Other than testing the frequency of deployment will depend on grid conditions and is a risk that should be considered
The financial benefits of participation must be weighed against the costs of designing facilities with the capabilities to operate in this manner These include
bull The costs to design the plant to reduce electrical demand within the required timeframes for demand response and to withstand an instantaneous interruption if not already part of the plant design For example a plant may need to be designed to have backup power generation on-site In addition there could also be costs to restart the system after an interruption
bull The costs to build a plant with excess capacity andor storage to make up for lost production hours when demand response is deployed This will add to the total capital costs of the project Land area constraints should also be considered when considering additional storage as the space requirements for the necessary storage capacity could be significant
bull Costs associated with the impact of interruptions on plant processes (eg more frequent replacement of membranes impacts to pretreatment system or plant infrastructure)
bull Potential financial penalties that would be incurred if deployment as part of demand response were to result in failure to meet contract obligations to supply water
bull The loss of potential benefits in the form of cost avoidance from participation in non-ERCOTshydispatched demand response opportunities (see Section 43) If a plant is committed to RRS or ERS the plant operator would lose the flexibility to take advantage of these other opportunities to reduce their electricity costs
The interplay of these benefits and costs will determine whether it would be beneficial for a future seawater desalination plant to participate in demand response in ERCOT
43 Considerations for Non-ERCOT-Dispatched Demand Response Outside of the reliability-based services administered by ERCOT there are other opportunities for seawater desalination plants to reduce their electricity costs As described in Section 321 seawater desalination plants may be able to reduce the demand charges on their electricity bills through curtailing load during 4CP intervals In addition plant operators may adjust operations in response to real-time electricity prices to take advantage of lower off-peak prices and avoid price spikes (see Sections 322 and 323) All of these opportunities require that the plant have flexibility to reduce production during certain times of the day
In the ERCOT region as noted above a portion of transmission and distribution charges are set based on the peak systemwide 15-minute interval of the four summer months (June through September) referred to as the four coincident peaks (4CP) Large customers can reduce or avoid this charge by reducing electrical consumption during these four peak intervals AEP Central Texas and CenterPoint are the transmission providers covering the majority of the Gulf Coast in Texas13
12 ERCOT June 2016 ldquoLoad Resource Deployment Updaterdquo Available at httpwwwercotcomcontentwcmkey_documents_lists870985_RRS_Load_Resource_Deployment_Updatepdf 13 It is also possible that a seawater desalination plant could be located in an area that as not opted in to competition in which case the plant owner would need to negotiate its electricity charges bilaterally with the Non Opt-In Entity (NOIE)
copy 2016 ERCOT All rights reserved 9
Study on the Demand Response Potential for Seawater Desalination Projects ERCOT Public
Assuming a future seawater desalination plant would be connected at transmission-level voltages the relevant 4CP charges based on the 2016 tariffs accounting for both transmission charges and transmission cost recovery factors would be $41425 per 4CP kW for AEP Central Texas and $41870 per 4CP kVA for CenterPoint14 If a seawater desalination plant has 10 MW of load and is capable of interrupting all of it and successfully does so for all four 4CP intervals the savings based on the 2016 tariffs would be approximately $500000 per year ($41425 times 1000 (kW to MW) times 10 MW times 12 months) Thus a seawater desalination plant that reduces its electricity use during the 4CP intervals could avert some or all of these charges
Another opportunity for seawater desalination plants to reduce their electricity costs is through adjusting operations in response to real-time electricity prices In 2015 the average electricity price in ERCOT was $2677MWh However prices exceeded $50MWh in 254 hours (3 of all hours) $100MWh in 88 hours (1) $200MWh in 40 hours (05) and $300MWh in 21 hours (02) Prices exceeded $3000MWh for 021 hours15 Depending on the desalination plantrsquos exposure to real-time wholesale market prices (via its retail contract) the degree of high prices the plant owner is willing to avoid and grid conditions in a given year reducing unit operations in order to avoid high electricity prices could impact operators for anywhere between a few and several hundred hours out of the year In addition a plant can plan its operations to take advantage of lower electricity prices during off-peak periods (eg at night when generation from wind is high) For example at least one company is marketing a modular desalination unit design intended to take advantage of low prices during periods of high renewables generation and to provide grid reliability services through demand response16
There are several factors to consider regarding these opportunities to reduce electricity costs The plant would need to monitor the ERCOT market or hire a contractor to do so in order to know when to reduce demand for electricity These programs do not impose any requirements on response time as with RRS or ERS and there may be sufficient warning of 4CP intervals or peak pricing to allow the plant operator to plan its operations earlier in the day with sufficient time to ramp down production under controlled conditions However quicker ramping capability may be desirable to respond to electricity price fluctuations
For 4CP because the four intervals used to set demand charges are not known ahead of time it is likely that the plant would need to reduce its demand multiple times per summer to ensure the 4CP intervals are hit impacting production at the facility Timing operations to coincide with off-peak pricing or to avoid price spikes would similarly result in reduced operations during certain hours To offset the lost production hours the plant may need to be designed with extra capacity and water storage capability to maintain the ability to meet its contractual obligations for freshwater delivery Because the period of reduced operations is greater than with ERCOT-dispatched demand response services this need would be greater for a seawater desalination plant reducing load during 4CP intervals or in response to real-time electricity prices and would increase the capital costs of the project It should also be noted that high prices in the ERCOT Region typically but not always occur in summer months when drought conditions are more likely to develop and demand for desalinated water is likely to be highest This may limit the flexibility of the plant to time its electricity consumption to avoid high-priced hours
14 Public Utility Commission of Texas ldquoTransmission and Distribution Rates for Investor Owned Utilitiesrdquo Available at httpwwwpuctexasgovindustryelectricratestdraspx 15 Potomac Economics June 2016 2015 State of the Market Report for the ERCOT Wholesale Electricity Markets Available at httpswwwpotomaceconomicscomindexphpmarkets_monitoredERCOT 16 Sisyan LLC ldquoDemand Response Desalinationrdquo Available at httprenewabledesalinationcomwpshycontentuploads201506Demand-Response-Desalinationpdf
copy 2016 ERCOT All rights reserved 10
Study on the Demand Response Potential for Seawater Desalination Projects ERCOT Public
In addition the plantrsquos ability to participate in demand response would also be limited for those hours it is reducing load as part of 4CP response or in response to real-time prices because the plant would not be able to reduce its electricity consumption if that demand is already committed to another demand response service Thus participating in demand response versus taking advantage of these other opportunities may be to some extent mutually exclusive
5 Conclusion
Based on this analysis it appears that the operational characteristics of seawater desalination plants would allow them to participate in demand response opportunities in ERCOT so long as the necessary operational requirements are considered in the design specifications of the plant Project developers should consider the necessary requirements early in the plant design Whether the economic benefits of participation would provide a sufficient incentive for them to do so will depend on the costs of accommodating those operational requirements and whether there is the flexibility available to operate the plant as necessary under these programs Though most existing seawater desalination plants do not participate in demand response programs it does appear that participation by these plants is possible and could result in a financial benefit Table 2 compares the different demand response opportunities available to demand-side resources in ERCOT
Table 2 Comparison of Demand Response Opportunities Demand Response
Opportunity Requirements for
Participation Impacts to Plant
Operations Financial Benefit Ancillary Services ndash Responsive Reserve Service (RRS)
bull Under-Frequency Relay bull Instantaneous or 10 minute
response time bull Recover load within 3
hours bull Bid in day-ahead market
bull Deployed once in 2015 for 10 minutes bull Subject to annual
unannounced testing
bull $1087 per MW per hour (based on 2015 prices)
Emergency Response Service (ERS)
bull 10 or 30 minute response time bull Recover load within 10
hours bull Four-month contract term
bull Not deployed in 2015 the most times ever deployed in a single year was twice in 2011 bull Subject to annual
unannounced testing
bull $645 per MW per hour (based on 2015 prices)
Four Coincident bull Interval Data Recorder bull Likely plant will need to bull Avoid ~$48000 per 4CP Peak (4CP) (IDR) meter
bull Ability to predict system-wide peak demand hours during summer months
reduce load multiple times per summer to hit 4CP intervals bull Likely to be able to predict
possible 4CP intervals earlier in day
MW per year (based on 2016 tariffs) if successful in reducing during all four summer months
LSE or DR Provider Contracted Price Response
bull Varies based on contractual arrangements
bull Varies based on contractual arrangements
bull Varies based on contractual arrangements
Self-Directed Price bull Retail contract with bull Varies depending on bull Varies depending on Response exposure to real-time
market prices bull Ability to monitor real-time
prices in ERCOT wholesale market
number and severity of pricing events bull May be able to predict
peak pricing events earlier in day
number and severity of pricing events
copy 2016 ERCOT All rights reserved 11
Study on the Demand Response Potential for Seawater Desalination Projects ERCOT Public
Demand response programs in ERCOT provide opportunities for demand-side resources to defray their electricity costs and provide reliability benefits to the ERCOT electric grid Because the process of seawater desalination is energy intensive participation in demand response could help to reduce electricity costs while posing a relatively low risk to plant operations if demand response participation is factored into plant design
Participation in non-ERCOT-dispatched demand response opportunities such as reducing load during 4CP intervals or in response to real-time electricity prices may also help to reduce electricity costs for seawater desalination plants in Texas As stakeholders in Texas continue to plan for possible future droughts in the region and identify water management strategies consideration of demand response could play a role in mitigating some costs associated with seawater desalination and allow seawater desalination plants to assist with maintaining electric reliability in the region
copy 2016 ERCOT All rights reserved 12
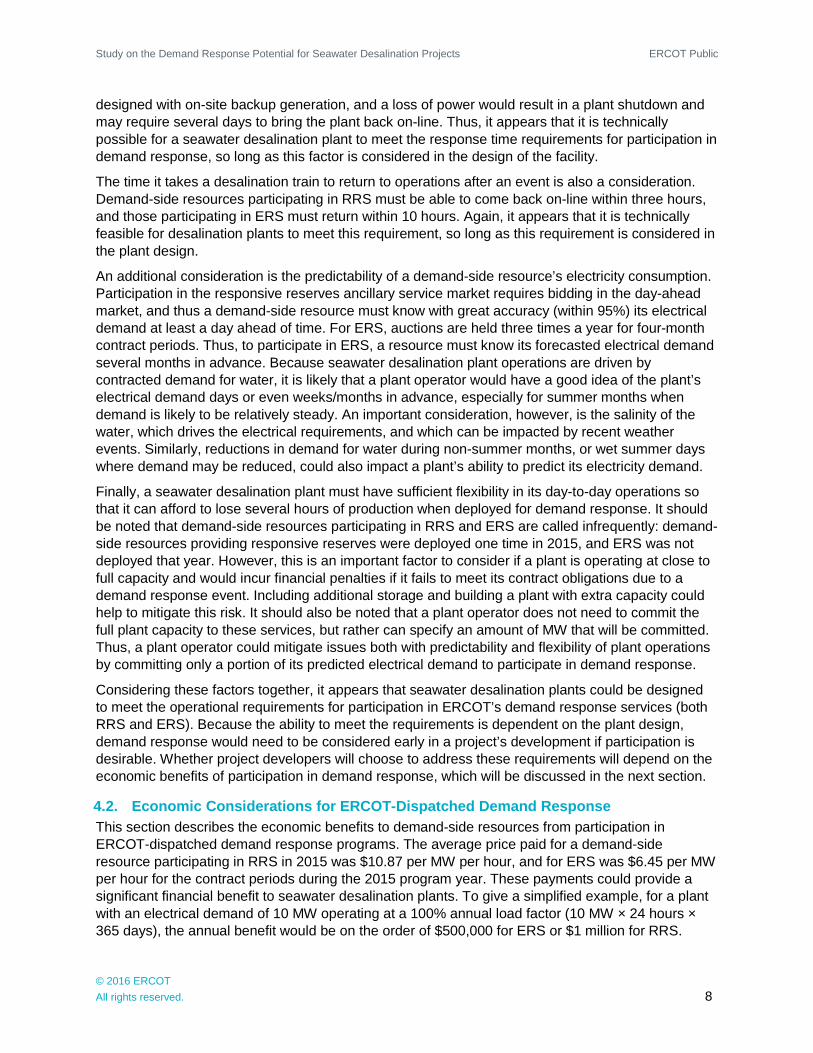
Study on the Demand Response Potential for Seawater Desalination Projects ERCOT Public
designed with on-site backup generation and a loss of power would result in a plant shutdown and may require several days to bring the plant back on-line Thus it appears that it is technically possible for a seawater desalination plant to meet the response time requirements for participation in demand response so long as this factor is considered in the design of the facility
The time it takes a desalination train to return to operations after an event is also a consideration Demand-side resources participating in RRS must be able to come back on-line within three hours and those participating in ERS must return within 10 hours Again it appears that it is technically feasible for desalination plants to meet this requirement so long as this requirement is considered in the plant design
An additional consideration is the predictability of a demand-side resourcersquos electricity consumption Participation in the responsive reserves ancillary service market requires bidding in the day-ahead market and thus a demand-side resource must know with great accuracy (within 95) its electrical demand at least a day ahead of time For ERS auctions are held three times a year for four-month contract periods Thus to participate in ERS a resource must know its forecasted electrical demand several months in advance Because seawater desalination plant operations are driven by contracted demand for water it is likely that a plant operator would have a good idea of the plantrsquos electrical demand days or even weeksmonths in advance especially for summer months when demand is likely to be relatively steady An important consideration however is the salinity of the water which drives the electrical requirements and which can be impacted by recent weather events Similarly reductions in demand for water during non-summer months or wet summer days where demand may be reduced could also impact a plantrsquos ability to predict its electricity demand
Finally a seawater desalination plant must have sufficient flexibility in its day-to-day operations so that it can afford to lose several hours of production when deployed for demand response It should be noted that demand-side resources participating in RRS and ERS are called infrequently demand-side resources providing responsive reserves were deployed one time in 2015 and ERS was not deployed that year However this is an important factor to consider if a plant is operating at close to full capacity and would incur financial penalties if it fails to meet its contract obligations due to a demand response event Including additional storage and building a plant with extra capacity could help to mitigate this risk It should also be noted that a plant operator does not need to commit the full plant capacity to these services but rather can specify an amount of MW that will be committed Thus a plant operator could mitigate issues both with predictability and flexibility of plant operations by committing only a portion of its predicted electrical demand to participate in demand response
Considering these factors together it appears that seawater desalination plants could be designed to meet the operational requirements for participation in ERCOTrsquos demand response services (both RRS and ERS) Because the ability to meet the requirements is dependent on the plant design demand response would need to be considered early in a projectrsquos development if participation is desirable Whether project developers will choose to address these requirements will depend on the economic benefits of participation in demand response which will be discussed in the next section
42 Economic Considerations for ERCOT-Dispatched Demand Response This section describes the economic benefits to demand-side resources from participation in ERCOT-dispatched demand response programs The average price paid for a demand-side resource participating in RRS in 2015 was $1087 per MW per hour and for ERS was $645 per MW per hour for the contract periods during the 2015 program year These payments could provide a significant financial benefit to seawater desalination plants To give a simplified example for a plant with an electrical demand of 10 MW operating at a 100 annual load factor (10 MW times 24 hours times 365 days) the annual benefit would be on the order of $500000 for ERS or $1 million for RRS
copy 2016 ERCOT All rights reserved 8
Study on the Demand Response Potential for Seawater Desalination Projects ERCOT Public
In 2015 demand-side resources providing responsive reserves were deployed one time for a duration of 10 minutes and ERS was not deployed12 The most ERS was ever deployed in a single year was two times in 2011 Thus participation in either program could result in a substantial payment to a seawater desalination plant with a relatively low risk of deployment and associated disruption of plant operations although it is important to note that participation in either ERCOT service subjects demand response resources to annual unannounced testing Other than testing the frequency of deployment will depend on grid conditions and is a risk that should be considered
The financial benefits of participation must be weighed against the costs of designing facilities with the capabilities to operate in this manner These include
bull The costs to design the plant to reduce electrical demand within the required timeframes for demand response and to withstand an instantaneous interruption if not already part of the plant design For example a plant may need to be designed to have backup power generation on-site In addition there could also be costs to restart the system after an interruption
bull The costs to build a plant with excess capacity andor storage to make up for lost production hours when demand response is deployed This will add to the total capital costs of the project Land area constraints should also be considered when considering additional storage as the space requirements for the necessary storage capacity could be significant
bull Costs associated with the impact of interruptions on plant processes (eg more frequent replacement of membranes impacts to pretreatment system or plant infrastructure)
bull Potential financial penalties that would be incurred if deployment as part of demand response were to result in failure to meet contract obligations to supply water
bull The loss of potential benefits in the form of cost avoidance from participation in non-ERCOTshydispatched demand response opportunities (see Section 43) If a plant is committed to RRS or ERS the plant operator would lose the flexibility to take advantage of these other opportunities to reduce their electricity costs
The interplay of these benefits and costs will determine whether it would be beneficial for a future seawater desalination plant to participate in demand response in ERCOT
43 Considerations for Non-ERCOT-Dispatched Demand Response Outside of the reliability-based services administered by ERCOT there are other opportunities for seawater desalination plants to reduce their electricity costs As described in Section 321 seawater desalination plants may be able to reduce the demand charges on their electricity bills through curtailing load during 4CP intervals In addition plant operators may adjust operations in response to real-time electricity prices to take advantage of lower off-peak prices and avoid price spikes (see Sections 322 and 323) All of these opportunities require that the plant have flexibility to reduce production during certain times of the day
In the ERCOT region as noted above a portion of transmission and distribution charges are set based on the peak systemwide 15-minute interval of the four summer months (June through September) referred to as the four coincident peaks (4CP) Large customers can reduce or avoid this charge by reducing electrical consumption during these four peak intervals AEP Central Texas and CenterPoint are the transmission providers covering the majority of the Gulf Coast in Texas13
12 ERCOT June 2016 ldquoLoad Resource Deployment Updaterdquo Available at httpwwwercotcomcontentwcmkey_documents_lists870985_RRS_Load_Resource_Deployment_Updatepdf 13 It is also possible that a seawater desalination plant could be located in an area that as not opted in to competition in which case the plant owner would need to negotiate its electricity charges bilaterally with the Non Opt-In Entity (NOIE)
copy 2016 ERCOT All rights reserved 9
Study on the Demand Response Potential for Seawater Desalination Projects ERCOT Public
Assuming a future seawater desalination plant would be connected at transmission-level voltages the relevant 4CP charges based on the 2016 tariffs accounting for both transmission charges and transmission cost recovery factors would be $41425 per 4CP kW for AEP Central Texas and $41870 per 4CP kVA for CenterPoint14 If a seawater desalination plant has 10 MW of load and is capable of interrupting all of it and successfully does so for all four 4CP intervals the savings based on the 2016 tariffs would be approximately $500000 per year ($41425 times 1000 (kW to MW) times 10 MW times 12 months) Thus a seawater desalination plant that reduces its electricity use during the 4CP intervals could avert some or all of these charges
Another opportunity for seawater desalination plants to reduce their electricity costs is through adjusting operations in response to real-time electricity prices In 2015 the average electricity price in ERCOT was $2677MWh However prices exceeded $50MWh in 254 hours (3 of all hours) $100MWh in 88 hours (1) $200MWh in 40 hours (05) and $300MWh in 21 hours (02) Prices exceeded $3000MWh for 021 hours15 Depending on the desalination plantrsquos exposure to real-time wholesale market prices (via its retail contract) the degree of high prices the plant owner is willing to avoid and grid conditions in a given year reducing unit operations in order to avoid high electricity prices could impact operators for anywhere between a few and several hundred hours out of the year In addition a plant can plan its operations to take advantage of lower electricity prices during off-peak periods (eg at night when generation from wind is high) For example at least one company is marketing a modular desalination unit design intended to take advantage of low prices during periods of high renewables generation and to provide grid reliability services through demand response16
There are several factors to consider regarding these opportunities to reduce electricity costs The plant would need to monitor the ERCOT market or hire a contractor to do so in order to know when to reduce demand for electricity These programs do not impose any requirements on response time as with RRS or ERS and there may be sufficient warning of 4CP intervals or peak pricing to allow the plant operator to plan its operations earlier in the day with sufficient time to ramp down production under controlled conditions However quicker ramping capability may be desirable to respond to electricity price fluctuations
For 4CP because the four intervals used to set demand charges are not known ahead of time it is likely that the plant would need to reduce its demand multiple times per summer to ensure the 4CP intervals are hit impacting production at the facility Timing operations to coincide with off-peak pricing or to avoid price spikes would similarly result in reduced operations during certain hours To offset the lost production hours the plant may need to be designed with extra capacity and water storage capability to maintain the ability to meet its contractual obligations for freshwater delivery Because the period of reduced operations is greater than with ERCOT-dispatched demand response services this need would be greater for a seawater desalination plant reducing load during 4CP intervals or in response to real-time electricity prices and would increase the capital costs of the project It should also be noted that high prices in the ERCOT Region typically but not always occur in summer months when drought conditions are more likely to develop and demand for desalinated water is likely to be highest This may limit the flexibility of the plant to time its electricity consumption to avoid high-priced hours
14 Public Utility Commission of Texas ldquoTransmission and Distribution Rates for Investor Owned Utilitiesrdquo Available at httpwwwpuctexasgovindustryelectricratestdraspx 15 Potomac Economics June 2016 2015 State of the Market Report for the ERCOT Wholesale Electricity Markets Available at httpswwwpotomaceconomicscomindexphpmarkets_monitoredERCOT 16 Sisyan LLC ldquoDemand Response Desalinationrdquo Available at httprenewabledesalinationcomwpshycontentuploads201506Demand-Response-Desalinationpdf
copy 2016 ERCOT All rights reserved 10
Study on the Demand Response Potential for Seawater Desalination Projects ERCOT Public
In addition the plantrsquos ability to participate in demand response would also be limited for those hours it is reducing load as part of 4CP response or in response to real-time prices because the plant would not be able to reduce its electricity consumption if that demand is already committed to another demand response service Thus participating in demand response versus taking advantage of these other opportunities may be to some extent mutually exclusive
5 Conclusion
Based on this analysis it appears that the operational characteristics of seawater desalination plants would allow them to participate in demand response opportunities in ERCOT so long as the necessary operational requirements are considered in the design specifications of the plant Project developers should consider the necessary requirements early in the plant design Whether the economic benefits of participation would provide a sufficient incentive for them to do so will depend on the costs of accommodating those operational requirements and whether there is the flexibility available to operate the plant as necessary under these programs Though most existing seawater desalination plants do not participate in demand response programs it does appear that participation by these plants is possible and could result in a financial benefit Table 2 compares the different demand response opportunities available to demand-side resources in ERCOT
Table 2 Comparison of Demand Response Opportunities Demand Response
Opportunity Requirements for
Participation Impacts to Plant
Operations Financial Benefit Ancillary Services ndash Responsive Reserve Service (RRS)
bull Under-Frequency Relay bull Instantaneous or 10 minute
response time bull Recover load within 3
hours bull Bid in day-ahead market
bull Deployed once in 2015 for 10 minutes bull Subject to annual
unannounced testing
bull $1087 per MW per hour (based on 2015 prices)
Emergency Response Service (ERS)
bull 10 or 30 minute response time bull Recover load within 10
hours bull Four-month contract term
bull Not deployed in 2015 the most times ever deployed in a single year was twice in 2011 bull Subject to annual
unannounced testing
bull $645 per MW per hour (based on 2015 prices)
Four Coincident bull Interval Data Recorder bull Likely plant will need to bull Avoid ~$48000 per 4CP Peak (4CP) (IDR) meter
bull Ability to predict system-wide peak demand hours during summer months
reduce load multiple times per summer to hit 4CP intervals bull Likely to be able to predict
possible 4CP intervals earlier in day
MW per year (based on 2016 tariffs) if successful in reducing during all four summer months
LSE or DR Provider Contracted Price Response
bull Varies based on contractual arrangements
bull Varies based on contractual arrangements
bull Varies based on contractual arrangements
Self-Directed Price bull Retail contract with bull Varies depending on bull Varies depending on Response exposure to real-time
market prices bull Ability to monitor real-time
prices in ERCOT wholesale market
number and severity of pricing events bull May be able to predict
peak pricing events earlier in day
number and severity of pricing events
copy 2016 ERCOT All rights reserved 11
Study on the Demand Response Potential for Seawater Desalination Projects ERCOT Public
Demand response programs in ERCOT provide opportunities for demand-side resources to defray their electricity costs and provide reliability benefits to the ERCOT electric grid Because the process of seawater desalination is energy intensive participation in demand response could help to reduce electricity costs while posing a relatively low risk to plant operations if demand response participation is factored into plant design
Participation in non-ERCOT-dispatched demand response opportunities such as reducing load during 4CP intervals or in response to real-time electricity prices may also help to reduce electricity costs for seawater desalination plants in Texas As stakeholders in Texas continue to plan for possible future droughts in the region and identify water management strategies consideration of demand response could play a role in mitigating some costs associated with seawater desalination and allow seawater desalination plants to assist with maintaining electric reliability in the region
copy 2016 ERCOT All rights reserved 12
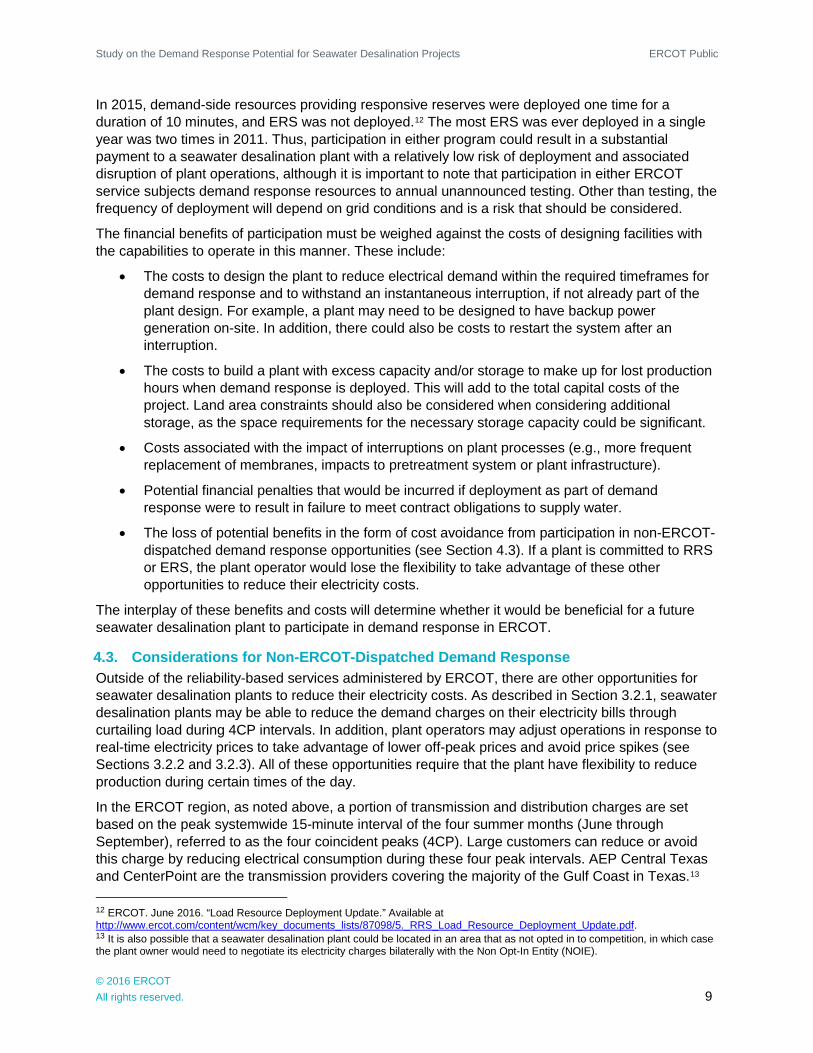
Study on the Demand Response Potential for Seawater Desalination Projects ERCOT Public
In 2015 demand-side resources providing responsive reserves were deployed one time for a duration of 10 minutes and ERS was not deployed12 The most ERS was ever deployed in a single year was two times in 2011 Thus participation in either program could result in a substantial payment to a seawater desalination plant with a relatively low risk of deployment and associated disruption of plant operations although it is important to note that participation in either ERCOT service subjects demand response resources to annual unannounced testing Other than testing the frequency of deployment will depend on grid conditions and is a risk that should be considered
The financial benefits of participation must be weighed against the costs of designing facilities with the capabilities to operate in this manner These include
bull The costs to design the plant to reduce electrical demand within the required timeframes for demand response and to withstand an instantaneous interruption if not already part of the plant design For example a plant may need to be designed to have backup power generation on-site In addition there could also be costs to restart the system after an interruption
bull The costs to build a plant with excess capacity andor storage to make up for lost production hours when demand response is deployed This will add to the total capital costs of the project Land area constraints should also be considered when considering additional storage as the space requirements for the necessary storage capacity could be significant
bull Costs associated with the impact of interruptions on plant processes (eg more frequent replacement of membranes impacts to pretreatment system or plant infrastructure)
bull Potential financial penalties that would be incurred if deployment as part of demand response were to result in failure to meet contract obligations to supply water
bull The loss of potential benefits in the form of cost avoidance from participation in non-ERCOTshydispatched demand response opportunities (see Section 43) If a plant is committed to RRS or ERS the plant operator would lose the flexibility to take advantage of these other opportunities to reduce their electricity costs
The interplay of these benefits and costs will determine whether it would be beneficial for a future seawater desalination plant to participate in demand response in ERCOT
43 Considerations for Non-ERCOT-Dispatched Demand Response Outside of the reliability-based services administered by ERCOT there are other opportunities for seawater desalination plants to reduce their electricity costs As described in Section 321 seawater desalination plants may be able to reduce the demand charges on their electricity bills through curtailing load during 4CP intervals In addition plant operators may adjust operations in response to real-time electricity prices to take advantage of lower off-peak prices and avoid price spikes (see Sections 322 and 323) All of these opportunities require that the plant have flexibility to reduce production during certain times of the day
In the ERCOT region as noted above a portion of transmission and distribution charges are set based on the peak systemwide 15-minute interval of the four summer months (June through September) referred to as the four coincident peaks (4CP) Large customers can reduce or avoid this charge by reducing electrical consumption during these four peak intervals AEP Central Texas and CenterPoint are the transmission providers covering the majority of the Gulf Coast in Texas13
12 ERCOT June 2016 ldquoLoad Resource Deployment Updaterdquo Available at httpwwwercotcomcontentwcmkey_documents_lists870985_RRS_Load_Resource_Deployment_Updatepdf 13 It is also possible that a seawater desalination plant could be located in an area that as not opted in to competition in which case the plant owner would need to negotiate its electricity charges bilaterally with the Non Opt-In Entity (NOIE)
copy 2016 ERCOT All rights reserved 9
Study on the Demand Response Potential for Seawater Desalination Projects ERCOT Public
Assuming a future seawater desalination plant would be connected at transmission-level voltages the relevant 4CP charges based on the 2016 tariffs accounting for both transmission charges and transmission cost recovery factors would be $41425 per 4CP kW for AEP Central Texas and $41870 per 4CP kVA for CenterPoint14 If a seawater desalination plant has 10 MW of load and is capable of interrupting all of it and successfully does so for all four 4CP intervals the savings based on the 2016 tariffs would be approximately $500000 per year ($41425 times 1000 (kW to MW) times 10 MW times 12 months) Thus a seawater desalination plant that reduces its electricity use during the 4CP intervals could avert some or all of these charges
Another opportunity for seawater desalination plants to reduce their electricity costs is through adjusting operations in response to real-time electricity prices In 2015 the average electricity price in ERCOT was $2677MWh However prices exceeded $50MWh in 254 hours (3 of all hours) $100MWh in 88 hours (1) $200MWh in 40 hours (05) and $300MWh in 21 hours (02) Prices exceeded $3000MWh for 021 hours15 Depending on the desalination plantrsquos exposure to real-time wholesale market prices (via its retail contract) the degree of high prices the plant owner is willing to avoid and grid conditions in a given year reducing unit operations in order to avoid high electricity prices could impact operators for anywhere between a few and several hundred hours out of the year In addition a plant can plan its operations to take advantage of lower electricity prices during off-peak periods (eg at night when generation from wind is high) For example at least one company is marketing a modular desalination unit design intended to take advantage of low prices during periods of high renewables generation and to provide grid reliability services through demand response16
There are several factors to consider regarding these opportunities to reduce electricity costs The plant would need to monitor the ERCOT market or hire a contractor to do so in order to know when to reduce demand for electricity These programs do not impose any requirements on response time as with RRS or ERS and there may be sufficient warning of 4CP intervals or peak pricing to allow the plant operator to plan its operations earlier in the day with sufficient time to ramp down production under controlled conditions However quicker ramping capability may be desirable to respond to electricity price fluctuations
For 4CP because the four intervals used to set demand charges are not known ahead of time it is likely that the plant would need to reduce its demand multiple times per summer to ensure the 4CP intervals are hit impacting production at the facility Timing operations to coincide with off-peak pricing or to avoid price spikes would similarly result in reduced operations during certain hours To offset the lost production hours the plant may need to be designed with extra capacity and water storage capability to maintain the ability to meet its contractual obligations for freshwater delivery Because the period of reduced operations is greater than with ERCOT-dispatched demand response services this need would be greater for a seawater desalination plant reducing load during 4CP intervals or in response to real-time electricity prices and would increase the capital costs of the project It should also be noted that high prices in the ERCOT Region typically but not always occur in summer months when drought conditions are more likely to develop and demand for desalinated water is likely to be highest This may limit the flexibility of the plant to time its electricity consumption to avoid high-priced hours
14 Public Utility Commission of Texas ldquoTransmission and Distribution Rates for Investor Owned Utilitiesrdquo Available at httpwwwpuctexasgovindustryelectricratestdraspx 15 Potomac Economics June 2016 2015 State of the Market Report for the ERCOT Wholesale Electricity Markets Available at httpswwwpotomaceconomicscomindexphpmarkets_monitoredERCOT 16 Sisyan LLC ldquoDemand Response Desalinationrdquo Available at httprenewabledesalinationcomwpshycontentuploads201506Demand-Response-Desalinationpdf
copy 2016 ERCOT All rights reserved 10
Study on the Demand Response Potential for Seawater Desalination Projects ERCOT Public
In addition the plantrsquos ability to participate in demand response would also be limited for those hours it is reducing load as part of 4CP response or in response to real-time prices because the plant would not be able to reduce its electricity consumption if that demand is already committed to another demand response service Thus participating in demand response versus taking advantage of these other opportunities may be to some extent mutually exclusive
5 Conclusion
Based on this analysis it appears that the operational characteristics of seawater desalination plants would allow them to participate in demand response opportunities in ERCOT so long as the necessary operational requirements are considered in the design specifications of the plant Project developers should consider the necessary requirements early in the plant design Whether the economic benefits of participation would provide a sufficient incentive for them to do so will depend on the costs of accommodating those operational requirements and whether there is the flexibility available to operate the plant as necessary under these programs Though most existing seawater desalination plants do not participate in demand response programs it does appear that participation by these plants is possible and could result in a financial benefit Table 2 compares the different demand response opportunities available to demand-side resources in ERCOT
Table 2 Comparison of Demand Response Opportunities Demand Response
Opportunity Requirements for
Participation Impacts to Plant
Operations Financial Benefit Ancillary Services ndash Responsive Reserve Service (RRS)
bull Under-Frequency Relay bull Instantaneous or 10 minute
response time bull Recover load within 3
hours bull Bid in day-ahead market
bull Deployed once in 2015 for 10 minutes bull Subject to annual
unannounced testing
bull $1087 per MW per hour (based on 2015 prices)
Emergency Response Service (ERS)
bull 10 or 30 minute response time bull Recover load within 10
hours bull Four-month contract term
bull Not deployed in 2015 the most times ever deployed in a single year was twice in 2011 bull Subject to annual
unannounced testing
bull $645 per MW per hour (based on 2015 prices)
Four Coincident bull Interval Data Recorder bull Likely plant will need to bull Avoid ~$48000 per 4CP Peak (4CP) (IDR) meter
bull Ability to predict system-wide peak demand hours during summer months
reduce load multiple times per summer to hit 4CP intervals bull Likely to be able to predict
possible 4CP intervals earlier in day
MW per year (based on 2016 tariffs) if successful in reducing during all four summer months
LSE or DR Provider Contracted Price Response
bull Varies based on contractual arrangements
bull Varies based on contractual arrangements
bull Varies based on contractual arrangements
Self-Directed Price bull Retail contract with bull Varies depending on bull Varies depending on Response exposure to real-time
market prices bull Ability to monitor real-time
prices in ERCOT wholesale market
number and severity of pricing events bull May be able to predict
peak pricing events earlier in day
number and severity of pricing events
copy 2016 ERCOT All rights reserved 11
Study on the Demand Response Potential for Seawater Desalination Projects ERCOT Public
Demand response programs in ERCOT provide opportunities for demand-side resources to defray their electricity costs and provide reliability benefits to the ERCOT electric grid Because the process of seawater desalination is energy intensive participation in demand response could help to reduce electricity costs while posing a relatively low risk to plant operations if demand response participation is factored into plant design
Participation in non-ERCOT-dispatched demand response opportunities such as reducing load during 4CP intervals or in response to real-time electricity prices may also help to reduce electricity costs for seawater desalination plants in Texas As stakeholders in Texas continue to plan for possible future droughts in the region and identify water management strategies consideration of demand response could play a role in mitigating some costs associated with seawater desalination and allow seawater desalination plants to assist with maintaining electric reliability in the region
copy 2016 ERCOT All rights reserved 12
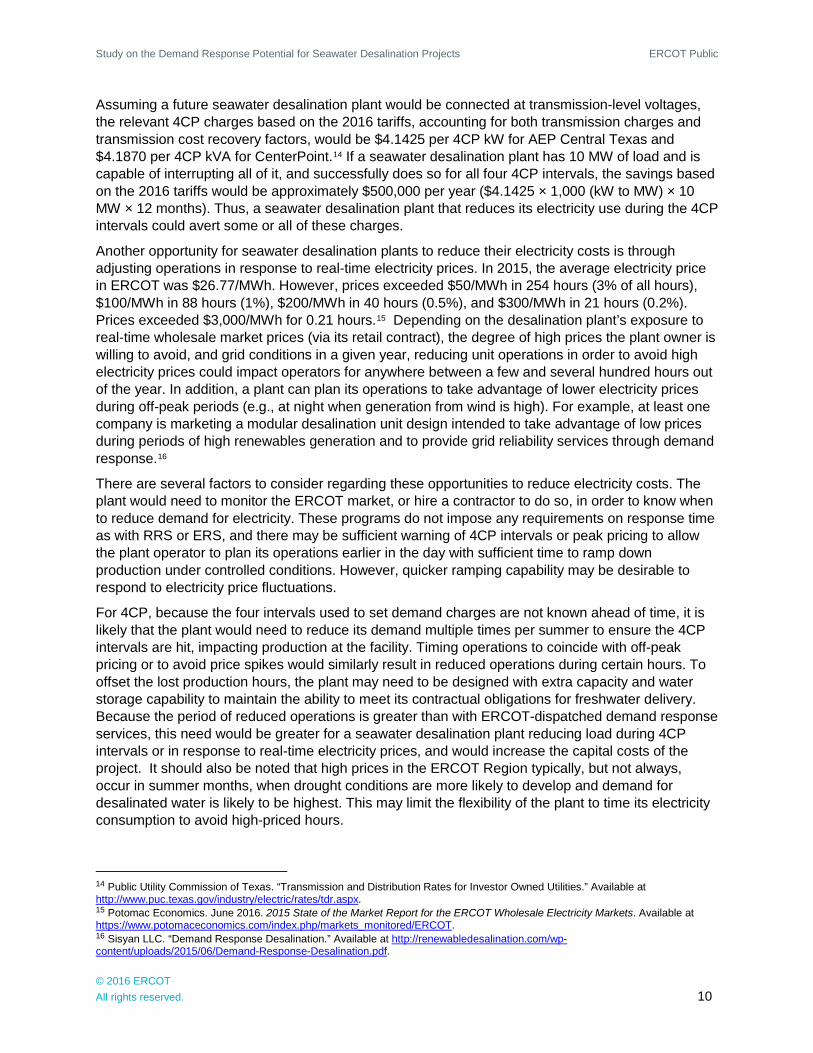
Study on the Demand Response Potential for Seawater Desalination Projects ERCOT Public
Assuming a future seawater desalination plant would be connected at transmission-level voltages the relevant 4CP charges based on the 2016 tariffs accounting for both transmission charges and transmission cost recovery factors would be $41425 per 4CP kW for AEP Central Texas and $41870 per 4CP kVA for CenterPoint14 If a seawater desalination plant has 10 MW of load and is capable of interrupting all of it and successfully does so for all four 4CP intervals the savings based on the 2016 tariffs would be approximately $500000 per year ($41425 times 1000 (kW to MW) times 10 MW times 12 months) Thus a seawater desalination plant that reduces its electricity use during the 4CP intervals could avert some or all of these charges
Another opportunity for seawater desalination plants to reduce their electricity costs is through adjusting operations in response to real-time electricity prices In 2015 the average electricity price in ERCOT was $2677MWh However prices exceeded $50MWh in 254 hours (3 of all hours) $100MWh in 88 hours (1) $200MWh in 40 hours (05) and $300MWh in 21 hours (02) Prices exceeded $3000MWh for 021 hours15 Depending on the desalination plantrsquos exposure to real-time wholesale market prices (via its retail contract) the degree of high prices the plant owner is willing to avoid and grid conditions in a given year reducing unit operations in order to avoid high electricity prices could impact operators for anywhere between a few and several hundred hours out of the year In addition a plant can plan its operations to take advantage of lower electricity prices during off-peak periods (eg at night when generation from wind is high) For example at least one company is marketing a modular desalination unit design intended to take advantage of low prices during periods of high renewables generation and to provide grid reliability services through demand response16
There are several factors to consider regarding these opportunities to reduce electricity costs The plant would need to monitor the ERCOT market or hire a contractor to do so in order to know when to reduce demand for electricity These programs do not impose any requirements on response time as with RRS or ERS and there may be sufficient warning of 4CP intervals or peak pricing to allow the plant operator to plan its operations earlier in the day with sufficient time to ramp down production under controlled conditions However quicker ramping capability may be desirable to respond to electricity price fluctuations
For 4CP because the four intervals used to set demand charges are not known ahead of time it is likely that the plant would need to reduce its demand multiple times per summer to ensure the 4CP intervals are hit impacting production at the facility Timing operations to coincide with off-peak pricing or to avoid price spikes would similarly result in reduced operations during certain hours To offset the lost production hours the plant may need to be designed with extra capacity and water storage capability to maintain the ability to meet its contractual obligations for freshwater delivery Because the period of reduced operations is greater than with ERCOT-dispatched demand response services this need would be greater for a seawater desalination plant reducing load during 4CP intervals or in response to real-time electricity prices and would increase the capital costs of the project It should also be noted that high prices in the ERCOT Region typically but not always occur in summer months when drought conditions are more likely to develop and demand for desalinated water is likely to be highest This may limit the flexibility of the plant to time its electricity consumption to avoid high-priced hours
14 Public Utility Commission of Texas ldquoTransmission and Distribution Rates for Investor Owned Utilitiesrdquo Available at httpwwwpuctexasgovindustryelectricratestdraspx 15 Potomac Economics June 2016 2015 State of the Market Report for the ERCOT Wholesale Electricity Markets Available at httpswwwpotomaceconomicscomindexphpmarkets_monitoredERCOT 16 Sisyan LLC ldquoDemand Response Desalinationrdquo Available at httprenewabledesalinationcomwpshycontentuploads201506Demand-Response-Desalinationpdf
copy 2016 ERCOT All rights reserved 10
Study on the Demand Response Potential for Seawater Desalination Projects ERCOT Public
In addition the plantrsquos ability to participate in demand response would also be limited for those hours it is reducing load as part of 4CP response or in response to real-time prices because the plant would not be able to reduce its electricity consumption if that demand is already committed to another demand response service Thus participating in demand response versus taking advantage of these other opportunities may be to some extent mutually exclusive
5 Conclusion
Based on this analysis it appears that the operational characteristics of seawater desalination plants would allow them to participate in demand response opportunities in ERCOT so long as the necessary operational requirements are considered in the design specifications of the plant Project developers should consider the necessary requirements early in the plant design Whether the economic benefits of participation would provide a sufficient incentive for them to do so will depend on the costs of accommodating those operational requirements and whether there is the flexibility available to operate the plant as necessary under these programs Though most existing seawater desalination plants do not participate in demand response programs it does appear that participation by these plants is possible and could result in a financial benefit Table 2 compares the different demand response opportunities available to demand-side resources in ERCOT
Table 2 Comparison of Demand Response Opportunities Demand Response
Opportunity Requirements for
Participation Impacts to Plant
Operations Financial Benefit Ancillary Services ndash Responsive Reserve Service (RRS)
bull Under-Frequency Relay bull Instantaneous or 10 minute
response time bull Recover load within 3
hours bull Bid in day-ahead market
bull Deployed once in 2015 for 10 minutes bull Subject to annual
unannounced testing
bull $1087 per MW per hour (based on 2015 prices)
Emergency Response Service (ERS)
bull 10 or 30 minute response time bull Recover load within 10
hours bull Four-month contract term
bull Not deployed in 2015 the most times ever deployed in a single year was twice in 2011 bull Subject to annual
unannounced testing
bull $645 per MW per hour (based on 2015 prices)
Four Coincident bull Interval Data Recorder bull Likely plant will need to bull Avoid ~$48000 per 4CP Peak (4CP) (IDR) meter
bull Ability to predict system-wide peak demand hours during summer months
reduce load multiple times per summer to hit 4CP intervals bull Likely to be able to predict
possible 4CP intervals earlier in day
MW per year (based on 2016 tariffs) if successful in reducing during all four summer months
LSE or DR Provider Contracted Price Response
bull Varies based on contractual arrangements
bull Varies based on contractual arrangements
bull Varies based on contractual arrangements
Self-Directed Price bull Retail contract with bull Varies depending on bull Varies depending on Response exposure to real-time
market prices bull Ability to monitor real-time
prices in ERCOT wholesale market
number and severity of pricing events bull May be able to predict
peak pricing events earlier in day
number and severity of pricing events
copy 2016 ERCOT All rights reserved 11
Study on the Demand Response Potential for Seawater Desalination Projects ERCOT Public
Demand response programs in ERCOT provide opportunities for demand-side resources to defray their electricity costs and provide reliability benefits to the ERCOT electric grid Because the process of seawater desalination is energy intensive participation in demand response could help to reduce electricity costs while posing a relatively low risk to plant operations if demand response participation is factored into plant design
Participation in non-ERCOT-dispatched demand response opportunities such as reducing load during 4CP intervals or in response to real-time electricity prices may also help to reduce electricity costs for seawater desalination plants in Texas As stakeholders in Texas continue to plan for possible future droughts in the region and identify water management strategies consideration of demand response could play a role in mitigating some costs associated with seawater desalination and allow seawater desalination plants to assist with maintaining electric reliability in the region
copy 2016 ERCOT All rights reserved 12
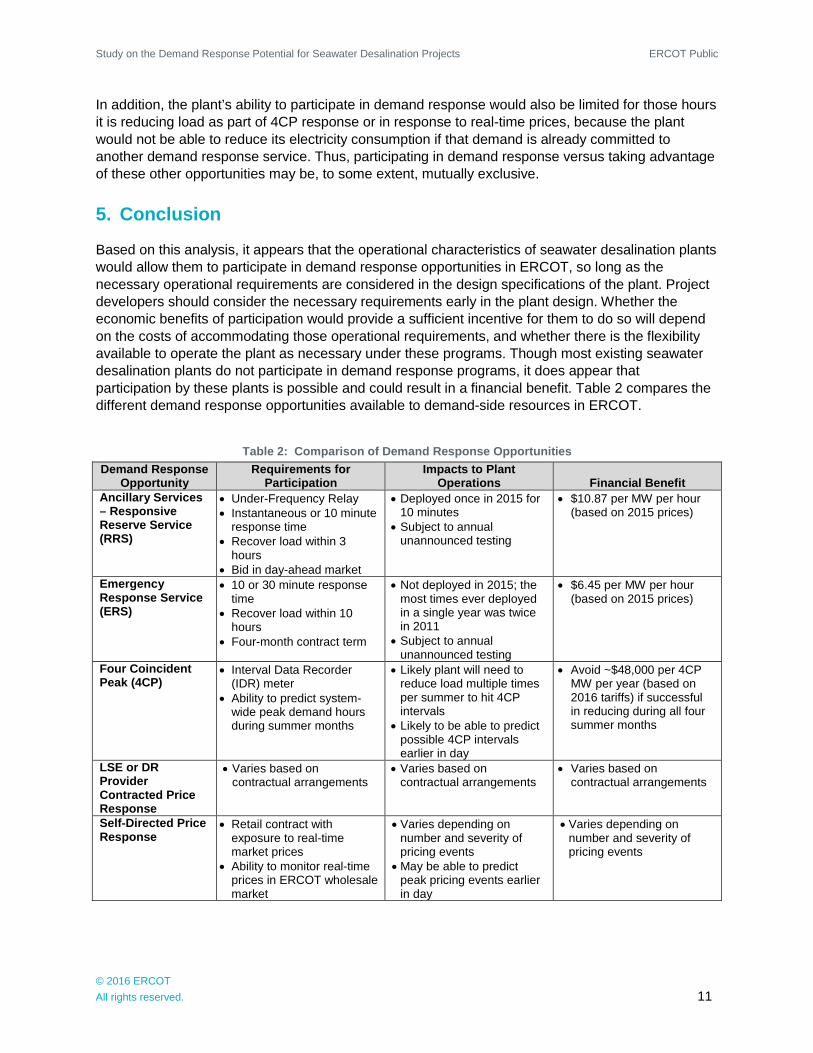
Study on the Demand Response Potential for Seawater Desalination Projects ERCOT Public
In addition the plantrsquos ability to participate in demand response would also be limited for those hours it is reducing load as part of 4CP response or in response to real-time prices because the plant would not be able to reduce its electricity consumption if that demand is already committed to another demand response service Thus participating in demand response versus taking advantage of these other opportunities may be to some extent mutually exclusive
5 Conclusion
Based on this analysis it appears that the operational characteristics of seawater desalination plants would allow them to participate in demand response opportunities in ERCOT so long as the necessary operational requirements are considered in the design specifications of the plant Project developers should consider the necessary requirements early in the plant design Whether the economic benefits of participation would provide a sufficient incentive for them to do so will depend on the costs of accommodating those operational requirements and whether there is the flexibility available to operate the plant as necessary under these programs Though most existing seawater desalination plants do not participate in demand response programs it does appear that participation by these plants is possible and could result in a financial benefit Table 2 compares the different demand response opportunities available to demand-side resources in ERCOT
Table 2 Comparison of Demand Response Opportunities Demand Response
Opportunity Requirements for
Participation Impacts to Plant
Operations Financial Benefit Ancillary Services ndash Responsive Reserve Service (RRS)
bull Under-Frequency Relay bull Instantaneous or 10 minute
response time bull Recover load within 3
hours bull Bid in day-ahead market
bull Deployed once in 2015 for 10 minutes bull Subject to annual
unannounced testing
bull $1087 per MW per hour (based on 2015 prices)
Emergency Response Service (ERS)
bull 10 or 30 minute response time bull Recover load within 10
hours bull Four-month contract term
bull Not deployed in 2015 the most times ever deployed in a single year was twice in 2011 bull Subject to annual
unannounced testing
bull $645 per MW per hour (based on 2015 prices)
Four Coincident bull Interval Data Recorder bull Likely plant will need to bull Avoid ~$48000 per 4CP Peak (4CP) (IDR) meter
bull Ability to predict system-wide peak demand hours during summer months
reduce load multiple times per summer to hit 4CP intervals bull Likely to be able to predict
possible 4CP intervals earlier in day
MW per year (based on 2016 tariffs) if successful in reducing during all four summer months
LSE or DR Provider Contracted Price Response
bull Varies based on contractual arrangements
bull Varies based on contractual arrangements
bull Varies based on contractual arrangements
Self-Directed Price bull Retail contract with bull Varies depending on bull Varies depending on Response exposure to real-time
market prices bull Ability to monitor real-time
prices in ERCOT wholesale market
number and severity of pricing events bull May be able to predict
peak pricing events earlier in day
number and severity of pricing events
copy 2016 ERCOT All rights reserved 11
Study on the Demand Response Potential for Seawater Desalination Projects ERCOT Public
Demand response programs in ERCOT provide opportunities for demand-side resources to defray their electricity costs and provide reliability benefits to the ERCOT electric grid Because the process of seawater desalination is energy intensive participation in demand response could help to reduce electricity costs while posing a relatively low risk to plant operations if demand response participation is factored into plant design
Participation in non-ERCOT-dispatched demand response opportunities such as reducing load during 4CP intervals or in response to real-time electricity prices may also help to reduce electricity costs for seawater desalination plants in Texas As stakeholders in Texas continue to plan for possible future droughts in the region and identify water management strategies consideration of demand response could play a role in mitigating some costs associated with seawater desalination and allow seawater desalination plants to assist with maintaining electric reliability in the region
copy 2016 ERCOT All rights reserved 12