2017 pre-budget tour: the state of the middle class
TRANSCRIPT

PRE-BUDGET
TOUR: THE STATE OF
THE MIDDLE CLASS
Growing and helping the middle class
• Our government is committed to grow the economy
and the middle class.
• Canada’s middle class is facing real challenges and
feeling the effects of a technological and global
economic change.
• Our government’s measures will spur growth and
deliver tangible results to meet the needs and
expectations of middle class Canadians.
2

Why is the middle class important?
Middle Class
Growth Trust Investments/ Human and Physical Capital
Expectations / Mobility
3

Drivers of growth
y = f(A,K,L)
Innovation (A) Private and Public Capital (K) Labour/Human Capital (L)
4

5

Inflation-adjusted wages have stagnated
since the 1970s, particularly for men…
Annual Median Gross Wage Income of Canadians,
1976-2016 (2016 constant dollars)
$30,000
$35,000
$40,000
$45,000
$50,000
$55,000
$60,000
1976 1981 1986 1991 1996 2001 2006 2011 2016
$ 2016
Median wage income of men
Median wage income
Median wage income of women
6
Note: Figure are for full-year, full-time workers (persons who usually worked 30 hours per week at their main job). For the years 1976 to 2011, data was
sourced from the Survey of Consumer Finances and Survey of Labour and Income Dynamics. For the years 2012 to 2014, data was sourced from the
Canadian Income Survey. Figures for 2015-2016 were imputed by applying growth experienced over the 2015-2016 period in weekly wage income of full-time
workers, sourced from the labour force survey and converted to real dollars using the Consumer Price Index.
Source: Statistics Canada; Department of Finance Calculations.

1.0
1.7
2.5
3.0
0.0
0.5
1.0
1.5
2.0
2.5
3.0
3.5
Bottom 90 per cent Top 1 per cent Top 0.1 per cent Top 0.01 per cent
…and income growth has been
concentrated at top income levels…
Notes: Based year for growth rates is 1982. Growth for top 1, 0.1, and 0.01 per cent is based on individual real after tax after transfer income of Canadians tax files from
the Longitudinal Administrative Databank. Growth for the bottom 90 per cent is based on real after-tax, after-transfer household income (adjusted for family size) from a
combination of the Survey of Consumer Finance, the Survey of Labour and Income Dynamics and the Canadian Income Survey data. After-tax, after-transfer income is
the sum of all income from market and government sources, minus income tax. Source: Statistics Canada; Department of Finance calculations.
Average Annual Growth in Inflation-Adjusted Family Income, 1982-2014
Per cent
7
3,5
3,0
2,5
2,0
1,5
1,0
0,5
0,0

… not only in Canada but in many
other countries.
Top 1% before tax and transfer income shares, Canada and selected countries
*2014 or most recent year available.
Sources: The Top Incomes Database for U.S., U.K., Sweden. The Canadian series uses taxation data from Statistics Canada's Longitudinal Administrative Databank.
8
U.S. U.K. Canada Sweden
1982 10.3 6.9 7.6 4.1
2014* 22.0 12.7 11.6 8.7

Many Canadians feel the next generation's
standard of living will be lower
Perception on Future Standard of Living
Source: Nanos Research, February 12, 2016
9

Certain groups remain particularly vulnerable
to poverty, and are remaining in poverty longer
30.2
23.7 22.5
20.7 20.3
8.8
0
5
10
15
20
25
30
35
Unattachedpeople 45-
64
Singleparents
People withdisabilities*
Indigenouspeople off-
reserve
Recentimmigrants
All people
Low Income Rate for Selected Sub-Groups (2014 or most recent year available)
Per cent
Persistence of Low Income for
Vulnerable Groups, 2005-2010 (in low income for at least 3 out of 6 years)
5.9
9.9
15.8 16.2 17.3
24.2
0
5
10
15
20
25
30
35
All peopleIndigenouspeople off-
reserve
Singleparents
People withdisabilities
Recentimmigrants
Unattachedpeople 45-
64
*From 2012 Canadian Survey on Disability
**Sources: From the backgrounder on the Poverty Reduction Strategy; Statistics Canada, Canadian Income Survey, Survey of Labour and Income Dynamics.
Based on available indicators (employment,
income, education) the situation is worse for
Indigenous peoples on-reserve.**
Per cent
10

Costs for essentials are increasing
faster than inflation
0
10
20
30
40
50
60
70
80
All Items Shelter costs Child Care Services Tuition Fees
Nominal Price Growth for all products and Key Household Costs, 2000-2015
Per cent
Notes: Shelter costs are a weighted average of rent, mortgage, insurance, property taxes, water, fuel and electricity costs.
Source: Statistics Canada, Consumer Price Index.
32.7
39.9
50.1
75.6
11
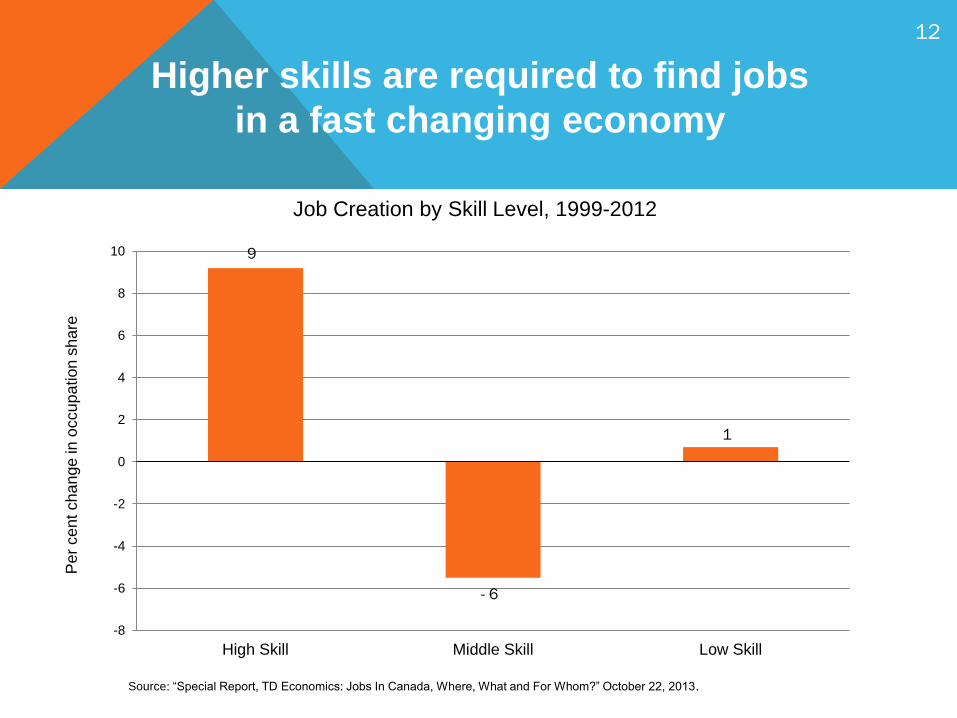
Higher skills are required to find jobs
in a fast changing economy
-8
-6
-4
-2
0
2
4
6
8
10
High Skill Middle Skill Low Skill
Pe
r ce
nt ch
an
ge
in o
ccu
pa
tion
sh
are
Job Creation by Skill Level, 1999-2012
Source: “Special Report, TD Economics: Jobs In Canada, Where, What and For Whom?” October 22, 2013.
9
1
- 6
12

Canadians are increasingly feeling
left out of the middle class
0
10
20
30
40
50
60
70
2009 2016
Working class or poor Middle-Class
Source: EKOS Research Associates, June 2016 and April 2009
Share of Canadians that self identify as middle class, working class or poor.
Per cent
Middle class
28.9
63.3
44.3
48
13

What do these challenges
mean for Canadians?
Growth: “Just not getting ahead.”
• It is harder to benefit from opportunities that growth is creating
(i.e., growth has not been inclusive).
• Persistent barriers for some disadvantaged groups mean they may be falling
further behind.
Affordability: “Harder to make ends meet.”
• Cost of necessary goods has outstripped inflation.
• Housing costs/costs of raising a family are increasing.
• Saving for retirement is harder/fewer employers offering defined benefit pensions.
• Greater indebtedness.
Changing nature of work: “Harder to qualify for a job and keep it.”
• Job insecurity is increasing, making it harder to enter and stay in the middle class.
• More education needed to get a good job & tuition costs are rising.
• Innovation in training and upskilling in order to create more jobs.
• Greater risk in investing in human capital.
14

15
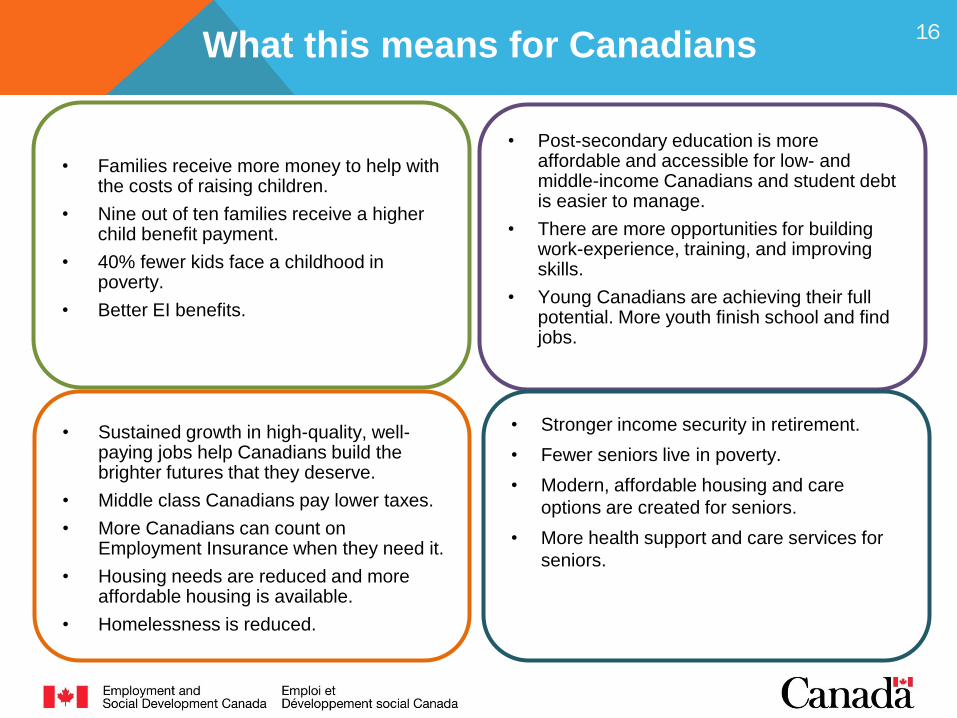
What this means for Canadians
• Families receive more money to help with the costs of raising children.
• Nine out of ten families receive a higher child benefit payment.
• 40% fewer kids face a childhood in poverty.
• Better EI benefits.
• Post-secondary education is more affordable and accessible for low- and middle-income Canadians and student debt is easier to manage.
• There are more opportunities for building work-experience, training, and improving skills.
• Young Canadians are achieving their full potential. More youth finish school and find jobs.
• Sustained growth in high-quality, well-paying jobs help Canadians build the brighter futures that they deserve.
• Middle class Canadians pay lower taxes.
• More Canadians can count on Employment Insurance when they need it.
• Housing needs are reduced and more affordable housing is available.
• Homelessness is reduced.
• Stronger income security in retirement.
• Fewer seniors live in poverty.
• Modern, affordable housing and care
options are created for seniors.
• More health support and care services for
seniors.
16
A vision for helping and
growing the middle class
All Canadians benefit from strong, sustained, and
inclusive economic growth
and everyone has a real and fair chance at economic
opportunity and success.
17