2017 key trends in hydropower · 2017 key trends in hydropower china once again installed more new...
TRANSCRIPT

In 2016, worldwide hydropower development grew steadily, with an estimated 31.5 GW (Figure 1) of new capacity added. This includes 6.4 GW of pumped storage, nearly twice the amount installed in 2015, and brings the world’s total installed hydro capacity to 1,246 GW1 (Figure 2). Total hydro generation for 2016 is estimated at 4,102 TWh2, the greatest ever contribution from a renewable source.
2017 KEY TRENDS IN HYDROPOWER
International Hydropower Association
Chancery House, St Nicholas Way, Sutton, London SM1 1JB, United Kingdom
T: +44 20 8652 5290 F: +44 20 8643 5600 E: [email protected]
hydropower.org
BRIEFING
continued >
1 IHA estimates for newly added and total installed capacity are based on the IHA statistics database and published sources. IHA estimates total installed pumped storage capacity at 150 GW.
2 IHA estimate
Total capacity added in 2016 by region:31.5 GW hydropower capacity (including 6.4 GW pumped storage)
Figure 1: Estimated distribution of new hydropower capacity added by region (pumped storage shown in brackets)
AfricaSouth America
11.7(3.7)
1.8(1.2)
3.4(1.3)
China East Asiaand Paci�c(exl. China)
North America
9.7
2.4
1.3 1.1
South andCentral Asia
GW
12
10
6
8
4
2
0
Europe
This briefing precedes the 2017 Hydropower Status Report, which will be published in May2017, featuring more in-depth analysis of trends and development by region and in key countries.

2017 KEY TRENDS IN HYDROPOWER
China once again installed more new hydropower capacity than any other country in 2016, putting 11.7 GW into operation, including 3.7 GW of pumped storage. This does, however, represent a slowdown in China’s new development, when compared to 19.4 GW new capacity installed in 2015 and 21.9 GW in 2014.
Brazil made significant advances, with inaugurations of major projects such as Jirau contributing to a total of 6.4 GW installed in 2016. Other countries leading in new development include Ecuador (2 GW), Ethiopia (1.5 GW), South Africa (1.3 GW), Vietnam (1.1 GW), Peru (1 GW) and Switzerland (1 GW).
Drivers for hydropower’s growth include a general increase in demand not just for electricity, but also for qualities such as reliable, clean and affordable power as countries seek to meet the carbon reduction goals set out in the Paris Agreement. The increase in pumped storage development signifies growing recognition of hydropower’s role in supporting energy systems, in particular balancing variable renewables such as wind and solar.
Countries that installed the most hydro, including pumped hydro, in 2016
Country Total hydropower capacity added in 2016 (GW)
China 11.7
Brazil 6.4
Ecuador 2.0
Ethiopia 1.5
South Africa 1.3
Vietnam 1.1
Peru 1.0
Switzerland 1.0
Laos 0.7
Malaysia 0.6
Rest of World 4.1
Worldwide distribution of pumped storage capacity (GW) at the end of 2016
Figure 3: Pumped storage hydropower capacity (GW) in operation; 6.2 GW added in 2016.
5
0
15
10
25
20
30
35
ChinaJapan UnitedStates
Germany AustriaItaly India Spain Rest ofWorld
SouthKorea
France
World installed hydropower capacity at the end of 2016: 1,246 GW (including 150 GW pumped storage)
Figure 2: Global total of installed hydropower capacity (GW) by country at the end of 2016, including pumped storage
1,246 GW2016 total
China 331
Brazil 98
United States 102
Canada 79 Russia 48India 52
Norway 32Turkey 26
France 25
Sweden 16
Venezuela 15Viet Nam 16
Austria 13
Italy 22
Switzerland 17
Spain 20
Mexico 12Colombia 12Germany 11Iran 11
Rest of World 246
Japan 50
The International Hydropower Association gathers statistics and monitors deployment and use throughout the year, and has identified the following highlights for hydropower in 2016.
Key trends and noteworthy developments in 2016
• Initiatives are being established to manage the risk profile of hydropower With an ever-increasing focus on ensuring that hydropower projects are built in the right way and in the right place, utilising all its multiple benefits, momentum is building for the establishment of a support facility for hydropower project preparation. Such a facility would optimise private sector engagement by managing a revolving fund to support the selection of the most appropriate project type and location according to the local context. By incorporating international
good practice in developing project blueprints, this could help ensure projects are built to the highest environmental standards and are compatible with the goals of the Paris Agreement. This would allow developers access to the growing green bond market, which nearly doubled in value in 2016, reaching a record USD 81 billion in issuances. In June 2016, the Climate Bonds Initiative launched a working group to develop criteria for the screening of climate-compatible hydropower, expected later this year.
• Renewables are working together to support grid stability Innovative projects coupling renewables technologies are providing firm, stable power to the grid, while also increasing individual efficiencies and creating net benefits. Floating photovoltaics on hydropower reservoirs are under construction in all regions. Taking advantage of existing electrical infrastructure, “floatovoltaics” also have
hydropower.org
2017 KEY TRENDS IN HYDROPOWER
increased efficiencies due to greater cooling. Also, floating PV panels on hydropower reservoirs could help reduce water losses due to evaporation. Pilot projects began in Brazil and Portugal, while India announced plans for 600 MW project on the Koyna reservoir. The USA began operations at the world’s first geothermal-hydropower hybrid project, where a hydropower turbine was added to the injection well, resulting in reduced operational costs and well safety.
• The role of pumped storage is serving global energy storage requirements Remaining the only form of electricity storage available on a large scale and at a competitive cost, pumped storage systems are continuing to grow, adding over 6 GW in 2016. Pumped-storage technologies are also evolving with our changing energy systems. An innovative wind-hydropower hybrid pumped storage system began construction at the German Naturspeicher project. Vessels at the base of the wind turbines themselves act as upper reservoirs of a pumped-storage system. Wind turbine heights are increased, harnessing stronger winds, and the pumped-storage technology regulates frequency variations from fluctuations in wind. Meanwhile, pumped-storage projects are being developed for small-grid systems in Hawaii and on the island of Gran Canaria.
• Ultra-high voltage transmission is connecting hydropower to markets The concept of ‘global energy interconnection’ has emerged as one the latest trends towards the development of major interconnections, regionally and on an inter-continental scale to enable the massive growth in renewable energy technologies to meet global energy demand. Discussions are already under way among major energy companies in China, Japan, Russia and South Korea around the creation of an ‘Asian Super Grid’, in which an ultra-high voltage grid would link electric grids across regions,
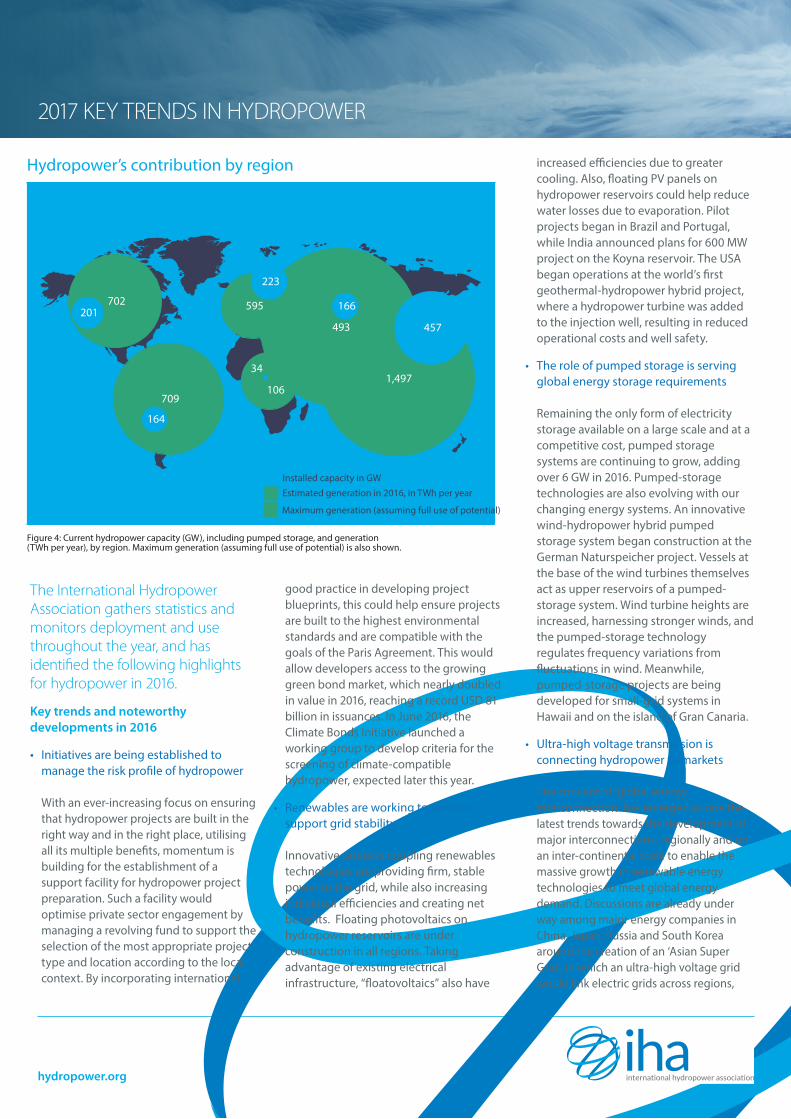
Hydropower’s contribution by region
Figure 4: Current hydropower capacity (GW), including pumped storage, and generation (TWh per year), by region. Maximum generation (assuming full use of potential) is also shown.
Installed capacity in GW
Estimated generation in 2016, in TWh per year
Maximum generation (assuming full use of potential)
164
1,497
457493
166
106
34
595
223
709
201702

hydropower.org
2017 KEY TRENDS IN HYDROPOWER
countries and continents to transmit electricity generated from regions with an abundance of clean, renewable sources like hydropower. In other parts of the world, such as in Canada, the predominantly hydro-based systems are increasing their already strong interconnections with the neighbouring grids of the US mid-west. Utilities like Manitoba Hydro can utilise their hydropower reservoirs to balance the output of major windfarm developments to the south, while enabling bilateral trade opportunities for export and providing import capability for reliability in low water conditions.
• New priorities are emerging on smart modernisation and digitisation of assets Asset management is becoming increasingly challenging across the sector as a growing number of hydropower assets are reaching the end of their expected life. By 2050, it is estimated that roughly half of the entire fleet of existing hydropower equipment will require modernisation. The digitisation of hydropower plants, control systems and surrounding networks is an emerging industry trend that promises to optimise asset management and performance. For example, the digitisation of hydropower systems is increasingly being implemented to allow hydro to work together with other renewable resources to provide increased flexibility and enhanced control for ancillary services (frequency control, balancing services, etc). Other digital innovations include cybersecurity, plant and fleet optimisation, outage management, condition monitoring equipment and energy forecasting. Together, these innovations are providing hydropower asset owners with actionable insights from data to increase the value of hydropower assets.
• Reporting mechanisms for hydropower’s carbon footprint are advancing An international research initiative has developed a framework for calculating the net greenhouse gas (GHG) emissions of freshwater reservoirs. To accurately estimate hydropower’s carbon footprint, pre-impoundment emissions specific to each reservoir will now be considered, as well as the multiple services provided by the reservoir. As hydropower investors and lenders are currently seeking to further refine guidelines on eligibility criteria for hydropower, there is a significant risk that it may be excluded from some mechanisms due to the perceived GHG emissions from reservoirs. The new conceptual approach has led to the development of the G-res tool which will provide estimates of net GHG emissions from planned and existing reservoirs, contributing a much more consistent estimate of hydropower’s GHG footprint, while establishing hydropower projects on a level playing field with other renewable energy resources for access to premium markets and green investments.
• Tools for reporting on sustainability performance are diversifying The Hydropower Sustainability Assessment Protocol has become broadly recognised as the primary tool for evaluating sustainability performance, having been implemented worldwide. The range in the tool’s application has grown, from full assessments through to guided internal assessments that are playing a strong role in building internal capacity. New initiatives such as green and climate bonds are increasingly recognising the protocol. For example, the Barclays MSCI Green Bond Index lists a published protocol assessment meeting ‘basic good practice’ in its eligibility criteria, while the Climate Bonds Initiative is working with a multi-stakeholder group as it develops its own eligibility criteria.
This evolution in protocol use has pointed to the need to develop further complementary derivatives to enable practical application while protecting the strong quality control elements of the tool. Two priorities for its evolution are an environmental and social derivative focusing on fundamental sustainability topics, and international industry good practice guidelines.
• Financing institutions are placing greater emphasis on climate resilience Climate change may both positively and negatively impact the hydropower sector in the future. Financing institutions seek to address climate-related risk by ensuring projects are planned and operated to be resilient to climate change. Resilience and adaptation measures must be communicated clearly and simply to investors. The World Bank has launched a new study to develop guidelines for designing resilient projects, where possible enabling them to take advantage of opportunities arising from climate change. These would ensure projects are safe and reliable and can provide adaptation services to incentivise policy and investment. The World Bank recently convened sector experts to outline a vision for these guidelines, where it was agreed they should cover practical risk assessment and mitigation. They must also be viable for, and recognised by, investors and multilateral organisations. One of the Climate Bonds Initiative’s eligibility criteria for financing hydropower projects now requires measurable evidence of climate resilience. Guidelines are set to become increasingly important in the sector.
This briefing was published in March 2017. If you would like to find out more about our hydropower statistics, please get in touch at [email protected].