2017 global mobile consumer survey - deloitte us · pdf file2017 global mobile consumer...
TRANSCRIPT
2017 Global Mobile Consumer Survey: US editionThe dawn of the next era in mobile
2017 Global Mobile Consumer Survey: US edition | The dawn of the next era in mobile
b
Contents
Device addiction shifts to device etiquette 2
Older generations mirror the younger 4
Wireless is everywhere 6
Choosing a network: Down to the core of wireless 9
Connecting the dots on IoT 11
The second coming of the second-hand smartphone 13
Summary: The momentum continues 14
2017 Global Mobile Consumer Survey: US edition | The dawn of the next era in mobile
1
Though adoption was initially driven by the youngergenerations, the use of mobile is not restricted to theyoung—there’s a new demographic that’s leading thecharge now. Consumers age 55 and older in the UnitedStates now are among the leading adopters and driversof many devices and services. For example, consumersin this age group have a three-year smartphonecompound annual growth rate (CAGR) of nearly eight percent compared to roughly two percent for 18- to 34-year-olds.
This is just one of the findings of Deloitte’s 2017 Global Mobile Consumer Survey, which has now been fielded for seven consecutive years. For the first time, however, we are seeing the use of smartphone apps and functionsbeginning to mature—across all age groups—after aboom generation of constant growth.
Deloitte’s Global Mobile Consumer Survey isgrounded in a study of 2,000 US-based consumers, ages18 to 75. This year’s survey marks the seventh consecutive year that Deloitte’s global Telecom practice has assessed and analyzed consumer attitudes about mobile technology. It confirms again the continued vibrancy of the mobile sector.
Most of us can’t imagine life without a smartphone since mobile makes the mundane exciting. Meeting with friends, phoning grandma, organizing a lunch, or checking a statistic a few minutes before a business meeting—how did we ever live without them?
2017 Global Mobile Consumer Survey: US edition | The dawn of the next era in mobile
22
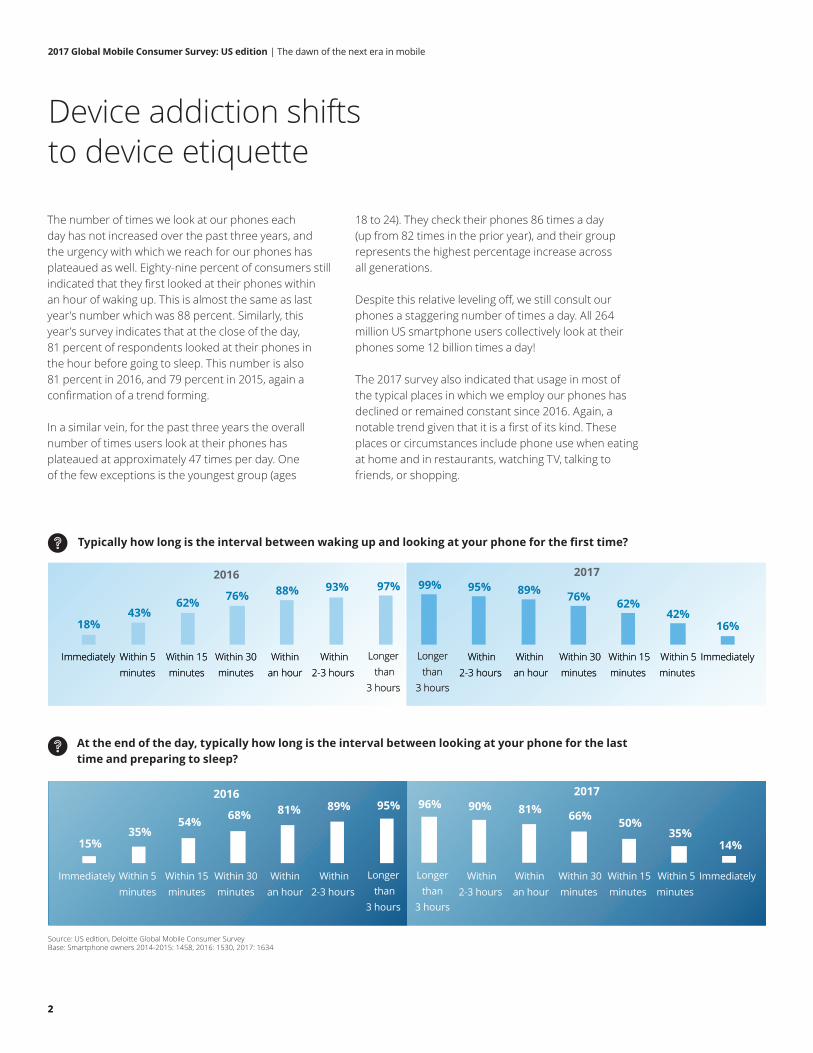
The number of times we look at our phones eachday has not increased over the past three years, andthe urgency with which we reach for our phones hasplateaued as well. Eighty-nine percent of consumers stillindicated that they first looked at their phones withinan hour of waking up. This is almost the same as lastyear’s number which was 88 percent. Similarly, this year’s survey indicates that at the close of the day, 81 percent of respondents looked at their phones in the hour before going to sleep. This number is also 81 percent in 2016, and 79 percent in 2015, again a confirmation of a trend forming.
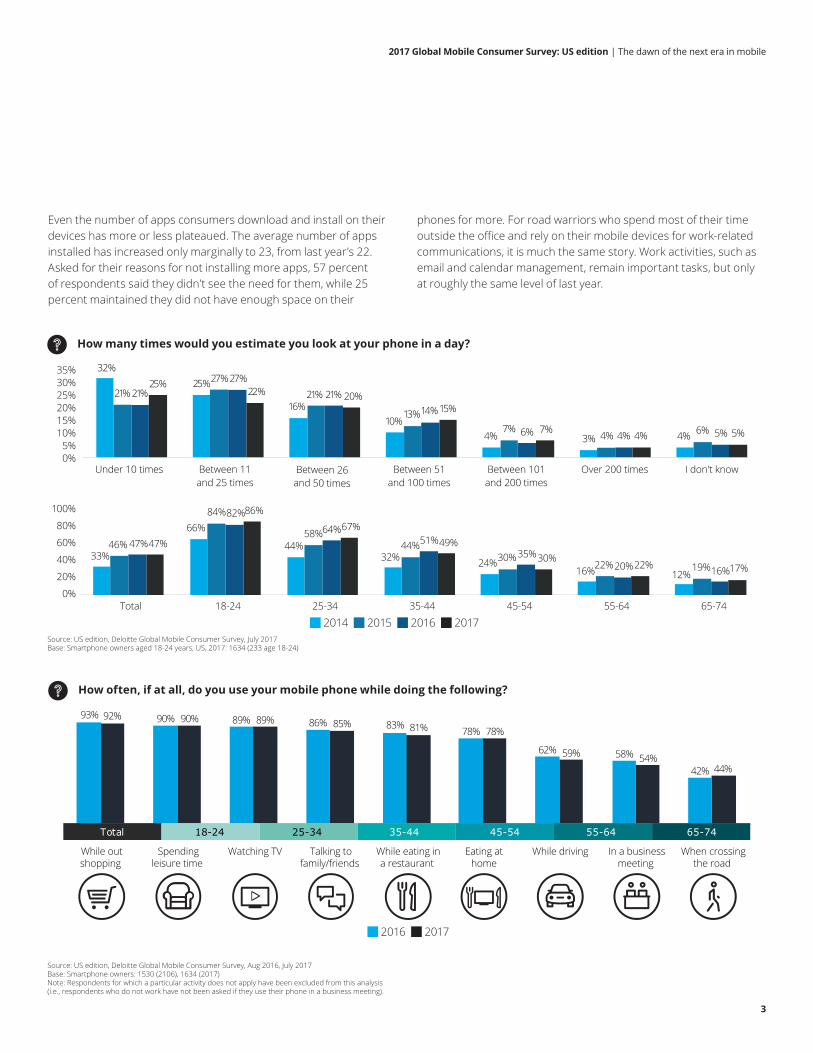
In a similar vein, for the past three years the overallnumber of times users look at their phones hasplateaued at approximately 47 times per day. One of the few exceptions is the youngest group (ages
18 to 24). They check their phones 86 times a day (up from 82 times in the prior year), and their group represents the highest percentage increase across all generations.
Despite this relative leveling off, we still consult ourphones a staggering number of times a day. All 264million US smartphone users collectively look at theirphones some 12 billion times a day!
The 2017 survey also indicated that usage in most ofthe typical places in which we employ our phones hasdeclined or remained constant since 2016. Again, anotable trend given that it is a first of its kind. Theseplaces or circumstances include phone use when eatingat home and in restaurants, watching TV, talking tofriends, or shopping.
Device addiction shifts to device etiquette
Source: US edition, Deloitte Global Mobile Consumer SurveyBase: Smartphone owners 2014-2015: 1458, 2016: 1530, 2017: 1634
Typically how long is the interval between waking up and looking at your phone for the first time?
At the end of the day, typically how long is the interval between looking at your phone for the last time and preparing to sleep?
Immediately Within 5minutes
Within 5minutes
Within 15minutes
Within 15minutes
Within 30minutes
Within 30minutes
Withinan hour
Within an hour
Within2-3 hours
Within2-3 hours
ImmediatelyLonger than
3 hours
Longer than
3 hours
2016
18%43%
62% 76% 88% 93% 97% 99% 95% 89% 76% 62%42%
16%
2017
Immediately Within 5minutes
Within 5minutes
Within 15minutes
Within 15minutes
Within 30minutes
Within 30minutes
Withinan hour
Within an hour
Within2-3 hours
Within2-3 hours
ImmediatelyLonger than
3 hours
Longer than
3 hours
2016
15%35%
54% 68% 81% 89% 95% 96% 90% 81% 66% 50%35%
14%
2017
Immediately Within 5minutes
Within 5minutes
Within 15minutes
Within 15minutes
Within 30minutes
Within 30minutes
Withinan hour
Within an hour
Within2-3 hours
Within2-3 hours
ImmediatelyLonger than
3 hours
Longer than
3 hours
2017 Global Mobile Consumer Survey: US edition | The dawn of the next era in mobile
3
Even the number of apps consumers download and install on theirdevices has more or less plateaued. The average number of appsinstalled has increased only marginally to 23, from last year’s 22.Asked for their reasons for not installing more apps, 57 percentof respondents said they didn’t see the need for them, while 25percent maintained they did not have enough space on their
phones for more. For road warriors who spend most of their timeoutside the office and rely on their mobile devices for work-relatedcommunications, it is much the same story. Work activities, such asemail and calendar management, remain important tasks, but onlyat roughly the same level of last year.
How many times would you estimate you look at your phone in a day?
How often, if at all, do you use your mobile phone while doing the following?
92% 90% 89% 85% 81% 78%
59% 54%44%
93% 90% 89% 86% 83% 78%
62% 58%
42%
While outshopping
Spendingleisure time
Watching TV Talking tofamily/friends
While eating ina restaurant
While driving In a businessmeeting
When crossingthe road
Eating at home
Total 18-24 25-34 35-44 45-54 55-64 65-74
Source: US edition, Deloitte Global Mobile Consumer Survey, Aug 2016, July 2017Base: Smartphone owners: 1530 (2106), 1634 (2017)Note: Respondents for which a particular activity does not apply have been excluded from this analysis (i.e., respondents who do not work have not been asked if they use their phone in a business meeting).
Source: US edition, Deloitte Global Mobile Consumer Survey, July 2017Base: Smartphone owners aged 18-24 years, US, 2017: 1634 (233 age 18-24)
2014 2015 2016 2017
2016 2017
32%
21% 21%25% 25%27%27%
22%16%
21% 21% 20%
10%13%14%15%
4%7% 6% 7%
3% 4% 4% 4% 4% 5% 5%6%
Under 10 times
Total 18-24 25-34 35-44 45-54 55-64 65-74
0%
35%30%
20%25%
10%15%
5%
Between 11 and 25 times
Between 26 and 50 times
Between 51 and 100 times
Between 101 and 200 times
Over 200 times I don't know
33%
66%
44%32% 24%
16% 12%
46%
84%
58%44%
30%22% 19%
47%
82%64%
51%35%
20% 16%
47%
86%67%
49%30%
22% 17%
0%
20%
40%
60%
80%
100%
2017 Global Mobile Consumer Survey: US edition | The dawn of the next era in mobile
4
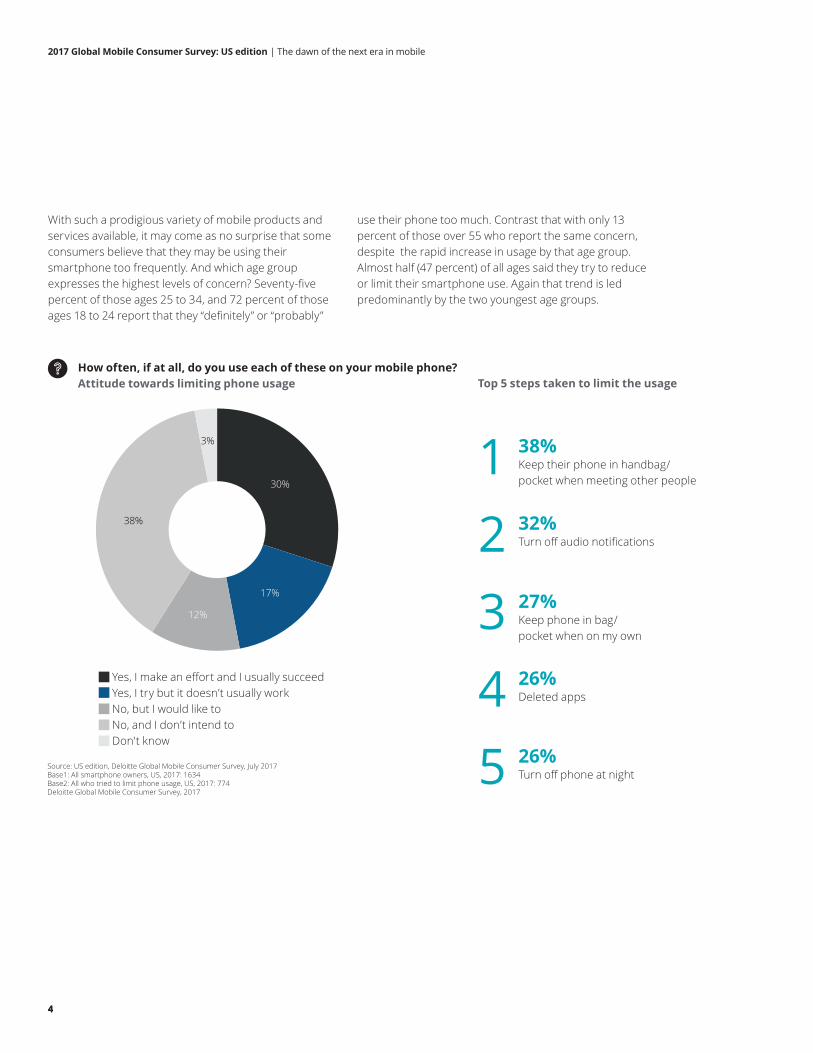
With such a prodigious variety of mobile products andservices available, it may come as no surprise that someconsumers believe that they may be using their smartphone too frequently. And which age group expresses the highest levels of concern? Seventy-five percent of those ages 25 to 34, and 72 percent of those ages 18 to 24 report that they “definitely” or “probably”
use their phone too much. Contrast that with only 13 percent of those over 55 who report the same concern, despite the rapid increase in usage by that age group. Almost half (47 percent) of all ages said they try to reduce or limit their smartphone use. Again that trend is led predominantly by the two youngest age groups.
How often, if at all, do you use each of these on your mobile phone?Attitude towards limiting phone usage Top 5 steps taken to limit the usage
Yes, I make an effort and I usually succeed Yes, I try but it doesn’t usually work No, but I would like to No, and I don’t intend to Don't know
Source: US edition, Deloitte Global Mobile Consumer Survey, July 2017Base1: All smartphone owners, US, 2017: 1634Base2: All who tried to limit phone usage, US, 2017: 774Deloitte Global Mobile Consumer Survey, 2017
38%
3%
30%
17%
12%
38% Keep their phone in handbag/pocket when meeting other people
32% Turn off audio notifications
27% Keep phone in bag/pocket when on my own
26% Deleted apps
26% Turn off phone at night
12345
4
2017 Global Mobile Consumer Survey: US edition | The dawn of the next era in mobile
5
Older generationsmirror the younger
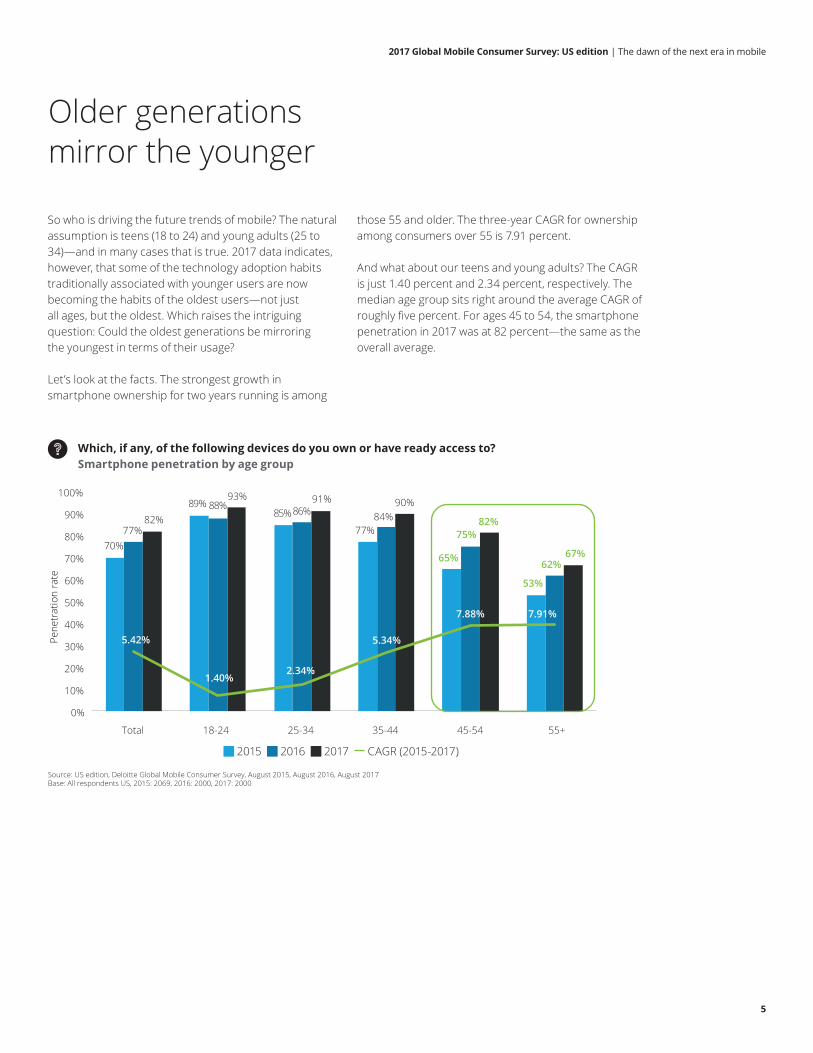
So who is driving the future trends of mobile? The natural assumption is teens (18 to 24) and young adults (25 to 34)—and in many cases that is true. 2017 data indicates, however, that some of the technology adoption habitstraditionally associated with younger users are nowbecoming the habits of the oldest users—not justall ages, but the oldest. Which raises the intriguingquestion: Could the oldest generations be mirroring the youngest in terms of their usage?
Let’s look at the facts. The strongest growth in smartphone ownership for two years running is among
those 55 and older. The three-year CAGR for ownership among consumers over 55 is 7.91 percent.
And what about our teens and young adults? The CAGRis just 1.40 percent and 2.34 percent, respectively. Themedian age group sits right around the average CAGR ofroughly five percent. For ages 45 to 54, the smartphonepenetration in 2017 was at 82 percent—the same as theoverall average.
Which, if any, of the following devices do you own or have ready access to?Smartphone penetration by age group
Source: US edition, Deloitte Global Mobile Consumer Survey, August 2015, August 2016, August 2017Base: All respondents US, 2015: 2069, 2016: 2000, 2017: 2000
Total
0%
10%
20%
30%
40%
70%
5.42%
1.40%2.34%
5.34%
7.88% 7.91%
77%82%
89% 88%93%
85%86%91%
77%84%
90%
65%
75%82%
53%
62%67%
50%
60%
70%
80%
90%
100%
18-24 25-34 35-44 45-54 55+
Pene
trat
ion
rate
2015 2016 2017 CAGR (2015-2017)
2017 Global Mobile Consumer Survey: US edition | The dawn of the next era in mobile
6
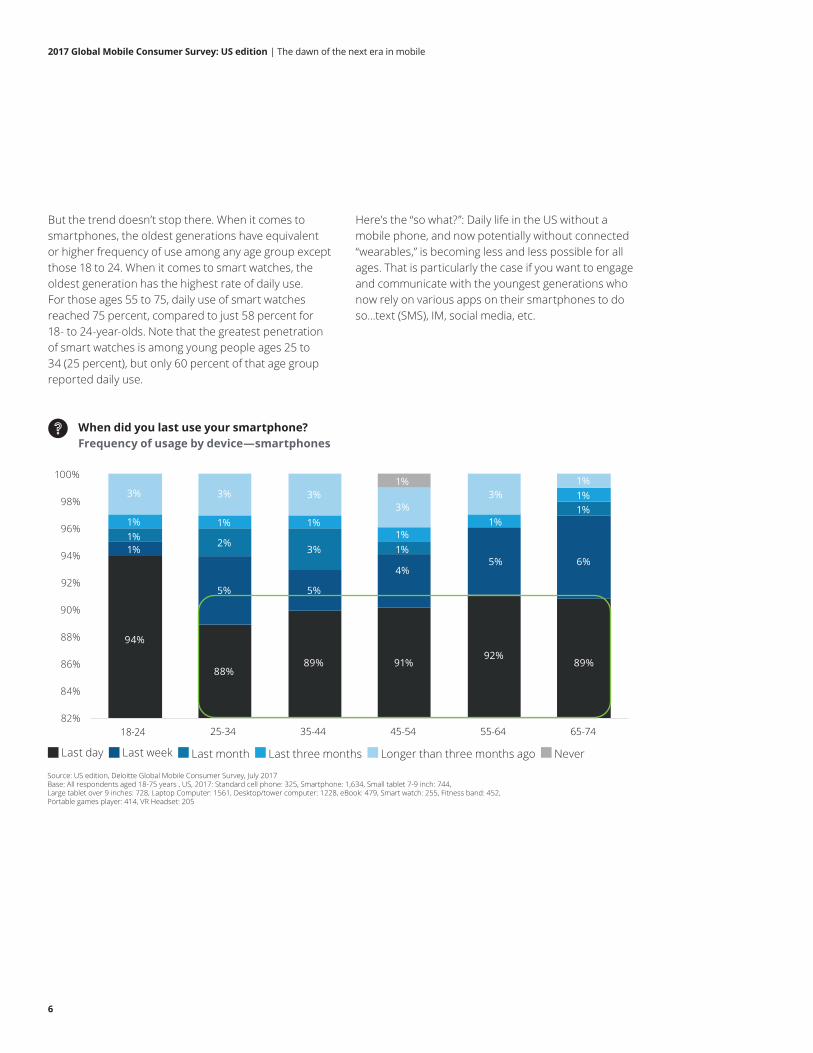
But the trend doesn’t stop there. When it comes tosmartphones, the oldest generations have equivalentor higher frequency of use among any age group exceptthose 18 to 24. When it comes to smart watches, theoldest generation has the highest rate of daily use.For those ages 55 to 75, daily use of smart watchesreached 75 percent, compared to just 58 percent for18- to 24-year-olds. Note that the greatest penetrationof smart watches is among young people ages 25 to34 (25 percent), but only 60 percent of that age groupreported daily use.
Here’s the “so what?”: Daily life in the US without a mobile phone, and now potentially without connected “wearables,” is becoming less and less possible for all ages. That is particularly the case if you want to engage and communicate with the youngest generations who now rely on various apps on their smartphones to do so…text (SMS), IM, social media, etc.
Source: US edition, Deloitte Global Mobile Consumer Survey, July 2017Base: All respondents aged 18-75 years , US, 2017: Standard cell phone: 325, Smartphone: 1,634, Small tablet 7-9 inch: 744, Large tablet over 9 inches: 728, Laptop Computer: 1561, Desktop/tower computer: 1228, eBook: 479, Smart watch: 255, Fitness band: 452, Portable games player: 414, VR Headset: 205
When did you last use your smartphone?Frequency of usage by device—smartphones
82%
84%
86%
88%
90%
92%
94%
96%
98%
100%
94%
1% 1% 1%
1% 1% 1%
3%
2%
5%
88%
1%
3%
3%
5%
5% 6%
89%
4%
89% 91% 92%
1% 1%
1%
3%
1%
1% 3%
3%
18-24 25-34 35-44 45-54 55-64 65-74
Last day Last week Last month Last three months Longer than three months ago Never
2017 Global Mobile Consumer Survey: US edition | The dawn of the next era in mobile
7
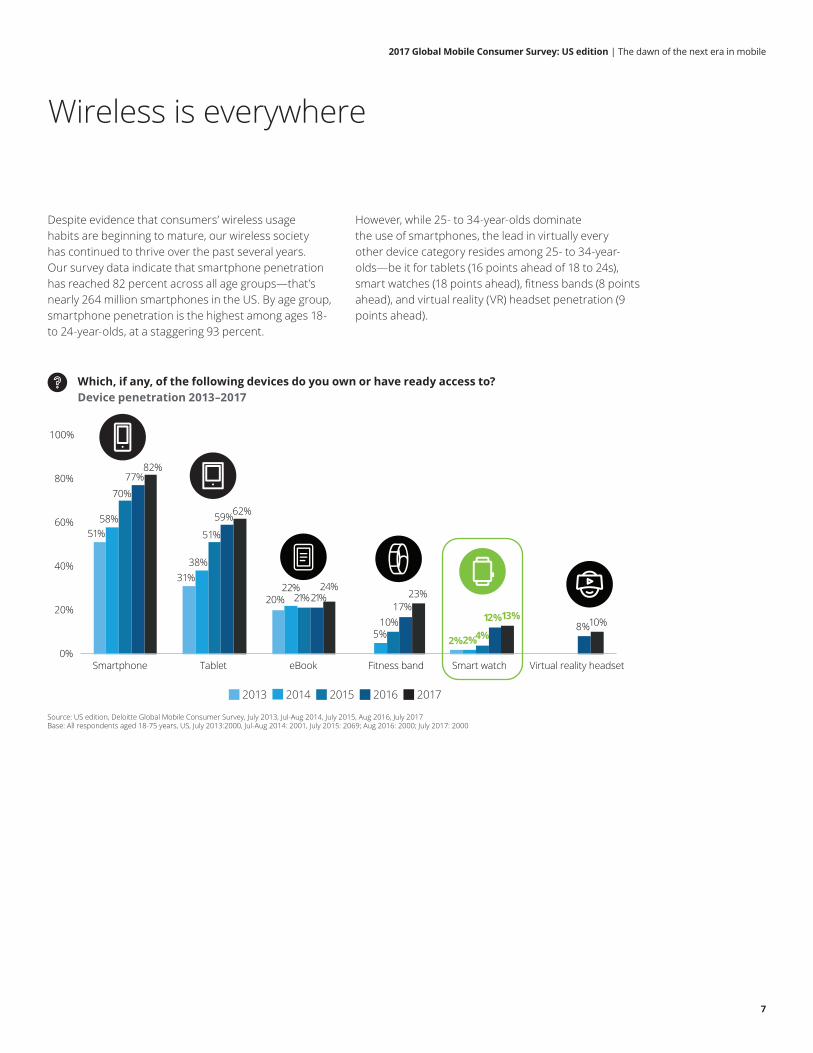
Despite evidence that consumers’ wireless usagehabits are beginning to mature, our wireless societyhas continued to thrive over the past several years.Our survey data indicate that smartphone penetrationhas reached 82 percent across all age groups—that’snearly 264 million smartphones in the US. By age group, smartphone penetration is the highest among ages 18- to 24-year-olds, at a staggering 93 percent.
However, while 25- to 34-year-olds dominatethe use of smartphones, the lead in virtually everyother device category resides among 25- to 34-year-olds—be it for tablets (16 points ahead of 18 to 24s), smart watches (18 points ahead), fitness bands (8 points ahead), and virtual reality (VR) headset penetration (9 points ahead).
Wireless is everywhere
Source: US edition, Deloitte Global Mobile Consumer Survey, July 2013, Jul-Aug 2014, July 2015, Aug 2016, July 2017Base: All respondents aged 18-75 years, US, July 2013:2000, Jul-Aug 2014: 2001, July 2015: 2069; Aug 2016: 2000; July 2017: 2000
Which, if any, of the following devices do you own or have ready access to?Device penetration 2013–2017
51%
31%
20%
2%
58%
38%
22%
5% 2%
70%
51%
10%4%
77%
59%
21%21%17%
12%8%
82%
62%
24%23%
13% 10%
0%
20%
40%
60%
80%
100%
Smartphone Tablet eBook Fitness band Smart watch Virtual reality headset
Device penetration 2013-2017
2013 2014 2015 2016 2017
2017 Global Mobile Consumer Survey: US edition | The dawn of the next era in mobile
8
What about interest in purchasing mobile devices in the coming year?The largest increase, on a percentage-growth basis, is likely to be insmart watches and VR headsets. It’s noteworthy that in 2017 smartwatches experienced a relative lull in penetration growth comparedto 2016. But this could simply be an indication that consumersare awaiting the next generation of smart watches, which will bemore powerful, have longer-lasting batteries, and will be “nativelyconnected” (as opposed to requiring a smartphone to connect).
Although still a niche product—with a reported 10 percent productpenetration—VR headsets enjoy a relatively devoted user group.Nearly half of the respondents who own VR headsets said they hadused the device in the last week, and 15 percent watch VR content ona daily basis.
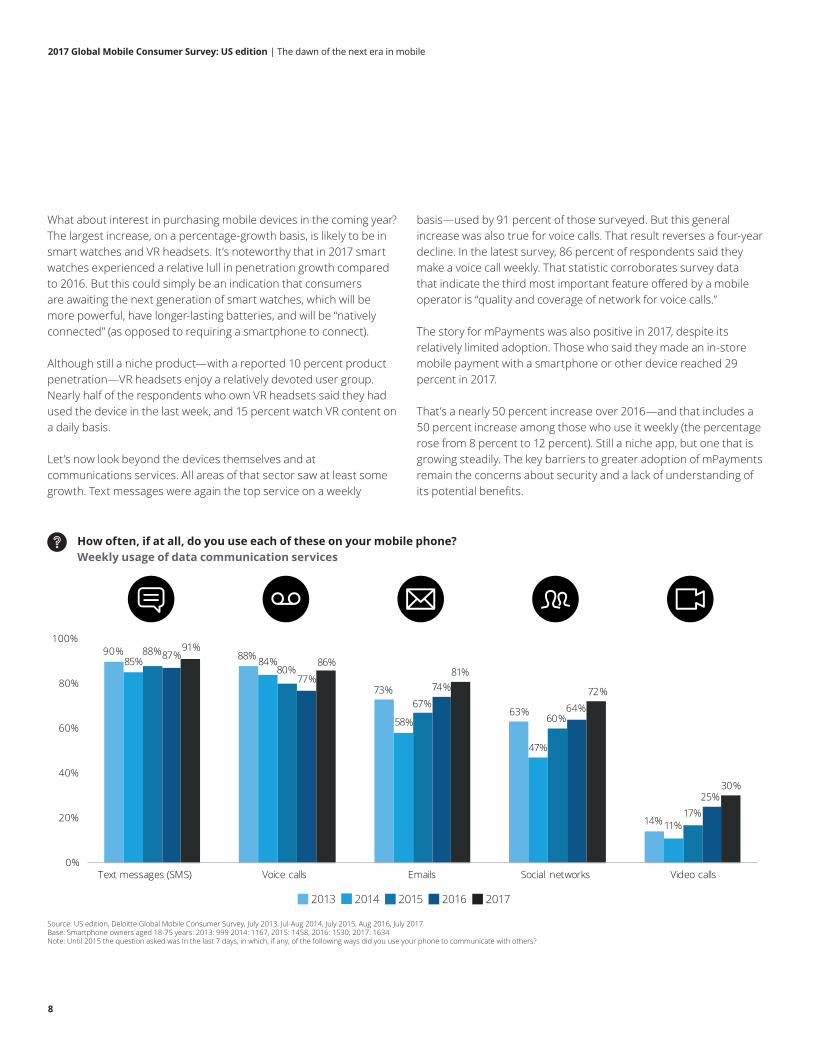
Let’s now look beyond the devices themselves and atcommunications services. All areas of that sector saw at least somegrowth. Text messages were again the top service on a weekly
basis—used by 91 percent of those surveyed. But this generalincrease was also true for voice calls. That result reverses a four-yeardecline. In the latest survey, 86 percent of respondents said theymake a voice call weekly. That statistic corroborates survey datathat indicate the third most important feature offered by a mobileoperator is “quality and coverage of network for voice calls.”
The story for mPayments was also positive in 2017, despite itsrelatively limited adoption. Those who said they made an in-storemobile payment with a smartphone or other device reached 29percent in 2017.
That’s a nearly 50 percent increase over 2016—and that includes a50 percent increase among those who use it weekly (the percentagerose from 8 percent to 12 percent). Still a niche app, but one that isgrowing steadily. The key barriers to greater adoption of mPaymentsremain the concerns about security and a lack of understanding ofits potential benefits.
How often, if at all, do you use each of these on your mobile phone?Weekly usage of data communication services
2013 2014 2015 2016 2017
Source: US edition, Deloitte Global Mobile Consumer Survey, July 2013, Jul-Aug 2014, July 2015, Aug 2016, July 2017Base: Smartphone owners aged 18-75 years: 2013: 999 2014: 1167, 2015: 1458, 2016: 1530; 2017: 1634Note: Until 2015 the question asked was In the last 7 days, in which, if any, of the following ways did you use your phone to communicate with others?
90% 88%
73%
63%
14%
85% 84%
58%
47%
11%
88%
80%
67%60%
17%
87%
77%74%
64%
25%
91%86%
81%
72%
30%
0%
20%
40%
60%
80%
100%
Text messages (SMS) Voice calls Emails Social networks Video calls
2017 Global Mobile Consumer Survey: US edition | The dawn of the next era in mobile
9
Choosing a network: Down to the core of wireless
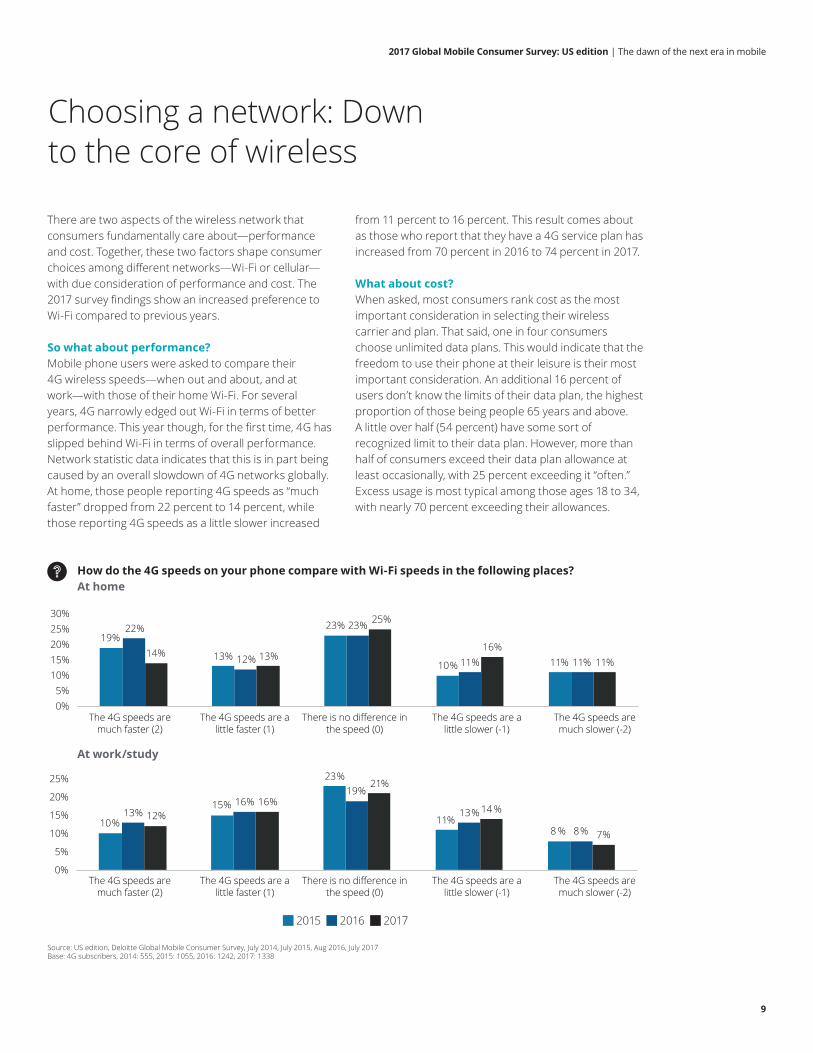
There are two aspects of the wireless network that consumers fundamentally care about—performance and cost. Together, these two factors shape consumer choices among different networks—Wi-Fi or cellular—with due consideration of performance and cost. The 2017 survey findings show an increased preference to Wi-Fi compared to previous years.
So what about performance? Mobile phone users were asked to compare their4G wireless speeds—when out and about, and atwork—with those of their home Wi-Fi. For severalyears, 4G narrowly edged out Wi-Fi in terms of betterperformance. This year though, for the first time, 4G hasslipped behind Wi-Fi in terms of overall performance. Network statistic data indicates that this is in part being caused by an overall slowdown of 4G networks globally.At home, those people reporting 4G speeds as “muchfaster” dropped from 22 percent to 14 percent, whilethose reporting 4G speeds as a little slower increased
from 11 percent to 16 percent. This result comes aboutas those who report that they have a 4G service plan hasincreased from 70 percent in 2016 to 74 percent in 2017.
What about cost? When asked, most consumers rank cost as the mostimportant consideration in selecting their wirelesscarrier and plan. That said, one in four consumerschoose unlimited data plans. This would indicate that thefreedom to use their phone at their leisure is their mostimportant consideration. An additional 16 percent ofusers don’t know the limits of their data plan, the highestproportion of those being people 65 years and above.A little over half (54 percent) have some sort ofrecognized limit to their data plan. However, more thanhalf of consumers exceed their data plan allowance atleast occasionally, with 25 percent exceeding it “often.”Excess usage is most typical among those ages 18 to 34,with nearly 70 percent exceeding their allowances.
How do the 4G speeds on your phone compare with Wi-Fi speeds in the following places?At home
19%
13%
23%
10% 11%
22%
12%
23%
11% 11%14% 13%
25%
16%11%
0%5%
10%15%20%25%30%
10%
15%
23%
11%8 %
13%16%
19%
13%
8%12%
16%
21%
14 %
7%
0%
5%
10%
15%
20%
25%
The 4G speeds are much faster (2)
The 4G speeds are a little faster (1)
The 4G speeds are a little slower (-1)
The 4G speeds are much slower (-2)
There is no difference in the speed (0)
The 4G speeds are much faster (2)
The 4G speeds are a little faster (1)
The 4G speeds are a little slower (-1)
The 4G speeds are much slower (-2)
There is no difference in the speed (0)
At work/study
2015 2016 2017
Source: US edition, Deloitte Global Mobile Consumer Survey, July 2014, July 2015, Aug 2016, July 2017Base: 4G subscribers, 2014: 555, 2015: 1055, 2016: 1242, 2017: 1338
2017 Global Mobile Consumer Survey: US edition | The dawn of the next era in mobile
10
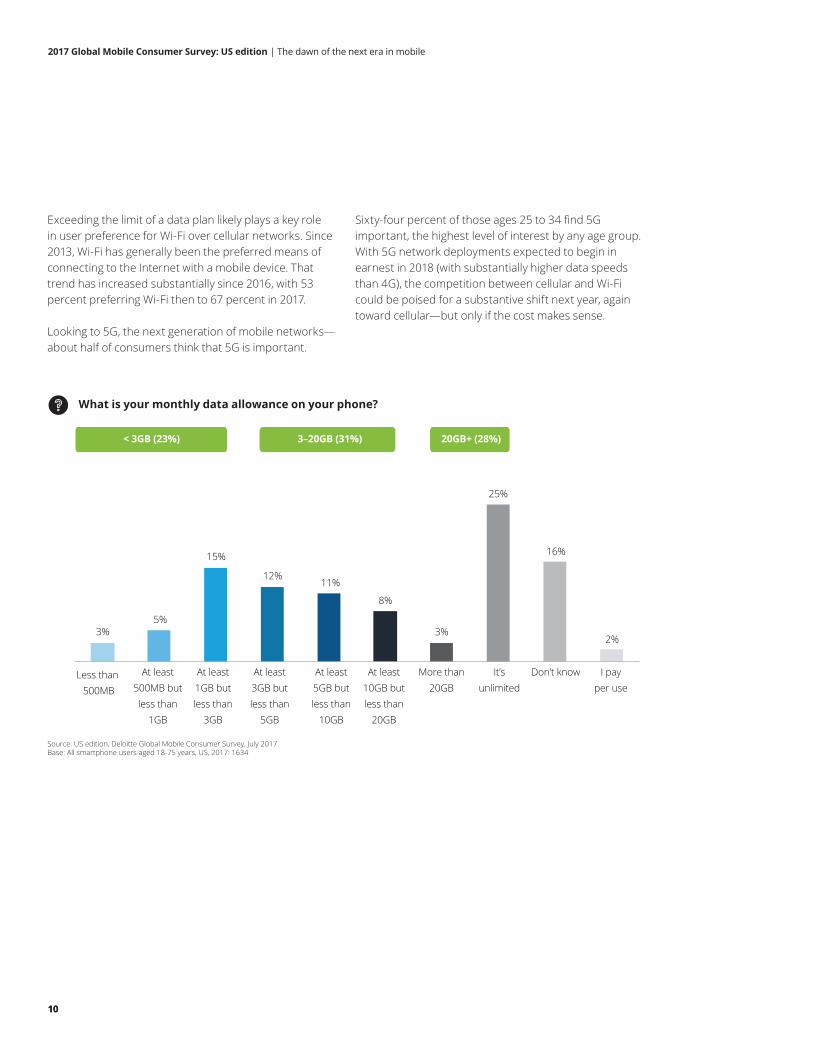
Exceeding the limit of a data plan likely plays a key rolein user preference for Wi-Fi over cellular networks. Since2013, Wi-Fi has generally been the preferred means ofconnecting to the Internet with a mobile device. Thattrend has increased substantially since 2016, with 53percent preferring Wi-Fi then to 67 percent in 2017.
Looking to 5G, the next generation of mobile networks—about half of consumers think that 5G is important.
Sixty-four percent of those ages 25 to 34 find 5Gimportant, the highest level of interest by any age group.With 5G network deployments expected to begin inearnest in 2018 (with substantially higher data speedsthan 4G), the competition between cellular and Wi-Ficould be poised for a substantive shift next year, againtoward cellular—but only if the cost makes sense.
What is your monthly data allowance on your phone?
Source: US edition, Deloitte Global Mobile Consumer Survey, July 2017Base: All smartphone users aged 18-75 years, US, 2017: 1634
Less than 500MB
At least 500MB but less than
1GB
3%5%
15%
12%11%
8%
3%
25%
16%
2%
At least 1GB but less than
3GB
At least 3GB but less than
5GB
At least 5GB but less than
10GB
At least 10GB but less than
20GB
More than 20GB
It’s unlimited
Don’t know I pay per use
< 3GB (23%) 3–20GB (31%) 20GB+ (28%)
10
2017 Global Mobile Consumer Survey: US edition | The dawn of the next era in mobile
11
Connecting the dots on IoT
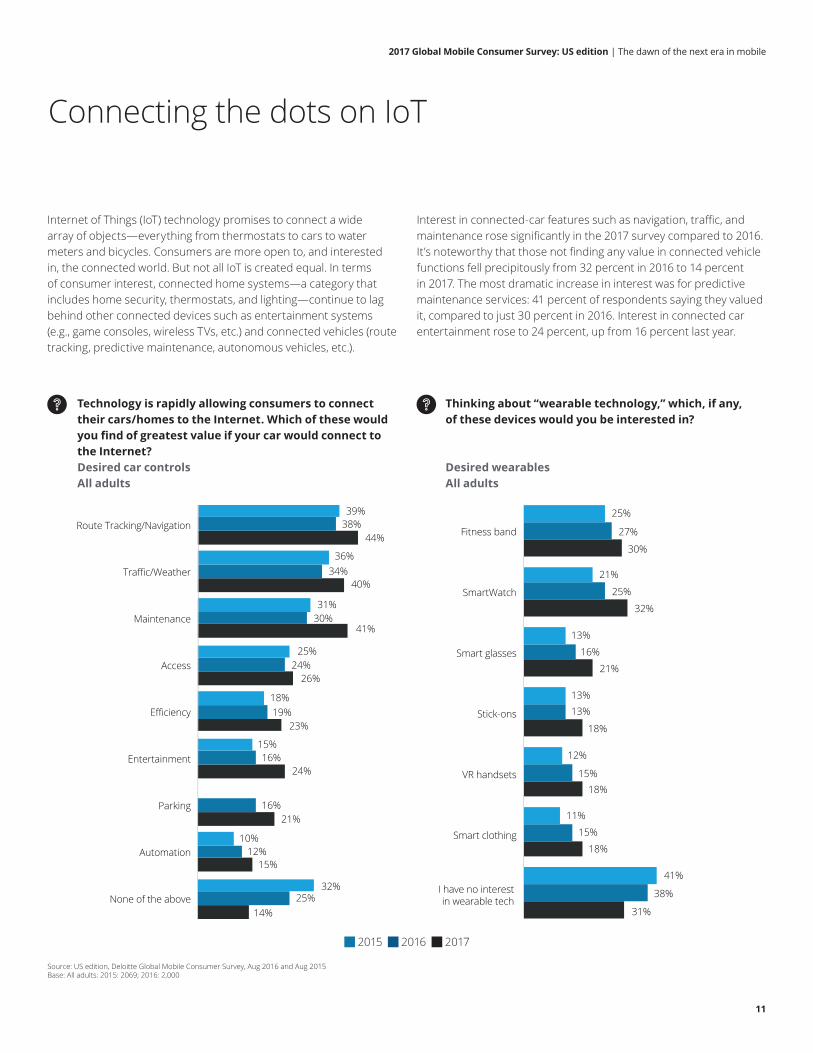
Internet of Things (IoT) technology promises to connect a widearray of objects—everything from thermostats to cars to watermeters and bicycles. Consumers are more open to, and interestedin, the connected world. But not all IoT is created equal. In termsof consumer interest, connected home systems—a category thatincludes home security, thermostats, and lighting—continue to lagbehind other connected devices such as entertainment systems(e.g., game consoles, wireless TVs, etc.) and connected vehicles (routetracking, predictive maintenance, autonomous vehicles, etc.).
Interest in connected-car features such as navigation, traffic, andmaintenance rose significantly in the 2017 survey compared to 2016.It’s noteworthy that those not finding any value in connected vehiclefunctions fell precipitously from 32 percent in 2016 to 14 percentin 2017. The most dramatic increase in interest was for predictivemaintenance services: 41 percent of respondents saying they valuedit, compared to just 30 percent in 2016. Interest in connected car entertainment rose to 24 percent, up from 16 percent last year.
Technology is rapidly allowing consumers to connect their cars/homes to the Internet. Which of these would you find of greatest value if your car would connect to the Internet? Desired car controlsAll adults
Source: US edition, Deloitte Global Mobile Consumer Survey, Aug 2016 and Aug 2015Base: All adults: 2015: 2069; 2016: 2,000
Thinking about “wearable technology,” which, if any, of these devices would you be interested in?
Desired wearablesAll adults
2015 2016 2017
None of the above
Automation
Parking
Entertainment
Efficiency
Access
Maintenance
Traffic/Weather
Route Tracking/Navigation39% 25%
27%
30%
21%
25%
32%
13%
16%
21%
13%13%
18%
12%
15%18%
11%
15%
18%
41%
38%
31%
38%44%
36%34%
40%
31%30%
41%
25%24%
26%
18%19%
23%
15%16%
16%21%
10%12%
15%
32%25%
14%
24%
I have no interest in wearable tech
Smart clothing
VR handsets
Stick-ons
Smart glasses
SmartWatch
Fitness band
2017 Global Mobile Consumer Survey: US edition | The dawn of the next era in mobile
12
Consumers’ willingness to pay for connected car and connectedhome services also rose across the board. But it comes with animportant caveat. The largest increase occurred among those willingto pay less than $10 a month, the lowest price category offered as aresponse in our survey. This finding may indicate that consumers arebeginning to view IoT services more as another utility, one for whichthey want to pay little or nothing at all.
Despite an interest and willingness to pay, as awareness of IoT growsso do concerns about security and privacy. More than 40 percent ofrespondents agree that smart home technology reveals too muchabout their personal lives and nearly 40 percent worry that usagecan be tracked. In addition, less than one in five consumers believethey are very well informed about the security risks associated withconnected home devices; and nearly 40 percent believe they are notproperly informed at all.
Autonomous vehicles are emerging as one of the most intriguinguse-cases of IoT—one in which consumers are increasinglyinterested. The number of consumers who said they would neverconsider owning, or riding in, an autonomous vehicle has droppedsignificantly since 2015. In the 2017 survey, 28 percent said theywould never consider riding in or owning one. That’s down from 38percent in 2015—and an increase of nearly one-third among thosewho are interested. Another significant revelation of the 2017 surveyis the move toward ridesharing. It would appear that the future ofautomobiles lies more with renting and hiring than with owning. For autonomous vehicles, the growth of interest in various ridesharing categories outpaced that of ownership by a factor of two (14 percent growth in ridesharing compared to seven percent growth in ownership).
When it comes to demographics, twice as many men compared towomen express an interest in riding in or owning an autonomousvehicle. Interest also wanes significantly with age. More than half ofpeople over age 65 say they would never consider owning or ridingin such a vehicle. That contrasts with just 13 percent in the agesegment 25 to 34. Moreover, just as it is with IoT, greater awarenesshas also engendered more distrust. Nearly 60 percent of all ages donot trust that autonomous driving technology will prevent accidents.All in all though, autonomous vehicles and other forms of IoT are
winning greater attention and popularity among consumers. Deloitteexpects this trend to continue despite a rise in concerns about therisks and costs associated with the technology.
Machine learning? It’s already a realityArtificial intelligence (AI) and machine learning (ML) are among themore recent cutting-edge industry buzzwords. The 2017 surveyshowed that already 68 percent of consumers are using some formof AI/ML on their smartphones. Highest use categories include:predictive text, voice assistants, and driving route suggestions.Those are in use by one-quarter to one-third of consumers.However, widespread adoption lies in a more distant future forcertain cutting-edge AI/ML services, such as automated calendarentries, location-based app suggestions, etc. Current use issomewhere around 10 percent or lower.
Consumer privacy: A concerned embrace of technologyConsumers continue to express concerns about security andprivacy captured in the data regarding the risks they perceive with IoT, mPayments, and autonomous vehicles. That said, consumers have been more open to signing agreements with mobile app and service providers—91 percent willingly accept legal terms and conditions without reading them before installing apps, registering Wi-Fi hotspots, accepting updates, and signing on to online services such as video streaming. For ages 18 to 34, the rate of acceptance of terms and conditions, without reading them, reaches 97 percent. The language of the vast majority of terms and conditions is understandably too complex for many. Given the absence of a choice, consumers don’t consider these as a barrier to purchasing and accepting many forms of new technology.
It is important to underscore the fact that more than 80 percent ofconsumers believe that companies use their personal data. What’smore, 78 percent believe that their personal data is shared withthird parties. Still, there’s a willingness by consumers to share somepersonal online data, such as their name or email address (by morethan 58 percent). But they are far less willing to share health metricsusing a phone or wearable (just seven percent). Only 13 percent say they never share personal information such as name, email address,phone number, photos, contact list, browsing activity, purchasehistory, and health metrics.
12
2017 Global Mobile Consumer Survey: US edition | The dawn of the next era in mobile
13
Since US carriers put an end to subsidized devices aspart of consumers’ regular monthly plans, there wasa perception by some that the sticker shock of a newsmartphone costing well more than many consumerswere willing to spend would ultimately curb smartphonepurchasing behavior. However, we see from Deloitte’s2017 Global Mobile Consumer Survey data that roughlytwo-thirds of consumers still plan to change theirdevices within two years, which is approximately thesame common upgrade frequency that existed duringthe carrier subsidy-plan phase. This is in responseto carriers’ leasing and purchasing programs thatessentially mimic the previous subsidy plans, as wellas the increasing utility of a smartphone drivingadditional demand. It’s becoming more and moredifficult to live in today’s ultra-connected societywithout a capable smartphone.
Another significant change wesee with regard to second-handsmartphones is that far moreUS consumers are finding more productive ways to utilize their previous phones.
In 2017 those who claimed to “throw their old phoneaway” were only five percent, less than half of the12 percent reported in 2016. It was predominantlyreplaced with those “giving it to a family member or afriend,” which increased from 12 percent to 20 percent,nearly doubling. This demonstrates the increasingunderstanding by mobile consumers that their previoussmartphones can be worth significant money—orvalue—if given within the family.
The second coming of the second-hand smartphone
2017 Global Mobile Consumer Survey: US edition | The dawn of the next era in mobile
14
Deloitte’s 2017 survey indicates that the mobile universewe have all grown to love—and think we understand—is shifting. The habits governing the use of smartphonesand other devices are maturing, as they becomecommonplace in nearly every consumer’s life. Worriesabout security, privacy, and mobile overuse are on therise. But for many this won’t be enough to deter themfrom capitalizing on the potential benefits each of theseconnected services provides. While a certain technologyskepticism may be settling in for some, the promiseof many exciting technologies lies on the horizon,technologies such as artificial intelligence and machinelearning, virtual reality and augmented reality, 5G, andautonomous vehicles to name a few. For all we know, wemay just be on the eve of the next generation of mobileand a new growth spurt.
Still, many questions remain: How will user attitudeschange with such innovations? What will be the role ofcarriers, original equipment manufacturer (OEM), andapp developers in advancing the adoption and rollingout of new products and services? What will they makeof, and will they heed, emerging consumer attitudes?No doubt, the mobile world is evolving, growing morecomplex and for many becoming ever-more attractive.In the years to come, you can be certain that Deloitte’s 2017 Global Mobile Consumer Survey will continue to keep current with the preferences of the mobile consumer.
About the surveyThis Global Mobile Consumer Survey covers six continents, 32 countries, and more than 51,000respondents. The insights in this particular report areextracted and analyzed from data gathered from 2,000survey respondents within the US.
Fielded by an independent research firm, the surveyfocuses on consumer behaviors, trends, and opinionsfor a broad range of wireless and mobility products andservices. In addition to exploring year-over-year resultsand key insights, the survey is also designed to highlightdifferences between consumers across generationaldivides—capturing findings from six distinct age groups,ranging from ages 18 to 75.
Summary: The momentum continues
14
2017 Global Mobile Consumer Survey: US edition | The dawn of the next era in mobile
15
Craig WiggintonVice ChairmanUS Telecommunications LeaderDeloitte & Touche LLP+1 212 436 [email protected]
Mike CurranSenior ManagerDeloitte Services LP+1 404 220 [email protected]
Terrence KarnerManager Deloitte & Touche LLP+1 312 486 [email protected]
Marketing inquiriesAys AytoluSenior ManagerDeloitte Services LP+1 408 704 [email protected]
Press contactAnisha SharmaSenior ManagerDeloitte Services LP+1 212 492 [email protected]
Contacts
To learn more about Deloitte’s 2017 Global Mobile Consumer Survey, please visit: www.deloitte.com/us/mobileconsumer#trendsinmobile

About DeloitteDeloitte refers to one or more of Deloitte Touche Tohmatsu Limited, a UK private company limited by guarantee (“DTTL”), its network of member firms, and their related entities. DTTL and each of its member firms are legally separate and independent entities. DTTL (also referred to as “Deloitte Global”) does not provide services to clients. In the United States, Deloitte refers to one or more of the US member firms of DTTL, their related entities that operate using the “Deloitte” name in the United States and their respective affiliates. Certain services may not be available to attest clients under the rules and regulations of public accounting. Please see www.deloitte.com/about to learn more about our global network of member firms. Copyright © 2017 Deloitte Development LLC. All rights reserved.