2017 full year results for personal use only presentation · omission from this presentation or of...
TRANSCRIPT
PRESENTERS:Michael Alscher, ChairmanPeter Barker, CFO
2017 FULL YEARRESULTS PRESENTATION
August 2017
For
per
sona
l use
onl
y

1 2017 Full Year Results
Disclaimer
This presentation contains certain statements and forecasts provided by or on behalf of Cardno Limited. Any forward‐looking statements reflect various assumptions
by or on behalf of Cardno. Accordingly, these statements are subject to significant business, economic and competitive uncertainties and contingencies associated
with the business of Cardno which may be beyond the control of Cardno which could cause actual results or trends to differ materially, including but not limited to
competition, industry downturns, inability to enforce contractual and other arrangements, legislative and regulatory changes, sovereign and political risks, ability to
meet funding requirements, dependence on key personnel and other market and economic factors. Accordingly, there can be no assurance that any such statements
and forecasts will be realised. Cardno makes no representations as to the accuracy or completeness of any such statement or forecasts or that any forecasts will be
achieved and there can be no assurance that any forecasts are attainable or will be realised.
Additionally, Cardno makes no representation or warranty, express or implied, in relation to, and no responsibility or liability (whether for negligence, under statute or
otherwise) is or will be accepted by Cardno or by any of its directors, shareholders, partners, employees, or advisers (Relevant Parties) as to or in relation to the
accuracy or completeness of the information, statements, opinions or matters (express or implied) arising out of, contained in or derived from this presentation or any
omission from this presentation or of any other written or oral information or opinions provided now or in the future to any interested party or its advisers. In furnishing
this presentation, Cardno undertakes no obligation to provide any additional or updated information whether as a result of new information, future events or results
or otherwise.
Except to the extent prohibited by law, the Relevant Parties disclaim all liability that may otherwise arise due to any of this information being inaccurate or incomplete.
By obtaining this document, the recipient releases the Relevant Parties from liability to the recipient for any loss or damage which any of them may suffer or incur
arising directly or indirectly out of or in connection with any use of or reliance on any of this information, whether such liability arises in contract, tort (including
negligence) or otherwise.
This document does not constitute, and should not be construed as, either an offer to sell or a solicitation of an offer to buy or sell securities. It does not include all
available information and should not be used in isolation as a basis to invest in Cardno.
COVER IMAGE PROJECT: Cardno is proud to have contributed to the success of Parklands, a unique revitalisation project, which will first serve as the athletes’
village, accommodating 6,600 people, for the Gold Coast 2018 Commonwealth Games.
For
per
sona
l use
onl
y
2017 FULL YEAR
RESULTS
PRESENTATION
> Performance overview
> Detailed financial review
> Commentary and outlook
For
per
sona
l use
onl
y

3 2017 Full Year Results
2017 Performance Overview
2017 has been a watershed year. We have completed the organisational restructure, reset our balance sheet, closed down loss
making businesses and sold non core assets. We exit FY17 in a much stronger position than we entered.
NOTABLE ACHIEVEMENTS:
> The business achieved net fee revenue growth of 0.8% to $788.2m.
Although this growth is modest, it represents the first positive
revenue growth since 2015.
> EBITDA growth of 4.8% to $44.0m. In the second half, the business
achieved EBITDA of $20.8m, which was more than 3x the EBITDA
in the second half of FY16.
> Cardno has systematically worked through its balance sheet to
address legacy issues.
> The Australian engineering division has continued to perform
strongly with fully allocated EBITDA margins of 10.9%.
> Backlog grew 5.3% to $846.1m on a like for like basis.
> Cardno expensed business review and restructure costs of
$56.0m in the year. The company does not believe there is
any further restructure or impairment costs to take up of a
material nature.
AREAS FOR CONTINUED FOCUS:
> The America’s is the largest division within Cardno with 36% of net
revenue, achieving a fully allocated EBITDA margin of 1.6% in FY17.
Significant progress has been made in the Americas in FY17 and it
remains a significant opportunity for Cardno over the next three years.
> Cardno’s oil and gas operations continue to be challenged. Over the
past 12 months, this portfolio company has exited its operations in
Nigeria, significantly refocused its workforce onto quality assurance
work and restructured its staff composition to reflect the operating
environment. Although momentum is being rebuilt, this business
remains tied to the oil price and will not materially improve until the oil
price rebounds.
> The South American operations continue to be scaled back
consistent with the roll off of projects and debtor management remains
a key focus.
For
per
sona
l use
onl
y

4 2017 Full Year Results
2017 Performance Overview
The focus has been across all parts of the business.
Strategy and
Structure
> Slimmed down corporate head office to true head office roles and eliminated the regional management layer in the USA and Asia Pacific
> Completed divisional restructure
> Divested software business, O&G related business (Nigeria), a construction and a coal consulting business
> Closed a number of sub economic or loss making offices and businesses
> Completed two synergistic bolt on acquisitions
People and
Leadership
> Implemented consistent employee contracts for senior managers
> Put in place realistic and achievable short term and long term incentive goals
> Improvement in staff engagement and turnover
Positive momentum in employee engagement survey
In the top 200 managers across the company, turnover was less than 5% in past 12 months
> Put in place a global health and safety and human resources policy and governance structure and decentralised all health and safety and human
resources functions into divisions
Transparency and
Governance
> Established consistent reporting and benchmarking across all divisions and geographies
> Recruited a Chief Risk Officer and re-established the Internal Audit function
Financial Stability
and Health
> Reduced leverage to $15.3m, down from $49.6m at 30 June 2016 and $311.3M at June 2015
> Finalised balance sheet review
The focus on stability, transparency and organic growth is starting to deliver across the organisation.
For
per
sona
l use
onl
y

5 2017 Full Year Results
2017 Performance Overview
The organisation has been restructured to focus on divisional decision making units. Each divisional leader reports into the
Group CEO and is empowered to make decisions via a clear delegated operating authority and oversite framework.
Key milestones at a divisional level are:
ASIA PACIFIC
> Removed Australian regional office and established two divisions: North and South
> Established central business development group focused on winning major projects
> Completed small bolt-on acquisition in Perth
AMERICAS
> Removed Americas regional office and established three divisions: Government, Infrastructure, Science and Environment
> Expanded presence in Canada, taking 100% ownership in T2 subsidiary (previously 50/50 joint venture)
> Divested two small consulting businesses, closed loss making drone business
INTERNATIONAL
DEVELOPMENT
> Restructured as a single global division with three units: Asia Pacific, Americas, Europe & Africa
> Increase in business development activities and backlog
CONSTRUCTION
SCIENCES
> Focused on rationalisation of Enterprise Agreements (EAs) and awards to ensure increased workforce flexibility
> Trialing new technologies to increase safety and efficiency
PPI
> Hired additional QA/QC and BD-focused staff to drive organic growth
> Divested Nigeria operations to reflect the challenging conditions in this country. Released personnel in Singapore, Australia and Louisiana offices to
remove a management layer and streamline operations
LATAM
> Consolidated management of Ecuador businesses
> Resized business to reflect current backlog
> Returned business to profitability
XP SOLUTIONS > Sold XP Solutions for US$49m in September 2016
For
per
sona
l use
onl
y

6 2017 Full Year Results
2017 Performance Overview
Based on our previous presentation at the 2016 AGM we have made considerable progress on our simple schematic.
With management,
set the strategy and
values for the company
> Revise strategy as to “what is Cardno” going forward
> Set clear parameters as to growth expectations
(organic plus acquisition)
> Refocus on organic over acquisition led growth
> New STI and LTI plans introduced across the
company with clear financial goals in place
> Bottom up budgets in place
Review performance
and hold management to account
and reward for performance
> Revised structure to enable
effective execution
Ensure the right
organisational structure is in
place to execute on that strategy
> Reset leadership team and make
sure it is capable of execution
Ensure the right
executives are in place to
achieve the goals of the company
> New reporting systems being implemented
which includes new Board and company reporting
including KPI measurement
Put in place appropriate
financial reporting and
measurement tools
For
per
sona
l use
onl
y
2017 FULL YEAR
RESULTS
PRESENTATION
> Performance overview
> Detailed financial review
> Commentary and outlook
For
per
sona
l use
onl
y

8 2017 Full Year Results
2017 Results A$ million (2)
Reported
Percent change year on year
Gross Revenue $1,182.0m 1.5%
Fee Revenue $788.2m 0.8%
EBITDA $44.0m 4.8%
Net Operating Profit after Tax $19.9m(1) 221.0%
Abnormal items $11.4m 94.4%
Net Profit after Tax $8.6m 104.4%
Backlog $846.1m 5.3%
Net Cash Flow from Operations ($3.8)m 106.7%
2017 Full Year Performance Highlights
Full Year underlying EBITDA of $44.0m in line
with market guidance.
> Modest growth in Fee Revenue(2), up 0.8% from FY16
> EBITDA from continuing operations of $44.0m,
consistent with guidance and up 4.8% from $42.0m
EBITDA in FY16
> Net Operating Profit after Tax of $19.9m, up from $6.2m
in FY16. This result excludes $11.4m of abnormal items
(see following slide)
> Backlog remains solid
__________________________
(1) Net Operating Profit after Tax, is a non-IFRS term which reflects the operating position of the business
prior to one off and impairment adjustments. A reconciliation of NPAT to NOPAT has been prepared
and is shown on slide 9.
(2) Underlying results – businesses divested in FY17 are excluded from results for both FY17 and the
FY16 comparative.
For
per
sona
l use
onl
y

9 2017 Full Year Results
2017 Full Year Performance Highlights
The Net Profit after Tax of $8.6m includes a gain on
sale of $27.9m and $39.3m of abnormal charges
related to divestments, restructuring and balance
sheet review costs.
> Net gain on disposal of discontinued operations: $27.9m (primarily related to
sale of XP Solutions)
> Restructure costs of $9.0m:
$3.6m related to redundancy and legal costs in Ecuador as business scaled
down with project maturity
$5.4m of group head office restructure and redundancy costs as head office
restructured to be fit for purpose
> Business review costs of $47.0m:
$10.7m provision related to lease costs associated with closures and
rationalisation of office infrastructure
$11.5m provision for historical receivables deemed materially at risk of
collection due to changed business conditions
$24.8m provisions/accruals/writeoffs associated with business reviews;
− $1.5m closure of developmental drones business
− $9.7m provision associated with the closure of Nigeria business
− $2.6m provision associated with the Petroleum and Gas business
− $4.2m provision related to multi-year project review
− $2.2m provision relating to prior year overhead rate audits
− $2.6m provision relating to litigation disputes
− $1.5m indirect tax provision in dispute
− $0.5m prior period payroll tax related disputes
> Interest, depreciation and tax benefit of ($16.7)m:
$7.1m acceleration of depreciation of externally purchased software
$3.7m income tax provisioning for taxes under dispute (including penalties
and interest)
($27.5)m tax effect of underlying adjustments
19.98.6
9.0
10.7
11.5
24.8
27.9
16.7
(20)
(10)
-
10
20
30
40
50
60
A$ millions
For
per
sona
l use
onl
y
10 2017 Full Year Results
2017 Full Year Performance Highlights
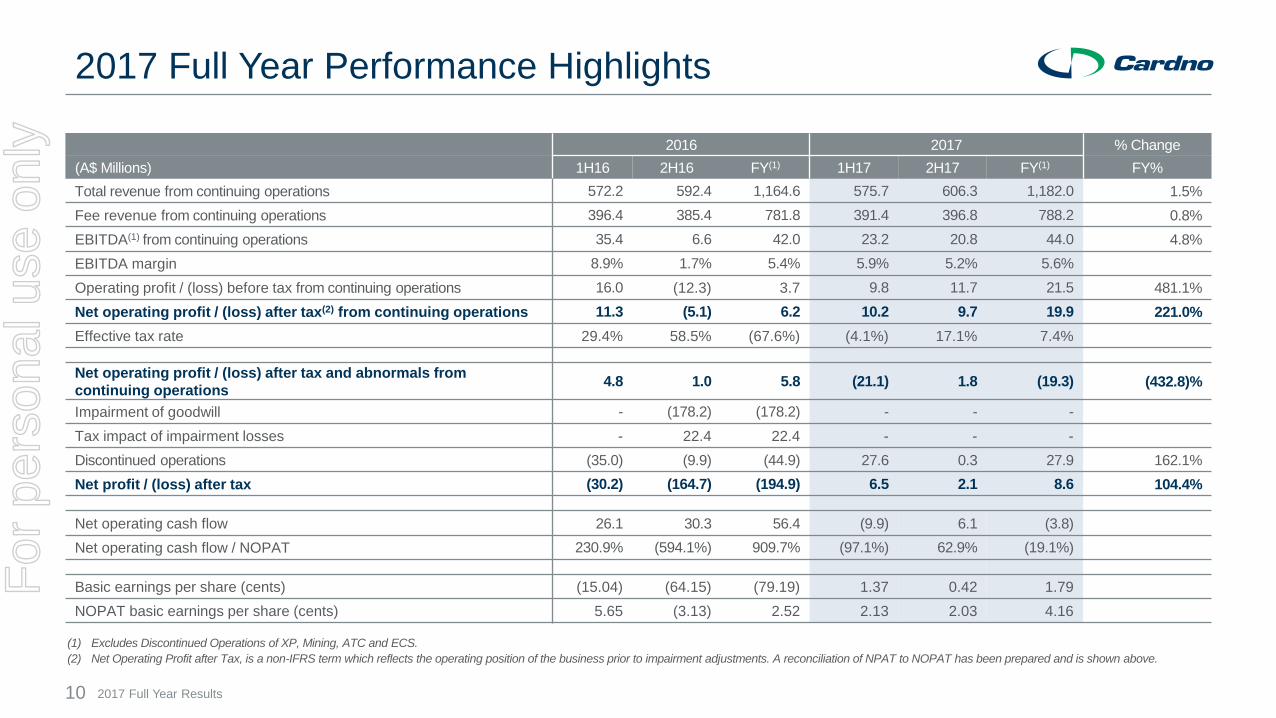
(1) Excludes Discontinued Operations of XP, Mining, ATC and ECS.
(2) Net Operating Profit after Tax, is a non-IFRS term which reflects the operating position of the business prior to impairment adjustments. A reconciliation of NPAT to NOPAT has been prepared and is shown above.
2016 2017 % Change
(A$ Millions) 1H16 2H16 FY(1) 1H17 2H17 FY(1) FY%
Total revenue from continuing operations 572.2 592.4 1,164.6 575.7 606.3 1,182.0 1.5%
Fee revenue from continuing operations 396.4 385.4 781.8 391.4 396.8 788.2 0.8%
EBITDA(1) from continuing operations 35.4 6.6 42.0 23.2 20.8 44.0 4.8%
EBITDA margin 8.9% 1.7% 5.4% 5.9% 5.2% 5.6%
Operating profit / (loss) before tax from continuing operations 16.0 (12.3) 3.7 9.8 11.7 21.5 481.1%
Net operating profit / (loss) after tax(2) from continuing operations 11.3 (5.1) 6.2 10.2 9.7 19.9 221.0%
Effective tax rate 29.4% 58.5% (67.6%) (4.1%) 17.1% 7.4%
Net operating profit / (loss) after tax and abnormals from
continuing operations4.8 1.0 5.8 (21.1) 1.8 (19.3) (432.8)%
Impairment of goodwill - (178.2) (178.2) - - -
Tax impact of impairment losses - 22.4 22.4 - - -
Discontinued operations (35.0) (9.9) (44.9) 27.6 0.3 27.9 162.1%
Net profit / (loss) after tax (30.2) (164.7) (194.9) 6.5 2.1 8.6 104.4%
Net operating cash flow 26.1 30.3 56.4 (9.9) 6.1 (3.8)
Net operating cash flow / NOPAT 230.9% (594.1%) 909.7% (97.1%) 62.9% (19.1%)
Basic earnings per share (cents) (15.04) (64.15) (79.19) 1.37 0.42 1.79
NOPAT basic earnings per share (cents) 5.65 (3.13) 2.52 2.13 2.03 4.16
For
per
sona
l use
onl
y

11 2017 Full Year Results
2017 Full Year Segments
Cardno segment reporting is now presented in four segments: Americas Engineering and Environmental, Asia Pacific
Engineering and Environmental, Portfolio Companies and International Development
International Development
Global operations, three major geographies:
Americas, Europe, Asia-Pacific
> FY17 Revenue $330.0m, fully allocated EBITDA $6.0m
> 4 locations (Cardno offices), 1,932 staff
Portfolio Companies: Construction Sciences,
PPI Oil and Gas, and Latin America
> FY17 Revenue $165.2m, fully allocated EBITDA $6.6m
> 23 locations, 1,021 staff
Asia Pacific Engineering and Environmental
> Managed in two geographic regions:
Northern and Southern.
> FY17 Revenue $275.9m, fully allocated EBITDA $30.1m
> 21 locations, 1,273 staff
Americas Engineering and Environmental
> Region structured as three divisions:
Science & Environment, Infrastructure, Government
> FY17 Revenue $411.0m, fully allocated EBITDA $6.6m
> 79 locations, 1,595 staff
NB: Staff numbers are FTE including permanent, fixed term and contractors.
For
per
sona
l use
onl
y

12 2017 Full Year Results
2017 Full Year Segments: Asia Pacific
Asia Pacific continues to perform strongly.
> Gross Revenue in FY17 of $275.9m. This was 3.9% higher than FY16
> Fully allocated EBITDA margin was 10.9%, which is broadly in line with FY16
EBITDA margin includes all allocations for corporate and group costs
> A number of restructure actions that have been completed in FY17 will generate
benefits from FY18 (for example material rent reduction in several offices)
> Business is investing significantly in major projects expertise with a new dedicated
business development team to focus on longer lead time material contracts
KEY WINS DURING THE YEAR INCLUDE:
> Survey works for Parramatta Light Rail
> Civil design & associated works for significant urban release projects in Western
Sydney (Leppington) and the Illawarra (Calderwood)
> Ipswich Motorway Upgrade
> Range of engineering and environmental work for HMAS Coonawarra and
Larrakeyah Barracks
> Environmental technical support for WestConnex M4
ASIA PACIFIC EBITDA AND % MARGIN
A$ million
0%
2%
4%
6%
8%
10%
12%
14%
10
11
12
13
14
15
16
17
H1 2016 H2 2016 H1 2017 H2 2017
EBITDA EBITDA margin (%)
For
per
sona
l use
onl
y

13 2017 Full Year Results
The performance in the Americas is beginning to improve. The 1H17 focus
on structure, leadership, staff and empowerment is beginning to bear fruit.
> Gross Revenue in FY17 of $411.0m. This was 4.7% down on FY16
> There remains significant potential in the Americas. Focus has turned to growing
revenue to improve margin (fixed cost utilisation) rather than additional cost reductions at
a local level
> Americas Head Office structure removed and devolved into operating units
as appropriate
KEY WINS DURING THE YEAR INCLUDE:
> Arizona Department of Transportation, Subsurface Utility Engineering & Survey on call
> Florida Department of Transportation, construction engineering and inspection services
> U.S. Army Corps of Engineers, Mobile District, BUILDER SMS Assessments Worldwide
for U.S. Army Installation Command
> US Navy, Encroachment Management Services in Western United States
2017 Full Year Segments: Americas
AMERICAS EBITDA AND % MARGINA$ million
-2%
-1%
0%
1%
2%
3%
4%
5%
6%
-5
0
5
10
15
H1 2016 H2 2016 H1 2017 H2 2017
EBITDA EBITDA margin (%)
For
per
sona
l use
onl
y

14 2017 Full Year Results
ID EBITDA AND % MARGIN
A$ million
-1.0%
-0.5%
0.0%
0.5%
1.0%
1.5%
2.0%
2.5%
3.0%
-2
-1
0
1
2
3
4
5
6
H1 2016 H2 2016 H1 2017 H2 2017
EBITDA EBITDA margin (%)
2017 Full Year Segments: International Development (ID)
International Development returns to profit.
KEY WINS DURING THE YEAR INCLUDE MULTI YEAR CONTRACTS FOR:
> USAID, Serbia Competitiveness Systems Strengthening Activity
> MCC, Liberia Fiscal Agent and Liberia Procurement Agent
> EU, Technical Assistance to the Bangladesh Small and Cottage Industries Corp.
> DFID, Supporting Sustainable Artisanal Mining in Rwanda Program
> DFAT, Australia Indonesia Partnership for Justice II
For
per
sona
l use
onl
y

15 2017 Full Year Results
Increased accountability has led to stronger financial performance.
> Fully allocated EBITDA margin for the year of 4.0%, up from 2.3% achieved in FY16
> Although some sectors (Oil & Gas) remain challenged others (eg. Construction Sciences)
are starting to see revenue and EBITDA pick up
> Reflecting the challenging economic environment, the Oil & Gas business exited its
Nigeria operations effective 30th June 2017
> Stabilising the business and completing engineering projects in Ecuador
KEY WINS DURING THE YEAR INCLUDE:
> Package C and Package D of Woolgoolga to Ballina Pacific Highway Project
> NorthConnex Project, Sydney
> Toowoomba Second Range Crossing earthworks and aggregates testing
> Lundin Gold environmental services in Ecuador
2017 Full Year Segments: Portfolio Companies
PORTFOLIO EBITDA AND % MARGINA$ million
-6%
-4%
-2%
0%
2%
4%
6%
8%
10%
12%
14%
-5
0
5
10
H1 2016 H2 2016 H1 2017 H2 2017
EBITDA EBITDA margin (%)
For
per
sona
l use
onl
y

16 2017 Full Year Results
2017 Full Year Balance Sheet
1. Net debt now $15.3m, down from $49.6m (June 2016)
and $311.3M (June 2015). Improvement in net debt in
FY17 primarily due to the sale of XP Solutions
2. Decrease in PPE includes impact of the write off of
onerous software contract
3. Decrease in intangibles reflects sale of XP Solutions
4. Decrease in WIP reflects increased in speed of
billing cycle
5. Increase in non-current liabilities Includes onerous lease
provisions relating to office closures and consolidations
6. Significant head room on covenants. Net Debt/EBITDA
of 0.4x, versus 1.5x (FY16) and 2.6x (FY15)
FY2015
‘$000’s
FY2016
‘$000’s
FY2017
‘000’s
Cash and cash equivalents 84,750 105,613 80,028
Trade and other receivables 266,513 191,053 218,749
Inventories 154,611 115,305 96,882
Other current assets 41,334 26,328 13,696
Total current assets 547,208 438,299 409,355
PPE 64,851 47,310 35,593
Intangible assets 548,084 322,604 295,873
Deferred tax assets 65,448 118,580 142,127
Other financial assets 7,625 3,770 1,323
Total non-current assets 686,008 492,264 474,916
Total assets 1,233,216 930,563 884,271
Trade and other payables 150,566 125,115 144,327
Loans and borrowings 2,982 2,795 615
Other current liabilities 103,982 87,279 87,117
Total current liabilities 257,530 215,189 232,059
Loans and borrowings 393,108 152,425 94,708
Other non-current liabilities 12,970 5,852 12,227
Non-current liabilities 406,078 158,277 106,935
Total liabilities 663,608 373,466 338,994
Net assets 569,608 557,097 545,277
Net debt 311,340 49,607 15,294
Net Debt/EBITDA (lending covenant <= 3.0x) 2.6x 1.5x 0.4x
Interest Cover Ratio (lending covenant >= 3.3x) 13.9x 3.5x 5.6x
Net Asset Value (lending covenant >= $445.0M) 569,608 557,097 545,277
Financial discipline over the past 18 months
has created a strong balance sheet 1
2
3
4
* Interest Cover Ratio is the ratio of EBITDA to Net Interest Expense for the prior 12 months.
5
6For
per
sona
l use
onl
y

17 2017 Full Year Results
2017 Full Year Balance Sheet Strength
1. Reduced net debt from $49.6m June 2016 to $15.3m
post XP sale
2. Permanently reduced debt facilities from US$210m at
June 2016 to US$86.6m post the sale of XP Solutions
3. Intangible assets reduced following sale of
XP solutions
4. Net tangible assets increased $14.9m due to the
pay down of debt
5. Liquidity ratios significantly improved
6. Covenant ratios improved
FY2015
‘$000’s
FY2016
‘$000’s
FY2017
‘000’s
Net debt 311,340 49,607 15,294
Total debt facilities US$480m US$210m US$86.6m
Intangible assets 548,084 322,604 295,873
Trade + Other Receivables – trade payables 115,947 65,938 74,422
Net tangible assets 21,524 234,493 249,404
Current assets/Current liabilities 2.1x 2.0x 1.8x
(Cash + Debtors + WIP) / (payables + debt) 0.9x 1.5x 1.7x
(Cash + Debtors + WIP) / Debt 1.3x 2.7x 4.2x
Net Debt/EBITDA (lending covenant <= 3.0x) 2.6x 1.5x 0.4x
Interest Cover Ratio (lending covenant >= 3.3x) 13.9x 3.5x 5.6x
Net Asset Value (lending covenant >= $445.0M) 569,608 557,097 545,277
Strong balance sheet enables the company to focus on
long term sustainable growth options to build value for shareholders.
4
5
3
* Interest Cover Ratio is the ratio of EBITDA to Net Interest Expense for the prior 12 months.
5
6
1
2
6
6
For
per
sona
l use
onl
y

18 2017 Full Year Results
2017 Cash Flow
1. The sale of XP Solutions for US$49m (prior to transaction
related costs) was the primary driver of cash flow from
investing activities
2. There was a significant repayment of debt, primarily from
the funds from the sale of XP Solutions
3. There has been a reduction in net interest paid reflecting
the lower net debt position of the business
4. A share buy back program was introduced in 2H17
5. Movement in working capital due to timing issues
FY2015
‘$000’s
FY2016
‘$000’s
FY2017
‘000’s
Underlying EBITDA 111,920 43,559 44,005
Other non cash (5,822) - -
Working capital movement (27,169) 17,517 (41,730)
Net interest paid (6,950) (10,387) (4,720)
Income tax paid (23,856) 5,698 (1,388)
Net cash provided by operating activities 48,123 56,387 (3,833)
Proceeds on disposal of subsidiaries - 85,943 57,977
Acquisition of subsidiaries, deferred consideration (11,187) (23,857) (6,180)
Payments for PPE (24,273) (19,312) (12,280)
Other investing activities 283 8,704 932
Net cash used in investing activities (35,177) 51,478 40,449
Proceeds from issue of shares 6,135 177,038 -
Share buy back - - (5,670)
Net change in borrowings 18,379 (262,151) (55,225)
Dividends (42,055) (7,693) -
Other (885) 4,808 (2,303)
Net cash used in financing activities (18,426) (87,998) (63,198)
Net increase in cash (5,480) 19,867 (26,582)
Cash and cash 1 July 85,885 84,750 105,613
Other 4,345 996 997
Cash and cash equivalents at period end 84,750 105,613 80,028
Net cash from operating activities / EBITDA 43.0% 129.4% (8.7%)
2
3
1
4
5
For
per
sona
l use
onl
y

2017 FULL YEAR
RESULTS
PRESENTATION
> Performance overview
> Detailed financial review
> Commentary and outlook
For
per
sona
l use
onl
y

20 2017 Full Year Results
Outlook for FY18
Cardno is entering the second year of a multi year business improvement plan. Cardno will continue to invest in business
infrastructure, broadening its service lines and building long term shareholder value.
> Cardno will continue to build out the breadth of its service offerings, particularly in the Americas. This will involve bolt on acquisitions and
investment in key hires. This is part of a multi year program to ensure we are best placed to mirror the scale and profitability of our
Australian operations in the America’s
> Cardno is committed to building long term organic growth capabilities and investment in business development teams will continue to act
as a drag on earnings over the next 12 to 24 months
> The board will continue its share buy back program while the board considers this an appropriate allocation of shareholder capital
> The Board has commenced the process to recruit a CEO. The focus is on finding a CEO with strong capability and cultural alignment with
the direction that Cardno is now travelling
Based on our performance exiting FY17, we believe that Cardno’s performance over FY18 should be a material increase over
FY17 and Earnings before Interest, Tax, Depreciation and Amortisation (EBITDA) and should be in the order of $55 to $60 million.
This guidance is predicated on the current momentum continuing throughout the FY18 year.
For
per
sona
l use
onl
y

THANK YOU
We are an ASX-listed professional
infrastructure and environmental
services company, with expertise in
the development and improvement
of physical and social infrastructure
for communities around the world.
www.cardno.com
For
per
sona
l use
onl
y