2017 full year - glanbia/media/files/g/glanbia-plc/documents/2018...investing in plant-based...
TRANSCRIPT

2017 Full Year
Results Presentation 21 February 2018
CAUTIONARY STATEMENT
2017 Full Year Results | Slide 2

Full Year
Highlights
2017 Full Year Results Presentation

8TH YEAR OF DOUBLE-DIGIT GROWTH
2017 Full Year Results | Slide 4
Total Group Pro-forma¹ EBITA
+8.6% constant currency²
Wholly-owned volume growth
+5.3%
Dividend payout
raised to 25%
2017 FINANCIAL Highlights 2017 STRATEGIC Highlights
Acquisition of Amazing Grass and Body & Fit
Disposal of 60% of Dairy Ireland
Refreshed Group strategy
Group structure focused on two growth platforms and strategic JVs
1. Pro-forma Adjusted Earnings Per Share for the continuing Group calculation
assumes the Dairy Ireland segment and related assets were disposed of at the
beginning of the 2016 financial year. A reconciliation of the pro-forma and
reported adjusted earnings per share can be found in the appendix of this
presentation
2. To arrive at the Constant Currency Change, the average FX rate for the current
period is applied to the relevant reported result from the same period in the
prior year. The average Euro US Dollar FX rate for 2017 was €1 = $1.130 (FY
2016: €1 = $1.107)
Pro-forma¹ adjusted EPS
+10.2% constant currency²

2017 TOTAL GROUP PRO-FORMA EBITA¹ PROGRESSION
2017 Full Year Results | Slide 5
JVs €56m
JVs €68m
GN €111m
GN €114m
GPN €162m
GPN €170m
€0m
€50m
€100m
€150m
€200m
€250m
€300m
€350m
€400m
2016 2017
Glanbia Performance Nutrition
Like-for-like branded revenue growth and acquisitions
Glanbia Nutritionals
Continued growth in Nutritional Solutions
Joint Ventures
Strong dairy markets and volume growth
Drivers
€330m
Total Group
pro-forma EBITA GPN EBITA
GN EBITA JV pro-forma EBITA
€351m
+ 21.9%
+ 4.1%
+ 7.0%
Constant currency growth
1. Pro-forma Adjusted Earnings Per Share for the continuing Group calculation assumes the Dairy Ireland segment and related assets were disposed of at the beginning of the 2016 financial year. A reconciliation of the pro-forma and
reported adjusted earnings per share can be found in the appendix of this presentation
2. To arrive at the Constant Currency Change, the average FX rate for the current period is applied to the relevant reported result from the same period in the prior year. The average Euro US Dollar FX rate for 2017 was €1 = $1.130 (FY
2016: €1 = $1.107)

STRONG YEAR OF STRATEGIC EXECUTION
Amazing Grass and
Body & Fit acquired
for €168m
Investing in plant-based nutrition and DTC¹ capability
On-going investment planned to drive growth
Disposal of 60% of
Dairy Ireland for
€209m
Glanbia Ireland joint venture created with ambitious growth plans
SwC – 25% expansion
in production capacity
$140m
Commissioning to be completed by Q3 2018
Initiatives
2017 Full Year Results | Slide 6
Update
1. Direct-to-consumer

IMPACT OF DAIRY IRELAND TRANSACTION
2017 Full Year Results | Slide 7
Creation of
Glanbia Ireland JV
The majority of the
Group’s primary dairy
processing now
in JVs
Two wholly-owned
growth platforms
Improved margin
profile in wholly-
owned Group
+120 bps
plc 40%
CO-OP 60%
Glanbia
Ireland
Ownership
GPN 47% GN
53%
2017
Revenues
10.7%
11.9%
0%
2%
4%
6%
8%
10%
12%
14%
2016¹ 2017²1. 2016 margin is the Glanbia wholly-owned reported margin, which includes the Dairy Ireland segment
2. 2017 margin is the Glanbia wholly-owned margin, excluding the Dairy Ireland segment. The Dairy Ireland segment was disposed of on 02 July 2017

Operational
Review
2017 Full Year Results Presentation

ACQUISITIONS
REVENUE
€1,121.1m
+13.7% (cc²)
EBITA
€169.7m
+7.0% (cc²)
LFL BRANDED
REVENUE
+6.3%
Vol. +8.0%
EBITA margin
15.1%
-100 bps (cc²)
INNOVATION
GLANBIA PERFORMANCE NUTRITION
2017 Full Year Results | Slide 9
Performance Good performance with total
branded revenue growth of 15%
Growth Growth driven by LAPAC,
EMEA and acquisitions
Innovation Strong performance in
ready-to-eat format
1. Percentage movements are on a constant currency basis
2. To arrive at the Constant Currency Change, the average FX rate for
the current period is applied to the relevant reported result from the
same period in the prior year. The average Euro US Dollar FX rate
for 2017 was €1 = $1.130 (FY 2016: €1 = $1.107)
3. Reported & constant currency reconciliations can be found in the
Appendix of this presentation

GPN MARKET OVERVIEW
• A global market leader
• GPN brands are
available across a
broad mix of
geographies and
channels
• GPN positioned to
deliver mid-to-high
single-digit volume
growth in 2018
2017 Full Year Results | Slide 10
Online 26%
Distributors 30%
Specialty 28%
FDMC¹ 16%
Total €1,121m
GPN Global Revenue 2017
by Channel
North America
62%
Rest of World 38% Total
€1,121m
GPN Global Revenue 2017
by Region
1. Food, Drug, Mass and Club
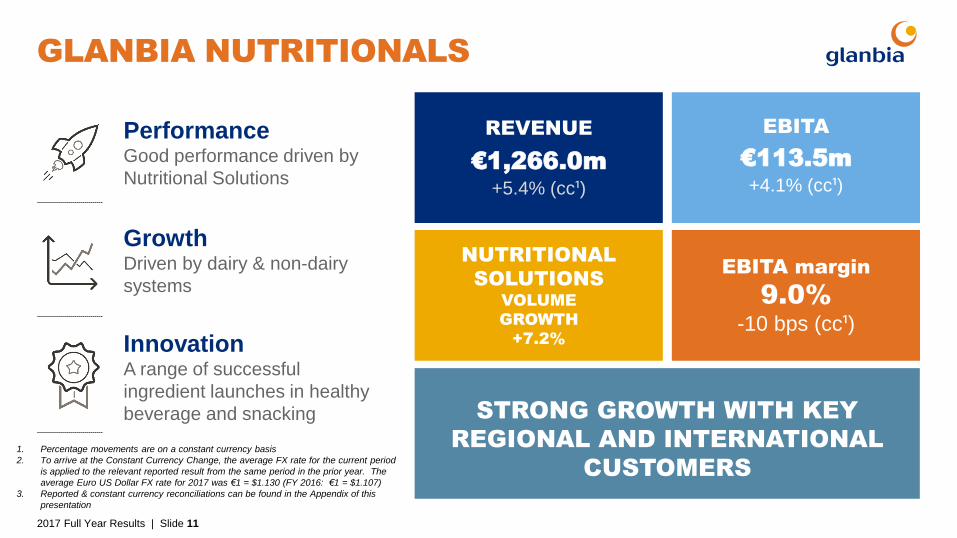
GLANBIA NUTRITIONALS
2017 Full Year Results | Slide 11
Performance Good performance driven by
Nutritional Solutions
Growth Driven by dairy & non-dairy
systems
Innovation A range of successful
ingredient launches in healthy
beverage and snacking
REVENUE
€1,266.0m
+5.4% (cc¹)
EBITA
€113.5m
+4.1% (cc¹)
NUTRITIONAL
SOLUTIONS
VOLUME
GROWTH
+7.2%
EBITA margin
9.0%
-10 bps (cc¹)
STRONG GROWTH WITH KEY
REGIONAL AND INTERNATIONAL
CUSTOMERS
1. Percentage movements are on a constant currency basis
2. To arrive at the Constant Currency Change, the average FX rate for the current period
is applied to the relevant reported result from the same period in the prior year. The
average Euro US Dollar FX rate for 2017 was €1 = $1.130 (FY 2016: €1 = $1.107)
3. Reported & constant currency reconciliations can be found in the Appendix of this
presentation

NUTRITIONAL SOLUTIONS OVERVIEW
2017 Full Year Results | Slide 12
Dairy 39% Non-
dairy 61%
Total
€532m
• Nutritional Solutions
is a key growth
engine
• Growth is being
driven by consumers
seeking ‘Better-For-
You’ and convenient
products
• Nutritional Solutions
supplies a range of
customers in a variety
of consumer
categories
Nutritional Solutions
42% US Cheese 58%
SPORTS &
PERFORMANCE
NUTRITION
LIFESTYLE
NUTRITION &
SUPPLEMENTS
EARLY
LIFE
FUNCTIONAL
BEVERAGE
CLINICAL
& MEDICAL
NUTRITION
DRESSINGS,
SAUCES &
SPREADS
BAKERY COSMETICS &
PERSONAL CARE
ANIMAL
NUTRITION
BARS, CEREALS
& SNACKS
Glanbia Nutritionals
Total Revenue 2017 €1,266m
Nutritional Solutions
Dairy/Non-dairy Revenue
Nutritional Solutions consumer categories

US CHEESE – INNOVATIVE PARTNER MODEL
2017 Full Year Results | Slide 13
• #1 position in the American-style
cheddar cheese category
• Commercial, technical and
operational partner for US JVs on
route-to-market and innovation
• Partnership approach with customers
on innovation
• On track for commissioning of new
plant in Michigan in 2020
52%
48%
2017 Total cheese production
Glanbia Nutritionals SwC JV
420,000
tonnes

STRONG PERFORMANCE FROM
JOINT VENTURES
2017 Full Year Results | Slide 14
Performance Strong performance in Revenue,
EBITA & margin
Growth Driven by mainly by volume
growth and relatively strong dairy
markets
Strategic Partnerships Innovative & robust business
model
REVENUE
€1,093.4m
+35.7% (cc¹)
EBITA
€63.4m
+50.2% (cc¹)
EBITA margin
5.8%
+60 bps (cc¹)
Joint Ventures Revenue
JV
Glanbia
Ireland SwC
Glanbia
Cheese Total
100% Revenue (€’m) 1,407 738 317 2,462
Glanbia share (€’m) 563 369 162 1,093
1. To arrive at the Constant Currency Change, the average FX rate for the current period is applied to the relevant reported result from the
same period in the prior year. The average Euro US Dollar FX rate for 2017 was €1 = $1.130 (FY 2016: €1 = $1.107).

Financial
Review
2017 Full Year Results Presentation

INCOME STATEMENT
2017 Full Year Results | Slide 16
2017 results summary
Pre-exceptional
€’m Reported currency
2017 2016 Change
Revenue (Wholly-owned) 2,387.1 2,231.7 +7.0%
EBITA (Wholly-owned) 283.2 273.3 +3.6%
EBITA margin 11.9% 12.2% -30 bps
Amortisation (43.1) (37.4)
Net Finance Costs (23.0) (22.8)
Share of Joint Ventures 42.8 26.0
Income Tax (38.3) (39.3)
Profit from continuing operations 221.6 199.8
Profit from discontinued operations 9.8 27.1
Profit for the period 231.4 226.9
Adjusted EPS - Continuing operations on a pro-forma¹ basis 87.11c 80.40c +8.3%
Adjusted EPS – Reported (continuing & discontinued operations) 89.17c 86.02c +3.7%
Constant
currency²
2017
+9.2%
+5.8%
-30 bps
+10.2%
+5.3%
1. Pro-forma Adjusted Earnings Per Share for the continuing Group calculation assumes the Dairy Ireland segment and related assets were disposed of at the beginning of the 2016 financial year. A reconciliation
of the pro-forma and reported adjusted earnings per share can be found in the appendix of this presentation
2. To arrive at the Constant Currency Change, the average FX rate for the current period is applied to the relevant reported result from the same period in the prior year. The average Euro US Dollar FX rate for
2017 was €1 = $1.130 (FY 2016: €1 = $1.107)
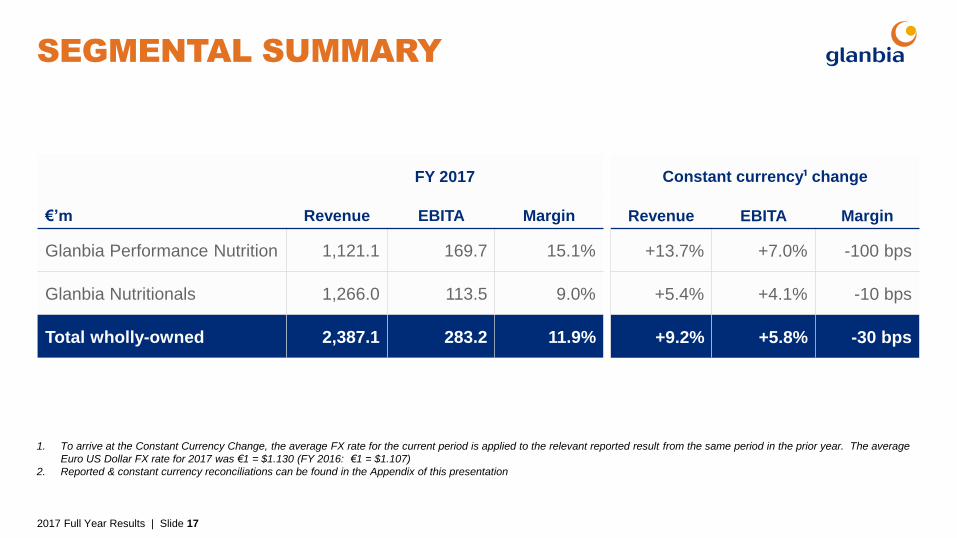
SEGMENTAL SUMMARY
2017 Full Year Results | Slide 17
FY 2017
€’m Revenue EBITA Margin
Glanbia Performance Nutrition 1,121.1 169.7 15.1%
Glanbia Nutritionals 1,266.0 113.5 9.0%
Total wholly-owned 2,387.1 283.2 11.9%
Constant currency¹ change
Revenue EBITA Margin
+13.7% +7.0% -100 bps
+5.4% +4.1% -10 bps
+9.2% +5.8% -30 bps
1. To arrive at the Constant Currency Change, the average FX rate for the current period is applied to the relevant reported result from the same period in the prior year. The average
Euro US Dollar FX rate for 2017 was €1 = $1.130 (FY 2016: €1 = $1.107)
2. Reported & constant currency reconciliations can be found in the Appendix of this presentation
WHOLLY-OWNED REVENUE GROWTH +9.2% (CC*)¹
2017 Full Year Results | Slide 18
Volume +5.3%, Price +0.2%, Acquisitions +3.7%
CONTINUING BUSINESS
€2,231.7m (2.0%)
6.2%
3.0% €2,387.1m
€2,000m
€2,100m
€2,200m
€2,300m
€2,400m
FY16 FX GPN GN FY171. To arrive at the Constant Currency Change, the average FX rate for the current period is applied to the relevant reported result from the same period in the prior year. The average
Euro US Dollar FX rate for 2017 was €1 = $1.130 (FY 2016: €1 = $1.107)
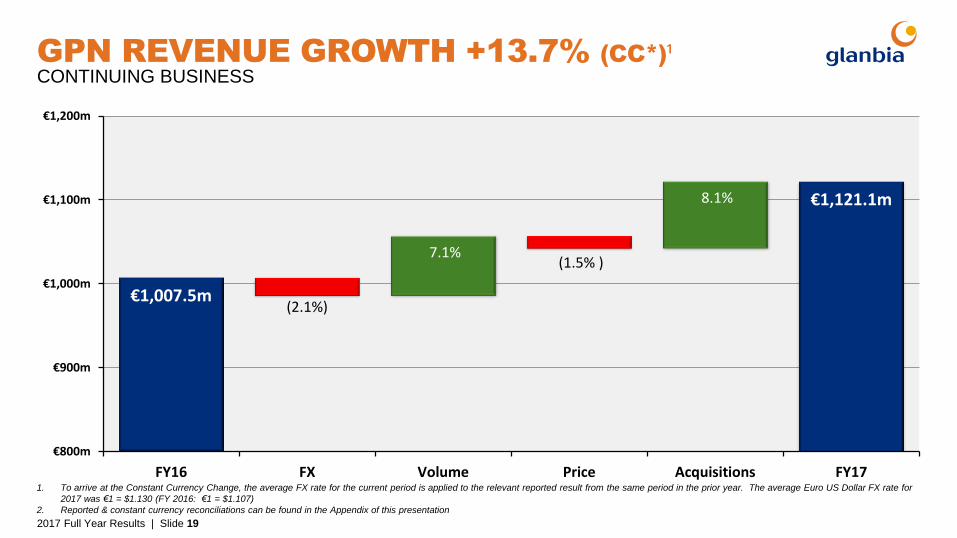
GPN REVENUE GROWTH +13.7% (CC*)¹
2017 Full Year Results | Slide 19
CONTINUING BUSINESS
€1,007.5m
7.1%
8.1%
(2.1%)
(1.5% )
€1,121.1m
€800m
€900m
€1,000m
€1,100m
€1,200m
FY16 FX Volume Price Acquisitions FY171. To arrive at the Constant Currency Change, the average FX rate for the current period is applied to the relevant reported result from the same period in the prior year. The average Euro US Dollar FX rate for
2017 was €1 = $1.130 (FY 2016: €1 = $1.107)
2. Reported & constant currency reconciliations can be found in the Appendix of this presentation
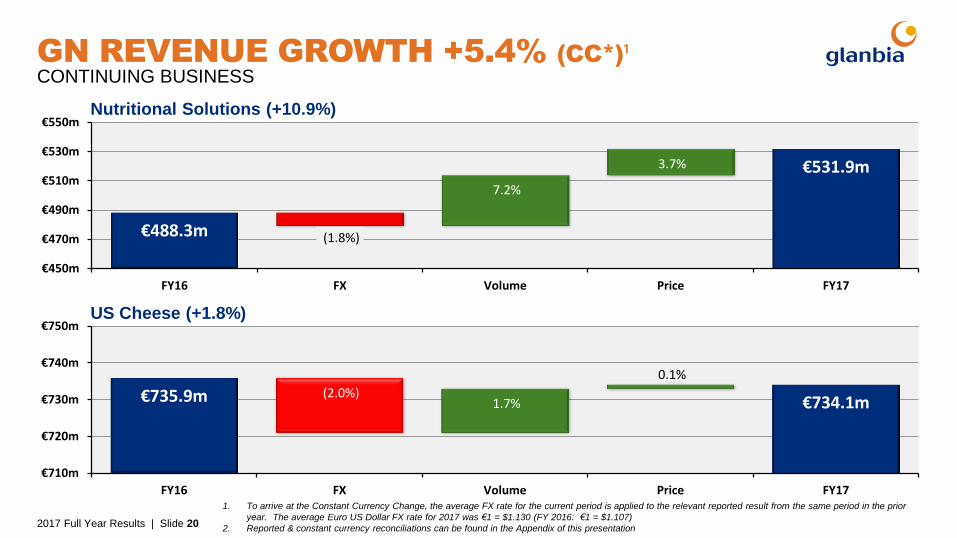
GN REVENUE GROWTH +5.4% (CC*)¹
2017 Full Year Results | Slide 20
CONTINUING BUSINESS
€488.3m
7.2%
3.7%
(1.8%)
€531.9m
€450m
€470m
€490m
€510m
€530m
€550m
FY16 FX Volume Price FY17
€735.9m 1.7%
0.1%
(2.0%) €734.1m
€710m
€720m
€730m
€740m
€750m
FY16 FX Volume Price FY17
Nutritional Solutions (+10.9%)
US Cheese (+1.8%)
1. To arrive at the Constant Currency Change, the average FX rate for the current period is applied to the relevant reported result from the same period in the prior
year. The average Euro US Dollar FX rate for 2017 was €1 = $1.130 (FY 2016: €1 = $1.107)
2. Reported & constant currency reconciliations can be found in the Appendix of this presentation
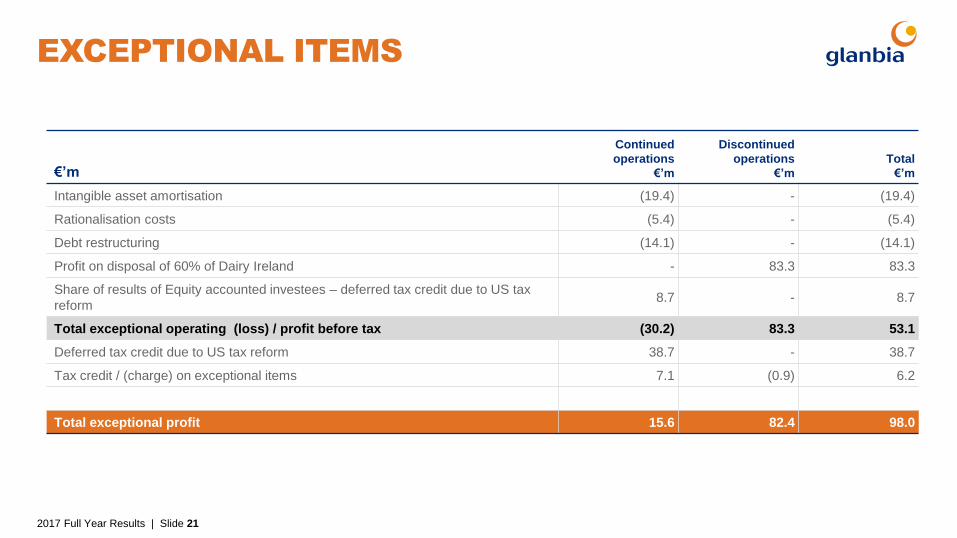
EXCEPTIONAL ITEMS
2017 Full Year Results | Slide 21
€’m
Continued
operations
€’m
Discontinued
operations
€’m
Total
€’m
Intangible asset amortisation (19.4) - (19.4)
Rationalisation costs (5.4) - (5.4)
Debt restructuring (14.1) - (14.1)
Profit on disposal of 60% of Dairy Ireland - 83.3 83.3
Share of results of Equity accounted investees – deferred tax credit due to US tax
reform 8.7 - 8.7
Total exceptional operating (loss) / profit before tax (30.2) 83.3 53.1
Deferred tax credit due to US tax reform 38.7 - 38.7
Tax credit / (charge) on exceptional items 7.1 (0.9) 6.2
Total exceptional profit 15.6 82.4 98.0

CASH FLOW FROM CONTINUING OPERATIONS
2017 Full Year Results | Slide 22
€328m
€16m
€123m
€20m €58m
€6m
€185m
€137m
€0m
€100m
€200m
€300m
€400m
2017 EBITDA Working Capital BusinessSustaining
Capex
2017 OperatingCash Flow
Net Interest &Tax
Dividends fromJV&A's
Other FCF 2017
• The pro-forma movement in working capital was (€123m), primarily due to an increase of receivables of (€76m) due to the
increased sales activity in Q4
• On a pro-forma basis operating cash flow conversion of EBITDA for 2017 was 56.4% compared to 101.5% in 2016
• The target for 2018 is 80% operating cash flow conversion

INVESTMENT & RETURNS
2017 Full Year Results | Slide 23
• Major projects were the new
GPN R&D Innovation Centre,
plant improvements and IT
systems upgrades
• Amazing Grass and Body &
Fit acquired in 2017 and
thinkThin in 2015
• 2018 Capital Expenditure
expected to be €75 to
€85 million
• Return on Capital Employed
– “ROCE” 13.4% (2016: 13.9%*)
ROCE 2017: 13.4% ROCE 2016: 13.9% ROCE 2015: 14.8%
Sustaining Capex Strategic Capex Acquisitions Total Investment
*Restated to include deferred tax
€24m €32m €37m
€49m €57m
€86m
€168m
€15m
€190m
2017 2016 2015
€241m
€104m
€313m
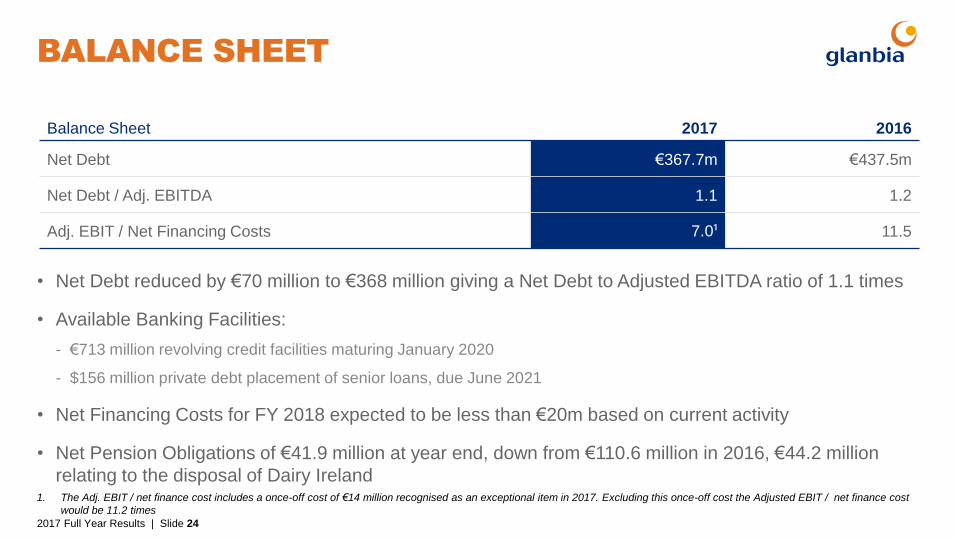
BALANCE SHEET
• Net Debt reduced by €70 million to €368 million giving a Net Debt to Adjusted EBITDA ratio of 1.1 times
• Available Banking Facilities:
- €713 million revolving credit facilities maturing January 2020
- $156 million private debt placement of senior loans, due June 2021
• Net Financing Costs for FY 2018 expected to be less than €20m based on current activity
• Net Pension Obligations of €41.9 million at year end, down from €110.6 million in 2016, €44.2 million
relating to the disposal of Dairy Ireland
2017 Full Year Results | Slide 24
Balance Sheet 2017 2016
Net Debt €367.7m €437.5m
Net Debt / Adj. EBITDA 1.1 1.2
Adj. EBIT / Net Financing Costs 7.0¹ 11.5
1. The Adj. EBIT / net finance cost includes a once-off cost of €14 million recognised as an exceptional item in 2017. Excluding this once-off cost the Adjusted EBIT / net finance cost
would be 11.2 times
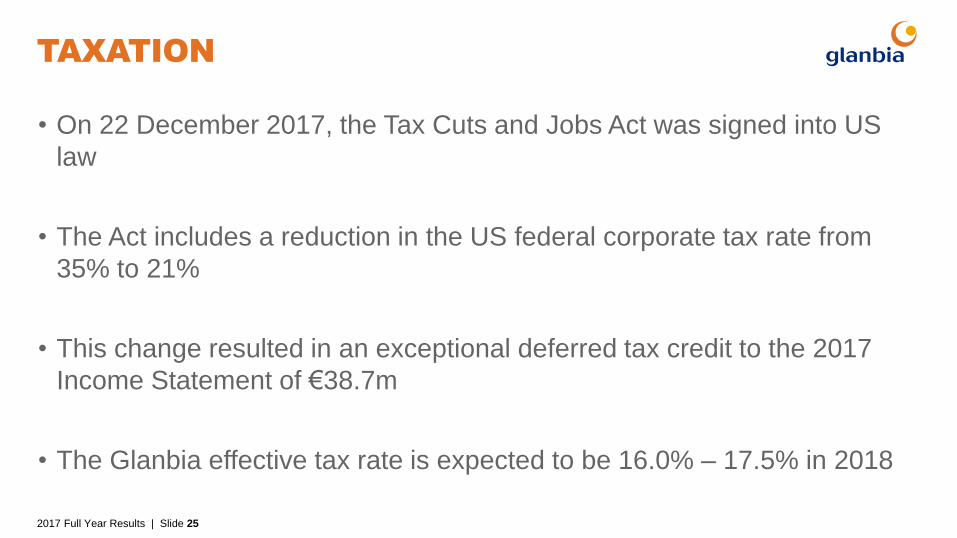
TAXATION
• On 22 December 2017, the Tax Cuts and Jobs Act was signed into US
law
• The Act includes a reduction in the US federal corporate tax rate from
35% to 21%
• This change resulted in an exceptional deferred tax credit to the 2017
Income Statement of €38.7m
• The Glanbia effective tax rate is expected to be 16.0% – 17.5% in 2018
2017 Full Year Results | Slide 25

DIVIDEND UPDATE
2017 Full Year Results | Slide 26
Completed review of dividend policy
Progressive dividend policy with target payout ratio 25% to 35%
2017 dividend payout will be 22c / share, an increase of 65% on 2016,
representing a payout of 25%

Strategy
&
Outlook
2017 Full Year Results Presentation

GLANBIA STRATEGY DRIVERS
2017 Full Year Results | Slide 28
Our Purpose: To deliver better nutrition for every step of life’s journey
Our Vision: To be one of world’s top performing nutrition companies trusted to enrich lives everyday
Trends driving our business
Health and
wellness
On-the-go food
& beverage
Digitally
connected
Clean
labelling

GLANBIA STRATEGY EXECUTION
2017 Full Year Results | Slide 29
Strategic Priorities
Maintain and grow
our global leadership
in Performance
Nutrition
Sustain current, and
drive further
ingredient market
leadership in
Nutritional
Solutions
Grow through organic
Investment programme and
acquisition/partner with
complementary businesses
Develop talent,
culture
and values in line with
our growing global
scale
Protect and grow
the core
Selectively build and
scale beyond the core
Embed enablers
across the business
Concentrate our focus in growing markets
where we have market leading capability
and right to win
Invest to capture
market opportunities
Build scale internationally
Invest in selective M&A or
partnerships to drive growth
Invest further in insights, technology, and
innovation to create and capture growth
opportunities
Engage the consumer online
Strategic Pillars

2018 OUTLOOK
2017 Full Year Results | Slide 30
• Positive outlook for FY 2018
• Growth will be driven by wholly-owned
business offsetting declines in JVs
• Mid-to-high single-digit like-for-like volume
growth expected across both the branded
portfolio of GPN & Nutritional Solutions
• GPN & GN margins expected to be in-line with
2017
• Pro-forma¹ adjusted EPS is expected to grow
by 5% – 8% constant currency²
1. Pro-forma Adjusted Earnings Per Share for the continuing Group calculation assumes the Dairy Ireland segment and related assets were
disposed of at the beginning of the 2016 financial year. A reconciliation of the pro-forma and reported adjusted earnings per share can be found in
the appendix of this presentation
2. To arrive at the Constant Currency Change, the average FX rate for the current period is applied to the relevant reported result from the same
period in the prior year. The average Euro US Dollar FX rate for 2017 was €1 = $1.130 (FY 2016: €1 = $1.107)
3. If the EUR/USD FX rate remains at approximately $1.24, we expect a pro-forma adjusted EPS headwind of c.8%

To register your interest please email: [email protected]
GLANBIA CAPITAL MARKETS DAY 2018
2017 Full Year Results | Slide 31
Date: 23 May 2018
Location: Chicago, USA
Focus: Glanbia Group with Site Tour

2017 Full Year Results | Slide 32

Appendix 2017 Full Year Results Presentation
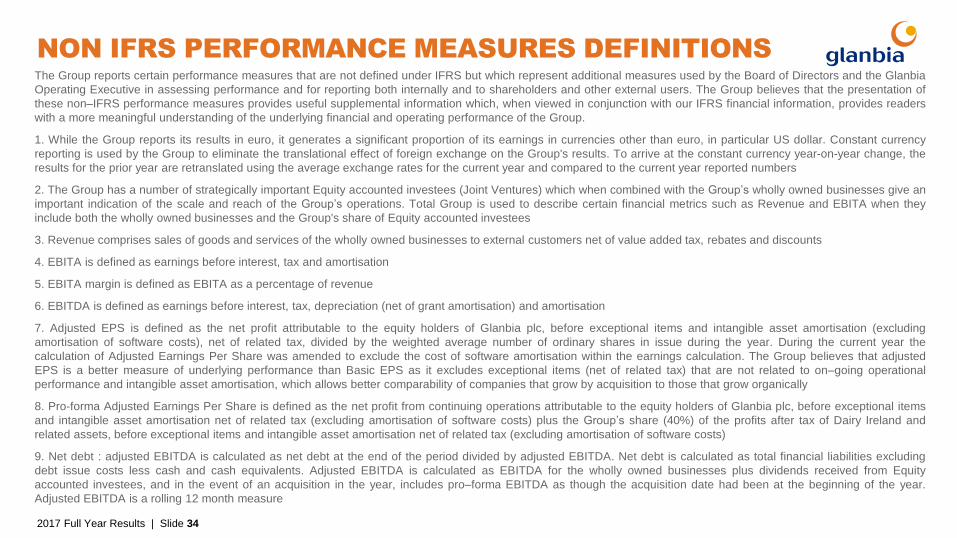
NON IFRS PERFORMANCE MEASURES DEFINITIONS
The Group reports certain performance measures that are not defined under IFRS but which represent additional measures used by the Board of Directors and the Glanbia
Operating Executive in assessing performance and for reporting both internally and to shareholders and other external users. The Group believes that the presentation of
these non–IFRS performance measures provides useful supplemental information which, when viewed in conjunction with our IFRS financial information, provides readers
with a more meaningful understanding of the underlying financial and operating performance of the Group.
1. While the Group reports its results in euro, it generates a significant proportion of its earnings in currencies other than euro, in particular US dollar. Constant currency
reporting is used by the Group to eliminate the translational effect of foreign exchange on the Group's results. To arrive at the constant currency year-on-year change, the
results for the prior year are retranslated using the average exchange rates for the current year and compared to the current year reported numbers
2. The Group has a number of strategically important Equity accounted investees (Joint Ventures) which when combined with the Group’s wholly owned businesses give an
important indication of the scale and reach of the Group’s operations. Total Group is used to describe certain financial metrics such as Revenue and EBITA when they
include both the wholly owned businesses and the Group's share of Equity accounted investees
3. Revenue comprises sales of goods and services of the wholly owned businesses to external customers net of value added tax, rebates and discounts
4. EBITA is defined as earnings before interest, tax and amortisation
5. EBITA margin is defined as EBITA as a percentage of revenue
6. EBITDA is defined as earnings before interest, tax, depreciation (net of grant amortisation) and amortisation
7. Adjusted EPS is defined as the net profit attributable to the equity holders of Glanbia plc, before exceptional items and intangible asset amortisation (excluding
amortisation of software costs), net of related tax, divided by the weighted average number of ordinary shares in issue during the year. During the current year the
calculation of Adjusted Earnings Per Share was amended to exclude the cost of software amortisation within the earnings calculation. The Group believes that adjusted
EPS is a better measure of underlying performance than Basic EPS as it excludes exceptional items (net of related tax) that are not related to on–going operational
performance and intangible asset amortisation, which allows better comparability of companies that grow by acquisition to those that grow organically
8. Pro-forma Adjusted Earnings Per Share is defined as the net profit from continuing operations attributable to the equity holders of Glanbia plc, before exceptional items
and intangible asset amortisation net of related tax (excluding amortisation of software costs) plus the Group’s share (40%) of the profits after tax of Dairy Ireland and
related assets, before exceptional items and intangible asset amortisation net of related tax (excluding amortisation of software costs)
9. Net debt : adjusted EBITDA is calculated as net debt at the end of the period divided by adjusted EBITDA. Net debt is calculated as total financial liabilities excluding
debt issue costs less cash and cash equivalents. Adjusted EBITDA is calculated as EBITDA for the wholly owned businesses plus dividends received from Equity
accounted investees, and in the event of an acquisition in the year, includes pro–forma EBITDA as though the acquisition date had been at the beginning of the year.
Adjusted EBITDA is a rolling 12 month measure
2017 Full Year Results | Slide 34

NON IFRS PERFORMANCE MEASURES DEFINITIONS
10. Adjusted EBIT: net finance cost is calculated as earnings before interest and tax plus dividends received from Equity accounted investees divided by net finance
cost. Net finance cost comprises finance costs less finance income per the Group income statement plus capitalised borrowing costs
11. The Group has adopted an income statement format that seeks to highlight significant items within the Group results for the year. Such items may include
restructuring, impairment of assets, adjustments to contingent consideration, material acquisition integration costs, restructuring costs, profit or loss on disposal or
termination of operations, material acquisition costs, litigation settlements, legislative changes, gains or losses on defined benefit pension plan restructuring and profit
or loss on disposal of investments. Judgement is used by the Group in assessing the particular items which by virtue of their scale and nature should be disclosed in
the income statement and notes as exceptional items
12. Volume increase/(decrease) represents the impact of sales volumes within the revenue movement year on year, excluding volume from acquisitions, on a constant
currency basis. Pricing increase/(decrease) represents the impact of sales pricing within the revenue movement year on year, excluding acquisitions, on a constant
currency basis
13. Like-for-like branded revenue growth represents the sales growth / (decline) year on year on branded sales, excluding acquisitions, on a constant currency basis
14. The effective tax rate is defined as the pre-exceptional income tax charge divided by the profit before tax less share of results of Equity accounted investees
15. The Group defines business sustaining capital expenditure as the expenditure required to maintain/replace existing assets with a high proportion of expired useful
life. This expenditure does not attract new customers or create the capacity for a bigger business. It enables the Group to keep running at current throughput rates but
also keep pace with regulatory and environmental changes as well as complying with new requirements from existing customers
16. The Group defines strategic capital expenditure as the expenditure required to facilitate growth and generate additional returns for the Group. This is generally
expansionary expenditure beyond what is necessary to maintain the Group’s current competitive position
17. Operating cash flow is defined as pre–exceptional EBITDA of the wholly owned businesses net of business sustaining capital expenditure and working capital
movements, excluding exceptional cash flows. ROCE is defined as the Group's earnings before interest, and amortisation (net of related tax) plus the Group's share of
the results of Equity accounted investees after interest and tax divided by capital employed. Capital employed comprises the sum of the Group's total assets plus
cumulative intangible asset amortisation less current liabilities less deferred tax liabilities excluding all financial liabilities, retirement benefit assets and cash. It is
calculated by taking the average of the relevant opening and closing balance sheet amounts. In years where the Group makes significant acquisitions or disposals, the
ROCE calculation is adjusted appropriately, to ensure the acquisition or disposal are equally time apportioned in the numerator and the denominator
18. Dividend pay-out ratio is defined as the annual dividend per ordinary share divided by the pro-forma Adjusted Earnings Per Share. The dividend pay–out ratio
provides an indication of the value returned to shareholders relative to the Group's total earnings
2017 Full Year Results | Slide 35

ADJUSTED EPS - REPORTED
2017 Full Year Results | Slide 36
Adjusted Earnings Per Share
Year
2017
€’m
Constant
currency
2016
€’m
Year
2016
€’m
Profit attributable to the equity holders of the company 329.4 208.6 211.8
Amortisation 31.7 26.7 27.3
Exceptional items (net of tax) (98.0) 14.5 14.8
Adjusted net income 263.1 249.8 253.9
Weighted average number of ordinary shares in issue 295,010.5 295,130.8 295,130.8
Adjusted Earnings Per Share (cent) 89.17 84.66 86.02
Constant currency growth +5.3%

PRO-FORMA ADJUSTED EPS
2017 Full Year Results | Slide 37
Pro-forma Adjusted Earnings Per Share
Pro-forma
2017
€’m
Constant
currency
Pro-forma
2016
€’m
Pro-forma
2016
€’m
Adjusted net income 263.1 249.8 253.9
Discontinued operations adjusted net income (100%) (10.1) (27.6) (27.6)
40% of Discontinued operations adjusted net income 4.0 11.1 11.1
Adjusted net income (pro-forma) 257.0 233.3 237.4
Weighted average number of ordinary shares in issue 295,010.5 295,130.8 295,130.8
Adjusted Earnings Per Share (cent) pro-forma 87.11 79.05 80.40
Constant currency growth +10.2%
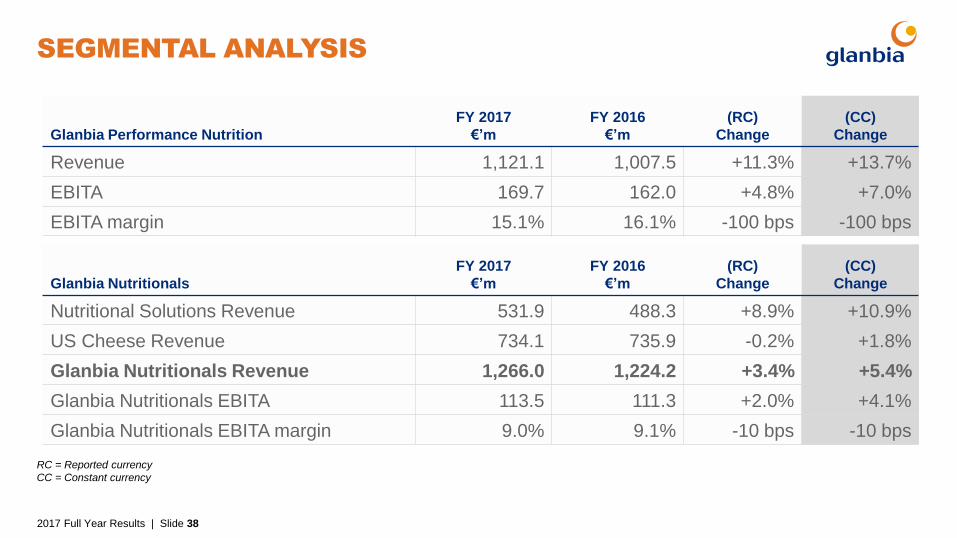
SEGMENTAL ANALYSIS
2017 Full Year Results | Slide 38
Glanbia Performance Nutrition
FY 2017
€’m
FY 2016
€’m
(RC)
Change
(CC)
Change
Revenue 1,121.1 1,007.5 +11.3% +13.7%
EBITA 169.7 162.0 +4.8% +7.0%
EBITA margin 15.1% 16.1% -100 bps -100 bps
Glanbia Nutritionals
FY 2017
€’m
FY 2016
€’m
(RC)
Change
(CC)
Change
Nutritional Solutions Revenue 531.9 488.3 +8.9% +10.9%
US Cheese Revenue 734.1 735.9 -0.2% +1.8%
Glanbia Nutritionals Revenue 1,266.0 1,224.2 +3.4% +5.4%
Glanbia Nutritionals EBITA 113.5 111.3 +2.0% +4.1%
Glanbia Nutritionals EBITA margin 9.0% 9.1% -10 bps -10 bps
RC = Reported currency
CC = Constant currency
SEGMENTAL ANALYSIS
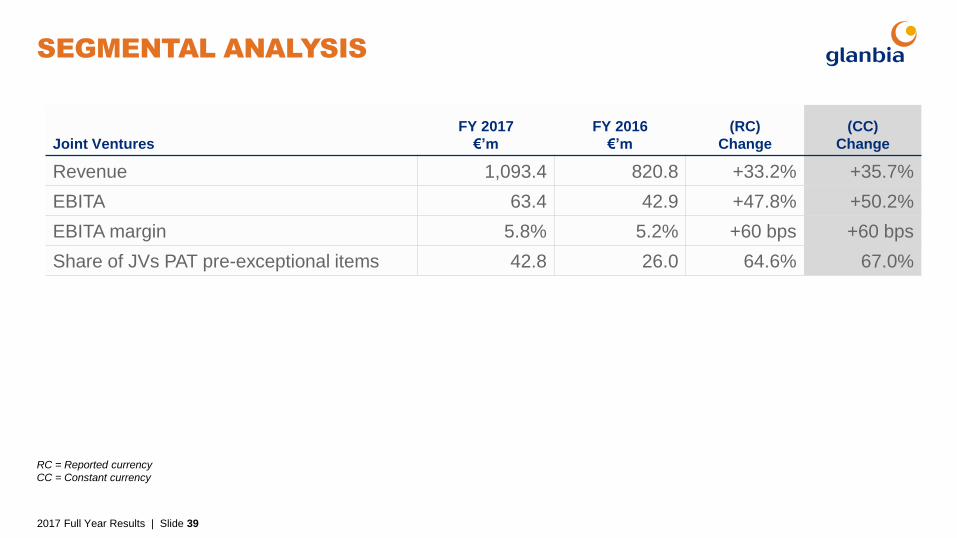
2017 Full Year Results | Slide 39
Joint Ventures
FY 2017
€’m
FY 2016
€’m
(RC)
Change
(CC)
Change
Revenue 1,093.4 820.8 +33.2% +35.7%
EBITA 63.4 42.9 +47.8% +50.2%
EBITA margin 5.8% 5.2% +60 bps +60 bps
Share of JVs PAT pre-exceptional items 42.8 26.0 64.6% 67.0%
RC = Reported currency
CC = Constant currency
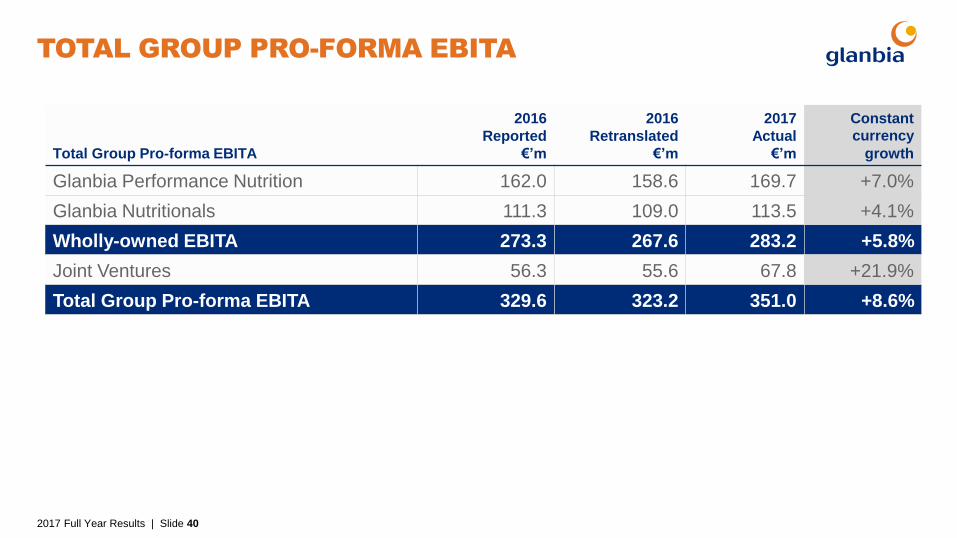
TOTAL GROUP PRO-FORMA EBITA
2017 Full Year Results | Slide 40
Total Group Pro-forma EBITA
2016
Reported
€’m
2016
Retranslated
€’m
2017
Actual
€’m
Constant
currency
growth
Glanbia Performance Nutrition 162.0 158.6 169.7 +7.0%
Glanbia Nutritionals 111.3 109.0 113.5 +4.1%
Wholly-owned EBITA 273.3 267.6 283.2 +5.8%
Joint Ventures 56.3 55.6 67.8 +21.9%
Total Group Pro-forma EBITA 329.6 323.2 351.0 +8.6%