2017 - evonik industries - specialty chemicals€¦ · 2017: building the best-in-class specialty...
TRANSCRIPT

2017
FINANCIAL REPORT

Key figures for the Evonik Group
Key figures T01
in € million 2013 2014 2015 2016 2017
Sales 12,708 12,917 13,507 12,732 14,419
Adjusted EBITDAa 1,995 1,882 2,465 2,165 2,360
Adjusted EBITDA margin in % 15.7 14.6 18.2 17.0 16.4
Adjusted EBIT b 1,404 1,256 1,752 1,448 1,490
ROCE c in % 15.1 12.5 16.6 14.0 11.2
Net income 2,054 568 991 844 717
Adjusted net income 806 782 1,128 930 1,010
Earnings per share in € 4.41 1.22 2.13 1.81 1.54
Adjusted earnings per share in € 1.73 1.68 2.42 1.99 2.17
Total assets as of December 31 15,883 15,685 17,005 19,645 19,939
Equity ratio as of December 31 in % 43.0 41.6 44.6 39.5 37.8
Cash flow from operating activities 1,055 1,066 1,971 1,769 1,551
Free cash flow d – 49 – 60 1,052 821 511
Capital expenditures e 1,140 1,123 877 960 1,078
Depreciation and amortization e 585 606 700 707 829
Net financial assets/debt as of December 31 571 400 1,098 1,111 – 3,023
Accident frequency f 0.95 1.18 0.97 1.24 1.16
Incident frequency g 1.23 1.40 1.29 0.95 1.11
Research and development expenses 394 413 434 438 458
No. of employees as of December 31 33,650 33,412 33,576 34,351 36,523
Prior-year figures restated.Figures for 2013 contain the former Real Estate segment as a discontinued operation.a Earnings before financial result, taxes, depreciation and amortization, after adjustments. b Earnings before financial result and taxes, after adjustments. c Return on capital employed. d Cash flow from operating activities, continuing operations, less cash outflows for capital expenditures on intangible assets, property, plant and equipment. e Intangible assets, property, plant and equipment. f Number of accidents involving Evonik employees and contractors’ employees under Evonik’s direct supervision per 1 million working hours. g Number of incidents involving the release of substances or energy, fire or explosion per 1 million working hours.Due to rounding, some figures in this report may not add up exactly to the totals stated.
Sales by segment C01
Nutrition & Care 31 %
Services 5 %
Performance Materials 26 %
Resource Efficiency 38 %
Sales by region a C02
a By location of customer.
Western Europe 43 %
Middle East, Africa 3 %
Asia-Pacific North 15 %
Asia-Pacific South 6 %
Central and South America 4 %
Eastern Europe 6 %North America 23 %

2 Brief profile of Evonik 5 Letter from the Chairman of the Executive Board 7 Evonik in the capital markets
9 MANAGEMENT REPORT
10 Basic information on the Evonik Group 15 Business review 33 Performance of Evonik Industries AG 36 Research & development 39 Sustainability 46 Opportunity and risk report 56 Report on expected developments
58 CORPORATE GOVERNANCE
59 Report of the Supervisory Board 66 Corporate governance report and
declaration on corporate governance (part of the management report)
75 Further information on corporate officers 79 Remuneration report
(part of the management report) 88 Takeover-relevant information
(part of the management report)
91 CONSOLIDATED FINANCIAL STATEMENTS
92 Income statement 93 Statement of comprehensive income 94 Balance sheet 96 Statement of changes in equity 97 Cash flow statement 98 Notes to the consolidated financial statements
162 SUPPLEMENTARY INFORMATION
163 Independent Auditor’s report 169 Market positions 170 Growth engines 171 Glossary 174 Alternative Performance Measures 174 Financial calendar 175 Credits
Contents

Living better with Evonik
We do quite a lot to make things better.What exactly? This selection gives an indication.
Car tires more fuel-efficient
Diapers more absorbent
Stadium seats more fade-resistant
Plastics more sustainable
Food healthier
Tablets more effective
Haircare gentler
Airplanes lighter
Car paint more scratch-resistant
Monuments more weather-proof
We make ...
The creative power of specialty chemicals
Evonik stands for appealing businesses and innovative strength. Around 80 percent of our sales come from market-leading positions.
We work in a results-focused corporate culture that is geared to profitable growth and increasing the value of the company.
Our strengths include the balanced spectrum of our business activities, end-markets, and regions as well as close collaboration with our customers.
More than 36,000 employees are bound by a claim: No product is so perfect that it couldn't be made better.
If you’d like to know what else gets better withEvonik specialty chemicals:
www.better-with-evonik.com
1880STOCKHAUSEN
1907RÖHM
1938HÜLS
1873DEGUSSA
1908SKW TROSTBERG
1847GOLDSCHMIDT
1996
1999
1989
EVONIK INDUSTRIESFINANCIAL REPORT 20172

2017: Building the best-in-class specialty chemicals company
170 years of competence in chemistry
The Evonik brand was introduced in 2007, but the Group’s historicroots go back to the first half of the 19th century.
• Strategic focus on specialty chemicals, customer-focused innovation, and a performance-oriented culture
• Growth segments strengthened by acquisitions; integration is proceeding rapidly
• Perceptible increase in volumes in the growth segments
• 5 percent organic sales growth; total sales growth 13 percent to €14.4 billion
• Forecast achieved: adjusted EBITDA €2.36 billion, in the upper half of the forecast range
• Adjusted net income up 9 percent at €1.0 billion
• Free cash flow of €511 million generated
• Outlook for 2018: slightly higher sales, adjusted EBITDA between €2.4 billion and €2.6 billion
1968RAG
2006
1999 2006 2007RAG BETEILIGUNGS AG
3BRIEF PROFILE OF EVONIK
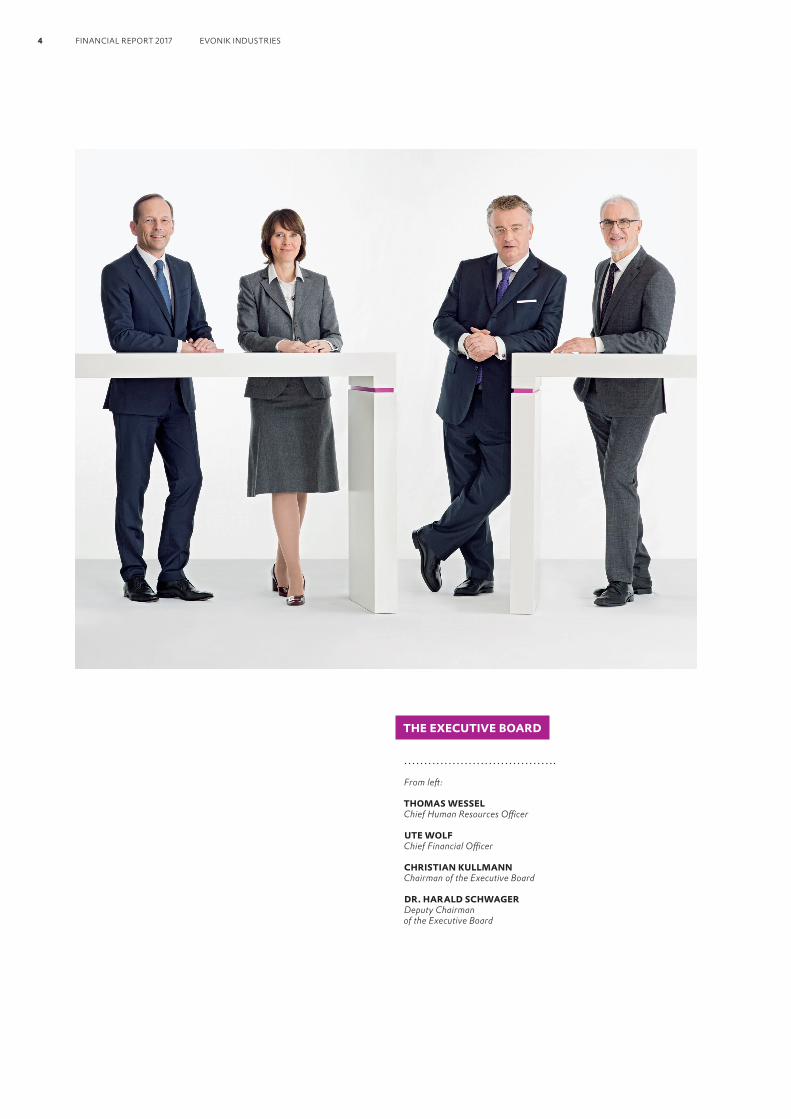
THE EXECUTIVE BOARD
From left:
THOMAS WESSELChief Human Resources Officer
UTE WOLFChief Financial Officer
CHRISTIAN KULLMANNChairman of the Executive Board
DR. HARALD SCHWAGERDeputy Chairman of the Executive Board
4 FINANCIAL REPORT 2017 EVONIK INDUSTRIES

In 2017, we celebrated Evonik Industries’ tenth anniversary. Our company has changed and developed enormously since September 12, 2007. Step by step, it has evolved from a broadly based industrial conglomerate into a focused specialty chem-icals company. Staff working for RAG, Degussa, and many other companies became Evonik employees and we now have more than 36,000 people working for us around the world. The new company that was viewed so skeptically when it was founded has turned into a successful stock corporation that enjoys the trust of the capital markets.
Our performance in 2017 shows that there is a solid basis for that trust. We grew sales 13 percent to €14.4 billion. Yet we are not focusing on growth at any price. Our goal is to develop profitably. Adjusted earnings before interest, taxes, deprecia-tion and amortization increased 9 percent to €2.36 billion, so we achieved our target here as well. Our shareholders benefit especially from this success: At the Annual Shareholders’ Meet-ing in May, the Executive Board and Supervisory Board will be proposing another attractive dividend of €1.15 per share, around 50 percent of adjusted net income per share.
Now is the time to look ahead and shape the future of Evonik, building on the company’s successful track record in the past decade. In our anniversary year, we did precisely that in many areas. Our goal is clearly defined and was communi-cated internally and externally in June 2017: We aim to be the best-in-class specialty chemicals company. That is a simple sentence but it is not a simple task.
What should we build on? First and foremost, on our innova-tive strength and on the competence of our employees. Their proximity to our customers is a key competitive advantage because we do not simply want to sell good products; we want to tailor our offerings to their specific challenges. In the future, we will therefore be aligning our ability to solve com-plex problems even more precisely to our customers’ needs.
To optimize proximity to our customers and our business, the Executive Board has invited the Chairmen of the Management Boards of our three operating segments and Technology & Infrastructure, as the heads of Evonik's operating business, to regularly attend meetings of the Executive Board and contribute their market expertise.
At the same time, we are systematically driving forward the internationalization of our company and step by step we are implementing the strategy for our six regions worldwide.
The second major lever to achieve our strategic goal is system-atically focusing Evonik on growth markets and high-margin specialty chemicals businesses. We made enormous progress here in 2017. We successfully closed the biggest acquisition in our history, the specialty additives business of the US company Air Products, and we are integrating these units into the Evonik Group quickly and smoothly. Moreover, the acquisition of the silica business of the US company J. M. Huber was completed in September. Thanks to the professional groundwork, integration is proceeding rapidly here too.
Letter from the Chairman of the Executive Board
5LETTER FROM THE CHAIRMAN OF THE EXECUTIVE BOARD

Furthermore, we acquired the Hamburg-based family-owned company Dr. Straetmans, which specializes in alternative preservatives. This is a good example of Evonik’s consistent focus on promising growth markets with stable margins.
We will be continuing our active management of Evonik’s portfolio. That applies for both further acquisitions and possible divestments, provided that the conditions are right. So ten years on, Evonik will be continuously changing and developing, moving creatively and consistently towards its goal of being best-in-class.
However, a clear strategic goal alone is not sufficient in the face of constant change. A necessary precondition for success is a corporate culture that supports and enables change. When I took office last summer, I made that cultural change a key focus, and every employee worldwide is expected to work actively to drive forward our company at all times. In particu-lar, I expect our executives to use their freedom to make decisions within our overall strategy, to take responsibility, and to act decisively.
This mindset was taken on board from the very beginning by staff at Evonik Digital GmbH, a new entity we established at the start of 2017 to seek out opportunities for Evonik in digi-talization and to develop new business models. Through its radical customer and market perspective, this company can provide key impetus for the transformation of Evonik.
We will be concentrating our efforts on our three strategic success factors—customer-focused innovative capability, active portfolio management, and an open, performance- oriented culture. We are convinced that this will also bear fruit economically. Therefore, we expect to increase earnings again in 2018 and reach an adjusted EBITDA of between €2.4 billion and €2.6 billion. At the same time, we will con-tinue to focus firmly on our profitability target: a lasting rise in our EBITDA margin to between 18 and 20 percent.
As well as market success, that requires sustained cost disci-pline. Here, we see potential for improvement at Evonik. With hindsight, not all expenditures in the past were justified by corresponding market success. In the future, we want to make sure that rising expenditures are accompanied by sales growth. We will take action consistently to curb unnecessary cost rises.
That said, Evonik will not make savings an end in itself—cost-cutting is not a substitute for strategy. Rather, we will continue to stand by our responsibility to our employees. For example, we have just agreed to extend protection against dismissal for operational reasons in Germany for a further year until the end of 2021. We are firmly convinced that we can only achieve our goal of being the best-in-class specialty chemicals company with our qualified and motivated employees around the world.
I invite you to use this publication to find out how much progress we made towards this goal in fiscal 2017.
Christian Kullmann
6 FINANCIAL REPORT 2017 EVONIK INDUSTRIES

Evonik in the capital marketsPerformance of Evonik sharesEvonik shares started 2017 at a price of €28.38 and developed solidly in the first half of the year. They also developed well relative to the benchmark indices, the MDAX and STOXX Europe 600 Chemicals. In June 2017, the Executive Board presented the company's future strategic focus, which was well received by the capital markets. The summer was dom-inated by mounting tension between the USA and North Korea and by the aftermath of Hurricane Harvey on the US Gulf coast. In this generally difficult environment, Evonik’s share price declined but from then on it mainly moved in line with
the benchmark indices. Following the low of € 27.03 on August 10, the share rebounded. Several analysts published positive valuations of the share, principally as a result of the company’s new strategy, the prospect of an improvement in cost efficiency, and the good conditions for Evonik’s business. Evonik shares reached a 2017 high of € 32.84 on December 6. Following some slight volatility in the final weeks of the year, the share price ended the year at €31.37. That was a gain of 10.5 percent over the year. The STOXX Europe 600 Chemicals rose 10.7 percent in the same period and the more broadly based MDAX index gained 15.5 percent.
Dividend payment Evonik has a long-term dividend policy aligned to continuity and reliability. At the Annual Shareholders’ Meeting on May 23, 2018, the Executive Board and Supervisory Board will propose payment of another attractive dividend of € 1.15 per share for 2017. The total dividend payment would be € 536 million, giving a payout ratio of 53 percent based on adjusted net income. With a dividend yield of around 3.7 per-cent, Evonik would remain among the leaders in the chemical industry.
Key data T02
Jan. 1 –
Dec. 31, 2017
Highest share price a in € 32.84
Lowest share price a in € 27.03
Closing price a on December 29, 2017 in € 31.37
Market capitalization a on December 29, 2017 in € billion 14.62
a Xetra trading.
Performance of Evonik shares January 1 – December 31, 2017 C03
in €
Evonik DJ STOXX Europe 600 Chemicals (indexed)
36.0
28.0
30.0
32.0
34.0
26.0
24.0
22.0
20.0Jan. MayApr.Mar.Feb. Jun. Jul. Aug. Dec.Sept. Okt. Nov.
7EVONIK IN THE CAPITAL MARKETS

A stable shareholder structureRAG-Stiftung remains Evonik’s largest shareholder with a stake of 68 percent of the capital stock. The free float is 32 percent.
Dialogue with the capital marketsEvonik continued its intensive capital markets communication in 2017. The company gave its shareholders and potential investors opportunities to gain impressions and engage in personal discussions at conferences and roadshows around the world, as well as several private investor events and field trips. Evonik’s future strategic development was a focus of the company's capital markets communication.
Analysts’ evaluations of Evonik sharesAt the end of 2017, Evonik was covered by 24 analysts. 14 of them rated the share as a buy, two as a sell, and eight issued “neutral” recommendations. During 2017, the proportion of buy recommendations improved from just over one third to more than half. The price targets ranged from € 25 to € 39, giving a median of €35.
Basic data on Evonik stock T03WKN EVNK01ISIN DE000EVNK013Ticker symbol EVKReuters (Xetra trading) EVKn.DEBloomberg (Xetra trading) EVK GYTrading segments Regulated market (Prime Standard),
Frankfurt am MainIndices
MDAX, MSCI World, DJ STOXX Europe 600 Chemicals, Dow Jones Sustainability Index
Europe, Dow Jones Sustainability Index World, FTSE4Good Global, FTSE4Good Europe,
STOXX Global ESG Leaders, MSCI World ESG Leaders Index, Socially Responsible Index MSCI
Europe, Vigeo Eiris Euronext Index – Europe 120
Solid investment grade rating confirmedBoth Moody’s and Standard & Poor’s (S&P) confirmed their credit ratings for Evonik Industries AG in the first half of 2017. The Moody’s & S&P ratings are unchanged at Baa1 and BBB+ respectively, with a stable outlook in both cases. Therefore, our solid investment grade rating was confirmed.
First hybrid bond issuedTo finance the acquisition of the Huber silica business and support our solid investment grade rating, in July 2017 we successfully placed our first hybrid bond with a nominal value of €500 million on the debt capital market.1
Inclusion in important sustainability indicesEvonik has established itself among the leaders in the chemicals sector in renowned sustainability ratings such as the Dow Jones Sustainability Indices World and Europe, oekom, Sustainalytics, and the MSCI. It is also represented in a range of SRI funds and sustainability-oriented index families. This good positioning shows that the capital markets reward Evonik’s commitment to sustainability.
Investor RelationsFor further information on our investor relations activities, visit our website at www.evonik.com/investor-relations. The financial calendar on our website provides a convenient overview of important dates. The website also contains key facts and figures, especially financial and segment data, and details of the company's structure and organization. This is supplemented by information on Evonik shares, the terms of bond issues, and an overview of our credit ratings. Current presentations, analysts’ estimates, and reports on our business per-formance are also available.
Contact: Phone +49 201 [email protected]
Analysts’ ratings C04
Buy 14
Sell 2
Hold 8
1 See section on financial position in the management report.
8 FINANCIAL REPORT 2017 EVONIK INDUSTRIES

1. Basic information on the Evonik Group 10 1.1 Business model 11 1.2 Principles and objectives 12 1.3 Business management systems 13
2. Business review 15 2.1 Overall assessment of the
economic situation 16 2.2 Economic background 16 2.3 Major events 17 2.4 Business conditions and performance 18 2.5 Comparison of forecast and
actual performance 21 2.6 Segment performance 22 2.7 Regional development 26 2.8 Earnings position 27 2.9 Financial condition 28 2.10 Asset structure 32
3. Performance of Evonik Industries AG 33
4. Research & development 36
5. Sustainability 39 5.1 Employees 41 5.2 Safety and environment 44
6. Opportunity and risk report 46 6.1 Opportunity and risk management 46 6.2 Overall assessment
of opportunities and risks 47 6.3 Market and competition
opportunities and risks 48 6.4 Legal/compliance risks
and opportunities 53 6.5 Process/organization risks 55
7. Report on expected developments 56 7.1 Economic background 56 7.2 Outlook 56
Parts of the management report included in the corporate governance chapter:
Declaration on corporate governance 66
Remuneration report 79
Takeover-relevant information 88
Combined management report for 2017 This management report is a combined management report for the Evonik Group and Evonik Industries AG.
Given the influence of the segments, statements relating to the development of the segments in the Evonik Group also apply for Evonik Industries AG. The consolidated financial statements for the Evonik Group have been prepared in accordance with the International Financial Reporting Standards (IFRS) and the financial statements of Evonik Industries AG have been prepared in accordance with the provisions of the German Commercial Code (HGB) and the German Stock Corporation Act (AktG).
The remuneration report and the takeover-relevant information pursuant to Section 315 Paragraph 4 of the German Commercial Code (HGB) are printed in the corporate governance chapter and form part of the audited combined management report. The declaration on corporate governance is also included in the corporate governance chapter and on our website at www.evonik.com/declaration-on-corporate-governance. It is an unaudited component of the combined management report.
MANAGEMENT REPORT
9CORPORATE GOVERNANCE SUPPLEMENTARY INFORMATIONCONSOLIDATED FINANCIAL STATEMENTS MANAGEMENT REPORT
Contents

o Corporate structure: three chemical segments that are close to their markets and customers
o Concentration on a balanced portfolio with four growth engines: Specialty Additives, Animal Nutrition, Smart Materials, and Health & Care
o Deep knowledge of our customers’ business, coupled with active innovation management, drives profitable and sustainable growth
o Balanced management of economic, ecological, and social factors
230
new patent applications submitted
Operations in more than
100 countries
Portfolio: more balanced
and specialty
Open and performance-
oriented cultureProfitable
growth
Customer- focused, sustainable
innovation
A specialty chemicals company focused on strong market positions, a clear innovation culture, and sustainable business activities
1. Basic information on the Evonik Group
None of our end-markets accounts for
more than
20% of sales
TARGETS
36,523 employees worldwide
10 FINANCIAL REPORT 2017 EVONIK INDUSTRIES
Volume growth > GDP
18 – 20% adjusted EBITDA margin

1.1 Business model
Evonik is one of the world's leading specialty chemicals com-panies. Our strengths include the balanced spectrum of our business activities, end-markets, and regions. Around 80 per-cent of sales come from market-leading positions1, which we are systematically expanding. Our strong competitive position is based on close collaboration with customers, high innovative capability, and integrated technology platforms.
Our specialty chemicals products make an indispensable contribution to the benefits of our customers’ products, which generate their success in global competition. Close cooperation with our customers enables us to build up a deep knowledge of their business, so we can offer products tailored to their specifications and extensive technical service. Our technology centers and customer competence centers play an important role in this around the world.
Market-oriented research and development is a key driver of profitable growth. This is based on our strong innovation culture, which is rooted in our innovation management and management development. Good ideas are rapidly recognized, driven forward, and implemented with our customers.
Highly trained employees are a key success factor. They drive forward the company on a daily basis through their hard work and identification. We have therefore developed a wide range of activities to gain and develop talented and qualified employees and to position Evonik as a preferred employer in order to retain them.
As preconditions for Evonik’s future viability, sustainable business activities and responsible conduct are cornerstones of our business model. We drive forward our sustainability activities along the value chain in close dialogue with our stakeholders. As well as our own production processes and
the products we market, we always consider the supply chain and the product benefits for our customers and their customers. We drive forward transparency and sustainability along the entire supply chain. We have observed rising demand from our customers for products that demonstrate a good balance of economic, ecological, and social factors. That opens up a broad spectrum of future-oriented business opportunities for Evonik in attractive markets. Sustainability has long been a growth driver in many of our business.
A decentralized corporate structureOur specialty chemicals operations are divided into three chemical manufacturing segments, which operate close to their markets and customers and have a high degree of entre-preneurial independence.
The Nutrition & Care and Resource Efficiency segments operate principally in attractive markets with above-average growth rates. Both segments offer customers customized, innovation-driven solutions and the aim is for them to achieve above-average, profitable growth through innovations, investments, and acquisitions.
The Performance Materials segment is characterized by processes that make intensive use of energy and raw materi-als. It therefore concentrates on integrated, cost-optimized technology platforms, efficient workflows, and economies of scale. Our strategic goal for this segment is to contribute earnings to finance the growth of the Evonik Group. In the future, investments and, where appropriate, alliances will concentrate on securing and extending our good market positions.
1 We define these as ranking 1st, 2nd or 3rd in the relevant markets.
Evonik
Nutrition & CareSegments Resource Efficiency Performance Materials Services
Corporate structure C05
Specialty chemicals for consumer goods for daily needs, animal nutrition, and healthcare products
High-performance materials and specialty additives for environment-friendly and energy- efficient system solutions for the automotive, paints, coatings, adhesives, and construction industries and many other sectors
Production of polymer materials and intermediates, mainly for the rubber, plastics, and agriculture industries
Services for internal and external customers at Evonik sites and standardized Group-wide administrative services
11
Basic information on the Evonik GroupBusiness model
CORPORATE GOVERNANCE SUPPLEMENTARY INFORMATIONCONSOLIDATED FINANCIAL STATEMENTS MANAGEMENT REPORT

Broadly diversified end-marketsMost of our customers are industrial companies that use our products for further processing. The range of markets in which they operate is diverse and balanced. None of these end-markets accounts for more than 20 percent of our sales.
Global productionEvonik has a presence in more than 100 countries and 82 per-cent of sales are generated outside Germany. We have produc-tion facilities in 28 countries on five continents and are therefore close to our markets and our customers. Our largest production sites—Marl, Wesseling and Rheinfelden (Germany), Antwerp (Belgium), Mobile (Alabama, USA), Shanghai (China), and Singapore—have integrated technology platforms used by various units.
Integrated technology platforms are a competitive advantageOur products are manufactured using highly developed technol-ogies that we are constantly refining. In many cases, Evonik has integrated production complexes where it produces key precursors for its operations in neighboring production facilities. In this way we offer our customers maximum reliability of
supply. At the same time, integrated world-scale production facilities combined with technologically demanding produc-tion processes act as high entry barriers.
1.2 Principles and objectives
Building a best-in-class specialty chemicals companyWe want to make Evonik the best-in-class specialty chemicals company. This global aspiration is closely linked to our goal of profitable growth. To increase the value of our company, our strategy has three focal areas:• A more balanced and more specialty portfolio• Customer-focused and sustainable innovation• An open and performance-oriented culture.
Our goal is to step up our focus on businesses with clear specialty chemicals characteristics. To ensure an even better balance within our portfolio and to grow where Evonik is already strong but there are especially promising prospects, our strategy concentrates on four growth engines: • Specialty Additives• Animal Nutrition• Smart Materials• Health & Care.
Capital allocation for new developments and enhancements, investment, and acquisitions will be concentrated principally on these growth engines.They each focus on different markets but they have one thing in common: They are aligned consis-tently to delivering innovative solutions for issues and devel-opments of relevance to industry and end-customers in the coming decades.
Innovation is an important driver of profitable growth at Evonik. It leverages the development of new products and applications. Within the four growth engines, Evonik has defined six innovation fields1: highly attractive new markets where we can effectively deploy our core competencies.
This is supported by a corporate culture where every employee takes responsibility for the company's success. Our corporate culture is based on trust, respect, and openness. We regard ourselves as an international company and see diversity as an opportunity. We initiate change, keep our promises, reward performance and readiness to take risks, and develop our own executives. Together with an even stronger focus on success and heightened cost-awareness, our corporate culture is a key element in our strategy.
Food and animal feed
Evonik’s end-markets C06
15 – 20 % 10 – 15 % 5 – 10 % < 5 %a Where not directly assigned to other end-customer industries.
Electrical and electronicsRenewable energiesAgriculture
Paper and printing
Other industries
Paints and coatings a
Metal and oil products
Pharmaceuticals
Plastics and rubber a
Construction
Automotive and mechanical
engineering
Consumer and personal care products
1 See section on research & development.
12 FINANCIAL REPORT 2017 EVONIK INDUSTRIES

Our sustainability strategy takes up the growth engines identified in our corporate strategy and defines areas of action geared to balanced management of economic, ecological, and social factors. We are keenly committed to expanding the contribution made by our innovative solutions to sustainable development.
Ambitious targets We aim to increase the value of our company. In parallel with the refocusing of our strategy, in 2017 we defined new financial targets to support our goal of profitable growth. • We want to achieve volume growth that exceeds global
economic growth across the economic cycle. • The adjusted EBITDA margin should be raised sustain-
ably to a level of 18 – 20 percent. Historically it has been 16 – 18 percent.
Moreover, our previous financial targets remain valid:• An appropriate return on capital (ROCE) above the cost
of capital• A sustained positive cash flow• A solid investment grade rating• An attractive dividend trend.
As a responsible specialty chemicals company, we are also continuing to pursue our ambitious non-financial targets.1
Non-financial targets for the Evonik Group T04
Accident frequencya in 2018 Below upper limit of 1.30
Incident frequencyb in 2018 Below upper limit of 1.10
Specific greenhouse gas emissions in 2020 Reduction of 12 %c
Specific water intake in 2020 Reduction of 10 %c
a Number of accidents involving Evonik employees and contractors’ employees under Evonik’s direct supervision per 1 million working hours.
b Number of incidents per 1 million working hours.c Reference base 2012.
1.3 Business management systems
Most important financial key performance indicatorsFinancial management of Evonik is based on a consistent system of value-oriented indicators. These are used to assess the business performance of the operational units and the Group. Through systematic alignment to these indicators, Evonik endeavors to create value by raising profitability and ensuring profitable growth.
We use adjusted EBITDA (i. e., EBITDA after factoring out special items) as a financial performance indicator. To track the attainment of targets, the adjusted EBITDA of the operating units is used. The adjusted EBITDA and the corre-sponding relative indicator, the adjusted EBITDA margin, show operating performance irrespective of the structure of assets and investment profile. We use this in particular for internal and external comparisons of the cost structure and profitability of our businesses.
The return on capital employed (ROCE) is used as a further indicator of value-driven management of the company. It is calculated from adjusted EBIT in relation to average capital employed. Comparison with the cost of capital, which shows the risk-adjusted return expectations of our investors, indicates
relative value creation. This is calculated using a weighted average cost of capital, which reflects the return expectations of both shareholders, derived from the capital asset pricing model, and providers of debt capital.
The special items that are factored out when calculating adjusted EBITDA and adjusted EBIT include restructuring, impairment losses/reversals of impairment losses, income and expenses in connection with the purchase/disposal of investments in companies, and other income and expense items that, due to their nature or amount, do not reflect the typical operating business. We consider that the adjusted earnings figures are more suitable than unadjusted data for comparing the performance of operating units over several periods.
We also use free cash flow as an operational performance indicator. This is calculated from the cash flow from operating activities, continuing operations, less outflows for capital expenditures on intangible assets, property, plant and equip-ment. The free cash flow is the amount that can be used for dividends, acquisitions, and to repay borrowing. It therefore shows the company’s internal financing capacity.
1 See section on safety and environment.
13CORPORATE GOVERNANCE SUPPLEMENTARY INFORMATIONCONSOLIDATED FINANCIAL STATEMENTS MANAGEMENT REPORT
Basic information on the Evonik GroupPrinciples and objectivesBusiness management systems
Most important non-financial key performance indicatorsEvonik also uses a wide variety of non-financial performance indicators. For example, our annual sustainability report1
provides information on ecological and societal issues to supplement our economic reporting.
Traditionally, we accord special significance to safety, which is regarded as a holistic management task that has to be lived at all management levels. Our guiding principles on safety are binding for staff at all levels and were reinforced in 2015 by a global safety culture initiative. In accordance with corporate policy, all units at Evonik have an occupational safety target. In addition, all production units have a plant safety target. The relevant indicators are accident frequency and incident frequency.2
1 This report is based on G4, the currently valid guidelines issued by the Global Reporting Initiative (GRI).2 See section on safety and environment.
14 FINANCIAL REPORT 2017 EVONIK INDUSTRIES

Acquisitions strengthen growth engines
2. Business review
Air Products specialty additives business
o Acquired on January 3, 2017
o Purchase price €3.5 billion
o Integrated into the Nutrition & Care and Resource Efficiency growth segments
Forecast for 2017 achieved
✓ Sales € 14.4 billion✓ Adjusted EBITDA € 2.4 billion✓ ROCE 11%✓ Capital expenditures € 1.1 billion✓ Free cash flow € 511 million
Huber silica business
o Acquired on September 1, 2017
o Purchase price € 550 million
o Strengthens the Resource Efficiency segment
Solid investment grade
rating
Adjusted EBITDA margin
16.4%
Volume growth
3%
Adjusted earnings per share
€ 2.17 Dividend
€ 1.15
per share
Adjusted net income grew 9 % to
€ 1.0 billion
15CORPORATE GOVERNANCE SUPPLEMENTARY INFORMATIONCONSOLIDATED FINANCIAL STATEMENTS MANAGEMENT REPORT
Business review

2.1 Overall assessment of the economic situation
As part of the ongoing development of our corporate strategy, we have defined four strategic growth engines within our Nutrition & Care and Resource Efficiency growth segments: Specialty Additives, Animal Nutrition, Smart Materials, and Health & Care. To improve the growth momentum of the Evonik Group, we intend to focus our acquisitions and research and development expenses on these growth engines, which have particularly promising prospects in our view.
The acquisition of the specialty additives business of Air Products and Chemicals Inc., Allentown (Pennsylvania, USA) strengthens our leading position on the attractive growth market for specialty additives. The acquisition of the silica business of J. M. Huber Corporation, Atlanta (Georgia, USA) strengths our activities in the Smart Materials growth engine. Both of the businesses acquired have business models that are similar to Evonik’s and are an ideal fit with our growth engines.
Operationally, our business developed well. Thanks to high global demand for our products, our growth segments posted volume rises that exceeded global economic growth (3.0 percent, expected). Selling prices developed differently in the segments but increased overall. Thanks to 5 percent organic sales growth and consolidation of the businesses acquired, sales grew 13 percent overall to €14,419 million. Adjusted EBITDA improved 9 percent to €2,360 million. The Resource Efficiency segment was very successful, benefiting from both higher volumes and the acquired businesses. Earnings in the Performance Materials segment were significantly better than in the previous year, mainly due to a favorable supply/demand situation. By contrast, the Nutrition & Care segment was held back by perceptibly lower selling prices.
The adjusted EBITDA margin of 16.4 percent fell short of both the prior-year level (17.0 percent) and the target mid-term range of 18 – 20 percent. ROCE was 11.2 percent, which was above the cost of capital, but it remained below the prior- year level (14.0 percent) as capital employed was significantly higher due to the acquisitions.
Net income fell 15 percent to €717 million. The reasons for this included higher expenses in connection with the acquisitions. Net income after adjustment for special items increased by 9 percent to €1,010 million, in line with the development of operating income. At the Annual Shareholders’ Meeting, the Executive Board and Supervisory Board will again propose a dividend of €1.15 per share.
Our financial profile is still very good: Evonik has a solid investment grade rating. The cash flow from operating activities was good at €1,551 million. After deduction of outflows for capital expenditures, the free cash flow was clearly positive at €511 million. At year-end 2017 we had net financial debt as a result of the acquisitions.
2.2 Economic background
Positive global economic developmentGlobal economic conditions developed better than expected in 2017. We estimate that the global economy grew by around 3.0 percent in 2017, which was faster than in the previous year (2.3 percent). At the start of the year, growth of 2.6 percent had been forecast.
Taking a regional view shows that the global upswing was broadly based. The economy picked up in the emerging markets as well as the industrialized nations.
The moderate upswing in Western Europe continued, with economies benefiting from the continuation of the European Central Bank’s expansionary monetary policy and a moderate rise in prices. In Germany, the economy was mainly driven by consumer spending, the trade surplus, and the good labor market situation.
Development of adjusted EBITDA in the Evonik Group C07
in € million
2013
2014
2015
2016
2017
500 1,000 1,500 2,000 2,500 3,0000
1,995
1,882
2,465
2,165
2,360
16 FINANCIAL REPORT 2017 EVONIK INDUSTRIES

Eastern Europe posted considerable growth overall, primarily as a result of the recent favorable development of the Russian market. The main reasons for this were the clear stabilization of the ruble and the associated reduction in inflation.
The strong growth in North America resulted principally from a rise in domestic consumption and investment by the corporate sector. In view of the good economic situation, the Federal Reserve continued its gradual tightening of monetary policy and raised key interest rates by a total of 0.75 percentage points in three steps to 1.5 percent.
A recovery is visible in Central and South America, although so far growth has been relatively low. Political uncer-tainty, high levels of unemployment and private debt, and structural problems prevented a significant improvement in the economic situation.
The Asia-Pacific region again posted high growth rates. The moderate recovery in Japan continued as a result of higher exports, while the Chinese economy stabilized, mainly thanks to an expansionary fiscal and monetary policy. Economic momentum in India was dampened by a cash reform and the introduction of a uniform nationwide value-added tax.
Stronger development of end-customer industriesWorldwide, the development of Evonik’s end-customer industries differed by region and by sector in 2017. We antici-pate that overall industrial growth was higher than in the previous year.
Demand for consumer and care products rose in Europe, driven by an improvement in consumer sentiment and falling unemployment, and remained high in Asia-Pacific. Growth momentum for food and animal feed increased in North America but weakened slightly in Central and South America. The construction industry reported slightly higher growth than in the previous year, mainly thanks to higher capital expenditures in Europe. By contrast, automotive and mechanical engineering output was lower in Asia-Pacific due to a reduc-tion in tax benefits and declined in North America.
Overall, there was an improvement in the general indus-trial trend in almost all regions of the world.
As a result of the increase in the price of crude oil and tougher environmental regulations in China at the end of the year, there was a year-on-year increase in Evonik’s average raw material prices in 2017.
The average annual exchange rate for the euro against Evonik’s most important currency—the US dollar—was US$1.13 and thus slightly higher than in the previous year (US$1.10).
2.3 Major events
On January 3, 2017, we closed the acquisition of the Air Products specialty additives business, integrated it into the Nutrition & Care and Resource Efficiency segments, and linked it to our established businesses. The acquisition of the Huber silica business was completed on September 1, 2017 and integrated into the Resource Efficiency segment.1 The integration of both businesses is proceeding on schedule. In 2017, we leveraged the first synergies of around €20 million, most of which came from the integration of the specialty additives business.
At its meeting on March 1, 2017, the Supervisory Board of Evonik Industries AG resolved on changes in the Executive Board. Dr. Klaus Engel handed over his post as Chairman of the Executive Board of Evonik Industries AG to Christian Kullmann after the Annual Shareholders’ Meeting on May 23, 2017 and left the company with effect from the end of the meeting. Dr. Ralph Sven Kaufmann left Evonik by mutual and amicable agreement on June 30, 2017, before the scheduled end of his term of office. Dr. Harald Schwager has been Deputy Chairman of the Executive Board, with responsibility for chem-icals and innovation, since September 1, 2017. Dr. Schwager is a chemist and was a member of the Board of Executive Direc-tors of BASF SE, Ludwigshafen (Germany) until May 2017.
Development of GDP 2016/2017 C08
in %
Global GDP
Western Europe
Eastern Europe
North America
Central and South America
Asia-Pacific
Middle East, Africa
– 1.0
2017 (projected) 2016
1.0 2.0 3.0 4.0 5.0
2.33.0
3.81.5
2.21.7
1.6
1.3
5.0
2.1
– 2.0
4.8
2.6
2.3
0– 2.0
1 See Note 4.2 to the consolidated financial statements.
17CORPORATE GOVERNANCE SUPPLEMENTARY INFORMATIONCONSOLIDATED FINANCIAL STATEMENTS MANAGEMENT REPORT
Business reviewEconomic backgroundMajor events

2.4 Business conditions and performance
Pleasing volume trendWe registered high demand for our products worldwide, especially in our growth segments, and were able to raise volumes sold considerably. Selling prices developed differ-ently in the segments, but improved overall. 8 percent of the increase in our sales came from the initial consolidation of the businesses acquired from Air Products and Huber. Overall, Group sales grew 13 percent to €14,419 million.
Change in sales 2017 versus 2016 T05
in %
Volumes 3
Prices 2
Organic sales growth 5
Exchange rates – 1
Portfolio/other effects 9
Total 13
Adjusted EBITDA at a good levelAdjusted EBITDA increased, driven principally by higher demand and consolidation of the acquired businesses. The adjusted EBITDA margin was 16.4 percent, down from the previous year's level of 17.0 percent.
Adjusted EBITDA by segment T06
in € million 2017 2016Change
in %
Nutrition & Care 749 1,006 – 26
Resource Efficiency 1,174 977 20
Performance Materials 660 371 78
Services 123 151 – 19
Corporate, other operations, consolidation – 346 – 340 – 2
Evonik 2,360 2,165 9
The decline in adjusted EBITDA in the Nutrition & Care seg-ment mainly resulted from perceptibly lower selling prices. The Resource Efficiency segment registered a further improvement in its adjusted EBITDA thanks to higher volumes and consolidation of the acquired businesses. The substantial rise in earnings in the Performance Materials segment was driven mainly by higher selling prices and by the successful implementation of restructuring and efficiency enhancement measures. Adjusted EBITDA in the Services segment was lower owing to higher costs at the sites. The adjusted EBITDA reported by Corporate, other operations, including consoli-dation, was around the prior-year level, and includes, among others, expenses for the Corporate Center and strategic research.
Sales and reconciliation from adjusted EBITDA to net income T07
in € million 2017 2016Change
in %
Sales 14,419 12,732 13
Adjusted EBITDA 2,360 2,165 9
Adjusted depreciation, amortization and impairment losses – 870 – 717
Adjusted EBIT 1,490 1,448 3
Adjustments – 261 – 150
thereof attributable to
Restructuring – 25 1
Impairment losses/reversals of impairment losses – 82 – 48
Acquisition/divestment of shareholdings – 89 – 46
Other – 65 – 57
Income before financial result and income taxes (EBIT) 1,229 1,298 – 5
Financial result – 202 – 174
Income before income taxes, continuing operations 1,027 1,124 – 9
Income taxes – 293 – 362
Income after taxes, continuing operations 734 762 – 4
Income after taxes, discontinued operations – 96
Income after taxes 734 858 – 14
thereof attributable to non-controlling interests 17 14
Net income 717 844 – 15
Earnings per share 1.54 1.81
18 FINANCIAL REPORT 2017 EVONIK INDUSTRIES

The adjustments totaled – €261 million, compared with – € 150 million in the previous year. The adjustment category purchase/disposal of investments contains expenses of € 164 million, costs (€ 62 million) for the acquisition and inte-gration1 of the Air Products specialty additives business, the Huber silica business, and Dr. Straetmans, as well as expenses for the consumption of inventories acquired with the busi-nesses, which were subject to purchase price step-ups in the course of the purchase price allocation (€ 102 million). This is countered by income (€ 75 million) in connection with the dissolution of a joint operation.1
The impairment losses and reversals of impairment losses related to assets in the Resource Efficiency segment (– €69 mil-lion) and the Nutrition & Care segment (– €13 million). The restructuring expenses mainly related to optimization of the administrative structure. The other adjustments included expenses in connection with the reorganization of contractual relationships at a production joint venture and expenses for simplification of the corporate structure in Europe.
The financial result of – €202 million contains special items of – €27 million, principally for impairment losses on loans to an equity investment (– €13 million) and currency hedging of the purchase price of the Huber silica business (– € 9 million). The adjusted financial result was – € 175 million, significantly below the year-back figure, mainly due to a rise in financial liabilities. Income before income taxes, continuing operations
dropped 9 percent to €1,027 million. The income tax rate of 29 percent was below the expected Group tax rate of 32 per-cent. This was primarily attributable to income resulting from the reduction in the corporation tax rate following the US tax reform. The income tax rate after factoring out taxes on spe-cial items was also 29 percent. The income after taxes, dis-continued operations of €96 million in 2016 mainly com-prised the partial reversal of a provision relating to the former Energy Business Area.
Net income fell 15 percent to €717 million mainly as a result of the acquisition-related increase in expenses con-tained in the adjustments.
We use adjusted net income to assess the earnings power of the continuing operations, especially on a long-term view, and to forecast future development. The calculation starts from EBITDA after adjustment for special items2. The financial result is then adjusted for income and expenses in connection with the purchase/disposal of equity investments and other income and expense items that, by nature or amount, do not form part of typical current financing activities. Further, we deduct amortization of intangible assets, which mainly results from acquisitions, and adjust income tax for taxes on special items.
Overall, the adjusted net income of the Evonik Group improved 9 percent to €1,010 million, in line with the develop-ment of operating earnings.
Reconciliation to adjusted net income T08
in € million 2017 2016Change
in %
Adjusted EBITDA 2,360 2,165 9
Adjusted depreciation, amortization and impairment losses – 870 – 717
Adjusted EBIT 1,490 1,448 3
Adjusted financial result – 175 – 139
Amortization and impairment losses on intangible assets 128 47
Adjusted income before income taxes a 1,443 1,356 6
Adjusted income taxes – 416 – 412
Adjusted income after taxes a 1,027 944 9
thereof adjusted income attributable to non-controlling interests 17 14
Adjusted net income a 1,010 930 9
Adjusted earnings per share a in € 2.17 1.99
a Continuing operations.
1 See Note 4.2 to the consolidated financial statements.2 See section on business management systems.
19
Business reviewBusiness conditions and performance
CORPORATE GOVERNANCE SUPPLEMENTARY INFORMATIONCONSOLIDATED FINANCIAL STATEMENTS MANAGEMENT REPORT

Improvement in the cost position initiatedTo support our financial targets, especially an improvement in the adjusted EBITDA margin, in November 2017 we announced plans to achieve a lasting reduction in selling and administrative expenses of €200 million by 2021. We have already identified savings potential of €50 million to be implemented in the course of 2018. Further details of the planned measures will be announced in 2018.
Efficient and effective procurement Reliable supply, gaining access to new procurement markets, and ongoing optimization of material costs are key tasks for our procurement function.
2017 was dominated by very volatile procurement markets and rising oil prices. The reasons for this included geopolitical tension in the Middle East, hurricanes such as Harvey in the USA, and the Chinese government’s tougher stance on environ-mental policy. This led to unforeseeable production stoppages in the supply chain and global price rises in some procurement markets. We essentially managed to secure supply to our sites through close cooperation with the suppliers affected and by drawing on alternative suppliers. Since we take environmental and sustainability aspects into account when selecting suppliers, none of our direct suppliers was affected by plant closures caused by Chinese environmental policy.
To optimize material costs, Procurement pursues a total-cost-of-ownership (TOC) approach, taking cross-unit aspects into account. This enables us to leverage savings potential along the value chain. Close collaboration with the business entities is a key success factor for efficient and effective procurement processes.
We continued to optimize our procurement processes in 2017. In particular, we made substantial progress in optimiz-ing the end-to-end process from order to payment and achieved a considerable increase in the automation rate.
As well as participating in procurement alliances with other companies and validating new suppliers, we are working intensively to extend strategic relationships with suppliers. Here we are looking for additional opportunities to reduce risk, optimize costs, and enhance cooperation and innovation with the suppliers that are currently of the greatest strategic importance. We are aware of our responsibility within the supply chain. Issues such as safety, health, environmental protection, corporate responsibility, and quality play an inte-gral part in our procurement strategy. These sustainability
aspects are also supported by standardized global assess-ments through the Together for Sustainability (TfS) sector initiative, which was co-founded by Evonik. Evonik’s principal suppliers and the majority of suppliers of critical raw materials have already taken part in these assessments, which are eval-uated by an impartial sustainability rating company.
In 2017, Evonik spent around €9.1 billion on raw materials and supplies, technical goods, services, energy, and other operating supplies. Raw materials and supplies make up around 60 percent of procurement volume. Spending on petro-chemical feedstocks is around €3.6 billion and accounts for 66 percent of our raw material base.
Using renewable resources remains very important to Evonik. In 2017, around 9 percent of raw materials were from renewable resources. The main applications for these raw mate-rials are amino acids and starting products for the cosmetics industry.
Another good return on capital employedWithin our value-oriented management approach, our suc-cess is measured principally by ROCE, which was 11.2 percent in 2017 and therefore above our cost of capital. In our regular review in 2017, the cost of capital was adjusted to 10.0 per-cent before taxes (2016: 10.5 percent).
Capital employed, ROCE, and Economic Value Added (EVA) T09
in € million 2017 2016
Intangible assets 5,476 3,231
+ Property, plant and equipment 6,300 5,851
+ Investments 46 49
+ Inventories 1,928 1,699
+ Trade accounts receivable 1,850 1,749
+ Other interest-free assets 500 402
– Interest-free provisions – 979 – 1,072
– Trade accounts payable – 1,271 – 1,013
– Other interest-free liabilities – 577 – 563
= Capital employed a 13,273 10,333
Adjusted EBIT 1,490 1,448
ROCE (adjusted EBIT/capital employed) in % 11.2 14.0
Cost of capital (capital employed * WACC) 1,327 1,033
EVA (adjusted EBIT – cost of capital) 163 415
a Annual averages.
20 FINANCIAL REPORT 2017 EVONIK INDUSTRIES

The average capital employed increased by €3.0 billion to €13.3 billion. The acquisitions made a key contribution to this as they led to substantial increases, especially in intangible assets, property, plant and equipment, and inventories.
The higher capital employed was the reason for the decline in ROCE at Group level and in the growth segments. The hidden reserves identified in connection with the acqui-sitions contributed to this.
ROCE by segment T10
in % 2017 2016
Nutrition & Care 10.9 26.8
Resource Efficiency 20.8 27.1
Performance Materials 41.2 18.3
Services – 0.2 5.6
Evonik (including Corporate, other operations) 11.2 14.0
In the three chemical segments, ROCE is above the cost of capital. In the Resource Efficiency and Performance Materials ROCE was well above average.
Clear value creationEconomic Value Added (EVA) is the difference between adjusted EBIT and the cost of capital, which is calculated by multiplying average capital employed by the average cost of capital (WACC). If EVA is positive, the Group creates value (value spread approach). In 2017, we generated EVA of €163 million. The substantial reduction of €252 million com-pared with the previous year was attributable to the rise in capital employed.
2.5 Comparison of forecast and actual performance
We almost entirely met our forecasts. Only incident frequency (1.11) was minimally above the expected upper limit of 1.10.1
Comparison of forecast and actual performance T11
Forecast performance indicators 2016 Forecast for 2017Adjusted forecast
for 2017a 2017 Forecast for 2018
Group sales €12.7 billionYear-on-year in-crease €14.4 billion Slight increase
Adjusted EBITDA €2.165 billionBetween €2.2 billion and €2.4 billion
Upper half of the range €2.360 billion
Between €2.4 billion and €2.6 billion
ROCE 14.0 %
Above the cost of capital, significant decline 11.2 %
Above the cost of capital, about level with the prior year
Capital expendituresb €1.0 billion Around €1.0 billion €1.1 billion Around €1.0 billion
Free cash flow €0.8 billion
Clearly positive, but perceptibly below the prior year €0.5 billion
Slightly above the prior year
Accident frequency 1.24Stable and below upper limit of 1.30 1.16
Stable and below upper limit of 1.30
Incident frequencyc 0.95Below upper limit of 1.10 1.11
Below upper limit of 1.10
a In the financial report for the first nine months of 2017. b Capital expenditures for intangible assets, property, plant and equipment. c Redefined in 2017 and restated to ensure comparability.
1 See section on safety and environment.
21CORPORATE GOVERNANCE SUPPLEMENTARY INFORMATIONCONSOLIDATED FINANCIAL STATEMENTS MANAGEMENT REPORT
Business reviewBusiness conditions and performanceComparison of forecast and actual performance

2.6 Segment performance
Nutrition & Care segment
Key data for the Nutrition & Care segment T12
in € million 2017 2016Change
in %
External sales 4,511 4,316 5
Adjusted EBITDA 749 1,006 – 26
Adjusted EBITDA margin in % 16.6 23.3 –
Adjusted EBIT 465 795 – 42
Capital expenditures a 391 315 24
Depreciation and amortization 262 209 25
Capital employed (annual average) 4,263 2,965 44
ROCE in % 10.9 26.8 –
No. of employees as of December 31 8,257 7,594 9
a Capital expenditures for intangible assets, property, plant and equipment.
Acquisitions lifted salesIn the Nutrition & Care segment, sales advanced 5 percent to €4,511 million. This was principally due to the first-time con-solidation of the business acquired from Air Products and of Dr. Straetmans. High global demand led to a perceptible rise in volumes. However, this was countered by the fact that sell-ing prices were substantially lower than in the prior-year period.
In essential amino acids for animal nutrition, selling prices for methionine were lower than in the previous year. Evonik used the more favorable market environment in the second half of the year to raise selling prices. However, sales declined significantly because the average market price level was sig-nificantly lower than in the previous year and volumes were basically constant. In the healthcare business, a very successful performance was posted by functional polymers for smart drug delivery systems for oral and parenteral pharmaceutical
applications and by exclusive synthesis for the pharmaceutical industry. Personal care products increased sales of active ingredients and emulsifiers. The integration of Dr. Straetmans is proving very successful and also contributed to the sales growth in this business line. Sales of household care products increased significantly thanks to buoyant demand and the inclusion of the Air Products activities. Higher volumes and inclusion of the Air Products activities also brought a significant increase in sales of additives for polyurethane foam, which are used, for example, in mattresses and in insulating materials.
Adjusted EBITDA lower than in the prior yearAdjusted EBITDA in the Nutrition & Care segment declined 26 percent to €749 million. This decline was due principally to lower selling prices. The adjusted EBITDA margin slipped from a very good level of 23.3 percent in the previous year to 16.6 percent.
2013: old structure.
Development of sales in the Nutrition & Care segment C09
in € million
2013
2014
2015
2016
2017
1,000 2,000 3,000 4,000 5,000 6,0000
4,171
4,075
4,924
4,316
4,511
2013: old structure.
Development of adjusted EBITDA in the Nutrition & Care segment C10
in € million
2013
2014
2015
2016
2017
400 800 1,200 1,6000
922
847
1,435
1,006
749
22 FINANCIAL REPORT 2017 EVONIK INDUSTRIES

Higher capital expenditures Capital expenditures in the Nutrition & Care segment increased 24 percent to €391 million and were again well above depre-ciation and amortization, which was €262 million. The average capital employed increased significantly to €4,263 million, mainly as a result of the acquisition of the Air Products business and Dr. Straetmans. The sharp drop in ROCE to 10.9 percent resulted from far higher capital employed and lower earnings.
Investment projects to drive growthNutrition & Care invested a high double-digit million euro amount in the construction of a new production plant for specialty silicones in Shanghai (China). Organically modified specialty silicones are part of the Specialty Additives growth engine and offer a broad spectrum of potential applications in many industries. As polymer additives, they ensure comfortable upholstered furniture, auto seats, and ergonomic mattresses. They also play an important part in formulations for insulating
materials for buildings and ensure the energy efficiency of refrigerators. The silicone platforms are the backbone of significant business activities in the Nutrition & Care and Resource Efficiency segments.
At the site in Tippecanoe (USA), Nutrition & Care invested a double-digit million euro amount to extend its production facilities for highly potent active ingredients. The market for contract development and manufacturing of pharmaceutical products is still very attractive and supports the positive devel-opment of the healthcare business.
In view of the strong growth in the market for methionine, Nutrition & Care is currently building a further world-scale production complex in Singapore, alongside the facility on Jurong Island that came into service in November 2014. This investment strengthens the Animal Nutrition growth engine. In this new, fully backwardly integrated production complex, as well, the Nutrition & Care segment will produce all key strategic precursors.
Resource Efficiency segment
Key data for the Resource Efficiency segment T13
in € million 2017 2016Change
in %
External sales 5,395 4,473 21
Adjusted EBITDA 1,174 977 20
Adjusted EBITDA margin in % 21.8 21.8 –
Adjusted EBIT 886 751 18
Capital expenditures a 340 266 28
Depreciation and amortization 281 224 25
Capital employed (annual average) 4,262 2,776 54
ROCE in % 20.8 27.1 –
No. of employees as of December 31 10,260 8,928 15
a Capital expenditures for intangible assets, property, plant and equipment.
Perceptible volume growth The Resource Efficiency segment posted a successful perfor-mance, with sales growing 21 percent to €5,395 million. There was a further substantial hike in volume sales, driven by higher demand. Slightly higher selling prices also had a positive effect. 13 percentage points of the increase came from con-solidation of the operations acquired from Air Products and Huber.
Silica benefited from higher demand, especially from the tire industry, and from consolidation of the Huber business, lead-ing to significantly higher sales. Crosslinkers developed well worldwide. These products are mainly used in environment-
friendly paint systems/coatings, high-performance composites, and specialty plastics. Including consolidation of the Air Prod-ucts business, sales were significantly higher. Coating addi-tives, which mainly offer applications solutions for coating technologies, increased sales substantially thanks to higher volumes and consolidation of the Air Products business. The business with high-performance polymers was pleasing, with high demand from the automotive sector, the electrical and electronics industry, and the consumer market bringing an increase in sales. Demand for oil additives for the automotive, construction, and transportation industries was high world-wide, resulting in a considerable year-on-year rise in sales.
23
Business reviewSegment performance
CORPORATE GOVERNANCE SUPPLEMENTARY INFORMATIONCONSOLIDATED FINANCIAL STATEMENTS MANAGEMENT REPORT
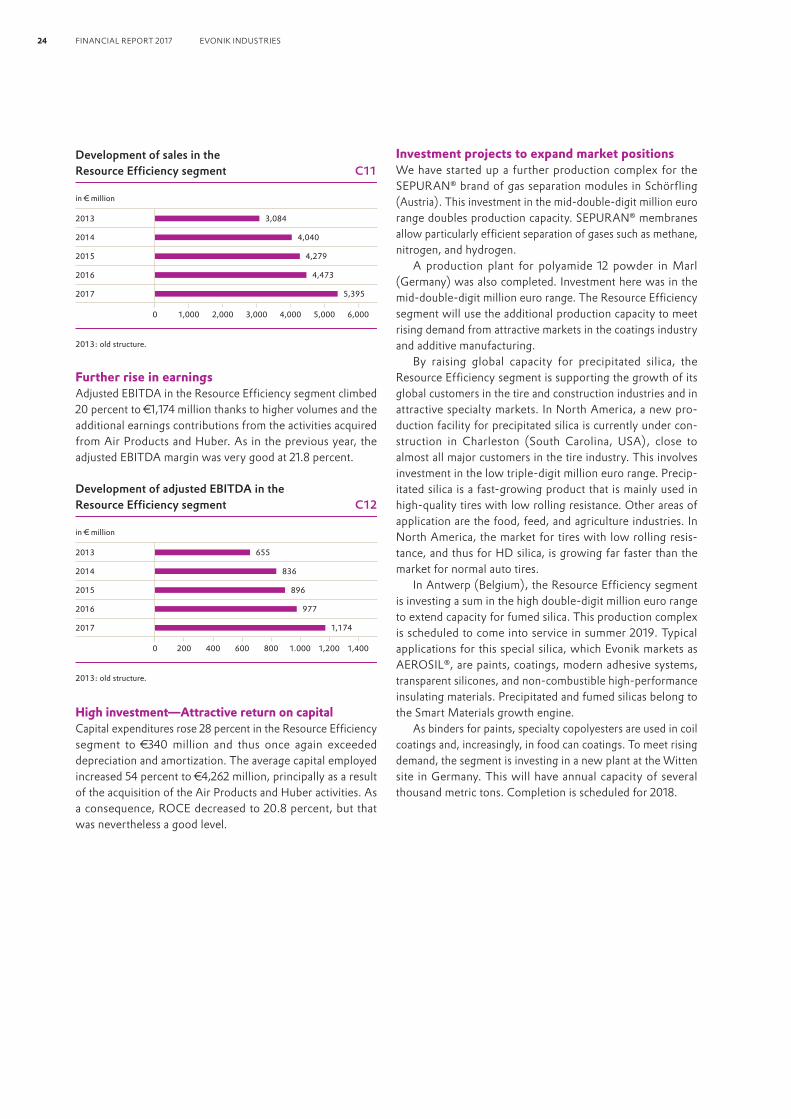
Further rise in earningsAdjusted EBITDA in the Resource Efficiency segment climbed 20 percent to €1,174 million thanks to higher volumes and the additional earnings contributions from the activities acquired from Air Products and Huber. As in the previous year, the adjusted EBITDA margin was very good at 21.8 percent.
High investment—Attractive return on capitalCapital expenditures rose 28 percent in the Resource Efficiency segment to €340 million and thus once again exceeded depreciation and amortization. The average capital employed increased 54 percent to €4,262 million, principally as a result of the acquisition of the Air Products and Huber activities. As a consequence, ROCE decreased to 20.8 percent, but that was nevertheless a good level.
Investment projects to expand market positionsWe have started up a further production complex for the SEPURAN brand of gas separation modules in Schörfling (Austria). This investment in the mid-double-digit million euro range doubles production capacity. SEPURAN membranes allow particularly efficient separation of gases such as methane, nitrogen, and hydrogen.
A production plant for polyamide 12 powder in Marl (Germany) was also completed. Investment here was in the mid- double-digit million euro range. The Resource Efficiency segment will use the additional production capacity to meet rising demand from attractive markets in the coatings industry and additive manufacturing.
By raising global capacity for precipitated silica, the Resource Efficiency segment is supporting the growth of its global customers in the tire and construction industries and in attractive specialty markets. In North America, a new pro-duction facility for precipitated silica is currently under con-struction in Charleston (South Carolina, USA), close to almost all major customers in the tire industry. This involves investment in the low triple-digit million euro range. Precip-itated silica is a fast-growing product that is mainly used in high-quality tires with low rolling resistance. Other areas of application are the food, feed, and agriculture industries. In North America, the market for tires with low rolling resis-tance, and thus for HD silica, is growing far faster than the market for normal auto tires.
In Antwerp (Belgium), the Resource Efficiency segment is investing a sum in the high double-digit million euro range to extend capacity for fumed silica. This production complex is scheduled to come into service in summer 2019. Typical applications for this special silica, which Evonik markets as AEROSIL, are paints, coatings, modern adhesive systems, transparent silicones, and non-combustible high-performance insulating materials. Precipitated and fumed silicas belong to the Smart Materials growth engine.
As binders for paints, specialty copolyesters are used in coil coatings and, increasingly, in food can coatings. To meet rising demand, the segment is investing in a new plant at the Witten site in Germany. This will have annual capacity of several thousand metric tons. Completion is scheduled for 2018.
2013: old structure.
Development of sales in the Resource Efficiency segment C11
in € million
2013
2014
2015
2016
2017
1,000 2,000 3,000 4,000 5,000 6,0000
3,084
4,040
4,279
4,473
5,395
2013: old structure.
Development of adjusted EBITDA in the Resource Efficiency segment C12
in € million
2013
2014
2015
2016
2017
400 600200 1.000800 1,200 1,4000
655
836
896
977
1,174
24 FINANCIAL REPORT 2017 EVONIK INDUSTRIES

Performance Materials segment
Key data for the Performance Materials segment T14
in € million 2017 2016Change
in %
External sales 3,781 3,245 17
Adjusted EBITDA 660 371 78
Adjusted EBITDA margin in % 17.5 11.4 –
Adjusted EBIT 508 234 117
Capital expenditures a 163 168 – 3
Depreciation and amortization 139 134 4
Capital employed (annual average) 1,233 1,278 – 4
ROCE in % 41.2 18.3 –
No. of employees as of December 31 4,364 4,393 – 1
a Capital expenditures for intangible assets, property, plant and equipment.
Considerably higher salesSales rose 17 percent to €3,781 million in the Performance Materials segment. The primarily price-driven rise in sales was mainly attributable to a boom in C4 business, concentration on attractive market segments, and new areas of application. The slightly lower volumes were mainly attributable to an unplanned shutdown in Antwerp (Belgium) in the second quarter of 2017.
Sales of performance intermediates rose substantially year-on-year, mainly because the average selling prices for the year were higher, especially for the C4 derivative butadiene. Methacrylates also registered a significant improvement in sales. Demand remained pleasing, especially from the coatings and automotive sectors, while supply on the market was tight. Alkoxides for the production of biodiesel posted a very good performance, with higher volumes leading to a percep-tible rise in sales.
Hike in adjusted EBITDAAdjusted EBITDA rose 78 percent to €660 million. Alongside higher selling prices and concentration on high-margin cus-tomer and product combinations, the focused implementation of restructuring projects and measures to improve the cost
structure had a positive effect. The adjusted EBITDA margin increased to 17.5 percent (2016: 11.4 percent).
Investment at prior-year level—Attractive return on capital Investment in the Performance Materials segment aims to secure its leading market positions, raise efficiency, and broaden the technology base. Capital expenditures amounted to €163 million, above depreciation and amortization, which was €139 million. The average capital employed was reduced by €45 million to €1,233 million. ROCE rose to an attractive level of 41.2 percent, principally as a result of the significant improvement in earnings.
Focused investmentTo ensure sustainable and reliable long-term supply of potas-sium derivatives to customers, Evonik established a production joint venture with AkzoNobel to build and operate a membrane electrolysis plant for chlorine and potassium hydroxide solution in Ibbenbüren (Germany). Production started at the end of 2017.
In Weiterstadt (Germany), Performance Materials is building a new production facility for high-quality flat films made from multi- layer polymethylmethacrylate (PMMA). This is scheduled to come into service at the end of 2018. Multi-layer PLEXIGLAS and EUROPLEX films are used in medical technology, in window and façade construction, and in the graphics industry.
2013: old structure.
Development of sales in the Performance Materials segment C13
in € million
2013
2014
2015
2016
2017
1,000 2,000 3,000 4,000 5,0000
4,490
3,827
3,435
3,245
3,781
2013 in alter Struktur.
Development of adjusted EBITDA in the Performance Materials segment C14
in € million
2013
2014
2015
2016
2017
200 300100 500400 600 7000
552
325
309
371
660
25
Business reviewSegment performance
CORPORATE GOVERNANCE SUPPLEMENTARY INFORMATIONCONSOLIDATED FINANCIAL STATEMENTS MANAGEMENT REPORT

Services segment
Key data for the Services segment T15
in € million 2017 2016Change
in %
External sales 716 683 5
Adjusted EBITDA 123 151 – 19
Adjusted EBITDA margin in % 17.2 22.1 –
Adjusted EBIT – 1 32 –
Capital expenditures a 162 189 – 14
Depreciation and amortization 124 117 6
Capital employed (annual average) 652 572 14
ROCE in % – 0.2 5.6 –
No. of employees as of December 31 13,021 12,892 1
a Capital expenditures for intangible assets, property, plant and equipment.
The Services segment generates sales both internally, with the specialty chemicals segments and Corporate Center (2017: €2,081 million), and with external customers. External sales advanced 5 percent to €716 million. This was mainly due to higher revenues from procurement and energy supply for exter-nal customers at our sites. Adjusted EBITDA was 19 percent
lower than in the previous year at €123 million. The decline was due, among other things, to higher expenses at the sites.
Capital expenditures in this segment decreased by 14 per-cent to €162 million and therefore exceeded depreciation and amortization, which amounted to €124 million.
2.7 Regional development
Strategic reorganization of the regionsEvonik adjusted its regional structure in 2017. Global market requirements are becoming increasingly more specific and require more differentiated management.
For this reason, we adjusted the regional structure to align it more closely to these new requirements. At the same time, the entrepreneurial freedom of the regions was strengthened. Their role is to enable the operating business to make the best possible use of local market opportunities by providing efficient, competitive, and compliant platforms.
The objective of this altered structure is to ensure a more focused response to future challenges and timely identification and utilization of growth opportunities throughout the world.
A global presenceIn 2017, 43 percent of our sales were generated in Western Europe. That was a year-on-year increase of 13 percent to
€6,253 million. The acquisition of the Air Products specialty additives business and the Huber silica business contributed to this.
To strengthen the sites in Western Europe, we increased capital expenditures to €576 million (2016: €538 million). A production facility for polyamide 12 powder was completed at our site in Marl (Germany). In Ibbenbüren (Germany), a pro-duction joint venture established with AkzoNobel started up a membrane electrolysis plant for chlorine and potassium hydroxide solution. Another complex for the production of gas separation membrane modules was constructed in Austria.
In Eastern Europe, sales increased 9 percent to €837 million. In particular, the Resource Efficiency and Performance Materials segments were able to increase sales. This region accounted for 6 percent of Group sales.
In the Middle East and Africa region, sales rose 4 percent to €421 million, which was 3 percent of Group sales.
26 FINANCIAL REPORT 2017 EVONIK INDUSTRIES

Higher sales in the AmericasWe generated sales of €3,303 million in North America. Acquisitions helped drive the 22 percent increase versus the prior year. This region accounted for 23 percent of total sales. Capital expenditures rose 5 percent to €254 million. In Tippe-canoe (USA), the production facilities for highly potent active pharmaceutical ingredients were extended.
Sales declined 2 percent in Central and South America to €551 million. This region accounted for 4 percent of Group sales.
Higher investment in the Asia-Pacific regionSales increased 11 percent to €2,158 million in Asia-Pacific North. This region accounted for 15 percent of Group sales. Capital expenditures in this region totaled €61 million. A new production facility for organically modified specialty silicones was constructed in Shanghai (China).
Sales in Asia-Pacific South rose 10 percent to €896 million, which was 6 percent of Group sales. Capital expenditures increased to €173 million (2016: €62 million). An additional world-scale production complex for methionine is currently under construction in Singapore.
2.8 Earnings position
Income before income taxes, continuing operations down slightly year-on-yearSales grew 13 percent to €14.4 billion, principally as a result of higher volumes and initial consolidation of the businesses acquired from Air Products and Huber. The rise in the cost of sales was driven mainly by consolidation of the new busi-nesses, higher volumes, and the increase in raw material costs. The higher selling expenses were mainly due to the expansion of our business, while administrative expenses increased as a result of consolidation of the acquired busi-nesses. Other operating income includes income in connection
with the dissolution of a joint operation. The increase in other operating expense was mainly attributable to the acqui-sitions. It included expenses resulting from the fact that the value of inventories acquired by Evonik with these businesses and used in 2017 was subject to step-ups in the course of the purchase price allocation ( €102 million), as well as costs in connection with the acquisitions ( €62 million). Income before financial result and income taxes was 5 percent lower at €1,229 million, principally because of higher expenses in connection with the acquisitions.
Sales by region C15
North America
Eastern Europe
Asia- Pacific North
Asia- Pacific SouthCentral & South America
3.3
0.5
Western Europe6.3 0.8
0.9
2.2
Middle East & Africa 0.4
in € billion
27CORPORATE GOVERNANCE SUPPLEMENTARY INFORMATIONCONSOLIDATED FINANCIAL STATEMENTS MANAGEMENT REPORT
Business reviewRegional developmentEarnings position

Income statement for the Evonik Group T16
in € million 2017 2016Change
in %
Sales 14,419 12,732 13
Cost of sales – 9,938 – 8,534 16
Gross profit on sales 4,481 4,198 7
Selling expenses – 1,695 – 1,515 12
Research and development expenses – 458 – 438 5
General administrative expenses – 732 – 686 7
Other operating income 311 321 – 3
Other operating expense – 688 – 543 27
Result from investments recognized at equity 10 – 39 –
Income before financial result and income taxes, continuing operations 1,229 1,298 – 5
Financial result – 202 – 174 16
Income before income taxes, continuing operations 1,027 1,124 – 9
Income taxes – 293 – 362 – 19
Income after taxes, continuing operations 734 762 – 4
Income after taxes, discontinued operations – 96 –
Income after taxes 734 858 – 14
thereof attributable to non-controlling interests 17 14 21
Shareholders of Evonik Industries AG (net income) 717 844 – 15
Lower net income The financial result includes special items totaling – €27 million, mainly for impairment losses on loans to an equity investment (– €13 million) and currency hedging of the purchase price of the Huber silica business (– €9 million). Income before income taxes, continuing operations decreased 9 percent to €1,027 million. Income taxes declined to €293 million, mainly due to income resulting from the reduction in the income tax rate following the US tax reform. Non-controlling interests in
after-tax income comprised the pro rata profits and losses of fully consolidated subsidiaries that are attributable to share-holders outside the Evonik Group. The income after taxes, discontinued operations of €96 million in 2016 mainly com-prised the partial reversal of a provision relating to the former Energy Business Area.
Group net income was 15 percent lower at €717 million, mainly because of higher expenses in connection with the acquisitions.
2.9 Financial condition
Central financial managementThe principal objectives of financial management are safe-guarding the financial independence of the Evonik Group and limiting financial risks. We therefore apply a central financing strategy. Borrowing and bond issuance are normally under-taken by Evonik Industries AG or its financing company Evonik Finance B.V., Amsterdam (Netherlands). The liabilities of this company are fully guaranteed by Evonik Industries AG. To reduce external borrowing, surplus liquidity at Group compa-nies is placed in a cash pool at Group level to cover financing requirements in other Group companies through intragroup loans. Currency derivatives are used at Group level to hedge intragroup loans. Evonik has a flexible range of corporate
financing instruments to meet liquidity requirements for day-to- day business, investments, and the repayment of financial debt.
Solid investment grade rating confirmedBoth Moody’s and Standard & Poor’s (S&P) confirmed their credit ratings for Evonik Industries AG in 2017. Moody’s rating is still Baa1 and S&P still rates Evonik BBB+, with a stable out-look in both cases. Maintaining a solid investment grade rating is a central element in our financing strategy. In this way we gain access to a broad investor base on appropriate financing terms and thus maintain our financial flexibility. A solid invest-ment grade rating gives banks, investors, customers, and sup-pliers a reliable basis for a long-term business relationship with Evonik.
28 FINANCIAL REPORT 2017 EVONIK INDUSTRIES

Solid funding of pension obligationsPension provisions account for about half of our total debt. They are non-current and depend on the discount rate. Applying a constant discount rate, there was a slight reduc-tion of €35 million in pension provisions compared with year-end 2016. The financing of pension obligations1 was 70 per-cent as of the reporting date, a solid level in line with the industry norm.
Net financial debt due to acquisitionsAs of December 31, 2017, financial debt was €4,045 million, a rise of €498 million compared with year-end 2016, principally as the result of the issue of a hybrid bond. Financial assets decreased by €3,636 million to €1,022 million, mainly as a result of payment of the purchase price of around €3.5 billion for the Air Products specialty additives business and payment of the dividend of €536 million for 2016. This was countered by the positive free cash flow2 of €511 million. Net financial debt was therefore €3,023 million as of end-December 2017, compared with net financial assets of €1,111 million at year-end 2016.
Net financing status T17
in € millionDec. 31,
2017Dec. 31,
2016
Non-current financial liabilities a – 3.694 – 3.240
Current financial liabilities a – 351 – 307
Financial debt – 4.045 – 3.547
Cash and cash equivalents 1.004 4.623
Current securities 9 11
Other financial investments 9 24
Financial assets 1.022 4.658
Net financial debt/assets as stated on the balance sheet – 3.023 1.111
a Excluding derivatives.
First hybrid bond issuedOn July 7, 2017, Evonik Industries AG issued a hybrid bond with a nominal value of €500 million on the debt capital mar-ket for the first time. It was used to finance the acquisition of the Huber silica business. The hybrid bond is recognized as debt, but the Moody’s and S&P rating agencies regard it as
50 percent equity as it is subordinate to other financial liabil-ities. Consequently, it supports our solid investment grade rating. The formal tenor of the bond is 60 years, but Evonik has a first redemption right in 2022. The issue price was 99.383 percent and it has a coupon of 2.125 percent p. a.
Corporate bonds as a central financing instrumentAt year-end 2017, the financial debt of €4,045 million com-prised six bonds with a total carrying amount of €3,624 mil-lion, decentralized bank loans totaling €350 million, and other financial liabilities of €71 million. On the reporting date, €3.15 billion of the debt issuance program of up to €5 billion had been used to issue bonds.
Around 94 percent of the Group's non-derivative financial liabilities are denominated in euros (2016: over 90 percent). Financial liabilities in other currencies result exclusively from local financing of foreign Group companies, especially in China. The use of currency derivatives aims to ensure that Evonik’s global operating activities are financed in the corresponding currencies. Including these currency derivatives, around 41 percent of financial liabilities are denominated in euros, 34 percent in US dollars, 16 percent in Chinese renminbi yuan (CNY), 6 percent in Singapore dollars (SGD), and 3 percent in other currencies.
1 Ratio of plan assets to pension obligations.2 Cash flow from operating activities, less outflows for capital expenditures for intangible assets, property, plant and equipment.
Maturity profile of financial liabilities C16
in € million
2018
2019
2020
2021
2022
2023
2024
2025
2026
2027
2028 ff.
As of December 31, 2017.The hybrid bond is included in 2022 (when Evonik has its first right of redemption).
200 400 600 8000
29
Business reviewFinancial condition
CORPORATE GOVERNANCE SUPPLEMENTARY INFORMATIONCONSOLIDATED FINANCIAL STATEMENTS MANAGEMENT REPORT

Bonds T18
Nominal value
in € millionRating
(S&P/Moody’s) MaturityCoupon
in %Issue price
in %
Evonik Industries AG
Fixed-interest bond 2013/2020a 500 BBB+/Baa1 April 8, 2020 1.875 99.185
Fixed-interest bond 2015/2023a 750 BBB+/Baa1 Jan. 23, 2023 1.000 99.337
Hybrid bond 2017/2077 500 BBB –/Baa3 July 7, 2077 2.125 99.383
Evonik Finance B. V.
Fixed-interest bond 2016/2021a 650 BBB+/Baa1 Mar. 8, 2021 0.000 99.771
Fixed-interest bond 2016/2024a 750 BBB+/Baa1 Sep. 7, 2024 0.375 99.490
Fixed-interest bond 2016/2028a 500 BBB+/Baa1 Sep. 7, 2028 0.750 98.830
a Issued through the debt issuance program.
Liquidity position remains strongAs of December 31, 2017, Evonik had cash and cash equiva-lents amounting to €1,004 million. Alongside cash and cash equivalents and investments in current securities, Evonik’s central source of liquidity is a €1.75 billion revolving credit facility. On June 20, 2017, we refinanced this credit line at the same amount with 18 national and international banks. The new credit line has an initial term running until 2022 with two extension options of one year each, so it runs until June 2024 at the latest. It was not utilized in 2017 and does not contain any covenants requiring Evonik to meet specific financial ratios.
In addition, there are various credit lines to meet local requirements, especially in the Asia-Pacific region. As of December 31, 2017, €306 million of the total amount had not been drawn. Higher capital expendituresIn the specialty chemicals sector Evonik is expanding in busi-ness areas and markets where it already has—or intends to build—a strong competitive position. Investment projects are
aimed at utilizing potential for sustained profitable growth and value creation. Every project undergoes detailed strategic and economic analyses. In addition, there is a minimum return requirement for every project based on Evonik’s cost of capital. We take a flexible and disciplined approach to extending our leading market positions. All projects are reg-ularly reviewed for changes in the market situation.
We increased capital expenditures by 12 percent to €1,078 million in 2017. In principle, there is a slight timing difference in outflows for property, plant and equipment due to payment terms. In 2017, cash outflows for property, plant and equipment totaled €1,040 million (2016: €948 million).
The highest proportion of capital expenditures went to the Nutrition & Care and Resource Efficiency segments (36 percent and 32 percent respectively). A further 15 percent each was allocated to the Performance Materials segment and the Ser-vices segment. The regional focus of capital expenditures was Western Europe, which accounted for 53 percent of the total, followed by North America (24 percent), Asia-Pacific South (16 percent), and Asia-Pacific North (6 percent).
Major projects completed or virtually completed in 2017 T19
Segment Location Project
Nutrition & Care Shanghai (China) Expansion of the silicone platform
Tippecanoe (Indiana, USA) Expansion of production capacity for active ingredients for the
pharmaceutical industry
Resource Efficiency Marl (Germany) Capacity expansion for polyamide 12 powder
Schörfling (Austria) Expansion of production capacity for hollow fiber membrane modules
Performance Materials Ibbenbüren (Germany) Construction of membrane electrolysis plant at a joint venture with AkzoNobel
For further information on current capital expenditure projects, see section on segment performance.
30 FINANCIAL REPORT 2017 EVONIK INDUSTRIES

Financial investments amounted to €4,322 million in 2017 (2016: €191 million). They mainly comprised the acquisition of the Air Products specialty additives business and the Huber silica business.1
Free cash flow of €511 millionThe cash flow from operating activities declined by €218 mil-lion year-on-year to €1,551 million. This was mainly due to a smaller reduction in net working capital.
In 2017, we generated a free cash flow of €511 million (2016: €821 million). In addition to the lower cash flow from operating activities, the higher cash outflows for capital expenditures contributed to the year-on-year decline.
The cash flow from other investing activities comprised an outflow of €4,141 million. The main reasons for this were cash outflows for the purchase of subsidiaries.
The cash flow from financing activities was €23 million, mainly as a result of the cash inflow from the new bond. This was mainly reduced by the cash outflow for payment of the dividend for 2016. In the previous year, the cash inflow from financing activities was €1,373 million, principally as a result of the issuance of bonds.
Cash flow statement (excerpt) T20
in € million 2017 2016
Cash flow from operating activities 1,551 1,769
Cash outflows for investments in intangible assets, property, plant and equipment – 1,040 – 948
Free cash flow 511 821
Cash flow from other investing activities – 4,141 65
Cash flow from financing activities 23 1,373
Change in cash and cash equivalents – 3,607 2,259
Prior-year figures restated.
1 See Note 4.2 to the consolidated financial statements.
Change in net financing status C17
in € million
a Cash outflows for capital expenditures for intangible assets, property, plant and equipment.
Dec. 31, 2016 Net financial
assets
Cash flow, operating activities
Cash outflow, investing activitiesa
Cash outflows, acquisition
of subsidiaries
Dividend payment
Other Dec. 31, 2017Net financial
debt
+ 1,111
+ 1,551
– 1,040
– 4,121
– 536+ 12
– 3,023
31
Business reviewFinancial condition
CORPORATE GOVERNANCE SUPPLEMENTARY INFORMATIONCONSOLIDATED FINANCIAL STATEMENTS MANAGEMENT REPORT

2.10 Asset structure
Slight increase in total assetsAs of December 31, 2017, total assets were €0.3 billion higher at €19.9 billion. Non-current assets increased by €3.7 billion to €14.5 billion, mainly as a consequence of the high earnings. This was primarily because intangible assets increased by €2.8 billion to €6.1 billion and property, plant and equipment increased by €0.5 billion to €6.5 billion. In all, non-current assets increased to 73 percent of total assets, up from 55 percent in the prior year. They are financed by liabil-ities with the same maturity structure.
Current assets declined by €3.4 billion to €5.4 billion. The decline resulted principally from cash and cash equivalents, which fell by €3.6 billion to €1.0 billion due to the purchase price payment for the Air Products specialty additives business. This was countered by an increase in inventories of €0.3 billion to €2.0 billion and rise of €0.1 billion in trade accounts receivable to €1.8 billion. Current assets therefore decreased to 27 percent of total assets (2016: 45 percent).
Equity 1 declined slightly, by €0.2 billion, to €7.5 billion. The equity ratio decreased from 40 percent to 38 percent.
Non-current assets rose by €0.4 billion to €9.1 billion. In particular, the issuance of the hybrid bond contributed €0.5 billion. Non-current liabilities increased from 44 percent to 46 percent of total equity and liabilities.
Balance sheet structure of the Evonik Group C18
in € million
Non-current assets
7,527(38 %)
7,750(40 %)
9,134(46 %)
8,700(44 %)
3,278(16 %)
3,195(16 %)
Equity
Current assetsCurrent liabilities
Non-current liabilities
2017 a 2016 a
Total assets 19,939 19,645
a As of December 31.
2016 a
10,837(55 %)
8,808(45 %)
19,645
14,507(73 %)
5,432(27 %)
2017 a
19,939 Total equity and liabilities
1 See disclosures pursuant to Section 160 Paragraph 1 No. 2 German Stock Corporation Act (AktG), Note 6.8 (d) to the consolidated financial statements.
32 FINANCIAL REPORT 2017 EVONIK INDUSTRIES

3. Performance of Evonik Industries AG Evonik Industries AG, Essen (Germany) is the parent company of the Evonik Group. It holds direct and indirect stakes in all subsidiaries in the Group. The annual financial statements for Evonik Industries AG have been prepared in accordance with the accounting standards set out in the German Commercial Code (HGB) and the German Stock Corporation Act (AktG).
The earnings performance of Evonik Industries AG is essen-tially dependent on income from its subsidiaries, income and expenses relating to corporate financing, and portfolio management activities. Financial management is therefore based on an earnings indicator that contains all these effects: net income.
Income statement for Evonik Industries AG T21
in € million 2017 2016
Sales 667 635
Increase/reduction in finished goods and work in progress – 5 4
Other own work capitalized 5 –
Other operating income 971 896
Cost of materials – 246 – 221
Personnel expense – 366 – 341
Depreciation and amortization of intangible assets, property, plant and equipment – 20 – 17
Other operating expense – 1,356 – 1,125
Operating result – 350 – 169
Income from investments 834 1,481
Write-downs of financial assets and current securities – 49 – 19
Write-ups of financial assets and current securities 149 12
Net interest income/expense – 43 18
Income before income taxes 541 1,323
Income taxes – 166 – 85
Income after taxes 375 1,238
Net income 375 1,238
Profit carried forward from the previous year 400 –
Allocation to revenue reserves – 5 – 302
Net profit 770 936
The 5 percent rise in sales to €667 million was principally attributable to an increase in procurement activities, espe-cially for raw materials. As a result, the cost of materials was 11 percent higher at €246 million. Personnel expense was €366 million, an increase of €25 million compared with the prior year. Other operating income increased to €971 million. The increase resulted mainly from currency translation gains. In the gross presentation, currency translation gains of €910 mil-lion (2016: €670 million) are shown in other operating income, while the corresponding currency translation losses of €914 mil-lion (2016: €675 million) are shown separately in other oper-ating expense. The net effect was a loss of €4 million (2016: €5 million). This was countered by the reduction in income from the reversal of provisions from €147 million to €6 mil-lion.
Income from investments fell 44 percent to €834 million. This decline was mainly due to lower income from profit-and-loss transfer agreements. The write-downs of financial assets and current securities totaling €49 million and write-ups of finan-cial assets and current securities totaling €149 million mainly related to affiliated companies.
The net interest position declined from net interest income of €18 million to net interest expense of €43 million. This was mainly caused by higher interest expense in connection with the valuation of pension obligations. This item also con-tains interest income and expense from the Group-wide cash pool, which is concentrated at Evonik Industries AG.
Income before income taxes declined by 59 percent to €541 million, principally as a result of lower income from profit-and-loss transfer agreements. Income taxes amounted to €166 million, compared with €85 million in 2016.
33CORPORATE GOVERNANCE SUPPLEMENTARY INFORMATIONCONSOLIDATED FINANCIAL STATEMENTS MANAGEMENT REPORT
Performance of Evonik Industries AG

As forecast, net income declined substantially and was €375 million, a drop of €863 million compared with the previous year. Following allocation of €4,537,505.50 to revenue reserves and taking into account the profit of €400,000,000.00 car-ried forward from the previous year, the net profit was
€770,000,000.00. A proposal will be put to the Annual Shareholders’ Meeting that €535,900,000.00 of the net profit should be paid out, giving a dividend of €1.15 per share. A further €234,100,000.00 should be carried forward to fiscal 2018.
Balance sheet for Evonik Industries AG T22
in € millionDec. 31,
2017Dec. 31,
2016
Assets
Intangible assets, property, plant and equipment 68 55
Financial assets 9,430 9,011
Non-current assets 9,498 9,066
Inventories 6 9
Receivables and other assets 3,327 2,625
Cash and cash equivalents 637 4,272
Current assets 3,970 6,906
Prepaid expenses and deferred charges 16 11
Total assets 13,484 15,983
Equity and liabilities
Issued capital 466 466
Capital reserve 721 721
Revenue reserves 4,611 4,606
Net profit 770 936
Equity 6,568 6,729
Provisions 610 577
Payables 6,305 8,661
Deferred income 1 16
Total equity and liabilities 13,484 15,983
The total assets of Evonik Industries AG decreased from €16.0 billion in the previous year to €13.5 billion. Financial assets mainly comprise shares in subsidiaries. The receivables mainly comprise financial receivables of €3.0 billion (2016: €2.2 billion), principally in connection with loans and cash pooling activities. The drop of €4.3 billion in cash and cash equivalents to €0.6 billion related to payment of the purchase price of €3.5 billion for the acquisition of the Air Products specialty additives business.
Equity decreased by €0.1 billion to €6.6 billion, mainly as a consequence of lower earnings. The equity ratio rose from 42.1 percent in 2016 to 48.7 percent. Provisions increased from €577 million to €610 million, mainly as a consequence of interest effects on provisions for pensions and higher provisions for taxes. The receivables and liabilities reflect the financing
activities of Evonik Industries AG in its role as the holding company for the Group. Payables include financial liabilities of €6.1 billion (2016: €8.4 billion). €4.2 billion (2016: €7.1 billion) of this amount comprises liabilities to affiliated companies, principally in connection with cash pooling activities. A further €1.8 billion (2016: €1.3 billion) relates to corporate bonds.
Opportunities and risksThe most significant operating subsidiaries in Germany have profit-and-loss transfer agreements with Evonik Industries AG. In line with the central financing strategy of the Evonik Group, most internal and external financing transactions are handled by Evonik Industries AG. Consequently, Evonik Industries AG is essentially exposed to the same risks and opportunities as the Evonik Group. Further information can be found in the opportunity and risk report.
34 FINANCIAL REPORT 2017 EVONIK INDUSTRIES

Outlook 1 for 2018 We anticipate that in 2018 the net income of Evonik Industries AG will be slightly higher than in 2017. This is based on the assumption of attractive income from investments. By contrast, given the low interest rates, effects relating to pension provi-sions could have a negative impact.
Report on relations with affiliated companiesA report on Evonik Industries AG's relations with affiliated companies has been prepared in accordance with Section 312 of the German Stock Corporation Act (AktG). It concludes with the following declaration: “Our company received adequate remuneration or compensation for each of the transactions set out in this report on relations with affiliated companies under the circumstances known to us at the time when the transactions were undertaken. No actions were performed or omitted at the instigation of such companies.”
1 For details of the assumptions, see the section on expected developments.
35CORPORATE GOVERNANCE SUPPLEMENTARY INFORMATIONCONSOLIDATED FINANCIAL STATEMENTS MANAGEMENT REPORT
Performance of Evonik Industries AG

Innovation strategy firmly anchored in corporate strategyInnovations and a systematic alignment to specialty chemicals play a key role in our drive to be the best-in-class specialty chemicals company.
In view of this, we have taken an important step to pave the way for the future: In 2016, we restructured our innovation portfolio to focus on six growth fields, which are assigned to our growth engines in highly attractive markets with above-average growth rates. Evonik’s core competencies are ideally positioned to supply new products and solutions in the six innovation growth fields: • Sustainable Nutrition: Establishing additional products
and services for sustainable nutrition of livestock and people• Healthcare Solutions: Developing new materials for
implants, as components of cell culture media, and for custom-tailored drug formulations
• Advanced Food Ingredients: Creating a portfolio of health-enhancing substances and nutritional supplements as a contribution to healthy nutrition
• Membranes: Extending SEPURAN technology for effi-cient gas separation to further applications
• Cosmetic Solutions: Developing further products based on natural sources for cosmetics and sensorially optimized formulations for skin care products
• Additive Manufacturing: Developing products and tech-nologies for additive manufacturing
In the Sustainable Nutrition growth field, for example, we are establishing further products and services for sustainable nutrition of livestock. That involves linking modern digital tech-nologies with our knowledge and experience of healthy animal nutrition. That benefits the animals, farmers, and consumers.
Another of our innovation growth fields is working on membranes. Our SEPURAN technology for efficient gas separation is continuously being optimized for additional applications, giving us access to attractive markets. In 2017, we started up an extended production complex at our site in Schörfling (Austria). Here we will be producing membrane modules, especially for efficient nitrogen separation. A further membrane for the treatment of natural gas should be added
4. Research & development
Enhance risk-taking
Trust, openness, and transparency
Improve knowledge sharing
Evonik is one of the most innovative companies in the world
Increase the value of the innovation pipeline
New products, applications, and processes must make a substantial contribution to sales and profit
Focus on growth fields
Push transformational innovation
Open collaboration
Innovation strategy
Innovation cu
lture
Innovation targets
Our vis
ion
First-class in innovation
Our claim: First-class in innovation
a Excluding sales from first-time consolidation of acquisitions.
3.2%R&D ratio
R&D expenses
€458 million
Approx.
230new patent applications
Patent-driven salesa
52%
Products/ applications introduced
in the past five years
10%of sales
Average rise in R&D expenses 2013 – 2017
4 % p.a.
Total patents held /applications filed approx.:
26,000
Registered/pending trademarks approx.:
7,500
Approx.
2,800R&D employees
40R&D locations
36 FINANCIAL REPORT 2017 EVONIK INDUSTRIES

Innovation strategy firmly anchored in corporate strategyInnovations and a systematic alignment to specialty chemicals play a key role in our drive to be the best-in-class specialty chemicals company.
In view of this, we have taken an important step to pave the way for the future: In 2016, we restructured our innovation portfolio to focus on six growth fields, which are assigned to our growth engines in highly attractive markets with above-average growth rates. Evonik’s core competencies are ideally positioned to supply new products and solutions in the six innovation growth fields: • Sustainable Nutrition: Establishing additional products
and services for sustainable nutrition of livestock and people• Healthcare Solutions: Developing new materials for
implants, as components of cell culture media, and for custom-tailored drug formulations
• Advanced Food Ingredients: Creating a portfolio of health-enhancing substances and nutritional supplements as a contribution to healthy nutrition
• Membranes: Extending SEPURAN technology for effi-cient gas separation to further applications
• Cosmetic Solutions: Developing further products based on natural sources for cosmetics and sensorially optimized formulations for skin care products
• Additive Manufacturing: Developing products and tech-nologies for additive manufacturing
In the Sustainable Nutrition growth field, for example, we are establishing further products and services for sustainable nutrition of livestock. That involves linking modern digital tech-nologies with our knowledge and experience of healthy animal nutrition. That benefits the animals, farmers, and consumers.
Another of our innovation growth fields is working on membranes. Our SEPURAN technology for efficient gas separation is continuously being optimized for additional applications, giving us access to attractive markets. In 2017, we started up an extended production complex at our site in Schörfling (Austria). Here we will be producing membrane modules, especially for efficient nitrogen separation. A further membrane for the treatment of natural gas should be added
to this product portfolio this year. Natural gas and nitrogen together account for over 80 percent of the total gas separation market.
The innovation portfolio in our growth segments and at our strategic innovation unit Creavis is aligned to these growth fields.
Successful innovationsEvonik has an extensive patent strategy to protect new prod-ucts and processes. The quality of our patent portfolio has increased steadily in recent years. Some 230 new patent appli-cations were filed in the reporting period. Overall, we had around 26,000 patents and pending patents in 2017. Our “patent- driven” sales indicator was 52 percent of consolidated sales.1 Product sales are defined as “patent-driven” if there is at least one relevant patent in force worldwide.
In 2017, products and applications introduced in the past five years accounted for 10 percent of Evonik’s consolidated sales.
Our innovation pipeline is well stocked. It comprises a balanced mixture: As well as addressing completely new business options, it is geared to securing and enhancing the prospects of existing businesses. Alongside product and process innovations, the focus includes innovative business models and product and process innovations. Our portfolio is aligned to the differing business strategies of the various business entities.
In view of the strategic importance of R&D, we have raised R&D expenses by an average of 4 percent since 2013. In 2017, R&D expenses totaled €458 million. Our R&D projects are managed using the multi-step Idea-to-Profit process developed by Evonik to support the systematic development of projects right up to profitable commercialization.
4. Research & development
1 Excluding sales from the newly consolidated acquired businesses.
R&D expenses C19
in € million
2013
2014
2015
2016
2017
100 200 300 400 5000
394
413
434
438
458
37CORPORATE GOVERNANCE SUPPLEMENTARY INFORMATIONCONSOLIDATED FINANCIAL STATEMENTS MANAGEMENT REPORT
Research & development

R&D drivers at EvonikAround 90 percent of our R&D is performed by our seg-ments. That includes, first and foremost, research geared specifically to their core technologies and markets and to the development of new business. The Nutrition & Care and Resource Efficiency growth segments will receive an above-average share of our R&D funds so that they can enter new markets through innovations and alliances. The Perfor-mance Materials segment focuses on optimizing products and processes. In addition, R&D is driven forward by Creavis, our strategic innovation unit. Working closely with the seg-ments, Creavis is engaged in research into new technologies. It concentrates on mid- and long-term projects, which are driven forward in a variety of ways. Its principal areas of focus are Evonik’s innovation growth fields, and its work is linked to the segments’ R&D activities. Examples are the development of new gas separation membranes, which add new technologies to our SEPURAN platform.
On the basis of the identified potential in the strategic growth fields, Creavis sets up project houses, which spend three years working on research into a potential innovation in conjunction with the segments and external experts. For example, the Medical Devices Project House in the Health-care Solutions growth field is currently working on new solu-tions for medical technology and on extending Evonik’s com-petence in biomaterials and polymers. In particular, it is addressing applications in implantology.
Evonik also obtains access to new technologies and business options through its corporate venture capital activities. We invest specifically in specialized technology funds and prom-ising start-ups of strategic relevance to Evonik. This gives us an insight into new technologies and business activities that fit our growth strategy at a very early stage of development. Products and technologies are developed in joint projects. In this way we speed up our innovative process. Evonik has been involved in the venture capital business since 2012 and
has made more than 20 investments in this time. In 2017, Evonik’s investments included four start-ups and three funds. Our investments in start-ups include NUMAFERM, a biotech-nology company based in Düsseldorf (Germany). NUMAFERM is working on more efficient production of peptides. Peptides and their applications are of enormous interest for our Specialty Additives and Health & Care growth engines. Evonik’s fund investments include Digital Growth Fund I in Munich (Ger-many). This fund provides capital for fast-growing young IndustrialTech and FinTech companies with proven and successful B2B business models. Our investment in Digital Growth Fund I is a strong partnership that strengthens Evonik in an important field of the future: digitalization. In addition, we are driving forward precision livestock farming (PLF) for poultry. Through our analytical services for amino acids we already have experience of digital business models in agricul-ture and we now aim to link these using modern digital tech-nologies.
We regard our innovation culture, which is encouraged and brought to life through our R&D activities, as a major factor in our innovative capability. It determines whether—and how fast—employees are able to identify and drive forward good ideas and convert them into additional sales and earnings. Alongside commitment, passion, and stamina, that entails the strength to discontinue R&D projects if their prospects of suc-cess are too low, as well as a constructive attitude to mistakes. We therefore regard Evonik as an open, learning company.
Opportunities offered by digitalizationEvonik recognized the opportunities inherent in digital business models at an early stage. We are consciously shaping the necessary changes in the company. In the coming years, Evonik intends to invest considerably in developing and testing digital technologies and building up the related expertise. Within the Evonik Group, Evonik Digital GmbH therefore started to develop new digital business models and build up digital competencies at the start of 2017. This Evonik entity focuses on digital solutions and drives them forward after successful testing in the Group. A major role here is played by collaboration with well-known technology companies and universities.
Breakdown of R&D expenses C20
Nutrition & Care
Creavis
Performance Materials
Resource Efficiency
5. Sustainability
38 FINANCIAL REPORT 2017 EVONIK INDUSTRIES

has made more than 20 investments in this time. In 2017, Evonik’s investments included four start-ups and three funds. Our investments in start-ups include NUMAFERM, a biotech-nology company based in Düsseldorf (Germany). NUMAFERM is working on more efficient production of peptides. Peptides and their applications are of enormous interest for our Specialty Additives and Health & Care growth engines. Evonik’s fund investments include Digital Growth Fund I in Munich (Ger-many). This fund provides capital for fast-growing young IndustrialTech and FinTech companies with proven and successful B2B business models. Our investment in Digital Growth Fund I is a strong partnership that strengthens Evonik in an important field of the future: digitalization. In addition, we are driving forward precision livestock farming (PLF) for poultry. Through our analytical services for amino acids we already have experience of digital business models in agricul-ture and we now aim to link these using modern digital tech-nologies.
We regard our innovation culture, which is encouraged and brought to life through our R&D activities, as a major factor in our innovative capability. It determines whether—and how fast—employees are able to identify and drive forward good ideas and convert them into additional sales and earnings. Alongside commitment, passion, and stamina, that entails the strength to discontinue R&D projects if their prospects of suc-cess are too low, as well as a constructive attitude to mistakes. We therefore regard Evonik as an open, learning company.
Opportunities offered by digitalizationEvonik recognized the opportunities inherent in digital business models at an early stage. We are consciously shaping the necessary changes in the company. In the coming years, Evonik intends to invest considerably in developing and testing digital technologies and building up the related expertise. Within the Evonik Group, Evonik Digital GmbH therefore started to develop new digital business models and build up digital competencies at the start of 2017. This Evonik entity focuses on digital solutions and drives them forward after successful testing in the Group. A major role here is played by collaboration with well-known technology companies and universities.
5. Sustainability
o Safety has top priority
o Our products help our customers achieve their sustainability goals
o Evonik offers an attractive working environment so employees like working for us and fulfill their potential
o Protecting the climate and the environment is important to us
We take responsibility for our business, our employees, and the environment
23.2 %of managers are female
Our employees come from
110nations
Climate strategy rated
A –by CDP Climate
Change
Low employee fluctuation rate of
5.8 %
55ESHQ audits worldwide
We invest around
€ 500per employee
in training
39CORPORATE GOVERNANCE SUPPLEMENTARY INFORMATIONCONSOLIDATED FINANCIAL STATEMENTS MANAGEMENT REPORT
Sustainability
Building Public Trust Award
German Awards for Excellence 2017: Evonik Industries AG
Sustainable Business Awards Singapore
Outstanding employer
Accolades:
Safety indicators at a very good level
✓ Accident frequency indicator: 1.16, below the maximum limit of 1.30✓ Incident frequency indicator: 1.1, only just above the maximum limit of 1.10

Responsible corporate managementSustainability is a core element in our corporate claim “Power to create.” Our products and solutions are used in many areas that help to improve people’s lives and minimize the use of scarce resources. In this way, we also aim to play a part in the 17 goals for sustainable development set by the United Nations, to be achieved by 2030. In the reporting period, we addressed these goals and their relevance for the Evonik Group, individual operating units, and entire value chains in a variety of ways.
Numerous voluntary commitmentsEvonik is committed to the ten principles of the UN Global Compact and is guided by the International Labour Standards issued by the International Labour Organization (ILO) and the Guidelines for Multinational Enterprises published by the Organisation for Economic Cooperation and Development (OECD). In addition, we are involved in many networks such as the “Chemie3” sustainability initiative of the German chemical industry, and the World Business Council for Sustainable Development (WBCSD). Together with our Code of Conduct, our Global Social Policy (GSP) and our Environment, Safety, Health and Quality (ESHQ) Values provide a framework for responsible corporate management.
We are also committed to the WBCSD’s “Vision 2050,” which describes the pathway to achieving a sustainable world with around 9 billion people living well within the limits of the planet by 2050.
Integrated sustainability strategy and sustainability managementWe are convinced that sustainable business activities and responsible conduct by our management and staff at all levels are vital for the future of our company. Our sustainability strategy takes up the growth engines identified in our corpo-rate strategy—Specialty Additives, Animal Nutrition, Smart Materials, and Health & Care—and defines areas of action geared to balanced management of economic, ecological, and social factors.
The Executive Board bears overall responsibility for sus-tainability. Direct responsibility is assigned to the Chief Human Resources Officer, who is also responsible for all climate- related aspects at Evonik. The Corporate Responsibility Division sets the strategic framework for sustainability management and coordinates the Group-wide implementation of the strategy in close collaboration with other central functions and the segments.
Intensive dialogue with stakeholdersDialogue with our stakeholders is important to give us a bet-ter understanding of different perspectives and regularly review our own positions. Findings and impetus from our stakeholder dialogues facilitate timely identification of upcoming market developments, trends, opportunities, and risks. That enables us to customize our products and solu-tions to meet the needs of our customers and markets.
Evonik’s stakeholder groups C21
Dire
ct in
fluen
ceIn
dire
ct in
fluen
ce
Shareholders
Lenders
Legislators
Authorities
Society/communityFinancial markets Regulatory bodiesThe business
Local residents
Non-governmentalorganizations
Scientific community
Media
Analysts/rating agencies PoliticiansAssociations
Competitors
Customers
Employees
Suppliers
40 FINANCIAL REPORT 2017 EVONIK INDUSTRIES

We use a variety of formats for dialogue with our stakeholders. One example was an exchange of experience with represen-tatives of churches, industrial unions, companies, and non- governmental organizations on “Industry and Human Rights” in June 2017. At the Evonik Perspectives expert forum in October 2017, the Corporate Responsibility Division and the Resource Efficiency segment discussed opportunities and challenges on the road to greater energy efficiency and more efficient use of resources with more than 100 stakeholders. Important feedback about our sustainability performance also comes from talking with members of the investment community.
Impact analysis launched Sustainability is a key criterion in many of our markets and is increasingly becoming a growth driver. Our sustainability analysis makes the contribution made by corresponding prod-ucts and services to our business performance measurable. We are continuously developing this methodology. In addition, we
have started to evaluate the positive and negative impacts of Evonik’s business activities along the value chain on the economy, the environment, and society in monetary terms.
Transparency in sustainability reportingTransparent and open reporting of our sustainability activities is important to us. The information channels provided for this include our “Responsibility” website, which was redesigned in 2017, our extensive Sustainability Report, and, for the first time, a separate non-financial report1. In addition, we are rated by prestigious rating agencies: Evonik is positioned among the leaders in the chemical industry in significant sustainability ratings and is included in major sustainability-oriented index families.
We received many accolades for our sustainability activi-ties and sustainability reporting in 2017. That recognition is an additional incentive for us to extend our commitment to sustainability.
5.1 Employees
Employees are the foundations of our successSkilled and motivated employees are the key to Evonik’s success. By providing an attractive working environment, we want to ensure that our employees like to work for Evonik and can develop their talents. All employees can fulfill their potential. We foster the creativity of our employees and offer them space to take their own route to innovative solutions. We want to create an atmosphere based on trust, respect, and openness. We reward performance and readiness to take risks and we develop our own managers.
This is reflected in our human resources strategy, which is divided into the following areas of action: attract, develop, perform, retain, and lead.
Attract Employer branding—Positioning as an attractive employer We seek out creative and competent employees with high potential and offer them a working environment that fosters ideas, rewards hard work, and maintains their mental and physical employability. We also use these employer qualities in the competition to attract the most talented employees and managers to Evonik.
Our new employer branding campaign, #HumanChemistry, is designed to make it clear that Evonik is an innovative and increasingly more digital specialty chemicals company where highly motivated employees and their abilities play a central role.
A variety of awards and surveys confirm that Evonik is already one of Germany's most attractive employers. In the Focus ranking, Evonik is still among the top-10 employers in the chemical industry. In the B2B Social Media Ranking (Brandwatch), Evonik shot up from 35th place in 2016 to first place in 2017. In China, Evonik was once again included in the list of the most popular employers published by the Top Employer Institute in 2017.
Modern recruitingTo attract potential new employees, it is becoming increas-ingly important to establish contact to relevant target groups at an early stage. We therefore work specifically with selected universities and higher education institutes around the world.
Through the Evonik Perspectives program we remain in contact with students whose performance in internships at Evonik is above average. Many of the participants in this pro-gram join Evonik when they finish their studies.
Develop Further training to secure the futureWe want to ensure timely identification of the potential of our employees and talents and to foster, develop, and stretch employees accordingly. Our intranet site provides transparent and accessible information for all employees on opportunities for continuing professional development, together with the content and whom to contact.
1 See www.evonik.com/nonfinancial-report
41
SustainabilityEmployees
CORPORATE GOVERNANCE SUPPLEMENTARY INFORMATIONCONSOLIDATED FINANCIAL STATEMENTS MANAGEMENT REPORT

We need employees with the right mindset and the relevant skills and competencies so we can address the digital trans-formation and potentially disruptive changes. Through #HumanWork, we aim to prepare our employees for tomor-row’s world of work and the age of digitalization. To support this necessary cultural change at Evonik, we established our first rooms to test new working conditions in 2017. In these New Work Labs our employees can make an active contribution to aspects of Work 4.0.
For the continuing professional development of our employees, we invested around €500 per employee in train-ing alone in 2017.
Vocational training for present and future specialistsWe still recruit specialists specifically from young people within the company, and are committed to their develop-ment. All employees hired following successful completion of their vocational training are offered a clear perspective for the future.
At year-end 2017, we had around 1,900 young people at 16 sites in Germany on more than 38 vocational training courses and combined vocational training and study programs. Around 390 of them were being trained on behalf of other companies. Apprentices accounted for nearly 8 percent of our workforce in Germany, which is still well above the national average. A total of 90 places were offered on the “Start in den Beruf” pre- apprenticeship project in the 2017/2018 academic year, including 20 for refugees. Overall, we invested €65 mil-lion in vocational training in Germany in 2017. That positions Evonik among the best training companies in Germany.
Talent management—Developing tomorrow’s executives Key positions are filled predominantly by talented employees from within the company. To this end, we develop employees with potential across hierarchical levels, functions, and organi-zational units. Important objectives for talent development at Evonik are personal responsibility, diversity, internationality, and entrepreneurship. Alongside on-the-job development through job rotation, involvement in projects, and international postings, targeted programs are used to ensure the develop-ment of our high potentials. In addition to demanding seminars on aspects of leadership and management in collaboration with major business schools such as IMD in Lausanne (Switzer-land), we have established a further element geared to ethical aspects, values, and personal development.
Options for personal behavior and responsibility are addressed, discussed, and experienced through community work in Vietnam, a special curriculum on ethics, values, and moral aspects, and a program of reflection on the role of companies in politics and society.
PerformWe regard a healthy performance culture as the basis for the company’s success and the personal motivation of every indi-vidual employee. Fair, performance-related remuneration plays a central role in this, together with employees’ annual performance and development review with their manager.
Remuneration—Performance-related pay around the worldWhen shaping remuneration systems, Evonik believes it is very important to offer specialists and executives market- oriented and performance-related salaries. The remuneration of many members of our workforce includes bonus payments that are based on the company’s business performance and/or their personal performance.
In addition, our employees in Germany, Belgium, and the USA and, for the first time in 2017, staff in China and Singapore are offered the “Share” employee share program. The partici-pation rate rose for the third time in succession to a new record of 41 percent.
Fringe benefits form part of overall remunerationAs a responsible employer, Evonik helps the majority of employees build financial security to cover risks such as accidents and disability and to provide for retirement, either directly or through pension contributions to external institu-tions. The arrangements are based on the economic, legal, and tax situation in the various countries. Employer contribu-tions to pension plans are an important element in competitive overall remuneration packages, especially in Germany, the USA, and some European countries. The pension plans in Germany and the USA have been revised and aligned to the future cost to Evonik as a result of demographic challenges.
Retain Diversity enrichesWe regard ourselves as an international company and see diversity as an opportunity. Diversity means fostering creativity, trying out new things, and better understanding the needs of our customers. We see diversity of nationality, gender, edu-cational background, and professional experience, as well as a wide-ranging age structure in the workforce, as a clear competitive advantage. For us, diversity means utilizing the entire spectrum of experience, competencies, and viewpoints that our employees contribute in their daily work.
Our diversity strategy includes gender networks as well as clear diversity targets for managers. It is evaluated and managed through a Group-wide Diversity Council.
42 FINANCIAL REPORT 2017 EVONIK INDUSTRIES

Key data on diversity T24
in € million 2017 2016
Women as a proportion of the total workforce in % 24.9 24.7
Female managers in % 23.2 22.0
Average age in years 41.9 41.8
Nationalities 110 105
Work-life balanceHealthy and motivated employees are vital for Evonik’s suc-cess and an integral part of our corporate responsibility. We respect the individual needs and personal aspirations of our employees. Therefore, it is very important to us that our employees find a balance between work and their private lives. We offer flexible worktime models and concrete mea-sures to support them in the various phases of their lives. Our well@work program covers all aspects that maintain and improve the employability and quality of life of our employees.
Core elements are support in child care and flexible worktime models.
Including employee interests in our corporate cultureOur corporate culture determines how we treat one another and our success. Regular surveys on our corporate culture are therefore important to us so we are aware of our employees’ attitudes and can include them in decisions. In 2017, we conducted an executive survey of the top 200 executives at Evonik. This will be followed in 2018 by our regular employee survey, which is conducted every three years and covers the approximately 36,000 employees in the Evonik Group.
Key data on employee retention T25
2017 2016
Fluctuation rate in % 5.8 4.7
Average length of service in years 14.6 14.9
LeadershipClear, consistent, cooperativeThe heart of our leadership culture is a trustful relationship between employees and managers. Here we focus on three dimensions: clear instructions, consistent action, and a cooper-ative approach to our employees. Our aim is to ensure that sin-cere and effective leadership is a distinctive quality at all Evonik sites. Following our executive survey, Share your wisdom, in spring 2017 we therefore launched a continuous dialogue between our Executive Board and Group executives.
A considerable increase in headcount due to growth and acquisitionsAt year-end 2017, the Evonik Group had 36,523 employees, 2,172 more than at year-end 2016. The increase resulted princi-pally from the acquisition of the Air Products specialty additives business (1,097 employees) and the Huber silica business (692 employees) as well as investment in growth projects in the Health & Care and Resource Efficiency segments. At the same time, there were some headcount reductions due to implementation of the Administration Excellence program to enhance efficiency and some small optimization programs in the chemical segments.
Employees by segment T26
Dec. 31,
2017Dec. 31,
2016
Nutrition & Care 8,257 7,594
Resource Efficiency 10,260 8,928
Performance Materials 4,364 4,393
Services 13,021 12,892
Other operations 621 544
Evonik 36,523 34,351
In 2017, personnel expenses, including social security contri-butions and pension expense, rose 8 percent to €3,374 million. Personnel expenses were therefore 23.4 percent of sales (2016: 24.6 percent).
Age structure in the Evonik Group C22
in %
Under 21 years
21 – 30 years
31 – 40 years
41 – 50 years
51 – 60 years
Over 60 years
10 20 300
Asia-Pacific North 10 %Asia-Pacific South 5 %
Central and South America 2 %
North America 13 %
Eastern Europe 2 %
Middle East, Africa 1 %
Western Europe 67 %
Employees by region C23
43
SustainabilityEmployees
CORPORATE GOVERNANCE SUPPLEMENTARY INFORMATIONCONSOLIDATED FINANCIAL STATEMENTS MANAGEMENT REPORT

5.2 Safety and environment
Safety as a management taskWe take our responsibility in the field of safety particularly seriously—during production and while shipping products to our customers. Our objective is to protect our employees and local residents as well as the environment from any potential negative impact of our activities. The Group-wide Safety at Evonik initiative has become firmly established as an ongoing process to develop our safety culture and as a fundamental management approach to all aspects of occupational and traffic safety. Our guiding principles for safety and our safety culture provide a structure and guidance for our corporate targets and activities. Binding principles are applicable for all employees, from local personnel to our management, and provide clear and measurable guidance for their personal conduct and leadership.
Incident frequency indicator improved slightly and was within the defined limitA special focus of our initiative is the safety of our employ-ees—both at work and on the way to and from work—and the safety of contractors working at our sites. In 2017, the accident frequency indicator1 for our employees was 1.16, which was within our defined maximum limit of 1.30. That was a slight improvement compared with the previous year (1.24). Discussing the accidents provided valuable pointers for future accident prevention, and these have been communicated to our employees.
In the year under review, there was one fatal accident involving an Evonik employee. There were no fatal accidents involving contractors’ employees, nor any fatal traffic accidents involv-ing employees on the way to or from work or on business trips.
The accident frequency indicator for contractors (number of work-related accidents involving non-Evonik employees resulting in absence from work per 1 million working hours) increased slightly year-on-year to 3.52 (2016: 3.15).2
Incident frequency indicator at a very good levelProcess safety at our plants is another focus of our initiative. The concepts to prevent fire and the release of hazardous substances are regularly analyzed in detail. The aim is timely identification of risks so we can develop appropriate mea-sures that reliably prevent these risks. We monitor and evaluate plant safety using the incident frequency indicator3. In 2017, this indicator was 1.11 and therefore fell slightly short of our target. Nevertheless, it was still at a very good level.
Safety targetsOur overriding aim is to avoid all accidents and incidents. We set annual limits for occupational safety and plant safety indicators.
For 2018 these are:• The accident frequency rate should not exceed 1.30.• The incident frequency rate should not exceed 1.10.
1 Number of accidents involving Evonik employees and contractors' employees under Evonik's direct supervision per 1 million working hours.2 Calculation based on assumptions and estimates.3 Number of incidents per 1 million working hours.
Accident frequency indicator C24
Number of accidents per 1 million working hours
2013 0.95
2014
2015
2016
2017
0.5 1.0 1.5 2.00.0
1.18
0.97
1.24
1.16
Incident frequency indicator C25
Number of incidents per 1 million working hours
2013
2014
2015
2016
2017
0.5 1.0 1.5 2.00.0
1.23
1.40
1.29
0.95
1.11
44 FINANCIAL REPORT 2017 EVONIK INDUSTRIES

Ambitious environmental targetsProtecting our environment and the climate are major global challenges of our age, along with the efficient use of limited natural resources in the face of the growing world population and increasing affluence. Maintaining the natural basis of life for future generations is part of our corporate responsibility. Key areas of action in the ecological arena can be derived from efficiency requirements. For us, that principally means reducing energy consumption, minimizing emissions into the air and water, and efficient water management.
We also develop products that contribute to forging a clear link between economic success and ecological progress. However, improving our ecological footprint and remaining internationally competitive are also dependent on public acceptance and political opportunity. These conditions are reflected in our strategic focus.
We have set demanding environmental targets for the period 2013 – 2020 (reference base: 2012):• Reduce specific greenhouse gas emissions1 by 12 percent.• Reduce specific water intake 2 by 10 percent.
In sustainable waste management, we are continuing our efforts to make more efficient use of resources.
In 2017, we made further progress in reducing emissions at all stages in the value chain. A functioning environmental management system is the basis for this. Integrating it into our corporate processes is an ongoing task and an integral part of our sustainability management. At Evonik, account-ability for plants, technical systems, products, and processes is therefore assigned to the responsible members of staff, for example, through job descriptions and letters of delegation.
Our environment, safety, health, and quality management system is binding for the entire Evonik Group. In addition, we require our production sites to be validated as conforming to the internationally recognized environmental management standard ISO 14001. As a result of the necessary start-up and preparatory phase for new units, the proportion of output covered by ISO 14001 validation varies. However, it is always between 95 and 100 percent. Audits are conducted to monitor implementation by the segments, regions, and sites. Alongside audits on specific issues, we conducted 55 ESHQ audits worldwide in 2017.
Carbon Disclosure Project—Climate reporting at a high levelCorporate growth potential arises from the systematic align-ment of products and services to global megatrends. That includes the challenge of global climate change. Many innova-tive products from Evonik help improve energy efficiency at subsequent stages in the value chain, reduce the use of resources, and cut emissions.
In the area of reporting key environmental indicators, Evonik is engaged in intensive exchange with rating agencies such as the Carbon Disclosure Project (CDP). In 2017, we confirmed the very good CDP Climate Change score of “A –” obtained in 2016.
Slightly higher CO2 emissions3
Output increased from 10.6 million metric tons to 11.0 million tons in 2017. About half of this increase came from the first-time consolidation of the Air Products specialty additives facil-ities.4 CO2 emissions increased from 9.4 million metric tons in 2016 to 9.8 million metric tons. In addition to higher output, this was attributable to routine shutdowns at gas power plants and the related increase in the use of the coal-fired power plant in Marl (Germany).
The 26 facilities operated by Evonik that fall within the scope of the European Union’s Emissions Trading System (EU ETS) emitted 3.8 million metric tons of CO2 in 2017.
1 Energy- and process-related emissions as defined by the Greenhouse Gas Protocol. Scope 2 emissions measured using the market-based method.2 Excluding site-specific factors in the use of surface water or groundwater.3 Direct CO2 emissions (Scope 1 emissions under the Greenhouse Gas Protocol) come from energy generation and production. Indirect CO2 emissions (Scope 2 emissions)
come from purchased energy. Gross emissions measured using the market-based method.4 The silica business acquired from Huber will only be included in the environmental data from 2018.
45
SustainabilitySafety and environment
CORPORATE GOVERNANCE SUPPLEMENTARY INFORMATIONCONSOLIDATED FINANCIAL STATEMENTS MANAGEMENT REPORT

6. Opportunity and risk report6.1 Opportunity and risk management
Risk strategyEvonik’s Group-wide internal opportunity and risk management (referred to generically as risk management in this section) forms a central element in the management of the company. Our risk management includes a risk detection system, which meets the requirements for publicly listed companies. The aims are to identify risks as early as possible and to define measures to counter and minimize them. To ensure optimal use is made of opportunities, these also need to be recognized and tracked from an early stage. We only enter into entrepre-neurial risks if we are convinced that in this way we can gen-erate a sustained rise in the value of the company and, at the same time, permanently limit possible negative implications.
Structure and organization of risk managementAt Group level, risk management is assigned to the Chief Financial Officer and is organized on a decentralized basis in line with Evonik’s organizational structure.
The segments, corporate divisions, and service units bear prime responsibility for risk management. That comprises early
identification of risks and estimating their implications. Further-more, suitable preventive and control measures have to be introduced and internal communication of risks must be ensured. Risk coordinators in the organizational units are responsible for agreeing on the relevant risk management activities. At all levels in the Group, systematic and timely risk reporting is a key element in strategic and operational plan-ning, the preparation of investment decisions, projections, and other management and decision-making processes.
A central Corporate Risk Officer coordinates and oversees the processes and systems. He is the contact for all risk coordi-nators and is responsible for information, documentation, and coordination at Group level. Further responsibilities include ongoing development of the methodology used by the risk management system. The Risk Committee is chaired by the Chief Financial Officer and composed of representatives of the corporate divisions. It validates the Group-wide risk situation and verifies that it is adequately reflected in financial reporting. The Supervisory Board, especially the Audit Committee, over-sees the risk management system.
Structure of risk management C26
Ove
rsee
n by
Inte
rnal
Aud
it
and
the
audi
tor
Corporate Risk Officer Risk Committee
Supervisory Board
Executive Board
Services and other unitsSegments
Business Lines
Corporate Center
Risk Coordinators &Risk Officers
Risk Coordinators &Risk Officers
Risk Officers
Risk Coordinators &Risk Officers
46 FINANCIAL REPORT 2017 EVONIK INDUSTRIES

In 2017, risk management again included all consolidated companies in the Evonik Group. At companies where we do not exert a controlling influence, we implement our risk management requirements primarily through our presence in management and supervisory bodies.
Corporate Audit monitors risk management in our orga-nizational units to make sure they comply with statutory and internal requirements and to ensure continuous improvement of risk management. The risk detection system is included in the annual audit in compliance with the requirements for listed companies. This audit showed that Evonik’s risk detec-tion system is suitable for timely identification of risks that could pose a threat to the company’s survival.
The risk management system is based on the internationally recognized COSO Enterprise Management standard. It is implemented through a binding Group-wide policy. Individual risks are systematically identified and managed with the aid of special risk management software. Their probability of occur-rence and the possible damage (potential impact) are evaluated and documented, together with their expected value (product
of probability of occurrence and potential impact). Analo-gously to current planning, the evaluation is based on a period of three years (mid-term planning). Opportunities and risks are defined as positive and negative deviations from the plan. The relevant indicators include adjusted EBITDA. In addition, longer-term opportunities and risks, including those relating to sustainability, are included.
The organizational units conduct an extensive annual risk inventory in connection with the mid-term planning process. They are required to provide details of the measures to be taken with regard to the risks identified, introduce them immediately, and track their timely implementation. Internal management (for example, reporting by the Risk Committee) takes a mid-term view. The opportunities and risks identified are classified as low, moderate, or high (see opportunity and risk matrix). The evaluation is always based on a net view, in other words, taking into account risk limitation measures. Risk limitation measures can reduce, transfer, or avoid gross risks. Common measures include economic counter-action, insurance, and the establishment of provisions on the balance sheet.
The risk inventory is supplemented by quarterly reviews of all opportunities and risks relating to the present year both to spot changes in the opportunities and risks that have already been identified and to identify new risks and opportunities.
All high risks and opportunities are classified as material individual risks and opportunities, as are moderate risks and opportunities with an expected value of over €100 million in the mid term. The expected value is used exclusively as a basis for prioritization and to focus reporting on key issues.
6.2 Overall assessment of opportunities and risks
Given the measures planned and implemented, no risks have been identified that—either individually or in conjunction with other risks—could jeopardize the continued existence of Evonik as a whole, including Evonik Industries AG in its role as the holding company for the Group. For 2017 we expected more risks than opportunities. During the year, there were some opportunities and risks whose overall effects canceled each other out. Pleasingly, in the
Resource Efficiency and Performance Materials segments we were mainly able to realize opportunities, especially in C4 chemicals and methacrylates. In the Nutrition & Care seg-ment, considerably more risks than opportunities materialized, especially in the market for amino acids. Our reporting distin-guishes between the categories market and competition risks, legal and compliance risks, and process and organization risks. The main parameters influencing the risk categories in terms of both opportunities realized and risks that materialized
1 – 10 %
> 500
250 – 500
100 – 250
10 – 100
0 – 10
76 – 100 %51 – 75 %26 – 50 %11 – 25 %
Impa
ctin
€ m
illio
n
Probability of occurrence
Opportunity/risk matrix C27
High opportunities/risks
Moderate opportunities/risks
Low opportunities/risks
47CORPORATE GOVERNANCE SUPPLEMENTARY INFORMATIONCONSOLIDATED FINANCIAL STATEMENTS MANAGEMENT REPORT
Opportunity and risk reportOpportunity and risk managementOverall assessment of opportunities and risks

resulted from the development of specific market and com-petition situations. From the present standpoint, the risks for 2018 again outweigh the potential opportunities. Compared with 2017, there has been a slight increase in the risks for the Evonik Group, while the opportunities have increased consid-erably.
Material individual risks and opportunities for the Evonik Group are changes in exchange rates and the development of margins for C4 chemicals. Further material risks relate to the
development of amino acid prices and the overall economic development. Measures to reduce the risks include general economic mitigation measures and, especially with regard to changes in exchange rates, the use of hedging instruments. Sections 6.3 and 6.4 present the material individual risks and opportunities, along with further opportunities and risks in each category. Except where otherwise indicated, they apply for all segments.
6.3 Market and competition opportunities and risks
In accordance with our internal management, opportunities and risks in the market and competition category are allo-cated to risk quantification classes within sub-categories. The chart shows the highest class to which an individual risk or opportunity is allocated in each sub-category. Individual
opportunities and risks may also be allocated to the lower risk classes. Where two sub-categories have the same profile in the chart, they are ranked first on the basis of the risks, then listed in descending order, based on their expected impact.
1. Sales marketsThe development of the global economy entails both oppor-tunities and risks for Evonik. If economic growth strengthens or weakens, for example, due to political developments, changes in interest rate and exchange rate policy, or the development of key sectors of the economy (e. g., the banking and real estate sectors), this can have an impact on demand in market segments of relevance to Evonik. That in turn can influence Evonik’s earnings and cash flows. Evonik counters these eco-nomic risks by constantly monitoring the macroeconomic environment, optimizing cost structures and competitive positions in its established areas of business, and extending businesses in its portfolio with low cyclical exposure.
Alongside the general demand situation, intensive competi-tion in the various market segments harbors both opportunities
and risks. These may result from either demand in specific markets or from the competitive situation in various industries. Changes in demand can have a considerable impact on our business volume and sales. In addition, competitors in low-wage countries in particular can increase competitive pressure through new capacities and aggressive pricing policies that can impair our selling prices and volume trends. To counter this we are broadening our foreign production base and gaining access to new markets in high-growth regions such as Asia and South America. To reduce these risks, the operating units affected also use various methods of increasing customer loyalty and gaining new customers, enter into research alliances with customers, and extend the services offered along the value chain.
Risks Sub-category Opportunities
Sales markets
Financial markets
Raw material markets
Human resources
Research & development
Production
Mergers & acquisitions
Other
Capital expenditures
Energy markets
Opportunity and risk classes within the market and competition category C28
High opportunities/risks
Moderate opportunities/risks
Low opportunities/risks
48 FINANCIAL REPORT 2017 EVONIK INDUSTRIES

On the other hand, opportunities arise for our businesses from unmet demand in individual markets, for example, if our competitors are unable to bring planned new capacity into service on schedule. In 2017, there was an increase in shut-downs of production facilities in China, including those oper-ated by our competitors, to improve environmental protection and occupational safety. Our production facilities worldwide are based on modern standards and have high levels of occu-pational and environmental safety, so we see an opportunity to increase our market share.
We are constantly developing attractive and competitive new products and technologies to mitigate the risk that chemical products could be replaced by new, improved, or less expen-sive materials or technologies. One potential risk factor for our amino acids business, for example in Asia, is the possible impact of substandard food quality and food safety, especially due to bird flu. We utilize opportunities for profitable future growth by gaining access to new markets as part of our stra-tegic development. One attractive market for our amino acids business is aquaculture, for which we have developed inno-vative products. As a result of global population growth, rising affluence in emerging markets, and overfishing of the world’s oceans, the global aquaculture market is growing faster than other areas of livestock farming.
Customer concentration is basically low in our chemicals segments. None of the end-markets that we supply accounts for more than 20 percent of sales. Nevertheless, some operational units, especially in the Nutrition & Care and Resource Efficiency segments, and the Services segment have a certain dependence on key customers. In the operating business, this applies in particular to production facilities erected in the direct vicinity of major customers. The possible loss of a major customer could result in lower sales and in impairment losses on receivables and investments, as well as impacting our long-term raw material agreements or the financial structure of our affiliates.
2. Financial marketsAs a rule, liquidity, credit default, currency, and interest rate risks and the risks relating to pension obligations are man-aged centrally. All material financial risk positions are identi-fied and evaluated in accordance with Group-wide policies and principles. This forms the basis for selective hedging to limit risks. In the use of derivative and non-derivative financial
instruments to minimize the risks, Evonik applies the principle of separation of front office, risk controlling, and back office functions and takes as its guide the banking-specific “Mini-mum Requirements for Risk Management” (MaRisk) and the requirements of the German legislation on corporate control and transparency (KonTraG). Financial derivatives1 are only used in connection with corresponding hedged items.
Exchange rate volatilityTransaction-related exchange rate risks arise from the trans-lation of operating monetary assets and liabilities on the balance sheet into the functional currency of the respective Group company. The resulting net risk is normally hedged in full using derivatives. Further, our transaction-related currency management takes account of forecast cash inflows and out-flows, which are hedged on the basis of forecast transactions, with a target hedging rate of up to 75 percent. Material opportunities and risks may arise from the remaining unhedged items and from discrepancies between the actual future rates and the average rates used to hedge forecast transactions. Scenario analyses are performed to estimate and control such risks and opportunities. These focus on the main foreign currencies of relevance for the Evonik Group, the US dollar, Chinese renminbi yuan, and the Singapore dollar. In view of the rising importance of regions outside the euro zone, risks and opportunities relating to transactions in foreign currencies will increase in the long term. In addition, there are currency-related risks from the translation of separate financial statements. Further, economic risks arise because exchange rates influence our competitiveness in global markets.
Risk of changes in interest ratesPotential changes in capital market rates result in opportunities and risks. These comprise, on the one hand, changes in the fair value of fixed-interest financial instruments and, on the other, changes in interest payments on variable-rate financial instruments. To control these risks, when setting interest rate terms Evonik pays special attention to the structure of the fixed-floating relationship and uses interest rate swaps for further optimization where appropriate. Through the use of fixed-interest loans and interest rate hedging instruments, 77 percent of all financial liabilities were classified as fixed- interest as of the reporting date, and therefore had no material exposure to changes in interest rates.
1 Further details of the financial derivatives used and their recognition and measurement can be found in Note 9.2 to the consolidated financial statements.
49
Opportunity and risk reportMarket and competition opportunities and risks
CORPORATE GOVERNANCE SUPPLEMENTARY INFORMATIONCONSOLIDATED FINANCIAL STATEMENTS MANAGEMENT REPORT

Liquidity risksTo manage the Group’s solvency, Evonik uses central liquidity risk management.1 At its heart is a Group-wide cash pool. In addition, our financial independence is secured through a broadly diversified financing structure and our good rating. Overall, we believe that adequate financing instruments are available to ensure sufficient liquidity at all times.
Default risksDefault risks involve the risk of a loss if our debtors are fully or partially unable to meet their payment commitments. The credit risk of our customers and financial counterparties is therefore systematically examined when the contracts are concluded and monitored continuously afterwards. Limits are set for each contractual partner on the basis of internal or rating-based creditworthiness analyses.
Financial risks in connection with pension obligationsBoth opportunities and risks may arise from potential changes in the parameters used to evaluate our pension obligations.2 Changes, especially in interest rates, but also in mortality rates and rates of salary increases can alter the present value of pension obligations, which directly alters equity and can result in changes in the expenses for pension plans.
Market opportunities and risks, and liquidity and default risks relating to financial instruments also arise from the management of our pension plan assets. We counter these risks through an active risk management approach, combined with detailed risk controlling. Strategic management of the portfolios takes place via regular active/passive studies. To minimize risk, we use derivative hedging strategies where appropriate. The broad diversification of asset classes, portfolio sizes, and asset managers avoids cluster risks but there are unavoidable residual risks in the individual investments.
Impairment riskThe risk of asset impairment arises when the interest rate used in an impairment test rises, the forecast cash flows decline, or investment projects are halted. In the present business environment, we do not see a material risk of impairment of goodwill or individual assets. This also applies to investments, which are recognized in the balance sheet at their present market value in accordance with IAS 39.
3. Raw material markets For our business operations we require both high-volume commodities and smaller amounts of strategically relevant raw materials that have to meet highly demanding specifications. In both cases, Evonik is confronted with opportunities and risks relating to the increasing volatility of the availability of raw materials and their prices.
The operating business is dependent on the price of strate-gic raw materials, especially petrochemical feedstocks obtained directly or indirectly from crude oil. The price of renewable raw materials is also highly volatile and is driven, for example, by weather-dependent harvest yields. Structural changes in exchange rates are another significant aspect affecting price risks. These risks are hedged by optimizing the global focus of procurement activities, for example by accessing new markets and concluding market-oriented agreements. To further reduce the price risks with regard to products that have intensive raw material requirements, our aim is to pass both the risks and the opportunities of fluctuations in raw material prices along to other stages in the value chain where necessary, for example, through price escalation clauses.
The overriding aim of the procurement strategy is to secure the availability of raw materials on the best possible business terms. Short- and mid-term bottlenecks in the availability of precursors and intermediates are potential risks. As well as making preparations to use substitute suppliers in an emer-gency, we constantly observe the business performance of suppliers of selected key raw materials to anticipate bottle-necks and avoid risks.
Increasing volatility requires constant monitoring of the corresponding risks in the value chain.
The opportunities and risks arising from changes in the price of petrochemical feedstocks mainly affect the Perfor-mance Materials segment because of its high procurement volume. Risks relating to single sourcing and short-term restrictions on the availability of raw materials mainly affect the Nutrition & Care and Resource Efficiency segments.
Supply chainEnsuring that the supply chain meets sustainability criteria is a central aspect of procurement. We expect our suppliers to share our principles of entrepreneurial responsibility. We therefore have our own code of conduct for suppliers, based on the principles of the UN Global Compact, the Interna-tional Labour Standards issued by the International Labour
1 A detailed overview of liquidity risks and their management can be found in Note 9.2 to the consolidated financial statements. Details of the financing of the Evonik Group and action to protect liquidity can be found in the section on financial condition.
2 See Note 6.9 to the consolidated financial statements.
50 FINANCIAL REPORT 2017 EVONIK INDUSTRIES

Organization (ILO), and the Responsible Care initiative. Globally, this approach to sustainability is also supported by the sector initiative Together for Sustainability, of which Evonik is a founding member, through the use of standardized assess-ments. Evonik’s principal suppliers and the majority of critical suppliers have already taken part in these assessments, which are evaluated by an impartial sustainability rating company.
4. Human resourcesAs a global corporation, we respect the principles of the International Charter of Human Rights, the ten principles of the UN Global Compact, the OECD Guidelines for Multinational Enterprises, and the International Labour Standards of the International Labour Organization (ILO). Compliance with all employment laws is especially important to us.
Qualified specialists and managers are the basis for the achievement of our strategic and operational targets and thus a key competitive factor. Both the loss of key personnel and difficulties in attracting and hiring skilled and talented staff could therefore constitute a risk in this context.
To ensure that we can recruit and retain qualified staff to meet our future requirements, we offer varied employment opportunities worldwide, systematic personnel development, and competitive remuneration. As a responsible employer, Evonik helps the majority of employees build financial security to cover adverse risk factors and provide for retirement, either directly or through pension contributions to external institutions. The arrangements are based on the economic, legal, and tax situation in the various countries. In addition, we take care of our employees’ personal welfare through programs such as well@work. In this way, we retain and foster high-performers and talented employees, and position Evonik as an attractive employer for prospective staff. We also maintain close links to universities and professional associations to help us recruit suitable youngsters. Both our employer branding and many internal activities are aligned to diversity. The aim is to make Evonik even more attractive to talented specialists and managers.1
Strategic human resources planning identifies require-ments for a five-year period so timely steps can be taken to cover future personnel needs. We have thus largely limited potential human resources risks. Opportunities and risks for the development of personnel expenses could come, for example, from future collective agreements.
5. ProductionAs a specialty chemicals company, Evonik is exposed to the risk of business interruptions, quality problems, and unex-pected technical difficulties. We use complex production processes, some of them with interdependent production steps. Consequently, disruption and stoppages can adversely affect subsequent production steps and products. The outage of production facilities and interruptions in production work-flows could have a significant negative influence on business and earnings performance, and could also harm people and the environment. Group-wide policies on project and quality management, highly qualified employees, and regular main-tenance of our plants effectively minimize these risks. Insofar as is economically viable, we take out insurance to cover damage to our plants and sites and production stoppages, so the financial consequences of potential production risks are largely insured. Nevertheless, there is a risk of unforeseeable individual incidents.
6. Mergers & acquisitions Active portfolio management has high priority for Evonik as part of our value-based management approach. We have set out clear procedures for preparing, analyzing, and undertaking acquisitions and divestments. In particular, these include clear rules on accountability and approval processes. An intensive examination of potential acquisition targets (due diligence) is undertaken before they are acquired. This involves systematic identification of all major opportunities and risks and an appropriate valuation. Key aspects of this process are strategic focus, earnings power, and development potential on the one hand, and any legal, financial, and environmental risks on the other. New companies are rapidly integrated into the Group and thus into our risk management and controlling processes. Every transaction of this type entails a risk that integration of the business may not be successful or that integration costs may be unexpectedly high, thus jeopardizing realization of the planned quantitative and qualitative targets such as synergies.
In the integration of the Air Products specialty additives business and the Huber silica business, which were acquired in 2017, Evonik is paying special attention to the identified risks and the related measures.
Where businesses no longer fit our strategy or meet our profitability requirements despite optimization, we also examine external options. If a planned divestment is not achieved successfully, this could generate risks that impact the Group’s earnings position.
1 See also the section on employees.
51
Opportunity and risk reportMarket and competition opportunities and risks
CORPORATE GOVERNANCE SUPPLEMENTARY INFORMATIONCONSOLIDATED FINANCIAL STATEMENTS MANAGEMENT REPORT

7. Other A steady improvement in our cost position is necessary to make us more competitive. Our goal is to achieve a lasting reduction of €200 million in selling and administrative expenses by 2021. We will be working out specific measures in the coming months. Beside the potential to raise strategic flexibility and strengthen the operating units as a result of these programs and other restructuring projects, there are risks relating to their implementation. These include delays in implementation, the loss of key personnel, ineffectiveness of measures, and higher costs for the realization of measures. Stringent project management, including involving relevant stakeholders, is used to counter these risks.
8. Research & developmentOpportunities for Evonik also come from market-oriented research & development (R&D), which we regard as an important driver of profitable growth. We have a well-stocked R&D pipeline with a balanced mixture of short-, mid-, and long-term R&D projects. On the one hand, we constantly strive to improve our processes in order to strengthen our cost leadership, and on the other, our projects open the door to new markets and new fields of technology. Our project portfolio is consistently aligned to our growth engines and innovation growth fields.
Through our venture capital program, we take stakes in companies whose know-how can support us in joint develop-ments. Aspects of digitalization are becoming more significant.
Opportunities and risks in R&D relate to the viability of planned product and process developments and the timing of their implementation. We mainly see opportunities arising from the introduction of new products that go beyond our present planning in the innovation growth fields.
9. InvestmentsGenerating growth through investment entails risks as regards the proposed scope and timing of projects. These risks are addressed through established, structured processes. For instance, we take an extremely disciplined approach to implementing our investment program. Both projects that have not yet started and those that are already underway are constantly reviewed for changes in the market situation and postponed if necessary.
At the same time, we regard building new production facilities in regions with high growth momentum as an opportunity to generate further profitable growth. For example,
socio-economic megatrends are driving the development of our amino acids business. Following the successful start-up of a world-scale facility for DL-methionine in Singapore in fall 2014, we are planning to erect another plant at this com-plex by 2019. Global population growth means that demand for animal protein will continue to rise steadily in the future. Moreover, environmentally compatible agricultural produc-tion that makes more efficient use of resources is becoming more important worldwide for ecological reasons.
Resource efficiency is the basis for a large number of energy-efficient and environment-friendly products from Evonik. One example is precipitated silica, where we are a market leader. Combining precipitated silica with silanes allows the manufacture of tires with considerably lower rolling resistance than conventional auto tires, resulting in fuel savings of up to 8 percent. Here, future growth will be supported, among other factors, by the introduction of tire labeling reg-ulations in further countries. To utilize the resultant opportu-nities, we are selectively increasing our capacity for silica. For instance, a new production facility was taken into service in Brazil in 2016 and a further production facility for precipitated silica will be constructed in the USA by the end of 2018.
The investments described above are included in our mid-term planning.
10. Energy marketsEvonik requires considerable amounts of energy from a wide variety of sources for its chemical facilities and infrastructure. The main sources are natural gas, electricity, and coal. At sev-eral major sites, our power and steam requirements are fully or partially met by resource-efficient co-generation plants. In 2017, we continued our constant monitoring of trends on the national and international energy markets, enabling us to respond in a risk- and cost-conscious manner.
In countries where the sourcing of energy is not state- regulated, we procured and traded in energy and, where nec-essary, emission allowances (CO2 allowances) within the framework of defined risk strategies. The aim is to balance the risks and opportunities of volatile energy markets. Depending on how the general conditions develop, our segments could be faced with additional costs.
Here, risks could come from the structure of the fourth trading period of the emissions trading system (2021 – 2030), which could possibly include tighter rules for the allocation of free allowances. In the broader regulatory context of the energy markets, the way in which the cost of renewables is allocated among captive energy generators in Germany is of particular significance for Evonik, especially in view of the legal framework in Europe. That said, in principle we assume that
52 FINANCIAL REPORT 2017 EVONIK INDUSTRIES

captive generation will continue to contribute to the competi-tiveness of our German sites in the future. Possible costs could arise from the increase in grid feed fees and changes in the grid fee system due to the shift in German energy policy. Overall,
we are exposed to fluctuations in the market price and cost of various energy sources as a result of the specific demand/sup-ply situation and political events. These entail both opportuni-ties and risks.
6.4 Legal/compliance risks and opportunities
The opportunities and risks in this category are far more difficult to quantify than market and competition risks, as they not only have financial implications but often also involve reputational risks for the company and/or criminal law consequences. Provisions are set up on our balance sheet to cover the financial impact. These are reflected in our sys-tem as reducing risk. In view of this complexity, legal/com-pliance opportunities and risks are not assigned to the oppor-tunity/risk matrix illustrated above, nor are they allocated to the risk quantification classes.
1. Compliance, law, and the regulatory frameworkCompliance means lawful business conduct. All forms of cor-ruption, including “facilitation payments,” are prohibited at Evonik. All employees are subject to the binding regulations on fair treatment of each other and of business partners set out in our Code of Conduct. Risks could therefore result from failure to comply with the corresponding regulations. To minimize compliance risks, extensive training and sensiti-zation of employees is undertaken at face-to-face training sessions and/or through e-learning programs. Our Code of Conduct is binding for all employees of the Evonik Group worldwide, including the Executive Board and the gover-nance bodies of all Evonik companies. They are required to comply with the rules set forth in the Code of Conduct, to ensure they are familiar with its content, and to take part in the relevant training.1
Evonik monitors the observance of human rights along its value chain. To minimize the related risks, we require compliance with the Evonik Supplier Code of Conduct, our Global Social Policy, and the Policy Statement on Human Rights.
Evonik is exposed to legal risks, resulting, for example, from legal disputes such as claims for compensation, and from administrative proceedings and fines. In its operating busi-ness, the Evonik Group is exposed to liability risks, especially in connection with product liability, patent law, tax law, com-petition law, antitrust law, and environmental law. Changes in public law could also give rise to legal risks or materially
alter such risk positions. As a chemicals company with its own power plants, risks of particular relevance here are a possible change in the charges levied under the German Alternative Energies Act (EEG) and amendments to the Euro-pean emissions trading regulations.
Further, Evonik may be liable for guarantee claims relating to divestments. Structured post-transaction management closely monitors any liability and guarantee risks resulting from divestments. We have developed a concept involving high quality and safety standards to ensure a controlled approach to such legal risks.
Insurance cover has been purchased for the financial con-sequences of any damage that may nevertheless occur as a result of damage to property, product liability claims, and other risks. Where necessary, Evonik sets up provisions for legal risks.
At present, the relevant legal risks are the issues outlined below. As a matter of principle, we refrain from evaluating the opportunities and risks of potential legal proceedings or proceedings that have commenced, in order not to influence our position.
Evonik is currently involved in three ongoing appraisal proceedings in connection with the settlement paid to former shareholders. The background relates to the following corpo-rate restructuring measures: the domination and profit-and-loss agreement concluded with RÜTGERS GmbH (formerly RÜTGERS AG) in 1999, the squeeze-out of non-controlling interests in RÜTGERS AG (now RÜTGERS GmbH) in 2003, and the squeeze-out of non-controlling interests in Degussa AG (now Evonik Degussa GmbH) in 2006. The appraisal proceedings comprise a court review of the appropriateness of cash settlements or compensation.
In connection with the divestment of the former carbon black activities, the purchaser has requested indemnification from environmental guarantees relating to alleged infringe-ment of the US Clean Air Act. Evonik is currently engaged in a dispute with the purchaser on this.
Following a fine imposed by the EU Commission in 2002 on various methionine producers (including Evonik), the Bra-zilian antitrust authorities have filed proceedings against
1 See declaration on corporate governance.
53CORPORATE GOVERNANCE SUPPLEMENTARY INFORMATIONCONSOLIDATED FINANCIAL STATEMENTS MANAGEMENT REPORT
Opportunity and risk reportMarket and competition opportunities and risksLegal/compliance risks and opportunities

Evonik in connection with the delivery of methionine to Brazil. Evonik is of the opinion that a fine cannot be imposed due to the statute of limitations.
Furthermore, following completion of administrative proceedings outside Germany, it is not improbable that indi-vidual customers could file claims for compensation.
With regard to employment law, there are risks relating, for example, to recalculation of pension commitments entered into by Evonik and its legal predecessors.
Tax risks relate to differences in the valuation of business processes, capital expenditures, restructuring by the financial authorities, tax reforms in some countries, and potential retro-active payments in the wake of tax audits.
2. Information security and the protection of intellectual property and know-how
Innovations play a significant part in Evonik’s business success. Protecting know-how and intellectual property is therefore of central importance. With markets growing ever closer and the globalization of business, a competent approach to protecting our competitive edge is a key element in our investment activities. The company is also exposed to a risk that intellectual property cannot be adequately protected, even through patents, especially when building new production facilities in certain countries. Similarly, the transfer of know-how in joint ventures and other forms of cooperation also entails a risk of an outflow of expertise from Evonik. For example, in the event of the possible separation from a joint venture or other cooperation partner there is no guarantee that the business partner will not continue to use know-how transferred or disclose it to third parties, thereby damaging Evonik’s competitive position.
Measures to minimize and avoid such risks are coordinated by the Corporate Security Division and the Intellectual Property Management unit.
IT risksElectronic information processing is a key element in Evonik’s success. Therefore, sustained protection of information and the availability, confidentiality, and integrity of IT-assisted business processes are especially important. If these systems and infor-mation are compromised, this can have a detrimental effect on our business and production processes.
To protect them and the associated knowledge from cyber criminality (including industrial espionage and manipulation through electronic attacks) from both within and outside the Group and to minimize such risks, Evonik has developed an IT security strategy and established organizational and technical measures. The secure use of information systems is described in binding Group-wide policies and regulations and driven forward and monitored by an internal control system.
In view of the considerable and continuously rising threat, we regularly review our security measures, implement risk-based countermeasures as required, and adapt them wherever necessary. Training, including compulsory training in some cases, and constant information, for example, via the Evonik Group intranet and internal social networking platforms, keep employees aware of the need for IT security. Strictly confidential information that Evonik needs to protect is iden-tified and corresponding protective measures are imple-mented. At the same time, managers’ awareness of this issue is raised. The Evonik Computer Emergency Response Team (CERT) is networked externally at various levels (Germany: member of the German CERT network, Europe: member of TF-CSIRT, globally: member of FIRST).
3. Environmental risks (environment, safety, health, quality)
Evonik is exposed to risks in the areas of occupational and plant safety. For example, workplace accidents and incidents in production facilities can cause injury to our employees or substance releases that impair the health of our employees and local residents. We counter these risks by living our understanding of safety as a holistic management task at all management levels. Our guiding principles for safety are binding for all managers and employees. In this way, Evonik makes it clear that safety is a central element in its corporate culture. We analyze accidents and incidents carefully so we can learn from them. Moreover, audits are conducted at the request of the Executive Board to check the controlled handling of such risks.
The aim of our product stewardship is timely identification and evaluation of possible health and environmental risks in our portfolio. We examine the entire value chain of each of our products—from procurement of the raw materials to delivery to our industrial customers, who receive all relevant information on the handling and disposal of our products. That includes, for example, safety data sheets and technical information sheets. As well as complying with all statutory requirements such as the European Chemicals Regulation (REACH) and the Globally Harmonized System of Classification and Labelling of Chemicals (GHS), product stewardship at Evonik includes voluntary commitments that go beyond these regulations.
Further risks may result from environmental regulations.Furthermore, the Group-wide environmental protection
and quality management system, which is validated as conforming to international standards, undergoes constant development and improvement. As a responsible chemicals company, Evonik ensures that such processes are operated in accordance with the principles of the global Responsible Care initiative and the UN Global Compact.
54 FINANCIAL REPORT 2017 EVONIK INDUSTRIES

Adequate provisions have been established to secure or remediate contaminated sites where necessary. Alongside the need to adjust environmental provisions identified through
structured internal processes, for example as a result of changes in the regulatory framework, further unplanned additions to such provisions may be necessary.
6.5 Process/organization risks
1. GeneralThis risk category covers the interface between risk manage-ment and the internal control system (ICS). In this category, risks generally result from specific process shortcomings. Alongside general weaknesses, these include, in particular, risks within the ICS and the accounting-related ICS. Classifi-cation is therefore based on the list of processes drawn up by Corporate Audit. Starting from key corporate processes, the existence of relevant control objectives and standard controls for the main risks identified is checked. In view of the types of risk in this category, a purely qualitative assessment is normally used.
The evaluation of specific risks resulting from weaknesses in processes within the organizational units showed very little scope to optimize existing processes because of the efficacy of the current controls. Corresponding scope for improve-ment has been identified. There are therefore no signs of systematic errors in the Evonik Group’s ICS.
2. Internal control system for financial accountingThe main financial reporting risks are identified in the ICS through a quantitative and a qualitative analysis. Controls are defined for each risk area of the accounting process. Their efficacy is reviewed at regular intervals and improved where necessary. All elements of the control process are verified by Internal Audit on the basis of random samples.
To ensure the quality of financial statements we have a Group-wide policy which defines uniform accounting and valuation principles for all German and foreign companies included in the consolidated financial statements for the Evonik Group. The majority of companies have delegated the preparation of their financial statements to Global Financial Services. Through systematic process orientation, standard-ization, and the utilization of economies of scale, this lever-ages sustained cost benefits and also improves the quality of accounting. Global Financial Services has developed a stan-dardized control matrix for the internal control system for financial accounting. This is implemented in the three global
shared service centers: in Offenbach (Germany) for the Germany region, Kuala Lumpur (Malaysia) for the Asia region, and San Jose (Costa Rica) for the Americas region. The aim is to ensure a uniform global standard for the internal control system for financial accounting. In principle, the annual financial statements of all fully consolidated companies and all joint operations are audited. In the few exceptions from this rule, an upfront risk assessment is performed with the auditor.
All data are consolidated by the Accounting Division using the SAP SEM-BCS system. Group companies submit their financial statements via a web-based interface. A range of technical validations is performed at this stage. Computerized and manual process controls and checking by a second per-son are the key oversight functions performed in the financial reporting process. The preparation of the monthly consoli-dated income statement and publication of three quarterly reports allow us to gain experience with new accounting issues and provide a sound basis for plausibilization of the year-end accounts. The Executive Board receives monthly reports and quarterly reports are submitted to the Audit Committee of the Supervisory Board.
Aspects that may represent opportunities or risks for financial reporting in the future are identified and evaluated early through the risk management system. This ensures that risk management can be closely aligned to controlling and accounting processes.
55CORPORATE GOVERNANCE SUPPLEMENTARY INFORMATIONCONSOLIDATED FINANCIAL STATEMENTS MANAGEMENT REPORT
Opportunity and risk reportLegal/compliance risks and opportunitiesProcess/organization risks

7. Report on expected developments7.1 Economic background
Global economy expected to grow slightly faster in 2018We expect global economic conditions in 2018 to be slightly better than in 2017. Overall, we anticipate slightly stronger global momentum, with a growth rate of 3.1 percent in 2018, compared with 3.0 percent in 2017.
We assume that the positive economic trend will continue in Western and Eastern Europe, albeit with slightly lower growth than in 2017. This should be supported, among other things, by continued monetary policy stimulation, a weaker fiscal policy headwind, and rising confidence among companies and private households. Nevertheless, the economic develop-ment could be marred by political risks and risks in the financial sector.
In North America, the economy should recover further. Growth will be driven by consumer spending, supported by falling unemployment and rising domestic incomes and assets. The US tax reform will reduce the tax burden on com-panies and private individuals and will provide moderate eco-nomic impetus through an increase in corporate investment
and private consumption. In the light of increasing inflation, the Federal Reserve in the USA will continue its cautious interest rate rises.
Thanks to the economic upturn in Brazil, growth will pick up further in Central and South America. However, political uncertainty, high unemployment, and private debt are holding back a significant improvement in the economic prospects for this region.
Growth will remain high in the Asia-Pacific region. We assume that lower growth in investment and lending, plus environmental policy, will dampen the Chinese economy slightly in the future. Economic growth in Japan will weaken slightly compared with the previous year. In India, by contrast, growth will pick up again following the reform of the cash system and the introduction of a uniform nationwide value- added tax.
The projection for the global economy is marked by some uncertainty. At present, the main risks relate to geopolitical uncertainty caused by the large number of crises. The global economy could, however, develop differently from our expectations, especially as a result of central bank action. Alongside the as yet unclear impact of the UK’s exit from the European Union, uncertainty about the United States’ eco-nomic policy has increased. Furthermore, global growth could be dampened if the slowdown of the Chinese economy gathers pace. In view of the stable development of raw material prices and exchange rates, we estimate that the rise in global inflation will be moderate. As of the start of 2018, we expect raw materials to rise as the markets recover in the second half of the year. Reasons for this are, on the one hand, the present development of oil prices and, on the other, the Chinese gov-ernment's tougher stance on environmental policy. Overall, we expect prices of Evonik-specific raw materials to be slightly higher than in 2017. Consequently, we estimate that in 2018 Evonik’s raw material index will be slightly higher than in 2017.
7.2 Outlook
Basis for our forecast:• Global growth of 3.1 percent• Euro/US dollar exchange rate: US$1.20 (2017: US$1.13)
• Internal raw material cost index slightly higher than in the prior year
3.03.1
3.13.8
2.02.2
2.3
1.5
4.9
3.1
1.3
5.0
2.1
2.7
GDP forecast for 2018 C29
in %
Global GDP
Western Europe
Eastern Europe
North America
Central and South America
Asia-Pacific
Middle East, Africa
2018 (forecast) 2017 (expected)
1.0 2.0 3.0 4.0 5.00
56 FINANCIAL REPORT 2017 EVONIK INDUSTRIES

Sales and earningsWe aim to grow sales and earnings again in 2018.
We anticipate that sales will grow slightly in 2018 (2017: €14.4 billion). Thanks to our strong market positions and strategic alignment to our four growth engines, we assume continued high demand for our products and perceptible volume growth. Selling prices are expected to be stable or rise slightly in most businesses. Overall, we anticipate a slight decline at Group level due to the expected development of the Performance Materials segment.
We also expect that operating earnings will improve compared with the prior year (€2,360 million). At the same time, there will be a further structural improvement in our earnings quality. In addition to higher contributions from our innovation growth fields, the businesses acquired from Air Products and Huber will play a considerable part in this. That will further reduce our dependence on individual products.
Specifically, we expect adjusted EBITDA to be between €2.4 billion and €2.6 billion. The growth in our operating earnings should be primarily organic. In addition, we assume positive earnings effects from the full-year consolidation of the Huber silica business, further synergies from the integration of the businesses acquired from Air Products and Huber, and a positive earnings contribution from the efficiency enhancement program we have launched.
We assume that earnings will continue to develop positively in the majority of businesses in the Nutrition & Care segment. Our solutions for sustainable animal nutrition and our inno-vative products and services for pharmaceuticals, medical technology, and cosmetics should make a significant contri-bution to this. As well as organic growth, we expect to leverage additional positive earnings effects from synergies resulting from the integration of the Air Products business. The annual average prices for essential amino acids for animal nutrition are expected to be stable compared with the prior year. At the same time, we assume sustained volume growth in this area. Overall, in the Nutrition & Care segment earnings are expected to be slightly higher than in the previous year.
We also anticipate that the Resource Efficiency segment will continue the very successful business performance of previous years. Further strong volume growth should bring another perceptible rise in earnings. Our broad portfolio of high-performance materials for environment-friendly and energy-efficient system solutions offers the best basis for a
continuation of the positive organic earnings trend. In addition, earnings growth will be boosted by additional earn-ings from the Huber silica business and synergies from the integration of the Air Products and Huber businesses.
The Performance Materials segment should get off to a good start in 2018. In addition to the measures already in place to raise efficiency, which are increasingly feeding through to earnings, the continuation of the favorable supply/demand situation, especially for methacrylates, is proving beneficial. In the remainder of the year, however, this segment is unlikely to achieve the good level of 2017. Overall, earnings in the Performance Materials segment will not achieve the prior-year level.
The earnings impact of slightly higher raw material prices may affect the various businesses differently, but should balance out across the portfolio as a whole, partly through our ability to recoup most of the rises through selling prices.
In 2018, the return on capital employed (ROCE) should again be above the cost of capital (10.0 percent before taxes) and will probably be around the prior-year level (2017: 11.2 percent).
Financing and investmentsWe expect capital expenditures to be around €1 billion in 2018. We have set ourselves a goal of keeping total capital expenditures below the prior-year level (2017: €1.1 billion), even though investment in our world-scale plant for feed additives in Singapore will double compared with 2017 to around €300 million. Our strict capital discipline and clear focus on our four growth engines will contribute to this.
Alongside the expected earnings growth and increased cost-awareness, our strict capital discipline will also result in a slight increase in the free cash flow (2017: €511 million).
Occupational and plant safetyWe assume that the accident frequency1 indicator will be stable in 2018 (2017: 1.16) and expect it to be below the upper limit of 1.30 defined for 2018. Our long-term goal is still a sustained value of less than 1.00. We anticipate that we can achieve a slight improvement in our plant safety indicator, incident frequency2 (2017: 1.11), and that it will remain below the upper limit of 1.10.
1 Number of accidents involving Evonik employees and contractors’ employees under Evonik's direct supervision per 1 million working hours.2 Number of incidents per 1 million working hours.
57CORPORATE GOVERNANCE SUPPLEMENTARY INFORMATIONCONSOLIDATED FINANCIAL STATEMENTS MANAGEMENT REPORT
Report on expected developmentsOutlook

Report of the Supervisory Board 59
Corporate governance report and declaration on corporate governance (part of the management report) 66
Further information on corporate officers 75
Chairmen of the Management Boards of the main management companies within the Evonik Group 78
Remuneration report (part of the management report) 79
Takeover-relevant information (part of the management report) 88
CORPORATE GOVERNANCE
58 FINANCIAL REPORT 2017 EVONIK INDUSTRIES

In 2017, the Supervisory Board of Evonik Industries AG (Evonik) performed the obligations defined by law and the Articles of Incorporation correctly and with the utmost care and regularly and conscientiously supervised the work of the
Executive Board. We supported the Executive Board by pro-viding advice on the management and strategic development of the company.
Collaboration between the Executive Board and Supervisory Board
The Executive Board always gave us full and timely informa-tion on all material issues affecting the Group and involved us in all fundamental decisions affecting the company. Key areas were business performance and the situation of the company, along with aspects of business policy, corporate planning, and Evonik’s ongoing strategic development.
The Supervisory Board’s oversight of the Executive Board centered in particular on ensuring the correct, orderly, expe-dient, and cost-effective management of Group-wide busi-ness activities. The content and scope of reporting by the Executive Board complied with the law, the principles of
good corporate governance, and the requirements set by the Supervisory Board.
Section 16 of the Articles of Incorporation of Evonik Industries AG and the Rules of Procedure of the Supervisory Board set out business activities and measures of fundamental impor-tance on which the Executive Board is required to seek the approval of the Supervisory Board or, in some cases, individual committees. In the past fiscal year, the Supervisory Board took decisions on business activities and measures submitted by the Executive Board after examining them and discussing them with the Executive Board.
Meetings and work of the Supervisory Board
We examined all issues of importance to the company at five meetings, on March 1, May 23, June 29, September 28, and December 13, 2017. In addition, the Supervisory Board adopted one resolution in June via a written circulation procedure.
The work of the Supervisory Board was again supported and prepared by its committees in 2017. The committees and their members in the year under review were as follows:• Executive Committee: Dr. Werner Müller (Chairman),
Edeltraud Glänzer (Deputy Chairwoman), Ralf Hermann, Dr. Volker Trautz.
• Audit Committee: Dr. Siegfried Luther (Chairman and financial expert within the meaning of Section 100 Para-graph 5 German Stock Corporation Act/AktG and Section 5.3.2 of the German Corporate Governance Code), Karin Erhard (Deputy Chairwoman), Prof. Barbara Grunewald, Norbert Pohlmann, Dr. Wilfried Robers, Angela Titzrath.
• Finance and Investment Committee: Michael Rüdiger (Chairman), Ralf Hermann (Deputy Chairman), Martin Albers, Prof. Aldo Belloni (from May 24, 2017), Stephan Gemkow (until May 23, 2017), Edeltraud Glänzer, Frank Löllgen, Dr. Werner Müller, Ulrich Weber.
• Nomination Committee: Dr. Werner Müller (Chairman), Dr. Volker Trautz, Ulrich Weber.
• Mediation Committee: Dr. Werner Müller (Chairman), Edeltraud Glänzer (Deputy Chairwoman), Ralf Hermann, Dr. Volker Trautz.
Report of the Supervisory Board
59
Report of the Supervisory Board
MANAGEMENT REPORT SUPPLEMENTARY INFORMATIONCONSOLIDATED FINANCIAL STATEMENTS CORPORATE GOVERNANCE

The tasks allocated to these committees are described in detail in the corporate governance report on pages 71 to 72.
The Executive Committee held seven meetings in 2017. The Audit Committee and the Finance and Investment Committee each held four meetings and the Nomination Committee met once in the reporting period. There was no need for the Mediation Committee to meet during the reporting period. The chairperson or deputy chairperson of each committee reported regularly at the meetings of the Supervisory Board on the issues discussed and the outcome of all committee meetings. The Supervisory Board therefore always received extensive information on all matters of significance in the Evonik Group.
At its meeting in March, the Supervisory Board focused on examining the annual financial statements, which had first been considered in detail by the Audit Committee, and pre-paring for the Annual Shareholders’ Meeting. It also adopted the corporate governance report for 2016, discussed the bonus payments to the Executive Board for 2016 and their targets for 2017, and set the target for the proportion of women on the Executive Board in the period from July 1, 2017 to June 30, 2022. The meeting on May 23 was dedicated to supplementary information and preparation shortly before the Annual Shareholders’ Meeting. At its meeting in June, the Supervisory Board aligned its Rules of Procedure to the latest amendments to the German Corporate Governance Code and to the requirements of the legislation to strengthen non-financial reporting by companies in their (combined) management report (CSR Directive Implementation Act). Further, the Supervisory Board accepted the human resources report and adopted measures relating to the 2017 efficiency review, based on the extensive preparatory work done by the Audit Committee. At its September meeting, the Supervisory Board accepted the report on corporate strategy, examined the implications of the CSR Directive Implementa-tion Act, and established that the external auditors were not required to audit Evonik's non-financial declaration. At its meeting in December, the Supervisory Board mainly discussed the budget for 2018 and the mid-term planning for the period up to 2020. In addition, at this meeting the Supervisory Board adopted the declaration of conformity in accordance with Section 161 of the German Stock Corporation Act (AktG) and the final report on the implementation of the measures adopted in response to the efficiency review. The amendments to the Rules of Procedure adopted by the Supervisory Board at this meeting on the basis of the preliminary examination by the Executive Committee and the approval of the amendments to the Executive Board’s Rules of Procedure are designed to strengthen and extend the scope of the segment managers to
take entrepreneurial decisions. In addition, the Supervisory Board amended the targets for its composition, thereby increasing flexibility in the selection of suitable candidates.
The Executive Committee dealt with the following issues during the year under review: changes on Evonik’s Executive Board; the agenda and proposals for resolutions for the Annual Shareholders’ Meeting; the bonus payments to members of the Executive Board for 2016 and their targets for 2017; Evonik's business situation, current projects, and the share price; optimization of global processes and cost structures in administration and sales.
At its meeting in February, the Audit Committee mainly examined the annual financial statements of Evonik Industries AG, the consolidated financial statements, the proposal for the election of the auditor for fiscal 2017, and the recommendation to the Supervisory Board of a target for the proportion of female members of the Executive Board. On the basis of the reports submitted by the Executive Board, it examined the effectiveness of the internal control system, opportunity and risk management and internal auditing, as well as compliance issues. The principal items discussed at the meeting in May were the quarterly financial report as of March 31, 2017 and the outcome of the 2017 efficiency review, including preparing the recommendations to the Supervisory Board. The meeting in August focused on the interim financial report as of June 30, 2017 and the appointment of the auditor of the consoli-dated financial statements to perform a review of the quar-terly financial report as of September 30, 2017. In November, the main issues discussed by the Audit Committee, apart from the financial report on the third quarter and the report on corporate governance, including the recommendation to the Supervisory Board on a profile of skills and expertise and a diversity concept, were the amendments to the Rules of Procedure of the Supervisory Board and the Executive Board.
The attention of the Finance and Acquisitions Committee in the reporting period was mainly concentrated on growth projects and on monitoring the integration of the acquisitions into the Group (see page 61 “Investments and acquisitions”).
As part of its ongoing succession planning, at the Super-visory Board meeting in November 2016, the Nomination Committee recommended that Prof. Aldo Belloni should be nominated for election to the Supervisory Board at the Annual Shareholders’ Meeting on May 23, 2017. At its meet-ing on November 4, 2017, the committee focused principally on preparing the upcoming elections to the Supervisory Board in 2018.
In addition— apart from the reports required by law—the Supervisory Board and its committees examined and discussed the following issues in detail:
60 FINANCIAL REPORT 2017 EVONIK INDUSTRIES

Performance and situation of the Evonik Group
Evonik’s operating business developed successfully in 2017. The Group reported pleasing volume growth thanks to high global demand for its products. Selling prices developed differently in the segments, but increased overall. Thanks to
5 percent organic sales growth and consolidation of the busi-nesses acquired, the Evonik Group increased sales by 13 percent to €14,419 million. Adjusted EBITDA improved 9 percent to €2,360 million.
Investments and acquisitions
Our discussions covered the main growth projects, including investment controlling of ongoing projects, and the develop-ment of sales, earnings, and headcount, as well as the financial and earnings position. The projects considered in particular detail by the Supervisory Board and the Finance and Investment Committee included: • Construction of a production facility for omega-3 fatty
acids for aquaculture (USA) • Acquisition of Dr. Straetmans GmbH (Germany)• Expansion of production capacity for fumed silicas
( Belgium)• Construction of an integrated production facility for oleo-
chemical specialty surfactants (Brazil)
• Continuation of a joint venture for the production of superabsorbents (Saudi Arabia)
• Construction and operation of a lysine production plant (Brazil)
• Expansion of capacity for high-molecular polyester ( Germany)
• Ending an acrylic acids joint venture (Germany and USA)• Capacity utilization at a hydrogen peroxide plant in Jilin
(China)
The Supervisory Board and its committees also closely moni-tored the integration of the acquired specialty additives and silica businesses into the Evonik Group.
Other issues addressed by the Supervisory Board and its committees
In addition to the issues and developments outlined above, the main topics addressed by the Supervisory Board and its committees in 2017 were:• Proposals for resolutions to be adopted at the Annual
Shareholders’ Meeting in May 2017, especially the pro-posal of the Supervisory Board to the Annual Shareholders’ Meeting on the appointment of the auditor
• Amendments to the Rules of Procedure of the Supervisory Board, including setting up an Innovation and Research Committee with effect from January 1, 2018 in an advisory capacity to discuss the Group’s innovation and research strategy
• Decision on the members of the Innovation and Research Committee as of January 1, 2018: Prof. Barbara Albert
(Chairwoman), Frank Löllgen (Deputy Chairman), Carmen Fuchs, Dr. Werner Müller, Anke Strüber-Hummelt, Dr. Volker Trautz
• Employee share program 2018• Optimization of global process and cost structures in
administration and sales• Appointment of Christian Kullmann as Chairman of the
Executive Board (see also “Personnel issues relating to the Executive Board and Supervisory Board” on page 65)
• Resolution on the Declaration of Conformity in compli-ance with Section 161 of the German Stock Corporation Act (AktG) in December 2017, and the Supervisory Board’s report to the Annual Shareholders' Meeting.
61
Report of the Supervisory Board
MANAGEMENT REPORT SUPPLEMENTARY INFORMATIONCONSOLIDATED FINANCIAL STATEMENTS CORPORATE GOVERNANCE

Individual disclosure of the attendance at meetings of the Supervisory Board and its committees T27
Supervisory Board member
Supervisory Board
Executive Committee
Finance & Investment Committee
Audit Committee
Nomination Committee
Mediation Committee
Presence in % Presence in % Presence in % Presence in % Presence in % Presence in %
Dr. Werner Müller (Chairman) 5/5 100 7/7 100 4/4 100 1/1 100 0/0
Edeltraud Glänzer (Deputy Chairwoman) 5/5 100 7/7 100 4/4 100 0/0
Martin Albers 5/5 100 4/4 100
Prof. Barbara Albert 5/5 100
Prof. Aldo Belloni (from May 24, 2017) 3/3 100 3/3 100
Karin Erhard 5/5 100 4/4 100
Carmen Fuchs 5/5 100
Stephan Gemkow (until May 23, 2017) 2/2 100 0/1 0
Prof. Barbara Grunewald 5/5 100 4/4 100
Ralf Hermann 5/5 100 7/7 100 4/4 100 0/0
Prof. Wolfgang A. Herrmann 5/5 100
Frank Löllgen 5/5 100 3/4 75
Dr. Siegfried Luther 4/5 80 4/4 100
Norbert Pohlmann 5/5 100 4/4 100
Dr. Wilfried Robers 5/5 100 4/4 100
Michael Rüdiger 5/5 100 4/4 100
Anke Strüber-Hummelt 5/5 100
Ulrich Terbrack 5/5 100
Angela Titzrath 5/5 100 4/4 100
Dr. Volker Trautz 5/5 100 7/7 100 1/1 100 0/0
Ulrich Weber 3/5 60 3/4 75 1/1 100
Corporate governance
The Supervisory Board is committed to the principles of good corporate governance. This is based principally on recogni-tion of the provisions of the German Corporate Governance Code in the present version of February 7, 2017. This does not exclude the possibility of departing from its recommen-dations and suggestions in legitimate individual cases.
Since it is listed on the stock exchange, Evonik is subject to the obligation contained in Section 161 of the German Stock Corporation Act (AktG) to submit a declaration of the extent to which it has complied with or will comply with the German Corporate Governance Code and which recommendations have not been and will not be met, together with the reasons for this (Declaration of Conformity). In December 2017, the Executive Board and Supervisory Board issued a declaration of conformity, which is published on the company’s website and in the corporate governance report on page 66.
The Supervisory Board has set objectives for its composition, which are taken into account by the Shareholders’ Meeting
when electing members of the Supervisory Board. The most recent revision of the objectives in December, including raising the age limit, enhances flexibility in the selection of suitable candidates for elections to the Supervisory Board. The objec-tives for the composition of the Supervisory Board are met in its present composition and proposals for its future composition.
In 2017, the Supervisory Board complied with the new rec-ommendation in the Corporate Governance Code that a profile of skills and expertise should be drawn up for the Supervisory Board as a whole and that, alongside the objectives, meeting the profile should be taken into account in the elections of Supervisory Board members. A full overview including details of the current status of implementation can be found in the corporate governance report on page 71.
The Supervisory Board comprises seven women and thirteen men. In accordance with its own targets and in compliance with statutory requirements, it therefore meets the minimum of 30 percent women and 30 percent men.
62 FINANCIAL REPORT 2017 EVONIK INDUSTRIES

At least five members of the Supervisory Board should be independent within the meaning of Section 5.4.2 of the German Corporate Governance Code. To ensure this, a Supervisory Board member should not have any personal or business rela-tions with the company, its executive bodies, a controlling shareholder, or an enterprise associated with the latter which may cause a substantial and not merely temporary conflict of interests. The Supervisory Board considers all current members to be independent, namely because, in its view, election as an employee representative does not conflict with such inde-pendence.
Further details of the diversity requirements and the list of objectives are set out in the corporate governance report on page 73.
The members of the Supervisory Board will receive atten-dance fees and purely fixed remuneration for their work on the Supervisory Board in 2017 and any membership of com-mittees (see page 87).
Members of the Supervisory Board of Evonik Industries AG had no conflicts of interest in 2017.
Moreover, there were no consultancy, service or similar con-tracts with any members of the company’s Supervisory Board in 2017. Furthermore, there were no transactions between the company or a company in the Evonik Group on the one hand and Supervisory Board members and related parties on the other.
Audit of the annual financial statements
PricewaterhouseCoopers Aktiengesellschaft Wirtschaftsprü-fungsgesellschaft (PwC), Düsseldorf (Germany) has audited the financial statements of Evonik Industries AG as of December 31, 2017 prepared in accordance with the German Commercial Code (HGB), the consolidated financial state-ments for the Evonik Group prepared using the International Financial Reporting Standards (IFRS), as permitted by Section 315a Paragraph 1 of the German Commercial Code (HGB), and the combined management report for Evonik Industries AG and the Evonik Group, and has endorsed them with an unqualified opinion pursuant to Section 322 of the German Commercial Code (HGB). The Supervisory Board awarded the contract for the audit of the annual financial statements of Evonik Industries AG and the consolidated financial state-ments of the Evonik Group in line with the resolution taken by the Shareholders' Meeting on May 23, 2017. In accordance with Section 317 Paragraph 4 of the German Commercial Code (HGB), the annual audit includes an audit of the risk identification system. The audit established that the Executive Board has taken the steps required in compliance with Section 91 Paragraph 2 of the German Stock Corporation Act (AktG) to establish an appropriate risk identification system and that this system is suitable for timely identification of developments that could represent a threat to the continued existence of the company.
The Executive Board submitted the above documents, together with the auditor's reports and the Executive Board’s proposal for the distribution of the profit, to all members of the Supervisory Board to prepare for the meeting of the Supervisory Board on March 5, 2018. At its meeting on Feb-ruary 26, 2018 the Audit Committee discussed the annual financial statements, auditor’s reports, and the proposal for the distribution of the profit in the presence of the auditor to prepare for the subsequent examination and discussion of these documents by the full meeting of the Supervisory Board. Further, the Audit Committee requested the auditor to
report on its collaboration with the internal audit department and other units involved in risk management, and on the effectiveness of the risk identification system with respect to accounting. The auditor reported that the Executive Board had taken the steps required in compliance with Section 91 Paragraph 2 of the German Stock Corporation Act (AktG) to establish an appropriate risk identification system and that this system is suitable to ensure timely identification of develop-ments that could represent a threat to the continued existence of the company.
The Supervisory Board conducted a thorough examination of the annual financial statements of Evonik Industries AG, the consolidated financial statements for the Evonik Group, the combined management report for fiscal 2017, and the Execu-tive Board's proposal for the distribution of the profit and—on the basis of explanations of these documents by the Executive Board—discussed them at its meeting on March 5, 2018. The auditor was also present at this meeting and reported on the main findings of the audit. He also answered questions from the Supervisory Board about the type and extent of the audit and the audit findings. The discussion included the audit of the risk identification system. The Supervisory Board shares the Audit Committee's assessment of the effectiveness of this system.
In this way, the Supervisory Board convinced itself that the audit had been conducted properly by the auditor and that both the audit and the audit reports comply with the statutory requirements. Following its thorough examination of the annual financial statements of Evonik Industries AG, the con-solidated annual financial statements, and the combined man-agement report (including the declaration on corporate gov-ernance), the Supervisory Board declares that, based on the outcome of its examination, it has no objections to raise to the annual financial statements of Evonik Industries AG, the consolidated annual financial statements, and the combined
63
Report of the Supervisory Board
MANAGEMENT REPORT SUPPLEMENTARY INFORMATIONCONSOLIDATED FINANCIAL STATEMENTS CORPORATE GOVERNANCE

management report. In line with the recommendation made by the Audit Committee, the Supervisory Board has therefore accepted the audit findings. At its meeting on March 5, 2018, the Supervisory Board therefore endorsed the annual financial statements of Evonik Industries AG and the consolidated annual financial statements. The annual financial statements for 2017 are thus ratified. The Supervisory Board concurs with the Executive Board’s assessment of the situation of the company
and the Group as expressed in the combined management report. The Supervisory Board considered the Executive Board’s proposal for the distribution of the profit, in particular with a view to the dividend policy, the impact on liquidity, and its regard for shareholders' interests. This also included an expla-nation by the Executive Board and a discussion with the auditor. The Supervisory Board then voted in favor of the proposal put forward by the Executive Board for the distribution of the profit.
Review of the separate combined non-financial report
In compliance with the CSR Directive Implementation Act, Evonik issued a separate combined non-financial report ( Sections 289b Paragraph 3 and 315 Paragraph 3 HGB) for the first time for fiscal 2017 (Section 80 of the Introductory Act to the German Commercial Code/EGHGB). The principal compo-nents of the report are employee and environmental aspects,
respect for human rights, prevention of bribery and corruption, social issues, and the supply chain. The Supervisory Board examined this report at its meeting on March 5, 2018 on the basis of a preliminary review by the Audit Committee and has no objections to the report.
Examination of the report by the Executive Board on relations with affiliated companies
The Executive Board has prepared a report on relations with affiliated companies in 2017. This was examined by the auditor, who issued the following unqualified opinion in accordance with Section 313 of the German Stock Corporation Act (AktG):
“In accordance with our professional audit and judgment we confirm that1. the factual disclosures made in this report are correct2. the company’s expenditures in connection with the legal
transactions contained in the report were not unreason-ably high.”
The Executive Board submitted the report on relations with affiliated companies and the associated auditor’s report to all members of the Supervisory Board to enable them to prepare for the Supervisory Board meeting on March 5, 2018.
The Audit Committee conducted a thorough examination of these documents at its meeting on February 26, 2018 to prepare for the examination and resolution by the full Super-visory Board. The members of the Executive Board provided detailed explanations of the report on relations with affiliated companies and answered questions on it. The auditor, who was present at this meeting, reported on the main findings of the audit of the report on relations with affiliated companies and answered questions raised by members of the Audit Committee. The members of the Audit Committee acknowl-edged the audit report and the audit opinion. The Audit
Committee was able to convince itself of the orderly nature of the audit and audit report and, in particular, came to the conclusion that both the audit report and the audit conducted by the auditor comply with the statutory requirements. The Audit Committee recommended that the Supervisory Board should approve the results of the audit and, since it was of the opinion that there were no objections to the Executive Board's declaration on the report on relations with affiliated companies, should adopt a corresponding resolution.
The Supervisory Board discussed the report on relations with affiliated companies at its meeting on March 5, 2018. At this meeting too, the members of the Executive Board provided detailed explanations of the report on relations with affiliated companies and answered questions on it. Moreover, the auditor was present at this meeting of the Supervisory Board and reported on the main findings of the audit of the report on relations with affiliated companies and answered ques-tions from members of the Supervisory Board. On this basis, the Supervisory Board ascertained that, under the circum-stances known at the time they were undertaken, the com-pany’s expenditures in connection with the transactions out-lined in the report on relations with affiliated companies were not unreasonably high and compensation had been received for any disadvantages. In particular, it obtained an explanation of the principles used to determine the relevant activities and the remuneration therefor, especially in the case of transactions of material significance. The Audit Committee
64 FINANCIAL REPORT 2017 EVONIK INDUSTRIES

had discussed the report on relations with affiliated compa-nies and gave the Supervisory Board a detailed overview of the outcome of its deliberations. The Supervisory Board was able to convince itself of the orderly nature of the audit and audit report and came to the conclusion, in particular, that both the audit report and the audit itself meet the statutory requirements.
In particular, it examined the completeness and correctness of the report on relations with affiliated companies. No grounds for objection were identified.
The Supervisory Board thus has no objection to raise to the final declaration made by the Executive Board in its report on relations with affiliated companies and concurs with the audi-tors’ findings.
Personnel issues relating to the Executive Board and Supervisory Board
At its meeting on March 1, 2017, the Supervisory Board first approved the early termination of the appointment of Dr. Klaus Engel with his resignation from his office as a member and Chairman of the Executive Board with effect from the end of May 23, 2017. It then reappointed Christian Kullmann as a member of the Executive Board for a term of five years from May 24, 2017 and as Chairman of the Execu-tive Board from this date. Further, at its March meeting the Supervisory Board appointed Dr. Harald Schwager as a mem-ber of the Executive Board for five years from September 1, 2017 and as Deputy Chairman of the Executive Board from this date. In addition, the Supervisory Board approved the early termination of the appointment of Dr. Ralph Sven Kaufmann as a member of the Executive Board through his resignation with effect from the end of June 30, 2017. At its meeting in December, the Supervisory Board renewed the
appointment of Ute Wolf as a member of the Executive Board for five years from October 1, 2018.
There was one change to the members of the Supervisory Board in 2017. Stephan Gemkow stepped down from the Supervisory Board with effect from the end of the Annual Shareholders’ Meeting on May 23, 2017. Through a resolu-tion of the Annual Shareholders’ Meeting, Prof. Aldo Belloni was elected to the Supervisory Board as successor to Stephan Gemkow with effect from May 24, 2017.
As a result, there was also a change in the membership of the Finance and Investment Committee. Prof. Aldo Belloni took over Stephan Gemkow's seat with effect from May 24, 2017.
The Supervisory Board would like to thank Stephan Gemkow for his commitment to the interests of the company and its employees over many years.
Concluding remark
The Supervisory Board would also like to thank the Executive Board, Works Councils, Executive Staff Councils, and all employees of Evonik Industries AG and its affiliated companies for their successful work over the past year.
The Supervisory Board adopted this report at its meeting on March 5, 2018, in accordance with Section 171 Paragraph 2 of the German Stock Corporation Act (AktG).
Essen, March 5, 2018
On behalf of the Supervisory BoardDr. Werner Müller, Chairman
65
Report of the Supervisory Board
MANAGEMENT REPORT SUPPLEMENTARY INFORMATIONCONSOLIDATED FINANCIAL STATEMENTS CORPORATE GOVERNANCE

Corporate governance report and declaration on corporate governance1
The following report on corporate governance and the prin-ciples of corporate management at Evonik is issued jointly by the Executive Board and Supervisory Board of Evonik Industries AG. It forms the corporate governance report in
accordance with Section 3.10 of the German Corporate Gov-ernance Code and the declaration on corporate governance in accordance with Sections 289f and 315d of the German Commercial Code (HGB).
1. Principles of corporate governance and corporate structure
Corporate governance comprises all principles for the manage-ment and supervision of a company. As an expression of good and responsible corporate management, it is therefore a key element in Evonik's management philosophy. The princi-ples of corporate governance relate mainly to collaboration within the Executive Board and Supervisory Board, between these two boards, and between the boards and the share-holders, especially at Shareholders’ Meetings. They also relate to the company's relationship with other people and organi-zations with which it has business dealings.
Evonik is committed to the German Corporate Governance CodeEvonik Industries is a stock corporation established under German law. Its shares have been listed on the stock exchange since April 25, 2013.Alongside compliance with the provisions of the relevant leg-islation, the basis for ensuring responsible management and
supervision of Evonik with a view to a sustained increase in corporate value is our commitment to the German Corporate Governance Code, both in the version dated May 5, 2015 and in the amended version of February 7, 2017. This code, which was adopted by the Government Commission on the German Corporate Governance Code, contains both key statutory provisions on the management and supervision of publicly listed German companies, and recommendations and sugges-tions based on nationally and internationally recognized stan-dards of responsible corporate governance.
The Executive Board and Supervisory Board of Evonik Industries AG are explicitly committed to responsible corpo-rate governance and identify with the goals of the German Corporate Governance Code. According to the foreword, in the interest of good and proactive corporate governance, a company may deviate from the recommendations set out in the code if this is necessary to reflect company-specific requirements.
2. Information on corporate management and corporate governance
2.1 Declaration of conformity with the German Corporate Governance Code pursuant to Section 161 of the German Stock Corporation Act (AktG)
Under Section 161 of the German Stock Corporation Act (AktG), the Executive Board and Supervisory Board of Evonik Industries AG are required to annually submit a decla-ration that the company has been, and is, in compliance with the recommendations of the Government Commission on the German Corporate Governance Code, as published by the Federal Ministry of Justice in the official section of the Federal Gazette (Bundesanzeiger), and which recommendations have not been or are not being applied, together with the associated reasons. The declaration has to be made perma-nently available to the public on the company's website.
The Executive Board and Supervisory Board of Evonik Industries AG hereby submit the following declaration pursu-ant to Section 161 of the German Stock Corporation Act:
Since submitting its last declaration of conformity in Decem-ber 2016, the company has fully complied with all recom-mendations of the German Corporate Governance Code in the versions dated May 5, 2015 and February 7, 2017, as published in the Federal Gazette on June 12, 2015 and April 24, 2017, respectively, and will continue to do so.
Further, nearly all suggestions contained in the aforemen-tioned two versions of the German Corporate Governance Code were applied, with the following exceptions:
1 The declaration on corporate governance also forms an integral part of the combined management report for Evonik Industries AG (Sections 289 ff. HGB) and the Evonik Group (Sections 315 ff. HGB). In accordance with Section 317 Paragraph 2 Sentence 4 of the German Commercial Code (HGB), it is not included in the audit by the external auditors.
66 FINANCIAL REPORT 2017 EVONIK INDUSTRIES

The suggestion set forth in Section 2.3.3 of the German Corporate Governance Code (the company should make it possible to follow the general meeting using modern com-munication media) was not and will not be applied. Instead, for organizational reasons, only the speeches by the Chairman of the Supervisory Board and the Chairman of the Executive Board will be transmitted. This procedure correlates with widespread practice. It cannot be excluded that a more extensive transmission could infringe the personal rights of shareholders.
Further, Section 2.3.2 Sentence 2, second half-sentence of the German Corporate Governance Code (the representative appointed to exercise shareholders’ voting rights in accordance
with instructions should also be reachable during the general meeting) was not and will not be applied. Application of this suggestion would only be appropriate in the event of trans-mission of the general shareholders’ meeting in full via modern communication media. Furthermore, the availability of the representatives nominated by the company via electronic media during the meeting as put forward by this suggestion involves technical uncertainties. These and the associated risks for the efficacy of resolutions are to be avoided.
Essen, December 2017
The Executive Board The Supervisory Board
2.2 Relevant information on corporate management practices
Corporate governanceThe company is explicitly committed to good corporate gov-ernance and complies with the recommendations and—with two exceptions—the suggestions set forth in the German Corporate Governance Code.1
ComplianceEvonik understands compliance as all activities to ensure that the conduct of the company, its governance bodies, and its employees respect all applicable mandatory standards such as legal provisions, statutory requirements and prohibitions, in- house directives, and voluntary undertakings.
The most important external and internal principles and rules are set out in Evonik’s Group-wide Code of Conduct. This is binding for both the Executive Board and all Evonik employees, both internally in their treatment of one another
and externally in contact with shareholders, business part-ners, representatives of authorities and government bodies, and the general public. It requires all employees to comply with the applicable laws, regulations, and other obligations. Evonik does not do business at any price. All employees worldwide receive regular training on the Code of Conduct and specific issues. Systematic action is taken to deal with any breach of the Code of Conduct.
The compliance areas identified as being of specific rele-vance to our company are bundled in a House of Compliance. They include antitrust law, prevention of corruption, the Code of Conduct, foreign trade and customs law, capital market law, data protection, taxes, and human resources. Environ-ment, safety, health, and quality, including compliance-related aspects, are managed and monitored in a separate corporate division.
1 See subsection 2.1 for details.
House of Compliance C30
Board
Compliance Committee
Ant
itrus
t
Prev
entio
n of
Co
rrup
tion,
Mon
ey
Laun
derin
g an
d Fr
aud
Cod
e of
Con
duct
Fore
ign
Trad
e
and
Cus
tom
s Law
Cap
ital M
arke
t Law
Dat
a Pr
otec
tion
Taxe
s
Hum
an R
esou
rces
Cor
pora
te A
udit
Chief Compliance OfficerHead of
Data Protection
Head of Taxes
Head of HR
Head of Corporate
Audita
Compliance Management System
a Advisory function.
67MANAGEMENT REPORT SUPPLEMENTARY INFORMATIONCONSOLIDATED FINANCIAL STATEMENTS CORPORATE GOVERNANCE
Corporate governance report and declaration on corporate governance

The role of the House of Compliance is to define minimum Group-wide standards for the compliance management sys-tems for these areas and ensure that they are implemented. The process of forming a consensus, sharing experience, and coordinating joint activities takes place in the Compliance Committee, which is composed of the heads of the respective
units, who have independent responsibility for their areas, and the Head of Corporate Audit. The compliance units are responsible for the appropriateness and efficacy of the com-pliance management system for the compliance topics allo-cated to them.
Further information on Evonik’s compliance management system and the corresponding areas of focus and action taken in the year under review can be found in the Sustainability Report.
Corporate responsibilityThe Executive Board and Supervisory Board examine sustain-ability topics, especially aspects of the environment, safety, and society several times a year. Further, the development of accident frequency and severity is reflected in the Executive Board’s variable pay as a performance-related component. Extensive information on corporate responsibility can be found in the sustainability section of the management report, the Sustainability Report1, and the combined non-financial report2.
TransparencyEvonik regards timely and equal public disclosure of informa-tion as a key basis of good corporate governance. The Investor
Relations Division provides extensive information in German and English on the company’s website. This includes our financial calendar, which provides a convenient overview of important dates.3
Evonik’s business performance is outlined principally in our financial reports and in investor relations presentations. These are supplemented by information on Evonik’s shares, the terms of bond issues, and an overview of our credit ratings.
Mandatory publications such as ad-hoc announcements, voting rights announcements, and information on directors’ dealings are also published immediately on our Investor Rela-tions site.4
The offering also includes information on corporate strategy and Evonik's corporate structure and organization. In addition, the Investor Relations site provides information on Evonik’s approach to corporate responsibility, and how the management and supervision of the company (corporate governance) are aligned to responsible and sustained value creation.5
Evonik: Compliance Management System (CMS) C31
Responsibility of Management
Con
tinuo
us Im
prov
emen
t
Ade
quac
y, E
ffec
tiven
ess
Values and Objectives
Prevention Detection Response
Compliance Reporting
• Whistleblower System• Investigations• Monitoring & Audits
• Corrective Measures• Sanctions• Lessons learned
• Risk Analysis• Standards• Processes• Training• Sensitization/Communication• Advice & Support
Compliance Organization
1 The Sustainability Report is not part of the audited management report; www.evonik.com/responsibility2 www.evonik.com/nonfinancial-report3 www.evonik.com/investor-relations4 www.evonik.com/investor-relations, see News & reports/Ad-hoc announcements, Share/Voting rights announcements, and Corporate governance/Directors’ Dealings.5 www.evonik.com/investor-relations, Sustainable Investments (SRI) and Corporate Governance.
68 FINANCIAL REPORT 2017 EVONIK INDUSTRIES

2.3 Work of the Executive Board and Supervisory Board
The German Stock Corporation Act (AktG) forms the legal basis for the incorporation of Evonik Industries AG. Further details are set forth in the company's Articles of Incorporation and the provisions of the German Corporate Governance Code.1
Executive BoardThe Executive Board of Evonik Industries AG is responsible for running the company in the company’s interests with a view to sustained value creation, taking into account the interests of the shareholders, employees, and other stake-holders. It works together trustfully with the other corporate governance bodies for the good of the company.
The Executive Board defines and updates the company’s business objectives, its basic strategic focus, business policy, and corporate structure. It ensures compliance with statutory provisions and internal directives and exerts its influence to ensure that they are observed by Group companies (compli-ance). It is also responsible for ensuring appropriate measures aligned to the company’s risk situation (compliance manage-ment system), and appropriate risk management and risk controlling in the company. A whistleblower system has been set up so that employees and third parties have an opportunity to report, in a protected manner, suspected breaches the law within the company.
When making appointments to management functions in the company, the Executive Board applies the principles of diversity. In this it strives, in particular, to ensure adequate representation of women.
The Executive Board has four members at present. One member is appointed to chair the Executive Board. With the approval of the Supervisory Board, the Executive Board has adopted Rules of Procedure and a plan allocating areas of responsibility. The Chairman coordinates the work of the Executive Board, provides information for the Supervisory Board, and maintains regular contact with the Chairman of the Supervisory Board. If the Chairman is not available to perform these tasks, they are assumed by the Deputy Chair-person. The members of the Executive Board are jointly responsible for the overall management of the company. They work together constructively and keep each other informed of the main activities and developments in their areas of responsibility. The Executive Board endeavors to take decisions unanimously, but may also adopt resolutions by majority vote. If an equal number of votes is cast, the Chair-man has the casting vote.
Ensuring that the Supervisory Board receives sufficient infor-mation is the joint responsibility of the Executive Board and Supervisory Board. The Executive Board provides the Super-visory Board with the reports to be prepared in accordance with Section 90 of the German Stock Corporation Act (AktG) and the Rules of Procedure of the Supervisory Board. It gives the Supervisory Board timely, regular, and full information on all matters that are relevant to the company and Group relat-ing to strategy, planning, business development, risks, risk management, and compliance. It outlines deviations between the planned and actual business performance and targets and the reasons therefor.
Further, the Executive Board submits timely reports to the Supervisory Board on business matters and actions for which it is required by the Articles of Incorporation or the Supervisory Board’s Rules of Procedure to obtain the approval for the Supervisory Board. In addition, the Supervisory Board can make further business activities and measures dependent on its consent on a case-by-case basis.
Members of the Executive Board are required to act in the interests of the company. They may not pursue personal interests in their decisions, nor may they utilize business opportunities available to the company for themselves.
The members of the Executive Board are subject to a comprehensive non-compete obligation during their term of office. They may only assume additional posts, especially seats on the supervisory boards of companies that are not affiliated companies of Evonik Industries AG, with the consent of the Supervisory Board. In such cases, the Executive Board member shall accept the post as a personal office and shall ensure strict confidentiality and strict separation from his/her activities as a member of the Executive Board. Every member of the Executive Board is required to disclose any conflict of interests to the Chairman of the Supervisory Board without delay and to inform the other members of the Executive Board.
In fiscal 2017, there were no conflicts of interest relating to members of the Executive Board of Evonik Industries AG.
All transactions between the company or companies in the Evonik Group on the one hand and Executive Board members and related parties on the other must take place on terms that are customary in the sector. No such transactions took place in the reporting period.
The composition of the Executive Board and membership of supervisory boards and similar governance bodies are outlined in the further information on corporate officers.
1 See subsection 2.1.
69MANAGEMENT REPORT SUPPLEMENTARY INFORMATIONCONSOLIDATED FINANCIAL STATEMENTS CORPORATE GOVERNANCE
Corporate governance report and declaration on corporate governance

Supervisory Board
The Supervisory Board advises and supervises the Executive Board. It appoints the members of the Executive Board and names one member as the Chairperson of the Executive Board. It also decides on the remuneration of the members of the Executive Board. The Executive Board is required to obtain the approval of the Supervisory Board on decisions of fundamental importance, which are defined in a separate list. These include:• Fundamental changes to the structure of the company and
the Group• Setting the annual budget for the Group• Investments exceeding €100 million • The assumption of loans and the issuance of bonds
exceeding €300 million with a maturity of more than one year.
The Supervisory Board examines the company’s annual financial statements, the Executive Board’s proposal for the distribution of the profit, the consolidated financial state-ments for the Group, and the combined management report. It also examines the combined non-financial report. The Supervisory Board submits a written report on the outcome of the audit to the Shareholders’ Meeting.
The Supervisory Board is subject to the German Code-termination Act (MitbestG) 1976. In accordance with these statutory provisions, the Supervisory Board comprises twenty members, ten representatives of the shareholders and ten representatives of the workforce. The representatives of the shareholders are elected by the Shareholders’ Meeting on the basis of nominations put forward by the Supervisory Board as prepared by the Nomination Committee. The representatives of the employees are elected by the workforce and comprise seven employee representatives and three representatives of the industrial union.
The composition of the Supervisory Board should ensure that its members collectively have the knowledge, skills, and professional expertise required to properly perform their duties. The members of the Supervisory Board may not under-take any duties as officers or advisors to the company’s major competitors.
The Supervisory Board should not include more than two former members of the Executive Board. A former member of the Executive Board has been elected to the Supervisory Board. His term of office on the Executive Board ended more than two years before the date of his election to the Super-visory Board. All members of the Supervisory Board shall ensure that they have sufficient time to perform their tasks as a member of the Supervisory Board. Members of the Super-visory Board who are also members of the Executive Board of a publicly listed stock corporation should not hold more than three seats on the Supervisory Boards of listed companies outside their group of companies or Supervisory Boards of companies where comparable demands are made on them.
Members of the Supervisory Board must act in the interests of the company and not pursue personal interests in their decisions, nor may they utilize business opportunities avail-able to the company for themselves. Members must disclose conflicts of interest to the Supervisory Board. Any member of the Supervisory Board who discloses a conflict of interest is excluded from resolutions at the meetings of the Super-visory Board dealing with matters relating to the conflict of interest. In its report to the Shareholders' Meeting the Super-visory Board discloses any conflicts of interest that have arisen and how they have been dealt with. Material conflicts of interest relating to a member of the Supervisory Board that are not by nature temporary should lead to termination of his/her term of office.
Consultancy, service, and similar contracts between a mem-ber of the Supervisory Board and the company must be approved by the Supervisory Board. There were no contracts of this type in 2017, nor were there any conflicts of interest relating to members of the Supervisory Board of Evonik Industries AG.
The Supervisory Board has adopted Rules of Procedure, which also govern the formation and tasks of the committees. At least two regular meetings of the Supervisory Board are held in each calendar half-year. In addition, meetings may be convened as required and the Supervisory Board may adopt resolutions outside meetings. If an equal number of votes is cast when taking a decision, and a second vote does not alter this situation, the Chairman of the Supervisory Board has the casting vote.
The Supervisory Board has set the following objectives for its composition, which are taken into account in the proposals put to the Shareholders’ Meeting with regard to the regular election of members of the Supervisory Board and the subse-quent election of a member of the Supervisory Board:• At least two members should have sound knowledge and
experience of regions which are of material importance for the Evonik Group's business, either through their back-ground or through professional experience gained in an international context.
• At least two members should have special knowledge and experience of business administration and of finance/accounting or auditing.
• The members of the Supervisory Board as a whole should be familiar with the chemical sector.
• At least two members should have experience of managing or supervising a major company.
• The Supervisory Board should comprise at least 30 percent women and at least 30 percent men.
• The members of the Supervisory Board should not hold consulting or governance positions with customers, suppli-ers, creditors or other business partners that could lead to a conflict of interests. Deviations from this rule are permitted in legitimate individual cases.
70 FINANCIAL REPORT 2017 EVONIK INDUSTRIES

• Members of the Supervisory Board should not normally be over 75 when they are elected.
• Members of the Supervisory Board should not normally hold office for more than three full terms within the meaning of Section 102, Paragraph 1 of the German Stock Corporation Act (AktG), i.e., normally 15 years. It is possible to deviate from this rule, in particular in the case of a mem-ber of the Supervisory Board who directly or indirectly holds at least 25 percent of the company’s shares or belongs to the governance body of a shareholder that directly or indirectly holds at least 25 percent of the com-pany’s shares.
• The collective knowledge and professional expertise of the members of the Supervisory Board should adequately reflect the skills profile.
• At least five members of the Supervisory Board should be independent within the meaning of Section 5.4.2 of the German Corporate Governance Code.
These targets were last revised in December 2017.The Supervisory Board currently comprises seven women
and 13 men. In accordance with its own targets and in com-pliance with statutory requirements, it therefore meets the minimum of 30 percent women and 30 percent men.
To ensure independence within the meaning of Section 5.4.2 of the German Corporate Governance Code, a Supervisory Board member should not have any personal or business rela-tions with the company, its executive bodies, a controlling shareholder, or an enterprise associated with the latter which may cause a substantial and not merely temporary conflict of interests. The Supervisory Board considers all current members to be independent specifically because, in its view, election as an employee representative does not conflict with such inde-pendence. Even taking into account the more far-reaching criteria set out in the European Commission’s Recommendation of February 15, 2005, there are no conflicts of interest and no doubts regarding the independence of the members of the Supervisory Board.1
The shareholders’ representatives classified by the Super-visory Board as independent members are: Dr. Werner Müller, Prof. Barbara Albert, Prof. Aldo Belloni, Prof. Barbara Grunewald, Prof. Wolfgang A. Herrmann, Dr. Siegfried Luther, Michael Rüdiger, Angela Titzrath, Dr. Volker Trautz, and Ulrich Weber.
The present Supervisory Board satisfies the objectives for its composition.
In accordance with the new recommendation in the amended version of the German Corporate Governance Code, as well as setting objectives for its composition, the Supervisory Board has drawn up a profile of the skills and
expertise required for the entire Supervisory Board. Future proposals for the election of Supervisory Board members will be based on this profile. The objectives and profile together form the Supervisory Board’s diversity concept pursuant to Section 289f Paragraph 2 No. 6 and Section 315d of the German Commercial Code (HGB), which is outlined outlined in subsection 2.4.
The Supervisory Board considers that the following skills are appropriate for the proper performance of its duties and are reflected by its members:• International experience This requires professional experience gained by spending
an extended period working in a foreign country or another international context. At present, four members of the Supervisory Board meet this requirement.
• Knowledge of business administration The basis for such knowledge may be vocational training,
a course of study, or professional activity in a relevant field. Nine members of the Supervisory Board have such exper-tise in business administration.
• Experience of human resources and social issues This requires professional experience of organizing,
selecting, and hiring personnel. Based on this description, 17 members of the Supervisory Board have experience of human resources and social issues.
• Scientific knowledge (especially a knowledge of the chemical sector)
Such knowledge may have been acquired through voca-tional training, a course of study, or professional activity in a scientific context. Eleven members of the Supervisory Board meet this requirement.
• Experience of corporate management Experience of corporate management requires many years
of professional experience in a company in managerial posi-tions with personnel and management responsibility. Eight members of the Supervisory Board meet this requirement.
The Supervisory Board has the following committees:The Executive Committee comprises the Chairman of
the Supervisory Board, his deputy and two further members. It undertakes the regular business of the Supervisory Board and advises the Executive Board on fundamental issues relat-ing to the ongoing strategic development of the company. Insofar as is permitted by law, it takes decisions in place of the full Supervisory Board on matters which cannot be deferred until the necessary resolution is passed by the full Supervisory Board without detrimental effects for the company. It also takes decisions on the use of authorized capital. It prepares meetings of the Supervisory Board and, in particular, personnel decisions and resolutions on the remuneration of the Execu-tive Board, including the main contractual elements and the overall remuneration of individual members of the Executive Board. It is also responsible for concluding, amending, and
1 Section 13.2 in conjunction with Annex 2 of the Commission Recommendation of February 15, 2005 on the role of non-executive directors/supervisory board members of publicly listed companies and committees of the board of directors/supervisory board (2005/162/EC).
71MANAGEMENT REPORT SUPPLEMENTARY INFORMATIONCONSOLIDATED FINANCIAL STATEMENTS CORPORATE GOVERNANCE
Corporate governance report and declaration on corporate governance

terminating employment contracts with the members of the Executive Board, where this does not involve altering or set-ting remuneration, and represents the company in other transactions of a legal nature with present and former mem-bers of the Executive Board and certain related parties.
The Audit Committee has six members and is familiar as a whole with the chemical sector. The members of the Audit Committee have specialist knowledge and experience in the application of accounting standards and internal control systems. Moreover, the Chairman is independent and is not a former member of the company’s Executive Board. Acting on behalf of the Supervisory Board, the Audit Committee’s principal tasks comprise supervising the accounting, the accounting process, the effectiveness of the internal control system, the risk management system and the internal audit system, the auditing of the financial statements, especially the indepen-dence of the auditor, any additional services provided by the auditor by prior agreement and retrospective review, and compliance and the related decisions. It can make proposals and recommendations geared to ensuring the integrity of the financial reporting process. It prepares the Supervisory Board’s proposal to the Shareholders’ Meeting on the appointment of the auditor. If the audit engagement is put out to tender, the proposal must include at least two candi-dates. Further, the Audit Committee takes decisions on the appointment of the auditor, the focal points of the audit, and the agreement on audit fees. Further, it authorizes the Chair-man of the Supervisory Board to issue the contract to the auditor. It assumes the specific duties regarding the statutory audit of public-interest entities assigned to the audit committee under applicable law, especially EU Regulation no. 537/2014. The Audit Committee prepares the decision of the Supervi-sory Board on approval of the annual financial statements of Evonik Industries AG and the consolidated financial state-ments for the Group. For this purpose, it is required to con-duct a preliminary examination of the annual financial state-ments of Evonik Industries AG, the consolidated financial statements for the Group, the combined management report, and the Executive Board’s proposal for the distribution of the profit. The Audit Committee also examines the auditor’s report. The Audit Committee also prepares the decision of the Supervisory Board on the (Group’s) non-financial state-ment or separate non-financial report. For this purpose, it is required to undertake a preliminary examination of the dec-laration or the report. The Audit Committee reviews the interim reports, especially the half-yearly report, discusses the audit review report with the auditor—if an auditor is engaged to conduct a review—and decides whether to raise any objections. Further, it examines issues relating to corporate
governance and reports to the Supervisory Board at least once a year on the status, effectiveness, and scope to imple-ment any improvements to corporate governance and on new requirements and new developments in this field.
The Finance and Investment Committee has eight mem-bers. Its work covers aspects of corporate finance and invest-ment planning. For example, it takes decisions on behalf of the Supervisory Board on approving investment and real estate transactions with a value of more than €100 million. Further, the Finance and Investment Committee takes deci-sions on behalf of the Supervisory Board involving approval for the establishment, acquisition, and divestment of busi-nesses and capital measures at other Group companies with a value of between €100 million and €500 million. It also prepares decisions of the full Supervisory Board on such measures, where they exceed €500 million. Furthermore, it takes decisions on the assumption of guarantees and sureties for credits exceeding €50 million and on investments in com-panies of more than €100 million.
The Innovation and Research Committee has up to eight members. It examines the company’s innovation and research strategy, in particular by analyzing expected future develop-ments both in the chemical sector and in the markets of rele-vance to the company. It discusses the resulting implications for the company's innovation and research programs with the Executive Board. This committee was established in 2017 and will take up its duties in 2018.
The Nomination Committee comprises three Supervi-sory Board members elected as representatives of the share-holders. The task of the Nomination Committee is to prepare a proposal for the Supervisory Board on the candidates to be nominated to the Shareholders’ Meeting for election to the Supervisory Board.
Finally, there is a Mediation Committee established in accordance with Section 27 Paragraph 3 of the German Codetermination Act. This mandatory committee is com-posed of the Chairman of the Supervisory Board, his deputy, one shareholder representative, and one employee represen-tative. This committee puts forward proposals to the Super-visory Board on the appointment of members of the Execu-tive Board if the necessary two-thirds majority of the Super-visory Board members is not achieved in the first vote.
It is only convened when necessary. All other committees meet regularly and may also hold additional meetings on spe-cific issues in line with their responsibilities as set out in the Rules of Procedure for the Supervisory Board.
Further details of the work of the Supervisory Board and its committees in the past fiscal year can be found in the report of the Supervisory Board. The report of the Super-visory Board also outlines the composition of the various
72 FINANCIAL REPORT 2017 EVONIK INDUSTRIES

committees and the meetings attended by members of the Supervisory Board. For details of the composition of the Supervisory Board and membership of other supervisory and governance bodies, further information on corporate officers.
The Supervisory Board regularly examines the efficiency of its work. Further details can be found in the report of the Supervisory Board.
Directors’ DealingsIn accordance with the EU market abuse regulation (Article 19 Paragraph 1 MAR), which came into force on July 3, 2016,
members of the Executive Board and Supervisory Board and persons closely associated with them (including spouses, partners who are equivalent to a spouse, and dependent chil-dren) are required to notify Evonik Industries AG and the Federal Financial Supervisory Authority (BaFin) of any trans-actions in shares or debt instruments of Evonik Industries AG or derivatives or other financial instruments linked thereto. This applies to transactions undertaken within a calendar year after a total value of €5,000 has been reached. The trans-actions notified are disclosed on the website of Evonik Industries AG.
2.4 Diversity at Evonik
Since Evonik Industries AG is a publicly listed company and is also subject to German codetermination legislation, the diver-sity requirements set forth in the German Stock Corporation Act (AktG) and the German Corporate Governance Code apply.
The statutory ratio of at least 30 percent women and at least 30 percent men applies for the composition of the Supervisory Board. The Supervisory Board meets this ratio: alongside 13 men, it has seven female members, three of whom represent the shareholders and four of whom represent the workforce.
For the proportion of women on the Executive Board, the Supervisory Board set a target of at least 20 percent, with a deadline for achieving this of June 30, 2017. The composition of the Executive Board fulfilled this requirement as it comprised one woman and four men. For the period from July 1, 2017 through June 30, 2022, the Supervisory Board has raised the target for the proportion of women on the Executive Board to 25 percent. Since September 1, 2017, the Executive Board has comprised one woman and three men. Therefore, the Executive Board also meets this new target.
Further, for the period from January 1, 2017 through December 31, 2019, the Executive Board has set a target of 20 percent female managers for both the first and the second management level below the Executive Board. The proportion of female managers is currently 25 percent at the first manage-ment level and 15.4 percent at the second management level.
Diversity conceptThe previous diversity requirements set out in the German Stock Corporation Act (AktG) and the German Corporate Governance Code for publicly listed corporations that are also classified as large stock corporations have been extended by the revised version of Section 289f Paragraph 2 No. 6 of the German Commercial Code (HGB). The diversity concept which has to be described pursuant to this provision, and which has to be followed in appointments to the Supervisory Board and the Executive Board, comprises the following ele-ments at Evonik Industries AG:
The diversity concept for Evonik’s Supervisory Board comprises both the Supervisory Board's objectives for its
composition and the profile for the skills and expertise of the Supervisory Board as a whole. Further details can be found in subsection 2.3. Most of the requirements set out in the new rules for Supervisory Board’s diversity concept are already reflected in the Supervisory Board’s objectives. These include rules on the age and gender of Supervisory Board members and on professional experience and knowledge of business administration and the chemical sector. These objectives have been supplemented by a profile which sets out the required skills and expertise and documents the extent to which they are met. The diversity concept is implemented by ensuring that the proposals put to the Shareholders’ Meeting for the election of Supervisory Board members reflect the objectives and the profile. In the past fiscal year, the election of Prof. Aldo Belloni to the Supervisory Board met these require-ments. The main reasons for his nomination at the Annual Shareholders’ Meeting were his international experience, gained through many long-term assignments in foreign coun-tries, and his experience of corporate management gained in managerial positions at Linde Aktiengesellschaft.
Alongside the target of 25 percent female members out-lined above, the diversity concept for the Executive Board includes an upper age limit of 65 for members of the Execu-tive Board. In addition to this age limit, when selecting suit-able candidates for the Executive Board the Supervisory Board ensures a suitable mixture of ages to ensure long-term succession planning. Further, as a leading global specialty chemicals company, when making appointments to the Exec-utive Board Evonik pays attention to ensuring that at least one member has knowledge of the area of human resources, one has knowledge of finance and accounting, and one has knowledge of the chemical sector. In addition, at least one member of the Executive Board should have international professional experience. The present composition of the Executive Board fully meets the requirements set by the diversity concept. Since September 1, 2017, Dr. Harald Schwager has contributed to this. He is a chemist and also has international experience gained during many years of service on the Board of Executive Directors of BASF SE.
73MANAGEMENT REPORT SUPPLEMENTARY INFORMATIONCONSOLIDATED FINANCIAL STATEMENTS CORPORATE GOVERNANCE
Corporate governance report and declaration on corporate governance

3. Shareholders and the Shareholders’ Meeting
The shareholders exercise their rights at the Shareholders’ Meeting. The Shareholders’ Meeting elects the auditor and the shareholder representatives on the Supervisory Board and resolves on the ratification of the actions of members of the Executive Board and Supervisory Board, the distribution of the profit, capital transactions, and amendments to the Articles of Incorporation. The shares are registered shares.
Shareholders who are entered in the register of shareholders are eligible to attend the Shareholders’ Meeting and exercise their voting rights, providing they register in good time to attend the meeting. The shareholders may exercise their voting rights at the Shareholders' Meeting in person, through a proxy of their choice, or through a proxy appointed by the company. Each share entitles the holder to one vote.
4. Information on accounting and auditing of the financial statements
Evonik Industries AG prepares its annual financial statements in accordance with the German Commercial Code (HGB) and the German Stock Corporation Act (AktG). The consolidated financial statements are prepared on the basis of the Interna-tional Financial Reporting Standards (IFRS), as adopted for use in the EU. In addition, the applicable statutory provisions of Section 315e Paragraph 1 of the German Commercial Code (HGB) are taken into account.
As proposed by the Supervisory Board, the Annual Share-holders’ Meeting on May 23, 2017 elected Pricewaterhouse-Coopers GmbH Wirtschaftsprüfungsgesellschaft (PwC), Frank-furt am Main, as auditor for the annual financial statements of Evonik Industries AG, the consolidated financial statements of
the Evonik Group, and the combined management report for fiscal 2017. The Supervisory Board previously ascertained the independence of the auditor. The auditors that sign the audit of the annual financial statements of Evonik Industries AG and the consolidated financial statements of the Evonik Group are Mr. Eckhard Sprinkmeier (since fiscal 2017) and Ms. Antje Schlotter (since fiscal 2014). In addition to the accounting, the audit covered the system to identify emerging risks and the accounting-related internal control system. Further, PwC conducted a review of the interim financial statements for the first half of 2017 and the quarterly financial statement as of September 30, 2017. These reviews were based on the resolu-tion adopted on May 23, 2017.
5. Risk management and internal control system (ICS)
Risk management in the Evonik Group, including the ICS relat-ing to the accounting process, is described in the opportunity risk report in the management report.
6. Remuneration
The principles of the remuneration system and the remunera-tion of the members of the Executive Board and the Supervisory Board are outlined in the remuneration report, which forms part of the management report.
74 FINANCIAL REPORT 2017 EVONIK INDUSTRIES

Further information on corporate officersSupervisory Board of Evonik Industries AG
Dr. Werner Müller, Mülheim an der RuhrChairman of the Supervisory BoardChairman of the Executive Board of RAG-Stiftunga) Borussia Dortmund GmbH & Co. KGaA
RAG Aktiengesellschaft (Chair) RAG Deutsche Steinkohle AG (Chair)
b) Contilia GmbH Stadler Rail AG, Bussnang (Switzerland)
Edeltraud Glänzer, HanoverDeputy Chairwoman of the Supervisory Board Deputy Chairwoman of the German Mining, Chemical and Energy Industrial Union (IG BCE)a) B. Braun Melsungen AG
Merck KGaA
Martin Albers, DorstenChairman of the Group Works Council of Evonik Industries AG Chairman of the Works Council for the Essen campus facilitiesa) Pensionskasse Degussa VVaGb) PEAG Holding GmbH
Prof. Barbara Albert, DarmstadtProfessor of Solid State Chemistry at the Eduard-Zintl Institute of Inorganic and Physical Chemistry of the Technical University of Darmstadta) Schunk GmbH
Prof. Aldo Belloni, Munich(since May 24, 2017)Chief Executive Officer of Linde AGb) TÜV Süd e. V.
Karin Erhard, HanoverLegal advisor to the Mining, Chemical and Energy Industrial Union (IG BCE)a) INEOS Deutschland GmbH
INEOS Köln GmbH
Carmen Fuchs, AlzenauChairwoman of the Works Council for the Hanau facilities a) Pensionskasse Degussa VVaG
Prof. Barbara Grunewald, BonnChair for Civil Law and Commercial Law at the University of Cologne
Ralf Hermann, HertenMember of the Works Council for the Marl facilitiesa) Pensionskasse Degussa VVaGb) RAG-Stiftung
Prof. Wolfgang A. Herrmann, FreisingPresident of Munich Technical Universityb) Bayerische Forschungsallianz GmbH (Chair)
Frank Löllgen, CologneRegional Director North Rhine of the German Mining, Chemical and Energy Industrial Union (IG BCE)a) Bayer AG
Dr. Siegfried Luther, GüterslohFormer CFO of Bertelsmann AG(now Bertelsmann SE & Co. KGaA)a) Schaeffler AG
Sparkasse Gütersloh-Rietberg
Norbert Pohlmann, EssenMember of the Works Council for the Goldschmidtstraße facilitiesa) BKK Novitas
Dr. Wilfried Robers, GescherChairman of the Executive Staff Council of the Evonik Groupa) Pensionskasse Degussa VVaG
(until November 30, 2017)
Michael Rüdiger, Utting am AmmerseeChief Executive Officer of DekaBank Deutsche Girozentralea) Deka Immobilien GmbH
Deka Investment GmbH (Chair) Landesbank Berlin Investment GmbH (since January 1, 2018, Chairman since January 15, 2018) Liquiditäts-Konsortialbank GmbH in liquidation (Chair)
Anke Strüber-Hummelt, MarlChairwoman of the Works Council for the Marl facilities a) Evonik Resource Efficiency GmbH
(until March 31, 2017)
Ulrich Terbrack, ReinheimMember of the Works Council in Darmstadt
a) Membership of other statutory supervisory boards.b) Membership of comparable German and foreign supervisory bodies of business enterprises pursuant to Section 125 Paragraph 1 Sentence 5 of the German Stock
Corporation Act (AktG).
75
Further information on corporate officers
MANAGEMENT REPORT SUPPLEMENTARY INFORMATIONCONSOLIDATED FINANCIAL STATEMENTS CORPORATE GOVERNANCE

Angela Titzrath, HamburgChairwoman of the Executive Board of Hamburger Hafen und Logistik AGa) AXA Konzern Aktiengesellschaft
Dr. Volker Trautz, MunichFormer Chairman of the Management Board of LyondellBasell Industriesa) Citigroup Global Markets Deutschland AGb) CERONA Companhia de Energia Renovável,
São Paulo (Brazil) Perstorp Holding AB, Malmö (Sweden) (until March 31, 2017)
Ulrich Weber, KrefeldFormer member of the Board of Management of Deutsche Bahn AG responsible for Human Resources and Lawa) DB Cargo AG
(until December 31, 2017) Schenker AG (until December 31, 2017) DB Gastronomie GmbH (Chair) (until December 31, 2017) DB JobService GmbH (Chair) (until December 31, 2017) DB Zeitarbeit GmbH (Chair) (until December 31, 2017) DEVK Deutsche Eisenbahn Versicherung- Lebensversicherungsverein AG Betriebliche Sozialeinrichtung der Deutschen Bahn DEVK Deutsche Eisenbahn Versicherung- Lebensversicherungsverein AG Sach- und HUK-Versicherungsverein AG HDI Global SE
The following member left the Supervisory Board in 2017:
Stephan Gemkow, Overath(until May 23, 2017)Chairman of the Management Board of Franz Haniel & Cie. GmbH a) TAKKT AG (Chair)b) Flughafen Zürich AG (Switzerland)
(since April 20, 2017) JetBlue Airways Corporation, New York (USA)
a) Membership of other statutory supervisory boards.b) Membership of comparable German and foreign supervisory bodies of business enterprises pursuant to Section 125 Paragraph 1 Sentence 5 of the German Stock
Corporation Act (AktG).
76 FINANCIAL REPORT 2017 EVONIK INDUSTRIES

Executive Board of Evonik Industries AG
Christian Kullmann, Hamminkeln Chairman of the Executive Board(since May 24, 2017)a) Borussia Dortmund GmbH & Co. KGaA Evonik
Performance Materials GmbH (until May 31, 2017)
Dr. Harald Schwager, Speyer(since September 1, 2017)Deputy Chairman of the Executive Boarda) Evonik Nutrition & Care GmbH
(Chairman since September 25, 2017) Evonik Resource Efficiency GmbH (Chairman since October 6, 2017) Evonik Performance Materials GmbH (Chairman since September 27, 2017)
b) KSB Management SE (since November 4, 2017)
Thomas Wessel, HertenChief Human Resources OfficerResponsible for Technology & Infrastructurea) Evonik Nutrition & Care GmbH
Evonik Resource Efficiency GmbH Evonik Performance Materials GmbH Evonik Technology & Infrastructure GmbH (Chair) Pensionskasse Degussa VVaG (Chairman since June 26, 2017) Vivawest GmbH Vivawest Wohnen GmbH
b) Gesellschaft zur Sicherung von Bergmannswohnungen mbH
Ute Wolf, DüsseldorfChief Financial Officera) Deutsche Asset Management Investment GmbH
Evonik Nutrition & Care GmbH Evonik Resource Efficiency GmbH Evonik Performance Materials GmbH Klöckner & Co. SE (since May 12, 2017) Pensionskasse Degussa VVaG
The following members left the Executive Board in 2017:
Dr. Klaus Engel, Mülheim an der Ruhr(until May 23, 2017)Chairman of the Executive Boarda) NATIONAL-BANK AGb) Borussia Dortmund Geschäftsführungs-GmbH
Dr. Ralph Sven Kaufmann, Düsseldorf (until June 30, 2017)Responsible for the Nutrition & Care, Resource Efficiency, and Performance Materials segmentsa) Evonik Nutrition & Care GmbH (Chair)
(until June 30, 2017) Evonik Resource Efficiency GmbH (Chair) (until June 30, 2017) Evonik Performance Materials GmbH (Chair) (until June 30, 2017)
a) Membership of other statutory supervisory boards.b) Membership of comparable German and foreign supervisory bodies of business enterprises pursuant to Section 125 Paragraph 1 Sentence 5 of the German Stock
Corporation Act (AktG).
77MANAGEMENT REPORT SUPPLEMENTARY INFORMATIONCONSOLIDATED FINANCIAL STATEMENTS CORPORATE GOVERNANCE
Further information on corporate officers

Chairmen of the Management Boards of the main management companies within the Evonik GroupDr. Reiner BesteChairman of the Board of Management of Evonik Nutrition & Care GmbH
Dr. Claus RettigChairman of the Board of Management of Evonik Resource Efficiency GmbH
Caspar GammelinChairman of the Board of Management of Evonik Performance Materials GmbH
Gregor HetzkeChairman of the Board of Management of Evonik Technology & Infrastructure GmbH
78 FINANCIAL REPORT 2017 EVONIK INDUSTRIES

Remuneration report 1
The remuneration report outlines the principles of the remu-neration system for the members of the Executive Board and the Supervisory Board, together with the structure and level of their individual remuneration. This report complies with the
German Commercial Code (HGB), including the principles set out in German Accounting Standard No. 17 (DRS 17), the International Financial Reporting Standards (IFRS), and the requirements of the German Corporate Governance Code.
1. Remuneration of the Executive Board
Changes on the Executive Board At the meeting of the Supervisory Board on March 1, 2017, Christian Kullmann was appointed Chairman of the Executive Board with effect from May 24, 2017, and Dr. Harald Schwager was appointed Deputy Chairman of the Executive Board with effect from September 1, 2017. Dr. Klaus Engel’s appointment as Chairman and a member of the Executive Board ended with his resignation effective May 23, 2017 (his employment contract ended on May 31, 2017) and the appointment of Dr. Ralph Sven Kaufmann ended—also due to his resignation—on June 30, 2017.
Principles and objectivesThe remuneration system for the Executive Board is designed to ensure that members receive adequate remuneration for their tasks and responsibilities and to take direct account of the performance of each member of the Executive Board and of the company. The structure of the remuneration system for the members of the Executive Board of Evonik Industries AG is geared to sustained value creation and performance- oriented management of the company. It comprises a fixed monthly base salary, which takes account of the tasks and services performed by the respective member, and a variable short-term component comprising an annual bonus, which is dependent on the attainment of annual performance targets. This is supplemented by a long-term component linked directly to the increase in the value of the company as an incentive for sustained commitment to the company and the customary fringe benefits.
The remuneration is reviewed regularly by the Supervisory Board, where appropriate on the basis of remuneration reports from independent consultants. These reviews examine the structure and level of remuneration of the Executive Board, particularly in comparison with the external market, and also in relation to remuneration elsewhere in the company. If this reveals a need to adjust the remuneration system, or the level or structure of remuneration, the Executive Committee of the Supervisory Board submits a corresponding proposal to the full Supervisory Board for a decision. An external review
of the appropriateness of the remuneration system was undertaken in 2017. As a result, it was decided to raise the fixed remuneration from January 1, 2018 by € 150 thousand for the Chairman and Deputy Chairman of the Executive Board and by € 100 thousand for all other members of the Executive Board. At the same time, the target for variable short-term remuneration was reduced by the same amount.
Christian Kullmann’s remuneration was adjusted with effect from May 24, 2017, following his appointment as Chairman of the Executive Board.
The chart shows the breakdown of the main remuneration components in 2017, i. e., excluding benefits in kind, other fringe benefits, and company pension plans:
Performance-unrelated components
Fixed annual base salaryThe fixed annual base salary is a cash payment for the fiscal year. It takes account of the scope of responsibility of each Executive Board member and is paid out in twelve equal installments.
1 This report is part of the audited management report.
a Excluding fringe benefits and retirement pensions.
Structure of remuneration of members of the Executive Board a G32
Long-term remuneration (agreed target amounts)
approx. 35 %Fixed annual base salary approx. 34 %
Annual bonus(assuming 100 %
target attainment) approx. 31 %
79MANAGEMENT REPORT SUPPLEMENTARY INFORMATIONCONSOLIDATED FINANCIAL STATEMENTS CORPORATE GOVERNANCE
Remuneration report

Benefits in kind and other fringe benefitsAs benefits in kind and other fringe benefits, members of the Executive Board receive a company car with a driver, the instal-lation of telecommunications equipment, and an entitlement to an annual medical check-up. Executive Board members may receive a rent subsidy if performance of their duties requires them to rent a second apartment. Benefits in kind are presented in this remuneration report at the values defined in the tax regulations.
Further, members of the Executive Board may receive additional remuneration for offices they hold in the interests of the company. Apart from fees for the attendance of meetings, insofar as such fees are paid to Executive Board members, they are deducted from their annual bonus or paid over to the company. In this remuneration report, remuneration for offices held in the interests of the company is included in other fringe benefits.
Performance-related components
Short-term variable remunerationThe performance-related annual bonus is dependent on the attainment of business targets measured by performance indicators (bonus factor) and the attainment of individual objectives (performance factor). The bonus factor and per-formance factor are multiplied. The level of the bonus factor depends on the achievement of the agreed business targets, and may be between 0 and 200 percent. ROCE, adjusted net income, and adjusted EBITDA are defined as business targets. The ROCE target is measured against the mid-term cost of capital, the target for adjusted net income is calculated in comparison to the previous year, and the target for adjusted EBITDA is derived from corporate planning. The develop-ment of accident frequency and the severity of accidents in the fiscal year are also taken into account.
The performance factor rewards the attainment of the personal objectives and can vary between 80 percent and 120 percent. The reference indicators are aligned individually to the performance objectives for each member of the Executive Board and normally have a multi-year context within the target- setting framework.
If the personal and business objectives are achieved in full, the contractually agreed bonus is paid. If the company’s income falls short of the planned level, the bonus factor may—in the extreme case—be zero, regardless of personal attainment. In other words, it is conceivable that a bonus might not be paid for a specific year. The bonus is capped at 200 percent of the target bonus.
The business and personal targets set for Executive Board members for the bonus and performance factors are agreed in writing at the start of each fiscal year between the Super-visory Board and each member of the Executive Board and the level of attainment is determined by the Supervisory Board after the end of the year.
Long-term variable remuneration (LTI Plans)The members of the Executive Board receive long-term variable remuneration in the form of Long-Term Incentive (LTI) Plans. Following Evonik’s stock exchange listing, the structure of the LTI Plans was redefined as from the 2013 tranche. The general reference base for long-term remuneration is a sustained rise in the value of the company.
LTI tranche 2012The 2012 tranche rewards achieving or exceeding the operating earnings targets set in the mid-term planning and their impact on the value of the company. The performance period runs for five years from January 1 of the grant year.
Entitlements are based on individually agreed target amounts, provided that earnings targets are met. LTI payments are calculated in the year following the end of the performance period, when the necessary indicators are available. Pay-ments are capped at three times the target amount and can be zero if the defined lower threshold is not reached.
To determine the value of the company as a basis for ascertaining target attainment, the share price at the end of the performance period is used. For this purpose, the average price of shares in Evonik in the three months prior to the end of the performance period is calculated. In addition, dividends paid and any capital increases or decreases during the performance period are taken into account. The cumulative discrepancy between planned and actual target attainment in the perfor-mance period and the dividends paid in the last year of the performance period are taken into account in the calculation. If there is no share price, the value of equity is determined on the basis of the last share transaction in the last twelve months of the performance period. If there was no share transaction in the last twelve months, a fictitious equity value is used. This is derived by applying a fixed EBITDA multiple to the company's business performance in the last full fiscal year.
80 FINANCIAL REPORT 2017 EVONIK INDUSTRIES

Given the structure of the 2012 LTI Plan, it did not meet the definition of share-based payment pursuant to DRS 17.9 until Evonik Industries AG was listed on the stock exchange. Con-sequently, it was not classified as a share-based payment. Payment was contingent on attainment of the defined perfor-mance target and on the condition that the amount available for distribution was not zero. Accordingly, this tranche was only deemed to have been granted in the year in which the performance period ended. Granting of payments was further conditional on the fact that the stock exchange listing had not taken place. The stock exchange listing in 2013 led to reclassi-fication of this remuneration component as a share-based payment. In accordance with DRS 17, the 2012 tranche is therefore regarded as granted as of this date and treated as a share-based payment. The fair value of the tranche as of the date of the legally binding commitment was calculated.
LTI tranches 2013 and subsequent yearsThe Supervisory Board redesigned the plan as a result of the stock exchange listing of Evonik Industries AG. Performance is now measured by the absolute performance of Evonik’s share price and its performance relative to the MSCI World Chemicals IndexSM.
Based on the contractually agreed target amount, which is defined in euros, a number of virtual shares is calculated using the share price at the start of the performance period. This is based on the price in the last 60 trading days before the start of performance period. The performance period starts on Janu-ary 1 of the grant year and runs for four years. Since there was no share price at the start of the performance period, as an
exception, the virtual shares for the 2013 tranche were calcu-lated from the share price in the first 60 trading days following admission to the stock exchange (April 25, 2013). At the end of the performance period, the starting price of Evonik shares is viewed against the average share price at the end of the performance period, including any dividends per share actually paid in this period. This is compared with the performance of the benchmark index (total shareholder return).
The relative performance may be between 70 and 130 per-centage points. If the relative performance is below 70 per-centage points, the relative performance factor is deemed to be zero. If the relative performance is above 130 percentage points, the relative performance is set at 130 percent.
The payment is calculated by multiplying the relative performance by the number of virtual shares allocated and the average price of Evonik shares at the end of the perfor-mance period.
Eligible participants are informed of the outcome after the end of the performance period. They can then opt to accept the payment calculated or to extend the performance period on a one-off basis for a further year. In this case, a renewed calculation is performed at the end of the extended perfor-mance period. Partial exercise at the end of the original performance period is not permitted. The upper limit for these payments is set at 300 percent of the individual target amount.
The fair values of the LTI tranches 2012 through 2017 as of the date of the legally binding commitment are shown in the next table:
LTI tranches T28
2012 a 2013 b 2014 b 2015 b 2016 b 2017 b
in €’000
No. of virtual shares in €’000
No. of virtual shares in €’000
No. of virtual shares in €’000
No. of virtual shares in €’000
No. of virtual shares in €’000
Dr. Klaus Engel 495 43,133 1,028 45,208 1,023 47,510 1,488 39,395 842 – –
Christian Kullmann – – – 13,562 307 28,506 893 28,803 616 41,787 1,033
Dr. Ralph Sven Kaufmann – – – – – 14,253 447 23,637 505 – –
Dr. Harald Schwager – – – – – – – – – 12,090 299
Thomas Wessel 297 25,880 617 27,125 614 28,506 893 23,637 505 27,203 672
Ute Wolf – 6,470 154 27,125 614 28,506 893 23,637 505 27,203 672
Total 792 75,483 1,799 113,020 2,558 147,281 4,614 139,109 2,973 108,283 2,676
a No details are given of other share-based payments because a specific number of shares or share options was not issued, nor can the tranche be converted into a number of virtual shares.
b The date of the legally binding commitment corresponds to the grant date.
81MANAGEMENT REPORT SUPPLEMENTARY INFORMATIONCONSOLIDATED FINANCIAL STATEMENTS CORPORATE GOVERNANCE
Remuneration report

In 2017, the total expense for all LTI tranches for the Executive Board was € 5,108 thousand. The breakdown of the expense was as follows: € 2,449 thousand for Dr. Engel, € 613 thousand for Mr. Kullmann, € 825 thousand for Dr. Kaufmann, € 71 thou-sand for Dr. Schwager, €575 thousand for Mr. Wessel, and € 575 thousand for Ms. Wolf.
Company pension planThe company pension arrangements for Dr. Klaus Engel com-prise a percentage of his fixed annual base salary, which is dependent on length of service with the company and is capped at 60 percent. This pension commitment provides for a lifelong retirement pension and surviving dependents’ benefits.
A defined-contribution system is applicable for Christian Kullmann, Thomas Wessel, and Ute Wolf. This is a capital- based system funded by provisions. The company credits a fixed annual amount to their pension account. This comprises 15 percent of their target remuneration, i.e., base salary and target bonus (variable short-term remuneration assuming 100 percent target attainment). The guaranteed annual return is 5 percent. The pension benefit comprises the amount that has accrued on the account, i.e., contributions credited to the account plus accumulated interest. In the event of death or disability, the amount that would be available on the account on the member’s 55th birthday, including projected contribu-tions and interest, is calculated. Payment normally comprises a lifelong pension. Alternatively, Executive Board members may opt for disbursement of part of the capital (maximum 50 per-cent) in six to ten installments. Pension entitlements accrued prior to appointment to the Executive Board are either inte-grated into the system as an initial contribution or continue to be managed separately. If a member’s contract as a member of the Executive Board ends before benefits are payable,
no further contributions are credited to the account. How-ever, it continues to earn interest at the common market interest rate based on the average return earned by major German life insurers (at least 2.25 percent p. a.) until benefits are claimed.
Members of the Executive Board are entitled to pension benefits after they leave the company if they leave on or after reaching the age of 60 or 62 (depending on their individual pension arrangements) or if they leave as a result of permanent incapacity to work. Further, Mr. Kullmann and Mr. Wessel can claim pension benefits from the date of premature termi-nation or non-extension of their contracts, based on pension entitlements accrued prior to their appointment to the Exec-utive Board.
No pension arrangements were agreed for Dr. Ralph Sven Kaufmann. An arrangement that differs from the pen-sion system has been agreed with Dr. Harald Schwager. He has been given a commitment that he will receive a lifelong pension of €40 thousand p.a. for each full year of service, and a pro rata amount for each partial year of service.
In 2017, the service cost for members of the Executive Board totaled €1,311 thousand (2016: €2,149 thousand) based on the German Commercial Code (HGB) and €1,482 thou-sand (2016: €1,116 thousand) based on IFRS.
The difference in service cost for pension commitments is attributable to differences in the valuation methods used to calculate the settlement amount in accordance with the Ger-man Commercial Code and the present value of pension obli-gations calculated in accordance with IFRS.
The present value of pension obligations for members of the Executive Board was € 10,191 thousand (2016: € 23,392 thou-sand) based on the German Commercial Code (HGB) and € 14,713 thousand (2016: € 33,973) based on IFRS.
Service cost and present value of pension obligations T29
in € ’000
German Commercial Code (HGB) IFRS
Service cost
Settlement amount of pension obligations as of Dec. 31 Service cost
Present value of the defined benefit obligation as of Dec. 31
2017 2016 2017 2016 2017 2016 2017 2016
Dr. Klaus Engel (until May 31, 2017) – 1,127 – 15,498 – – – 21,526
Christian Kullmann 505 404 4,142 3,207 642 401 6,225 5,323
Dr. Ralph Sven Kaufmann (until June 30, 2017) – – – – – – – –
Dr. Harald Schwager (from September 1, 2017) 208 – 220 – – – 297 –
Thomas Wessel 318 326 4,082 3,394 435 375 5,620 5,045
Ute Wolf 280 292 1,747 1,293 405 340 2,571 2,079
Total 1,311 2,149 10,191 23,392 1,482 1,116 14,713 33,973
82 FINANCIAL REPORT 2017 EVONIK INDUSTRIES

Provisions for pension obligations to former members of the Executive Board and their surviving dependents as of the reporting date were €57,714 thousand (2016: €37,250 thou-sand) based on the German Commercial Code (HGB) and €79,926 thousand (2016: €55,220 thousand) based on IFRS.
Rules on termination of service on the Executive Board
Cap on termination benefits in the event of premature termination of term of officeIn conformance with the German Corporate Governance Code, the employment contracts with all members of the Executive Board provide for a cap on termination benefits. If
a member’s term of office is prematurely terminated, pay-ments may not exceed two years' remuneration, including variable remuneration components. In no case is remuneration payable for periods beyond the remaining term of the contract. The contracts specify that no termination benefits are payable if an Executive Board member’s contract is terminated for reasons for which he or she is responsible. The cap on termi-nation benefits is based on total remuneration including fringe benefits in the previous fiscal year and, where appro-priate, the anticipated total remuneration for the current fiscal year.
The termination benefits paid to Dr. Klaus Engel and Dr. Ralph Sven Kaufmann did not exceed this cap.
Termination benefits T30
in € ’000Fixed
remuneration
Compensation for fringe
benefitsAnnual bonus
Long-term remuneration Total
Dr. Klaus Engel 1,979 50 2,454 2,500 a 6,983
Dr. Ralph Sven Kaufmann 700 25 827 1,125 a 2,677
a The termination benefits include the 2017 and 2018 LTI tranches. Where granted, the 2013 – 2016 LTI tranches remain in place.
Post-contractual non-compete agreements Post-contractual non-compete agreements have not been concluded with members of the Executive Board.
Change-of-control clauseChange-of-control clauses are only agreed with members of the Executive Board in connection with long-term remuner-ation. A change of control is defined as cases when another company obtains control of Evonik Industries AG as defined in the German Securities Acquisition and Takeover Act (WpÜG) or there is a material change in the company’s shareholders as a result of a merger or comparable reorganization or business combination. In such cases, the long-term remuneration due to the eligible Executive Board members is calculated imme-diately and paid with their next regular salary payment. From
the 2013 tranche, the payment is calculated pro rata based on the period between the grant date and the change of control and the four-year performance period.
Remuneration of the Executive Board in fiscal 2017The total remuneration paid to the members of the Executive Board for their work in 2017, including remuneration for the performance of other offices, was € 11,296 thousand (2016: € 12,167 thousand). The amount for 2017 includes bonus pay-ments of € 178 thousand for the previous year, for which no provision was established in 2016.
Based on the principles outlined, the breakdown of remu-neration for each Executive Board member in 2017 was as follows:
83MANAGEMENT REPORT SUPPLEMENTARY INFORMATIONCONSOLIDATED FINANCIAL STATEMENTS CORPORATE GOVERNANCE
Remuneration report

Remuneration of the Executive Board T31
in € ’000
Performance-unrelated remuneration Performance-related remuneration
Total remuneration in accordance with DRS 17Fixed remuneration
Benefits in kind and other fringe benefits Annual bonus LTI a
2017 2016 2017 2016 2017 2016 2017 2016 2017 2016
Dr. Klaus Engel b 521 1,250 8 18 653 1,392 – 842 1,182 3,502
Christian Kullmann 1,141 880 86 72 1,431 1,007 1,033 616 3,691 2,575
Dr. Ralph Sven Kaufmann c 350 700 294 123 178 707 – 505 822 2,035
Dr. Harald Schwager d 327 – 21 – 390 – 299 – 1,037 –
Thomas Wessel 700 700 230 147 698 687 672 505 2,300 2,039
Ute Wolf 700 700 118 92 774 719 672 505 2,264 2,016
Total 3,739 4,230 757 452 4,124 4,512 2,676 2,973 11,296 12,167
a Fair value as of the legally binding commitment or grant date.b 2017: pro rata until May 31, 2017.c 2017: pro rata until June 30, 2017.d 2017: pro rata from September 1, 2017.
In 2017, no member of the Executive Board received benefits or corresponding promises from third parties in connection with his or her service on the Executive Board. Further, as of December 31, 2017 there were no loans or advances to mem-bers of the Executive Board.
Finally, third-party financial loss insurance cover is pro-vided for each member of the Executive Board to cover their statutory liability arising from their work on the Executive Board. In the event of a claim, this provides for a deductible
of 10 percent of the damage, up to one-and-a-half times the individual member’s fixed annual remuneration.
Remuneration report in accordance with the German Corporate Governance CodeThe German Corporate Governance Code recommends that listed companies should also disclose the remuneration of the Executive Board on the basis of a defined table showing the granting and allocation of benefits.
84 FINANCIAL REPORT 2017 EVONIK INDUSTRIES

Benefits granted T32
in €’000
Dr. Klaus Engel a Chairman of the Executive Board (until May 23, 2017)
Christian Kullmann b Chairman of the Executive Board
2016 2017 2017 (min) 2017 (max) 2016 2017 2017 (min) 2017 (max)
Fixed remuneration 1,250 521 521 521 880 1,141 1,141 1,141
Fringe benefits 18 8 8 8 72 86 86 86
Total 1,268 529 529 529 952 1,227 1,227 1,227
One-year variable remuneration 1,150 479 – 958 814 1,052 – 2,104
Multi-year variable remuneration 842 – – – 616 1,033 – 3,456
LTI 2016 through 2019 842 – – – 616 – – –
LTI 2017 through 2020 – – – – – 1,033 – 3,456
Total 3,260 1,008 529 1,487 2,382 3,312 1,227 6,787
Penions expense (service cost) – – – – 401 642 642 642
Total remuneration 3,260 1,008 529 1,487 2,783 3,954 1,869 7,429
in €’000
Dr. Ralph Sven Kaufmann Responsible for the Nutrition & Care, Resource Efficiency and Performance Materials segments (until June 30, 2017)
Dr. Harald Schwager Deputy Chairman of the Executive Board (from September 1, 2017)
2016 2017 2017 (min) 2017 (max) 2016 2017 2017 (min) 2017 (max)
Fixed remuneration 700 350 350 350 – 327 327 327
Fringe benefits 123 294 294 294 – 21 21 21
Total 823 644 644 644 – 348 348 348
One-year variable remuneration 650 325 – 650 – 300 – 600
Multi-year variable remuneration 505 – – – – 299 – 1,000
LTI 2016 through 2019 505 – – – – – – –
LTI 2017 through 2020 – – – – – 299 – 1,000
Total 1,978 969 644 1,294 – 947 348 1,948
Penions expense (service cost) – – – – – – – –
Total remuneration 1,978 969 644 1,294 – 947 348 1,948
in €’000
Thomas Wessel Chief Human Resources Officer
Ute Wolf Chief Financial Officer
2016 2017 2017 (min) 2017 (max) 2016 2017 2017 (min) 2017 (max)
Fixed remuneration 700 700 700 700 700 700 700 700
Fringe benefits 147 230 230 230 92 118 118 118
Total 847 930 930 930 792 818 818 818
One-year variable remuneration 650 650 – 1,300 650 650 – 1,300
Multi-year variable remuneration 505 672 – 2,250 505 672 – 2,250
LTI 2016 through 2019 505 – – – 505 – – –
LTI 2017 through 2020 – 672 – 2,250 – 672 – 2,250
Total 2,002 2,252 930 4,480 1,947 2,140 818 4,368
Penions expense (service cost) 375 435 435 435 340 405 405 405
Total remuneration 2,377 2,687 1,365 4,915 2,287 2,545 1,223 4,773
a Appointment as Chairman of the Executive Board ended on May 23, 2017; contract ended on May 31, 2017.b Appointed Chairman of the Executive Board effective May 24, 2017; his annual base salary, targets for one-year variable remuneration, and the allocation of multi-year variable
remuneration were adjusted as of this date.
85MANAGEMENT REPORT SUPPLEMENTARY INFORMATIONCONSOLIDATED FINANCIAL STATEMENTS CORPORATE GOVERNANCE
Remuneration report

Allocation T33
in €'000
Dr. Klaus Engel a Chairman of the Executive Board (until May 23, 2017)
Christian Kullmann b Chairman of the Executive Board
Dr. Ralph Sven Kaufmann Responsible for the Nutrition & Care, Resource Efficiency, and Performance Materials segments (until June 30, 2017)
Dr. Harald Schwager Deputy Chairman of the Executive Board (from September 1, 2017)
Thomas Wessel Chief Human Resources Officer
Ute Wolf Chief Financial Officer
2016 2017 2016 2017 2016 2017 2016 2017 2016 2017 2016 2017
Fixed remuneration 1,250 521 880 1,141 700 350 – 327 700 700 700 700
Fringe benefits 18 8 72 86 123 294 – 21 147 230 92 118
Total 1,268 529 952 1,227 823 644 – 348 847 930 792 818
One-year variable remuneration c, d, e 1,330 646 1,015 1,338 701 153 – 390 681 665 721 755
Multi-year variable remuneration – – – – – – – – – 571 – 143
LTI 2011 through 2015 – – – – – – – – – – – –
LTI 2012 through 2016 – – – – – – – – – – – –
LTI 2013 through 2016 – – – – – – – – – 571 – 143
Total 2,598 1,175 1,967 2,565 1,524 797 – 738 1,528 2,166 1,513 1,716
Pension expense ( service cost) – – 401 642 – – – – 375 435 340 405
Total remuneration 2,598 1,175 2,368 3,207 1,524 797 – 738 1,903 2,601 1,853 2,121
a Appointment as Chairman of the Executive Board ended on May 23, 2017; contract ended on May 31, 2017.b Appointed Chairman of the Executive Board effective May 24, 2017; his annual base salary, targets for one-year variable remuneration, and the allocation of multi-year variable
remuneration were adjusted as of this date. c In some cases, fees for other offices held are offset against variable remuneration contained in fringe benefits; 2016: Kullmann €15 thousand, Kaufmann €73 thousand, Wessel
€100 thousand, Wolf €45 thousand; 2017: Kullmann €30 thousand, Kaufmann €270 thousand, Wessel €180 thousand, Wolf €90 thousand. d The one-year variable remuneration for 2016 corresponds to the actual payments made in 2017 for 2016 (a correction has been made for any discrepancies between the actual
payments and the estimates made in the remuneration report in 2016).e The one-year variable remuneration for 2017 has not yet been finalized; estimate based on assumptions made for provisions.
Former Executive Board members, including members who left the Executive Board in 2017Total remuneration for former members of the Executive Board and their surviving dependents was €11,492 thousand in 2017 (2016: €1,722 thousand).
2. Remuneration of the Supervisory Board
The remuneration of the Supervisory Board is governed by Section 15 of the Articles of Incorporation of Evonik Industries AG.
The remuneration system takes account of the responsi-bilities and scope of activities of the members of the Super-visory Board. In addition to reimbursement of their expenses and value-added tax payable on their remuneration and expenses, the members of the Supervisory Board receive a fixed annual payment. Their remuneration does not include a variable component.
Different levels of fixed annual remuneration are paid to the Chairman (€250 thousand), Deputy Chairwoman (€175 thousand), and other members of the Supervisory Board (€100 thousand).
The Chairman of the Executive Committee receives addi-tional remuneration of € 60,000, the Deputy Chairwoman € 45,000, and the other members € 35,000 each. The Chairman of the Audit Committee receives additional remuneration of € 75 thousand, the Deputy Chairwoman € 50 thousand, and the other members € 40 thousand each. The Chairman of the Finance and Investment Committee receives additional remu-neration of € 50 thousand, the Deputy Chairman € 40 thou-sand, and the other members €30 thousand each. The chairmen of the Nomination Committee and the Mediation Committee receive additional remuneration of € 20,000 each, the deputy chairpersons receive € 10,000 each and the other members € 10,000 each. Entitlement to the additional remuneration for work on the Mediation Committee only applies if the com-mittee is actually convened during the fiscal year.
86 FINANCIAL REPORT 2017 EVONIK INDUSTRIES

Further, members of the Supervisory Board receive a fee of €1 thousand for each meeting of the Supervisory Board and its committees that they attend. If several meetings are held on the same day, this fee is only paid once.
Members who only serve on the Supervisory Board for part of a fiscal year receive remuneration on a pro rata basis. This also applies for increases in the remuneration of the Chairman of the Supervisory Board and his deputy and any increased remuneration paid for membership of or chairing a committee.
Remuneration of the Supervisory Board T34
in €'000
Fixed remuneration
Remuneration for member ship of a committee Attendance fees Total
2017 2016 2017 2016 2017 2016 2017 2016
Martin Albers 100 100 30 30 9 10 139 140
Prof. Dr. Barbara Albert 100 100 – – 5 6 105 106
Prof. Aldo Belloni (from May 24, 2017) 67 – 20 – 6 – 93 –
Karin Erhard 100 100 50 50 9 10 159 160
Carmen Fuchs 100 100 – – 5 6 105 106
Stephan Gemkow (until May 23, 2017) 42 100 13 30 2 9 57 139
Edeltraud Glänzer (from May 19, 2016) 175 117 75 50 10 6 260 173
Prof. Barbara Grunewald 100 100 40 40 9 10 149 150
Ralf Hermann 100 100 75 72 10 11 185 183
Prof. Wolfgang A. Herrmann 100 100 – – 5 6 105 106
Dieter Kleren (until May 18, 2016) – 42 – – – 3 – 45
Steven Koltes (until May 18, 2016) – 42 – 4 – 1 – 47
Frank Löllgen 100 100 30 30 8 10 138 140
Dr. Siegfried Luther 100 100 75 75 8 10 183 185
Dr. Werner Müller 250 250 110 110 15 18 375 378
Norbert Pohlmann 100 100 40 40 9 10 149 150
Dr. Wilfried Robers 100 100 40 40 9 10 149 150
Michael Rüdiger 100 100 50 50 9 10 159 160
Anke Strüber-Hummelt (from May 19, 2016) 100 67 – – 5 3 105 70
Ulrich Terbrack 100 100 – – 5 6 105 106
Angela Titzrath (from May 19, 2016) 100 67 40 27 9 4 149 98
Dr. Volker Trautz 100 100 45 45 9 11 154 156
Michael Vassiliadis (until May 18, 2016) – 73 – 35 – 6 – 114
Ulrich Weber (from May 19, 2016) 100 67 40 27 7 6 147 100
Dr. Christian Wildmoser (until May 18, 2016) – 42 – 29 – 6 – 77
Total 2,234 2,267 773 784 163 188 3,170 3,239
The remuneration and attendance fees paid to the Supervisory Board in 2016 and 2017 are presented on a cost basis. For members who joined or left the Supervisory Board during 2016 and 2017, the amounts are calculated on a pro rata basis.
As of December 31, 2017, there were no loans or advances to members of the Supervisory Board. In 2017, the members of the Supervisory Board did not receive any remuneration for services provided personally, especially consulting and referral services.
Finally, third-party financial loss insurance cover is provided for each member of the Supervisory Board to cover their statutory liability arising from their work on the Supervisory Board. In the event of a claim, this provides for a deductible of ten percent of the damage, up to one-and-a-half times the individual member's fixed annual remuneration.
87MANAGEMENT REPORT SUPPLEMENTARY INFORMATIONCONSOLIDATED FINANCIAL STATEMENTS CORPORATE GOVERNANCE
Remuneration report

Information pursuant to Section 289a Paragraph 1 and Section 315a Paragraph 1 of the German Commercial Code (HGB) and explanatory report by the Executive Board pursuant to Section 176 Paragraph 1 of the German Stock Corporation Act (AktG) 1
Structure of issued capitalThe capital stock of Evonik Industries AG is €466,000,000 and is divided into 466,000,000 no-par registered shares. Each share entitles the holder to one vote.
Under Section 5 Paragraph 2 of the Articles of Incorpo-ration, shareholders do not have any claim to the issue of certificates for their shares unless the issue of a certificate is required by the rules of a stock exchange on which the share has been admitted for trading.
There are no different share classes, nor any shares with special rights.
Restrictions on voting rights or the transfer of sharesIn connection with Evonik’s employee share programs, there are restrictions on the ability of participating employees to dis-pose of their shares for a certain time period. In particular, they are required to hold their shares in each case until the end of the next-but-one calendar year after the year of allocation.
The Executive Board is not aware of any other restrictions on voting rights or the transfer of shares.
Direct and indirect shareholdings that exceed 10 percent of the voting rightsUnder the German Securities Trading Act (WpHG), every shareholder whose voting rights in the company reach, exceed, or drop below a certain level, whether through the purchase or sale of shares or in any other way, must notify the company and the Federal Financial Supervisory Authority (BaFin). Under Section 33 Paragraph 1 of the German Securities Trading Act 2, the relevant thresholds are 3, 5, 10, 15, 20, 25, 30, 50, and 75 percent of the voting rights. Changes in voting rights between these thresholds are not subject to notification under the German Securities Trading Act so the following data may differ from more recent overviews of the shareholder structure. In compliance with Section 160 Paragraph 1 No. 8 of the German Stock Corporation Act (AktG), the notes to the financial statements of Evonik Industries AG contain an overview of all voting rights notifications submitted to the company pursuant to Section 33 of the German Securities Trading Act.
Under Section 289a Paragraph 1 Sentence 1 No. 3 and Section 315a Paragraph 1 Sentence 1 No. 3 of the German Commercial Code (HGB), all direct and indirect shareholdings exceeding 10 percent of the voting rights must be declared.
As of December 31, 2017, the Executive Board had only received notification of one direct shareholding exceeding 10 percent of the voting rights—from RAG-Stiftung, Essen (Germany).
The Executive Board is not aware of any further direct or indirect holdings in the company's capital stock that exceed 10 percent of the voting rights.
Method of exercising oversight through voting rights in the event of employee shareholdingsEmployees can become shareholders in the company through employee share programs. Instead of exercising their rights of oversight themselves, employees who hold shares in the com-pany’s capital may transfer these rights to an employee share-holder association, which acts in their interests. 21,340 voting rights had been transferred to the employee shareholder association as of the reporting date.
Appointment and dismissal of Executive Board members, amendments to the Articles of IncorporationThe appointment and dismissal of members of the Executive Board of Evonik Industries AG is governed by Section 84 of the German Stock Corporation Act (AktG) and Section 31 of the German Codetermination Act (MitbestG), in conjunction with Section 6 of the company’s Articles of Incorporation. Section 6 of the Articles of Incorporation states that the Executive Board comprises at least two members. Further, the Supervisory Board is responsible for determining the number of members.
Changes to the Articles of Incorporation are normally resolved by the Annual Shareholders’ Meeting. Section 20 Paragraph 2 of the Articles of Incorporation states that, unless mandatory provisions require otherwise, resolutions shall be adopted by a simple majority of the votes cast and—unless, besides a majority of the votes, a majority of the capital is required by law—by a simple majority of the capital stock represented.
Under Section 11 Paragraph 7 of the Articles of Incorpo-ration, the Supervisory Board is authorized to resolve on amendments to the Articles of Incorporation, provided they are only editorial. A simple majority vote is sufficient.1 This report is part of the audited management report.
2 Section 33 Paragraph 1 of the version effective from January 3, 2018.
88 FINANCIAL REPORT 2017 EVONIK INDUSTRIES

Authorization of the Executive Board, especially to issue and repurchase sharesPursuant to a resolution of the Shareholders’ Meeting of May 18, 2016, the Executive Board is authorized until May 17, 2021, subject to the approval of the Supervisory Board, to purchase up to 10 percent of the company’s capital stock. Together with other shares in the company which the company has already acquired or still owns, or which are attributable to it pursuant to Sections 71d and 71e of the German Stock Corporation Act (AktG), the shares acquired under this authorization may not, at any time, exceed 10 percent of the capital stock. Shares in the company may not be purchased for trading purposes.
Subject to the principle of equal treatment (Section 53a AktG), the purchase may take place via the stock exchange or via a public offer to all shareholders for the purchase or exchange of shares. In the latter case, notwithstanding the exclusion of tender rights permitted in specific circumstances, the principle of equal treatment (Section 53a AktG) must also be taken into account.
The resolution adopted by the Annual Shareholders’ Meeting on March 11, 2013 authorizing the Executive Board to buy back shares in the company was rescinded.
The Annual Shareholders’ Meeting on May 20, 2014 adopted an amendment to Section 4 Paragraph 6 of the Articles of Incorporation authorizing the Executive Board until May 1, 2019, subject to the approval of the Supervisory Board, to increase the company’s capital stock by up to € 116,500,000 (Authorized Capital 2014).
This authorization may be exercised through one or more issuances.
The new shares may be issued against cash and/or con-tributions in kind. The Executive Board is authorized, subject to the approval of the Supervisory Board, to exclude share-holders’ statutory subscription rights when issuing new shares in the following cases:• capital increases against contributions in kind • if the capital increase is against cash and the proportionate
share of the capital stock attributable to the new shares does not exceed 10 percent of the capital stock, and the issue price of the new shares is not significantly below the stock market price of shares already listed on the stock exchange
• to exclude fractional amounts arising from the subscrip-tion ratio
• insofar as is necessary to grant holders and/or creditors of warrants or conversion rights or obligors of warrant and/or conversion obligations subscription rights to new shares to the extent that they would be entitled to them after exercise of their warrants and/or conversion rights or fulfillment of their warrant or conversion obligations
• to grant shares to employees (employee stock), provided that the new shares for which subscription rights are excluded do not in aggregate account for a proportionate share of the capital stock in excess of 1 percent
• for the execution of a scrip dividend.
The proportionate amount of the capital stock attributable to the shares for which subscription rights are excluded, together with the proportionate amount of the capital stock attribut-able to treasury stock or to conversion and/or warrant rights or obligations arising from debt instruments, which are sold or issued after May 20, 2014 under exclusion of subscription rights, may not exceed 20 percent of the capital stock. If the sale or issue takes place in application—analogously or mutatis mutandis—of Section 186 Paragraph 3 Sentence 4 of the German Stock Corporation Act (AktG), this shall also be deemed to constitute exclusion of subscription rights.
The Executive Board is authorized, subject to the approval of the Supervisory Board, to define further details of capital increases out of the Authorized Capital 2014. The authorized capital has not yet been utilized.
In connection with the authorization of May 20, 2014 to issue convertible and/or warrant bonds with a nominal value of up to €1.25 billion up to May 1, 2019, the capital stock is conditionally increased by a further €37,280,000 (Condi-tional Capital 2014).
The conditional capital increase will only be conducted insofar as holders or creditors of warrant or conversion rights or obligors of warrant or conversion obligations arising from warrant bonds and/or convertible bonds issued or guaranteed on the basis of the authorization resolved at the Annual Shareholders’ Meeting of May 20, 2014 exercise their warrants or conversion rights or, insofar as they have an obligation to exercise the warrants or conversion obligations, meet the obligation to exercise the warrant or conversion obligations and other forms of settlement are not used.
The new shares are entitled to a dividend from the start of the fiscal year in which they are issued.
89MANAGEMENT REPORT SUPPLEMENTARY INFORMATIONCONSOLIDATED FINANCIAL STATEMENTS CORPORATE GOVERNANCE
Takeover-relevant information

Significant agreements concluded by the company that are contingent upon a change of control resulting from a takeover bidEvonik Industries AG is a contracting party in the following agreements that are contingent upon a change of control resulting from a takeover bid:• The company has agreed a €1.75 billion syndicated credit
facility with its core banks, which had not been drawn as of December 31, 2017. In the event of a change of control resulting from a takeover bid, these banks could withdraw the credit facility. On the terms agreed, this applies if a new major shareholder (apart from RAG-Stiftung and its subsidiaries) acquires direct or indirect voting rights of more than 50 percent in Evonik Industries AG—including through a voting rights agreement with one or more other shareholders (pursuant to Section 30 Paragraph 2 of the German Securities Acquisition and Takeover Act (WpÜG).
• The company has a debt issuance program to place bonds with a total volume of up to €5 billion. By December 31, 2017 five bonds with a total nominal value of €3.15 billion had been issued under this program. The issue conditions contain a change-of-control clause. In the event of a change of control resulting from a takeover bid and a deterioration in the credit rating of Evonik Industries AG to non-investment grade within 90 days as a result of such change of control, the bondholders have the right to demand redemption of the bond at nominal value plus accrued interest. A change of control is deemed to have occurred if a person (apart from RAG-Stiftung or a (direct or indirect) subsidiary of RAG-Stiftung) or persons acting in a
concerted manner directly or indirectly acquire(s) more than 50 percent of the voting rights in Evonik Industries AG.
• The company has issued a € 500 million hybrid bond. If there is a change of control and if, within a defined change-of-control period, the rating agencies withdraw all ratings previously assigned to the company or downgrade them to non-investment grade, Evonik Industries AG has the right to redeem the bond within a defined period. If the bond is not redeemed, the interest rate applicable for interest payments on the bond will be increased by 5 per-centage points p. a.
Agreements on payment of compensation by the company to members of the Executive Board or other employees in the event of a change of controlChange-of-control clauses are only agreed with members of the Executive Board in connection with long-term remuneration. A change of control is defined as cases when another com-pany obtains control of Evonik Industries AG as defined in the German Securities Acquisition and Takeover Act (WpÜG) or there is a material change in the company's shareholders as a result of a merger or comparable reorganization or business combination. In such cases, the long-term remuneration due to the eligible employees is calculated immediately and paid into their salary account with their next regular salary payment. From the 2013 tranche, the payment is calculated pro rata based on the period between the grant date and the change of control and the four-year performance period.
90 FINANCIAL REPORT 2017 EVONIK INDUSTRIES

Income statement 92
Statement of comprehensive income 93
Balance sheet 94
Statement of changes in equity 96
Cash flow statement 97
Notes 98 1. Segment report 98 2. General information 100 3. Basis of preparation of the financial statements 100 4. Changes in the Group 105 5. Notes to the income statement 113 6. Notes to the balance sheet 118 7. Notes to the cash flow statement 139 8. Notes to the segment report 140 9. Other disclosures 143 10. Disclosures in compliance with
German legislation 159
CONSOLIDATED FINANCIAL STATEMENTS
91
Contents
CORPORATE GOVERNANCEMANAGEMENT REPORT SUPPLEMENTARY INFORMATION CONSOLIDATED FINANCIAL STATEMENTS

Income statement Income statement for the Evonik Group T35
in € million Notes 2017 2016
Sales 5.1 14,419 12,732
Cost of sales 5.2 – 9,938 – 8,534
Gross profit on sales 4,481 4,198
Selling expenses 5.2 – 1,695 – 1,515
Research and development expenses 5.2 – 458 – 438
General administrative expenses 5.2 – 732 – 686
Other operating income 5.3 311 321
Other operating expense 5.4 – 688 – 543
Result from investments recognized at equity 5.5 10 – 39
Income before financial result and income taxes, continuing operations 1,229 1,298
Interest income 73 80
Interest expense – 242 – 229
Other financial income/expense – 33 – 25
Financial result 5.6 – 202 – 174
Income before income taxes, continuing operations 1,027 1,124
Income taxes 5.7 – 293 – 362
Income after taxes, continuing operations 734 762
Income after taxes, discontinued operations – 96
Income after taxes 734 858
thereof attributable to
Non-controlling interests 17 14
Shareholders of Evonik Industries AG (net income) 717 844
Earnings per share in € (basic and diluted) 5.8 1.54 1.81
92 FINANCIAL REPORT 2017 EVONIK INDUSTRIES

Statement of comprehensive income Statement of comprehensive income for the Evonik Group T36
in € million 2017 2016
Income after taxes 734 858
Gains/losses on available-for-sale securities 11 19
Gains/losses on hedging instruments 34 149
Currency translation adjustment – 554 137
Attributable to the equity method (after income taxes) – 1
Deferred taxes – 17 – 33
Comprehensive income that will be reclassified subsequently to profit or loss – 526 273
Remeasurement of the net defined benefit liability for defined benefit pension plans 102 – 585
Attributable to the equity method (after income taxes) – –
Deferred taxes 21 168
Comprehensive income that will not be reclassified subsequently to profit or loss 123 – 417
Other comprehensive income after taxes – 403 – 144
Total comprehensive income 331 714
thereof attributable to
Non-controlling interests 12 15
Shareholders of Evonik Industries AG 319 699
Total comprehensive income attributable to shareholders of Evonik Industries AG 319 699
thereof attributable to
Continuing operations 319 603
Discontinued operations – 96
93CORPORATE GOVERNANCEMANAGEMENT REPORT SUPPLEMENTARY INFORMATION CONSOLIDATED FINANCIAL STATEMENTS
Income statement Statement of comprehensive income

Balance sheetBalance sheet for the Evonik Group T37
in € million Notes Dec. 31, 2017 Dec. 31, 2016
Intangible assets 6.1 & 6.4 6,105 3,312
Property, plant and equipment 6.2 & 6.4 6,495 6,041
Investments recognized at equity 6.3 & 6.4 47 43
Financial assets 6.5 327 213
Deferred taxes 6.13 1,223 1,162
Other income tax assets 6.13 14 8
Other receivables 6.7 296 58
Non-current assets 14,507 10,837
Inventories 6.6 2,025 1,679
Other income tax assets 6.13 154 228
Trade accounts receivable 6.7 1,776 1,661
Other receivables 6.7 314 300
Financial assets 6.5 159 317
Cash and cash equivalents 7.3 1,004 4,623
Current assets 5,432 8,808
Total assets 19,939 19,645
94 FINANCIAL REPORT 2017 EVONIK INDUSTRIES

in € million Notes Dec. 31, 2017 Dec. 31, 2016
Issued capital 466 466
Capital reserve 1,167 1,166
Accumulated income 6,020 5,716
Accumulated other comprehensive income – 214 310
Equity attributable to shareholders of Evonik Industries AG 7,439 7,658
Equity attributable to non-controlling interests 88 92
Equity 6.8 7,527 7,750
Provisions for pensions and other post-employment benefits 6.9 3,817 3,852
Other provisions 6.10 788 817
Deferred taxes 6.13 541 453
Other income tax liabilities 6.13 225 173
Financial liabilities 6.11 3,706 3,334
Other payables 6.12 57 71
Non-current liabilities 9,134 8,700
Other provisions 6.10 1,035 1,035
Other income tax liabilities 6.13 50 83
Financial liabilities 6.11 371 401
Trade accounts payable 6.12 1,449 1,212
Other payables 6.12 373 464
Current liabilities 3,278 3,195
Total equity and liabilities 19,939 19,645
95CORPORATE GOVERNANCEMANAGEMENT REPORT SUPPLEMENTARY INFORMATION CONSOLIDATED FINANCIAL STATEMENTS
Balance sheet

Statement of changes in equity Statement of changes in equity for the Evonik Group Note 6.8 T38
in € million Issued capitalCapital reserve
Accumulated income
Treasury shares
Accumulated other com- prehensive
income
Attributable to shareholders
of Evonik Industries AG
Attributable to non-
controlling interests
Total equity
As of January 1, 2016 466 1,166 5,821 – 40 7,493 83 7,576
Capital increases/decreases – – – – – – 4 4
Dividend distribution – – – 536 – – – 536 – 9 – 545
Purchase of treasury shares – – – – 15 – – 15 – – 15
Share-based payment – 3 – – – 3 – 3
Sale of treasury shares – – 3 – 15 – 12 – 12
Income after taxes – – 844 – – 844 14 858
Other comprehensive income after taxes – – – 417 – 272 – 145 1 – 144
Total comprehensive income – – 427 – 272 699 15 714
Other changes – – 4 – – 2 2 – 1 1
As of December 31, 2016 466 1,166 5,716 – 310 7,658 92 7,750
Capital increases/decreases – – – – – – – –
Dividend distribution – – – 536 – – – 536 – 14 – 550
Purchase of treasury shares – – – – 19 – – 19 – – 19
Share-based payment – 5 – – – 5 – 5
Sale of treasury shares – – 4 – 19 – 15 – 15
Income after taxes – – 717 – – 717 17 734
Other comprehensive income after taxes – – 123 – – 521 – 398 – 5 – 403
Total comprehensive income – – 840 – – 521 319 12 331
Other changes – – – – – 3 – 3 – 2 – 5
As of December 31, 2017 466 1,167 6,020 – – 214 7,439 88 7,527
96 FINANCIAL REPORT 2017 EVONIK INDUSTRIES

Cash flow statementCash flow statement for the Evonik Group T39
in € million Notes 2017 2016
Income before financial result and income taxes, continuing operations 1,229 1,298
Depreciation, amortization, impairment losses/reversal of impairment losses on non-current assets 923 747
Result from investments recognized at equity – 10 39
Gains/losses on the disposal of non-current assets – 73 3
Change in inventories – 95 107
Change in trade accounts receivable – 61 173
Change in trade accounts payable and current advance payments received from customers 190 101
Change in provisions for pensions and other post-employment benefits – 202 – 173
Change in other provisions – 2 – 124
Change in miscellaneous assets/liabilities 19 124
Cash outflows for interest – 127 – 101
Cash inflows from interest 62 56
Cash inflows from dividends 11 11
Cash inflows/outflows for income taxes – 313 – 492
Cash flow from operating activities 7.1 1,551 1,769
Cash outflows for investments in intangible assets, property, plant and equipment – 1,040 – 948
Cash outflows for investments in subsidiaries – 4,121 – 96
Cash outflows for investments in other shareholdings – 16 – 53
Cash inflows from divestments of intangible assets, property, plant and equipment 12 17
Cash inflows/outflows from divestment of shareholdings – 10 1
Cash inflows/outflows relating to securities, deposits and loans 17 218
Transfers to the pension trust fund (CTA) – 23 – 22
Cash flow from investing activities 7.2 – 5,181 – 883
Cash inflows/outflows relating to capital contributions – 4
Cash outflows for dividends to shareholders of Evonik Industries AG – 536 – 536
Cash outflows for dividends to non-controlling interests – 14 – 9
Cash outflows for the purchase of treasury shares – 19 – 15
Cash inflows from the sale of treasury shares 20 15
Cash inflows from the addition of financial liabilities 700 2,064
Cash outflows for repayment of financial liabilities – 201 – 98
Cash inflows/outflows in connection with financial transactions 73 – 52
Cash flow from financing activities 23 1,373
Change in cash and cash equivalents – 3,607 2,259
Cash and cash equivalents as of January 1 4,623 2,368
Change in cash and cash equivalents – 3,607 2,259
Changes in exchange rates and other changes in cash and cash equivalents – 12 – 4
Cash and cash equivalents as on the balance sheet as of December 31 7.3 1,004 4,623
Prior-year figures restated.
97CORPORATE GOVERNANCEMANAGEMENT REPORT SUPPLEMENTARY INFORMATION CONSOLIDATED FINANCIAL STATEMENTS
Statement of changes in equity Cash flow statement

Notes to the consolidated financial statements 1. Segment report
Segment report by operating segments Note 8.1 T40
in € million
Nutrition & Care Resource Efficiency Performance Materials
Services Other operationsCorporate, consolidation
Total Group (continuing operations)
2017 2016 2017 2016 2017 2016 2017 2016 2017 2016 2017 2016 2017 2016
External sales 4,511 4,316 5,395 4,473 3,781 3,245 716 683 16 15 – – 14,419 12,732
Internal sales 33 32 46 40 177 113 2,081 1,947 24 38 – 2,361 – 2,170 – –
Total sales 4,544 4,348 5,441 4,513 3,958 3,358 2,797 2,630 40 53 – 2,361 – 2,170 14,419 12,732
Result from investments recognized at equity 4 – 45 3 3 – 3 – 1 6 4 – – – – 10 – 39
Adjusted EBITDA 749 1,006 1,174 977 660 371 123 151 – 101 – 109 – 245 – 231 2,360 2,165
Adjusted EBITDA margin in % 16.6 23.3 21.8 21.8 17.5 11.4 17.2 22.1 – – – – 16.4 17.0
Adjusted EBIT 465 795 886 751 508 234 – 1 32 – 114 – 122 – 254 – 242 1,490 1,448
Capital employed (annual average) 4,263 2,965 4,262 2,776 1,233 1,278 652 572 – 10 – 137 2,873 2,879 13,273 10,333
ROCE in % 10.9 26.8 20.8 27.1 41.2 18.3 – 0.2 5.6 – – – – 11.2 14.0
Depreciation and amortization a – 262 – 209 – 281 – 224 – 139 – 134 – 124 – 117 – 14 – 13 – 9 – 10 – 829 – 707
Capital expenditures a 391 315 340 266 163 168 162 189 15 20 7 2 1,078 960
Financial investments 1,966 140 2,341 15 3 19 2 10 – 7 10 – 4,322 191
No. of employees as of December 31 8,257 7,594 10,260 8,928 4,364 4,393 13,021 12,892 249 211 372 333 36,523 34,351
For details of the segmentation of impairments and reversals of impairments in accordance with IAS 36, see Notes 5.3 to 5.5.a Intangible assets, property, plant and equipment.
Segment report by regions Note 8.2 T41
in € million
Western Europe Eastern Europe North America
Central and South America
Asia-Pacific North
Asia-Pacific South
Middle East, Africa
Total Group (continuing operations)
2017 2016 2017 2016 2017 2016 2017 2016 2017 2016 2017 2016 2017 2016 2017 2016
External sales a 6,253 5,534 837 767 3,303 2,700 551 563 2,158 1,947 896 818 421 403 14,419 12,732
Goodwill as of December 31b 2,403 2,081 54 54 1,847 398 30 34 195 199 94 46 19 20 4,642 2,832
Other intangible assets, property, plant and equipment as of December 31b 4,244 3,475 27 49 1,879 1,234 178 219 787 835 834 700 9 9 7,958 6,521
Capital expenditures 576 538 5 12 254 242 8 20 61 85 173 62 1 1 1,078 960
No. of employees as of December 31 24,488 23,860 643 638 4,982 4,054 680 631 3,793 3,474 1,741 1,508 196 186 36,523 34,351
Prior-year figures restated.a External sales Western Europe: thereof Germany €2,639 million (2016: €2,441 million). b Non-current assets according to IFRS 8.33 b.
98 FINANCIAL REPORT 2017 EVONIK INDUSTRIES

Segment report by operating segments Note 8.1 T40
in € million
Nutrition & Care Resource Efficiency Performance Materials
Services Other operationsCorporate, consolidation
Total Group (continuing operations)
2017 2016 2017 2016 2017 2016 2017 2016 2017 2016 2017 2016 2017 2016
External sales 4,511 4,316 5,395 4,473 3,781 3,245 716 683 16 15 – – 14,419 12,732
Internal sales 33 32 46 40 177 113 2,081 1,947 24 38 – 2,361 – 2,170 – –
Total sales 4,544 4,348 5,441 4,513 3,958 3,358 2,797 2,630 40 53 – 2,361 – 2,170 14,419 12,732
Result from investments recognized at equity 4 – 45 3 3 – 3 – 1 6 4 – – – – 10 – 39
Adjusted EBITDA 749 1,006 1,174 977 660 371 123 151 – 101 – 109 – 245 – 231 2,360 2,165
Adjusted EBITDA margin in % 16.6 23.3 21.8 21.8 17.5 11.4 17.2 22.1 – – – – 16.4 17.0
Adjusted EBIT 465 795 886 751 508 234 – 1 32 – 114 – 122 – 254 – 242 1,490 1,448
Capital employed (annual average) 4,263 2,965 4,262 2,776 1,233 1,278 652 572 – 10 – 137 2,873 2,879 13,273 10,333
ROCE in % 10.9 26.8 20.8 27.1 41.2 18.3 – 0.2 5.6 – – – – 11.2 14.0
Depreciation and amortization a – 262 – 209 – 281 – 224 – 139 – 134 – 124 – 117 – 14 – 13 – 9 – 10 – 829 – 707
Capital expenditures a 391 315 340 266 163 168 162 189 15 20 7 2 1,078 960
Financial investments 1,966 140 2,341 15 3 19 2 10 – 7 10 – 4,322 191
No. of employees as of December 31 8,257 7,594 10,260 8,928 4,364 4,393 13,021 12,892 249 211 372 333 36,523 34,351
For details of the segmentation of impairments and reversals of impairments in accordance with IAS 36, see Notes 5.3 to 5.5.a Intangible assets, property, plant and equipment.
Segment report by regions Note 8.2 T41
in € million
Western Europe Eastern Europe North America
Central and South America
Asia-Pacific North
Asia-Pacific South
Middle East, Africa
Total Group (continuing operations)
2017 2016 2017 2016 2017 2016 2017 2016 2017 2016 2017 2016 2017 2016 2017 2016
External sales a 6,253 5,534 837 767 3,303 2,700 551 563 2,158 1,947 896 818 421 403 14,419 12,732
Goodwill as of December 31b 2,403 2,081 54 54 1,847 398 30 34 195 199 94 46 19 20 4,642 2,832
Other intangible assets, property, plant and equipment as of December 31b 4,244 3,475 27 49 1,879 1,234 178 219 787 835 834 700 9 9 7,958 6,521
Capital expenditures 576 538 5 12 254 242 8 20 61 85 173 62 1 1 1,078 960
No. of employees as of December 31 24,488 23,860 643 638 4,982 4,054 680 631 3,793 3,474 1,741 1,508 196 186 36,523 34,351
Prior-year figures restated.a External sales Western Europe: thereof Germany €2,639 million (2016: €2,441 million). b Non-current assets according to IFRS 8.33 b.
99
NotesSegment report
CORPORATE GOVERNANCEMANAGEMENT REPORT SUPPLEMENTARY INFORMATION CONSOLIDATED FINANCIAL STATEMENTS

2. General information
Evonik Industries AG is an international specialty chemicals company headquartered in Germany. Its registered office is at Rellinghauser Straße 1 – 11, 45128 Essen (Germany) and the company is registered in the Commercial Register at Essen District Court under HRB No. 19474.
As a subsidiary of RAG-Stiftung, Essen (Germany), Evonik Industries AG and its subsidiaries are included in the annual consolidated financial statements prepared by RAG-Stiftung, which prepares consolidated financial statements for the largest and smallest groups of companies to which Evonik and its subsidiaries belong. The consolidated financial statements of
RAG-Stiftung are published in the German Federal Gazette (Bundesanzeiger).
The present consolidated financial statements of Evonik Industries AG and its subsidiaries (referred to jointly as Evonik or the Group) were prepared by the Executive Board of Evonik Industries AG at its meeting on February 19, 2018, discussed at the meeting of the Audit Committee on February 26, 2018, and presented to the Supervisory Board for approval at its meeting on March 5, 2018. The consolidated financial statements are also published in the German Federal Gazette.
3. Basis of preparation of the financial statements
3.1 Compliance with IFRS
As permitted by Section 315e Paragraph 1 of the German Com-mercial Code (HGB), the present consolidated financial state-ments have been prepared on the basis of the International
Financial Reporting Standards (IFRS), as adopted by the European Union (EU), and comply with these standards.
3.2 Presentation and methods
The consolidated financial statements cover the period from January 1 to December 31, 2017 and are presented in euros. All amounts are stated in millions of euros (€ million) except where otherwise indicated. In some cases, rounding may mean that the figures in this report do not add up exactly to the totals stated and percentages do not correlate exactly to the figures presented.
For the first time, the accounting policies are outlined in the respective notes.
Both the accounting policies and the items presented in the consolidated financial statements are in principle consistent from one period to the next, with the exception of the follow-ing change:
In the cash flow statement, all effects from currency hedging transactions were previously included in the cash flow from operating activities, with the exception of the effects of
currency hedging in connection with acquisition projects. The effects of these transactions were included in the cash flow from investing activities if they related to currency hedging of the purchase price to be paid, and in the cash flow from financing activities if they related to hedging of acquisition- related intragroup financing. From fiscal 2017, all financing- related cash flow effects from currency hedging—including those unrelated to acquisitions—are included in the cash flow from financing activities. This change leads to consistent treat-ment of the financing-related cash flow effects of currency hedging. Moreover, it is in keeping with the differentiated allocation of income and expenses from currency translation and currency hedging introduced in 2015. Since then, these have been recognized in income before financial result and income taxes (which is the starting point for the indirect method of calculating the cash flow from operating activities) if they relate to the operating business, and in the financial result if they relate to financing-related processes. The comparative figures for the prior-year period have been restated accordingly.
3.3 Assumptions and estimation uncertainties
The preparation of consolidated financial statements involves assumptions and estimates about the future. The subsequent circumstances may differ from these estimates. Adjustments to estimates are recognized in income as soon as better
information is available. The estimates and assumptions that constitute a considerable risk that the carrying amounts of assets and liabilities may have to be adjusted within the next fiscal year are discussed in the corresponding notes.
100 FINANCIAL REPORT 2017 EVONIK INDUSTRIES

3.4 New accounting standards
Accounting standards to be applied for the first timeA number of revised and newly issued standards and inter-pretations had to be applied for the first time in fiscal 2017. However, they did not have a material impact on the consoli-dated financial statements.
Accounting standards that are not yet mandatoryThe International Accounting Standards Board (IASB) has issued further accounting standards (IFRS, IAS) and interpre-tations (IFRIC, SIC) which did not become mandatory in fiscal 2017 or have not yet been officially adopted by the European Union. The accounting standards that could be of relevance for the consolidated financial statements are out-lined below. They will probably be applied for the first time from the date on which they come into force.
Accounting standards that are not yet mandatory T42
Standard a: Issued by the IASB b: Effective date as per IASB c: Effective date as per EU d: Publication in the Official Journal of the EU Subject of standard—Expected impact on the consolidated financial statements
IFRS 15 Revenue from Contracts with Customers
a: May 28, 2014 b: Jan. 1, 2018 c: Jan. 1, 2018 d: Oct. 29, 2016
IFRS 15 contains extensive new rules for the recognition of revenues arising from contracts with customers for all sectors. A five-step model outlines in detail aspects such as identifying distinct performance obligations, the level of the expected consideration, taking into account variable price components, and the distribution of the expected consideration among the identified performance obligations. Further, there are now uniform criteria to determine whether a performance obligation is satisfied at a point in time or over time. This new standard will replace the following current standards and interpretations: IAS 11, IAS 18, IFRIC 13, IFRIC 15, IFRIC 18, and SIC-31. IFRS 15 has to be applied fully retrospectively from January 1, 2018. An analysis of contracts and the subsequent design phase identified areas where there is a possible need for change and implemented them in the systems and processes. Implementation has been completed. New business transactions are constantly assessed for the potential impact of IFRS 15. A change in the timing of revenue recognition may result, among other things, from identification of an additional performance obligation, a change in the assessment of whether revenue is realized at a point in time or over time, or of the timing of the transfer of control. If IFRS 15 had already been applied in 2017, Group sales would have been €36 million lower and EBITDA would have been €3 million lower. A new separate performance obligation was identified in connection with freight and transportation services provided after transfer of control. The effect of shifting the revenue component for freight and transportation services to a later point in time would have been €1 million in fiscal 2017 and would have affected EBITDA by the same amount. Under certain conditions for overseas shipment relating to the sale of products, the timing of the transfer of control to the customer is later than the previous timing of revenue recognition (transfer of opportunities and risks). The effect of the shift in sales compared with the present timing of revenue recognition would have amounted to €6 million in 2017. The corresponding impact on EBITDA would have been €1 million. Further, under IFRS 15 the level of revenues recognized over the total period may differ from previous practice. This is possible in the following cases: • For prepayments by customers, where it may be necessary to recognize a financing component that
would increase sales, the effect of the increase in sales and EBITDA is €1 million. • Some agreements on the unconditional repurchase of products are classified as leases. The effects
of the related reduction in sales would have been €6 million for fiscal 2017. This has no impact on EBITDA.
• In future, no revenue will be recognized for exchange-type transactions with competitors. The underlying products will continue to be recognized by Evonik and the transaction will therefore be classified as financing. This would have reduced revenue by €24 million in 2017, and the corre-sponding EBITDA effect would have been €2 million.
Application of IFRS 15 will mainly affect disclosures in the notes to the consolidated financial statements.
101
NotesBasis of preparation of the financial statements
CORPORATE GOVERNANCEMANAGEMENT REPORT SUPPLEMENTARY INFORMATION CONSOLIDATED FINANCIAL STATEMENTS

Accounting standards that are not yet mandatory T42
Standard a: Issued by the IASB b: Effective date as per IASB c: Effective date as per EU d: Publication in the Official Journal of the EU Subject of standard—Expected impact on the consolidated financial statements
IFRS 9 Financial Instruments
a: Jul. 24, 2014 b: Jan. 1, 2018 c: Jan. 1, 2018 d: Nov. 29, 2016
IFRS 9 is the replacement for IAS 39 Financial Instruments: Recognition and Measurement. The main changes in IFRS 9 compared with the old standard IAS 39 comprise the introduction of completely new classification and measurement rules for financial assets, the introduction of a new impairment model which should result in more timely recognition of losses, extension of the permitted hedged items, a modified assessment of the effectiveness of hedge-accounting relationships, and extended information in the notes. Evonik is applying IFRS 9 from January 1, 2018, the date of first-time application of this new standard. It is not using the option of restatement for prior-year periods. The differences between the previous carrying amount in accordance with IAS 39 and the carrying amount in accordance with IFRS 9 will be presented in the opening balance of accumulated income (revenue reserves) as of January 1, 2018. At Evonik, the new classification and measurement rules principally affect other investments, which fall within the scope of IFRS 9, convertible bonds, and trade accounts receivable. Other investments were previously allocated to the category available-for-sale. Listed instruments were measured at fair value while some unlisted instruments were measured at cost of acquisition for reasons of simplification. In the future, classification and measurement will be either at fair value through profit or loss (FVPL) or at fair value through other comprehensive income (FVOCI), without subsequent reclassification to the income statement, and will be based on a case-by-case decision. As of January 1, 2018, all equity instruments, which have a total carrying amount of €126 million, will be carried at fair value through other compre-hensive income (FVOCI), without subsequent reclassification to profit or loss. All convertible bonds will be measured at the fair value of the host contract and the derivative. Trade accounts receivable held until settlement will in future be measured at amortized cost. By contrast, where there is an intention of selling trade accounts receivable, they will be measured at fair value through profit or loss (FVPL). No further material reclassification requirements were identified in the analysis of other financial assets. The changes resulting from the new classification and measurement rules in IFRS 9 are in the low single- digit millions of euros and do not impact income. The new impairment model for expected credit losses takes a more differentiated approach to risks. As of January 1, 2018, we expect the effect on trade accounts receivable to be in the single-digit million euro range. In subsequent years, an increase in earnings volatility on the income statement cannot be ruled out as a result of the introduction of the new impairment model due to the earlier inclusion of credit risks. In the area of hedge accounting, in some cases there will be changes in financial risk management in the Evonik Group, especially with regard to the management of risks (extended scope and documentation of the hedging process). There are no transition effects as of January 1, 2018. Forward components and basis spreads will be disclosed in the cost of hedging reserve in the future.
IFRS 16 Leases
a: Jan. 13, 2016 b: Jan. 1, 2019 c: Jan. 1, 2019 d: Nov. 9, 2017
This new standard on leases has far-reaching implications for the recognition of leases by the lessee. Under IAS 17, the transfer of substantially all opportunities and risks of the leased asset was decisive for rec-ognition of a lease by the lessee. In future, the lessee will generally recognize each lease on the balance sheet in the form of a right-of-use for the leased asset and a corresponding liability. For lessors, by con-trast, the accounting principles are essentially unchanged, especially as regards the continued require-ments for the classification of leases. IFRS 16 supersedes IAS 17 and the associated interpretations IFRIC 4, SIC-15, and SIC-27. The Group-wide project initiated by Evonik to implement the new standard on leases is currently at the phase of collecting and analyzing contracts. This includes selecting suitable software (lease engine) that will be able to calculate the impact of IFRS 16 and make the relevant postings. A preliminary analysis based on the figures for fiscal 2016 indicates that the increase in assets resulting from this change would be around 3 percent and EBITDA would rise by around 5 percent. However, these findings could alter because the final impact is contingent, among other things, on the following decisions: • Selection of the transition method • Determination of the interest rates implicit in leases or incremental borrowing rates • Application of the option for low-value asset leases • Application of the option for short-term leases The present nominal value of obligations as a lessee under operating leases is outlined in Note 9.4.
102 FINANCIAL REPORT 2017 EVONIK INDUSTRIES

Accounting standards that are not yet mandatory T42
Standard a: Issued by the IASB b: Effective date as per IASB c: Effective date as per EU d: Publication in the Official Journal of the EU Subject of standard—Expected impact on the consolidated financial statements
Clarifications to IFRS 15 Revenue from Contracts with Customers
a: Apr. 12, 2016 b: Jan. 1, 2018 c: Jan. 1, 2018 d: Nov. 9, 2017
The clarifications relate to the following issues: identification of performance obligations and checking the contract for separability, classification as principal or agent, and license revenues. In addition, two further principles have been added to facilitate initial application of the standard. For further information on the impact of IFRS 15 on the consolidated financial statements, please see the relevant section above.
Annual Improvement Process (IFRSs 2014 – 2016 Cycle)
a: Dec. 8, 2016 b: Jan. 1, 2017/ Jan. 1, 2018 c: Jan.1, 2017/ Jan. 1, 2018 d: Feb. 8, 2018
Annual Improvements to IFRSs 2014 – 2016 Cycle comprises amendments to IFRS 1, IFRS 12, and IAS 28. They comprise improvements and clarification of existing standards. The changes are not currently relevant for the consolidated financial statements or could affect details given in the notes to the con-solidated financial statements.
IFRIC Interpretation 22 Foreign Currency Transactions and Advance Consideration
a: Dec. 8, 2016 b: Jan. 1, 2018 c: open d: open
This interpretation clarifies the exchange rate to be used for initial recognition of a foreign currency transaction in the functional currency of an entity if the entity pays or receives consideration in advance for the assets, expenses, or income related to the transaction. Evonik has already applied this principle in the past.
IFRIC Interpretation 23 Uncertainty over Income Tax Treatments
a: Jun. 7, 2017 b: Jan. 1, 2019 c: open d: open
IFRIC 23 clarifies the treatment of uncertainty relating to income taxes. It implements decisions taken by the IFRS Interpretations Committee (IFRS IC) on the recognition and measurement of tax risk positions and thus closes a gap in IAS 12. According to this interpretation, tax uncertainties must be taken into account when it is not probable that the taxation authority would accept the tax treatment. An entity is required to assume that a tax authority with the right to examine and challenge tax treatments will examine those treatments and have full knowledge of all related information. Detection risk is not considered in the recognition and measurement of uncertainty regarding tax treatments. Tax uncertainties may be measured at the most likely amount or the expected value. This interpretation clarifies that the valuation method that best reflects the existing risk should be used. The changes are not currently expected to have any impact on the consolidated financial statements.
Amendments to IFRS 9 Financial Instruments: Prepayment Features with Negative Compensation
a: Oct. 12, 2017 b: Jan. 1, 2019 c: open d: open
The amendments clarify that financial assets with prepayment features are eligible for measurement at amortized cost or at fair value through comprehensive income (FVOCI) if one party receives or pays appropriate compensation for the prepayment, even though the compensation payment does not meet the cash flow criterion set out in IFRS 9. The clarification is not currently relevant for the consolidated financial statements.
Amendments to IAS 28: Long-term Interests in Associates and Joint Ventures
a: Oct. 12, 2017 b: Jan. 1, 2019 c: open d: open
Long-term investments that, in substance, form part of an entity's net investment in an entity recognized at equity must be recognized and measured in accordance with IFRS 9. However, the ruling in IAS 28.38 that, when allocating losses recognized using the equity method, such investments must be taken into account, also has to be considered. The clarification will not have a material impact on the consolidated financial statements.
Annual Improvement Process (IFRSs 2015 – 2017 Cycle)
a: Dec. 12, 2017 b: Jan. 1, 2019 c: open d: open
Annual Improvements to IFRSs 2015 – 2017 Cycle comprises amendments to IFRS 3, IFRS 11, IAS 12, and IAS 23. These comprise improvements and clarification of existing standards that currently have no impact on the consolidated financial statements.
Clarifications to IAS 19: Employee Benefits: Plan Amendment, Curtailment or Settlement
a: Feb. 2, 2018 b: Jan. 1, 2019 c: open d: open
The clarifications address plan amendments, curtailments, and settlements where the net defined benefit liability has to be remeasured in the future on the basis of updated actuarial assumptions. In addition, the remeasured net liability (taking into account the revised benefits resulting from remeasurement) have to be used to determine the net interest expense after the remeasurement. The impact on the consolidated financial statements is currently being examined.
3.5 Consolidation methods and scope of consolidation
Scope of consolidationAlongside Evonik Industries AG, all material German and for-eign subsidiaries directly or indirectly controlled by Evonik Industries AG are fully consolidated in the consolidated financial statements of Evonik Industries AG. Evonik Industries AG con-trols a company if it is exposed to, or has rights to, variable returns from its involvement with the company and has the
ability to affect those returns through its power over the company.
Joint operations are included in the consolidated financial statements on a pro rata basis. A joint operation is an arrange-ment where the parties that have joint control have rights to the assets, and obligations for the liabilities, relating to the arrange-ment.
103
NotesBasis of preparation of the financial statements
CORPORATE GOVERNANCEMANAGEMENT REPORT SUPPLEMENTARY INFORMATION CONSOLIDATED FINANCIAL STATEMENTS

Joint ventures and associates are generally recognized at equity. A joint venture is a joint arrangement where the Group has joint control, together with other parties, and has rights to the net assets of the arrangement. Associates are companies where the Evonik Group has a significant influ-ence but does not have control or joint control of financial and operating policies.
Two companies are included in the consolidated financial statements as associates even though the voting rights and shareholding are below 20 percent in each case, because Evonik has a significant influence through contractual agreements.1
Companies whose influence on the assets, financial posi-tion, and earnings of the Group, both individually and in aggregate, is negligible are carried at amortized cost.
Changes in the scope of consolidation are outlined in Note 4.1.
Consolidation methodsThe financial statements of the consolidated German and foreign subsidiaries are prepared using uniform accounting policies.
Capital is consolidated at the time of acquisition by offset-ting the carrying amount of the business acquired against the pro rata revalued equity of the subsidiary. Ancillary acquisition costs are not included in the carrying amount of the subsidiary. Instead they are recognized as expense in the income state-ment. The assets and liabilities (net assets) of the subsidiary are included at their fair values. If shares in the subsidiary are held before acquiring control, they must be revalued and any resultant change in value must be recognized in the income statement in other operating income or other operating expense. Gains or losses recognized in other comprehensive income must be derecognized in the same way as if the acquirer had divested the shares previously held. Any remaining excess of the acquisition cost over the fair value of the net assets is recognized as goodwill. Negative differences are included in income following a renewed examination of the fair value of the net assets.
Changes in shareholdings in a previously consolidated subsidiary that do not result in a loss of control are recognized directly in equity as a transaction between owners. In this case, the shares attributable to the owners of the parent company and to the other shareholders are adjusted to reflect the changes in their respective stakes in the subsidiary. Any
difference between this adjustment and the fair value of the consideration paid or received is recognized directly in equity and allocated to the shares attributable to the owners of the parent company. Directly related transaction costs are also recognized as a transaction between owners that has no impact on income, with the exception of costs for the issuance of debt or equity instruments, which are still measured in accor-dance with the criteria for recognizing financial instruments. Cash inflows and outflows relating to these transactions are presented in the cash flow from financing activities.
A subsidiary must be deconsolidated as of the date on which control is lost. The net assets of the subsidiary and the non-controlling interests (in other words, the parent company’s share in the net assets of the subsidiary) are derecognized. The gain or loss on the divestments must be calculated from the Group viewpoint. It is derived from the difference between the proceeds of the divestment (selling price less costs to sell) and the parent company’s share in the divested net assets of the subsidiary (including the remaining hidden reserves and liabilities, and any goodwill shown on the balance sheet). The shares in the former subsidiary still held by Evonik are revalued at fair value as of the date on which control is lost. All resulting gains and losses are recog-nized in the income statement as other operating income or other operating expense. In addition, amounts shown in equity under accumulated other comprehensive income are also reclassified to the income statement, except where another accounting standard requires direct transfer to revenue reserves.
Intragroup income and expenses, profits, losses, receivables, and liabilities between consolidated subsidiaries are fully eliminated. In the case of joint operations, elimination is pro rata. Write-downs on shares in such companies recognized in the separate financial statements are reversed.
Joint operations are recognized in the consolidated financial statements at the proportionate amount of their assets and liabilities, revenues and expenses in accordance with Evonik’s rights and obligations.
The same consolidation principles apply for companies accounted for using the equity method. In this case, any goodwill is recognized in the carrying amount of the invest-ment. The financial statements of the companies recognized at equity are prepared using uniform accounting policies.
1 These companies are ARG mbH & Co. KG, Duisburg (Germany) and Biosynthetic Technologies LLC., Irvine (California, USA).
104 FINANCIAL REPORT 2017 EVONIK INDUSTRIES

3.6 Currency translation
The financial statements of Evonik Industries AG and its sub-sidiaries are generally prepared in their functional currency. In the separate financial statements prepared by these com-panies, business transactions in foreign currencies are trans-lated at the exchange rate on the date of initial recognition. Any gains or losses resulting from the valuation of monetary assets and liabilities in foreign currencies are recognized in other operating income, other operating expense, or other financial result at the closing rate on the reporting date.
In the consolidated financial statements, the assets and liabilities of all foreign subsidiaries are translated from their functional currency into euros at closing rates on the reporting date. Goodwill and hidden assets and liabilities from the acquisition of a foreign subsidiary are translated at the closing rate as assets and liabilities of the foreign subsidiary. Income and expense items are translated at average exchange rates for the year, which are derived from the mean of the exchange rates at month-end over the past 13 months. Trans-lation differences compared to the prior year and translation differences between the income statement and balance sheet
are recognized in other comprehensive income. They are only reclassified to the income statement when the foreign subsidiary is divested.
The equity of foreign companies recognized using the equity method is translated in the same way.
Exchange rates T43
€1 corresponds to
Average annual rates Closing rates
2017 2016Dec. 31,
2017Dec. 31,
2016
Brazilian real (BRL) 3.63 3.86 3.97 3.43
British pound (GBP) 0.87 0.82 0.89 0.86
Chinese renminbi yuan (CNY) 7.63 7.32 7.80 7.32
Japanese yen (JPY) 127.00 121.26 135.01 123.40
Singapore dollar (SGD) 1.56 1.53 1.60 1.52
US dollar (USD) 1.13 1.10 1.20 1.05
4. Changes in the Group
4.1 Scope of consolidation
Changes in the scope of consolidation T44
No. of companies GermanyOther
countries Total
Evonik Industries AG and consolidated subsidiaries
As of December 31, 2016 38 99 137
Acquisitions 4 8 12
Other companies consolidated for the first time 2 1 3
Intragroup mergers – 1 – – 1
Other companies deconsolidated – – 1 – 1
As of December 31, 2017 43 107 150
Joint operations
As of December 31, 2016 3 2 5
Other companies consolidated for the first time – 2 2
Divestments – – 2 – 2
Other companies deconsolidated – 2 – – 2
As of December 31, 2017 1 2 3
Investments recognized at equity
As of December 31, 2016 4 9 13
Acquisitions – 1 1
Other companies included at equity for the first time – 1 1
As of December 31, 2017 4 11 15
48 120 168
105CORPORATE GOVERNANCEMANAGEMENT REPORT SUPPLEMENTARY INFORMATION CONSOLIDATED FINANCIAL STATEMENTS
NotesBasis of preparation of the financial statementsChanges in the Group
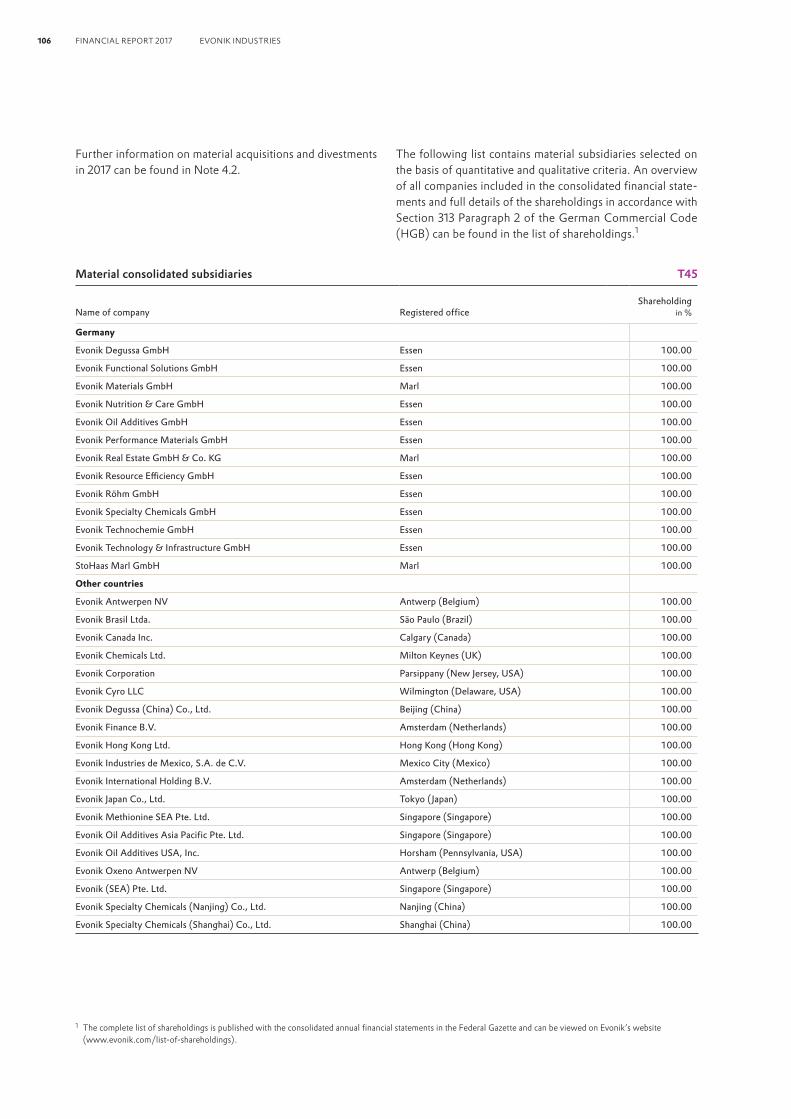
Further information on material acquisitions and divestments in 2017 can be found in Note 4.2.
The following list contains material subsidiaries selected on the basis of quantitative and qualitative criteria. An overview of all companies included in the consolidated financial state-ments and full details of the shareholdings in accordance with Section 313 Paragraph 2 of the German Commercial Code (HGB) can be found in the list of shareholdings.1
Material consolidated subsidiaries T45
Name of company Registered officeShareholding
in %
Germany
Evonik Degussa GmbH Essen 100.00
Evonik Functional Solutions GmbH Essen 100.00
Evonik Materials GmbH Marl 100.00
Evonik Nutrition & Care GmbH Essen 100.00
Evonik Oil Additives GmbH Essen 100.00
Evonik Performance Materials GmbH Essen 100.00
Evonik Real Estate GmbH & Co. KG Marl 100.00
Evonik Resource Efficiency GmbH Essen 100.00
Evonik Röhm GmbH Essen 100.00
Evonik Specialty Chemicals GmbH Essen 100.00
Evonik Technochemie GmbH Essen 100.00
Evonik Technology & Infrastructure GmbH Essen 100.00
StoHaas Marl GmbH Marl 100.00
Other countries
Evonik Antwerpen NV Antwerp (Belgium) 100.00
Evonik Brasil Ltda. São Paulo (Brazil) 100.00
Evonik Canada Inc. Calgary (Canada) 100.00
Evonik Chemicals Ltd. Milton Keynes (UK) 100.00
Evonik Corporation Parsippany (New Jersey, USA) 100.00
Evonik Cyro LLC Wilmington (Delaware, USA) 100.00
Evonik Degussa (China) Co., Ltd. Beijing (China) 100.00
Evonik Finance B.V. Amsterdam (Netherlands) 100.00
Evonik Hong Kong Ltd. Hong Kong (Hong Kong) 100.00
Evonik Industries de Mexico, S.A. de C.V. Mexico City (Mexico) 100.00
Evonik International Holding B.V. Amsterdam (Netherlands) 100.00
Evonik Japan Co., Ltd. Tokyo (Japan) 100.00
Evonik Methionine SEA Pte. Ltd. Singapore (Singapore) 100.00
Evonik Oil Additives Asia Pacific Pte. Ltd. Singapore (Singapore) 100.00
Evonik Oil Additives USA, Inc. Horsham (Pennsylvania, USA) 100.00
Evonik Oxeno Antwerpen NV Antwerp (Belgium) 100.00
Evonik (SEA) Pte. Ltd. Singapore (Singapore) 100.00
Evonik Specialty Chemicals (Nanjing) Co., Ltd. Nanjing (China) 100.00
Evonik Specialty Chemicals (Shanghai) Co., Ltd. Shanghai (China) 100.00
1 The complete list of shareholdings is published with the consolidated annual financial statements in the Federal Gazette and can be viewed on Evonik’s website (www.evonik.com/list-of-shareholdings).
106 FINANCIAL REPORT 2017 EVONIK INDUSTRIES

4.2 Acquisitions and divestments
When accounting for acquisitions, all identifiable assets, liabilities, and contingent liabilities are measured at fair value as of the acquisition date. The principal estimation uncertainties relate to the determination of their fair values. Land and buildings are normally measured on the basis of independent valuations, while plant and machinery are recognized at their estimated replacement cost. The identification and measurement of intangible assets depends on the type of intangible asset and the complexity of determining the fair value using appropriate valuation techniques, which are normally based on a projection of the expected future cash flows. These valuations are closely linked to management assumptions regarding future changes in the value of the respective assets and the discount rate applied.
Acquisition of the specialty additives business of Air Products and Chemicals, Inc.On January 3, 2017, Evonik acquired the specialty additives business (Performance Materials Division) of Air Products and Chemicals, Inc. (Air Products), Allentown (Pennsylvania, USA). The acquisition comprised asset deals, and the acquisition of all shares in six companies and 50 percent of the shares in one further company (share deals). The specialty additives busi-ness, which has around 1,100 employees at eleven production and development locations, has been integrated into the Nutrition & Care and Resource Efficiency segments.
The business acquired and Evonik’s existing specialty additives business are a good fit, both regionally and in terms of their product ranges. In the core markets for coating and adhesive additives, high-quality additives for polyurethane foam, and specialty surfactants for industrial cleaners, they target the same customers, but with different and complemen-tary products. The regional focus of the business acquired from Air Products is North America and Asia, while Evonik is mainly active on the European market. The acquisition mainly strengthens Evonik’s position on the North American market, improving its ability to serve the increasingly global operations of its customers in the future.
Purchase price allocation for the specialty additives business as of the acquisition date T46
in € millionFair value
recognized
Intangible assets 907
Property, plant and equipment 332
Investments recognized at equity 5
Non-current assets 1,244
Inventories 349
Trade accounts receivable 157
Other receivables 4
Cash and cash equivalents 11
Current assets 521
Total assets 1,765
Provisions for pensions and other post-employment benefits 13
Deferred taxes 36
Non-current liabilities 49
Other provisions 3
Other income tax liabilities 5
Trade accounts payable 55
Other payables 3
Current liabilities 66
Total liabilities 115
Net assets 1,650
Goodwill 1,862
Purchase price pursuant to IFRS 3 3,512
The intangible assets include acquired customer relationships, technologies, and brands. For customer relationships, a useful life of between 6 and 20 years was assumed and churn rates were applied. For technologies and brands, average expected license periods of between 5 and 15 years and royalty rates of between 0.5 and 7 percent were assumed. Discounting is performed using the weighted average cost of capital of comparable intangible assets, taking into account country- specific risk adjustments.
107
NotesChanges in the Group
CORPORATE GOVERNANCEMANAGEMENT REPORT SUPPLEMENTARY INFORMATION CONSOLIDATED FINANCIAL STATEMENTS

In the period between the provisional first-time recognition and finalization of the amounts for the opening balance sheet (valuation period), intangible assets increased by €198 million, mainly because the valuation of customer relationships was revised. The fair value of property, plant and equipment declined by €87 million, principally as a result of new infor-mation on plant and machinery. Further, an additional €6 million was allocated to the purchase price for inventories. Provisions for pensions and other post-employment benefits increased by €2 million as a result of a revised assessment. Deferred tax liabilities decreased by €18 million.
Purchase price for the acquisition of the specialty additives business T47
in € million
Purchase price before purchase price adjustments and currency hedging effects 3,647
Purchase price adjustments – 20
Currency hedging effects transferred to the assets acquired – 115
Purchase price pursuant to IFRS 3 3,512
Cash and cash equivalents acquired – 11
Cash outflow as per cash flow statement 3,501
The purchase price, which was agreed in US dollars, was paid out of cash and cash equivalents, including the proceeds of the bond issue in September 2016.
Change in goodwill for the acquired specialty additives business T48
in € million
Goodwill as of January 3, 2017, as stated in the quarterly financial report for Q1 2017 1,999
Effect of adjustment of the purchase price allocation – 137
Goodwill as of January 3, 2017, as per the final status of the purchase price allocation 1,862
Currency translation – 224
Goodwill as of December 31, 2017 1,638
The goodwill mainly comprises the expected future benefits of assets that were not individually identifiable or for which recognition is not permitted. These include cost synergies resulting from optimization of procurement, production,
logistics, marketing, sales, and administration, and sales syn-ergies due to joint innovation, extension of the customer base and product portfolios, and improved access to new markets. In addition, positive tax effects result from the customary write- downs in connection with the asset deals. €1,582 million of the goodwill as of January 3, 2017 is expected to be deductible for tax purposes.
The breakdown of the costs relating to the acquisition of the specialty additives business included in adjustments is as follows:
Costs relating to the acquisition of the specialty additives business T49
in € million 2017 2016
Acquisition costs (other operating expense) 4 27
Cost of integration/preparing integration (other operating expense) 35 11
Transaction taxes (other operating expense) 1 –
Financing costs (interest expense) – 5
Currency hedging and financing costs (other financial income/expense) – 24
40 67
Bank charges of €4 million were accrued in fiscal 2016 in connection with the issuance of bonds. These are included in interest expense on a pro rata basis by applying the effective interest method over the tenor of each of the bonds.
Sales from the specialty additives business since the acquisition date totaled € 930 million. The determination of the income from the acquired business also took into account additional expenses of € 91 million resulting from the fact that the invento-ries acquired by Evonik and used in the reporting period were subject to a fair value step-up in the course of the purchase price allocation. Further, income includes depreciation and amortization of assets newly recognized or revalued in the purchase price allocation. Overall, income after taxes was € 38 million.
Evonik and Air Products concluded further agreements alongside the acquisition of the specialty additives business. These included a service agreement that had expired at year-end 2017 covering services such as IT, finance, accounting, and taxes, which were provided by Air Products and billed monthly. Supply and leasing agreements and a rental agreement were also concluded.
108 FINANCIAL REPORT 2017 EVONIK INDUSTRIES

Acquisition of Dr. Straetmans GmbHOn May 10, 2017, Evonik acquired all shares in Dr. Straetmans GmbH, Hamburg (Germany). This company specializes in developing and marketing alternative preservatives for the cosmetics industry. This acquisition complements Evonik’s portfolio of specialties for the cosmetics business. The com-pany has been renamed Evonik Dr. Straetmans GmbH (Evonik Dr. Straetmans) and integrated into the Nutrition & Care segment.
Purchase price allocation for Evonik Dr. Straetmans as of the acquisition date T50
in € millionFair value
recognized
Intangible assets 41
Property, plant and equipment 8
Non-current assets 49
Inventories 11
Trade accounts receivable 4
Other receivables 1
Cash and cash equivalents 4
Current assets 20
Total assets 69
Deferred taxes 14
Financial liabilities 4
Non-current liabilities 18
Other income tax liabilities 1
Trade accounts payable 2
Current liabilities 3
Total liabilities 21
Net assets 48
Goodwill 32
Purchase price pursuant to IFRS 3 80
In the reporting period, intangible assets increased by €9 mil-lion, mainly because the valuation of customer relationships was revised. Further, an additional €4 million of the purchase price was allocated to inventories. Deferred tax liabilities therefore increased by €4 million and provisional goodwill was reduced by €9 million.
The purchase price was settled out of cash and cash equivalents. The goodwill is not tax deductible and mainly comprises the expected future benefits of assets that were not individually identifiable or for which recognition is not permitted. These include expected synergies from backward integration of production and use of Evonik’s global distribution network, as well as the workforce of Evonik Dr. Straetmans.
Transaction costs of €1 million relating to this acquisition have been recognized. In addition, the contract contains agreements that are classified as separate transactions and are not included in the purchase price in accordance with IFRS 3 Business Combinations. A maximum of € 4 million is tied to the retention of key personnel in the company and will be paid at the latest after three years. Personnel-related provisions have been recognized for this. A further amount of at most €4 million is tied to the attainment of specific objectives by key personnel and will be paid at the latest after three years. The level of personnel-related provisions required on the basis of the attainment of these objectives will be reviewed as of each reporting date. Additional expenses of €4 million resulted from the use of inventories acquired by Evonik, which were subject to a fair value step-up in the course of the purchase price allocation. The earnings effects of these items are con-tained in the income statement in other operating expense and are included in the adjustments.
The contributions made by Evonik Dr. Straetmans to sales and earnings were not material relative to the Nutrition & Care segment as a whole, either since the date of acquisition or on a pro forma basis in the period since January 1, 2017.
Acquisition of the silica business of J. M. Huber CorporationEvonik acquired the silica business of J. M. Huber Corporation (Huber), Atlanta (Georgia, USA) as of September 1, 2017. The acquisition comprised asset deals and the acquisition of all shares in four companies (share deals). The silica business, which has around 700 employees at six sites, has been inte-grated into the Resource Efficiency segment.
The acquisition complements the existing portfolio of silica products. So far, Evonik has mainly focused on industrial applications, for example, for the tire and coatings industries. The acquired silica business has a stronger alignment to the consumer goods sector, especially the dental market. It is also a good geographical fit with Evonik as it concentrates on the US, Chinese, and Indian markets.
109
NotesChanges in the Group
CORPORATE GOVERNANCEMANAGEMENT REPORT SUPPLEMENTARY INFORMATION CONSOLIDATED FINANCIAL STATEMENTS

Purchase price allocation for the silica business as of the acquisition date T51
in € millionFair value
recognized
Intangible assets 200
Property, plant and equipment 139
Non-current assets 339
Inventories 24
Trade accounts receivable 37
Other receivables 4
Cash and cash equivalents 7
Current assets 72
Total assets 411
Provisions for pensions and other post-employment benefits 1
Other provisions 5
Deferred taxes 16
Non-current liabilities 22
Trade accounts payable 20
Other payables 2
Current liabilities 22
Total liabilities 44
Net assets 367
Goodwill 183
Purchase price pursuant to IFRS 3 550
The intangible assets include acquired customer relationships, technologies, and brands. A useful life of between 8 and 20 years was assumed for the customer relationships and churn rates were applied. For the acquired technologies, an average useful life of 15 years and an average royalty rate of 4 percent were applied. For brands, average expected license periods of between 5 and 15 years and royalty rates of between 0.5 and 0.75 percent were assumed. Discounting is performed using the weighted average cost of capital of comparable intangible assets, taking into account country-specific risk adjustments.
In the reporting period, the fair value of the intangible assets decreased by €7 million because the valuation of customer relationships was revised. The fair value of property, plant and equipment rose by €7 million, principally as a result
of new information on land, land rights and buildings. Further, an additional €2 million of the purchase price was allocated to inventories. Deferred tax liabilities declined by €11 million.
Purchase price for the acquisition of the silica business T52
in € million
Purchase price before purchase price adjustments and currency hedging effects 529
Purchase price adjustments 17
Currency hedging effects transferred to the assets acquired 4
Purchase price pursuant to IFRS 3 550
Cash and cash equivalents acquired – 7
Transferred currency hedging effects that impacted cash flows in fiscal 2016 – 4
Cash outflow as per cash flow statement 539
The purchase price, which was agreed in US dollars, was paid out of cash and cash equivalents, including the proceeds of a hybrid bond issued in July 2017.
Change in goodwill for the acquired silica business T53
in € million
Goodwill as of September 1, 2017, as stated in the financial report for the first nine months of 2017 193
Effect of adjustment of the purchase price allocation – 10
Goodwill as of September 1, 2017, as per the final status of the purchase price allocation 183
Currency translation – 1
Goodwill as of December 31, 2017 182
The goodwill mainly comprises the expected future benefits of assets that were not individually identifiable or for which recognition is not permitted. It includes both cost synergies resulting from optimization of procurement, production, logistics, marketing, sales, and administration, and sales syner-gies from the use of a common customer basis and the broader portfolio of products and applications. In addition, positive tax effects result from the customary write-downs in connection with the asset deals. € 136 million of the goodwill as of September 1, 2017 is expected to be deductible for tax purposes.
110 FINANCIAL REPORT 2017 EVONIK INDUSTRIES

The breakdown of the costs relating to the acquisition of the silica business included in adjustments is as follows:
Costs relating to the acquisition of the silica business T54
in € million 2017 2016
Acquisition costs (other operating expense) 2 8
Cost of integration/preparing integration (other operating expense) 8 –
Transaction taxes (other operating expense) 3 –
Currency hedging costs (other financial income/expense) 9 1
22 9
An issuance discount and bank charges totaling €5 million were accrued in fiscal 2017 in connection with the issuance of the hybrid bond. These are included in interest expense on a pro rata basis by applying the effective interest method over an expected period of five years.
Sales from the silica business since the acquisition date totaled €84 million. The determination of the income from the acquired business also took into account additional
expenses of €7 million resulting from the fact that the inven-tories acquired by Evonik and used in the reporting period were subject to a fair value step-up in the course of the pur-chase price allocation. Further, income includes depreciation and amortization of assets newly recognized or revalued in the purchase price allocation. Overall, income after taxes was €3 million.
Evonik and Huber concluded further agreements alongside the acquisition of the silica business. These include a service agreement for a defined period. During this time Huber will provide services such as IT, finance, accounting, taxes, HR, sales, and procurement, which will be billed monthly.
Dissolution of the StoHaas joint operationAs of December 31, 2017, Evonik and The Dow Chemical Company (Dow), Midland (Michigan, USA) dissolved their joint operation, StoHaas. Its purpose had been the joint pro-duction of acrylic acid at the sites in Marl (Germany) and Deer Park (Texas, USA) for use by Evonik and its partner Dow. By dissolving the joint operation and adjusting the acrylic acid supply agreements, Evonik aims to optimize its cost position in the supply of acrylic acid.
Dissolution of the StoHaas joint operation T55
Name of company Registered officeShareholding in %
before the transaction
Shareholding in % after the transaction as of Dec. 31, 2017
StoHaas Marl GmbH Marl (Germany) 50.00 100,00
StoHaas Monomer GmbH & Co. KG Marl (Germany) 50.00 –
ROH Delaware LLC Deer Park (Texas, USA) 50.00 –
ROH Delaware LP Deer Park (Texas, USA) 50.00 –
Through this transaction, Evonik received a further 50 percent of the shares in StoHaas Marl GmbH (StoHaas Marl), Marl (Germany) and Dow received a further 50 percent of the shares in the two US companies ROH Delaware LLC, Deer Park (Texas, USA) and ROH Delaware LP, Deer Park (Texas, USA). In addition, Evonik paid €39 million to Dow as compensation for a jointly financed capacity expansion in Marl (Germany) in the past. The legal status of the former management com-pany, StoHaas Monomer GmbH & Co. KG, Marl (Germany), was first reorganized by the exit of the general partner, StoHaas Management GmbH (StoHaas Management), Marl (Germany), and then wound up as of December 31, 2017. The general partner, StoHaas Management, in which Evonik holds a stake of 50 percent and which is included in the con-solidated financial statements at amortized cost, will be liqui-dated in accordance with the statutory provisions.
The acquisition of the additional shares in StoHaas Marl consti-tutes a business combination in stages as defined in IFRS 3 Business Combinations. Accordingly, the shares previously held in StoHaas Marl were revalued at fair value (€ 81 million) and are included in the purchase price. This resulted in a gain of € 63 million. The shares in the US companies were revalued at fair value (€ 41 million) prior to disposal. This resulted in a gain of €38 million. The revaluations were undertaken using a discounted cash flow method based on multi-year business planning assumptions. Together with the pro rata disposal of the goodwill, which reduced earnings, this resulted in income of €75 million, which is recognized in the income statement in other operating income and is contained in adjustments.
111
NotesChanges in the Group
CORPORATE GOVERNANCEMANAGEMENT REPORT SUPPLEMENTARY INFORMATION CONSOLIDATED FINANCIAL STATEMENTS

Provisional purchase price for StoHaas Marl T56
in € million
Fair value of the previously held 50 percent of the shares in StoHaas Marl 81
Fair value of the 50 percent of the shares in ROH Delaware LLC and ROH Delaware LP disposed of 41
Compensation payment for expansion of capacity 39
Purchase price before purchase price adjustments 161
Provisional purchase price adjustments 3
Provisional purchase price pursuant to IFRS 3 164
Shares disposed of and shares previously held (non-cash components of the purchase price) – 122
Financial liabilities from provisional purchase price adjustments not yet paid – 3
Additional cash and cash equivalents acquired – 34
Cash outflow as per cash flow statement 5
The fictitious disposal of the previously held, revalued shares in StoHaas Marl in connection with the business combination in stages and the disposal of the revalued shares in the US companies, together with the goodwill allocated to these shares, impacted the balance sheet as follows:
Disposals due to the dissolution of the StoHaas joint operation T57
in € million
Non-current assets 141
thereof revaluation of shares previously held 101
Current assets 63
thereof cash and cash equivalents 34
Total assets 204
Current liabilities 57
Total liabilities 57
Net assets 147
A provisional purchase price allocation was performed for the 100 percent stake in StoHaas Marl held after the transaction. The investment is allocated to the Nutrition & Care segment.
Provisional purchase price allocation for StoHaas Marl as of the acquisition date T58
in € millionFair value
recognized
Property, plant and equipment 135
Non-current assets 135
Inventories 1
Trade accounts receivable 19
Cash and cash equivalents 68
Current assets 88
Total assets 223
Deferred taxes 35
Non-current liabilities 35
Financial liabilities 20
Trade accounts payable 60
Current liabilities 80
Total liabilities 115
Provisional net assets 108
Provisional goodwill 56
Provisional purchase price pursuant to IFRS 3 164
The purchase price allocation for StoHaas Marl has not yet been finalized. Consequently, there may be changes to the allocation of the purchase price among the assets and liabilities acquired. This mainly relates to finalization of the revaluation of property, plant and equipment, and to deferred taxes. Further, changes in the purchase price could result from finalization of the agreed purchase price adjustments, which relate to net working capital, cash and cash equivalents, and financial assets and liabilities as of the acquisition date.
The goodwill is not tax deductible and mainly comprises the expected future benefits of assets that were not individually identifiable or for which recognition is not permitted. These include, in particular, intragroup customer relationships.
In parallel with the dissolution of the joint operation, Evonik and Dow concluded operating, product supply, and product exchange agreements.
If the acquisitions outlined above, including the addition of further shares in StoHaas Marl, had been made on January 1, 2017, the sales presented in the income statement for the Evonik Group would have been € 14,595 million (instead of € 14,419 million) and income after taxes would have been € 752 million (instead of € 734 million). This is based on the assumption that the purchase price allocations as of January 1, 2017 would have resulted in the same adjustments to the carrying amounts.
112 FINANCIAL REPORT 2017 EVONIK INDUSTRIES

5. Notes to the income statement
5.1 Sales
Sales revenues arise from normal business activity.Prices are contractually agreed between the parties
and are measured as the fair value of the consideration received or to be received less value-added tax and any discounts or bulk rebates granted.
Revenues from the sale of products are recognized at a point in time when the principal opportunities and risks associated with title to the products pass to the customer.
Revenues from services are recognized when the percentage of completion can be reliably measured. Where the provision of services extends over more than one reporting period, revenues are recognized over time, proportionately to the total service to be provided.
Provisions are established for general risks arising from such transactions on the basis of previous experience.
Sales were €14,419 million in 2017 (2016: €12,732 million). The Nutrition & Care, Resource Efficiency, and Performance Materials segments mainly generate sales by selling specialty chemicals to industrial customers for further processing. The Services segment principally provides services for the chemicals businesses, the management holding company, and external customers at Evonik's sites; for further details see Note 8.1.
5.2 Function costs
Function costs are derived from cost accounting data. IFRS accounting policies are the central recognition prin-ciples used at Evonik. Therefore, implicit costs may not be allocated to the functional areas. Function costs are determined after internal cross-charging to ensure that they take account of transactions between the functional areas.
Evonik distinguishes between the following func-tional areas: cost of sales, selling expenses, research and development expenses, and general administrative expenses.
Operating expenses that cannot be allocated to the functional areas are recognized as other operating expense.
113
NotesNotes to the income statement
CORPORATE GOVERNANCEMANAGEMENT REPORT SUPPLEMENTARY INFORMATION CONSOLIDATED FINANCIAL STATEMENTS

5.3 Other operating income
Other operating income T59
in € million 2017 2016
Income from the disposal of assets 80 17
Income from non-core operations 63 56
Income from the reversal of provisions 28 65
Income from subsidies 22 3
Income from restructuring measures 15 76
thereof income from the reversal of provisions 14 73
thereof income from the reversal of impairment losses 1 2
Net income from operational currency hedging 14 –
Income from the reversal of impairment losses 5 25
Net income from currency translation of operating monetary assets and liabilities – 5
Other income 84 74
311 321
thereof adjustments 95 137
The income from the disposal of assets includes €75 million from revaluation and disposal effects in connection with the termination of the StoHaas joint operation and €5 million (2016: €17 million) from the sale of intangible assets, property, plant and equipment.
The income from non-core operations contains income from occasional, unplanned business activities that are not intended to be permanent operations.
The income from subsidies of €22 million (2016: €3 million) principally relates to measures in connection with the change in German energy policy.
The income from restructuring measures mainly comprises income in connection with the optimization of administrative structures and income relating to the optimization of the product portfolio in the Performance Materials segment. This item also includes income that by nature would otherwise be allocated to other line items in other operating income.
The gross income and expense from operational currency hedging are netted in the same way as the gross income and expense from the currency translation of operating monetary assets and liabilities. The corresponding net amounts are recog-nized in other operating income or other operating expense as appropriate. Net income and expense for operational cur-rency hedging results principally from the use of currency
derivatives for portfolio hedging of trade accounts receivable and payable in foreign currencies. Further, this item contains the forward components of derivatives used to hedge forecast sales that are not designated as hedge accounting; see Note 9.2.5, Notes on financial risk management.
Other income includes insurance refunds, insurance premiums, and commission.
In all, other operating income contains a total of €6 million (2016: €27 million) from the reversal of impairment losses. This comprises €4 million (2016: €22 million) in accordance with IAS 39 Financial Instruments: Recognition and Measurement relating to trade accounts receivable.
The income from the reversal of impairment losses in accordance with IAS 36 Impairment of Assets totaling €2 million (2016: €5 million) relates to the following segments:
Income from the reversal of impairment losses by segment T60
in € million 2017 2016
Resource Efficiency 1 1
Performance Materials – 4
Other operations 1 –
2 5
Evonik refers to the special items that are factored out when calculating the operational performance indicators adjusted EBITDA and adjusted EBIT as adjustments. These adjust-ments are included in other operating income and expense in the income statement.
The adjustments recognized in other operating income relate to the following functional areas:
Adjustments included in other operating income T61
in € million 2017 2016
Production-related 1 50
Sales-related – 8
R&D-related 2 6
Administration-related 10 59
Not allocated to any functional area 82 14
95 137
114 FINANCIAL REPORT 2017 EVONIK INDUSTRIES

5.4 Other operating expense
Other operating expense T62
in € million 2017 2016
Impairment losses 121 30
Net expenses for currency translation of operating monetary assets and liabilities 63 –
Expenses for restructuring measures 40 75
thereof impairment losses 2 14
thereof losses on the disposal of assets 1 –
Expenses relating to the REACH Regulation 10 10
Losses on the disposal of assets 9 12
Expenses for recultivation and environmental protection 6 14
Net expenses for operational currency hedging – 39
Other expense 439 363
688 543
thereof adjustments 358 246
The expenses for restructuring measures mainly contain expenses for the optimization of administrative structures and expenses in connection with the optimization of the product portfolio in the Performance Materials segment. This item also includes expenses that by nature would otherwise be allocated to other line items in other operating expense.
Losses on the disposal of assets totaling €10 million (2016: €12 million) comprise €8 million (2016: €12 million) from the sale of property, plant and equipment and €2 million (2016: none) from trade accounts receivable.
The other expense of €439 million (2016: €363 million) comprises costs of €62 million in connection with the acquisi-tion of the Air Products specialty additives business, the Huber silica business, and Dr. Straetmans (2016: €46 million for the acquisition of the Air Products specialty additives business and the Huber silica business) and additional expenses of €102 million resulting from the fact that the inventories acquired by Evonik and used in the reporting period were subject to a fair value step-up in the course of the purchase
price allocation. Further, this item includes expenses for sim-plification of corporate structures in Europe and for insurance deductibles, outsourcing, non-core businesses, commission payments, other taxes, and legal and consultancy fees.
Overall, other operating expense contains impairment losses of €123 million (2016: €44 million). The impairment losses on financial instruments, which are calculated in accordance with IAS 39 Financial Instruments: Recognition and Measurement, totaled €39 million (2016: €17 million) and relate to trade accounts receivable.
Impairment losses determined in accordance with IAS 36 Impairment of Assets in response to indications of a possible impairment were divided among the segments as shown in the table below:
Impairment losses by segment T63
in € million 2017 2016
Nutrition & Care 24 –
Resource Efficiency 48 2
Performance Materials 11 24
Other operations 1 1
84 27
The impairment losses in the Nutrition & Care segment mainly related to a production facility in Eastern Europe, which was written down completely. Partial impairment losses were recognized by the Resource Efficiency segment for a production plant in Asia-Pacific North and by the Perfor-mance Materials segment for a production facility in Western Europe. All impairment losses involved a reduction in the value in use. A discount rate corresponding to the weighted average cost of capital of the segment was used to calculate the value in use, see Note 6.4.
The adjustments recognized in other operating expense relate to the following functional areas:
Adjustments included in other operating expense T64
in € million 2017 2016
Production-related 105 106
Sales-related – 6
R&D-related – –
Administration-related 122 85
Not allocated to any functional area 131 49
358 246
115
NotesNotes to the income statement
CORPORATE GOVERNANCEMANAGEMENT REPORT SUPPLEMENTARY INFORMATION CONSOLIDATED FINANCIAL STATEMENTS

5.5 Result from investments recognized at equity
Result from investments recognized at equity T65
in € million 2017 2016
Income from measurement at equity 13 8
Expenses for measurement at equity – 3 – 47
10 – 39
thereof adjustments 2 – 41
The income from measurement at equity in 2017 includes €2 million from the reversal of an impairment loss on an equity investment in the Nutrition & Care segment, which is contained in adjustments. In 2016, the expenses for measure-ment at equity included an impairment loss of €41 million on an equity investment in the Nutrition & Care segment, which is contained in adjustments.
5.6 Financial result
Financial result T66
in € million 2017 2016
Income from securities and loans 5 5
Interest and similar income from derivatives 17 10
Other interest-type income 51 65
Interest income 73 80
Interest expense on financial liabilities – 61 – 44
Interest and similar expenses for derivatives – 63 – 41
Interest expense for other provisions a – 22 – 33
Net interest expense for pensions – 77 – 90
Other interest-type expense – 19 – 21
Interest expense – 242 – 229
Result from currency translation of financing-related assets and liabilities 1 41
Income from financing-related currency hedging – 23 – 68
Miscellaneous financial income and expenses – 11 2
Other financial income/expense – 33 – 25
– 202 – 174
a This item contains expense from the unwinding of discounting and from changes in interest rates.
The interest income from loans and the interest expense on financial liabilities are recognized on a pro rata temporis basis using the effective interest method. The present negative interest on short-term deposits resulted in negative interest income of €1 million (2016: €2 million), which is included in interest expense on financial liabilities.
The other interest-type income contains €42 million (2016: €59 million) relating to tax reductions.
Interest and similar expenses for derivatives and the cor-responding income item mainly comprise accrued and realized
interest from cross-currency interest rate swaps used for cur-rency hedging of non-current intragroup loans.
The result from currency translation of financing-related assets and liabilities included in other financial income mainly results from the exchange rate risk of current intragroup financing transactions (cash pooling) denominated in foreign currencies and from cash and cash equivalents in foreign currencies as these balance-sheet items are not included in hedge account-ing. The impact of the related currency hedges is recognized in income from financing-related currency hedging. This line item also includes the ineffective portion and forward compo-nents of financial derivatives designated to hedge non-current intragroup foreign currency loans. Further, it includes changes in the time value of currency options used to hedge forecast purchase prices as the time value of these options is excluded from hedge accounting; see Note 9.2.5, Notes on financial risk management.
Expenses of €9 million (2016: €1 million) for currency hedg-ing of the acquisition of the Huber silica business are included in other financial income/expense. In connection with the acquisition of the Air Products specialty additives business, expenses of €5 million were incurred in 2016 for the provi-sion of bridge financing that was not used. These expenses are included in other interest-type expense. Further, expenses of €24 million were incurred for currency hedging and ancillary financing costs. These are included in other financial income/expense.
The miscellaneous financial income and expense includes expenses of €13 million for impairment losses calculated in accordance with IAS 39 Financial Instruments: Recognition and Measurement on loans to an investment recognized at equity.
Borrowing costs of €3 million (2016: €3 million) that could be allocated directly to the acquisition, construction, or production of a qualifying asset were capitalized. The average underlying cost of financing was 0.8 percent (2016: 2.7 percent).
116 FINANCIAL REPORT 2017 EVONIK INDUSTRIES

5.7 Income taxes
Income taxes shown in the income statement T67
in € million 2017 2016
Other income taxes 359 310
thereof relating to other periods 52 9
Deferred taxes – 66 52
thereof relating to other periods – 14 – 19
thereof relating to temporary differences – 74 48
293 362
The tax reconciliation shows the development of expected income taxes relative to the effective income taxes stated in the income statement. The expected income taxes are based on an overall tax rate of 32 percent (2016: 30 percent). The year-on-year change is principally due to an increase in trade tax rates. The overall tax rate comprises German corporation tax of 15 percent, a solidarity surcharge of 5.5 percent, and an average trade tax rate of around 16 percent. The effective income taxes include other income taxes and deferred taxes.
Tax reconciliation T68
in € million 2017 2016
Income before income taxes, continuing operations 1,027 1,124
Expected income taxes 329 337
Variances due to differences in the assessment base for trade tax 5 – 3
Deviation from the expected tax rate – 19 16
Changes in the valuation of deferred taxes – 5 4
Losses not affecting deferred taxes and the use of loss carryforwards 21 39
Changes in tax rates and tax legislation – 38 –
Non-deductible expenses 18 29
Interest ceiling – –
Tax-free income – 48 – 56
Result from investments recognized at equity – 3 –
Other 33 – 4
Effective income taxes (current income taxes and deferred taxes) 293 362
Effective income tax rate in % 28.5 32.2
The impairment losses on deferred tax assets previously recognized total €8 million. This is countered by reversals of € 13 million. While the impairment losses relate to loss carry-forwards, the reversals of impairment losses mainly relate to temporary differences. “Other” contains other income taxes and deferred taxes relating to different periods.
5.8 Earnings per share
Earnings per share T69
in € million 2017 2016
Income after taxes, continuing operations 734 762
Income after taxes, discontinued operations – 96
Less income after taxes attributable to non-controlling interests – 17 – 14
Income after taxes attributable to shareholders of Evonik Industries AG (net income) 717 844
Earnings per share in € (basic and diluted)
from continuing operations 1.58 1.63
from discontinued operations – 0.21
less earnings per share attributable to non-controlling interests – 0.04 – 0.03
Earnings per share in € (basic and diluted) attributable to shareholders of Evonik Industries AG 1.54 1.81
Earnings per share as shown in the income statement are calculated by dividing net income by the weighted average number of shares issued, i.e., 466,000,000 shares. Net income comprises the total earnings for the year less non- controlling interests, including the earnings of discontinued operations. Earnings per share could be diluted by potential ordinary shares. Since there were no potential ordinary shares in either 2017 or 2016, diluted earnings per share are identical to basic earnings per share.
117
NotesNotes to the income statement
CORPORATE GOVERNANCEMANAGEMENT REPORT SUPPLEMENTARY INFORMATION CONSOLIDATED FINANCIAL STATEMENTS

6. Notes to the balance sheet
6.1 Intangible assets
Change in intangible assets T70
in € million Goodwill
Franchises, trademarks, and licenses
Capitalized development
costsOther
intangible assets Total
Cost of acquisition/production
As of January 1, 2016 2,861 1,666 165 527 5,219
Currency translation 14 3 – 1 18
Additions from business combinations 54 37 – 2 93
Other additions – 53 – 22 75
Disposal – – 29 – – – 29
Reclassification – 14 – – 9 5
As of December 31, 2016 2,929 1,744 165 543 5,381
Currency translation – 298 – 12 – – 75 – 385
Additions from business combinations 2,133 342 – 806 3,281
Other additions – 15 – 20 35
Disposal – 25 – 40 – 1 – – 66
Reclassification – 36 – – 28 8
As of December 31, 2017 4,739 2,085 164 1,266 8,254
Amortization and impairment losses
As of January 1, 2016 97 1,330 162 462 2,051
Currency translation – 2 – – 2
Amortization – 37 – 5 42
Impairment losses – 5 – 2 7
Disposal – – 33 – – – 33
Reclassification – – – – –
As of December 31, 2016 97 1,341 162 469 2,069
Currency translation – – 8 – – 3 – 11
Amortization – 77 – 46 123
Impairment losses – 4 1 – 5
Disposal – – 38 – – – 38
Reclassification – 4 – – 3 1
As of December 31, 2017 97 1,380 163 509 2,149
Carrying amounts as of December 31, 2016 2,832 403 3 74 3,312
Carrying amounts as of December 31, 2017 4,642 705 1 757 6,105
118 FINANCIAL REPORT 2017 EVONIK INDUSTRIES

Intangible assets are capitalized at acquisition or produc-tion cost and amortized using the straight-line method if their useful life is finite. An impairment test is conducted on assets with a finite useful life if there are indications of a possible impairment and on assets with an indefinite useful life, especially goodwill, at least once a year.
The estimated useful life of franchises, trademarks, and licenses is between 5 and 25 years. Trademarks with no restriction on their use (an indefinite useful life) are tested annually for impairment and to check that their useful life is still indefinite. If the assessment alters and is reclassified as finite, the carrying amounts of such trade-marks are amortized over their estimated remaining useful life using the straight-line method.
Development costs are capitalized if they can be clearly assigned to a newly developed product or process that is technically feasible and is designated for captive use or commercialization. They are amortized over their estimated useful life of between 3 and 15 years using the straight-line method.
The other intangible assets mainly comprise acquired customer relationships. Their useful life is estimated on the basis of contractual data and experience and is generally between 5 and 20 years. Amortization also takes account of the probability of continuance of the customer relation-ship in the form of a churn rate.
Franchises, trademarks, and licenses include trademarks with an indefinite useful life totaling € 209 million (2016: € 203 million).
As in the previous year, on the reporting date there were no intangible assets to which title was restricted.
6.2 Property, plant and equipment
Property, plant and equipment are carried at acquisition or production cost and depreciated over their useful life. If there are indications of a possible impairment, an impairment test is conducted. The cost of acquisition includes expenses directly attributable to the acquisition. The cost of production comprises all direct costs, plus the systematically allocable material costs and manufacturing overheads. Costs relating to obligations to dismantle or remove non-current assets at the end of their useful life are also included in the cost of acquisition or production.
Acquisition and production costs may also include transfers from gains and losses on cash flow hedges entered into to hedge foreign currency exposures in con-nection with the purchase of plants, which were recog-nized in the statement of comprehensive income until they were reclassified to property, plant and equipment.
Borrowing costs that can be allocated directly to the acquisition, construction, or production of a qualifying asset (necessary timescale: over 1 year) are included in the cost of acquisition or production.
Government grants for the purchase or construction of property, plant and equipment reduce the cost of acqui-sition or production of such assets. They are reflected in the income statement over the useful life of the assets through lower depreciation.
Property, plant and equipment are depreciated using the straight-line method over the expected useful life of the assets. This is between 5 and 50 years for buildings, between 2 and 25 years for plant and machinery, and between 3 and 25 years for other plant, office furniture and equipment.
Gains and losses on disposal are recognized in profit or loss via other operating income or expense.
119
NotesNotes to the balance sheet
CORPORATE GOVERNANCEMANAGEMENT REPORT SUPPLEMENTARY INFORMATION CONSOLIDATED FINANCIAL STATEMENTS

Change in property, plant and equipment T71
in € millionLand, land rights
and buildingsPlant and
machinery
Other plant, office furniture and equipment
Advance payments and
construction in progress Total
Cost of acquisition/production
As of January 1, 2016 3,374 12,696 1,047 611 17,728
Currency translation 20 121 5 12 158
Additions from business combinations 3 3 – – 6
Other additions 43 189 50 603 885
Disposal – 21 – 142 – 51 – 1 – 215
Reclassification 52 318 13 – 383 –
As of December 31, 2016 3,471 13,185 1,064 842 18,562
Currency translation – 124 – 467 – 16 – 48 – 655
Additions from business combinations 117 446 14 37 614
Other additions 54 207 46 736 1,043
Disposal – 17 – 342 – 51 – 10 – 420
Reclassification 59 428 20 – 509 – 2
As of December 31, 2017 3,560 13,457 1,077 1,048 19,142
Depreciation and impairment losses
As of January 1, 2016 1,640 9,396 841 43 11,920
Currency translation 10 76 3 – 89
Depreciation 78 518 69 – 665
Impairment losses 8 20 2 7 37
Reversals of impairment losses – – 5 – – – 5
Disposal – 9 – 126 – 50 – – 185
Reclassification 4 – 3 – 1 – –
As of December 31, 2016 1,731 9,876 864 50 12,521
Currency translation – 48 – 298 – 11 – – 357
Depreciation 83 555 68 – 706
Impairment losses 18 68 1 4 91
Reversals of impairment losses – 2 – – – – 2
Disposal – 16 – 250 – 48 – 1 – 315
Reclassification – 4 – 1 – 3
As of December 31, 2017 1,766 9,955 873 53 12,647
Carrying amounts as of December 31, 2016 1,740 3,309 200 792 6,041
Carrying amounts as of December 31, 2017 1,794 3,502 204 995 6,495
120 FINANCIAL REPORT 2017 EVONIK INDUSTRIES

A lease comprises an agreement that transfers the right to use an asset for a certain period in return for one or more payments. The Evonik Group is mainly party to operating leases—as either lessor or lessee.
As a lessor, Evonik mainly leases out land under operating leases. The nominal values of expected future minimum lease payments for these assets over the non-cancelable term of the lease are due as follows:
Maturity structure of future minimum lease payments (lessor; operating leases) T72
in € million 2017 2016
Due within 1 year 7 6
Due in more than 1 and up to 5 years 19 14
Due in more than 5 years 144 143
170 163
Prior-year figures restated.
6.3 Investments recognized at equity
Associates and joint ventures are generally recognized using the equity method. They are initially measured at cost of acquisition, including all directly allocable ancillary costs. If there are indications of a possible impairment, an impairment test is conducted.
For initial measurement, the difference between the cost of acquisition and the investor's share in the investee’s equity is determined. Any positive difference remaining after allocation of hidden reserves or hidden liabilities is treated as goodwill and recognized in the carrying amount of the investment. Negative differences are included in income by increasing the carrying amount of the investment.
Starting from the cost of acquisition of the investment, in subsequent periods its carrying amount is increased or reduced by the investor's share in the investee’s net income. Further adjustments to the carrying amount of the investment are necessary if the equity of the investment alters as a result of items contained in other comprehensive income. Subsequent measurement must take into account depreciation of the hidden reserves identified at the time of initial recognition, which must be deducted from the investor’s share in the investee's net income. To avoid dual recognition, any dividends received must be deducted from the carrying amount.
Investments recognized at equity T73
in € millionDec. 31,
2017Dec. 31,
2016
Carrying amount of individually non-material associates 8 8
Carrying amount of individually non-material joint ventures 39 35
47 43
The condensed financial data for the investments recognized at equity which are classified individually as non-material for Evonik, based on Evonik's interest, are as follows:
Condensed financial data for individually non-material investments recognized at equity T74
in € million
Associates Joint ventures
2017 2016 2017 2016
Income after taxes, continuing operations 7 4 3 – 43
Other comprehensive income after taxes – – – – 1
Total comprehensive income 7 4 3 – 44
For information on contingent liabilities to associates and joint ventures, see Note 9.3.
121
NotesNotes to the balance sheet
CORPORATE GOVERNANCEMANAGEMENT REPORT SUPPLEMENTARY INFORMATION CONSOLIDATED FINANCIAL STATEMENTS

6.4 Impairment test pursuant to IAS 36
If there are indications of possible impairment, an impairment test is conducted on intangible assets, prop-erty plant and equipment, and investments recognized at equity in accordance with IAS 36 Impairment of Assets.
Goodwill and other intangible assets with an indefinite useful life are tested for impairment at least once a year. The impairment test is generally conducted for a cash-generating unit (CGU) or a group of CGUs.
For the impairment test, the recoverable amount of the CGU/group of CGUs is compared with its carrying amount. The recoverable amount is determined as the higher of the fair value less costs of disposal and the value in use of the CGU/group of CGUs. An impairment loss is recognized if the recoverable amount is below the carrying amount. The impairment loss is reversed—except in the case of goodwill—if the reason for the original impairment charge no longer applies.
When testing goodwill for impairment, the recoverable amount of goodwill is determined from the fair value less costs of disposal of the relevant segment. The fair value less costs of disposal is determined as the present value of future cash flows using a valuation model and
thus on the basis of non-observable inputs (Level 3 of the fair value hierarchy set out in IFRS 13 Fair Value Measurement). Future cash flows are derived from the current three-year mid-term plan, which is based on a mixture of experience and expectations of future market trends. The main economic data, such as growth in gross domestic product, the development of exchange rates, raw material and energy prices, and the increase in wages and salaries used for planning purposes are derived from internal and external market expectations and are set centrally by Evonik. The specific growth rates for individual segments are derived from experience and future expectations; a terminal growth rate is also assumed. The expected future cash flows are discounted using the segment-specific weighted average cost of capital (WACC) after taxes. The weighted average cost of capital is determined for each segment on the basis of a capital asset pricing model and is the weighted average cost of debt and equity.
For impairment testing of other intangible assets, property, plant and equipment, the recoverable amount is normally determined by calculating the value in use of the CGU/group of CGUs.
Parameters used in impairment testing and allocation of goodwill by segment T75
WACC after taxes (in %)
Terminal growth rate (in %)
Goodwill (in € million)
2017 2016 2017 2016 Dec. 31, 2017 Dec. 31, 2016
Nutrition & Care 6.94 6.12 1.50 1.50 1,981 1,082
Resource Efficiency 7.27 7.17 1.50 1.50 2,118 1,192
Performance Materials 7.81 8.09 1.50 1.50 482 495
Services 7.32 7.15 1.50 1.50 61 63
The carrying amounts of goodwill are normally recognized directly in the segments. The goodwill relating to former acquisitions of shares in Evonik Degussa GmbH (Evonik Degussa), Essen (Germany) forms an exception to this rule. In the segment reporting, it is assigned to “Corporate, consolida-tion”. For impairment testing, this goodwill is also allocated among the three chemicals segments.
As in the previous year, the impairment test on goodwill did not result in any impairment losses. The outcome of the impairment test on the other assets is outlined in Notes 5.3 to 5.5.
The impairment test on goodwill is based on assumptions and estimates that could change, leading to impairment losses in future periods.
In none of the segments would a relative increase in the weighted average cost of capital after taxes of 10 percent or a reduction of 10 percent in the net cash flow or terminal growth rate result in an impairment loss.
122 FINANCIAL REPORT 2017 EVONIK INDUSTRIES

6.5 Financial assets
Financial assets T76
in € million
Dec. 31, 2017 Dec. 31, 2016
Totalthereof
non-current Totalthereof
non-current
Other investments 126 126 110 110
Loans 59 43 72 69
Securities and similar claims 9 1 12 1
Receivables from derivatives 247 152 299 30
Other financial assets 45 5 37 3
486 327 530 213
(a) Other investmentsOther investments include shares in Borussia Dortmund GmbH & Co. KGaA, Dortmund (Germany) totaling €83 million (2016: €72 million), which are recognized at their stock market value as of the reporting date. This investment is therefore exposed to a market price risk.
Further, other investments contains unlisted equity instru-ments, see Note 9.2.1.
(b) LoansLoans are recognized at amortized cost. They are exposed to an interest rate risk, which can affect their fair value or future cash flows.
Risk and maturity structure of loans T77
in € millionDec. 31,
2017Dec. 31,
2016
Impaired loans – 3
Nominal value 13 3
Impairment losses – 13 –
Non-impaired loans 59 69
Not yet due 59 69
Overdue – –
59 72
Evonik did not renegotiate the terms and conditions of any non-current loans in 2017 or the previous year.
(c) Securities and similar claimsSecurities and similar claims mainly comprise bonds and money market paper purchased to invest liquid funds. They are exposed to an interest rate risk, which can affect their fair value or future cash flows. All securities are measured at market price. Securities listed on a stock exchange are exposed to a risk of changes in their market price.
(d) Receivables from derivatives
Receivables from derivatives T78
in € millionDec. 31,
2017Dec. 31,
2016
Receivables from cross-currency interest rate swaps 150 17
Receivables from forward exchange contracts, currency options, and currency swaps 95 280
Receivables from commodity derivatives 2 2
247 299
(e) Other financial assetsOther financial assets comprise time deposits at banks, receiv-ables from profit-and-loss transfer agreements with invest-ments that are not fully consolidated, and claims relating to the termination of contracts. Reversals of impairment losses amounted to €14 million (2016: €5 million).
Risk and maturity structure of other financial assets T79
in € millionDec. 31,
2017Dec. 31,
2016
Impaired other financial assets – 3
Nominal value – 10
Impairment losses – – 7
Non-impaired other financial assets 45 34
Not yet due 45 33
Overdue – 1
45 37
123
NotesNotes to the balance sheet
CORPORATE GOVERNANCEMANAGEMENT REPORT SUPPLEMENTARY INFORMATION CONSOLIDATED FINANCIAL STATEMENTS

6.6 Inventories
Inventories are measured at the lower of cost and net realizable value. Normally the cost of inventories is determined uniformly using the average cost method, the first-in first-out method, or the standard cost method. The cost of production of finished goods and work in progress comprises the cost of raw materials and supplies, directly attributable personnel expenses, other direct costs, and general overheads that can be system-atically assigned to production.
Impairment losses on raw materials, supplies, and merchan-dise totaling €31 million were recognized in 2017 (2016: €48 million), while reversals of impairment losses amounted to
€21 million (2016: €14 million). Reversals of impairment losses were mainly due to higher selling prices and improved market conditions.
Inventories T80
in € millionDec. 31,
2017Dec. 31,
2016
Raw materials and supplies 471 423
Work in progress 82 68
Finished goods and merchandise 1,472 1,188
2,025 1,679
6.7 Trade accounts receivable, other receivables
Trade accounts receivable, other receivables T81
in € million
Dec. 31, 2017 Dec. 31, 2016
Totalthereof
non-current Totalthereof
non-current
Trade accounts receivable 1,776 – 1,661 –
Net defined benefit assets from overfunded pension plansa 232 232 – –
Advance payments made 33 – 37 –
Deferred expenses 45 9 42 10
Miscellaneous other receivables 299 55 279 48
2,385 296 2,019 58
a See Note 6.9.
Miscellaneous other receivables mainly comprise receiv-ables from other taxes, receivables from governments, and receivables from insurance policies.
At year end, trade accounts receivable totaling €291 million (2016: €354 million) were covered by credit insurance. In contrast to 2016, there was no other usable collateral (2016: €7 million). As in the previous year, no terms were renegoti-ated for trade accounts receivable not yet due.
Risk and maturity structure of trade accounts receivable T82
in € millionDec. 31,
2017Dec. 31,
2016
Impaired receivables 17 18
Nominal value 67 35
Impairment losses – 50 – 17
Non-impaired receivables 1,759 1,643
Not yet due 1,457 1,408
Overdue 302 235
up to 3 months 242 181
more than 3 and up to 6 months 13 19
more than 6 and up to 9 months 6 5
more than 9 and up to 12 months 13 9
more than 1 year 28 21
1,776 1,661
124 FINANCIAL REPORT 2017 EVONIK INDUSTRIES

6.8 Equity
(a) Issued capitalAs in the previous year, the company's fully paid-up capital was €466,000,000 on the reporting date. It is divided into 466,000,000 no-par registered shares. The arithmetic value of each share is €1.
(b) Authorized capitalA resolution on authorized capital was adopted at the Annual Shareholders’ Meeting on May 20, 2014. This authorizes the Executive Board until May 1, 2019 to increase the company’s capital stock, subject to the approval of the Supervisory Board, by up to €116,500,000 by issuing new registered no-par shares (Authorized Capital 2014).
This authorization may be exercised through one or more issuances.
The new shares may be issued against cash and/or contri-butions in kind. The Executive Board is authorized, subject to the approval of the Supervisory Board, to exclude shareholders’ statutory subscription rights when issuing new shares in the following cases:• capital increases against contributions in kind • if the capital increase is against cash and the proportionate
share of the capital stock attributable to the new shares does not exceed 10 percent of the capital stock, and the issue price of the new shares is not significantly below the stock market price of shares already listed on the stock exchange
• to exclude fractional amounts arising from the subscription ratio
• insofar as is necessary to grant holders and/or creditors of warrants or conversion rights or obligors of warrant and/or conversion obligations subscription rights to new shares to the extent that they would be entitled to them after exercise of their warrants and/or conversion rights or ful-fillment of their warrant or conversion obligations
• to grant shares to employees (employee stock), provided that the new shares for which subscription rights are excluded do not in aggregate account for a proportionate share of the capital stock in excess of 1 percent
• for the execution of a scrip dividend.
The proportionate amount of the capital stock attributable to the shares for which subscription rights are excluded, together with the proportionate amount of the capital stock
attributable to treasury stock or to conversion and/or warrant rights or obligations arising from debt instruments, which are sold or issued after May 20, 2014 under exclusion of subscrip-tion rights, may not exceed 20 percent of the capital stock. If the sale or issue takes place in application—analogously or mutatis mutandis—of Section 186 Paragraph 3 Sentence 4 of the German Stock Corporation Act (AktG), this shall also be deemed to constitute exclusion of subscription rights.
The Executive Board is authorized, subject to the approval of the Supervisory Board, to define further details of capital increases out of the Authorized Capital 2014.
The authorized capital has not yet been utilized.
(c) Conditional capitalUnder a further resolution adopted by the Annual Share-holders’ Meeting of May 20, 2014, the capital stock is condi-tionally increased by up to €37,280,000, divided into up to 37,280,000 registered shares with no par value (Conditional Capital 2014). This conditional capital increase relates to a resolution of the above Shareholders’ Meeting granting authorization to issue convertible and/or warrant bonds.
The conditional capital increase will only be conducted insofar as holders or creditors of warrant or conversion rights or obligors of warrant or conversion obligations arising from warrant bonds and/or convertible bonds issued or guaranteed on the basis of the authorization resolved at the Annual Shareholders’ Meeting of May 20, 2014 exercise their warrants or conversion rights or, insofar as they have an obligation to exercise the warrants or conversion obligations, meet the obligation to exercise the warrant or conversion obligations, and other forms of settlement are not used. In principle, the shareholders have a statutory right to subscription rights to the convertible and/or warrant bonds; the authorization sets out specific cases where the Executive Board may exclude subscription rights to convertible and/or warrant bonds, subject to the approval of the Supervisory Board. The new shares shall be issued at the warrant or conversion price set in accordance with the above provisions of the resolution.
The new shares are entitled to a dividend from the start of the fiscal year in which they are issued.
The Executive Board is authorized, subject to the approval of the Supervisory Board, to define further details of capital increases out of the conditional capital.
The conditional capital has not yet been utilized.
125
NotesNotes to the balance sheet
CORPORATE GOVERNANCEMANAGEMENT REPORT SUPPLEMENTARY INFORMATION CONSOLIDATED FINANCIAL STATEMENTS

(d) Treasury sharesOn March 3, 2017, Evonik Industries AG announced that it would be utilizing the authorization granted by the Annual Shareholders’ Meeting on May 18, 2016 to purchase shares in the company totaling up to €130.8 million by April 7, 2017 at the latest. The purpose of purchasing the shares was to grant shares under an employee share program to employees of Evonik Industries AG and certain subordinated companies in the Evonik Group as well as to members of the management of subordinated affiliated companies of Evonik Industries AG.
Through this share buyback program, by April 5, 2017 Evonik Industries AG purchased a total of 621,241 shares in the com-pany (corresponding to 0.1 percent or €621,241 of the capital stock). A total of €18.7 million was spent on the shares, corresponding to an average price of €30.02 per share. The purchases were made from March 7, 2017 at an average daily volume of around 28,200 shares on each Xetra trading day through a bank acting on the instructions of Evonik Industries AG. The maximum purchase price of each share repurchased (excluding ancillary costs) could not exceed or fall short of the opening price as set in the opening auction for the trading day for shares in Evonik Industries AG in Xetra trading on the Frankfurt Stock Exchange by more than 5 percent. At the start of April, 564,408 ordinary shares (including 140,711 bonus shares) were transferred to participating employees on the basis of the share price and the exchange rate for the US dollar, Singapore dollar, and Chinese renminbi yuan prevailing on April 6, 2017. The remaining 56,833 ordinary shares were sold to third parties via the stock exchange by April 13, 2017. As of December 31, 2017, Evonik Industries AG therefore no longer held any treasury shares.
(e) Capital reserveThe capital reserve mainly contains other payments received from shareholders pursuant to Section 272 Paragraph 2 No. 4 of the German Commercial Code (HGB).
(f) Accumulated incomeThe accumulated income of €6,020 million (2016: €5,716 mil-lion) comprises Group earnings from 2017 and previous years, as well as other comprehensive income from the remeasure-ment of the net benefit liability for defined benefit pension plans. Income after taxes corresponds to the net income attributable to shareholders of Evonik Industries AG, as stated in the income statement for fiscal 2017. However, under German
stock corporation law, only revenue reserves from the separate financial statements drawn up by Evonik Industries AG that are not subject to any restrictions are available for distribution. As of December 31, 2017, the revenue reserves of Evonik Industries AG totaled €4,611 million (2016: €4,606 million). As in the previous year, €47 million of this comprised the statutory reserve that is not available for distribution.
A proposal will be submitted to the Annual Shareholders’ Meeting that the net profit of Evonik Industries AG of €770,000,000.00 for 2017 should be used to pay a dividend of €535,900,000.00. That corresponds to a dividend of €1.15 per no-par share.
(g) Accumulated other comprehensive incomeAccumulated other comprehensive income contains gains and losses that are not included in the income statement. The reserve for gains and losses on available-for-sale securities contains remeasurement amounts resulting from changes in the value of financial instruments that are expected to be temporary and thus not charged to income. The reserve for gains and losses on hedging instruments comprises changes in the fair value of the effective portion of hedging instru-ments that are accounted for as cash flow hedges or net investment hedges. The reserve for revaluation surplus for acquisitions made in stages contains the change in the fair value of shares previously held in subsidiaries that were con-solidated for the first time on or before December 31, 2009. The reserve for currency translation adjustment comprises differences arising from the translation of foreign financial statements.
126 FINANCIAL REPORT 2017 EVONIK INDUSTRIES

Change in accumulated other comprehensive income attributable to shareholders of Evonik Industries AG T83
in € million
Gains/losses on available-for-sale
securities
Gains/losses on hedging instruments
Revaluation surplus for
acquisitions in stages
Currency translation adjustment Total
As of January 1, 2016 6 – 59 12 81 40
Other comprehensive income as in the statement of comprehensive income 15 120 – 137 272
Recognized gains and losses 19 93 – – 112
Amounts reclassified to the income statement – 56 – – 56
Amounts reclassified to assets and liabilities – – – – –
Currency translation adjustment – – – 136 136
Attributable to the equity method (after income taxes) – – – 1 1
Deferred taxes – 4 – 29 – – – 33
Other changes – – – 2 – – 2
As of December 31, 2016 21 61 10 218 310
Other comprehensive income as in the statement of comprehensive income 17 11 – – 549 – 521
Recognized gains and losses 11 175 – – 186
Amounts reclassified to the income statement – – 55 – – – 55
Amounts reclassified to assets and liabilities – – 86 – – – 86
Currency translation adjustment – – – – 549 – 549
Attributable to the equity method (after income taxes) – – – – –
Deferred taxes 6 – 23 – – – 17
Other changes – – – 3 – – 3
As of December 31, 2017 38 72 7 – 331 – 214
In 2017, an overall hedging result of €55 million (2016: – € 56 million) was reclassified from the reserve for gains/losses on hedging instruments to the income statement as follows:
Reclassification of hedging results from accumulated other comprehensive income to the income statement T84
in € million 2017 2016
Sales 13 – 29
Cost of sales – – 8
Net interest expense – 3 – 3
Other financial income /expense 45 – 16
55 – 56
127
NotesNotes to the balance sheet
CORPORATE GOVERNANCEMANAGEMENT REPORT SUPPLEMENTARY INFORMATION CONSOLIDATED FINANCIAL STATEMENTS

(h) Non-controlling interestsNon-controlling interests amounting to €88 million (2016: €92 million) comprise shares in the issued capital and reserves of consolidated subsidiaries that are not attributable to the shareholders of Evonik Industries AG.
Changes in shareholdings in subsidiaries without loss of control were negligible in 2017, as in the previous year.
Change in accumulated other comprehensive income attributable to non-controlling interests T85
in € million
Currency translation adjustment Total
As of January 1, 2016 3 3
Other comprehensive income as in the statement of comprehensive income 1 1
Currency translation adjustment 1 1
As of December 31, 2016 4 4
Other comprehensive income as in the statement of comprehensive income – 5 – 5
Currency translation adjustment – 5 – 5
As of December 31, 2017 – 1 – 1
6.9 Provisions for pensions and other post-employment benefits
Provisions for pensions and other post-employment benefits are measured using the projected unit credit method for defined benefit obligations in accordance with IAS 19 Employee Benefits. This method takes account of future salary and pension increases, biometric assumptions, as well as pension obligations and accrued entitlements as of the reporting date. Pension obligations are determined using country-specific parameters and measurement principles.
Actuarial gains and losses relating to pension obliga-tions and income from plan assets (apart from interest income) are derived from the difference between the expected pension obligations and the actual obligation calculated at year end, and from deviations between the expected and actual fair value of plan assets calculated at year end.
Changes that arise during a year as a result of actuarial gains/losses relating to pension obligations, income from plan assets (excluding interest income), changes in the asset ceiling (excluding interest cost), and income from claims to refunds (excluding interest income) are offset directly in the statement of other comprehensive income.
The defined benefit obligations at year end are compared with the fair value of the plan assets (funded status). The pension provisions are derived from this, taking into account the asset ceiling and the net defined benefit assets from overfunded plans recognized on the assets side.
Defined contribution plans result in an expense in the period in which the contribution is made. Defined contri-bution plans exist for both company pension plans and state pension plans (statutory pension insurance).
Provisions for pensions are established to cover benefit plans for retirement, disability, and surviving dependents’ pensions. The benefit obligations vary depending on the legal, tax, and economic circumstances in the various countries in which the companies operate. The level of the benefit obligations gen-erally depends on length of service and remuneration.
At the German companies, occupational pension plans are predominantly defined benefit plans. They are primarily funded by provisions, pension fund assets, and a contractual trust arrangement (CTA).
The pension plans at foreign companies may be either defined contribution or defined benefit plans.
128 FINANCIAL REPORT 2017 EVONIK INDUSTRIES

The present value of the defined benefit obligations and the fair value of the plan assets as of December 31, 2017 mainly relate to the following countries:
Breakdown of the present value of the defined benefit obligation and the fair value of plan assets T86
2017
in € million
Defined benefit
obligation Plan assets
Evonik total 11,563 8,087
thereof Germany 10,224 6,906
thereof pension fund/reinsured support fund 4,649 3,426
thereof funded through CTA 5,224 3,479
thereof USA 663 441
thereof UK 509 615
2016
in € million
Defined benefit
obligation Plan assets
Evonik total 11,585 7,807
thereof Germany 10,094 6,555
thereof pension fund/reinsured support fund 4,496 3,276
thereof funded through CTA 5,272 3,279
thereof USA 743 485
thereof UK 570 637
The main pension plans for employees in Germany are as follows:
Pension fund (Pensionskasse): There are a number of closed pension plans. Income-related contributions are con-verted into defined benefits and invested with the company- owned Degussa Pension Fund. The structure of the tariffs, including investment of the assets, is subject to oversight by the supervisory authority for the insurance sector. The pension fund is a multi-employer fund. It is funded on a projected benefit basis. The level of plan assets required to cover the projected benefits is derived from a technical business plan approved by the supervisory authority, and from statutory requirements. Funding must be sufficient at all times to cover benefits, which have to be upheld even if the employer’s contributions are terminated. The company contribution to Tariff DuPK is calculated to ensure that, together with the employee contributions, funding of the resulting entitlements in line with the technical business plan is assured. The company
contribution to the Marl and Troisdorf tariffs is proposed by the responsible actuary and is based on the funds required to cover the benefits. As the sponsoring company of this pension fund, Evonik Degussa GmbH has a contractual obligation to cover benefits under the Marl and Troisdorf tariffs if sufficient funding is not available. This obligation is not limited to the company where the insurees are employed. The obligation was assumed on the basis of a requirement stipulated by the supervisory authority when these tariffs were established. At that time, only company employees were insured in the plan. At present, it is not possible to estimate whether this obliga-tion could be of relevance as a supplement to the tools set out in the pension fund regulation, such as increasing com-pany contributions or cutting benefits in the event of a loss.
Support fund (Unterstützungskasse): This is the plan that is open to new employees. It also allows for deferred compensa-tion arrangements. Income-related contributions are converted into defined benefits and invested with the company-owned Degussa Pension Fund. The structure of the tariffs, including investment of the assets, is subject to oversight by the super-visory authority for the insurance sector. Pension increases of 1 percent p. a. are a firm commitment. The support fund meets the criteria for classification as a multi-employer plan. It is funded through reinsurance with the Degussa Pension Fund, which maintains sufficient funding for this in compliance with the German Insurance Supervision Act and the ordinances issued by the supervisory authority. Funding must be sufficient at all times to cover benefits, which have to be upheld even if the employer's contributions are terminated. The level of benefits is based on the contributions paid into the fund. The support fund does not have any arrangements under which the Group is liable for the obligations of companies outside the Evonik Group in the event of inadequate funding.
Direct pension commitments: These comprise various defined benefit plans where the pension benefit is generally directly or indirectly linked to the final salary. Most of these plans grant higher benefits for income components above the ceiling for contributions to the state pension insurance plan or are intended exclusively to cover such income components. All final salary plans are closed and in most cases they now only operate through the protection of the accrued benefits for insurees who are currently still working.
Direct commitments of this type are now only used for senior executives and voluntary deferred compensation arrangements. In such cases, a defined benefit is calculated on the basis of an income-related contribution or an amount credited by the employee. Insurees can choose between various forms of payment, for example, as a lump sum, an annuity, or installment payments. The benefits include a fixed pension increase of 1 percent a year.
129
NotesNotes to the balance sheet
CORPORATE GOVERNANCEMANAGEMENT REPORT SUPPLEMENTARY INFORMATION CONSOLIDATED FINANCIAL STATEMENTS

Plan assets for large Group companies, which account for the vast majority of obligations under direct commitments, are managed by Evonik Pensionstreuhand e. V. This fund is not subject to regulatory oversight or minimum funding require-ments. It uses an asset-liability matching strategy, whereby changes in obligations are offset through changes in the plan assets. In this strategy, the interest rate and credit sensitivities of the liabilities are partially replicated in the plan assets.
Description of the potential risks arising from pension plans:Most German pension plans grant lifelong pension benefits.
A specific risk here is that rising life expectancy could increase the benefit obligation. In most cases, increases in the benefits paid by these funds are linked to the consumer price index. This entails an additional inflation risk. In the case of plans where employees can choose between a lump-sum payment or an annuity, there is a risk that the option could be selected on the basis of individual assessments of health and life expectancy.
For final salary plans, the benefit risk relates to future salary trends for employees covered by collective agreements and exempt employees and, in some cases, changes in the ceiling for contributions to statutory pension insurance.
Where assets are invested externally by the pension fund, support fund, and Evonik Pensionstreuhand e. V., plans are exposed to a capital market risk. Depending on the composition of the investment portfolio, this comprises a risk of changes in value and income risks, which could mean that the assumed performance or return is not generated over the term of the investment. Under German legislation on occupational pen-sions, the employer is liable to cover firm benefit commitments and guaranteed returns.
The main pension plans for employees in the USA:In the USA, there are unfunded, fully funded, and partially
funded pension plans and post-employment benefits under healthcare plans. The majority of the obligations relate to funded plans. The defined benefit pension plans in the USA are not open to new employees. Benefits are based on a
range of parameters such as final salary, average salary during career, individual pension accounts, and fixed benefits. Most plans include a lump-sum option with a corresponding risk to the company that this will be utilized. Minimum funding levels have to be observed. To avoid volatility, this is supported by an asset-liability matching strategy. This is implemented primarily through US government bonds and corporate bonds denomi-nated in US dollars. The assets are managed by a pension trust.
The main pension plans for employees in the UK:In the UK, plans are organized through external trusts and
the majority of the assets are invested in funds. The majority of the obligations relate to vested benefits for former employees and retirees. Only one plan is still open to new employees. Almost all plans are final salary plans. The plan assets are subject to the asset ceiling. They are required to meet minimum fund-ing requirements that are agreed with the trustees. Similarly, surplus assets cannot be returned to the companies without the approval of the trustees. The investment strategy for plan assets is an asset-liability matching strategy which is imple-mented principally through inflation-linked British government bonds and British corporate bonds.
The table shows the weighted average assumptions used for the actuarial valuation of the obligations:
Assumptions used in the actuarial valuation of pension obligations T87
in %
Group Germany
2017 2016 2017 2016
Discount rate as of December 31 2.12 2.16 2.00 2.00
Future salary increases 2.56 2.57 2.50 2.50
Future pension increases 1.58 1.59 1.50 1.50
Healthcare cost trend 6.52 6.76 – –
130 FINANCIAL REPORT 2017 EVONIK INDUSTRIES

The discount rate for Germany and the euro-zone countries is extrapolated from a yield structure curve derived from AA-rated corporate bonds denominated in euros and, where there are no longer any market data, a yield curve for zero-coupon German government bonds, taking into account a risk premium for euro-denominated AA-rated corporate bonds. The data on AA-rated euro-denominated corporate bonds is based on bonds with an AA rating from at least one of the major rating agencies. The yield structure curve derived from AA-rated euro-denominated corporate bonds is used to determine the present value of the cash flows from company pension obligations. The discount rate comprises the rounded constant interest rate that results in the same present value when applied to the cash flow.
Analogous methods are used in the UK and the USA. As of December 31, 2017, the rounded discount rate was 3.61 percent for the USA (2016: 4.08 percent) and 2.56 percent for the UK (2016: 2.46 percent).
In Germany, valuation is based on the biometric data in the 2005 G mortality tables published by Klaus Heubeck. For the companies in the UK, the S1PXA tables are used and for the USA the MP-2017 mortality protection scale is used.
Change in the present value of the defined benefit obligation T88
in € million 2017 2016
Present value of the defined benefit obligation as of January 1 11,585 10,542
Current service cost 200 180
Interest cost 243 297
Employee contributions 43 52
Actuarial gains (–) and losses (+) (remeasurement component) 64 985
of which based on financial assumptions 25 1,062
of which based on demographic assumptions – 12 – 18
of which changes in the past fiscal year 51 – 59
Benefits paid – 462 – 428
Past service cost – 5 – 2
Changes at the companies 10 17
Reclassifications in accordance with IFRS 5 – –
Gain/loss from settlement – –
Payments for settlement of plans – –
Currency translation – 115 – 58
Present value of the defined benefit obligation as of December 31 11,563 11,585
The weighted term of the obligations is 17.0 years (2016: 17.1 years).
Breakdown of the present value of the defined benefit obligation T89
in € million 2017 2016
Unfunded plans 384 365
Partially or fully funded plans 11,071 11,101
Healthcare benefit obligations 108 119
Present value of the defined benefit obligation as of December 31 11,563 11,585
The valuation of pension provisions is subject, among other things, to assumptions about discount rates, expected future salary and pension increases, the cost trend for healthcare, and mortality tables. The actual data may differ from these assumptions as a result of changes in economic or market conditions.
Sensitivity analysis: effects of changes in parameters on the defined benefit obligation T90
in € million
Reduction of 1 percentage point
Increase of 1 percentage point
Dec. 31, 2017
Dec. 31, 2016
Dec. 31, 2017
Dec. 31, 2016
Group-wide discount rate 2,208 2,243 – 1,687 – 1,689
Future salary increases – 159 – 172 169 184
Future pension increases – 899 – 888 1,078 1,062
Healthcare cost trend – 11 – 14 13 17
Assuming all other parameters remain unchanged, a reduc-tion of 20 percent in mortality in the retirement phase would increase the defined benefit obligation by € 862 million (2016: € 858 million).
131
NotesNotes to the balance sheet
CORPORATE GOVERNANCEMANAGEMENT REPORT SUPPLEMENTARY INFORMATION CONSOLIDATED FINANCIAL STATEMENTS

Change in the fair value of plan assets T91
in € million 2017 2016
Fair value of plan assets as of January 1 7,807 7,302
Interest income from plan assets 168 211
Employer contributions 209 174
Employee contributions 11 11
Income from assets excluding interest income from plan assets (remeasurement component) 202 376
Other administrative expense – 6 – 5
Benefits paid – 210 – 181
Payments for settlement of plans – –
Changes at the companies – 9 –
Currency translation – 85 – 81
Fair value of plan assets as of December 31 8,087 7,807
Breakdown of the fair value of plan assets T92
Dec. 31, 2017 Dec. 31, 2016
in € million in % in € million in %
Cash/balances with banks 243 3.0 184 2.4
Shares—active market 784 9.7 713 9.1
Shares—no active market – – – –
Government bonds—active market 1,148 14.2 1,175 15.1
Government bonds—no active market 40 0.5 45 0.6
Corporate bonds—active market 2,273 28.1 2,344 30.0
Corporate bonds—no active market 631 7.8 658 8.4
Other bonds—active market 429 5.3 393 5.0
Other bonds—no active market – – – –
Real estate (direct and indirect investments)—active market 16 0.2 16 0.2
Real estate (direct and indirect investments)—no active market 1,577 19.5 1,483 19.0
Other investment funds—active market – – 2 –
Other investment funds—no active market – – – –
Alternative investments (infrastructure/hedge funds/commodities)—active market 736 9.1 580 7.4
Alternative investments (infrastructure/hedge funds/commodities)—no active market 97 1.2 89 1.2
Other—active market 32 0.4 48 0.6
Other—no active market 81 1.0 77 1.0
8,087 100.0 7,807 100.0
In 2017, as in 2016, none of the other assets were used by the company.
Change in the asset ceiling T93
in € million 2017 2016
Asset ceiling as of January 1 74 109
Interest expense on the unrecognized portion of plan assets 2 4
Changes in asset ceiling, excluding interest expense (remeasurement component) 36 – 24
Changes at the companies – –
Currency translation – 3 – 15
Asset ceiling as of December 31 109 74
132 FINANCIAL REPORT 2017 EVONIK INDUSTRIES

Change in the net defined benefit liability T94
in € millionDec. 31,
2017Dec. 31,
2016
Net defined benefit liability as of January 1 3,852 3,349
Current service cost 200 180
Past service cost – 5 – 2
Gain/loss from settlement – –
Net interest cost 77 90
Employee contributions 32 41
Other administrative expense 6 5
Changes recognized in OCI (remeasurement) – 102 585
Benefits paid – 252 – 247
Employer contributions – 209 – 174
Changes at the companies 19 17
Reclassifications in accordance with IFRS 5 – –
Currency translation – 33 8
Net defined benefit liability as of December 31 3,585 3,852
Assets from overfunded plans as of December 31 232 –
Pension provisions as of December 31 3,817 3,852
The pension provisions recognized on the balance sheet included healthcare benefit entitlements, mainly of retirees of US subsidiaries.
The first-time recognition of net defined benefit assets from overfunded plans results from a pension plan where the spon-soring company is entitled to the surplus assets, so they cannot be set off against the pension provisions of other plans.
Expected change in benefit payments T95
in € millionReporting
periodPrior year
2017 253
2018 248 260
2019 255 264
2020 258 267
2021 265 275
2022 268
Employer contributions of € 208 million are expected to be incurred for the following year (2016: € 207 million).
The net interest expense is included in the financial result; see Note 5.6. The other amounts are allocated to the functional areas as personnel expense (pension expenses). A breakdown of overall personnel expense is given in Note 10.2.
For details of the deferred tax assets relating to pension provisions, see Note 6.13, Deferred taxes, other income taxes.
Foreign subsidiaries paid a total of € 34 million (2016: € 27 million) into defined contribution plans, which are also included in personnel expense (pension expenses).
Further, € 144 million (2016: € 139 million) were paid into defined-contribution state plans (statutory pension insurance) in Germany and abroad. This is also reported in personnel expense (expenses for social security contributions).
6.10 Other provisions
Other provisions are liabilities of uncertain timing or amount. They are established to cover a present legal or constructive obligation to third parties based on past events that will probably lead to a cash outflow. In addi-tion, it must be possible to reliably estimate the level of the obligation.
Provisions are based on the probable settlement obli-gations and take account of future cost increases. Non- current provisions are discounted.
Reversals of provisions are recognized as income in the functional areas where the original expense for the provision was recognized.
The determination of other provisions, especially provi-sions for legal risks, recultivation, environmental protec-tion, and restructuring, is naturally exposed to significant estimation uncertainties regarding the amount and timing of the obligation. In some cases, the company has to make assumptions about the probability of occurrence or future trends, such as the costs to be recognized for the obligation, on the basis of experience. In particular, the amount of the non-current provisions depends to a large extent on the selection and development of the market- oriented discount rates. The Group uses different interest rates for different currencies and terms to maturity.
133
NotesNotes to the balance sheet
CORPORATE GOVERNANCEMANAGEMENT REPORT SUPPLEMENTARY INFORMATION CONSOLIDATED FINANCIAL STATEMENTS

Other provisions T96
in € million
Dec. 31, 2017 Dec. 31, 2016
Totalthereof
non-current Totalthereof
non-current
Personnel-related 906 343 913 367
Recultivation and environmental protection 310 250 329 257
Restructuring 86 37 138 55
Sales and procurement 116 9 114 11
Other taxes and interest on taxes 40 33 35 24
Other obligations 365 116 323 103
1,823 788 1,852 817
Overall, the other provisions were €29 million lower than in 2016, principally due to the reduction in provisions for restructuring and provisions for recultivation and environ-mental protection. It is expected that slightly more than half of total provisions will be utilized in 2018.
Provisions relating to relevant legal risks amounted to €136 million (2016: €121 million) and are allocated to the various categories of provisions on the basis of their type. In 2017 and 2016, all of these provisions were reported in other obligations. They contain appropriate expenses for court and lawyers’ fees, payments to plaintiffs, and any payments for settlement or indemnity. The level of such provisions is based,
among other factors, on the type of dispute or claim, status of the legal proceedings, the opinion of lawyers, experience of comparable cases, and probability assumptions. The relevant legal risks for which provisions have been set up relate to three ongoing appraisal proceedings in connection with the settlement paid to former shareholders and a claim for indemnification from environmental guarantees submitted by the purchaser of the former carbon black business. A provision has been recognized for the expected costs of a legal dispute involving proceedings to fine Evonik in connection with deliveries of methionine to Brazil. These cases are outlined in detail in section 6.4 of the management report.
Change in other provisions T97
in € millionPersonnel-
related
Recultivation, environmental
protection Restructuring Sales,
procurement
Other taxes, interest
on taxes Other
obligations Total
As of January 1, 2017 913 329 138 114 35 323 1.852
Additions 474 25 3 79 18 126 725
Utilization – 470 – 38 – 39 – 53 – 6 – 69 – 675
Reversal – 15 – 3 – 15 – 21 – 7 – 15 – 76
Unwinding of discounting/interest rate changes 14 2 – – – – 16
Other – 10 – 5 – 1 – 3 – – – 19
As of December 31, 2017 906 310 86 116 40 365 1,823
Personnel-related provisions are established for many dif-ferent reasons and include bonus payments and variable remuneration, including Long-Term Incentive plans. These are performance-related remuneration plans for Evonik’s executives and members of the Executive Board. The resulting obligations are settled in cash and expensed in accordance
with IFRS 2 Share-based Payment. Further personnel-related provisions are established for statutory and in-house early retirement arrangements, lifetime working arrangements, and anniversary bonuses. About one third of non-current personnel-related provisions will result in payments after the end of 2022.
134 FINANCIAL REPORT 2017 EVONIK INDUSTRIES

Provisions for recultivation and environmental protection are established on the basis of laws, contracts, and regulatory requirements. They cover soil reclamation obligations, water protection, the recultivation of landfills, and site decontami-nation obligations. Slightly less than two thirds of the non- current provisions will result in payments after the end of 2022.
Restructuring provisions are only established if constructive obligations exist on the basis of a formal, detailed plan and those affected have been given justifiable expectations that the restructuring will be carried out. Such measures comprise programs which are planned and controlled by the company and will materially alter one of the company’s areas of business activity or the way in which a business activity is carried out. Restructuring provisions may only be established for costs that are directly attributable to the restructuring program. These include severance packages, redundancy and early retirement arrangements, expenses for the termination of contracts, dis-mantling and soil reclamation expenses, rents for unused facilities, and all other shutdown and wind-up expenses. As of the reporting date, the restructuring provisions included, among other things, a provision for a program to further strengthen our competitive position and to optimize the quality of our administrative processes. The partial reversal and utilization of this provision, together with the partial utilization of a pro-vision relating to the former Energy Business Area, which was divested in 2011, made a substantial contribution to the
reduction in provisions for restructuring in the reporting period. The non-current portion of provisions for restructuring will be fully utilized by the end of 2022.
The provisions for sales and procurement mainly relate to guarantee obligations, outstanding commission payments, price discounts and rebates, bonuses, and contracts where the unavoidable costs of performing the contractual obligation exceed the expected economic benefits. The non-current portion will be utilized by the end of 2022.
Provisions for other taxes and interest on taxes mainly comprise property tax, value-added tax, and interest obliga-tions relating to all types of taxes. The non-current portion will be utilized by the end of 2022.
Provisions for other obligations comprise provisions for a variety of obligations that cannot be allocated to the above categories. These include provisions for legal disputes, admin-istrative proceedings or fines, liability risks, and guarantee claims relating to divestments. They also include provisions for dismantling obligations, which were reported separately in 2016. Further, this item includes provisions for legal and con-sultancy expenses, audit fees, and changes in public law regulations, for example, in connection with the levy on renewable energy sources and European emissions trading. The non-current portion of provisions for other obligations will mainly be utilized by year-end 2022.
6.11 Financial liabilities
Financial liabilities T98
in € million
Dec. 31, 2017 Dec. 31, 2016
Totalthereof
non-current Totalthereof
non-current
Bonds 3,624 3,624 3,127 3,127
Liabilities to banks 350 70 375 103
Loans from non-banks 18 – 16 –
Liabilities from derivatives 32 12 188 94
Other financial liabilities 53 – 29 10
4,077 3,706 3,735 3,334
The following reconciliation shows the change in financial debt. Additions and repayments are disclosed in the cash flow statement in cash flow from financing activities. The
definition of financial debt is explained in section 2.9 of the management report.
135
NotesNotes to the balance sheet
CORPORATE GOVERNANCEMANAGEMENT REPORT SUPPLEMENTARY INFORMATION CONSOLIDATED FINANCIAL STATEMENTS

Financial debt T99
in € millionDec. 31,
2016
Addition and repayment of financial
liabilities
Changes in the scope of
consolidation
Changes in exchange
rates Other effectsDec. 31,
2017
Bonds 3,127 495 – – 2 3,624
Liabilities to banks 375 – 6 3 – 23 1 350
Loans from non-banks 16 – – – 2 18
Other financial liabilities 29 10 – – 1 15 53
3,547 499 3 – 24 20 4,045
(a) BondsThe €497 million increase in bonds to €3,624 million was mainly due to the issue in July 2017 of a hybrid bond with a
nominal value of €500 million to finance the acquisition of the Huber silica business. The formal tenor of the bond is 60 years, but Evonik has a first redemption right in 2022.
Bonds T100
in € million
Carrying amount Stock market value
Interest coupon in %
Nominal value
Dec. 31, 2017
Dec. 31, 2016
Dec. 31, 2017
Dec. 31, 2016
Evonik Industries AG
Fixed-interest bond 2013/2020 1.875 500 498 497 521 530
Fixed-interest bond 2015/2023 1.000 750 746 745 771 767
Hybrid bond 2017/2077 2.125 500 495 – 513 –
Evonik Finance B. V.
Fixed-interest bond 2016/2021 0.000 650 646 647 645 644
Fixed-interest bond 2016/2024 0.375 750 745 745 727 720
Fixed-interest bond 2016/2028 0.750 500 494 493 468 465
3,650 3,624 3,127 3,645 3,126
Fixed-interest bonds are exposed to a risk of price fluctua-tions while variable-rate liabilities are exposed to a risk of changes in interest rates. These risks may affect their fair value or future cash flows.
(b) Loans from non-banksThe accrual of €18 million (2016: €16 million) for payment of the coupon on the bonds is recognized in current loans from non-banks.
(c) Liabilities from derivatives
Liabilities from derivatives T101
in € millionDec. 31,
2017Dec. 31,
2016
Liabilities from interest rate swaps 2 –
Liabilities from cross-currency interest rate swaps 11 23
Liabilities from forward exchange contracts and currency swaps 17 160
Liabilities from commodity derivatives 2 5
32 188
136 FINANCIAL REPORT 2017 EVONIK INDUSTRIES

6.12 Trade accounts payable, other payables
Trade accounts payable, other payables T102
in € million
Dec. 31, 2017 Dec. 31, 2016
Totalthereof
non-current Totalthereof
non-current
Trade accounts payable 1,449 – 1,212 –
Advance payments received 28 – 29 –
Miscellaneous other payables 342 5 366 27
Deferred income 60 52 140 44
1,879 57 1,747 71
The miscellaneous other payables mainly comprise liabil-ities for other taxes, liabilities to the public sector, and liabilities from insurance contracts.
6.13 Deferred taxes, other income taxes
Deferred tax assets and liabilities are established for tem-porary valuation and recognition differences between the assets and liabilities recognized in the balance sheets prepared for tax purposes and those prepared in accor-dance with IFRS. Tax-deductible loss carryforwards that will probably be utilized in the future are capitalized at the amount of the deferred tax asset, taking into account whether they can be carried forward for a limited or unlimited period.
The recognition of deferred tax assets at companies with tax-deductible loss carryforwards is based, on the one hand, on current planning calculations, which are normally for a five-year period, and on the other hand, on the avail-ability of sufficient temporary tax differences. Deferred tax assets are recognized where it is probable that future taxable income will be generated, which can cover these temporary differences. If these expectations are not met, an impairment loss must be recognized in income for the deferred tax assets.
Deferred taxes are calculated on the basis of the tax rates applicable on the date when temporary differences are likely to be reversed.
Deferred tax assets and liabilities are netted if the company is permitted to net other income tax assets and liabilities and if the deferred tax assets and liabilities relate to income taxes in the same tax jurisdiction.
Other income taxes for the reporting period and previ-ous periods are recognized on the basis of the expected payment or refund. They are calculated using the company- specific tax rates applicable on the reporting date.
Group companies are liable to pay income tax in many countries around the world. When evaluating global income tax assets and liabilities, there may be some uncertainty relating, in particular, to the interpretation of tax regulations. It cannot be ruled out that the fiscal authorities will take a different view on the correct inter-pretation of tax regulations. Changes in assumptions regarding the correct interpretation of tax regulations, for example, as a result of changes in legal decisions, are reflected in the recognition of uncertain income tax assets and liabilities for the corresponding fiscal year. Uncertain tax assets and liabilities are recognized as soon as their probability of occurrence is more than 50 percent. Uncertain income tax positions are recognized on the basis of their most likely amount.
137
NotesNotes to the balance sheet
CORPORATE GOVERNANCEMANAGEMENT REPORT SUPPLEMENTARY INFORMATION CONSOLIDATED FINANCIAL STATEMENTS

Deferred taxes and other income taxes reported on the balance sheet T103
in € million
Dec. 31, 2017 Dec. 31, 2016
Totalthereof
non-current Totalthereof
non-current
Deferred tax assets 1,223 1,133 1,162 1,006
Other income tax assets 168 14 236 8
Deferred tax liabilities 541 419 453 407
Other income tax liabilities 275 225 256 173
In accordance with IAS 1 Presentation of Financial Statements, the current elements of deferred taxes are reported on the balance sheet under non-current assets and liabilities.
Deferred taxes by balance sheet item T104
in € million
Deferred tax assets Deferred tax liabilities
Dec. 31, 2017
Dec. 31, 2016
Dec. 31, 2017
Dec. 31, 2016
Assets
Intangible assets 3 3 247 127
Property, plant and equipment, investment property 38 45 284 415
Financial assets 901 645 75 166
Inventories 64 63 – 1
Receivables and other assets 63 248 108 31
Liabilities
Provisions 1,220 1,197 887 908
Liabilities 67 203 62 56
Special tax allowance reserves (based on local law) – – 38 28
Loss carryforwards 25 35 – –
Tax credits 3 1 – –
Other – 1 1 –
Deferred taxes (gross) 2,384 2,441 1,702 1,732
Netting – 1,161 – 1,279 – 1,161 – 1,279
Deferred taxes (net) 1,223 1,162 541 453
€1,042 million (2016: €1,013 million) of the deferred tax assets relate to the pension provisions recognized on the balance sheet.
No deferred tax assets were recognized on temporary dif-ferences of €341 million (2016: €357 million) because it is not probable that there will be sufficient future taxable income to enable them to be realized.
The total taxable temporary differences relating to shares in subsidiaries for which no deferred taxes were recognized
amounted to €1,337 million (2016: €1,872 million). €1,246 mil-lion (2016: €1,789 million) of this amount is only subject to a tax rate of around 1.5 percent, based on Section 8b of the German Corporation Tax Act (KStG). Evonik is in a position to manage the timing of the reversal of temporary differences.
Deferred tax assets of €14 million (2016: €14 million) were recognized for companies that made a loss. Utilization will be ensured by suitable measures.
138 FINANCIAL REPORT 2017 EVONIK INDUSTRIES

In addition to tax loss carryforwards for which deferred taxes were recognized, there were tax loss carryforwards that were not utilizable and for which no deferred taxes were recognized.
Tax loss carryforwards by expiration date T105
in € million
Corporation taxes (German and foreign)
Local taxes (German and foreign)
Tax credits (foreign)
2017 2016 2017 2016 2017 2016
Up to 1 year – 3 – – – –
More than 1 and up to 5 years 110 183 – – – –
More than 5 and up to 10 years 9 8 – – – –
Unlimited 350 362 232 228 – 1
469 556 232 228 – 1
7. Notes to the cash flow statement
The cash flow statement shows the changes in cash and cash equivalents of the Group in the reporting period. The cash flows are classified by operating, investing, and financing activities.
The net cash flow from discontinued operations that is attributable to third parties is shown separately.
The impact of changes in the scope of consolidation has been eliminated.
Interest paid and interest and dividends received are included in operating activities, while dividends paid are assigned to financing activities.
7.1 Cash flow from operating activities
The cash flow from operating activities is calculated using the indirect method. Income before the financial result and income taxes, continuing operations, is adjusted for the effects of non-cash income and expenses and items
that are allocated to investing or financing activities. Cer-tain other changes in amounts shown on the balance sheet are calculated and added to the result.
7.2 Cash flow from investing activities
For further details of the cash outflows for the acquisition of subsidiaries consolidated for the first time, see Note 4.2.
7.3 Cash and cash equivalents
As well as the cash and cash equivalents shown on the balance sheet, where applicable this item includes cash and cash equivalents included in assets held for sale. Cash and cash equivalents comprise balances with banks, checks, and cash. This item also includes highly liquid financial instruments with a maturity, calculated as of the
date of purchase, of no more than three months, pro-vided that they can be converted into cash and cash equivalents at any time and are only subject to negligible fluctuations in value. They are measured at fair value.
Cash and cash equivalents amount to €1,004 million (2016: €4,623 million).
139CORPORATE GOVERNANCEMANAGEMENT REPORT SUPPLEMENTARY INFORMATION CONSOLIDATED FINANCIAL STATEMENTS
NotesNotes to the balance sheetNotes to the cash flow statement

8. Notes to the segment report
8.1 Reporting based on operating segments
The Executive Board of Evonik Industries AG decides on the allocation of resources and evaluates the earnings power of the Group’s operations on the basis of the following reporting segments, which reflect the core operating business (subse-quently referred to as segments):• Nutrition & Care• Resource Efficiency• Performance Materials• Services.
The reporting based on operating segments therefore reflects the internal reporting and management structure of the Evonik Group (management approach).
The same accounting standards are applied as for external financial reporting; see Notes 3.5 and 3.6 and the accounting policies described in the other notes.
Evonik’s segments are outlined below:
The Nutrition & Care segment produces specialty chemicals, principally for use in consumer goods for daily needs, and in animal nutrition and healthcare products.
Ingredients, additives, and system solutions for high- quality consumer goods and specific industrial applications are focal areas of this segment. It has outstanding knowledge of interfacial chemistry. Its products are based on an exten-sive range of oleochemical derivatives, organically modified silicones, and active ingredients produced by biotechnology. Key success factors are high innovative capability, integrated technology platforms, and strategic partnerships with impor-tant consumer goods manufacturers. The Nutrition & Care segment also produces and markets essential amino acids for animal nutrition. Alongside its high technological competence, one factor in its success is years of experience of chemical synthesis and biotechnology, which Evonik regards as major growth drivers. Other significant competitive advantages for this segment are its global distribution network and extensive and differentiated service offering. The Nutrition & Care segment is also a strategic partner for the healthcare industry.
With its custom-tailored solutions, the Resource Efficiency segment helps customers in a wide range of industries posi-tion themselves better to meet future needs. Thanks to its environment- friendly and energy-efficient system solutions for the paints and coatings, automotive, and construction industries and for many other sectors, products marketed by Resource Efficiency are in demand in many markets. In the automotive industry, for example, lightweight materials from this seg-ment replace metal parts in the bodywork, chassis, interior,
and engine. As well as reducing the weight of vehicles, they reduce fuel consumption and exhaust emissions. Products from the Resource Efficiency segment also improve the resis-tance and durability of paintwork, make a contribution to tires with low rolling resistance, and pave the way for 3D printing technologies in industrial manufacturing. Further-more, products from this segment are used in the construc-tion of new buildings and energy-efficient refurbishment. The basis for the success of this segment is the good interaction of research, applications technology, production, marketing, and sales in all nine business lines.
The heart of the Performance Materials segment is the pro-duction of polymer materials and intermediates, mainly for the rubber, plastics, and agriculture industries. Performance Mate-rials’ mission is to be a leading supplier of polymer materials and intermediates. Its products, integrated structures, experience, and competencies make the difference. For this reason, it is often the market leader with its high-volume intermediates and custom-tailored solutions. This applies for integrated C4 and hydrocyanic production, and alkoxides, which are used, among other things, in the production of biodiesel. Through its methacrylates business and the strong PLEXIGLAS brand, Performance Materials is a trendsetter and driving force in the design, lighting design, architecture, and automotive areas.
The Services segment provides site management, utilities, waste management, technical, process technology, engineering, and logistics services for the chemicals segments and external customers at Evonik's sites. This segment also supports the chemicals businesses and the management holding company by providing standardized Group-wide business services, for example, in the areas of IT, human resources, accounting, and legal services.
Other operations bundles business activities that are not assigned to any of the reporting segments.
The column headed Corporate, consolidation includes the management holding company, strategic research, hidden reserves and liabilities, goodwill relating to former acquisi-tions of shares in Evonik Degussa, and intersegment consoli-dation effects.
140 FINANCIAL REPORT 2017 EVONIK INDUSTRIES

8.2 Reporting based on regions
For this purpose, countries and country groups are aggre-gated into regions. The reporting based on regions is outlined in more detail in Note 8.3.
The composition of the regions was revised in 2017 to ensure a more targeted response to future challenges as well as timely identification and utilization of growth opportunities around the world. The prior-year figures have been restated.
8.3 Notes to the segment data
External sales reflect the segments’ sales with parties outside the Evonik Group. Sales generated between the segments are internal sales and are cross-charged at market prices or using the cost-plus method.
Reconciliation from the sales of all reporting segments to Group sales T106
in € million 2017 2016
Sales, reporting segments 16,740 14,849
Sales, other operations 40 53
Corporate, consolidation, less discontinued operations – 2,361 – 2,170
External sales of the Evonik Group 14,419 12,732
External sales by country (location of customer) T107
in € million 2017 2016
USA 2,875 2,306
Germany 2,639 2,441
China 1,078 1,007
Netherlands 684 467
Switzerland 675 679
Japan 499 444
UK 483 360
France 476 401
Italy 356 321
Brazil 354 331
Other countries 4,300 3,975
External sales of the Evonik Group 14,419 12,732
Reconciliation from adjusted EBITDA of the reporting segments to income before income taxes, continuing operations T108
in € million 2017 2016
Adjusted EBITDA, reporting segments 2,706 2,505
Adjusted EBITDA, other operations – 101 – 109
Adjusted EBITDA, Corporate – 244 – 228
Consolidation – 1 – 3
Less discontinued operations – –
Adjusted EBITDA, Corporate, consolidation – 245 – 231
Adjusted EBITDA 2,360 2,165
Depreciation and amortization – 829 – 707
Impairment losses/reversals of impairment losses – 128 – 74
Depreciation, amortization, impairment losses/reversal of impairment losses included in adjustments 87 64
Adjusted depreciation, amortization and impairment losses – 870 – 717
Adjusted EBIT 1,490 1,448
Adjustmentsa – 261 – 150
Financial result – 202 – 174
Income before income taxes, continuing operations 1,027 1,124
a See management report, section 2.4 Business performance.
141
NotesNotes to the segment report
CORPORATE GOVERNANCEMANAGEMENT REPORT SUPPLEMENTARY INFORMATION CONSOLIDATED FINANCIAL STATEMENTS

The result from investments recognized at equity corresponds to the result for these investments as reported in the income statement; see Note 5.5.
The Executive Board of Evonik Industries AG uses adjusted EBITDA as the main parameter to measure operating performance. Adjusted EBITDA is the main earnings parameter that can be influenced by the segment management. It com-prises earnings before financial result, income taxes, depreci-ation, amortization, and impairment losses/reversal of impairment losses, after adjustments.
The adjusted EBITDA margin is the ratio of adjusted EBITDA to external sales.
Adjusted EBIT comprises earnings before financial result and income taxes, after adjustments. It is used to calculate the internal management parameter return on capital employed (ROCE).
Capital employed comprises the net assets required by the reporting segments for their operations. It is calculated by determining the total of intangible assets, property, plant and equipment, investments, inventories, trade accounts receiv-able, and other non-interest-bearing assets. The sum of interest- free provisions, trade accounts payable, and other interest- free liabilities is then deducted from this.
The return on capital employed (ROCE) is another internal management parameter used by the Group. ROCE is calcu-lated from the ratio of adjusted EBIT to capital employed. To smooth the closing date effect, the calculation uses average capital employed in the reporting period.
Depreciation and amortization relate to the depletion in the value of intangible assets, property, plant and equipment over their estimated useful life.
Capital expenditures comprise additions to intangible assets (excluding goodwill from capital consolidation), property, plant and equipment. Additions resulting from changes in the scope of consolidation are not taken into account. Capital expenditures by region are based on the location of the sub-sidiaries.
Additions to investments recognized at equity, other invest-ments, non-current loans, and non-current securities and similar claims made in the reporting period are recognized as financial investments. The acquisition of subsidiaries is shown as an addition to financial investments in the year of acquisition (including goodwill from capital consolidation).
The headcount is taken on the reporting date. It shows the number of employees. Part-time employees are included as absolute figures. The headcount by region is based on the location of the subsidiaries.
Goodwill, other intangible assets, and property, plant and equipment are segmented by the location of the subsidiaries. Together, these assets comprise the non-current assets in accordance with IFRS 8 Operating Segments (see IFRS 8.33 b).
Breakdown of non-current assets by country T109
in € millionDec. 31,
2017Dec. 31,
2016
Germany 5,231 4,500
USA 3,599 1,492
Singapore 807 627
China 774 808
Belgium 554 528
Other countries 1,635 1,398
Non-current assets 12,600 9,353
142 FINANCIAL REPORT 2017 EVONIK INDUSTRIES

9. Other disclosures
9.1 Performance-related remuneration
Evonik’s remuneration system comprises a basic salary, annual short-term incentive payments and, as a long-term component, the Long-Term Incentive (LTI) Plans for members of the Exec-utive Board and other executives of the Evonik Group. Since Evonik did not have a quoted share price, for members of the Executive Board the targets for the annual tranches of these LTI Plans issued up to and including 2012 were based on the development of uniformly defined business indicators. How-ever, the target amounts and performance periods of the plans differed. Following the stock exchange listing, the performance of Evonik shares became the central element in the LTI Plan for the first time in 2013. The redesigned LTI Plan was introduced for both Executive Board members and other executives. Fol-lowing the stock exchange listing of Evonik Industries AG, the performance of shares in the company also became relevant for the valuation of the pre-2013 LTI Plans.
All LTI Plans are share-based payments with cash settle-ment. They are valued on the reporting date using a Monte Carlo simulation, which models exercise patterns. The LTI Plans result in personnel expense which is distributed over the term of each tranche.
(a) Evonik LTI Plan for Executive Board members—2012 tranche
The reference base for these plans is a sustained rise in the value of the company. The plan rewards achieving or exceeding the operating earnings targets set in the mid-term planning and their impact on the value of the company. Each of these tranches runs for five years from January 1 of the year in which it was granted.
Entitlements are based on individually agreed target amounts provided that earnings targets are met (lower threshold). LTI payments are calculated in the year following the end of the performance period, when the necessary indi-cators are available. Payments are capped at three times the target amount and can be zero if the defined lower threshold is not reached.
To determine the value of the company as a basis for ascertaining target attainment, the share price at the end of the performance period is used. For this purpose, the average price of shares in Evonik in the three months prior to the end of the performance period is calculated. In addition, dividends paid and any capital increases or decreases during the perfor-mance period are taken into account. The cumulative discrep-ancy between planned and actual target attainment in the
performance period and the dividends paid in the last year of the performance period are taken into account in the calcula-tion. If there is no share price, the value of equity is determined on the basis of the last share transaction in the last twelve months of the performance period. If there was no share transaction in the last twelve months, a fictitious equity value is used. This is derived by applying a fixed EBITDA multiple to the company’s business performance in the last full fiscal year.
Under the terms of the plan, the 2012 tranche for members of the Executive Board became vested as of December 31, 2016 and had no intrinsic value. There was no income or expense for this tranche in fiscal 2017, nor was any provision recognized as of December 31, 2017.
(b) Evonik LTI Plan for Executive Board members and other executives—Tranches 2013 through 2017
In view of the stock exchange listing of Evonik Industries AG, the Supervisory Board redesigned the LTI Plan for the period from 2013 so it differs from the tranches for 2012 and previous years. Performance is measured by the absolute performance of Evonik’s share price and its performance relative to the MSCI World Chemicals IndexSM.
Based on the contractually agreed target amount, which is defined in euros, a number of virtual shares is calculated using the share price at the start of the performance period. This is based on the price in the last 60 trading days before the start of performance period. The performance period starts on January 1 of the grant year and runs for four years. Since there was no share price at the start of the performance period, as an exception, the virtual shares for the 2013 tranche were calculated from the share price in the first 60 trading days following admission to the stock exchange (April 25, 2013). At the end of the performance period, the starting price of Evonik shares is viewed against the average share price at the end of the performance period. This is compared with the performance of the benchmark index (total share-holder return).
If the relative performance is below 70 percentage points, the relative performance factor is deemed to be zero. If the relative performance is above 130 percentage points, the rel-ative performance factor is set at 130.
The payment is calculated by multiplying the relative per-formance by the number of virtual shares allocated and the average price of Evonik shares at the end of the performance period.
143
NotesOther disclosures
CORPORATE GOVERNANCEMANAGEMENT REPORT SUPPLEMENTARY INFORMATION CONSOLIDATED FINANCIAL STATEMENTS

At the end of the performance period, there is an option to extend it once for a further year. Partial exercise at the end of the original performance period is not permitted. The upper limit for these payments is set at 300 percent of the individual target amount.
Since the previous performance periods for the LTI Plan for executives, including the 2012 tranche, were three years, the 2013 tranche for executives was set to allow the first half
of the 2013 tranche to be exercised after three years and the second half after four years. As a further incentive for the transition, the payments for this tranche are multiplied by 1.2. From the 2014 tranche, a four-year performance period is also applied for executives. As of December 31, 2017, there was a provision of €38.9 million (2016: €29.7 million) for the LTI Plans for 2013, 2014, 2015, 2016, and 2017.
LTI Plan for Executive Board members—2013, 2014, 2015, 2016, and 2017 tranches T110
2017 tranche 2016 tranche 2015 tranche 2014 tranche 2013 tranche
Grant date Date Jun. 7, 2017 May 18, 2016 Apr. 29, 2015 Apr. 14, 2014 Aug. 14, 2013
No. of virtual shares granted 108,283 139,109 175,787 140,145 153,123
No. of virtual shares forfeited – – – – 51,760
No. of virtual shares exercised – – – – 32,350
No. of virtual shares as of December 31, 2017 108,283 139,109 175,787 140,145 69,013
Performance period from – to
Jan. 1, 2017 – Dec. 31, 2020
Jan. 1, 2016 – Dec. 31, 2019
Jan. 1, 2015 – Dec. 31, 2018
Jan. 1, 2014 – Dec. 31, 2017
Jan. 1, 2013 – Dec. 31, 2017a
Expense (+)/income (–) for the period in €'000 635 1,997 1,379 801 298
Carrying amount of provision in €'000 635 2,674 4,041 3,526 2,000
a Extension option utilized in some cases.
LTI Plan for executives—2013, 2014, 2015, 2016, and 2017 tranches T111
2017 tranche 2016 tranche 2015 tranche 2014 tranche 2013 tranche
Grant date Date Jun. 6, 2017 May 18, 2016 May 18, 2015 Apr. 11, 2014 Aug. 27, 2013
No. of virtual shares granted 524,378 436,125 535,195 420,598 395,422
No. of virtual shares forfeited 5,442 7,880 14,821 17,177 13,456
No. of virtual shares exercised – – – – 372,269
No. of virtual shares as of December 31, 2017 518,936 428,245 520,374 403,421 9,697
Performance period from – to
Jan. 1, 2017 – Dec. 31, 2020
Jan. 1, 2016 – Dec. 31, 2019
Jan. 1, 2015 – Dec. 31, 2018
Jan. 1, 2014 – Dec. 31, 2017
Jan. 1, 2013 – Dec. 31, 2017a
Expense (+)/income (–) for the period in €'000 3,041 1,677 3,308 1,933 – 278
Carrying amount of provision in €'000 3,041 3,792 10,139 9,081 0
a Extension option utilized in some cases.
As of December 31, 2017, total provisions for share-based payment amounted to €38.9 million (2016: €29.7 million). In 2017, total expense for share-based payment was €14.8 million (2016: €8.4 million).
144 FINANCIAL REPORT 2017 EVONIK INDUSTRIES

9.2 Additional information on financial instruments
Financial instruments comprise contractually agreed rights and obligations resulting in an inflow or outflow of financial assets or the issue of equity instruments. They are initially measured at fair value plus any directly attributable transaction costs. Transaction costs for financial instruments assigned to the category at fair value through profit or loss are recognized directly in the income statement. Subsequent measurement is also based on the classification of financial instruments defined in IAS 39 Financial Instruments: Recognition and Measurement.
(a) Non-derivative financial instrumentsAssets relating to non-derivative financial instruments are initially recognized at the settlement date. They are derecognized when the contractual rights to receive pay-ments lapse or are transferred and Evonik has transferred substantially all opportunities and risks associated with ownership. Liabilities relating to financial instruments are derecognized when the obligation has been settled or canceled or has expired.
In the Evonik Group, assets relating to non-derivative financial instruments are allocated to the categories loans and receivables or held for sale. Liabilities relating to non-derivative financial instruments are recognized at amortized cost.
Loans and receivables principally comprise trade accounts receivable and loans. These assets are valued at amortized cost using the effective interest rate method. If there are objective indications of impairment of an asset, an impairment loss is recognized in profit or loss. If the original reason for the impairment loss no longer applies, it is reversed to income, but only up to the amortized cost.
Other investments and other securities are allocated to the category available-for-sale and measured at fair value. If no fair value is available for such assets, or the fair value cannot be determined reliably, they are recog-nized at amortized cost. Changes in the fair value are recognized in other comprehensive income, taking into account deferred taxes. As of every reporting date, they are examined for objective indications of impairment, for example, a material or lasting reduction in the fair value to below the cost of acquisition. In such cases, the corre-sponding losses are derecognized from other compre-hensive income and recognized in the income statement.
If the reason for the impairment loss no longer applies, the reversal is recognized in other comprehensive income. Only debt instruments are written back by up to the amount of the original impairment in the income state-ment. Impairment losses are not reversed if they apply to financial assets whose fair value cannot be reliably determined.
The category at amortized cost mainly refers to trade accounts payable and loans. They are measured at amor-tized cost using the effective interest rate method.
Receivables and liabilities from finance leases, which are recognized at Evonik in other financial assets or other financial liabilities, are not allocated to any category because they are measured in accordance with IAS 17 Leases rather than IAS 39.
The impairment test on loans, receivables, and invest-ments is based on estimates. If there is a considerable change in the underlying assumptions or circumstances, the estimates have to be reviewed. This may result in impairment of the related assets.
(b) Derivative financial instrumentsDerivative financial instruments are used to hedge the risk of changes in exchange rates, the price of commodities, and interest rates. Initial recognition is on the trading date and they are measured at fair value. If no stock exchange or market price is available for the derivative from an active market, the fair value is determined using financial valuation methods. Derivatives are recognized on the balance sheet either on a stand-alone basis or as a valuation unit with the corresponding hedged items (hedge accounting).
145
NotesOther disclosures
CORPORATE GOVERNANCEMANAGEMENT REPORT SUPPLEMENTARY INFORMATION CONSOLIDATED FINANCIAL STATEMENTS

Stand-alone derivatives are allocated to the category held for trading. Changes in their fair value are recog-nized in profit or loss. Derivatives in valuation units are not allocated to any category. They are recognized at fair value. However, the treatment of changes in their fair value is based on the special rules for hedge accounting.
The fair value is the price that would be received for the sale of an asset or the transfer of a liability in an orderly transaction between market participants at the measure-ment date. It is therefore an exit price based on a hypo-thetical transaction on the reporting date. The fair value is determined on the basis of the three-level hierarchy set out in IFRS 13 Fair Value Measurement. Where avail-able, it is determined from the quoted prices for identical assets or liabilities in an active market without adjustment (Level 1). If such data are not available, measurement based on directly or indirectly observable inputs is used
(Level 2). In all other cases, valuation methods that are not based on observable market data are used (Level 3). Where input factors from different levels are used, the level applicable for the lowest material input factor is determined and the overall fair value is assigned to this level.
9.2.1 Disclosures on the carrying amounts and fair values of financial instruments
Financial instruments that fall within the scope of IFRS 7 Financial Instruments: Disclosures are to be disclosed by classes that take into account the characteristics of the finan-cial instruments. The following tables show the classification used by Evonik, which is based on the presentation on the balance sheet. The carrying amounts and fair values are disclosed for each IAS 39 category.
Carrying amounts and fair values of financial assets as of December 31, 2017 T112
in € million
Carrying amount by valuation category Dec. 31, 2017
Available- for-sale
Loans and receivables
Held for trading
Not allocated to any
categoryCarrying
amountFair
value
Financial assets 135 90 9 252 486 472
Other investments a 126 – – – 126 112
Loans – 59 – – 59 59
Securities and similar claims 9 – – – 9 9
Receivables from derivatives – – 9 238 247 247
Other financial assets – 31 – 14 45 45
Trade accounts receivable – 1,776 – – 1,776 1,776
Cash and cash equivalents – 1,004 – – 1,004 1,004
135 2,870 9 252 3,266 3,252
a The fair value of the other investments (€112 million) does not include investments of €14 million recognized at cost of acquisition as their fair value cannot be determined reliably.
146 FINANCIAL REPORT 2017 EVONIK INDUSTRIES

Carrying amounts and fair values of financial assets as of December 31, 2016 T113
in € million
Carrying amount by valuation category Dec. 31, 2016
Available- for-sale
Loans and receivables
Held for trading
Not allocated to any
categoryCarrying
amountFair
value
Financial assets 122 104 14 290 530 492
Other investments a 110 – – – 110 72
Loans – 72 – – 72 72
Securities and similar claims 12 – – – 12 12
Receivables from derivatives – – 14 285 299 299
Other financial assets – 32 – 5 37 37
Trade accounts receivable – 1,661 – – 1,661 1,661
Cash and cash equivalents – 4,623 – – 4,623 4,623
122 6,388 14 290 6,814 6,776
a The fair value of the other investments (€72 million) does not include investments of €38 million recognized at cost of acquisition as their fair value cannot be determined reliably.
Carrying amounts and fair values of financial liabilities as of December 31, 2017 T114
in € million
Carrying amount by valuation category Dec. 31, 2017
Liabilities held for trading
Liabilities at amortized
cost
Not allocated to any
categoryCarrying
amountFair
value
Financial liabilities 7 4,045 25 4,077 4,101
Bonds – 3,624 – 3,624 3,644
Liabilities to banks – 350 – 350 354
Loans from non-banks – 18 – 18 18
Liabilities from derivatives 7 – 25 32 32
Other financial liabilities – 53 – 53 53
Trade accounts payable – 1,449 – 1,449 1,449
7 5,494 25 5,526 5,550
Carrying amounts and fair values of financial liabilities as of December 31, 2016 T115
in € million
Carrying amount by valuation category Dec. 31, 2016
Liabilities held for trading
Liabilities at amortized
cost
Not allocated to any
categoryCarrying
amountFair
value
Financial liabilities 14 3,546 175 3,735 3,737
Bonds – 3,127 – 3,127 3,126
Liabilities to banks – 375 – 375 378
Loans from non-banks – 16 – 16 16
Liabilities from derivatives 14 – 174 188 188
Other financial liabilities – 28 1 29 29
Trade accounts payable – 1,212 – 1,212 1,212
14 4,758 175 4,947 4,949
147
NotesOther disclosures
CORPORATE GOVERNANCEMANAGEMENT REPORT SUPPLEMENTARY INFORMATION CONSOLIDATED FINANCIAL STATEMENTS

Financial instruments recognized at fair valueThe following tables show the financial instruments that are
measured at fair value on a recurring basis after initial recog-nition on the balance sheet:
Financial instruments recognized at fair value as of December 31, 2017 T116
in € million
Fair value based onDec. 31, 2017
Publicly quoted
market prices
(Level 1)
Directly observable
market- related prices
(Level 2)
Individual valuation
parameters
(Level 3)
Other investments 83 – 29 112
Securities and similar claims 9 – – 9
Receivables from derivatives – 247 – 247
Liabilities from derivatives – – 32 – – 32
Financial instruments recognized at fair value as of December 31, 2016 T117
in € million
Fair value based onDec. 31, 2016
Publicly quoted
market prices
(Level 1)
Directly observable
market- related prices
(Level 2)
Individual valuation
parameters
(Level 3)
Other investments 72 – – 72
Securities and similar claims 12 – – 12
Receivables from derivatives – 299 – 299
Liabilities from derivatives – – 188 – – 188
The financial instruments allocated to Level 1 are recognized at their present stock market price. They comprise all securities and one equity investment. As of the present reporting date, all derivatives are allocated to Level 2. They comprise currency, interest rate, and commodity derivatives whose fair value was determined with the aid of a discounted cash flow method or option pricing models on the basis of the exchange rates at the European Central Bank, observed interest rate structure curves, FX volatilities, observed commodity prices, and observed credit default premiums. The other investments, which are allocated to Level 3, are unlisted equity invest-ments in the category available-for-sale financial assets. They are measured on the basis of the best available information as of the reporting date. The fair values were derived from observable prices in connection with equity refinancing. In the case of unlisted investment funds, the fair values of the companies in which the funds were invested are taken into account. Between January 1, 2017 and December 31, 2017, the following changes occurred within Level 3: As of January 1, 2017, available-for-sale financial assets with a carrying amount of €22 million previously recognized at the cost of
acquisition were measured at their fair value of €23 million and assigned to Level 3. The change in valuation in 2017 was recognized outside of profit or loss in the statement of other comprehensive income. Further available-for-sale assets totaling €6 million were acquired in 2017 and assigned directly to Level 3.
Fair value of financial instruments recognized at amortized costThe fair value of bonds is their directly observable stock market price on the reporting date. For loans, other financial assets, liabilities to banks, loans from non-banks, and other financial liabilities the fair value is determined as the present value of the expected future cash inflows or outflows and is therefore allo-cated to Level 2. Discounting is based on the interest rate for the respective maturity on the reporting date, taking the credit-worthiness of the counterparties into account. Since the majority of other financial receivables and liabilities and trade accounts receivable and payable are current, their fair values—like the fair value of cash and cash equivalents—corre-spond to their carrying amounts.
148 FINANCIAL REPORT 2017 EVONIK INDUSTRIES

The other investments that are recognized on the balance sheet at amortized cost comprise investments in equity instruments for which there is no quoted price in an active market and whose fair values cannot be determined reliably in accordance with one of the three levels of the fair value hierarchy. There is no intention of selling these investments.
9.2.2 Results of financial instrumentsThe income and expenses, gains and losses from financial instruments reflected in the income statement are allocated to the following IAS 39 valuation categories:
Net result by valuation category 2017 T118
in € million
Net result by valuation category 2017
Available- for-sale assets
Loans and receivables
Financial instruments
held for trading
Liabilities at amortized
cost
Proceeds from disposals 2 – 2 – – –
Income from derivatives – – – 8 – – 8
Impairment losses/reversals of impairment losses – – 49 – – – 49
Net interest expense 1 4 – 46 – 61 – 102
Income from other investments 3 – – – 3
6 – 47 – 54 – 61 – 156
Net result by valuation category 2016 T119
in € million
Net result by valuation category 2016
Available- for-sale assets
Loans and receivables
Financial instruments
held for trading
Liabilities at amortized
cost
Proceeds from disposals – – 1 – – – 1
Income from derivatives – – – 107 – – 107
Impairment losses/reversals of impairment losses – 5 – – 5
Net interest expense – 4 – 31 – 47 – 74
Income from other investments 1 – – – 1
1 8 – 138 – 47 – 176
Income from derivatives does not include income from deriv-ative financial instruments for which hedge accounting is applied.
As in 2016, net interest expense did not include any interest income on the impaired portion of financial assets or trade accounts receivable.
9.2.3 Notional value of derivatives
The notional value of interest rate swaps is the principal on which the swap agreement is based, while the notional value of the cross-currency interest rate swaps, forward exchange contracts, currency options, and currency swaps is the hedged foreign exchange amount converted into euros. The notional value of the commodity derivatives is the hedged procurement cost translated into euros.
149
NotesOther disclosures
CORPORATE GOVERNANCEMANAGEMENT REPORT SUPPLEMENTARY INFORMATION CONSOLIDATED FINANCIAL STATEMENTS

Notional value of derivative financial instruments T120
in € million
Dec. 31, 2017 Dec. 31, 2016
Totalthereof current
thereof non-current Total
thereof current
thereof non-current
Interest rate swaps 650 – 650 – – –
Cross-currency interest rate swaps 1,727 88 1,639 680 40 640
Forward exchange contracts, currency options, and currency swaps 3,873 3,606 267 8,700 6,708 1,992
Commodity derivatives 56 30 26 95 57 38
6,306 3,724 2,582 9,475 6,805 2,670
9.2.4 Hedge accounting
Derivatives used as hedging instruments and the corre-sponding hedged items are recognized as a valuation unit for the purpose of hedge accounting. In particular, hedge accounting requires extensive documentation of the hedging relationship, together with evidence that the expected and actual effectiveness of the hedge is between 80 and 125 percent. A derivative no longer qualifies for hedge accounting if these conditions are not fulfilled.
The purpose of cash flow hedges is to minimize the risk of volatility of future cash flows. These may result from a recognized asset or liability or a forecast transaction that is considered highly probable. The effective portion of changes in the fair value of a hedging instrument is recog-nized in other comprehensive income and the ineffective portion of the change in value is recognized in the income statement. Amounts recognized in other comprehensive income are reclassified to the income statement as soon as the hedged item has an impact on the income statement. In the case of interest rate hedges, such amounts are included in net interest income or expense, while in the case of cur-rency hedges for forecast sales in foreign currencies they are included in sales revenues, and hedges on the procure-ment of goods are included directly in the cost of sales. If the hedged future transaction comprises a non-financial asset or a non-financial liability, the gain or loss previously recognized in other comprehensive income is included in the cost of acquisition of the asset or liability when it is initially recognized. Hedge accounting must also be halted if the forecast transaction no longer appears probable. The amount recognized in other comprehensive income is reclassified to the income statement.
The purpose of a hedge of a net investment is to reduce the foreign currency risk involved in an investment in a company whose functional currency is not the euro. Such hedges are accounted for in the same way as cash flow
hedges. Gains and losses recognized in other comprehen-sive income are reclassified to the income statement when the foreign subsidiary is divested or investment in it is reduced.
The purpose of fair value hedges is to hedge the fair value of assets or liabilities reflected on the balance sheet. Both changes in the fair value of the hedging instrument and changes in the value of the hedged item are recognized in the income statement. In view of this method, changes in the value of the hedged item and the hedge cancel each other out in the income statement.
Hedge accounting was applied for the following major trans-actions in 2017:
(a) Cash flow hedgesAs of the balance sheet date, forward exchange contracts and currency swaps were used to hedge forecast foreign cur-rency sales amounting to around €1,620 million (2016: around €1,940 million) up to March 2019 against exchange rate movements. These hedging instruments had a positive fair value of €72 million (2016: negative fair value of €56 million). At year-end 2017, gains of €92 million (2016: losses of €49 mil-lion) were recognized in the hedge reserve.
Evonik hedges the currency risk arising from intragroup foreign currency loans against the functional currency of the relevant Group company through cross-currency interest rate swaps, forward exchange contracts, and currency swaps. The notional value of these cash flow hedges on the reporting date was €2,004 million (2016: €1,122 million). The designated hedges had a fair value of €156 million (2016: €0 million). The hedge reserve for this hedge comprises income of €16 million (2016: €37 million).
150 FINANCIAL REPORT 2017 EVONIK INDUSTRIES

To hedge the acquisition of the Air Products specialty addi-tives business, forward exchange contracts and USD currency options were concluded until the transaction was closed in January 2017. When the acquisition took place, income of €74 million was transferred from the hedge reserve to the associated balance sheet items.
To hedge the acquisition of the Huber silica business, for-ward exchange contracts and USD currency options were concluded. When the acquisition took place in September 2017, expense of €4 million was transferred from the hedge reserve to the associated balance sheet items.
Between December 2011 and December 2012 Evonik suc-cessively purchased a total of ten forward starting payer swaps with a notional value of €50 million each to hedge the interest rate risk of a highly probable refinancing transaction totaling €500 million forecast for 2013. In this way, a 5-year swap rate of 1.6 percent was locked in for a period of five years starting from June 2013. The expected refinancing took place in spring 2013 through the issue of a new bond by Evonik Industries AG. The hedge was terminated when the financing terms were fixed. The realized hedging expense of €15 million will be released to net interest expense over the original hedged financing period using the effective interest method. At year-end 2017, a negative fair value of €2 million was recognized in the hedge reserve for these transactions (2016: negative fair value of €5 million).
As of year-end 2017, commodity swaps with a negative fair value of €1 million (2016: negative fair value of €3 million) were used to hedge forecast purchases of raw materials against price fluctuations up to 2019. The hedge reserve for this transaction was €0 million in 2017 (2016: negative fair value of €1 million).
The effectiveness of the hedging relationships was deter-mined using the dollar offset method, critical term match, the hypothetical derivatives method, regression analyses, and sen-sitivity analyses. When hedging the currency risk of highly probable forecast transactions, in general only the spot compo-nents of forward exchange contracts used to hedge currency risks are designated as hedges. In 2017, the valuation of cash flow hedges resulted in income of €1 million (2016: €0 million) from ineffective portions. (b) Hedge of a net investmentSince March 2010 the investment in UK subsidiaries has been hedged against foreign currency risks on a rolling basis. The hedging contracts normally have terms of a few months. As of December 31, 2017, the notional value of the hedges was
£65 million, as in the previous year. At year-end 2017, the outstanding hedging contracts had a negative fair value of €1 million (2016: positive fair value of €1 million). Between the start of hedging in March 2010 and year-end 2017, total of expenses of €5 million (2016: €6 million) were assigned to the hedge reserve.
(c) Fair value hedgesSince January 2017, a fixed-interest loan and an interest rate swap have been combined as a fair value hedge. The notional value of the interest rate swap is €650 million and it had a negative fair value of €2 million as of the reporting date.
9.2.5 Notes on financial risk managementAs an international company, Evonik is exposed to financial risks in the normal course of business. A major objective of corporate policy is to minimize the impact of market, liquidity, and default risks on both the value of the company and profitability in order to check adverse fluctuations in cash flows and earnings without forgoing the opportunity to benefit from positive market trends. For this purpose, a systematic financial and risk management system has been established. Interest rate and exchange rate risks are managed centrally by the Finance Division of Evonik Industries AG, while commodity risks are managed by the segments in accordance with established corporate policies.
The financial derivatives contracts used by Evonik are entered into exclusively in connection with a corresponding underlying transaction (hedged item) relating to normal operating business, which provides a risk profile directly opposite to that of the hedge. The instruments used are cus-tomary products found on the market. For the management of interest rates and exchange rates, they comprise currency swaps, forward exchange contracts, cross-currency interest rate swaps, and interest rate swaps. Commodity swaps are used to hedge the risk of fluctuations in the price of coal, natural gas, electricity, and petrochemical feedstocks. The procurement of emission allowances to meet obligations pur-suant to Section 6 of the German Emissions Trading Act (TEHG) can be optimized through use of EUA-CER swaps and EUA or CER futures.
(a) Market riskMarket risk can basically be subdivided into exchange rate, interest rate, and commodity risks. The management of these risks is explained below.
151
NotesOther disclosures
CORPORATE GOVERNANCEMANAGEMENT REPORT SUPPLEMENTARY INFORMATION CONSOLIDATED FINANCIAL STATEMENTS

Exchange rate risks relate to both the sourcing of raw mate-rials and the sale of end-products in currencies other than the functional currency of the company concerned. One aim of currency risk management is to protect the company’s oper-ating business from fluctuations in earnings and cash flows resulting from changes in exchange rates. The opposite effects arising from procurement and sales activities are taken into account. Another objective of currency management is to eliminate the currency risk relating to financing transactions that are not denominated in the functional currency of the respective Group companies.
In the management of currency risks, Evonik distin-guishes between risk positions recognized on the balance sheet and off-balance-sheet (i. e., firmly agreed or forecast) exposures. For currency hedging of current risk positions on the balance sheet, Evonik uses a portfolio approach where the hedged items and hedging instruments are accounted for separately. By contrast, micro hedging is applied for non-current loans and exposures arising from firmly agreed or forecast transactions. The hedging instrument and related hedged item are then designated in a formal hedge relationship (cash flow hedge accounting). This synchronizes the earnings impact of the hedging instruments with hedged items that can only be recognized on the balance sheet at a later date. In the case of hedges on loans, it allows the distribution of hedging costs on a straight-line basis over the term of hedging rela-tionship.
In the portfolio approach, the net risk position in each foreign currency is determined for each Group company. The net risk positions are then bundled through intragroup hedging and where appropriate netted at Group level. The remaining net positions are then hedged externally via forward exchange contracts and currency swaps. This currency management is carried out separately for operational risk positions (mainly trade accounts receivable and payable in foreign currencies) and risk positions arising from current financing activities such as cash pooling, bank deposits, and cash and cash equivalents.
Gross income and expenses from currency translation of operating monetary assets and liabilities are netted; so are gross income and expenses from the corresponding opera-tional currency hedging. The net result from the translation of operating monetary assets and liabilities and the net result of operational currency hedging calculated in this way are recognized in other operating income or other operating
expense as appropriate. Gross income and expenses from the currency translation of financing-related risk positions and financing-related currency hedging are netted analogously. The resulting net results for currency translation and currency hedging are recognized in other financial income/expense. The net presentation of the results reflects both the management of risk positions in the Evonik Group and the economic substance.
Due to the application of hedge accounting, micro-hedging of foreign currency balance sheet exposure (for example, financing-related currency hedging of non-current loans through cross-currency interest rate swaps) and the hedging of planned or firmly agreed foreign currency cash flows (for example, hedging of forecast sales revenues) are only reflected in the net result from operational or financing- related currency hedging with any ineffective portion or any forward components that are excluded from the hedge accounting relationship. By contrast, the effective results of micro-hedges reflected in cash flow hedge accounting are recognized in accumulated other comprehensive income until the hedged transaction is realized. Subsequently, they are transferred to sales if they were used as a sales hedge, to inventories or the cost of sales if they were used to hedge cost risks relating to procurement, or to the initial carrying balance of property, plant and equipment if the purpose was to hedge the foreign currency risk relating to the procure-ment of assets of this type. In the case of currency hedges for loans for which cash flow hedge accounting is applied, the effective portion of the hedge is transferred from accumulated other comprehensive income to offset the net result of currency translation of monetary assets and liabilities triggered by the hedged item. See Note 6.8 (g).
The aim of interest rate management is to protect net income from the negative effects of fluctuations in market interest rates. Interest rate risk is managed by using derivative and non-derivative financial instruments. The aim is to achieve an appropriate ratio of fixed rates (with interest rates fixed for more than one year) and variable rates (terms of less than one year), taking costs and risks into account. At year-end 2017, 94 percent (2016: 93 percent) of non-derivative financial instru-ments were fixed-interest contracts. Taking financial deriva-tives into account, the proportion of fixed- interest financial instruments declines to 77 percent (2016: 79 percent).
Several scenario analyses were carried out to measure exchange rate and interest rate risk as of December 31, 2017.
152 FINANCIAL REPORT 2017 EVONIK INDUSTRIES

The most important currencies for Evonik are the US dollar (USD) and the Chinese renminbi yuan (CNY/CNH). CNH is the technical market designation for renminbi that are tradable and deliverable outside the territory of China. A sensitivity analysis was performed for these currencies by modeling a change of 5 percent and 10 percent in the exchange rate relative to all other currencies to simulate the possible loss of value of derivative and non-derivative financial instruments in the event of the appreciation or depreciation of these currencies. The percentage standard deviation of changes in exchange rates versus the euro in 2017 was 6.7 percent for the USD (2016: 4.0 percent), and 6.4 percent for the CNY/CNH (2016: 3.6 percent). The results of these scenarios were as follows:
USD sensitivity analysis T121
in € million
Dec. 31, 2017 Dec. 31, 2016
Impact on income
Impact on equity
Impact on income
Impact on equity
+ 5 % – – 28 – 1 – 60
− 5 % – 28 1 60
+ 10 % 1 – 57 – 2 – 120
− 10 % – 1 57 2 120
CNY/CNH sensitivity analysis T122
in € million
Dec. 31, 2017 Dec. 31, 2016
Impact on income
Impact on equity
Impact on income
Impact on equity
+ 5 % 1 – 3 – 1 – 10
− 5 % – 1 3 1 10
+ 10 % 2 – 7 – 1 – 19
− 10 % – 2 7 1 19
Several scenarios were also simulated for interest rates. These analyzed shifts of 50, 100, and 150 basis points in EUR interest rates or the EUR interest rate curve to simulate the possible loss of value of derivative and non-derivative financial instruments. The scenarios are summarized in the table:
EUR interest rate sensitivity analysis T123
in € million
Dec. 31, 2017 Dec. 31, 2016
Impact on income
Impact on equity
Impact on income
Impact on equity
+ 50 basis points – – 8 1 3
– 50 basis points – 9 – 1 – 3
+ 100 basis points – – 17 3 5
– 100 basis points – 17 – 3 – 5
+ 150 basis points – – 25 4 8
– 150 basis points – 26 – 4 – 8
Commodity risks result from changes in the market prices for the purchase and sale of raw materials. Raw materials were purchased principally to meet in-house demand. Other factors of importance for Evonik’s risk position are the avail-ability and price of relevant raw materials, starting products, and intermediates. In particular, raw material prices of signif-icance to the Evonik Group are dependent on exchange rates and the price of crude oil. Commodity management, which is the responsibility of the segments, involves identifying pro-curement risks and defining effective measures to minimize them. For example, price escalation clauses and swaps are used to reduce price volatility. Pricing and procurement risks are reduced through worldwide procurement and optimized processes to ensure immediate sourcing of additional raw material requirements. Further, use of alternative raw materials is examined for various production processes and Evonik is working on the development of alternative production tech-nologies.
Financial derivatives were also used on a small scale to hedge procurement price risks. If the price of natural gas had been 10 percent higher or lower, the impact of the fluctuation in the value of the commodity derivatives on the other com-prehensive income from gains/losses from hedging instru-ments would have been +€1 million or – €1 million at year-end 2017 (2016: +€2 million or – €2 million). If the price of naphtha-based petrochemical feedstocks had been 10 percent higher or lower, the impact of the fluctuation in the value of the commodity derivatives on the hedge reserve as of the reporting date would have been +€4 million or – €4 million at year-end 2017 (2016: +€5 million or – €5 million). As in 2016, in both cases the impact on income would have been negligible.
153
NotesOther disclosures
CORPORATE GOVERNANCEMANAGEMENT REPORT SUPPLEMENTARY INFORMATION CONSOLIDATED FINANCIAL STATEMENTS

(b) Liquidity riskLiquidity risk is managed through business planning to ensure that the funds required to finance the current operating business and current and future investments in all Group companies are available at the right time and in the right currency at opti-mum cost. Liquidity requirements for business operations, investments, and other financial activities are derived from a financing status and liquidity planning, which form part of liquidity risk management. Liquidity is pooled in a central cash management pool where this makes economic sense and is legally permissible. Central liquidity risk management facilitates low-cost borrowing and advantageous offsetting of financial requirements.
As of December 31, 2017, Evonik had cash and cash equiv-alents amounting to €1,004 million. Alongside cash and cash
equivalents and investments in current securities, Evonik’s central source of liquidity is a €1.75 billion revolving credit facility from a syndicate of 18 national and international banks. This credit line has an initial term running until 2022 with two extension options of one year each, so it runs until June 2024 at the latest. It was not utilized in 2017 and does not contain any covenants requiring Evonik to meet specific financial ratios.
Further, as of December 31, 2017, various unused credit lines totaling €306 million were available to meet local requirements, especially in the Asia-Pacific region.
The table shows the remaining maturity of the non- derivative financial instruments based on the agreed dates for interest and redemption payments:
Remaining maturity of non-derivative financial instruments 2017 T124
in € million
Payments due inDec. 31, 2017
up to 1 year
more than 1 and up to
3 years
more than 3 and up to
5 yearsmore than
5 years
Financial liabilities 385 617 1,220 2,044 4,266
Bonds 34 568 1,199 2,036 3,837
Liabilities to banks 280 49 21 8 358
Loans from non-banks 18 – – – 18
Other financial liabilities 53 – – – 53
Trade accounts payable 1,449 – – – 1,449
Remaining maturity of non-derivative financial instruments 2016 T125
in € million
Payments due inDec. 31, 2016
up to 1 year
more than 1 and up to
3 years
more than 3 and up to
5 yearsmore than
5 years
Financial liabilities 338 104 1,234 2,075 3,751
Bonds 23 47 1,188 2,050 3,308
Liabilities to banks 280 47 46 25 398
Loans from non-banks 16 – – – 16
Other financial liabilities 19 10 – – 29
Trade accounts payable 1,212 – – – 1,212
A disclosure on the maturity of existing financial guarantees can be found in the section on risk of default below. The Group met all payment terms agreed for its financial liabilities.
154 FINANCIAL REPORT 2017 EVONIK INDUSTRIES

The breakdown of the sum of interest and redemption pay-ments by maturity in the following table relates to derivative financial instruments with positive and negative fair values. The tables show the net value of cash inflows and outflows.
Since netting was not agreed for forward exchange contracts, currency swaps, interest rate swaps, and cross-currency interest rate swaps, they are presented as gross amounts:
Remaining maturity of derivative financial instruments 2017 T126
in € million
Payments due inDec. 31, 2017
up to 1 year
more than 1 and up to
3 yearsmore than
3 years
Receivables from derivatives 49 24 60 133
Cross-currency interest rate swaps – 32 27 60 55
Cash inflows 10 848 632 1,490
Cash outflows – 42 – 821 – 572 – 1,435
Forward exchange contracts and currency swaps 80 – 3 – 77
Cash inflows 2,357 207 – 2,564
Cash outflows – 2,277 – 210 – – 2,487
Commodity derivatives 1 – – 1
Liabilities from derivatives – 26 – 28 – 1 – 55
Interest rate swaps 1 – 2 – 1 – 2
Cross-currency interest rate swaps – 10 – 22 – – 32
Cash inflows 47 279 – 326
Cash outflows – 57 – 301 – – 358
Forward exchange contracts and currency swaps – 17 – 3 – – 20
Cash inflows 1,314 55 – 1,369
Cash outflows – 1,331 – 58 – – 1,389
Commodity derivatives – – 1 – – 1
Remaining maturity of derivative financial instruments 2016 T127
in € million
Payments due inDec. 31, 2016
up to 1 year
more than 1 and up to
3 yearsmore than
3 years
Receivables from derivatives 1,973 205 – 15 2,163
Cross-currency interest rate swaps – 4 – 8 – 15 – 27
Cash inflows 5 34 136 175
Cash outflows – 9 – 42 – 151 – 202
Forward exchange contracts, currency options, and currency swaps 1,974 213 – 2,187
Cash inflows 4,293 725 – 5,018
Cash outflows – 2,319 – 512 – – 2,831
Commodity derivatives 3 – – 3
Liabilities from derivatives – 125 – 138 – 77 – 340
Cross-currency interest rate swaps – 22 – 57 – – 79
Cash inflows 56 339 – 395
Cash outflows – 78 – 396 – – 474
Forward exchange contracts, currency options, and currency swaps – 103 – 76 – 77 – 256
Cash inflows 2,338 671 413 3,422
Cash outflows – 2,441 – 747 – 490 – 3,678
Commodity derivatives – – 5 – – 5
155
NotesOther disclosures
CORPORATE GOVERNANCEMANAGEMENT REPORT SUPPLEMENTARY INFORMATION CONSOLIDATED FINANCIAL STATEMENTS

Receivables from cross-currency interest rate swaps comprise transactions with negative net cash flows resulting from positive inflows in euros and negative outflows in foreign currencies. In the overview for 2017, in the maturity bracket up to one year, the foreign currency outflows translated into euros exceeded the actual euro inflows. As a result of the translation and discounting of the higher notional value of the swap in later maturity brackets, overall the fair value of the cross-currency interest swaps is positive. In 2016, the foreign currency outflows translated into euros exceeded the actual euro inflows in all maturity brackets. Since interest rates in foreign currencies were higher, discounting resulted in a pos-itive fair value and thus a positive overall carrying amount for the instruments overall despite the negative net cash flows.
(c) Risk of defaultCredit risk management divides default risks into three cate-gories, which are analyzed separately on the basis of their specific features. The three categories are debtor and creditor risk, country risk, and the risk of default by financial counter-parties.
The debtor and creditor default risks are analyzed and monitored continuously with the aid of an internal limit sys-tem. Political risk (country risk) is also taken into account for export orders so that the overall risk assessment takes account of both political and economic risk factors. On the basis of this analysis, a maximum risk exposure limit is set for
the contracting party. The credit standing of contracting par-ties is updated constantly via ratings or scoring processes.
In addition, a specific limit is set for financial counter-parties for each type of risk (money market, capital market, and derivatives). Maximum limits for each contracting party are set on the basis of the creditworthiness analyses. These are predominantly based on the ratings issued by international rating agencies and our own internal credit analysis. In addition, the development of the price of credit default swaps and equity prices (where available) is analyzed. Country limits are set for the money and capital markets to ensure diversification of country risks.
Credit management also covers derivative financial instru-ments, where the risk of default is equivalent to the positive fair value. This risk is minimized by setting high standards for the creditworthiness of counterparties. Only common instru-ments found on the market with sufficient liquidity are used. Consequently, no material risk of default is expected in this field. As for non-derivative financial instruments, there is also a default risk amounting to the positive fair value. This can be minimized by regular creditworthiness reviews. We do not anticipate any material risk of default here either.
Evonik concludes master netting arrangements and similar agreements for financial derivatives on a limited scale. These mainly come into effect in the event of the insolvency of a counterparty. The resulting net positions of receivables and liabilities from derivatives are presented in the following table:
Offsetting rights for financial assets and liabilities T128
in € million
Receivables from derivatives
Liabilities from derivatives
Dec. 31, 2017
Dec. 31, 2016
Dec. 31, 2017
Dec. 31, 2016
Netting of financial assets/liabilities
Gross amount of transactions affected by netting arrangements 246 296 30 185
Amounts set off in accordance with IAS 32 – – – –
Amounts recognized for the relevant transactions 246 296 30 185
Affected by enforceable master netting arrangements or similar arrangements
Receivables/liabilities that do not fully meet the offsetting criteria 26 111 26 111
Amounts related to financial collateral – – – –
Net amount 220 185 4 74
Further, there is a default risk relating to the granting of financial guarantees. As of the reporting date, guarantees with a total nominal value of €37 million (2016: €44 million) had been granted. This is also the maximum default risk; see Note 9.3. In principle these guarantees can be called in full at any time during their residual term (2018 or 2023) as soon as
the contractual conditions are met. At present, there is no indication that these financial guarantees will result in a loss.
Owing to the diversity of business and the large number of customers and financial counterparties, there were no signif-icant cluster risks.
156 FINANCIAL REPORT 2017 EVONIK INDUSTRIES

9.3 Related parties
In addition to the subsidiaries included in the consolidated financial statements, the Group maintains relationships with related parties.
Related parties comprise RAG-Stiftung, Essen (Germany) as a shareholder of Evonik Industries AG, due to its controlling influence, fellow subsidiaries of Evonik owned by RAG-Stiftung, and associated companies and joint ventures of Evonik which are recognized at equity.
Business relations with related parties T129
in € million
R AG-Stiftung Fellow subsidiaries Joint ventures Associates
2017 2016 2017 2016 2017 2016 2017 2016
Goods and services supplied – – 1 2 27 27 5 4
Goods and services received – – – 22 – 13 – 4 – – 1 – 1
Other income – – – – 1 – 7 9
Receivables as of December 31 – – – – 5 2 – –
Liabilities as of December 31 – – – – – 14 – – –
Contingent liabilities as of December 31 – – – – – 37 -44 – –
The dividend for fiscal 2016 was paid in the second quarter of 2017, following the adoption of the resolution by the Annual Shareholders’ Meeting on May 23, 2017. RAG-Stiftung, Essen (Germany) received €364 million.
In 2017, Evonik received dividends of €8 million (2016: €9 million), mainly from associates.
The contingent liabilities recognized as of December 31, 2017 comprise €37 million relating to a joint venture and result mainly from a guarantee of €33 million granted to secure a loan for the joint venture Saudi Acrylic Polymers Company, Ltd., Jubail (Saudi Arabia). In addition, two guarantees total-ing €4 million were provided as collateral for a facility for hedging transactions at the joint venture CyPlus Idesa, S.A.P.I. de C.V., Mexico City (Mexico).
The Federal Republic of Germany and the federal states of North Rhine-Westphalia and the Saarland are also classified as related parties as they are able to exercise a significant influence on RAG-Stiftung through their membership of the Board of Trustees of RAG-Stiftung.
Transactions effected between Evonik and these federal and state governments and their subsidiaries or joint ventures in the reporting period comprised generally available govern-ment grants and subsidies and investments in their securities. Furthermore, customary business relationships were maintained with the Deutsche Bahn Group and the Duisport Group.
Individuals defined as related parties include members of the management who are directly or indirectly responsible for corporate planning, management, and oversight, and members of their families. At Evonik, these parties comprise members of the Executive Board and Supervisory Board of Evonik Industries AG, members of the Executive Board and Board of Trustees of RAG-Stiftung, and other management members who hold key positions in the Group.
Remuneration paid to related parties T130
in €'000
Executive Board of Evonik Industries AG
Supervisory Board of Evonik Industries AG
Other management members
2017 2016 2017 2016 2017 2016
Short-term remuneration 8,620 9,194 3,170 3,239 13,803 14,789
Share-based payment 5,108 1,881 – – 1,529 1,446
Current service cost for pensions and other post-employment benefits 1,482 1,116 – – 1,660 4,169
Termination benefits 9,660 – – – – –
157
NotesOther disclosures
CORPORATE GOVERNANCEMANAGEMENT REPORT SUPPLEMENTARY INFORMATION CONSOLIDATED FINANCIAL STATEMENTS

Short-term remuneration comprises both amounts not related to performance and short-term performance-related payments.
As of December 31, 2017, there were provisions of €3,148 thousand (2016: €4,269 thousand) for short-term performance-related remuneration of members of the Exec-utive Board and €9,521 thousand (2016: €9,634 thousand) for other management members.
At year-end 2017, provisions for share-based payment amounted to € 4,501 thousand (2016: €6,231 thousand) for the Executive Board and €4,471 thousand (2016: €3,282 thousand) for other management members.
The information on share-based payment relates to expenses for fiscal 2017 for the LTI tranches 2012 through 2017 for the Executive Board and LTI tranches 2013 through 2017 for other management members.
The present value of pension obligations (defined benefit obligations) was €14,713 thousand (2016: €33,973 thousand) for the Executive Board and €26,683 thousand (2016: €24,568 thousand) for other members of the management.
Further, the employee representatives elected to the Supervisory Board of Evonik Industries AG continued to receive the regular salary agreed in their employment con-tract. The level of their salary provided appropriate remuner-ation for the exercise of their functions and tasks in the com-pany.
Apart from the relationships stated above, Evonik did not have any other significant business relationships with related parties.
9.4 Contingent liabilities, contingent receivables, and other financial commitments
Contingent liabilities, except for those recognized in connection with a business combination, are possible or present obligations arising from past events where an outflow of resources is not improbable but which are not recognized on the balance sheet.
Contingent liabilities mainly comprise guarantee and war-ranty obligations totaling €59 million (2016: €68 million). They include a guarantee of €37 million in favor of joint ven-tures, see Note 9.3, and indemnity obligations of €10 million in connection with divestments, which expired in the period up to December 31, 2017.
Through its corporate venture capital activities, the Evonik Group also invests indirectly in specialized technology funds. Evonik holds between 0.82 percent and 25 percent of the respective (sub-)fund assets and recognizes them in financial assets as other investments with a total carrying amount of €11 million. As a result of contractual agreements, there are obligations to make payments into the fund assets of a maxi-mum of €17 million at the request of the fund management companies. The maximum default risk arising from these investments is the sum of the carrying amounts on the balance sheet and the outstanding payment obligations. There is no intention of providing further financial or other support.
Furthermore, following completion of administrative pro-ceedings outside Germany, it is not improbable that individual customers could file claims for compensation. Since the prob-ability is considered to be low, Evonik is of the opinion that the risk is in the low double-digit million euro range.
There were no contingent receivables as of December 31, 2017.
Other financial commitments result from non-onerous executory contracts, continuous obligations, statutory requirements, and other commercial obligations that are not already included in the liabilities shown on the balance sheet or in contingent liabilities.
The other financial commitments are order commitments for the purchase of intangible assets, property, plant and equip-ment, and operating lease liabilities where Evonik is the lessee.
As of the reporting date, the Group had commitments of €1 million (2016: €0 million) to purchase intangible assets and of €191 million (2016: €162 million) to purchase property, plant and equipment.
The financial obligations from leases result from operating leases where Evonik is the lessee. These are mainly rents for land and buildings, plant, and office furniture and equipment. The table shows the nominal value of obligations from future minimum lease payments for leased assets with the following payment terms:
158 FINANCIAL REPORT 2017 EVONIK INDUSTRIES

Maturity structure of future minimum lease payments (lessee; operating leases) T131
in € million 2017 2016
Due within 1 year 110 109
Due in more than 1 and up to 5 years 281 295
Due in more than 5 years 229 262
620 666
Prior-year figures restated.
Total payments of €142 million (2016: €131 million) were recognized as expense for operating leases in the reporting period. These include minimum lease payments of €131 million (2016: €120 million) and, as in 2016, contingent lease payments of €11 million. The expected future minimum lease payments for sub-leasing agreements amounts to €3 million (2016: €4 million).
9.5 Events after the reporting date
No material events have occurred since the reporting date.
10. Disclosures in compliance with German legislation
10.1 Information on shareholdings pursuant to Section 313 Paragraph 2 of the German Commercial Code (HGB)
The overview of all companies included in the consolidated financial statements and full details of the shareholdings in accordance with Section 313 Paragraph 2 of the German Commercial Code (HGB), along with details of the subsid-iaries that are exempt from the obligation to prepare and publish financial statements, forms part of the audited consoli-dated financial statements submitted to the electronic Federal Gazette (Bundesanzeiger).
The complete list of shareholdings is also available on the internet.1
Disclosure pursuant to Section 313 Paragraph 2 No. 5 of the German Commercial Code (HGB):Evonik holds more than 5 percent of the voting rights in the following company, which is defined as a large stock corpo-ration in accordance with Section 267 Paragraph 3 of the German Commercial Code (HGB): Borussia Dortmund GmbH & Co. KGaA, Dortmund (Germany) (shareholding: 14.78 percent; fiscal year 2016/2017: income after taxes: €6.3 million; equity: €348 million).
10.2 Personnel expense and number of employees pursuant to Section 314 Paragraph 1 No. 4 of the German Commercial Code (HGB)
Personnel expense T132
in € million 2017 2016
Wages and salaries 2,665 2,498
Social security contributions 404 377
Pension expenses 229 205
Other personnel expense 76 48
3,374 3,128
Wages and salaries also include expenses related to restruc-turing.
The net interest expense for pension provisions is shown in the financial result; see Note 5.6.
The table shows the annual average headcount for the con-tinuing operations:
Headcount (annual average) T133
No. of employees 2017 2016
Nutrition & Care 8,491 7,443
Resource Efficiency 9,493 8,787
Performance Materials 4,401 4,387
Services 12,811 12,769
Corporate, other operations 607 519
35,803 33,905
The companies included in the consolidated financial state-ments on a pro rata basis do not have any employees.
1 www.evonik.com/list-of-shareholdings.
159CORPORATE GOVERNANCEMANAGEMENT REPORT SUPPLEMENTARY INFORMATION CONSOLIDATED FINANCIAL STATEMENTS
NotesOther disclosuresDisclosures in compliance with German legislation

10.3 Remuneration of the Executive Board and Supervisory Board pursuant to Section 314 Paragraph 1 No. 6 of the German Commercial Code (HGB)
Remuneration paid to the members of the Executive Board of Evonik Industries AG for their work in 2017, including two members who resigned, amounted to €11,296 thousand (2016: €12,167 thousand). The figure for 2017 includes bonus payments of €178 thousand for the previous year, for which no provision was established in 2016.
Further details, including an individual breakdown of remuneration, can be found in the remuneration report in the combined management report.
Total remuneration of former members of the Executive Board, including those who resigned in the fiscal year, and their surviving dependents, was €11,492 thousand in 2017 (2016: €1,722 thousand).
As of the balance sheet date, the present value of pension obligations (defined benefit obligations) for former members of the Executive Board and those who left in 2017, and their surviving dependents, amounted to €79,626 thousand (2016: €55,220 thousand).
The remuneration of the Supervisory Board for 2017 totaled €3,170 thousand (2016: €3,239 thousand).
10.4 Declaration on the German Corporate Governance Code
In December 2017, the Executive Board and Supervisory Board of Evonik Industries AG submitted the declaration required by Section 161 of the German Stock Corporation Act (AktG)
and made it permanently available to the public on the com-pany’s website.1
10.5 Auditor’s fees pursuant to Section 314 Paragraph 1 No. 9 of the German Commercial Code (HGB)
The auditor for the consolidated financial statements of the Evonik Group was PricewaterhouseCoopers GmbH Wirtschaftsprüfungsgesellschaft (PwC), Düsseldorf (Germany).
The fees charged by the PwC group for auditing financial statements mainly comprised expenses for the statutory audit of the separate and consolidated financial statements of Evonik Industries AG and its German and foreign subsidiaries, reviews of consolidated interim financial statements,
audit-related support in connection with the implementation of new financial reporting standards, and the audit of infor-mation systems and processes. The fees recognized as other audit-related services mainly relate to services in connection with regulatory and statutory requirements. The other services were principally project-related consultancy services in con-nection with the optimization and management of business processes.
Auditor’s fees T134
in € million
Germany Other countries Total fees
2017 2016 2017 2016 2017 2016
Auditing of financial statements 4.8 6.1 7.8 4.7 12.6 10.8
Other audit-related services 0.1 0.3 – – 0.1 0.3
Tax consultation services – – – 0.1 – 0.1
Other services 2.2 2.3 – – 2.2 2.3
7.1 8.7 7.8 4.8 14.9 13.5
1 www.evonik.com/declaration-on-corporate-governance
160 FINANCIAL REPORT 2017 EVONIK INDUSTRIES

Responsibility statement
To the best of our knowledge, and in accordance with the applicable reporting principles, the consolidated financial statements give a true and fair view of the assets, liabilities, financial position, and profit or loss of the Group in accor-dance with German accepted accounting principles and the management report for the Group, which is combined with the management report for Evonik Industries AG, includes a fair review of the development and performance of the business and the position of the Group, together with a description of the material opportunities and risks associated with the expected development of the Group.
Essen, February 19, 2018
Evonik Industries AGThe Executive Board
Kullmann Dr. Schwager
Wessel Wolf
161
NotesResponsibility statement
CORPORATE GOVERNANCEMANAGEMENT REPORT SUPPLEMENTARY INFORMATION CONSOLIDATED FINANCIAL STATEMENTS

SUPPLEMENTARY INFORMATION
Independent Auditor’s Report 163
Market positions 169
Growth engines 170
Glossary 171
Alternative Parformance Measures 174
Financial calendar 174
Credits 175
162 FINANCIAL REPORT 2017 EVONIK INDUSTRIES

Independent auditor’s reportTo Evonik Industries AG, Essen
Report on the audit of the consolidated financial statements and of the group management report Audit OpinionsWe have audited the consolidated financial statements of Evonik Industries AG, Essen, and its subsidiaries (the Group), which comprise the consolidated statement of financial position as at 31 December 2017, and the consolidated statement of comprehensive income, consolidated statement of profit or loss, consolidated statement of changes in equity and consolidated statement of cash flows for the financial year from 1 January to 31 December 2017, and notes to the consolidated financial statements, including a summary of significant accounting policies. In addition, we have audited the group management report of Evonik Industries AG, which is combined with the Company’s management report, for the financial year from 1 January to 31 December 2017. We have not audited the content of those parts of the group management report listed in the “Other Information” section of our auditor’s report in accordance with the German legal requirements.
In our opinion, on the basis of the knowledge obtained in the audit,• the accompanying consolidated financial statements comply,
in all material respects, with the IFRSs as adopted by the EU, and the additional requirements of German commercial law pursuant to § [Article] 315e Abs. [paragraph] 1 HGB [Handelsgesetzbuch: German Commercial Code] and, in compliance with these requirements, give a true and fair view of the assets, liabilities, and financial position of the Group as at 31 December 2017, and of its financial perfor-mance for the financial year from 1 January to 31 Decem-ber 2017 and
• the accompanying group management report as a whole provides an appropriate view of the Group’s position. In all material respects, this group management report is consistent with the consolidated financial statements, complies with German legal requirements and appropriately presents the opportunities and risks of future de velopment. Our audit opinion on the group management report does not cover the content of those parts of the group manage-ment report listed in the “Other Information” section of our auditor’s report.
Pursuant to § 322 Abs. 3 Satz [sentence] 1 HGB, we declare that our audit has not led to any reservations relating to the legal compliance of the consolidated financial statements and of the group management report.
Basis for the Audit Opinions We conducted our audit of the consolidated financial state-ments and of the group management report in accordance with § 317 HGB and the EU Audit Regulation (No. 537/2014, referred to subsequently as “EU Audit Regulation”) and in compliance with German Generally Accepted Standards for Financial Statement Audits promulgated by the Institut der Wirtschaftsprüfer [Institute of Public Auditors in Germany] (IDW). We performed the audit of the consolidated financial statements in supplementary compliance with the Interna-tional Standards on Auditing (ISAs). Our responsibilities under those requirements, principles and standards are further described in the “Auditor’s Responsibilities for the Audit of the Consolidated Financial Statements and of the Group Management Report” section of our auditor’s report. We are independent of the group entities in accordance with the requirements of European law and German commercial and professional law, and we have fulfilled our other German professional responsibilities in accordance with these require-ments. In addition, in accordance with Article 10 (2) point (f) of the EU Audit Regulation, we declare that we have not pro-vided non-audit services prohibited under Article 5 (1) of the EU Audit Regulation. We believe that the audit evidence we have obtained is sufficient and appropriate to provide a basis for our audit opinions on the consolidated financial state-ments and on the group management report.
Key Audit Matters in the Audit of the Consolidated Financial Statements Key audit matters are those matters that, in our professional judgment, were of most significance in our audit of the consolidated financial statements for the financial year from January 1 to December 31, 2017. These matters were addressed in the context of our audit of the consolidated financial statements as a whole, and in forming our audit opinion thereon; we do not provide a separate audit opinion on these matters. In our view, the matters of most significance in our audit were as follows:1 Recoverability of goodwill2 Pension provisions3 Corporate transactions
Our presentation of these key audit matters has been structured in each case as follows:1 Matter and issue2 Audit approach and findings3 Reference to further information
163
Independent auditor’s report
CORPORATE GOVERNANCEMANAGEMENT REPORT CONSOLIDATED FINANCIAL STATEMENTS SUPPLEMENTARY INFORMATION .

Hereinafter we present the key audit matters:
1 Recoverability of goodwill1 In the consolidated financial statements of Evonik Industries
AG, goodwill amounting in total to EUR 4.6 billion is reported under the “Intangible assets” balance sheet item, representing 23 percent of consolidated total assets. Goodwill is tested for impairment on the measurement reporting date or when there are indications that goodwill may be impaired. The result of this measurement depends to a large extent on the executive directors’ assessment of future cash inflows and the discount rate used and is subject to considerable uncertainty. Against this background and due to the underlying complexity of the measurement of this significant item in terms of its amount, this matter was of particular significance for our audit.
2 As part of our audit, we assessed the methodology used for the purposes of performing the impairment tests, among other things. We assessed the appropriateness of the expected future cash inflows used in the impairment tests in financial year 2017, among other things, by comparing this data with the current budgets in the medium-term business plan adopted by the executive directors and approved by the supervisory board, and by reconciling it with general and sector-specific market expectations. We discussed supplementary adjust-ments to the medium-term plan for the purposes of the impairment test with the specialist departments responsible and assessed their appropriateness. In addition we assessed the appropriate consideration of the costs for group functions. With the knowledge that even relatively small changes in the discount rate applied can have material effects on the value of the entity calculated using this method, we focused our testing in particular on the determination of the parameters used for the discount rate applied, including the average cost of capital, and evaluated the measurement model. Due to the materiality of goodwill and the fact that its measurement also depends on economic conditions which are outside of the Company’s sphere of influence, in addition to the Company’s analyses we carried out our own sensitivity analyses for the cash-generating units and found, based on the information available, that the respective items of goodwill are suffi-ciently covered by the discounted future net cash inflows. Overall, the measurement parameters and assumptions used by the executive directors are in line with our expectations and are also within the ranges considered by us to be reasonable.
3 The Company's disclosures on goodwill are contained in sections 6.1 and 6.4 of the notes to the consolidated financial statements. 2 Pension provisions1 In the consolidated financial statements of Evonik Industries
AG, pension provisions of EUR 3.8 billion and a net pension asset of EUR 0.2 billion are reported. For all defined benefit pension plans, the present value of the obligations amounts to EUR 11.6 billion, the fair value of the plan assets EUR 8.1 billion and the effect of the asset ceiling EUR 0.1 billion. Most of these amounts relate to pension commitments in Germany, the USA and the United Kingdom, with a smaller amount of additional obligations from medical care plans in the USA. Obligations from defined-benefit pension plans and the med-ical care plans are measured using the projected unit credit method in accordance with IAS 19. This requires assumptions to be made in particular about long-term salary and pension increases and average life expectancy, as well as the cost trend for medical care plans. Furthermore, the discount rate applied as of the balance sheet date must be determined by reference to market yields on high-quality corporate bonds with matching currencies and terms which are consistent with the expected maturities of the obligations. Changes to these actuarial assumptions are recognized in other compre-hensive income as actuarial gains or losses. Actuarial losses arising in respect of the obligations in the past financial year amounted to EUR 0.1 billion. In our view, these matters were of particular significance in the context of our audit because the recognition and measurement of this significant item in terms of its amount are based to a large extent on estimates and assumptions made by the executive directors.
2 Our audit included evaluating the actuarial expert reports obtained by the respective Group companies and the technical competence of the actuarial expert, among other things. Given the special features of the actuarial calculations, we received support from our internal pension specialists for this purpose. With their assistance, we assessed whether the valuation methods on which the valuations were based as well as the valuation parameters used were appropriate and com-plied with the relevant standards. In addition, we analyzed the development of the obligations and the cost components on the basis of the actuarial expert reports in the light of changes occurring in the valuation parameters and the changes in the numerical data, and assessed their plausibility.
164 FINANCIAL REPORT 2017 EVONIK INDUSTRIES

Finally, we reconciled the accounting entries for the provi-sions and the disclosures in the notes based on the actuarial expert reports. We evaluated an internal company valuation available to us for the audit of the fair value of the equity interest in Vivawest GmbH contained in the plan assets. We also obtained bank confirmations for the fair values of the quoted securities held directly, fund units and bank balances included in the plan assets. In the case of quoted securities for which the bank confirmations did not include fair values, unquoted bonds and structured products held directly as well as fund units, we assessed the methods on which the respective valuation was based and the valuation parameters used on a sample basis with the assistance of our internal specialists. Based on our audit procedures, we were able to satisfy our-selves that the estimates applied and assumptions made by the executive directors were justified and sufficiently documented.
3 The Company’s disclosures relating to the pension provi-sions are contained in note 6.9 to the consolidated financial statements.
3 Corporate transactions1 Evonik Industries AG acquired the specialty additives busi-
ness (Performance Materials Division) of Air Products and Chemicals, Inc., Allentown, USA, on 3 January 2017. The acquisition took the form both of asset deals and the purchase of 100 percent of the shares in each of six companies (share deals). The specialty additives business has been integrated into the Group’s “Nutrition & Care” and “Resource Efficiency” segments. In addition to the acquisition of the specialty addi-tives business, a services agreement with a limited term until the end of the year 2017 was concluded between Evonik Industries AG and Air Products and Chemicals, Inc., covering services relating to finance, accounting and tax, and IT pro-vided by Air Products and Chemicals, Inc., for the specialty additives business purchased, among other things. On 1 October 2017, the comprehensive technical migration of the asset and share deals to Evonik Industries AG’s systems took place. The purchase price for the specialty additives business was EUR 3.5 billion. The identified assets and liabilities must normally be recognized at fair value as of the acquisition date. This resulted in purchased goodwill of EUR 1.9 billion. Intan-gible assets amounting to EUR 0.9 billion were also recog-nized in the course of allocating the purchase price.
As of 1 September 2017, Evonik Industries AG acquired the silica business of J. M. Huber Corporation, Atlanta (Georgia), USA. The acquisition took the form of asset deals and the purchase of 100 percent of the shares in each of four compa-nies (share deals). The purchase price was EUR 550 million. The resulting purchased goodwill amounted to EUR 183 million. Intangible assets amounting to EUR 200 million were also
recognized in the context of allocating the purchase price. In addition to the acquisition of the silica business, a services agreement with a limited term was also concluded between Evonik Industries AG and J. M. Huber Corporation, covering services relating to finance, accounting, tax, human resources, sales, purchasing, and IT provided by J. M. Huber Corporation for the business purchased, among other things.
In view of the material overall impact of these acquisitions on the assets, liabilities, financial position, and financial per-formance of the Evonik Group and given the complexity of measuring the acquisitions, these matters were of particular significance in the context of our audit.
2 For the purpose of auditing the accounting treatment of the company transactions, we initially inspected and assessed the respective contractual agreements underlying the acqui-sitions. In this connection, we reconciled the purchase prices paid by Evonik Industries AG as consideration for the assets received with the supporting documentation for the pay-ments made provided to us, among other procedures. We assessed the opening balance sheets underlying the afore-mentioned company acquisitions. We evaluated centrally calculated fair values (e.g. for customer relationships) by assessing the reasonableness of the assumptions in the busi-ness plan on the basis of market expectations, due diligence reports and discussions with the Company and its advisers. We also used checklists to establish whether the require-ments set out in IFRS 3 for disclosures in the notes to the consolidated financial statements had been complied with in full. In total, based on these and other audit procedures and the information available to us, we were able to satisfy our-selves that the company transactions described have been appropriately presented.
3 The Company’s disclosures relating to corporate trans-actions are contained in note 4.2 to the consolidated financial statements.
Other InformationThe executive directors are responsible for the other infor-mation. The other information comprises the following non-audited parts of the group management report:• the statement on corporate governance pursuant to
§ 289f HGB and § 315d HGB included in section “ Corporate governance report and declaration on corporate gover-nance” of the group management report
• the corporate governance report pursuant to No. 3.10 of the German Corporate Governance Code
• the separate non-financial report pursuant to § 289b Abs. 3 HGB and § 315b Abs. 3 HGB
165
Independent auditor’s report
CORPORATE GOVERNANCEMANAGEMENT REPORT CONSOLIDATED FINANCIAL STATEMENTS SUPPLEMENTARY INFORMATION .

The other information comprises further the remaining parts of the finance report – excluding cross-references to external information – with the exception of the audited consolidated financial statements, the audited group management report and our auditor’s report.
Our audit opinions on the consolidated financial statements and on the group management report do not cover the other information, and consequently we do not express an audit opinion or any other form of assurance conclusion thereon.
In connection with our audit, our responsibility is to read the other information and, in so doing, to consider whether the other information• is materially inconsistent with the consolidated financial
statements, with the group management report or our knowledge obtained in the audit, or
• otherwise appears to be materially misstated.
If, based on the work we have performed, we conclude that there is a material misstatement of this other information, we are required to report that fact. We have nothing to report in this regard.
Responsibilities of the Executive Directors and the Supervisory Board for the Consolidated Financial Statements and the Group Management ReportThe executive directors are responsible for the preparation of the consolidated financial statements that comply, in all mate-rial respects, with IFRSs as adopted by the EU and the addi-tional requirements of German commercial law pursuant to § 315e Abs. 1 HGB and that the consolidated financial state-ments, in compliance with these requirements, give a true and fair view of the assets, liabilities, financial position, and financial performance of the Group. In addition the executive directors are responsible for such internal control as they have determined necessary to enable the preparation of con-solidated financial statements that are free from material mis-statement, whether due to fraud or error.
In preparing the consolidated financial statements, the exec-utive directors are responsible for assessing the Group’s ability to continue as a going concern. They also have the responsi-bility for disclosing, as applicable, matters related to going concern. In addition, they are responsible for financial report-ing based on the going concern basis of accounting unless
there is an intention to liquidate the Group or to cease oper-ations, or there is no realistic alternative but to do so.
Furthermore, the executive directors are responsible for the preparation of the group management report that, as a whole, provides an appropriate view of the Group’s position and is, in all material respects, consistent with the consoli-dated financial statements, complies with German legal requirements, and appropriately presents the opportunities and risks of future development. In addition, the executive directors are responsible for such arrangements and measures (systems) as they have considered necessary to enable the preparation of a group management report that is in accor-dance with the applicable German legal requirements, and to be able to provide sufficient appropriate evidence for the assertions in the group management report.
The supervisory board is responsible for overseeing the Group’s financial reporting process for the preparation of the consolidated financial statements and of the group management report.
Auditor’s Responsibilities for the Audit of the Consolidated Financial Statements and of the Group Management Report Our objectives are to obtain reasonable assurance about whether the consolidated financial statements as a whole are free from material misstatement, whether due to fraud or error, and whether the group management report as a whole provides an appropriate view of the Group’s position and, in all material respects, is consistent with the consolidated financial statements and the knowledge obtained in the audit, complies with the German legal requirements and appropri-ately presents the opportunities and risks of future develop-ment, as well as to issue an auditor’s report that includes our audit opinions on the consolidated financial statements and on the group management report.
Reasonable assurance is a high level of assurance, but is not a guarantee that an audit conducted in accordance with § 317 HGB and the EU Audit Regulation and in compliance with German Generally Accepted Standards for Financial Statement Audits promulgated by the Institut der Wirtschaftsprüfer (IDW) and supplementary compliance with the ISAs will always detect a material misstatement. Misstatements can arise from fraud or error and are consid-ered material if, individually or in the aggregate, they could reasonably be expected to influence the economic decisions of users taken on the basis of these consolidated financial statements and this group management report.
166 FINANCIAL REPORT 2017 EVONIK INDUSTRIES

We exercise professional judgment and maintain professional skepticism throughout the audit. We also:• Identify and assess the risks of material misstatement of
the consolidated financial statements and of the group management report, whether due to fraud or error, design and perform audit procedures responsive to those risks, and obtain audit evidence that is sufficient and appropriate to provide a basis for our audit opinions. The risk of not detecting a material misstatement resulting from fraud is higher than for one resulting from error, as fraud may involve collusion, forgery, intentional omissions, mis-representations, or the override of internal control.
• Obtain an understanding of internal control relevant to the audit of the consolidated financial statements and of arrangements and measures (systems) relevant to the audit of the group management report in order to design audit procedures that are appropriate in the circum-stances, but not for the purpose of expressing an audit opinion on the effectiveness of these systems.
• Evaluate the appropriateness of accounting policies used by the executive directors and the reasonableness of estimates made by the executive directors and related disclosures.
• Conclude on the appropriateness of the executive direc-tors’ use of the going concern basis of accounting and, based on the audit evidence obtained, whether a material uncertainty exists related to events or conditions that may cast significant doubt on the Group’s ability to continue as a going concern. If we conclude that a material uncer-tainty exists, we are required to draw attention in the auditor’s report to the related disclosures in the consoli-dated financial statements and in the group management report or, if such disclosures are inadequate, to modify our respective audit opinions. Our conclusions are based on the audit evidence obtained up to the date of our auditor’s report. However, future events or conditions may cause the Group to cease to be able to continue as a going concern.
• Evaluate the overall presentation, structure and content of the consolidated financial statements, including the dis-closures, and whether the consolidated financial state-ments present the underlying transactions and events in a manner that the consolidated financial statements give a true and fair view of the assets, liabilities, financial position and financial performance of the Group in compliance
with IFRSs as adopted by the EU and the additional requirements of German commercial law pursuant to § 315e Abs. 1 HGB.
• Obtain sufficient appropriate audit evidence regarding the financial information of the entities or business activities within the Group to express audit opinions on the consol-idated financial statements and on the group management report. We are responsible for the direction, supervision and performance of the group audit. We remain solely responsible for our audit opinions.
• Evaluate the consistency of the group management report with the consolidated financial statements, its conformity with German law, and the view of the Group’s position it provides.
• Perform audit procedures on the prospective information presented by the executive directors in the group manage-ment report. On the basis of sufficient appropriate audit evidence we evaluate, in particular, the significant assumptions used by the executive directors as a basis for the prospective information, and evaluate the proper derivation of the prospective information from these assumptions. We do not express a separate audit opinion on the prospective information and on the assumptions used as a basis. There is a substantial unavoidable risk that future events will differ materially from the prospective information.
We communicate with those charged with governance regarding, among other matters, the planned scope and timing of the audit and significant audit findings, including any significant deficiencies in internal control that we identify during our audit.
We also provide those charged with governance with a statement that we have complied with the relevant indepen-dence requirements, and communicate with them all relation-ships and other matters that may reasonably be thought to bear on our independence, and where applicable, the related safeguards.
From the matters communicated with those charged with governance, we determine those matters that were of most significance in the audit of the consolidated financial state-ments of the current period and are therefore the key audit matters. We describe these matters in our auditor’s report unless law or regulation precludes public disclosure about the matter.
167
Independent auditor’s report
CORPORATE GOVERNANCEMANAGEMENT REPORT CONSOLIDATED FINANCIAL STATEMENTS SUPPLEMENTARY INFORMATION .

Other legal and regulatory requirements
Further Information pursuant to Article 10 of the EU Audit RegulationWe were elected as group auditor by the annual general meeting on 23 May 2017. We were engaged by the supervisory board on 25 October 2017. We have been the group auditor of Evonik Industries AG, Essen, without interruption since the Company first met the requirements as a public- interest entity within the meaning of § 319a Abs. 1 Satz 1 HGB in the financial year 2013.
We declare that the audit opinions expressed in this auditor’s report are consistent with the additional report to the audit committee pursuant to Article 11 of the EU Audit Regulation (long-form audit report).
German public auditor responsible for the engagement
The German Public Auditor responsible for the engagement is Antje Schlotter.
Düsseldorf, 20 February 2018
PricewaterhouseCoopers GmbHWirtschaftsprüfungsgesellschaft
Eckhard Sprinkmeier Antje SchlotterWirtschaftsprüfer Wirtschaftsprüferin
(German Public Auditor) (German Public Auditor)
168 FINANCIAL REPORT 2017 EVONIK INDUSTRIES

Market positions
Market positions 2017 a T135
Product ApplicationGlobal
ranking aCapacity in
metric tons p. a.
Nutrition & Care
Amphoteric surfactants Shampoos, shower gels 1 c
Ceramides, phytosphingosines Cosmetics 1 c
Oleochemical, quaternary derivatives Fabric softeners 1 c
Polyurethane additives Stabilizers and catalysts for the production of polyurethane foam 1 c
Organically modified silicones Cosmetics, radiation-cured separation coatings, super-spreading agents 1 – 2 c
Superabsorbents Diapers, incontinence products, feminine hygiene products, technical applications 3 c
Amino acids and amino acid derivatives Pharmaceutical intermediates and infusion solutions 3 c
Exclusive synthesis Intermediates and active substances for pharmaceuticals and specialty applications 2 c
Pharmaceutical polymers Drug delivery systems (e.g., tablet coatings) and medical products (e.g., bioresorbable implants) 2 c
DL-methionine Animal nutrition 1 580,000
Resource Efficiency
Hydrogen peroxideBleaching of pulp and textiles, oxidation agent for the chemical industry, starting product for polyurethane 2 > 900,000
Activated nickel catalysts Life sciences and fine chemicals, industrial chemicals 3 c
Precious metal powder catalysts Life sciences and fine chemicals, industrial chemicals 1 c
Oil and fat hydrogenation catalysts Life sciences and fine chemicals, industrial chemicals 3 c
Amorphous polyalphaolefins Thermoplastic hot melt adhesives 1 c
Polybutadienes Automotive manufacturing (adhesives and sealants) 2 c
Polyester resins Can- and coil coating, reactive hot melt adhesives 1 c
Thermoplastic and reactive methacrylate resins
Binders for paints and coatings 1 – 2 c
Organically modified silicones Binders for paints and printing inks 2 c
Isophorone chemistry Environment-friendly coating systems, high-performance composites (crosslinkers) 1 c
PEEK Special applications in the oil and gas, automotive and aviation industries, electronics/semiconductors, specialty medical technology (e.g., implants) 3 c
Polyamide 12 High-performance specialty polymer applications (e.g., automotive, medical, sport, gas and offshore oil pipelines) 1 c
Oil additives Viscosity modifiers 1 c
Organosilanes, chlorosilanes Rubber, silicone rubber, paints and coatings, adhesives and sealants, building protection materials, pharmaceuticals, cosmetics, optical fibers 1 b c
Fumed silicas, fumed metal oxides, precipitated silicas, matting agents
Silicone rubber, paints and coatings, adhesives, sealants and plastics, pharmaceuticals, cosmetics, high-temperature insulation, electronics, reinforcement of rubber, consumer products, additives for the coatings and printing inks industry 1 600,000
a Evonik’s assessment based on various individual market reports/information and in-house market research.b Chlorosilanes: freely traded volumes. Overall assessment—market position differs depending on application.c No data available.
169
Market positions
CORPORATE GOVERNANCEMANAGEMENT REPORT CONSOLIDATED FINANCIAL STATEMENTS SUPPLEMENTARY INFORMATION .

Market positions 2017 a T135
Product ApplicationGlobal
ranking aCapacity in
metric tons p. a.
Performance Materials
Butene-1 Co-monomer for polyolefins 1 b 235,000
DINP High-molecular plasticizers for use in flexible PVC 3 220,000
Isononanol Intermediate for high-molecular plasticizers 2 400,000
Cyanuric chloride Industrial applications and specialties (e.g., crosslinkers and optical brighteners), crop protection (especially Chinese producers) 3 31,000
Alcoholates Catalysts for biodiesel, pharmaceuticals, agrochemicals, and other applications 1 300,000
Methacrylate monomers Dispersions, coatings, plastics, additives, adhesives, optical lenses 1 – 2 c
Methacrylate polymers (PMMA molding compounds and PMMA semi-finished products)
Construction materials for the automotive and electrical/electronics industries, specialty medical technology, architecture, design and communication applications 1 – 2 400,000
a Evonik’s assessment based on various individual market reports/information and in-house market research.b Freely traded volumes.c No data available.
Growth engines
Specialty AdditivesSpecialty additives improve the properties of countless every-day products—from coatings and sofas to engine oils. Small quantities of these additives are used in production processes to achieve a variety of different effects, for example, to regulate the hardness of cushioning or the viscosity of lubricants. Demand for specialty additives is growing steadily. These specialty chemicals enhance the quality and durability of end- products and the energy-efficiency of production processes. Margins in this market make it particularly attractive.
Animal NutritionSustainable food production is one of the big challenges of our time. Globally, meat production is increasing as a result of rising living standards in emerging markets. That means more land is required for farming and also increases emissions of methane gases by cattle. Evonik already offers many solutions to address this development. Markets are also influenced by the desire for safer and better quality food and criticism of the use of antibiotics in animal nutrition. Evonik is active in this area as well: It develops probiotics for livestock farming and produces omega-3 fatty acids from natural microalgae as a substitute for fish oil and fishmeal in salmon farming.
Smart MaterialsSmart materials have specially tailored functionalities that help to optimize the properties of products. One example is
silica, which is used in many applications in the consumer goods industry. These tiny silicon dioxide particles make an important contribution to products such as toothpaste, paper, and modern tire treads. By reducing the rolling resistance of tires, silica particles cut fuel consumption. Smart materials are also used in 3D printing. Here, it is particularly important to make sure the materials used have the right properties. Evonik markets high-performance polyamide 12 for 3D printing. This powder enhances the speed and precision of 3D print-ing—even for complex components—so it is driving forward industrial application of this technology.
Health & CareThe Health & Care growth engine comprises products and services for pharmaceuticals, medical technology, cosmetics, and nutritional supplements. Examples are pharmaceutical polymers, which release the active ingredients in medicines in the body exactly when and where they are needed. Along with rising health-awareness, fitness and beauty are becoming more important. Many people want to stay young and keep their looks for as long as possible. Anti-aging products have long been a billion dollar market. Evonik serves this indus-try—with innovative active ingredients that take account of regional differences as well as sustainability. Consumers want cosmetics they can use with a good conscience, so developing and using alternatives to petroleum-based raw materials are becoming more important.
170 FINANCIAL REPORT 2017 EVONIK INDUSTRIES

GlossaryTechnical terms
Accident frequency (occupational safety indicator)Number of accidents involving Evonik employees and contractors’ employees under Evonik’s direct supervision per 1 million working hours.
AlkoxidesEvonik produces alkoxides, which are used as catalysts for efficient high-yield production of biodiesel. Using Evonik’s catalysts, biodiesel can be manufactured in a water-free process. As a result, fewer unwanted by-products are gener-ated, leading to less contamination, so they facilitate the production of biodiesel.
Amino acidsAmino acids are building blocks for proteins that are used in animal nutrition. They are used to ensure that the amino acid content of animal feed is optimally aligned to requirements. As a result, livestock needs less feed. That also reduces excretion of nitrogen and undigested nutrients, which improves the carbon footprint of livestock farming and reduces overfertilization of the soil. Evonik also produces amino acids and their derivatives in pharmaceutical quality for use in infusion solutions for parenteral nutrition, as starting products for animal cell cultures, and in the manufacture of active ingredients.
ButadieneButadiene is mainly used in synthetic rubber, for example for the manufacture of tires. It also has a wide range of applications in elastomers and plastics. For example, it increases the hydrocarbon resistance of nitrile rubber gloves. Butadiene is also an important precursor for the production of latex mattresses.
C4 chemistryC4 crack is a by-product of crude oil refining. It is mainly produced in a steam cracker when naphtha is split into ethylene and propylene. After isolation, Evonik processes the C4 hydrocarbons and places them on the market, for example, as butadiene for tires and butene-1 for the plastics industry. Isobutene is processed into methyl tertiary butylether (MTBE), which is used as an anti-knock agent in fuel. In further processing steps, it manufactures high-chain alcohols and plasticizers for flexible PVC. Evonik’s integrated C4 technology platform ensures excellent product yields. All hydrocarbons contained in C4 crack are processed cost-effectively.
Carbon Disclosure Project (CDP)The Carbon Disclosure Project (CDP) is a non-profit organi-zation and is currently the world’s largest and most important initiative by the financial sector on climate change. It is cur-rently supported by more than 800 institutional investors with total assets under management of over US$100 trillion. Companies report data and information on CO2 emissions, climate risks, and reduction targets and strategies to the CDP on voluntary basis once a year. Investors use the data to derive a climate risk profile for companies, which they then use in their investment decisions.
CrosslinkersPolymers comprise long chains of linked molecules. Cross-linking these chains to form three-dimensional networks creates materials with high mechanical and thermal stability. Evonik produces the key components for the crosslinking process for many important classes of polymers such as epoxy resin and polyurethanes.
Greenhouse Gas Protocol (GHG Protocol)The Greenhouse Gas Protocol is the most widespread volun-tary international standard for calculating and compiling data on greenhouse gas emissions from industry. It was developed by the World Business Council for Sustainable Development and the World Resources Institute.
High-performance polymersEvonik is a specialist for high-performance polymers. These have particularly high strength, making them a welcome alternative to metals in many fields, for example, in lightweight structures, medical, or industrial applications. Depending on where they are used, such materials have to withstand high temperatures, aggressive chemicals, and significant mechanical strain.
Hydrogen peroxideHydrogen peroxide is one of the cleanest and most versatile chemicals. Because of its positive properties it is used in a wide range of applications, from environmentally benign bleaching agents in the pulp and textile industries to etching agents in the electronics industry, active pharmaceutical ingredients and cosmetic applications, sterilization and disinfection agents in food processing as well as oxidizing agents in chemical and pharmaceutical syntheses. It is also used in the innovative Hydrogen-Peroxide-to-Propylene-Oxide (HPPO) process developed by Evonik and ThyssenKrupp Industrial Solutions for the direct chemical synthesis of propylene oxide, an important precursor for polyurethanes, and, for example, in the production of caprolactam.
171
Glossary
CORPORATE GOVERNANCEMANAGEMENT REPORT CONSOLIDATED FINANCIAL STATEMENTS SUPPLEMENTARY INFORMATION .

Incident frequency (plant safety indicator)Number of incidents involving the release of substances or energy, fire or explosion per 1 million working hours.
Integrated technology platformsIntegrated technology platforms allow efficient use of product streams and thus high added value by utilizing by-products from one production process as starting products for others. That saves resources, reduces CO2 emissions, and leverages cost-efficiency. Examples of integrated technology platforms in the Evonik Group are isophorone and silicon.
Isophorone/isophorone diamine/isophorone diisocyanate Isophorone is used as a solvent, for example, in the paints and coatings industry. It is also used to produce the derivatives isophorone diamine and isophorone diisocyanate. Isopho-rone diamine is an important curing agent for epoxy resin systems, for example, to strengthen rotor blades. Isophorone diiso cyanate is used to produce light- and weather-resistant polyurethane coatings, for example, for instrument panels and other plastic components.
Monomers Monomers are low-molecular-weight, reactive molecules that can build polymers.
Oil additivesAs a leading global supplier of oil additives, Evonik develops innovative technologies that improve the operative efficiency of engines, gears, and hydraulic systems. Specific and customized improvements in the flow properties of lubricants over a wide temperature range play an important role.
PMMAAbbreviation for polymethylmethacrylate. This is a colorless polymer (acrylic glass) that can be colored in a range of shades. Properties: high light transmittance, good moldability, excep-tionally high weather resistance. Applications: automotive and aviation engineering, architecture, lighting, design, electronics, and communications technology. Best-known brand: PLEXIGLAS, which is marketed as ACRYLITE in the Americas. Form supplied: thermoplastic molding compounds, cast or extruded semi-finished goods (sheet, film, tubes, rods).
PolymersLong-chain, short-chain, or crosslinked molecules (macro-molecules) produced by linking smaller molecules (monomers).
REACHREACH (Registration, Evaluation, Authorisation and Restric-tion of Chemicals) is the European chemicals regulation (1907/2006/EC).
Responsible CareResponsible Care is the global initiative of the chemical industry to bring about a continuous improvement in environ-mental protection, health, and safety. As well as complying with legislation and other regulations, the industry cooperates with government agencies and other stakeholders in various voluntary initiatives.
Silanes Silanes are a group of chemical compounds, consisting of a silicon-based structure and up to four functional groups. Evonik produces three types of silanes. • Organofunctional silanes have at least one functional
hydrocarbon group and possibly another functional group. They are used in high-performance additives that improve the properties of inorganic particles, resins, and polymers. For example, they enhance the bonding properties of adhesives, make plastics heat-resistant, and add flame- retardant properties to cables.
• Sulfur-functional silanes have revolutionized the production of tires, where they are used in combination with silica to improve key properties such as rolling resistance and wet grip.
• Chlorosilanes are key resources for the semiconductor and optical fiber industry.
SilicaEvonik manufactures both precipitated silica using a wet route and fumed silica, which is produced by a flame process. Silica is also known as silicon dioxide. These ultra-fine particles are used in a wide range of applications, including the life sciences (pharmaceuticals and cosmetics), construction, adhesives and sealants, paints and coatings, furniture manu-facture, electronics applications such as polishing computer chips, and the production of toners for digital printing. They also play a key role in energy-saving tires with low rolling resistance (“green” tires).
Silica/silane systemSilica is used in combination with silanes to reinforce the tread of modern tires. The silica/silane system greatly reduces rolling resistance, resulting in fuel savings of up to 8 percent compared with conventional car tires. It also improves grip on wet and wintry roads.
SuperabsorbentsCrosslinked polymers that are insoluble in water and can absorb and store large quantities of aqueous liquid through a mechanism that causes them to swell and form hydro gels. The liquid is not released even under pressure. Consequently, these polymers are mainly used in diapers. Special forms of superabsorbents are used in agriculture to regulate the mois-ture in soil. They can absorb large quantities of water and release it to the plants during dry periods.
172 FINANCIAL REPORT 2017 EVONIK INDUSTRIES

UN Global CompactThe United Nations Global Compact is a strategic initiative for companies that undertake to align their business operations and strategies with ten universally recognized principles relating to human rights, labor, environmental protection, and fighting corruption. Companies that join the Global Compact give an undertaking that they will report annually on their progress.
Vision 2050The Vision 2050 of the World Business Council for Sustain-able Development describes the pathway to achieving a sustainable world with around 9 billion people living well within the limits of the planet by 2050. Companies play a key role in this.
Financial and economic terms
Adjusted EBITEarnings before financial result and taxes, after adjustments. Earnings indicator showing Evonik’s operating earnings per-formance irrespective of the structure of its assets.
Adjusted EBITDAEarnings before financial result, taxes, depreciation and amortization, after adjustments. Earnings indicator showing Evonik’s operating earnings performance irrespective of the structure of its assets and its investment profile. This is a cash flow-related indicator which is used in particular in the adjusted EBITDA margin to show the relationship to sales as a basis for comparison with competitors.
AdjustmentsEvonik refers to the special items that are factored out when calculating the operational performance indicators adjusted EBITDA and adjusted EBIT as adjustments. They include restructuring, impairment losses/reversals of impairment losses, income and expenses in connection with the purchase/ disposal of investments in companies, and other income and expense items that, due to their nature or amount, do not reflect the typical operating business.
Capital expendituresCapital expenditures comprise investment in intangible assets, property, plant and equipment.
EVAAbbreviation for economic value added. Indicator used for value-oriented management of the Evonik Group. EVA is calculated from the difference between adjusted EBIT and the cost of capital employed. If EVA is positive, value is created.
Free cash flowThe free cash flow is a measure of the company’s internal financing capacity. It shows the cash that is available to pay dividends, make acquisitions, and repay borrowing. The free cash flow is calculated from the cash flow from operating activities, continuing operations, less outflows for capital expenditures on intangible assets, property, plant and equip-ment.
RatingIn the financial community, a rating is an assessment of the creditworthiness of a debtor. Ratings are generally awarded by specialized rating agencies. The probability of default is calculated on the basis of specific criteria and debtors are assigned to rating classes that are indicated by rating codes. Ratings are also awarded for corporate and government bonds. A rating indirectly affects the debtor’s business activity. Normally a better rating enables a debtor to obtain favorable terms for borrowing.
ROCEThe return on capital employed is a measure of the profitability of capital employed. It is calculated by dividing adjusted EBIT by the average capital employed in the reporting period.
Venture capitalVenture capital is risk capital that is made available to fund innovative concepts and ideas, generally at high-growth small and mid-sized enterprises. Through its venture capital activities, Evonik aims to invest up to € 100 million in promising start-ups and leading specialized venture capital funds in the mid-term. The regional focus is Europe, the USA, and Asia.
173
Glossary
CORPORATE GOVERNANCEMANAGEMENT REPORT CONSOLIDATED FINANCIAL STATEMENTS SUPPLEMENTARY INFORMATION .

Alternative performance measures
For internal management purposes, we use alternative per-formance measures that are not defined by IFRS. The calcu-lation of these measures and their development are outlined in
the management report in addition to the IFRS performance measures. The most important alternative performance mea-sures are also presented in the segment reporting.
Alternative performance measures used T136
For definition and calculation see page
Adjusted EBITDA 13, 18, 142
Adjusted EBITDA margin 13, 18, 142
Adjusted EBIT 13, 18, 142
Adjustments 13, 18, 19
Adjusted net income 19
Adjusted earnings per share 19
Capital employed 20, 142
Economic value added (EVA) 20, 21
Free cash flow 13, 31
Net financial assets/debt 29
ROCE 13, 20, 142
Financial calendar Financial calendar 2018 T137
Event Date
Interim report Q1 2018 May 8, 2018
Annual Shareholders’ Meeting 2018 May 23, 2018
Interim report Q2 2018 August 2, 2018
Interim report Q3 2018 November 6, 2018
174 FINANCIAL REPORT 2017 EVONIK INDUSTRIES

Credits
PUBLISHEREvonik Industries AGRellinghauser Straße 1–1145128 EssenGermanywww.evonik.com
CONTACTCommunicationsPhone +49 201 177-3315Fax +49 201 [email protected]
Investor RelationsPhone +49 201 177-3146Fax +49 201 [email protected]
CONCEPT, DESIGN, AND REALIZATIONBISSINGER[+] GmbH
PRINTINGGriebsch & Rochol Druck GmbH
PICTURE CREDITSPage 4: Andreas Pohlmann/Evonik
PRODUCTION OF EVONIK’S FINANCIAL REPORT 2017This report is printed on environment-friendly FSC paper. The Forest Stewardship Council seal is an assurance that the timber used to produce the paper comes from sustainable forestry. The printing company used by us has its own environmental manage-ment system and uses state-of-the-art technology. Printing inks containing heavy metals are not used. To minimize emissions resulting from distribution of this report we utilize efficient transportation logistics. If you no longer need this report, please pass it on to someone else or dispose of it in a paper recycling facility.
This report contains forward-looking statements based on the present expectations, assumptions and forecasts made by the Executive Board and the information available to it. These forward-looking statements do not constitute a guarantee of future developments and earnings expectations. Future performance and developments depend on a wide variety of factors which contain a number of risks and unforeseeable factors and are based on assumptions that may prove incorrect.

EVONIK INDUSTRIES AGRellinghauser Straße 1–1145128 Essen, Germanywww.evonik.com