2017 county data sheets - acy.org · 2017 county data sheets every statistic isn’t just a number...
TRANSCRIPT

2017 COUNTY DATA SHEETSEvery statistic isn’t just a number – it’s a life. A child’s life.


Annual research on key child well-being indicators is conducted by Advocates for Children and Youth. Additional figures can be found on the KIDS COUNT Data Center. This data sheet is one part of a separate county-by-county evaluation prepared by Advocates for Children and Youth.
ADVOCATES FOR CHILDREN AND YOUTH | www.acy.org | [email protected] @MarylandACY
167,564Total Population72,13012,767
Child Population
ALLEGANY COUNTYEvery statistic isn’t just a number – it’s a life. A child’s life.
*At the time of publication, current data not available. Child Welfare, 2016 Data
2017
INDICATOR ALLEGANY COUNTY MARYLAND
EDUCATION
3rd Graders Not Meeting or Exceeding Expectations in Math – PARCC 357 (57.1%) 39,389 (57.0%)
8th Graders Not Meeting or Exceeding Expectations in Math – PARCC 381 (80.9%) 31,504 (83.2%)
3rd Graders Not Meeting or Exceeding Expectations in Reading – PARCC 360 (57.5%) 41,380 (60.2%)
8th Graders Not Meeting or Exceeding Expectations in Reading – PARCC 390 (63.9%) 38,489 (61.1%)
Suspension Rate (2016-2017) 431 (5.2%) 38,254 (4.5%)
Dropout rate: 4-year adjusted cohort (2015-2016) 57 (8.6%) 5,057 (8.0%)
Graduation rate: 4-year adjusted cohort (2015-2016) 601 (90.2%) 55,586 (87.6%)
School-based arrests 15 (2.8%) 938 (4.0%)
HEALTH
Infant Mortality per 1,000 Live Births 5 (8.1) 478 (6.5)
Low-Birthweight 53 (8.6%) 6,264 (8.6%)
Uninsured Children 443 (3.3%) 51,944 (3.7%)
JUVENILE JUSTICE
Juvenile Arrests 393 22,705
Juvenile Arrest Rate per 10,000 Youth 663.7 375.6
Juvenile Arrest Black-White Disparity (Relative Rate Index) 8.40 3.00
CHILD WELFARE*
Family Foster Care (children in foster care) 81 4,542
Family Foster Care – Monthly Caseworker Visitation 100% 96%
Children Aged Out of Foster Care (12-month average) 4 454
Reunification 59 1313
ECONOMIC SUFFICIENCY
Students Receiving Free and Reduced School Meals (FARMs) 4912 (57%) 382,726 (43%)
Supplemental Nutrition Assistance Program (SNAP) participation 7,731 376,619


Annual research on key child well-being indicators is conducted by Advocates for Children and Youth. Additional figures can be found on the KIDS COUNT Data Center. This data sheet is one part of a separate county-by-county evaluation prepared by Advocates for Children and Youth.
ADVOCATES FOR CHILDREN AND YOUTH | www.acy.org | [email protected] @MarylandACY
ANNE ARUNDEL COUNTYEvery statistic isn’t just a number – it’s a life. A child’s life.
*At the time of publication, current data not available. Child Welfare, 2017 Data
Total Population568,346127,321
Child Population
2017
INDICATOR ANNE ARUNDEL COUNTY MARYLAND
EDUCATION
3rd Graders Not Meeting or Exceeding Expectations in Math – PARCC 3,586 (55.2%) 39,389 (57.0%)
8th Graders Not Meeting or Exceeding Expectations in Math – PARCC 2,843 (86.7%) 31,504 (83.2%)
3rd Graders Not Meeting or Exceeding Expectations in Reading – PARCC 2,861 (44.2%) 41,380 (60.2%)
8th Graders Not Meeting or Exceeding Expectations in Reading – PARCC 3,315(56.8%) 38,489 (61.1%)
Suspension Rate (2016-2017) 4,043 (5.1%) 38,254 (4.5%)
Dropout rate: 4-year adjusted cohort (2015-2016) 472 (8.2%) 5,057 (8.0%)
Graduation rate: 4-year adjusted cohort (2015-2016) 5,101 (89.1%) 55,586 (87.6%)
School-based arrests 121 (4.4%) 938 (4.0%)
HEALTH
Infant Mortality per 1,000 Live Births 39 (5.6) 478 (6.5)
Low-Birthweight 518 (7.4%) 6,264 (8.6%)
Uninsured Children 4,588 (3.5%) 51,944 (3.7%)
JUVENILE JUSTICE
Juvenile Arrests 2,317 22,705
Juvenile Arrest Rate per 10,000 Youth 413.6 375.6
Juvenile Arrest Black-White Disparity (Relative Rate Index) 3.90 3.00
CHILD WELFARE*
Family Foster Care (children in foster care) 149 4,542
Family Foster Care – Monthly Caseworker Visitation 100% 96%
Children Aged Out of Foster Care (12-month average) 8 454
Reunification 24 1313
ECONOMIC SUFFICIENCY
Students Receiving Free and Reduced School Meals (FARMs) 27,349 (34%) 382,726 (43%)
Supplemental Nutrition Assistance Program (SNAP) participation 20,452 376,619


Annual research on key child well-being indicators is conducted by Advocates for Children and Youth. Additional figures can be found on the KIDS COUNT Data Center. This data sheet is one part of a separate county-by-county evaluation prepared by Advocates for Children and Youth.
ADVOCATES FOR CHILDREN AND YOUTH | www.acy.org | [email protected] @MarylandACY
BALTIMORE CITYEvery statistic isn’t just a number – it’s a life. A child’s life.
*At the time of publication, current data not available. Child Welfare, 2016 Data
Total Population614,664129,207
Child Population
2017
INDICATOR BALTIMORE CITY MARYLAND
EDUCATION
3rd Graders Not Meeting or Exceeding Expectations in Math – PARCC 5,427(80.7%) 39,389 (57.0%)
8th Graders Not Meeting or Exceeding Expectations in Math – PARCC 4,235 (95.2%) 31,504 (83.2%)
3rd Graders Not Meeting or Exceeding Expectations in Reading – PARCC 5,782 (86.6%) 41,380 (60.2%)
8th Graders Not Meeting or Exceeding Expectations in Reading – PARCC 4,327 (86.1%) 38,489 (61.1%)
Suspension Rate (2016-2017) 4,449 (5.7%) 38,254 (4.5%)
Dropout rate: 4-year adjusted cohort (2015-2016) 711 (13.9%) 5,057 (8.0%)
Graduation rate: 4-year adjusted cohort (2015-2016) 3,625 (70.7%) 55,586 (87.6%)
School-based arrests 427 (12.6%) 938 (4.0%)
HEALTH
Infant Mortality per 1,000 Live Births 75 (8.8) 478 (6.5)
Low-Birthweight 995 (11.7%) 6,264 (8.6%)
Uninsured Children 4,306 (3.2%) 51,944 (3.7%)
JUVENILE JUSTICE*
Juvenile Arrests 2,544 22,705
Juvenile Arrest Rate per 10,000 Youth 484.2 375.6
Juvenile Arrest Black-White Disparity (Relative Rate Index) 6.80 3.00
CHILD WELFARE*
Family Foster Care (children in foster care) 1,918 4,542
Family Foster Care – Monthly Caseworker Visitation 95% 96%
Children Aged Out of Foster Care (12-month average) 205 454
Reunification 816 1313
ECONOMIC SUFFICIENCY
Students Receiving Free and Reduced School Meals (FARMs) 49,135 (60%) 382,726 (43%)
Supplemental Nutrition Assistance Program (SNAP) participation 113,026 376,619


Total Population831,026179,828
Child Population
Annual research on key child well-being indicators is conducted by Advocates for Children and Youth. Additional figures can be found on the KIDS COUNT Data Center. This data sheet is one part of a separate county-by-county evaluation prepared by Advocates for Children and Youth.
ADVOCATES FOR CHILDREN AND YOUTH | www.acy.org | [email protected] @MarylandACY
BALTIMORE COUNTYEvery statistic isn’t just a number – it’s a life. A child’s life.
*At the time of publication, current data not available. Child Welfare, 2016 Data
2017
INDICATOR BALTIMORE COUNTY MARYLAND
EDUCATION
3rd Graders Not Meeting or Exceeding Expectations in Math – PARCC 5,216(58.3%) 39,389 (57.0%)
8th Graders Not Meeting or Exceeding Expectations in Math – PARCC 3,442(71.1%) 31,504 (83.2%)
3rd Graders Not Meeting or Exceeding Expectations in Reading – PARCC 5,472 (62.3%) 41,380 (60.2%)
8th Graders Not Meeting or Exceeding Expectations in Reading – PARCC 5,366 (68.0%) 38,489 (61.1%)
Suspension Rate (2016-2017) 6,011 (5.5%) 38,254 (4.5%)
Dropout rate: 4-year adjusted cohort (2015-2016) 590 (7.5%) 5,057 (8.0%)
Graduation rate: 4-year adjusted cohort (2015-2016) 7,050 (89.2%) 55,586 (87.6%)
School-based arrests 0 (0.0%) 938 (4.0%)
HEALTH
Infant Mortality per 1,000 Live Births 58 (5.9) 478 (6.5)
Low-Birthweight 858 (8.8%) 6,264 (8.6%)
Uninsured Children 5,967 (3.2%) 51,944 (3.7%)
JUVENILE JUSTICE*
Juvenile Arrests 4,766 22,705
Juvenile Arrest Rate per 10,000 Youth 599.3 375.6
Juvenile Arrest Black-White Disparity (Relative Rate Index) 4.20 3.00
CHILD WELFARE*
Family Foster Care (children in foster care) 556 4,542
Family Foster Care – Monthly Caseworker Visitation 98% 96%
Children Aged Out of Foster Care (12-month average) 49 454
Reunification 73 1313
ECONOMIC SUFFICIENCY
Students Receiving Free and Reduced School Meals (FARMs) 53,342 (47%) 382,726 (43%)
Supplemental Nutrition Assistance Program (SNAP) participation 49,933 376,619


Total Population91,25121,571
Child Population
Annual research on key child well-being indicators is conducted by Advocates for Children and Youth. Additional figures can be found on the KIDS COUNT Data Center. This data sheet is one part of a separate county-by-county evaluation prepared by Advocates for Children and Youth.
ADVOCATES FOR CHILDREN AND YOUTH | www.acy.org | [email protected] @MarylandACY
CALVERT COUNTYEvery statistic isn’t just a number – it’s a life. A child’s life.
*At the time of publication, current data not available. Child Welfare, 2016 Data
2017
INDICATOR CALVERT COUNTY MARYLAND
EDUCATION
3rd Graders Not Meeting or Exceeding Expectations in Math – PARCC 406 (35.8%) 39,389 (57.0%)
8th Graders Not Meeting or Exceeding Expectations in Math – PARCC 633(85.8%) 31,504 (83.2%)
3rd Graders Not Meeting or Exceeding Expectations in Reading – PARCC 512(45.2%) 41,380 (60.2%)
8th Graders Not Meeting or Exceeding Expectations in Reading – PARCC 656 (49.9%) 38,489 (61.1%)
Suspension Rate (2014-2015) 479 (3.1%) 38,254 (4.5%)
Suspension Rate (2016-2017) 52 (3.9%) 5,057 (8.0%)
Dropout rate: 4-year adjusted cohort (2015-2016) 1,249 (94.5%) 55,586 (87.6%)
Graduation rate: 4-year adjusted cohort (2015-2016) 0 (0.0%) 938 (4.0%)
HEALTH
Infant Mortality per 1,000 Live Births 6(6.6) 478 (6.5)
Low-Birthweight 55 (6.1%) 6,264 (8.6%)
Uninsured Children 703(3.1%) 51,944 (3.7%)
JUVENILE JUSTICE
Juvenile Arrests 382 22,705
Juvenile Arrest Rate per 10,000 Youth 348.0 375.6
Juvenile Arrest Black-White Disparity (Relative Rate Index) 2.70 3.00
CHILD WELFARE*
Family Foster Care (children in foster care) 63 4,542
Family Foster Care – Monthly Caseworker Visitation 100% 96%
Children Aged Out of Foster Care (12-month average) 5 454
Reunification 11 1313
ECONOMIC SUFFICIENCY
Students Receiving Free and Reduced School Meals (FARMs) 3,497 (22%) 382,726 (43%)
Supplemental Nutrition Assistance Program (SNAP) participation 4,155 376,619


167,564Total Population32,8507,732
Child Population
Annual research on key child well-being indicators is conducted by Advocates for Children and Youth. Additional figures can be found on the KIDS COUNT Data Center. This data sheet is one part of a separate county-by-county evaluation prepared by Advocates for Children and Youth.
ADVOCATES FOR CHILDREN AND YOUTH | www.acy.org | [email protected] @MarylandACY
CAROLINE COUNTYEvery statistic isn’t just a number – it’s a life. A child’s life.
*At the time of publication, current data not available. Child Welfare, 2016 Data
2017
INDICATOR CAROLINE COUNTY MARYLAND
EDUCATION
3rd Graders Not Meeting or Exceeding Expectations in Math – PARCC 268 (57.1%) 39,389 (57.0%)
8th Graders Not Meeting or Exceeding Expectations in Math – PARCC 233(65.3%) 31,504 (83.2%)
3rd Graders Not Meeting or Exceeding Expectations in Reading – PARCC 284 (60.9%) 41,380 (60.2%)
8th Graders Not Meeting or Exceeding Expectations in Reading – PARCC 270 (66.7%) 38,489 (61.1%)
Suspension Rate (2016-2017) 168 (3.1%) 38,254 (4.5%)
Dropout rate: 4-year adjusted cohort (2015-2016) 30 (8.5%) 5,057 (8.0%)
Graduation rate: 4-year adjusted cohort (2015-2016) 314 (89.0%) 55,586 (87.6%)
School-based arrests 0 (0.0%) 938 (4.0%)
HEALTH
Infant Mortality per 1,000 Live Births 4 (LNE) 478 (6.5)
Low-Birthweight 24 (6.2%) 6,264 (8.6%)
Uninsured Children 400 (5.0%) 51,944 (3.7%)
JUVENILE JUSTICE*
Juvenile Arrests 258 22,705
Juvenile Arrest Rate per 10,000 Youth 716.9 375.6
Juvenile Arrest Black-White Disparity (Relative Rate Index) 2.90 3.00
CHILD WELFARE*
Family Foster Care (children in foster care) 22 4,542
Family Foster Care – Monthly Caseworker Visitation 100% 96%
Children Aged Out of Foster Care (12-month average) 3 454
Reunification 3 1313
ECONOMIC SUFFICIENCY
Students Receiving Free and Reduced School Meals (FARMs) 3,154 (55%) 376,619
Supplemental Nutrition Assistance Program (SNAP) participation 3,128 405,601
* Low Number Event – not statistically significant


167,564Total Population167,65636,637
Child Population
Annual research on key child well-being indicators is conducted by Advocates for Children and Youth. Additional figures can be found on the KIDS COUNT Data Center. This data sheet is one part of a separate county-by-county evaluation prepared by Advocates for Children and Youth.
ADVOCATES FOR CHILDREN AND YOUTH | www.acy.org | [email protected] @MarylandACY
CARROLL COUNTYEvery statistic isn’t just a number – it’s a life. A child’s life.
*At the time of publication, current data not available. Child Welfare, 2016 Data
2017
INDICATOR CARROLL COUNTY MARYLAND
EDUCATION
3rd Graders Not Meeting or Exceeding Expectations in Math – PARCC 618 (33.4%) 39,389 (57.0%)
8th Graders Not Meeting or Exceeding Expectations in Math – PARCC 936 (58.3%) 31,504 (83.2%)
3rd Graders Not Meeting or Exceeding Expectations in Reading – PARCC 937 (50.9%) 41,380 (60.2%)
8th Graders Not Meeting or Exceeding Expectations in Reading – PARCC 1,032(51.9%) 38,489 (61.1%)
Suspension Rate (2016-2017) 622 (2.5%) 38,254 (4.5%)
Dropout rate: 4-year adjusted cohort (2015-2016) 74 (3.3%) 5,057 (8.0%)
Graduation rate: 4-year adjusted cohort (2015-2016) NA 55,586 (87.6%)
School-based arrests 20 (4.3%) 938 (4.0%)
HEALTH
Infant Mortality per 1,000 Live Births 5 (2.9) 478 (6.5)
Low-Birthweight 122 (7.1%) 6,264 (8.6%)
Uninsured Children 1,070 (2.8%) 51,944 (3.7%)
JUVENILE JUSTICE*
Juvenile Arrests 358 22,705
Juvenile Arrest Rate per 10,000 Youth 186.2 375.6
Juvenile Arrest Black-White Disparity (Relative Rate Index) 2.90 3.00
CHILD WELFARE*
Family Foster Care (children in foster care) 42 4,542
Family Foster Care – Monthly Caseworker Visitation 100% 96%
Children Aged Out of Foster Care (12-month average) 0 454
Reunification 12 1313
ECONOMIC SUFFICIENCY
Students Receiving Free and Reduced School Meals (FARMs) 5,262 (21%) 382,726 (43%)
Supplemental Nutrition Assistance Program (SNAP) participation 5,831 376,619


Total Population102,60323,685
Child Population
Annual research on key child well-being indicators is conducted by Advocates for Children and Youth. Additional figures can be found on the KIDS COUNT Data Center. This data sheet is one part of a separate county-by-county evaluation prepared by Advocates for Children and Youth.
ADVOCATES FOR CHILDREN AND YOUTH | www.acy.org | [email protected] @MarylandACY
CECIL COUNTYEvery statistic isn’t just a number – it’s a life. A child’s life.
*At the time of publication, current data not available. Child Welfare, 2016 Data
2017
INDICATOR CECIL COUNTY MARYLAND
EDUCATION
3rd Graders Not Meeting or Exceeding Expectations in Math – PARCC 687 (58.2%) 39,389 (57.0%)
8th Graders Not Meeting or Exceeding Expectations in Math – PARCC 643(83.3%) 31,504 (83.2%)
3rd Graders Not Meeting or Exceeding Expectations in Reading – PARCC 764 (64.9%) 41,380 (60.2%)
8th Graders Not Meeting or Exceeding Expectations in Reading – PARCC 694 (61.3%) 38,489 (61.1%)
Suspension Rate (2016-2017) 1,096 (7.3%) 38,254 (4.5%)
Dropout rate: 4-year adjusted cohort (2015-2016) 92 (7.5%) 5,057 (8.0%)
Graduation rate: 4-year adjusted cohort (2015-2016) 1,115 (90.7%) 55,586 (87.6%)
School-based arrests 0 (0.0%) 938 (4.0%)
HEALTH
Infant Mortality per 1,000 Live Births 8 (7.2) 478 (6.5)
Low-Birthweight 87 (7.9%) 6,264 (8.6%)
Uninsured Children 906 (3.6%) 51,944 (3.7%)
JUVENILE JUSTICE*
Juvenile Arrests 509 22,705
Juvenile Arrest Rate per 10,000 Youth 437.2 375.6
Juvenile Arrest Black-White Disparity (Relative Rate Index) 4.30 3.00
CHILD WELFARE*
Family Foster Care (children in foster care) 154 4,542
Family Foster Care – Monthly Caseworker Visitation 96% 96%
Children Aged Out of Foster Care (12-month average) 5 454
Reunification 13 1313
ECONOMIC SUFFICIENCY
Students Receiving Free and Reduced School Meals (FARMs) 7,084 (46%) 382,726 (43%)
Supplemental Nutrition Assistance Program (SNAP) participation 7,260 376,619


Total Population157,70538,196
Child Population
Annual research on key child well-being indicators is conducted by Advocates for Children and Youth. Additional figures can be found on the KIDS COUNT Data Center. This data sheet is one part of a separate county-by-county evaluation prepared by Advocates for Children and Youth.
ADVOCATES FOR CHILDREN AND YOUTH | www.acy.org | [email protected] @MarylandACY
CHARLES COUNTYEvery statistic isn’t just a number – it’s a life. A child’s life.
*At the time of publication, current data not available. Child Welfare, 2016 Data
2017
INDICATOR CHARLES COUNTY MARYLAND
EDUCATION
3rd Graders Not Meeting or Exceeding Expectations in Math – PARCC 1,148 (57.8%) 39,389 (57.0%)
8th Graders Not Meeting or Exceeding Expectations in Math – PARCC 1,171 (87.1%) 31,504 (83.2%)
3rd Graders Not Meeting or Exceeding Expectations in Reading – PARCC 1,214 (61.2%) 41,380 (60.2%)
8th Graders Not Meeting or Exceeding Expectations in Reading – PARCC 1,206 (61.1%) 38,489 (61.1%)
Suspension Rate (2016-2017) 1,575 (6.2%) 38,254 (4.5%)
Dropout rate: 4-year adjusted cohort (2015-2016) 94 (4.3%) 5,057 (8.0%)
Graduation rate: 4-year adjusted cohort (2015-2016) 2,012 (92.2%) 55,586 (87.6%)
School-based arrests 0 (0.0%) 938 (4.0%)
HEALTH
Infant Mortality per 1,000 Live Births 19 (10.5) 478 (6.5)
Low-Birthweight 186 (10.2%) 6,264 (8.6%)
Uninsured Children 1,426 (3.6%) 51,944 (3.7%)
JUVENILE JUSTICE*
Juvenile Arrests 842 22,705
Juvenile Arrest Rate per 10,000 Youth 454.0 375.6
Juvenile Arrest Black-White Disparity (Relative Rate Index) 2.30 3.00
CHILD WELFARE*
Family Foster Care (children in foster care) 91 4,542
Family Foster Care – Monthly Caseworker Visitation 86% 96%
Children Aged Out of Foster Care (12-month average) 8 454
Reunification 5 1313
ECONOMIC SUFFICIENCY
Students Receiving Free and Reduced School Meals (FARMs) 9930 (37%) 382,726 (43%)
Supplemental Nutrition Assistance Program (SNAP) participation 8,656 376,619


Total Population32,2586,864
Child Population
Annual research on key child well-being indicators is conducted by Advocates for Children and Youth. Additional figures can be found on the KIDS COUNT Data Center. This data sheet is one part of a separate county-by-county evaluation prepared by Advocates for Children and Youth.
ADVOCATES FOR CHILDREN AND YOUTH | www.acy.org | [email protected] @MarylandACY
DORCHESTER COUNTYEvery statistic isn’t just a number – it’s a life. A child’s life.
*At the time of publication, current data not available. Child Welfare, 2016 Data
2017
INDICATOR DORCHESTER COUNTY MARYLAND
EDUCATION
3rd Graders Not Meeting or Exceeding Expectations in Math – PARCC 269 (65.6%) 39,389 (57.0%)
8th Graders Not Meeting or Exceeding Expectations in Math – PARCC 232 (95.9%) 31,504 (83.2%)
3rd Graders Not Meeting or Exceeding Expectations in Reading – PARCC 319 (77.8%) 41,380 (60.2%)
8th Graders Not Meeting or Exceeding Expectations in Reading – PARCC 259 (76.2%) 38,489 (61.1%)
Suspension Rate (2016-2017) 613 (13.4%) 38,254 (4.5%)
Dropout rate: 4-year adjusted cohort (2015-2016) 31 (10.5%) 5,057 (8.0%)
Graduation rate: 4-year adjusted cohort (2015-2016) 256 (86.5%) 55,586 (87.6%)
School-based arrests 0 (0.0%) 938 (4.0%)
HEALTH
Infant Mortality per 1,000 Live Births 1 (LNE) 478 (6.5)
Low-Birthweight 37 (9.7%) 6,264 (8.6%)
Uninsured Children 311 (4.4%) 51,944 (3.7%)
JUVENILE JUSTICE
Juvenile Arrests 542 22,705
Juvenile Arrest Rate per 10,000 Youth 1866.4 375.6
Juvenile Arrest Black-White Disparity (Relative Rate Index) 3.40 3.00
CHILD WELFARE*
Family Foster Care (children in foster care) 33 4,542
Family Foster Care – Monthly Caseworker Visitation 100% 96%
Children Aged Out of Foster Care (12-month average) 1 454
Reunification 3 1313
ECONOMIC SUFFICIENCY
Students Receiving Free and Reduced School Meals (FARMs) 3,263 (68%) 382,726 (43%)
Supplemental Nutrition Assistance Program (SNAP) participation 4,595 376,619
* Low Number Event – not statistically significant

Total Population247,59158,425
Child Population
Annual research on key child well-being indicators is conducted by Advocates for Children and Youth. Additional figures can be found on the KIDS COUNT Data Center. This data sheet is one part of a separate county-by-county evaluation prepared by Advocates for Children and Youth.
ADVOCATES FOR CHILDREN AND YOUTH | www.acy.org | [email protected] @MarylandACY
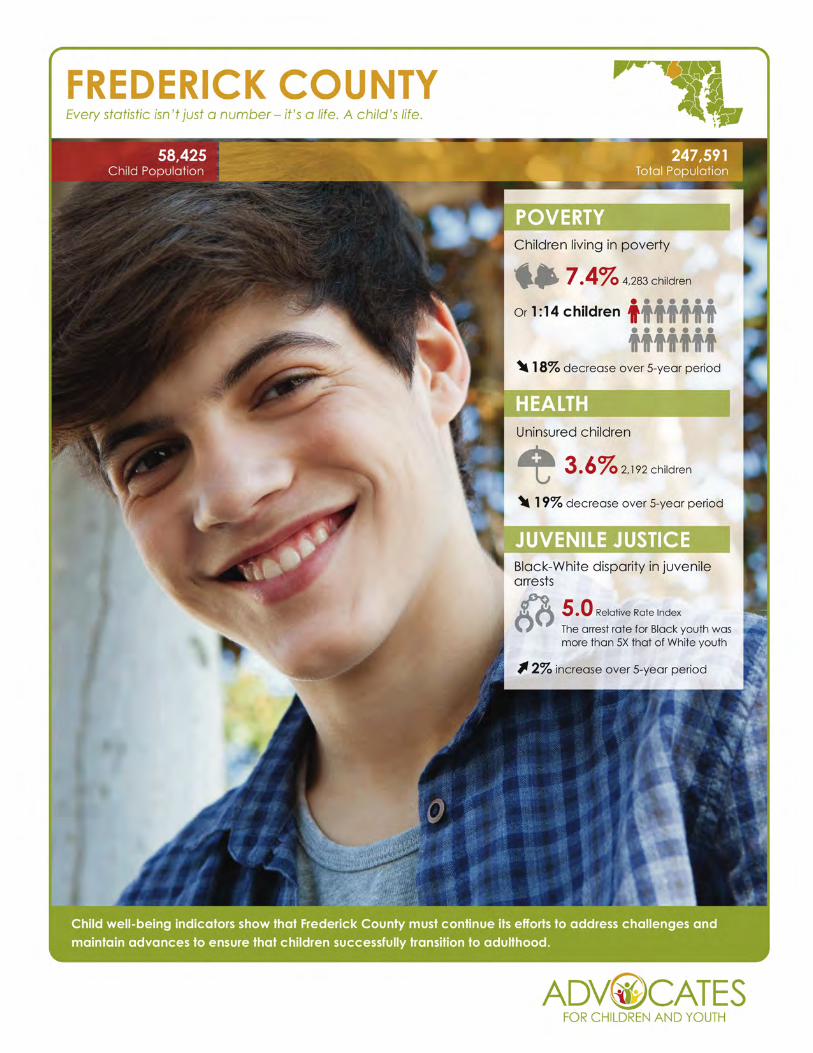
FREDERICK COUNTYEvery statistic isn’t just a number – it’s a life. A child’s life.
*At the time of publication, current data not available. Child Welfare, 2016 Data
2017
INDICATOR FREDERICK COUNTY MARYLAND
EDUCATION
3rd Graders Not Meeting or Exceeding Expectations in Math – PARCC 1,481 (48.4%) 39,389 (57.0%)
8th Graders Not Meeting or Exceeding Expectations in Math – PARCC 1,592 (62.8%) 31,504 (83.2%)
3rd Graders Not Meeting or Exceeding Expectations in Reading – PARCC 1,568 (50.2%) 41,380 (60.2%)
8th Graders Not Meeting or Exceeding Expectations in Reading – PARCC 1,560 (51.0%) 38,489 (61.1%)
Suspension Rate (2016-2017) 1,173 (2.9%) 38,254 (4.5%)
Dropout rate: 4-year adjusted cohort (2015-2016) 144 (4.7%) 5,057 (8.0%)
Graduation rate: 4-year adjusted cohort (2015-2016) 2,828 (92.1%) 55,586 (87.6%)
School-based arrests 8 (1.1%) 938 (4.0%)
HEALTH
Infant Mortality per 1,000 Live Births 9 (3.2) 478 (6.5)
Low-Birthweight 168 (5.9%) 6,264 (8.6%)
Uninsured Children 2,192 (3.6%) 51,944 (3.7%)
JUVENILE JUSTICE
Juvenile Arrests 754 22,705
Juvenile Arrest Rate per 10,000 Youth 273.5 375.6
Juvenile Arrest Black-White Disparity (Relative Rate Index) 5.00 3.00
CHILD WELFARE*
Family Foster Care (children in foster care) 109 4,542
Family Foster Care – Monthly Caseworker Visitation 98% 96%
Children Aged Out of Foster Care (12-month average) 13 454
Reunification 18 1313
ECONOMIC SUFFICIENCY
Students Receiving Free and Reduced School Meals (FARMs) 11,496 (28%) 382,726 (43%)
Supplemental Nutrition Assistance Program (SNAP) participation 9,101 376,619


Total Population29,4255,594
Child Population
Annual research on key child well-being indicators is conducted by Advocates for Children and Youth. Additional figures can be found on the KIDS COUNT Data Center. This data sheet is one part of a separate county-by-county evaluation prepared by Advocates for Children and Youth.
ADVOCATES FOR CHILDREN AND YOUTH | www.acy.org | [email protected] @MarylandACY
GARRETT COUNTYEvery statistic isn’t just a number – it’s a life. A child’s life.
*At the time of publication, current data not available. Child Welfare, 2016 Data
2017
INDICATOR GARRETT COUNTY MARYLAND
EDUCATION
3rd Graders Not Meeting or Exceeding Expectations in Math – PARCC 173 (64.8%) 39,389 (57.0%)
8th Graders Not Meeting or Exceeding Expectations in Math – PARCC 162 (86.6%) 31,504 (83.2%)
3rd Graders Not Meeting or Exceeding Expectations in Reading – PARCC 181 (67.8%) 41,380 (60.2%)
8th Graders Not Meeting or Exceeding Expectations in Reading – PARCC 202 (68.5%) 38,489 (61.1%)
Suspension Rate (2016-2017) 61 (1.7%) 38,254 (4.5%)
Dropout rate: 4-year adjusted cohort (2015-2016) 24 (8.0%) 5,057 (8.0%)
Graduation rate: 4-year adjusted cohort (2015-2016) 274 (91.6%) 55,586 (87.6%)
School-based arrests 12 (6.7%) 938 (4.0%)
HEALTH
Infant Mortality per 1,000 Live Births 1(LNE) 478 (6.5)
Low-Birthweight 31 (10.0%) 6,264 (8.6%)
Uninsured Children 288(4.9%) 51,944 (3.7%)
JUVENILE JUSTICE
Juvenile Arrests 110 22,705
Juvenile Arrest Rate per 10,000 Youth 395.7 375.6
Juvenile Arrest Black-White Disparity (Relative Rate Index) 9.80 3.00
CHILD WELFARE*
Family Foster Care (children in foster care) 46 4,542
Family Foster Care – Monthly Caseworker Visitation 100% 96%
Children Aged Out of Foster Care (12-month average) 2 454
Reunification 24 1313
ECONOMIC SUFFICIENCY
Students Receiving Free and Reduced School Meals (FARMs) 1,827 (48%) 382,726 (43%)
Supplemental Nutrition Assistance Program (SNAP) participation 2,149 376,619
* Low Number Event – not statistically significant


Total Population251,03256,561
Child Population
Annual research on key child well-being indicators is conducted by Advocates for Children and Youth. Additional figures can be found on the KIDS COUNT Data Center. This data sheet is one part of a separate county-by-county evaluation prepared by Advocates for Children and Youth.
ADVOCATES FOR CHILDREN AND YOUTH | www.acy.org | [email protected] @MarylandACY
HARFORD COUNTYEvery statistic isn’t just a number – it’s a life. A child’s life.
*At the time of publication, current data not available. Child Welfare, 2016 Data
2017
INDICATOR HARFORD COUNTY MARYLAND
EDUCATION
3rd Graders Not Meeting or Exceeding Expectations in Math – PARCC 1,433 (49.5%) 39,389 (57.0%)
8th Graders Not Meeting or Exceeding Expectations in Math – PARCC 1,243 (88.8%) 31,504 (83.2%)
3rd Graders Not Meeting or Exceeding Expectations in Reading – PARCC 1,352 (46.7%) 41,380 (60.2%)
8th Graders Not Meeting or Exceeding Expectations in Reading – PARCC 1,563 (55.8%) 38,489 (61.1%)
Suspension Rate (2016-2017) 2,124 (5.9%) 38,254 (4.5%)
Dropout rate: 4-year adjusted cohort (2015-2016) 218 (7.6%) 5,057 (8.0%)
Graduation rate: 4-year adjusted cohort (2015-2016) 2,573 (89.1%) 55,586 (87.6%)
School-based arrests 0 (0.0%) 938 (4.0%)
HEALTH
Infant Mortality per 1,000 Live Births 13 (4.8) 478 (6.5)
Low-Birthweight 205 (7.6%) 6,264 (8.6%)
Uninsured Children 1,796 (3.0%) 51,944 (3.7%)
JUVENILE JUSTICE
Juvenile Arrests 843 22,705
Juvenile Arrest Rate per 10,000 Youth 306.5 375.6
Juvenile Arrest Black-White Disparity (Relative Rate Index) 4.90 3.00
CHILD WELFARE*
Family Foster Care (children in foster care) 195 4,542
Family Foster Care – Monthly Caseworker Visitation 97% 96%
Children Aged Out of Foster Care (12-month average) 16 454
Reunification 38 1313
ECONOMIC SUFFICIENCY
Students Receiving Free and Reduced School Meals (FARMs) 11,935 (32%) 382,726 (43%)
Supplemental Nutrition Assistance Program (SNAP) participation 10,707 376,619


Total Population317,23377,889
Child Population
Annual research on key child well-being indicators is conducted by Advocates for Children and Youth. Additional figures can be found on the KIDS COUNT Data Center. This data sheet is one part of a separate county-by-county evaluation prepared by Advocates for Children and Youth.
ADVOCATES FOR CHILDREN AND YOUTH | www.acy.org | [email protected] @MarylandACY
HOWARD COUNTYEvery statistic isn’t just a number – it’s a life. A child’s life.
*At the time of publication, current data not available. Child Welfare, 2016 Data
2017
INDICATOR HOWARD COUNTY MARYLAND
EDUCATION
3rd Graders Not Meeting or Exceeding Expectations in Math – PARCC 1,704 (39.7%) 39,389 (57.0%)
8th Graders Not Meeting or Exceeding Expectations in Math – PARCC 1,522 (83.5%) 31,504 (83.2%)
3rd Graders Not Meeting or Exceeding Expectations in Reading – PARCC 1,886 (44.1%) 41,380 (60.2%)
8th Graders Not Meeting or Exceeding Expectations in Reading – PARCC 1,948 (45.5%) 38,489 (61.1%)
Suspension Rate (2016-2017) 1,430 (2.6%) 38,254 (4.5%)
Dropout rate: 4-year adjusted cohort (2015-2016) 168 (4.0%) 5,057 (8.0%)
Graduation rate: 4-year adjusted cohort (2015-2016) 3,954 (93.2%) 55,586 (87.6%)
School-based arrests 0 (0.0%) 938 (4.0%)
HEALTH
Infant Mortality per 1,000 Live Births 17 (4.8) 478 (6.5)
Low-Birthweight 298 (8.4%) 6,264 (8.6%)
Uninsured Children 2,264 (2.9%) 51,944 (3.7%)
JUVENILE JUSTICE
Juvenile Arrests 1,127 22,705
Juvenile Arrest Rate per 10,000 Youth 304.0 375.6
Juvenile Arrest Black-White Disparity (Relative Rate Index) 4.20 3.00
CHILD WELFARE*
Family Foster Care (children in foster care) 58 4,542
Family Foster Care – Monthly Caseworker Visitation 100% 96%
Children Aged Out of Foster Care (12-month average) 12 454
Reunification 14 1313
ECONOMIC SUFFICIENCY
Students Receiving Free and Reduced School Meals (FARMs) 12,393 (22%) 382,726 (43%)
Supplemental Nutrition Assistance Program (SNAP) participation 8,871 376,619


Total Population19,7303,235
Child Population
Annual research on key child well-being indicators is conducted by Advocates for Children and Youth. Additional figures can be found on the KIDS COUNT Data Center. This data sheet is one part of a separate county-by-county evaluation prepared by Advocates for Children and Youth.
ADVOCATES FOR CHILDREN AND YOUTH | www.acy.org | [email protected] @MarylandACY
KENT COUNTYEvery statistic isn’t just a number – it’s a life. A child’s life.
*At the time of publication, current data not available. Child Welfare, 2016 Data
2017
INDICATOR KENT COUNTY MARYLAND
EDUCATION
3rd Graders Not Meeting or Exceeding Expectations in Math – PARCC 96 (62.7%) 39,389 (57.0%)
8th Graders Not Meeting or Exceeding Expectations in Math – PARCC 89 (95.7%) 31,504 (83.2%)
3rd Graders Not Meeting or Exceeding Expectations in Reading – PARCC 115(75.2%) 41,380 (60.2%)
8th Graders Not Meeting or Exceeding Expectations in Reading – PARCC 104(71.2%) 38,489 (61.1%)
Suspension Rate (2016-2017) 88 (4.7%) 38,254 (4.5%)
Dropout rate: 4-year adjusted cohort (2015-2016) 14 (10.0%) 5,057 (8.0%)
Graduation rate: 4-year adjusted cohort (2015-2016) 124(88.6%) 55,586 (87.6%)
School-based arrests 0 (0.0%) 938 (4.0%)
HEALTH
Infant Mortality per 1,000 Live Births 2 (LNE) 478 (6.5)
Low-Birthweight 12 (8.1%) 6,264 (8.6%)
Uninsured Children 198 (5.8%) 51,944 (3.7%)
JUVENILE JUSTICE
Juvenile Arrests 40 22,705
Juvenile Arrest Rate per 10,000 Youth 265.6 375.6
Juvenile Arrest Black-White Disparity (Relative Rate Index) 11.40 3.00
CHILD WELFARE*
Family Foster Care (children in foster care) 8 4,542
Family Foster Care – Monthly Caseworker Visitation 100% 96%
Children Aged Out of Foster Care (12-month average) 1 454
Reunification 1 1313
ECONOMIC SUFFICIENCY
Students Receiving Free and Reduced School Meals (FARMs) x 382,726 (43%)
Supplemental Nutrition Assistance Program (SNAP) participation 1,586 376,619
* Low Number Event – not statistically significant


Total PopulationChild Population1,043,863244,477
Annual research on key child well-being indicators is conducted by Advocates for Children and Youth. Additional figures can be found on the KIDS COUNT Data Center. This data sheet is one part of a separate county-by-county evaluation prepared by Advocates for Children and Youth.
ADVOCATES FOR CHILDREN AND YOUTH | www.acy.org | [email protected] @MarylandACY
MONTGOMERY COUNTYEvery statistic isn’t just a number – it’s a life. A child’s life.
*At the time of publication, current data not available. Child Welfare, 2016 Data
2017
INDICATOR MONTGOMERY COUNTY MARYLAND
EDUCATION
3rd Graders Not Meeting or Exceeding Expectations in Math – PARCC 5,614 (45.7%) 39,389 (57.0%)
8th Graders Not Meeting or Exceeding Expectations in Math – PARCC 2,279 (95.3%) 31,504 (83.2%)
3rd Graders Not Meeting or Exceeding Expectations in Reading – PARCC 6,434 (52.5%) 41,380 (60.2%)
8th Graders Not Meeting or Exceeding Expectations in Reading – PARCC 5,931 (52.0%) 38,489 (61.1%)
Suspension Rate (2016-2017) 2,515 (1.6%) 38,254 (4.5%)
Dropout rate: 4-year adjusted cohort (2015-2016) 641 (5.7%) 5,057 (8.0%)
Graduation rate: 4-year adjusted cohort (2015-2016) 10,114 (89.8%) 55,586 (87.6%)
School-based arrests 0 (0.0%) 938 (4.0%)
HEALTH
Infant Mortality per 1,000 Live Births 73 (5.6) 478 (6.5)
Low-Birthweight 943 (7.2%) 6,264 (8.6%)
Uninsured Children 10,790 (4.3%) 51,944 (3.7%)
JUVENILE JUSTICE
Juvenile Arrests 1,846 22,705
Juvenile Arrest Rate per 10,000 Youth 170.5 375.6
Juvenile Arrest Black-White Disparity (Relative Rate Index) 3.20 3.00
CHILD WELFARE*
Family Foster Care (children in foster care) 388 4,542
Family Foster Care – Monthly Caseworker Visitation 96% 96%
Children Aged Out of Foster Care (12-month average) 37 454
Reunification 58 1313
ECONOMIC SUFFICIENCY
Students Receiving Free and Reduced School Meals (FARMs) 58,586 (36%) 382,726 (43%)
Supplemental Nutrition Assistance Program (SNAP) participation 33,761 376,619


Total Population908,049204,148
Child Population
Annual research on key child well-being indicators is conducted by Advocates for Children and Youth. Additional figures can be found on the KIDS COUNT Data Center. This data sheet is one part of a separate county-by-county evaluation prepared by Advocates for Children and Youth.
ADVOCATES FOR CHILDREN AND YOUTH | www.acy.org | [email protected] @MarylandACY
PRINCE GEORGE’S COUNTYEvery statistic isn’t just a number – it’s a life. A child’s life.
*At the time of publication, current data not available. Child Welfare, 2016 Data
2017
INDICATOR PRINCE GEORGE’S COUNTY
MARYLAND
EDUCATION
3rd Graders Not Meeting or Exceeding Expectations in Math – PARCC 7,676 (74.6%) 39,389 (57.0%)
8th Graders Not Meeting or Exceeding Expectations in Math – PARCC 6,806 (90.9%) 31,504 (83.2%)
3rd Graders Not Meeting or Exceeding Expectations in Reading – PARCC 7,734 (75.2%) 41,380 (60.2%)
8th Graders Not Meeting or Exceeding Expectations in Reading – PARCC 6,328 (71.2%) 38,489 (61.1%)
Suspension Rate (2016-2017) 7,871 (6.3%) 38,254 (4.5%)
Dropout rate: 4-year adjusted cohort (2015-2016) 1,254 (13.9%) 5,057 (8.0%)
Graduation rate: 4-year adjusted cohort (2015-2016) 7,342 (81.4%) 55,586 (87.6%)
School-based arrests 325 (17.9%) 938 (4.0%)
HEALTH
Infant Mortality per 1,000 Live Births 94 (7.6) 478 (6.5)
Low-Birthweight 1,193 (9.7%) 6,264 (8.6%)
Uninsured Children 9,660 (4.6%) 51,944 (3.7%)
JUVENILE JUSTICE
Juvenile Arrests 1,924 22,705
Juvenile Arrest Rate per 10,000 Youth 223.4 375.6
Juvenile Arrest Black-White Disparity (Relative Rate Index) 1.50 3.00
CHILD WELFARE*
Family Foster Care (children in foster care) 480 4,542
Family Foster Care – Monthly Caseworker Visitation 89% 96%
Children Aged Out of Foster Care (12-month average) 53 454
Reunification 45 1313
ECONOMIC SUFFICIENCY
Students Receiving Free and Reduced School Meals (FARMs) 83,475 (63%) 382,726 (43%)
Supplemental Nutrition Assistance Program (SNAP) participation 46,028 376,619


48,804
Total Population10,626 48,929
Child Population
Annual research on key child well-being indicators is conducted by Advocates for Children and Youth. Additional figures can be found on the KIDS COUNT Data Center. This data sheet is one part of a separate county-by-county evaluation prepared by Advocates for Children and Youth.
ADVOCATES FOR CHILDREN AND YOUTH | www.acy.org | [email protected] @MarylandACY
QUEEN ANNE’S COUNTYEvery statistic isn’t just a number – it’s a life. A child’s life.
*At the time of publication, current data not available. Child Welfare, 2016 Data
2017
INDICATOR QUEEN ANNE’S COUNTY MARYLAND
EDUCATION
3rd Graders Not Meeting or Exceeding Expectations in Math – PARCC 246 41.8%) 39,389 (57.0%)
8th Graders Not Meeting or Exceeding Expectations in Math – PARCC 299 (71.0%) 31,504 (83.2%)
3rd Graders Not Meeting or Exceeding Expectations in Reading – PARCC 323 (55.1%) 41,380 (60.2%)
8th Graders Not Meeting or Exceeding Expectations in Reading – PARCC 241 (41.1%) 38,489 (61.1%)
Suspension Rate (2016-2017) 121(1.6%) 38,254 (4.5%)
Dropout rate: 4-year adjusted cohort (2015-2016) N/A (N/A%) 5,057 (8.0%)
Graduation rate: 4-year adjusted cohort (2015-2016) N/A (N/A%) 55,586 (87.6%)
School-based arrests 0 (0.0%) 938 (4.0%)
HEALTH
Infant Mortality per 1,000 Live Births 0 (LNE) 478 (6.5)
Low-Birthweight 38 (7.6%) 6,264 (8.6%)
Uninsured Children 458 (4.1%) 51,944 (3.7%)
JUVENILE JUSTICE*
Juvenile Arrests 110 22,705
Juvenile Arrest Rate per 10,000 Youth 207.1 375.6
Juvenile Arrest Black-White Disparity (Relative Rate Index) 3.10 3.00
CHILD WELFARE*
Family Foster Care (children in foster care) 8 4,542
Family Foster Care – Monthly Caseworker Visitation 100% 96%
Children Aged Out of Foster Care (12-month average) 1 454
Reunification 4 1313
ECONOMIC SUFFICIENCY
Students Receiving Free and Reduced School Meals (FARMs) 2,096 (27%) 382,726 (43%)
Supplemental Nutrition Assistance Program (SNAP) participation 2,271 376,619
* Low Number Event – not statistically significant


48,804
Total Population25,7684,350
Child Population
Annual research on key child well-being indicators is conducted by Advocates for Children and Youth. Additional figures can be found on the KIDS COUNT Data Center. This data sheet is one part of a separate county-by-county evaluation prepared by Advocates for Children and Youth.
ADVOCATES FOR CHILDREN AND YOUTH | www.acy.org | [email protected] @MarylandACY
SOMERSET COUNTYEvery statistic isn’t just a number – it’s a life. A child’s life.
*At the time of publication, current data not available. Child Welfare, 2016 Data
2017
INDICATOR SOMERSET COUNTY
MARYLAND
EDUCATION
3rd Graders Not Meeting or Exceeding Expectations in Math – PARCC 144 (64.9%) 39,389 (57.0%)
8th Graders Not Meeting or Exceeding Expectations in Math – PARCC 163 (81.5%) 31,504 (83.2%)
3rd Graders Not Meeting or Exceeding Expectations in Reading – PARCC 145 (66.2%) 41,380 (60.2%)
8th Graders Not Meeting or Exceeding Expectations in Reading – PARCC 132 (66.3%) 38,489 (61.1%)
Suspension Rate (2016-2017) 381 (13.7%) 38,254 (4.5%)
Dropout rate: 4-year adjusted cohort (2015-2016) 23 (12.9%) 5,057 (8.0%)
Graduation rate: 4-year adjusted cohort (2015-2016) 147 (82.6%) 55,586 (87.6%)
School-based arrests 0 (0.0%) 938 (4.0%)
HEALTH
Infant Mortality per 1,000 Live Births 4 (LNE) 478 (6.5)
Low-Birthweight 27 (10.2%) 6,264 (8.6%)
Uninsured Children 201 (4.4%) 51,944 (3.7%)
JUVENILE JUSTICE
Juvenile Arrests 139 22,705
Juvenile Arrest Rate per 10,000 Youth 754.6 375.6
Juvenile Arrest Black-White Disparity (Relative Rate Index) 3.80 3.00
CHILD WELFARE*
Family Foster Care (children in foster care) 24 4,542
Family Foster Care – Monthly Caseworker Visitation 100% 96%
Children Aged Out of Foster Care (12-month average) 1 454
Reunification 1 1313
ECONOMIC SUFFICIENCY
Students Receiving Free and Reduced School Meals (FARMs) 1,907 (66%) 382,726 (43%)
Supplemental Nutrition Assistance Program (SNAP) participation 2,938 376,619
* Low Number Event – not statistically significant


48,804
Total Population112,58727,643
Child Population
Annual research on key child well-being indicators is conducted by Advocates for Children and Youth. Additional figures can be found on the KIDS COUNT Data Center. This data sheet is one part of a separate county-by-county evaluation prepared by Advocates for Children and Youth.
ADVOCATES FOR CHILDREN AND YOUTH | www.acy.org | [email protected] @MarylandACY
ST. MARY’S COUNTYEvery statistic isn’t just a number – it’s a life. A child’s life.
*At the time of publication, current data not available. Child Welfare, 2016 Data
2017
INDICATOR ST. MARY’S COUNTY
MARYLAND
EDUCATION
3rd Graders Not Meeting or Exceeding Expectations in Math – PARCC 703 (51.6%) 39,389 (57.0%)
8th Graders Not Meeting or Exceeding Expectations in Math – PARCC 613 (71.1%) 31,504 (83.2%)
3rd Graders Not Meeting or Exceeding Expectations in Reading – PARCC 808 (59.4%) 41,380 (60.2%)
8th Graders Not Meeting or Exceeding Expectations in Reading – PARCC 701 (54.9%) 38,489 (61.1%)
Suspension Rate (2016-2017) 613 (3.6%) 38,254 (4.5%)
Dropout rate: 4-year adjusted cohort (2015-2016) 52 (4.3%) 5,057 (8.0%)
Graduation rate: 4-year adjusted cohort (2015-2016) 1,141(93.7%) 55,586 (87.6%)
School-based arrests 0 (0.0%) 938 (4.0%)
HEALTH
Infant Mortality per 1,000 Live Births 10 (7.0) 478 (6.5)
Low-Birthweight 93 (6.5%) 6,264 (8.6%)
Uninsured Children 872 (3.1%) 51,944 (3.7%)
JUVENILE JUSTICE
Juvenile Arrests 574 22,705
Juvenile Arrest Rate per 10,000 Youth 460.8 375.6
Juvenile Arrest Black-White Disparity (Relative Rate Index) 5.00 3.00
CHILD WELFARE*
Family Foster Care (children in foster care) 99 4,542
Family Foster Care – Monthly Caseworker Visitation 98% 96%
Children Aged Out of Foster Care (12-month average) 6 454
Reunification 31 1313
ECONOMIC SUFFICIENCY
Students Receiving Free and Reduced School Meals (FARMs) 6,001 (33%) 382,726 (43%)
Supplemental Nutrition Assistance Program (SNAP) participation 6,994 376,619


48,804
Total Population37,2786,905
Child Population
Annual research on key child well-being indicators is conducted by Advocates for Children and Youth. Additional figures can be found on the KIDS COUNT Data Center. This data sheet is one part of a separate county-by-county evaluation prepared by Advocates for Children and Youth.
ADVOCATES FOR CHILDREN AND YOUTH | www.acy.org | [email protected] @MarylandACY
TALBOT COUNTYEvery statistic isn’t just a number – it’s a life. A child’s life.
*At the time of publication, current data not available. Child Welfare, 2016 Data
2017
INDICATOR TALBOT COUNTY
MARYLAND
EDUCATION
3rd Graders Not Meeting or Exceeding Expectations in Math – PARCC 202 (58.2%) 39,389 (57.0%)
8th Graders Not Meeting or Exceeding Expectations in Math – PARCC 205 (92.8%) 31,504 (83.2%)
3rd Graders Not Meeting or Exceeding Expectations in Reading – PARCC 202 (59.1%) 41,380 (60.2%)
8th Graders Not Meeting or Exceeding Expectations in Reading – PARCC 210 (66.7%) 38,489 (61.1%)
Suspension Rate (2016-2017) 164 (3.8%) 38,254 (4.5%)
Dropout rate: 4-year adjusted cohort (2015-2016) 36 (10.2%) 5,057 (8.0%)
Graduation rate: 4-year adjusted cohort (2015-2016) 301 (85.5%) 55,586 (87.6%)
School-based arrests 0 (0.0%) 938 (4.0%)
HEALTH
Infant Mortality per 1,000 Live Births 3 (LNE) 478 (6.5)
Low-Birthweight 25 (7.6%) 6,264 (8.6%)
Uninsured Children 384 (5.3%) 51,944 (3.7%)
JUVENILE JUSTICE
Juvenile Arrests 127 22,705
Juvenile Arrest Rate per 10,000 Youth 392.1 375.6
Juvenile Arrest Black-White Disparity (Relative Rate Index) 3.60 3.00
CHILD WELFARE*
Family Foster Care (children in foster care) 20 4,542
Family Foster Care – Monthly Caseworker Visitation 100% 96%
Children Aged Out of Foster Care (12-month average) 0 454
Reunification 2 1313
ECONOMIC SUFFICIENCY
Students Receiving Free and Reduced School Meals (FARMs) 2,118 (46%) 382,726 (43%)
Supplemental Nutrition Assistance Program (SNAP) participation 2,378 376,619
* Low Number Event – not statistically significant

48,804
Total Population150,29233,362
Child Population
Annual research on key child well-being indicators is conducted by Advocates for Children and Youth. Additional figures can be found on the KIDS COUNT Data Center. This data sheet is one part of a separate county-by-county evaluation prepared by Advocates for Children and Youth.
ADVOCATES FOR CHILDREN AND YOUTH | www.acy.org | [email protected] @MarylandACY
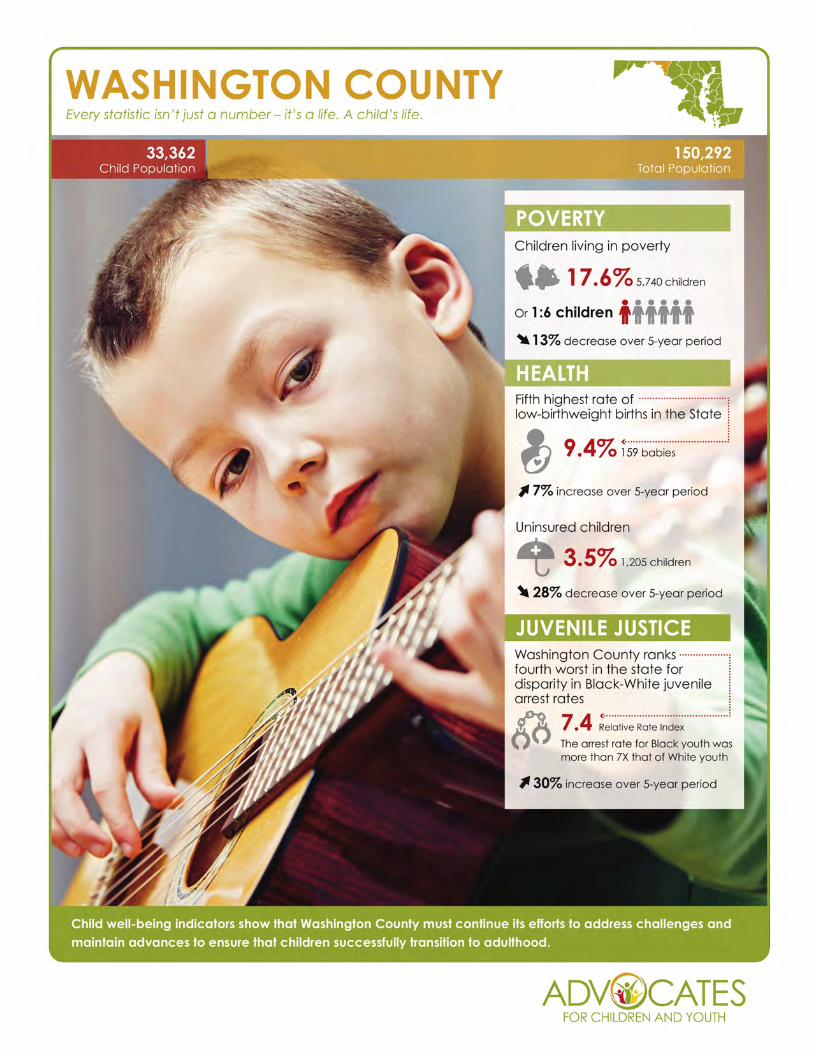
WASHINGTON COUNTYEvery statistic isn’t just a number – it’s a life. A child’s life.
*At the time of publication, current data not available. Child Welfare, 2016 Data
2017
INDICATOR WASHINGTON COUNTY
MARYLAND
EDUCATION
3rd Graders Not Meeting or Exceeding Expectations in Math – PARCC 1,159(67.6%) 39,389 (57.0%)
8th Graders Not Meeting or Exceeding Expectations in Math – PARCC 921 (92.9%) 31,504 (83.2%)
3rd Graders Not Meeting or Exceeding Expectations in Reading – PARCC 1,105 (64.2%) 41,380 (60.2%)
8th Graders Not Meeting or Exceeding Expectations in Reading – PARCC 1,093 (64.4%) 38,489 (61.1%)
Suspension Rate (2016-2017) 447(2.0%) 38,254 (4.5%)
Dropout rate: 4-year adjusted cohort (2015-2016) 111(6.7%) 5,057 (8.0%)
Graduation rate: 4-year adjusted cohort (2015-2016) 1,508 (91.1%) 55,586 (87.6%)
School-based arrests 0 (0.0%) 938 (4.0%)
HEALTH
Infant Mortality per 1,000 Live Births 12 (7.1) 478 (6.5)
Low-Birthweight 159 (9.4%) 6,264 (8.6%)
Uninsured Children 1,205 (3.5%) 51,944 (3.7%)
JUVENILE JUSTICE
Juvenile Arrests 744 22,705
Juvenile Arrest Rate per 10,000 Youth 482.1 375.6
Juvenile Arrest Black-White Disparity (Relative Rate Index) 7.40 3.00
CHILD WELFARE*
Family Foster Care (children in foster care) 167 4,542
Family Foster Care – Monthly Caseworker Visitation 98% 96%
Children Aged Out of Foster Care (12-month average) 19 454
Reunification 41 1313
ECONOMIC SUFFICIENCY
Students Receiving Free and Reduced School Meals (FARMs) 10,980 (49%) 382,726 (43%)
Supplemental Nutrition Assistance Program (SNAP) participation 11,941 376,619

48,804
Total Population102,57722,624
Child Population
Annual research on key child well-being indicators is conducted by Advocates for Children and Youth. Additional figures can be found on the KIDS COUNT Data Center. This data sheet is one part of a separate county-by-county evaluation prepared by Advocates for Children and Youth.
ADVOCATES FOR CHILDREN AND YOUTH | www.acy.org | [email protected] @MarylandACY
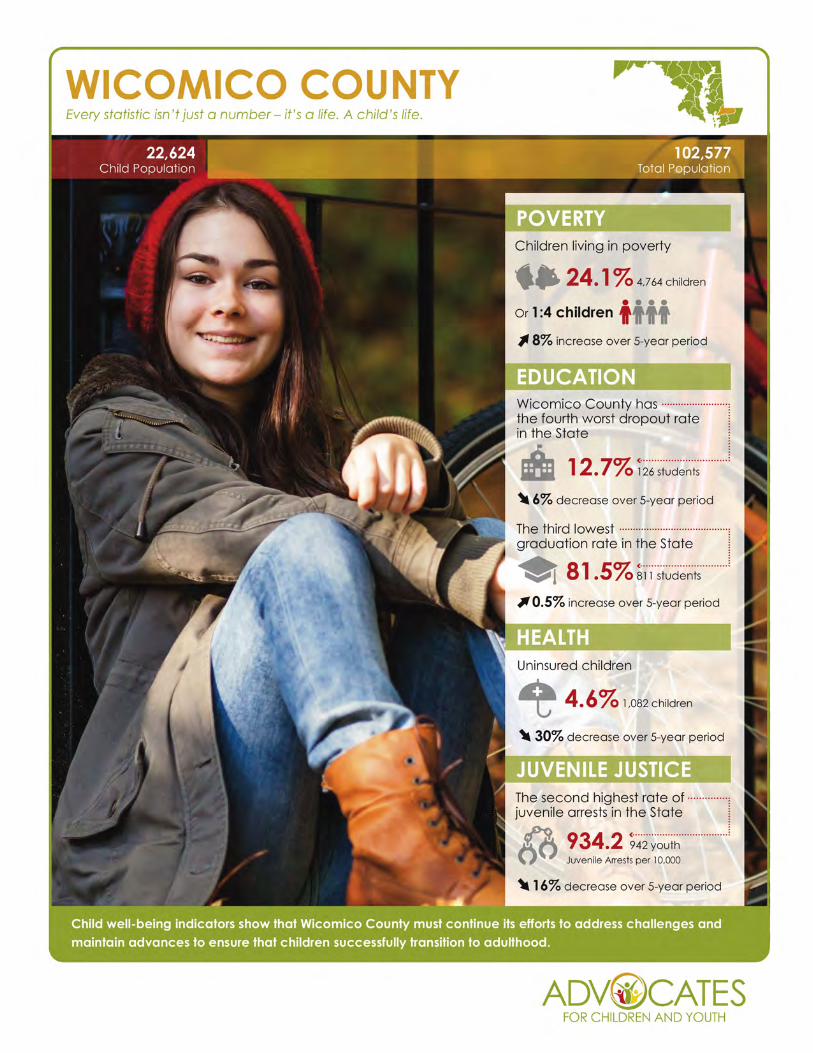
WICOMICO COUNTYEvery statistic isn’t just a number – it’s a life. A child’s life.
*At the time of publication, current data not available. Child Welfare, 2016 Data
2017
INDICATOR WICOMICO COUNTY
MARYLAND
EDUCATION
3rd Graders Not Meeting or Exceeding Expectations in Math – PARCC 668 (54.5%) 39,389 (57.0%)
8th Graders Not Meeting or Exceeding Expectations in Math – PARCC 657 (82.8%) 31,504 (83.2%)
3rd Graders Not Meeting or Exceeding Expectations in Reading – PARCC 794(65.4%) 41,380 (60.2%)
8th Graders Not Meeting or Exceeding Expectations in Reading – PARCC 669 (66.6%) 38,489 (61.1%)
Suspension Rate (2016-2017) 1,418(9.9%) 38,254 (4.5%)
Dropout rate: 4-year adjusted cohort (2015-2016) 126 (12.7%) 5,057 (8.0%)
Graduation rate: 4-year adjusted cohort (2015-2016) 811 (81.5%) 55,586 (87.6%)
School-based arrests 0 (0.0%) 938 (4.0%)
HEALTH
Infant Mortality per 1K Live Births 12 (9.7) 478 (6.5)
Low-Birthweight 112 (9.0%) 6,264 (8.6%)
Uninsured Children 1082 (4.6%) 51,944 (3.7%)
JUVENILE JUSTICE
Juvenile Arrests 942 22,705
Juvenile Arrest Rate per 10K 934.2 375.6
Juvenile Arrest Black-White Disparity (Relative Rate Index) 4.30 3.00
CHILD WELFARE*
Family Foster Care (children in foster care) 29 4,542
Family Foster Care – Monthly Caseworker Visitation 92% 96%
Children Aged Out of Foster Care (12-month average) 4 454
Reunification 4 1313
ECONOMIC SUFFICIENCY
Students Receiving Free and Reduced School Meals (FARMs) 8,894 (60%) 382,726 (43%)
Supplemental Nutrition Assistance Program (SNAP) participation 9,790 376,619


48,804
Total Population51,4449,065
Child Population
Annual research on key child well-being indicators is conducted by Advocates for Children and Youth. Additional figures can be found on the KIDS COUNT Data Center. This data sheet is one part of a separate county-by-county evaluation prepared by Advocates for Children and Youth.
ADVOCATES FOR CHILDREN AND YOUTH | www.acy.org | [email protected] @MarylandACY
WORCESTER COUNTYEvery statistic isn’t just a number – it’s a life. A child’s life.
*At the time of publication, current data not available. Child Welfare, 2016 Data
2017
INDICATOR WORCESTER COUNTY
MARYLAND
EDUCATION
3rd Graders Not Meeting or Exceeding Expectations in Math – PARCC 162 (34.0%) 39,389 (57.0%)
8th Graders Not Meeting or Exceeding Expectations in Math – PARCC 202 (54.3%) 31,504 (83.2%)
3rd Graders Not Meeting or Exceeding Expectations in Reading – PARCC 193 (40.5%) 41,380 (60.2%)
8th Graders Not Meeting or Exceeding Expectations in Reading – PARCC 216 (44.2%) 38,489 (61.1%)
Suspension Rate (2016-2017) 227 (3.6%) 38,254 (4.5%)
Dropout rate: 4-year adjusted cohort (2015-2016) 31 (6.2%) 5,057 (8.0%)
Graduation rate: 4-year adjusted cohort (2015-2016) 461 (91.7%) 55,586 (87.6%)
School-based arrests 0 (0.0%) 938 (4.0%)
HEALTH
Infant Mortality per 1,000 Live Births 8 (19.0) 478 (6.5)
Low-Birthweight 25(6.0%) 6,264 (8.6%)
Uninsured Children 434 (4.6%) 51,944 (3.7%)
JUVENILE JUSTICE
Juvenile Arrests 368 22,705
Juvenile Arrest Rate per 10,000 Youth 838.8 375.6
Juvenile Arrest Black-White Disparity (Relative Rate Index) 2.40 3.00
CHILD WELFARE*
Family Foster Care (children in foster care) 33 4,542
Family Foster Care – Monthly Caseworker Visitation 100% 96%
Children Aged Out of Foster Care (12-month average) 1 454
Reunification 13 1313
ECONOMIC SUFFICIENCY
Students Receiving Free and Reduced School Meals (FARMs) 2,939 (44%) 382,726 (43%)
Supplemental Nutrition Assistance Program (SNAP) participation 3,337 376,619

SOURCESEvery statistic isn’t just a number – it’s a life. A child’s life.
Infant Mortality: Maryland Department of Health and Mental Hygiene; Maryland Vital Statistics Annual Report
Low Birth Weight: Maryland Department of Health and Mental Hygiene; Maryland Vital Statistics Annual Report
Graduation: Department of Education, Maryland School Report Card
Dropout: Department of Education, Maryland School Report Card
Suspensions: Maryland State Department of Education, Suspension, Expulsion and Health Related Exclusions report.
Partnership for Assessment of Readiness for College and Careers (PARCC): Department of Education, Maryland School Report Card
Uninsured: 2015 U.S. Census, Small Area Health Insurance Estimates (SAHIE)
Poverty: 2016 US Census Bureau, Small Area Income and Poverty Estimates (SAIPE) with 90% confidence level
Family foster care: Maryland Department of Human Resources, SSA, Child Welfare Data
Juvenile Arrests: Arrest data from the Maryland State Police. Population data from Puzzanchera et al, Easy Access to Juvenile Populations: 1990-2014.
www.acy.org | [email protected]