2017 annual reports22.q4cdn.com/.../annual/2017/annualreport_2017_web.pdf4 2017 annual report when...
TRANSCRIPT

ANNUAL REPORTPINNACLE WEST CAPITAL CORPORATION
2017

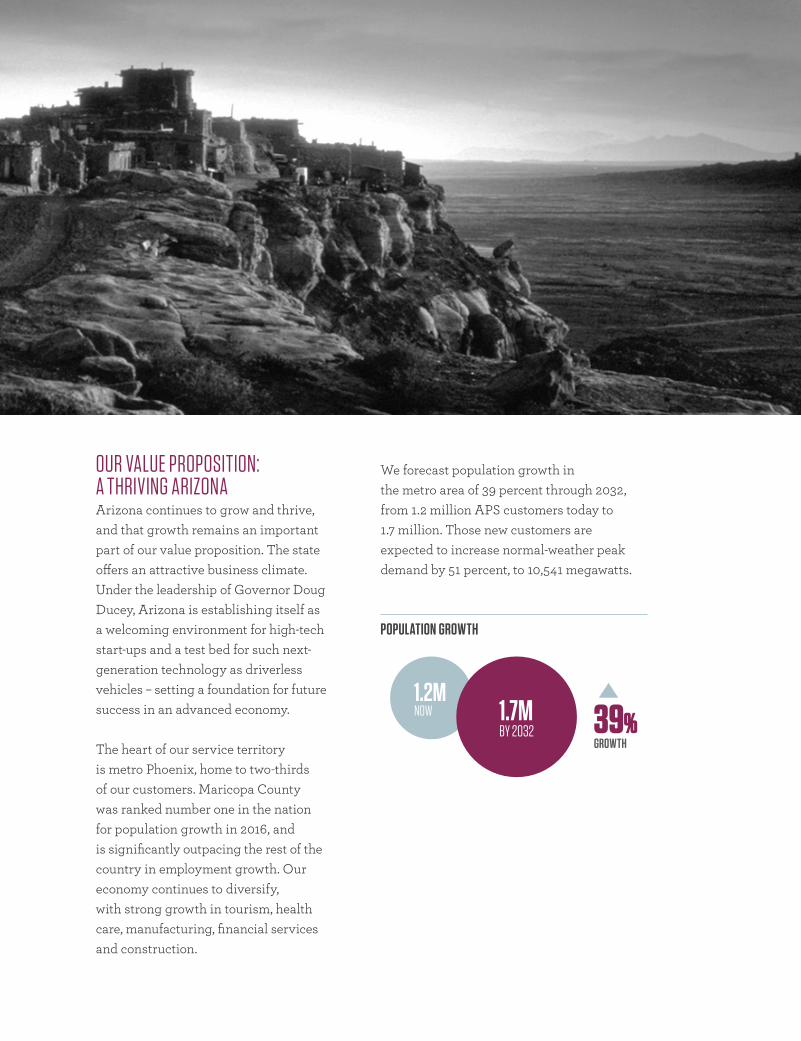
FEATURING THE PHOTOGRAPHY OF JERRY JACKA Known for his wide-ranging work featuring the Southwest and its indigenous peoples, Mr. Jacka’s photographs have been featured in National Geographic, Smithsonian Magazine and Arizona Highways. A native son of Arizona, Jerry served as a Maricopa County Deputy Sheriff in his early years, rising to the rank of Lieutenant before moving to photography full time. His recent passing brings into focus his contributions to the culture of our great state. Enjoy these timeless images of beauty, grace and power.
FEATURED WORK: White House Ruin in Canyon de Chelly (Cover), Mummy Cave in Canyon del Muerto (pg 8-9), Walpi Village on First Mesa (pg 10-11), White House Ruin in Canyon de Chelly (pg 12), Antelope House in Canyon del Muerto (pg 14-15).
2017

2017PINNACLE WEST CAPITAL CORPORATION COMBINES A SOLID FOUNDATION AND A CLEAR STRATEGY TO BUILD SHAREHOLDER VALUE...Superior reliability and operating performance across our business
Excellent customer service and deep community involvement
Affordable electricity rates
A cleaner, more flexible power generation portfolio
A constructive regulatory environment
Targeted investments in innovative technologies
An engaged workforce
Solid financial results
THE APS VISION Creating a sustainable energy future for Arizona.
THE APS MISSION We safely and efficiently generate and deliver reliable energy to meet the changing needs of our customers.
…WITH A SHARPENED FOCUS ON OUR CORE UTILITY BUSINESS.

2017 ANNUAL REPORT4
When we serve customers well and operate efficiently, our shareholders benefit. In 2017, Pinnacle West recorded earnings of $488.5 million, or $4.35 per share, exceeding earnings guidance. That compares favorably to net income of $442.0 million, or $3.95 per share, in 2016. Our consolidated earned return on average common equity was 9.96 percent.
Our board of directors increased the dividend for the sixth straight year, by 6 percent in 2017 to $2.78, for a dividend yield of 3.3 percent as of December 31, 2017. Our balance sheet remains strong due to disciplined financial management, earning the equivalent of A- ratings or better from the three major rating agencies.
Driven by strong company performance and favorable market conditions, shares of Pinnacle West rose to a new all-time closing high of $91.81 on November 30, 2017.
DEAR FELLOW SHAREHOLDERS
STRONG FINANCIAL RESULTS
Today’s customers depend on safe, highly reliable electricity that powers their lives 24 hours a day, seven days a week. They expect us to keep electricity affordable, and they demand real value in return. They push us to stay ahead of the latest advances in customer technology and integrate them onto an increasingly smart and connected energy grid. And for 130 years, our customers have trusted us to be responsible stewards of the environment and deeply involved in the communities we serve.
I’m pleased, and intensely proud, to say our principal subsidiary, Arizona Public Service, delivered on those responsibilities in 2017.

5PINNACLE WEST CAPITAL CORPORATION
CHAIRMAN, PRESIDENT AND CHIEF EXECUTIVE OFFICER
DONALD E. BRANDT
As we navigate continued changes in our industry, your company is well positioned for sustainable success and industry-leading financial performance.

2017Our customers now have more choice and control over their energy bills.

7PINNACLE WEST CAPITAL CORPORATION
SERVING CUSTOMERS WELLOur customers enjoy electricity service that continues, year after year, to be among the most reliable in our industry.
With the implementation of our new customer care and billing system, completed in 2017, our customers have greater access to timely account updates, more self-service options on our website, real-time payment processing and increased account security.Thanks to the 2017 decision by the Arizona Corporation Commission (ACC) that modernized electricity rates, our customers now have more choice and control over their energy bills.
In February 2018, the ACC also approved our proposal to pass along $119 million in savings from federal tax reform, lowering the average residential customer bill by $5.40 each month. We anticipate that additional tax savings will be passed on to customers after the full impact of the new law is determined.
TOTAL SHAREHOLDER RETURN SINCE 2009
RATE REVIEW DECISIONWhen the ACC completed its review of our rates in August 2017, our first in five years, it marked the end of a rigorous process that involved 40 intervenors, thousands of data requests and dozens of public hearings. Demonstrating what can be accomplished when people come together to resolve complex policy issues, we were able to reach a broad settlement agreement with 29 of the parties in the proceeding. The ACC staff, the Residential Utility Consumer Office,
18.8 % PINNACLE WEST
16.2% S&P 500
11.8% INDUSTRY PEERS
0%
10%
20%
Total shareholder return was 12.7 percent, 41.2 percent, 38.4 percent and 100.7 percent for 1, 2, 3 and 5-year periods, respectively, outperforming the electric utility industry in all periods. Our market capitalization increased by $0.8 billion during 2017 and stood at $9.5 billion on December 31, 2017.
These positive results continued a history of strong performance. Long-term Pinnacle West shareholders have earned a total annualized return of 18.8 percent since 2009, compared to the annualized returns of the S&P 1500 Electric Utilities index of 11.8 percent, and the S&P 500 index of 16.2 percent.

2017 ANNUAL REPORT8
limited-income advocates, environmental groups, business customers, merchant generators and, significantly, private rooftop solar organizations all joined the agreement. It was subsequently reviewed and recommended by an administrative law judge, and approved by the Commission, making APS among the first utilities in the nation to resolve the controversy over net metering through a negotiated agreement.
The agreement included a $95 million revenue increase, which translated to a 3.3 percent average increase in rates across all customer classes, and an allowed return on equity of 10 percent. The rate review also increased annual funding for limited-income assistance from $35 million to $48 million, and allocated $1.25 million in annual crisis bill assistance. The newly approved rate plans offer a demand component, which provides incentives for customers to reduce their peak usage, creating another way for them to manage their monthly bills and further aligning customer rates with wholesale energy prices.
The decision was a victory for sound long-term energy policy in Arizona.
This forward-thinking rate reform will begin to update our industry’s century-old rate model to reflect the new realities of advancing energy technology, an evolving generation mix and the changing usage patterns of today’s electricity consumers.
Reducing our carbon intensity and deploying a diverse, cleaner energy mix is good for our customers, our communities and the environment. Forward-thinking investments in advanced energy technology, including microgrids and battery storage, have also positioned us at the forefront of our industry.
The company’s 2017 Integrated Resource Plan details our comprehensive strategies to meet customers’ projected energy needs, fulfill regulatory targets and manage environmental impacts over the next 15 years. The plan is projected to reduce our carbon intensity by 23 percent.
We are working to achieve a cleaner energy mix by closing older coal units, increasing environmental controls at existing units, modernizing natural gas plants, using more renewable energy and increasing energy efficiency. In addition, the Palo Verde Generating Station, the nation’s largest carbon-free energy resource, provides
A CLEANER ENERGY MIX
We plan to build on the progress achieved in our rate review with an energy efficiency strategy that shifts the focus to a smarter use of electricity from simply using less of it. We have proposed new programs that include incentives for smart thermostats, electric vehicle charging infrastructure, energy storage, a reverse demand-response initiative and a pilot program to introduce electric-powered school buses.

9PINNACLE WEST CAPITAL CORPORATION
Reducing our carbon intensity and deploying a diverse, cleaner energy mix is good for our customers, our communities and the environment.
80 percent of Arizona’s carbon-free energy. For the first time in Palo Verde history, both spring and fall outages in 2017 were completed in 30 days. The plant closed 2017 with a 93.8 percent capacity factor, generating 32.3 million megawatt-hours.
As we have invested in environmental controls and peaking capacity upgrades for existing plants, we are also at the forefront of energy companies studying and deploying advanced infrastructure to enable reliable and cost-efficient integration of emerging technologies onto the grid.
Our industry-leading Solar Partner Program received a prominent industry award for its research into integrating private rooftop solar onto the grid while maintaining reliability for customers.
We are moving forward with our Solar Innovation Study, which will help us determine how customers can use various combinations of distributed energy resources, such as solar panels, battery storage, advanced thermostats and high-efficiency HVAC systems, to better manage their energy usage and bills. And the APS Solar Communities program will enable limited-income residential customers and multi-family complexes, Title 1 schools, non-profits and other customers to participate in a rooftop solar program owned and installed by APS in exchange for a monthly bill credit.
CAPACITY FACTORMEGAWATT -HOURS
93.8%32.3M
In 2017, our dedication to environmental stewardship was recognized with our first “Leadership” rating from CDP (formerly the Carbon Disclosure Project) for climate change and water management due to our governance, strategy and risk management actions. Pinnacle West was one of only two U.S. utilities awarded Leadership ratings, which is the highest rating, from CDP for both climate change and water management.
PALO VERDE 2017 STATS

1,500MW
23%CARBON INTENSITY REDUCTION PROJECTED IN THE 2017 INTEGRATED RESOURCE PLAN
OUR RENEWABLE PORTFOLIO EXCEEDS


In 2017, we were among the first electric companies to deploy battery storage technology in a new and innovative way, with installations in two sections of the Phoenix metropolitan area with high solar penetration. In November, we broke ground on another battery storage project, using the relatively new technology to solve an age-old problem: powering rural areas. Rather than rebuilding 20 miles of power lines to serve a growing rural town, we are installing two battery storage systems – a cost-effective alternative to power lines traversing rough, hilly terrain. We expect the system to be operational in the first half of 2018.
Our two microgrid projects came online at the end of 2016 and proved to be valuable resources for reliability in 2017, mitigating 39 grid frequency, capacity or voltage events during the year. The microgrids were vital to providing reliable power during the state’s third-hottest June on record and our highest peak demand in company history.
ADVANCED TECHNOLOGIESWe invested smartlyand emerged as oneof the national leadersin microgrids andbattery storage.
Arizona continues to grow and thrive, and that growth remains an important part of our value proposition. The state offers an attractive business climate. Under the leadership of Governor Doug Ducey, Arizona is establishing itself as a welcoming environment for high-tech start-ups and a test bed for such next-generation technology as driverless vehicles – setting a foundation for future success in an advanced economy.
The heart of our service territory is metro Phoenix, home to two-thirds of our customers. Maricopa County was ranked number one in the nation for population growth in 2016, and is significantly outpacing the rest of the country in employment growth. Our economy continues to diversify, with strong growth in tourism, health care, manufacturing, financial services and construction.
OUR VALUE PROPOSITION: A THRIVING ARIZONA
We forecast population growth in the metro area of 39 percent through 2032, from 1.2 million APS customers today to 1.7 million. Those new customers are expected to increase normal-weather peak demand by 51 percent, to 10,541 megawatts.
POPULATION GROWTH
1.7MBY 2032 39%
GROWTH
1.2MNOW


15PINNACLE WEST CAPITAL CORPORATION
COMMUNITY IMPACTJust as our company’s long history is intertwined with the history of Arizona, our future success is enhanced when Arizona is growing and prosperous. That’s why we are actively involved in making our state a better place to live, work and play. Last year, we contributed $9.8 million to Arizona communities, $1.4 million of which funded science, technology, engineering and math education programs across the state. Our employees contributed more than 110,000 volunteer hours to causes of their choice, and our annual Community Services Fund campaign yielded employee pledges of $2.4 million for deserving nonprofit organizations.
The numbers, although significant, can never do justice to the human stories behind them. As I write this letter, 46 of our employees are in the Toa Alta region of Puerto Rico, a densely forested area that sustained terrible damage from Hurricanes Irma and Maria. When I think about the special character that defines so many of our APS employees, I think about Donny Luster.
As his team worked to restore power to a devastated neighborhood, Donny came across an elderly woman living alone in a home that had been damaged worse than most by the storm. The roof was torn completely away, the contents of her home were destroyed and the electrical wiring was so badly damaged that it was unsafe for our crew to restore power to the home.
COMMUNITY GIVING SUMMARY
$9.8MTO SCIENCE, TECHNOLOGY,
ENGINEERING AND MATH EDUCATION PROGRAMS
TOTAL$1.4M
110,000VOLUNTEER HOURS
The woman remained in Donny’s thoughts, and two weeks later he returned. He’d taken up a collection among his teammates and hired a licensed, bonded contractor to repair the roof. Donny spent his only time off after 12 consecutive days of grueling restoration work helping to repair the woman’s house.
Donny’s leadership was impressive, but it was not a surprise. Going over and above in the name of service is our way of life at APS. It’s what we do.

2017 ANNUAL REPORT16
CHAIRMAN, PRESIDENT AND CHIEF EXECUTIVE OFFICER
DONALD E. BRANDT
As we navigate continued changes in our industry, your company is well positioned for sustainable success and industry-leading financial performance. We recognize the importance of shareholder capital entrusted to us, and we intend to provide a competitive return on your investment. Last year set an important foundation with new collaborations, new ways to connect with our customers and new rate structures that begin to align rates with costs. But among all that is new, one thing remains unchanged: our commitment to our customers, our employees, our shareholders and our communities.
IN CLOSING

INFORMATIONFinancial

2017 ANNUAL REPORT18
BOARD MEMBERS & OFFICERSPINNACLE WEST AND ARIZONA PUBLIC SERVICE BOARD MEMBERS
DONALD E. BRANDT 2009 Chairman of the Board, President & Chief Executive Officer, Pinnacle West and APS
DENIS A. CORTESE, M.D. 2010 Director, Health Care Delivery and Policy Program, Arizona State University; Emeritus President & Chief Executive Officer, Mayo Clinic
RICHARD P. FOX 2014 Independent Business Consultant
MICHAEL L. GALLAGHER 1997 Chairman Emeritus, Gallagher & Kennedy, P.A.
ROY A. HERBERGER, JR., PH.D.* 1992 President Emeritus, Thunderbird School of Global Management
DALE E. KLEIN, PH.D. 2010 Associate Vice Chancellor for Research, University of Texas System; Former Chairman, U.S. Nuclear Regulatory Commission
HUMBERTO S. LOPEZ 1995 Chairman, HSL Properties, Inc.
KATHRYN L. MUNRO 1999 Principal, BridgeWest, LLC
BRUCE J. NORDSTROM 1997 President & Certified Public Accountant, Nordstrom & Associates, P.C.
PAULA J. SIMS 2016 Professor of Practice and Executive Coach, University of North Carolina at Chapel Hill
DAVID P. WAGENER 2014 Managing Partner, Wagener Capital Management
PINNACLE WEST OFFICERS
DONALD E. BRANDT 2002 Chairman of the Board, President & Chief Executive Officer
DAVID P. FALCK** 2009 Executive Vice President, Law
JEFFREY B. GULDNER 2004 Executive Vice President, Public Policy & General Counsel
JAMES R. HATFIELD 2008 Executive Vice President & Chief Financial Officer
ROBERT S. AIKEN 1986 Vice President, Federal Affairs
DENISE R. DANNER 2009 Vice President, Controller & Chief Accounting Officer
LEE R. NICKLOY 2010 Vice President & Treasurer
DIANE WOOD 1998 Assistant Vice President & Secretary
ARIZONA PUBLIC SERVICE OFFICERS
DONALD E. BRANDT Chairman of the Board, President & Chief Executive Officer
ROBERT S. BEMENT 2007 Executive Vice President & Chief Nuclear Officer, Palo Verde Generating Station
DANIEL T. FROETSCHER 1980 Executive Vice President, Operations
JEFFREY B. GULDNER Executive Vice President, Public Policy & General Counsel
JAMES R. HATFIELD Executive Vice President & Chief Financial Officer
MARK A. SCHIAVONI*** 2009 Executive Vice President
JOHN J. CADOGAN 2009 Senior Vice President, Site Operations, Palo Verde Generating Station
MARIA L. LACAL 2007 Senior Vice President, Regulatory & Oversight, Palo Verde Generating Station
BRAD ALBERT 1984 Vice President, Resource Management
ANN C. BECKER 2001 Vice President & Chief Procurement Officer
DENISE R. DANNER Vice President, Controller & Chief Accounting Officer
STACY L. DERSTINE 1995 Vice President, Customer Service & Chief Customer Officer
PATRICK DINKEL 1986 Vice President, Environmental & Chief Sustainability Officer
DONNA M. EASTERLY 1984 Vice President, Human Resources & Ethics
TED N. GEISLER 2001 Vice President & Chief Information Officer
DAVID A. HANSEN 1980 Vice President, Fossil Generation
JOHN S. HATFIELD 2010 Vice President, Communications
CHARLES KHARRL 2007 Vice President, Site Operations & General Plant Manager, Palo Verde Generating Station
BARBARA D. LOCKWOOD 1999 Vice President, Regulation
MICHAEL E. MCLAUGHLIN 2011 Vice President, Operations Support, Palo Verde Generating Station
LEE R. NICKLOY Vice President & Treasurer
JESSICA M. PACHECO 2009 Vice President, State & Local Affairs
BRUCE RASH 2016 Vice President, Nuclear Engineering, Palo Verde Generating Station
JACOB TETLOW 2001 Vice President, Transmission & Distribution Operations
DIANE WOOD Secretary
The year shown indicates when the Officer was first employed by, or the individual first became a Director of, Pinnacle West or APS.
*Retiring May 2018**Retiring April 2018***Retiring August 2018

19PINNACLE WEST CAPITAL CORPORATION
PINNACLE WEST HIGHLIGHTS
STOCK PERFORMANCE COMPARISON
(dollars and shares in millions, except per share amounts)
(value of $100 invested as of December 31, 2012, with dividends reinvested)
2017 2016 2015
STOCK SUMMARY
Stock price per share—year-end $85.18 $78.03 $64.48
Market capitalization—year-end $9,519 $8,688 $7,156
Common shares outstanding—year-end 111.8 111.4 111.1
PER SHARE HIGHLIGHTS (DILUTED)
Earnings per share—net income attributable to common shareholders $4.35 $3.95 $3.92
Indicated annual dividend—year-end $2.78 $2.62 $2.50
CAPITAL EXPENDITURES $1,369 $1,254 $1,060
OPERATING STATISTICS
Retail electric sales (GWh) 28,018 28,022 27,951
Total electric sales (GWh) 30,893 31,789 34,291
Average retail revenue (per kWh) 12.16¢ 11.90¢ 11.76¢
Generating capacity owned or leased—year-end (MW) 6,236 6,236 6,186
Generation output (GWh) 25,034 24,849 27,452
System peak load (MW) 7,363 7,051 7,031
Electric customers—year-end 1,227,765 1,205,478 1,190,242
Employees—year-end 6,292 6,339 6,407
$225
$200
$175
$150
$125
$100
$75Pinnacle West Common Stock
Edison Electric Institute Index
S&P 500 Index
$100$100$100
2012
$108$113$132
2013
$145$146$150
2014
$142$140$153
2015
$178$164$171
2016
$201$184$208
2017

2017 ANNUAL REPORT20
CONDENSED CONSOLIDATED FINANCIAL STATEMENTS(dollars in millions)
2017 2016 2015
CONDENSED CONSOLIDATED STATEMENTS OF INCOME YEAR ENDED DECEMBER 31,
Operating revenues $3,565 $3,499 $3,496
Fuel and purchased power (981) (1,076) (1,101)
Other operating expenses (1,650) (1,567) (1,540)
Operating income 934 856 855
Net other income 29 27 18
Interest expense (198) (186) (179)
Income taxes (258) (236) (238)
Net income 507 461 456
Less: Net income attributable to noncontrolling interests 19 19 19
Net income attributable to common shareholders $488 $442 $437
CONDENSED CONSOLIDATED BALANCE SHEETS YEAR ENDED DECEMBER 31,
ASSETS
Current assets $1,016 $822 $890
Investments and other assets 956 849 800
Property, plant and equipment - net 13,445 12,714 11,809
Deferred debits 1,602 1,619 1,529
Total assets $17,019 $16,004 $15,028
LIABILITIES AND EQUITY
Current liabilities, excluding current maturities of long-term debt $1,116 $1,167 $1,085
Long-term debt 4,871 4,147 3,820
Deferred credits and other 5,896 5,754 5,404
Total equity 5,136 4,936 4,719
Total liabilities and equity $17,019 $16,004 $15,028
CONDENSED CONSOLIDATED STATEMENTS OF CASH FLOWS YEAR ENDED DECEMBER 31,
Cash and cash equivalents at beginning of year $9 $40 $8
Net cash flow provided by operating activities 1,118 1,023 1,094
Net cash flow used for investing activities (1,429) (1,252) (1,066)
Net cash flow provided by financing activities 316 198 4
Cash and cash equivalents at end of year $14 $9 $40
Complete audited consolidated financial statements are included in our Annual Report on Form 10-K.

21PINNACLE WEST CAPITAL CORPORATION
FORWARD-LOOKING STATEMENTSThis report contains forward-looking statements based on current expectations. These forward-looking statements are often identified by words such as “estimate,” “predict,” “may,” “believe,” “plan,” “expect,” “require,” “intend,” “assume” and similar words. Because actual results may differ materially from expectations, we caution you not to place undue reliance on these statements. A number of factors could cause future results to differ materially from historical results, or from outcomes currently expected or sought by us. A discussion of some of these risks and uncertainties is contained in our Annual Report on Form 10-K and is available on our website at PinnacleWest.com, which you should review carefully before placing any reliance on our forward-looking statements, financial statements or disclosures. We assume no obligation to update any forward-looking statements, even if our internal estimates change, except as may be required by applicable law.

2017 ANNUAL REPORT22
SHAREHOLDER INFORMATIONINVESTORS ADVANTAGE PLAN AND SHAREHOLDER ACCOUNT INFORMATIONPinnacle West offers a direct stock purchase plan. Any interested investor may purchase Pinnacle West common stock through the Investors Advantage Plan. Features of the Plan include a variety of options for reinvesting dividends, direct deposit of cash dividends, automatic monthly investment, certificate safekeeping and more. An Investors Advantage Plan prospectus and enrollment materials may be obtained by calling Computershare at (800) 457-2983, by visiting computershare.com/investor or by writing to:
ComputershareP.O. Box 43078Providence, Rhode Island 02940-3078
FORM 10-K Pinnacle West’s 2017 Annual Report on Form 10-K filed with the Securities and Exchange Commission is available on our website or by writing to the Office of the Secretary.
STATISTICAL REPORTA detailed Statistical Report for Financial Analysis for 2013 to 2017 is available on our website.
CORPORATE RESPONSIBILITY REPORTThe Pinnacle West Corporate Responsibility Reportis available on our website.
INVESTOR RELATIONS CONTACTStefanie A. Layton(602) 250-4541
CORPORATE WEBSITEPinnacleWest.com
STOCK LISTINGTICKER SYMBOLPNW on New York Stock Exchange
TRANSFER AGENT AND REGISTRARComputershare P.O. Box 43078Providence, Rhode Island02940-3078computershare.com/investor
ADMINISTRATIVE INFORMATIONCOMPANY CONTACT Jacqueline Patterson (602) [email protected]
ANNUAL MEETING OF SHAREHOLDERSMay 16, 2018 10:30 a.m. MST
SHAREHOLDERS MAY PARTICIPATE IN THE ANNUAL MEETING BY LOGGING ON TO THE FOLLOWING WEBSITE:VirtualShareholderMeeting.com/PNW
CORPORATE HEADQUARTERS400 North 5th StreetPhoenix, Arizona 85004
MAILING ADDRESSP.O. Box 53999Phoenix, Arizona 85072-3999
MAIN TELEPHONE NUMBER (602) 250-1000

UNITED STATES
SECURITIES AND EXCHANGE COMMISSION WASHINGTON, D.C. 20549
FORM 10-K (Mark One)
ANNUAL REPORT PURSUANT TO SECTION 13 OR 15(d) OF THE SECURITIES EXCHANGE ACT OF 1934 For the fiscal year ended December 31, 2017
OR TRANSITION REPORT PURSUANT TO SECTION 13 OR 15(d) OF THE SECURITIES EXCHANGE ACT OF 1934
For the transition period from to Commission File Number Registrants; State of Incorporation;
Addresses; and Telephone Number IRS Employer Identification No.
1-8962
PINNACLE WEST CAPITAL CORPORATION (An Arizona corporation) 400 North Fifth Street, P.O. Box 53999 Phoenix, Arizona 85072-3999 (602) 250-1000
86-0512431
1-4473
ARIZONA PUBLIC SERVICE COMPANY (An Arizona corporation) 400 North Fifth Street, P.O. Box 53999 Phoenix, Arizona 85072-3999 (602) 250-1000
86-0011170
Securities registered pursuant to Section 12(b) of the Act: Title Of Each Class Name Of Each Exchange On Which Registered PINNACLE WEST CAPITAL CORPORATION
Common Stock, No Par Value
New York Stock Exchange
ARIZONA PUBLIC SERVICE COMPANY None None Securities registered pursuant to Section 12(g) of the Act: ARIZONA PUBLIC SERVICE COMPANY Common Stock, Par Value $2.50 per share Indicate by check mark if the registrant is a well-known seasoned issuer, as defined in Rule 405 of the Securities Act
PINNACLE WEST CAPITAL CORPORATION Yes No
ARIZONA PUBLIC SERVICE COMPANY Yes No
Indicate by check mark if the registrant is not required to file reports pursuant to Section 13 or Section 15(d) of the Act.
PINNACLE WEST CAPITAL CORPORATION Yes No
ARIZONA PUBLIC SERVICE COMPANY Yes No
Indicate by check mark whether the registrant (1) has filed all reports required to be filed by Section 13 or 15(d) of the Securities Exchange Act of 1934 during the preceding 12 months (or for such shorter period that the registrant was required to file such reports), and (2) has been subject to such filing requirements for the past 90 days.
PINNACLE WEST CAPITAL CORPORATION Yes No
ARIZONA PUBLIC SERVICE COMPANY Yes No
Indicate by check mark whether the registrant has submitted electronically and posted on its corporate Web site, if any, every Interactive Data File required to be submitted and posted pursuant to Rule 405 of Regulation S-T during the preceding 12 months (or for such shorter period that the registrant was required to submit and post such files).
PINNACLE WEST CAPITAL CORPORATION Yes No
ARIZONA PUBLIC SERVICE COMPANY Yes No
Indicate by check mark if disclosure of delinquent filers pursuant to Item 405 of Regulation S-K is not contained herein, and will not be contained, to the best of registrant’s knowledge, in definitive proxy or information statements incorporated by reference in Part III of this Form 10-K or in any amendment to this Form 10-K. Indicate by check mark whether the registrant is a large accelerated filer, an accelerated filer, a non-accelerated filer, a smaller reporting company, or an emerging growth company. See the definitions of “large accelerated filer,” “accelerated filer,” “smaller reporting company,” and "emerging growth company" in Rule 12b-2 of the Exchange Act. (Check one):
PINNACLE WEST CAPITAL CORPORATION
Large accelerated filer Accelerated filer
Non-accelerated filer Smaller reporting company (Do not check if a smaller reporting company) Emerging growth company ☐
ARIZONA PUBLIC SERVICE COMPANY Large accelerated filer Accelerated filer
Non-accelerated filer Smaller reporting company (Do not check if a smaller reporting company) Emerging growth company ☐
If an emerging growth company, indicate by check mark if the registrant has elected not to use the extended transition period for complying with any new or revised financial accounting standards provided pursuant to Section 13(a) of the Exchange Act. ☐ Indicate by check mark whether each registrant is a shell company (as defined in Rule 12b-2 of the Act). Yes No State the aggregate market value of the voting and non-voting common equity held by non-affiliates, computed by reference to the price at which the common equity was last sold, or the average bid and asked price of such common equity, as of the last business day of each registrant’s most recently completed second fiscal quarter:
PINNACLE WEST CAPITAL CORPORATION
$9,461,736,502.18 as of June 30, 2017
ARIZONA PUBLIC SERVICE COMPANY
$0 as of June 30, 2017
The number of shares outstanding of each registrant’s common stock as of February 16, 2018 PINNACLE WEST CAPITAL CORPORATION
111,799,789 shares
ARIZONA PUBLIC SERVICE COMPANY
Common Stock, $2.50 par value, 71,264,947 shares. Pinnacle West Capital Corporation is the sole holder of Arizona Public Service Company’s Common Stock.
DOCUMENTS INCORPORATED BY REFERENCE Portions of Pinnacle West Capital Corporation’s definitive Proxy Statement relating to its Annual Meeting of Shareholders to be held on May 16, 2018 are incorporated by reference into Part III hereof.
Arizona Public Service Company meets the conditions set forth in General Instruction I(1)(a) and (b) of Form 10-K and is therefore filing this form with the reduced disclosure format allowed under that General Instruction.

i
TABLE OF CONTENTS
Page
GLOSSARY OF NAMES AND TECHNICAL TERMS FORWARD-LOOKING STATEMENTS PART I
Item 1. BusinessItem 1A. Risk FactorsItem 1B. Unresolved Staff CommentsItem 2. PropertiesItem 3. Legal ProceedingsItem 4. Mine Safety DisclosuresExecutive Officers of Pinnacle West
PART II
Item 5. Market for Registrants’ Common Equity, Related Stockholder Matters and Issuer Purchases of Equity Securities
Item 6. Selected Financial DataItem 7. Management’s Discussion and Analysis of Financial Condition and Results of OperationsItem 7A. Quantitative and Qualitative Disclosures About Market RiskItem 8. Financial Statements and Supplementary Data
Pinnacle West Financial StatementsAPS Financial StatementsCombined Notes to Consolidated Financial Statements
Item 9. Changes in and Disagreements with Accountants on Accounting and Financial DisclosureItem 9A. Controls and ProceduresItem 9B. Other Information
PART III
Item 10. Directors, Executive Officers and Corporate Governance of Pinnacle WestItem 11. Executive CompensationItem 12. Security Ownership of Certain Beneficial Owners and Management and Related Stockholder MattersItem 13. Certain Relationships and Related Transactions, and Director IndependenceItem 14. Principal Accountant Fees and Services
PART IV
Item 15. Exhibits and Financial Statement Schedules
SIGNATURES
This combined Form 10-K is separately filed by Pinnacle West and APS. Each registrant is filing on its own behalf all of the
information contained in this Form 10-K that relates to such registrant and, where required, its subsidiaries. Except as stated in the preceding sentence, neither registrant is filing any information that does not relate to such registrant, and therefore makes no representation as to any such information. The information required with respect to each company is set forth within the applicable items. Item 8 of this report includes Consolidated Financial Statements of Pinnacle West and Consolidated Financial Statements of APS. Item 8 also includes Combined Notes to Consolidated Financial Statements.
ii
1
22
284041444445
46
46474981828695
101179179180
180180180181182183
184184
205

ii
GLOSSARY OF NAMES AND TECHNICAL TERMS
4CA 4C Acquisition, LLC, a wholly-owned subsidiary of Pinnacle Westac Alternating CurrentACC Arizona Corporation CommissionADEQ Arizona Department of Environmental QualityAFUDC Allowance for Funds Used During ConstructionANPP Arizona Nuclear Power Project, also known as Palo VerdeAPS Arizona Public Service Company, a subsidiary of the CompanyARO Asset retirement obligationsASU Accounting Standards UpdateBART Best available retrofit technologyBase Fuel Rate The portion of APS’s retail base rates attributable to fuel and purchased power costsBCE Bright Canyon Energy Corporation, a subsidiary of the CompanyBHP Billiton BHP Billiton New Mexico Coal, Inc.BNCC BHP Navajo Coal CompanyCAISO California Independent System OperatorCCR Coal combustion residualsCholla Cholla Power Plantdc Direct Current
distributed energy systems Small-scale renewable energy technologies that are located on customers’ properties, such as rooftop solar systemsDOE United States Department of EnergyDOI United States Department of the InteriorDOJ United States Department of JusticeDSM Demand side managementEES Energy Efficiency StandardEl Dorado El Dorado Investment Company, a subsidiary of the CompanyEl Paso El Paso Electric CompanyEPA United States Environmental Protection AgencyFERC United States Federal Energy Regulatory CommissionFour Corners Four Corners Power PlantGWh Gigawatt-hour, one billion watts per hourkV Kilovolt, one thousand voltskWh Kilowatt-hour, one thousand watts per hourLFCR Lost Fixed Cost Recovery MechanismMMBtu One million British Thermal UnitsMW Megawatt, one million wattsMWh Megawatt-hour, one million watts per hourNative Load Retail and wholesale sales supplied under traditional cost-based rate regulationNavajo Plant Navajo Generating StationNERC North American Electric Reliability CorporationNRC United States Nuclear Regulatory CommissionNTEC Navajo Transitional Energy Company, LLCOCI Other comprehensive incomeOSM Office of Surface Mining Reclamation and EnforcementPalo Verde Palo Verde Generating Station or PVGSPinnacle West Pinnacle West Capital Corporation (any use of the words “Company,” “we,” and “our” refer to Pinnacle West)PSA Power supply adjustor approved by the ACC to provide for recovery or refund of variations in actual fuel and
purchased power costs compared with the Base Fuel RateRES Arizona Renewable Energy Standard and TariffSalt River Project or SRP Salt River Project Agricultural Improvement and Power DistrictSCE Southern California Edison CompanyTCA Transmission cost adjustorTEAM Tax expense adjustor mechanismVIE Variable interest entity

1
FORWARD-LOOKING STATEMENTS
This document contains forward-looking statements based on current expectations. These forward-looking statements are often identified by words such as “estimate,” “predict,” “may,” “believe,” “plan,” “expect,” “require,” “intend,” “assume,” “project” and similar words. Because actual results may differ materially from expectations, we caution readers not to place undue reliance on these statements. A number of factors could cause future results to differ materially from historical results, or from outcomes currently expected or sought by Pinnacle West or APS. In addition to the Risk Factors described in Item 1A and in Item 7 — “Management’s Discussion and Analysis of Financial Condition and Results of Operations,” these factors include, but are not limited to:
• our ability to manage capital expenditures and operations and maintenance costs while maintaining reliability and customer service levels;
• variations in demand for electricity, including those due to weather, seasonality, the general economy, customer and sales growth (or decline), and the effects of energy conservation measures and distributed generation;
• power plant and transmission system performance and outages;• competition in retail and wholesale power markets;• regulatory and judicial decisions, developments and proceedings;• new legislation, ballot initiatives and regulation, including those relating to environmental requirements,
regulatory policy, nuclear plant operations and potential deregulation of retail electric markets;• fuel and water supply availability;• our ability to achieve timely and adequate rate recovery of our costs, including returns on and of debt and
equity capital investment;• our ability to meet renewable energy and energy efficiency mandates and recover related costs;• risks inherent in the operation of nuclear facilities, including spent fuel disposal uncertainty;• current and future economic conditions in Arizona, including in real estate markets;• the development of new technologies which may affect electric sales or delivery;• the cost of debt and equity capital and the ability to access capital markets when required;• environmental, economic and other concerns surrounding coal-fired generation, including regulation of
greenhouse gas emissions;• volatile fuel and purchased power costs;• the investment performance of the assets of our nuclear decommissioning trust, pension, and other
postretirement benefit plans and the resulting impact on future funding requirements;• the liquidity of wholesale power markets and the use of derivative contracts in our business;• potential shortfalls in insurance coverage;• new accounting requirements or new interpretations of existing requirements;• generation, transmission and distribution facility and system conditions and operating costs;• the ability to meet the anticipated future need for additional generation and associated transmission facilities
in our region;• the willingness or ability of our counterparties, power plant participants and power plant land owners to meet
contractual or other obligations or extend the rights for continued power plant operations; and• restrictions on dividends or other provisions in our credit agreements and ACC orders.
These and other factors are discussed in the Risk Factors described in Item 1A of this report, which
readers should review carefully before placing any reliance on our financial statements or disclosures. Neither Pinnacle West nor APS assumes any obligation to update these statements, even if our internal estimates change, except as required by law.

2
PART I
ITEM 1. BUSINESS
Pinnacle West
Pinnacle West is a holding company that conducts business through its subsidiaries. We derive essentially all of our revenues and earnings from our wholly-owned subsidiary, APS. APS is a vertically-integrated electric utility that provides either retail or wholesale electric service to most of the State of Arizona, with the major exceptions of about one-half of the Phoenix metropolitan area, the Tucson metropolitan area and Mohave County in northwestern Arizona.
Pinnacle West’s other subsidiaries are El Dorado, BCE and 4CA. Additional information related to
these subsidiaries is provided later in this report.
Our reportable business segment is our regulated electricity segment, which consists of traditional regulated retail and wholesale electricity businesses (primarily electric service to Native Load customers) and related activities, and includes electricity generation, transmission and distribution.
BUSINESS OF ARIZONA PUBLIC SERVICE COMPANY
APS currently provides electric service to approximately 1.2 million customers. We own or lease 6,236 MW of regulated generation capacity and we hold a mix of both long-term and short-term purchased power agreements for additional capacity, including a variety of agreements for the purchase of renewable energy. During 2017, no single purchaser or user of energy accounted for more than 2.4% of our electric revenues.
3
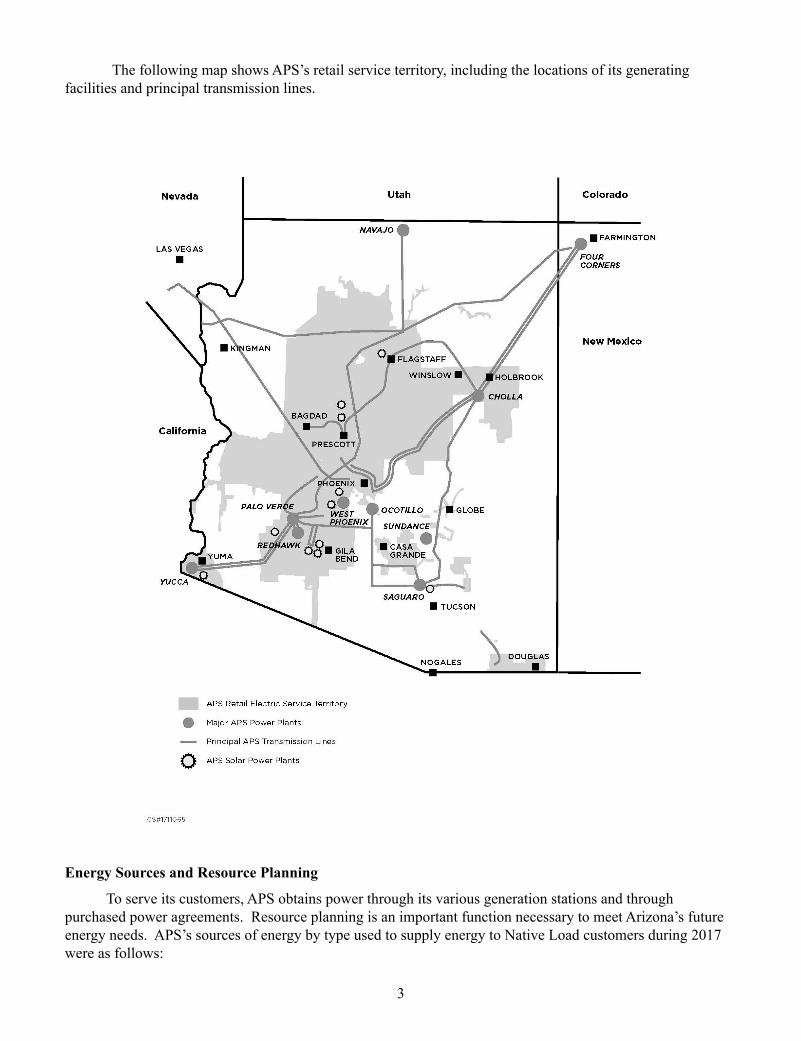
The following map shows APS’s retail service territory, including the locations of its generating facilities and principal transmission lines.
Energy Sources and Resource Planning
To serve its customers, APS obtains power through its various generation stations and through purchased power agreements. Resource planning is an important function necessary to meet Arizona’s future energy needs. APS’s sources of energy by type used to supply energy to Native Load customers during 2017 were as follows:

4
Generation Facilities APS has ownership interests in or leases the coal, nuclear, gas, oil and solar generating facilities
described below. For additional information regarding these facilities, see Item 2.
Coal-Fueled Generating Facilities Four Corners — Four Corners is located in the northwestern corner of New Mexico, and was
originally a 5-unit coal-fired power plant. APS owns 100% of Units 1, 2 and 3, which were retired as of December 30, 2013. APS operates the plant and owns 63% of Four Corners Units 4 and 5 following the acquisition of SCE’s interest in Units 4 and 5 described below. APS has a total entitlement from Four Corners of 970 MW. Additionally, 4CA, a wholly-owned subsidiary of Pinnacle West, owns 7% of Units 4 and 5 following its acquisition of El Paso's interest in these units described below.
On December 30, 2013, APS purchased SCE’s 48% interest in each of Units 4 and 5 of Four Corners.
The final purchase price for the interest was approximately $182 million. In connection with APS’s prior general retail rate case with the ACC, the ACC reserved the right to review the prudence of the Four Corners transaction for cost recovery purposes upon the closing of the transaction. On December 23, 2014, the ACC approved rate adjustments related to APS’s acquisition of SCE’s interest in Four Corners resulting in a revenue increase of $57.1 million on an annual basis. This decision was appealed and on September 26, 2017, the Court of Appeals affirmed the ACC's decision on the Four Corners rate adjustment.

5
Concurrently with the closing of the SCE transaction, BHP Billiton, the parent company of BNCC, the coal supplier and operator of the mine that served Four Corners, transferred its ownership of BNCC to NTEC, a company formed by the Navajo Nation to own the mine and develop other energy projects. BHP Billiton was retained by NTEC under contract as the mine manager and operator through 2016. Also occurring concurrently with the closing, the Four Corners’ co-owners executed a long-term agreement for the supply of coal to Four Corners from July 2016 through 2031 (the "2016 Coal Supply Agreement"). El Paso, a 7% owner in Units 4 and 5 of Four Corners, did not sign the 2016 Coal Supply Agreement. Under the 2016 Coal Supply Agreement, APS agreed to assume the 7% shortfall obligation. (See Note 10 for a discussion of a pending arbitration related to the 2016 Coal Supply Agreement.) On February 17, 2015, APS and El Paso entered into an asset purchase agreement providing for the purchase by APS, or an affiliate of APS, of El Paso’s 7% interest in each of Units 4 and 5 of Four Corners. 4CA purchased the El Paso interest on July 6, 2016. The purchase price was immaterial in amount, and 4CA assumed El Paso's reclamation and decommissioning obligations associated with the 7% interest.
NTEC had the option to purchase the 7% interest within a certain timeframe pursuant to an option granted to NTEC. On December 29, 2015, NTEC provided notice of its intent to exercise the option. The purchase did not occur during the originally contemplated timeframe. The parties are currently in discussions as to the future of the option transaction.
The 2016 Coal Supply Agreement contains alternate pricing terms for the 7% shortfall obligations in the event NTEC does not purchase the interest. At this time, since NTEC has not yet purchased the 7% interest, the alternate pricing provisions are applicable to 4CA as the holder of the 7% interest. These terms include a formula under which NTEC must make certain payments to 4CA for reimbursement of operations and maintenance costs and a specified rate of return, offset by revenue generated by 4CA’s power sales. Such payments are due to 4CA at the end of each calendar year. A $10 million payment was due to 4CA at December 31, 2017, which NTEC satisfied by directing to 4CA a prepayment from APS of a portion of a future mine reclamation obligation. The balance of the amount under this formula at December 31, 2017 is approximately $20 million, which is due to 4CA at December 31, 2018. In future years there may be similar payments due from NTEC to 4CA under this formula. 4CA believes NTEC should continue to satisfy its contractual obligations related to these payments; however, if NTEC fails to meet its contractual obligations when due, 4CA will consider appropriate measures and potential impacts to the Company's financial statements.
APS, on behalf of the Four Corners participants, negotiated amendments to an existing facility lease with the Navajo Nation, which extends the Four Corners leasehold interest from 2016 to 2041. The Navajo Nation approved these amendments in March 2011. The effectiveness of the amendments also required the approval of the DOI, as did a related federal rights-of-way grant. A federal environmental review was undertaken as part of the DOI review process, and culminated in the issuance by DOI of a record of decision on July 17, 2015 justifying the agency action extending the life of the plant and the adjacent mine.
On April 20, 2016, several environmental groups filed a lawsuit against OSM and other federal agencies in the District of Arizona in connection with their issuance of the approvals that extended the life of Four Corners and the adjacent mine. The lawsuit alleges that these federal agencies violated both the Endangered Species Act ("ESA") and the National Environmental Policy Act ("NEPA") in providing the federal approvals necessary to extend operations at Four Corners and the adjacent Navajo Mine past July 6, 2016. APS filed a motion to intervene in the proceedings, which was granted on August 3, 2016.
On September 15, 2016, NTEC, the company that owns the adjacent mine, filed a motion to intervene for the purpose of dismissing the lawsuit based on NTEC's tribal sovereign immunity. On September 11, 2017, the Arizona District Court issued an order granting NTEC's motion, dismissing the litigation with prejudice, and terminating the proceedings. On November 9, 2017, the environmental group plaintiffs appealed the

6
district court order dismissing their lawsuit. We cannot predict whether this appeal will be successful and, if it is successful, the outcome of further district court proceedings.
Cholla — Cholla was originally a 4-unit coal-fired power plant, which is located in northeastern
Arizona. APS operates the plant and owns 100% of Cholla Units 1, 2 and 3. PacifiCorp owns Cholla Unit 4, and APS operates that unit for PacifiCorp. On September 11, 2014, APS announced that it would close its 260 MW Unit 2 at Cholla and cease burning coal at Units 1 and 3 by the mid-2020s if EPA approves a compromise proposal offered by APS to meet required environmental and emissions standards and rules. On April 14, 2015, the ACC approved APS's plan to retire Unit 2, without expressing any view on the future recoverability of APS's remaining investment in the Unit, which was later addressed in the 2017 Settlement Agreement. (See Note 3 for details related to the resulting regulatory asset and allowed recovery set forth in the 2017 Settlement Agreement.) APS believes that the environmental benefits of this proposal are greater in the long-term than the benefits that would have resulted from adding the emissions control equipment. APS closed Unit 2 on October 1, 2015. Following the closure of Unit 2, APS has a total entitlement from Cholla of 387 MW. In early 2017, EPA approved a final rule incorporating APS's compromise proposal, which took effect for Cholla on April 26, 2017.
APS purchases all of Cholla’s coal requirements from a coal supplier that mines all of the coal under long-term leases of coal reserves with the federal and state governments and private landholders. The Cholla coal contract runs through 2024. In addition, APS has a coal transportation contract that runs through 2019.
Navajo Plant — The Navajo Plant is a 3-unit coal-fired power plant located in northern Arizona. Salt
River Project operates the plant and APS owns a 14% interest in Navajo Units 1, 2 and 3. APS has a total entitlement from the Navajo Plant of 315 MW. The Navajo Plant’s coal requirements are purchased from a supplier with long-term leases from the Navajo Nation and the Hopi Tribe. The Navajo Plant is under contract with its coal supplier through 2019, with extension rights through 2026. The Navajo Plant site is leased from the Navajo Nation and is also subject to an easement from the federal government.
The co-owners of the Navajo Plant and the Navajo Nation agreed that the Navajo Plant will remain in operation until December 2019 under the existing plant lease. The co-owners and the Navajo Nation executed a lease extension on November 29, 2017 that will allow for decommissioning activities to begin after the plant ceases operations in December 2019. Various stakeholders including regulators, tribal representatives, the plant's coal supplier and DOI have been meeting to determine if an alternate solution can be reached that would permit continued operation of the plant beyond 2019. Although we cannot predict whether any alternate plans will be found that would be acceptable to all of the stakeholders and feasible to implement, we believe it is probable that the Navajo Plant will cease operations in 2019.
APS is currently recovering depreciation and a return on the net book value of its interest in the Navajo Plant over its previously estimated life through 2026. APS will seek continued recovery in rates for the book value of its remaining investment in the plant (see Note 3 for details related to the resulting regulatory asset) plus a return on the net book value as well as other costs related to retirement and closure, which are still being assessed and which may be material. On February 14, 2017, the ACC opened a docket titled "ACC Investigation Concerning the Future of the Navajo Generating Station" with the stated goal of engaging stakeholders and negotiating a sustainable pathway for the Navajo Plant to continue operating in some form after December 2019. APS cannot predict the outcome of this proceeding.
These coal-fueled plants face uncertainties, including those related to existing and potential legislation
and regulation, that could significantly impact their economics and operations. See “Environmental Matters”

7
below and “Management’s Discussion and Analysis of Financial Condition and Results of Operations — Overview and Capital Expenditures” in Item 7 for developments impacting these coal-fueled facilities. See Note 10 for information regarding APS’s coal mine reclamation obligations.
Nuclear Palo Verde Generating Station — Palo Verde is a 3-unit nuclear power plant located approximately 50
miles west of Phoenix, Arizona. APS operates the plant and owns 29.1% of Palo Verde Units 1 and 3 and approximately 17% of Unit 2. In addition, APS leases approximately 12.1% of Unit 2, resulting in a 29.1% combined ownership and leasehold interest in that unit. APS has a total entitlement from Palo Verde of 1,146 MW.
Palo Verde Leases — In 1986, APS entered into agreements with three separate lessor trust entities in
order to sell and lease back approximately 42% of its share of Palo Verde Unit 2 and certain common facilities. The leaseback was originally scheduled to expire at the end of 2015 and contained options to renew the leases or to purchase the leased property for fair market value at the end of the lease terms. On July 7, 2014, APS exercised the fixed rate lease renewal options. The exercise of the renewal options resulted in APS retaining the assets through 2023 under one lease and 2033 under the other two leases. At the end of the lease renewal periods, APS will have the option to purchase the leased assets at their fair market value, extend the leases for up to two years, or return the assets to the lessors. See Note 18 for additional information regarding the Palo Verde Unit 2 sale leaseback transactions.
Palo Verde Operating Licenses — Operation of each of the three Palo Verde Units requires an
operating license from the NRC. The NRC issued full power operating licenses for Unit 1 in June 1985, Unit 2 in April 1986 and Unit 3 in November 1987, and issued renewed operating licenses for each of the three units in April 2011, which extended the licenses for Units 1, 2 and 3 to June 2045, April 2046 and November 2047, respectively.
Palo Verde Fuel Cycle — The Palo Verde participants are continually identifying their future nuclear
fuel resource needs and negotiating arrangements to fill those needs. The fuel cycle for Palo Verde is comprised of the following stages:
• mining and milling of uranium ore to produce uranium concentrates;• conversion of uranium concentrates to uranium hexafluoride;• enrichment of uranium hexafluoride;• fabrication of fuel assemblies;• utilization of fuel assemblies in reactors; and• storage and disposal of spent nuclear fuel.
The Palo Verde participants have contracted for 100% of Palo Verde’s requirements for uranium concentrates through 2023 and 50% of its requirements for 2024 and 2025. Additionally, Palo Verde has multiple contracts in various phases of negotiation to procure an additional 2.5 million pounds of uranium concentrates (equivalent to 1.5 years supply). Once these new contracts are completed, Palo Verde will have 100% of uranium concentrates assured through 2026.
The Palo Verde participants have also contracted for 100% of its requirements for conversion services through 2021 and 46% of its requirements for 2022 through 2025. Additionally, Palo Verde has two contracts in negotiation to procure an additional 2.9 million kilograms of elemental uranium of conversion services (equivalent to 4.3 years supply). Once these new contracts are completed, Palo Verde will have 100% of conversion services assured through 2027.

8
The Palo Verde participants have also contracted for 100% of its requirements for enrichment services through 2020 and 20% of its enrichment services for 2021 through 2026. Additionally, Palo Verde has several contracts in negotiation to procure an additional 2.3 million separative work units of enrichment services (equivalent to 4.3 years supply). Once these new contracts are completed, Palo Verde will have 100% of enrichment services assured through 2021, 90% in 2022 and 80% in 2023 through 2026.
The Palo Verde participants have contracted for 100% of its requirements for fuel fabrication through 2024.
Spent Nuclear Fuel and Waste Disposal — The Nuclear Waste Policy Act of 1982 (“NWPA”) required the DOE to accept, transport, and dispose of spent nuclear fuel and high level waste generated by the nation’s nuclear power plants by 1998. The DOE’s obligations are reflected in a contract for Disposal of Spent Nuclear Fuel and/or High-Level Radioactive Waste (the “Standard Contract”) with each nuclear power plant. The DOE failed to begin accepting spent nuclear fuel by 1998. APS is directly and indirectly involved in several legal proceedings related to DOE’s failure to meet its statutory and contractual obligations regarding acceptance of spent nuclear fuel and high level waste.
APS Lawsuit for Breach of Standard Contract — In December 2003, APS, acting on behalf of itself
and the participant owners of Palo Verde, filed a lawsuit against DOE in the United States Court of Federal Claims ("Court of Federal Claims") for damages incurred due to DOE’s breach of the Standard Contract. The Court of Federal Claims ruled in favor of APS and the Palo Verde participants in October 2010 and awarded $30.2 million in damages to APS and the Palo Verde participants for costs incurred through December 2006.
On December 19, 2012, APS, acting on behalf of itself and the participant owners of Palo Verde, filed a second breach of contract lawsuit against the DOE in the Court of Federal Claims. This lawsuit sought to recover damages incurred due to DOE’s breach of the Standard Contract for failing to accept Palo Verde’s spent nuclear fuel and high level waste from January 1, 2007 through June 30, 2011, as it was required to do pursuant to the terms of the Standard Contract and the NWPA. On August 18, 2014, APS and DOE entered into a settlement agreement, stipulating to a dismissal of the lawsuit and payment of $57.4 million by DOE to the Palo Verde owners for certain specified costs incurred by Palo Verde during the period January 1, 2007 through June 30, 2011. APS’s share of this amount is $16.7 million. Amounts recovered in the lawsuit and settlement were recorded as adjustments to a regulatory liability and had no impact on the amount of reported net income. In addition, the settlement agreement provides APS with a method for submitting claims and getting recovery for costs incurred through December 31, 2016, which has been extended to December 31, 2019.
APS has submitted three claims pursuant to the terms of the August 18, 2014 settlement agreement, for three separate time periods during July 1, 2011 through June 30, 2016. The DOE has approved and paid $65.2 million for these claims (APS’s share is $19 million). The amounts recovered were primarily recorded as adjustments to a regulatory liability and had no impact on reported net income. APS's next claim pursuant to the terms of the August 18, 2014 settlement agreement was submitted to the DOE in the fourth quarter of 2017 in the amount of $9 million (APS's share is $2.6 million). In February 2018, the DOE approved this claim.
The One-Mill Fee — In 2011, the National Association of Regulatory Utility Commissioners and the Nuclear Energy Institute challenged DOE’s 2010 determination of the adequacy of the one tenth of a cent per kWh fee (the “one-mill fee”) paid by the nation’s commercial nuclear power plant owners pursuant to their individual obligations under the Standard Contract. This fee is recovered by APS in its retail rates. In June 2012, the U.S. Court of Appeals for the District of Columbia Circuit (the “D.C. Circuit”) held that DOE failed to conduct a sufficient fee analysis in making the 2010 determination. The D.C. Circuit remanded the

9
2010 determination to the Secretary of the DOE (“Secretary”) with instructions to conduct a new fee adequacy determination within six months. In February 2013, upon completion of DOE’s revised one-mill fee adequacy determination, the D.C. Circuit reopened the proceedings. On November 19, 2013, the D.C. Circuit found that the DOE did not conduct a legally adequate fee assessment and ordered the Secretary to notify Congress of his intent to suspend collecting annual fees for nuclear waste disposal from nuclear power plant operators, as he is required to do pursuant to the NWPA and the D.C. Circuit’s order. On January 3, 2014, the Secretary notified Congress of his intention to suspend collection of the one-mill fee, subject to Congress’ disapproval. On May 16, 2014, the DOE notified all commercial nuclear power plant operators who are party to a Standard Contract that it reduced the one-mill fee to zero, thus effectively terminating the one-mill fee.
DOE’s Construction Authorization Application for Yucca Mountain — The DOE had planned to meet
its NWPA and Standard Contract disposal obligations by designing, licensing, constructing, and operating a permanent geologic repository at Yucca Mountain, Nevada. In June 2008, the DOE submitted its Yucca Mountain construction authorization application to the NRC, but in March 2010, the DOE filed a motion to dismiss with prejudice the Yucca Mountain construction authorization application. Several interested parties have also intervened in the NRC proceeding. Additionally, a number of interested parties filed a variety of lawsuits in different jurisdictions around the country challenging the DOE’s authority to withdraw the Yucca Mountain construction authorization application and NRC’s cessation of its review of the Yucca Mountain construction authorization application. The cases have been consolidated into one matter at the D.C. Circuit. In August 2013, the D.C. Circuit ordered the NRC to resume its review of the application with available appropriated funds.
On October 16, 2014, the NRC issued Volume 3 of the safety evaluation report developed as part of the Yucca Mountain construction authorization application. This volume addresses repository safety after permanent closure, and its issuance is a key milestone in the Yucca Mountain licensing process. Volume 3 contains the staff’s finding that the DOE’s repository design meets the requirements that apply after the repository is permanently closed, including but not limited to the post-closure performance objectives in NRC’s regulations.
On December 18, 2014, the NRC issued Volume 4 of the safety evaluation report developed as part of the Yucca Mountain construction authorization application. This volume covers administrative and programmatic requirements for the repository. It documents the staff’s evaluation of whether the DOE’s research and development and performance confirmation programs, as well as other administrative controls and systems, meet applicable NRC requirements. Volume 4 contains the staff’s finding that most administrative and programmatic requirements in NRC regulations are met, except for certain requirements relating to ownership of land and water rights.
Publication of Volumes 3 and 4 does not signal whether or when the NRC might authorize construction of the repository.
Waste Confidence and Continued Storage — On June 8, 2012, the D.C. Circuit issued its decision on a challenge by several states and environmental groups of the NRC’s rulemaking regarding temporary storage and permanent disposal of high level nuclear waste and spent nuclear fuel. The petitioners had challenged the NRC’s 2010 update to the agency’s Waste Confidence Decision and temporary storage rule (“Waste Confidence Decision”).
The D.C. Circuit found that the agency’s 2010 Waste Confidence Decision update constituted a major
federal action, which, consistent with NEPA, requires either an environmental impact statement or a finding of no significant impact from the agency’s actions. The D.C. Circuit found that the NRC’s evaluation of the

10
environmental risks from spent nuclear fuel was deficient, and therefore remanded the 2010 Waste Confidence Decision update for further action consistent with NEPA.
On September 6, 2012, the NRC Commissioners issued a directive to the NRC staff to proceed directly
with development of a generic environmental impact statement to support an updated Waste Confidence Decision. The NRC Commissioners also directed the staff to establish a schedule to publish a final rule and environmental impact study within 24 months of September 6, 2012.
In September 2013, the NRC issued its draft Generic Environmental Impact Statement (“GEIS”) to support an updated Waste Confidence Decision. On August 26, 2014, the NRC approved a final rule on the environmental effects of continued storage of spent nuclear fuel. Renamed as the Continued Storage Rule, the NRC’s decision adopted the findings of the GEIS regarding the environmental impacts of storing spent fuel at any reactor site after the reactor’s licensed period of operations. As a result, those generic impacts do not need to be re-analyzed in the environmental reviews for individual licenses. Although Palo Verde had not been involved in any licensing actions affected by the D.C. Circuit’s June 8, 2012, decision, the NRC lifted its suspension on final licensing actions on all nuclear power plant licenses and renewals that went into effect when the D.C. Circuit issued its June 2012 decision. The final Continued Storage Rule was subject to continuing legal challenges before the NRC and the Court of Appeals. In June 2016, the D.C. Circuit issued its final decision, rejecting all remaining legal challenges to the Continued Storage Rule. On August 8, 2016, the D.C. Circuit denied a petition for rehearing.
Palo Verde has sufficient capacity at its on-site independent spent fuel storage installation (“ISFSI”) to store all of the nuclear fuel that will be irradiated during the initial operating license period, which ends in December 2027. Additionally, Palo Verde has sufficient capacity at its on-site ISFSI to store a portion of the fuel that will be irradiated during the period of extended operation, which ends in November 2047. If uncertainties regarding the United States government’s obligation to accept and store spent fuel are not favorably resolved, APS will evaluate alternative storage solutions that may obviate the need to expand the ISFSI to accommodate all of the fuel that will be irradiated during the period of extended operation.
Nuclear Decommissioning Costs — APS currently relies on an external sinking fund mechanism to
meet the NRC financial assurance requirements for decommissioning its interests in Palo Verde Units 1, 2 and 3. The decommissioning costs of Palo Verde Units 1, 2 and 3 are currently included in APS’s ACC jurisdictional rates. Decommissioning costs are recoverable through a non-bypassable system benefits charge (paid by all retail customers taking service from the APS system). Based on current nuclear decommissioning trust asset balances, site specific decommissioning cost studies, anticipated future contributions to the decommissioning trusts, and return projections on the asset portfolios over the expected remaining operating life of the facility, we are on track to meet the current site specific decommissioning costs for Palo Verde at the time the units are expected to be decommissioned. See Note 19 for additional information about APS’s nuclear decommissioning trusts.
Palo Verde Liability and Insurance Matters — See “Palo Verde Generating Station — Nuclear
Insurance” in Note 10 for a discussion of the insurance maintained by the Palo Verde participants, including APS, for Palo Verde.
Natural Gas and Oil Fueled Generating Facilities APS has six natural gas power plants located throughout Arizona, consisting of Redhawk, located near
Palo Verde; Ocotillo, located in Tempe (discussed below); Sundance, located in Coolidge; West Phoenix, located in southwest Phoenix; Saguaro, located north of Tucson; and Yucca, located near Yuma. Several of the units at Yucca run on either gas or oil. APS has one oil-only power plant, Fairview, located in the town of Douglas, Arizona. APS owns and operates each of these plants with the exception of one oil-only combustion

11
turbine unit and one oil and gas steam unit at Yucca that are operated by APS and owned by the Imperial Irrigation District. APS has a total entitlement from these plants of 3,179 MW. Gas for these plants is financially hedged up to five years in advance of purchasing and the gas is generally purchased one month prior to delivery. APS has long-term gas transportation agreements with three different companies, some of which are effective through 2024. Fuel oil is acquired under short-term purchases delivered primarily to West Phoenix, where it is distributed to APS’s other oil power plants by truck. Ocotillo is a 330 MW 4-unit gas plant located in the metropolitan Phoenix area. In early 2014, APS announced a project to modernize the plant, which involves retiring two older 110 MW steam units, adding five 102 MW combustion turbines and maintaining two existing 55 MW combustion turbines. In total, this increases the capacity of the site by 290 MW, to 620 MW, with completion targeted by summer 2019. (See Note 3 for rate recovery as part of the 2017 Rate Case Decision). On September 9, 2016, Maricopa County issued a final permit decision that authorizes construction of the Ocotillo modernization project and construction began in early 2017.
Solar Facilities
APS developed utility scale solar resources through the 170 MW ACC-approved AZ Sun Program. APS invested approximately $675 million in its AZ Sun Program. These facilities are owned by APS and are located in multiple locations throughout Arizona. In addition to the AZ Sun Program, APS developed the 40MW Red Rock Solar Plant, which it owns and operates. Two of our large customers purchase renewable energy credits from APS that is equivalent to the amount of renewable energy that Red Rock is projected to generate.
APS owns and operates more than forty small solar systems around the state. Together they have the
capacity to produce approximately 4 MW of renewable energy. This fleet of solar systems includes a 3 MW facility located at the Prescott Airport and 1 MW of small solar in various locations across Arizona. APS has also developed solar photovoltaic distributed energy systems installed as part of the Community Power Project in Flagstaff, Arizona. The Community Power Project, approved by the ACC on April 1, 2010, was a pilot program through which APS owns, operates and receives energy from approximately 1 MW of solar photovoltaic distributed energy systems located within a certain test area in Flagstaff, Arizona. The pilot program is now complete, and as part of the 2017 Rate Case Decision, the participants have been transferred to the Solar Partner Program described below. Additionally, APS owns 12 MW of solar photovoltaic systems installed across Arizona through the ACC-approved Schools and Government Program.
In December 2014, the ACC voted that it had no objection to APS implementing an APS-owned rooftop solar research and development program aimed at learning how to efficiently enable the integration of rooftop solar and battery storage with the grid. The first stage of the program, called the "Solar Partner Program," placed 8 MW of residential rooftop solar on strategically selected distribution feeders in an effort to maximize potential system benefits, as well as made systems available to limited-income customers who could not easily install solar through transactions with third parties. The second stage of the program, which included an additional 2 MW of rooftop solar and energy storage, placed two energy storage systems sized at 2 MW on two different high solar penetration feeders to test various grid-related operation improvements and system interoperability, and was in operation by the end of 2016. The costs for this program have been included in APS's rate base as part of the 2017 Rate Case Decision.
In APS's 2017 Rate Case Decision, the ACC approved the "APS Solar Communities" program. APS Solar Communities is a three-year program requiring APS to spend $10-15 million in capital costs each year to install utility-owned distributed generation systems on low to moderate income residential homes, buildings of non-profit entities, Title I schools and rural government facilities. The 2017 Rate Case Decision provided that all operations and maintenance expenses, property taxes, marketing and advertising expenses, and the capital carrying costs for this program will be recovered through the RES.

12
Purchased Power Contracts
In addition to its own available generating capacity, APS purchases electricity under various arrangements, including long-term contracts and purchases through short-term markets to supplement its owned or leased generation and hedge its energy requirements. A portion of APS’s purchased power expense is netted against wholesale sales on the Consolidated Statements of Income. (See Note 16.) APS continually assesses its need for additional capacity resources to assure system reliability.
Purchased Power Capacity — APS’s purchased power capacity under long-term contracts as of
December 31, 2017 is summarized in the table below. All capacity values are based on net capacity unless otherwise noted.
Type
Dates Available
Capacity (MW)
Purchase Agreement (a)
Year-round through June 14, 2020
60Exchange Agreement (b)
May 15 to September 15 annually through February 2021
480Tolling Agreement
Summer seasons through October 2019
560Demand Response Agreement (c)
Summer seasons through 2024
25Tolling Agreement Summer seasons from Summer 2020 through Summer 2025 565Tolling Agreement June 1 through September 30, 2020-2026 570Renewable Energy (d)
Various
629
(a) Up to 60 MW of capacity is available; however, the amount of electricity available to APS under this agreement is based in large part on customer demand and is adjusted annually.
(b) This is a seasonal capacity exchange agreement under which APS receives electricity during the summer peak season (from May 15 to September 15) and APS returns a like amount of electricity during the winter season (from October 15 to February 15).
(c) The capacity under this agreement may be increased in 10 MW increments in years 2017 through 2024, up to a maximum of 50 MW.
(d) Renewable energy purchased power agreements are described in detail below under “Current and Future Resources — Renewable Energy Standard — Renewable Energy Portfolio.”
Current and Future Resources
Current Demand and Reserve Margin
Electric power demand is generally seasonal. In Arizona, demand for power peaks during the hot summer months. APS’s 2017 peak one-hour demand on its electric system was recorded on June 20, 2017 at 7,363 MW, compared to the 2016 peak of 7,051 MW recorded on June 19, 2016. APS’s reserve margin at the time of the 2017 peak demand, calculated using system load serving capacity, was 15%. For 2018, due to expiring purchase contracts, APS is procuring market resources to maintain its minimum 15% planning reserve criteria.
Future Resources and Resource Plan
APS filed its preliminary 2017 Integrated Resource Plan on March 1, 2016 and an updated preliminary 2017 Integrated Resource Plan on September 30, 2016. APS also held stakeholder meetings in February and November 2016 in addition to an ACC-led Integrated Resource Plan workshop in July 2016. The preliminary Integrated Resource Plan and associated stakeholder meetings are part of a modified planning process that allows time to incorporate implications of the Clean Power Plan as well as input from stakeholder meetings. The final Integrated Resource Plan was submitted on April 10, 2017. The ACC has not yet completed its review of the final Integrated Resource Plan.

13
On September 11, 2014, APS announced that it would close Cholla Unit 2 and cease burning coal at the other APS-owned units (Units 1 and 3) at the plant by the mid-2020s, if EPA approved a compromise proposal offered by APS to meet required environmental and emissions standards and rules. In early 2017, EPA approved a final rule incorporating APS's compromise proposal, which took effect for Cholla on April 26, 2017. (See "Business of Arizona Public Service Company - Energy Sources and Resource Planning - Generation Facilities - Coal-Fueled Generating Facilities - Cholla" above for information regarding the Cholla Plant).
See "Business of Arizona Public Service Company - Energy Sources and Resource Planning - Generation Facilities - Coal-Fueled Generating Facilities" above for information regarding future plans for the Four Corners Plant, Navajo Plant and Ocotillo Plant." See Business of Arizona Public Service Company - Energy Sources and Resource Planning - Purchased Power Contracts" above for information regarding future plans for purchased power contracts.
Energy Imbalance Market
In 2015, APS and the CAISO, the operator for the majority of California's transmission grid, signed an agreement for APS to begin participation in the Energy Imbalance Market (“EIM”). APS's participation in the EIM began on October 1, 2016. The EIM allows for rebalancing supply and demand in 15-minute blocks with dispatching every five minutes before the energy is needed, instead of the traditional one hour blocks. APS expects that its participation in EIM will lower its fuel costs, improve visibility and situational awareness for system operations in the Western Interconnection power grid, and improve integration of APS’s renewable resources.
Renewable Energy Standard
In 2006, the ACC adopted the RES. Under the RES, electric utilities that are regulated by the ACC must supply an increasing percentage of their retail electric energy sales from eligible renewable resources, including solar, wind, biomass, biogas and geothermal technologies. The renewable energy requirement is 8% of retail electric sales in 2018 and increases annually until it reaches 15% in 2025. In APS’s 2009 general retail rate case settlement agreement (the “2009 Settlement Agreement”), APS committed to use its best efforts to have 1,700 GWh of new renewable resources in service by year-end 2015 in addition to its RES renewable resource commitments. APS met its settlement commitment and overall RES target for 2017.
A component of the RES is focused on stimulating development of distributed energy systems. Accordingly, under the RES, an increasing percentage of that requirement must be supplied from distributed energy resources. This distributed energy requirement is 30% of the overall RES requirement of 8% in 2018. The following table summarizes the RES requirement standard (not including the additional commitment required by the 2009 Settlement Agreement) and its timing:
2018 2020 2025
RES as a % of retail electric sales 8% 10% 15%
Percent of RES to be supplied from distributed energyresources 30% 30% 30%
On April 21, 2015, the RES rules were amended to require utilities to report on all eligible renewable resources in their service territory, irrespective of whether the utility owns renewable energy credits associated with such renewable energy. The rules allow the ACC to consider such information in determining whether APS has satisfied the requirements of the RES. See "Renewable Energy Ballot Initiative" and "Clean

14
Resource Energy Standard and Tariff" in Note 3 for information regarding two additional renewable energy standards proposals.
Renewable Energy Portfolio. To date, APS has a diverse portfolio of existing and planned renewable resources totaling 1,655 MW, including solar, wind, geothermal, biomass and biogas. Of this portfolio, 1,583 MW are currently in operation and 72 MW are under contract for development or are under construction. Renewable resources in operation include 239 MW of facilities owned by APS, 629 MW of long-term purchased power agreements, and an estimated 682 MW of customer-sited, third-party owned distributed energy resources.
APS’s strategy to achieve its RES requirements includes executing purchased power contracts for new
facilities, ongoing development of distributed energy resources and procurement of new facilities to be owned by APS. See "Energy Sources and Resource Planning - Generation Facilities - Solar Facilities" above for information regarding APS-owned solar facilities.

15
The following table summarizes APS’s renewable energy sources currently in operation and under development as of December 31, 2017. Agreements for the development and completion of future resources are subject to various conditions, including successful siting, permitting and interconnection of the projects to the electric grid.
Location
Actual/ Target
CommercialOperation
DateTerm
(Years)
Net Capacity
In Operation(MW AC)
Net Capacity Planned/
UnderDevelopment
(MW AC)
APS Owned
Solar:
AZ Sun Program:
Paloma Gila Bend, AZ 2011
17
Cotton Center Gila Bend, AZ 2011
17
Hyder Phase 1 Hyder, AZ 2011
11
Hyder Phase 2 Hyder, AZ 2012
5
Chino Valley Chino Valley, AZ 2012
19
Hyder II Hyder, AZ 2013
14
Foothills Yuma, AZ 2013
35
Gila Bend Gila Bend, AZ 2014
32Luke AFB Glendale, AZ 2015 10Desert Star Buckeye, AZ 2015 10
Subtotal AZ Sun Program
170 —Multiple Facilities AZ Various
4
Red Rock Red Rock, AZ 2016 40Distributed Energy:
APS Owned (a) AZ Various
25Total APS Owned
239 —
Purchased Power Agreements
Solar:
Solana Gila Bend, AZ 2013 30 250
RE Ajo Ajo, AZ 2011 25 5
Sun E AZ 1 Prescott, AZ 2011 30 10
Saddle Mountain Tonopah, AZ 2012 30 15
Badger Tonopah, AZ 2013 30 15
Gillespie Maricopa County, AZ 2013 30 15
Wind:
Aragonne Mesa Santa Rosa, NM 2006 20 90
High Lonesome Mountainair, NM 2009 30 100
Perrin Ranch Wind Williams, AZ 2012 25 99
Geothermal:
Salton Sea Imperial County, CA 2006 23 10
Biomass:
Snowflake Snowflake, AZ 2008 15 14
Biogas:
Glendale Landfill Glendale, AZ 2010 20 3
NW Regional Landfill Surprise, AZ 2012 20 3
Total Purchased Power Agreements
629 —Distributed Energy
Solar (b)
Third-party Owned AZ Various
682 72Agreement 1 Bagdad, AZ 2011 25 15
Agreement 2 AZ 2011-2012 20-21 18
Total Distributed Energy
715 72Total Renewable Portfolio
1,583 72

16
(a) Includes Flagstaff Community Power Project, APS School and Government Program and APS Solar Partner Program.
(b) Includes rooftop solar facilities owned by third parties. Distributed generation is produced in DC and is converted to AC for reporting purposes.
Additionally, in early February 2018, APS entered into a 15-year power purchase agreement for a 65 MW solar facility that charges a 50 MW solar-fueled battery. Service under the agreement is scheduled to begin in 2021.
Demand Side Management
In December 2009, Arizona regulators placed an increased focus on energy efficiency and other demand side management programs to encourage customers to conserve energy, while incentivizing utilities to aid in these efforts that ultimately reduce the demand for energy. The ACC initiated its Energy Efficiency rulemaking, with a proposed EES of 22% cumulative annual energy savings by 2020. This standard was adopted and became effective on January 1, 2011. This standard will likely impact Arizona’s future energy resource needs. (See Note 3 for energy efficiency and other demand side management obligations).
Competitive Environment and Regulatory Oversight
Retail
The ACC regulates APS’s retail electric rates and its issuance of securities. The ACC must also approve any significant transfer or encumbrance of APS’s property used to provide retail electric service and approve or receive prior notification of certain transactions between Pinnacle West, APS and their respective affiliates.
APS is subject to varying degrees of competition from other investor-owned electric and gas utilities in Arizona (such as Southwest Gas Corporation), as well as cooperatives, municipalities, electrical districts and similar types of governmental or non-profit organizations. In addition, some customers, particularly industrial and large commercial customers, may own and operate generation facilities to meet some or all of their own energy requirements. This practice is becoming more popular with customers installing or having installed products such as rooftop solar panels to meet or supplement their energy needs.
On April 14, 2010, the ACC issued a decision holding that solar vendors that install and operate solar facilities for non-profit schools and governments pursuant to a specific type of contract that calculates payments based on the energy produced are not “public service corporations” under the Arizona Constitution, and are therefore not regulated by the ACC. APS cannot predict when, and the extent to which, additional electric service providers will enter or re-enter APS’s service territory.
On May 9, 2013, the ACC voted to re-examine the facilitation of a deregulated retail electric market in
Arizona. The ACC subsequently opened a docket for this matter and received comments from a number of interested parties on the considerations involved in establishing retail electric deregulation in the state. One of these considerations was whether various aspects of a deregulated market, including setting utility rates on a “market” basis, would be consistent with the requirements of the Arizona Constitution. On September 11, 2013, after receiving legal advice from the ACC staff, the ACC voted 4-1 to close the current docket and await full Arizona Constitutional authority before any further examination of this matter. The motion approved by the ACC also included opening one or more new dockets in the future to explore options to offer more rate choices to customers and innovative changes within the existing cost-of-service regulatory model that could include elements of competition. The ACC opened a docket on November 4, 2013 to explore technological

17
advances and innovative changes within the electric utility industry. A series of workshops in this docket were held in 2014 and another in February of 2015. No further workshops are scheduled and no actions were taken as a result of these workshops.
Wholesale
FERC regulates rates for wholesale power sales and transmission services. (See Note 3 for information regarding APS’s transmission rates.) During 2017, approximately 3.8% of APS’s electric operating revenues resulted from such sales and services. APS’s wholesale activity primarily consists of managing fuel and purchased power supplies to serve retail customer energy requirements. APS also sells, in the wholesale market, its generation output that is not needed for APS’s Native Load and, in doing so, competes with other utilities, power marketers and independent power producers. Additionally, subject to specified parameters, APS hedges both electricity and fuels. The majority of these activities are undertaken to mitigate risk in APS’s portfolio.
Subpoena from Arizona Corporation Commissioner Robert Burns
On August 25, 2016, Commissioner Burns, individually and not by action of the ACC as a whole, served subpoenas in APS’s then current retail rate proceeding on APS and Pinnacle West for the production of records and information relating to a range of expenditures from 2011 through 2016. The subpoenas requested information concerning marketing and advertising expenditures, charitable donations, lobbying expenses, contributions to 501(c)(3) and (c)(4) nonprofits and political contributions. The return date for the production of information was set as September 15, 2016. The subpoenas also sought testimony from Company personnel having knowledge of the material, including the Chief Executive Officer.
On September 9, 2016, APS filed with the ACC a motion to quash the subpoenas or, alternatively to stay APS's obligations to comply with the subpoenas and decline to decide APS's motion pending court proceedings. Contemporaneously with the filing of this motion, APS and Pinnacle West filed a complaint for special action and declaratory judgment in the Superior Court of Arizona for Maricopa County, seeking a declaratory judgment that Commissioner Burns’ subpoenas are contrary to law. On September 15, 2016, APS produced all non-confidential and responsive documents and offered to produce any remaining responsive documents that are confidential after an appropriate confidentiality agreement is signed.
On February 7, 2017, Commissioner Burns opened a new ACC docket and indicated that its purpose is to study and rectify problems with transparency and disclosure regarding financial contributions from regulated monopolies or other stakeholders who may appear before the ACC that may directly or indirectly benefit an ACC Commissioner, a candidate for ACC Commissioner, or key ACC staff. As part of this docket, Commissioner Burns set March 24, 2017 as a deadline for the production of all information previously requested through the subpoenas. Neither APS nor Pinnacle West produced the information requested and instead objected to the subpoena. On March 10, 2017, Commissioner Burns filed suit against APS and Pinnacle West in the Superior Court of Arizona for Maricopa County in an effort to enforce his subpoenas. On March 30, 2017, APS filed a motion to dismiss Commissioner Burns' suit against APS and Pinnacle West. In response to the motion to dismiss, the court stayed the suit and ordered Commissioner Burns to file a motion to compel the production of the information sought by the subpoenas with the ACC. On June 20, 2017, the ACC denied the motion to compel. On August 4, 2017, Commissioner Burns amended his complaint to add all of the ACC Commissioners and the ACC itself as defendants. All defendants moved to dismiss the complaint. On February 15, 2018, the Superior Court dismissed Commissioner Burns’ complaint. The matter is subject to appeal. APS and Pinnacle West cannot predict the outcome of this matter.
18
In addition to the Superior Court proceedings discussed above, on August 20, 2017, Commissioner Burns filed a special action petition in the Arizona Supreme Court seeking to vacate the 2017 Rate Case Decision so that alleged issues of disqualification and bias on the part of the other Commissioners could be fully investigated. APS opposed the petition, and on October 17, 2017, the Arizona Supreme Court declined to accept jurisdiction over Commissioner Burns’ special action petition.
Environmental Matters
Climate Change
Legislative Initiatives. There have been no recent attempts by Congress to pass legislation that would regulate greenhouse gas ("GHG") emissions, and it is doubtful whether the 115th Congress will consider a climate change bill. In the event climate change legislation ultimately passes, the actual economic and operational impact of such legislation on APS depends on a variety of factors, none of which can be fully known until a law is written and enacted and the specifics of the resulting program are established. These factors include the terms of the legislation with regard to allowed GHG emissions; the cost to reduce emissions; in the event a cap-and-trade program is established, whether any permitted emissions allowances will be allocated to source operators free of cost or auctioned (and, if so, the cost of those allowances in the marketplace) and whether offsets and other measures to moderate the costs of compliance will be available; and, in the event of a carbon tax, the amount of the tax per pound of carbon dioxide (“CO2”) equivalent emitted.
In addition to federal legislative initiatives, state-specific initiatives may also impact our business. While Arizona has no pending legislation and no proposed agency rule regulating GHGs in Arizona, the California legislature enacted AB 32 and SB 1368 in 2006 to address GHG emissions. In October 2011, the California Air Resources Board approved final regulations that established a state-wide cap on GHG emissions beginning on January 1, 2013 and established a GHG allowance trading program under that cap. The first phase of the program, which applies to, among other entities, importers of electricity, commenced on January 1, 2013. Under the program, entities selling electricity into California, including APS, must hold carbon allowances to cover GHG emissions associated with electricity sales into California from outside the state. APS is authorized to recover the cost of these carbon allowances through the PSA.
Regulatory Initiatives. In 2009, EPA determined that GHG emissions endanger public health and welfare. As a result of this “endangerment finding,” EPA determined that the Clean Air Act required new regulatory requirements for new and modified major GHG emitting sources, including power plants. APS will generally be required to consider the impact of GHG emissions as part of its traditional New Source Review ("NSR") analysis for new major sources and major modifications to existing plants.
On June 2, 2014, EPA issued two proposed rules to regulate GHG emissions from modified and reconstructed electric generating units ("EGUs") pursuant to Section 111(b) of the Clean Air Act and existing fossil fuel-fired power plants pursuant to Clean Air Act Section 111(d).
On August 3, 2015, EPA finalized carbon pollution standards for EGUs. Shortly thereafter, a coalition of states, industry groups and electric utilities challenged the legality of these standards, including EPA's Clean Power Plan for existing EGUs, in the U.S. Court of Appeals for the D.C. Circuit. On February 9, 2016, the U.S. Supreme Court granted a stay of the Clean Power Plan pending judicial review of the rule, which temporarily delays compliance obligations under the Clean Power Plan. On March 28, 2017, President Trump issued an Executive Order that, among other things, instructs EPA to reevaluate Agency regulations concerning carbon emissions from EGUs and take appropriate action to suspend, revise or rescind the August 2015 carbon pollution standards for EGUs, including the Clean Power Plan. Also on March 28, 2017, DOJ, on behalf of

19
EPA, filed a motion with the U.S. Court of Appeals for the D.C. Circuit Court to hold the ongoing litigation over the Clean Power Plan in abeyance pending EPA action in accordance with the Executive Order. At this time, the D.C. Circuit Court proceedings evaluating the legality of the Clean Power Plan remain on hold.
Based upon EPA's reevaluation of the August 2015 carbon pollution standards and the legal basis for these regulations, on October 10, 2017, EPA issued a proposal to repeal the Clean Power Plan. That proposal relies on EPA's current view as to the Agency's legal authority under Clean Air Act Section 111(d), which (in contrast to the Clean Power Plan) would limit the scope of any future Section 111(d) regulations to measures undertaken exclusively at a power plant's source of GHG emissions. On December 18, 2017, EPA issued an Advanced Notice of Proposed Rulemaking through which EPA is soliciting comments as to potential replacements for the Clean Power Plan that would be consistent with EPA's current legal interpretation of the Clean Air Act.
We cannot predict the outcome of EPA's regulatory actions related to the August 2015 carbon pollution standards for EGU's, including any actions related to EPA's repeal proposal for the Clean Power Plan or additional rulemaking actions to develop regulations replacing the Clean Power Plan. In addition, we cannot predict whether the D.C. Circuit Court will continue to hold the litigation challenging the original Clean Power Plan in abeyance in light of EPA's repeal proposal.
Company Response to Climate Change Initiatives. We have undertaken a number of initiatives that address emission concerns, including renewable energy procurement and development, promotion of programs and rates that promote energy conservation, renewable energy use, and energy efficiency. (See “Energy Sources and Resource Planning - Current and Future Resources” above for details of these plans and initiatives.) APS currently has a diverse portfolio of renewable resources, including solar, wind, geothermal, biogas, and biomass.
APS prepares an annual inventory of GHG emissions from its operations. This inventory is reported to EPA under the EPA GHG Reporting Program and is voluntarily communicated to the public in Pinnacle West’s annual Corporate Responsibility Report, which is available on our website (www.pinnaclewest.com). The report provides information related to the Company and its approach to sustainability and its workplace and environmental performance. The information on Pinnacle West’s website, including the Corporate Responsibility Report, is not incorporated by reference into or otherwise a part of this report.
EPA Environmental Regulation
Regional Haze Rules. In 1999, EPA announced regional haze rules to reduce visibility impairment in national parks and wilderness areas. The rules require states (or, for sources located on tribal land, EPA) to determine what pollution control technologies constitute the BART for certain older major stationary sources, including fossil-fired power plants. EPA subsequently issued the Clean Air Visibility Rule, which provides guidelines on how to perform a BART analysis.
Cholla. APS believed that EPA’s original 2012 final rule establishing controls constituting BART for Cholla, which would require installation of selective catalytic reduction ("SCR") controls, was unsupported and that EPA had no basis for disapproving Arizona’s State Implementation Plan ("SIP") and promulgating a Federal Implementation Plan ("FIP") that was inconsistent with the state’s considered BART determinations under the regional haze program. In September 2014, APS met with EPA to propose a compromise BART strategy. APS would permanently close Cholla Unit 2 and cease burning coal at Units 1 and 3 by the mid-2020s. (See Note 3 for details related to the resulting regulatory asset.) APS made the proposal with the understanding that additional emission control equipment is unlikely to be required in the future because retiring and/or converting the units as contemplated in the proposal is more cost effective than, and will result

20
in increased visibility improvement over, the current BART requirements for NOx imposed on the Cholla units under EPA's BART FIP.
On October 16, 2015, ADEQ issued a revised operating permit for Cholla, which incorporates APS's proposal, and subsequently submitted a proposed revision to the SIP to EPA, which would incorporate the new permit terms. On June 30, 2016, EPA issued a proposed rule approving a revision to the Arizona SIP that incorporates APS’s compromise approach for compliance with the regional haze program. In early 2017, EPA approved a final rule incorporating APS's compromise proposal, which took effect for Cholla on April 26, 2017.
Four Corners. Based on EPA’s final standards, APS's 63% share of the cost of required controls for Four Corners Units 4 and 5 is approximately $400 million. (See Note 3 for information regarding the related rate recovery.) In addition, APS and El Paso entered into an asset purchase agreement providing for the purchase by APS, or an affiliate of APS, of El Paso's 7% interest in Four Corners Units 4 and 5. 4CA purchased the El Paso interest on July 6, 2016. NTEC has the option to purchase the interest within a certain timeframe pursuant to an option granted to NTEC. In December 2015, NTEC notified APS of its intent to exercise the option. The purchase did not occur during the originally contemplated timeframe. The parties are currently in discussions as to the future of the option transaction. The cost of the pollution controls related to the 7% interest is approximately $45 million, which will be assumed by the ultimate owner of the 7% interest.
Navajo Plant. APS estimates that its share of costs for upgrades at the Navajo Plant, based on EPA’s FIP, could be up to approximately $200 million; however, given the future plans for the Navajo Plant, we do not expect to incur these costs. See "Energy Sources and Resource Planning - Generation Facilities - Coal-Fueled Generating Facilities - Navajo Generating Station" above and "Navajo Plant" in Note 3 for information regarding future plans for the Navajo Plant.
Coal Combustion Waste. On December 19, 2014, EPA issued its final regulations governing the handling and disposal of CCR, such as fly ash and bottom ash. The rule regulates CCR as a non-hazardous waste under Subtitle D of the Resource Conservation and Recovery Act ("RCRA") and establishes national minimum criteria for existing and new CCR landfills and surface impoundments and all lateral expansions consisting of location restrictions, design and operating criteria, groundwater monitoring and corrective action, closure requirements and post closure care, and recordkeeping, notification, and Internet posting requirements. The rule generally requires any existing unlined CCR surface impoundment that is contaminating groundwater above a regulated constituent’s groundwater protection standard to stop receiving CCR and either retrofit or close, and further requires the closure of any CCR landfill or surface impoundment that cannot meet the applicable performance criteria for location restrictions or structural integrity.
While EPA has chosen to regulate the disposal of CCR in landfills and surface impoundments as non-hazardous waste under the final rule, the agency makes clear that it will continue to evaluate any risks associated with CCR disposal and leaves open the possibility that it may regulate CCR as a hazardous waste under RCRA Subtitle C in the future.
On December 16, 2016, President Obama signed the Water Infrastructure Improvements for the Nation ("WIIN") Act into law, which contains a number of provisions requiring EPA to modify the self-implementing provisions of the Agency's current CCR rules under Subtitle D. Such modifications include new EPA authority to directly enforce the CCR rules through the use of administrative orders and providing states, like Arizona, where the Cholla facility is located, the option of developing CCR disposal unit permitting programs, subject to EPA approval. For facilities in states that do not develop state-specific permitting programs, EPA is required to develop a federal permit program, pending the availability of congressional appropriations. By contrast, for facilities located within the boundaries of Native American tribal reservations, such as the Navajo Nation,

21
where the Navajo Plant and Four Corners facilities are located, EPA is required to develop a federal permit program regardless of appropriated funds.
ADEQ has initiated a process to evaluate how to develop a state CCR permitting program that would cover EGUs, including Cholla. While APS has been working with ADEQ on the development of this program, we are unable to predict when Arizona will be able to finalize and secure EPA approval for a state-specific CCR permitting program. With respect to the Navajo Nation, APS recently filed a comment letter with EPA seeking clarification as to when and how EPA would be initiating permit proceedings for facilities on the reservation, including Four Corners. We are unable to predict at this time when EPA will be issuing CCR management permits for the facilities on the Navajo Nation. At this time, it remains unclear how the CCR provisions of the WIIN Act will affect APS and its management of CCR.
Based upon utility industry petitions for EPA to reconsider the RCRA Subtitle D regulations for CCR, which were premised in part on the CCR provisions of the 2016 WIIN Act, on September 13, 2017 EPA agreed to evaluate whether to revise these federal CCR regulations. At this time, it is not clear whether EPA will initiate further notice-and-comment rulemaking to revise the federal CCR rules, nor is it clear what aspects of the federal CCR rules might be changed as a result of this process. With respect to ongoing litigation initiated by industry and environmental groups challenging the legality of these federal CCR regulations, on September 27, 2017, the United States Court of Appeals for the D.C. Circuit, the court overseeing these judicial challenges, ordered EPA to file by November 15, 2017 a list of federal regulatory provisions addressing CCR that are or likely will be revised through EPA’s reconsideration proceedings. While this filing identified certain provisions of the federal CCR regulations that EPA intends to revise, including allowances for risk-based groundwater protection standards for regulated CCR constituents for which no federal maximum contaminant level has been set, it is not clear at this time which specific provisions of the federal CCR rules will be modified, how they will be modified, or when such modification will occur.
Pursuant to a June 24, 2016 order by the D.C. Circuit Court of Appeals in the litigation by industry and environmental groups challenging EPA’s CCR regulations, within the next two years EPA is required to complete a rulemaking proceeding concerning whether or not boron must be included on the list of groundwater constituents that might trigger corrective action under EPA’s CCR rules. EPA is not required to take final action approving the inclusion of boron, but EPA must propose and consider its inclusion. Should EPA take final action adding boron to the list of groundwater constituents that might trigger corrective action, any resulting corrective action measures may increase APS's costs of compliance with the CCR rule at our coal-fired generating facilities. At this time APS cannot predict when EPA will commence its rulemaking concerning boron or the eventual results of those proceedings.
APS currently disposes of CCR in ash ponds and dry storage areas at Cholla and Four Corners. APS estimates that its share of incremental costs to comply with the CCR rule for Four Corners is approximately $22 million and its share of incremental costs to comply with the CCR rule for Cholla is approximately $20 million. The Navajo Plant currently disposes of CCR in a dry landfill storage area. APS estimates that its share of incremental costs to comply with the CCR rule for the Navajo Plant is approximately $1 million. Additionally, the CCR rule requires ongoing, phased groundwater monitoring. By October 17, 2017, electric utility companies that own or operate CCR disposal units, such as APS, must have collected sufficient groundwater sampling data to initiate a detection monitoring program. To the extent that certain threshold constituents are identified through this initial detection monitoring at levels above the CCR rule’s standards, the rule requires the initiation of an assessment monitoring program by April 15, 2018. If this assessment monitoring program reveals concentrations of certain constituents above the CCR rule standards that trigger remedial obligations, a corrective measures evaluation must be completed by January 2019. Depending upon the results of such groundwater monitoring and data evaluations at each of Cholla, Four Corners and the

22
Navajo Plant, we may be required to take corrective actions, the costs of which we are unable to reasonably estimate at this time.
Effluent Limitation Guidelines. On September 30, 2015, EPA finalized revised effluent limitation guidelines establishing technology-based wastewater discharge limitations for fossil-fired EGUs. EPA’s final regulation targets metals and other pollutants in wastewater streams originating from fly ash and bottom ash handling activities, scrubber activities, and coal ash disposal leachate. Based upon an earlier set of preferred alternatives, the final effluent limitations generally require chemical precipitation and biological treatment for flue gas desulfurization scrubber wastewater, “zero discharge” from fly ash and bottom ash handling, and impoundment for coal ash disposal leachate.
On August 11, 2017, EPA announced that it would be initiating rulemaking proceedings to potentially revise the September 2015 effluent limitation guidelines. On September 18, 2017, EPA finalized a regulation postponing the earliest date on which compliance with the effluent limitation guidelines for these waste-streams would be required from November 1, 2018 until November 1, 2020. Until EPA issues a proposal describing how it intends to change the effluent limitation guidelines for bottom ash transport water and flue gas desulfurization wastewater, it is unclear how EPA’s reconsideration process will affect how the Four Corners plant manages these waste-streams. We expect that compliance with these limitations will be required in connection with National Pollution Discharge Elimination System ("NPDES") discharge permit renewals. Until a draft NPDES permit for Four Corners is proposed during the revised compliance timeframe (i.e., from November 1, 2020 through December 31, 2023), we are uncertain what will be required to control these discharges in compliance with the revised finalized effluent limitations at that facility. Cholla and the Navajo Plant do not require NPDES permitting.
Ozone National Ambient Air Quality Standards. On October 1, 2015, EPA finalized revisions to the primary ground-level ozone national ambient air quality standards (“NAAQS”) at a level of 70 parts per billion (“ppb”). With ozone standards becoming more stringent, our fossil generation units will come under increasing pressure to reduce emissions of nitrogen oxides and volatile organic compounds, and to generate emission offsets for new projects or facility expansions located in ozone nonattainment areas. EPA was expected to designate attainment and nonattainment areas relative to the new 70 ppb standard by October 1, 2017. To date, EPA has only taken action to designate areas of the U.S. that are in attainment with the 2015 NAAQS for ozone. EPA’s failure to take action relative to nonattainment designations is currently subject to on-going judicial review by certain states and environmental groups. At this time, it remains unclear when EPA will ultimately make a complete designation of all attainment and nonattainment areas within the U.S. Depending on when EPA approves attainment designations for the Arizona and Navajo Nation jurisdictions in which our fossil generation units are located, revisions to SIPs and FIPs, respectively, implementing required controls to achieve the new 70 ppb standard are expected to be in place between 2020 and 2021. At this time, because proposed SIPs and FIPs implementing the revised ozone NAAQSs have yet to be released, APS is unable to predict what impact the adoption of these standards may have on the Company. APS will continue to monitor these standards as they are implemented within the jurisdictions affecting APS.
Superfund-Related Matters. The Comprehensive Environmental Response Compensation and Liability Act ("Superfund") establishes liability for the cleanup of hazardous substances found contaminating the soil, water or air. Those who generated, transported or disposed of hazardous substances at a contaminated site are among those who are potentially responsible parties ("PRPs"). PRPs may be strictly, and often are jointly and severally, liable for clean-up. On September 3, 2003, EPA advised APS that EPA considers APS to be a PRP in the Motorola 52nd Street Superfund Site, Operable Unit 3 ("OU3") in Phoenix, Arizona. APS has facilities that are within this Superfund site. APS and Pinnacle West have agreed with EPA to perform certain investigative activities of the APS facilities within OU3. In addition, on September 23, 2009, APS agreed with EPA and one other PRP to voluntarily assist with the funding and management of the site-wide groundwater

23
remedial investigation and feasibility study ("RI/FS"). Based upon discussions between the OU3 working group parties and EPA, along with the results of recent technical analyses prepared by the OU3 working group to supplement the RI/FS, APS anticipates finalizing the RI/FS in the summer or fall of 2018. We estimate that our costs related to this investigation and study will be approximately $2 million. We anticipate incurring additional expenditures in the future, but because the overall investigation is not complete and ultimate remediation requirements are not yet finalized, at the present time expenditures related to this matter cannot be reasonably estimated.
On August 6, 2013, the Roosevelt Irrigation District ("RID") filed a lawsuit in Arizona District Court against APS and 24 other defendants, alleging that RID’s groundwater wells were contaminated by the release of hazardous substances from facilities owned or operated by the defendants. The lawsuit also alleges that, under Superfund laws, the defendants are jointly and severally liable to RID. The allegations against APS arise out of APS’s current and former ownership of facilities in and around OU3. As part of a state governmental investigation into groundwater contamination in this area, on January 25, 2015, the ADEQ sent a letter to APS seeking information concerning the degree to which, if any, APS’s current and former ownership of these facilities may have contributed to groundwater contamination in this area. APS responded to ADEQ on May 4, 2015. On December 16, 2016, two RID contractors filed ancillary lawsuits for recovery of costs against APS and the other defendants. Because the ancillary lawsuits concern past costs allegedly incurred by these RID vendors, which were ruled unrecoverable directly by RID in November of 2016, the additional lawsuits do not increase APS’s exposure or risk related to these matters. In addition, on March 15, 2017, the Arizona District Court granted partial summary judgment to RID for one element of RID's lawsuit against APS and the other defendants. On May 12, 2017, the court denied a motion for reconsideration as to this order. We are unable to predict the outcome of these matters; however, we do not expect the outcome to have a material impact on our financial position, results of operations or cash flows.
Manufactured Gas Plant Sites. Certain properties which APS now owns or which were previously owned by it or its corporate predecessors were at one time sites of, or sites associated with, manufactured gas plants. APS is taking action to voluntarily remediate these sites. APS does not expect these matters to have a material adverse effect on its financial position, results of operations or cash flows.
Federal Agency Environmental Lawsuit Related to Four Corners
On April 20, 2016, several environmental groups filed a lawsuit against OSM and other federal agencies in the District of Arizona in connection with their issuance of the approvals that extended the life of Four Corners and the adjacent mine. The lawsuit alleges that these federal agencies violated both ESA and NEPA in providing the federal approvals necessary to extend operations at the Four Corners Power Plant and the adjacent Navajo Mine past July 6, 2016. APS filed a motion to intervene in the proceedings, which was granted on August 3, 2016.
On September 15, 2016, NTEC, the company that owns the adjacent mine, filed a motion to intervene for the purpose of dismissing the lawsuit based on NTEC's tribal sovereign immunity. On September 11, 2017, the Arizona District Court issued an order granting NTEC's motion, dismissing the litigation with prejudice, and terminating the proceedings. On November 9, 2017, the environmental group plaintiffs appealed the district court order dismissing their lawsuit. We cannot predict whether this appeal will be successful and, if it is successful, the outcome of further district court proceedings.

24
Navajo Nation Environmental Issues
Four Corners and the Navajo Plant are located on the Navajo Reservation and are held under easements granted by the federal government, as well as leases from the Navajo Nation. See “Energy Sources and Resource Planning - Generation Facilities - Coal-Fueled Generating Facilities” above for additional information regarding these plants.
In July 1995, the Navajo Nation enacted the Navajo Nation Air Pollution Prevention and Control Act, the Navajo Nation Safe Drinking Water Act, and the Navajo Nation Pesticide Act (collectively, the “Navajo Acts”). The Navajo Acts purport to give the Navajo Nation Environmental Protection Agency authority to promulgate regulations covering air quality, drinking water, and pesticide activities, including those activities that occur at Four Corners and the Navajo Plant. On October 17, 1995, the Four Corners participants and the Navajo Plant participants each filed a lawsuit in the District Court of the Navajo Nation, Window Rock District, challenging the applicability of the Navajo Acts as to Four Corners and the Navajo Plant. The Court has stayed these proceedings pursuant to a request by the parties, and the parties are seeking to negotiate a settlement.
In April 2000, the Navajo Nation Council approved operating permit regulations under the Navajo Nation Air Pollution Prevention and Control Act. APS believes the Navajo Nation exceeded its authority when it adopted the operating permit regulations. On July 12, 2000, the Four Corners participants and the Navajo Plant participants each filed a petition with the Navajo Supreme Court for review of these regulations. Those proceedings have been stayed, pending the settlement negotiations mentioned above. APS cannot currently predict the outcome of this matter.
On May 18, 2005, APS, SRP, as the operating agent for the Navajo Plant, and the Navajo Nation executed a Voluntary Compliance Agreement to resolve their disputes regarding the Navajo Nation Air Pollution Prevention and Control Act. As a result of this agreement, APS sought, and the courts granted, dismissal of the pending litigation in the Navajo Nation Supreme Court and the Navajo Nation District Court, to the extent the claims relate to the Clean Air Act. The agreement does not address or resolve any dispute relating to other Navajo Acts. APS cannot currently predict the outcome of this matter.
Water Supply
Assured supplies of water are important for APS’s generating plants. At the present time, APS has adequate water to meet its needs. The Four Corners region, in which Four Corners is located, has historically experienced drought conditions that may affect the water supply for the plants if adequate moisture is not received in the watershed that supplies the area. However, during the past 12 months the region has received snowfall and precipitation sufficient to recover the Navajo Reservoir to an optimum operating level, reducing the probability of shortage in future years. Although the watershed and reservoirs are in a good condition at this time, APS is continuing to work with area stakeholders to implement agreements to minimize the effect, if any, on future drought conditions that could have an impact on operations of its plants.
Conflicting claims to limited amounts of water in the southwestern United States have resulted in numerous court actions, which, in addition to future supply conditions, have the potential to impact APS’s operations.
San Juan River Adjudication. Both groundwater and surface water in areas important to APS’s operations have been the subject of inquiries, claims, and legal proceedings, which will require a number of years to resolve. APS is one of a number of parties in a proceeding, filed March 13, 1975, before the Eleventh Judicial District Court in New Mexico to adjudicate rights to a stream system from which water for Four

25
Corners is derived. An agreement reached with the Navajo Nation in 1985, however, provides that if Four Corners loses a portion of its rights in the adjudication, the Navajo Nation will provide, for an agreed upon cost, sufficient water from its allocation to offset the loss. In addition, APS is a party to a water contract that allows the company to secure water for Four Corners in the event of a water shortage and is a party to a shortage sharing agreement, which provides for the apportionment of water supplies to Four Corners in the event of a water shortage in the San Juan River Basin.
Gila River Adjudication. A summons served on APS in early 1986 required all water claimants in the Lower Gila River Watershed in Arizona to assert any claims to water on or before January 20, 1987, in an action pending in Arizona Superior Court. Palo Verde is located within the geographic area subject to the summons. APS’s rights and the rights of the other Palo Verde participants to the use of groundwater and effluent at Palo Verde are potentially at issue in this adjudication. As operating agent of Palo Verde, APS filed claims that dispute the court’s jurisdiction over the Palo Verde participants’ groundwater rights and their contractual rights to effluent relating to Palo Verde. Alternatively, APS seeks confirmation of such rights. Several of APS’s other power plants are also located within the geographic area subject to the summons, including a number of gas-fired power plants located within Maricopa and Pinal Counties. In November 1999, the Arizona Supreme Court issued a decision confirming that certain groundwater rights may be available to the federal government and Indian tribes. In addition, in September 2000, the Arizona Supreme Court issued a decision affirming the lower court’s criteria for resolving groundwater claims. Litigation on both of these issues has continued in the trial court. In December 2005, APS and other parties filed a petition with the Arizona Supreme Court requesting interlocutory review of a September 2005 trial court order regarding procedures for determining whether groundwater pumping is affecting surface water rights. The Arizona Supreme Court denied the petition in May 2007, and the trial court is now proceeding with implementation of its 2005 order. No trial date concerning APS’s water rights claims has been set in this matter.
At this time, the lower court proceedings in the Gila River adjudication are in the process of determining the specific hydro-geologic testing protocols for determining which groundwater wells located outside of the subflow zone of the Gila River should be subject to the adjudication court’s jurisdiction. Discovery as to this issue is ongoing at this time, and a hearing to determine this jurisdictional test question will be held in March of 2018. Further proceedings thereafter will be dedicated to determining the specific hydro-geologic testing protocols for subflow depletion determinations. At this time, APS cannot predict the outcome of these proceedings.
Little Colorado River Adjudication. APS has filed claims to water in the Little Colorado River Watershed in Arizona in an action pending in the Apache County, Arizona, Superior Court, which was originally filed on September 5, 1985. APS’s groundwater resource utilized at Cholla is within the geographic area subject to the adjudication and, therefore, is potentially at issue in the case. APS’s claims dispute the court’s jurisdiction over its groundwater rights. Alternatively, APS seeks confirmation of such rights. Other claims have been identified as ready for litigation in motions filed with the court. No trial date concerning APS’s water rights claims has been set in this matter.
Although the above matters remain subject to further evaluation, APS does not expect that the described litigation will have a material adverse impact on its financial position, results of operations, or cash flows.

26
BUSINESS OF OTHER SUBSIDIARIES
Bright Canyon Energy
On July 31, 2014, Pinnacle West announced its creation of a wholly-owned subsidiary, BCE. BCE's focus is on new growth opportunities that leverage the Company’s core expertise in the electric energy industry. BCE’s first initiative is a 50/50 joint venture with BHE U.S. Transmission LLC, a subsidiary of Berkshire Hathaway Energy Company. The joint venture, named TransCanyon, is pursuing independent transmission opportunities within the eleven states that comprise the Western Electricity Coordinating Council, excluding opportunities related to transmission service that would otherwise be provided under the tariffs of the retail service territories of the venture partners’ utility affiliates. TransCanyon continues to pursue transmission development opportunities in the western United States consistent with its strategy.
On March 29, 2016, TransCanyon entered into a strategic alliance agreement with Pacific Gas and Electric Company ("PG&E") to jointly pursue competitive transmission opportunities solicited by the CAISO, the operator for the majority of California's transmission grid. TransCanyon and PG&E intend to jointly engage in the development of future transmission infrastructure and compete to develop, build, own and operate transmission projects approved by the CAISO.
El Dorado
El Dorado owns minority interests in several energy-related investments and Arizona community-based ventures. El Dorado’s short-term goal is to prudently realize the value of its existing investments. As of December 31, 2017, El Dorado had total assets of approximately $12 million. El Dorado is not expected to contribute in any material way to our future financial performance, nor will it require any material amounts of capital over the next three years.
4CA See "Business of Arizona Public Service Company - Energy Sources and Resource Planning - Generating Facilities - Coal-Fueled Generating Facilities - Four Corners" above for information regarding 4CA. As of December 31, 2017, 4CA had total assets of approximately $108 million.
OTHER INFORMATION
Subpoenas
Pinnacle West has received grand jury subpoenas issued in connection with an investigation by the office of the United States Attorney for the District of Arizona. The subpoenas seek information principally pertaining to the 2014 statewide election races in Arizona for Secretary of State and for positions on the ACC. The subpoenas request records involving certain Pinnacle West officers and employees, including the Company’s Chief Executive Officer, as well as communications between Pinnacle West personnel and a former ACC Commissioner. Pinnacle West is cooperating fully with the United States Attorney’s office in this matter.

27
Other Information
Pinnacle West, APS and El Dorado are all incorporated in the State of Arizona. BCE and 4CA are incorporated in Delaware. Additional information for each of these companies is provided below:
Principal Executive OfficeAddress
Year ofIncorporation
ApproximateNumber of
Employees atDecember 31, 2017
Pinnacle West 400 North Fifth StreetPhoenix, AZ 85004
1985 90
APS 400 North Fifth StreetP.O. Box 53999Phoenix, AZ 85072-3999
1920 6,196
BCE 400 East Van BurenPhoenix, AZ 85004
2014 6
El Dorado 400 East Van BurenPhoenix, AZ 85004
1983 —
4CA 400 North Fifth StreetPhoenix, AZ 85004
2016 —
Total 6,292
The APS number includes employees at jointly-owned generating facilities (approximately 2,565 employees) for which APS serves as the generating facility manager. Approximately 1,369 APS employees are union employees, represented by the International Brotherhood of Electrical Workers ("IBEW"). In January 2018, the Company concluded negotiations with IBEW and approved a two-year extension of the existing collective bargaining agreement, which was set to expire on April 1, 2018. The new agreement is in place until April 1, 2020. Approximately 200 APS employees at Palo Verde were union employees, represented by the United Security Professionals of America ("USPA"). The USPA collective bargaining agreement expired on May 31, 2017, but APS and the USPA did not reach an agreement over the terms of a new collective bargaining agreement. Certain members of the USPA bargaining unit filed a petition with the National Labor Relations Board ("NLRB") seeking to decertify the USPA as the representative of the bargaining unit, and the employees elected to decertify the union. The NLRB certified the results of the election on September 11, 2017.
WHERE TO FIND MORE INFORMATION
We use our website (www.pinnaclewest.com) as a channel of distribution for material Company information. The following filings are available free of charge on our website as soon as reasonably practicable after they are electronically filed with, or furnished to, the Securities and Exchange Commission (“SEC”): Annual Reports on Form 10-K, definitive proxy statements for our annual shareholder meetings, Quarterly Reports on Form 10-Q, Current Reports on Form 8-K and all amendments to those reports. Our board and committee charters, Code of Ethics for Financial Executives, Code of Ethics and Business Practices and other corporate governance information is also available on the Pinnacle West website. Pinnacle West will post any amendments to the Code of Ethics for Financial Executives and Code of Ethics and Business Practices, and any waivers that are required to be disclosed by the rules of either the SEC or the New York Stock Exchange, on its website. The information on Pinnacle West’s website is not incorporated by reference into this report.
You can request a copy of these documents, excluding exhibits, by contacting Pinnacle West at the
following address: Pinnacle West Capital Corporation, Office of the Corporate Secretary, Mail Station 8602, P.O. Box 53999, Phoenix, Arizona 85072-3999 (telephone 602-250-4400).

28
ITEM 1A. RISK FACTORS
In addition to the factors affecting specific business operations identified in the description of these operations contained elsewhere in this report, set forth below are risks and uncertainties that could affect our financial results. Unless otherwise indicated or the context otherwise requires, the following risks and uncertainties apply to Pinnacle West and its subsidiaries, including APS.
REGULATORY RISKS Our financial condition depends upon APS’s ability to recover costs in a timely manner from customers through regulated rates and otherwise execute its business strategy.
APS is subject to comprehensive regulation by several federal, state and local regulatory agencies that significantly influence its business, liquidity and results of operations and its ability to fully recover costs from utility customers in a timely manner. The ACC regulates APS’s retail electric rates and FERC regulates rates for wholesale power sales and transmission services. The profitability of APS is affected by the rates it may charge and the timeliness of recovering costs incurred through its rates. Consequently, our financial condition and results of operations are dependent upon the satisfactory resolution of any APS rate proceedings and ancillary matters which may come before the ACC and FERC, including in some cases how court challenges to these regulatory decisions are resolved. Arizona, like certain other states, has a statute that allows the ACC to reopen prior decisions and modify otherwise final orders under certain circumstances.
The ACC must also approve APS’s issuance of securities and any significant transfer or encumbrance of APS property used to provide retail electric service, and must approve or receive prior notification of certain transactions between us, APS and our respective affiliates. Decisions made by the ACC or FERC could have a material adverse impact on our financial condition, results of operations or cash flows.
APS’s ability to conduct its business operations and avoid fines and penalties depends upon compliance with federal, state and local statutes, regulations and ACC requirements, and obtaining and maintaining certain regulatory permits, approvals and certificates.
APS must comply in good faith with all applicable statutes, regulations, rules, tariffs, and orders of agencies that regulate APS’s business, including FERC, NRC, EPA, the ACC, and state and local governmental agencies. These agencies regulate many aspects of APS’s utility operations, including safety and performance, emissions, siting and construction of facilities, customer service and the rates that APS can charge retail and wholesale customers. Failure to comply can subject APS to, among other things, fines and penalties. For example, under the Energy Policy Act of 2005, FERC can impose penalties (approximately $1.2 million dollars per day per violation) for failure to comply with mandatory electric reliability standards. APS is also required to have numerous permits, approvals and certificates from these agencies. APS believes the necessary permits, approvals and certificates have been obtained for its existing operations and that APS’s business is conducted in accordance with applicable laws in all material respects. However, changes in regulations or the imposition of new or revised laws or regulations could have an adverse impact on our results of operations. We are also unable to predict the impact on our business and operating results from pending or future regulatory activities of any of these agencies.
The operation of APS’s nuclear power plant exposes it to substantial regulatory oversight and potentially significant liabilities and capital expenditures.
The NRC has broad authority under federal law to impose safety-related, security-related and other licensing requirements for the operation of nuclear generation facilities. Events at nuclear facilities of other

29
operators or impacting the industry generally may lead the NRC to impose additional requirements and regulations on all nuclear generation facilities, including Palo Verde. In the event of noncompliance with its requirements, the NRC has the authority to impose a progressively increased inspection regime that could ultimately result in the shut-down of a unit or civil penalties, or both, depending upon the NRC’s assessment of the severity of the situation, until compliance is achieved. The increased costs resulting from penalties, a heightened level of scrutiny and implementation of plans to achieve compliance with NRC requirements may adversely affect APS’s financial condition, results of operations and cash flows.
APS is subject to numerous environmental laws and regulations, and changes in, or liabilities under, existing or new laws or regulations may increase APS’s cost of operations or impact its business plans.
APS is, or may become, subject to numerous environmental laws and regulations affecting many aspects of its present and future operations, including air emissions of conventional pollutants and greenhouse gases, water quality, discharges of wastewater and streams originating from fly ash and bottom ash handling facilities, solid waste, hazardous waste, and coal combustion products, which consist of bottom ash, fly ash, and air pollution control wastes. These laws and regulations can result in increased capital, operating, and other costs, particularly with regard to enforcement efforts focused on power plant emissions obligations. These laws and regulations generally require APS to obtain and comply with a wide variety of environmental licenses, permits, and other approvals. If there is a delay or failure to obtain any required environmental regulatory approval, or if APS fails to obtain, maintain, or comply with any such approval, operations at affected facilities could be suspended or subject to additional expenses. In addition, failure to comply with applicable environmental laws and regulations could result in civil liability as a result of government enforcement actions or private claims or criminal penalties. Both public officials and private individuals may seek to enforce applicable environmental laws and regulations. APS cannot predict the outcome (financial or operational) of any related litigation that may arise.
Environmental Clean Up. APS has been named as a PRP for a Superfund site in Phoenix, Arizona, and
it could be named a PRP in the future for other environmental clean-up at sites identified by a regulatory body. APS cannot predict with certainty the amount and timing of all future expenditures related to environmental matters because of the difficulty of estimating clean-up costs. There is also uncertainty in quantifying liabilities under environmental laws that impose joint and several liability on all PRPs.
Coal Ash. In December 2014, EPA issued final regulations governing the handling and disposal of CCR, which are generated as a result of burning coal and consist of, among other things, fly ash and bottom ash. The rule regulates CCR as a non-hazardous waste. APS currently disposes of CCR in ash ponds and dry storage areas at Cholla and Four Corners and in a dry landfill storage area at the Navajo Plant. To the extent the rule requires the closure or modification of these CCR units or the construction of new CCR units beyond what we currently anticipate, APS would incur significant additional costs for CCR disposal.
Ozone National Ambient Air Quality Standards. In 2015, EPA finalized revisions to the national ambient air quality standards for nitrogen oxides, which set new, more stringent standards intended to protect human health and human welfare. Depending on the final attainment designations for the new standards and the state implementation requirements, APS may be required to invest in new pollution control technologies and to generate emission offsets for new projects or facility expansions located in ozone nonattainment areas.
APS cannot assure that existing environmental regulations will not be revised or that new regulations seeking to protect the environment will not be adopted or become applicable to it. Revised or additional regulations that result in increased compliance costs or additional operating restrictions, particularly if those costs incurred by APS are not fully recoverable from APS’s customers, could have a material adverse effect on its financial condition, results of operations or cash flows. Due to current or potential future regulations or

30
legislation coupled with trends in natural gas and coal prices, the economics of continuing to own certain resources, particularly coal facilities, may deteriorate, warranting early retirement of those plants, which may result in asset impairments. APS would seek recovery in rates for the book value of any remaining investments in the plants as well as other costs related to early retirement, but cannot predict whether it would obtain such recovery.
APS faces potential financial risks resulting from climate change litigation and legislative and regulatory efforts to limit GHG emissions, as well as physical and operational risks related to climate effects.
Concern over climate change has led to significant legislative and regulatory efforts to limit CO2, which is a major byproduct of the combustion of fossil fuel, and other GHG emissions.
Potential Financial Risks - Greenhouse Gas Regulation, the Clean Power Plan and Potential Litigation. In 2015, EPA finalized a rule to limit carbon dioxide emissions from existing power plants. The implementation of this rule within the jurisdictions where APS operates could result in a shift in in-state generation from coal to natural gas and renewable generation. Such a substantial change in APS’s generation portfolio could require additional capital investments and increased operating costs, and thus have a significant financial impact on the Company. EPA took action in October 2017 to potentially repeal these regulations and is currently taking public comments on whether or how EPA could take action to replace the Clean Power Plan with a new set of regulations.
Depending on the final outcome of a pending judicial review of the Clean Power Plan, along with related regulatory activity to repeal or replace these regulations, the utility industry may face alternative efforts from private parties seeking to establish alternative GHG emission limitations from power plants. Alternative GHG emission limitations may arise from litigation under either federal or state common laws or citizen suit provisions of federal environmental statutes that attempt to force federal agency rulemaking or imposing direct facility emission limitations. Such lawsuits may also seek damages from harm alleged to have resulted from power plant GHG emissions.
Physical and Operational Risks. Weather extremes such as drought and high temperature variations are common occurrences in the Southwest’s desert area, and these are risks that APS considers in the normal course of business in the engineering and construction of its electric system. Large increases in ambient temperatures could require evaluation of certain materials used within its system and represent a greater challenge.
Co-owners of our jointly owned generation facilities may have unaligned goals and positions due to the effects of legislation, regulations, economic conditions or changes in our industry, which could have a significant impact on our ability to continue operations of such facilities.
APS owns certain of our power plants jointly with other owners with varying ownership interests in such facilities. Changes in the nature of our industry and the economic viability of certain plants, including impacts resulting from types and availability of other resources, fuel costs, legislation and regulation, together with timing considerations related to expiration of leases or other agreements for such facilities, could result in unaligned positions among co-owners. Such differences in the co-owners’ willingness or ability to continue their participation could ultimately lead to disagreements among the parties as to how and whether to continue operation of such plants, which could lead to eventual shut down of units or facilities and uncertainty related to the resulting cost recovery of such assets. See Note 3 for a discussion of the co-owners' plans to cease operations of the Navajo Plant and the related risks associated with APS's continued recovery of its remaining investment in the plant.

31
Deregulation or restructuring of the electric industry may result in increased competition, which could have a significant adverse impact on APS’s business and its results of operations.
In 1999, the ACC approved rules for the introduction of retail electric competition in Arizona. Retail competition could have a significant adverse financial impact on APS due to an impairment of assets, a loss of retail customers, lower profit margins or increased costs of capital. Although some very limited retail competition existed in APS’s service area in 1999 and 2000, there are currently no active retail competitors offering unbundled energy or other utility services to APS’s customers. On May 9, 2013, the ACC voted to re-examine the facilitation of a deregulated retail electric market in Arizona. The ACC subsequently opened a docket for this matter and received comments from a number of interested parties on the considerations involved in establishing retail electric deregulation in the state. One of these considerations is whether various aspects of a deregulated market, including setting utility rates on a “market” basis, would be consistent with the requirements of the Arizona Constitution. On September 11, 2013, after receiving legal advice from the ACC staff, the ACC voted 4-1 to close the current docket and await full Arizona Constitutional authority before any further examination of this matter. The motion approved by the ACC also included opening one or more new dockets in the future to explore options to offer more rate choices to customers and innovative changes within the existing cost-of-service regulatory model that could include elements of competition.
One of these options would be a continuation or expansion of APS’s existing AG (Alternative Generation)-X program, which essentially allows up to 200 MW of cumulative load to be served via a buy-through arrangement with competitive suppliers of generation. The AG-X program was approved by the ACC as part of the 2017 Settlement Agreement.
Proposals to enable or support retail electric competition may be made from time to time through ballot
initiatives, legislative action or other forums in Arizona. We cannot predict future regulatory or legislative action that might result in increased competition.
OPERATIONAL RISKS APS’s results of operations can be adversely affected by various factors impacting demand for electricity.
Weather Conditions. Weather conditions directly influence the demand for electricity and affect the price of energy commodities. Electric power demand is generally a seasonal business. In Arizona, demand for power peaks during the hot summer months, with market prices also peaking at that time. As a result, APS’s overall operating results fluctuate substantially on a seasonal basis. In addition, APS has historically sold less power, and consequently earned less income, when weather conditions are milder. As a result, unusually mild weather could diminish APS’s financial condition, results of operations or cash flows.
Higher temperatures may decrease the snowpack, which might result in lowered soil moisture and an
increased threat of forest fires. Forest fires could threaten APS’s communities and electric transmission lines and facilities. Any damage caused as a result of forest fires could negatively impact APS’s financial condition, results of operations or cash flows.
Effects of Energy Conservation Measures and Distributed Energy Resources. The ACC has enacted
rules regarding energy efficiency that mandate a 22% cumulative annual energy savings requirement by 2020. This will likely increase participation by APS customers in energy efficiency and conservation programs and other demand-side management efforts, which in turn will impact the demand for electricity. The rules also include a requirement for the ACC to review and address financial disincentives, recovery of fixed costs and

32
the recovery of net lost income/revenue that would result from lower sales due to increased energy efficiency requirements. To that end, the LFCR is designed to address these matters.
APS must also meet certain distributed energy requirements. A portion of APS’s total renewable
energy requirement must be met with an increasing percentage of distributed energy resources (generally, small scale renewable technologies located on customers’ properties). The distributed energy requirement was 25% of the overall RES requirement of 3% in 2011 and increased to 30% of the applicable RES requirement for 2012 and subsequent years. Customer participation in distributed energy programs would result in lower demand, since customers would be meeting some of their own energy needs.
In addition to these rules and requirements, energy efficiency technologies and distributed energy resources continue to evolve, which may have similar impacts on demand for electricity. Reduced demand due to these energy efficiency requirements, distributed energy requirements and other emerging technologies, unless substantially offset through ratemaking mechanisms, could have a material adverse impact on APS’s financial condition, results of operations and cash flows.
Actual and Projected Customer and Sales Growth. Retail customers in APS's service territory
increased 1.8% for the year ended December 31, 2017 compared with the prior year. For the three years 2015 through 2017, APS’s retail customer growth averaged 1.5% per year. We currently project annual customer growth to be 1.5-2.5% for 2018 and to average in the range of 2-3% for 2018 through 2020 based on our assessment of modestly improving economic conditions in Arizona.
Retail electricity sales in kWh, adjusted to exclude the effects of weather variations, decreased 0.3% for the year ended December 31, 2017 compared with the prior year. Improving economic conditions and customer growth were more than offset by energy savings driven by customer conservation, energy efficiency, distributed renewable generation initiatives and one fewer day of sales due to the leap year in 2016. For the three years 2015 through 2017, APS experienced annual increases in retail electricity sales averaging 0.1%, adjusted to exclude the effects of weather variations. We currently project that annual retail electricity sales in kWh will increase in the range of 0.5-1.5% for 2018 and increase on average in the range of 0.5-1.5% during 2018 through 2020, including the effects of customer conservation and energy efficiency and distributed renewable generation initiatives, but excluding the effects of weather variations. A slower recovery of the Arizona economy or acceleration of the expected effects of customer conservation, energy efficiency or distributed renewable generation initiatives could further impact these estimates.
Actual customer and sales growth may differ from our projections as a result of numerous factors, such as economic conditions, customer growth, usage patterns and energy conservation, impacts of energy efficiency programs and growth in distributed renewable generation, and responses to retail price changes. Additionally, recovery of a substantial portion of our fixed costs of providing service is based upon the volumetric amount of our sales. If our customer growth rate does not continue to improve as projected, or if we experience acceleration of expected effects of customer conservation, energy efficiency or distributed renewable generation initiatives, we may be unable to reach our estimated sales projections, which could have a negative impact on our financial condition, results of operations and cash flows.

33
The operation of power generation facilities and transmission systems involves risks that could result in reduced output or unscheduled outages, which could materially affect APS’s results of operations.
The operation of power generation, transmission and distribution facilities involves certain risks, including the risk of breakdown or failure of equipment, fuel interruption, and performance below expected levels of output or efficiency. Unscheduled outages, including extensions of scheduled outages due to mechanical failures or other complications, occur from time to time and are an inherent risk of APS’s business. Because our transmission facilities are interconnected with those of third parties, the operation of our facilities could be adversely affected by unexpected or uncontrollable events occurring on the larger transmission power grid, and the operation or failure of our facilities could adversely affect the operations of others. Concerns over physical security of these assets could include damage to certain of our facilities due to vandalism or other deliberate acts that could lead to outages or other adverse effects. If APS’s facilities operate below expectations, especially during its peak seasons, it may lose revenue or incur additional expenses, including increased purchased power expenses.
The inability to successfully develop or acquire generation resources to meet reliability requirements and other new or evolving standards or regulations could adversely impact our business.
Potential changes in regulatory standards, impacts of new and existing laws and regulations, including environmental laws and regulations, and the need to obtain various regulatory approvals create uncertainty surrounding our generation portfolio. The current abundance of low, stably priced natural gas, together with environmental and other concerns surrounding coal-fired generation resources, create strategic challenges as to the appropriate generation portfolio and fuel diversification mix. In addition, APS is required by the ACC to meet certain energy resource portfolio requirements, including those related to renewables development and energy efficiency measures. The development of any generation facility is subject to many risks, including those related to financing, siting, permitting, new and evolving technology, the construction of sufficient transmission capacity to support these facilities and stresses to generation and transmission resources from the intermittent generation characteristics of renewable resources. APS’s inability to adequately develop or acquire the necessary generation resources could have a material adverse impact on our business and results of operations.
In expressing concerns about the environmental and climate-related impacts from continued extraction, transportation, delivery and combustion of fossil fuels, environmental advocacy groups and other third parties have in recent years undertaken greater efforts to oppose the permitting and construction of fossil fuel infrastructure projects. These efforts may increase in scope and frequency depending on a number of variables, including the future course of Federal environmental regulation and the increasing financial resources devoted to these opposition activities. APS cannot predict the effect that any such opposition may have on our ability to develop and construct fossil fuel infrastructure projects in the future. The lack of access to sufficient supplies of water could have a material adverse impact on APS’s business and results of operations.
Assured supplies of water are important for APS’s generating plants. Water in the southwestern United States is limited, and various parties have made conflicting claims regarding the right to access and use such limited supply of water. Both groundwater and surface water in areas important to APS’s generating plants have been and are the subject of inquiries, claims and legal proceedings. In addition, the region in which APS’s power plants are located is prone to drought conditions, which could potentially affect the plants’ water supplies. APS’s inability to access sufficient supplies of water could have a material adverse impact on our business and results of operations.

34
We are subject to cybersecurity risks and risks of unauthorized access to our systems.
We operate in a highly regulated industry that requires the continued operation of sophisticated information technology systems and network infrastructure. In the regular course of our business, we handle a range of sensitive security, customer and business systems information. There appears to be an increasing level of activity, sophistication and maturity of threat actors, in particular nation state actors, that seek to exploit potential vulnerabilities in the electric utility industry and wish to disrupt the U.S. bulk power, transmission and distribution system. Our information technology systems, generation (including our Palo Verde nuclear facility), transmission and distribution facilities, and other infrastructure facilities and systems and physical assets could be targets of unauthorized access and are critical areas of cyber protection for us.
Despite implementation of security measures, our technology systems are vulnerable to disability, failures or unauthorized access. If a significant cybersecurity event or breach were to occur, we may not be able to fulfill critical business functions and we could (i) experience property damage, disruptions to our business, theft of or unauthorized access to customer, employee, financial or system operation information or other information; (ii) experience loss of revenue or incur significant costs for repair, remediation and breach notification, and increased capital and operating costs to implement increased security measures? and (iii) be subject to increased regulation, litigation and reputational damage. These types of events could also require significant management attention and resources, and could have a material adverse impact on our financial condition, results of operations or cash flows.
We are subject to laws and rules issued by multiple government agencies concerning safeguarding and maintaining the confidentiality of our security, customer and business information. One of these agencies, NERC, has issued comprehensive regulations and standards surrounding the security of bulk power systems, and is continually in the process of developing updated and additional requirements with which the utility industry must comply. The NRC also has issued regulations and standards related to the protection of critical digital assets at commercial nuclear power plants. The increasing promulgation of NERC and NRC rules and standards will increase our compliance costs and our exposure to the potential risk of violations of the standards. Experiencing a cybersecurity incident could cause us to be non-compliant with applicable laws and regulations, such as those promulgated by NERC and the NRC, or contracts that require us to securely maintain confidential data, causing us to incur costs related to legal claims or proceedings and regulatory fines or penalties.
The risk of these system-related events and security breaches occurring continues to intensify. We have experienced, and expect to continue to experience, threats and attempted intrusions to our information technology systems and we could experience such threats and attempted intrusions to our operational control systems. To date we have not experienced a material breach or disruption to our network or information systems or our service operations. However, as such attacks continue to increase in sophistication and frequency, we may be unable to prevent all such attacks from being successful in the future.
We have obtained cyber insurance to provide coverage for a portion of the losses and damages that may result from a security breach of our information technology systems, but such insurance is subject to a number of exclusions and may not cover the total loss or damage caused by a breach. The market for cybersecurity insurance is relatively new and coverage available for cybersecurity events may evolve as the industry matures. In the future, adequate insurance may not be available at rates that we believe are reasonable, and the costs of responding to and recovering from a cyber incident may not be covered by insurance or recoverable in rates.

35
The ownership and operation of power generation and transmission facilities on Indian lands could result in uncertainty related to continued leases, easements and rights-of-way, which could have a significant impact on our business.
Certain APS power plants and portions of certain APS transmission lines are located on Indian lands pursuant to leases, easements or other rights-of-way that are effective for specified periods. APS is unable to predict the final outcomes of pending and future approvals by the applicable sovereign governing bodies with respect to renewals of these leases, easements and rights-of-way.
There are inherent risks in the ownership and operation of nuclear facilities, such as environmental, health, fuel supply, spent fuel disposal, regulatory and financial risks and the risk of terrorist attack.
APS has an ownership interest in and operates, on behalf of a group of participants, Palo Verde, which is the largest nuclear electric generating facility in the United States. Palo Verde constitutes approximately 18% of our owned and leased generation capacity. Palo Verde is subject to environmental, health and financial risks, such as the ability to obtain adequate supplies of nuclear fuel; the ability to dispose of spent nuclear fuel; the ability to maintain adequate reserves for decommissioning; potential liabilities arising out of the operation of these facilities; the costs of securing the facilities against possible terrorist attacks; and unscheduled outages due to equipment and other problems. APS maintains nuclear decommissioning trust funds and external insurance coverage to minimize its financial exposure to some of these risks; however, it is possible that damages could exceed the amount of insurance coverage. In addition, APS may be required under federal law to pay up to $111 million (but not more than $16.6 million per year) of liabilities arising out of a nuclear incident occurring not only at Palo Verde, but at any other nuclear power plant in the United States. Although we have no reason to anticipate a serious nuclear incident at Palo Verde, if an incident did occur, it could materially and adversely affect our results of operations and financial condition. A major incident at a nuclear facility anywhere in the world could cause the NRC to limit or prohibit the operation or licensing of any domestic nuclear unit and to promulgate new regulations that could require significant capital expenditures and/or increase operating costs.
The use of derivative contracts in the normal course of our business could result in financial losses that negatively impact our results of operations.
APS’s operations include managing market risks related to commodity prices. APS is exposed to the impact of market fluctuations in the price and transportation costs of electricity, natural gas and coal to the extent that unhedged positions exist. We have established procedures to manage risks associated with these market fluctuations by utilizing various commodity derivatives, including exchange traded futures and over-the-counter forwards, options, and swaps. As part of our overall risk management program, we enter into derivative transactions to hedge purchases and sales of electricity and fuels. The changes in market value of such contracts have a high correlation to price changes in the hedged commodity. To the extent that commodity markets are illiquid, we may not be able to execute our risk management strategies, which could result in greater unhedged positions than we would prefer at a given time and financial losses that negatively impact our results of operations.
The Dodd-Frank Wall Street Reform and Consumer Protection Act (“Dodd-Frank Act”) contains
measures aimed at increasing the transparency and stability of the over-the counter, or OTC, derivative markets and preventing excessive speculation. The Dodd-Frank Act could restrict, among other things, trading positions in the energy futures markets, require different collateral or settlement positions, or increase regulatory reporting over derivative positions. Based on the provisions included in the Dodd-Frank Act and the implementation of regulations, these changes could, among other things, impact our ability to hedge commodity price and interest rate risk or increase the costs associated with our hedging programs.

36
We are exposed to losses in the event of nonperformance or nonpayment by counterparties. We use a
risk management process to assess and monitor the financial exposure of all counterparties. Despite the fact that the majority of APS’s trading counterparties are rated as investment grade by the rating agencies, there is still a possibility that one or more of these companies could default, which could result in a material adverse impact on our earnings for a given period.
Changes in technology could create challenges for APS’s existing business.
Alternative energy technologies that produce power or reduce power consumption or emissions are being developed and commercialized, including renewable technologies such as photovoltaic (solar) cells, customer-sited generation, energy storage (batteries), and efficiency technologies. Advances in technology and equipment/appliance efficiency could reduce the demand for supply from conventional generation and increase the complexity of managing APS's information technology and power system operations, which could adversely affect APS’s business.
APS continues to pursue and implement advanced grid technologies, including transmission and
distribution system technologies and digital meters enabling two-way communications between the utility and its customers. Many of the products and processes resulting from these and other alternative technologies have not yet been widely used or tested on a long-term basis, and their use on large-scale systems is not as established or mature as APS’s existing technologies and equipment. The implementation of new and additional technologies adds complexity to our information technology and operational technology systems, which could require additional infrastructure and resources. Widespread installation and acceptance of new technologies could also enable the entry of new market participants, such as technology companies, into the interface between APS and its customers and could have other unpredictable effects on APS’s traditional business model.
Deployment of renewable energy technologies is expected to continue across the western states and result in a larger portion of the overall energy production coming from these sources. These trends, which have benefited from historical and continuing government support for certain technologies, have the potential to put downward pressure on wholesale power prices throughout the western states which could make APS's existing generating facilities less economical and impact their operational patterns and long-term viability.
We are subject to employee workforce factors that could adversely affect our business and financial condition.
Like many companies in the electric utility industry, our workforce is maturing, with approximately 30% of employees eligible to retire by the end of 2020. Although we have undertaken efforts to recruit, train and develop new employees, we face increased competition for talent. We are subject to other employee workforce factors, such as the availability of qualified personnel, the need to negotiate collective bargaining agreements with union employees and potential work stoppages. These or other employee workforce factors could negatively impact our business, financial condition or results of operations.

37
FINANCIAL RISKS Financial market disruptions or new rules or regulations may increase our financing costs or limit our access to various financial markets, which may adversely affect our liquidity and our ability to implement our financial strategy. Pinnacle West and APS rely on access to credit markets as a significant source of liquidity and the capital markets for capital requirements not satisfied by cash flow from our operations. We believe that we will maintain sufficient access to these financial markets. However, certain market disruptions or rules or regulations may cause our cost of borrowing to increase generally, and/or otherwise adversely affect our ability to access these financial markets.
In addition, the credit commitments of our lenders under our bank facilities may not be satisfied or continued beyond current commitment periods for a variety of reasons, including new rules and regulations, periods of financial distress or liquidity issues affecting our lenders or financial markets, which could materially adversely affect the adequacy of our liquidity sources and the cost of maintaining these sources.
Changes in economic conditions, monetary policy, financial regulation or other factors could result in higher interest rates, which would increase interest expense on our existing variable rate debt and new debt we expect to issue in the future, and thus reduce funds available to us for our current plans.
Additionally, an increase in our leverage, whether as a result of these factors or otherwise, could adversely affect us by:
• causing a downgrade of our credit ratings;• increasing the cost of future debt financing and refinancing;• increasing our vulnerability to adverse economic and industry conditions; and• requiring us to dedicate an increased portion of our cash flow from operations to payments on our
debt, which would reduce funds available to us for operations, future investment in our business or other purposes.
A downgrade of our credit ratings could materially and adversely affect our business, financial condition and results of operations.
Our current ratings are set forth in “Liquidity and Capital Resources — Credit Ratings” in Item 7. We cannot be sure that any of our current ratings will remain in effect for any given period of time or that a rating will not be lowered or withdrawn entirely by a rating agency if, in its judgment, circumstances in the future so warrant. Any downgrade or withdrawal could adversely affect the market price of Pinnacle West’s and APS’s securities, limit our access to capital and increase our borrowing costs, which would diminish our financial results. We would be required to pay a higher interest rate for future financings, and our potential pool of investors and funding sources could decrease. In addition, borrowing costs under our existing credit facilities depend on our credit ratings. A downgrade could also require us to provide additional support in the form of letters of credit or cash or other collateral to various counterparties. If our short-term ratings were to be lowered, it could severely limit access to the commercial paper market. We note that the ratings from rating agencies are not recommendations to buy, sell or hold our securities and that each rating should be evaluated independently of any other rating.

38
Investment performance, changing interest rates and other economic, social and political factors could decrease the value of our benefit plan assets and nuclear decommissioning trust funds or increase the valuation of our related obligations, resulting in significant additional funding requirements. We are also subject to risks related to the provision of employee healthcare benefits and healthcare reform legislation. Any inability to fully recover these costs in our utility rates would negatively impact our financial condition.
We have significant pension plan and other postretirement benefits plan obligations to our employees and retirees, and legal obligations to fund our pension trust and nuclear decommissioning trusts for Palo Verde. We hold and invest substantial assets in these trusts that are designed to provide funds to pay for certain of these obligations as they arise. Declines in market values of the fixed income and equity securities held in these trusts may increase our funding requirements into the related trusts. Additionally, the valuation of liabilities related to our pension plan and other postretirement benefit plans are impacted by a discount rate, which is the interest rate used to discount future pension and other postretirement benefit obligations. Declining interest rates decrease the discount rate, increase the valuation of the plan liabilities and may result in increases in pension and other postretirement benefit costs, cash contributions, regulatory assets, and charges to OCI. Changes in demographics, including increased number of retirements or changes in life expectancy and changes in other actuarial assumptions, may also result in similar impacts. The minimum contributions required under these plans are impacted by federal legislation and related regulations. Increasing liabilities or otherwise increasing funding requirements under these plans, resulting from adverse changes in legislation or otherwise, could result in significant cash funding obligations that could have a material impact on our financial position, results of operations or cash flows.
We recover most of the pension costs and other postretirement benefit costs and all of the nuclear
decommissioning costs in our regulated rates. Any inability to fully recover these costs in a timely manner would have a material negative impact on our financial condition, results of operations or cash flows.
Employee healthcare costs in recent years have continued to rise. While most of the Patient Protection
and Affordable Care Act provisions have been implemented, changes to that Act or other potential legislation could increase costs of providing medical insurance for our employees. Any potential changes and resulting cost impacts cannot be determined with certainty at this time.
Our cash flow depends on the performance of APS.
We derive essentially all of our revenues and earnings from our wholly-owned subsidiary, APS. Accordingly, our cash flow and our ability to pay dividends on our common stock is dependent upon the earnings and cash flows of APS and its distributions to us. APS is a separate and distinct legal entity and has no obligation to make distributions to us.
APS’s financing agreements may restrict its ability to pay dividends, make distributions or otherwise
transfer funds to us. In addition, an ACC financing order requires APS to maintain a common equity ratio of at least 40% and does not allow APS to pay common dividends if the payment would reduce its common equity below that threshold. The common equity ratio, as defined in the ACC order, is total shareholder equity divided by the sum of total shareholder equity and long-term debt, including current maturities of long-term debt.
39
Pinnacle West’s ability to meet its debt service obligations could be adversely affected because its debt securities are structurally subordinated to the debt securities and other obligations of its subsidiaries.
Because Pinnacle West is structured as a holding company, all existing and future debt and other liabilities of our subsidiaries will be effectively senior in right of payment to our debt securities. The assets and cash flows of our subsidiaries will be available, in the first instance, to service their own debt and other obligations. Our ability to have the benefit of their cash flows, particularly in the case of any insolvency or financial distress affecting our subsidiaries, would arise only through our equity ownership interests in our subsidiaries and only after their creditors have been satisfied.
The market price of our common stock may be volatile.
The market price of our common stock could be subject to significant fluctuations in response to factors such as the following, some of which are beyond our control:
• variations in our quarterly operating results;• operating results that vary from the expectations of management, securities analysts and investors;• changes in expectations as to our future financial performance, including financial estimates by
securities analysts and investors;• developments generally affecting industries in which we operate;• announcements by us or our competitors of significant contracts, acquisitions, joint marketing
relationships, joint ventures or capital commitments;• announcements by third parties of significant claims or proceedings against us;• favorable or adverse regulatory or legislative developments;• our dividend policy;• future sales by the Company of equity or equity-linked securities; and• general domestic and international economic conditions.
In addition, the stock market in general has experienced volatility that has often been unrelated to the operating performance of a particular company. These broad market fluctuations may adversely affect the market price of our common stock.
Certain provisions of our articles of incorporation and bylaws and of Arizona law make it difficult for shareholders to change the composition of our board and may discourage takeover attempts.
These provisions, which could preclude our shareholders from receiving a change of control premium, include the following:
• restrictions on our ability to engage in a wide range of “business combination” transactions with an “interested shareholder” (generally, any person who owns 10% or more of our outstanding voting power or any of our affiliates or associates) or any affiliate or associate of an interested shareholder, unless specific conditions are met;
• anti-greenmail provisions of Arizona law and our bylaws that prohibit us from purchasing shares of our voting stock from beneficial owners of more than 5% of our outstanding shares unless specified conditions are satisfied;
• the ability of the Board of Directors to increase the size of the Board of Directors and fill vacancies on the Board of Directors, whether resulting from such increase, or from death, resignation, disqualification or otherwise; and

40
• the ability of our Board of Directors to issue additional shares of common stock and shares of preferred stock and to determine the price and, with respect to preferred stock, the other terms, including preferences and voting rights, of those shares without shareholder approval.
While these provisions have the effect of encouraging persons seeking to acquire control of us to
negotiate with our Board of Directors, they could enable the Board of Directors to hinder or frustrate a transaction that some, or a majority, of our shareholders might believe to be in their best interests and, in that case, may prevent or discourage attempts to remove and replace incumbent directors.
Our financial results could be adversely affected if 4CA is unable to reach resolution with NTEC regarding the future ownership of 4CA’s 7% interest in Four Corners and NTEC is unwilling or unable to satisfy its contractual obligations.
On July 6, 2016, 4CA purchased El Paso’s 7% interest in Four Corners. NTEC had the option to purchase the 7% interest within a certain timeframe pursuant to an option granted to NTEC. On December 29, 2015, NTEC provided notice of its intent to exercise the option. The purchase did not occur during the originally contemplated timeframe. The parties are currently in discussions as to the future of the option transaction.
The 2016 Coal Supply Agreement contains alternate pricing terms for the 7% interest in the event NTEC does not purchase the interest. At this time, since NTEC has not yet purchased the 7% interest, the alternate pricing provisions are applicable to 4CA as the holder of the 7% interest. These terms include a formula under which NTEC must make certain payments to 4CA for reimbursement of operations and maintenance costs and a specified rate of return, offset by revenue generated by 4CA’s power sales. Such payments are due to 4CA at the end of each calendar year. A $10 million payment was due to 4CA at December 31, 2017, which NTEC satisfied by directing to 4CA a prepayment from APS of a portion of a future mine reclamation obligation. The balance of the amount under this formula at December 31, 2017 is approximately $20 million, which is due to 4CA at December 31, 2018. In future years there may be similar payments due from NTEC to 4CA under this formula. 4CA believes NTEC should continue to satisfy its contractual obligations related to these payments; however, if NTEC fails to meet its contractual obligations when due, 4CA will consider appropriate measures.
If NTEC is unwilling or unable to ultimately assume ownership of the 7% interest of Four Corners on terms acceptable to 4CA, and if NTEC is unwilling or unable to satisfy its contractual obligations related to payments owed to 4CA under the 2016 Coal Supply Agreement, 4CA will consider potential impacts to the Company’s financial statements, which may negatively impact our financial condition, results of operations or cash flows. 4CA and NTEC are in active discussions regarding these matters and cannot predict the outcome of those discussions.
ITEM 1B. UNRESOLVED STAFF COMMENTS
Neither Pinnacle West nor APS has received written comments regarding its periodic or current reports from the SEC staff that were issued 180 days or more preceding the end of its 2017 fiscal year and that remain unresolved.

41
ITEM 2. PROPERTIES
Generation Facilities
APS
APS’s portfolio of owned and leased generating facilities is provided in the table below:
NameNo. ofUnits
%Owned (a)
PrincipalFuelsUsed
PrimaryDispatch
Type
OwnedCapacity
(MW)
Nuclear:
Palo Verde (b) 3 29.1% Uranium Base Load 1,146Total Nuclear
1,146Steam:
Four Corners 4, 5 (c) 2 63% Coal Base Load 970Cholla 1,3 (d) 2
Coal Base Load 387Navajo (e) 3 14% Coal Base Load 315Ocotillo 2
Gas Peaking 220Total Steam
1,892Combined Cycle:
Redhawk 2
Gas Load Following 984West Phoenix 5
Gas Load Following 887Total Combined Cycle
1,871Combustion Turbine:
Ocotillo 2
Gas Peaking 110Saguaro 3
Gas Peaking 189Fairview 1
Oil Peaking 16Sundance 10
Gas Peaking 420West Phoenix 2
Gas Peaking 110Yucca 1, 2, 3 3
Gas Peaking 93Yucca 4 1
Oil Peaking 54Yucca 5, 6 2
Gas Peaking 96Total Combustion Turbine
1,088Solar:
Cotton Center 1
Solar As Available 17Hyder I 1
Solar As Available 16Paloma 1
Solar As Available 17Chino Valley 1
Solar As Available 19Gila Bend 1 Solar As Available 32Hyder II 1
Solar As Available 14Foothills 1
Solar As Available 35Luke AFB 1 Solar As Available 10Desert Star 1 Solar As Available 10Red Rock 1 Solar As Available 40APS Owned Distributed Energy
Solar As Available 25Multiple facilities
Solar As Available 4Total Solar
239Total Capacity
6,236

42
(a) 100% unless otherwise noted.(b) See “Business of Arizona Public Service Company — Energy Sources and Resource Planning —
Generation Facilities — Nuclear” in Item 1 for details regarding leased interests in Palo Verde. The other participants are Salt River Project (17.49%), SCE (15.8%), El Paso (15.8%), Public Service Company of New Mexico (10.2%), Southern California Public Power Authority (5.91%), and Los Angeles Department of Water & Power (5.7%). The plant is operated by APS.
(c) The other participants are Salt River Project (10%), Public Service Company of New Mexico (13%), Tucson Electric Power Company (7%) and 4CA (7%). The plant is operated by APS.
(d) Cholla Unit 2's last day of service was on October 1, 2015.(e) The other participants are Salt River Project (42.9%), Nevada Power Company (11.3%), the United
States Government (24.3%) and Tucson Electric Power Company (7.5%). The plant is operated by Salt River Project. In July 2016, Salt River Project purchased Los Angeles Department of Water & Power's share in this plant (21.2%).
See “Business of Arizona Public Service Company — Environmental Matters” in Item 1 with respect to matters having a possible impact on the operation of certain of APS’s generating facilities.
See “Business of Arizona Public Service Company” in Item 1 for a map detailing the location of APS’s major power plants and principal transmission lines.
4CA
4CA, a wholly-owned subsidiary of Pinnacle West, purchased El Paso's 7% interest in Units 4 and 5 of Four Corners on July 6, 2016. See "Areas of Business Focus - Operational Performance, Reliability and Recent Developments - Four Corners - Asset Purchase Agreement and Coal Supply Matters" in Item 7 for additional information about 4CA's interest in Four Corners. Transmission and Distribution Facilities
Current Facilities. APS’s transmission facilities consist of approximately 6,137 pole miles of overhead lines and approximately 49 miles of underground lines, 5,914 miles of which are located in Arizona. APS’s distribution facilities consist of approximately 11,167 miles of overhead lines and approximately 21,524 miles of underground primary cable, all of which are located in Arizona. APS distribution facilities reflect an actual net gain of 419 miles in 2017. APS shares ownership of some of its transmission facilities with other companies.

43
The following table shows APS’s jointly-owned interests in those transmission facilities recorded on the Consolidated Balance Sheets at December 31, 2017:
Percent Owned(Weighted-Average)
Morgan — Pinnacle Peak System 64.6%Palo Verde — Rudd 500kV System 50.0%Round Valley System 50.0%ANPP 500kV System 34.0%Navajo Southern System 27.5%Four Corners Switchyards 63.2%Palo Verde — Yuma 500kV System 18.1%Phoenix — Mead System 17.1%Palo Verde — Morgan System 90.9%Hassayampa — North Gila System 80.0%Cholla 500kV Switchyard 85.7%Saguaro 500kV Switchyard 60.0%Kyrene - Knox System 50.0%
Expansion. Each year APS prepares and files with the ACC a ten-year transmission plan. In APS’s
2018 plan, APS projects it will develop 52 miles of new transmission lines over the next ten years. One significant project currently under development is a new 500kV path that will span from the Palo Verde hub around the western and northern edges of the Phoenix metropolitan area and terminate at a bulk substation in the northeast part of Phoenix. The Palo Verde to Morgan System includes Palo Verde-Delaney-Sun Valley-Morgan-Pinnacle Peak. The project consists of four phases. The first three phases, Morgan to Pinnacle Peak 500kV, Palo Verde to Delaney 500kV, and Delaney to Sun Valley 500kV are currently in-service. The fourth phase, Morgan to Sun Valley 500kV, has started construction and is expected to be energized by May 2018. In total, the projects consist of over 100 miles of new 500kV lines, with many of those miles constructed with the capability to string a 230kV line as a second circuit.
APS continues to work with regulators to identify transmission projects necessary to support renewable energy facilities. Two such projects, which have been completed and were included in previous APS transmission plans, are the Delaney to Palo Verde line and the North Gila to Hassayampa line, both of which support the transmission of renewable energy to Phoenix and California. The North Gila to Hassayampa line went into service in May 2015 and the Delaney to Palo Verde line went into service in May 2016.
Physical Security Standards. On July 14, 2015, FERC approved version 2 of the proposed Physical Security Reliability Standard CIP-014. It became effective on October 2, 2015 and requires transmission owners and operators to protect those critical transmission stations and substations and their associated primary control centers that, if rendered inoperable or damaged as a result of a physical attack, could result in widespread instability, uncontrolled separation or cascading within an interconnection. As required by the Physical Security Reliability Standard, APS determined its critical transmission stations and substations and associated primary control centers that were required to comply with the standard timely, which triggered additional requirements and obligations within the Physical Security Reliability Standard. These remaining obligations, which consist of a risk evaluation and development and verification of a physical security plan, were largely completed in 2016 with remaining activities projected to be complete in the first quarter of 2018. At this time, significant financial or operational impacts on APS are not anticipated.
NERC Critical Infrastructure Protection Reliability Standards. In 2014, APS initiated a comprehensive project to ensure compliance with Version 5 of NERC's Critical Infrastructure Protection

44
Reliability Standards ("CIP V.5"), which will become effective pursuant to various implementation dates through 2018. APS completed a significant portion of its compliance implementation activities to meet an initial compliance date of July 1, 2016; however, APS will be incurring incremental capital expenditures through 2018 to meet further upcoming compliance deadlines associated with CIP V.5. Total expenditures are estimated to be approximately $52 million, the majority of which has been incurred by the Company as of December 31, 2017.
Plant and Transmission Line Leases and Rights-of-Way on Indian Lands
The Navajo Plant and Four Corners are located on land held under leases from the Navajo Nation and also under rights-of-way from the federal government. The co-owners of the Navajo Plant and the Navajo Nation agreed that the Navajo Plant will remain in operation until December 2019 under the existing plant lease. The co-owners and the Navajo Nation executed a lease extension on November 29, 2017 that will allow for decommissioning activities to begin after the plant ceases operations in December 2019. APS, on behalf of the Four Corners participants, negotiated amendments to the Four Corners facility lease with the Navajo Nation, which extends the Four Corners leasehold interest from 2016 to 2041. See "Areas of Business Focus - Operational Performance, Reliability and Recent Developments - Four Corners - Lease Extension" in Item 7 for additional information about the Four Corners right-of-way and lease matters.
Certain portions of our transmission lines are located on Indian lands pursuant to rights-of-way that are effective for specified periods. Some of these rights-of-way have expired and our renewal applications have not yet been acted upon by the appropriate Indian tribes or federal agencies. Other rights expire at various times in the future and renewal action by the applicable tribe or federal agencies will be required at that time. In recent negotiations, certain of the affected Indian tribes have required payments substantially in excess of amounts that we have paid in the past for such rights-of-way. The ultimate cost of renewal of certain of the rights-of-way for our transmission lines is therefore uncertain.
ITEM 3. LEGAL PROCEEDINGS
See “Business of Arizona Public Service Company — Environmental Matters” in Item 1 with regard to pending or threatened litigation and other disputes.
See Note 3 for ACC and FERC-related matters.
See Note 10 for information regarding environmental matters and Superfund–related matters.
ITEM 4. MINE SAFETY DISCLOSURES
Not applicable.

45
EXECUTIVE OFFICERS OF PINNACLE WEST
Pinnacle West’s executive officers are elected no less often than annually and may be removed by the Board of Directors at any time. The executive officers, their ages at February 23, 2018, current positions and principal occupations for the past five years are as follows:
Name Age Position Period
Donald E. Brandt 63 Chairman of the Board and Chief Executive Officer of Pinnacle West;Chairman of the Board of APS
2009-Present
President of APS 2013-Present President of Pinnacle West 2008-Present Chief Executive Officer of APS 2008-PresentRobert S. Bement 62 Executive Vice President and Chief Nuclear Officer, PVGS, of APS 2016-Present
Senior Vice President, Site Operations, PVGS, of APS 2011-2016Denise R. Danner 62 Vice President, Controller and Chief Accounting Officer of Pinnacle
West; Chief Accounting Officer of APS2010-Present
Vice President and Controller of APS 2009-PresentDonna M. Easterly 53 Vice President, Human Resources and Ethics of APS 2017-Present
Vice President, Chief Procurement Officer of APS 2014-2017Director, Transmission and Distribution Construction of APS 2013-2014Director, Statewide Energy Delivery of APS 2010-2013
David P. Falck (a) 64 Executive Vice President, Law of Pinnacle West 2017-Present
Executive Vice President and General Counsel of Pinnacle West and APS 2009-2017Daniel T. Froetscher 56 Executive Vice President, Operations of APS 2018-Present
Senior Vice President, Transmission, Distribution & Customers of APS 2014-2018 Vice President, Energy Delivery of APS 2008-2014Jeffrey B. Guldner 52 Executive Vice President, Public Policy and General Counsel of Pinnacle
West and APS 2017-Present
Senior Vice President, Public Policy of APS 2014-2017
Senior Vice President, Customers and Regulation of APS 2012-2014James R. Hatfield 60 Executive Vice President of Pinnacle West and APS 2012-Present Chief Financial Officer of Pinnacle West and APS 2008-PresentJohn S. Hatfield 52 Vice President, Communications of APS 2010-PresentBarbara D. Lockwood 51 Vice President, Regulation of APS 2015-Present
General Manager, Regulatory Policy and Compliance of APS 2014-2015General Manager, Innovation of APS 2012-2014
Lee R. Nickloy 51 Vice President and Treasurer of Pinnacle West and APS 2010-PresentMark A. Schiavoni (b) 62 Executive Vice President of APS 2018-Present
Executive Vice President and Chief Operating Officer of APS 2014-2018Executive Vice President, Operations of APS 2012-2014
(a) David P. Falck is retiring from PNW on April 2, 2018.(b) Mark A. Schiavoni is retiring from APS on August 20, 2018.

46
PART II
ITEM 5. MARKET FOR REGISTRANTS’ COMMON EQUITY, RELATED STOCKHOLDER MATTERS AND ISSUER PURCHASES OF EQUITY SECURITIES
Pinnacle West’s common stock is publicly held and is traded on the New York Stock Exchange. At the
close of business on February 16, 2018, Pinnacle West’s common stock was held of record by approximately 18,684 shareholders. QUARTERLY STOCK PRICES AND DIVIDENDS PAID PER SHARESTOCK SYMBOL: PNW
Dividends
2017 High Low Close Per Share
1st Quarter $ 84.72 $ 75.79 $ 83.38 $ 0.6552nd Quarter 89.56 82.62 85.16 0.6553rd Quarter 90.92 83.95 84.56 0.6554th Quarter 92.48 84.14 85.18 0.695
Dividends
2016 High Low Close Per Share
1st Quarter $ 75.15 $ 62.51 $ 75.07 $ 0.6252nd Quarter 81.08 70.11 81.06 0.6253rd Quarter 82.78 73.94 75.99 0.6254th Quarter 78.97 70.86 78.03 0.655
APS’s common stock is wholly-owned by Pinnacle West and is not listed for trading on any stock
exchange. As a result, there is no established public trading market for APS’s common stock.
The chart below sets forth the dividends paid on APS’s common stock for each of the four quarters for 2017 and 2016.
Common Stock Dividends(Dollars in Thousands)
Quarter 2017 2016
1st Quarter $ 72,900 $ 69,4002nd Quarter 73,100 69,5003rd Quarter 73,100 69,5004th Quarter 77,700 72,900
The sole holder of APS’s common stock, Pinnacle West, is entitled to dividends when and as declared
out of legally available funds. As of December 31, 2017, APS did not have any outstanding preferred stock.

47
ITEM 6. SELECTED FINANCIAL DATA
PINNACLE WEST CAPITAL CORPORATION – CONSOLIDATED
The selected data presented below as of and for the years ended December 31, 2017, 2016, 2015, 2014 and 2013 are derived from the Consolidated Financial Statements. The data should be read in connection with the Consolidated Financial Statements including the related notes included in Item 8 of this Form 10-K.
2017 2016 2015 2014 2013
(dollars in thousands, except per share amounts)
OPERATING RESULTS
Operating revenues $ 3,565,296 $ 3,498,682 $ 3,495,443 $ 3,491,632 $ 3,454,628Net income 507,949 461,527 456,190 423,696 439,966Less: Net income attributable tononcontrolling interests 19,493 19,493 18,933 26,101 33,892Net income attributable to commonshareholders $ 488,456 $ 442,034 $ 437,257 $ 397,595 $ 406,074COMMON STOCK DATA
Book value per share – year-end $ 44.80 $ 43.14 $ 41.30 $ 39.50 $ 38.07Earnings per weighted-averagecommon share outstanding:
Net income attributable to commonshareholders – basic $ 4.37 $ 3.97 $ 3.94 $ 3.59 $ 3.69Net income attributable to commonshareholders – diluted $ 4.35 $ 3.95 $ 3.92 $ 3.58 $ 3.66
Dividends declared per share $ 2.70 $ 2.56 $ 2.44 $ 2.33 $ 2.23Weighted-average common sharesoutstanding – basic 111,838,922 111,408,729 111,025,944 110,626,101 109,984,160Weighted-average common sharesoutstanding – diluted 112,366,675 112,046,043 111,552,130 111,178,141 110,805,943BALANCE SHEET DATA
Total assets $ 17,019,082 $ 16,004,253 $ 15,028,258 $ 14,288,890 $ 13,486,826Liabilities and equity:
Current liabilities $ 1,197,852 $ 1,292,946 $ 1,442,317 $ 1,559,143 $ 1,618,644Long-term debt less currentmaturities 4,789,713 4,021,785 3,462,391 3,006,573 2,774,605Deferred credits and other 5,895,787 5,753,610 5,404,093 5,204,072 4,753,117Total liabilities 11,883,352 11,068,341 10,308,801 9,769,788 9,146,366Total equity 5,135,730 4,935,912 4,719,457 4,519,102 4,340,460
Total liabilities and equity $ 17,019,082 $ 16,004,253 $ 15,028,258 $ 14,288,890 $ 13,486,826

48
SELECTED FINANCIAL DATA
ARIZONA PUBLIC SERVICE COMPANY – CONSOLIDATED
2017 2016 2015 2014 2013
(dollars in thousands)
OPERATING RESULTS
Electric operating revenues $ 3,554,139 $ 3,489,754 $ 3,492,357 $ 3,488,946 $ 3,451,251Fuel and purchased power costs 992,744 1,082,625 1,101,298 1,179,829 1,095,709Other operating expenses 1,881,826 1,789,149 1,779,075 1,716,325 1,733,677
Operating income 679,569 617,980 611,984 592,792 621,865Other income 36,284 46,744 33,332 36,358 20,797Interest expense — net of allowancefor borrowed funds 192,051 183,090 176,109 181,830 183,801Net income 523,802 481,634 469,207 447,320 458,861Less: Net income attributable tononcontrolling interests 19,493 19,493 18,933 26,101 33,892Net income attributable to commonshareholder $ 504,309 $ 462,141 $ 450,274 $ 421,219 $ 424,969BALANCE SHEET DATA
Total assets $ 16,893,751 $ 15,931,175 $ 14,982,182 $ 14,190,362 $ 13,359,517Liabilities and equity:
Total equity $ 5,385,869 $ 5,037,970 $ 4,814,794 $ 4,629,852 $ 4,454,874Long-term debt less currentmaturities 4,491,292 4,021,785 3,337,391 2,881,573 2,649,604
Total capitalization 9,877,161 9,059,755 8,152,185 7,511,425 7,104,478Current liabilities 1,098,274 1,094,037 1,424,708 1,532,464 1,580,847Deferred credits and other 5,918,316 5,777,383 5,405,289 5,146,473 4,674,192
Total liabilities and equity $ 16,893,751 $ 15,931,175 $ 14,982,182 $ 14,190,362 $ 13,359,517

49
ITEM 7. MANAGEMENT’S DISCUSSION AND ANALYSIS OF FINANCIAL CONDITION AND RESULTS OF OPERATIONS
INTRODUCTION
The following discussion should be read in conjunction with Pinnacle West’s Consolidated Financial Statements and APS’s Consolidated Financial Statements and the related Notes that appear in Item 8 of this report. For information on factors that may cause our actual future results to differ from those we currently seek or anticipate, see “Forward-Looking Statements” at the front of this report and “Risk Factors” in Item 1A.
OVERVIEW
Pinnacle West owns all of the outstanding common stock of APS. APS is a vertically-integrated electric utility that provides either retail or wholesale electric service to most of the state of Arizona, with the major exceptions of about one-half of the Phoenix metropolitan area, the Tucson metropolitan area and Mohave County in northwestern Arizona. APS currently accounts for essentially all of our revenues and earnings.
Areas of Business Focus
Operational Performance, Reliability and Recent Developments. Nuclear. APS operates and is a joint owner of Palo Verde. Palo Verde experienced strong performance
throughout 2017. The April and October scheduled refueling outages were each completed in 30 days. During the peak summer demand season, its capacity factor was 98.9%, and the total year capacity factor was 93.8%. For additional information, see “Business of Arizona Public Service Company - Energy Sources and Resource Planning - Generation Facilities - Nuclear.”
Coal and Related Environmental Matters and Transactions. APS is a joint owner of three coal-fired power plants and acts as operating agent for two of the plants. APS is focused on the impacts on its coal fleet that may result from increased regulation and potential legislation concerning GHG emissions. On August 3, 2015, EPA finalized a rule to limit carbon dioxide emissions from existing power plants (the "Clean Power Plan"). On October 10, 2017, EPA issued a proposal to repeal the Clean Power Plan. On December 18, 2017, EPA issued an Advanced Notice of Proposed Rulemaking through which EPA is soliciting comments as to potential replacements for the Clean Power Plan that would be consistent with EPA's current legal interpretation of the Clean Air Act. APS will monitor these proceedings to assess whether or how any future proposed regulations of carbon emissions from existing EGUs would affect APS. See "Business - Environmental Matters - Climate Change - Regulatory Initiatives" for additional information on the current status of EPA's carbon pollution standards for EGUs. APS continually analyzes its long-range capital management plans to assess the potential effects of these changes, understanding that any resulting regulation and legislation could impact the economic viability of certain plants, as well as the willingness or ability of power plant participants to continue participation in such plants.

50
Cholla
On September 11, 2014, APS announced that it would close its 260 MW Unit 2 at Cholla and cease burning coal at the other APS-owned units (Units 1 and 3) at the plant by the mid-2020s, if EPA approves a compromise proposal offered by APS to meet required environmental and emissions standards and rules. On April 14, 2015, the ACC approved APS's plan to retire Unit 2, without expressing any view on the future recoverability of APS's remaining investment in the Unit, which was later addressed in the 2017 Settlement Agreement. (See Note 3 for details related to the resulting cost recovery.) APS believes that the environmental benefits of this proposal are greater in the long-term than the benefits that would have resulted from adding emissions control equipment. APS closed Unit 2 on October 1, 2015. In early 2017, EPA approved a final rule incorporating APS's compromise proposal, which took effect for Cholla on April 26, 2017. For additional information, see "Business of Arizona Public Service Company - Energy Sources and Resource Planning - Coal-Fueled Generating Facilities - Cholla."
Four Corners Asset Purchase Agreement and Coal Supply Matters. On December 30, 2013, APS purchased SCE’s
48% interest in each of Units 4 and 5 of Four Corners. The final purchase price for the interest was approximately $182 million. In connection with APS’s prior general retail rate case with the ACC, the ACC reserved the right to review the prudence of the Four Corners transaction for cost recovery purposes upon the closing of the transaction. On December 23, 2014, the ACC approved rate adjustments related to APS’s acquisition of SCE’s interest in Four Corners resulting in a revenue increase of $57.1 million on an annual basis. This decision was appealed and, on September 26, 2017, the Court of Appeals affirmed the ACC's decision on the Four Corners rate adjustment.
Concurrently with the closing of the SCE transaction described above, BHP Billiton, the parent company of BNCC, the coal supplier and operator of the mine that served Four Corners, transferred its ownership of BNCC to NTEC, a company formed by the Navajo Nation to own the mine and develop other energy projects. Also occurring concurrently with the closing, the Four Corners’ co-owners executed the 2016 Coal Supply Agreement for the supply of coal to Four Corners from July 2016 through 2031. El Paso, a 7% owner in Units 4 and 5 of Four Corners, did not sign the 2016 Coal Supply Agreement. Under the 2016 Coal Supply Agreement, APS agreed to assume the 7% shortfall obligation. (See Note 10 for a discussion of a pending arbitration related to the 2016 Coal Supply Agreement.) On February 17, 2015, APS and El Paso entered into an asset purchase agreement providing for the purchase by APS, or an affiliate of APS, of El Paso’s 7% interest in each of Units 4 and 5 of Four Corners. 4CA purchased the El Paso interest on July 6, 2016. The purchase price was immaterial in amount, and 4CA assumed El Paso's reclamation and decommissioning obligations associated with the 7% interest.
NTEC had the option to purchase the 7% interest within a certain timeframe pursuant to an option granted to NTEC. On December 29, 2015, NTEC provided notice of its intent to exercise the option. The purchase did not occur during the originally contemplated timeframe. The parties are currently in discussions as to the future of the option transaction.
The 2016 Coal Supply Agreement contains alternate pricing terms for the 7% shortfall obligations in the event NTEC does not purchase the interest. At this time, since NTEC has not yet purchased the 7% interest, the alternate pricing provisions are applicable to 4CA as the holder of the 7% interest. These terms include a formula under which NTEC must make certain payments to 4CA for reimbursement of operations and maintenance costs and a specified rate of return, offset by revenue generated by 4CA’s power sales. Such payments are due to 4CA at the end of each calendar year. A $10 million payment was due to 4CA at December 31, 2017, which NTEC satisfied by directing to 4CA a prepayment from APS of a portion of a future mine reclamation obligation. The balance of the amount under this formula at December 31, 2017 is

51
approximately $20 million, which is due to 4CA at December 31, 2018. In future years there may be similar payments due from NTEC to 4CA under this formula. 4CA believes NTEC should continue to satisfy its contractual obligations related to these payments; however, if NTEC fails to meet its contractual obligations when due, 4CA will consider appropriate measures and potential impacts to the Company's financial statements.
Lease Extension. APS, on behalf of the Four Corners participants, negotiated amendments to an existing facility lease with the Navajo Nation, which extends the Four Corners leasehold interest from 2016 to 2041. The Navajo Nation approved these amendments in March 2011. The effectiveness of the amendments also required the approval of the DOI, as did a related federal rights-of-way grant. A federal environmental review was undertaken as part of the DOI review process, and culminated in the issuance by DOI of a record of decision on July 17, 2015 justifying the agency action extending the life of the plant and the adjacent mine.
On April 20, 2016, several environmental groups filed a lawsuit against OSM and other federal agencies in the District of Arizona in connection with their issuance of the approvals that extended the life of Four Corners and the adjacent mine. The lawsuit alleges that these federal agencies violated both the ESA and NEPA in providing the federal approvals necessary to extend operations at the Four Corners Power Plant and the adjacent Navajo Mine past July 6, 2016. APS filed a motion to intervene in the proceedings, which was granted on August 3, 2016.
On September 15, 2016, NTEC, the company that owns the adjacent mine, filed a motion to intervene for the purpose of dismissing the lawsuit based on NTEC's tribal sovereign immunity. On September 11, 2017, the Arizona District Court issued an order granting NTEC's motion, dismissing the litigation with prejudice, and terminating the proceedings. On November 9, 2017, the environmental group plaintiffs appealed the district court order dismissing their lawsuit. We cannot predict whether this appeal will be successful and, if it is successful, the outcome of further district court proceedings. For additional information, see "Business of Arizona Public Service Company - Energy Sources and Resource Planning - Generation Facilities - Coal-Fueled Generating Facilities - Four Corners."
Navajo Plant
The co-owners of the Navajo Plant and the Navajo Nation agreed that the Navajo Plant will remain in operation until December 2019 under the existing plant lease. The co-owners and the Navajo Nation executed a lease extension on November 29, 2017 that will allow for decommissioning activities to begin after the plant ceases operations in December 2019. Various stakeholders including regulators, tribal representatives, the plant's coal supplier and DOI have been meeting to determine if an alternate solution can be reached that would permit continued operation of the plant beyond 2019. Although we cannot predict whether any alternate plans will be found that would be acceptable to all of the stakeholders and feasible to implement, we believe it is probable that the Navajo Plant will cease operations in December 2019.
APS is currently recovering depreciation and a return on the net book value of its interest in the Navajo Plant over its previously estimated life through 2026. APS will seek continued recovery in rates for the book value of its remaining investment in the plant (see Note 3 for details related to the resulting regulatory asset) plus a return on the net book value as well as other costs related to retirement and closure, which are still being assessed and may be material. On February 14, 2017, the ACC opened a docket titled "ACC Investigation Concerning the Future of the Navajo Generating Station" with the stated goal of engaging stakeholders and negotiating a sustainable

52
pathway for the Navajo Plant to continue operating in some form after December 2019. APS cannot predict the outcome of this proceeding.
For additional information, see "Business of Arizona Public Service Company - Energy Sources and Resource Planning - Generation Facilities - Coal-Fueled Generating Facilities - Navajo Plant."
Natural Gas. APS has six natural gas power plants located throughout Arizona, including Ocotillo. Ocotillo is a 330 MW 4-unit gas plant located in the metropolitan Phoenix area. In early 2014, APS announced a project to modernize the plant, which involves retiring two older 110 MW steam units, adding five 102 MW combustion turbines and maintaining two existing 55 MW combustion turbines. In total, this increases the capacity of the site by 290 MW, to 620 MW, with completion targeted by summer 2019. (See Note 3 for details of the rate recovery in our 2017 Rate Case Decision.) For additional information, see "Business of Arizona Public Service Company - Energy Sources and Resource Planning - Generation Facilities - Coal-Fueled Generating Facilities - Natural Gas and Oil-Fueled Generating Facilities."
Transmission and Delivery. APS is working closely with regulators to identify and plan for transmission needs that continue to support system reliability, access to markets and renewable energy development. The capital expenditures table presented in the "Liquidity and Capital Resources" section below includes new APS transmission projects, along with other transmission costs for upgrades and replacements. APS is also working to establish and expand advanced grid technologies throughout its service territory to provide long-term benefits both to APS and its customers. APS is strategically deploying a variety of technologies that are intended to allow customers to better manage their energy usage, minimize system outage durations and frequency, enable customer choice for new customer sited technologies, and facilitate greater cost savings to APS through improved reliability and the automation of certain distribution functions.
Energy Imbalance Market. In 2015, APS and the CAISO, the operator for the majority of California's transmission grid, signed an agreement for APS to begin participation in EIM. APS's participation in the EIM began on October 1, 2016. The EIM allows for rebalancing supply and demand in 15-minute blocks with dispatching every five minutes before the energy is needed, instead of the traditional one hour blocks. APS expects that its participation in EIM will lower its fuel costs, improve visibility and situational awareness for system operations in the Western Interconnection power grid, and improve integration of APS’s renewable resources.
Regulatory Matters
Rate Matters. APS needs timely recovery through rates of its capital and operating expenditures to maintain its financial health. APS’s retail rates are regulated by the ACC and its wholesale electric rates (primarily for transmission) are regulated by FERC. See Note 3 for information on APS’s FERC rates.
On June 1, 2016, APS filed an application with the ACC for an annual increase in retail base rates of $165.9 million. This amount excluded amounts that were then collected on customer bills through adjustor mechanisms. The application requested that some of the balances in these adjustor accounts (aggregating to approximately $267.6 million as of December 31, 2015) be transferred into base rates through the ratemaking process. This transfer would not have had an incremental effect on average customer bills. The average annual customer bill impact of APS’s request was an increase of 5.74% (the average annual bill impact for a typical APS residential customer was 7.96%). See Note 3 for details regarding the principal provisions of APS's application.
On March 27, 2017, a majority of the stakeholders in the general retail rate case, including the ACC Staff, the Residential Utility Consumer Office, limited income advocates and private rooftop solar

53
organizations signed the 2017 Settlement Agreement and filed it with the ACC. The average annual customer bill impact under the 2017 Settlement Agreement is an increase of 3.28% (the average annual bill impact for a typical APS residential customer is 4.54%). (See Note 3 for details of the 2017 Settlement Agreement.)
On August 15, 2017, the ACC approved (by a vote of 4-1), the 2017 Settlement Agreement without material modifications. On August 18, 2017, the ACC issued a final written Opinion and Order reflecting its decision in APS’s general retail rate case (the "2017 Rate Case Decision"), which is subject to requests for rehearing and potential appeal. The new rates went into effect on August 19, 2017. On August 20, 2017, Commissioner Burns filed a special action petition in the Arizona Supreme Court seeking to vacate the ACC's order approving the 2017 Settlement Agreement so that alleged issues of disqualification and bias on the part of the other Commissioners can be fully investigated. APS opposed the petition, and on October 17, 2017, the Arizona Supreme Court declined to accept jurisdiction over Commissioner Burns’ special action petition.
On October 17, 2017, Warren Woodward (an intervener in APS's general retail rate case) filed a Notice of Appeal in the Arizona Court of Appeals, Division One. The notice raises a single issue related to the application of certain rate schedules to new APS residential customers after May 1, 2018. Mr. Woodward filed a second notice of appeal on November 13, 2017 challenging APS’s $5 per month automated metering infrastructure opt-out program. Mr. Woodward’s two appeals have been consolidated and APS has filed a motion to intervene. APS cannot predict the outcome of this consolidated appeal but does not believe it will have a material impact.
On January 3, 2018, an APS customer filed a petition with the ACC that was determined by the ACC Staff to be a complaint filed pursuant to Arizona Revised Statute §40-246 (the “Complaint”) and not a request for rehearing. Arizona Revised Statute §40-246 requires the ACC to hold a hearing regarding any complaint alleging that a public service corporation is in violation of any commission order or that the rates being charged are not just and reasonable if the complaint is signed by at least twenty-five customers of the public service corporation. The Complaint alleged that APS is “in violation of commission order” [sic]. On February 13, 2018, the complainant filed an amended Complaint alleging that the rates and charges in the 2017 Rate Case Decision are not just and reasonable. The complainant is requesting that the ACC hold a hearing on her amended Complaint to determine if the average bill impact on residential customers of the rates and charges approved in the 2017 Rate Case Decision is greater than 4.54% (the average annual bill impact for a typical APS residential customer estimated by APS), and if so, what effect the alleged greater bill impact has on APS's revenues and the overall reasonableness and justness of APS's rates and charges, in order to determine if there is sufficient evidence to warrant a full-scale rate hearing. APS cannot predict the outcome of this matter.
APS has several recovery mechanisms in place that provide more timely recovery to APS of its fuel and transmission costs, and costs associated with the promotion and implementation of its demand side management and renewable energy efforts and customer programs. These mechanisms are described more fully below and in Note 3.
SCR Cost Recovery. On December 29, 2017, in accordance with the 2017 Rate Case Decision, APS filed a Notice of Intent to file its SCR Rate Rider to permit recovery of costs associated with the installation of SCR equipment at Four Corners Units 4 and 5. APS intends to file the SCR Rate Rider in April 2018. Consistent with the 2017 Rate Case Decision, the rate rider filing will be narrow in scope and will address only costs associated with this specific environmental compliance equipment. Also, as provided for in the 2017 Rate Case Decision, APS will request that the rate rider become effective no later than January 1, 2019.
Renewable Energy. The ACC approved the RES in 2006. The renewable energy requirement is 8% of retail electric sales in 2018 and increases annually until it reaches 15% in 2025. In APS’s 2009 general retail rate case settlement agreement, APS agreed to exceed the RES standards, committing to use APS’s best efforts

54
to have 1,700 GWh of new renewable resources in service by year-end 2015, in addition to its RES renewable resource commitments. APS met its settlement commitment and overall RES target for 2017. A component of the RES targets development of distributed energy systems. For additional information, see “Business of Arizona Public Service Company-Energy Sources and Resource Planning - Current and Future Resources-Renewable Energy Standard.”
On July 1, 2016, APS filed its 2017 RES Implementation Plan and proposed a budget of approximately $150 million. APS’s budget request included additional funding to process the high volume of residential rooftop solar interconnection requests and also requested a permanent waiver of the residential distributed energy requirement for 2017 contained in the RES rules. On April 7, 2017, APS filed an amended 2017 RES Implementation Plan and updated budget request which included the revenue neutral transfer of specific revenue requirements into base rates in accordance with the 2017 Settlement Agreement. On August 15, 2017, the ACC approved the 2017 RES Implementation Plan.
On June 30, 2017, APS filed its 2018 RES Implementation Plan and proposed a budget of approximately $90 million. APS’s budget request supports existing approved projects and commitments and includes the anticipated transfer of specific revenue requirements into base rates in accordance with the 2017 Settlement Agreement and also requests a permanent waiver of the residential distributed energy requirement for 2018 contained in the RES rules. APS's 2018 RES budget request is lower than the 2017 RES budget due in part to a certain portion of the RES being collected by APS in base rates rather than through the RES adjustor.
On November 20, 2017, APS filed an updated 2018 RES budget to include budget adjustments for APS Solar Communities (formerly known as AZ Sun II), which was approved as part of the 2017 Rate Case Decision. APS Solar Communities is a three-year program requiring APS to spend $10-15 million in capital costs each year to install utility-owned distributed generation ("DG") systems for low to moderate income residential homes, buildings of non-profit entities, Title I schools and rural government facilities. The 2017 Rate Case Decision provided that all operations and maintenance expenses, property taxes, marketing and advertising expenses, and the capital carrying costs for this program will be recovered through the RES. The ACC has not yet ruled on APS's 2018 RES Implementation Plan.
In September 2016, the ACC initiated a proceeding which will examine the possible modernization and expansion of the RES. The ACC noted that many of the provisions of the original rule may no longer be appropriate, and the underlying economic assumptions associated with the rule have changed dramatically. The proceeding will review such issues as the rapidly declining cost of solar generation, an increased interest in community solar projects, energy storage options, and the decline in fossil fuel generation due to stringent EPA regulations. The proceeding will also examine the feasibility of increasing the standard to 30% of retail sales by 2030, in contrast to the current standard of 15% of retail sales by 2025. On January 30, 2018, ACC Commissioner Tobin proposed a new standard in this proceeding which would broaden the RES to include a series of energy reform policies tied to clean energy sources. The proposal would rename the RES to the Clean Resource Energy Standard and Tariff ("CREST"). APS cannot predict the outcome of this proceeding. See Note 3 for more information on the RES and the CREST.
Demand Side Management. In December 2009, Arizona regulators placed an increased focus on energy efficiency and other demand side management programs to encourage customers to conserve energy, while incentivizing utilities to aid in these efforts that ultimately reduce the demand for energy. The ACC initiated an Energy Efficiency rulemaking, with a proposed Electric Energy Efficiency Standard of 22% cumulative annual energy savings by 2020. The 22% figure represents the cumulative reduction in future energy usage through 2020 attributable to energy efficiency initiatives. This standard became effective on January 1, 2011.

55
On June 1, 2016, APS filed its 2017 DSM Implementation Plan, in which APS proposed programs and measures that specifically focus on reducing peak demand, shifting load to off-peak periods and educating customers about strategies to manage their energy and demand. The requested budget in the 2017 DSM Implementation Plan is $62.6 million. On January 27, 2017, APS filed an updated and modified 2017 DSM Implementation Plan that incorporated the proposed $4 million Residential Demand Response, Energy Storage and Load Management Program that was filed with the ACC on December 5, 2016 and requested that the budget for the 2017 DSM Implementation Plan be increased to $66.6 million. On August 15, 2017, the ACC approved the amended 2017 DSM Implementation Plan.
On September 1, 2017, APS filed its 2018 DSM Implementation Plan, which proposes modifications to the demand side management portfolio to better meet system and customer needs by focusing on peak demand reductions, storage, load shifting and demand response programs in addition to traditional energy savings measures. The 2018 DSM Implementation Plan seeks a reduced requested budget of $52.6 million and requests a waiver of the Electric Energy Efficiency Standard for 2018. On November 14, 2017, APS filed an amended 2018 DSM Implementation Plan, which revised the allocations between budget items to address customer participation levels, but kept the overall budget at $52.6 million. See Note 3 for more information on demand side management.
Tax Expense Adjustor Mechanism and FERC Tax Filing. As part of the 2017 Settlement Agreement, the parties agreed to a rate adjustment mechanism to address potential federal income tax reform and enable the pass-through of certain income tax effects to customers. On December 22, 2017 the Tax Cuts and Jobs Act (“Tax Act”) was enacted. This legislation made significant changes to the federal income tax laws including a reduction in the corporate tax rate from 35% to 21% effective January 1, 2018. On January 8, 2018, APS filed an application with the ACC requesting that the TEAM be implemented in two steps. The first addresses the change in the marginal federal tax rate from 35% to 21% resulting from the Tax Act and, if approved, would reduce rates by $119.1 million annually through an equal cents per kWh credit. APS asked that this decrease become effective February 1, 2018. On February 22, 2018, the ACC approved the reduction of rates by $119.1 million annually through an equal cents per kWh credit applied to all but a small subset of customers who are taking service under specially-approved tariffs. The rate reduction will be effective March 1, 2018.
The second step will address the amortization of excess deferred taxes previously collected from customers. APS is analyzing the final impact of the Tax Act provisions related to deferred taxes and intends to make a second TEAM filing later in 2018.
The TEAM expressly applies to APS's retail rates with the exception noted above. The Company expects to make a filing with FERC in the first quarter of 2018 seeking authorization to provide for the cost reductions resulting from the income tax changes in its wholesale transmission rates.
See Note 3 for additional details.
Net Metering. In 2015, the ACC voted to conduct a generic evidentiary hearing on the value and cost of DG to gather information that will inform the ACC on net metering issues and cost of service studies in upcoming utility rate cases. A hearing was held in April 2016. On October 7, 2016, an Administrative Law Judge issued a recommendation in the docket concerning the value and cost of DG solar installations. On December 20, 2016, the ACC completed its open meeting to consider the recommended opinion and order by the Administrative Law Judge. After making several amendments, the ACC approved the recommended opinion and order by a 4-1 vote. As a result of the ACC’s action, effective as of APS’s 2017 Rate Case Decision, the current net metering tariff that governs payments for energy exported to the grid from rooftop

56
solar systems was replaced by a more formula-driven approach that utilizes inputs from historical wholesale solar power costs and eventually an avoided cost methodology.
As amended, the decision provides that payments by utilities for energy exported to the grid from DG solar facilities will be determined using a resource comparison proxy methodology, a method that is based on the price that APS pays for utility-scale solar projects on a five year rolling average, while a forecasted avoided cost methodology is being developed. The price established by this resource comparison proxy method will be updated annually (between general retail rate cases) but will not be decreased by more than 10% per year. Once the avoided cost methodology is developed, the ACC will determine in APS's subsequent general retail rate cases which method (or a combination of methods) is appropriate to determine the actual price to be paid by APS for exported distributed energy.
In addition, the ACC made the following determinations:
• Customers who have interconnected a DG system or submitted an application for interconnection for DG systems prior to August 19, 2017, the date new rates were effective based on APS's 2017 Rate Case Decision, will be grandfathered for a period of 20 years from the date the customer’s interconnection application was accepted by the utility;
• Customers with DG solar systems are to be considered a separate class of customers for ratemaking purposes; and
• Once an export price is set for APS, no netting or banking of retail credits will be available for new DG customers, and the then-applicable export price will be guaranteed for new customers for a period of 10 years.
This decision of the ACC addresses policy determinations only. The decision states that its principles will be applied in future general retail rate cases, and the policy determinations themselves may be subject to future change, as are all ACC policies. A first-year export energy price of 12.9 cents per kWh is included in the 2017 Settlement Agreement and became effective on August 19, 2017.
On January 23, 2017, The Alliance for Solar Choice ("TASC") sought rehearing of the ACC's decision regarding the value and cost of DG. TASC asserted that the ACC improperly ignored the Administrative Procedure Act, failed to give adequate notice regarding the scope of the proceedings, and relied on information that was not submitted as evidence, among other alleged defects. TASC filed a Notice of Appeal in the Court of Appeals and filed a Complaint and Statutory Appeal in the Maricopa County Superior Court on March 10, 2017. As part of the 2017 Settlement Agreement described above, TASC agreed to withdraw these appeals when the ACC decision implementing the 2017 Settlement Agreement is no longer subject to appellate review.
Subpoena from Arizona Corporation Commissioner Robert Burns. On August 25, 2016, Commissioner Burns, individually and not by action of the ACC as a whole, served subpoenas in APS’s then current retail rate proceeding on APS and Pinnacle West for the production of records and information relating to a range of expenditures from 2011 through 2016. The subpoenas requested information concerning marketing and advertising expenditures, charitable donations, lobbying expenses, contributions to 501(c)(3) and (c)(4) nonprofits and political contributions. The return date for the production of information was set as September 15, 2016. The subpoenas also sought testimony from Company personnel having knowledge of the material, including the Chief Executive Officer.
On September 9, 2016, APS filed with the ACC a motion to quash the subpoenas or, alternatively to stay APS's obligations to comply with the subpoenas and decline to decide APS's motion pending court proceedings. Contemporaneously with the filing of this motion, APS and Pinnacle West filed a complaint for special action and declaratory judgment in the Superior Court of Arizona for Maricopa County, seeking a
57
declaratory judgment that Commissioner Burns’ subpoenas are contrary to law. On September 15, 2016, APS produced all non-confidential and responsive documents and offered to produce any remaining responsive documents that are confidential after an appropriate confidentiality agreement is signed.
On February 7, 2017, Commissioner Burns opened a new ACC docket and indicated that its purpose is to study and rectify problems with transparency and disclosure regarding financial contributions from regulated monopolies or other stakeholders who may appear before the ACC that may directly or indirectly benefit an ACC Commissioner, a candidate for ACC Commissioner, or key ACC staff. As part of this docket, Commissioner Burns set March 24, 2017 as a deadline for the production of all information previously requested through the subpoenas. Neither APS nor Pinnacle West produced the information requested and instead objected to the subpoena. On March 10, 2017, Commissioner Burns filed suit against APS and Pinnacle West in the Superior Court of Arizona for Maricopa County in an effort to enforce his subpoenas. On March 30, 2017, APS filed a motion to dismiss Commissioner Burns' suit against APS and Pinnacle West. In response to the motion to dismiss, the court stayed the suit and ordered Commissioner Burns to file a motion to compel the production of the information sought by the subpoenas with the ACC. On June 20, 2017, the ACC denied the motion to compel. On August 4, 2017, Commissioner Burns amended his complaint to add all of the ACC Commissioners and the ACC itself as defendants. All defendants moved to dismiss the complaint. On February 15, 2018, the Superior Court dismissed Commissioner Burns’ complaint. The matter is subject to appeal. APS and Pinnacle West cannot predict the outcome of this matter.
In addition to the Superior Court proceedings discussed above, on August 20, 2017, Commissioner Burns filed a special action petition in the Arizona Supreme Court seeking to vacate the 2017 Rate Case Decision so that alleged issues of disqualification and bias on the part of the other Commissioners could be fully investigated. APS opposed the petition, and on October 17, 2017, the Arizona Supreme Court declined to accept jurisdiction over Commissioner Burns’ special action petition.
Renewable Energy Ballot Initiative. On February 20, 2018, a coalition of renewable energy advocates filed with the Arizona Secretary of State a ballot initiative for an Arizona constitutional amendment requiring Arizona public service corporations to procure 50% of their energy supply from renewable sources by 2030. For purposes of the proposed amendment, eligible renewable sources would not include nuclear generating facilities. The stated goal of the Clean Energy for a Healthy Arizona coalition is to complete the necessary steps to allow the initiative to be placed on the November 2018 Arizona elections ballot. The coalition must present over 225,000 verifiable signatures to the Secretary of State by July 5, 2018 to meet that goal. APS intends to oppose this effort. We believe the initiative is irresponsible and would result in negative impacts to Arizona utility customers, the Arizona economy and our company. We cannot predict the outcome of this matter.
Clean Resource Energy Standard and Tariff. On January 30, 2018, ACC Commissioner Tobin proposed the CREST, which consists of a series of energy reform policies tied to clean energy sources such as energy storage, biomass, energy efficiency, electric vehicles, and expanded energy planning through the Integrated Resource Plan process. The ACC has not yet initiated any formal proceedings with respect to Commissioner Tobin’s proposal; however, on February 22, 2018, the ACC Staff filed a Notice of Inquiry to further examine the matter. APS cannot predict the outcome of this matter.
FERC Matter. As part of APS’s acquisition of SCE’s interest in Four Corners Units 4 and 5, APS and SCE agreed, via a "Transmission Termination Agreement" that, upon closing of the acquisition, the companies would terminate an existing transmission agreement ("Transmission Agreement") between the parties that provides transmission capacity on a system (the "Arizona Transmission System") for SCE to transmit its portion of the output from Four Corners to California. APS previously submitted a request to FERC related to this termination, which resulted in a FERC order denying rate recovery of $40 million that APS agreed to pay SCE associated with the termination. On December 22, 2015, APS and SCE agreed to terminate the

58
Transmission Termination Agreement and allow for the Transmission Agreement to expire according to its terms, which includes settling obligations in accordance with the terms of the Transmission Agreement. APS established a regulatory asset of $12 million in 2015 in connection with the payment required under the terms of the Transmission Agreement. On July 1, 2016, FERC issued an order denying APS’s request to recover the regulatory asset through its FERC-jurisdictional rates. APS and SCE completed the termination of the Transmission Agreement on July 6, 2016. APS made the required payment to SCE and wrote-off the $12 million regulatory asset and charged operating revenues to reflect the effects of this order in the second quarter of 2016. On July 29, 2016, APS filed for a rehearing with FERC. In its order denying recovery, FERC also referred to its enforcement division a question of whether the agreement between APS and SCE relating to the settlement of obligations under the Transmission Agreement was a jurisdictional contract that should have been filed with FERC. On October 5, 2017, FERC issued an order denying APS's request for rehearing. FERC also upheld its prior determination that the agreement relating to the settlement was a jurisdictional contract and should have been filed with FERC. APS cannot predict whether or if the enforcement division will take any action. APS filed an appeal of FERC's July 1, 2016 and October 5, 2017 orders with the United States Court of Appeals for the Ninth Circuit on December 4, 2017. That proceeding is pending and APS cannot predict the outcome of the proceeding.
Financial Strength and Flexibility. Pinnacle West and APS currently have ample borrowing capacity under their respective credit facilities, and may readily access these facilities ensuring adequate liquidity for each company. Capital expenditures will be funded with internally generated cash and external financings, which may include issuances of long-term debt and Pinnacle West common stock.
Other Subsidiaries.
Bright Canyon Energy. On July 31, 2014, Pinnacle West announced its creation of a wholly-owned subsidiary, BCE. BCE's focus is on new growth opportunities that leverage the Company’s core expertise in the electric energy industry. BCE’s first initiative is a 50/50 joint venture with BHE U.S. Transmission LLC, a subsidiary of Berkshire Hathaway Energy Company. The joint venture, named TransCanyon, is pursuing independent transmission opportunities within the eleven states that comprise the Western Electricity Coordinating Council, excluding opportunities related to transmission service that would otherwise be provided under the tariffs of the retail service territories of the venture partners’ utility affiliates. TransCanyon continues to pursue transmission development opportunities in the western United States consistent with its strategy.
On March 29, 2016, TransCanyon entered into a strategic alliance agreement with PG&E to jointly pursue competitive transmission opportunities solicited by the CAISO, the operator for the majority of California's transmission grid. TransCanyon and PG&E intend to jointly engage in the development of future transmission infrastructure and compete to develop, build, own and operate transmission projects approved by the CAISO.
El Dorado. The operations of El Dorado are not expected to have any material impact on our financial results, or to require any material amounts of capital, over the next three years.
4CA. See "Four Corners - Asset Purchase Agreement and Coal Supply Matters" above for information regarding 4CA.

59
Key Financial Drivers
In addition to the continuing impact of the matters described above, many factors influence our financial results and our future financial outlook, including those listed below. We closely monitor these factors to plan for the Company’s current needs, and to adjust our expectations, financial budgets and forecasts appropriately.
Electric Operating Revenues. For the years 2015 through 2017, retail electric revenues comprised
approximately 95% of our total electric operating revenues. Our electric operating revenues are affected by customer growth or decline, variations in weather from period to period, customer mix, average usage per customer and the impacts of energy efficiency programs, distributed energy additions, electricity rates and tariffs, the recovery of PSA deferrals and the operation of other recovery mechanisms. These revenue transactions are affected by the availability of excess generation or other energy resources and wholesale market conditions, including competition, demand and prices.
Actual and Projected Customer and Sales Growth. Retail customers in APS’s service territory
increased 1.8% for the year ended December 31, 2017 compared with the prior year. For the three years 2015 through 2017, APS’s customer growth averaged 1.5% per year. We currently project annual customer growth to be 1.5 - 2.5% for 2018 and to average in the range of 2 - 3% for 2018 through 2020 based on our assessment of modestly improving economic conditions in Arizona.
Retail electricity sales in kWh, adjusted to exclude the effects of weather variations, decreased 0.3% for the year ended December 31, 2017 compared with the prior year. Improving economic conditions and customer growth were more than offset by energy savings driven by customer conservation, energy efficiency, distributed renewable generation initiatives and one fewer day of sales due to the leap year in 2016. For the three years 2015 through 2017, APS experienced annual increases in retail electricity sales averaging 0.1%, adjusted to exclude the effects of weather variations. We currently project that annual retail electricity sales in kWh will increase in the range of 0.5 - 1.5% for 2018 and increase on average in the range of 0.5 - 1.5% during 2018 through 2020, including the effects of customer conservation and energy efficiency and distributed renewable generation initiatives, but excluding the effects of weather variations. A slower recovery of the Arizona economy or acceleration of the expected effects of customer conservation, energy efficiency or distributed renewable generation initiatives could further impact these estimates.
Actual sales growth, excluding weather-related variations, may differ from our projections as a result of numerous factors, such as economic conditions, customer growth, usage patterns and energy conservation, impacts of energy efficiency programs and growth in DG, and responses to retail price changes. Based on past experience, a reasonable range of variation in our kWh sales projections attributable to such economic factors under normal business conditions can result in increases or decreases in annual net income of up to approximately $10 million.
Weather. In forecasting the retail sales growth numbers provided above, we assume normal weather patterns based on historical data. Historically, extreme weather variations have resulted in annual variations in net income in excess of $20 million. However, our experience indicates that the more typical variations from normal weather can result in increases or decreases in annual net income of up to $10 million.
Fuel and Purchased Power Costs. Fuel and purchased power costs included on our Consolidated
Statements of Income are impacted by our electricity sales volumes, existing contracts for purchased power and generation fuel, our power plant performance, transmission availability or constraints, prevailing market

60
prices, new generating plants being placed in service in our market areas, changes in our generation resource allocation, our hedging program for managing such costs and PSA deferrals and the related amortization.
Operations and Maintenance Expenses. Operations and maintenance expenses are impacted by customer and sales growth, power plant operations, maintenance of utility plant (including generation, transmission, and distribution facilities), inflation, unplanned outages, planned outages (typically scheduled in the spring and fall), renewable energy and demand side management related expenses (which are offset by the same amount of operating revenues) and other factors. See Note 2 for discussion on new accounting guidance related to the presentation of net periodic pension and postretirement benefit cost.
Depreciation and Amortization Expenses. Depreciation and amortization expenses are impacted by net additions to utility plant and other property (such as new generation, transmission, and distribution facilities), and changes in depreciation and amortization rates. See "Liquidity and Capital Resources" below for information regarding the planned additions to our facilities and income tax impacts related to bonus depreciation. Property Taxes. Taxes other than income taxes consist primarily of property taxes, which are affected by the value of property in-service and under construction, assessment ratios, and tax rates. The average property tax rate in Arizona for APS, which owns essentially all of our property, was 11.2% of the assessed value for 2017, 11.2% for 2016 and 11.0% for 2015. We expect property taxes to increase as we add new generating units and continue with improvements and expansions to our existing generating units and transmission and distribution facilities.
Income Taxes. Income taxes are affected by the amount of pretax book income, income tax rates, certain deductions and non-taxable items, such as AFUDC. In addition, income taxes may also be affected by the settlement of issues with taxing authorities. On December 22, 2017, the Tax Cuts and Jobs Act was enacted and is generally effective on January 1, 2018. Changes which will impact the Company include a reduction in the corporate tax rate to 21%, revisions to the rules related to tax bonus depreciation, limitations on interest deductibility and an associated exception for certain public utilities, and requirements that certain excess deferred tax amounts of regulated utilities be normalized. (See Note 4 for details of the impacts on the Company as of December 31, 2017.) In APS's recent general retail rate case, the ACC approved a Tax Expense Adjustor Mechanism which will be used to pass through the income tax effects to retail customers of the Tax Cuts and Jobs Act. (See Note 3 for details of the TEAM.)
Interest Expense. Interest expense is affected by the amount of debt outstanding and the interest rates on that debt (see Note 6). The primary factors affecting borrowing levels are expected to be our capital expenditures, long-term debt maturities, equity issuances and internally generated cash flow. AFUDC offsets a portion of interest expense while capital projects are under construction. We stop accruing AFUDC on a project when it is placed in commercial operation.
RESULTS OF OPERATIONS
Pinnacle West’s only reportable business segment is our regulated electricity segment, which consists of traditional regulated retail and wholesale electricity businesses (primarily electric service to Native Load customers) and related activities and includes electricity generation, transmission and distribution.
Operating Results – 2017 compared with 2016.
Our consolidated net income attributable to common shareholders for the year ended December 31, 2017 was $488 million, compared with $442 million for the prior year. The results reflect an increase of

61
approximately $48 million for the regulated electricity segment primarily due to higher revenue resulting from the retail regulatory settlement effective August 19, 2017, higher transmission revenues, higher retail revenues due to customer growth and higher average effective prices due to customer usage patterns and changes relating to customer program eligibility, partially offset by higher depreciation and amortization primarily due to increased plant in service and higher depreciation and amortization rates.
The following table presents net income attributable to common shareholders by business segment compared with the prior year:
Year EndedDecember 31,
2017 2016 Net change
(dollars in millions)Regulated Electricity Segment: Operating revenues less fuel and purchased power expenses $ 2,561 $ 2,407 $ 154Operations and maintenance (911) (906) (5)Depreciation and amortization (532) (485) (47)Taxes other than income taxes (183) (166) (17)All other income and expenses, net 29 35 (6)Interest charges, net of allowance for borrowed funds used duringconstruction (198) (186) (12)Income taxes (Note 4) (256) (237) (19)Less income related to noncontrolling interests (Note 18) (19) (19) —
Regulated electricity segment income 491 443 48All other (3) (1) (2)Net Income Attributable to Common Shareholders $ 488 $ 442 $ 46

62
Operating revenues less fuel and purchased power expenses. Regulated electricity segment operating revenues less fuel and purchased power expenses were $154 million higher for the year ended December 31, 2017 compared with the prior year. The following table summarizes the major components of this change:
Increase (Decrease)
Operatingrevenues
Fuel andpurchased
power expenses Net change
(dollars in millions)Impacts of retail regulatory settlement effective August 19, 2017
(Note 3) $ 55 $ — $ 55Transmission revenues (Note 3):
Higher transmission revenues 30 — 30
Absence of 2016 FERC disallowance 12 — 12Higher retail revenue due to customer growth and higher average
effective prices due to customer usage patterns and changesrelating to customer program participation (a) 21 (3) 24
Lost fixed cost recovery 14 — 14Effects of weather 9 3 6Changes in net fuel and purchased power costs, including off-
system sales margins and related deferrals (83) (92) 9Higher demand side management regulatory surcharges and
renewable energy regulatory surcharges and purchased power,partially offset in operations and maintenance costs 9 2 7
Miscellaneous items, net (3) — (3)Total $ 64 $ (90) $ 154
(a) Partially offset by the impacts of efficiency programs and distributed generation.
Operations and maintenance. Operations and maintenance expenses increased $5 million for the year ended December 31, 2017 compared with the prior year primarily because of:
• An increase of $10 million for employee benefit costs;
• An increase of $9 million for costs primarily related to information technology and other corporate support;
• An increase of $8 million related to costs for demand-side management, renewable energy and similar regulatory programs, which is partially offset in operating revenues and purchased power;
• An increase of $5 million related to the Navajo Plant capital projects canceled due to the expected plant retirement, which were deferred for regulatory recovery in depreciation;
• A decrease of $12 million for lower Palo Verde operating costs;
• A decrease of $11 million in fossil generation costs primarily due to less planned outage activity in the current year and lower Navajo Generating Plant costs;

63
• A decrease of $5 million primarily due to the absence of 2016 costs to support the Company's positions on a solar net metering ballot initiative in Arizona; and
• An increase of $1 million related to miscellaneous other factors.
Depreciation and amortization. Depreciation and amortization expenses were $47 million higher for the year ended December 31, 2017 compared with the prior year primarily related to increased plant in service of $32 million and increased depreciation and amortization rates of $19 million, partially offset by the regulatory deferral of the canceled capital projects associated with the expected Navajo Plant retirement of $5 million.
Taxes other than income taxes. Taxes other than income taxes were $17 million higher for the year ended December 31, 2017 compared with the prior year primarily due to higher property values and the amortization of our property tax deferral regulatory asset.
All other income and expenses, net. All other income and expenses, net, were $6 million lower for the year ended December 31, 2017 compared with the prior year primarily due to the absence of a gain on sale of a transmission line, which occurred in 2016.
Interest charges, net of allowance for borrowed funds used during construction. Interest charges, net of allowance for borrowed funds used during construction, increased $12 million for the year ended December 31, 2017 compared with the prior year, primarily because of higher debt balances in the current year.
Income taxes. Income taxes were $19 million higher for the year ended December 31, 2017 compared with the prior year primarily due to the effects of higher pretax income in the current year and the effects of the federal tax reform, partially offset by a lower effective tax rate primarily due to stock compensation. The stock compensation guidance requires all excess income tax benefits and deficiencies arising from share-based payments to be recognized in earnings in the period they occur, which causes effective tax rate fluctuations when stock compensation payouts occur.

64
Operating Results – 2016 compared with 2015.
Our consolidated net income attributable to common shareholders for the year ended December 31, 2016 was $442 million, compared with $437 million for the prior year. The results reflect an increase of approximately $4 million for the regulated electricity segment primarily due to higher transmission revenues, higher retail revenues due to customer growth and changes in customer usage patterns and related pricing, partially offset by higher operations and maintenance expense primarily related to transmission, distribution and customer service costs.
The following table presents net income attributable to common shareholders by business segment compared with the prior year:
Year EndedDecember 31,
2016 2015 Net change
(dollars in millions)Regulated Electricity Segment: Operating revenues less fuel and purchased power expenses $ 2,407 $ 2,391 $ 16Operations and maintenance (906) (868) (38)Depreciation and amortization (485) (494) 9Taxes other than income taxes (166) (172) 6All other income and expenses, net 35 19 16Interest charges, net of allowance for borrowed funds used duringconstruction (186) (179) (7)Income taxes (237) (239) 2Less income related to noncontrolling interests (Note 18) (19) (19) —
Regulated electricity segment income 443 439 4All other (1) (2) 1Net Income Attributable to Common Shareholders $ 442 $ 437 $ 5

65
Operating revenues less fuel and purchased power expenses. Regulated electricity segment operating revenues less fuel and purchased power expenses were $16 million higher for the year ended December 31, 2016 compared with the prior year. The following table summarizes the major components of this change:
Increase (Decrease)
Operatingrevenues
Fuel andpurchased
power expenses Net change
(dollars in millions)Lost fixed cost recovery $ 17 $ — $ 17Effects of weather 6 2 4Transmission revenues (Note 3):
Higher transmission revenues 27 — 27FERC disallowance (12) — (12)
Higher retail revenues due to changes in customer usage patternsand related pricing 10 — 10
Changes in net fuel and purchased power costs, including off-system sales margins and related deferrals (15) (17) 2
Palo Verde system benefits charge (offset in depreciation andamortization, see Note 3) (14) — (14)
Lower demand side management regulatory surcharges andrenewable energy regulatory surcharges and purchased powerpartially offset in operations and maintenance costs (16) (1) (15)
Miscellaneous items, net (6) (3) (3)Total $ (3) $ (19) $ 16
Operations and maintenance. Operations and maintenance expenses increased $38 million for the year ended December 31, 2016 compared with the prior year primarily because of:
• An increase of $16 million for transmission, distribution, and customer service costs primarily related to increased maintenance costs and implementation of new systems;
• An increase of $9 million primarily for costs to support the company's positions on a solar net metering ballot initiative in Arizona and increased political participation costs;
• An increase of $8 million in fossil generation costs primarily related to $33 million in higher planned outage costs, partially offset by $25 million of lower other fossil operating costs;
• An increase of $7 million for costs related to legal, regulatory, information systems and other corporate support;
• An increase of $5 million for employee benefit costs primarily related to increased pension, medical claims and other benefit costs;
• An increase of $5 million related to higher nuclear generation costs;

66
• An offsetting decrease of $13 million related to costs for demand-side management, renewable energy and similar regulatory programs, which is partially offset in operating revenues and purchased power; and
• An increase of $1 million related to miscellaneous other factors.
Additionally, stock compensation costs were flat compared to the prior year as a $12 million increase in costs was offset by a one-time $12 million reduction for the adoption of new stock compensation guidance (See Note 15);
Depreciation and amortization. Depreciation and amortization expenses were $9 million lower for the year ended December 31, 2016 compared with the prior year primarily related to:
• A decrease of $20 million related to the regulatory treatment of the Palo Verde sale leaseback lease extension;
• A decrease of $14 million due to lower Palo Verde decommissioning expense recovered through the system benefits charge (offset in operating revenues); and
• An increase of $25 million due to increased plant in service.
Taxes other than income taxes. Taxes other than income taxes were $6 million lower for the year ended December 31, 2016 compared with the prior year primarily due to lower assessed values resulting from a lower Arizona statutory rate, partially offset by higher property tax rates.
All other income and expenses, net. All other income and expenses, net, were $16 million higher for the year ended December 31, 2016 compared with the prior year primarily due to higher allowance for equity funds used during construction and the gain on sale of a transmission line.
Interest charges, net of allowance for borrowed funds used during construction. Interest charges, net of allowance for borrowed funds used during construction, increased $7 million for the year ended December 31, 2016 compared with the prior year, primarily because of higher debt balances in the current year.
LIQUIDITY AND CAPITAL RESOURCES
Overview
Pinnacle West’s primary cash needs are for dividends to our shareholders and principal and interest payments on our indebtedness. The level of our common stock dividends and future dividend growth will be dependent on declaration by our Board of Directors and based on a number of factors, including our financial condition, payout ratio, free cash flow and other factors.
Our primary sources of cash are dividends from APS and external debt and equity issuances. An ACC
order requires APS to maintain a common equity ratio of at least 40%. As defined in the related ACC order, the common equity ratio is defined as total shareholder equity divided by the sum of total shareholder equity and long-term debt, including current maturities of long-term debt. At December 31, 2017, APS’s common equity ratio, as defined, was 53%. Its total shareholder equity was approximately $5.3 billion, and total capitalization was approximately $10.0 billion. Under this order, APS would be prohibited from paying dividends if such payment would reduce its total shareholder equity below approximately $4.0 billion,

67
assuming APS’s total capitalization remains the same. This restriction does not materially affect Pinnacle West’s ability to meet its ongoing cash needs or ability to pay dividends to shareholders.
APS’s capital requirements consist primarily of capital expenditures and maturities of long-term debt.
APS funds its capital requirements with cash from operations and, to the extent necessary, external debt financing and equity infusions from Pinnacle West.
On December 22, 2017, the Tax Cuts and Jobs Act of 2017 was enacted. As a result of this legislation, bonus depreciation is no longer available for regulated public utility company property acquired, or that commenced construction, after September 27, 2017. The final legislative language contains a transition rule for property which was acquired, or under construction, prior to September 28, 2017 which would allow at least some part of APS’s capital projects under construction at that time to continue to qualify for bonus depreciation under pre-Act rules. However, because of current ambiguities regarding the scope of this transition rule, it is unclear how much of APS’s capital projects which were under construction prior to September 28, 2017, will qualify. The Company currently believes the continued availability of bonus depreciation for property under construction prior to September 28, 2017 will generate at least $60-$75 million of cash tax benefits over the next two years. These benefits may be higher if the current ambiguities in the legislative language are clarified in a manner which allows additional expenditures incurred after September 27, 2017, related to ongoing capital projects under construction as of that date, to qualify for bonus depreciation. The cash generated by bonus depreciation is an acceleration of the tax benefits that APS would have otherwise received over 20 years and reduces rate base for ratemaking purposes. At Pinnacle West Consolidated, when coupled with a lower 21 percent corporate tax rate, the continued availability of bonus depreciation to this transition period property is expected to delay until 2019 full cash realization of approximately $85 million of currently unrealized Investment Tax Credits and other tax credits, which are recorded as a deferred tax asset on the Condensed Consolidated Balance Sheet as of December 31, 2017.
Summary of Cash Flows The following tables present net cash provided by (used for) operating, investing and financing activities for the years ended December 31, 2017, 2016 and 2015 (dollars in millions):
Pinnacle West Consolidated
2017 2016 2015Net cash flow provided by operating activities $ 1,118 $ 1,023 $ 1,094Net cash flow used for investing activities (1,429) (1,252) (1,066)Net cash flow provided by financing activities 316 198 4
Net increase (decrease) in cash and cash equivalents $ 5 $ (31) $ 32 Arizona Public Service Company
2017 2016 2015Net cash flow provided by operating activities $ 1,162 $ 1,010 $ 1,100Net cash flow used for investing activities (1,401) (1,219) (1,060)Net cash flow provided by (used for) financing activities 244 196 (22)
Net increase (decrease) in cash and cash equivalents $ 5 $ (13) $ 18

68
Operating Cash Flows
2017 Compared with 2016. Pinnacle West’s consolidated net cash provided by operating activities was $1,118 million in 2017 compared to $1,023 million in 2016. The increase of $95 million in net cash provided is primarily due to lower payments of operations and maintenance, fuel and purchased power costs and higher cash receipts, partially offset by no collateral posted in 2017 compared to $17 million returned in 2016. The difference between APS and Pinnacle West's net cash provided by operating activities primarily relates to Pinnacle West's cash payments for 4CA's operating costs and differences in other operating cash payments.
2016 Compared with 2015. Pinnacle West’s consolidated net cash provided by operating activities was $1,023 million in 2016 compared to $1,094 million in 2015. The decrease of $71 million in net cash provided is primarily due to higher operations and maintenance costs.
Retirement plans and other postretirement benefits. Pinnacle West sponsors a qualified defined benefit pension plan and a non-qualified supplemental excess benefit retirement plan for the employees of Pinnacle West and our subsidiaries. The requirements of the Employee Retirement Income Security Act of 1974 ("ERISA") require us to contribute a minimum amount to the qualified plan. We contribute at least the minimum amount required under ERISA regulations, but no more than the maximum tax-deductible amount. The minimum required funding takes into consideration the value of plan assets and our pension benefit obligations. Under ERISA, the qualified pension plan was 116% funded as of January 1, 2018 and 115% as of January 1, 2017. Under accounting principles generally accepted in the United States of America ("GAAP"), the qualified pension plan was 95% funded as of January 1, 2018 and 88% funded as of January 1, 2017. See Note 7 for additional details. The assets in the plan are comprised of fixed-income, equity, real estate, and short-term investments. Future year contribution amounts are dependent on plan asset performance and plan actuarial assumptions. We made contributions to our pension plan totaling $100 million in 2017, $100 million in 2016, and $100 million in 2015. The minimum required contributions for the pension plan are zero for the next three years. We expect to make voluntary contributions up to a total of $250 million during the 2018-2020 period. With regard to contributions to our other postretirement benefit plans, we made a contribution of approximately $1 million in each of 2017, 2016 and 2015. We do not expect to make any contributions over the next three years to our other postretirement benefit plans. APS funds its share of the contributions. APS’s share of the pension plan contribution was approximately $100 million in 2017, $100 million in 2016 and $100 million in 2015. APS’s share of the contributions to the other postretirement benefit plan was approximately $1 million in 2017, 2016 and 2015.
Due to plan changes in September 2014, the Company is currently in the process of seeking Internal Revenue Service ("IRS") approval to move approximately $186 million of other postretirement benefit trust assets into a new trust account to pay for active union employee medical costs. In December 2016, FERC approved a methodology for determining the amount of other postretirement benefit trust assets to transfer into a new trust account to pay for active union employee medical costs. On January 2, 2018, these funds were moved to the new trust account. The Company negotiated a draft Closing Agreement granting tentative approval from the IRS prior to the transfer. Subsequent to the transfer, the Company submitted proof of the transfer to the IRS and expects to execute a final Closing Agreement early in 2018. Per the terms of an order from FERC, the Company must also make an informational filing with FERC. The Company made this FERC filing during February 2018. It is the Company’s understanding that completion of these regulatory requirements will then permit access to the approximately $186 million for the sole purpose of paying active union employee medical benefits.

69
Investing Cash Flows
2017 Compared with 2016. Pinnacle West’s consolidated net cash used for investing activities was $(1,429) million in 2017, compared to $(1,252) million in 2016. The increase of $177 million in net cash used primarily related to increased capital expenditures.
2016 Compared with 2015. Pinnacle West’s consolidated net cash used for investing activities was $(1,252) million in 2016, compared to $(1,066) million in 2015. The increase of $186 million in net cash used primarily related to increased capital expenditures.
Capital Expenditures. The following table summarizes the estimated capital expenditures for the next three years:
Capital Expenditures
(dollars in millions)
Estimated for the Year Ended
December 31, 2018 2019 2020APS
Generation: Nuclear Fuel $ 72 $ 64 $ 64Renewables 16 24 17Environmental 91 22 46New Gas Generation 120 9 —Other Generation 210 177 134
Distribution 444 541 617Transmission 148 215 180Other (a) 80 101 153
Total APS $ 1,181 $ 1,153 $ 1,211
(a) Primarily information systems and facilities projects. Generation capital expenditures are comprised of various improvements to APS’s existing fossil,
renewable and nuclear plants. Examples of the types of projects included in this category are additions, upgrades and capital replacements of various power plant equipment, such as turbines, boilers and environmental equipment. We are monitoring the status of environmental matters, which, depending on their final outcome, could require modification to our planned environmental expenditures.
On February 17, 2015, APS and El Paso entered into an asset purchase agreement providing for the purchase by APS, or an affiliate of APS, of El Paso’s 7% interest in each of Units 4 and 5 of Four Corners. 4CA purchased the El Paso interest on July 6, 2016. NTEC had the option to purchase the 7% interest within a certain timeframe pursuant to an option granted to NTEC. On December 29, 2015, NTEC provided notice of its intent to exercise the option. The purchase did not occur during the originally contemplated timeframe. The parties are currently in discussions as to the future of the option transaction. The table above does not include capital expenditures related to 4CA's interest in Four Corners Units 4 and 5 of approximately $15 million in 2018, $7 million in 2019 and $6 million in 2020, which will be assumed by the ultimate owner of the 7% interest.

70
Distribution and transmission capital expenditures are comprised of infrastructure additions and upgrades, capital replacements, and new customer construction. Examples of the types of projects included in the forecast include power lines, substations, and line extensions to new residential and commercial developments.
Capital expenditures will be funded with internally generated cash and external financings, which may include issuances of long-term debt and Pinnacle West common stock.
Financing Cash Flows and Liquidity
2017 Compared with 2016. Pinnacle West’s consolidated net cash provided by financing activities was $316 million in 2017, compared to $198 million in 2016, an increase of $118 million in net cash provided. The net cash provided by financing activities includes $245 million in lower long-term debt repayments and $155 million higher issuances of long-term debt through December 31, 2017, partially offset by a $259 million net decrease in short-term borrowings and $16 million of higher dividend payments.
APS’s consolidated net cash provided by financing activities was $244 million in 2017, compared to $196 million in 2016, an increase of $48 million in net cash provided. The net cash provided by financing activities includes $370 million in lower long-term debt repayments and $108 million in higher equity infusions from Pinnacle West, partially offset by $143 million lower issuances of long-term debt through December 31, 2017, $271 million net decrease in short-term borrowings and $16 million of higher dividend payments.
2016 Compared with 2015. Pinnacle West’s consolidated net cash provided by financing activities was $198 million in 2016, compared to $4 million in 2015, an increase of $194 million in net cash provided. The increase in net cash provided by financing activities is primarily due to a $325 million net increase in short-term borrowings and $45 million in lower long-term debt repayments partially offset by $149 million lower issuances of long-term debt through December 31, 2016.
Significant Financing Activities. On December 20, 2017, the Pinnacle West Board of Directors declared a dividend of $0.695 per share of common stock, payable on March 1, 2018 to shareholders of record on February 1, 2018. During 2017, Pinnacle West increased its indicated annual dividend from $2.62 per share to $2.78 per share. For the year ended December 31, 2017, Pinnacle West's total dividends paid per share of common stock were $2.66 per share, which resulted in dividend payments of $290 million.
On November 30, 2017, Pinnacle West issued $300 million of 2.25% unsecured senior notes that mature on November 30, 2020. The net proceeds from the sale were used to repay our $125 million term loan and for general corporate purposes.
On March 21, 2017, APS issued an additional $250 million par amount of its outstanding 4.35% senior unsecured notes that mature on November 15, 2045. The net proceeds from the sale were used to refinance commercial paper borrowings and to replenish cash temporarily used to fund capital expenditures.
On September 11, 2017, APS issued $300 million of 2.95% senior unsecured notes that mature on September 15, 2027. The net proceeds from the sale were used to refinance commercial paper and other indebtedness and to replenish cash used to fund capital expenditures.
On November 30, 2017, PNW contributed $150 million to APS in the form of an equity infusion. APS used this contribution to repay short-term indebtedness, to finance capital expenditures and for other general corporate purposes.

71
Available Credit Facilities. Pinnacle West and APS maintain committed revolving credit facilities in order to enhance liquidity and provide credit support for their commercial paper programs.
At December 31, 2017, Pinnacle West had a $200 million facility that matures in May 2021. Pinnacle
West has the option to increase the amount of the facility up to a maximum of $300 million upon the satisfaction of certain conditions and with the consent of the lenders. At December 31, 2017, Pinnacle West had no outstanding borrowings under its credit facility, no letters of credit outstanding and $29.4 million of commercial paper borrowings.
On July 31, 2017, Pinnacle West amended its 364-day unsecured revolving credit facility to increase its capacity from $75 million to $125 million, and to extend the termination date of the facility from August 30, 2017 to July 30, 2018. Borrowings under the facility bear interest at LIBOR plus 0.80% per annum. At December 31, 2017, Pinnacle West had $66 million outstanding under the facility.
On June 29, 2017, APS replaced its $500 million revolving credit facility that would have matured in September 2020, with a new $500 million facility that matures in June 2022.
At December 31, 2017, APS had two revolving credit facilities totaling $1 billion, including a $500 million credit facility that matures in May 2021 and the above-mentioned $500 million facility. APS may increase the amount of each facility up to a maximum of $700 million, for a total of $1.4 billion, upon the satisfaction of certain conditions and with the consent of the lenders. Interest rates are based on APS’s senior unsecured debt credit ratings. These facilities are available to support APS’s $500 million commercial paper program, for bank borrowings or for issuances of letters of credit. At December 31, 2017, APS had no commercial paper outstanding and no outstanding borrowings or letters of credit under its revolving credit facilities.
See "Financial Assurances" in Note 10 for a discussion of APS’s separate outstanding letters of credit.
Other Financing Matters. See Note 16 for information related to the change in our margin and collateral accounts.
Debt Provisions
Pinnacle West’s and APS’s debt covenants related to their respective bank financing arrangements include maximum debt to capitalization ratios. Pinnacle West and APS comply with this covenant. For both Pinnacle West and APS, this covenant requires that the ratio of consolidated debt to total consolidated capitalization not exceed 65%. At December 31, 2017, the ratio was approximately 50% for Pinnacle West and 47% for APS. Failure to comply with such covenant levels would result in an event of default which, generally speaking, would require the immediate repayment of the debt subject to the covenants and could "cross-default" other debt. See further discussion of "cross-default" provisions below.
Neither Pinnacle West’s nor APS’s financing agreements contain "rating triggers" that would result in
an acceleration of the required interest and principal payments in the event of a rating downgrade. However, our bank credit agreements contain a pricing grid in which the interest rates we pay for borrowings thereunder are determined by our current credit ratings.
All of Pinnacle West’s loan agreements contain "cross-default" provisions that would result in defaults
and the potential acceleration of payment under these loan agreements if Pinnacle West or APS were to default under certain other material agreements. All of APS’s bank agreements contain "cross-default" provisions that would result in defaults and the potential acceleration of payment under these bank agreements if APS were to default under certain other material agreements. Pinnacle West and APS do not have a material adverse change restriction for credit facility borrowings.

72
See Note 6 for further discussions of liquidity matters.
Credit Ratings
The ratings of securities of Pinnacle West and APS as of February 16, 2018 are shown below. We are disclosing these credit ratings to enhance understanding of our cost of short-term and long-term capital and our ability to access the markets for liquidity and long-term debt. The ratings reflect the respective views of the rating agencies, from which an explanation of the significance of their ratings may be obtained. There is no assurance that these ratings will continue for any given period of time. The ratings may be revised or withdrawn entirely by the rating agencies if, in their respective judgments, circumstances so warrant. Any downward revision or withdrawal may adversely affect the market price of Pinnacle West’s or APS’s securities and/or result in an increase in the cost of, or limit access to, capital. Such revisions may also result in substantial additional cash or other collateral requirements related to certain derivative instruments, insurance policies, natural gas transportation, fuel supply, and other energy-related contracts. At this time, we believe we have sufficient available liquidity resources to respond to a downward revision to our credit ratings.
Moody’s Standard & Poor’s FitchPinnacle West
Corporate credit rating A3 A- A-Senior unsecured A3 BBB+ A-Commercial paper P-2 A-2 F2Outlook Stable Positive Stable
APS
Corporate credit rating A2 A- A-Senior unsecured A2 A- ACommercial paper P-1 A-2 F2Outlook Stable Positive Stable
Off-Balance Sheet Arrangements
See Note 18 for a discussion of the impacts on our financial statements of consolidating certain VIEs.

73
Contractual Obligations
The following table summarizes Pinnacle West’s consolidated contractual requirements as of December 31, 2017 (dollars in millions):
20182019-2020
2021-2022 Thereafter Total
Long-term debt payments,including interest: (a)
APS $ 290 $ 1,192 $ 310 $ 5,959 $ 7,751Pinnacle West 7 314 — — 321
Total long-term debt payments,including interest 297 1,506 310 5,959 8,072Short-term debt payments,including interest (b) 95 — — — 95Fuel and purchased powercommitments (c) 539 1,099 1,084 6,271 8,993Renewable energy credits (d) 40 80 80 370 570Purchase obligations (e) 176 27 18 204 425Coal reclamation 32 56 46 207 341Nuclear decommissioning fundingrequirements 2 4 4 55 65Noncontrolling interests (f) 23 46 46 182 297Operating lease payments 13 21 12 56 102Total contractual commitments $ 1,217 $ 2,839 $ 1,600 $ 13,304 $ 18,960
(a) The long-term debt matures at various dates through 2046 and bears interest principally at fixed rates. Interest on variable-rate long-term debt is determined by using average rates at December 31, 2017 (see Note 6).
(b) See Note 5 - Lines of credit and short-term borrowings for further details. (c) Our fuel and purchased power commitments include purchases of coal, electricity, natural gas,
renewable energy, nuclear fuel, and natural gas transportation (see Notes 3 and 10).(d) Contracts to purchase renewable energy credits in compliance with the RES (see Note 3).(e) These contractual obligations include commitments for capital expenditures and other obligations.(f) Payments to the noncontrolling interests relate to the Palo Verde Sale Leaseback (see Note 18).
This table excludes $42 million in unrecognized tax benefits because the timing of the future cash
outflows is uncertain. Estimated minimum required pension contributions are zero for 2018, 2019 and 2020 (see Note 7).
CRITICAL ACCOUNTING POLICIES
In preparing the financial statements in accordance with GAAP, management must often make estimates and assumptions that affect the reported amounts of assets, liabilities, revenues, expenses and related disclosures at the date of the financial statements and during the reporting period. Some of those judgments can be subjective and complex, and actual results could differ from those estimates. We consider the following accounting policies to be our most critical because of the uncertainties, judgments and complexities of the underlying accounting standards and operations involved.

74
Regulatory Accounting
Regulatory accounting allows for the actions of regulators, such as the ACC and FERC, to be reflected in our financial statements. Their actions may cause us to capitalize costs that would otherwise be included as an expense in the current period by unregulated companies. Regulatory assets represent incurred costs that have been deferred because they are probable of future recovery in customer rates. Regulatory liabilities generally represent amounts collected in rates to recover costs expected to be incurred in the future or amounts collected in excess of costs incurred and are refundable to customers. Management continually assesses whether our regulatory assets are probable of future recovery by considering factors such as applicable regulatory environment changes and recent rate orders to other regulated entities in the same jurisdiction. This determination reflects the current political and regulatory climate in Arizona and is subject to change in the future. If future recovery of costs ceases to be probable, the assets would be written off as a charge in current period earnings. We had $1,450 million of regulatory assets and $2,553 million of regulatory liabilities on the Consolidated Balance Sheets at December 31, 2017.
Included in the balance of regulatory assets at December 31, 2017 is a regulatory asset of $576 million for pension benefits. This regulatory asset represents the future recovery of these costs through retail rates as these amounts are charged to earnings. If all or a portion of these costs are disallowed by the ACC, this regulatory asset would be charged to OCI and result in lower future earnings.
See Notes 1 and 3 for more information.
Pensions and Other Postretirement Benefit Accounting
Changes in our actuarial assumptions used in calculating our pension and other postretirement benefit liability and expense can have a significant impact on our earnings and financial position. The most relevant actuarial assumptions are the discount rate used to measure our liability and net periodic cost, the expected long-term rate of return on plan assets used to estimate earnings on invested funds over the long-term, the mortality assumptions, and the assumed healthcare cost trend rates. We review these assumptions on an annual basis and adjust them as necessary.
The following chart reflects the sensitivities that a change in certain actuarial assumptions would have had on the December 31, 2017 reported pension liability on the Consolidated Balance Sheets and our 2017 reported pension expense, after consideration of amounts capitalized or billed to electric plant participants, on Pinnacle West’s Consolidated Statements of Income (dollars in millions):
Increase (Decrease)
Actuarial Assumption (a)
Impact onPensionLiability
Impact onPensionExpense
Discount rate: Increase 1% $ (372) $ (11)Decrease 1% 455 14
Expected long-term rate of return on plan assets:Increase 1% — (13)Decrease 1% — 13
(a) Each fluctuation assumes that the other assumptions of the calculation are held constant while the rates are changed by one percentage point.
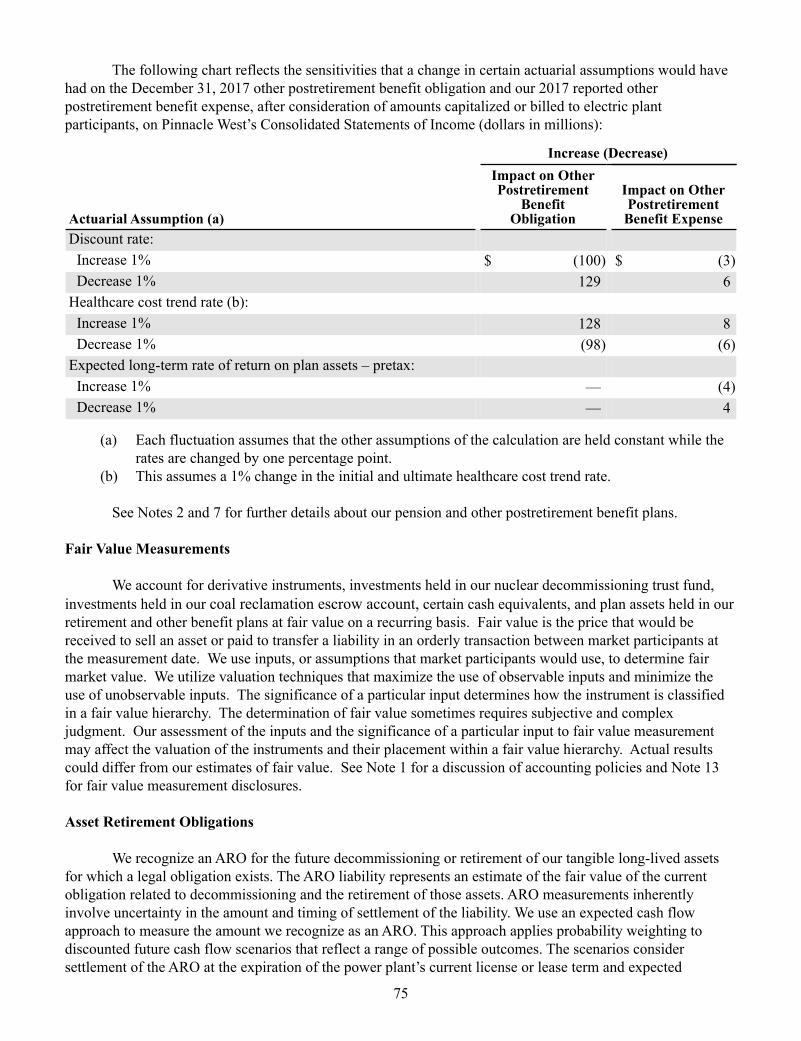
75
The following chart reflects the sensitivities that a change in certain actuarial assumptions would have had on the December 31, 2017 other postretirement benefit obligation and our 2017 reported other postretirement benefit expense, after consideration of amounts capitalized or billed to electric plant participants, on Pinnacle West’s Consolidated Statements of Income (dollars in millions):
Increase (Decrease)
Actuarial Assumption (a)
Impact on OtherPostretirement
BenefitObligation
Impact on OtherPostretirement
Benefit ExpenseDiscount rate:
Increase 1% $ (100) $ (3)Decrease 1% 129 6
Healthcare cost trend rate (b):Increase 1% 128 8Decrease 1% (98) (6)
Expected long-term rate of return on plan assets – pretax: Increase 1% — (4)Decrease 1% — 4
(a) Each fluctuation assumes that the other assumptions of the calculation are held constant while the rates are changed by one percentage point.
(b) This assumes a 1% change in the initial and ultimate healthcare cost trend rate. See Notes 2 and 7 for further details about our pension and other postretirement benefit plans.
Fair Value Measurements
We account for derivative instruments, investments held in our nuclear decommissioning trust fund, investments held in our coal reclamation escrow account, certain cash equivalents, and plan assets held in our retirement and other benefit plans at fair value on a recurring basis. Fair value is the price that would be received to sell an asset or paid to transfer a liability in an orderly transaction between market participants at the measurement date. We use inputs, or assumptions that market participants would use, to determine fair market value. We utilize valuation techniques that maximize the use of observable inputs and minimize the use of unobservable inputs. The significance of a particular input determines how the instrument is classified in a fair value hierarchy. The determination of fair value sometimes requires subjective and complex judgment. Our assessment of the inputs and the significance of a particular input to fair value measurement may affect the valuation of the instruments and their placement within a fair value hierarchy. Actual results could differ from our estimates of fair value. See Note 1 for a discussion of accounting policies and Note 13 for fair value measurement disclosures.
Asset Retirement Obligations
We recognize an ARO for the future decommissioning or retirement of our tangible long-lived assets for which a legal obligation exists. The ARO liability represents an estimate of the fair value of the current obligation related to decommissioning and the retirement of those assets. ARO measurements inherently involve uncertainty in the amount and timing of settlement of the liability. We use an expected cash flow approach to measure the amount we recognize as an ARO. This approach applies probability weighting to discounted future cash flow scenarios that reflect a range of possible outcomes. The scenarios consider settlement of the ARO at the expiration of the power plant’s current license or lease term and expected

76
decommissioning dates. The fair value of an ARO is recognized in the period in which it is incurred. The associated asset retirement costs are capitalized as part of the carrying value of the long-lived asset and are depreciated over the life of the related assets. In addition, we accrete the ARO liability to reflect the passage of time. Changes in these estimates and assumptions could materially affect the amount of the recorded ARO for these assets. In accordance with regulatory accounting, APS accrues removal costs for its regulated utility assets, even if there is no legal obligation for removal.
AROs as of December 31, 2017 are described further in “Note 11, Asset Retirement Obligations”.
Income Taxes
Our income tax expense, deferred tax assets and liabilities, and liabilities for unrecognized tax benefits reflect management’s best estimate of current and future taxes to be paid.
On December 22, 2017, the Tax Cuts and Jobs Act was enacted, and is generally effective January 1, 2018. This legislation made significant changes to the federal income tax laws. Changes which will impact the Company include, but are not limited to, a reduction in the corporate tax rate to 21%, revisions to the rules related to tax bonus depreciation, limitations on interest deductibility and an associated exception for certain public utility property, and requirements that certain excess deferred tax amounts of regulated utilities be normalized. Several sections of the final legislation contain technical ambiguities. Accordingly, it is necessary for management to interpret this legislation and make judgements until further guidance becomes available. As a result, changes in these judgments could materially affect amounts the Company recognized in its financial statements.
Deferred tax assets or liabilities are recognized for the estimated future tax effects attributable to temporary differences between the financial statement basis and the tax basis of assets and liabilities as well as tax credit carry forwards and net operating loss carry forwards. Deferred tax assets and liabilities are measured using enacted tax rates expected to apply to taxable income in the years in which those temporary differences are expected to be recovered or settled. The effect on deferred tax assets and liabilities of a change in tax rates is recognized in the period the change is enacted. Given the regulatory nature of the Company’s business, the effect on deferred tax assets and liabilities for the reduction in the federal corporate tax rate to 21%, which management believes it is probable that a regulatory agency will seek to recover for ratepayers, has been recorded as a regulatory liability as of December 31, 2017.
The calculation of our tax liabilities involves dealing with the application of complex laws and regulations which are voluminous and often ambiguous. Interpretations and guidance surrounding income tax laws and regulations change over time. Tax positions taken by Pinnacle West on its income tax returns that are recognized in the financial statements must satisfy a more likely than not recognition threshold, assuming that the position will be sustained upon examination by taxing authorities with full knowledge of all relevant information, including resolutions of any related appeals or litigation processes, on the basis of the technical merits.
We record unrecognized tax benefits for tax positions that may not satisfy this more likely than not recognition threshold as liabilities in accordance with generally accepted accounting principles. These liabilities are adjusted when management judgement changes as a result of the evaluation of new information not previously available. These changes will be reflected as an increase or decrease to income tax expense in the period in which new information is available.

77
OTHER ACCOUNTING MATTERS
We adopted the following new accounting standards on January 1, 2018:
• ASU 2014-09: Revenue from Contracts with Customers, and related amendments
• ASU 2016-01: Financial Instruments, Recognition and Measurement
• ASU 2016-15: Statement of Cash Flows, Classification of Certain Cash Receipts and Cash Payments
• ASU 2016-18: Statement of Cash Flows, Restricted Cash
• ASU 2017-07: Compensation-Retirement Benefits, Improving the Presentation of Net Periodic Pension
Cost and Net Periodic Postretirement Benefit Cost
• ASU 2017-01: Business Combinations, Clarifying the Definition of a Business
• ASU 2017-05: Other Income, Clarifying the Scope of Asset Derecognition Guidance and Accounting
for Partial Sales of Nonfinancial Assets
We are currently evaluating the impacts of the pending adoption of the following new accounting standards:
• ASU 2016-02: Leases, and related amendments, effective for us on January 1, 2019
• ASU 2017-12: Derivatives and Hedging, Targeted Improvements to Accounting for Hedging Activities,
effective for us on January 1, 2019
• ASU 2018-02: Income Statement-Reporting Comprehensive Income: Reclassification of Certain Tax
Effects from Accumulated Other Comprehensive Income
• ASU 2016-13: Financial Instruments, Measurement of Credit Losses, effective for us on January 1,
2020
See Note 2 for additional information related to new accounting standards.
MARKET AND CREDIT RISKS
Market Risks
Our operations include managing market risks related to changes in interest rates, commodity prices and investments held by our nuclear decommissioning trust fund and benefit plan assets.
Interest Rate and Equity Risk
We have exposure to changing interest rates. Changing interest rates will affect interest paid on
variable-rate debt and the market value of fixed income securities held by our nuclear decommissioning trust fund (see Note 13 and Note 19) and benefit plan assets. The nuclear decommissioning trust fund and benefit plan assets also have risks associated with the changing market value of their equity and other non-fixed income investments. Nuclear decommissioning and benefit plan costs are recovered in regulated electricity prices.

78
The tables below present contractual balances of our consolidated long-term and short-term debt at the expected maturity dates, as well as the fair value of those instruments on December 31, 2017 and 2016. The interest rates presented in the tables below represent the weighted-average interest rates as of December 31, 2017 and 2016 (dollars in millions):
Pinnacle West – Consolidated
Short-TermDebt
Variable-RateLong-Term Debt
Fixed-RateLong-Term Debt
Interest Interest Interest 2017 Rates Amount Rates Amount Rates Amount
2018 2.14% $ 95 2.17% $ 50 1.75% $ 322019 — — 2.27% 100 8.75% 5002020 — — — — 2.23% 5502021 — — — — — —2022 — — — — — —Years thereafter — — 1.77% 36 4.25% 3,640Total $ 95 $ 186 $ 4,722Fair value $ 95 $ 186 $ 5,119
Short-TermDebt
Variable-RateLong-Term Debt
Fixed-RateLong-Term Debt
Interest Interest Interest 2016 Rates Amount Rates Amount Rates Amount
2017 1.01% $ 177 1.52% $ 125 —% $ —2018 — — 1.37% 50 1.75% 322019 — — 1.46% 100 8.75% 5002020 — — — — 2.20% 2502021 — — — — — —Years thereafter — — 0.81% 36 4.37% 3,090Total $ 177 $ 311 $ 3,872Fair value $ 177 $ 311 $ 4,115

79
The tables below present contractual balances of APS’s long-term and short-term debt at the expected maturity dates, as well as the fair value of those instruments on December 31, 2017 and 2016. The interest rates presented in the tables below represent the weighted-average interest rates as of December 31, 2017 and 2016 (dollars in millions):
APS — Consolidated
Variable-RateLong-Term Debt
Fixed-RateLong-Term Debt
Interest Interest 2017 Rates Amount Rates Amount
2018 2.17% $ 50 1.75% $ 322019 2.27% 100 8.75% 5002020 — — 2.20% 2502021 — — — —2022 — — — —Years thereafter 1.77% 36 4.25% 3,640Total $ 186 $ 4,422Fair value $ 186 $ 4,820
Short-TermDebt
Variable-RateLong-Term Debt
Fixed-RateLong-Term Debt
Interest Interest Interest 2016 Rates Amount Rates Amount Rates Amount
2017 0.88% $ 135 —% $ — —% $ —2018 — — 1.37% 50 1.75% 322019 — — 1.46% 100 8.75% 5002020 — — — — 2.20% 2502021 — — — — — —Years thereafter — — 0.81% 36 4.37% 3,090Total $ 135 $ 186 $ 3,872Fair value $ 135 $ 186 $ 4,115
Commodity Price Risk We are exposed to the impact of market fluctuations in the commodity price and transportation costs of
electricity and natural gas. Our risk management committee, consisting of officers and key management personnel, oversees company-wide energy risk management activities to ensure compliance with our stated energy risk management policies. We manage risks associated with these market fluctuations by utilizing various commodity instruments that may qualify as derivatives, including futures, forwards, options and swaps. As part of our risk management program, we use such instruments to hedge purchases and sales of electricity and fuels. The changes in market value of such contracts have a high correlation to price changes in the hedged commodities.

80
The following table shows the net pretax changes in mark-to-market of our derivative positions in 2017 and 2016 (dollars in millions):
2017 2016Mark-to-market of net positions at beginning of year $ (49) $ (154)Decrease (Increase) in regulatory asset (46) 101Recognized in OCI:
Mark-to-market losses realized during the period 4 4Change in valuation techniques — —
Mark-to-market of net positions at end of year $ (91) $ (49)
The table below shows the fair value of maturities of our derivative contracts (dollars in millions) at December 31, 2017 by maturities and by the type of valuation that is performed to calculate the fair values, classified in their entirety based on the lowest level of input that is significant to the fair value measurement. See Note 1, “Derivative Accounting” and “Fair Value Measurements,” for more discussion of our valuation methods.
Source of Fair Value 2018 2019 2020 2021
Total fair
valueObservable prices provided by other externalsources $ (49) $ (23) $ (1) $ (1) $ (74)
Prices based on unobservable inputs (5) (8) (4) — (17)Total by maturity $ (54) $ (31) $ (5) $ (1) $ (91)
The table below shows the impact that hypothetical price movements of 10% would have on the market value of our risk management assets and liabilities included on Pinnacle West’s Consolidated Balance Sheets at December 31, 2017 and 2016 (dollars in millions):
December 31, 2017Gain (Loss)
December 31, 2016Gain (Loss)
Price Up 10%
Price Down 10%
Price Up 10%
Price Down 10%
Mark-to-market changes reported in: Regulatory asset (liability) or OCI (a)
Electricity $ 1 $ (1) $ 2 $ (2)Natural gas 45 (45) 46 (46)
Total $ 46 $ (46) $ 48 $ (48)
(a) These contracts are economic hedges of our forecasted purchases of natural gas and electricity. The impact of these hypothetical price movements would substantially offset the impact that these same price movements would have on the physical exposures being hedged. To the extent the amounts are eligible for inclusion in the PSA, the amounts are recorded as either a regulatory asset or liability.

81
Credit Risk
We are exposed to losses in the event of non-performance or non-payment by counterparties. See Note 16 for a discussion of our credit valuation adjustment policy.
ITEM 7A. QUANTITATIVE AND QUALITATIVEDISCLOSURES ABOUT MARKET RISK
See “Market and Credit Risks” in Item 7 above for a discussion of quantitative and qualitative
disclosures about market risks.

(This page intentionally left blank)

82
ITEM 8. FINANCIAL STATEMENTS AND SUPPLEMENTARY DATA
INDEX TO FINANCIAL STATEMENTS ANDFINANCIAL STATEMENT SCHEDULES
Page
Management’s Report on Internal Control over Financial Reporting (Pinnacle West Capital Corporation)Report of Independent Registered Public Accounting FirmPinnacle West Consolidated Statements of Income for 2017, 2016 and 2015Pinnacle West Consolidated Statements of Comprehensive Income for 2017, 2016, and 2015Pinnacle West Consolidated Balance Sheets as of December 31, 2017 and 2016Pinnacle West Consolidated Statements of Cash Flows for 2017, 2016 and 2015Pinnacle West Consolidated Statements of Changes in Equity for 2017, 2016 and 2015 Management’s Report on Internal Control over Financial Reporting (Arizona Public Service Company)Report of Independent Registered Public Accounting FirmAPS Consolidated Statements of Income for 2017, 2016 and 2015APS Consolidated Statements of Comprehensive Income for 2017, 2016 and 2015APS Consolidated Balance Sheets as of December 31, 2017 and 2016APS Consolidated Statements of Cash Flows for 2017, 2016 and 2015APS Consolidated Statements of Changes in Equity for 2017, 2016 and 2015
Combined Notes to Consolidated Financial StatementsNote 1. Summary of Significant Accounting PoliciesNote 2. New Accounting StandardsNote 3. Regulatory MattersNote 4. Income TaxesNote 5. Lines of Credit and Short-Term BorrowingsNote 6. Long-Term Debt and Liquidity MattersNote 7. Retirement Plans and Other Postretirement BenefitsNote 8. LeasesNote 9. Jointly-Owned FacilitiesNote 10. Commitments and ContingenciesNote 11. Asset Retirement ObligationsNote 12. Selected Quarterly Financial Data (Unaudited)Note 13. Fair Value MeasurementsNote 14. Earnings Per ShareNote 15. Stock-Based CompensationNote 16. Derivative AccountingNote 17. Other Income and Other ExpenseNote 18. Palo Verde Sale Leaseback Variable Interest EntitiesNote 19. InvestmentsNote 20. Changes in Accumulated Other Comprehensive Loss
See Note 12 for the selected quarterly financial data (unaudited) required to be presented in this Item.
83848687889091
929395969799
100
101101108112124128130133141143144152153154161161164169169171172

83
MANAGEMENT’S REPORT ON INTERNAL CONTROLOVER FINANCIAL REPORTING
(PINNACLE WEST CAPITAL CORPORATION)
Our management is responsible for establishing and maintaining adequate internal control over
financial reporting, as such term is defined in Exchange Act Rules 13a-15(f), for Pinnacle West. Management conducted an evaluation of the effectiveness of our internal control over financial reporting based on the framework in Internal Control — Integrated Framework (2013) issued by the Committee of Sponsoring Organizations of the Treadway Commission. Based on our evaluation under the framework in Internal Control — Integrated Framework (2013), our management concluded that our internal control over financial reporting was effective as of December 31, 2017. The effectiveness of our internal control over financial reporting as of December 31, 2017 has been audited by Deloitte & Touche LLP, an independent registered public accounting firm, as stated in their report which is included herein and also relates to the Company’s consolidated financial statements. February 23, 2018

84
REPORT OF INDEPENDENT REGISTERED PUBLIC ACCOUNTING FIRM To the Shareholders and the Board of Directors of Pinnacle West Capital CorporationPhoenix, Arizona
Opinions on the Financial Statements and Internal Control over Financial Reporting
We have audited the accompanying consolidated balance sheets of Pinnacle West Capital Corporation and subsidiaries (the "Company") as of December 31, 2017 and 2016, the related consolidated statements of income, comprehensive income, changes in equity, and cash flows for each of the three years in the period ended December 31, 2017, the related notes and the schedules listed in the Index at Item 15 (collectively referred to as the "financial statements"). We also have audited the Company’s internal control over financial reporting as of December 31, 2017, based on criteria established in Internal Control - Integrated Framework (2013) issued by the Committee of Sponsoring Organizations of the Treadway Commission (COSO).
In our opinion, the financial statements referred to above present fairly, in all material respects, the financial position of the Company as of December 31, 2017 and 2016, and the results of its operations and its cash flows for each of the three years in the period ended December 31, 2017, in conformity with accounting principles generally accepted in the United States of America. Also, in our opinion, the Company maintained, in all material respects, effective internal control over financial reporting as of December 31, 2017, based on criteria established in Internal Control - Integrated Framework (2013) issued by COSO.
Basis for Opinions
The Company’s management is responsible for these financial statements, for maintaining effective internal control over financial reporting, and for its assessment of the effectiveness of internal control over financial reporting, included in the accompanying Management’s Report on Internal Control over Financial Reporting. Our responsibility is to express an opinion on these financial statements and an opinion on the Company’s internal control over financial reporting based on our audits. We are a public accounting firm registered with the Public Company Accounting Oversight Board (United States) (PCAOB) and are required to be independent with respect to the Company in accordance with the U.S. federal securities laws and the applicable rules and regulations of the Securities and Exchange Commission and the PCAOB. We conducted our audits in accordance with the standards of the PCAOB. Those standards require that we plan and perform the audits to obtain reasonable assurance about whether the financial statements are free of material misstatement, whether due to error or fraud, and whether effective internal control over financial reporting was maintained in all material respects.
Our audits of the financial statements included performing procedures to assess the risks of material misstatement of the financial statements, whether due to error or fraud, and performing procedures to respond to those risks. Such procedures included examining, on a test basis, evidence regarding the amounts and disclosures in the financial statements. Our audits also included evaluating the accounting principles used and significant estimates made by management, as well as evaluating the overall presentation of the financial statements. Our audit of internal control over financial reporting included obtaining an understanding of internal control over financial reporting, assessing the risk that a material weakness exists, and testing and evaluating the design and operating effectiveness of internal control based on the assessed risk. Our audits also included performing such other procedures as we considered necessary in the circumstances. We believe that our audits provide a reasonable basis for our opinions.

85
Definition and Limitations of Internal Control over Financial Reporting
A company’s internal control over financial reporting is a process designed to provide reasonable assurance regarding the reliability of financial reporting and the preparation of financial statements for external purposes in accordance with generally accepted accounting principles. A company’s internal control over financial reporting includes those policies and procedures that (1) pertain to the maintenance of records that, in reasonable detail, accurately and fairly reflect the transactions and dispositions of the assets of the company; (2) provide reasonable assurance that transactions are recorded as necessary to permit preparation of financial statements in accordance with generally accepted accounting principles, and that receipts and expenditures of the company are being made only in accordance with authorizations of management and directors of the company; and (3) provide reasonable assurance regarding prevention or timely detection of unauthorized acquisition, use, or disposition of the company’s assets that could have a material effect on the financial statements. Because of its inherent limitations, internal control over financial reporting may not prevent or detect misstatements. Also, projections of any evaluation of effectiveness to future periods are subject to the risk that controls may become inadequate because of changes in conditions, or that the degree of compliance with the policies or procedures may deteriorate.
Phoenix, ArizonaFebruary 23, 2018
We have served as the Company's auditor since 1932.

86
PINNACLE WEST CAPITAL CORPORATIONCONSOLIDATED STATEMENTS OF INCOME
(dollars and shares in thousands, except per share amounts)
Year Ended December 31,
2017 2016 2015
OPERATING REVENUES $ 3,565,296 $ 3,498,682 $ 3,495,443OPERATING EXPENSES
Fuel and purchased power 981,301 1,075,510 1,101,298Operations and maintenance 924,443 911,319 868,377Depreciation and amortization 534,118 485,829 494,422Taxes other than income taxes 184,347 166,499 171,812Other expenses 6,660 3,541 4,932
Total 2,630,869 2,642,698 2,640,841OPERATING INCOME 934,427 855,984 854,602OTHER INCOME (DEDUCTIONS)
Allowance for equity funds used during construction (Note 1) 47,011 42,140 35,215Other income (Note 17) 4,006 901 621Other expense (Note 17) (21,539) (15,337) (17,823)
Total 29,478 27,704 18,013INTEREST EXPENSE
Interest charges 219,796 205,720 194,964Allowance for borrowed funds used during construction (Note 1) (22,112) (19,970) (16,259)
Total 197,684 185,750 178,705INCOME BEFORE INCOME TAXES 766,221 697,938 693,910INCOME TAXES (Note 4) 258,272 236,411 237,720NET INCOME 507,949 461,527 456,190Less: Net income attributable to noncontrolling interests (Note 18) 19,493 19,493 18,933NET INCOME ATTRIBUTABLE TO COMMON SHAREHOLDERS $ 488,456 $ 442,034 $ 437,257
WEIGHTED-AVERAGE COMMON SHARES OUTSTANDING —BASIC 111,839 111,409 111,026WEIGHTED-AVERAGE COMMON SHARES OUTSTANDING —DILUTED 112,367 112,046 111,552
EARNINGS PER WEIGHTED-AVERAGE COMMON SHAREOUTSTANDING
Net income attributable to common shareholders — basic $ 4.37 $ 3.97 $ 3.94Net income attributable to common shareholders — diluted $ 4.35 $ 3.95 $ 3.92
The accompanying notes are an integral part of the financial statements.

87
PINNACLE WEST CAPITAL CORPORATIONCONSOLIDATED STATEMENTS OF COMPREHENSIVE INCOME
(dollars in thousands)
Year Ended December 31,
2017 2016 2015
NET INCOME $ 507,949 $ 461,527 $ 456,190
OTHER COMPREHENSIVE INCOME (LOSS), NET OF TAX
Derivative instruments:
Net unrealized loss, net of tax benefit (expense) of $24, $(585), and$(342) (Note 16) (35) (538) (957)Reclassification of net realized loss, net of tax benefit of $1,294, $985,and $1,801 (Note 16) 2,225 2,941 4,187
Pension and other postretirement benefits activity, net of tax benefit(expense) of $693, $633, and $(13,302) (Note 7) (3,370) (1,477) 20,163
Total other comprehensive income (loss) (1,180) 926 23,393
COMPREHENSIVE INCOME 506,769 462,453 479,583Less: Comprehensive income attributable to noncontrolling interests 19,493 19,493 18,933
COMPREHENSIVE INCOME ATTRIBUTABLE TO COMMONSHAREHOLDERS $ 487,276 $ 442,960 $ 460,650
The accompanying notes are an integral part of the financial statements.

88
PINNACLE WEST CAPITAL CORPORATIONCONSOLIDATED BALANCE SHEETS
(dollars in thousands)
December 31,
2017 2016
ASSETS
CURRENT ASSETS
Cash and cash equivalents $ 13,892 $ 8,881Customer and other receivables 305,147 250,491Accrued unbilled revenues 112,434 107,949Allowance for doubtful accounts (2,513) (3,037)Materials and supplies (at average cost) 264,012 253,979Fossil fuel (at average cost) 25,258 28,608Income tax receivable (Note 4) — 3,751Assets from risk management activities (Note 16) 1,931 19,694Deferred fuel and purchased power regulatory asset (Note 3) 75,637 12,465Other regulatory assets (Note 3) 172,451 94,410Other current assets 48,039 45,028
Total current assets 1,016,288 822,219INVESTMENTS AND OTHER ASSETS
Assets from risk management activities (Note 16) 51 1Nuclear decommissioning trust (Notes 13 and 19) 871,000 779,586Other assets 84,531 69,063
Total investments and other assets 955,582 848,650PROPERTY, PLANT AND EQUIPMENT (Notes 1, 6 and 9)
Plant in service and held for future use 17,798,061 17,341,888Accumulated depreciation and amortization (6,128,535) (5,970,100)
Net 11,669,526 11,371,788Construction work in progress 1,291,498 1,019,947Palo Verde sale leaseback, net of accumulated depreciation of $241,405 and $237,535(Note 18) 109,645 113,515Intangible assets, net of accumulated amortization of $582,272 and $603,637 257,189 90,022Nuclear fuel, net of accumulated amortization of $144,070 and $147,202 117,408 119,004
Total property, plant and equipment 13,445,266 12,714,276DEFERRED DEBITS
Regulatory assets (Notes 1, 3 and 4) 1,202,302 1,313,428Assets for other postretirement benefits (Note 7) 268,978 166,206Other 130,666 139,474
Total deferred debits 1,601,946 1,619,108TOTAL ASSETS $ 17,019,082 $ 16,004,253
The accompanying notes are an integral part of the financial statements.

89
PINNACLE WEST CAPITAL CORPORATIONCONSOLIDATED BALANCE SHEETS
(dollars in thousands)
December 31,
2017 2016
LIABILITIES AND EQUITY
CURRENT LIABILITIES
Accounts payable $ 256,442 $ 264,631Accrued taxes (Note 4) 148,946 138,964Accrued interest 56,397 52,835Common dividends payable 77,667 72,926Short-term borrowings (Note 5) 95,400 177,200Current maturities of long-term debt (Note 6) 82,000 125,000Customer deposits 70,388 82,520Liabilities from risk management activities (Note 16) 59,252 25,836Liabilities for asset retirements (Note 11) 4,745 9,135Regulatory liabilities (Note 3) 100,086 99,899Other current liabilities 246,529 244,000
Total current liabilities 1,197,852 1,292,946LONG-TERM DEBT LESS CURRENT MATURITIES (Note 6) 4,789,713 4,021,785DEFERRED CREDITS AND OTHER
Deferred income taxes (Note 4) 1,690,805 2,945,232Regulatory liabilities (Notes 1, 3, 4 and 7) 2,452,536 948,916Liabilities for asset retirements (Note 11) 674,784 615,340Liabilities for pension benefits (Note 7) 327,300 509,310Liabilities from risk management activities (Note 16) 37,170 47,238Customer advances 113,996 88,672Coal mine reclamation 231,597 221,910Deferred investment tax credit 205,575 210,162Unrecognized tax benefits (Note 4) 13,115 10,046Other 148,909 156,784
Total deferred credits and other 5,895,787 5,753,610COMMITMENTS AND CONTINGENCIES (SEE NOTES)EQUITY
Common stock, no par value; authorized 150,000,000 shares, 111,816,170 and 111,392,053issued at respective dates 2,614,805 2,596,030Treasury stock at cost; 64,463 shares at end of 2017 and 55,317 shares at end of 2016 (5,624) (4,133)
Total common stock 2,609,181 2,591,897Retained earnings 2,442,511 2,255,547Accumulated other comprehensive loss (Note 20) (45,002) (43,822)Total shareholders’ equity 5,006,690 4,803,622Noncontrolling interests (Note 18) 129,040 132,290
Total equity 5,135,730 4,935,912TOTAL LIABILITIES AND EQUITY $ 17,019,082 $ 16,004,253
The accompanying notes are an integral part of the financial statements.

90
PINNACLE WEST CAPITAL CORPORATIONCONSOLIDATED STATEMENTS OF CASH FLOWS
(dollars in thousands)
Year Ended December 31, 2017 2016 2015CASH FLOWS FROM OPERATING ACTIVITIES Net Income $ 507,949 $ 461,527 $ 456,190Adjustments to reconcile net income to net cash provided by operatingactivities:
Depreciation and amortization including nuclear fuel 610,629 565,011 571,664Deferred fuel and purchased power (48,405) (60,303) 14,997Deferred fuel and purchased power amortization (14,767) 38,152 1,617Allowance for equity funds used during construction (47,011) (42,140) (35,215)Deferred income taxes 248,164 206,870 236,819Deferred investment tax credit (4,587) 23,082 8,473Change in derivative instruments fair value (373) (403) (381)Stock compensation 20,502 18,883 18,756Changes in current assets and liabilities:
Customer and other receivables (93,797) (2,489) (22,219)Accrued unbilled revenues (4,485) (11,709) 4,293Materials, supplies and fossil fuel (6,683) (1,491) (23,945)Income tax receivable 3,751 (3,162) 2,509Other current assets (10,580) (23,324) 3,145Accounts payable (23,769) (66,917) (34,266)Accrued taxes 9,982 447 (2,013)Other current liabilities 19,154 29,594 603
Change in margin and collateral accounts — assets (300) 673 (324)Change in margin and collateral accounts — liabilities (533) 17,735 22,776Change in unrecognized tax benefits 5,891 1,628 (10,328)Change in long-term regulatory liabilities 45,764 14,682 (20,535)Change in other long-term assets (68,480) (60,163) 2,426Change in other long-term liabilities (29,980) (82,793) (100,715)Net cash flow provided by operating activities 1,118,036 1,023,390 1,094,327
CASH FLOWS FROM INVESTING ACTIVITIES Capital expenditures (1,408,774) (1,275,472) (1,076,087)Contributions in aid of construction 23,708 64,296 46,546Allowance for borrowed funds used during construction (22,112) (19,970) (16,259)Proceeds from nuclear decommissioning trust sales 542,246 633,410 478,813Investment in nuclear decommissioning trust (544,527) (635,691) (496,062)Other (19,078) (18,651) (3,184)
Net cash flow used for investing activities (1,428,537) (1,252,078) (1,066,233)CASH FLOWS FROM FINANCING ACTIVITIES Issuance of long-term debt 848,239 693,151 842,415Repayment of long-term debt (125,000) (370,430) (415,570)Short-term borrowings and (repayments) — net (107,800) 137,200 (147,400)Short-term debt borrowings under revolving credit facility 58,000 40,000 —Short-term debt repayments under revolving credit facility (32,000) — —Dividends paid on common stock (289,793) (274,229) (260,027)Common stock equity issuance and purchases - net (13,390) (4,867) 19,373Distributions to noncontrolling interests (22,744) (22,744) (35,002)Other — — 1
Net cash flow provided by financing activities 315,512 198,081 3,790NET INCREASE (DECREASE) IN CASH AND CASH EQUIVALENTS 5,011 (30,607) 31,884CASH AND CASH EQUIVALENTS AT BEGINNING OF YEAR 8,881 39,488 7,604CASH AND CASH EQUIVALENTS AT END OF YEAR $ 13,892 $ 8,881 $ 39,488
The accompanying notes are an integral part of the financial statements.

91
PINNACLE WEST CAPITAL CORPORATIONCONSOLIDATED STATEMENTS OF CHANGES IN EQUITY
(dollars in thousands, except per share amounts)
Common Stock Treasury StockRetainedEarnings
AccumulatedOther
ComprehensiveIncome (Loss)
NoncontrollingInterests Total
Shares Amount Shares Amount
Balance, December 31, 2014 110,649,762 $2,512,970 (78,400) $ (3,401) $1,926,065 $ (68,141) $ 151,609 $ 4,519,102
Net income — — 437,257 — 18,933 456,190
Other comprehensive income — — — 23,393 — 23,393Dividends on common stock($2.44 per share) — — (270,519) — — (270,519)
Issuance of common stock 445,640 28,698 — — — — 28,698
Purchase of treasury stock (a) — (154,751) (10,136) — — — (10,136)
Reissuance of treasury stockfor stock-basedcompensation and other — 118,121 7,731 — — — 7,731
Net capital activities bynoncontrolling interests — — — — (35,002) (35,002)
Balance, December 31, 2015 111,095,402 2,541,668 (115,030) (5,806) 2,092,803 (44,748) 135,540 4,719,457
Net income — — 442,034 — 19,493 461,527
Other comprehensive income — — — 926 — 926
Dividends on common stock($2.56 per share) — — (284,765) — — (284,765)
Issuance of common stock 296,651 13,982 — — — — 13,982
Purchase of treasury stock (a) — (128,105) (9,087) — — — (9,087)
Reissuance of treasury stockfor stock-basedcompensation and other — 187,818 10,760 — — — 10,760
Stock compensationcumulative effectadjustments (See Note 15) 40,380 — 5,475 — — 45,855
Net capital activities bynoncontrolling interests — — — — (22,743) (22,743)
Balance, December 31, 2016 111,392,053 2,596,030 (55,317) (4,133) 2,255,547 (43,822) 132,290 4,935,912
Net income — — 488,456 — 19,493 507,949
Other comprehensive loss — — — (1,180) — (1,180)Dividends on common stock($2.70 per share) — — (301,492) — — (301,492)
Issuance of common stock 424,117 18,775 — — — — 18,775
Purchase of treasury stock (a) — (216,911) (17,755) — — — (17,755)
Reissuance of treasury stockfor stock-basedcompensation and other — 207,765 16,264 — — — 16,264
Net capital activities bynoncontrolling interests — — — — (22,743) (22,743)
Balance, December 31, 2017 111,816,170 $2,614,805 (64,463) $ (5,624) $2,442,511 $ (45,002) $ 129,040 $ 5,135,730
(a) Primarily represents shares of common stock withheld from certain stock awards for tax purposes.
The accompanying notes are an integral part of the financial statements.

(This page intentionally left blank)

92
MANAGEMENT’S REPORT ON INTERNAL CONTROLOVER FINANCIAL REPORTING
(ARIZONA PUBLIC SERVICE COMPANY)
Our management is responsible for establishing and maintaining adequate internal control over
financial reporting, as such term is defined in Exchange Act Rules 13a-15(f), for APS. Management conducted an evaluation of the effectiveness of our internal control over financial reporting based on the framework in Internal Control — Integrated Framework (2013) issued by the Committee of Sponsoring Organizations of the Treadway Commission. Based on our evaluation under the framework in Internal Control — Integrated Framework (2013), our management concluded that our internal control over financial reporting was effective as of December 31, 2017. The effectiveness of our internal control over financial reporting as of December 31, 2017 has been audited by Deloitte & Touche LLP, an independent registered public accounting firm, as stated in their report which is included herein and also relates to the Company’s financial statements. February 23, 2018

93
REPORT OF INDEPENDENT REGISTERED PUBLIC ACCOUNTING FIRM To the Shareholders and the Board of Directors of Arizona Public Service CompanyPhoenix, Arizona
Opinions on the Financial Statements and Internal Control over Financial Reporting
We have audited the accompanying consolidated balance sheets of Arizona Public Service Company and subsidiary (the "Company") as of December 31, 2017 and 2016, the related consolidated statements of income, comprehensive income, changes in equity, and cash flows for each of the three years in the period ended December 31, 2017, the related notes and the schedule listed in the Index at Item 15 (collectively referred to as the "financial statements"). We also have audited the Company’s internal control over financial reporting as of December 31, 2017, based on criteria established in Internal Control - Integrated Framework (2013) issued by the Committee of Sponsoring Organizations of the Treadway Commission (COSO).
In our opinion, the financial statements referred to above present fairly, in all material respects, the financial position of the Company as of December 31, 2017 and 2016, and the results of its operations and its cash flows for each of the three years in the period ended December 31, 2017, in conformity with accounting principles generally accepted in the United States of America. Also, in our opinion, the Company maintained, in all material respects, effective internal control over financial reporting as of December 31, 2017, based on criteria established in Internal Control - Integrated Framework (2013) issued by COSO.
Basis for Opinions
The Company’s management is responsible for these financial statements, for maintaining effective internal control over financial reporting, and for its assessment of the effectiveness of internal control over financial reporting, included in the accompanying Management’s Report on Internal Control over Financial Reporting. Our responsibility is to express an opinion on these financial statements and an opinion on the Company’s internal control over financial reporting based on our audits. We are a public accounting firm registered with the Public Company Accounting Oversight Board (United States) (PCAOB) and are required to be independent with respect to the Company in accordance with the U.S. federal securities laws and the applicable rules and regulations of the Securities and Exchange Commission and the PCAOB. We conducted our audits in accordance with the standards of the PCAOB. Those standards require that we plan and perform the audits to obtain reasonable assurance about whether the financial statements are free of material misstatement, whether due to error or fraud, and whether effective internal control over financial reporting was maintained in all material respects.
Our audits of the financial statements included performing procedures to assess the risks of material misstatement of the financial statements, whether due to error or fraud, and performing procedures to respond to those risks. Such procedures included examining, on a test basis, evidence regarding the amounts and disclosures in the financial statements. Our audits also included evaluating the accounting principles used and significant estimates made by management, as well as evaluating the overall presentation of the financial statements. Our audit of internal control over financial reporting included obtaining an understanding of internal control over financial reporting, assessing the risk that a material weakness exists, and testing and evaluating the design and operating effectiveness of internal control based on the assessed risk. Our audits also included performing such other procedures as we considered necessary in the circumstances. We believe that our audits provide a reasonable basis for our opinions.
94
Definition and Limitations of Internal Control over Financial Reporting
A company’s internal control over financial reporting is a process designed to provide reasonable assurance regarding the reliability of financial reporting and the preparation of financial statements for external purposes in accordance with generally accepted accounting principles. A company’s internal control over financial reporting includes those policies and procedures that (1) pertain to the maintenance of records that, in reasonable detail, accurately and fairly reflect the transactions and dispositions of the assets of the company; (2) provide reasonable assurance that transactions are recorded as necessary to permit preparation of financial statements in accordance with generally accepted accounting principles, and that receipts and expenditures of the company are being made only in accordance with authorizations of management and directors of the company; and (3) provide reasonable assurance regarding prevention or timely detection of unauthorized acquisition, use, or disposition of the company’s assets that could have a material effect on the financial statements. Because of its inherent limitations, internal control over financial reporting may not prevent or detect misstatements. Also, projections of any evaluation of effectiveness to future periods are subject to the risk that controls may become inadequate because of changes in conditions, or that the degree of compliance with the policies or procedures may deteriorate.
Phoenix, ArizonaFebruary 23, 2018
We have served as the Company's auditor since 1932.

95
ARIZONA PUBLIC SERVICE COMPANYCONSOLIDATED STATEMENTS OF INCOME
(dollars in thousands)
Year Ended December 31,
2017 2016 2015
ELECTRIC OPERATING REVENUES $ 3,554,139 $ 3,489,754 $ 3,492,357
OPERATING EXPENSES
Fuel and purchased power 992,744 1,082,625 1,101,298Operations and maintenance 891,129 879,108 853,135Depreciation and amortization 532,423 484,909 494,298Income taxes (Note 4) 275,295 259,353 260,143Taxes other than income taxes 182,979 165,779 171,499
Total 2,874,570 2,871,774 2,880,373OPERATING INCOME 679,569 617,980 611,984
OTHER INCOME (DEDUCTIONS)
Income taxes (Note 4) 6,127 13,511 14,302Allowance for equity funds used during construction (Note 1) 47,011 42,140 35,215Other income (Note 17) 6,526 8,607 2,834Other expense (Note 17) (23,380) (17,514) (19,019)
Total 36,284 46,744 33,332
INTEREST EXPENSE
Interest on long-term debt 200,211 189,828 180,123Interest on short-term borrowings 9,119 7,983 7,376Debt discount, premium and expense 4,833 4,760 4,793Allowance for borrowed funds used during construction (Note 1) (22,112) (19,481) (16,183)
Total 192,051 183,090 176,109
NET INCOME 523,802 481,634 469,207
Less: Net income attributable to noncontrolling interests (Note 18) 19,493 19,493 18,933
NET INCOME ATTRIBUTABLE TO COMMON SHAREHOLDER $ 504,309 $ 462,141 $ 450,274
The accompanying notes are an integral part of the financial statements.

96
ARIZONA PUBLIC SERVICE COMPANYCONSOLIDATED STATEMENTS OF COMPREHENSIVE INCOME
(dollars in thousands)
Year Ended December 31,
2017 2016 2015
NET INCOME $ 523,802 $ 481,634 $ 469,207
OTHER COMPREHENSIVE INCOME (LOSS), NET OF TAX
Derivative instruments:
Net unrealized loss, net of tax benefit (expense) of $24, $(585), and$(342) (Note 16) (35) (538) (957)Reclassification of net realized loss, net of tax benefit of $1,294, $985,and $1,801 (Note 16) 2,225 2,941 4,187
Pension and other postretirement benefits activity, net of tax benefit(expense) of $977, $293, and $(11,776) (Note 7) (3,750) (729) 18,006
Total other comprehensive income (loss) (1,560) 1,674 21,236
COMPREHENSIVE INCOME 522,242 483,308 490,443Less: Comprehensive income attributable to noncontrolling interests 19,493 19,493 18,933
COMPREHENSIVE INCOME ATTRIBUTABLE TO COMMONSHAREHOLDER $ 502,749 $ 463,815 $ 471,510
The accompanying notes are an integral part of the financial statements.

97
ARIZONA PUBLIC SERVICE COMPANYCONSOLIDATED BALANCE SHEETS
(dollars in thousands)
December 31,
2017 2016
ASSETS
PROPERTY, PLANT AND EQUIPMENT (Notes 1, 6 and 9)
Plant in service and held for future use $ 17,654,078 $ 17,228,787Accumulated depreciation and amortization (6,041,965) (5,881,941)
Net 11,612,113 11,346,846Construction work in progress 1,266,636 989,497Palo Verde sale leaseback, net of accumulated depreciation of $241,405 and $237,535(Note 18) 109,645 113,515Intangible assets, net of accumulated amortization of $581,135 and $603,637 257,028 89,868Nuclear fuel, net of accumulated amortization of $144,070 and $147,202 117,408 119,004
Total property, plant and equipment 13,362,830 12,658,730INVESTMENTS AND OTHER ASSETS
Nuclear decommissioning trust (Notes 13 and 19) 871,000 779,586Assets from risk management activities (Note 16) 51 1Other assets 67,103 48,320
Total investments and other assets 938,154 827,907CURRENT ASSETS
Cash and cash equivalents 13,851 8,840Customer and other receivables 292,791 262,611Accrued unbilled revenues 112,434 107,949Allowance for doubtful accounts (2,513) (3,037)Materials and supplies (at average cost) 262,630 252,777Fossil fuel (at average cost) 25,258 28,608Income tax receivable — 11,174Assets from risk management activities (Note 16) 1,931 19,694Deferred fuel and purchased power regulatory asset (Note 3) 75,637 12,465Other regulatory assets (Note 3) 172,451 94,410Other current assets 41,055 41,849
Total current assets 995,525 837,340DEFERRED DEBITS
Regulatory assets (Notes 1, 3, and 4) 1,202,302 1,313,428Assets for other postretirement benefits (Note 7) 265,139 162,911Other 129,801 130,859
Total deferred debits 1,597,242 1,607,198TOTAL ASSETS $ 16,893,751 $ 15,931,175
The accompanying notes are an integral part of the financial statements.

98
ARIZONA PUBLIC SERVICE COMPANYCONSOLIDATED BALANCE SHEETS
(dollars in thousands)
December 31,
2017 2016
LIABILITIES AND EQUITY
CAPITALIZATION
Common stock $ 178,162 $ 178,162Additional paid-in capital 2,571,696 2,421,696Retained earnings 2,533,954 2,331,245Accumulated other comprehensive loss (Note 20) (26,983) (25,423)Total shareholder equity 5,256,829 4,905,680Noncontrolling interests (Note 18) 129,040 132,290
Total equity 5,385,869 5,037,970Long-term debt less current maturities (Note 6) 4,491,292 4,021,785
Total capitalization 9,877,161 9,059,755CURRENT LIABILITIES
Short-term borrowings (Note 5) — 135,500Current maturities of long-term debt (Note 6) 82,000 —Accounts payable 247,852 259,161Accrued taxes (Note 4) 157,349 130,576Accrued interest 55,533 52,525Common dividends payable 77,700 72,900Customer deposits 70,388 82,520Liabilities from risk management activities (Note 16) 59,252 25,836Liabilities for asset retirements (Note 11) 4,192 8,703Regulatory liabilities (Note 3) 100,086 99,899Other current liabilities 243,922 226,417
Total current liabilities 1,098,274 1,094,037DEFERRED CREDITS AND OTHER
Deferred income taxes (Note 4) 1,742,485 2,999,295Regulatory liabilities (Notes 1, 3, and 4) 2,452,536 948,916Liabilities for asset retirements (Note 11) 666,527 607,234Liabilities for pension benefits (Note 7) 306,542 488,253Liabilities from risk management activities (Note 16) 37,170 47,238Customer advances 113,996 88,672Coal mine reclamation 215,830 206,645Deferred investment tax credit 205,575 210,162Unrecognized tax benefits (Note 4) 43,876 37,408Other 133,779 143,560
Total deferred credits and other 5,918,316 5,777,383COMMITMENTS AND CONTINGENCIES (SEE NOTES)TOTAL LIABILITIES AND EQUITY $ 16,893,751 $ 15,931,175
The accompanying notes are an integral part of the financial statements.

99
ARIZONA PUBLIC SERVICE COMPANYCONSOLIDATED STATEMENTS OF CASH FLOWS
(dollars in thousands)
Year Ended December 31,2017 2016 2015
CASH FLOWS FROM OPERATING ACTIVITIESNet income $ 523,802 $ 481,634 $ 469,207Adjustments to reconcile net income to net cash provided by operating activities:
Depreciation and amortization including nuclear fuel 608,935 564,091 571,540Deferred fuel and purchased power (48,405) (60,303) 14,997Deferred fuel and purchased power amortization (14,767) 38,152 1,617Allowance for equity funds used during construction (47,011) (42,140) (35,215)Deferred income taxes 249,465 221,167 223,069Deferred investment tax credit (4,587) 23,082 8,473Change in derivative instruments fair value (373) (403) (381)Changes in current assets and liabilities:
Customer and other receivables (68,040) (1,601) (21,040)Accrued unbilled revenues (4,485) (11,709) 4,293Materials, supplies and fossil fuel (6,503) (1,454) (23,945)Income tax receivable 11,174 (14,567) —Other current assets (6,775) (21,640) 4,498Accounts payable (26,561) (67,543) (34,891)Accrued taxes 26,773 (13,912) 13,378Other current liabilities 27,912 5,097 (3,718)
Change in margin and collateral accounts — assets (300) 673 (324)Change in margin and collateral accounts — liabilities (533) 17,735 22,776Change in long-term regulatory liabilities 45,764 14,682 (20,535)Change in unrecognized tax benefits 5,891 1,628 (10,328)Change in other long-term assets (78,540) (45,866) (813)Change in other long-term liabilities (31,106) (76,855) (82,628)
Net cash flow provided by operating activities 1,161,730 1,009,948 1,100,030CASH FLOWS FROM INVESTING ACTIVITIES
Capital expenditures (1,381,930) (1,248,010) (1,072,053)Contributions in aid of construction 23,708 64,296 46,546Allowance for borrowed funds used during construction (22,112) (19,481) (16,183)Proceeds from nuclear decommissioning trust sales 542,246 633,410 478,813Investment in nuclear decommissioning trust (544,527) (635,691) (496,062)Other (18,538) (13,865) (1,093)
Net cash flow used for investing activities (1,401,153) (1,219,341) (1,060,032)CASH FLOWS FROM FINANCING ACTIVITIES
Issuance of long-term debt 549,478 693,151 842,415Repayment of long-term debt — (370,430) (415,570)Short-term borrowings and (repayments) — net (135,500) 135,500 (147,400)Dividends paid on common stock (296,800) (281,300) (266,900)Equity infusion from Pinnacle West 150,000 42,000 —Noncontrolling interests (22,744) (22,744) (35,002)
Net cash flow provided by (used for) financing activities 244,434 196,177 (22,457)NET INCREASE (DECREASE) IN CASH AND CASH EQUIVALENTS 5,011 (13,216) 17,541CASH AND CASH EQUIVALENTS AT BEGINNING OF YEAR 8,840 22,056 4,515CASH AND CASH EQUIVALENTS AT END OF YEAR $ 13,851 $ 8,840 $ 22,056Supplemental disclosure of cash flow information:
Cash paid (received) during the year for:Income taxes, net of refunds $ (14,098) $ 26,864 $ 14,831Interest, net of amounts capitalized 184,210 181,809 167,670
Significant non-cash investing and financing activities:Accrued capital expenditures $ 130,057 $ 114,874 $ 83,798Dividends declared but not paid 77,700 72,900 69,400
The accompanying notes are an integral part of the financial statements.

100
ARIZONA PUBLIC SERVICE COMPANYCONSOLIDATED STATEMENTS OF CHANGES IN EQUITY
(dollars in thousands)
Common Stock
AdditionalPaid-InCapital
RetainedEarnings
AccumulatedOther
ComprehensiveIncome (Loss)
NoncontrollingInterests Total
Shares Amount
Balance, December 31, 2014 71,264,947 $ 178,162 $ 2,379,696 $1,968,718 $ (48,333) $ 151,609 $ 4,629,852
Net income — — 450,274 — 18,933 469,207Other comprehensive income — — — 21,236 — 21,236Dividends on common stock — — (270,500) — — (270,500)Other — — 1 — — 1Net capital activities bynoncontrolling interests — — — — (35,002) (35,002)
Balance, December 31, 2015 71,264,947 178,162 2,379,696 2,148,493 (27,097) 135,540 4,814,794
Equity infusion from PinnacleWest — 42,000 — — — 42,000Net income — — 462,141 — 19,493 481,634Other comprehensive income — — — 1,674 — 1,674Dividends on common stock — — (284,800) — — (284,800)Other — — — — — —Stock compensation cumulativeeffect adjustments (See Note 15) — — 5,411 — — 5,411Net capital activities bynoncontrolling interests — — — — (22,743) (22,743)
Balance, December 31, 2016 71,264,947 178,162 2,421,696 2,331,245 (25,423) 132,290 5,037,970
Equity infusion from PinnacleWest — 150,000 — — — 150,000Net income — — 504,309 — 19,493 523,802Other comprehensive loss — — — (1,560) — (1,560)Dividends on common stock — — (301,600) — — (301,600)Net capital activities bynoncontrolling interests — — — — (22,743) (22,743)
Balance, December 31, 2017 71,264,947 $ 178,162 $ 2,571,696 $2,533,954 $ (26,983) $ 129,040 $ 5,385,869
The accompanying notes are an integral part of the financial statements.

COMBINED NOTES TO CONSOLIDATED FINANCIAL STATEMENTS
101
1. Summary of Significant Accounting Policies
Description of Business and Basis of Presentation
Pinnacle West is a holding company that conducts business through its subsidiaries, APS, El Dorado, BCE and 4CA. APS, our wholly-owned subsidiary, is a vertically-integrated electric utility that provides either retail or wholesale electric service to substantially all of the state of Arizona, with the major exceptions of about one-half of the Phoenix metropolitan area, the Tucson metropolitan area and Mohave County in northwestern Arizona. APS accounts for essentially all of our revenues and earnings, and is expected to continue to do so. El Dorado is an investment firm. BCE is a subsidiary that was formed in 2014 that focuses on growth opportunities that leverage the Company's core expertise in the electric energy industry. BCE is currently pursuing transmission opportunities through a joint venture arrangement. 4CA is a subsidiary that was formed in 2016 as a result of the purchase of El Paso's 7% interest in Four Corners.
Pinnacle West’s Consolidated Financial Statements include the accounts of Pinnacle West and our
subsidiaries: APS, El Dorado, BCE and 4CA. APS’s consolidated financial statements include the accounts of APS and certain VIEs relating to the Palo Verde sale leaseback. Intercompany accounts and transactions between the consolidated companies have been eliminated.
We consolidate VIEs for which we are the primary beneficiary. We determine whether we are the
primary beneficiary of a VIE through a qualitative analysis that identifies which variable interest holder has the controlling financial interest in the VIE. In performing our primary beneficiary analysis, we consider all relevant facts and circumstances, including the design and activities of the VIE, the terms of the contracts the VIE has entered into, and which parties participated significantly in the design or redesign of the entity. We continually evaluate our primary beneficiary conclusions to determine if changes have occurred which would impact our primary beneficiary assessments. We have determined that APS is the primary beneficiary of certain VIE lessor trusts relating to the Palo Verde sale leaseback, and therefore APS consolidates these entities (see Note 18).
Our consolidated financial statements reflect all adjustments (consisting only of normal recurring
adjustments, except as otherwise disclosed in the notes) that we believe are necessary for the fair presentation of our financial position, results of operations and cash flows for the periods presented.
Certain line items are presented in a more condensed form on the Consolidated Balance Sheets than in the prior year. The prior year amounts were reclassified to conform to the current year presentation. These reclassifications have no impact on accumulated other comprehensive loss. The following tables show the impacts of the reclassifications of the prior year (previously reported) amounts (dollars in thousands):
Pinnacle West Capital Corporation Consolidated Balance Sheets- December 31, 2016
As previouslyreported
Reclassifications toconform to current
yearpresentation
Amount reported afterreclassification to
conform to current yearpresentation
Accumulated other comprehensive loss:Pension and other postretirement benefits $ (39,070) $ 39,070 $ —Derivative instruments (4,752) 4,752 —Total accumulated other comprehensive loss (43,822) 43,822 —Accumulated other comprehensive loss — (43,822) (43,822)

COMBINED NOTES TO CONSOLIDATED FINANCIAL STATEMENTS
102
Arizona Public Service Company Consolidated Balance Sheets - December 31, 2016
As previouslyreported
Reclassifications toconform to current
yearpresentation
Amount reported afterreclassification to
conform to current yearpresentation
Accumulated other comprehensive loss:Pension and other postretirement benefits $ (20,671) $ 20,671 $ —Derivative instruments (4,752) 4,752 —Total accumulated other comprehensive loss (25,423) 25,423 —Accumulated other comprehensive loss — (25,423) (25,423)
Accounting Records and Use of Estimates
Our accounting records are maintained in accordance with generally accepted in the United States of America ("GAAP"). The preparation of financial statements in accordance with GAAP requires management to make estimates and assumptions that affect the reported amounts of assets and liabilities, disclosure of contingent assets and liabilities at the date of the financial statements and reported amounts of revenues and expenses during the reporting period. Actual results could differ from those estimates.
Regulatory Accounting
APS is regulated by the ACC and FERC. The accompanying financial statements reflect the rate-making policies of these commissions. As a result, we capitalize certain costs that would be included as expense in the current period by unregulated companies. Regulatory assets represent incurred costs that have been deferred because they are probable of future recovery in customer rates. Regulatory liabilities generally represent amounts collected in rates to recover costs expected to be incurred in the future or amounts collected in excess of costs incurred and are refundable to customers.
Management continually assesses whether our regulatory assets are probable of future recovery by considering factors such as changes in the applicable regulatory environment and recent rate orders applicable to APS or other regulated entities in the same jurisdiction. This determination reflects the current political and regulatory climate in Arizona and is subject to change in the future. If future recovery of costs ceases to be probable, the assets would be written off as a charge in current period earnings.
See Note 3 for additional information.
Electric Revenues
We derive electric revenues primarily from sales of electricity to our regulated Native Load customers. Revenues related to the sale of electricity are generally recorded when service is rendered or electricity is delivered to customers. The billing of electricity sales to individual Native Load customers is based on the reading of their meters, which occurs on a systematic basis throughout the month. Unbilled revenues are estimated by applying an average revenue/kWh by customer class to the number of estimated kWhs delivered but not billed. Differences historically between the actual and estimated unbilled revenues are immaterial. We exclude sales taxes and franchise fees on electric revenues from both revenue and taxes other than income taxes.
Revenues from our Native Load customers and non-derivative instruments are reported on a gross
basis on Pinnacle West’s Consolidated Statements of Income. In the electricity business, some contracts to purchase energy are netted against other contracts to sell energy. This is called a “book-out” and usually

COMBINED NOTES TO CONSOLIDATED FINANCIAL STATEMENTS
103
occurs for contracts that have the same terms (quantities and delivery points) and for which power does not flow. We net these book-outs, which reduces both revenues and fuel and purchased power costs.
Some of our cost recovery mechanisms are alternative revenue programs. For alternative revenue
programs that meet specified accounting criteria, we recognize revenues when the specific events permitting billing of the additional revenues have been completed.
Allowance for Doubtful Accounts
The allowance for doubtful accounts represents our best estimate of existing accounts receivable that will ultimately be uncollectible. The allowance is calculated by applying estimated write-off factors to various classes of outstanding receivables, including accrued utility revenues. The write-off factors used to estimate uncollectible accounts are based upon consideration of both historical collections experience and management’s best estimate of future collections success given the existing collections environment. Property, Plant and Equipment
Utility plant is the term we use to describe the business property and equipment that supports electric service, consisting primarily of generation, transmission and distribution facilities. We report utility plant at its original cost, which includes:
• material and labor;• contractor costs;• capitalized leases;• construction overhead costs (where applicable); and• allowance for funds used during construction.
Pinnacle West’s property, plant and equipment included in the December 31, 2017 and 2016 Consolidated Balance Sheets is composed of the following (dollars in thousands):
Property, Plant and Equipment: 2017 2016Generation $ 7,963,998 $ 7,874,898Transmission 2,836,578 2,746,508Distribution 6,025,856 5,738,801General plant 971,629 981,681
Plant in service and held for future use 17,798,061 17,341,888Accumulated depreciation and amortization (6,128,535) (5,970,100)
Net 11,669,526 11,371,788Construction work in progress 1,291,498 1,019,947Palo Verde sale leaseback, net of accumulated depreciation 109,645 113,515Intangible assets, net of accumulated amortization 257,189 90,022Nuclear fuel, net of accumulated amortization 117,408 119,004Total property, plant and equipment $ 13,445,266 $ 12,714,276
Property, plant and equipment balances and classes for APS are not materially different than Pinnacle West.

COMBINED NOTES TO CONSOLIDATED FINANCIAL STATEMENTS
104
We expense the costs of plant outages, major maintenance and routine maintenance as incurred. We charge retired utility plant to accumulated depreciation. Liabilities associated with the retirement of tangible long-lived assets are recognized at fair value as incurred and capitalized as part of the related tangible long-lived assets. Accretion of the liability due to the passage of time is an operating expense, and the capitalized cost is depreciated over the useful life of the long-lived asset. See Note 11.
APS records a regulatory liability for the difference between the amount that has been recovered in
regulated rates and the amount calculated in accordance with guidance on accounting for asset retirement obligations. APS believes it can recover in regulated rates the costs calculated in accordance with this accounting guidance.
We record depreciation and amortization on utility plant on a straight-line basis over the remaining useful life of the related assets. The approximate remaining average useful lives of our utility property at December 31, 2017 were as follows:
• Fossil plant — 21 years;• Nuclear plant — 26 years;• Other generation — 25 years;• Transmission — 38 years;• Distribution — 33 years; and• General plant — 6 years. Depreciation of utility property, plant and equipment is computed on a straight-line, remaining-life
basis. Depreciation expense was $453 million in 2017, $422 million in 2016, and $430 million in 2015. For the years 2015 through 2017, the depreciation rates ranged from a low of 0.18% to a high of 16.44%. The weighted-average depreciation rate was 2.80% in 2017, 2.66% in 2016, and 2.74% in 2015.
Asset Retirement Obligations
APS has asset retirement obligations for its Palo Verde nuclear facilities and certain other generation assets. The Palo Verde asset retirement obligation primarily relates to final plant decommissioning. This obligation is based on the NRC’s requirements for disposal of radiated property or plant and agreements APS reached with the ACC for final decommissioning of the plant. The non-nuclear generation asset retirement obligations primarily relate to requirements for removing portions of those plants at the end of the plant life or lease term and coal ash pond closures. Some of APS’s transmission and distribution assets have asset retirement obligations because they are subject to right of way and easement agreements that require final removal. These agreements have a history of uninterrupted renewal that APS expects to continue. As a result, APS cannot reasonably estimate the fair value of the asset retirement obligation related to such transmission and distribution assets. Additionally, APS has aquifer protection permits for some of its generation sites that require the closure of certain facilities at those sites.
See Note 11 for further information on Asset Retirement Obligations.
Allowance for Funds Used During Construction
AFUDC represents the approximate net composite interest cost of borrowed funds and an allowed return on the equity funds used for construction of regulated utility plant. Both the debt and equity components of AFUDC are non-cash amounts within the Consolidated Statements of Income. Plant

COMBINED NOTES TO CONSOLIDATED FINANCIAL STATEMENTS
105
construction costs, including AFUDC, are recovered in authorized rates through depreciation when completed projects are placed into commercial operation.
AFUDC was calculated by using a composite rate of 6.68% for 2017, 7.17% for 2016, and 8.02% for 2015. APS compounds AFUDC semi-annually and ceases to accrue AFUDC when construction work is completed and the property is placed in service.
Materials and Supplies
APS values materials, supplies and fossil fuel inventory using a weighted-average cost method. APS materials, supplies and fossil fuel inventories are carried at the lower of weighted-average cost or market, unless evidence indicates that the weighted-average cost (even if in excess of market) will be recovered. Fair Value Measurements
We account for derivative instruments, investments held in our nuclear decommissioning trust, coal reclamation escrow accounts, certain cash equivalents and plan assets held in our retirement and other benefit plans at fair value on a recurring basis. Due to the short-term nature of net accounts receivable, accounts payable, and short-term borrowings, the carrying values of these instruments approximate fair value. Fair value measurements may also be applied on a nonrecurring basis to other assets and liabilities in certain circumstances such as impairments. We also disclose fair value information for our long-term debt, which is carried at amortized cost (see Note 6).
Fair value is the price that would be received for an asset or paid to transfer a liability (exit price) in the
principal or most advantageous market which we can access for the asset or liability in an orderly transaction between willing market participants on the measurement date. Inputs to fair value may include observable and unobservable data. We maximize the use of observable inputs and minimize the use of unobservable inputs when measuring fair value.
We determine fair market value using observable inputs such as actively-quoted prices for identical
instruments when available. When actively-quoted prices are not available for the identical instruments, we use other observable inputs, such as prices for similar instruments, other corroborative market information, or prices provided by other external sources. For options, long-term contracts and other contracts for which observable price data are not available, we use models and other valuation methods, which may incorporate unobservable inputs to determine fair market value.
The use of models and other valuation methods to determine fair market value often requires subjective
and complex judgment. Actual results could differ from the results estimated through application of these methods.
See Note 13 for additional information about fair value measurements.

COMBINED NOTES TO CONSOLIDATED FINANCIAL STATEMENTS
106
Derivative Accounting
We are exposed to the impact of market fluctuations in the commodity price and transportation costs of electricity, natural gas, coal and in interest rates. We manage risks associated with market volatility by utilizing various physical and financial instruments including futures, forwards, options and swaps. As part of our overall risk management program, we may use derivative instruments to hedge purchases and sales of electricity and fuels. The changes in market value of such contracts have a high correlation to price changes in the hedged transactions. We also enter into derivative instruments for economic hedging purposes. Contracts that have the same terms (quantities, delivery points and delivery periods) and for which power does not flow are netted, which reduces both revenues and fuel and purchased power expenses in our Consolidated Statements of Income, but does not impact our financial condition, net income or cash flows.
We account for our derivative contracts in accordance with derivatives and hedging guidance, which
requires all derivatives not qualifying for a scope exception to be measured at fair value on the balance sheet as either assets or liabilities. Transactions with counterparties that have master netting arrangements are reported net on the balance sheet. See Note 16 for additional information about our derivative instruments.
Loss Contingencies and Environmental Liabilities
Pinnacle West and APS are involved in certain legal and environmental matters that arise in the normal course of business. Contingent losses and environmental liabilities are recorded when it is determined that it is probable that a loss has occurred and the amount of the loss can be reasonably estimated. When a range of the probable loss exists and no amount within the range is a better estimate than any other amount, Pinnacle West and APS record a loss contingency at the minimum amount in the range. Unless otherwise required by GAAP, legal fees are expensed as incurred.
Retirement Plans and Other Postretirement Benefits
Pinnacle West sponsors a qualified defined benefit and account balance pension plan for the employees of Pinnacle West and its subsidiaries. We also sponsor an other postretirement benefit plan for the employees of Pinnacle West and its subsidiaries that provides medical and life insurance benefits to retired employees. Pension and other postretirement benefit expense are determined by actuarial valuations, based on assumptions that are evaluated annually. See Note 7 for additional information on pension and other postretirement benefits.
Nuclear Fuel
APS amortizes nuclear fuel by using the unit-of-production method. The unit-of-production method is based on actual physical usage. APS divides the cost of the fuel by the estimated number of thermal units it expects to produce with that fuel. APS then multiplies that rate by the number of thermal units produced within the current period. This calculation determines the current period nuclear fuel expense.
APS also charges nuclear fuel expense for the interim storage and permanent disposal of spent nuclear fuel. The DOE is responsible for the permanent disposal of spent nuclear fuel and charged APS $0.001 per kWh of nuclear generation through May 2014, at which point the DOE reduced the fee to zero. In accordance with a settlement agreement with the DOE in August 2014, we will now accrue a receivable for incurred claims and an offsetting regulatory liability through the settlement period ending December of 2019. See Note 10 for information on spent nuclear fuel disposal costs.

COMBINED NOTES TO CONSOLIDATED FINANCIAL STATEMENTS
107
Income Taxes
Income taxes are provided using the asset and liability approach prescribed by guidance relating to accounting for income taxes and are based on currently enacted tax rates. We file our federal income tax return on a consolidated basis, and we file our state income tax returns on a consolidated or unitary basis. In accordance with our intercompany tax sharing agreement, federal and state income taxes are allocated to each first-tier subsidiary as though each first-tier subsidiary filed a separate income tax return. Any difference between that method and the consolidated (and unitary) income tax liability is attributed to the parent company. The income tax accounts reflect the tax and interest associated with management’s estimate of the largest amount of tax benefit that is greater than 50% likely of being realized upon settlement for all known and measurable tax exposures (see Note 4).
Cash and Cash Equivalents
We consider all highly liquid investments with a remaining maturity of three months or less at acquisition to be cash equivalents.
The following table summarizes supplemental Pinnacle West cash flow information for each of the last three years (dollars in thousands):
Year ended December 31,
2017 2016 2015Cash paid during the period for:
Income taxes, net of refunds $ 2,186 $ 9,956 $ 6,550Interest, net of amounts capitalized 189,288 184,462 170,209
Significant non-cash investing and financing activities:
Accrued capital expenditures $ 130,404 $ 114,855 $ 83,798Dividends declared but not paid 77,667 72,926 69,363
Intangible Assets
We have no goodwill recorded and have separately disclosed other intangible assets, primarily APS's software, on Pinnacle West’s Consolidated Balance Sheets. The intangible assets are amortized over their finite useful lives. Amortization expense was $72 million in 2017, $58 million in 2016, and $58 million in 2015. Estimated amortization expense on existing intangible assets over the next five years is $53 million in 2018, $38 million in 2019, $28 million in 2020, $22 million in 2021, and $17 million in 2022. At December 31, 2017, the weighted-average remaining amortization period for intangible assets was 6 years.
Investments
El Dorado holds investments in both debt and equity securities. Investments in debt securities are generally accounted for as held-to-maturity and investments in equity securities are accounted for using either the equity method (if significant influence) or the cost method (if less than 20% ownership and no significant influence).
Our investments in the nuclear decommissioning trust fund, and coal reclamation escrow, are
accounted for in accordance with guidance on accounting for certain investments in debt and equity securities. See Note 13 and Note 19 for more information on these investments.

COMBINED NOTES TO CONSOLIDATED FINANCIAL STATEMENTS
108
See Note 2 for new accounting guidance relating to financial instruments including investments in equity securities, effective for us in 2018.
Business Segments
Pinnacle West’s reportable business segment is our regulated electricity segment, which consists of traditional regulated retail and wholesale electricity businesses (primarily electricity service to Native Load customers) and related activities and includes electricity generation, transmission and distribution. All other segment activities are insignificant.
Preferred Stock
At December 31, 2017, Pinnacle West had 10 million shares of serial preferred stock authorized with no par value, none of which was outstanding, and APS had 15,535,000 shares of various types of preferred stock authorized with $25, $50 and $100 par values, none of which was outstanding.
2. New Accounting Standards ASU 2014-09, Revenue from Contracts with Customers
In May 2014, a new revenue recognition accounting standard was issued. This standard provides a single comprehensive model for entities to use in accounting for revenue arising from contracts with customers and supersedes most current revenue recognition guidance. Since the issuance of the new revenue standard, additional guidance was issued to clarify certain aspects of the new revenue standard, including principal versus agent considerations, identifying performance obligations, and other narrow scope improvements. The new revenue standard, and related amendments, became effective for us on January 1, 2018. The standard may be adopted using a full retrospective application or a simplified transition method that allows entities to record a cumulative effect adjustment in retained earnings at the date of initial application.
We adopted this standard on January 1, 2018 using the modified retrospective transition approach. The adoption of this standard will not have significant impact on our financial statement results. Our revenues are derived primarily from sales of electricity to our regulated retail customers, and based on our assessment the adoption of this guidance does not generally impact the timing of our revenue recognition relating to these customers. The adoption of the new standard will result in expanded revenue related disclosures.
ASU 2016-01, Financial Instruments: Recognition and Measurement
In January 2016, a new accounting standard was issued relating to the recognition and measurement of financial instruments. The new guidance will require certain investments in equity securities to be measured at fair value with changes in fair value recognized in net income, and modifies the impairment assessment of certain equity securities. The new standard became effective for us on January 1, 2018. Certain aspects of the standard require a cumulative effect adjustment and other aspects of the standard are required to be adopted prospectively. We adopted this standard on a prospective basis on January 1, 2018. The adoption of this standard will not have a significant impact on our financial statement results, as we did not have significant equity investments impacted by this standard.

COMBINED NOTES TO CONSOLIDATED FINANCIAL STATEMENTS
109
ASU 2016-02, Leases
In February 2016, a new lease accounting standard was issued. This new standard supersedes the existing lease accounting model, and modifies both lessee and lessor accounting. The new standard will require a lessee to reflect most operating lease arrangements on the balance sheet by recording a right-of-use asset and a lease liability that will initially be measured at the present value of lease payments. Among other changes, the new standard also modifies the definition of a lease, and requires expanded lease disclosures. In January 2018, additional lease guidance was issued specifically relating to land easements and how entities may elect to account for these arrangements at transition. The new standard, and related amendments, will be effective for us on January 1, 2019, with early application permitted. The standard must be adopted using a modified retrospective approach, with various optional practical expedients provided to facilitate transition.
We plan on adopting this standard, and related amendments, on January 1, 2019, and are evaluating the transition practical expedients we may elect. Our evaluation of this new accounting standard and the impacts it will have on our financial statements is on-going. We expect the adoption of the new guidance will impact our Consolidated Balance Sheets as we will be required to reflect lease assets and lease liabilities relating to certain operating lease arrangements. We are currently evaluating the significance of the expected balance sheet impacts, and the impacts, if any, the lease guidance will have on our other financial statements. Our evaluation includes assessing leasing activities, implementing new processes and procedures, and preparing the expanded lease disclosures.
ASU 2016-13, Financial Instruments: Measurement of Credit Losses
In June 2016, a new accounting standard was issued that amends the measurement of credit losses on certain financial instruments. The new standard will require entities to use a current expected credit loss model to measure impairment of certain investments in debt securities, trade accounts receivables, and other financial instruments. The new standard is effective for us on January 1, 2020 and must be adopted using a modified retrospective approach for certain aspects of the standard, and a prospective approach for other aspects of the standard. We are currently evaluating this new accounting standard and the impacts it may have on our financial statements.

COMBINED NOTES TO CONSOLIDATED FINANCIAL STATEMENTS
110
ASU 2016-15, Statement of Cash Flows: Classification of Certain Cash Receipts and Cash Payments
In August 2016, a new accounting standard was issued that clarifies how entities should present certain specific cash flow activities on the statement of cash flows. The guidance is intended to eliminate diversity in practice in how entities classify these specific activities between cash flows from operating activities, investing activities and financing activities. The specific activities addressed include debt prepayments and extinguishment costs, proceeds from the settlement of insurance claims, proceeds from corporate owned life insurance policies, and other activities. The standard also addresses how entities should apply the predominance principle when a transaction includes separately identifiable cash flows. The new standard is effective for us, and will be adopted, during the first quarter of 2018 using a retrospective transition method. The adoption of this guidance will not have a significant impact on our financial statements, as either our statement of cash flow presentation is consistent with the new prescribed guidance or we do not have significant activities relating to the specific transactions that are addressed by the new standard.
ASU 2016-18, Statement of Cash Flows: Restricted Cash
In November 2016, a new accounting standard was issued that clarifies how restricted cash and restricted cash equivalents should be presented on the statement of cash flows. The new guidance requires entities to include restricted cash and restricted cash equivalents as a component of the beginning and ending cash and cash equivalent balances on the statement of cash flows. The new standard is effective for us, and will be adopted, during the first quarter of 2018 using a retrospective transition method. We do not expect the adoption of this guidance will impact our financial statements, as our holdings and activities designated as restricted cash and restricted cash equivalents are generally insignificant.
ASU 2017-01, Business Combinations: Clarifying the Definition of a Business
In January 2017, a new accounting standard was issued that clarifies the definition of a business. This standard is intended to assist entities with evaluating whether a transaction should be accounted for as an acquisition (or disposal) of assets or a business. The definition of a business affects many areas of accounting including acquisitions, disposals, goodwill, and consolidation. The new standard became effective for us on January 1, 2018 using a prospective approach. We adopted this new standard on January 1, 2018, using a prospective approach with no impacts on our financial statements on the date of adoption.
ASU 2017-05, Other Income: Clarifying the Scope of Asset Derecognition Guidance and Accounting for Partial Sales of Nonfinancial Assets
In February 2017, a new accounting standard was issued that intended to clarify the scope of accounting guidance pertaining to gains and losses from the derecognition of nonfinancial assets, and to add guidance for partial sales of nonfinancial assets. The new standard became effective for us on January 1, 2018. The guidance may be applied using either a retrospective or modified retrospective transition approach. We adopted this standard on January 1, 2018 using a modified retrospective transition approach. The adoption of this guidance did not have a significant impact on our financial statement results.

COMBINED NOTES TO CONSOLIDATED FINANCIAL STATEMENTS
111
ASU 2017-07, Compensation-Retirement Benefits: Improving the Presentation of Net Periodic Pension Cost and Net Periodic Postretirement Benefit Cost
In March 2017, a new accounting standard was issued that modifies how plan sponsors present net periodic pension cost and net periodic postretirement benefit cost (net benefit costs). The presentation changes will require net benefit costs to be disaggregated on the income statement by the various components that comprise these costs. Specifically, only the service cost component will be eligible for presentation as an operating income item, and all other cost components will be presented as non-operating items. This presentation change must be applied retrospectively. Furthermore, the new standard only allows the service cost component to be eligible for capitalization. The change in capitalization requirements must be applied prospectively. The new guidance became effective for us on January 1, 2018.
We adopted this new accounting standard on January 1, 2018. Beginning in the first quarter of 2018, we will present the non-service cost components of net benefit costs in other income instead of operating income. Prior year non-service cost components will also be reclassified from operating income to other income. Upon adoption, we will no longer capitalize a portion of the non-service cost components of net benefit costs. In 2018, because the non-service cost components are a reduction to total benefit costs, we estimate this change will result in the capitalization of an additional $15 million of net benefit costs, with a corresponding increase to pretax income. See note 7 for additional information related to our pension plans and other postretirement benefits. ASU 2017-12, Derivatives and Hedging: Targeted Improvements to Accounting for Hedging Activities
In August 2017, a new accounting standard was issued that modifies hedge accounting guidance with the intent of simplifying the application of hedge accounting. The new standard is effective for us on January 1, 2019, with early application permitted. At transition, the guidance requires the changes to be applied to hedging relationships existing on the date of adoption, with the effect of adoption reflected as of the beginning of the fiscal year of adoption using a cumulative effect adjustment approach. The presentation and disclosure changes may be applied prospectively. We are evaluating the new guidance, but at this time we do not expect the adoption of this guidance will have a significant impact on our financial statement results as we are currently not applying hedge accounting.
ASU 2018-02, Income Statement-Reporting Comprehensive Income: Reclassification of Certain Tax Effects from Accumulated Other Comprehensive Income
In February 2018, new accounting guidance was issued that allows entities an optional election to reclassify the income tax effects of the 2017 Tax Cuts and Jobs Act legislation on items within accumulated other comprehensive income to retained earnings. Amounts eligible for reclassification must relate to the effects from the Tax Cuts and Jobs Act remaining in accumulated other comprehensive income. The new guidance also requires expanded disclosures. This guidance is effective for us on January 1, 2019 with early application permitted. The guidance should be applied either in the period of adoption or retrospectively to each period in which the effect of the Tax Cuts and Jobs Act was recognized. We are currently evaluating this new guidance to determine whether we will elect this reclassification adjustment. The adoption of this guidance will not impact our income from continuing operations. See Note 4 for additional discussion of the Tax Cuts and Jobs Act.

COMBINED NOTES TO CONSOLIDATED FINANCIAL STATEMENTS
112
3. Regulatory Matters Retail Rate Case Filing with the Arizona Corporation Commission
On June 1, 2016, APS filed an application with the ACC for an annual increase in retail base rates of $165.9 million. This amount excluded amounts that were then collected on customer bills through adjustor mechanisms. The application requested that some of the balances in these adjustor accounts (aggregating to approximately $267.6 million as of December 31, 2015) be transferred into base rates through the ratemaking process. This transfer would not have had an incremental effect on average customer bills. The average annual customer bill impact of APS’s request was an increase of 5.74% (the average annual bill impact for a typical APS residential customer was 7.96%).
On March 27, 2017, a majority of the stakeholders in the general retail rate case, including the ACC Staff, the Residential Utility Consumer Office, limited income advocates and private rooftop solar organizations signed a settlement agreement (the "2017 Settlement Agreement") and filed it with the ACC. The 2017 Settlement Agreement provides for a net retail base rate increase of $94.6 million, excluding the transfer of adjustor balances, consisting of: (1) a non-fuel, non-depreciation, base rate increase of $87.2 million per year; (2) a base rate decrease of $53.6 million attributable to reduced fuel and purchased power costs; and (3) a base rate increase of $61.0 million due to changes in depreciation schedules. The average annual customer bill impact under the 2017 Settlement Agreement is an increase of 3.28% (the average annual bill impact for a typical APS residential customer is 4.54%).
Other key provisions of the agreement include the following:
• an agreement by APS not to file another general retail rate case application before June 1, 2019;• an authorized return on common equity of 10.0%;• a capital structure comprised of 44.2% debt and 55.8% common equity;• a cost deferral order for potential future recovery in APS’s next general retail rate case for the
construction and operating costs APS incurs for its Ocotillo modernization project; • a cost deferral and procedure to allow APS to request rate adjustments prior to its next general retail
rate case related to its share of the construction costs associated with installing selective catalytic reduction ("SCR") equipment at Four Corners;
• a deferral for future recovery (or credit to customers) of the Arizona property tax expense above or below a specified test year level caused by changes to the applicable Arizona property tax rate;
• an expansion of the PSA to include certain environmental chemical costs and third-party battery storage costs;
• a new AZ Sun II program (now known as APS Solar Communities) for utility-owned solar distributed generation ("DG") with the purpose of expanding access to rooftop solar for low and moderate income Arizonans, recoverable through the RES, to be no less than $10 million per year, and not more than $15 million per year;
• an increase to the per kWh cap for the environmental improvement surcharge from $0.00016 to $0.00050 and the addition of a balancing account;
• rate design changes, including: a change in the on-peak time of use period from noon - 7 p.m. to 3 p.m. - 8 p.m. Monday
through Friday, excluding holidays; non-grandfathered DG customers would be required to select a rate option that has time
of use rates and either a new grid access charge or demand component; a Resource Comparison Proxy (“RCP”) for exported energy of 12.9 cents per kWh in year
one; and

COMBINED NOTES TO CONSOLIDATED FINANCIAL STATEMENTS
113
• an agreement by APS not to pursue any new self-build generation (with certain exceptions) having an in-service date prior to January 1, 2022 (extended to December 31, 2027 for combined-cycle generating units), unless expressly authorized by the ACC.
Through a separate agreement, APS, industry representatives, and solar advocates committed to stand by the 2017 Settlement Agreement and refrain from seeking to undermine it through ballot initiatives, legislation or advocacy at the ACC.
On August 15, 2017, the ACC approved (by a vote of 4-1), the 2017 Settlement Agreement without material modifications. On August 18, 2017, the ACC issued a final written Opinion and Order reflecting its decision in APS’s general retail rate case (the "2017 Rate Case Decision"), which is subject to requests for rehearing and potential appeal. The new rates went into effect on August 19, 2017. On August 20, 2017, Commissioner Burns filed a special action petition in the Arizona Supreme Court seeking to vacate the ACC's order approving the 2017 Settlement Agreement so that alleged issues of disqualification and bias on the part of the other Commissioners can be fully investigated. APS opposed the petition, and on October 17, 2017, the Arizona Supreme Court declined to accept jurisdiction over Commissioner Burns’ special action petition.
On October 17, 2017, Warren Woodward (an intervener in APS's general retail rate case) filed a Notice of Appeal in the Arizona Court of Appeals, Division One. The notice raises a single issue related to the application of certain rate schedules to new APS residential customers after May 1, 2018. Mr. Woodward filed a second notice of appeal on November 13, 2017 challenging APS’s $5 per month automated metering infrastructure opt-out program. Mr. Woodward’s two appeals have been consolidated and APS has filed a motion to intervene. APS cannot predict the outcome of this consolidated appeal but does not believe it will have a material impact.
On January 3, 2018, an APS customer filed a petition with the ACC that was determined by the ACC Staff to be a complaint filed pursuant to Arizona Revised Statute §40-246 (the “Complaint”) and not a request for rehearing. Arizona Revised Statute §40-246 requires the ACC to hold a hearing regarding any complaint alleging that a public service corporation is in violation of any commission order or that the rates being charged are not just and reasonable if the complaint is signed by at least twenty-five customers of the public service corporation. The Complaint alleged that APS is “in violation of commission order” [sic]. On February 13, 2018, the complainant filed an amended Complaint alleging that the rates and charges in the 2017 Rate Case Decision are not just and reasonable. The complainant is requesting that the ACC hold a hearing on her amended Complaint to determine if the average bill impact on residential customers of the rates and charges approved in the 2017 Rate Case Decision is greater than 4.54% (the average annual bill impact for a typical APS residential customer estimated by APS), and if so, what effect the alleged greater bill impact has on APS's revenues and the overall reasonableness and justness of APS's rates and charges, in order to determine if there is sufficient evidence to warrant a full-scale rate hearing. APS cannot predict the outcome of this matter.
Prior Rate Case Filing with the Arizona Corporation Commission
On June 1, 2011, APS filed an application with the ACC for a net retail base rate increase of $95.5 million. On January 6, 2012, APS and other parties to the general retail rate case entered into the 2012 Settlement Agreement (the "2012 Settlement Agreement") detailing the terms upon which the parties agreed to settle the rate case. On May 15, 2012, the ACC approved the 2012 Settlement Agreement without material modifications.

COMBINED NOTES TO CONSOLIDATED FINANCIAL STATEMENTS
114
Cost Recovery Mechanisms
APS has received regulatory decisions that allow for more timely recovery of certain costs outside of a general retail rate case through the following recovery mechanisms.
Renewable Energy Standard. In 2006, the ACC approved the RES. Under the RES, electric utilities
that are regulated by the ACC must supply an increasing percentage of their retail electric energy sales from eligible renewable resources, including solar, wind, biomass, biogas and geothermal technologies. In order to achieve these requirements, the ACC allows APS to include a RES surcharge as part of customer bills to recover the approved amounts for use on renewable energy projects. Each year APS is required to file a 5-year implementation plan with the ACC and seek approval for funding the upcoming year’s RES budget.
In 2013, the ACC conducted a hearing to consider APS’s proposal to establish compliance with distributed energy requirements by tracking and recording distributed energy, rather than acquiring and retiring renewable energy credits. On February 6, 2014, the ACC established a proceeding to modify the renewable energy rules to establish a process for compliance with the renewable energy requirement that is not based solely on the use of renewable energy credits. On September 9, 2014, the ACC authorized a rulemaking process to modify the RES rules. The proposed changes would permit the ACC to find that utilities have complied with the distributed energy requirement in light of all available information. The ACC adopted these changes on December 18, 2014. The revised rules went into effect on April 21, 2015.
In December 2014, the ACC voted that it had no objection to APS implementing an APS-owned rooftop solar research and development program aimed at learning how to efficiently enable the integration of rooftop solar and battery storage with the grid. The first stage of the program, called the "Solar Partner Program," placed 8 MW of residential rooftop solar on strategically selected distribution feeders in an effort to maximize potential system benefits, as well as made systems available to limited-income customers who could not easily install solar through transactions with third parties. The second stage of the program, which included an additional 2 MW of rooftop solar and energy storage, placed two energy storage systems sized at 2 MW on two different high solar penetration feeders to test various grid-related operation improvements and system interoperability, and was in operation by the end of 2016. The costs for this program have been included in APS's rate base as part of the 2017 Rate Case Decision.
On July 1, 2016, APS filed its 2017 RES Implementation Plan and proposed a budget of approximately $150 million. APS’s budget request included additional funding to process the high volume of residential rooftop solar interconnection requests and also requested a permanent waiver of the residential distributed energy requirement for 2017 contained in the RES rules. On April 7, 2017, APS filed an amended 2017 RES Implementation Plan and updated budget request which included the revenue neutral transfer of specific revenue requirements into base rates in accordance with the 2017 Settlement Agreement. On August 15, 2017, the ACC approved the 2017 RES Implementation Plan.
On June 30, 2017, APS filed its 2018 RES Implementation Plan and proposed a budget of approximately $90 million. APS’s budget request supports existing approved projects and commitments and includes the anticipated transfer of specific revenue requirements into base rates in accordance with the 2017 Settlement Agreement and also requests a permanent waiver of the residential distributed energy requirement for 2018 contained in the RES rules. APS's 2018 RES budget request is lower than the 2017 RES budget due in part to a certain portion of the RES being collected by APS in base rates rather than through the RES adjustor.

COMBINED NOTES TO CONSOLIDATED FINANCIAL STATEMENTS
115
On November 20, 2017, APS filed an updated 2018 RES budget to include budget adjustments for APS Solar Communities (formerly known as AZ Sun II), which was approved as part of the 2017 Rate Case Decision. APS Solar Communities is a 3-year program requiring APS to spend $10-$15 million in capital costs each year to install utility-owned DG systems for low to moderate income residential homes, buildings of non-profit entities, Title I schools and rural government facilities. The 2017 Rate Case Decision provided that all operations and maintenance expenses, property taxes, marketing and advertising expenses, and the capital carrying costs for this program will be recovered through the RES. The ACC has not yet ruled on APS's 2018 RES Implementation Plan.
In September 2016, the ACC initiated a proceeding which will examine the possible modernization and expansion of the RES. The ACC noted that many of the provisions of the original rule may no longer be appropriate, and the underlying economic assumptions associated with the rule have changed dramatically. The proceeding will review such issues as the rapidly declining cost of solar generation, an increased interest in community solar projects, energy storage options, and the decline in fossil fuel generation due to stringent regulations of EPA. The proceeding will also examine the feasibility of increasing the standard to 30% of retail sales by 2030, in contrast to the current standard of 15% of retail sales by 2025. On January 30, 2018, ACC Commissioner Tobin proposed a new standard in this proceeding which would broaden the RES to include a series of energy reform policies tied to clean energy sources. The proposal would rename the RES to the Clean Resource Energy Standard and Tariff ("CREST"). APS cannot predict the outcome of this proceeding.
Demand Side Management Adjustor Charge. The ACC Electric Energy Efficiency Standards require APS to submit a Demand Side Management Implementation Plan ("DSM Plan") annually for review by and approval of the ACC. On March 20, 2015, APS filed an application with the ACC requesting a budget of $68.9 million for 2015 and minor modifications to its DSM portfolio going forward, including for the first time three resource savings projects which reflect energy savings on APS's system. The ACC approved APS’s 2015 DSM budget on November 25, 2015. In its decision, the ACC also ruled that verified energy savings from APS's resource savings projects could be counted toward compliance with the Electric Energy Efficiency Standards; however, the ACC ruled that APS was not allowed to count savings from systems savings projects toward determination of the achievement of performance incentives, nor may APS include savings from conservation voltage reduction in the calculation of its LFCR mechanism.
On June 1, 2016, APS filed its 2017 DSM Plan, in which APS proposed programs and measures that specifically focus on reducing peak demand, shifting load to off-peak periods and educating customers about strategies to manage their energy and demand. The requested budget in the 2017 DSM Plan is $62.6 million. On January 27, 2017, APS filed an updated and modified 2017 DSM Plan that incorporated the proposed Residential Demand Response, Energy Storage and Load Management Program and requested that the budget be increased to $66.6 million. On August 15, 2017, the ACC approved the amended 2017 DSM Plan.
On September 1, 2017, APS filed its 2018 DSM Plan, which proposes modifications to the demand side management portfolio to better meet system and customer needs by focusing on peak demand reductions, storage, load shifting and demand response programs in addition to traditional energy savings measures. The 2018 DSM Plan seeks a reduced requested budget of $52.6 million and requests a waiver of the Electric Energy Efficiency Standard for 2018. On November 14, 2017, APS filed an amended 2018 DSM Plan, which revised the allocations between budget items to address customer participation levels, but kept the overall budget at $52.6 million.
Electric Energy Efficiency. On June 27, 2013, the ACC voted to open a new docket investigating whether the Electric Energy Efficiency Standards should be modified. The ACC held a series of three workshops in March and April 2014 to investigate methodologies used to determine cost effective energy

COMBINED NOTES TO CONSOLIDATED FINANCIAL STATEMENTS
116
efficiency programs, cost recovery mechanisms, incentives, and potential changes to the Electric Energy Efficiency and Resource Planning Rules.
On November 4, 2014, the ACC staff issued a request for informal comment on a draft of possible amendments to Arizona’s Electric Energy Efficiency Standards. The draft proposed substantial changes to the rules and energy efficiency standards. The ACC accepted written comments and took public comment regarding the possible amendments on December 19, 2014. On July 12, 2016, the ACC Commissioners ordered that ACC staff convene a workshop within 120 days to discuss a number of issues related to the Electric Energy Efficiency Standards, including the process of determining the cost effectiveness of DSM programs and the treatment of peak demand and capacity reductions, among others. ACC staff convened the workshop on November 29, 2016 and sought public comment on potential revisions to the Electric Energy Efficiency Standards. APS cannot predict the outcome of this proceeding.
Power Supply Adjustor Mechanism and Balance. The PSA provides for the adjustment of retail rates
to reflect variations in retail fuel and purchased power costs. The PSA is subject to specified parameters and procedures, including the following:
• APS records deferrals for recovery or refund to the extent actual retail fuel and purchased power costs vary from the Base Fuel Rate;
• An adjustment to the PSA rate is made annually each February 1 (unless otherwise approved by the ACC) and goes into effect automatically unless suspended by the ACC;
• The PSA uses a forward-looking estimate of fuel and purchased power costs to set the annual PSA rate, which is reconciled to actual costs experienced for each PSA Year (February 1 through January 31) (see the following bullet point);
• The PSA rate includes (a) a “Forward Component,” under which APS recovers or refunds differences between expected fuel and purchased power costs for the upcoming calendar year and those embedded in the Base Fuel Rate; (b) a “Historical Component,” under which differences between actual fuel and purchased power costs and those recovered or refunded through the combination of the Base Fuel Rate and the Forward Component are recovered during the next PSA Year; and (c) a “Transition Component,” under which APS may seek mid-year PSA changes due to large variances between actual fuel and purchased power costs and the combination of the Base Fuel Rate and the Forward Component; and
• The PSA rate may not be increased or decreased more than $0.004 per kWh in a year without permission of the ACC.
The following table shows the changes in the deferred fuel and purchased power regulatory asset (liability) for 2017 and 2016 (dollars in thousands):
Twelve Months Ended
December 31, 2017 2016Beginning balance $ 12,465 $ (9,688)Deferred fuel and purchased power costs — current period 48,405 60,303Amounts refunded/(charged) to customers 14,767 (38,150)Ending balance $ 75,637 $ 12,465

COMBINED NOTES TO CONSOLIDATED FINANCIAL STATEMENTS
117
The PSA rate for the PSA year beginning February 1, 2017 was $(0.001348) per kWh, as compared to
$0.001678 per kWh for the prior year. This rate was comprised of a forward component of $(0.001027) per kWh and a historical component of $(0.000321) per kWh. On August 19, 2017, the PSA rate was revised to $0.000555 per kWh as part of the 2017 Rate Case Decision. This new rate was comprised of a forward component of $0.000876 per kWh and a historical component of $(0.000321) per kWh. On November 30, 2017, APS submitted its calculation for the 2018 PSA year beginning February 1, 2018. The current PSA rate is $.004555 per kWh consisting of a forward component of $.002009 per kWh and a historical component of $.002546 per kWh.
Transmission Rates, Transmission Cost Adjustor and Other Transmission Matters. In July 2008, the
FERC approved an Open Access Transmission Tariff for APS to move from fixed rates to a formula rate-setting methodology in order to more accurately reflect and recover the costs that APS incurs in providing transmission services. A large portion of the rate represents charges for transmission services to serve APS's retail customers ("Retail Transmission Charges"). In order to recover the Retail Transmission Charges, APS was previously required to file an application with, and obtain approval from, the ACC to reflect changes in Retail Transmission Charges through the TCA. Under the terms of the 2012 Settlement Agreement, however, an adjustment to rates to recover the Retail Transmission Charges will be made annually each June 1 and will go into effect automatically unless suspended by the ACC.
The formula rate is updated each year effective June 1 on the basis of APS's actual cost of service, as disclosed in APS's FERC Form 1 report for the previous fiscal year. Items to be updated include actual capital expenditures made as compared with previous projections, transmission revenue credits and other items. The resolution of proposed adjustments can result in significant volatility in the revenues to be collected. APS reviews the proposed formula rate filing amounts with the ACC staff. Any items or adjustments which are not agreed to by APS and the ACC staff can remain in dispute until settled or litigated at FERC. Settlement or litigated resolution of disputed issues could require an extended period of time and could have a significant effect on the Retail Transmission Charges because any adjustment, though applied prospectively, may be calculated to account for previously over- or under-collected amounts.
Effective June 1, 2016, APS's annual wholesale transmission rates for all users of its transmission system increased by approximately $24.9 million for the twelve-month period beginning June 1, 2016 in accordance with the FERC-approved formula. An adjustment to APS’s retail rates to recover FERC approved transmission charges went into effect automatically on June 1, 2016.
Effective June 1, 2017, APS's annual wholesale transmission rates for all users of its transmission system increased by approximately $35.1 million for the twelve-month period beginning June 1, 2017 in accordance with the FERC-approved formula. An adjustment to APS’s retail rates to recover FERC approved transmission charges went into effect automatically on June 1, 2017.
On January 31, 2017, APS made a filing to reduce the Post-Employment Benefits Other than Pension expense reflected in its FERC transmission formula rate calculation to recognize certain savings resulting from plan design changes to the other postretirement benefit plans. A transmission customer intervened and protested certain aspects of APS’s filing. FERC initiated a proceeding under Section 206 of the Federal Power Act to evaluate the justness and reasonableness of the revised formula rate filing APS proposed. APS entered into a settlement agreement with the intervening transmission customer, which was filed with FERC for approval on September 26, 2017. FERC approved the settlement agreement without modification or condition on December 21, 2017.

COMBINED NOTES TO CONSOLIDATED FINANCIAL STATEMENTS
118
Lost Fixed Cost Recovery Mechanism. The LFCR mechanism permits APS to recover on an after-the-fact basis a portion of its fixed costs that would otherwise have been collected by APS in the kWh sales lost due to APS energy efficiency programs and to DG such as rooftop solar arrays. The fixed costs recoverable by the LFCR mechanism were first established in the 2012 Settlement Agreement and amount to approximately 3.1 cents per residential kWh lost and 2.3 cents per non-residential kWh lost. These amounts were revised in the 2017 Settlement Agreement to 2.5 cents for both lost residential and non-residential kWh. The LFCR adjustment has a year-over-year cap of 1% of retail revenues. Any amounts left unrecovered in a particular year because of this cap can be carried over for recovery in a future year. The kWh’s lost from energy efficiency are based on a third-party evaluation of APS’s energy efficiency programs. DG sales losses are determined from the metered output from the DG units.
APS filed its 2016 annual LFCR adjustment on January 15, 2016, requesting an LFCR adjustment of
$46.4 million (a $7.9 million annual increase). The ACC approved the 2016 annual LFCR effective beginning in May 2016. APS filed its 2017 LFCR adjustment on January 13, 2017 requesting an LFCR adjustment of $63.7 million (a $17.3 million per year increase over 2016 levels). On April 5, 2017, the ACC approved the 2017 annual LFCR adjustment as filed, effective with the first billing cycle of April 2017. On February 15, 2018, APS filed its LFCR Adjustment, requesting that effective May 1, 2018, the LFCR be adjusted to $60.7 million (a $3 million per year decrease over 2017 levels). Because the LFCR mechanism has a balancing account that trues up any under or over recoveries, a one or two month delay in implementation does not have an adverse effect on APS.
Tax Expense Adjustor Mechanism and FERC Tax Filing. As part of the 2017 Settlement Agreement, the parties agreed to a rate adjustment mechanism to address potential federal income tax reform and enable the pass-through of certain income tax effects to customers. On December 22, 2017 the Tax Cuts and Jobs Act (“Tax Act”) was enacted. This legislation made significant changes to the federal income tax laws including a reduction in the corporate tax rate from 35% to 21% effective January 1, 2018.
On January 8, 2018, APS filed an application with the ACC requesting that the TEAM be implemented in two steps. The first addresses the change in the marginal federal tax rate from 35% to 21% resulting from the Tax Act and, if approved, would reduce rates by $119.1 million annually through an equal cents per kWh credit. APS asked that this decrease become effective February 1, 2018. On February 22, 2018, the ACC approved the reduction of rates by $119.1 million annually through an equal cents per kWh credit applied to all but a small subset of customers who are taking service under specially-approved tariffs. The rate reduction will be effective March 1, 2018.
The second step will address the amortization of excess deferred taxes previously collected from customers. APS is analyzing the final impact of the Tax Act provisions related to deferred taxes and intends to make a second TEAM filing later in 2018. The TEAM expressly applies to APS's retail rates with the exception noted above. The Company expects to make a filing with FERC in the first quarter of 2018 seeking authorization to provide for the cost reductions resulting from the income tax changes in its wholesale transmission rates.

COMBINED NOTES TO CONSOLIDATED FINANCIAL STATEMENTS
119
Net Metering
In 2015, the ACC voted to conduct a generic evidentiary hearing on the value and cost of DG to gather information that will inform the ACC on net metering issues and cost of service studies in upcoming utility rate cases. A hearing was held in April 2016. On October 7, 2016, the Administrative Law Judge issued a recommendation in the docket concerning the value and cost of DG solar installations. On December 20, 2016, the ACC completed its open meeting to consider the recommended opinion and order by the Administrative Law Judge. After making several amendments, the ACC approved the recommended opinion and order by a 4-1 vote. As a result of the ACC’s action, effective as of APS’s 2017 Rate Case Decision, the current net metering tariff that governs payments for energy exported to the grid from rooftop solar systems was replaced by a more formula-driven approach that utilizes inputs from historical wholesale solar power costs and eventually an avoided cost methodology.
As amended, the decision provides that payments by utilities for energy exported to the grid from DG solar facilities will be determined using a RCP methodology, a method that is based on the price that APS pays for utility-scale solar projects on a five year rolling average, while a forecasted avoided cost methodology is being developed. The price established by this RCP method will be updated annually (between general retail rate cases) but will not be decreased by more than 10% per year. Once the avoided cost methodology is developed, the ACC will determine in APS's subsequent general retail rate cases which method (or a combination of methods) is appropriate to determine the actual price to be paid by APS for exported distributed energy.
In addition, the ACC made the following determinations:
• Customers who have interconnected a DG system or submitted an application for interconnection for DG systems prior to August 19, 2017, the date new rates were effective based on APS's 2017 Rate Case Decision, will be grandfathered for a period of 20 years from the date the customer’s interconnection application was accepted by the utility;
• Customers with DG solar systems are to be considered a separate class of customers for ratemaking purposes; and
• Once an export price is set for APS, no netting or banking of retail credits will be available for new DG customers, and the then-applicable export price will be guaranteed for new customers for a period of 10 years.
This decision of the ACC addresses policy determinations only. The decision states that its principles will be applied in future general retail rate cases, and the policy determinations themselves may be subject to future change, as are all ACC policies. A first-year export energy price of 12.9 cents per kWh is included in the 2017 Settlement Agreement and became effective on August 19, 2017.
On January 23, 2017, The Alliance for Solar Choice ("TASC") sought rehearing of the ACC's decision regarding the value and cost of DG. TASC asserted that the ACC improperly ignored the Administrative Procedure Act, failed to give adequate notice regarding the scope of the proceedings, and relied on information that was not submitted as evidence, among other alleged defects. TASC filed a Notice of Appeal in the Court of Appeals and filed a Complaint and Statutory Appeal in the Maricopa County Superior Court on March 10, 2017. As part of the 2017 Settlement Agreement described above, TASC agreed to withdraw these appeals when the ACC decision implementing the 2017 Settlement Agreement is no longer subject to appellate review.

COMBINED NOTES TO CONSOLIDATED FINANCIAL STATEMENTS
120
System Benefits Charge
The 2012 Settlement Agreement provided that once APS achieved full funding of its decommissioning obligation under the sale leaseback agreements covering Unit 2 of Palo Verde, APS was required to implement a reduced System Benefits charge effective January 1, 2016. Beginning on January 1, 2016, APS began implementing a reduced System Benefits charge. The impact on APS retail revenues from the new System Benefits charge is an overall reduction of approximately $14.6 million per year with a corresponding reduction in depreciation and amortization expense. This adjustment is subsumed within the 2017 Settlement Agreement and its associated revenue requirement.
Subpoena from Arizona Corporation Commissioner Robert Burns
On August 25, 2016, Commissioner Burns, individually and not by action of the ACC as a whole, served subpoenas in APS’s then current retail rate proceeding on APS and Pinnacle West for the production of records and information relating to a range of expenditures from 2011 through 2016. The subpoenas requested information concerning marketing and advertising expenditures, charitable donations, lobbying expenses, contributions to 501(c)(3) and (c)(4) nonprofits and political contributions. The return date for the production of information was set as September 15, 2016. The subpoenas also sought testimony from Company personnel having knowledge of the material, including the Chief Executive Officer.
On September 9, 2016, APS filed with the ACC a motion to quash the subpoenas or, alternatively to stay APS's obligations to comply with the subpoenas and decline to decide APS's motion pending court proceedings. Contemporaneously with the filing of this motion, APS and Pinnacle West filed a complaint for special action and declaratory judgment in the Superior Court of Arizona for Maricopa County, seeking a declaratory judgment that Commissioner Burns’ subpoenas are contrary to law. On September 15, 2016, APS produced all non-confidential and responsive documents and offered to produce any remaining responsive documents that are confidential after an appropriate confidentiality agreement is signed.
On February 7, 2017, Commissioner Burns opened a new ACC docket and indicated that its purpose is to study and rectify problems with transparency and disclosure regarding financial contributions from regulated monopolies or other stakeholders who may appear before the ACC that may directly or indirectly benefit an ACC Commissioner, a candidate for ACC Commissioner, or key ACC staff. As part of this docket, Commissioner Burns set March 24, 2017 as a deadline for the production of all information previously requested through the subpoenas. Neither APS nor Pinnacle West produced the information requested and instead objected to the subpoena. On March 10, 2017, Commissioner Burns filed suit against APS and Pinnacle West in the Superior Court of Arizona for Maricopa County in an effort to enforce his subpoenas. On March 30, 2017, APS filed a motion to dismiss Commissioner Burns' suit against APS and Pinnacle West. In response to the motion to dismiss, the court stayed the suit and ordered Commissioner Burns to file a motion to compel the production of the information sought by the subpoenas with the ACC. On June 20, 2017, the ACC denied the motion to compel. On August 4, 2017, Commissioner Burns amended his complaint to add all of the ACC Commissioners and the ACC itself as defendants. All defendants moved to dismiss the complaint. On February 15, 2018, the Superior Court dismissed Commissioner Burns’ complaint. The matter is subject to appeal. APS and Pinnacle West cannot predict the outcome of this matter.
In addition to the Superior Court proceedings discussed above, on August 20, 2017, Commissioner Burns filed a special action petition in the Arizona Supreme Court seeking to vacate the 2017 Rate Case Decision so that alleged issues of disqualification and bias on the part of the other Commissioners could be fully investigated. APS opposed the petition, and on October 17, 2017, the Arizona Supreme Court declined to accept jurisdiction over Commissioner Burns’ special action petition.

COMBINED NOTES TO CONSOLIDATED FINANCIAL STATEMENTS
121
Renewable Energy Ballot Initiative
On February 20, 2018, a coalition of renewable energy advocates filed with the Arizona Secretary of State a ballot initiative for an Arizona constitutional amendment requiring Arizona public service corporations to procure 50% of their energy supply from renewable sources by 2030. For purposes of the proposed amendment, eligible renewable sources would not include nuclear generating facilities. The stated goal of the Clean Energy for a Healthy Arizona coalition is to complete the necessary steps to allow the initiative to be placed on the November 2018 Arizona elections ballot. The coalition must present over 225,000 verifiable signatures to the Secretary of State by July 5, 2018 to meet that goal. APS intends to oppose this effort. We believe the initiative is irresponsible and would result in negative impacts to Arizona utility customers, the Arizona economy and our company. We cannot predict the outcome of this matter.
Clean Resource Energy Standard and Tariff
On January 30, 2018, ACC Commissioner Tobin proposed the CREST, which consists of a series of energy reform policies tied to clean energy sources such as energy storage, biomass, energy efficiency, electric vehicles, and expanded energy planning through the Integrated Resource Plan process. The ACC has not yet initiated any formal proceedings with respect to Commissioner Tobin’s proposal; however, on February 22, 2018, the ACC Staff filed a Notice of Inquiry to further examine the matter. APS cannot predict the outcome of this matter.
Four Corners SCE-Related Matters. On December 30, 2013, APS purchased SCE’s 48% ownership interest in each of Units 4 and 5 of Four Corners. The 2012 Settlement Agreement includes a procedure to allow APS to request rate adjustments prior to its next general retail rate case related to APS’s acquisition of the additional interests in Units 4 and 5 and the related closure of Units 1-3 of Four Corners. APS made its filing under this provision on December 30, 2013. On December 23, 2014, the ACC approved rate adjustments resulting in a revenue increase of $57.1 million on an annual basis. This included the deferral for future recovery of all non-fuel operating costs for the acquired SCE interest in Four Corners, net of the non-fuel operating costs savings resulting from the closure of Units 1-3 from the date of closing of the purchase through its inclusion in rates. The 2012 Settlement Agreement also provided for deferral for future recovery of all unrecovered costs incurred in connection with the closure of Units 1-3. The deferral balance related to the acquisition of SCE’s interest in Units 4 and 5 and the closure of Units 1-3 was $56 million as of December 31, 2017 and is being amortized in rates over a total of 10 years. The ACC's rate adjustment decision was appealed and on September 26, 2017, the Court of Appeals affirmed the ACC's decision on the Four Corners rate adjustment.
As part of APS’s acquisition of SCE’s interest in Units 4 and 5, APS and SCE agreed, via a
"Transmission Termination Agreement" that, upon closing of the acquisition, the companies would terminate an existing transmission agreement ("Transmission Agreement") between the parties that provides transmission capacity on a system (the "Arizona Transmission System") for SCE to transmit its portion of the output from Four Corners to California. APS previously submitted a request to FERC related to this termination, which resulted in a FERC order denying rate recovery of $40 million that APS agreed to pay SCE associated with the termination. On December 22, 2015, APS and SCE agreed to terminate the Transmission Termination Agreement and allow for the Transmission Agreement to expire according to its terms, which includes settling obligations in accordance with the terms of the Transmission Agreement. APS established a regulatory asset of $12 million in 2015 in connection with the payment required under the terms of the Transmission Agreement. On July 1, 2016, FERC issued an order denying APS’s request to recover the regulatory asset through its FERC-jurisdictional rates. APS and SCE completed the termination of the Transmission Agreement on July 6,

COMBINED NOTES TO CONSOLIDATED FINANCIAL STATEMENTS
122
2016. APS made the required payment to SCE and wrote-off the $12 million regulatory asset and charged operating revenues to reflect the effects of this order in the second quarter of 2016. On July 29, 2016, APS filed a request for rehearing with FERC. In its order denying recovery, FERC also referred to its enforcement division a question of whether the agreement between APS and SCE relating to the settlement of obligations under the Transmission Agreement was a jurisdictional contract that should have been filed with FERC. On October 5, 2017, FERC issued an order denying APS's request for rehearing. FERC also upheld its prior determination that the agreement relating to the settlement was a jurisdictional contract and should have been filed with FERC. APS cannot predict whether or if the enforcement division will take any action. APS filed an appeal of FERC's July 1, 2016 and October 5, 2017 orders with the United States Court of Appeals for the Ninth Circuit on December 4, 2017. That proceeding is pending and APS cannot predict the outcome of the proceeding.
SCR Cost Recovery. On December 29, 2017, in accordance with the 2017 Rate Case Decision, APS filed a Notice of Intent to file its SCR Rate Rider to permit recovery of costs associated with the installation of SCR equipment at Four Corners Units 4 and 5. APS intends to file the SCR Rate Rider in April 2018. Consistent with the 2017 Rate Case Decision, the rate rider filing will be narrow in scope and will address only costs associated with this specific environmental compliance equipment. Also, as provided for in the 2017 Rate Case Decision, APS will request that the rate rider become effective no later than January 1, 2019.
Cholla
On September 11, 2014, APS announced that it would close Unit 2 of Cholla and cease burning coal at the other APS-owned units (Units 1 and 3) at the plant by the mid-2020s, if EPA approves a compromise proposal offered by APS to meet required environmental and emissions standards and rules. On April 14, 2015, the ACC approved APS's plan to retire Unit 2, without expressing any view on the future recoverability of APS's remaining investment in the Unit. APS closed Unit 2 on October 1, 2015. In early 2017, EPA approved a final rule incorporating APS's compromise proposal, which took effect on April 26, 2017.
Previously, APS estimated Cholla Unit 2’s end of life to be 2033. APS has been recovering a return on and of the net book value of the unit in base rates. Pursuant to the 2017 Settlement Agreement described above, APS will be allowed continued recovery of the net book value of the unit and the unit’s decommissioning and other retirement-related costs ($105 million as of December 31, 2017), in addition to a return on its investment. In accordance with GAAP, in the third quarter of 2014, Unit 2’s remaining net book value was reclassified from property, plant and equipment to a regulatory asset. The 2017 Settlement Agreement also shortened the depreciation lives of Cholla Units 1 and 3 to 2026.
Navajo Plant
The co-owners of the Navajo Plant and the Navajo Nation agreed that the Navajo Plant will remain in operation until December 2019 under the existing plant lease. The co-owners and the Navajo Nation executed a lease extension on November 29, 2017 that will allow for decommissioning activities to begin after the plant ceases operations in December 2019. Various stakeholders including regulators, tribal representatives, the plant's coal supplier and the U.S. Department of the Interior have been meeting to determine if an alternate solution can be reached that would permit continued operation of the plant beyond 2019. Although we cannot predict whether any alternate plans will be found that would be acceptable to all of the stakeholders and feasible to implement, we believe it is probable that the Navajo Plant will cease operations in December 2019.
On February 14, 2017, the ACC opened a docket titled "ACC Investigation Concerning the Future of the Navajo Generating Station" with the stated goal of engaging stakeholders and negotiating a sustainable

COMBINED NOTES TO CONSOLIDATED FINANCIAL STATEMENTS
123
pathway for the Navajo Plant to continue operating in some form after December 2019. APS cannot predict the outcome of this proceeding.
APS is currently recovering depreciation and a return on the net book value of its interest in the Navajo Plant over its previously estimated life through 2026. APS will seek continued recovery in rates for the book value of its remaining investment in the plant ($99 million as of December 31, 2017) plus a return on the net book value as well as other costs related to retirement and closure, which are still being assessed and may be material. APS believes it will be allowed recovery of the net book value, in addition to a return on its investment. In accordance with GAAP, in the second quarter of 2017, APS's remaining net book value of its interest in the Navajo Plant was reclassified from property, plant and equipment to a regulatory asset. If the ACC does not allow full recovery of the remaining net book value of this interest, all or a portion of the regulatory asset will be written off and APS's net income, cash flows, and financial position will be negatively impacted.
Regulatory Assets and Liabilities
The detail of regulatory assets is as follows (dollars in thousands):
SDecember 31, 2017 December 31, 2016
AmortizationThrough Current Non-Current Current Non-Current
Pension (a) $ — $ 576,188 $ — $ 711,059Retired power plant costs 2033 27,402 188,843 9,913 117,591Income taxes - AFUDC equity 2047 3,828 142,852 6,305 152,118Deferred fuel and purchased power — mark-to-market (Note 16) 2020 52,100 34,845 — 42,963Four Corners cost deferral 2024 8,077 48,305 6,689 56,894Income taxes — investment tax credit basisadjustment 2046 1,066 26,218 2,120 54,356Lost fixed cost recovery (b) 2018 59,844 — 61,307 —Palo Verde VIEs (Note 18) 2046 — 19,395 — 18,775Deferred compensation 2036 — 36,413 — 35,595Deferred property taxes 2027 8,569 74,926 — 73,200Loss on reacquired debt 2038 1,637 15,305 1,637 16,942AG-1 deferral 2022 2,654 8,472 — 5,868Demand side management (b) 2017 — — 3,744 —Tax expense of Medicare subsidy 2024 1,236 7,415 1,513 10,589Mead-Phoenix transmission line CIAC 2050 332 10,376 332 10,708Deferred fuel and purchased power (b) (c) 2018 75,637 — 12,465 —Coal reclamation 2026 1,068 12,396 418 5,182Other Various 4,638 353 432 1,588
Total regulatory assets (d)
$ 248,088 $ 1,202,302 $ 106,875 $ 1,313,428
(a) This asset represents the future recovery of pension benefit obligations through retail rates. If these costs are disallowed by the ACC, this regulatory asset would be charged to OCI and result in lower future revenues. See Note 7 for further discussion.
(b) See “Cost Recovery Mechanisms” discussion above.(c) Subject to a carrying charge.

COMBINED NOTES TO CONSOLIDATED FINANCIAL STATEMENTS
124
(d) There are no regulatory assets for which the ACC has allowed recovery of costs, but not allowed a return by exclusion from rate base. FERC rates are set using a formula rate as described in “Transmission Rates, Transmission Cost Adjustor and Other Transmission Matters.”
The detail of regulatory liabilities is as follows (dollars in thousands):
December 31, 2017 December 31, 2016
AmortizationThrough Current Non-Current Current Non-Current
Excess deferred income taxes - Tax Cuts andJobs Act (a) $ — $ 1,520,274 $ — $ —Asset retirement obligations 2057 — 332,171 — 279,976Removal costs (b) 18,238 209,191 29,899 223,145Other post retirement benefits (d) 37,642 151,985 32,662 123,913Income taxes - deferred investment tax credit 2046 2,164 52,497 4,368 108,827Income taxes - change in rates 2046 2,573 70,537 1,771 70,898Spent nuclear fuel 2027 6,924 62,132 — 71,726Renewable energy standard (c) 2018 23,155 — 26,809 —Demand side management (c) 2019 3,066 4,921 — 20,472Sundance maintenance 2030 — 16,897 — 15,287Deferred gains on utility property 2022 4,423 10,988 2,063 8,895Four Corners coal reclamation 2038 1,858 18,921 — 18,248Other Various 43 2,022 2,327 7,529
Total regulatory liabilities
$ 100,086 $ 2,452,536 $ 99,899 $ 948,916
(a) See Note 4. While the majority of the excess deferred tax balance shown is subject to special amortization rules under federal income tax laws, which require amortization of the balance over the remaining regulatory life of the related property, treatment of a portion of the liability, and the month in which pass-through of the excess deferred tax balance will begin is subject to regulatory approval. This approval will be sought through the Company's TEAM adjustor mechanism and FERC filings in 2018. As a result, the Company cannot estimate the amount of this regulatory liability which is expected to reverse within the next 12 months.
(b) In accordance with regulatory accounting guidance, APS accrues for removal costs for its regulated assets, even if there is no legal obligation for removal (see Note 11).
(c) See “Cost Recovery Mechanisms” discussion above.(d) See Note 7.
4. Income Taxes
Certain assets and liabilities are reported differently for income tax purposes than they are for financial statement purposes. The tax effect of these differences is recorded as deferred taxes. We calculate deferred taxes using currently enacted income tax rates.
APS has recorded regulatory assets and regulatory liabilities related to income taxes on its Balance Sheets in accordance with accounting guidance for regulated operations. The regulatory assets are for certain temporary differences, primarily the allowance for equity funds used during construction, investment tax credit (“ITC”) basis adjustment and tax expense of Medicare subsidy. The regulatory liabilities primarily relate to the change in income tax rates and deferred taxes resulting from ITCs.

COMBINED NOTES TO CONSOLIDATED FINANCIAL STATEMENTS
125
On December 22, 2017, the Tax Cuts and Jobs Act ("Tax Act") was enacted. This legislation made significant changes to the federal income tax laws including a reduction in the corporate tax rate to 21% effective January 1, 2018. In accordance with generally accepted accounting principles, the effects of this corporate tax rate reduction were recognized for the year ending December 31, 2017. As a result of this rate reduction, the Company has recognized a $1.14 billion reduction in its net deferred income tax liabilities as of December 31, 2017.
In accordance with accounting for regulated companies, the effect of this rate reduction is substantially offset by a regulatory liability. As of December 31, 2017, to reflect the $1.14 billion reduction in its net deferred income tax liabilities caused by the rate reduction, APS has recorded a regulatory liability of $1.52 billion and a new $377 million deferred tax asset. The company intends to amortize the regulatory liability in accordance with applicable federal income tax laws, which require the amortization of a majority of the balance over the remaining regulatory life of the related property, and in a manner to be approved by its federal and state regulatory agencies. See Note 3 for more details.
Additionally, as a result of the corporate tax rate reduction, the Company recorded income tax expense of $9.3 million, for the year ended December 31, 2017, to recognize the effect of certain reductions in deferred tax assets, for which the Company did not believe recovery was probable through its revenue requirement.
Several sections of the Tax Cuts and Jobs Act contain technical ambiguities. These ambiguities include certain transition rules regarding the applicability of bonus depreciation to property acquired, or under construction, prior to September 28, 2017 and the continued deductibility of certain executive compensation arrangements in place prior to November 3, 2017. Management has recognized tax positions which it believes are more likely than not to be sustained upon examination based upon its interpretation of this legislation. Clarifying guidance may be issued through additional legislation, Treasury regulations, or other technical guidance, within the next 12 months which may impact the income tax effects of the Tax Act as recorded by the Company. As of December 31, 2017, the Company does not have a reasonable estimate of what the income tax effects of such clarifying guidance may be, if any.
In accordance with regulatory requirements, APS ITCs are deferred and are amortized over the life of the related property with such amortization applied as a credit to reduce current income tax expense in the statement of income.
Net income associated with the Palo Verde sale leaseback VIEs is not subject to tax (see Note 18). As
a result, there is no income tax expense associated with the VIEs recorded on the Pinnacle West Consolidated and APS Consolidated Statements of Income.
The following is a tabular reconciliation of the total amounts of unrecognized tax benefits, excluding interest and penalties, at the beginning and end of the year that are included in accrued taxes and unrecognized tax benefits (dollars in thousands):

COMBINED NOTES TO CONSOLIDATED FINANCIAL STATEMENTS
126
Pinnacle West Consolidated APS Consolidated
2017 2016 2015 2017 2016 2015
Total unrecognized tax benefits, January 1 $ 36,075 $ 34,447 $ 44,775 $ 36,075 $ 34,447 $ 44,775Additions for tax positions of the current year 2,937 2,695 2,175 2,937 2,695 2,175Additions for tax positions of prior years 4,783 886 — 4,783 886 —Reductions for tax positions of prior years for:
Changes in judgment (1,829) (1,953) (10,244) (1,829) (1,953) (10,244)Settlements with taxing authorities — — — — — —Lapses of applicable statute of limitations — — (2,259) — — (2,259)
Total unrecognized tax benefits, December 31 $ 41,966 $ 36,075 $ 34,447 $ 41,966 $ 36,075 $ 34,447
Included in the balances of unrecognized tax benefits are the following tax positions that, if recognized, would decrease our effective tax rate (dollars in thousands):
Pinnacle West Consolidated APS Consolidated
2017 2016 2015 2017 2016 2015
Tax positions, that if recognized, woulddecrease our effective tax rate $ 16,373 $ 11,313 $ 9,523 $ 16,373 $ 11,313 $ 9,523
As of the balance sheet date, the tax year ended December 31, 2014 and all subsequent tax years
remain subject to examination by the IRS. With a few exceptions, we are no longer subject to state income tax examinations by tax authorities for years before 2013.
We reflect interest and penalties, if any, on unrecognized tax benefits in the Pinnacle West
Consolidated and APS Consolidated Statements of Income as income tax expense. The amount of interest expense or benefit recognized related to unrecognized tax benefits are as follows (dollars in thousands):
Pinnacle West Consolidated APS Consolidated
2017 2016 2015 2017 2016 2015
Unrecognized tax benefit interest expense/(benefit) recognized $ 577 $ 529 $ (161) $ 577 $ 529 $ (161)
Following are the total amount of accrued liabilities for interest recognized related to unrecognized benefits that could reverse and decrease our effective tax rate to the extent matters are settled favorably (dollars in thousands):
Pinnacle West Consolidated APS Consolidated
2017 2016 2015 2017 2016 2015
Unrecognized tax benefit interest accrued $ 1,910 $ 1,333 $ 804 $ 1,910 $ 1,333 $ 804
Additionally, as of December 31, 2017, we have recognized less than $1 million of interest expense to be paid on the underpayment of income taxes for certain adjustments that we have filed, or will file, with the IRS.
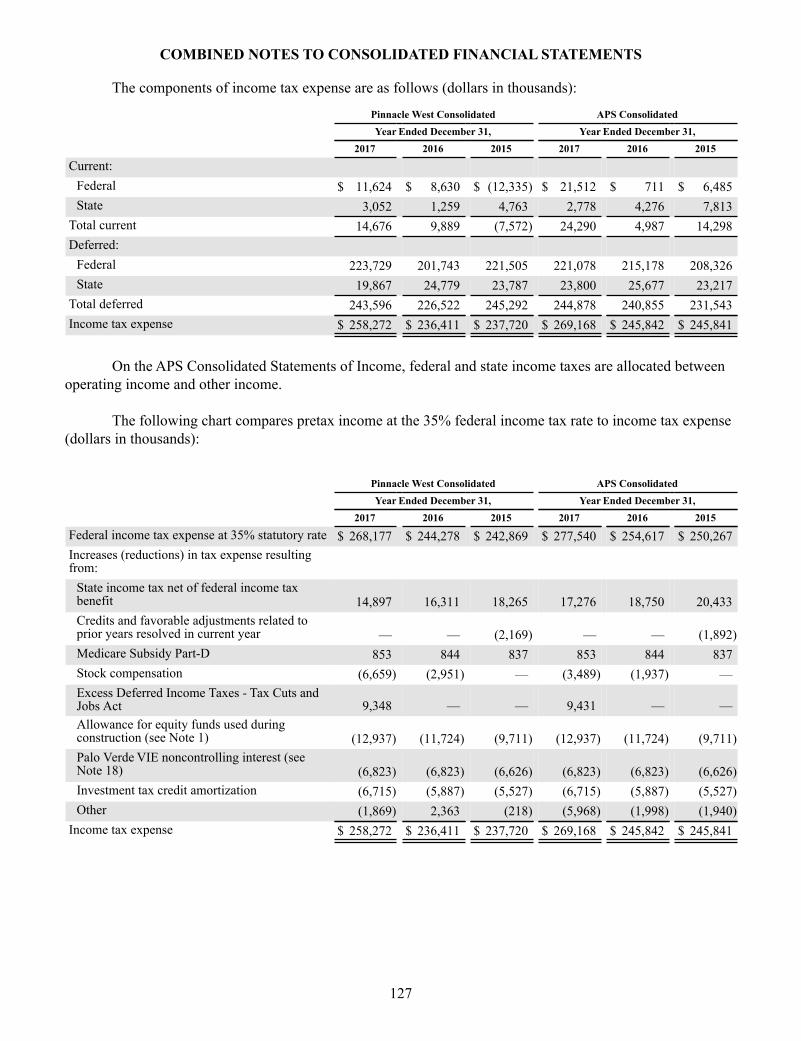
COMBINED NOTES TO CONSOLIDATED FINANCIAL STATEMENTS
127
The components of income tax expense are as follows (dollars in thousands):
Pinnacle West Consolidated APS Consolidated
Year Ended December 31, Year Ended December 31,
2017 2016 2015 2017 2016 2015
Current:
Federal $ 11,624 $ 8,630 $ (12,335) $ 21,512 $ 711 $ 6,485State 3,052 1,259 4,763 2,778 4,276 7,813
Total current 14,676 9,889 (7,572) 24,290 4,987 14,298Deferred:
Federal 223,729 201,743 221,505 221,078 215,178 208,326State 19,867 24,779 23,787 23,800 25,677 23,217
Total deferred 243,596 226,522 245,292 244,878 240,855 231,543Income tax expense $ 258,272 $ 236,411 $ 237,720 $ 269,168 $ 245,842 $ 245,841
On the APS Consolidated Statements of Income, federal and state income taxes are allocated between operating income and other income.
The following chart compares pretax income at the 35% federal income tax rate to income tax expense (dollars in thousands):
Pinnacle West Consolidated APS Consolidated
Year Ended December 31, Year Ended December 31,
2017 2016 2015 2017 2016 2015
Federal income tax expense at 35% statutory rate $ 268,177 $ 244,278 $ 242,869 $ 277,540 $ 254,617 $ 250,267Increases (reductions) in tax expense resultingfrom:
State income tax net of federal income taxbenefit 14,897 16,311 18,265 17,276 18,750 20,433Credits and favorable adjustments related toprior years resolved in current year — — (2,169) — — (1,892)Medicare Subsidy Part-D 853 844 837 853 844 837Stock compensation (6,659) (2,951) — (3,489) (1,937) —Excess Deferred Income Taxes - Tax Cuts andJobs Act 9,348 — — 9,431 — —Allowance for equity funds used duringconstruction (see Note 1) (12,937) (11,724) (9,711) (12,937) (11,724) (9,711)Palo Verde VIE noncontrolling interest (seeNote 18) (6,823) (6,823) (6,626) (6,823) (6,823) (6,626)Investment tax credit amortization (6,715) (5,887) (5,527) (6,715) (5,887) (5,527)Other (1,869) 2,363 (218) (5,968) (1,998) (1,940)
Income tax expense $ 258,272 $ 236,411 $ 237,720 $ 269,168 $ 245,842 $ 245,841

COMBINED NOTES TO CONSOLIDATED FINANCIAL STATEMENTS
128
The components of the net deferred income tax liability were as follows (dollars in thousands):
Pinnacle West Consolidated APS Consolidated
December 31, December 31,
2017 2016 2017 2016
DEFERRED TAX ASSETS
Risk management activities $ 25,103 $ 26,614 $ 25,103 $ 26,614Regulatory liabilities:
Excess Deferred Income Taxes - Tax Cuts and Jobs Act 376,906 — 376,906 —Asset retirement obligation and removal costs 135,847 200,140 135,847 200,140Unamortized investment tax credits 54,661 113,195 54,661 113,195Other postretirement benefits 47,021 60,375 47,021 60,375Other 37,489 63,311 37,489 63,311
Pension liabilities 83,126 204,436 77,280 194,981Renewable energy incentives 33,546 56,379 33,546 56,379Credit and loss carryforwards 53,946 75,944 1,920 1,645Other 102,432 158,421 108,223 187,453
Total deferred tax assets 950,077 958,815 897,996 904,093DEFERRED TAX LIABILITIES
Plant-related (2,220,886) (3,297,989) (2,220,886) (3,297,989)Risk management activities (491) (7,594) (491) (7,594)Other postretirement assets (66,134) (63,477) (65,733) (62,819)Regulatory assets:
Allowance for equity funds used during construction (36,365) (61,088) (36,365) (61,088)Deferred fuel and purchased power — mark-to-market (40,778) (21,396) (40,778) (21,396)Pension benefits (142,848) (274,184) (142,848) (274,184)Retired power plant costs (see Note 3) (53,611) (49,166) (53,611) (49,166)Other (74,423) (123,987) (74,423) (123,987)
Other (5,346) (5,166) (5,346) (5,165)Total deferred tax liabilities (2,640,882) (3,904,047) (2,640,481) (3,903,388)Deferred income taxes — net $ (1,690,805) $ (2,945,232) $ (1,742,485) $ (2,999,295)
As of December 31, 2017, the deferred tax assets for credit and loss carryforwards relate primarily to
federal general business credits of approximately $79 million, which first begin to expire in 2034, and other federal and state credit carryforwards of $6 million, which first begin to expire in 2031. The credit and loss carryforwards amount above has been reduced by $31 million of unrecognized tax benefits.
5. Lines of Credit and Short-Term Borrowings
Pinnacle West and APS maintain committed revolving credit facilities in order to enhance liquidity and provide credit support for their commercial paper programs, to refinance indebtedness, and for other general corporate purposes.

COMBINED NOTES TO CONSOLIDATED FINANCIAL STATEMENTS
129
The table below presents the consolidated credit facilities and the amounts available and outstanding as of December 31, 2017 and 2016 (dollars in thousands):
December 31, 2017 December 31, 2016Pinnacle
West APS TotalPinnacle
West APS TotalCommitments under Credit Facilities $ 325,000 $1,000,000 $1,325,000 $ 275,000 $ 1,000,000 $ 1,275,000Outstanding Commercial Paper andRevolving Credit Facility Borrowings (95,400) — (95,400) (41,700) (135,500) (177,200)Amount of Credit Facilities Available $ 229,600 $1,000,000 $1,229,600 $ 233,300 $ 864,500 $ 1,097,800
Weighted-Average Commitment Fees 0.125% 0.100% 0.125% 0.100%
Pinnacle West At December 31, 2017, Pinnacle West had a $200 million facility that matures in May 2021. Pinnacle
West has the option to increase the amount of the facility up to a maximum of $300 million upon the satisfaction of certain conditions and with the consent of the lenders. At December 31, 2017, Pinnacle West had no outstanding borrowings under its credit facility, no letters of credit outstanding and $29.4 million of commercial paper borrowings.
On July 31, 2017, Pinnacle West amended its 364-day unsecured revolving credit facility to increase its capacity from $75 million to $125 million, and to extend the termination date of the facility from August 30, 2017 to July 30, 2018. Borrowings under the facility bear interest at LIBOR plus 0.80% per annum. At December 31, 2017, Pinnacle West had $66 million outstanding under the facility.
APS On June 29, 2017, APS replaced its $500 million revolving credit facility that would have matured in
September 2020, with a new $500 million facility that matures in June 2022.
At December 31, 2017, APS had two revolving credit facilities totaling $1 billion, including a $500 million credit facility that matures in May 2021 and the above-mentioned $500 million facility. APS may increase the amount of each facility up to a maximum of $700 million, for a total of $1.4 billion, upon the satisfaction of certain conditions and with the consent of the lenders. Interest rates are based on APS’s senior unsecured debt credit ratings. These facilities are available to support APS’s $500 million commercial paper program, for bank borrowings or for issuances of letters of credit. At December 31, 2017, APS had no commercial paper outstanding and no outstanding borrowings or letters of credit under its revolving credit facilities. See "Financial Assurances" in Note 10 for a discussion of APS's other outstanding letters of credit.
Debt Provisions
On February 6, 2013, the ACC issued a financing order in which, subject to specified parameters and procedures, it approved APS’s short-term debt authorization equal to a sum of 7% of APS’s capitalization, and $500 million (which is required to be used for costs relating to purchases of natural gas and power). This financing order was set to expire on December 31, 2017; however, on December 15, 2016, APS filed a financing application with the ACC requesting continuation of its authorization of (i) Continuing Long-Term Debt of $5.1 billion and (ii) Continuing Short-Term Debt. The financing application is currently pending with

COMBINED NOTES TO CONSOLIDATED FINANCIAL STATEMENTS
130
the ACC. The authorizations approved in the 2013 order continue until further order of the ACC with respect to the pending application. See Note 6 for additional long-term debt provisions.
6. Long-Term Debt and Liquidity Matters
All of Pinnacle West’s and APS’s debt is unsecured. The following table presents the components of long-term debt on the Consolidated Balance Sheets outstanding at December 31, 2017 and 2016 (dollars in thousands):
Maturity Interest December 31,
Dates (a) Rates 2017 2016
APS
Pollution control bonds:
Variable 2029 (b) $ 35,975 $ 35,975Fixed 2024-2029 1.75%-4.70% 147,150 147,150Total pollution control bonds
183,125 183,125Senior unsecured notes 2019-2046 2.20%-8.75% 4,275,000 3,725,000Term loans 2018-2019 (c) 150,000 150,000Unamortized discount
(11,288) (11,816)Unamortized premium
8,049 4,506Unamortized debt issuance cost (31,594) (29,030)Total APS long-term debt
4,573,292 4,021,785Less current maturities
82,000 —Total APS long-term debt less current maturities
4,491,292 4,021,785Pinnacle West
Term loan 2017 (d) — 125,000Senior unsecured notes 2020 2.25% 300,000 —Unamortized discount (184) —Unamortized debt issuance cost (1,395) —Total PNW long-term debt 298,421 125,000Less current maturities — 125,000Total PNW long-term debt less current maturities 298,421 —TOTAL LONG-TERM DEBT LESS CURRENT MATURITIES
$ 4,789,713 $ 4,021,785
(a) This schedule does not reflect the timing of redemptions that may occur prior to maturities.(b) The weighted-average rate for the variable rate pollution control bonds was 1.77% at December 31,
2017 and 0.81% at December 31, 2016.(c) The weighted-average interest rate was 2.236% at December 31, 2017, and 1.427% at
December 31, 2016.(d) The interest rate was 1.520% at December 31, 2016.

COMBINED NOTES TO CONSOLIDATED FINANCIAL STATEMENTS
131
The following table shows principal payments due on Pinnacle West’s and APS’s total long-term debt (dollars in thousands):
YearConsolidatedPinnacle West
ConsolidatedAPS
2018 $ 82,000 $ 82,0002019 600,000 600,0002020 550,000 250,0002021 — —2022 — —Thereafter 3,676,125 3,676,125Total $ 4,908,125 $ 4,608,125
Debt Fair Value
Our long-term debt fair value estimates are based on quoted market prices for the same or similar issues, and are classified within Level 2 of the fair value hierarchy. Certain of our debt instruments contain third-party credit enhancements and, in accordance with GAAP, we do not consider the effect of these credit enhancements when determining fair value. The following table represents the estimated fair value of our long-term debt, including current maturities (dollars in thousands):
As ofDecember 31, 2017
As ofDecember 31, 2016
CarryingAmount Fair Value
CarryingAmount Fair Value
Pinnacle West $ 298,421 $ 298,608 $ 125,000 $ 125,000APS 4,573,292 5,006,348 4,021,785 4,300,789
Total $ 4,871,713 $ 5,304,956 $ 4,146,785 $ 4,425,789
Credit Facilities and Debt Issuances
Pinnacle West
On November 30, 2017, Pinnacle West issued $300 million of 2.25% unsecured senior notes that mature on November 30, 2020. The net proceeds from the sale were used to repay our $125 million term loan and for general corporate purposes.
APS
On March 21, 2017, APS issued an additional $250 million par amount of its outstanding 4.35% senior unsecured notes that mature on November 15, 2045. The net proceeds from the sale were used to refinance commercial paper borrowings and to replenish cash temporarily used to fund capital expenditures.
On September 11, 2017, APS issued $300 million of 2.95% senior unsecured notes that mature on September 15, 2027. The net proceeds from the sale were used to refinance commercial paper and other indebtedness and to replenish cash used to fund capital expenditures.
On November 30, 2017, PNW contributed $150 million into APS in the form of an equity infusion. APS used this contribution to repay short-term indebtedness, to finance capital expenditures and for other general corporate purposes.

COMBINED NOTES TO CONSOLIDATED FINANCIAL STATEMENTS
132
See “Lines of Credit and Short-Term Borrowings” in Note 5 and “Financial Assurances” in Note 10 for discussion of APS’s separate outstanding letters of credit.
Debt Provisions
Pinnacle West’s and APS’s debt covenants related to their respective bank financing arrangements include maximum debt to capitalization ratios. Pinnacle West and APS comply with this covenant. For both Pinnacle West and APS, this covenant requires that the ratio of consolidated debt to total consolidated capitalization not exceed 65%. At December 31, 2017, the ratio was approximately 50% for Pinnacle West and 47% for APS. Failure to comply with such covenant levels would result in an event of default, which, generally speaking, would require the immediate repayment of the debt subject to the covenants and could cross-default other debt. See further discussion of “cross-default” provisions below.
Neither Pinnacle West’s nor APS’s financing agreements contain “rating triggers” that would result in
an acceleration of the required interest and principal payments in the event of a rating downgrade. However, our bank credit agreements contain a pricing grid in which the interest rates we pay for borrowings thereunder are determined by our current credit ratings.
All of Pinnacle West’s loan agreements contain "cross-default" provisions that would result in defaults
and the potential acceleration of payment under these loan agreements if Pinnacle West or APS were to default under certain other material agreements. All of APS’s bank agreements contain "cross-default" provisions that would result in defaults and the potential acceleration of payment under these bank agreements if APS were to default under certain other material agreements. Pinnacle West and APS do not have a material adverse change restriction for credit facility borrowings.
An existing ACC order requires APS to maintain a common equity ratio of at least 40%. As defined in the ACC order, the common equity ratio is total shareholder equity divided by the sum of total shareholder equity and long-term debt, including current maturities of long-term debt. Its total shareholder equity was approximately $5.3 billion, and total capitalization was approximately $10.0 billion. APS would be prohibited from paying dividends if the payment would reduce its total shareholder equity below approximately $4.0 billion, assuming APS’s total capitalization remains the same. APS was in compliance with this common equity ratio requirement as of December 31, 2017.
Although provisions in APS’s articles of incorporation and ACC financing orders establish maximum amounts of preferred stock and debt that APS may issue, APS does not expect any of these provisions to limit its ability to meet its capital requirements. On February 6, 2013, the ACC issued a financing order in which, subject to specified parameters and procedures, it approved an increase in APS’s long-term debt authorization from $4.2 billion to $5.1 billion in light of the projected growth of APS and its customer base and the resulting projected financing needs, and authorized APS to enter into derivative financial instruments for the purpose of managing interest rate risk associated with its long- and short-term debt. This financing order was set to expire on December 31, 2017; however, on December 15, 2016, APS filed a financing application with the ACC requesting continuation of its authorization of (i) Continuing Long-Term Debt of $5.1 billion and (ii) Continuing Short-Term Debt. The financing application is currently pending with the ACC. The authorizations approved in the 2013 order continue until further order of the ACC with respect to the pending application. See Note 5 for additional short-term debt provisions.

COMBINED NOTES TO CONSOLIDATED FINANCIAL STATEMENTS
133
7. Retirement Plans and Other Postretirement Benefits
Pinnacle West sponsors a qualified defined benefit and account balance pension plan (The Pinnacle West Capital Corporation Retirement Plan) and a non-qualified supplemental excess benefit retirement plan for the employees of Pinnacle West and its subsidiaries. All new employees participate in the account balance plan. Defined benefit plans specify the amount of benefits a plan participant is to receive using information about the participant. The pension plan covers nearly all employees. The supplemental excess benefit retirement plan covers officers of the Company and highly compensated employees designated for participation by the Board of Directors. Our employees do not contribute to the plans. We calculate the benefits based on age, years of service and pay.
Pinnacle West also sponsors other postretirement benefit plans (Pinnacle West Capital Corporation Group Life and Medical Plan and Pinnacle West Capital Corporation Post-65 Retiree Health Reimbursement Arrangement) for the employees of Pinnacle West and its subsidiaries. These plans provide medical and life insurance benefits to retired employees. Employees must retire to become eligible for these retirement benefits, which are based on years of service and age. For the medical insurance plan, retirees make contributions to cover a portion of the plan costs. For the life insurance plan, retirees do not make contributions. We retain the right to change or eliminate these benefits.
On September 30, 2014, Pinnacle West announced plan design changes to the postretirement benefit plan, which required an interim remeasurement of the benefit obligation for the plan. Effective January 1, 2015, those eligible retirees and dependents over age 65 and on Medicare can choose to be enrolled in a Health Reimbursement Arrangement ("HRA"). The Company is providing a subsidy allowing post-65 retirees to purchase a Medicare supplement plan on a private exchange network. The remeasurement of the benefit obligation included updating the assumptions. The 2014 remeasurement also resulted in a decrease in Pinnacle West’s other postretirement benefit obligation of $316 million, which was offset by the related regulatory asset and accumulated other comprehensive income.
Because of plan changes in September 2014, the Company is currently in the process of seeking IRS
approval to move approximately $186 million of other postretirement benefit trust assets into a new trust account to pay for active union employee medical costs. In December 2016, FERC approved a methodology for determining the amount of other postretirement benefit trust assets to transfer into a new trust account to pay for active union employee medical costs. On January 2, 2018, these funds were moved to the new trust account. The Company negotiated a draft Closing Agreement granting tentative approval from the IRS prior to the transfer. Subsequent to the transfer, the Company submitted proof of the transfer to the IRS and expects to execute a final Closing Agreement early in 2018. Per the terms of an order from FERC, the Company must also make an informational filing with FERC. The Company made this FERC filing during February 2018. It is the Company’s understanding that completion of these regulatory requirements will then permit access to the approximately $186 million for the sole purpose of paying active union employee medical benefits.
Pinnacle West uses a December 31 measurement date each year for its pension and other postretirement benefit plans. The market-related value of our plan assets is their fair value at the measurement date. See Note 13 for further discussion of how fair values are determined. Due to subjective and complex judgments, which may be required in determining fair values, actual results could differ from the results estimated through the application of these methods.
A significant portion of the changes in the actuarial gains and losses of our pension and postretirement
plans is attributable to APS and therefore is recoverable in rates. Accordingly, these changes are recorded as a regulatory asset or regulatory liability. In its 2009 retail rate case settlement, APS received approval to defer a
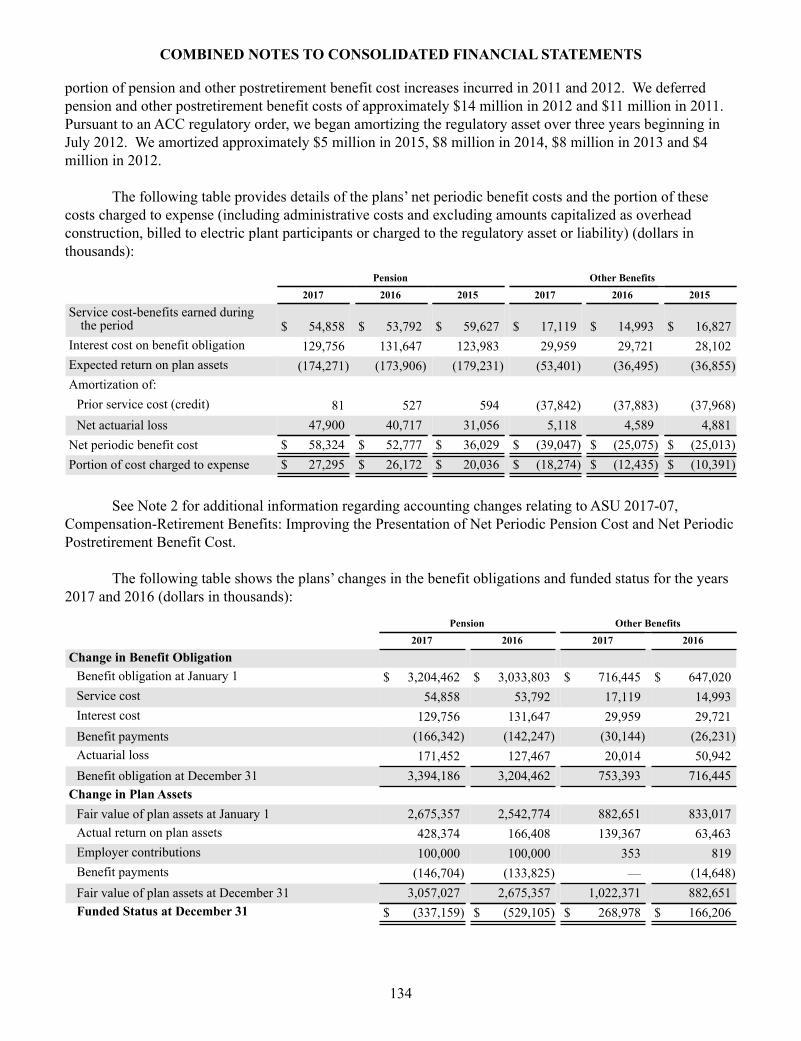
COMBINED NOTES TO CONSOLIDATED FINANCIAL STATEMENTS
134
portion of pension and other postretirement benefit cost increases incurred in 2011 and 2012. We deferred pension and other postretirement benefit costs of approximately $14 million in 2012 and $11 million in 2011. Pursuant to an ACC regulatory order, we began amortizing the regulatory asset over three years beginning in July 2012. We amortized approximately $5 million in 2015, $8 million in 2014, $8 million in 2013 and $4 million in 2012.
The following table provides details of the plans’ net periodic benefit costs and the portion of these
costs charged to expense (including administrative costs and excluding amounts capitalized as overhead construction, billed to electric plant participants or charged to the regulatory asset or liability) (dollars in thousands):
Pension Other Benefits
2017 2016 2015 2017 2016 2015
Service cost-benefits earned duringthe period $ 54,858 $ 53,792 $ 59,627 $ 17,119 $ 14,993 $ 16,827
Interest cost on benefit obligation 129,756 131,647 123,983 29,959 29,721 28,102Expected return on plan assets (174,271) (173,906) (179,231) (53,401) (36,495) (36,855)Amortization of:
Prior service cost (credit) 81 527 594 (37,842) (37,883) (37,968)Net actuarial loss 47,900 40,717 31,056 5,118 4,589 4,881
Net periodic benefit cost $ 58,324 $ 52,777 $ 36,029 $ (39,047) $ (25,075) $ (25,013)Portion of cost charged to expense $ 27,295 $ 26,172 $ 20,036 $ (18,274) $ (12,435) $ (10,391)
See Note 2 for additional information regarding accounting changes relating to ASU 2017-07, Compensation-Retirement Benefits: Improving the Presentation of Net Periodic Pension Cost and Net Periodic Postretirement Benefit Cost.
The following table shows the plans’ changes in the benefit obligations and funded status for the years 2017 and 2016 (dollars in thousands):
Pension Other Benefits
2017 2016 2017 2016
Change in Benefit Obligation
Benefit obligation at January 1 $ 3,204,462 $ 3,033,803 $ 716,445 $ 647,020Service cost 54,858 53,792 17,119 14,993Interest cost 129,756 131,647 29,959 29,721Benefit payments (166,342) (142,247) (30,144) (26,231)Actuarial loss 171,452 127,467 20,014 50,942Benefit obligation at December 31 3,394,186 3,204,462 753,393 716,445
Change in Plan Assets
Fair value of plan assets at January 1 2,675,357 2,542,774 882,651 833,017Actual return on plan assets 428,374 166,408 139,367 63,463Employer contributions 100,000 100,000 353 819Benefit payments (146,704) (133,825) — (14,648)Fair value of plan assets at December 31 3,057,027 2,675,357 1,022,371 882,651Funded Status at December 31 $ (337,159) $ (529,105) $ 268,978 $ 166,206

COMBINED NOTES TO CONSOLIDATED FINANCIAL STATEMENTS
135
The following table shows the projected benefit obligation and the accumulated benefit obligation for pension plans with an accumulated obligation in excess of plan assets as of December 31, 2017 and 2016 (dollars in thousands):
2017 2016
Projected benefit obligation $ 3,394,186 $ 3,204,462Accumulated benefit obligation 3,227,233 3,049,406Fair value of plan assets 3,057,027 2,675,357
The following table shows the amounts recognized on the Consolidated Balance Sheets as of
December 31, 2017 and 2016 (dollars in thousands):
Pension Other Benefits
2017 2016 2017 2016
Noncurrent asset $ — $ — $ 268,978 $ 166,206Current liability (9,859) (19,795) — —Noncurrent liability (327,300) (509,310) — —Net amount recognized $ (337,159) $ (529,105) $ 268,978 $ 166,206
The following table shows the details related to accumulated other comprehensive loss as of
December 31, 2017 and 2016 (dollars in thousands):
Pension Other Benefits
2017 2016 2017 2016
Net actuarial loss $ 643,199 $ 773,750 $ 75,439 $ 146,509Prior service cost (credit) — 81 (265,575) (303,417)APS’s portion recorded as a regulatory (asset) liability (576,188) (711,059) 189,627 156,575Income tax expense (benefit) (24,915) (24,202) 853 833Accumulated other comprehensive loss $ 42,096 $ 38,570 $ 344 $ 500
The following table shows the estimated amounts that will be amortized from accumulated other
comprehensive loss and regulatory assets and liabilities into net periodic benefit cost in 2018 (dollars in thousands):
Pension
OtherBenefits
Net actuarial loss $ 28,334 $ —Prior service credit — (37,842)Total amounts estimated to be amortized from accumulated other comprehensive loss (gain)and regulatory assets (liabilities) in 2018 $ 28,334 $ (37,842)
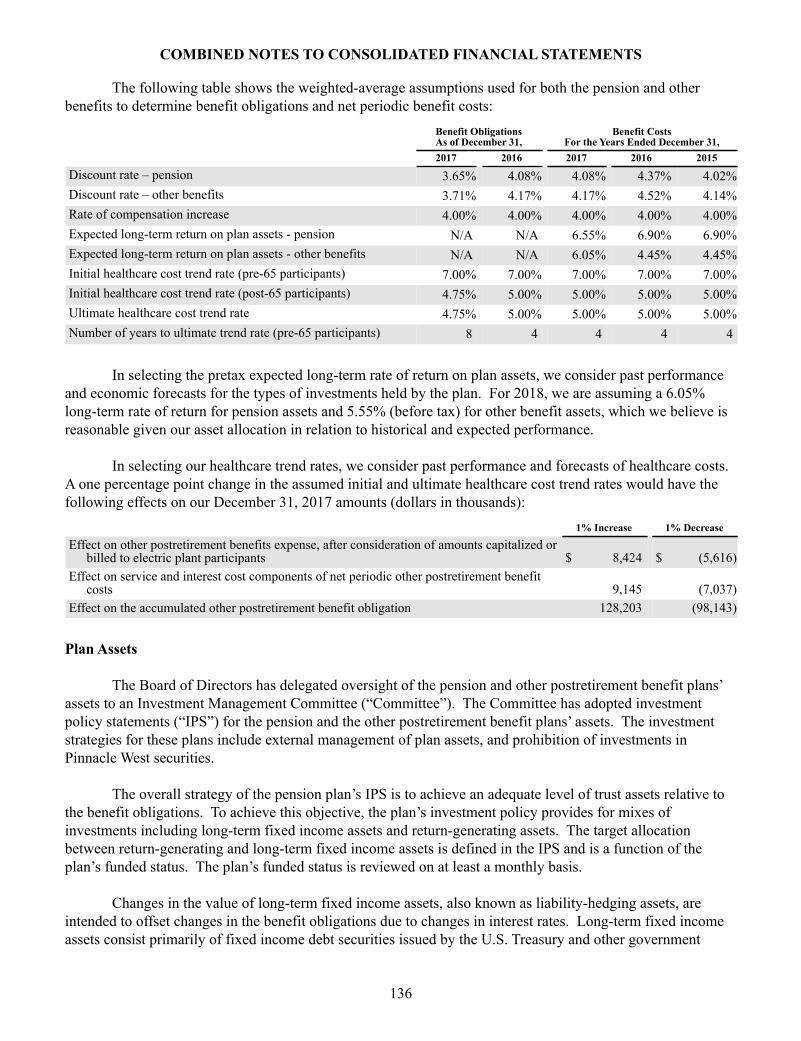
COMBINED NOTES TO CONSOLIDATED FINANCIAL STATEMENTS
136
The following table shows the weighted-average assumptions used for both the pension and other benefits to determine benefit obligations and net periodic benefit costs:
Benefit ObligationsAs of December 31,
Benefit CostsFor the Years Ended December 31,
2017 2016 2017 2016 2015
Discount rate – pension 3.65% 4.08% 4.08% 4.37% 4.02%Discount rate – other benefits 3.71% 4.17% 4.17% 4.52% 4.14%Rate of compensation increase 4.00% 4.00% 4.00% 4.00% 4.00%Expected long-term return on plan assets - pension N/A N/A 6.55% 6.90% 6.90%Expected long-term return on plan assets - other benefits N/A N/A 6.05% 4.45% 4.45%Initial healthcare cost trend rate (pre-65 participants) 7.00% 7.00% 7.00% 7.00% 7.00%Initial healthcare cost trend rate (post-65 participants) 4.75% 5.00% 5.00% 5.00% 5.00%Ultimate healthcare cost trend rate 4.75% 5.00% 5.00% 5.00% 5.00%Number of years to ultimate trend rate (pre-65 participants) 8 4 4 4 4
In selecting the pretax expected long-term rate of return on plan assets, we consider past performance
and economic forecasts for the types of investments held by the plan. For 2018, we are assuming a 6.05% long-term rate of return for pension assets and 5.55% (before tax) for other benefit assets, which we believe is reasonable given our asset allocation in relation to historical and expected performance.
In selecting our healthcare trend rates, we consider past performance and forecasts of healthcare costs. A one percentage point change in the assumed initial and ultimate healthcare cost trend rates would have the following effects on our December 31, 2017 amounts (dollars in thousands):
1% Increase 1% Decrease
Effect on other postretirement benefits expense, after consideration of amounts capitalized orbilled to electric plant participants $ 8,424 $ (5,616)
Effect on service and interest cost components of net periodic other postretirement benefitcosts 9,145 (7,037)
Effect on the accumulated other postretirement benefit obligation 128,203 (98,143)
Plan Assets
The Board of Directors has delegated oversight of the pension and other postretirement benefit plans’ assets to an Investment Management Committee (“Committee”). The Committee has adopted investment policy statements (“IPS”) for the pension and the other postretirement benefit plans’ assets. The investment strategies for these plans include external management of plan assets, and prohibition of investments in Pinnacle West securities.
The overall strategy of the pension plan’s IPS is to achieve an adequate level of trust assets relative to
the benefit obligations. To achieve this objective, the plan’s investment policy provides for mixes of investments including long-term fixed income assets and return-generating assets. The target allocation between return-generating and long-term fixed income assets is defined in the IPS and is a function of the plan’s funded status. The plan’s funded status is reviewed on at least a monthly basis.
Changes in the value of long-term fixed income assets, also known as liability-hedging assets, are
intended to offset changes in the benefit obligations due to changes in interest rates. Long-term fixed income assets consist primarily of fixed income debt securities issued by the U.S. Treasury and other government

COMBINED NOTES TO CONSOLIDATED FINANCIAL STATEMENTS
137
agencies, U.S. Treasury Futures Contracts, and fixed income debt securities issued by corporations. Long-term fixed income assets may also include interest rate swaps, and other instruments.
Return-generating assets are intended to provide a reasonable long-term rate of investment return with
a prudent level of volatility. Return-generating assets are composed of U.S. equities, international equities, and alternative investments. International equities include investments in both developed and emerging markets. Alternative investments include investments in real estate, private equity and various other strategies. The plan may also hold investments in return-generating assets by holding securities in partnerships, common and collective trusts and mutual funds.
Based on the IPS, and given the pension plan's funded status at year-end 2017, the target and actual allocation for the pension plan at December 31, 2017 are as follows:
Pension
TargetAllocation
ActualAllocation
Long-term fixed income assets 62% 58%Return-generating assets 38% 42%Total 100% 100%
The permissible range is within +/- 3% of the target allocation shown in the above table, and also considers the Plan's funded status.
The following table presents the additional target allocations, as a percent of total pension plan assets, for the return-generating assets:
Asset ClassTarget
Allocation
Equities in US and other developed markets 18%Equities in emerging markets 6%Alternative investments 14%Total 38%
The pension plan IPS does not provide for a specific mix of long-term fixed income assets, but does expect the average credit quality of such assets to be investment grade.
As of December 31, 2017, the asset allocation for other postretirement benefit plan assets is governed by the IPS for those plans, which provides for different asset allocation target mixes depending on the characteristics of the liability. Some of these asset allocation target mixes vary with the plan’s funded status. The following table presents the actual allocations of the investment for the other postretirement benefit plan at December 31, 2017:
Other BenefitsActual
Allocation
Long-term fixed income assets 67%Return-generating assets 33%Total 100%
See Note 13 for a discussion on the fair value hierarchy and how fair value methodologies are applied.
The plans invest directly in fixed income, U.S. Treasury Futures Contracts, and equity securities, in addition to

COMBINED NOTES TO CONSOLIDATED FINANCIAL STATEMENTS
138
investing indirectly in fixed income securities, equity securities and real estate through the use of mutual funds, partnerships and common and collective trusts. Equity securities held directly by the plans are valued using quoted active market prices from the published exchange on which the equity security trades, and are classified as Level 1. U.S. Treasury Future Contracts are valued using the quoted active market prices from the exchange on which they trade, and are classified as Level 1. Fixed income securities issued by the U.S. Treasury held directly by the plans are valued using quoted active market prices, and are classified as Level 1. Fixed income securities issued by corporations, municipalities, and other agencies are primarily valued using quoted inactive market prices, or quoted active market prices for similar securities, or by utilizing calculations which incorporate observable inputs such as yield, maturity and credit quality. These instruments are classified as Level 2.
Mutual funds, partnerships, and common and collective trusts are valued utilizing a net asset value
(NAV) concept or its equivalent. Mutual funds, which includes exchange traded funds (ETFs), are classified as Level 1 and valued using a NAV that is observable and based on the active market in which the fund trades.
Common and collective trusts are maintained by banks or investment companies and hold certain investments in accordance with a stated set of objectives (such as tracking the performance of the S&P 500 Index). The trust's shares are offered to a limited group of investors, and are not traded in an active market. Investments in common and collective trusts are valued using NAV as a practical expedient and, accordingly, are not classified in the fair value hierarchy. The NAV for trusts investing in exchange traded equities, and fixed income securities is derived from the market prices of the underlying securities held by the trusts. The NAV for trusts investing in real estate is derived from the appraised values of the trust's underlying real estate assets. As of December 31, 2017, the plans were able to transact in the common and collective trusts at NAV.
Investments in partnerships are also valued using the concept of NAV as a practical expedient and, accordingly, are not classified in the fair value hierarchy. The NAV for these investments is derived from the value of the partnerships' underlying assets. The plan's partnerships holdings relate to investments in high-yield fixed income instruments and assets of privately held portfolio companies. Certain partnerships also include funding commitments that may require the plan to contribute up to $75 million to these partnerships; as of December 31, 2017, approximately $58 million of these commitments have been funded.
The plans’ trustee provides valuation of our plan assets by using pricing services that utilize
methodologies described to determine fair market value. We have internal control procedures to ensure this information is consistent with fair value accounting guidance. These procedures include assessing valuations using an independent pricing source, verifying that pricing can be supported by actual recent market transactions, assessing hierarchy classifications, comparing investment returns with benchmarks, and obtaining and reviewing independent audit reports on the trustee’s internal operating controls and valuation processes.
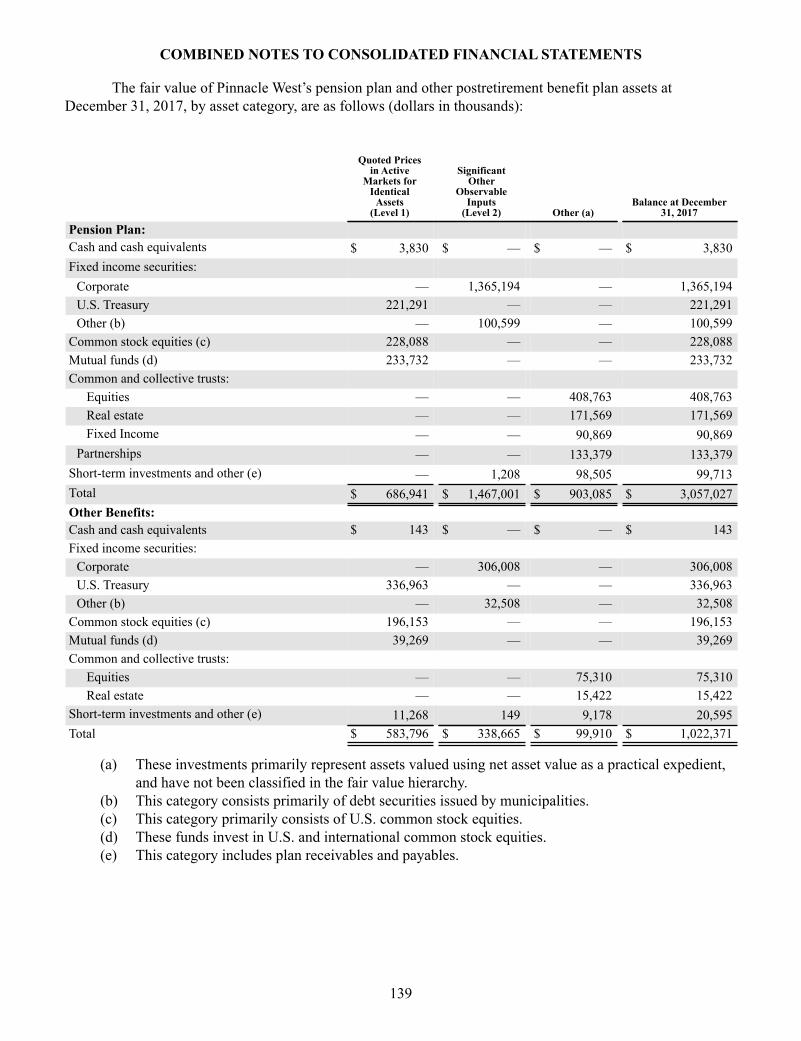
COMBINED NOTES TO CONSOLIDATED FINANCIAL STATEMENTS
139
The fair value of Pinnacle West’s pension plan and other postretirement benefit plan assets at December 31, 2017, by asset category, are as follows (dollars in thousands):
Quoted Pricesin Active
Markets forIdentical
Assets(Level 1)
SignificantOther
ObservableInputs
(Level 2) Other (a)Balance at December
31, 2017
Pension Plan:
Cash and cash equivalents $ 3,830 $ — $ — $ 3,830Fixed income securities:
Corporate — 1,365,194 — 1,365,194U.S. Treasury 221,291 — — 221,291Other (b) — 100,599 — 100,599
Common stock equities (c) 228,088 — — 228,088Mutual funds (d) 233,732 — — 233,732Common and collective trusts:
Equities — — 408,763 408,763 Real estate — — 171,569 171,569 Fixed Income — — 90,869 90,869Partnerships — — 133,379 133,379
Short-term investments and other (e) — 1,208 98,505 99,713Total $ 686,941 $ 1,467,001 $ 903,085 $ 3,057,027Other Benefits:
Cash and cash equivalents $ 143 $ — $ — $ 143Fixed income securities:
Corporate — 306,008 — 306,008U.S. Treasury 336,963 — — 336,963Other (b) — 32,508 — 32,508
Common stock equities (c) 196,153 — — 196,153Mutual funds (d) 39,269 — — 39,269Common and collective trusts:
Equities — — 75,310 75,310 Real estate — — 15,422 15,422
Short-term investments and other (e) 11,268 149 9,178 20,595Total $ 583,796 $ 338,665 $ 99,910 $ 1,022,371
(a) These investments primarily represent assets valued using net asset value as a practical expedient, and have not been classified in the fair value hierarchy.
(b) This category consists primarily of debt securities issued by municipalities.(c) This category primarily consists of U.S. common stock equities.(d) These funds invest in U.S. and international common stock equities. (e) This category includes plan receivables and payables.

COMBINED NOTES TO CONSOLIDATED FINANCIAL STATEMENTS
140
The fair value of Pinnacle West’s pension plan and other postretirement benefit plan assets at December 31, 2016, by asset category, are as follows (dollars in thousands):
Quoted Pricesin Active
Markets forIdentical
Assets(Level 1)
SignificantOther
ObservableInputs
(Level 2) Other (a)Balance at December
31, 2016
Pension Plan:
Cash and cash equivalents $ 13,995 $ — $ — $ 13,995Fixed income securities:
Corporate — 1,210,453 — 1,210,453U.S. Treasury 112,583 — — 112,583Other (b) — 102,170 — 102,170
Common stock equities (c) 235,109 — — 235,109Mutual funds (d) 251,506 — — 251,506Common and collective trusts:
Equities — — 266,840 266,840 Real estate — — 161,449 161,449
Partnerships — — 208,915 208,915Short-term investments and other (e) — — 112,337 112,337Total $ 613,193 $ 1,312,623 $ 749,541 $ 2,675,357Other Benefits:
Cash and cash equivalents $ 304 $ — $ — $ 304Fixed income securities:
Corporate — 268,193 — 268,193U.S. Treasury 145,255 — — 145,255Other (b) — 34,506 — 34,506
Common stock equities (c) 243,741 — — 243,741Mutual funds (d) 67,418 — — 67,418Common and collective trusts:
Equities — — 95,814 95,814 Real estate — — 14,509 14,509
Partnerships — — 3,060 3,060Short-term investments and other (e) — — 9,851 9,851Total $ 456,718 $ 302,699 $ 123,234 $ 882,651
(a) These investments primarily represent assets valued using net asset value as a practical expedient, and have not been classified in the fair value hierarchy.
(b) This category consists primarily of debt securities issued by municipalities.(c) This category primarily consists of U.S. common stock equities.(d) These funds invest in U.S. and international common stock equities. (e) This category includes plan receivables and payables.
Contributions
Future year contribution amounts are dependent on plan asset performance and plan actuarial assumptions. We made contributions to our pension plan totaling $100 million in 2017, $100 million in 2016, and $100 million in 2015. The minimum required contributions for the pension plan are zero for the next three years. We expect to make voluntary contributions up to a total of $250 million during the 2018-2020 period.

COMBINED NOTES TO CONSOLIDATED FINANCIAL STATEMENTS
141
With regard to contributions to our other postretirement benefit plans, we made a contribution of approximately $1 million in each of 2017, 2016 and 2015. We do not expect to make any contributions over the next three years to our other postretirement benefit plans. APS funds its share of the contributions. APS’s share of the pension plan contribution was approximately $100 million in 2017, $100 million in 2016 and $100 million in 2015. APS’s share of the contributions to the other postretirement benefit plan was approximately $1 million in 2017, 2016 and 2015. Estimated Future Benefit Payments
Benefit payments, which reflect estimated future employee service, for the next five years and the succeeding five years thereafter, are estimated to be as follows (dollars in thousands):Year Pension Other Benefits
2018 $ 175,383 $ 31,8912019 181,902 34,0002020 191,586 35,6582021 196,583 37,0902022 201,463 37,860Years 2023-2027 1,068,568 191,207
Electric plant participants contribute to the above amounts in accordance with their respective
participation agreements.
Employee Savings Plan Benefits
Pinnacle West sponsors a defined contribution savings plan for eligible employees of Pinnacle West and its subsidiaries. In 2017, costs related to APS’s employees represented 99% of the total cost of this plan. In a defined contribution savings plan, the benefits a participant receives result from regular contributions participants make to their own individual account, the Company’s matching contributions and earnings or losses on their investments. Under this plan, the Company matches a percentage of the participants’ contributions in cash which is then invested in the same investment mix as participants elect to invest their own future contributions. Pinnacle West recorded expenses for this plan of approximately $10 million for 2017, $10 million for 2016, and $9 million for 2015.
8. Leases
We lease certain vehicles, land, buildings, equipment and miscellaneous other items through operating rental agreements with varying terms, provisions and expiration dates. See Note 2 for a discussion of the new lease accounting standard.
Total lease expense recognized in the Consolidated Statements of Income was $18 million in 2017, $16
million in 2016, and $17 million in 2015. APS’s lease expense was $17 million in 2017, $15 million in 2016, and $14 million in 2015.

COMBINED NOTES TO CONSOLIDATED FINANCIAL STATEMENTS
142
Estimated future minimum lease payments for Pinnacle West’s and APS’s operating leases, excluding purchased power agreements, are approximately as follows (dollars in thousands):
YearPinnacle WestConsolidated APS
2018 $ 13,412 $ 13,1102019 11,054 10,8022020 9,641 9,3922021 7,105 6,8582022 4,609 4,510Thereafter 55,940 53,605Total future lease commitments $ 101,761 $ 98,277
In 1986, APS entered into agreements with three separate lessor trust entities in order to sell and lease
back interests in Palo Verde Unit 2 and related common facilities. These lessor trust entities have been deemed VIEs for which APS is the primary beneficiary. As the primary beneficiary, APS consolidated these lessor trust entities. The impacts of these sale leaseback transactions are excluded from our lease disclosures as lease accounting is eliminated upon consolidation. See Note 18 for a discussion of VIEs.
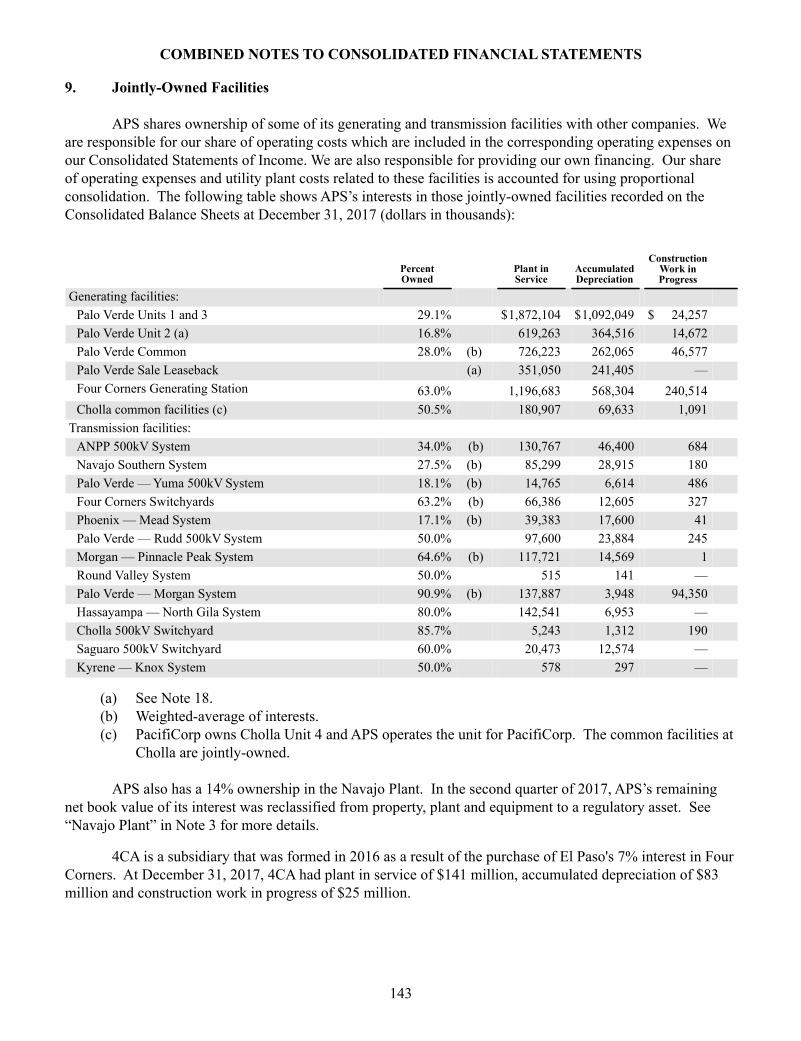
COMBINED NOTES TO CONSOLIDATED FINANCIAL STATEMENTS
143
9. Jointly-Owned Facilities
APS shares ownership of some of its generating and transmission facilities with other companies. We are responsible for our share of operating costs which are included in the corresponding operating expenses on our Consolidated Statements of Income. We are also responsible for providing our own financing. Our share of operating expenses and utility plant costs related to these facilities is accounted for using proportional consolidation. The following table shows APS’s interests in those jointly-owned facilities recorded on the Consolidated Balance Sheets at December 31, 2017 (dollars in thousands):
PercentOwned
Plant inService
AccumulatedDepreciation
ConstructionWork inProgress
Generating facilities:
Palo Verde Units 1 and 3 29.1% $1,872,104 $1,092,049 $ 24,257Palo Verde Unit 2 (a) 16.8% 619,263 364,516 14,672Palo Verde Common 28.0% (b) 726,223 262,065 46,577Palo Verde Sale Leaseback
(a) 351,050 241,405 —Four Corners Generating Station 63.0% 1,196,683 568,304 240,514Cholla common facilities (c) 50.5% 180,907 69,633 1,091
Transmission facilities:
ANPP 500kV System 34.0% (b) 130,767 46,400 684Navajo Southern System 27.5% (b) 85,299 28,915 180Palo Verde — Yuma 500kV System 18.1% (b) 14,765 6,614 486Four Corners Switchyards 63.2% (b) 66,386 12,605 327Phoenix — Mead System 17.1% (b) 39,383 17,600 41Palo Verde — Rudd 500kV System 50.0% 97,600 23,884 245Morgan — Pinnacle Peak System 64.6% (b) 117,721 14,569 1Round Valley System 50.0% 515 141 —Palo Verde — Morgan System 90.9% (b) 137,887 3,948 94,350Hassayampa — North Gila System 80.0% 142,541 6,953 —Cholla 500kV Switchyard 85.7% 5,243 1,312 190Saguaro 500kV Switchyard 60.0% 20,473 12,574 —Kyrene — Knox System 50.0% 578 297 —
(a) See Note 18.(b) Weighted-average of interests.(c) PacifiCorp owns Cholla Unit 4 and APS operates the unit for PacifiCorp. The common facilities at
Cholla are jointly-owned.
APS also has a 14% ownership in the Navajo Plant. In the second quarter of 2017, APS’s remaining net book value of its interest was reclassified from property, plant and equipment to a regulatory asset. See “Navajo Plant” in Note 3 for more details.
4CA is a subsidiary that was formed in 2016 as a result of the purchase of El Paso's 7% interest in Four Corners. At December 31, 2017, 4CA had plant in service of $141 million, accumulated depreciation of $83 million and construction work in progress of $25 million.
COMBINED NOTES TO CONSOLIDATED FINANCIAL STATEMENTS
144
10. Commitments and Contingencies Palo Verde Generating Station
Spent Nuclear Fuel and Waste Disposal
On December 19, 2012, APS, acting on behalf of itself and the participant owners of Palo Verde, filed a second breach of contract lawsuit against the DOE in the United States Court of Federal Claims ("Court of Federal Claims"). The lawsuit sought to recover damages incurred due to DOE’s breach of the Contract for Disposal of Spent Nuclear Fuel and/or High Level Radioactive Waste ("Standard Contract") for failing to accept Palo Verde's spent nuclear fuel and high level waste from January 1, 2007 through June 30, 2011, as it was required to do pursuant to the terms of the Standard Contract and the Nuclear Waste Policy Act. On August 18, 2014, APS and DOE entered into a settlement agreement, stipulating to a dismissal of the lawsuit and payment of $57.4 million by DOE to the Palo Verde owners for certain specified costs incurred by Palo Verde during the period January 1, 2007 through June 30, 2011. APS’s share of this amount is $16.7 million. Amounts recovered in the lawsuit and settlement were recorded as adjustments to a regulatory liability and had no impact on the amount of reported net income. In addition, the settlement agreement, as amended, provides APS with a method for submitting claims and getting recovery for costs incurred through December 31, 2019.
APS has submitted three claims pursuant to the terms of the August 18, 2014 settlement agreement, for three separate time periods during July 1, 2011 through June 30, 2016. The DOE has approved and paid $65.2 million for these claims (APS’s share is $19 million). The amounts recovered were primarily recorded as adjustments to a regulatory liability and had no impact on reported net income. In accordance with the 2017 retail rate case settlement, this regulatory liability is being refunded to customers (see Note 3). APS's next claim pursuant to the terms of the August 18, 2014 settlement agreement was submitted to the DOE in the fourth quarter of 2017 in the amount of $9 million (APS's share is $2.6 million). In February 2018, the DOE approved this claim.
Nuclear Insurance
Public liability for incidents at nuclear power plants is governed by the Price-Anderson Nuclear
Industries Indemnity Act ("Price-Anderson Act"), which limits the liability of nuclear reactor owners to the amount of insurance available from both commercial sources and an industry-wide retrospective payment plan. In accordance with the Price-Anderson Act, the Palo Verde participants are insured against public liability for a nuclear incident up to approximately $13.4 billion per occurrence. Palo Verde maintains the maximum available nuclear liability insurance in the amount of $450 million, which is provided by American Nuclear Insurers ("ANI"). The remaining balance of approximately $13.0 billion of liability coverage is provided through a mandatory industry-wide retrospective premium program. If losses at any nuclear power plant covered by the program exceed the accumulated funds, APS could be responsible for retrospective premiums. The maximum retrospective premium per reactor under the program for each nuclear liability incident is approximately $127.3 million, subject to a maximum annual premium of $19 million per incident. Based on APS’s ownership interest in the three Palo Verde units, APS’s maximum retrospective premium per incident for all three units is approximately $111.1 million, with a maximum annual retrospective premium of approximately $16.6 million.
The Palo Verde participants maintain insurance for property damage to, and decontamination of, property at Palo Verde in the aggregate amount of $2.8 billion. APS has also secured accidental outage insurance for a sudden and unforeseen accidental outage of any of the three units. The property damage,

COMBINED NOTES TO CONSOLIDATED FINANCIAL STATEMENTS
145
decontamination, and accidental outage insurance are provided by Nuclear Electric Insurance Limited ("NEIL"). APS is subject to retrospective premium adjustments under all NEIL policies if NEIL’s losses in any policy year exceed accumulated funds. The maximum amount APS could incur under the current NEIL policies totals approximately $24 million for each retrospective premium assessment declared by NEIL’s Board of Directors due to losses. In addition, NEIL policies contain rating triggers that would result in APS providing approximately $64.8 million of collateral assurance within 20 business days of a rating downgrade to non-investment grade. The insurance coverage discussed in this and the previous paragraph is subject to certain policy conditions, sublimits and exclusions. Fuel and Purchased Power Commitments and Purchase Obligations
APS is party to various fuel and purchased power contracts and purchase obligations with terms expiring between 2018 and 2043 that include required purchase provisions. APS estimates the contract requirements to be approximately $715 million in 2018; $578 million in 2019; $548 million in 2020; $548 million in 2021; $554 million in 2022; and $6.5 billion thereafter. However, these amounts may vary significantly pursuant to certain provisions in such contracts that permit us to decrease required purchases under certain circumstances.
Of the various fuel and purchased power contracts mentioned above, some of those contracts for coal
supply include take-or-pay provisions. The current coal contracts with take-or-pay provisions have terms expiring through 2031.
The following table summarizes our estimated coal take-or-pay commitments (dollars in thousands):
Years Ended December 31,
2018 2019 2020 2021 2022 Thereafter
Coal take-or-pay commitments (a) $ 159,997 $ 185,365 $ 186,632 $ 190,607 $ 194,678 $ 1,750,739
(a) Total take-or-pay commitments are approximately $2.7 billion. The total net present value of these commitments is approximately $1.9 billion.
APS may spend more to meet its actual fuel requirements than the minimum purchase obligations in our coal take-or-pay contracts. The following table summarizes actual amounts purchased under the coal contracts which include take-or-pay provisions for each of the last three years (dollars in thousands):
Year Ended December 31,
2017 2016 2015
Total purchases $ 165,220 $ 160,066 $ 211,327
Renewable Energy Credits
APS has entered into contracts to purchase renewable energy credits to comply with the RES. APS estimates the contract requirements to be approximately $40 million in 2018; $40 million in 2019; $40 million in 2020; $40 million in 2021; $40 million in 2022; and $370 million thereafter. These amounts do not include purchases of renewable energy credits that are bundled with energy.

COMBINED NOTES TO CONSOLIDATED FINANCIAL STATEMENTS
146
Coal Mine Reclamation Obligations
APS and 4CA must reimburse certain coal providers for amounts incurred for final and contemporaneous coal mine reclamation. We account for contemporaneous reclamation costs as part of the cost of the delivered coal. We utilize site-specific studies of costs expected to be incurred in the future to estimate our final reclamation obligation. These studies utilize various assumptions to estimate the future costs. Based on the most recent reclamation studies, APS recorded an obligation for the coal mine final reclamation of approximately $216 million at December 31, 2017 and $207 million at December 31, 2016. 4CA recorded an obligation for the coal mine final reclamation of approximately $16 million at December 31, 2017 and $15 million at December 31, 2016. Under our current coal supply agreements, APS expects to make payments for the final mine reclamation as follows: $31 million in 2018; $32 million in 2019; $21 million in 2020; $20 million in 2021; $22 million in 2022; and $191 million thereafter. 4CA expects to make payments for the final mine reclamation as follows: $1 million in 2018; $1 million in 2019; $2 million in 2020; $2 million in 2021; $2 million in 2022; and $16 million thereafter. Any amendments to current coal supply agreements may change the timing of the contribution. Portions of these funds will be held in an escrow account and distributed to certain coal providers under the terms of the applicable coal supply agreements.
Superfund-Related Matters
Superfund establishes liability for the cleanup of hazardous substances found contaminating the soil, water or air. Those who generated, transported or disposed of hazardous substances at a contaminated site are among those who are PRPs. PRPs may be strictly, and often are jointly and severally, liable for clean-up. On September 3, 2003, EPA advised APS that EPA considers APS to be a PRP in the Motorola 52nd Street Superfund Site, Operable Unit 3 ("OU3") in Phoenix, Arizona. APS has facilities that are within this Superfund site. APS and Pinnacle West have agreed with EPA to perform certain investigative activities of the APS facilities within OU3. In addition, on September 23, 2009, APS agreed with EPA and one other PRP to voluntarily assist with the funding and management of the site-wide groundwater RI/FS. Based upon discussions between the OU3 working group parties and EPA, along with the results of recent technical analyses prepared by the OU3 working group to supplement the RI/FS, APS anticipates finalizing the RI/FS in the summer or fall of 2018. We estimate that our costs related to this investigation and study will be approximately $2 million. We anticipate incurring additional expenditures in the future, but because the overall investigation is not complete and ultimate remediation requirements are not yet finalized, at the present time expenditures related to this matter cannot be reasonably estimated.
On August 6, 2013, RID filed a lawsuit in Arizona District Court against APS and 24 other defendants,
alleging that RID’s groundwater wells were contaminated by the release of hazardous substances from facilities owned or operated by the defendants. The lawsuit also alleges that, under Superfund laws, the defendants are jointly and severally liable to RID. The allegations against APS arise out of APS’s current and former ownership of facilities in and around OU3. As part of a state governmental investigation into groundwater contamination in this area, on January 25, 2015, ADEQ sent a letter to APS seeking information concerning the degree to which, if any, APS’s current and former ownership of these facilities may have contributed to groundwater contamination in this area. APS responded to ADEQ on May 4, 2015. On December 16, 2016, two RID contractors filed ancillary lawsuits for recovery of costs against APS and the other defendants. Because the ancillary lawsuits concern past costs allegedly incurred by these RID vendors, which were ruled unrecoverable directly by RID in November of 2016, the additional lawsuits do not increase APS’s exposure or risk related to these matters. In addition, on March 15, 2017, the Arizona District Court granted partial summary judgment to RID for one element of RID's lawsuit against APS and the other defendants. On May 12, 2017, the court denied a motion for reconsideration as to this order. We are unable to

COMBINED NOTES TO CONSOLIDATED FINANCIAL STATEMENTS
147
predict the outcome of these matters; however, we do not expect the outcome to have a material impact on our financial position, results of operations or cash flows. Environmental Matters
APS is subject to numerous environmental laws and regulations affecting many aspects of its present and future operations, including air emissions of both conventional pollutants and greenhouse gases, water quality, wastewater discharges, solid waste, hazardous waste, and CCRs. These laws and regulations can change from time to time, imposing new obligations on APS resulting in increased capital, operating, and other costs. Associated capital expenditures or operating costs could be material. APS intends to seek recovery of any such environmental compliance costs through our rates, but cannot predict whether it will obtain such recovery. The following proposed and final rules involve material compliance costs to APS.
Regional Haze Rules. APS has received the final rulemaking imposing new pollution control
requirements on Four Corners and the Navajo Plant. EPA will require these plants to install pollution control equipment that constitutes BART to lessen the impacts of emissions on visibility surrounding the plants. EPA approved a proposed rule for Regional Haze compliance at Cholla that does not involve the installation of new pollution controls and that will replace an earlier BART determination for this facility. See below for details of the Cholla BART approval.
Four Corners. Based on EPA’s final standards, APS's 63% share of the cost of required controls for Four Corners Units 4 and 5 is approximately $400 million. In addition, APS and El Paso entered into an asset purchase agreement providing for the purchase by APS, or an affiliate of APS, of El Paso's 7% interest in Four Corners Units 4 and 5. 4CA purchased the El Paso interest on July 6, 2016. NTEC had the option to purchase the interest within a certain timeframe pursuant to an option granted to NTEC. In December 2015, NTEC notified APS of its intent to exercise the option. The purchase did not occur during the originally contemplated timeframe. The parties are currently in discussions as to the future of the option transaction. The cost of the pollution controls related to the 7% interest is approximately $45 million, which will be assumed by the ultimate owner of the 7% interest.
Navajo Plant. APS estimates that its share of costs for upgrades at the Navajo Plant, based on EPA’s FIP, could be up to approximately $200 million; however, given the future plans for the Navajo Plant, we do not expect to incur these costs. See "Navajo Plant" in Note 3 for information regarding future plans for the Navajo Plant.
Cholla. APS believed that EPA’s original 2012 final rule establishing controls constituting BART for Cholla, which would require installation of SCR controls, was unsupported and that EPA had no basis for disapproving Arizona’s SIP and promulgating a FIP that was inconsistent with the state’s considered BART determinations under the regional haze program. In September 2014, APS met with EPA to propose a compromise BART strategy. APS would permanently close Cholla Unit 2 and cease burning coal at Units 1 and 3 by the mid-2020s. (See Note 3 for details related to the resulting regulatory asset.) APS made the proposal with the understanding that additional emission control equipment is unlikely to be required in the future because retiring and/or converting the units as contemplated in the proposal is more cost effective than, and will result in increased visibility improvement over, the current BART requirements for NOx imposed on the Cholla units under EPA's BART FIP.
On October 16, 2015, ADEQ issued a revised operating permit for Cholla, which incorporates APS's proposal, and subsequently submitted a proposed revision to the SIP to EPA, which would incorporate the new permit terms. On June 30, 2016, EPA issued a proposed rule approving a revision to the Arizona SIP that

COMBINED NOTES TO CONSOLIDATED FINANCIAL STATEMENTS
148
incorporates APS’s compromise approach for compliance with the Regional Haze program. In early 2017, EPA approved a final rule incorporating APS's compromise proposal, which took effect for Cholla on April 26, 2017.
Coal Combustion Waste. On December 19, 2014, EPA issued its final regulations governing the
handling and disposal of CCR, such as fly ash and bottom ash. The rule regulates CCR as a non-hazardous waste under Subtitle D of RCRA and establishes national minimum criteria for existing and new CCR landfills and surface impoundments and all lateral expansions consisting of location restrictions, design and operating criteria, groundwater monitoring and corrective action, closure requirements and post closure care, and recordkeeping, notification, and Internet posting requirements. The rule generally requires any existing unlined CCR surface impoundment that is contaminating groundwater above a regulated constituent’s groundwater protection standard to stop receiving CCR and either retrofit or close, and further requires the closure of any CCR landfill or surface impoundment that cannot meet the applicable performance criteria for location restrictions or structural integrity.
While EPA has chosen to regulate the disposal of CCR in landfills and surface impoundments as non-hazardous waste under the final rule, the agency makes clear that it will continue to evaluate any risks associated with CCR disposal and leaves open the possibility that it may regulate CCR as a hazardous waste under RCRA Subtitle C in the future. On December 16, 2016, President Obama signed the WIIN Act into law, which contains a number of provisions requiring EPA to modify the self-implementing provisions of the Agency's current CCR rules under Subtitle D. Such modifications include new EPA authority to directly enforce the CCR rules through the use of administrative orders and providing states, like Arizona, where the Cholla facility is located, the option of developing CCR disposal unit permitting programs, subject to EPA approval. For facilities in states that do not develop state-specific permitting programs, EPA is required to develop a federal permit program, pending the availability of congressional appropriations. By contrast, for facilities located within the boundaries of Native American tribal reservations, such as the Navajo Nation, where the Navajo Plant and Four Corners facilities are located, EPA is required to develop a federal permit program regardless of appropriated funds.
ADEQ has initiated a process to evaluate how to develop a state CCR permitting program that would cover EGUs, including Cholla. While APS has been working with ADEQ on the development of this program, we are unable to predict when Arizona will be able to finalize and secure EPA approval for a state-specific CCR permitting program. With respect to the Navajo Nation, APS recently filed a comment letter with EPA seeking clarification as to when and how EPA would be initiating permit proceedings for facilities on the reservation, including Four Corners. We are unable to predict at this time when EPA will be issuing CCR management permits for the facilities on the Navajo Nation. At this time, it remains unclear how the CCR provisions of the WIIN Act will affect APS and its management of CCR.
Based upon utility industry petitions for EPA to reconsider the RCRA Subtitle D regulations for CCR, which were premised in part on the CCR provisions of the 2016 WIIN Act, on September 13, 2017 EPA agreed to evaluate whether to revise these federal CCR regulations. At this time, it is not clear whether EPA will initiate further notice-and-comment rulemaking to revise the federal CCR rules, nor is it clear what aspects of the federal CCR rules might be changed as a result of this process. With respect to ongoing litigation initiated by industry and environmental groups challenging the legality of these federal CCR regulations, on September 27, 2017 the United States Court of Appeals for the D.C. Circuit, the court overseeing these judicial challenges, ordered EPA to file by November 15, 2017 a list of federal regulatory provisions addressing CCR that are or likely will be revised through EPA’s reconsideration proceedings. While this filing identified certain provisions of the federal CCR regulations that EPA intends to revise, including allowances for risk-based

COMBINED NOTES TO CONSOLIDATED FINANCIAL STATEMENTS
149
groundwater protection standards for regulated CCR constituents for which no federal maximum contaminant level has been set, it is not clear at this time which specific provisions of the federal CCR rules will be modified, how they will be modified, or when such modification will occur. Pursuant to a June 24, 2016 order by the D.C. Circuit Court of Appeals in the litigation by industry- and environmental-groups challenging EPA’s CCR regulations, within the next 2 years EPA is required to complete a rulemaking proceeding concerning whether or not boron must be included on the list of groundwater constituents that might trigger corrective action under EPA’s CCR rules. EPA is not required to take final action approving the inclusion of boron, but EPA must propose and consider its inclusion. Should EPA take final action adding boron to the list of groundwater constituents that might trigger corrective action, any resulting corrective action measures may increase APS's costs of compliance with the CCR rule at our coal-fired generating facilities. At this time APS cannot predict when EPA will commence its rulemaking concerning boron or the eventual results of those proceedings.
APS currently disposes of CCR in ash ponds and dry storage areas at Cholla and Four Corners. APS estimates that its share of incremental costs to comply with the CCR rule for Four Corners is approximately $22 million and its share of incremental costs to comply with the CCR rule for Cholla is approximately $20 million. The Navajo Plant currently disposes of CCR in a dry landfill storage area. APS estimates that its share of incremental costs to comply with the CCR rule for the Navajo Plant is approximately $1 million. Additionally, the CCR rule requires ongoing, phased groundwater monitoring. By October 17, 2017, electric utility companies that own or operate CCR disposal units, such as APS, must have collected sufficient groundwater sampling data to initiate a detection monitoring program. To the extent that certain threshold constituents are identified through this initial detection monitoring at levels above the CCR rule’s standards, the rule requires the initiation of an assessment monitoring program by April 15, 2018. If this assessment monitoring program reveals concentrations of certain constituents above the CCR rule standards that trigger remedial obligations, a corrective measures evaluation must be completed by January 2019. Depending upon the results of such groundwater monitoring and data evaluations at each of Cholla, Four Corners and the Navajo Plant, we may be required to take corrective actions, the costs of which we are unable to reasonably estimate at this time.
Clean Power Plan. On August 3, 2015, EPA finalized carbon pollution standards for EGUs. Shortly thereafter, a coalition of states, industry groups and electric utilities challenged the legality of these standards, including EPA's Clean Power Plan for existing EGUs, in the U.S. Court of Appeals for the D.C. Circuit. On February 9, 2016, the U.S. Supreme Court granted a stay of the Clean Power Plan pending judicial review of the rule, which temporarily delays compliance obligations under the Clean Power Plan. On March 28, 2017, President Trump issued an Executive Order that, among other things, instructs EPA to reevaluate Agency regulations concerning carbon emissions from EGUs and take appropriate action to suspend, revise or rescind the August 2015 carbon pollution standards for EGUs, including the Clean Power Plan. Also on March 28, 2017, the U.S. Department of Justice, on behalf of EPA, filed a motion with the U.S. Court of Appeals for the D.C. Circuit Court to hold the ongoing litigation over the Clean Power Plan in abeyance pending EPA action in accordance with the Executive Order. At this time, the D.C. Circuit Court proceedings evaluating the legality of the Clean Power Plan remain on hold.
Based upon EPA's reevaluation of the August 2015 carbon pollution standards and the legal basis for these regulations, on October 10, 2017, EPA issued a proposal to repeal the Clean Power Plan. That proposal relies on EPA's current view as to the Agency's legal authority under Clean Air Act Section 111(d), which (in contrast to the Clean Power Plan) would limit the scope of any future Section 111(d) regulations to measures undertaken exclusively at a power plant's source of GHG emissions. On December 18, 2017, EPA issued an Advanced Notice of Proposed Rulemaking through which EPA is soliciting comments as to potential

COMBINED NOTES TO CONSOLIDATED FINANCIAL STATEMENTS
150
replacements for the Clean Power Plan that would be consistent with EPA's current legal interpretation of the Clean Air Act.
We cannot predict the outcome of EPA's regulatory actions related to the August 2015 carbon pollution standards for EGU's, including any actions related to EPA's repeal proposal for the Clean Power Plan or additional rulemaking actions to develop regulations replacing the Clean Power Plan. In addition, we cannot predict whether the D.C. Circuit Court will continue to hold the litigation challenging the original Clean Power Plan in abeyance in light of EPA's repeal proposal.
Other environmental rules that could involve material compliance costs include those related to effluent limitations, the ozone national ambient air quality standard and other rules or matters involving the Clean Air Act, Clean Water Act, Endangered Species Act, RCRA, Superfund, the Navajo Nation, and water supplies for our power plants. The financial impact of complying with current and future environmental rules could jeopardize the economic viability of our coal plants or the willingness or ability of power plant participants to fund any required equipment upgrades or continue their participation in these plants. The economics of continuing to own certain resources, particularly our coal plants, may deteriorate, warranting early retirement of those plants, which may result in asset impairments. APS would seek recovery in rates for the book value of any remaining investments in the plants as well as other costs related to early retirement, but cannot predict whether it would obtain such recovery.
Federal Agency Environmental Lawsuit Related to Four Corners
On April 20, 2016, several environmental groups filed a lawsuit against OSM and other federal agencies in the District of Arizona in connection with their issuance of the approvals that extended the life of Four Corners and the adjacent mine. The lawsuit alleges that these federal agencies violated both ESA and NEPA in providing the federal approvals necessary to extend operations at the Four Corners Power Plant and the adjacent Navajo Mine past July 6, 2016. APS filed a motion to intervene in the proceedings, which was granted on August 3, 2016.
On September 15, 2016, NTEC, the company that owns the adjacent mine, filed a motion to intervene for the purpose of dismissing the lawsuit based on NTEC's tribal sovereign immunity. On September 11, 2017, the Arizona District Court issued an order granting NTEC's motion, dismissing the litigation with prejudice, and terminating the proceedings. On November 9, 2017, the environmental group plaintiffs appealed the district court order dismissing their lawsuit. We cannot predict whether this appeal will be successful and, if it is successful, the outcome of further district court proceedings.
Four Corners Coal Supply Agreement
Arbitration
On June 13, 2017, APS received a Demand for Arbitration from NTEC in connection with the 2016 Coal Supply Agreement, dated December 30, 2013, under which NTEC supplies coal to APS and the other Four Corners owners (collectively, the “Buyer”) for use at the Four Corners Power Plant. NTEC was originally seeking a declaratory judgment to support its interpretation of a provision regarding uncontrollable forces in the agreement that relates to annual minimum quantities of coal to be purchased by the Buyer. NTEC also alleged a shortfall in the Buyer’s purchases for the initial contract year of approximately $30 million. APS’s share of this amount is approximately $17 million. On September 20, 2017, NTEC amended its Demand for Arbitration removing its request for a declaratory judgment and at this time is only seeking relief for the alleged shortfall in the Buyer's purchases for the initial contract year. We cannot predict the timing or

COMBINED NOTES TO CONSOLIDATED FINANCIAL STATEMENTS
151
outcome of this arbitration; however we do not expect the outcome to have a material impact on our financial position, results of operations or cash flows.
4CA Matter
On July 6, 2016, 4CA purchased El Paso’s 7% interest in Four Corners. NTEC had the option to purchase the 7% interest within a certain timeframe pursuant to an option granted to NTEC. On December 29, 2015, NTEC provided notice of its intent to exercise the option. The purchase did not occur during the originally contemplated timeframe. The parties are currently in discussions as to the future of the option transaction.
The 2016 Coal Supply Agreement contains alternate pricing terms for the 7% interest in the event NTEC does not purchase the interest. At this time, since NTEC has not yet purchased the 7% interest, the alternate pricing provisions are applicable to 4CA as the holder of the 7% interest. These terms include a formula under which NTEC must make certain payments to 4CA for reimbursement of operations and maintenance costs and a specified rate of return, offset by revenue generated by 4CA’s power sales. Such payments are due to 4CA at the end of each calendar year. A $10 million payment was due to 4CA at December 31, 2017, which NTEC satisfied by directing to 4CA a prepayment from APS of a portion of a future mine reclamation obligation. The balance of the amount under this formula at December 31, 2017 is approximately $20 million, which is due to 4CA at December 31, 2018. In future years there may be similar payments due from NTEC to 4CA under this formula. 4CA believes NTEC should continue to satisfy its contractual obligations related to these payments; however, if NTEC fails to meet its contractual obligations when due, 4CA will consider appropriate measures and potential impacts to the Company's financial statements.
Financial Assurances In the normal course of business, we obtain standby letters of credit and surety bonds from financial institutions and other third parties. These instruments guarantee our own future performance and provide third parties with financial and performance assurance in the event we do not perform. These instruments support certain commodity contract collateral obligations and other transactions. As of December 31, 2017, standby letters of credit totaled $5 million and will expire in 2018. As of December 31, 2017, surety bonds expiring through 2019 totaled $62 million. The underlying liabilities insured by these instruments are reflected on our balance sheets, where applicable. Therefore, no additional liability is reflected for the letters of credit and surety bonds themselves.
We enter into agreements that include indemnification provisions relating to liabilities arising from or
related to certain of our agreements. Most significantly, APS has agreed to indemnify the equity participants and other parties in the Palo Verde sale leaseback transactions with respect to certain tax matters. Generally, a maximum obligation is not explicitly stated in the indemnification provisions and, therefore, the overall maximum amount of the obligation under such indemnification provisions cannot be reasonably estimated. Based on historical experience and evaluation of the specific indemnities, we do not believe that any material loss related to such indemnification provisions is likely.
Pinnacle West has issued parental guarantees and has provided indemnification under certain surety
bonds for APS which were not material at December 31, 2017. Since July 6, 2016, Pinnacle West has issued four parental guarantees for 4CA relating to payment obligations arising from 4CA’s acquisition of El Paso’s 7% interest in Four Corners, and pursuant to the Four Corners participation agreement payment obligations arising from 4CA’s ownership interest in Four Corners.

COMBINED NOTES TO CONSOLIDATED FINANCIAL STATEMENTS
152
11. Asset Retirement Obligations In 2017, APS received a new decommissioning study for the Navajo Plant. This resulted in an increase to the ARO in the amount of $22 million, an increase in regulatory asset of $2 million and a reduction of the regulatory liability of $20 million.
In 2016, APS recognized an ARO for the Ocotillo steam units as a condition of the air permit (issued in 2016) to allow the construction and operation of five new turbine units. This resulted in an increase to the ARO in the amount of $10 million. In addition, 4CA acquired El Paso's share of Four Corners Units 4 and 5 and the associated ARO. This resulted in an increase to the ARO in the amount of $9 million. In addition, Four Corners spent $16 million in actual decommissioning costs. Finally, in 2016, APS received a new decommissioning study for the Palo Verde Generating Station. This resulted in an increase to the ARO in the amount of $151 million, an increase in plant in service of $131 million, and a reduction of the regulatory liability of $20 million.
The following table shows the change in our asset retirement obligations for 2017 and 2016 (dollars in thousands):
2017 2016Asset retirement obligations at the beginning of year $ 624,475 $ 443,576
Changes attributable to: Accretion expense 33,104 26,656Settlements — (15,732)Estimated cash flow revisions 21,950 151,046Newly incurred or acquired obligations — 18,929
Asset retirement obligations at the end of year $ 679,529 $ 624,475 In accordance with regulatory accounting, APS accrues removal costs for its regulated utility assets, even if there is no legal obligation for removal. See detail of regulatory liabilities in Note 3.

COMBINED NOTES TO CONSOLIDATED FINANCIAL STATEMENTS
153
12. Selected Quarterly Financial Data (Unaudited)
Consolidated quarterly financial information for 2017 and 2016 is provided in the tables below (dollars in thousands, except per share amounts). Weather conditions cause significant seasonal fluctuations in our revenues; therefore, results for interim periods do not necessarily represent results expected for the year.
2017 Quarter Ended 2017
March 31, June 30, September 30, December 31, Total
Operating revenues $ 677,728 $ 944,587 $ 1,183,322 $ 759,659 $ 3,565,296Operations and maintenance 219,976 214,013 224,305 266,149 924,443Operating income 73,506 304,229 466,082 90,610 934,427Income taxes 4,211 88,967 144,319 20,775 258,272Net income 28,185 172,317 280,945 26,502 507,949Net income attributable to commonshareholders 23,312 167,443 276,072 21,629 488,456
Earnings Per Share:
Net income attributable to commonshareholders — Basic $ 0.21 $ 1.50 $ 2.47 $ 0.19 $ 4.37Net income attributable to commonshareholders — Diluted 0.21 1.49 2.46 0.19 4.35
2016 Quarter Ended 2016
March 31, June 30, September 30, December 31, Total
Operating revenues $ 677,167 $ 915,394 $ 1,166,922 $ 739,199 $ 3,498,682Operations and maintenance 243,195 242,279 217,568 208,277 911,319Operating income 50,162 231,748 451,258 122,816 855,984Income taxes 1,914 65,742 141,446 27,309 236,411Net income 9,326 126,182 267,900 58,119 461,527Net income attributable to commonshareholders 4,453 121,308 263,027 53,246 442,034
Earnings Per Share:
Net income attributable to commonshareholders — Basic $ 0.04 $ 1.09 $ 2.36 $ 0.48 $ 3.97Net income attributable to commonshareholders — Diluted 0.04 1.08 2.35 0.47 3.95

COMBINED NOTES TO CONSOLIDATED FINANCIAL STATEMENTS
154
Selected Quarterly Financial Data (Unaudited) - APS
APS's quarterly financial information for 2017 and 2016 is as follows (dollars in thousands):
2017 Quarter Ended, 2017
March 31, June 30, September 30, December 31, Total
Operating revenues $ 676,869 $ 942,615 $ 1,178,106 $ 756,549 $ 3,554,139Operations and maintenance 212,218 208,286 215,264 255,361 891,129Operating income 65,468 212,790 322,053 79,258 679,569Net income attributable to common shareholder 23,162 169,108 284,256 27,783 504,309
2016 Quarter Ended, 2016
March 31, June 30, September 30, December 31, Total
Operating revenues $ 676,632 $ 909,757 $ 1,166,359 $ 737,006 $ 3,489,754Operations and maintenance 238,711 233,712 209,366 197,319 879,108Operating income 48,930 165,684 307,601 95,765 617,980Net income attributable to common shareholder 7,253 127,188 269,220 58,480 462,141
13. Fair Value Measurements
We classify our assets and liabilities that are carried at fair value within the fair value hierarchy. This hierarchy ranks the quality and reliability of the inputs used to determine fair values, which are then classified and disclosed in one of three categories. The three levels of the fair value hierarchy are:
Level 1 — Unadjusted quoted prices in active markets for identical assets or liabilities.
Level 2 — Other significant observable inputs, including quoted prices in active markets for similar assets or liabilities; quoted prices in markets that are not active, and model-derived valuations whose inputs are observable (such as yield curves).
Level 3 — Valuation models with significant unobservable inputs that are supported by little or no
market activity. Instruments in this category include long-dated derivative transactions where valuations are unobservable due to the length of the transaction, options, and transactions in locations where observable market data does not exist. The valuation models we employ utilize spot prices, forward prices, historical market data and other factors to forecast future prices.
Assets and liabilities are classified in their entirety based on the lowest level of input that is significant
to the fair value measurement. Thus, a valuation may be classified in Level 3 even though the valuation may include significant inputs that are readily observable. We maximize the use of observable inputs and minimize the use of unobservable inputs. We rely primarily on the market approach of using prices and other market information for identical and/or comparable assets and liabilities. If market data is not readily available, inputs may reflect our own assumptions about the inputs market participants would use. Our assessment of the inputs and the significance of a particular input to the fair value measurement requires judgment and may affect the valuation of fair value assets and liabilities as well as their placement within the fair value hierarchy levels. We assess whether a market is active by obtaining observable broker quotes, reviewing actual market activity, and assessing the volume of transactions. We consider broker quotes observable inputs when the quote is

COMBINED NOTES TO CONSOLIDATED FINANCIAL STATEMENTS
155
binding on the broker, we can validate the quote with market activity, or we can determine that the inputs the broker used to arrive at the quoted price are observable.
Certain instruments have been valued using the concept of NAV, as a practical expedient. These instruments are typically structured as investment companies offering shares or units to multiple investors for the purpose of providing a return. These instruments are similar to mutual funds; however, their NAV is generally not published and publicly available, nor are these instruments traded on an exchange. Instruments valued using NAV, as a practical expedient are included in our fair value disclosures however, in accordance with GAAP are not classified within the fair value hierarchy levels.
Recurring Fair Value Measurements
We apply recurring fair value measurements to certain cash equivalents, derivative instruments, and investments held in our coal reclamation escrow accounts and nuclear decommissioning trust. On an annual basis we apply fair value measurements to plan assets held in our retirement and other benefit plans. See Note 7 for fair value discussion of plan assets held in our retirement and other benefit plans.
Cash Equivalents Cash equivalents represent short-term investments with original maturities of three months or less in
exchange traded money market funds that are valued using quoted prices in active markets.
Risk Management Activities — Derivative Instruments Exchange traded commodity contracts are valued using unadjusted quoted prices. For non-exchange
traded commodity contracts, we calculate fair value based on the average of the bid and offer price, discounted to reflect net present value. We maintain certain valuation adjustments for a number of risks associated with the valuation of future commitments. These include valuation adjustments for liquidity and credit risks. The liquidity valuation adjustment represents the cost that would be incurred if all unmatched positions were closed out or hedged. The credit valuation adjustment represents estimated credit losses on our net exposure to counterparties, taking into account netting agreements, expected default experience for the credit rating of the counterparties and the overall diversification of the portfolio. We maintain credit policies that management believes minimize overall credit risk.
Certain non-exchange traded commodity contracts are valued based on unobservable inputs due to the
long-term nature of contracts, characteristics of the product, or the unique location of the transactions. Our long-dated energy transactions consist of observable valuations for the near-term portion and unobservable valuations for the long-term portions of the transaction. We rely primarily on broker quotes to value these instruments. When our valuations utilize broker quotes, we perform various control procedures to ensure the quote has been developed consistent with fair value accounting guidance. These controls include assessing the quote for reasonableness by comparison against other broker quotes, reviewing historical price relationships, and assessing market activity. When broker quotes are not available, the primary valuation technique used to calculate the fair value is the extrapolation of forward pricing curves using observable market data for more liquid delivery points in the same region and actual transactions at more illiquid delivery points.
When the unobservable portion is significant to the overall valuation of the transaction, the entire
transaction is classified as Level 3. Our classification of instruments as Level 3 is primarily reflective of the long-term nature of our energy transactions.

COMBINED NOTES TO CONSOLIDATED FINANCIAL STATEMENTS
156
Our energy risk management committee, consisting of officers and key management personnel, oversees our energy risk management activities to ensure compliance with our stated energy risk management policies. We have a risk control function that is responsible for valuing our derivative commodity instruments in accordance with established policies and procedures. The risk control function reports to the chief financial officer’s organization.
Investments Held in Nuclear Decommissioning Trust and Coal Reclamation Escrow The nuclear decommissioning trust invests in fixed income securities, equity securities, and may hold
cash and cash equivalents. The coal reclamation escrow account invests in fixed income instruments and may also hold cash and cash equivalents. See Note 19 for additional discussion about our investment accounts.
The nuclear decommissioning trust's equity security investments are held indirectly through commingled funds. The commingled funds are valued using the funds' NAV as a practical expedient. The funds' NAV is primarily derived from the quoted active market prices of the underlying equity securities held by the funds. We may transact in these commingled funds on a semi-monthly basis at the NAV. The commingled funds are maintained by a bank and hold investments in accordance with the stated objective of tracking the performance of the S&P 500 Index. Because the commingled funds' shares are offered to a limited group of investors, they are not considered to be traded in an active market. As these instruments are valued using NAV, as a practical expedient, they have not been classified within the fair value hierarchy.
Fixed income securities issued by the U.S. Treasury are valued using quoted active market prices and
are typically classified as Level 1. Fixed income securities issued by corporations, municipalities, and other agencies, including mortgage-backed instruments, are valued using quoted inactive market prices, quoted active market prices for similar securities, or by utilizing calculations which incorporate observable inputs such as yield curves and spreads relative to such yield curves. These fixed income instruments are classified as Level 2. Whenever possible, multiple market quotes are obtained which enables a cross-check validation. A primary price source is identified based on asset type, class, or issue of securities.
Cash equivalents reported within Level 1 represent investments held in short-term investment exchange-traded mutual funds. These short-term investment accounts invest in certificates of deposit, variable rate notes, time deposit accounts, U.S. Treasury and Agency obligations, U.S. Treasury repurchase agreements, commercial paper, and other short term instruments.
We price investment securities using information provided by our trustees for our nuclear
decommissioning trust assets, and provided by our escrow agent for coal reclamation escrow assets. Our trustee and escrow agent use pricing services that utilize the valuation methodologies described above to determine fair market value. We have internal control procedures designed to ensure this information is consistent with fair value accounting guidance. These procedures include assessing valuations using an independent pricing source, verifying that pricing can be supported by actual recent market transactions, assessing hierarchy classifications, comparing investment returns with benchmarks, and obtaining and reviewing independent audit reports on the trustee’s and escrow agent's internal operating controls and valuation processes.

COMBINED NOTES TO CONSOLIDATED FINANCIAL STATEMENTS
157
Fair Value Tables The following table presents the fair value at December 31, 2017 of our assets and liabilities that are
measured at fair value on a recurring basis (dollars in thousands):
Quoted Pricesin Active
Markets forIdentical
Assets(Level 1)
SignificantOther
ObservableInputs
(Level 2)
SignificantUnobservable
Inputs (a)(Level 3) Other
Balance atDecember 31,
2017
Assets
Cash equivalents $ 10,630 $ — $ — $ — $ 10,630Risk management activities —derivative instruments:
Commodity contracts — 5,683 1,036 (4,737) (b) 1,982Coal reclamation escrow account (c): 455 31,562 — 525 32,542Nuclear decommissioning trust:
Cash and cash equivalents 7,224 — — 109 (d) 7,333U.S. commingled equity funds — — — 417,390 (e) 417,390Fixed income securities:
U.S. Treasury 127,662 — — —
127,662Corporate debt — 114,007 — —
114,007Mortgage-backed securities — 111,874 — —
111,874Municipal bonds — 79,049 — —
79,049Other — 13,685 — —
13,685Subtotal nuclear decommissioning trust 134,886 318,615 — 417,499 871,000
Total Assets $ 145,971 $ 355,860 $ 1,036 $ 413,287 $ 916,154Liabilities
Risk management activities —derivative instruments:
Commodity contracts $ — $ (78,646) $ (19,292) $ 1,516 (b) $ (96,422)
(a) Primarily consists of long-dated electricity contracts.(b) Represents counterparty netting, margin, and collateral. See Note 16.(c) Represents investments restricted for coal mine reclamation funding related to Four Corners. These
assets are included in the Other Assets line item, reported under the Investments and Other Assets section of our Consolidated Balance Sheets. Primarily consists of fixed income municipal bonds.
(d) Represents nuclear decommissioning trust net pending securities sales and purchases.(e) Valued using NAV as a practical expedient and, therefore, are not classified in the fair value
hierarchy.

COMBINED NOTES TO CONSOLIDATED FINANCIAL STATEMENTS
158
The following table presents the fair value at December 31, 2016 of our assets and liabilities that are
measured at fair value on a recurring basis (dollars in thousands):
Quoted Pricesin Active
Markets forIdentical
Assets(Level 1)
SignificantOther
ObservableInputs
(Level 2)
SignificantUnobservable
Inputs (a)(Level 3) Other
Balance atDecember 31,
2016
Assets
Coal reclamation trust (b):$ 14,521 $ — $ — $ — $ 14,521
Risk management activities —derivative instruments:
Commodity contracts — 43,722 11,076 (35,103) (c) 19,695Nuclear decommissioning trust:
U.S. commingled equity funds — — — 353,261 (d) 353,261Fixed income securities:
Cash and cash equivalent funds — — — 795 (e) 795U.S. Treasury 95,441 — — —
95,441Corporate debt — 111,623 — —
111,623Mortgage-backed securities — 115,337 — —
115,337Municipal bonds — 80,997 — —
80,997Other — 22,132 — —
22,132Subtotal nuclear decommissioning trust 95,441 330,089 — 354,056 779,586
Total $ 109,962 $ 373,811 $ 11,076 $ 318,953 $ 813,802Liabilities
Risk management activities —derivative instruments:
Commodity contracts $ — $ (45,641) $ (58,482) $ 31,049 (c) $ (73,074)
(a) Primarily consists of long-dated electricity contracts.(b) Represents investments restricted for coal mine reclamation funding related to Four Corners. These
assets are included in the Other Assets line item, reported under the Investments and Other Assets section of our Consolidated Balance Sheets. Primarily consists of cash equivalents. Presented as Coal reclamation escrow in 2017.
(c) Represents counterparty netting, margin and collateral. See Note 16.(d) Valued using NAV as a practical expedient and, therefore, are not classified in the fair value
hierarchy.(e) Represents nuclear decommissioning trust net pending securities sales and purchases.
Fair Value Measurements Classified as Level 3
The significant unobservable inputs used in the fair value measurement of our energy derivative contracts include broker quotes that cannot be validated as an observable input primarily due to the long-term nature of the quote. Significant changes in these inputs in isolation would result in significantly higher or lower fair value measurements. Changes in our derivative contract fair values, including changes relating to unobservable inputs, typically will not impact net income due to regulatory accounting treatment (see Note 3).

COMBINED NOTES TO CONSOLIDATED FINANCIAL STATEMENTS
159
Because our forward commodity contracts classified as Level 3 are currently in a net purchase position, we would expect price increases of the underlying commodity to result in increases in the net fair value of the related contracts. Conversely, if the price of the underlying commodity decreases, the net fair value of the related contracts would likely decrease.
Other unobservable valuation inputs include credit and liquidity reserves which do not have a material impact on our valuations; however, significant changes in these inputs could also result in higher or lower fair value measurements.
The following tables provide information regarding our significant unobservable inputs used to value
our risk management derivative Level 3 instruments at December 31, 2017 and December 31, 2016:
December 31, 2017 Fair Value (thousands)
ValuationTechnique
SignificantUnobservable Input Range
Weighted-AverageCommodity Contracts Assets Liabilities
Electricity:
Forward Contracts (a) $ 21 $ 15,485 Discountedcash flows
Electricityforward price(per MWh) $18.51 - $38.75 $ 27.89
Natural Gas:
Forward Contracts (a) 1,015 3,807Discountedcash flows
Natural gasforward price(per MMBtu) $2.33 - $3.11 $ 2.71
Total $ 1,036 $ 19,292
(a) Includes swaps and physical and financial contracts.
December 31, 2016 Fair Value (thousands)
ValuationTechnique
SignificantUnobservable Input Range
Weighted-AverageCommodity Contracts Assets Liabilities
Electricity:
Forward Contracts (a) $ 10,648 $ 32,042 Discountedcash flows
Electricityforward price(per MWh) $16.43 - $41.07 $ 29.86
Natural Gas:
Forward Contracts (a) 428 26,440Discountedcash flows
Natural gasforward price(per MMBtu) $2.32 - $3.60 $ 2.81
Total $ 11,076 $ 58,482
(a) Includes swaps and physical and financial contracts.

COMBINED NOTES TO CONSOLIDATED FINANCIAL STATEMENTS
160
The following table shows the changes in fair value for our risk management activities' assets and liabilities that are measured at fair value on a recurring basis using Level 3 inputs for the years ended December 31, 2017 and 2016 (dollars in thousands):
Year EndedDecember 31,
Commodity Contracts 2017 2016
Net derivative balance at beginning of period $ (47,406) $ (32,979)Total net gains (losses) realized/unrealized:
Included in earnings — —Included in OCI 3 88Deferred as a regulatory asset or liability (13,643) (37,543)
Settlements 5,834 15,146Transfers into Level 3 from Level 2 (10,026) 1,900Transfers from Level 3 into Level 2 46,982 5,982Net derivative balance at end of period $ (18,256) $ (47,406)
Net unrealized gains included in earnings related to instruments still held at end of period $ — $ —
Amounts included in earnings are recorded in either operating revenues or fuel and purchased power
depending on the nature of the underlying contract. Transfers reflect the fair market value at the beginning of the period and are triggered by a change in
the lowest significant input as of the end of the period. We had no significant Level 1 transfers to or from any other hierarchy level. Transfers in or out of Level 3 are typically related to our long-dated energy transactions that extend beyond available quoted periods.
Financial Instruments Not Carried at Fair Value
The carrying value of our net accounts receivable, accounts payable and short-term borrowings approximate fair value. Our short-term borrowings are classified within Level 2 of the fair value hierarchy. See Note 6 for our long-term debt fair values.
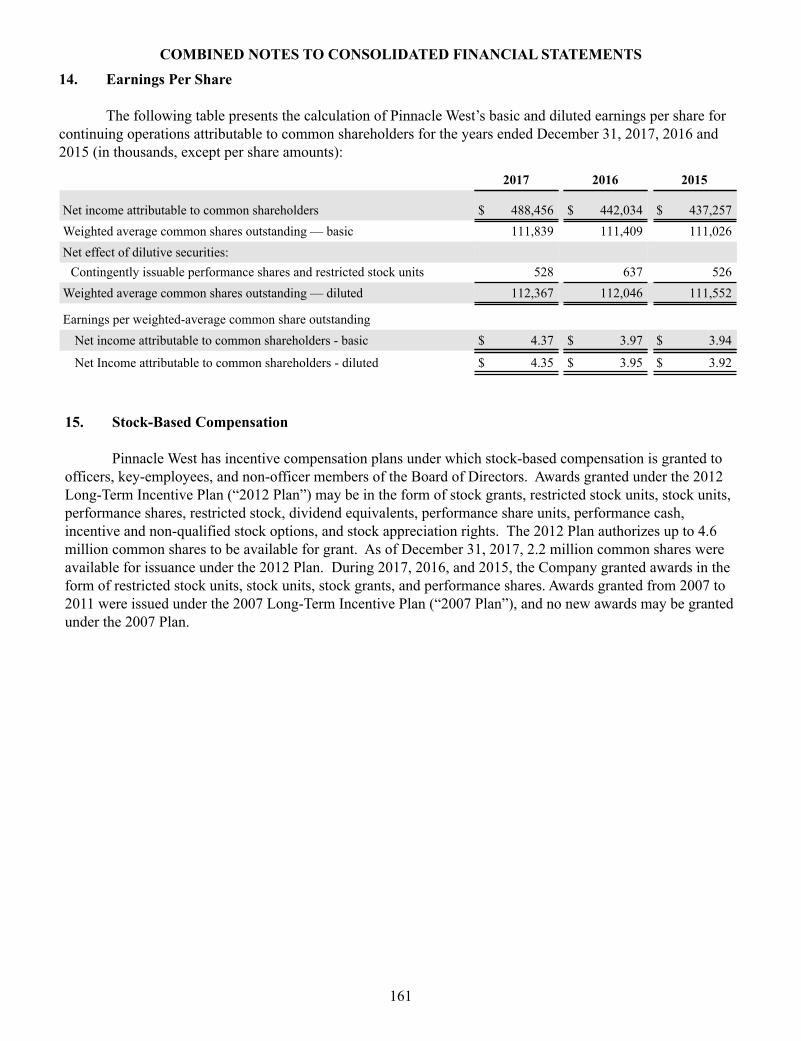
COMBINED NOTES TO CONSOLIDATED FINANCIAL STATEMENTS
161
14. Earnings Per Share
The following table presents the calculation of Pinnacle West’s basic and diluted earnings per share for continuing operations attributable to common shareholders for the years ended December 31, 2017, 2016 and 2015 (in thousands, except per share amounts):
2017 2016 2015
Net income attributable to common shareholders $ 488,456 $ 442,034 $ 437,257Weighted average common shares outstanding — basic 111,839 111,409 111,026Net effect of dilutive securities:
Contingently issuable performance shares and restricted stock units 528 637 526Weighted average common shares outstanding — diluted 112,367 112,046 111,552
Earnings per weighted-average common share outstandingNet income attributable to common shareholders - basic $ 4.37 $ 3.97 $ 3.94
Net Income attributable to common shareholders - diluted $ 4.35 $ 3.95 $ 3.92
15. Stock-Based Compensation
Pinnacle West has incentive compensation plans under which stock-based compensation is granted to officers, key-employees, and non-officer members of the Board of Directors. Awards granted under the 2012 Long-Term Incentive Plan (“2012 Plan”) may be in the form of stock grants, restricted stock units, stock units, performance shares, restricted stock, dividend equivalents, performance share units, performance cash, incentive and non-qualified stock options, and stock appreciation rights. The 2012 Plan authorizes up to 4.6 million common shares to be available for grant. As of December 31, 2017, 2.2 million common shares were available for issuance under the 2012 Plan. During 2017, 2016, and 2015, the Company granted awards in the form of restricted stock units, stock units, stock grants, and performance shares. Awards granted from 2007 to 2011 were issued under the 2007 Long-Term Incentive Plan (“2007 Plan”), and no new awards may be granted under the 2007 Plan.

COMBINED NOTES TO CONSOLIDATED FINANCIAL STATEMENTS
162
Stock-Based Compensation Expense and Activity
During the fourth quarter of 2016, we adopted new stock-based compensation accounting guidance prescribed by ASU 2016-09. Prior to the adoption of this guidance we had certain awards that were accounted for as liability awards due to the ability of the employee to withhold taxes beyond the minimum statutory tax withholding rate. Under the new standard, the tax withholding terms of our awards no longer trigger liability treatment. Accordingly, effective January 1, 2016 certain awards that were previously classified as liability awards are now accounted for as equity awards. The impacts of this accounting change relating to prior years have been applied using a modified retrospective approach, resulting in a $6 million cumulative-effect adjustment, net of income tax expense of $3 million, to increase Retained Earnings as of January 1, 2016. The impacts of this accounting change relating to 2016 resulted in a pre-tax $12 million adjustment to decrease operations and maintenance expense that was recognized during the fourth quarter of 2016. The following amounts related to years ended 2017 and 2016 expense and activity include the effects of adopting this new accounting standard; however, expense and activities relating to 2015 reflect the historical accounting treatment. The new standard also requires excess income tax benefits and deficiencies arising from stock based compensation to now be recognized in the period incurred, simplifies accounting for forfeitures, and clarifies certain cash flow presentation matters. These other provisions of the standard did not have a material impact on our consolidated financial statements.
Compensation cost included in net income for stock-based compensation plans was $21 million in 2017, $19 million in 2016, and $19 million in 2015. The compensation cost capitalized is immaterial for all years. Income tax benefits related to stock-based compensation arrangements were $15 million in 2017, $10 million in 2016, and $7 million in 2015.
As of December 31, 2017, there were approximately $12 million of unrecognized compensation costs related to nonvested stock-based compensation arrangements. We expect to recognize these costs over a weighted-average period of 2 years.
The total fair value of shares vested was $22 million in 2017, $22 million in 2016 and $21 million in 2015.
The following table is a summary of awards granted and the weighted-average grant date fair value for
the three years ended 2017, 2016 and 2015.
Restricted Stock Units, StockGrants, and Stock Units (a) Performance Shares (b)
2017 2016 2015 2017 2016 2015Units granted 161,963 141,811 152,651 147,706 166,666 151,430Weighted-average grant date fair value $ 72.60 $ 67.34 $ 64.12 $ 78.99 $ 66.60 $ 64.97
(a) Units granted includes awards that will be cash settled of 67,599 in 2017, 43,952 in 2016, and 45,104 in 2015.
(b) Reflects the target payout level.

COMBINED NOTES TO CONSOLIDATED FINANCIAL STATEMENTS
163
The following table is a summary of the status of non-vested awards as of December 31, 2017 and changes during the year.
Restricted Stock Units, StockGrants, and Stock Units Performance Shares
Shares
Weighted-Average
Grant DateFair Value Shares (b)
Weighted-Average
Grant DateFair Value
Nonvested at January 1, 2017 335,259 $ 62.04 312,724 $ 65.32Granted 161,963 72.60 147,706 78.99Change in performance factor — — 18,266 64.97Vested (202,327) 59.19 (164,396) 63.87Forfeited (c) (3,607) 69.58 (4,798) 69.77
Nonvested at December 31, 2017 291,288 (a) 69.78 309,502 72.46
Vested Awards Outstanding at December 31, 2017 89,928 164,396
(a) Includes 133,373 of awards that will be cash settled.(b) The nonvested performance shares are reflected at target payout level. The performance metric
component increase or decrease in the number of shares from the target level to the estimated actual payout level is included in the increase for performance factor amounts in the year the award vests.
(c) We account for forfeitures as they occur.
Share-based liabilities paid relating to restricted stock units were $4 million, $3 million and $10 million in 2017, 2016 and 2015, respectively. This includes cash used to settle restricted stock units of $4 million, $3 million and $3 million in 2017, 2016 and 2015, respectively. Restricted stock units that are cash settled are classified as liability awards. Share-based liabilities paid relating to performance shares were $16 million in 2015. In 2017 and 2016, performance shares were classified as equity awards. Restricted Stock Units, Stock Grants, and Stock Units
Restricted stock units are granted to officers and key employees. Restricted stock units typically vest and settle in equal annual installments over a 4-year period after the grant date. Vesting is typically dependent upon continuous service during the vesting period; however, awards granted to retirement-eligible employees will vest upon the employee's retirement. Awardees elect to receive payment in either 100% stock, 100% cash, or 50% in cash and 50% in stock. Restricted stock unit awards typically include a dividend equivalent feature. This feature allows each award to accrue dividend rights equal to the dividends they would have received had they directly owned the stock. Interest on dividend rights compounds quarterly. If the award is forfeited the employee is not entitled to the dividends on those shares.
In December 2012, the Company granted a retention award of 50,617 performance-linked restricted
stock units to the Chairman of the Board and Chief Executive Officer of Pinnacle West. This award vested on December 31, 2016, because he remained employed with the Company through that date. The Board did increase the number of awards that vested by 33,745 restricted stock units, payable in stock because certain performance requirements were met. In February 2017, 84,362 restricted stock units were released.

COMBINED NOTES TO CONSOLIDATED FINANCIAL STATEMENTS
164
Compensation cost for restricted stock unit awards is based on the fair value of the award, with the fair value being the market price of our stock on the measurement date. Restricted stock unit awards that will be settled in cash are accounted for as liability awards, with compensation cost initially calculated on the date of grant using the Company’s closing stock price, and remeasured at each balance sheet date. Restricted stock unit awards that will be settled in shares are accounted for as equity awards, with compensation cost calculated using the Company's closing stock price on the date of grant. Compensation cost is recognized over the requisite service period based on the fair value of the award.
Stock grants are issued to non-officer members of the Board of Directors. They may elect to receive
the stock grant, or to defer receipt until a later date and receive stock units in lieu of the stock grant. The members of the Board of Directors who elect to defer may elect to receive payment in either 100% stock, or 50% in cash and 50% in stock. Each stock unit is convertible to one share of stock. The stock units accrue dividend rights, equal to the amount of dividends the Directors would have received had they directly owned stock equal to the number of vested restricted stock units or stock units from the date of grant to the date of payment, plus interest compounded quarterly. The dividends and interest are paid, based on the Director’s election, in either stock, or 50% in cash and 50% in stock. Performance Share Awards Performance share awards are granted to officers and key employees. The awards contain two separate performance criteria that affect the number of shares that may be received if after the end of a 3-year performance period the performance criteria are met. For the first criteria, the number of shares that will vest is based on non-financial performance metrics (i.e., the metric component). The other criteria is based upon Pinnacle West's total shareholder return ('TSR') in relation to the TSR of other companies in a specified utility index (i.e., the TSR component). The exact number of shares issued will vary from 0% to 200% of the target award. Shares received include dividend rights paid in stock equal to the amount of dividends that recipients would have received had they directly owned stock, equal to the number of vested performance shares from the date of grant to the date of payment plus interest compounded quarterly. If the award is forfeited or if the performance criteria are not achieved, the employee is not entitled to the dividends on those shares.
Performance share awards are accounted for as equity awards, with compensation cost based on the
fair value of the award on the grant date. Compensation cost relating to the metric component of the award is based on the Company’s closing stock price on the date of grant, with compensation cost recognized over the requisite service period based on the number of shares expected to vest. Management evaluates the probability of meeting the metric component at each balance sheet date. If the metric component criteria are not ultimately achieved, no compensation cost is recognized relating to the metric component, and any previously recognized compensation cost is reversed. Compensation cost relating to the TSR component of the award is determined using a Monte Carlo simulation valuation model, with compensation cost recognized ratably over the requisite service period, regardless of the number of shares that actually vest.
16. Derivative Accounting
Derivative financial instruments are used to manage exposure to commodity price and transportation costs of electricity, natural gas, coal, emissions allowances and interest rates. Risks associated with market volatility are managed by utilizing various physical and financial derivative instruments, including futures, forwards, options and swaps. As part of our overall risk management program, we may use derivative instruments to hedge purchases and sales of electricity and fuels. Derivative instruments that meet certain hedge accounting criteria may be designated as cash flow hedges and are used to limit our exposure to cash

COMBINED NOTES TO CONSOLIDATED FINANCIAL STATEMENTS
165
flow variability on forecasted transactions. The changes in market value of such instruments have a high correlation to price changes in the hedged transactions. Derivative instruments are also entered into for economic hedging purposes. While economic hedges may mitigate exposure to fluctuations in commodity prices, these instruments have not been designated as accounting hedges. Contracts that have the same terms (quantities, delivery points and delivery periods) and for which power does not flow are netted, which reduces both revenues and fuel and purchased power costs in our Consolidated Statements of Income, but does not impact our financial condition, net income or cash flows.
Our derivative instruments, excluding those qualifying for a scope exception, are recorded on the
balance sheet as an asset or liability and are measured at fair value. See Note 13 for a discussion of fair value measurements. Derivative instruments may qualify for the normal purchases and normal sales scope exception if they require physical delivery and the quantities represent those transacted in the normal course of business. Derivative instruments qualifying for the normal purchases and sales scope exception are accounted for under the accrual method of accounting and excluded from our derivative instrument discussion and disclosures below.
For its regulated operations, APS defers for future rate treatment 100% of the unrealized gains and losses on derivatives pursuant to the PSA mechanism that would otherwise be recognized in income. Realized gains and losses on derivatives are deferred in accordance with the PSA to the extent the amounts are above or below the Base Fuel Rate (see Note 3). Gains and losses from derivatives in the following tables represent the amounts reflected in income before the effect of PSA deferrals.
As of December 31, 2017, we had the following outstanding gross notional volume of derivatives, which represent both purchases and sales (does not reflect net position):
QuantityCommodity Unit of Measure December 31, 2017 December 31, 2016Power GWh 583 1,314Gas Billion cubic feet 240 194
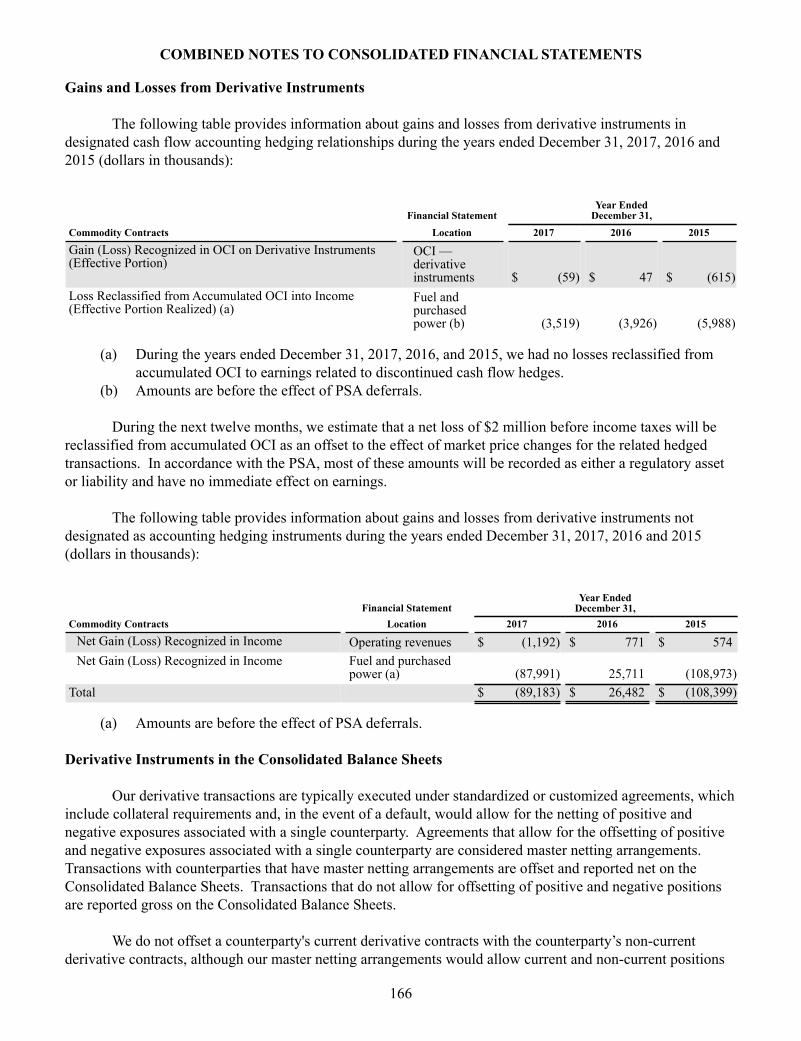
COMBINED NOTES TO CONSOLIDATED FINANCIAL STATEMENTS
166
Gains and Losses from Derivative Instruments
The following table provides information about gains and losses from derivative instruments in designated cash flow accounting hedging relationships during the years ended December 31, 2017, 2016 and 2015 (dollars in thousands):
Financial Statement Year Ended
December 31,Commodity Contracts Location 2017 2016 2015
Gain (Loss) Recognized in OCI on Derivative Instruments(Effective Portion)
OCI —derivativeinstruments $ (59) $ 47 $ (615)
Loss Reclassified from Accumulated OCI into Income(Effective Portion Realized) (a)
Fuel andpurchasedpower (b) (3,519) (3,926) (5,988)
(a) During the years ended December 31, 2017, 2016, and 2015, we had no losses reclassified from accumulated OCI to earnings related to discontinued cash flow hedges.
(b) Amounts are before the effect of PSA deferrals. During the next twelve months, we estimate that a net loss of $2 million before income taxes will be
reclassified from accumulated OCI as an offset to the effect of market price changes for the related hedged transactions. In accordance with the PSA, most of these amounts will be recorded as either a regulatory asset or liability and have no immediate effect on earnings.
The following table provides information about gains and losses from derivative instruments not
designated as accounting hedging instruments during the years ended December 31, 2017, 2016 and 2015 (dollars in thousands):
Financial Statement Year Ended
December 31,Commodity Contracts Location 2017 2016 2015
Net Gain (Loss) Recognized in Income Operating revenues $ (1,192) $ 771 $ 574Net Gain (Loss) Recognized in Income Fuel and purchased
power (a) (87,991) 25,711 (108,973)Total
$ (89,183) $ 26,482 $ (108,399)
(a) Amounts are before the effect of PSA deferrals.
Derivative Instruments in the Consolidated Balance Sheets
Our derivative transactions are typically executed under standardized or customized agreements, which include collateral requirements and, in the event of a default, would allow for the netting of positive and negative exposures associated with a single counterparty. Agreements that allow for the offsetting of positive and negative exposures associated with a single counterparty are considered master netting arrangements. Transactions with counterparties that have master netting arrangements are offset and reported net on the Consolidated Balance Sheets. Transactions that do not allow for offsetting of positive and negative positions are reported gross on the Consolidated Balance Sheets.
We do not offset a counterparty's current derivative contracts with the counterparty’s non-current
derivative contracts, although our master netting arrangements would allow current and non-current positions

COMBINED NOTES TO CONSOLIDATED FINANCIAL STATEMENTS
167
to be offset in the event of a default. Additionally, in the event of a default, our master netting arrangements would allow for the offsetting of all transactions executed under the master netting arrangement. These types of transactions may include non-derivative instruments, derivatives qualifying for scope exceptions, trade receivables and trade payables arising from settled positions, and other forms of non-cash collateral (such as letters of credit). These types of transactions are excluded from the offsetting tables presented below.
As of December 31, 2017, we no longer have derivative instruments that are designated as cash flow
hedging instruments. As of December 31, 2016, the Consolidated Balance Sheets included $2 million of gross liabilities related to derivative instruments designated as cash flow hedging instruments.
The following tables provide information about the fair value of our risk management activities reported on a gross basis, and the impacts of offsetting as of December 31, 2017 and 2016. These amounts relate to commodity contracts and are located in the assets and liabilities from risk management activities lines of our Consolidated Balance Sheets.
As of December 31, 2017: (dollars in thousands)
Gross Recognized Derivatives
(a)
Amounts Offset
(b)
Net Recognized Derivatives
Other (c)
Amount Reported on
Balance Sheet
Current assets $ 5,427 $ (3,796) $ 1,631 $ 300 $ 1,931Investments and other assets 1,292 (1,241) 51 — 51Total assets 6,719 (5,037) 1,682 300 1,982
Current liabilities (59,527) 3,796 (55,731) (3,521) (59,252)Deferred credits and other (38,411) 1,241 (37,170) — (37,170)Total liabilities (97,938) 5,037 (92,901) (3,521) (96,422)Total $ (91,219) $ — $ (91,219) $ (3,221) $ (94,440)
(a) All of our gross recognized derivative instruments were subject to master netting arrangements.(b) No cash collateral has been provided to counterparties, or received from counterparties, that is
subject to offsetting.(c) Represents cash collateral and cash margin that is not subject to offsetting. Amounts relate to non-
derivative instruments, derivatives qualifying for scope exceptions, or collateral and margin posted in excess of the recognized derivative instrument. Includes cash collateral received from counterparties of $3,521 and cash margin provided to counterparties of $300.
As of December 31, 2016: (dollars in thousands)
Gross Recognized Derivatives
(a)
AmountsOffset
(b)
Net Recognized Derivatives
Other (c)
Amount Reported on
Balance Sheet
Current assets $ 48,094 $ (28,400) $ 19,694 $ — $ 19,694
Investments and other assets 6,704 (6,703) 1 — 1Total assets 54,798 (35,103) 19,695 — 19,695
Current liabilities (50,182) 28,400 (21,782) (4,054) (25,836)Deferred credits and other (53,941) 6,703 (47,238) — (47,238)Total liabilities (104,123) 35,103 (69,020) (4,054) (73,074)Total $ (49,325) $ — $ (49,325) $ (4,054) $ (53,379)
(a) All of our gross recognized derivative instruments were subject to master netting arrangements.

COMBINED NOTES TO CONSOLIDATED FINANCIAL STATEMENTS
168
(b) No cash collateral has been provided to counterparties, or received from counterparties, that is subject to offsetting.
(c) Represents cash collateral and cash margin that is not subject to offsetting. Amounts relate to non-derivative instruments, derivatives qualifying for scope exceptions, or collateral and margin posted in excess of the recognized derivative instrument. Includes cash collateral received from counterparties of $4,054.
Credit Risk and Credit Related Contingent Features
We are exposed to losses in the event of nonperformance or nonpayment by counterparties and have risk management contracts with many counterparties. As of December 31, 2017, Pinnacle West has no counterparties with positive exposures of greater than 10% of risk management assets. Our risk management process assesses and monitors the financial exposure of all counterparties. Despite the fact that the great majority of trading counterparties' debt is rated as investment grade by the credit rating agencies, there is still a possibility that one or more of these counterparties could default, resulting in a material impact on consolidated earnings for a given period. Counterparties in the portfolio consist principally of financial institutions, major energy companies, municipalities and local distribution companies. We maintain credit policies that we believe minimize overall credit risk to within acceptable limits. Determination of the credit quality of our counterparties is based upon a number of factors, including credit ratings and our evaluation of their financial condition. To manage credit risk, we employ collateral requirements and standardized agreements that allow for the netting of positive and negative exposures associated with a single counterparty. Valuation adjustments are established representing our estimated credit losses on our overall exposure to counterparties.
Certain of our derivative instrument contracts contain credit-risk-related contingent features including,
among other things, investment grade credit rating provisions, credit-related cross-default provisions, and adequate assurance provisions. Adequate assurance provisions allow a counterparty with reasonable grounds for uncertainty to demand additional collateral based on subjective events and/or conditions. For those derivative instruments in a net liability position, with investment grade credit contingencies, the counterparties could demand additional collateral if our debt credit rating were to fall below investment grade (below BBB- for Standard & Poor’s or Fitch or Baa3 for Moody’s).
The following table provides information about our derivative instruments that have credit-risk-related
contingent features at December 31, 2017 (dollars in thousands):
December 31,2017
Aggregate fair value of derivative instruments in a net liability position $ 97,938Cash collateral posted —Additional cash collateral in the event credit-risk related contingent features were fully triggered (a) 91,071
(a) This amount is after counterparty netting and includes those contracts which qualify for scope exceptions, which are excluded from the derivative details above.
We also have energy related non-derivative instrument contracts with investment grade credit-related
contingent features, which could also require us to post additional collateral of approximately $110 million if our debt credit ratings were to fall below investment grade.

COMBINED NOTES TO CONSOLIDATED FINANCIAL STATEMENTS
169
17. Other Income and Other Expense
The following table provides detail of Pinnacle West's Consolidated other income and other expense for 2017, 2016 and 2015 (dollars in thousands):
2017 2016 2015Other income:
Interest income $ 3,497 $ 884 $ 493Miscellaneous 509 17 128
Total other income $ 4,006 $ 901 $ 621Other expense:
Non-operating costs $ (11,749) $ (9,235) $ (11,292)Investment losses — net (4,113) (1,747) (2,080)Miscellaneous (5,677) (4,355) (4,451)
Total other expense $ (21,539) $ (15,337) $ (17,823)
Other Income and Other Expense - APS
The following table provides detail of APS’s other income and other expense for 2017, 2016 and 2015 (dollars in thousands):
2017 2016 2015Other income:
Interest income $ 2,858 $ 261 $ 163Gain on disposition of property 2,048 5,745 716Miscellaneous 1,620 2,601 1,955
Total other income $ 6,526 $ 8,607 $ 2,834Other expense:
Non-operating costs (a) $ (12,395) $ (11,034) $ (11,648)Loss on disposition of property (5,424) (1,246) (2,219)Miscellaneous (5,561) (5,234) (5,152)
Total other expense $ (23,380) $ (17,514) $ (19,019)
(a) As defined by FERC, includes non-operating utility income and expense (items excluded from utility rate recovery).
18. Palo Verde Sale Leaseback Variable Interest Entities
In 1986, APS entered into agreements with three separate VIE lessor trust entities in order to sell and lease back interests in Palo Verde Unit 2 and related common facilities. APS will retain the assets through 2023 under one lease and 2033 under the other two leases. APS will be required to make payments relating to these leases of approximately $23 million annually for the period 2018 through 2023, and about $16 million annually for the period 2024 through 2033. At the end of the lease period, APS will have the option to purchase the leased assets at their fair market value, extend the leases for up to two years, or return the assets to the lessors.
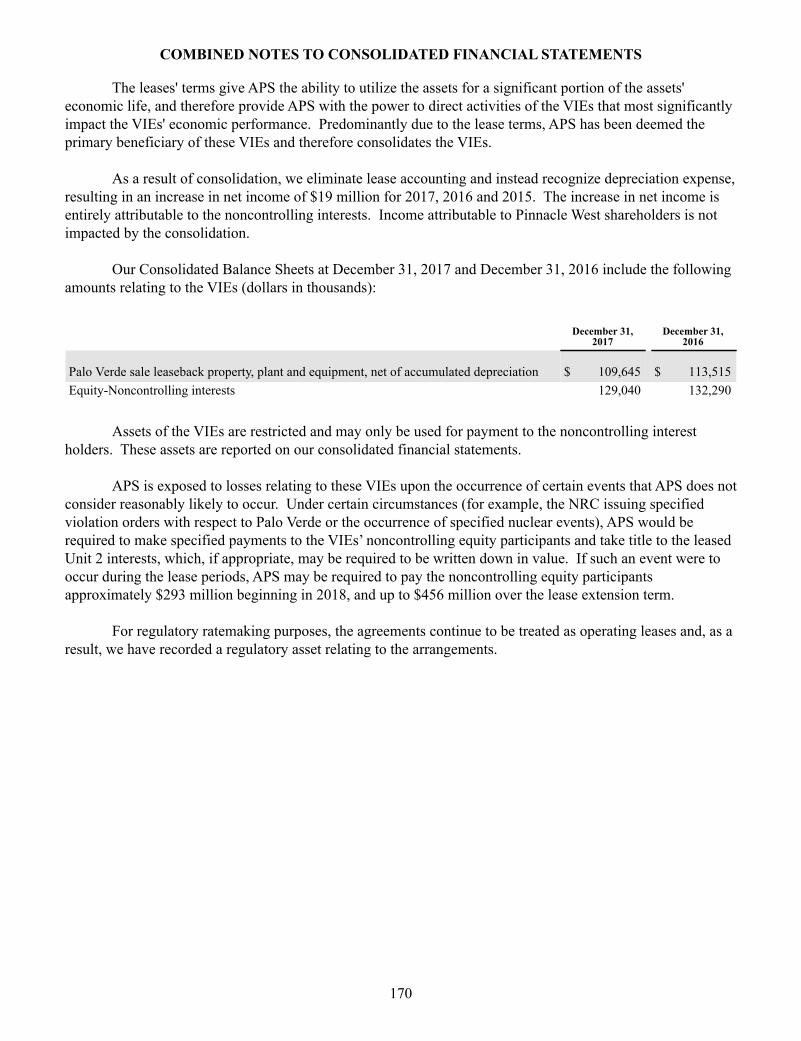
COMBINED NOTES TO CONSOLIDATED FINANCIAL STATEMENTS
170
The leases' terms give APS the ability to utilize the assets for a significant portion of the assets' economic life, and therefore provide APS with the power to direct activities of the VIEs that most significantly impact the VIEs' economic performance. Predominantly due to the lease terms, APS has been deemed the primary beneficiary of these VIEs and therefore consolidates the VIEs.
As a result of consolidation, we eliminate lease accounting and instead recognize depreciation expense, resulting in an increase in net income of $19 million for 2017, 2016 and 2015. The increase in net income is entirely attributable to the noncontrolling interests. Income attributable to Pinnacle West shareholders is not impacted by the consolidation.
Our Consolidated Balance Sheets at December 31, 2017 and December 31, 2016 include the following amounts relating to the VIEs (dollars in thousands):
December 31,2017
December 31,2016
Palo Verde sale leaseback property, plant and equipment, net of accumulated depreciation $ 109,645 $ 113,515Equity-Noncontrolling interests 129,040 132,290
Assets of the VIEs are restricted and may only be used for payment to the noncontrolling interest
holders. These assets are reported on our consolidated financial statements. APS is exposed to losses relating to these VIEs upon the occurrence of certain events that APS does not
consider reasonably likely to occur. Under certain circumstances (for example, the NRC issuing specified violation orders with respect to Palo Verde or the occurrence of specified nuclear events), APS would be required to make specified payments to the VIEs’ noncontrolling equity participants and take title to the leased Unit 2 interests, which, if appropriate, may be required to be written down in value. If such an event were to occur during the lease periods, APS may be required to pay the noncontrolling equity participants approximately $293 million beginning in 2018, and up to $456 million over the lease extension term.
For regulatory ratemaking purposes, the agreements continue to be treated as operating leases and, as a
result, we have recorded a regulatory asset relating to the arrangements.

COMBINED NOTES TO CONSOLIDATED FINANCIAL STATEMENTS
171
19. Investments
We have investments in debt and equity securities held in Nuclear Decommissioning Trusts and Coal Reclamation Escrow Accounts. These investments are classified as available for sale securities, and as a result we record the investments at their fair value on our Consolidated Balance Sheets. See Note 13 for a discussion of how fair value is determined and the classification of the investments within the fair value hierarchy. Because of the ability of APS to recover decommissioning and coal reclamation costs in rates, and in accordance with the regulatory treatment, APS has deferred realized and unrealized gains and losses (including other-than-temporary impairments on investment securities) in other regulatory liabilities. The costs of securities sold are determined on the basis of specific identification.
Nuclear Decommissioning Trusts
To fund the costs APS expects to incur to decommission Palo Verde, APS established external decommissioning trusts in accordance with NRC regulations. Third-party investment managers are authorized to buy and sell securities per stated investment guidelines. The trust funds are invested in fixed income securities and equity securities. The following table includes the unrealized gains and losses based on the original cost of the investment and summarizes the fair value of APS’s nuclear decommissioning trust fund assets at December 31, 2017 and December 31, 2016 (dollars in thousands):
December 31, 2017 December 31, 2016
Fair Value
Total Unrealized
Gains
Total Unrealized
Losses Fair Value
Total Unrealized
Gains
Total Unrealized
Losses
Equity securities $ 417,390 $ 248,623 $ — $ 353,261 $ 188,091 $ —Fixed income securities 446,277 11,537 (2,996) 425,530 9,820 (4,962)Cash and cash equivalents 7,224 — — — — —Net receivables (a) 109 — — 795 — —
Total $ 871,000 $ 260,160 $ (2,996) $ 779,586 $ 197,911 $ (4,962)
(a) Net receivables/(payables) relate to pending purchases and sales of securities. The following table sets forth approximate gains and losses and proceeds from the sale of securities by
the nuclear decommissioning trust funds (dollars in thousands):
Nuclear Decommissioning
Year Ended December 31,
2017 2016 2015
Realized gains $ 21,813 $ 11,213 $ 5,189Realized losses (13,146) (10,106) (6,225)Proceeds from the sale of securities (a) 542,246 633,410 478,813
(a) Proceeds are reinvested in the trust/account.
Coal Reclamation Escrow Accounts
APS has investments restricted for coal mine reclamation funding related to Four Corners. As of December 31, 2017, APS’s coal reclamation escrow accounts are invested in fixed income securities with a fair value of $30 million. The realized and unrealized gains and losses relating to these fixed income securities was
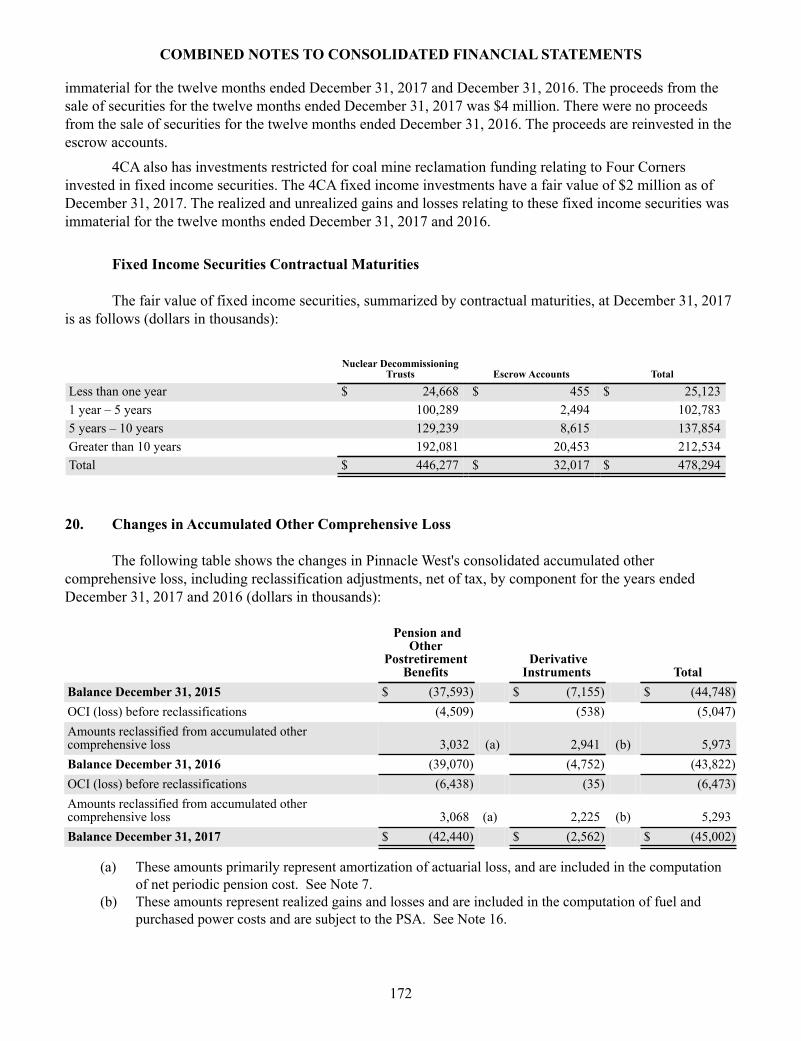
COMBINED NOTES TO CONSOLIDATED FINANCIAL STATEMENTS
172
immaterial for the twelve months ended December 31, 2017 and December 31, 2016. The proceeds from the sale of securities for the twelve months ended December 31, 2017 was $4 million. There were no proceeds from the sale of securities for the twelve months ended December 31, 2016. The proceeds are reinvested in the escrow accounts. 4CA also has investments restricted for coal mine reclamation funding relating to Four Corners invested in fixed income securities. The 4CA fixed income investments have a fair value of $2 million as of December 31, 2017. The realized and unrealized gains and losses relating to these fixed income securities was immaterial for the twelve months ended December 31, 2017 and 2016. Fixed Income Securities Contractual Maturities
The fair value of fixed income securities, summarized by contractual maturities, at December 31, 2017 is as follows (dollars in thousands):
Nuclear DecommissioningTrusts Escrow Accounts Total
Less than one year $ 24,668 $ 455 $ 25,1231 year – 5 years 100,289 2,494 102,7835 years – 10 years 129,239 8,615 137,854Greater than 10 years 192,081 20,453 212,534Total $ 446,277 $ 32,017 $ 478,294
20. Changes in Accumulated Other Comprehensive Loss
The following table shows the changes in Pinnacle West's consolidated accumulated other comprehensive loss, including reclassification adjustments, net of tax, by component for the years ended December 31, 2017 and 2016 (dollars in thousands):
Pension andOther
PostretirementBenefits
DerivativeInstruments Total
Balance December 31, 2015 $ (37,593) $ (7,155) $ (44,748)OCI (loss) before reclassifications (4,509) (538) (5,047)Amounts reclassified from accumulated other comprehensive loss 3,032 (a) 2,941 (b) 5,973Balance December 31, 2016 (39,070) (4,752) (43,822)OCI (loss) before reclassifications (6,438) (35) (6,473)Amounts reclassified from accumulated other comprehensive loss 3,068 (a) 2,225 (b) 5,293Balance December 31, 2017 $ (42,440) $ (2,562) $ (45,002)
(a) These amounts primarily represent amortization of actuarial loss, and are included in the computation of net periodic pension cost. See Note 7.
(b) These amounts represent realized gains and losses and are included in the computation of fuel and purchased power costs and are subject to the PSA. See Note 16.
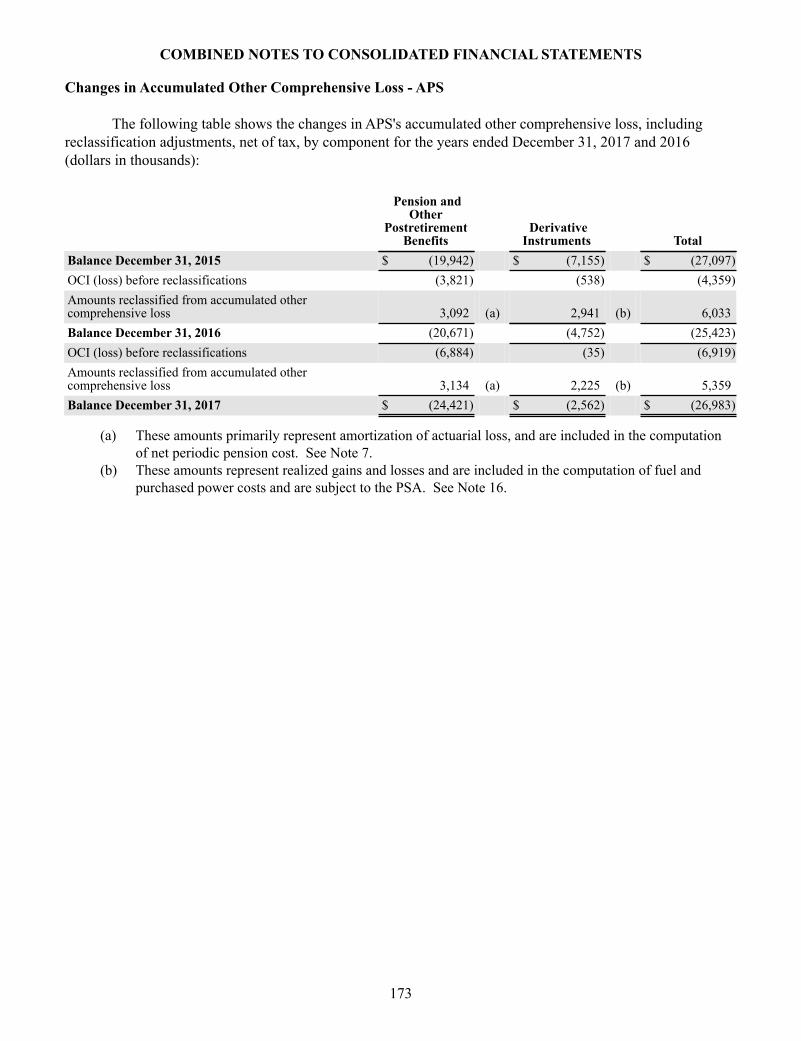
COMBINED NOTES TO CONSOLIDATED FINANCIAL STATEMENTS
173
Changes in Accumulated Other Comprehensive Loss - APS
The following table shows the changes in APS's accumulated other comprehensive loss, including reclassification adjustments, net of tax, by component for the years ended December 31, 2017 and 2016 (dollars in thousands):
Pension andOther
PostretirementBenefits
DerivativeInstruments Total
Balance December 31, 2015 $ (19,942) $ (7,155) $ (27,097)OCI (loss) before reclassifications (3,821) (538) (4,359)Amounts reclassified from accumulated other comprehensive loss 3,092 (a) 2,941 (b) 6,033Balance December 31, 2016 (20,671) (4,752) (25,423)OCI (loss) before reclassifications (6,884) (35) (6,919)Amounts reclassified from accumulated other comprehensive loss 3,134 (a) 2,225 (b) 5,359Balance December 31, 2017 $ (24,421) $ (2,562) $ (26,983)
(a) These amounts primarily represent amortization of actuarial loss, and are included in the computation of net periodic pension cost. See Note 7.
(b) These amounts represent realized gains and losses and are included in the computation of fuel and purchased power costs and are subject to the PSA. See Note 16.
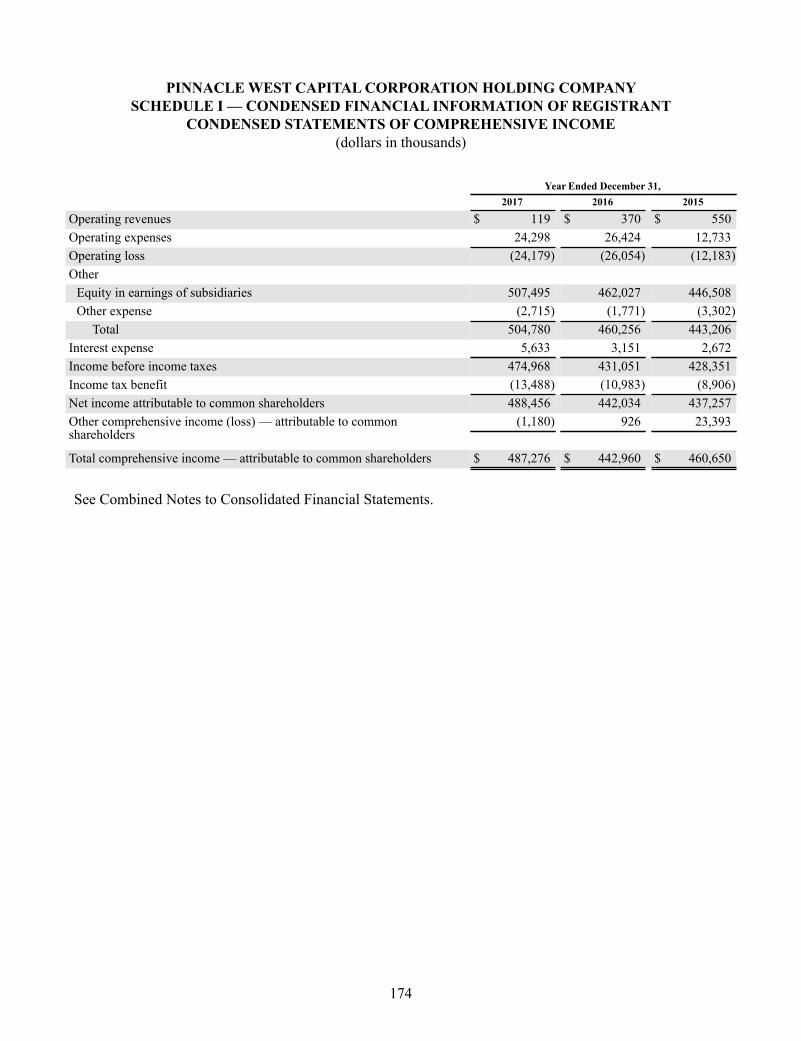
174
PINNACLE WEST CAPITAL CORPORATION HOLDING COMPANYSCHEDULE I — CONDENSED FINANCIAL INFORMATION OF REGISTRANT
CONDENSED STATEMENTS OF COMPREHENSIVE INCOME(dollars in thousands)
Year Ended December 31,
2017 2016 2015
Operating revenues $ 119 $ 370 $ 550Operating expenses 24,298 26,424 12,733Operating loss (24,179) (26,054) (12,183)Other
Equity in earnings of subsidiaries 507,495 462,027 446,508Other expense (2,715) (1,771) (3,302)
Total 504,780 460,256 443,206Interest expense 5,633 3,151 2,672Income before income taxes 474,968 431,051 428,351Income tax benefit (13,488) (10,983) (8,906)Net income attributable to common shareholders 488,456 442,034 437,257Other comprehensive income (loss) — attributable to commonshareholders
(1,180) 926 23,393
Total comprehensive income — attributable to common shareholders $ 487,276 $ 442,960 $ 460,650
See Combined Notes to Consolidated Financial Statements.

175
PINNACLE WEST CAPITAL CORPORATION HOLDING COMPANYSCHEDULE I — CONDENSED FINANCIAL INFORMATION OF REGISTRANT
CONDENSED BALANCE SHEETS(dollars in thousands)
December 31,
2017 2016
ASSETS
Current assets
Cash and cash equivalents $ 41 $ 41Accounts receivable 93,554 81,751Income tax receivable 19,124 —Other current assets 267 340
Total current assets 112,986 82,132Investments and other assets
Investments in subsidiaries 5,465,137 5,084,035Deferred income taxes 54,352 53,805Other assets 44,613 38,500
Total investments and other assets 5,564,102 5,176,340Total Assets $ 5,677,088 $ 5,258,472LIABILITIES AND EQUITY
Current liabilities
Accounts payable $ 7,638 $ 5,421Accrued taxes 8,927 12,050Common dividends payable 77,667 72,926Short-term borrowings 95,400 41,700Current maturities of long-term debt — 125,000Other current liabilities 17,417 31,182
Total current liabilities 207,049 288,279
Long-term debt less current maturities 298,421 —
Pension liabilities 20,758 21,057Other 15,130 13,224
Total deferred credits and other 35,888 34,281Common stock equity
Common stock 2,609,181 2,591,897Accumulated other comprehensive loss (45,002) (43,822)Retained earnings 2,442,511 2,255,547
Total Pinnacle West Shareholders’ equity 5,006,690 4,803,622Noncontrolling interests 129,040 132,290Total Equity 5,135,730 4,935,912
Total Liabilities and Equity $ 5,677,088 $ 5,258,472
See Combined Notes to Consolidated Financial Statements.

176
PINNACLE WEST CAPITAL CORPORATION HOLDING COMPANYSCHEDULE I — CONDENSED FINANCIAL INFORMATION OF REGISTRANT
CONDENSED STATEMENTS OF CASH FLOWS(dollars in thousands)
Year Ended December 31,
2017 2016 2015
Cash flows from operating activities
Net income $ 488,456 $ 442,034 $ 437,257Adjustments to reconcile net income to net cash provided by operatingactivities:
Equity in earnings of subsidiaries — net (507,495) (462,027) (446,508)Depreciation and amortization 76 85 92Deferred income taxes (264) (12,402) 12,967Accounts receivable (2,106) 15,823 11,336Accounts payable (11,162) 10,402 637Accrued taxes and income tax receivables — net (22,247) 20,041 (12,882)Dividends received from subsidiaries 296,800 239,300 266,900Other 15,092 5,514 (6,995)Net cash flow provided by operating activities 257,150 258,770 262,804
Cash flows from investing activities
Construction work in progress — (18,457) (3,462)Investments in subsidiaries (178,027) (19,242) (3,491)Repayments of loans from subsidiaries 2,987 1,026 157Advances of loans to subsidiaries (6,388) (2,092) (1,010)
Net cash flow used for investing activities (181,428) (38,765) (7,806)Cash flows from financing activities
Issuance of long-term debt 298,761 — —Short-term debt borrowings under revolving credit facility 58,000 40,000 —Short-term debt repayments under revolving credit facility (32,000) — —Commercial paper - net 27,700 1,700 —Dividends paid on common stock (289,793) (274,229) (260,027)Repayment of long-term debt (125,000) — —Common stock equity issuance - net of purchases (13,390) (4,867) 19,373
Net cash flow used for financing activities (75,722) (237,396) (240,654)Net increase (decrease) in cash and cash equivalents — (17,391) 14,344Cash and cash equivalents at beginning of year 41 17,432 3,088Cash and cash equivalents at end of year $ 41 $ 41 $ 17,432
See Combined Notes to Consolidated Financial Statements.
PINNACLE WEST CAPITAL CORPORATION HOLDING COMPANYNOTES TO FINANCIAL STATEMENTS OF HOLDING COMPANY
The Combined Notes to Consolidated Financial Statements in Part II, Item 8 should be read in conjunction with the Pinnacle West Capital Corporation Holding Company Financial Statements.
The Pinnacle West Capital Corporation Holding Company Financial Statements have been prepared to present the financial position, results of operations and cash flows of Pinnacle West Capital Corporation on a stand-alone basis as a holding company. Investments in subsidiaries are accounted for using the equity method.

177
PINNACLE WEST CAPITAL CORPORATIONSCHEDULE II — RESERVE FOR UNCOLLECTIBLES
(dollars in thousands)
Column A Column B Column C Column D Column E
Additions
Description
Balance atbeginningof period
Charged tocost andexpenses
Chargedto otheraccounts Deductions
Balanceat end ofperiod
Reserve for uncollectibles:
2017 $ 3,037 $ 6,836 $ — $ 7,360 $ 2,5132016 3,125 4,025 — 4,113 3,0372015 3,094 4,073 — 4,042 3,125

178
ARIZONA PUBLIC SERVICE COMPANYSCHEDULE II — RESERVE FOR UNCOLLECTIBLES
(dollars in thousands)
Column A Column B Column C Column D Column E
Additions
Description
Balance atbeginningof period
Charged tocost andexpenses
Chargedto otheraccounts Deductions
Balanceat end ofperiod
Reserve for uncollectibles:
2017 $ 3,037 $ 6,836 $ — $ 7,360 $ 2,5132016 3,125 4,025 — 4,113 3,0372015 3,094 4,073 — 4,042 3,125

179
ITEM 9. CHANGES IN AND DISAGREEMENTS WITH ACCOUNTANTSON ACCOUNTING AND FINANCIAL DISCLOSURE
None.
ITEM 9A. CONTROLS AND PROCEDURES
(a) Disclosure Controls and Procedures The term “disclosure controls and procedures” means controls and other procedures of a company that
are designed to ensure that information required to be disclosed by a company in the reports that it files or submits under the Securities Exchange Act of 1934 (the “Exchange Act”) (15 U.S.C. 78a et seq.) is recorded, processed, summarized and reported, within the time periods specified in the SEC’s rules and forms. Disclosure controls and procedures include, without limitation, controls and procedures designed to ensure that information required to be disclosed by a company in the reports that it files or submits under the Exchange Act is accumulated and communicated to a company’s management, including its principal executive and principal financial officers, or persons performing similar functions, as appropriate to allow timely decisions regarding required disclosure.
Pinnacle West’s management, with the participation of Pinnacle West’s Chief Executive Officer and
Chief Financial Officer, have evaluated the effectiveness of Pinnacle West’s disclosure controls and procedures as of December 31, 2017. Based on that evaluation, Pinnacle West’s Chief Executive Officer and Chief Financial Officer have concluded that, as of that date, Pinnacle West’s disclosure controls and procedures were effective.
APS’s management, with the participation of APS’s Chief Executive Officer and Chief Financial
Officer, have evaluated the effectiveness of APS’s disclosure controls and procedures as of December 31, 2017. Based on that evaluation, APS’s Chief Executive Officer and Chief Financial Officer have concluded that, as of that date, APS’s disclosure controls and procedures were effective.
(b) Management’s Annual Reports on Internal Control Over Financial Reporting
Reference is made to “Management’s Report on Internal Control over Financial Reporting (Pinnacle
West Capital Corporation)” in Item 8 of this report and “Management’s Report on Internal Control over Financial Reporting (Arizona Public Service Company)” in Item 8 of this report.
(c) Attestation Reports of the Registered Public Accounting Firm Reference is made to “Report of Independent Registered Public Accounting Firm” in Item 8 of this
report and “Report of Independent Registered Public Accounting Firm” in Item 8 of this report on the internal control over financial reporting of Pinnacle West and APS, respectively.
(d) Changes In Internal Control Over Financial Reporting No change in Pinnacle West’s or APS’s internal control over financial reporting occurred during the
fiscal quarter ended December 31, 2017 that materially affected, or is reasonably likely to materially affect, Pinnacle West’s or APS’s internal control over financial reporting.

180
ITEM 9B. OTHER INFORMATION
None.
PART III
ITEM 10. DIRECTORS, EXECUTIVE OFFICERSAND CORPORATE GOVERNANCE OF PINNACLE WEST
Reference is hereby made to “Information About Our Board and Corporate Governance,” “Proposal 1
— Election of Directors” and to “Section 16(a) Beneficial Ownership Reporting Compliance” in the Pinnacle West Proxy Statement relating to the Annual Meeting of Shareholders to be held on May 16, 2018 (the “2018 Proxy Statement”) and to the “Executive Officers of Pinnacle West” section in Part I of this report.
Pinnacle West has adopted a Code of Ethics for Financial Executives that applies to financial executives including Pinnacle West’s Chief Executive Officer, Chief Financial Officer, Chief Accounting Officer, Controller, Treasurer, and General Counsel, the President and Chief Operating Officer of APS and other persons designated as financial executives by the Chair of the Audit Committee. The Code of Ethics for Financial Executives is posted on Pinnacle West’s website (www.pinnaclewest.com). Pinnacle West intends to satisfy the requirements under Item 5.05 of Form 8-K regarding disclosure of amendments to, or waivers from, provisions of the Code of Ethics for Financial Executives by posting such information on Pinnacle West’s website.
ITEM 11. EXECUTIVE COMPENSATION
Reference is hereby made to “Directors’ Compensation,” “Report of the Human Resources Committee,” “Executive Compensation,” and “Human Resources Committee Interlocks and Insider Participation” in the 2018 Proxy Statement.

181
ITEM 12. SECURITY OWNERSHIP OFCERTAIN BENEFICIAL OWNERS AND MANAGEMENT
AND RELATED STOCKHOLDER MATTERS
Reference is hereby made to “Ownership of Pinnacle West Stock” in the 2018 Proxy Statement.
Securities Authorized for Issuance Under Equity Compensation Plans
The following table sets forth information as of December 31, 2017 with respect to the 2012 Plan and the 2007 Plan, under which our equity securities are outstanding or currently authorized for issuance.
Equity Compensation Plan Information
Plan Category
Number ofsecurities to be
issued uponexercise of
outstandingoptions, warrants
and rights (a)
Weighted-average
exercise priceof outstanding
options,warrants and
rights (b)
Number ofsecurities remainingavailable for future
issuance underequity
compensation plans(excluding
securities reflectedin column (a))
(c)
Equity compensation plans approved by security holders 1,364,170 — 2,172,786Equity compensation plans not approved by security holders —Total 1,364,170 — 2,172,786
(a) This amount includes shares subject to outstanding performance share awards and restricted stock unit awards at the maximum amount of shares issuable under such awards. However, payout of the performance share awards is contingent on the Company reaching certain levels of performance during a three-year performance period. If the performance criteria for these awards are not fully satisfied, the award recipient will receive less than the maximum number of shares available under these grants and may receive nothing from these grants.
(b) The weighted-average exercise price in this column does not take performance share awards or restricted stock unit awards into account, as those awards have no exercise price.
(c) Awards under the 2012 Plan can take the form of options, stock appreciation rights, restricted stock, performance shares, performance share units, performance cash, stock grants, stock units, dividend equivalents, and restricted stock units. Additional shares cannot be awarded under the 2007 Plan. However, if an award under the 2012 Plan is forfeited, terminated or canceled or expires, the shares subject to such award, to the extent of the forfeiture, termination, cancellation or expiration, may be added back to the shares available for issuance under the 2012 Plan.

182
Equity Compensation Plans Approved By Security Holders
Amounts in column (a) in the table above include shares subject to awards outstanding under two equity compensation plans that were previously approved by our shareholders: (a) the 2007 Plan, which was approved by our shareholders at our 2007 annual meeting of shareholders and under which no new stock awards may be granted; and (b) the 2012 Plan, as amended, which was approved by our shareholders at our 2012 annual meeting of shareholders and the first amendment to the 2012 Plan was approved by our shareholders at our 2017 annual meeting of shareholders. See Note 15 of the Notes to Consolidated Financial Statements for additional information regarding these plans.
Equity Compensation Plans Not Approved by Security Holders
The Company does not have any equity compensation plans under which shares can be issued that have not been approved by the shareholders.
ITEM 13. CERTAIN RELATIONSHIPS AND RELATEDTRANSACTIONS, AND DIRECTOR INDEPENDENCE
Reference is hereby made to “Information About Our Board and Corporate Governance” and “Related
Party Transactions” in the 2018 Proxy Statement.

183
ITEM 14. PRINCIPAL ACCOUNTANTFEES AND SERVICES
Pinnacle West
Reference is hereby made to “Accounting and Auditing Matters — Audit Fees and — Pre-Approval Policies” in the 2018 Proxy Statement. APS
The following fees were paid to APS’s independent registered public accountants, Deloitte & Touche LLP, for the last two fiscal years: Type of Service 2017 2016
Audit Fees (1) $ 2,212,137 $ 2,137,925Audit-Related Fees (2) 292,467 283,070
(1) The aggregate fees billed for services rendered for the audit of annual financial statements and
for review of financial statements included in Reports on Form 10-Q.(2) The aggregate fees billed for assurance and related services that are reasonably related to the
performance of the audit or review of the financial statements and are not included in Audit Fees reported above, which primarily consist of fees for employee benefit plan audits performed in 2017 and 2016.
Pinnacle West’s Audit Committee pre-approves each audit service and non-audit service to be provided
by APS’s registered public accounting firm. The Audit Committee has delegated to the Chair of the Audit Committee the authority to pre-approve audit and non-audit services to be performed by the independent public accountants if the services are not expected to cost more than $50,000. The Chair must report any pre-approval decisions to the Audit Committee at its next scheduled meeting. All of the services performed by Deloitte & Touche LLP for APS in 2017 were pre-approved by the Audit Committee or the Chair consistent with the pre-approval policy.

(This page intentionally left blank)

184
PART IV
ITEM 15. EXHIBITS AND FINANCIAL STATEMENT SCHEDULES
Financial Statements and Financial Statement Schedules
See the Index to Financial Statements and Financial Statement Schedule in Part II, Item 8. Exhibits Filed
The documents listed below are being filed or have previously been filed on behalf of Pinnacle West or APS and are incorporated herein by reference from the documents indicated and made a part hereof. Exhibits not identified as previously filed are filed herewith.
ExhibitNo.
Registrant(s)
Description Previously Filed as Exhibit: a
Date Filed
3.1
Pinnacle West
Articles of Incorporation, restated as of May 21, 2008
3.1 to Pinnacle West/APS June 30,2008 Form 10-Q Report, FileNo. 1-8962
8/7/2008
3.2
Pinnacle West
Pinnacle West Capital Corporation Bylaws, amended as of February 22, 2017
3.1 to Pinnacle West/APS February28, 2017 Form 8-K Report, File Nos.1-8962 and 1-4473
2/28/2017
3.3
APS
Articles of Incorporation, restated asof May 25, 1988
4.2 to APS’s Form 18 RegistrationNos. 33-33910 and 33-55248 bymeans of September 24, 1993Form 8-K Report, File No. 1-4473
9/29/1993
3.3.1
APS
Amendment to the Articles of Incorporation of Arizona Public Service Company, amended May 16, 2012
3.1 to Pinnacle West/APS May 22,2012 Form 8-K Report, File Nos.1-8962 and 1-4473
5/22/2012
3.4
APS
Arizona Public Service Company Bylaws, amended as of December 16, 2008
3.4 to Pinnacle West/APSDecember 31, 2008 Form 10-K, FileNo. 1-4473
2/20/2009
4.1
Pinnacle West
Specimen Certificate of Pinnacle West Capital Corporation Common Stock, no par value
4.1 to Pinnacle West June 20, 2017 Form 8-K Report, File No. 1-8962
6/20/2017
4.2
Pinnacle WestAPS
Indenture dated as of January 1, 1995 among APS and The Bank of New York Mellon, as Trustee
4.6 to APS’s Registration StatementNos. 33-61228 and 33-55473 bymeans of January 1, 1995 Form 8-KReport, File No. 1-4473
1/11/1995
4.2a
Pinnacle WestAPS
First Supplemental Indenture dated as of January 1, 1995
4.4 to APS’s Registration StatementNos. 33-61228 and 33-55473 bymeans of January 1, 1995 Form 8-KReport, File No. 1-4473
1/11/1995
4.3
Pinnacle WestAPS
Indenture dated as of November 15, 1996 between APS and The Bank of New York, as Trustee
4.5 to APS’s Registration StatementsNos. 33-61228, 33-55473, 33-64455and 333- 15379 by means ofNovember 19, 1996 Form 8-KReport, File No. 1-4473
11/22/1996

185
ExhibitNo.
Registrant(s)
Description Previously Filed as Exhibit: a
Date Filed
4.3a
Pinnacle WestAPS
First Supplemental Indenture dated as of November 15, 1996
4.6 to APS’s Registration StatementsNos. 33-61228, 33-55473, 33-64455and 333-15379 by means ofNovember 19, 1996 Form 8-KReport, File No. 1-4473
11/22/1996
4.3b
Pinnacle WestAPS
Second Supplemental Indenture dated as of April 1, 1997
4.10 to APS’s Registration StatementNos. 33-55473, 33-64455 and333-15379 by means of April 7, 1997Form 8-K Report, File No. 1-4473
4/9/1997
4.3c
Pinnacle WestAPS
Third Supplemental Indenture dated as of November 1, 2002
10.2 to Pinnacle West’s March 31,2003 Form 10-Q Report, FileNo. 1-8962
5/15/2003
4.4
Pinnacle West
Indenture dated as of December 1, 2000 between the Company and The Bank of New York, as Trustee, relating to Senior Unsecured Debt Securities
4.1 to Pinnacle West’s RegistrationStatement No. 333-52476
12/21/2000
4.4a Pinnacle West Third Supplemental Indenture dated as of November 30, 2017
4.1 to Pinnacle West November 30,2017 Form 8-K Report, File No.1-8962
11/30/2017
4.5
Pinnacle West
Indenture dated as of December 1, 2000 between the Company and The Bank of New York, as Trustee, relating to Subordinated Unsecured Debt Securities
4.2 to Pinnacle West’s RegistrationStatement No. 333-52476
12/21/2000
4.6
Pinnacle WestAPS
Indenture dated as of January 15, 1998 between APS and The Bank of New York Mellon Trust Company N.A. (successor to JPMorgan Chase Bank, N.A., formerly known as The Chase Manhattan Bank), as Trustee
4.10 to APS’s Registration StatementNos. 333-15379 and 333-27551 bymeans of January 13, 1998 Form 8-KReport, File No. 1-4473
1/16/1998
4.6a
Pinnacle WestAPS
Seventh Supplemental Indenture dated as of May 1, 2003
4.1 to APS’s Registration StatementNo. 333-90824 by means of May 7,2003 Form 8-K Report, FileNo. 1-4473
5/9/2003
4.6b
Pinnacle WestAPS
Eighth Supplemental Indenture dated as of June 15, 2004
4.1 to APS’s Registration StatementNo. 333-106772 by means of June 24,2004 Form 8-K Report, FileNo. 1-4473
6/28/2004
4.6c
Pinnacle WestAPS
Ninth Supplemental Indenture dated as of August 15, 2005
4.1 to APS’s Registration StatementsNos. 333-106772 and 333-121512 bymeans of August 17, 2005 Form 8-KReport, File No. 1-4473
8/22/2005
4.6d
APS
Tenth Supplemental Indenture dated as of August 1, 2006
4.1 to APS’s July 31, 2006 Form 8-KReport, File No. 1-4473
8/3/2006
4.6e
Pinnacle WestAPS
Eleventh Supplemental Indenture dated as of February 26, 2009
4.6e to Pinnacle West/APS 2014Form 10-K Report, File Nos. 1-8962and 1-4473
2/20/2015
4.6f
Pinnacle WestAPS
Twelfth Supplemental Indenture dated as of August 25, 2011
4.6f to Pinnacle West/APS 2014Form 10-K Report, File Nos. 1-8962and 1-4473
2/20/2015
4.6g
Pinnacle WestAPS
Thirteenth Supplemental Indenture dated as of January 13, 2012
4.6g to Pinnacle West/APS 2014Form 10-K Report, File Nos. 1-8962and 1-4473
2/20/2015
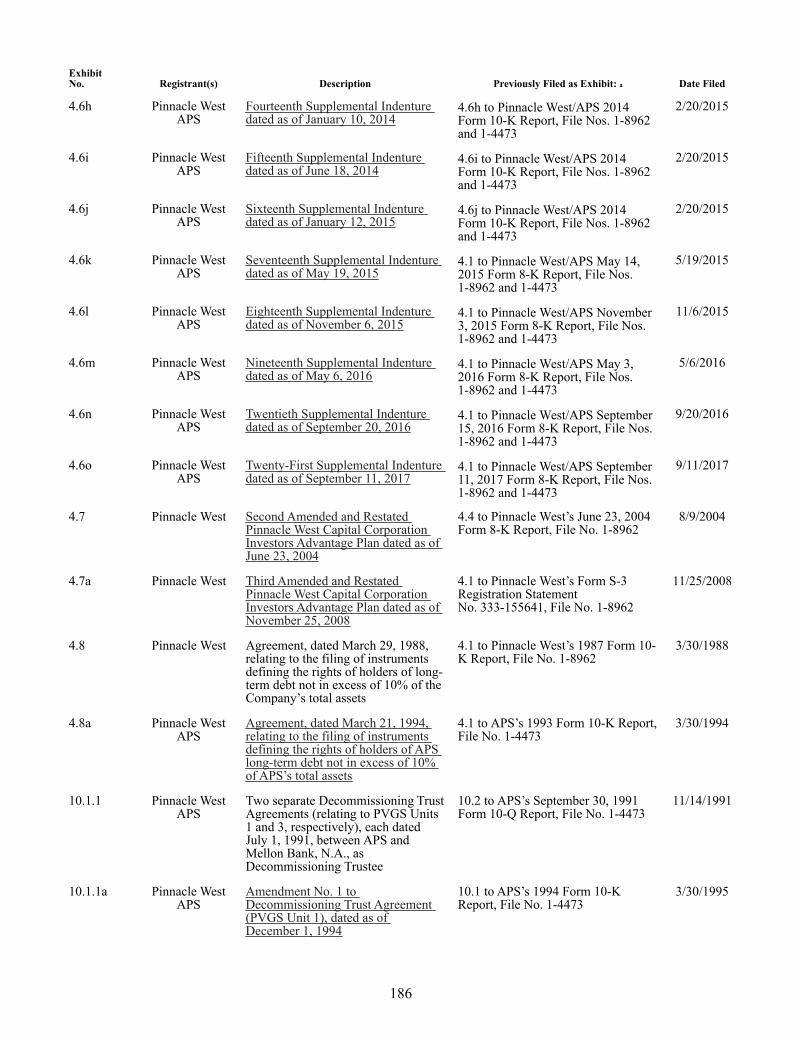
186
ExhibitNo.
Registrant(s)
Description Previously Filed as Exhibit: a
Date Filed
4.6h
Pinnacle WestAPS
Fourteenth Supplemental Indenture dated as of January 10, 2014
4.6h to Pinnacle West/APS 2014Form 10-K Report, File Nos. 1-8962and 1-4473
2/20/2015
4.6i
Pinnacle WestAPS
Fifteenth Supplemental Indenture dated as of June 18, 2014
4.6i to Pinnacle West/APS 2014Form 10-K Report, File Nos. 1-8962and 1-4473
2/20/2015
4.6j
Pinnacle WestAPS
Sixteenth Supplemental Indenture dated as of January 12, 2015
4.6j to Pinnacle West/APS 2014Form 10-K Report, File Nos. 1-8962and 1-4473
2/20/2015
4.6k Pinnacle WestAPS
Seventeenth Supplemental Indenture dated as of May 19, 2015
4.1 to Pinnacle West/APS May 14,2015 Form 8-K Report, File Nos.1-8962 and 1-4473
5/19/2015
4.6l
Pinnacle WestAPS
Eighteenth Supplemental Indenture dated as of November 6, 2015
4.1 to Pinnacle West/APS November3, 2015 Form 8-K Report, File Nos.1-8962 and 1-4473
11/6/2015
4.6m
Pinnacle WestAPS
Nineteenth Supplemental Indenture dated as of May 6, 2016
4.1 to Pinnacle West/APS May 3,2016 Form 8-K Report, File Nos.1-8962 and 1-4473
5/6/2016
4.6n Pinnacle WestAPS
Twentieth Supplemental Indenture dated as of September 20, 2016
4.1 to Pinnacle West/APS September15, 2016 Form 8-K Report, File Nos.1-8962 and 1-4473
9/20/2016
4.6o Pinnacle WestAPS
Twenty-First Supplemental Indenture dated as of September 11, 2017
4.1 to Pinnacle West/APS September11, 2017 Form 8-K Report, File Nos.1-8962 and 1-4473
9/11/2017
4.7
Pinnacle West
Second Amended and Restated Pinnacle West Capital Corporation Investors Advantage Plan dated as of June 23, 2004
4.4 to Pinnacle West’s June 23, 2004Form 8-K Report, File No. 1-8962
8/9/2004
4.7a
Pinnacle West
Third Amended and Restated Pinnacle West Capital Corporation Investors Advantage Plan dated as of November 25, 2008
4.1 to Pinnacle West’s Form S-3Registration StatementNo. 333-155641, File No. 1-8962
11/25/2008
4.8
Pinnacle West
Agreement, dated March 29, 1988,relating to the filing of instrumentsdefining the rights of holders of long-term debt not in excess of 10% of theCompany’s total assets
4.1 to Pinnacle West’s 1987 Form 10-K Report, File No. 1-8962
3/30/1988
4.8a
Pinnacle WestAPS
Agreement, dated March 21, 1994, relating to the filing of instruments defining the rights of holders of APS long-term debt not in excess of 10% of APS’s total assets
4.1 to APS’s 1993 Form 10-K Report,File No. 1-4473
3/30/1994
10.1.1
Pinnacle WestAPS
Two separate Decommissioning TrustAgreements (relating to PVGS Units1 and 3, respectively), each datedJuly 1, 1991, between APS andMellon Bank, N.A., asDecommissioning Trustee
10.2 to APS’s September 30, 1991Form 10-Q Report, File No. 1-4473
11/14/1991
10.1.1a
Pinnacle WestAPS
Amendment No. 1 to Decommissioning Trust Agreement (PVGS Unit 1), dated as of December 1, 1994
10.1 to APS’s 1994 Form 10-KReport, File No. 1-4473
3/30/1995

187
ExhibitNo.
Registrant(s)
Description Previously Filed as Exhibit: a
Date Filed
10.1.1b
Pinnacle WestAPS
Amendment No. 1 to Decommissioning Trust Agreement (PVGS Unit 3), dated as of December 1, 1994
10.2 to APS’s 1994 Form 10-KReport, File No. 1-4473
3/30/1995
10.1.1c
Pinnacle WestAPS
Amendment No. 2 to APS Decommissioning Trust Agreement (PVGS Unit 1) dated as of July 1, 1991
10.4 to APS’s 1996 Form 10-KReport , File No. 1-4473
3/28/1997
10.1.1d
Pinnacle WestAPS
Amendment No. 2 to APS Decommissioning Trust Agreement (PVGS Unit 3) dated as of July 1, 1991
10.6 to APS’s 1996 Form 10-KReport, File No. 1-4473
3/28/1997
10.1.1e
Pinnacle WestAPS
Amendment No. 3 to the Decommissioning Trust Agreement (PVGS Unit 1), dated as of March 18, 2002
10.2 to Pinnacle West’s March 31,2002 Form 10-Q Report, FileNo. 1-8962
5/15/2002
10.1.1f
Pinnacle WestAPS
Amendment No. 3 to the Decommissioning Trust Agreement (PVGS Unit 3), dated as of March 18, 2002
10.4 to Pinnacle West’s March 2002Form 10-Q Report, File No. 1-8962
5/15/2002
10.1.1g
Pinnacle WestAPS
Amendment No. 4 to the Decommissioning Trust Agreement (PVGS Unit 1), dated as of December 19, 2003
10.3 to Pinnacle West’s 2003Form 10-K Report, File No. 1-8962
3/15/2004
10.1.1h
Pinnacle WestAPS
Amendment No. 4 to the Decommissioning Trust Agreement (PVGS Unit 3), dated as of December 19, 2003
10.5 to Pinnacle West’s 2003Form 10-K Report, File No. 1-8962
3/15/2004
10.1.1i
Pinnacle WestAPS
Amendment No. 5 to the Decommissioning Trust Agreement (PVGS Unit 1), dated as of May 1, 2007
10.1 to Pinnacle West/APS March 31,2007 Form 10-Q Report, File Nos.1-8962 and 1-4473
5/9/2007
10.1.1j
Pinnacle WestAPS
Amendment No. 5 to the Decommissioning Trust Agreement (PVGS Unit 3), dated as of May 1, 2007
10.2 to Pinnacle West/APS March 31,2007 Form 10-Q Report, File Nos.1-8962 and 104473
5/9/2007
10.1.2
Pinnacle WestAPS
Amended and RestatedDecommissioning Trust Agreement(PVGS Unit 2) dated as ofJanuary 31, 1992, among APS,Mellon Bank, N.A., asDecommissioning Trustee, and StateStreet Bank and Trust Company, assuccessor to The First National Bankof Boston, as Owner Trustee undertwo separate Trust Agreements, eachwith a separate Equity Participant,and as Lessor under two separateFacility Leases, each relating to anundivided interest in PVGS Unit 2
10.1 to Pinnacle West’s 1991Form 10-K Report, File No. 1-8962
3/26/1992
10.1.2a
Pinnacle WestAPS
First Amendment to Amended andRestated Decommissioning TrustAgreement (PVGS Unit 2), dated asof November 1, 1992
10.2 to APS’s 1992 Form 10-KReport, File No. 1-4473
3/30/1993

188
ExhibitNo.
Registrant(s)
Description Previously Filed as Exhibit: a
Date Filed
10.1.2b
Pinnacle WestAPS
Amendment No. 2 to Amended and Restated Decommissioning Trust Agreement (PVGS Unit 2), dated as of November 1, 1994
10.3 to APS’s 1994 Form 10-KReport, File No. 1-4473
3/30/1995
10.1.2c
Pinnacle WestAPS
Amendment No. 3 to Amended and Restated Decommissioning Trust Agreement (PVGS Unit 2), dated as of June 20, 1996
10.1 to APS’s June 30, 1996Form 10-Q Report, File No. 1-4473
8/9/1996
10.1.2d
Pinnacle WestAPS
Amendment No. 4 to Amended and Restated Decommissioning Trust Agreement (PVGS Unit 2) dated as of December 16, 1996
APS 10.5 to APS’s 1996 Form 10-KReport, File No. 1-4473
3/28/1997
10.1.2e
Pinnacle WestAPS
Amendment No. 5 to the Amended and Restated Decommissioning Trust Agreement (PVGS Unit 2), dated as of June 30, 2000
10.1 to Pinnacle West’s March 31,2002 Form 10-Q Report, FileNo. 1-8962
5/15/2002
10.1.2f
Pinnacle WestAPS
Amendment No. 6 to the Amended and Restated Decommissioning Trust Agreement (PVGS Unit 2), dated as of March 18, 2002
10.3 to Pinnacle West’s March 31,2002 Form 10-Q Report, FileNo. 1-8962
5/15/2002
10.1.2g
Pinnacle WestAPS
Amendment No. 7 to the Amended and Restated Decommissioning Trust Agreement (PVGS Unit 2), dated as of December 19, 2003
10.4 to Pinnacle West’s 2003Form 10-K Report, File No. 1-8962
3/15/2004
10.1.2h
Pinnacle WestAPS
Amendment No. 8 to the Amended and Restated Decommissioning Trust Agreement (PVGS Unit 2), dated as of April 1, 2007
10.1.2h to Pinnacle West’s 2007Form 10-K Report, File No. 1-8962
2/27/2008
10.2.1b
Pinnacle WestAPS
Arizona Public Service CompanyDeferred Compensation Plan, asrestated, effective January 1, 1984,and the second and third amendmentsthereto, dated December 22, 1986,and December 23, 1987, respectively
10.4 to APS’s 1988 Form 10-KReport, File No. 1-4473
3/8/1989
10.2.1ab
Pinnacle WestAPS
Third Amendment to the Arizona Public Service Company Deferred Compensation Plan, effective as of January 1, 1993
10.3A to APS’s 1993 Form 10-KReport, File No. 1-4473
3/30/1994
10.2.1bb
Pinnacle WestAPS
Fourth Amendment to the Arizona Public Service Company Deferred Compensation Plan effective as of May 1, 1993
10.2 to APS’s September 30, 1994Form 10-Q Report, File No. 1-4473
11/10/1994
10.2.1cb
Pinnacle WestAPS
Fifth Amendment to the Arizona Public Service Company Deferred Compensation Plan effective January 1, 1997
10.3A to APS’s 1996 Form 10-KReport, File No. 1-4473
3/28/1997
10.2.1db
Pinnacle WestAPS
Sixth Amendment to the Arizona Public Service Company Deferred Compensation Plan effective January 1, 2001
10.8A to Pinnacle West’s 2000Form 10-K Report, File No. 1-8962
3/14/2001
10.2.2b
Pinnacle WestAPS
Arizona Public Service CompanyDirectors’ Deferred CompensationPlan, as restated, effective January 1,1986
10.1 to APS’s June 30, 1986Form 10-Q Report, File No. 1-4473
8/13/1986

189
ExhibitNo.
Registrant(s)
Description Previously Filed as Exhibit: a
Date Filed
10.2.2ab
Pinnacle WestAPS
Second Amendment to the Arizona Public Service Company Directors’ Deferred Compensation Plan, effective as of January 1, 1993
10.2A to APS’s 1993 Form 10-KReport, File No. 1-4473
3/30/1994
10.2.2bb
Pinnacle WestAPS
Third Amendment to the Arizona Public Service Company Directors’ Deferred Compensation Plan, effective as of May 1, 1993
10.1 to APS’s September 30, 1994Form 10-Q Report, File No. 1-4473
11/10/1994
10.2.2cb
Pinnacle WestAPS
Fourth Amendment to the Arizona Public Service Company Directors Deferred Compensation Plan, effective as of January 1, 1999
10.8A to Pinnacle West’s 1999Form 10-K Report, File No. 1-8962
3/30/2000
10.2.3b
Pinnacle WestAPS
Trust for the Pinnacle West Capital Corporation, Arizona Public Service Company and SunCor Development Company Deferred Compensation Plans dated August 1, 1996
10.14A to Pinnacle West’s 1999Form 10-K Report, File No. 1-8962
3/30/2000
10.2.3ab
Pinnacle WestAPS
First Amendment dated December 7, 1999 to the Trust for the Pinnacle West Capital Corporation, Arizona Public Service Company and SunCor Development Company Deferred Compensation Plans
10.15A to Pinnacle West’s 1999Form 10-K Report, File No. 1-8962
3/30/2000
10.2.4b
Pinnacle WestAPS
Pinnacle West Capital Corporation, Arizona Public Service Company, SunCor Development Company and El Dorado Investment Company Deferred Compensation Plan as amended and restated effective January 1, 1996
10.10A to APS’s 1995 Form 10-KReport, File No. 1-4473
3/29/1996
10.2.4ab
Pinnacle WestAPS
First Amendment effective as of January 1, 1999, to the Pinnacle West Capital Corporation, Arizona Public Service Company, SunCor Development Company and El Dorado Investment Company Deferred Compensation Plan
10.7A to Pinnacle West’s 1999 Form10-K Report, File No. 1-8962
3/30/2000
10.2.4bb
Pinnacle WestAPS
Second Amendment effective January 1, 2000 to the Pinnacle West Capital Corporation, Arizona Public Service Company, SunCor Development Company and El Dorado Investment Company Deferred Compensation Plan
10.10A to Pinnacle West’s 1999 Form10-K Report, File No. 1-8962
3/30/2000
10.2.4cb
Pinnacle WestAPS
Third Amendment to the Pinnacle West Capital Corporation, Arizona Public Service Company, SunCor Development Company and El Dorado Investment Company Deferred Compensation Plan, effective as of January 1, 2002
10.3 to Pinnacle West’s March 31,2003 Form 10-Q Report, File No.1-8962
5/15/2003
10.2.4db
Pinnacle WestAPS
Fourth Amendment to the Pinnacle West Capital Corporation, Arizona Public Service Company, SunCor Development Company and El Dorado Investment Company Deferred Compensation Plan, effective January 1, 2003
10.64b to Pinnacle West/APS 2005Form 10-K Report, File Nos. 1-8962and 1-4473
3/13/2006

190
ExhibitNo.
Registrant(s)
Description Previously Filed as Exhibit: a
Date Filed
10.2.5b
Pinnacle WestAPS
Deferred Compensation Plan of 2005 for Employees of Pinnacle West Capital Corporation and Affiliates (as amended and restated effective January 1, 2016)
10.2.5 to Pinnacle West/APS 2015Form 10-K Report, File Nos. 1-8962and 1-4473
2/19/2016
10.3.1b
Pinnacle WestAPS
Pinnacle West Capital Corporation Supplemental Excess Benefit Retirement Plan, amended and restated as of January 1, 2003
10.7A to Pinnacle West’s 2003Form 10-K Report, File No. 1-8962
3/15/2004
10.3.1ab
Pinnacle WestAPS
Pinnacle West Capital Corporation Supplemental Excess Benefit Retirement Plan, as amended and restated, dated December 18, 2003
10.48b to Pinnacle West/APS 2005Form 10-K Report, File Nos. 1-8962and 1-4473
3/13/2006
10.3.2b
Pinnacle WestAPS
Pinnacle West Capital Corporation Supplemental Excess Benefit Retirement Plan of 2005 (as amended and restated effective January 1, 2016)
10.3.2 to Pinnacle West/APS 2015Form 10-K Report, File Nos. 1-8962and 1-4473
2/19/2016
10.3.2ab
Pinnacle WestAPS
First Amendment to the Pinnacle West Capital Corporation Supplemental Excess Benefit Retirement Plan of 2005 (as amended and restated effective January 1, 2016)
10.3.2a to Pinnacle West/APS 2016Form 10-K Report, File Nos. 1-8962and 1-4473
2/24/2017
10.3.2bb
Pinnacle WestAPS
Second Amendment to the Pinnacle West Capital Corporation Supplemental Excess Benefit Retirement Plan of 2005 (as amended and restated effective January 1, 2016)
10.4.1b
APS
Letter Agreement dated December 20, 2006 between APS and Randall K. Edington
10.78 to Pinnacle West/APS 2006Form 10-K Report, File Nos. 1-8962and 1-4473
2/28/2007
10.4.2b
APS
Letter Agreement dated July 22, 2008 between APS and Randall K. Edington
10.3 to Pinnacle West/APS June 30,2008 Form 10-Q Report, FileNo. 1-4473
8/7/2008
10.4.3b
Pinnacle WestAPS
Letter Agreement dated June 17, 2008 between Pinnacle West/APS and James R. Hatfield
10.1 to Pinnacle West/APS June 30,2008 Form 10-Q Report, File Nos.1-8962 and 1-4473
8/7/2008
10.4.4b
APS
Supplemental Agreement dated December 26, 2008 between APS and Randall K. Edington
10.4.10 to Pinnacle West/APS 2008Form 10-K Report, File No. 1-4473
2/20/2009
10.4.5b
APS
Description of 2010 Palo Verde Specific Compensation Opportunity for Randall K. Edington
10.4.13 to Pinnacle West/APS 2009Form 10-K Report, File Nos. 1-8962and 1-4473
2/19/2010
10.4.6b
Pinnacle West
Letter Agreement dated May 21, 2009, between Pinnacle West and David P. Falck
10.4 to Pinnacle West/APS March 31,2010 Form 10-Q Report, FileNo. 1-8962
5/6/2010
10.4.7b
APS
Supplemental Agreement dated June 19, 2012 between APS and Randall K. Edington
10.1 to Pinnacle West/APS June 30,2012 Form 10-Q Report File Nos.1-8962 and 1-4473
8/2/2012
10.4.8b
APS Description of 2016 Palo Verde Specific Compensation Opportunity for Randall K. Edington
Pinnacle West/APS December 15,2015 Form 8-K Report, FileNo. 1-4473
12/21/2015
191
ExhibitNo.
Registrant(s)
Description Previously Filed as Exhibit: a
Date Filed
10.4.9b
APS Supplemental Agreement dated December 14, 2014 between APS and Randall K. Edington
10.4.9 to Pinnacle West/APS 2014Form 10-K Report, File Nos. 1-8962and 1-4473
2/20/2015
10.5.1bd
Pinnacle WestAPS
Key Executive Employment and Severance Agreement between Pinnacle West and certain executive officers of Pinnacle West and its subsidiaries
10.77bd to Pinnacle West/APS 2005Form 10-K Report, File Nos. 1-8962and 1-4473
3/13/2006
10.5.1abd
Pinnacle WestAPS
Form of Amended and Restated Key Executive Employment and Severance Agreement between Pinnacle West and certain officers of Pinnacle West and its subsidiaries
10.4 to Pinnacle West/APSSeptember 30, 2007 Form 10-QReport, File Nos. 1-8962 and 1-4473
11/6/2007
10.5.2bd
Pinnacle WestAPS
Form of Key Executive Employment and Severance Agreement between Pinnacle West and certain officers of Pinnacle West and its subsidiaries
10.3 to Pinnacle West/APSSeptember 30, 2007 Form 10-QReport, File Nos. 1-8962 and 1-4473
11/6/2007
10.5.3bd
Pinnacle WestAPS
Form of Key Executive Employment and Severance Agreement between Pinnacle West and certain officers of Pinnacle West and its subsidiaries
10.5.3 to Pinnacle West/APS 2009Form 10-K Report, File Nos. 1-8962and 1-4473
2/19/2010
10.5.4bd
Pinnacle WestAPS
Form of Key Executive Employment and Severance Agreement between Pinnacle West and certain officers of Pinnacle West and its subsidiaries
10.5.4 to Pinnacle West/APS 2012Form 10-K, File Nos. 1-8962 and1-4473
2/22/2013
10.6.1b
Pinnacle West
Pinnacle West Capital Corporation 2007 Long-Term Incentive Plan
Appendix B to the Proxy Statementfor Pinnacle West’s 2007 AnnualMeeting of Shareholders, FileNo. 1-8962
4/20/2007
10.6.1ab
Pinnacle West
First Amendment to the Pinnacle West Capital Corporation 2007 Long-Term Incentive Plan
10.2 to Pinnacle West/APS April 18,2007 Form 8-K Report, FileNo. 1-8962
4/20/2007
10.6.1bbd
Pinnacle WestAPS
Performance Share Agreement under the Pinnacle West Capital Corporation 2007 Long-Term Incentive Plan
10.3 to Pinnacle West/APS March 31,2009 Form 10-Q Report, File Nos.1-8962 and 1-4473
5/5/2009
10.6.1cbd
Pinnacle West
Form of Performance Share Agreement under the Pinnacle West Capital Corporation 2007 Long-Term Incentive Plan
10.1 to Pinnacle West/APS June 30,2010 Form 10-Q Report, FileNo. 1-8962
8/3/2010
10.6.1dbd
Pinnacle West
Form of Restricted Stock Unit Agreement under the Pinnacle West Capital Corporation 2007 Long-Term Incentive Plan
10.2 to Pinnacle West/APS June 30,2010 Form 10-Q Report, FileNo. 1-8962
8/3/2010
10.6.1ebd
Pinnacle West
Form of Performance Share Agreement under the Pinnacle West Capital Corporation 2007 Long-Term Incentive Plan
10.4 to Pinnacle West/APS March 31,2011 Form 10-Q Report, FileNo. 1-8962
4/29/2011
10.6.1fbd
Pinnacle West
Form of Restricted Stock Unit Agreement under the Pinnacle West Capital Corporation 2007 Long-Term Incentive Plan
10.5 to Pinnacle West/APS March 31,2011 Form 10-Q Report, FileNo. 1-8962
4/29/2011

192
ExhibitNo.
Registrant(s)
Description Previously Filed as Exhibit: a
Date Filed
10.6.1gbd
Pinnacle West
Form of Restricted Stock Unit Agreement under the Pinnacle West Capital Corporation 2007 Long-Term Incentive Plan (Supplemental 2010 Award)
10.6 to Pinnacle West/APS March 31,2011 Form 10-Q Report, FileNo. 1-8962
4/29/2011
10.6.2b
Pinnacle West
Description of Annual Stock Grants to Non-Employee Directors
10.1 to Pinnacle West/APSSeptember 30, 2007 Form 10-QReport, File No. 1-8962
11/6/2007
10.6.3b
Pinnacle West
Description of Annual Stock Grants to Non-Employee Directors
10.2 to Pinnacle West/APS June 30,2008 Form 10-Q Report, FileNo. 1-8962
8/7/2008
10.6.4bd
Pinnacle WestAPS
Summary of 2018 CEO Variable Incentive Plan and Officer Variable Incentive Plan
10.6.5
Pinnacle West
Description of Restricted Stock Unit Grant to Donald E. Brandt
Pinnacle West/APS December 24,2012 Form 8-K Report, FileNo. 1-8962
12/26/2012
10.6.6b
Pinnacle WestAPS
Pinnacle West Capital Corporation 2012 Long-Term Incentive Plan
Appendix A to the Proxy Statementfor Pinnacle West’s 2012 AnnualMeeting of Shareholders, FileNo. 1-8962
3/29/2012
10.6.6abd
Pinnacle West
Form of Performance Share Award Agreement under the Pinnacle West Capital Corporation 2012 Long-Term Incentive Plan
10.1 to Pinnacle West/APS March 31,2012 Form 10-Q Report, File Nos.1-8962 and 1-4473
5/3/2012
10.6.6bbd
Pinnacle West
Form of Restricted Stock Unit Award Agreement under the Pinnacle West Capital Corporation 2012 Long-Term Incentive Plan
10.2 to Pinnacle West/APS March 31,2012 Form 10-Q Report, File Nos.1-8962 and 1-4473
5/3/2012
10.6.6cbd Pinnacle West Form of Performance Share Award
Agreement under the Pinnacle West Capital Corporation 2012 Long-Term Incentive Plan
10.6.8c to Pinnacle West/APS 2013Form 10-K Report, File Nos. 1-8962and 1-4473
2/21/2014
10.6.6dbd
Pinnacle West
Form of Restricted Stock Unit Award Agreement under the Pinnacle West Capital Corporation 2012 Long-Term Incentive Plan
10.6.8d to Pinnacle West/APS 2013Form 10-K Report, File Nos. 1-8962and 1-4473
2/21/2014
10.6.6ebd Pinnacle West Form of Performance Share Award
Agreement under the Pinnacle West Capital Corporation 2012 Long-Term Incentive Plan
10.6.6e to Pinnacle West/APS 2015Form 10-K Report, File Nos. 1-8962and 1-4473
2/19/2016
10.6.6fbd
Pinnacle West
Form of Restricted Stock Unit Award Agreement under the Pinnacle West Capital Corporation 2012 Long-Term Incentive Plan
10.6.6f to Pinnacle West/APS 2016Form 10-K Report, File Nos. 1-8962and 1-4473
2/24/2017
10.6.6gbd Pinnacle West Form of Performance Share Award
Agreement under the Pinnacle West Capital Corporation 2012 Long-Term Incentive Plan
10.6.6g to Pinnacle West/APS 2016Form 10-K Report, File Nos. 1-8962and 1-4473
2/24/2017
10.6.6hbd
Pinnacle West
Master Amendment to Performance Share Agreements
10.3 to Pinnacle West/APS March 31,2012 Form 10-Q Report, File Nos.1-8962 and 1-4473
5/3/2012

193
ExhibitNo.
Registrant(s)
Description Previously Filed as Exhibit: a
Date Filed
10.6.6ibd
Pinnacle West
Master Amendment to Restricted Stock Unit Agreements
10.4 to Pinnacle West/APS March 31,2012 Form 10-Q Report, File Nos.1-8962 and 1-4473
5/3/2012
10.6.6jbd
Pinnacle West Performance Cash Award Agreement, dated May 10, 2017, between Pinnacle West and Donald E. Brandt
10.1 to Pinnacle West/APS June 30,2017 Form 10-Q Report, File Nos.1-8962 and 1-4473
5/2/2017
10.6.6kbd Pinnacle West First Amendment to the Pinnacle West Capital Corporation 2012 Long-Term Incentive Plan
Appendix A to the Proxy Statementfor Pinnacle West’s 2017 AnnualMeeting of Shareholders, File No.1-8962
3/31/2017
10.7.1
Pinnacle WestAPS
Indenture of Lease with Navajo Tribeof Indians, Four Corners Plant
5.01 to APS's Form S-7 RegistrationStatement, File No. 2-59644
9/1/1977
10.7.1a
Pinnacle WestAPS
Supplemental and AdditionalIndenture of Lease, includingamendments and supplements tooriginal lease with Navajo Tribe ofIndians, Four Corners Plant
5.02 to APS’s Form S-7 RegistrationStatement, File No. 2-59644
9/1/1977
10.7.1b
Pinnacle WestAPS
Amendment and Supplement No. 1 toSupplemental and AdditionalIndenture of Lease Four Corners,dated April 25, 1985
10.36 to Pinnacle West’s RegistrationStatement on Form 8-B Report, FileNo. 1-89
7/25/1985
10.7.1c
Pinnacle WestAPS
Amendment and Supplement No. 2 to Supplemental and Additional Indenture of Lease with the Navajo Nation dated March 7, 2011
10.1 to Pinnacle West/APS March 31,2011 Form 10-Q Report, File Nos.1-8962 and 1-4473
4/29/2011
10.7.1d
Pinnacle WestAPS
Amendment and Supplement No. 3 to Supplemental and Additional Indenture of Lease with the Navajo Nation dated March 7, 2011
10.2 to Pinnacle West/APS March 31,2011 Form 10-Q Report, File Nos.1-8962 and 1-4473
4/29/2011
10.7.2
Pinnacle WestAPS
Application and Grant of multi-partyrights-of-way and easements, FourCorners Plant Site
5.04 to APS’s Form S-7 RegistrationStatement, File No. 2-59644
9/1/1977
10.7.2a
Pinnacle WestAPS
Application and Amendment No. 1 toGrant of multi-party rights-of-wayand easements, Four Corners Sitedated April 25, 1985
10.37 to Pinnacle West’s RegistrationStatement on Form 8-B, FileNo. 1-8962
7/25/1985
10.7.3
Pinnacle WestAPS
Application and Grant of APS rights-of-way and easements, Four CornersSite
5.05 to APS’s Form S-7 RegistrationStatement, File No. 2-59644
9/1/1977
10.7.3a
Pinnacle WestAPS
Application and Amendment No. 1 toGrant of APS rights-of-way andeasements, Four Corners Site datedApril 25, 1985
10.38 to Pinnacle West’s RegistrationStatement on Form 8-B, FileNo. 1-8962
7/25/1985
10.7.4a
Pinnacle WestAPS
Four Corners Project Co-Tenancy Agreement Amendment No. 6
10.7 to Pinnacle West’s 2000Form 10-K Report, File No. 1-8962
3/14/2001
10.7.4b Pinnacle WestAPS
Four Corners Project Co-Tenancy Agreement Amendment No. 7, dated December 30, 2013, among APS, El Paso Electric Company, Public Service Company of New Mexico, SRP, SCE, and Tucson Electric Power Company
10.3 to Pinnacle West/APS March 31,2014 Form 10-Q Report, File Nos.1-8962 and 1-4473
5/2/2014

194
ExhibitNo.
Registrant(s)
Description Previously Filed as Exhibit: a
Date Filed
10.8.1
Pinnacle WestAPS
Indenture of Lease, Navajo Units 1,2, and 3
5(g) to APS’s Form S-7 RegistrationStatement, File No. 2-36505
3/23/1970
10.8.2
Pinnacle WestAPS
Application of Grant of rights-of-wayand easements, Navajo Plant
5(h) to APS Form S-7 RegistrationStatement, File No. 2-36505
3/23/1970
10.8.3
Pinnacle WestAPS
Water Service Contract Assignmentwith the United States Department ofInterior, Bureau of Reclamation,Navajo Plant
5(l) to APS’s Form S-7 RegistrationStatement, File No. 2-394442
3/16/1971
10.8.4
Pinnacle WestAPS
Navajo Project Co-Tenancy Agreement dated as of March 23, 1976, and Supplement No. 1 thereto dated as of October 18, 1976, Amendment No. 1 dated as of July 5, 1988, and Amendment No. 2 dated as of June 14, 1996; Amendment No. 3 dated as of February 11, 1997; Amendment No. 4 dated as of January 21, 1997; Amendment No. 5 dated as of January 23, 1998; Amendment No. 6 dated as of July 31, 1998
10.107 to Pinnacle West/APS 2005Form 10-K Report, File Nos. 1-8962and 1-4473
3/13/2006
10.8.5
Pinnacle WestAPS
Navajo Project Participation Agreement dated as of September 30, 1969, and Amendment and Supplement No. 1 dated as of January 16, 1970, and Coordinating Committee Agreement No. 1 dated as of September 30, 1971
10.108 to Pinnacle West/APS 2005Form 10-K Report, File Nos. 1-8962and 1-4473
3/13/2006
10.9.1
Pinnacle WestAPS
ANPP Participation Agreement, datedAugust 23, 1973, among APS, SRP,SCE, Public Service Company ofNew Mexico, El Paso, SouthernCalifornia Public Power Authority,and Department of Water and Powerof the City of Los Angeles, andamendments 1-12 thereto
10. 1 to APS’s 1988 Form 10-KReport, File No. 1-4473
3/8/1989
10.9.1a
Pinnacle WestAPS
Amendment No. 13, dated as ofApril 22, 1991, to ANPPParticipation Agreement, datedAugust 23, 1973, among APS, SRP,SCE, Public Service Company ofNew Mexico, El Paso, SouthernCalifornia Public Power Authority,and Department of Water and Powerof the City of Los Angeles
10.1 to APS’s March 31, 1991Form 10-Q Report, File No. 1-4473
5/15/1991
10.9.1b
Pinnacle WestAPS
Amendment No. 14 to ANPP Participation Agreement, dated August 23, 1973, among APS, SRP, SCE, Public Service Company of New Mexico, El Paso, Southern California Public Power Authority, and Department of Water and Power of the City of Los Angeles
99.1 to Pinnacle West’s June 30, 2000Form 10-Q Report, File No. 1-8962
8/14/2000

195
ExhibitNo.
Registrant(s)
Description Previously Filed as Exhibit: a
Date Filed
10.9.1c
Pinnacle WestAPS
Amendment No. 15, dated November 29, 2010, to ANPP Participation Agreement, dated August 23, 1973, among APS, SRP, SCE, Public Service Company of New Mexico, El Paso, Southern California Public Power Authority, and Department of Water and Power of the City of Los Angeles
10.9.1c to Pinnacle West/APS 2010Form 10-K Report, File Nos. 1-8962and 1-4473
2/18/2011
10.9.1d Pinnacle WestAPS
Amendment No. 16, dated April 28, 2014, to ANPP Participation Agreement, dated August 23, 1973, among APS, SRP, SCE, Public Service Company of New Mexico, El Paso, Southern California Public Power Authority, and Department of Water and Power of the City of Los Angeles
10.2 to Pinnacle West/APS March 31,2014 Form 10-Q Report, File Nos.1-8962 and 1-4473
5/2/2014
10.10.1
Pinnacle WestAPS
Asset Purchase and Power ExchangeAgreement dated September 21, 1990between APS and PacifiCorp, asamended as of October 11, 1990 andas of July 18, 1991
10.1 to APS’s June 30, 1991Form 10-Q Report, File No. 1-4473
8/8/1991
10.10.2
Pinnacle WestAPS
Long-Term Power TransactionAgreement dated September 21, 1990between APS and PacifiCorp, asamended as of October 11, 1990, andas of July 8, 1991
10.2 to APS’s June 30, 1991Form 10-Q Report, File No. 1-4473
8/8/1991
10.10.2a
Pinnacle WestAPS
Amendment No. 1 dated April 5, 1995 to the Long-Term Power Transaction Agreement and Asset Purchase and Power Exchange Agreement between PacifiCorp and APS
10.3 to APS’s 1995 Form 10-KReport, File No. 1-4473
3/29/1996
10.10.3
Pinnacle WestAPS
Restated Transmission Agreement between PacifiCorp and APS dated April 5, 1995
10.4 to APS’s 1995 Form 10-KReport, File No. 1-4473
3/29/1996
10.10.4
Pinnacle WestAPS
Contract among PacifiCorp, APS and DOE Western Area Power Administration, Salt Lake Area Integrated Projects for Firm Transmission Service dated May 5, 1995
10.5 to APS’s 1995 Form 10-KReport, File No. 1-4473
3/29/1996
10.10.5
Pinnacle WestAPS
Reciprocal Transmission Service Agreement between APS and PacifiCorp dated as of March 2, 1994
10.6 to APS’s 1995 Form 10-KReport, File No. 1-4473
3/29/1996
10.11.1
Pinnacle West
Term Loan Agreement dated as of December 31, 2014 among Pinnacle West, as Borrower, JPMorgan Chase Bank, N.A., as Agent, U.S. Bank Association, as Syndication Agent, TD Bank, N.A., The Bank of Nova Scotia and The Bank of Tokyo-Mitsubishi UFJ, Ltd., as Co-Documentation Agents, and such institutions compromising the lenders party thereto
10.11.2 to Pinnacle West/APS 2014Form 10-K Report, File Nos. 1-8962and 1-4473
2/20/2015

196
ExhibitNo.
Registrant(s)
Description Previously Filed as Exhibit: a
Date Filed
10.11.2 Pinnacle West Five-Year Credit Agreement dated as of May 13, 2016, among Pinnacle West, as Borrower, Barclays Bank PLC, as Agent and Issuing Bank, and the lenders and other parties thereto
10.1 to Pinnacle West/APS June 30,2016 Form 10-Q Report, File Nos.1-8962 and 1-4473
8/2/2016
10.11.2a Pinnacle West Amendment No. 1 to Five-Year Credit Agreement dated as of May 13, 2016, among Pinnacle West, as Borrower, Barclays Bank PLC, as Agent and Issuing Bank, and the lenders and other parties thereto
10.11.2a to Pinnacle West/APS June30, 2017 Form 10-Q Report, FileNos. 1-8962 and 1-4473
8/3/2017
10.11.3
Pinnacle West
364-day Credit Agreement dated as of August 31, 2016, among Pinnacle West, as Borrower, The Bank of Tokyo-Mitsubishi UFJ, Ltd., as Agent and Issuing Bank, and the lenders and other parties thereto
10.1 to Pinnacle West/APSSeptember 30, 2016 Form 10-QReport, File Nos. 1-8962 and 1-4473
11/3/2016
10.11.3a
Pinnacle West Amendment No. 1 to 364-day Credit Agreement dated as of August 31, 2016, among Pinnacle West, as Borrower, The Bank of Tokyo-Mitsubishi UFJ, Ltd., as Agent and Issuing Bank, and the lenders and other parties thereto
10.11.3a to Pinnacle West/APS June30, 2017 Form 10-Q Report, FileNos. 1-8962 and 1-4473
8/3/2017
10.11.4
Pinnacle WestAPS
Five-Year Credit Agreement dated as of June 29, 2017 among APS, as Borrower, Barclays Bank PLC, as Agent and Issuing Bank, and the lenders and other parties thereto
10.2 to Pinnacle West/APS June 30,2017 Form 10-Q Report, File Nos.1-8962 and 1-4473
8/3/2017
10.11.5 Pinnacle WestAPS
Term Loan Agreement dated as of June 26, 2015 among APS, as Borrower, Toronto Dominion (Texas) LLC, as Agent, Citibank, N.A., as Syndication Agent, and such institutions compromising the lenders party thereto
10.1 to Pinnacle West/APS June 30,2015 Form 10-Q Report, File Nos.1-8962 and 1-4473
7/30/2015
10.11.6 Pinnacle WestAPS
Term Loan Agreement dated as of April 22, 2016 among APS, as Borrower, Toronto Dominion (Texas) LLC, as Agent and such institutions compromising the lenders party thereto
10.1 to Pinnacle West/APS March 31,2016 Form 10-Q Report, File Nos.1-8962 and 1-4473
4/29/2016
10.11.7 Pinnacle WestAPS
Five-Year Credit Agreement dated as of May 13, 2016, among APS, as Borrower, Barclays Bank PLC, as Agent and Issuing Bank, and the lenders and other parties thereto
10.2 to Pinnacle West/APS June 30,2016 Form 10-Q Report, File Nos.1-8962 and 1-4473
8/2/2016
10.11.7a Pinnacle WestAPS
Amendment No. 1 to Five-Year Credit Agreement dated as of May 13, 2016, among APS, as Borrower, Barclays Bank PLC, as Agent and Issuing Bank, and the lenders and other parties thereto
10.11.7a to Pinnacle West/APS June30, 2017 Form 10-Q Report, FileNos. 1-8962 and 1-4473
8/3/2017

197
ExhibitNo.
Registrant(s)
Description Previously Filed as Exhibit: a
Date Filed
10.12.1c
Pinnacle WestAPS
Facility Lease, dated as of August 1,1986, between U.S. Bank NationalAssociation, successor to State StreetBank and Trust Company, assuccessor to The First National Bankof Boston, in its capacity as OwnerTrustee, as Lessor, and APS, asLessee
4.3 to APS’s Form 18 RegistrationStatement, File No. 33-9480
10/24/1986
10.12.1ac
Pinnacle WestAPS
Amendment No. 1, dated as ofNovember 1, 1986, to Facility Lease,dated as of August 1, 1986, betweenU.S. Bank National Association,successor to State Street Bank andTrust Company, as successor to TheFirst National Bank of Boston, in itscapacity as Owner Trustee, as Lessor,and APS, as Lessee
10.5 to APS’s September 30, 1986Form 10-Q Report by means ofAmendment No. 1 on December 3,1986 Form 8, File No. 1-4473
12/4/1986
10.12.1bc
Pinnacle WestAPS
Amendment No. 2 dated as of June 1,1987 to Facility Lease dated as ofAugust 1, 1986 between U.S. BankNational Association, successor toState Street Bank and TrustCompany, as successor to The FirstNational Bank of Boston, as Lessor,and APS, as Lessee
10.3 to APS’s 1988 Form 10-KReport, File No. 1-4473
3/8/1989
10.12.1cc
Pinnacle WestAPS
Amendment No. 3, dated as ofMarch 17, 1993, to Facility Lease,dated as of August 1, 1986, betweenU.S. Bank National Association,successor to State Street Bank andTrust Company, as successor to TheFirst National Bank of Boston, asLessor, and APS, as Lessee
10.3 to APS’s 1992 Form 10-KReport, File No. 1-4473
3/30/1993
10.12.1dc
Pinnacle WestAPS
Amendment No. 4, dated as of September 30, 2015, to Facility Lease, dated as of August 1, 1986, between U.S. Bank National Association, successor to State Street Bank and Trust Company, as successor to The First National Bank of Boston, as Owner Trustee under a Trust Agreement with Emerson Finance LLC, as Lessor, and APS, as Lessee
10.2 to Pinnacle West/APSSeptember 30, 2015 Form 10-QReport, File Nos. 1-8962 and 1-4473
10/30/2015
10.12.1ec
Pinnacle WestAPS
Amendment No. 3, dated as of September 30, 2015, to Facility Lease, dated as of August 1, 1986, between U.S. Bank National Association, successor to State Street Bank and Trust Company, as successor to The First National Bank of Boston, as Owner Trustee under a Trust Agreement with Security Pacific Capital Leasing Corporation, as Lessor, and APS, as Lessee
10.3 to Pinnacle West/APSSeptember 30, 2015 Form 10-QReport, File Nos. 1-8962 and 1-4473
10/30/2015

198
ExhibitNo.
Registrant(s)
Description Previously Filed as Exhibit: a
Date Filed
10.12.2
Pinnacle WestAPS
Facility Lease, dated as ofDecember 15, 1986, between U.S.Bank National Association, successorto State Street Bank and TrustCompany, as successor to The FirstNational Bank of Boston, in itscapacity as Owner Trustee, as Lessor,and APS, as Lessee
10.1 to APS’s November 18, 1986Form 8-K Report, File No. 1-4473
1/20/1987
10.12.2a
Pinnacle WestAPS
Amendment No. 1, dated as ofAugust 1, 1987, to Facility Lease,dated as of December 15, 1986,between U.S. Bank NationalAssociation, successor to State StreetBank and Trust Company, assuccessor to The First National Bankof Boston, as Lessor, and APS, asLessee
4.13 to APS’s Form 18 RegistrationStatement No. 33-9480 by means ofAugust 1, 1987 Form 8-K Report,File No. 1-4473
8/24/1987
10.12.2b
Pinnacle WestAPS
Amendment No. 2, dated as ofMarch 17, 1993, to Facility Lease,dated as of December 15, 1986,between U.S. Bank NationalAssociation, successor to State StreetBank and Trust Company, assuccessor to The First National Bankof Boston, as Lessor, and APS, asLessee
10.4 to APS’s 1992 Form 10-KReport, File No. 1-4473
3/30/1993
10.12.2c
Pinnacle WestAPS
Amendment No. 3, dated July 10, 2014, to Facility Lease, dated as of December 15, 1986, between U.S. Bank National Association, successor to State Street Bank and Trust Company, as successor to the First National Bank of Boston, as Lessor, and APS, as Lessee
10.2 to Pinnacle West/APS June 30,2014 Form 10-Q Report, File Nos.1-8962 and 1-4473
7/31/2014
10.13.1
Pinnacle WestAPS
Agreement between Pinnacle West Energy Corporation and APS for Transportation and Treatment of Effluent by and between Pinnacle West Energy Corporation and APS dated as of the 10th day of April, 2001
10.102 to Pinnacle West/APS 2004Form 10-K Report, File Nos. 1-8962and 1-4473
3/16/2005
10.13.2
Pinnacle WestAPS
Agreement for the Transfer and Use of Wastewater and Effluent by and between APS, SRP and PWE dated June 1, 2001
10.103 to Pinnacle West/APS 2004Form 10-K Report, File Nos. 1-8962and 1-4473
3/16/2005
10.13.3
Pinnacle WestAPS
Agreement for the Sale and Purchase of Wastewater Effluent dated November 13, 2000, by and between the City of Tolleson, Arizona, APS and SRP
10.104 to Pinnacle West/APS 2004Form 10-K Report, File Nos. 1-8962and 1-4473
3/16/2005
10.13.4
Pinnacle WestAPS
Operating Agreement for the Co-Ownership of Wastewater Effluent dated November 16, 2000 by and between APS and SRP
10.105 to Pinnacle West/APS 2004Form 10-K Report, File Nos. 1-8962and 1-4473
3/16/2005

199
ExhibitNo.
Registrant(s)
Description Previously Filed as Exhibit: a
Date Filed
10.13.5
Pinnacle WestAPS
Municipal Effluent Purchase and Sale Agreement dated April 29, 2010, by and between City of Phoenix, City of Mesa, City of Tempe, City of Scottsdale, City of Glendale, APS and SRP
10.1 to Pinnacle West/APS March 31,2010 Form 10-Q Report, File Nos.1-8962 and 1-4473
5/6/2010
10.14.1
Pinnacle WestAPS
Contract, dated July 21, 1984, withDOE providing for the disposal ofnuclear fuel and/or high-levelradioactive waste, ANPP
10.31 to Pinnacle West’s Form S-14Registration Statement, FileNo. 2-96386
3/13/1985
10.15.1
Pinnacle WestAPS
Territorial Agreement between APS and SRP
10.1 to APS’s March 31, 1998Form 10-Q Report, File No. 1-4473
5/15/1998
10.15.2
Pinnacle WestAPS
Power Coordination Agreement between APS and SRP
10.2 to APS’s March 31, 1998Form 10-Q Report, File No. 1-4473
5/15/1998
10.15.3
Pinnacle WestAPS
Memorandum of Agreement between APS and SRP
10.3 to APS’s March 31, 1998Form 10-Q Report, File No. 1-4473
5/15/1998
10.15.3a
Pinnacle WestAPS
Addendum to Memorandum of Agreement between APS and SRP dated as of May 19, 1998
10.2 to APS’s May 19, 1998 Form 8-K Report, File No. 1-4473
6/26/1998
10.16
Pinnacle WestAPS
Purchase and Sale Agreement dated November 8, 2010 by and between SCE and APS
10.1 to Pinnacle West/APSNovember 8, 2010 Form 8-K Report,File Nos. 1-8962 and 1-4473
11/8/2010
10.17
Pinnacle WestAPS
Proposed Settlement Agreement dated January 6, 2012 by and among APS and certain parties to its retail rate case (approved by ACC Order No. 73183)
10.17 to Pinnacle West/APS 2011Form 10-K Report, File Nos. 1-8962and 1-4473
2/24/2012
10.18
Pinnacle WestAPS
Proposed Settlement Agreement dated March 27, 2017 by and among APS and certain parties to its retail rate case (approved by ACC Order No. 76295)
10.1 to Pinnacle West/APS March 31,2017 Form 10-Q Report, File Nos.1-8962 and 1-4473
5/2/2017
12.1
Pinnacle West
Ratio of Earnings to Fixed Charges
12.2
APS
Ratio of Earnings to Fixed Charges
12.3
Pinnacle West
Ratio of Earnings to Combined Fixed Charges and Preferred Stock Dividend Requirements
21.1
Pinnacle West
Subsidiaries of Pinnacle West
23.1
Pinnacle West
Consent of Deloitte & Touche LLP
23.2
APS
Consent of Deloitte & Touche LLP
31.1
Pinnacle West
Certificate of Donald E. Brandt, Chief Executive Officer, pursuant to Rule 13a-14(a) and Rule 15d-14(a) of the Securities Exchange Act, as amended
31.2
Pinnacle West
Certificate of James R. Hatfield, Chief Financial Officer, pursuant to Rule 13a-14(a) and Rule 15d-14(a) of the Securities Exchange Act, as amended

200
ExhibitNo.
Registrant(s)
Description Previously Filed as Exhibit: a
Date Filed
31.3
APS
Certificate of Donald E. Brandt, Chief Executive Officer, pursuant to Rule 13a-14(a) and Rule 15d-14(a) of the Securities Exchange Act, as amended
31.4
APS
Certificate of James R. Hatfield, Chief Financial Officer, pursuant to Rule 13a-14(a) and Rule 15d-14(a) of the Securities Exchange Act, as amended
32.1e
Pinnacle West
Certification of Chief Executive Officer and Chief Financial Officer, pursuant to 18 U.S.C. Section 1350, as adopted pursuant to Section 906 of the Sarbanes-Oxley Act of 2002
32.2e
APS
Certification of Chief Executive Officer and Chief Financial Officer, pursuant to 18 U.S.C. Section 1350, as adopted pursuant to Section 906 of the Sarbanes-Oxley Act of 2002
99.1
Pinnacle WestAPS
Collateral Trust Indenture amongPVGS II Funding Corp., Inc., APSand Chemical Bank, as Trustee
4.2 to APS’s 1992 Form 10-K Report,File No. 1-4473
3/30/1993
99.1a
Pinnacle WestAPS
Supplemental Indenture to CollateralTrust Indenture among PVGS IIFunding Corp., Inc., APS andChemical Bank, as Trustee
4.3 to APS’s 1992 Form 10-K Report,File No. 1-4473
3/30/1993
99.2c
Pinnacle WestAPS
Participation Agreement, dated as ofAugust 1, 1986, among PVGSFunding Corp., Inc., Bank of AmericaNational Trust and SavingsAssociation, State Street Bank andTrust Company, as successor to TheFirst National Bank of Boston, in itsindividual capacity and as OwnerTrustee, Chemical Bank, in itsindividual capacity and as IndentureTrustee, APS, and the EquityParticipant named therein
28.1 to APS’s September 30, 1992Form 10-Q Report, File No. 1-4473
11/9/1992
99.2ac
Pinnacle WestAPS
Amendment No. 1 dated as ofNovember 1, 1986, to ParticipationAgreement, dated as of August 1,1986, among PVGS FundingCorp., Inc., Bank of AmericaNational Trust and SavingsAssociation, State Street Bank andTrust Company, as successor to TheFirst National Bank of Boston, in itsindividual capacity and as OwnerTrustee, Chemical Bank, in itsindividual capacity and as IndentureTrustee, APS, and the EquityParticipant named therein
10.8 to APS’s September 30, 1986Form 10-Q Report by means ofAmendment No. 1, on December 3,1986 Form 8, File No. 1-4473
12/4/1986

201
ExhibitNo.
Registrant(s)
Description Previously Filed as Exhibit: a
Date Filed
99.2bc
Pinnacle WestAPS
Amendment No. 2, dated as ofMarch 17, 1993, to ParticipationAgreement, dated as of August 1,1986, among PVGS FundingCorp., Inc., PVGS II FundingCorp., Inc., State Street Bank andTrust Company, as successor to TheFirst National Bank of Boston, in itsindividual capacity and as OwnerTrustee, Chemical Bank, in itsindividual capacity and as IndentureTrustee, APS, and the EquityParticipant named therein
28.4 to APS’s 1992 Form 10-KReport, File No. 1-4473
3/30/1993
99.3c
Pinnacle WestAPS
Trust Indenture, Mortgage, SecurityAgreement and Assignment ofFacility Lease, dated as of August 1,1986, between State Street Bank andTrust Company, as successor to TheFirst National Bank of Boston, asOwner Trustee, and Chemical Bank,as Indenture Trustee
4.5 to APS’s Form 18 RegistrationStatement, File No. 33-9480
10/24/1986
99.3ac
Pinnacle WestAPS
Supplemental Indenture No. 1, datedas of November 1, 1986 to TrustIndenture, Mortgage, SecurityAgreement and Assignment ofFacility Lease, dated as of August 1,1986, between State Street Bank andTrust Company, as successor to TheFirst National Bank of Boston, asOwner Trustee, and Chemical Bank,as Indenture Trustee
10.6 to APS’s September 30, 1986Form 10-Q Report by means ofAmendment No. 1 on December 3,1986 Form 8, File No. 1-4473
12/4/1986
99.3bc
Pinnacle WestAPS
Supplemental Indenture No. 2 toTrust Indenture, Mortgage, SecurityAgreement and Assignment ofFacility Lease, dated as of August 1,1986, between State Street Bank andTrust Company, as successor to TheFirst National Bank of Boston, asOwner Trustee, and Chemical Bank,as Lease Indenture Trustee
4.4 to APS’s 1992 Form 10-K Report,File No. 1-4473
3/30/1993
99.4c
Pinnacle WestAPS
Assignment, Assumption and FurtherAgreement, dated as of August 1,1986, between APS and State StreetBank and Trust Company, assuccessor to The First National Bankof Boston, as Owner Trustee
28.3 to APS’s Form 18 RegistrationStatement, File No. 33-9480
10/24/1986
99.4ac
Pinnacle WestAPS
Amendment No. 1, dated as ofNovember 1, 1986, to Assignment,Assumption and Further Agreement,dated as of August 1, 1986, betweenAPS and State Street Bank and TrustCompany, as successor to The FirstNational Bank of Boston, as OwnerTrustee
10.10 to APS’s September 30, 1986Form 10-Q Report by means ofAmendment No. l on December 3,1986 Form 8, File No. 1-4473
12/4/1986

202
ExhibitNo.
Registrant(s)
Description Previously Filed as Exhibit: a
Date Filed
99.4bc
Pinnacle WestAPS
Amendment No. 2, dated as ofMarch 17, 1993, to Assignment,Assumption and Further Agreement,dated as of August 1, 1986, betweenAPS and State Street Bank and TrustCompany, as successor to The FirstNational Bank of Boston, as OwnerTrustee
28.6 to APS’s 1992 Form 10-KReport, File No. 1-4473
3/30/1993
99.5
Pinnacle WestAPS
Participation Agreement, dated as ofDecember 15, 1986, among PVGSFunding Report Corp., Inc., StateStreet Bank and Trust Company, assuccessor to The First National Bankof Boston, in its individual capacityand as Owner Trustee, ChemicalBank, in its individual capacity andas Indenture Trustee under a TrustIndenture, APS, and the OwnerParticipant named therein
28.2 to APS’s September 30, 1992Form 10-Q Report, File No. 1-4473
11/9/1992
99.5a
Pinnacle WestAPS
Amendment No. 1, dated as ofAugust 1, 1987, to ParticipationAgreement, dated as of December 15,1986, among PVGS FundingCorp., Inc. as Funding Corporation,State Street Bank and TrustCompany, as successor to The FirstNational Bank of Boston, as OwnerTrustee, Chemical Bank, as IndentureTrustee, APS, and the OwnerParticipant named therein
28.20 to APS’s Form 18 RegistrationStatement No. 33-9480 by means of aNovember 6, 1986 Form 8-K Report,File No. 1-4473
8/10/1987
99.5b
Pinnacle WestAPS
Amendment No. 2, dated as ofMarch 17, 1993, to ParticipationAgreement, dated as of December 15,1986, among PVGS FundingCorp., Inc., PVGS II FundingCorp., Inc., State Street Bank andTrust Company, as successor to TheFirst National Bank of Boston, in itsindividual capacity and as OwnerTrustee, Chemical Bank, in itsindividual capacity and as IndentureTrustee, APS, and the OwnerParticipant named therein
28.5 to APS’s 1992 Form 10-KReport, File No. 1-4473
3/30/1993
99.6
Pinnacle WestAPS
Trust Indenture, Mortgage SecurityAgreement and Assignment ofFacility Lease, dated as ofDecember 15, 1986, between StateStreet Bank and Trust Company, assuccessor to The First National Bankof Boston, as Owner Trustee, andChemical Bank, as Indenture Trustee
10.2 to APS’s November 18, 1986Form 10-K Report, File No. 1-4473
1/20/1987
99.6a
Pinnacle WestAPS
Supplemental Indenture No. 1, datedas of August 1, 1987, to TrustIndenture, Mortgage, SecurityAgreement and Assignment ofFacility Lease, dated as ofDecember 15, 1986, between StateStreet Bank and Trust Company, assuccessor to The First National Bankof Boston, as Owner Trustee, andChemical Bank, as Indenture Trustee
4.13 to APS’s Form 18 RegistrationStatement No. 33-9480 by means ofAugust 1, 1987 Form 8-K Report,File No. 1-4473
8/24/1987

203
ExhibitNo.
Registrant(s)
Description Previously Filed as Exhibit: a
Date Filed
99.6b
Pinnacle WestAPS
Supplemental Indenture No. 2 toTrust Indenture Mortgage, SecurityAgreement and Assignment ofFacility Lease, dated as ofDecember 15, 1986, between StateStreet Bank and Trust Company, assuccessor to The First National Bankof Boston, as Owner Trustee, andChemical Bank, as Lease IndentureTrustee
4.5 to APS’s 1992 Form 10-K Report,File No. 1-4473
3/30/1993
99.7
Pinnacle WestAPS
Assignment, Assumption and FurtherAgreement, dated as of December 15,1986, between APS and State StreetBank and Trust Company, assuccessor to The First National Bankof Boston, as Owner Trustee
10.5 to APS’s November 18, 1986Form 8-K Report, File No. 1-4473
1/20/1987
99.7a
Pinnacle WestAPS
Amendment No. 1, dated as ofMarch 17, 1993, to Assignment,Assumption and Further Agreement,dated as of December 15, 1986,between APS and State Street Bankand Trust Company, as successor toThe First National Bank of Boston, asOwner Trustee
28.7 to APS’s 1992 Form 10-KReport, File No. 1-4473
3/30/1993
99.8c
Pinnacle WestAPS
Indemnity Agreement dated as ofMarch 17, 1993 by APS
28.3 to APS’s 1992 Form 10-KReport, File No. 1-4473
3/30/1993
99.9
Pinnacle WestAPS
Extension Letter, dated as ofAugust 13, 1987, from the signatoriesof the Participation Agreement toChemical Bank
28.20 to APS’s Form 18 RegistrationStatement No. 33-9480 by means of aNovember 6, 1986 Form 8-K Report,File No. 1-4473
8/10/1987
99.10
Pinnacle WestAPS
ACC Order, Decision No. 61969, dated September 29, 1999, including the Retail Electric Competition Rules
10.2 to APS’s September 30, 1999Form 10-Q Report, File No. 1-4473
11/15/1999
99.11
Pinnacle West
Purchase Agreement by and among Pinnacle West Energy Corporation and GenWest, L.L.C. and Nevada Power Company, dated June 21, 2005
99.5 to Pinnacle West/APS June 30,2005 Form 10-Q Report, File Nos.1-8962 and 1-4473
8/9/2005
101.INS
Pinnacle WestAPS
XBRL Instance Document
101.SCH
Pinnacle WestAPS
XBRL Taxonomy Extension SchemaDocument
101.CAL
Pinnacle WestAPS
XBRL Taxonomy ExtensionCalculation Linkbase Document
101.LAB
Pinnacle WestAPS
XBRL Taxonomy Extension LabelLinkbase Document
101.PRE
Pinnacle WestAPS
XBRL Taxonomy ExtensionPresentation Linkbase Document
101.DEF
Pinnacle WestAPS
XBRL Taxonomy DefinitionLinkbase Document
aReports filed under File No. 1-4473 and 1-8962 were filed in the office of the Securities and Exchange Commission located in Washington, D.C.

204
bManagement contract or compensatory plan or arrangement to be filed as an exhibit pursuant to Item
15(b) of Form 10-K.
cAn additional document, substantially identical in all material respects to this Exhibit, has been entered into, relating to an additional Equity Participant. Although such additional document may differ in other respects (such as dollar amounts, percentages, tax indemnity matters, and dates of execution), there are no material details in which such document differs from this Exhibit.
dAdditional agreements, substantially identical in all material respects to this Exhibit have been entered into with additional persons. Although such additional documents may differ in other respects (such as dollar amounts and dates of execution), there are no material details in which such agreements differ from this Exhibit.
eFurnished herewith as an Exhibit.

(This page intentionally left blank)

205
SIGNATURES
Pursuant to the requirements of Section 13 or 15(d) of the Securities Exchange Act of 1934, the Registrant has duly caused this report to be signed on its behalf by the undersigned, thereunto duly authorized.
PINNACLE WEST CAPITAL CORPORATION(Registrant)
Date: February 23, 2018 /s/ Donald E. Brandt(Donald E. Brandt, Chairman of
the Board of Directors, President andChief Executive Officer)
Power of Attorney
We, the undersigned directors and executive officers of Pinnacle West Capital Corporation, hereby
severally appoint James R. Hatfield and Jeffrey B. Guldner, and each of them, our true and lawful attorneys with full power to them and each of them to sign for us, and in our names in the capacities indicated below, any and all amendments to this Annual Report on Form 10-K filed with the Securities and Exchange Commission.
Pursuant to the requirements of the Securities Exchange Act of 1934, this report has been signed below by the following persons on behalf of the registrant and in the capacities and on the dates indicated.
Signature Title Date
/s/ Donald E. Brandt Principal Executive Officer February 23, 2018(Donald E. Brandt, Chairman and Director
of the Board of Directors, Presidentand Chief Executive Officer)
/s/ James R. Hatfield Principal Financial Officer February 23, 2018(James R. Hatfield,
Executive Vice President andChief Financial Officer)
/s/ Denise R. Danner Principal Accounting Officer February 23, 2018(Denise R. Danner,
Vice President, Controller andChief Accounting Officer)

206
/s/ Denis A. Cortese Director February 23, 2018(Denis A. Cortese, M.D.)
/s/ Richard P. Fox Director February 23, 2018(Richard P. Fox)
/s/ Michael L. Gallagher Director February 23, 2018(Michael L. Gallagher)
/s/ Roy A. Herberger, Jr., Ph.D. Director February 23, 2018(Roy A. Herberger, Jr., Ph.D.)
/s/ Dale E. Klein, Ph.D. Director February 23, 2018(Dale E. Klein, Ph.D.)
/s/ Humberto S. Lopez Director February 23, 2018(Humberto S. Lopez)
/s/ Kathryn L. Munro Director February 23, 2018(Kathryn L. Munro)
/s/ Bruce J. Nordstrom Director February 23, 2018(Bruce J. Nordstrom)
/s/ Paula J. Sims Director February 23, 2018(Paula J. Sims)
/s/ David P. Wagener Director February 23, 2018(David P. Wagener)

207
SIGNATURES Pursuant to the requirements of Section 13 or 15(d) of the Securities Exchange Act of 1934, the
Registrant has duly caused this report to be signed on its behalf by the undersigned, thereunto duly authorized.
ARIZONA PUBLIC SERVICE COMPANY (Registrant) Date: February 23, 2018 /s/ Donald E. Brandt (Donald E. Brandt, Chairman of
the Board of Directors, President and ChiefExecutive Officer)
Power of Attorney
We, the undersigned directors and executive officers of Arizona Public Service Company, hereby
severally appoint James R. Hatfield and Jeffrey B. Guldner, and each of them, our true and lawful attorneys with full power to them and each of them to sign for us, and in our names in the capacities indicated below, any and all amendments to this Annual Report on Form 10-K filed with the Securities and Exchange Commission.
Pursuant to the requirements of the Securities Exchange Act of 1934, this report has been signed below by the following persons on behalf of the registrant and in the capacities and on the dates indicated.
Signature Title Date
/s/ Donald E. Brandt Principal Executive Officer February 23, 2018(Donald E. Brandt, Chairman and Director
of the Board of Directors, President and
Chief Executive Officer)
/s/ James R. Hatfield Principal Financial Officer February 23, 2018(James R. Hatfield,
Executive Vice President and
Chief Financial Officer)
/s/ Denise R. Danner Principal Accounting Officer February 23, 2018(Denise R. Danner,
Vice President, Controller and
Chief Accounting Officer)

208
/s/ Denis A. Cortese Director February 23, 2018(Denis A. Cortese, M.D.)
/s/ Richard P. Fox Director February 23, 2018(Richard P. Fox)
/s/ Michael L. Gallagher Director February 23, 2018(Michael L. Gallagher)
/s/ Roy A. Herberger, Jr., Ph.D. Director February 23, 2018(Roy A. Herberger, Jr., Ph.D.)
/s/ Dale E. Klein, Ph.D. Director February 23, 2018(Dale E. Klein, Ph.D.)
/s/ Humberto S. Lopez Director February 23, 2018(Humberto S. Lopez)
/s/ Kathryn L. Munro Director February 23, 2018(Kathryn L. Munro)
/s/ Bruce J. Nordstrom Director February 23, 2018(Bruce J. Nordstrom)
/s/ Paula J. Sims Director February 23, 2018(Paula J. Sims)
/s/ David P. Wagener Director February 23, 2018(David P. Wagener)

(This page intentionally left blank)

(This page intentionally left blank)

(This page intentionally left blank)

(This page intentionally left blank)

(This page intentionally left blank)

(This page intentionally left blank)

(This page intentionally left blank)

(This page intentionally left blank)

(This page intentionally left blank)
