2017 annual report · transactions for a low brokerage fee. 5paisa is engaged in providing an...
TRANSCRIPT

HOLDINGS CORPORATION
2017 Annual Report

Contents
Fairfax India Corporate Performance . . . . . . . . 1
Corporate Profile . . . . . . . . . . . . . . . . . . . . . . 2
Letter to Shareholders . . . . . . . . . . . . . . . . . . . 4
Management’s Responsibility for theConsolidated Financial Statements . . . . . . . . 18
Independent Auditor’s Report . . . . . . . . . . . . . 19
Fairfax India Consolidated Financial Statements . 20
Notes to Consolidated Financial Statements . . . 26
Management’s Discussion and Analysis ofFinancial Condition and Results of Operations 55
Corporate Information . . . . . . . . . . . . . . . . . . 95

8MAR201619315321HOLDINGS CORPORATION
2017Annual Report
Fairfax India Corporate Performance
(in US$ thousands, except as otherwise indicated)(1)
Book Commonvalue Closing share- Shares Earnings
per share Net Total holders’ out- pershare price(1) Income earnings assets Investments equity standing(1) share
As at and for the years ended December 31Initial public offering 10.00 10.00(2)
2015 9.50 10.10 65,251 40,939 1,025,421 978,569 1,013,329 106.7 0.422016 10.25 11.55 128,604 107,825 1,303,497 1,095,569 1,075,446 104.9 1.012017 14.46 15.00 609,670 452,509 2,672,221 2,635,726 2,132,464 147.4 2.94
Compound annual growth 13.5%(3) 14.9%
(1) All share references are to common shares; Closing share price is in U.S. dollars; per share amounts are in U.S. dollars; Shares outstandingare in millions.
(2) On January 30, 2015, upon completion of the company’s initial public offering price of $10.00 per share, Fairfax India HoldingsCorporation’s subordinate voting shares began trading on the Toronto Stock Exchange under the symbol FIH.U.
(3) The company’s book value per share of $14.46 at December 31, 2017 represented a compound annual growth rate from the initial publicoffering price of $10.00 per share at January 30, 2015 of 13.5%.
1

FAIRFAX INDIA HOLDINGS CORPORATION
Corporate Profile
Fairfax India Holdings Corporation is an investment holding company whose objective is to achieve long termcapital appreciation, while preserving capital, by investing in public and private equity securities and debtinstruments in India and Indian businesses (‘‘Indian Investments’’).
Indian Investments(1)
IIFL Holdings Limited (‘‘IIFL’’) was incorporated in 1995 and is a publicly traded, diversified financial servicesholding company located in Mumbai, India with principal lines of business in wealth management, capital marketsand other activities (comprised of retail investment brokerage, institutional equities, investment banking andfinancial products distribution) and a non-banking finance company. IIFL’s revenues for the twelve months endedDecember 31, 2017 were $933 million. At year end, IIFL had shareholders’ equity of $1 billion and there were13,595 employees. Additional information can be accessed from IIFL’s website www.iifl.com.
Fairchem Speciality Limited (‘‘Fairchem’’, formerly known as Adi Finechem Limited) is a publicly traded,specialty chemical manufacturer located in Ahmedabad, India. Fairchem manufactures oleochemicals used in thepaints, inks and adhesives industries, as well as intermediate nutraceutical and health products. Privi OrganicsLimited (‘‘Privi’’), a wholly-owned subsidiary of Fairchem, is a supplier of aroma chemicals to the fragrance industryand is located in Mumbai, India. Privi’s world-class products are the result of its very strong research anddevelopment team that has proven expertise in developing new products, customizing aromas per customerspecifications, scaling up products from basic research to commercial scale, and designing process improvements todrive quality and cost optimization. Fairchem’s revenues (comprised of Fairchem and Privi) for the twelve monthsended December 31, 2017 were $149 million (prepared in accordance with International Financial ReportingStandards (‘‘IFRS’’)). At year end, Fairchem had shareholders’ equity of $72 million (based on IFRS) and there were1,336 employees. Additional information can be accessed from Fairchem’s and Privi’s websites www.fairchem.in andwww.privi.com.
5paisa Capital Limited (‘‘5paisa’’), located in Mumbai, India, is a publicly traded online financial servicesprovider with a do-it-yourself based investment brokerage model where the customer can execute investmenttransactions for a low brokerage fee. 5paisa is engaged in providing an online technology platform through Internetterminals and mobile applications for trading securities on the BSE (formerly known as Bombay Stock ExchangeLimited) and the National Stock Exchange of India. 5paisa’s revenues for the twelve months ended December 31,2017 were $3 million. At year end, 5paisa had shareholders’ equity of approximately $9 million and there were644 employees. Additional information can be accessed from 5paisa’s website www.5paisa.com.
Bangalore International Airport Limited (‘‘BIAL’’) is a private company located in Bengaluru, India. BIAL,under a concession agreement with the Government of India until the year 2038 (with the right to extend theagreement for an additional 30 years), has the exclusive rights to carry out the development, design, financing,construction, commissioning, maintenance, operation and management of the Kempegowda International AirportBengaluru (‘‘KIAB’’) through a public-private partnership. KIAB is the first greenfield airport in India built through apublic-private partnership. BIAL’s revenues for the twelve months ended December 31, 2017 were $231 million. Atyear end, BIAL had shareholders’ equity of $360 million and there were 903 employees. Additional information canbe accessed from BIAL’s website www.bengaluruairport.com.
National Collateral Management Services Limited (‘‘NCML’’) is a private agricultural commodities storagecompany headquartered in Gurugram, India, operating in the agriculture value chain and offering end-to-endsolutions in grain procurement, testing, storage and collateral management. In 2016 NCML launched its wholly-owned subsidiary, NCML Finance Private Ltd, which focuses on rural and agri-business finance. NCML’s revenues forthe twelve months ended December 31, 2017 were $167 million. At year end, NCML had shareholders’ equity of$97 million and there were 3,521 employees. Additional information can be accessed from NCML’s websitewww.ncml.com.
Notes:(1) All of the above Indian Investments’ revenues and shareholders’ equity figures are based on Indian Accounting Standards (‘‘Ind AS’’)
unless otherwise stated.
2

Sanmar Chemicals Group (‘‘Sanmar’’), a private company, is one of the largest suspension polyvinyl chloride(‘‘PVC’’) manufacturers in India, headquartered in Chennai, India with an operational presence in India and Egypt.Sanmar also manufactures caustic soda, chloromethanes, refrigerant gases, industrial salt and specialty chemicalintermediates. Sanmar’s revenues for the twelve months ended December 31, 2017 were $652 million. At year end,Sanmar had a shareholders’ deficit of $286 million and there were 2,252 employees. Additional information can beaccessed from Sanmar’s website www.sanmargroup.com.
Saurashtra Freight Private Limited (‘‘Saurashtra’’), a private company headquartered in Mumbai, India, runsone of the largest container freight stations at Mundra port (Gujarat), the third largest and fastest growing containerport in India. Services provided by Saurashtra’s container freight station includes transportation of containers to andfrom the port, stuffing/destuffing of containers, cargo storage, transportation of cargo to the end customer, and thestorage, maintenance and repair of empty containers. Saurashtra also provides services for container shipping,offering integrated logistic solutions to its customers by providing Saurashtra’s own containers to importers andexporters to transport cargo. Saurashtra’s revenues for the twelve months ended December 31, 2017 were$18 million. At year end, Saurashtra had shareholders’ equity of $31 million and there were 157 employees.Additional information can be accessed from Saurashtra’s website www.saurashtrafreight.com.
National Stock Exchange of India Limited (‘‘NSE’’), a private company located in Mumbai, India, operatesIndia’s largest stock exchange. In addition to providing a platform for exchange-traded financial products in India,NSE’s flagship index, Nifty50, is used extensively by investors in India and around the world as a barometer of theIndian capital markets. NSE’s revenues for the nine months ended December 31, 2017 were $341 million. Additionalinformation can be accessed from NSE’s website www.nseindia.com.
3

FAIRFAX INDIA HOLDINGS CORPORATION
To Our Shareholders,
Fairfax India turned three years old on January 30, 2018! While that doesn’t qualify as the long term, it is certainly astart to what we hope will be the base for true long term performance. Our results over the last three years areas follows*:
2017 2016 2015 CAGR(1)
Income 609,670 128,604 65,251Net earnings 452,509 107,825 40,939Return on equity 28.2% 10.3% 4.0% 14.2%(2)
Total assets 2,672,221 1,303,497 1,025,451 38.9%Investments 2,635,726 1,095,569 978,569 40.5%Common shareholders’ equity 2,132,464 1,075,446 1,013,329 29.1%Book value per share – before performance fee $ 15.24 $ 10.25 $ 9.50 17.1%Book value per share – net of performance fee $ 14.46 $ 10.25 $ 9.50 15.0%
(1) Compound annual growth rates are since Fairfax India’s inception on January 30, 2015, when it raised net proceeds of$1.03 billion at $10 per share representing an initial book value of $9.62 per share after expenses.
(2) Simple average of the return on equity for each of the three years.
Fairfax India’s common shareholders’ equity increased $1.1 billion or 98% from the previous year to $2.1 billion in2017. Book value per share, our key performance measure, increased by 41.1% in 2017, from $10.25 at the end of2016 to $14.46. During the same period the USD S&P BSE Sensex 30 (Sensex) appreciated by 37.9%. You can see thatit was a very successful year for the markets in India!
Looking over three years, however, Fairfax India greatly outperformed the market index, as demonstrated in thefollowing table showing percentage increases:
3-yearAt December 31, 2017 1-year Annualized(1)
Fairfax India book value per share:– before performance fee 48.7% 15.5%– after performance fee 41.1% 13.5%
USD S&P BSE Sensex 30 37.9% 5.9%
(1) Fairfax India’s 3-year annualized growth in book value per share is calculated based on its IPO price of $10 per share onJanuary 30, 2015.
Using its issue price of $10.00 per share as the starting point, over three years, Fairfax India’s annual increaseoutperformed the Sensex by 760 basis points.
Please note that Fairfax India’s book value is based on publicly traded market value only for the three of its eightinvestments which are publicly traded (the rest are based on appraised values not too different from their cost),whereas the Sensex is obviously based entirely on publicly traded market value.
Fairfax India’s net earnings had excellent growth in 2017, up 320% from $108 million in 2016 to $453 million in2017, largely the result of net unrealized gains on investments of $592 million compared to $105 million in 2016.Earnings also reflect interest income of $22 million, a performance fee payable of $114 million and net foreignexchange losses of $14 million. Fully diluted earnings per share grew 191% to $2.94 in 2017 from $1.01 in 2016.
On the investment front, during 2017 we acquired (in two stages), for an aggregate investment of $586 million, 48%of Bangalore International Airport Limited, which included the acquisition from the GVK Group of its entire 43%promoter stake in the airport. We will discuss this exciting investment in more detail later in this letter.
* All dollar amounts in this letter are in U.S. dollars unless specified otherwise. Numbers in the tables in this letter are inU.S. dollars and $ thousands except as otherwise indicated. Except where specified otherwise, all figures in this letter are,where applicable, after provision for the performance fee payable.
4

Also in 2017, we made an additional investment in IIFL Holdings (IIFL) and an investment in Saurashtra Freight, andthe merger of Fairchem Speciality and Privi Organics (Fairfax India had invested separately in each of them) wascompleted under the Fairchem name, resulting in Fairfax India owning 48.8% of Fairchem.
Since we began, Fairfax India has completed investments in eight companies, all located and reviewed by Fairbridge,Fairfax Financial Holdings’ (Fairfax Financial) wholly-owned sub-advisor in India. Fairbridge does outstanding workunder its CEO Harsha Raghavan and its Vice Presidents Sumit Maheshwari, Sarvjit Bedi and Amruta Adukia. FairfaxIndia’s Mauritius subsidiary, FIH Mauritius Investments, ably led by its CEO Amy Tan, and its independent Board ofDirectors are an integral part of the investment process.
All of Fairfax India’s investments are in outstanding companies with a history of strong financial performance, led byfounders and management who are not only excellent but also adhere to the highest ethical standards. The details ofthese investments in chronological order of the initial investment are as follows:
Fair Value atAmount December 31,
Date of Investment Ownership Invested 2017 Return(1)
National Collateral Aug. 2015 and 89.5% 174,318 179,054 1.3%Management Services Aug. 2017
IIFL Holdings (including Dec. 2015, Feb. 2017 26.6% 276,734 908,443 93.3%5paisa Capital) and Oct. 2017
Fairchem Speciality Feb. and Aug. 2016 48.8% 74,384 149,200 59.3%(formerly Adi Finechemand Privi Organics)
Sanmar Chemicals Group Apr. and Sep. 2016 Debentures and 300,000 333,728 6.9%30.0%
National Stock Exchange of Jul. 2016 1.0% 26,783 40,452 39.3%India
Saurashtra Freight Feb. 2017 51.0% 30,018 28,000 (7.6)%Bangalore International Mar. and Jul. 2017 48.0% 585,591 608,288 6.4%
Airport
Total 1,467,828 2,247,165
(1) Return calculated using the internal rate of return.
While the valuations of the private companies that Fairfax India has invested in remained relatively close to theprices it paid for them, two of the three publicly traded companies in its portfolio (IIFL and Fairchem Speciality) haveposted strong mark to market gains. IIFL’s share price has appreciated 207% to 670 rupees from our blended cost baseof 218 rupees, and Fairchem’s share price has appreciated 90% to 500 rupees from our adjusted cost base of263 rupees, resulting in mark to market gains, since inception, including foreign currency translation gains, of$632 million and $75 million respectively.
While the book value per share of Fairfax India is $14.46, we believe that the underlying intrinsic value is muchhigher. IIFL, for example, in spite of an average 14% return on equity (ROE) and a 30% annual growth in book valueper share over the past ten years, even at its current price of around 700 rupees per share is selling at a price earningsratio of only 18 times expected earnings and the founder, Nirmal Jain, is an outstanding entrepreneur. All thecompanies listed above have similar characteristics. The potential for all of them is very significant.
Performance Fee
You will recall that under the investment advisory agreement with Fairfax Financial, Fairfax India’s sponsor andcontrolling shareholder, and Fairfax Financial’s investment counsel subsidiary Hamblin Watsa, Fairfax India will, atthe end of 2017 and every three years thereafter, pay a performance fee (if earned) of 20% of the increase in bookvalue per share (on a rolling basis) in excess of the higher of a hurdle rate of 5% per annum and a high water mark.
As a result of the excellent performance of Fairfax India during the period from the completion of its IPO onJanuary 30, 2015 to December 31, 2017, the performance fee earned for this period was $114.4 million. Thisperformance fee was settled on March 9, 2018 by the issuance of 7.7 million subordinate voting shares valued at
5

FAIRFAX INDIA HOLDINGS CORPORATION
$14.93 per share (the weighted average share trading price over the last ten trading days in 2017). This increasedFairfax Financial’s ownership in Fairfax India from 30.2% at the end of 2017 to 33.6%.
Indian Investments(1)
IIFL Holdings (IIFL)
2017 was an outstanding year for IIFL and it is now ranked #241 (by revenue) in the Fortune 500-India List, up42 places from a year ago!
IIFL shares closed 2017 at a price of 670 rupees, a 207% increase in rupee terms from our blended cost base. In spite ofa 14% average ROE and 30% annual growth in book value per share over the past ten years, IIFL is selling at a priceearnings ratio of only 18 times expected earnings.
For the year ended December 31, 2017, IIFL’s revenue grew 33% to $933 million; profit after tax, after minorityinterest, grew 46% to $166 million; and shareholders’ equity grew 17% to $1 billion, generating an ROE of 17%.
IIFL is a leading, well-established national financial services company serving over 4 million customers from1,300 branches in India. It also has an international presence with offices in New York, Singapore, Dubai, Geneva,Hong Kong, London, Mauritius and Toronto. Through its subsidiaries, it offers a wide array of services includingloans and mortgages, asset and wealth management, and capital market related activities such as financial productsdistribution, investment banking, institutional equities and realty services. In addition to the founding team, IIFLnow has a highly qualified, experienced and motivated management team. Again in 2017 under the exceptionalleadership of Nirmal Jain and R. Venkataraman, IIFL achieved outstanding results in each of its three following majorbusiness divisions:
Loans and Mortgages: This division has made further progress in diversifying its lending to a more retail-focusedloan portfolio. Loan assets under management (AUM), predominantly retail, grew 29% to $4.3 billion, driven bysmall home loans and loans to small and medium enterprises (SMEs). Retail home loan assets grew 61% to$1.2 billion. Apart from mortgages, IIFL also offers its customers loans for commercial vehicles, gold loans, businessloans and loans against shares. Asset quality remained stable with gross non-performing assets (NPAs) of 2.1% andnet NPAs of 1.2%. On December 31, 2017 the total capital adequacy ratio (CAR) was 18.2% while the statutoryrequirement is 15%.
During the year, the housing finance arm assisted 6,600 households to acquire homes with the benefit of agovernment subsidy provided under a government initiative to promote affordable housing.
IIFL’s wholly-owned microfinance subsidiary, Samasta Microfinance, through its expansion in the eastern andsouthern parts of the country, grew its assets over the past nine months by 140% to $90 million and now serves over300,000 customers.
IIFL has made significant progress in its technology platform, having implemented the usage of automatic scorecardsfor instant credit assessment and enhanced its digitization processes. About 97% of loans were digitally on-boardedand more than 90% of the loans were booked using an Aadhaar-based electronic Know Your Client (eKYC) system.Aadhaar is India’s recently implemented biometric identification system, with over 1.2 billion registrants.
Wealth and Asset Management: In less than a decade since its inception, IIFL Wealth Management hascatapulted itself to the position of the largest private wealth management firm in India. Its 300+ bankers helpmanage the assets of more than 10,000 high and ultra high net worth individuals and families in India and abroad.Headquartered in Mumbai, it has more than 800 employees and a presence in nine major global financial hubs with23 locations in India and around the world.
Its total AUM grew 58% over the previous year to $20.1 billion. Profit after tax for the year ended December 31, 2017grew 62% over the previous year to $54 million.
IIFL Wealth Management is also the largest manager of Alternative Investment Funds in India, with AUM of$1.8 billion. The funds launched during the year included the Special Opportunities Fund and the IndiaHousing Fund.
(1) All of the Indian Investments’ figures are based on Indian Accounting Standards (Ind AS) unless otherwise stated. EffectiveApril 1, 2017 all of the company’s Indian Investments have adopted Ind AS. Ind AS are based on and substantiallycorrelated with IFRS.
6

IIFL Wealth Finance, its wholly-owned subsidiary that commenced operations in February 2016 to provide loansagainst securities to its clients, increased its loan book in 2017 by 100% to $916 million.
Capital Markets: This is a collection of several businesses, including retail and institutional stock broking,financial products distribution, mutual fund management and investment banking. The broking business is a leaderin its field and provides broking and advisory services to retail and institutional clients. It is well known for its highquality and innovative research which covers over 500 Indian stocks.
IIFL’s investment banking franchise has a pre-eminent position in India with a track record of strong execution and arobust pipeline of advisory and capital markets assignments. During the nine months ended December 31, 2017, itcompleted 21 transactions, including ten initial public offerings. It has been ranked #3 in equity issuances for 2016and 2017, covering IPOs, follow-on public offerings, qualified institutional placements and institutional placementprograms.
The IIFL Markets app is highly rated and the most downloaded app in India with over 1,300,000 downloads onGoogle Play Store. The app can also be accessed by retail investors at 1,200 locations in India. With the growth ofmobile networks in remote locations, do it yourself (DIY) mobile trading constitutes over 40% of clients and hasreduced the information asymmetry of financial markets in Tier 2 locations in India.
During the year, IIFL’s capital markets business introduced many new features on its ‘Markets’, ‘Mutual Funds’ and‘Loans’ applications. IIFL Markets was the first in the industry to implement a mobile personal identificationnumber-based login and the Mutual Funds app was the first in the industry to enable instant systematic investmentplans through a linkage to Aadhaar.
Proposed Reorganization of IIFL Group Companies: IIFL recently announced its intention to divide itsthree business groups described above into three separate companies, with each to be listed on the Indian stockexchanges. IIFL believes that this is the best structure for its business because:
1) Each business now has the critical mass to operate independently.
2) It allows each business to create its own business, platform and identity and focus on its own business,thereby achieving even higher growth in a rapidly changing, technology and innovation-drivenenvironment.
3) Each business needs to continue to attract and keep high quality talent to sustain its high growth rate. Eachcompany, listed separately, can attract and motivate its key people with stock options such that theirrewards are strongly correlated with their performance. Currently, stock options granted are on shares of theparent company.
4) It allows greater flexibility for each of the businesses to raise capital according to its needs.
5) It provides investors greater flexibility to invest in the businesses that best suit their strategies andrisk appetite.
The reorganization is subject to shareholder and regulatory approvals and is expected to be completed later in 2018.
The key challenges faced by IIFL in 2017 and going forward are:
• The Goods and Services Tax (GST), implemented in July 2017, changed the taxation structure of the country,resulting in some amount of disruption in the economy. SMEs were especially impacted due to neededtechnology investments and increased reporting and regulatory compliance requirements which hamperedtheir growth. However, IIFL is optimistic about the long term benefits of this change in taxation structure.
• IIFL believes that in 2018, interest rates will rise gradually, not only in India but also globally. This will result insome amount of yield compression in high value home loans, loans against property and financing of newcommercial vehicles. Also, due to intense competition from new players (many of whom are backed by privateequity) who are keen to grow their book size, product yields will remain low. Given its distribution reach andsuperior CAR, IIFL believes that it can withstand such short term pricing pressures. In any case, IIFL will nottake undue risks to increase short term market share.
• Retention of managerial talent will become a challenge, especially for the loans and mortgages business. IIFL isseeing a number of players entering the market and offering very high compensation to lure talent away. Thiswill also result in wage increases.
In summary, IIFL had an outstanding year in 2017!
7

FAIRFAX INDIA HOLDINGS CORPORATION
5paisa Capital (5paisa)
On October 20, 2017, IIFL spun off, and subsequently separately listed on the Indian stock exchanges, 5paisa, acompany it had incubated to take advantage of business opportunities in digital trading and distribution services, anemerging new segment with the potential for exponential growth. Its services are targeted at retail investors and highvolume traders who actively invest and trade in securities markets and DIY services at a low cost.
5paisa provides financial services through its online technology platform and mobile applications for trading ofsecurities on the Indian stock exchanges. Also, since it is a participant in India’s depositories for securities and mutualfunds, it is able to hold customers’ securities in their accounts.
Bangalore International Airport (BIAL)
In March 2017, Fairfax India acquired 38% of BIAL for $385 million (including 33% from GVK Group, BIAL’spromoter), implying an equity value of approximately $1 billion for the whole company. Based on BIAL’sMarch 2017 financial statements, the purchase price valued BIAL at a price earnings ratio of 14.5 times, price to bookvalue of 4.7 times and price to free cash flow of 8.7 times. The value of the extensive real estate that can be monetizedwas not included in this valuation. In July 2017 Fairfax India acquired the final 10% of BIAL owned by GVK for$200 million, the higher price being justified by this purchase enabling Fairfax India and the other remainingshareholders to reconstitute BIAL’s Board, to appoint the best qualified person as BIAL’s CEO, and generally to allowit to be managed according to Fairfax India’s standards of corporate governance and guiding principles.
Subsequently, three new directors with expertise in airport and airline management and finance were appointed tothe Board of BIAL, and Hari Marar, the former COO of BIAL, was appointed as its new Managing Director and CEO.We would like to thank G.V.K. Reddy (Chairman) and Sanjay Reddy (Vice Chairman) of GVK for their leadership indeveloping BIAL into one of the best airports in India and for seamlessly transferring their ownership interest in it toFairfax India.
BIAL has three potential sources of revenue:
• Aero Revenue: Aero revenue, which has grown at a CAGR of 22% from 2009 to 2017, is the revenue earnedfor providing services such as landing, take-off, parking, ground handling, ground safety, facilities, amenitiesand services to airlines and passengers. The tariffs for these services are set for five-year periods and are fixed soas to yield a regulated 16% ROE. The regulatory authority treats 30% of non-aero revenue as aero revenue.
BIAL is currently operating under tariffs set for the first five-year period. When set for the next five-year period,tariffs will be adjusted for any returns achieved above or below the regulated return in the first period, suchthat the regulated ROE is maintained over the term of the concession.
• Non-aero Revenue: All revenue other than aero revenue, such as revenue from cargo handling, fuel sales,food and beverage sales and duty free shops, constitutes non-aero revenue. Non-aero revenue has grown at aCAGR of 19% from 2009 to 2017 and is expected to grow substantially due to an increase in passenger growthrates, the availability of additional space and the increasing propensity of passengers at the airport tomake purchases.
• Real Estate Monetization: BIAL also has approximately 460 acres of land adjoining the airport that can bedeveloped. All of this land is undeveloped except for a small piece on which BIAL has built a hotel, currentlyoperated by the Taj hotel brand under a management contract. Bangalore’s historical population areas aregetting congested, so the city is expanding in the airport’s direction. BIAL anticipates significant upside, overtime, from monetization of this real estate.
BIAL had an outstanding year in 2017 with passenger traffic growing by 12.9% over the previous year to 25 millionpassengers and cargo handled growing 8.1%. BIAL’s revenue for 2017 grew 16% to $231 million and profit after taxgrew 25% to $105 million. Free cash flow after maintenance capex grew 15% to $151 million, implying a free cashflow yield of 12.3% if 100% of BIAL were valued on the basis of the aggregate purchase price of Fairfax India’s48% interest.
BIAL is entering a phase of significant investment to expand its currently designed capacity of 20 million passengersto 65 million in 2028. The land preparation for a second runway has been completed and the contract to constructthe second runway, scheduled to be completed in 2019, has been awarded. For the second terminal, scheduled to becompleted in 2021, the phase 1 schematic design has been completed and detailed planning has commenced. The
8

investment required to complete the expansion projects is approximately $2 billion and will be funded throughinternally generated funds and debt. The financing plan, based on a debt to equity ratio of 80:20, and negotiationswith banks are well underway.
This is indeed a very exciting investment for Fairfax India.
Sanmar Chemicals Group (Sanmar)
In 2016, Fairfax India lent Sanmar the rupee equivalent of $300 million by way of non-convertible debentures(NCDs) for a period of seven years. The NCDs pay 3% payment-in-kind interest and pay a redemption premium suchthat the yield of the NCDs is 13%. In addition, for $1 million Fairfax India received a 30% equity interest in Sanmar’sentire chemicals business. Fairfax India provided the initial tranche of $250 million in April 2016 and the secondtranche of $50 million in September 2016.
Based on discounted cash flows, we believe that the value of our loan to Sanmar is now $333 million and the value ofour 30% equity in Sanmar’s chemical business is $0.6 million. For the year ended December 31, 2017 Sanmar’srevenue grew by 14% to $652 million. Until Sanmar completes its capital projects in Egypt and sales ramp up to fullcapacity, it will lose money. Net loss in 2017 was reduced to $85 million from a loss of $113 million in 2016.However, earnings before income tax, depreciation and amortization (EBITDA) for 2017 increased 51% to$95 million. We expect over time to make a very rewarding compound annual return on this investment.
N. Sankar, the chairman of the Sanmar group, and his son Vijay, the deputy chairman, have grown it into a largeprivate conglomerate with sales of around $1 billion and an asset base of around $1.5 billion. Founded in the earlysixties, its business interests spanned chemicals, engineering technology and shipping, with operations in India, theMiddle East and the Americas. Fairfax India’s investment is in the chemicals business, which constitutes more than80% of the group’s operations and is housed within three operating companies, two in India, Chemplast Sanmar(Chemplast) and Sanmar Speciality Chemicals, and one in Egypt, TCI Sanmar (TCI). The group is renowned for itshigh integrity and the highest levels of corporate governance and environmental and social responsibility.
Chemplast is Sanmar’s flagship Indian company and has been in the chemicals business for 50 years, celebrating itsgolden anniversary in 2017. N. Sankar is considered a pioneer in the polyvinyl chloride (PVC) industry in India. Withhis visionary leadership, in 2009 Chemplast commissioned one of the largest greenfield PVC projects in India withan annual capacity of 200,000 tons per annum (ktpa) which has been enhanced to 300 ktpa, mainly through processimprovements and minor debottlenecking, with an additional investment of only around $1 million. The aggregatePVC capacity of Chemplast is 366 ktpa, making it the second largest PVC player in India.
Sanmar acquired TCI in 2007, with the intention of setting up a large greenfield PVC plant in Egypt to cater to thehigh growth markets of North Africa, the Middle East and parts of Europe. TCI currently has a 200 ktpa capacity PVCplant but until recently produced only at the rate of about 130 ktpa per annum. TCI has undertaken a majorexpansion as follows:
• Phase 1, already completed, made several improvements to the existing PVC plant, including the replacementof a dryer, which will enable it to eventually increase its production to its full capacity. It is already producingat a rate of about 150 kpta.
• Phase 2, with an investment of $185 million, is the addition of a new 200 ktpa PVC plant, a 130 ktpa calciumchloride plant and a 75 ktpa caustic soda by-product line. This phase is expected to be completed in 2018 andthe ramp-up to full production is expected to take two more years, with full capacity expected to be attained by2020. This will take advantage of Sanmar’s significant investment and infrastructure in Egypt.
Our analysis of the PVC industry going back about 25 years indicates that:
1. PVC sales are highly correlated with GDP growth. The auto, housing and construction sectors (key products:pipes and windows) are key drivers of this demand. TCI’s key market areas of India, Egypt and Turkey areexpected to see strong GDP growth and Sanmar has significant cost advantages supplying these countries.
2. PVC margins are not correlated to the price of crude oil or most other commodities.
9

FAIRFAX INDIA HOLDINGS CORPORATION
There have been some significant developments for Sanmar since our investment. Optimism which returned to theglobal PVC industry for the first time in a decade in 2016 continued through 2017. This was due to reduced levels ofproduction in China and Europe necessitated by the closure of sub-optimally sized and environmentally unfriendlyPVC plants. Limited capacity addition and growing demand led by markets like India and Egypt resulted in very goodprospects for the global PVC industry.
Chemplast again had very good financial performance in 2017. Margins were very strong, resulting in high cashgeneration. Its joint venture to manufacture chlorinated PVC (CPVC) received environmental clearance and projectplanning has commenced. CPVC is a fast growing commodity and the joint venture will be only the second domesticproducer addressing a big opportunity in India.
The previously announced acquisition by Chemplast of a hydrogen peroxide plant has been completed. Plans tomove the plant to Sanmar’s facilities are under way and the move is expected to be completed in 2018. Whencompleted, this plant will manufacture a value added product that utilizes hydrogen produced by Chemplast, andwill provide entry into the market for a new valuable and allied product.
TCI has successfully restructured its balance sheet with a capital injection of $285 million from the parent. Further, ithas obtained a $280 million project financing loan from a consortium of Indian banks for its expansion. The keyactivity for TCI over the last two years was the implementation of the important Phase 2 project described above, andTCI is expecting to complete the project on time and on budget in June 2018.
National Collateral Management Services (NCML)
NCML was Fairfax India’s very first investment, completed in August 2015. NCML has operated for over 13 years andis now well positioned to further expand and take advantage of the significant market potential in India’s under-developed agricultural storage industry. NCML operates in the agriculture value chain by offering end-to-endsolutions in grain procurement, testing, storage and collateral management.
NCML has more than 1.6 million metric tons (MT) of storage capacity across 785 warehouses in 18 states in India. Ithas a network of 40 regional offices, more than 500 touch points at agricultural produce markets and thousands offarmers and traders to facilitate procurement of commodities. With AUM of $1.7 billion, NCML commands a 36%share of the agricultural commodities collateral management business in India, offering custodial services to about75 banks and financial institutions for the management of collateralized agricultural commodities, based on whichthose institutions advance post-harvest loans to farmers or dealers owning commodities.
In 2015 Fairfax India invested a total of $149 million to acquire an 88% interest in NCML: $31 million was a capitalinfusion into NCML to fund growth plans, while the remaining $118 million was used to buy out existingshareholders. In August 2017, Fairfax India acquired an additional 1.4% stake through a rights issue for $25 million.Based on discounted cash flows, NCML is now valued at $179 million compared to our investment cost of$174 million.
For the year ended December 31, 2017 NCML’s revenue grew by 36% to $167 million, shareholders’ equity grew by20% to $97 million and net earnings grew by 67% to $6 million. The increase in revenue was driven by robustpercentage growth across all business segments, but in absolute numbers was driven disproportionately by thesupply chain business which accounted for over 70% of the increase. Based on 2017 results, Fairfax India’sinvestment cost of $174 million represents a price to book ratio of 1.8 times and a price earnings ratio of 25 times,multiples we believe are justified by the strong growth rate of NCML.
Under the continued able leadership of its CEO Sanjay Kaul, assisted by executive director Unupom Kausik, NCMLhas made significant progress in 2017, achieving growth momentum across each of its business segments, with afocus on expanding and diversifying its client base.
We summarize below the performance of NCML’s four major business groupings:
Supply Chain Management: This division provides end-to-end services to both government and private clientsin the procurement, storage, financing and logistics of agricultural commodities. In 2017, it added several newclients, grew revenue by 32% to $131 million and grew profit before tax by 75% to $2.1 million. It had developed aninnovative program for port-based services for handling and financing the import of pulses through a credit linefrom the Export Development Corporation of Canada. Unfortunately this could not become operational in 2017
10

because increased import duties caused the import of pulses to be unviable. This division is well positioned forfurther high growth in the future.
Storage and Preservation: This division provides warehousing and preservation services for agriculturalcommodities. With the waning impact of demonetization, capacity utilization of warehouse space increased to over80%, returning this division to profitability in 2017. Revenue grew 23% over the previous year to $15.1 million andprofit before tax grew to $0.6 million from a loss of $0.4 million in 2016. Several initiatives have been implementedto further drive capacity utilization and improve storage yields. This division will also benefit from the recentaddition of 100,000 MT of owned storage capacity.
As you may recall, this division launched a modern warehousing silo vertical by successfully bidding for 13 largeconcession contracts from the Food Corporation of India. This represents an aggregate capacity increase of650,000 MT at an estimated total project cost of about $122 million. The project is progressing well and landacquisition for the project has been completed.
Collateral Management: This division offers custodial services to about 75 banks and financial institutions forthe management of collateralized agricultural commodities, based on which those institutions advance post-harvestloans to farmers or traders owning these commodities. While this division remained focused on strengtheningprotocols in 2017, revenue grew 19% to $12.2 million and profit before tax grew 15% to $3.2 million.
NCML Finance (Nfin): Nfin, established in 2016, is a Reserve Bank of India (RBI)-registered NBFC that focuses onrural and agri-business lending. In 2017 it grew revenue by 482% to $3.5 million and achieved profit before tax of$1.1 million. While continuing to pursue increased market share in the warehouse receipt finance market, Nfin plansto diversify its service offerings to several other product categories.
Beyond the four above major business groupings, in 2017 NCML’s testing and certification service, commodity andweather intelligence service and newly launched online commerce portal NCML MktYard all continued to makeexcellent progress.
Fairchem Speciality (Fairchem)
In March 2017, the previously announced merger of Fairchem Speciality and Privi Organics (Privi) was completed,resulting in Fairfax India owning 48.8% of Fairchem. Fairfax India had earlier separately owned controlling interestsin both these companies.
Based on IFRS, for the year ended December 31, 2017 the consolidated Fairchem entity grew revenue by 25% to$149 million and net income by 16% to $6 million. Shareholders’ equity grew 8% to $72 million, generating an ROEof 8.5%.
While the two businesses have been merged into one corporate entity, they will each continue to be managedindependently by their founders and existing management teams. We describe below the performance of thetwo businesses:
Fairchem (formerly Adi Finechem): Fairchem, led by Nahoosh Jariwala, is an oleochemicals company.Oleochemicals are, broadly, chemicals that are derived from plant or animal fat, which can be used for making bothedible and non-edible products. In recent years the production of oleochemicals has been moving from the U.S. andEurope to Asian countries because of the local availability of key raw materials.
Fairchem occupies a unique niche in this large global playing field. It has developed an in-house technology that usesmachinery manufactured by leading European companies to convert waste generated during the production of soy,sunflower, corn and cotton oils into valuable chemicals. These chemicals include acids that go into non-edibleproducts like soaps, detergents, personal care products and paints, and other products that are used in themanufacture of health foods and vitamin E. The company’s customers include major multinational companiesincluding BASF, Archer Daniels Midland, Cargill, Advanced Organic Materials, IFFCO Chemicals and Asian Paints.Fairchem operates out of a single plant in Ahmedabad, the largest city in Gujarat, the home state of Prime MinisterModi: the plant has one of the largest processing capacities for natural soft oil-based fatty acids in India. Over the lastten years, Fairchem’s sales have grown on average at 22% per year, net earnings have grown on average at 23% peryear, and the average annual ROE was over 17%.
Based on IFRS, for the year ended December 31, 2017 Fairchem revenue grew by 28% to $38 million, net earningsgrew by 12% to $2 million, and shareholders’ equity grew 15% to $13 million, generating an ROE of 17.5%. The
11

FAIRFAX INDIA HOLDINGS CORPORATION
capacity increase implemented in 2016 paid dividends in 2017 as the volume of raw material processed grew 31% to38,906 tons.
Privi: Founded in 1992, Privi, led by Mahesh Babani and D. B. Rao, is one of India’s leading manufacturers ofaroma chemicals. Privi started manufacturing aroma chemicals with only two products, which it gradually expandedto a range of over 50 products today, with a capacity of over 24,500 tonnes per annum. Its products are used asfragrance additives in perfumes, soaps, shampoos and packaged food. Privi enjoys a dominant position andeconomies of scale in its product categories. Privi also develops and produces custom-made aroma chemicals tospecific requirements of its customers. Privi sources most of its raw materials from pulp and paper companies globallyand competes primarily with pure play and niche suppliers such as IFF, DRT and Renessenz.
One of Privi’s significant strengths is its established research and development capabilities in aroma chemicals, witha staff of 81 people comprised of PhDs in chemistry, chemical engineers and instrumentation engineers. The researchspecialists continuously strive to develop new products and processes. Importantly, one of the R&D labs iscompletely focused on developing, through biotechnology, green products and green technologies in technicalcollaboration with the University Institute of Chemical Technology, Mumbai.
Based on IFRS, for the year ended December 31, 2017 Privi revenue grew 24% to $111 million, net earnings grew 30%to $4 million, and shareholders’ equity grew 7% to $59 million, generating an ROE of 7%.
Pinene-based products constitute about 60% of Privi’s revenue and net earnings. Prices for Pinene-based products,which were depressed for the last three years, started to turn around toward the end of 2017. About 75% of Privi’sPinene-based products business is based on annual contracts, and contracts for 2018 are being set at prices about 20%higher than the prior year’s price.
Privi has made significant investments in manufacturing facilities that convert a waste product in pulp and papermanufacturing, crude sulphated turpentine (CST), into aroma chemicals. CST, a more cost effective raw materialthan the more traditional plant based gum turpentine oil (GTO), is procured through annual contracts while GTOhas to be purchased on volatile spot markets. This positions Privi for more profitable operations in the future.
Saurashtra Freight (Saurashtra)
In February 2017 Fairfax India invested $30 million to acquire a 51% interest in Saurashtra. $18 million of the$30 million was used to purchase the founder’s stake: $10 million of this was infused back into Saurashtra by thefounders and used to unwind all previous transactions with Saurashtra group companies. The remaining $12 millionwas invested directly into Saurashtra. Based on Saurashtra’s March 31, 2017 annual financial statements, this impliesa price earnings ratio of 17.7 times and price to book value of 1.0 times for a business that has over the past five yearsgrown revenue and EBITDA at 18% and 15% per annum respectively and generated a 25% average ROE. After thecompletion of the transaction, Saurashtra was left with about $22 million of cash, which it intended to use to pursueits acquisition plans.
Saurashtra’s principal business is owning and operating container freight stations (CFSs), which are an importantlink between transport operators and shipping lines and effectively work as an extension of a port. It is in the port’sbest interest to focus on maximizing container traffic and not get bogged down handling containers that are waitingto be dispatched. Also, ports lack adequate storage facilities to hold containers for extended periods of time. CFSsprovide a facility outside of congested ports for temporary storage of goods pending customs clearance and furtherdistribution. Activities like stuffing and destuffing of containers, which might otherwise have to be done in the port,are done at the CFS.
Launched in 2005, Saurashtra is located five kilometers from Mundra port. With 24/7 operations, Saurashtra has thecapacity to handle 180,000 TEUs (twenty foot equivalent unit cargo containers) per annum and handled about90,000 TEUs in 2017, implying capacity utilization of about 50%. Under the dynamic leadership of RaghavAgarwalla, it has achieved a market share of about 14% at Mundra port, the highest among all CFSs there. Saurashtraderives volume and revenue from both the import and export of containers.
For the year ended December 31, 2017 Saurashtra’s revenue grew 15% to $18 million. Due to investments in newbusinesses described below and the losses incurred in one of them, Sauashtra did not have any net earnings in thisperiod whereas it had net earnings of $2.0 million in the previous year.
12

In 2017 Saurashtra embarked on an aggressive cost optimization program. The entire purchasing process and teamwas revamped, and Saurashtra introduced online auctioning for all high value and bulk purchases. It believes thatthese efforts will bear fruit in 2018.
In order to stay ahead of its competition, Saurashtra implemented several major technology initiatives in 2017. Italso more than doubled its fleet size from 51 to 111 trucks to cater to the growing transportation needs of itscustomers, and achieved average capacity utilization of 85% of its fleet.
Saurashtra also launched two small ancillary businesses in 2017. In August, it launched Fairfreight Lines (Fairfreight),a non-vessel operating common carrier (NVOCC). Fairfreight has a container fleet of over 1,000 TEUs with its ownbranding. Many existing customers of Saurashtra have started using Fairfreight as their preferred carrier for the Gulfregion. This initiative has had a good beginning and is expected to be profitable from the first quarter of 2018.
The second business, Fairwind Shipping, a feeder shipping service to several Gulf ports, was not as successful and wasshut down after it sustained losses. Increased competition rendered this business unviable.
Saurashtra continues to pursue other growth opportunities. In order to take advantage of the robust growth in itsexport business, it is evaluating a proposal to increase its capacity. This would allow it to handle incremental cargo ofexisting customers who are currently using other CFSs. Saurashtra also continues to seek and evaluate opportunitiesto acquire CFSs at other major container ports.
National Stock Exchange of India (NSE)
In July 2016, Fairfax India acquired a 1% stake in NSE, the largest stock exchange in India with a market share of over88% in cash equity trading and 100% in equity derivatives trading. With over 200,000 terminals in over2,000 centres, NSE provides trading facilities with national reach. The exchange uses the latest communicationstechnology for automated screen-based trading. For the year ended March 31, 2017, NSE’s revenue grew 14% to$413 million and profit after tax grew 93% to $188 million. The planned initial public offering of NSE has beendelayed and is now expected sometime in 2018 or 2019.
Catholic Syrian Bank (CSB)
On February 20, 2018 Fairfax India agreed, subject to various conditions precedent including regulatory approval, tobuy a 51% stake in CSB for consideration of 12.1 billion rupees (approximately $186 million). This was theculmination of an effort that began in December 2016, when the RBI gave Fairfax India permission to acquire a 51%stake in CSB. This was the first time in the history of the RBI that anyone was given approval to acquire a majoritystake in a bank in India.
However, after several months of negotiations, in May 2017 we discontinued our efforts because we could not agreewith the Board of CSB on the price and valuation at which we would invest in the bank. Since that time CSB haspursued, unsuccessfully, several avenues to attract capital at a valuation acceptable to it.
Meanwhile, in anticipation of investing in CSB, we had identified Mr. C.V.R. Rajendran as the individual who wouldhave been our choice for CEO of the bank. He in fact was appointed as CEO about 14 months ago and is now well incontrol: he understands the bank and its loan book very well.
In late January 2018, Mr. Rajendran reopened the conversation with us on the premise that based on improvementshe had made at the bank, including loan recoveries and successful enhancements to its organizational structure,there might have emerged a new price and valuation that may be acceptable to us. This was indeed the case, and wehave now agreed to invest at 140 rupees per share, implying a multiple of 1.1 times the September 30, 2017 bookvalue per share. While Mr. Rajendran has already implemented several positive changes, much more still needs to bedone to improve and modernize CSB and bring it to its full potential. The capital that we are infusing will be used toimprove its CAR and drive the necessary changes.
Christianity in India dates back to 52 A.D. when, according to legend, Saint Thomas, one of the disciples of Jesus,arrived in what is present day Kodungallur, Kerala, barely a few miles from Thrissur where CSB is headquartered. TheChristians of the area were called Syrian, which comes from ‘Syrio’ which is the language of one of the forms ofCatholic liturgy called Syrio-Catholic. Today Syrian Catholics are a large Christian sect from Kerala with a world-widemembership of over 5 million.
13
FAIRFAX INDIA HOLDINGS CORPORATION
On the initiative of influential members of the local Christian community, CSB was founded in 1920 in Thrissur inwhat is now the Indian state of Kerala. During that time, Thrissur was the centre of vast agricultural production in thesurrounding areas and was thriving as a centre for trade and banking, and many other banks were founded thereduring that time.
Today CSB is one of the oldest private sector banks in India and has a strong base in Kerala along with a significantpresence in the states of Tamil Nadu, Karnataka and Maharashtra. The bank currently operates 421 branches and251 ATMs across India. With its branches primarily in south India, it focuses on retail, gold and SME loans. Together,these comprise over 80% of total advances. Over the last few years, CSB had deviated from its core expertise and builta meaningful corporate lending book, mainly through consortium lending. In the last two years, it has had to takesignificant write-offs on this portfolio. CSB also owns 38 residential and commercial properties and land banks, somepurchased several years ago and others acquired by enforcement of security.
Financial Position
Fairfax India came into being about three years ago on January 30, 2015, when it issued 106.7 million shares, raisinggross proceeds of $1.1 billion by completing a public offering, a placement to cornerstone investors and an issue toFairfax Financial. In September 2016, the company completed a $225 million two-year secured term loan with asyndicate of Canadian banks. In January 2017 Fairfax India issued 42.6 million shares at $11.75 per share in a publicoffering and a concurrent private placement to OMERS and Fairfax Financial, raising gross proceeds of $500 million.In March 2017, the company repaid its term loan of $225 million to the syndicate of Canadian banks, and then inJuly 2017 it completed a $400 million one-year secured loan from a Canadian bank. Fairfax India currently has about$412 million for new investments and ongoing expenses.
At December 31, 2017, the financial position of Fairfax India was as follows:
($ millions)
Undeployed cash and investments 412.4Secured term loan (from a Canadian bank, maturing in July 2018) 400.0Common shareholders’ equity 2,132.5Total debt to equity 18.8%
Developments in India
One of the signals that the unrelenting economic reforms that Prime Minister Modi has been implementing, since hetook office almost four years ago, are working, is that India has moved up by 30 places, and broken into the top100 for the first time, in the 2018 World Bank Business Report’s ‘Ease of doing business’ measure. While there is still along way to go, this indicates that India is moving in the right direction.
We summarize below some of the significant developments in India in 2017:
Recovery in economic growth: Economic growth decelerated sharply after demonetization (the withdrawalfrom circulation of all the high denomination currency that represented 80% of the currency in circulation,described in last year’s letter) and during the transition to the new GST that replaced an archaic tax regime that had amyriad of multilevel taxes and domestic excise duties for the movement of goods from one state to another. GDPgrowth in the second quarter of 2017 dropped to just 5.7%, the lowest in more than three years. However, recent datareleases suggest that growth is finally recovering. Manufacturing PMI in December 2017 was the highest in morethan five years, while industrial production growth in November was the highest in two years. GDP growthrecovered to the 7% level in the fourth quarter of 2017.
Demonetization: Last year we discussed at length the economic and political impact of India’s 2016demonetization – the immediate withdrawal from circulation of all the high denomination currency in circulation(the 500 and 1,000 rupee notes, worth about $7.50 and $15.00) and their replacement with new 500 and 2,000 rupeenotes. One year on, India has recovered fully from any negative economic impact of demonetization and there isgeneral consensus that the level of tax avoidance has declined, as evidenced by the 1.8 million increase in individualsfiling income tax returns. Personal income tax collection has increased by approximately 20% over the previous yearin each of the years ending March 2017 (actual) and 2018 (estimate), resulting in additional tax revenues ofapproximately $18 billion in the two years. The increase in each of the two years before demonetization was onlyapproximately 9%. While currency in circulation has continued to increase and as a percent of GDP is only 10%
14

below the levels prior to demonetization, digital transactions have increased substantially and non-cash retailpayments in 2017 increased over the previous year by 65% in volume terms and 34% in value terms.
Aadhaar: India’s recently implemented biometric-based identity program, generally referred to as the Aadhaarprogram, now covers 1.2 billion people, 90% of India’s population. Growth in Aadhaar coverage creates a crediblebase for future direct benefit transfers of government subsidies. Last year the government passed the Aadhaar Act toenable targeted delivery of government subsidies and services using the Aadhaar identity. Aadhaar has now beenused to authenticate a staggering 17 billion transactions and is currently being used to authenticate almost30 million transactions a day. Since the April 1, 2017 start of India’s current fiscal year, almost $15 billion of benefitshave been transferred directly into the bank accounts of about 320 million individual intended recipients.
Recapitalization of banks: Resolving Indian banks’ twin balance sheet problems of high NPAs and highcorporate leverage has been one of the key challenges faced by the government. In its efforts to resolve this issue andkick-start the capex cycle, the government announced a bank recapitalization program of $32 billion (1.3% of GDP).Under this program the government would sell, for payment in kind by way of equity shares, ‘recapitalization bonds’to the banks worth $21 billion, and the remaining $11 billion would be raised through a combination of direct cashinfusion by the government and capital raised from the market. The first tranche of $12.5 billion of recapitalizationbonds will be issued before the end of March 2018. This should provide banks enough capital to fully recognize andprovide for the bad loans on their balance sheets. This, coupled with the new bankruptcy code, is expected to helpresolve bank NPAs and support capex recovery in the medium term.
Decisive steps to resolve bank NPAs: RBI has directed banks to file insolvency proceedings against the12 largest NPA accounts and to either resolve a further 28 NPA accounts or file insolvency proceedings against them.Thus, bankruptcy proceedings under the new bankruptcy code will be initiated against up to 40 accounts thatrepresent almost a third of total NPAs. Since the new code requires that the proceedings must be completed in270 days, these accounts either would be subject to a credible resolution plan or would be liquidated in less than ayear. Thus, the end game in the battle against NPAs has begun and 2018 should result in the banks crystallizing (notjust setting up provisions for) their actual losses on the major NPAs. They can then start lending again, as therecapitalization program for banks described above will allow them to take the write-offs needed under this process.
Implementation of Goods and Services Tax (GST): In July 2017, India’s complex multi-tiered indirect taxcode was replaced by a single GST, culminating a reform process that started over a decade ago. GST intends toeliminate the cascading of taxes, simplify compliance procedures and unify India into a single market for the sale ofgoods and services. While there have been teething problems in the transition, the system is likely to settle over thenext couple of quarters. Medium-term benefits of GST include increased productivity, especially in logistics, theelimination of cascading taxes, easier inter-state trade and higher tax revenues for the government due to improvedcompliance.
Moderate inflation: Due to low commodity prices and modest Minimum Support Price increases for agriculturalproducts, inflation continued to be benign for most of the year. Although inflation has edged up to an annualized5.2% over the last couple of months, driven by a rise in house rents and vegetable prices, it remains within the targetrange of the Monetary Policy Committee. Inflation in 2018 is expected to be around 3.5%, significantly lower thanthe double-digit inflation of the past.
Political stability: The ruling BJP party continued to consolidate its hold over Indian politics. The BJP won alandslide majority in the largest Indian state of Uttar Pradesh and retained its bastion of Gujarat. It also wrestedpower from the opposition Congress party in the small northern Indian state of Himachal Pradesh. The BJP is now inpower in 19 of the 29 lndian states and this could help it gain control of the upper house (Rajya Sabha). If, as widelyexpected, it comes back to power in 2019, the BJP would thus not face any significant legislative headwinds inimplementing reforms.
Continued macro stability and consequent sovereign rating upgrade: India has achieved remarkablemacro stability over the last few years. The current account deficit has declined to less than 1% of GDP in the fiscalyear ended March 31, 2017 and is likely to remain below 2% in the 2018 fiscal year (FY). As noted above, inflation hasmoderated to less than 4%, the lowest in more than a decade. The government has continued to reduce its fiscaldeficit, achieving a level of 3.5% of GDP in FY17, and is budgeting for a further reduction to around 3.2% in FY18. Asa result of this, in the past few years the rupee has remained one of the most stable emerging market currencies,
15
8MAR201612231920 10MAR201607580995
FAIRFAX INDIA HOLDINGS CORPORATION
outperforming a basket of 12 emerging market currencies for four consecutive years from 2014 to 2017. In 2017,Moody’s upgraded India’s sovereign credit rating by a notch to Baa2 from Baa3.
As we end our first three years of operation, we would like to acknowledge the strong support and leadershipprovided by John Varnell, Vice President of Corporate Affairs, Jennifer Allen, Chief Financial Officer, and Keir Hunt,General Counsel and Corporate Secretary. We would also like to thank our independent directors, Deepak Parekh,Tony Griffiths, Chris Hodgson and Alan Horn, for their wise advice, support and encouragement.
We are looking forward to seeing you at our annual meeting at 2:00 p.m. (Eastern time) on April 26, 2018 at RoyThomson Hall, 60 Simcoe Street, Toronto, Canada. Once again you will have the opportunity to meet the excellentleaders of many of our companies: Raghav Agarwalla (Saurashtra), Mahesh Babani (Privi), Nirmal Jain (IIFL),Nahoosh Jariwala (Fairchem), Sanjay Kaul (NCML), Hari Marar (BIAL), C.V.R. Rajendran (CSB) and Vijay Sankar(Sanmar).
March 9, 2018
Chandran Ratnaswami V. Prem WatsaChief Executive Officer Chairman
16

(This page is intentionally left blank)
17

8MAR201612231920 28FEB201713300060
FAIRFAX INDIA HOLDINGS CORPORATION
Management’s Responsibility for the Consolidated Financial Statements
The preparation and presentation of the accompanying consolidated financial statements, Management’sDiscussion and Analysis of Financial Condition and Results of Operations (‘‘MD&A’’) and all financial informationare the responsibility of management and have been approved by the Board of Directors.
The consolidated financial statements have been prepared in accordance with International Financial ReportingStandards as issued by the International Accounting Standards Board. Financial statements, by nature, are not precisesince they include certain amounts based upon estimates and judgments. When alternative methods exist,management has chosen those it deems to be the most appropriate in the circumstances.
Management maintains appropriate systems of internal controls. Policies and procedures are designed to givereasonable assurance that transactions are properly authorized, assets are safeguarded and financial records properlymaintained to provide reliable information for the preparation of the consolidated financial statements.
We, as Fairfax India’s Chief Executive Officer and Chief Financial Officer, have certified Fairfax India’s annualdisclosure documents filed with the Canadian Securities Administrators in accordance with Canadian securitieslegislation.
The Board of Directors is responsible for ensuring that management fulfills its responsibilities for financial reportingand is ultimately responsible for reviewing and approving the consolidated financial statements and MD&A. TheBoard carries out this responsibility principally through its Audit Committee which is independent frommanagement.
The Audit Committee is appointed by the Board of Directors and reviews the consolidated financial statements andMD&A; considers the report of the independent auditor; assesses the adequacy of the internal controls of thecompany; examines the fees and expenses for audit services; and recommends to the Board the independent auditorfor appointment by the shareholders. The independent auditor has full access to the Audit Committee and meet withit to discuss their audit work, Fairfax India’s internal control over financial reporting and financial reporting matters.The Audit Committee reports its findings to the Board for consideration when approving the consolidated financialstatements and MD&A for issuance to the shareholders.
March 9, 2018
Chandran Ratnaswami Jennifer AllenChief Executive Officer Chief Financial Officer
18

9MAR201808523542
Independent Auditor’s Report
To the Shareholders of Fairfax India Holdings Corporation
We have audited the accompanying consolidated financial statements of Fairfax India Holdings Corporation and itssubsidiaries, which comprise the consolidated balance sheets as at December 31, 2017 and 2016 and the consolidatedstatements of earnings, comprehensive income, changes in equity and cash flows for the years then ended, and therelated notes, which comprise a summary of significant accounting policies and other explanatory information.
Management’s responsibility for the consolidated financial statementsManagement is responsible for the preparation and fair presentation of these consolidated financial statements inaccordance with International Financial Reporting Standards (IFRS), and for such internal control as managementdetermines is necessary to enable the preparation of consolidated financial statements that are free from materialmisstatement, whether due to fraud or error.
Auditor’s responsibilityOur responsibility is to express an opinion on these consolidated financial statements based on our audits. Weconducted our audits in accordance with Canadian generally accepted auditing standards. Those standards requirethat we comply with ethical requirements and plan and perform the audit to obtain reasonable assurance aboutwhether the consolidated financial statements are free from material misstatement.
An audit involves performing procedures to obtain audit evidence about the amounts and disclosures in theconsolidated financial statements. The procedures selected depend on the auditor’s judgment, including theassessment of the risks of material misstatement of the consolidated financial statements, whether due to fraud orerror. In making those risk assessments, the auditor considers internal control relevant to the entity’s preparation andfair presentation of the consolidated financial statements in order to design audit procedures that are appropriate inthe circumstances, but not for the purpose of expressing an opinion on the effectiveness of the entity’s internalcontrol. An audit also includes evaluating the appropriateness of accounting policies used and the reasonableness ofaccounting estimates made by management, as well as evaluating the overall presentation of the consolidatedfinancial statements.
We believe that the audit evidence we have obtained in our audits is sufficient and appropriate to provide a basis forour audit opinion.
OpinionIn our opinion, the consolidated financial statements present fairly, in all material respects, the financial position ofFairfax India Holdings Corporation and its subsidiaries as at December 31, 2017 and 2016 and their financialperformance and their cash flows for the years then ended in accordance with IFRS.
Chartered Professional Accountants, Licensed Public AccountantsToronto, Ontario
March 9, 2018
19

10MAR201607580995 10MAR201607580340
FAIRFAX INDIA HOLDINGS CORPORATION
Consolidated Financial Statements
Consolidated Balance Sheetsas at December 31, 2017 and December 31, 2016(US$ thousands)
December 31, December 31,Notes 2017 2016
AssetsCash and cash equivalents 6, 15 13,244 146,960Restricted cash 6, 7 10,598 18,810Short term investments 6 27,481 27,428Bonds 5, 6 694,252 528,857Common stocks 5, 6 1,913,993 539,284
Total cash and investments 2,659,568 1,261,339
Interest receivable 9,422 7,493Income taxes refundable 3,098 7,326Other assets 6 133 27,339
Total assets 2,672,221 1,303,497
LiabilitiesAccounts payable and accrued liabilities 977 606Payable for rights issue 5 15,954 –Payable to related parties 12 122,826 3,673Term loans 7 400,000 223,772
Total liabilities 539,757 228,051
EquityCommon shareholders’ equity 8 2,132,464 1,075,446
2,672,221 1,303,497
See accompanying notes.
Signed on behalf of the Board
Director Director
20

Consolidated Statements of Earningsfor the years ended December 31, 2017 and 2016(US$ thousands except share and per share amounts)
Notes 2017 2016
IncomeInterest 6 21,848 21,343Dividends 6 8,627 5,611Net realized gains on investments 6 1,195 3,392Net change in unrealized gains on investments and other costs 6 592,277 104,995Net foreign exchange losses 6 (14,277) (6,737)
609,670 128,604
ExpensesInvestment and advisory fees 12 27,531 12,552Performance fee 12 112,218 –General and administration expenses 14 4,166 4,937Interest expense 7 15,664 4,171
159,579 21,660
Earnings before income taxes 450,091 106,944Recovery of income taxes 10 (2,418) (881)
Net earnings 452,509 107,825
Net earnings per share 9 $ 3.10 $ 1.01Net earnings per diluted share 9 $ 2.94 $ 1.01Shares outstanding (weighted average) 9 146,035,470 106,517,213
See accompanying notes.
21
FAIRFAX INDIA HOLDINGS CORPORATION
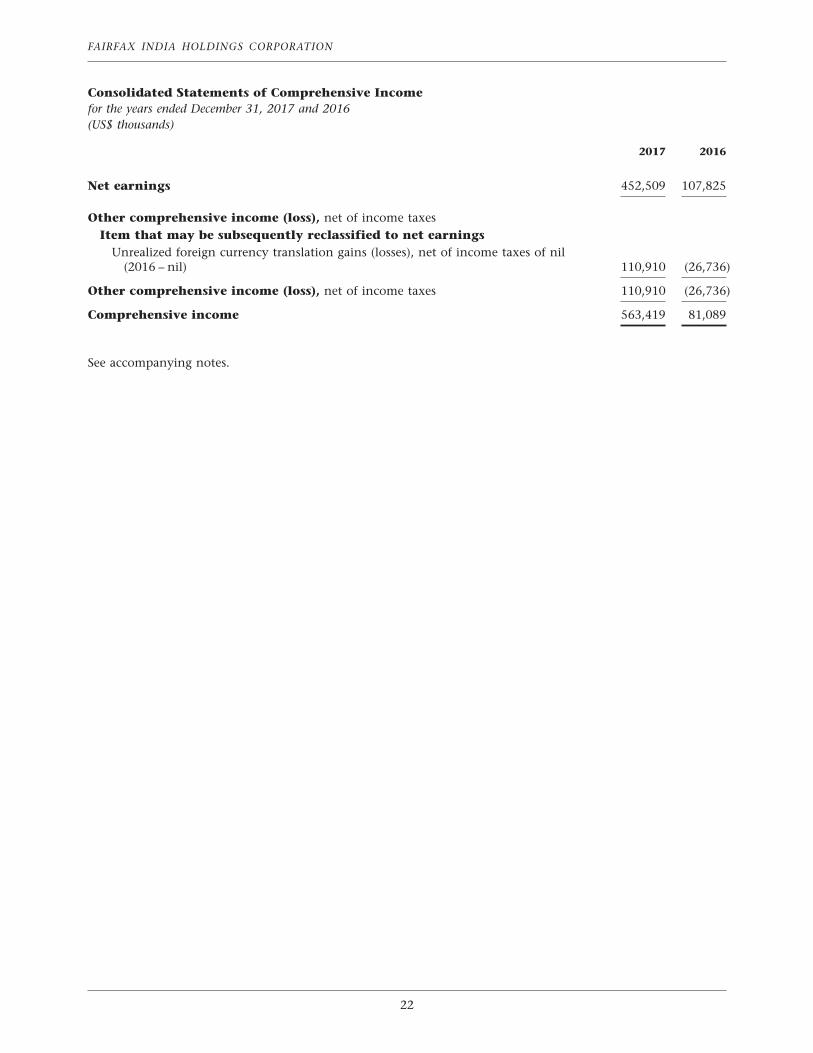
Consolidated Statements of Comprehensive Incomefor the years ended December 31, 2017 and 2016(US$ thousands)
2017 2016
Net earnings 452,509 107,825
Other comprehensive income (loss), net of income taxesItem that may be subsequently reclassified to net earnings
Unrealized foreign currency translation gains (losses), net of income taxes of nil(2016 – nil) 110,910 (26,736)
Other comprehensive income (loss), net of income taxes 110,910 (26,736)
Comprehensive income 563,419 81,089
See accompanying notes.
22

Consolidated Statements of Changes in Equityfor the years ended December 31, 2017 and 2016(US$ thousands)
AccumulatedShare-based other Common
Subordinate Multiple payments, Retained comprehensive shareholders’voting shares voting shares net earnings income (loss) equity
Balance as of January 1, 2017 713,027 300,000 (186) 144,604 (81,999) 1,075,446Net earnings – – – 452,509 – 452,509Other comprehensive income:
Unrealized foreign currency translation gains – – – – 110,910 110,910Issuance of shares, net of issuance costs (note 8) 493,504 – – – – 493,504Repurchases (note 8) (19) – – (8) – (27)Amortization of share-based payment awards – – 122 – – 122
Balance as of December 31, 2017 1,206,512 300,000 (64) 597,105 28,911 2,132,464
Balance as of January 1, 2016 727,972 300,000 (319) 40,939 (55,263) 1,013,329Net earnings – – – 107,825 – 107,825Other comprehensive loss:
Unrealized foreign currency translation losses – – – – (26,736) (26,736)Repurchases (note 8) (17,018) – – (4,160) – (21,178)Amortization of share-based payment awards – – 133 – – 133Tax benefit on share issuance costs 2,073 – – – – 2,073
Balance as of December 31, 2016 713,027 300,000 (186) 144,604 (81,999) 1,075,446
See accompanying notes.
23

FAIRFAX INDIA HOLDINGS CORPORATION
Consolidated Statements of Cash Flowsfor the years ended December 31, 2017 and 2016(US$ thousands)
Notes 2017 2016
Operating activitiesNet earnings 452,509 107,825Items not affecting cash and cash equivalents:
Net bond premium (discount) amortization 300 (100)Deferred income taxes 10 – 2,071Amortization of share-based payment awards 122 133Net realized gains on investments 6 (1,195) (3,392)Net change in unrealized gains on investments 6 (666,479)(1) (104,995)Net foreign exchange losses 6 14,277 6,737
Net (purchases) sales of short term investments classified as FVTPL (112) 22,590Purchases of bonds and common stocks classified as FVTPL 15 (812,484)(1) (423,639)Sales of bonds and common stocks classified as FVTPL 15 78,458 333,591Decrease in restricted cash in support of investments – 6,457Changes in operating assets and liabilities:
Interest receivable (1,426) 19,306Income taxes payable (refundable) 4,601 (16,902)Payable to related parties 116,662 1,760Other 9,199 5,065
Cash used in operating activities (805,568) (43,493)
Investing activitiesPurchases of premises and equipment – (128)
Cash used in investing activities – (128)
Financing activitiesTerm loans: 7
Proceeds 400,000 225,000Issuance costs (3,022) (2,752)Repayment of term loan (225,000) –Net decrease (increase) in restricted cash in support of term loans 8,212 (18,810)
Subordinate voting shares: 8Issuances 500,004 –Issuance costs (6,500) –Repurchases (27) (21,178)
Cash provided by financing activities 673,667 182,260
Increase (decrease) in cash and cash equivalents (131,901) 138,639Cash and cash equivalents – beginning of year 146,960 12,464Foreign currency translation (1,815) (4,143)
Cash and cash equivalents – end of year 13,244 146,960
(1) Excludes $74,202 cash consideration paid attributable to the costs incurred to purchase the additional 10.0% equity interest in BangaloreInternational Airport Limited (see note 5).
See accompanying notes.
24

Index to Notes to Consolidated Financial Statements
1. Business Operations . . . . . . . . . . . . . . . . . . . . . . . . . . . . . . . . . . . . . . . . . . . . . . . . . . . . . . . . . 26
2. Basis of Presentation . . . . . . . . . . . . . . . . . . . . . . . . . . . . . . . . . . . . . . . . . . . . . . . . . . . . . . . . 26
3. Summary of Significant Accounting Policies . . . . . . . . . . . . . . . . . . . . . . . . . . . . . . . . . . . . . . . . 27
4. Critical Accounting Estimates and Judgments . . . . . . . . . . . . . . . . . . . . . . . . . . . . . . . . . . . . . . . 31
5. Indian Investments . . . . . . . . . . . . . . . . . . . . . . . . . . . . . . . . . . . . . . . . . . . . . . . . . . . . . . . . . 33
6. Cash and Investments . . . . . . . . . . . . . . . . . . . . . . . . . . . . . . . . . . . . . . . . . . . . . . . . . . . . . . . 39
7. Term Loans . . . . . . . . . . . . . . . . . . . . . . . . . . . . . . . . . . . . . . . . . . . . . . . . . . . . . . . . . . . . . . . 42
8. Common Shareholders’ Equity . . . . . . . . . . . . . . . . . . . . . . . . . . . . . . . . . . . . . . . . . . . . . . . . . 42
9. Net Earnings per Share . . . . . . . . . . . . . . . . . . . . . . . . . . . . . . . . . . . . . . . . . . . . . . . . . . . . . . . 43
10. Income Taxes . . . . . . . . . . . . . . . . . . . . . . . . . . . . . . . . . . . . . . . . . . . . . . . . . . . . . . . . . . . . . 44
11. Financial Risk Management . . . . . . . . . . . . . . . . . . . . . . . . . . . . . . . . . . . . . . . . . . . . . . . . . . . 46
12. Related Party Transactions . . . . . . . . . . . . . . . . . . . . . . . . . . . . . . . . . . . . . . . . . . . . . . . . . . . . 51
13. Segment Reporting . . . . . . . . . . . . . . . . . . . . . . . . . . . . . . . . . . . . . . . . . . . . . . . . . . . . . . . . . 53
14. General and Administration Expenses . . . . . . . . . . . . . . . . . . . . . . . . . . . . . . . . . . . . . . . . . . . . 53
15. Supplementary Cash Flow Information . . . . . . . . . . . . . . . . . . . . . . . . . . . . . . . . . . . . . . . . . . . 53
25

FAIRFAX INDIA HOLDINGS CORPORATION
Notes to Consolidated Financial Statementsfor the years ended December 31, 2017 and 2016(in US$ and thousands except share and per share amounts and as otherwise indicated)
1. Business Operations
Fairfax India Holdings Corporation (‘‘the company’’ or ‘‘Fairfax India’’) is an investment holding company whoseobjective is to achieve long term capital appreciation, while preserving capital, by investing in public and privateequity securities and debt instruments in India and Indian businesses or other businesses with customers, suppliersor business primarily conducted in, or dependent on, India (‘‘Indian Investments’’). The company makes all orsubstantially all of its investments either directly or through one of its wholly-owned subsidiaries, FIH MauritiusInvestments Ltd (‘‘FIH Mauritius’’) and FIH Private Investments Ltd (‘‘FIH Private’’).
In late 2014, Fairfax Financial Holdings Limited (‘‘Fairfax’’) took the initiative in creating the company and is FairfaxIndia’s ultimate parent and acts as its administrator. Fairfax is a holding company which, through its subsidiaries, isprincipally engaged in property and casualty insurance and reinsurance and the associated investment management.Fairfax is a Canadian reporting issuer with securities listed on the Toronto Stock Exchange (‘‘TSX’’) and trading inCanadian dollars under the symbol FFH for over 30 years and in U.S. dollars under the symbol FFH.U. Fairfax,through its subsidiaries, owns 30,000,000 multiple voting shares of Fairfax India. On January 30, 2015, uponcompletion of the company’s initial public offering, the company’s subordinate voting shares commenced tradingon the TSX under the symbol FIH.U. The multiple voting shares are not traded.
During 2017, Fairfax acquired 13,717,873 subordinate voting shares from the company by way of a privateplacement (see note 8) and open market transactions. At December 31, 2017 Fairfax’s holding of multiple andsubordinate voting shares represented 93.6% of the voting rights and 30.2% of the equity interest in Fairfax India(December 31, 2016 – 95.3% and 29.4% respectively).
Hamblin Watsa Investment Counsel Ltd. (the ‘‘Portfolio Advisor’’), a wholly-owned subsidiary of Fairfax andregistered portfolio manager in the province of Ontario, is the portfolio advisor of the company and its consolidatedsubsidiaries, responsible to source and advise with respect to all investments.
The company was federally incorporated on November 25, 2014 and is domiciled in Ontario, Canada. The principaloffice of the company, Fairfax and the Portfolio Advisor is located at 95 Wellington Street West, Suite 800, Toronto,Ontario M5J 2N7.
Subsequent to December 31, 2017
In accordance with the Investment Advisory Agreement (defined in note 12), the performance fee payable to Fairfaxfor the first calculation period (ending on December 31, 2017) was settled on March 9, 2018 by the company issuing7,663,685 subordinate voting shares to Fairfax. The issuance of these subordinate voting shares increased Fairfax’sequity interest in Fairfax India from 30.2% at December 31, 2017 to 33.6% (see note 12 for additional details on theperformance fee).
2. Basis of Presentation
The company’s consolidated financial statements for the year ended December 31, 2017 have been prepared inaccordance with International Financial Reporting Standards (‘‘IFRS’’) as issued by the International AccountingStandards Board (‘‘IASB’’) effective as at December 31, 2017, except IFRS 9 (2010) Financial Instruments which wasadopted early. The company has determined that it meets the definition of an investment entity under IFRS(see note 4).
The consolidated balance sheets of the company are presented on a non-classified basis. Except for bonds andcommon stocks, all other assets expected to be realized and liabilities expected to be settled within the company’snormal operating cycle of one year are considered current.
The preparation of the company’s consolidated financial statements requires management to make estimates andassumptions that affect the reported amounts of assets and liabilities at the date of the consolidated financialstatements, the reported amounts of income and expenses during the reporting periods covered by the consolidatedfinancial statements and the related note disclosures. Critical accounting estimates and judgments are described innote 4.
26

These consolidated financial statements were approved for issue by the company’s Board of Directors onMarch 9, 2018.
3. Summary of Significant Accounting Policies
The principal accounting policies applied to the preparation of these consolidated financial statements and themethods of computation have been consistently applied to all periods presented unless otherwise stated, and are setout as follows.
Consolidation
Subsidiaries – A subsidiary is an entity over which the company has control. The company controls an entity whenthe company is exposed to, or has rights to, variable returns from its involvement with the entity and has the abilityto affect those returns through its power over the entity. As an investment entity (see note 4), the company isrequired to account for its investments in subsidiaries (Fairchem Speciality Limited (‘‘Fairchem’’, comprised ofFairchem, formerly known as Adi Finechem Limited, and Privi Organics Limited (‘‘Privi’’)), National CollateralManagement Services Limited (‘‘NCML’’), and Saurashtra Freight Private Limited (‘‘Saurashtra’’)) at fair valuethrough profit or loss (‘‘FVTPL’’) rather than by consolidation.
The company has concluded that FIH Mauritius and FIH Private should be consolidated as these entities provideservices relating to the company’s investment activities. All intercompany balances, profits and transactions areeliminated in full.
Investments in associates – An associate is an entity over which the company has significant influence, but notcontrol, over the financial and operating policies. As an investment entity, the company accounts for its investmentsin associates (IIFL Holdings Limited (‘‘IIFL’’), 5paisa Capital Limited (‘‘5paisa’’), Bangalore International AirportLimited (‘‘BIAL’’), and Sanmar Chemicals Group (‘‘Sanmar’’)) at FVTPL rather than by the equity method.
Foreign currency translation
Functional and presentation currency – The consolidated financial statements are presented in U.S. dollarswhile the Indian rupee is the functional currency of the company and its consolidated subsidiaries.
Although the company’s Indian Investments are denominated in Indian rupees, its primary financial reportingobjective is to measure long term capital appreciation in U.S. dollars. Accordingly, the company presents itsconsolidated financial statements in U.S. dollars to provide comparability with other North American investmententities.
Foreign currency transactions – Foreign currency transactions are translated into the functional currency usingthe exchange rates prevailing at the dates of the transactions. Foreign exchange gains and losses resulting from thesettlement of such transactions and from the translation at period end exchange rates of monetary assets andliabilities denominated in foreign currencies are recognized in net foreign exchange gains (losses) in the consolidatedstatements of earnings. Income and expenses are translated at the average rate of exchange for the period.
Translation to the presentation currency – The consolidated balance sheets and consolidated statements ofearnings of Fairfax India and its consolidated subsidiaries are translated to the presentation currency as follows:
• assets and liabilities are translated at the rates of exchange prevailing at the balance sheet dates;
• income and expenses are translated at the average rates of exchange for the periods presented (unless this isnot a reasonable approximation of the cumulative effect of the rates prevailing on the transaction dates, inwhich case income and expenses are translated at the dates of the transactions); and
• the net unrealized gains or losses resulting from this translation are recognized in accumulated othercomprehensive income (loss).
Upon disposal or partial disposal of FIH Mauritius or FIH Private, a proportionate share of the cumulative amount ofexchange differences recognized in accumulated other comprehensive income (loss) and accumulated in a separatecomponent in equity would be recycled to the consolidated statement of earnings as part of the determination of thegain or loss on disposal of these consolidated subsidiaries.
27

FAIRFAX INDIA HOLDINGS CORPORATION
Comprehensive income (loss)
Comprehensive income (loss) consists of net earnings (loss) and other comprehensive income (loss) and includes allchanges in common shareholders’ equity during a period, except for those resulting from investments by owners anddistributions to owners. Unrealized foreign currency translation gains (losses), net of income taxes arising from thetranslation of the company’s Indian rupee functional currency consolidated financial statements to the U.S. dollarpresentation currency are recognized in other comprehensive income (loss) and included in accumulated othercomprehensive income (loss) until recycled to the consolidated statements of earnings in the future. Accumulatedother comprehensive income (loss) is included on the consolidated balance sheets as a component of commonshareholders’ equity.
Consolidated statements of cash flows
The company’s consolidated statements of cash flows are prepared in accordance with the indirect method,classifying cash flows by operating, investing and financing activities.
Cash and cash equivalents – Cash and cash equivalents consists of cash on hand, demand deposits with banksand other short term highly liquid investments with maturities of three months or less when purchased, andexcludes cash that is restricted. The carrying value of cash and cash equivalents approximates fair value.
Restricted cash – Restricted cash primarily consists of amounts required to be maintained on deposit withCanadian banks to support the term loans (see note 7).
Cash and Investments
Cash and investments include cash and cash equivalents, restricted cash, short term investments, bonds andcommon stocks. The appropriate classifications of investments are determined at their acquisition date.
Classification – Short term investments, equity instruments and debt instruments are classified as FVTPL.
Recognition and measurement – The company recognizes cash and investments at fair value upon initialrecognition. Purchases and sales are recognized on the trade date, which is the date on which the company commitsto purchase or sell the investments.
Investments classified as FVTPL are carried at fair value on the consolidated balance sheets with realized gains andlosses and unrealized gains and losses recorded in net realized gains (losses) on investments and net change inunrealized gains (losses) on investments and other costs, respectively, in the consolidated statements of earnings andas operating activities in the consolidated statements of cash flows. Interest and dividends earned on investments areincluded in the consolidated statements of earnings in interest and dividends, respectively, and as operatingactivities in the consolidated statements of cash flows.
Transactions pending settlement are reflected on the consolidated balance sheets in other assets or in accountspayable and accrued liabilities. Transaction costs related to investments classified as FVTPL are expensed as incurred.An investment is derecognized when the rights to receive cash flows from the investment have expired or have beentransferred and when the company has transferred substantially all the risks and rewards of ownership.
Short term investments – Short term investments are investments with maturity dates between three monthsand twelve months when purchased.
Determination of fair value – Fair values for substantially all of the company’s investments are measured usingmarket or income approaches. Considerable judgment may be required in interpreting market data used to developestimates of fair value. Accordingly, actual values realized in future market transactions may differ from the estimatespresented in these consolidated financial statements. The use of different market assumptions and/or valuationmethodologies may have a material effect on the estimated fair values. The fair values of investments are based onbid prices for financial assets and ask prices for financial liabilities.
The company categorizes its fair value measurements according to a three level hierarchy described below:
Level 1 – Inputs represent unadjusted quoted prices for identical instruments exchanged in active markets.
Level 2 – Inputs include directly or indirectly observable inputs (other than Level 1 inputs) such as quoted pricesfor similar financial instruments exchanged in active markets, quoted prices for identical or similar financialinstruments exchanged in inactive markets and other market observable inputs.
28

Level 3 – Inputs include unobservable inputs used in the measurement of financial instruments. Management isrequired to use its own assumptions regarding unobservable inputs as there is little, if any, market activity inthese instruments or related observable inputs that can be corroborated at the measurement date.
Transfers between fair value hierarchy categories are considered effective from the beginning of the reporting periodin which the transfer is identified.
Valuation techniques used by the company’s independent pricing service providers and third party broker-dealersinclude use of prices from similar instruments where observable market prices exist, discounted cash flow analysis,option pricing models, and other valuation techniques commonly used by market participants. The companyassesses the reasonableness of pricing received from these third party sources by comparing the fair values received torecent transaction prices for similar assets where available, to industry accepted discounted cash flow models (thatincorporate estimates of the amount and timing of future cash flows and market observable inputs such as creditspreads and discount rates) and to option pricing models (that incorporate market observable inputs including thequoted price, volatility and dividend yield of the underlying security and the risk free rate).
All other financial assets and liabilities, primarily comprised of interest receivable, income taxes refundable, otherassets, accounts payable and accrued liabilities, payable for rights issue, payable to related parties, and term loans, aremeasured at amortized cost which approximates fair value. Under the amortized cost method, financial assets andliabilities reflect the amount required to be received or paid and discounted when appropriate, at the contract’seffective interest rate.
Net realized gains (losses) on investments, and Net change in unrealized gains (losses) oninvestments and other costs
Net realized gains (losses) arising on the disposition of investments and net change in unrealized gains (losses)arising on the re-measurement of investments at fair value are included in net realized gains (losses) on investmentsand net change in unrealized gains (losses) on investments and other costs in the consolidated statements ofearnings, respectively. In 2017 net change in unrealized gains (losses) on investments and other costs in theconsolidated statement of earnings included costs incurred to purchase the additional 10.0% equity interest in BIAL(see note 5).
Interest and dividend income
Interest income is recognized on an accrual basis using the effective interest method and includes bank interest andinterest from investments in debt instruments, except for Sanmar bonds where interest income is included in its fairvalue measurement (see note 5). Interest receivable is shown separately on the consolidated balance sheets based onthe debt instruments’ stated rates of interest. Dividends from equity investments are recognized when the company’sright to receive payment is established.
Income taxes
The provision for (recovery of) income taxes for the period comprises current and deferred income tax. Income taxesare recognized in the consolidated statements of earnings, except to the extent that they relate to items recognized inother comprehensive income (loss) or directly in equity. In those cases, the related taxes are also recognized in othercomprehensive income (loss) or directly in equity, respectively.
Current income tax is calculated on the basis of the tax laws enacted or substantively enacted at the end of thereporting period in the countries where the company and its subsidiaries and its associates operate and generatetaxable income.
Deferred income tax is calculated under the liability method whereby deferred income tax assets and liabilities arerecognized for temporary differences between the financial statement carrying amounts of assets and liabilities andtheir respective income tax bases at the current substantively enacted tax rates. Changes in deferred income taxassociated with components of other comprehensive income (loss) are recognized directly in other comprehensiveincome (loss) while all other changes in deferred income tax are included in the provision for (recovery of) incometaxes in the consolidated statements of earnings.
Deferred income tax assets are recognized to the extent that it is probable that future taxable profit will be availableagainst which the temporary differences can be utilized. Carry forwards of unused losses or unused tax credits are tax
29

FAIRFAX INDIA HOLDINGS CORPORATION
effected and recognized as deferred tax assets when it is probable that future taxable profits will be available againstwhich these losses or tax credits can be utilized.
A deferred income tax liability is not recognized on unremitted earnings related to the company’s IndianInvestments where the company has determined that the unremitted earnings do not constitute a taxable temporarydifference.
Current and deferred income tax assets and liabilities are offset when the income taxes are levied by the sametaxation authority and there is a legally enforceable right of offset.
Term loans
Borrowings are recognized initially at fair value, net of transaction costs incurred, and subsequently carried atamortized cost. Interest expense on borrowings is recognized in the consolidated statements of earnings using theeffective interest method.
Equity
Common stock issued by the company is classified as equity when there is no contractual obligation to transfer cashor other financial assets to the holder of the shares. Incremental costs directly attributable to the issue or repurchasefor cancellation of equity instruments are recognized in equity, net of tax.
Dividends and other distributions to holders of the company’s equity instruments are recognized directly in equity.
Share-based payments
The company has restricted share plans or equivalent for its directors with vesting periods of up to ten years from thedate of grant. The fair value of restricted share awards on the grant date is amortized to compensation expense,included in general and administration expenses in the consolidated statements of earnings, over the vesting period,with a corresponding increase in share-based payments, net, in the consolidated statements of changes in equity. Ateach balance sheet date, the company reviews its estimates of the number of restricted share awards expected to vest.
Net earnings (loss) per share
Basic net earnings (loss) per share is calculated by dividing the net earnings (loss) by the weighted average number ofsubordinate and multiple voting shares issued and outstanding during the period.
Net earnings (loss) per diluted share
Diluted net earnings (loss) per share is calculated by adjusting the weighted average number of subordinate andmultiple voting shares outstanding during the period for the dilutive effect of the contingently issuable subordinatevoting shares relating to the performance fee payable to Fairfax (see note 12) that would have been outstandingduring the period had all potential subordinate and multiple voting shares been issued at the beginning ofthe period.
New accounting pronouncements adopted in 2017
The company adopted the following amendments, effective January 1, 2017. These changes were adopted inaccordance with the applicable transitional provisions of each amendment, and did not have a significant impact onthe consolidated financial statements.
Recognition of Deferred Tax Assets for Unrealised Losses (Amendments to IAS 12)
In January 2016 the IASB issued amendments to IAS 12 Income Taxes to clarify the requirements on recognition ofdeferred tax assets for unrealized losses.
Disclosure Initiative (Amendments to IAS 7)
In January 2016 the IASB issued amendments to IAS 7 Statement of Cash Flows that require additional disclosuresaround changes in liabilities arising from financing activities, including both changes arising from cash flow andnon-cash changes.
30

New accounting pronouncements issued but not yet effective
The following new standards have been issued by the IASB and were not yet effective for the fiscal year beginningJanuary 1, 2017. The company is currently evaluating their impact on its consolidated financial statements and doesnot expect to adopt any of them in advance of their respective effective dates.
IFRS 9 Financial Instruments (‘‘IFRS 9’’)
In July 2014 the IASB issued the complete version of IFRS 9 which will supersede the 2010 version of IFRS 9 currentlyapplied by the company. This complete version is effective for annual periods beginning on or after January 1, 2018,with retrospective application, and includes: requirements for the classification and measurement of financial assetsand liabilities; an expected credit loss model that replaces the existing incurred loss impairment model; and newhedge accounting guidance. The company is nearing completion of its analysis of the accounting requirementsunder IFRS 9 and has determined that its current classifications of equity investments and financial liabilities willremain substantially unchanged compared to the 2010 version of IFRS 9. The company continues to monitor andconsider evolving guidance and interpretations related to IFRS 9 as it works through the classification analysis for itsinvestments in debt instruments.
IFRIC Interpretation 23 Uncertainty over Income Tax Treatments (‘‘IFRIC 23’’)
In June 2017 the IASB issued IFRIC 23 to clarify how the requirements of IAS 12 Income Taxes should be applied whenthere is uncertainty over income tax treatments. The interpretation is effective for annual periods beginning on orafter January 1, 2019, with modified retrospective or retrospective application. Adoption of IFRIC 23 is not expectedto have a significant impact on the company’s consolidated financial statements.
4. Critical Accounting Estimates and Judgments
In the preparation of the company’s consolidated financial statements, management has made a number of criticalaccounting estimates and judgments which are discussed below. Estimates and judgments are continually evaluatedand are based on historical experience and other factors, including expectations of future events that are believed tobe reasonable under the circumstances.
Where estimates were made, the reported amounts of assets, liabilities, income and expenses may differ from theamounts that would otherwise be reflected if the ultimate outcome of all uncertainties and future earnings wereknown at the time the consolidated financial statements were prepared.
Determination of investment entity status
An entity that meets the IFRS 10 Consolidated Financial Statements (‘‘IFRS 10’’) definition of an investment entity isrequired to measure its investments in subsidiaries at FVTPL rather than consolidate them (other than thosesubsidiaries that provide services to the company).
An investment entity is an entity that obtains funds from one or more investors for the purpose of providing themwith investment management services, commits to its investors that its business purpose is to invest funds solely forreturns from capital appreciation, investment income, or both, and measures and evaluates the performance ofsubstantially all of its investments on a fair value basis. The company exercised judgment that it continues to meetthe definition of an investment entity, as its strategic objective of investing in Indian Investments and providinginvestment management services to investors for the purpose of generating returns in the form of long term capitalappreciation, remains unchanged. The company has also determined that FIH Mauritius and FIH Private continue toprovide investment related services to the company and should continue to be consolidated.
The company may from time to time seek to realize on any of its Indian Investments. The circumstances under whichthe company may sell some or all of its investments include: (i) where the company believes that the IndianInvestments are fully valued or that the original investment thesis has played out; or (ii) where the company hasidentified other investment opportunities which it believes present more attractive risk-adjusted returnopportunities and additional capital is needed to make such alternative investments.
The company would exit its private Indian Investments either through initial public offerings or private sales. Forpublicly traded Indian Investments, exit strategies may include selling the investments through private placementsor in public markets.
31

FAIRFAX INDIA HOLDINGS CORPORATION
Valuation of Private Indian Investments
The valuation of the company’s private Indian Investments are assessed at the end of each reporting period.
For each private Indian Investment acquired during the reporting period, the transaction price is generallyconsidered to be representative of fair value, subject to the background of the investment, changes in marketconditions and factors specific to the investee. The company monitors various factors impacting the businesses of itsinvestees and the transaction price of a private Indian Investment may no longer be an appropriate estimate of fairvalue upon occurrence of certain events such as significant variances from budgeted earnings; changes in marketconditions; changes to the regulatory environment; movements in interest rates, foreign exchange rates and othermarket variables; and the passage of time.
Estimates and judgments for private Indian Investments are continually evaluated and are based on historicalexperience and other factors, including expectations of future events that are believed to be reasonable under thecircumstances. The company utilizes Fairfax’s valuation personnel to assist with the valuation of its investmentportfolio. Detailed valuations are performed for those financial instruments that are priced internally, while externalpricing received from independent pricing service providers and third party broker-dealers are evaluated by thecompany for reasonableness. The company does not use independent valuation experts to determine the fair valueof its investments. The company’s Chief Financial Officer oversees the valuation function and regularly reviewsvaluation processes and results, including at each quarterly reporting period. Significant valuation matters,particularly those requiring extensive judgment, are communicated to the company’s Audit Committee.
Notwithstanding the rigour of the company’s valuation processes, the valuation of private Indian Investmentsinherently has estimation uncertainty and different assumptions could lead to significantly different fair values.Refer to note 5 for additional disclosure related to the valuation of the company’s private Indian Investments.
Income taxes
The company is subject to income taxes in Canada, Mauritius and India, and the company’s determination of its taxliability or receivable is subject to review by those applicable tax authorities. The company exercised judgment inassessing that unremitted earnings related to its Indian Investments, as disclosed in note 10, are not expected toresult in taxable amounts in the foreseeable future; as a consequence no tax has been recorded in the consolidatedfinancial statements on these unremitted earnings. While the company believes its tax positions to be reasonable,where the company’s interpretations differ from those of tax authorities or the timing of realization is not asexpected, the provision for income taxes may increase or decrease in future periods to reflect actual experience. Thecompany has tax specialist personnel responsible for assessing the income tax consequences of planned transactionsand events, and undertaking the appropriate tax planning.
Realization of deferred income tax assets is dependent upon the generation of taxable income in those jurisdictionswhere the relevant tax losses and temporary differences exist. Tax legislation of each jurisdiction in which thecompany operates is interpreted to determine the provision for (recovery of) income taxes and expected timing ofthe reversal of deferred income tax assets and liabilities. The company exercised judgment that certain carryforwardsof unused losses or unused tax credits and timing differences disclosed in note 10 should not be recognized as anasset because it is not probable that they will be realized.
32

5. Indian Investments
Public Indian Investments
The fair values of Fairfax India’s Public Indian Investments, whose shares are listed on both the BSE (formerly knownas Bombay Stock Exchange Limited) and the National Stock Exchange of India (‘‘NSE of India’’), are determinedusing the bid prices of those investments (without adjustments or discounts) at the balance sheet date.
Investment in IIFL Holdings Limited
IIFL Holdings Limited (‘‘IIFL’’) is a publicly traded, diversified financial services holding company located inMumbai, India with principal lines of business in wealth management, capital markets and other activities(comprised of retail investment brokerage, institutional equities, investment banking and financial productsdistribution) and a non-banking finance company.
On December 1, 2015 Fairfax India acquired 68,788,445 common shares of IIFL (representing a 21.9% equityinterest) for $2.93 per share (195 Indian rupees per share) for cash consideration of $201,559 (approximately13.4 billion Indian rupees).
Prior to the formation of Fairfax India, Fairfax, through its subsidiaries, had acquired an 8.9% equity interest and anadditional 5.2% economic interest in IIFL through derivative financial instruments.
On February 8, 2017 Fairfax India acquired an additional 15,853,000 common shares of IIFL (representing a 4.99%equity interest) for cash consideration of $75,175 (approximately 5.1 billion Indian rupees). In connection with theFairfax India transaction, Fairfax, through its subsidiaries, partially disposed of the derivative financial instrumentsrepresenting an economic interest of 4.99% in IIFL. In accordance with regulations of the Securities and ExchangeBoard of India (‘‘SEBI’’) and the NSE of India, the transaction was subject to certain sale and purchase pricingguidelines and, as a result, the total consideration paid per share approximated fair market value of the equityinterest acquired.
Contemporaneously with the initial purchase of IIFL common shares by the company, Fairfax India and Fairfaxprovided undertakings to SEBI that they would not take certain actions that could result in the acquisition of controlof IIFL. In particular, Fairfax India and Fairfax agreed to limit their voting rights on IIFL shareholder resolutions to25% of the issued and outstanding common shares of IIFL at the time of voting, even in circumstances when theiractual voting rights may exceed 25%. Fairfax India and Fairfax also agreed to limit any additional purchases of IIFLshares such that their collective shareholding in IIFL would not exceed 36% of the issued and outstanding commonshares of IIFL unless Fairfax India and Fairfax made an open offer to all IIFL shareholders or SEBI provided its priorconsent for such an acquisition.
At December 31, 2017 the fair value of the company’s investment in IIFL was $888,485 comprised of84,641,445 common shares representing a 26.6% equity interest (fair value of $265,951 at December 31, 2016representing a 21.7% equity interest). The changes in fair value of the company’s investment in IIFL during 2017 and2016 are presented in the table disclosed later in note 5.
On October 20, 2017 IIFL spun-off its wholly-owned subsidiary 5Paisa Digital Undertaking through the formation ofa new public company, 5paisa Capital Limited (‘‘5paisa’’) in a non-cash transaction. The distribution of 5paisa to IIFLshareholders was characterized as a return of capital which resulted in Fairfax India recording the initial cost of itsinvestment in 5paisa at its fair value of $19,758 with a corresponding amount recorded as a reduction of the cost ofits investment in IIFL. Additional details on the 5paisa spin-off transaction are disclosed later in note 5.
Subsequent to December 31, 2017
Reorganization of IIFL Holdings Limited
On January 31, 2018 IIFL’s board of directors approved a draft plan to reorganize IIFL into three listed entities(the ‘‘reorganization’’) consisting of IIFL Finance (currently known as IIFL Holdings Limited comprised of the loansand mortgages businesses), IIFL Wealth (comprised of the wealth, asset management and alternative investmentfund businesses) and IIFL Securities (comprised of all other IIFL businesses including investment brokerage,distribution and investment banking). Shares of IIFL Finance, IIFL Wealth and IIFL Securities will be traded on theBSE and NSE of India as listed public companies. Shareholders of IIFL will receive seven common shares of IIFL
33

FAIRFAX INDIA HOLDINGS CORPORATION
Securities and one common share of IIFL Wealth for every seven IIFL shares held. Completion of the reorganization isanticipated in late 2018 or early 2019, subject to customary closing conditions and applicable regulatory approvals.
Investment in Fairchem Speciality Limited
Fairchem Speciality Limited (‘‘Fairchem’’, formerly known as Adi Finechem Limited) is a publicly traded, specialtychemical manufacturer located in Ahmedabad, India. Fairchem manufactures oleochemicals used in the paints, inksand adhesives industries, as well as intermediate nutraceutical and health products.
Privi Organics Limited (‘‘Privi’’), a wholly-owned subsidiary of Fairchem, is a supplier of aroma chemicals to thefragrance industry and is located in Mumbai, India.
On February 8, 2016 Fairfax India acquired a 44.7% equity interest in Fairchem for $3.13 per share (212 Indian rupeesper share) for cash consideration of $19,409 (approximately 1.3 billion Indian rupees).
On August 26, 2016 Fairfax India acquired a 50.8% equity interest in Privi for cash consideration of $54,975(approximately 3.7 billion Indian rupees).
On March 14, 2017 Fairchem and Privi were merged with the surviving entity continuing as Fairchem (the ‘‘Merger’’)and with no changes to management of the underlying companies. The Merger should improve diversification andincrease synergies between the two companies. Under the terms of the Merger, Privi shareholders received27 common shares and 27 compulsorily convertible preference shares (‘‘CCPS’’) of Fairchem for every 40 Privi sharesexchanged. Concurrent with the Merger, 88.5% of the CCPS received by the Privi shareholders were converted intocommon shares of Fairchem.
At December 31, 2017 the fair value of the company’s investment in Fairchem was $149,200 comprised of18,307,318 common shares (fair value of $143,413) and 738,760 CCPS (fair value of $5,787) representing a 48.8%equity interest on a fully diluted basis (or a 48.7% equity interest excluding the impact of the CCPS). The fair value ofthe company’s investment in Fairchem at December 31, 2017 was determined by multiplying the bid price of thepublicly traded Fairchem shares by the number of Fairchem shares owned by the company (inclusive of the commonshares and CCPS). The changes in fair value of the company’s investment in Fairchem during 2017 and 2016 arepresented in the table disclosed later in note 5.
At December 31, 2016, prior to giving effect to the Merger, the fair value of the company’s investment in Fairchemand Privi was $45,488 (determined using the bid price of the shares) and $54,315 (determined using the initialtransaction price) respectively. Privi’s initial transaction price approximated fair value at December 31, 2016 as therewere no significant changes to its business, capital structure or operating environment and there were no significantchanges to any key assumptions in the company’s acquisition valuation model for Privi due to the proximity of theclosing date of the transaction to December 31, 2016.
Investment in 5paisa Capital Limited
5paisa Capital Limited (‘‘5paisa’’), located in Mumbai, India, is a publicly traded, online financial services providerwith a do-it-yourself based investment brokerage model where the customer can execute investment transactions fora low brokerage fee. 5paisa is engaged in providing an online technology platform through Internet terminals andmobile applications for trading securities on the BSE and the NSE of India.
On October 20, 2017 IIFL spun-off its wholly-owned subsidiary 5Paisa Digital Undertaking through the formation ofa new public company, 5paisa Capital Limited, listed on the BSE and the NSE of India effective November 16, 2017.This non-cash transaction resulted in Fairfax India receiving one new common share of 5paisa for every 25 commonshares of IIFL held for a total of 3,385,657 common shares of 5paisa with a fair value of $19,758. The distribution of5paisa to IIFL shareholders was characterized as a return of capital which resulted in Fairfax India recording the initialcost of its investment in 5paisa at its fair value of $19,758 with a corresponding amount recorded as a reduction ofthe cost of its investment in IIFL.
Fairfax India and Fairfax provided undertakings to SEBI that were identical to those in respect of its investment inIIFL, specifically they agreed that they would not take certain actions that could result in the acquisition of controlof 5paisa.
34
At December 31, 2017 the fair value of the company’s investment in 5paisa was $19,958 comprised of3,385,657 common shares representing a 26.6% equity interest. The changes in fair value of the company’sinvestment in 5paisa during 2017 are presented in the table disclosed later in note 5.
Private Indian Investments
The fair values of Fairfax India’s Private Indian Investments cannot be derived from an active market andaccordingly, are determined using industry accepted valuation techniques and models. Market observable inputs areused where possible, with unobservable inputs used where necessary. Use of unobservable inputs can involvesignificant judgment and may materially affect the reported fair value of these investments.
Investment in Bangalore International Airport Limited
Bangalore International Airport Limited (‘‘BIAL’’) is a private company located in Bengaluru, India. BIAL, under aconcession agreement with the Government of India until the year 2038 (with the right to extend the agreement foran additional 30 years), has the exclusive rights to carry out the development, design, financing, construction,commissioning, maintenance, operation and management of the Kempegowda International Airport Bengaluru(‘‘KIAB’’) through a public-private partnership. KIAB is the first greenfield airport in India built through a public-private partnership.
On March 24, 2017 Fairfax India acquired a 38.0% equity interest in BIAL for cash consideration of $385,498(approximately 25.2 billion Indian rupees). A portion of that equity interest (33.0%) was purchased from a wholly-owned subsidiary of GVK Power and Infrastructure Limited (‘‘GVK’’) where Fairfax issued a put option to GVK whichgave GVK the right to sell some or all of its remaining 10.0% equity interest in BIAL to Fairfax or Fairfax India untilApril 8, 2019 (the ‘‘Put Option’’). The remaining equity interest of 5.0% was purchased from Flughafen ZurichAG (‘‘Zurich’’).
On July 13, 2017 Fairfax India acquired the additional 10.0% equity interest in BIAL from GVK for cash considerationof $200,093 (12.9 billion Indian rupees) which the company determined included $74,202 (approximately4.8 billion Indian rupees) of consideration in excess of the fair value of those additional shares acquired. Theadditional consideration of $74,202 paid to GVK reflected costs attributed by management to: (i) motivate GVK tosell its remaining 10.0% equity interest in BIAL; (ii) increase the company’s holdings in BIAL to enhance thecompany’s investment returns; and, (iii) accelerate the development of a second runway and terminal, and makeimprovements to the existing runway. In 2017, the costs incurred of $74,202 were recorded in net change inunrealized gains on investments and other costs in the consolidated statement of earnings. The Put Option wasterminated upon the company’s acquisition of the additional 10.0% equity interest in BIAL from GVK.
Upon completion of the additional 10.0% investment in BIAL, the company had invested aggregate cashconsideration of $585,591 (inclusive of the $74,202 of costs incurred) for a 48.0% equity interest in BIAL.
During the second quarter of 2017 the company refined its internal valuation model used in the determination ofthe fair value of BIAL. At December 31, 2017 the company estimated the fair value of its investment in BIAL using adiscounted cash flow analysis based on multi-year free cash flow projections with assumed after-tax discount ratesranging from 10.4% to 11.7% and a long term growth rate of 3.0%. Free cash flow projections were based on EBITDAestimates derived from financial information for BIAL’s business units prepared in the fourth quarter of 2017 byBIAL’s management. Discount rates were based on the company’s assessment of risk premiums to the appropriaterisk-free rate of the economic environment in which BIAL operates. At December 31, 2017 the company’s internalvaluation model indicated that the fair value of the company’s investment in BIAL was $608,288. The changes in fairvalue of the company’s investment in BIAL during 2017 are presented in the table disclosed later in note 5.
Investment in National Collateral Management Services Limited
National Collateral Management Services Limited (‘‘NCML’’) is a private agricultural commodities storage companyheadquartered in Gurugram, India, operating in the agriculture value chain and offering end-to-end solutions ingrain procurement, testing, storage and collateral management. In 2016 NCML launched its wholly-ownedsubsidiary, NCML Finance Private Ltd, which focuses on rural and agri-business finance.
In the third quarter of 2015 Fairfax India acquired an 88.1% equity interest in NCML for cash consideration of$148,716 (approximately 9.7 billion Indian rupees).
35

FAIRFAX INDIA HOLDINGS CORPORATION
On February 3, 2017 NCML entered into a 30 year concession agreement with the Food Corporation of India toconstruct 11 silo locations that are expected to be completed in early 2019 and financed through debt andcommon equity.
On August 8, 2017 Fairfax India participated in NCML’s rights issue through which it acquired its pro-rata share of18,945,840 common shares of NCML at 86.00 Indian rupees per share for total consideration of $25,602(approximately 1.6 billion Indian rupees) comprised of cash consideration of $9,601 (approximately 611 millionIndian rupees) settled on the closing date and the remaining $16,001 (approximately 1.0 billion Indian rupees)reflected in payable for rights issue on the consolidated balance sheet at December 31, 2017. The payable for rightsissue was settled in January 2018. NCML issued 19,071,602 common shares to the participating shareholders as partof the rights issue and will use the proceeds to supplement its funding requirements for its silo projects.
At December 31, 2017 the company held an aggregate of 131,941,286 common shares of NCML representing an89.5% equity interest (December 31, 2016 – 88.1%).
At December 31, 2017 the company estimated the fair value of its investment in NCML using a discounted cash flowanalysis based on multi-year free cash flow projections with assumed after-tax discount rates ranging from 12.0% to19.9% and long term growth rates ranging from 2.4% to 6.0% (December 31, 2016 – 11.9% to 15.8%, and 6.0%,respectively). Free cash flow projections were based on EBITDA estimates derived from financial information forNCML’s business units prepared in the fourth quarter of 2017 by NCML’s management. Discount rates were based onthe company’s assessment of risk premiums to the appropriate risk-free rate of the economic environment in whichNCML operates. At December 31, 2017 the company’s internal valuation model indicated that the fair value of thecompany’s investment in NCML was $179,054 (December 31, 2016 – $146,586). The changes in fair value of thecompany’s investment in NCML during 2017 and 2016 are presented in the table disclosed later in note 5.
Investment in Sanmar Chemicals Group
Sanmar Chemicals Group (‘‘Sanmar’’), a private company, is one of the largest suspension polyvinyl chloride(‘‘PVC’’) manufacturers in India, headquartered in Chennai, India with an operational presence in India and Egypt.Sanmar also manufactures caustic soda, chloromethanes, refrigerant gases, industrial salt and specialty chemicalintermediates.
On April 28, 2016 Fairfax India invested $250,000 in Sanmar comprised of $1,000 in common shares (representing a30.0% equity interest) and $249,000 in bonds. On September 26, 2016 Fairfax India invested an additional $50,000in Sanmar bonds. Both tranches of Sanmar bonds mature on April 22, 2023 (7 years from the date of issuance of thefirst tranche), subject to earlier redemption at the option of Sanmar under certain circumstances. In lieu of cash, thecoupon payment on the bond is payable in kind in the form of additional Sanmar bonds over the life of the financialinstrument. A redemption premium may also be payable in kind to the company.
Sanmar Common Shares
At December 31, 2017 the company estimated the fair value of its investment in Sanmar common shares based on aninternal valuation model which consisted of a discounted cash flow analysis based on multi-year free cash flowprojections with assumed after-tax discount rates ranging from 15.2% to 19.5% and long term growth rates rangingfrom 2.0% to 3.6% (December 31, 2016 – 15.5% to 22.5% and 2.0% to 3.6%, respectively). Free cash flow projectionswere based on EBITDA estimates derived from financial information for Sanmar’s three main business units preparedin the fourth quarter of 2017 by Sanmar’s management. Discount rates were based on the company’s assessment ofrisk premiums to the appropriate risk-free rate of the economic environment in which Sanmar operates. AtDecember 31, 2017 the company’s internal valuation model indicated that the fair value of the common shares was$556 (December 31, 2016 – $440). The changes in fair value of the company’s investment in Sanmar common sharesduring 2017 and 2016 are presented in the table disclosed later in note 5.
Sanmar Bonds
At December 31, 2017 the company estimated the fair value of its investment in Sanmar bonds using an industryaccepted discounted cash flow and option pricing model that incorporated Sanmar’s estimated credit spread of 8.2%(December 31, 2016 – 7.1%) and assumptions related to certain redemption options embedded in the bonds. Theestimated credit spread was based on the credit spreads of a peer group of comparable companies adjusted for creditrisk specific to Sanmar. At December 31, 2017 the company’s internal valuation model indicated that the fair value of
36

Sanmar bonds was $333,172 (December 31, 2016 – $299,093). The changes in fair value of the company’s investmentin Sanmar bonds during 2017 and 2016 are presented in the table disclosed later in note 5.
Investment in Saurashtra Freight Private Limited
Saurashtra Freight Private Limited (‘‘Saurashtra’’), a private company headquartered in Mumbai, India, runs one ofthe largest container freight stations at Mundra port (Gujarat). Services provided by Saurashtra’s container freightstation includes transportation of containers to and from the port, stuffing/destuffing of containers, cargo storage,transportation of cargo to the end customer, and the storage, maintenance and repair of empty containers. Duringthe third quarter of 2017, Saurashtra commenced operations in a new line of business that focuses on new servicesfor container shipping, offering integrated logistic solutions to its customers by providing Saurashtra’s owncontainers to importers and exporters to transport cargo.
On February 14, 2017 Fairfax India acquired a 51.0% equity interest in Saurashtra for cash consideration of $30,018(approximately 2.0 billion Indian rupees).
The company refined its internal valuation model used in the determination of the fair value of Saurashtra toincorporate the impact of the decision made by management in the fourth quarter of 2017 to exit the niche shippingline voyages between India and select countries in the Gulf region (Fairwind Shipping) due to competitive factorsand demand not materializing as expected. At December 31, 2017 the company estimated the fair value of itsinvestment in Saurashtra using a discounted cash flow analysis based on multi-year free cash flow projections withassumed after-tax discount rates ranging from 14.6% to 14.7% and long term growth rates ranging from 4.0% to5.0%. Free cash flow projections were based on EBITDA estimates derived from financial information for Saurashtra’stwo business units prepared in the fourth quarter of 2017 by Saurashtra’s management. The discount rates were basedon the company’s assessment of risk premiums to the appropriate risk-free rate of the economic environment inwhich Saurashtra operates. At December 31, 2017 the company’s internal valuation model indicated that the fairvalue of the company’s investment in Saurashtra was $28,000. The changes in fair value of the company’sinvestment in Saurashtra during 2017 are presented in the table disclosed later in note 5.
Investment in National Stock Exchange of India Limited
National Stock Exchange of India Limited (‘‘NSE’’), a private company located in Mumbai, India, operates India’slargest stock exchange. In addition to providing a platform for exchange-traded financial products in India, NSE’sflagship index, Nifty50, is used extensively by investors in India and around the world as a barometer of the Indiancapital markets.
In the third quarter of 2016 Fairfax India acquired a 1.0% equity interest in NSE for cash consideration of $26,783(approximately 1.8 billion Indian rupees). The initial transaction price was considered to approximate fair value atDecember 31, 2016 due to the proximity of the transaction closing date to year end and the absence of changes infactors impacting the fair value since the closing date.
During the first quarter of 2017 the company refined its internal valuation model used in the determination of thefair value of NSE. At December 31, 2017 the fair value of the company’s investment in NSE was based on an internalmarket approach valuation model. The model references the earnings multiple of a peer group of comparablecompanies that had a median earnings multiple of 26.2 times, that when applied to NSE’s earnings resulted in a fairvalue of $40,452 (December 31, 2016 – $26,504). The changes in fair value of the company’s investment in NSEduring 2017 and 2016 are presented in the table that disclosed later in note 5.
Subsequent to December 31, 2017
Investment in The Catholic Syrian Bank Ltd.
On February 20, 2018 the company entered into an agreement to acquire a 51.0% equity interest in The CatholicSyrian Bank Ltd. (‘‘CSB’’) for approximately $186,000 at the exchange rate at that date (approximately 12.1 billionIndian rupees). The transaction is expected to close in the first half of 2018, subject to customary closing conditions.CSB, a private company, was established in 1920 and is a full-service bank offering neighborhood banking,non-resident Indian services, small-to-medium-enterprise and wholesale banking services through 421 branches and251 automated teller machines across India. CSB is headquartered in Thrissur, India.
37

FAIRFAX INDIA HOLDINGS CORPORATION
Summary of Changes in the Fair Value of the Company’s Indian Investments
A summary of changes in the fair value of the company’s Public and Private Indian Investments during 2017 and2016 were as follows:
Public Indian Investments Private Indian Investments
Common stocks Bonds Common stocks
Total IndianIIFL Fairchem 5paisa Total Sanmar BIAL NCML Sanmar Saurashtra NSE Privi Total Investments
Balance as of January 1, 2017 265,951 45,488 – 311,439 299,093 – 146,586 440 – 26,504 54,315 526,938 838,377
Purchases 75,175 – – 75,175 – 585,591(1) 25,602 – 30,018 – – 641,211 716,386
Transfer due to Merger(2) / Spin-off(3) (19,758) 54,315 19,758 54,315 – – – – – – (54,315) (54,315) –
Net change in unrealized gains (losses)on investments and other costs 536,121 42,241 (195) 578,167 14,843 10,902(1) (2,298) 86 (3,423) 12,032 – 32,142 610,309
Net unrealized foreign currencytranslation gains 30,996 7,156 395 38,547 19,236 11,795 9,164 30 1,405 1,916 – 43,546 82,093
Balance as of December 31, 2017 888,485 149,200 19,958 1,057,643 333,172 608,288 179,054 556 28,000 40,452 – 1,189,522 2,247,165
Balance as of January 1, 2016 220,747 – – 220,747 – – 146,445 – – – – 146,445 367,192
Purchases – 19,409 – 19,409 299,000 – – 1,000 – 26,783 54,975 381,758 401,167
Net change in unrealized gains (losses)on investments 51,305 26,399 – 77,704 6,907 – 3,879 (545) – – – 10,241 87,945
Net unrealized foreign currencytranslation losses (6,101) (320) – (6,421) (6,814) – (3,738) (15) – (279) (660) (11,506) (17,927)
Balance as of December 31, 2016 265,951 45,488 – 311,439 299,093 – 146,586 440 – 26,504 54,315 526,938 838,377
(1) On July 13, 2017 the company acquired an additional 10.0% equity interest in BIAL for cash consideration of $200,093 (12.9 billionIndian rupees) which the company determined included $74,202 (approximately 4.8 billion Indian rupees) of consideration in excess ofthe fair value of those additional shares acquired. The excess cash consideration paid was attributable to the costs incurred and includedin the table above in purchases, and was recorded in net change in unrealized gains on investments and other costs included in theconsolidated statement of earnings.
(2) The merger of Fairchem and Privi resulted in the reallocation of the investment in Privi from Private Indian Investments to the PublicIndian Investment in Fairchem.
(3) The spin-off of 5paisa from IIFL resulted in the reallocation of the fair value of 5paisa out of the cost of IIFL to form the initial costof 5paisa.
38

6. Cash and Investments
Fair Value Disclosures
The company’s use of quoted market prices (Level 1), valuation models using observable market information asinputs (Level 2) and valuation models without observable market information as inputs (Level 3) in the valuation ofsecurities by type of issuer was as follows:
December 31, 2017 December 31, 2016
Total fair Total fairSignificant value of Significant value of
other Significant assets in other Significant assets inQuoted observable unobservable Total fair Indian Quoted observable unobservable Total fair Indian
prices inputs inputs value rupees prices inputs inputs value rupees(Level 1) (Level 2) (Level 3) of assets (in millions) (Level 1) (Level 2) (Level 3) of assets (in millions)
Cash and cash equivalents 13,244 – – 13,244 845 146,960 – – 146,960 9,974
Restricted cash(1) 10,598 – – 10,598 676 18,810 – – 18,810 1,277
23,842 – – 23,842 1,521 165,770 – – 165,770 11,251
Short term investments –U.S. treasury bills 27,481 – – 27,481 1,754 27,428 – – 27,428 1,861
Bonds:
Government of India(2) – 259,356 – 259,356 16,554 – 130,317 – 130,317 8,845
Indian corporate(2) – 101,724 – 101,724 6,493 – 99,447 – 99,447 6,750
Sanmar – – 333,172 333,172 21,266 – – 299,093 299,093 20,299
– 361,080 333,172 694,252 44,313 – 229,764 299,093 528,857 35,894
Common stocks:
IIFL 888,485 – – 888,485 56,710 265,951 – – 265,951 18,050
Fairchem(3) 149,200 – – 149,200 9,523 45,488 – – 45,488 3,087
5paisa 19,958 – – 19,958 1,274 – – – – –
BIAL – – 608,288 608,288 38,825 – – – – –
NCML – – 179,054 179,054 11,429 – – 146,586 146,586 9,949
Sanmar – – 556 556 36 – – 440 440 30
Saurashtra – – 28,000 28,000 1,787 – – – – –
NSE – – 40,452 40,452 2,582 – – 26,504 26,504 1,799
Privi – – – – – – – 54,315 54,315 3,686
1,057,643 – 856,350 1,913,993 122,166 311,439 – 227,845 539,284 36,601
Total cash and investments 1,108,966 361,080 1,189,522 2,659,568 169,754 504,637 229,764 526,938 1,261,339 85,607
41.7% 13.6% 44.7% 100.0% 100.0% 40.0% 18.2% 41.8% 100.0% 100.0%
(1) Comprised of funds set aside as restricted cash to fund term loan interest payments.
(2) Priced based on information provided by independent pricing service providers at December 31, 2017 and 2016. There were no changes invaluation techniques for these securities during 2017.
(3) Includes the fair value of 738,760 CCPS that were priced based on the bid of Fairchem’s share price at December 31, 2017.
The consolidated balance sheet at December 31, 2016 included a receivable of $26,525 related to the pendingsettlement of sales on investments from the disposition of investment funds presented as a component ofother assets.
Transfers between fair value hierarchy levels are considered effective from the beginning of the reporting period inwhich the transfer is identified. During 2017 and 2016 there were no transfers of financial instruments betweenLevel 1 and Level 2 and there were no transfers of financial instruments in or out of Level 3 as a result of changes inthe observability of valuation inputs. During 2017 as a result of the Merger of Fairchem and Privi, described in note 5,the investment in Privi was transferred out of Level 3 and aggregated with the Level 1 investment in Fairchem.
39

FAIRFAX INDIA HOLDINGS CORPORATION
A summary of changes in fair value of the company’s Private Indian Investments (classified as Level 3) denominatedin the company’s functional currency of the Indian rupee for the years ended December 31 was as follows:
Indian rupees Bonds Common stocks(in millions)
Sanmar BIAL NCML Sanmar Saurashtra NSE Privi Total
Balance as of January 1, 2017 20,299 – 9,949 30 – 1,799 3,686 35,763
Purchases – 38,116(1) 1,629 – 2,010 – – 41,755
Transfer out of category due to Merger – – – – – – (3,686) (3,686)
Net change in unrealized gains (losses) on investments and other costs 967 709(1) (149) 6 (223) 783 – 2,093
Balance as of December 31, 2017 21,266 38,825 11,429 36 1,787 2,582 – 75,925
Balance as of January 1, 2016 – – 9,688 – – – – 9,688
Purchases 19,835 – – 66 – 1,799 3,686 25,386
Net change in unrealized gains (losses) on investments 464 – 261 (36) – – – 689
Balance as of December 31, 2016 20,299 – 9,949 30 – 1,799 3,686 35,763
(1) On July 13, 2017 the company acquired an additional 10.0% equity interest in BIAL for cash consideration of $200,093 (12.9 billionIndian rupees) which the company determined included $74,202 (approximately 4.8 billion Indian rupees) of consideration in excess ofthe fair value of those additional shares acquired. The excess cash consideration paid was attributable to the costs incurred and included inthe table above in purchases, and was recorded in net change in unrealized gains on investments and other costs included in theconsolidated statement of earnings.
The change in fair value of the company’s Private Indian Investments (classified as Level 3) in the company’spresentation currency of U.S. dollars is disclosed in note 5.
The table that follows illustrates the potential impact on net earnings of various combinations of changes inunobservable inputs in the company’s internal valuation models for its Private Indian Investments classified asLevel 3 at December 31, 2017. The analysis assumes variations within a reasonably possible range determined by thecompany based on an analysis of the return on various equity indexes, management’s knowledge of the Indianequity markets and the potential impact of changes in interest rates.
Significantunobservableinputs used Hypothetical
in the $ change HypotheticalFair Significant internal effect on $ change
value of Valuation unobservable valuation fair value effect onInvestments investment technique inputs models measurement(1) net earnings(1)
DiscountedBonds: Sanmar $333,172 Credit spread 8.2% 17,067 / (16,176) 12,554 / (11,889)cash flow
Common Stocks:
DiscountedBIAL $608,288 After-tax discount rate 10.4% to 11.7% 103,126 / (89,674) 89,462 / (77,792)cash flowLong term growth rate 3.0% 12,600 / (11,781) 10,931 / (10,220)
DiscountedNCML $179,054 After-tax discount rate 12.0% to 19.9% 33,098 / (28,360) 28,713 / (24,602)cash flowLong term growth rate 2.4% to 6.0% 10,589 / (9,799) 9,186 / (8,501)
DiscountedSanmar $556 After-tax discount rate 15.2% to 19.5% 17,812 / (556) 15,452 / (482)cash flowLong term growth rate 2.0% to 3.6% 5,279 / (556) 4,580 / (482)
DiscountedSaurashtra $28,000 After-tax discount rate 14.6% to 14.7% 947 / (1,067) 822 / (926)cash flowLong term growth rate 4.0% to 5.0% 250 / (448) 217 / (389)
MarketNSE $40,452 Price to earnings ratio 26.2 times 4,045 / (4,045) 2,973 / (2,973)approach
(1) The impact on the internal valuation models from changes in significant unobservable inputs deemed to be subject to the most judgmentand estimates disclosed in the table above shows the hypothetical increase (decrease) in net earnings. Changes in the after-tax discountrates (50 basis points), long term growth rates (25 basis points), price to earnings ratio (15.0%), and credit spreads (100 basis points),each in isolation, would hypothetically change the fair value of the company’s investments as noted in the table above. Generally, anincrease (decrease) in long term growth rates or price to earnings ratio, or a decrease (increase) in after-tax discount rates or credit spreads,would result in a higher (lower) fair value of the company’s Private Indian Investments.
40

Fixed Income Maturity Profile
Bonds are summarized by their earliest contractual maturity date in the table that follows. Actual maturities maydiffer from maturities shown below due to the existence of call and put features. At December 31, 2017 bondscontaining call features represented $333,172 (December 31, 2016 – $299,093) of the total fair value of bonds. AtDecember 31, 2017 and 2016, there were no bonds containing put features.
December 31, 2017 December 31, 2016
Amortized Amortizedcost Fair value cost Fair value
Due in 1 year or less 310,767 333,172 292,257 299,093Due after 5 years through 10 years 337,414 334,457 181,097 191,613Due after 10 years 28,498 26,623 35,919 38,151
676,679 694,252 509,273 528,857
Effective interest rate(1) 7.4% 8.1%
(1) Excludes Sanmar bonds.
Investment Income
An analysis of investment income for the years ended December 31 is summarized in the tables that follow:
Interest and dividends
2017 2016
Interest:Cash and cash equivalents 349 175Short term investments 144 135Bonds 21,355 21,033
21,848 21,343
Dividends: Common stocks 8,627 5,611
Net gains (losses) on investments and net foreign exchange gains (losses)
2017 2016
Netchange in Net
Net unrealized Net change inrealized gains (losses) realized unrealized
gains and other Net gains gains gains Net gains(losses) costs (losses) (losses) (losses) (losses)
Net gains (losses) on investments:Short term investments – – – (17) – (17)Bonds 1,195 (3,189)(1) (1,994) (3,327) 22,318(1) 18,991Common stocks – 595,466(2) 595,466 4,688 81,038(2) 85,726Common stocks – Investment funds – – – 2,048 1,639 3,687
1,195 592,277 593,472 3,392 104,995 108,387
Net foreign exchange gains (losses) on:Cash and cash equivalents (27,531)(3) – (27,531) (3,624) – (3,624)Investments (1,244) (664) (1,908) 3,005 (3,155) (150)Term loans 9,812 4,764 14,576 – (2,963) (2,963)Other 586 – 586 – – –
(18,377) 4,100 (14,277) (619) (6,118) (6,737)
(1) In 2017, comprised of Government of India bonds (unrealized loss of $14,086) and Indian corporate bonds (unrealized loss of $3,946),partially offset by Sanmar bonds (unrealized gain of $14,843). In 2016, comprised of unrealized gains from Government of India bonds($9,419), Sanmar bonds ($6,907) and Indian corporate bonds ($5,992).
(2) Refer to note 5 for a summary of changes in the fair value of the company’s Public and Private Indian Investments during 2017 and 2016.(3) Primarily related to the U.S. dollar net proceeds received from the secondary Offerings (see note 8) that were held in U.S. dollar
denominated cash equivalents until the funds were partially deployed to acquire the 38.0% equity interest in BIAL.
41

FAIRFAX INDIA HOLDINGS CORPORATION
7. Term Loans
December 31, 2017 December 31, 2016
Carrying Fair Carrying FairPrincipal value value(1) Principal value(2) value(1)
Secured Term Loans:
1 Year Term Loan, floating rate due July 11, 2018 400,000 400,000 400,000 – – –
2 Year Term Loan, floating rate due September 17, 2018 – – – 225,000 223,772 223,772
400,000 400,000 400,000 225,000 223,772 223,772
(1) Carrying value approximated fair value at December 31, 2017 and 2016.
(2) Principal net of unamortized issue costs.
On July 11, 2017 the company entered into an agreement with a Canadian bank for a 1 year secured term loan with aprincipal amount of $400,000 bearing interest at a rate of LIBOR plus 325 to 375 basis points (the ‘‘1 year term loan’’).On July 13, 2017 the company used a portion of the net proceeds from the 1 year term loan to complete theadditional 10.0% investment in BIAL of $200,093 and participate in the NCML rights issue (see note 5).
Under the terms of the 1 year term loan, the company is required to maintain a debt service reserve account to fundthe term loan interest payments. The cash held in the debt service reserve account is classified as restricted cash onthe consolidated balance sheet. The company is also required to use the term loan proceeds solely for the purposes offunding: (i) investments in Specified Portfolio Companies (comprised of the company’s Indian Investments);(ii) investments in cash equivalents, inclusive of permitted investments; (iii) transaction costs, fees and expensesrelated to such investments; and (iv) the debt service reserve account. The 1 year term loan includes a financialcovenant that requires the company to maintain common shareholders’ equity of not less than $1.3 billion. AtDecember 31, 2017 the company was in compliance with the 1 year term loan financial covenant.
On September 16, 2016 the company entered into an agreement with a syndicate of Canadian banks for a 2 yearsecured term loan with a principal amount of $225,000 bearing interest at a rate of LIBOR plus 350 to 500 basis points(the ‘‘2 year term loan’’). Under the terms of the 2 year term loan, the company was required to set aside funds asrestricted cash to fund the term loan interest payments. The 2 year term loan was repaid on March 31, 2017 pursuantto a mandatory prepayment clause that required the company to repay the $225,000 principal amount from the netproceeds of the secondary Offerings (see note 8).
Interest Expense
In 2017 interest expense of $15,664 (2016 – $4,171) was comprised of interest expense of $11,414 (2016 – $2,647),issue costs on the 1 year term loan of $3,022 (2016 – nil), and the release of unamortized issue costs on the 2 yearterm loan of $1,228 (2016 – amortization of issue costs of $1,524).
8. Common Shareholders’ Equity
Authorized Capital
The company’s authorized share capital consists of (i) an unlimited number of multiple voting shares that may onlybe issued to Fairfax or its affiliates; (ii) an unlimited number of subordinate voting shares; and, (iii) an unlimitednumber of preference shares, issuable in series. Except as provided in any special rights or restrictions attaching toany series of preference shares issued from time to time, the preference shares will not be entitled to vote at anymeeting of the shareholders of the company.
Issued Capital
Issued capital at December 31, 2017 included 30,000,000 (December 31, 2016 – 30,000,000) multiple voting sharesand 117,432,631 (December 31, 2016 – 74,881,031) subordinate voting shares without par value. Each subordinatevoting share carries one vote per share at all meetings of shareholders except for separate meetings of holders ofanother class of shares. Each multiple voting share carries fifty votes per share at all meetings of shareholders exceptfor separate meetings of holders of another class of shares. Fairfax, through its subsidiaries, owns all the issued andoutstanding multiple voting shares, which are not traded. At December 31, 2017 there were no preferenceshares issued.
42

Common stock
The number of shares outstanding was as follows:
2017 2016
Subordinate voting shares – January 1 74,881,031 76,678,879Issuances of shares 42,553,500 –Purchases for cancellation (1,900) (1,797,848)
Subordinate voting shares – December 31 117,432,631 74,881,031Multiple voting shares – beginning and end of year 30,000,000 30,000,000
Common shares effectively outstanding – December 31 147,432,631 104,881,031
Capital transactions
Year ended December 31, 2017
On January 13, 2017 the company completed an underwritten public offering of 12,766,000 subordinate votingshares at a price of $11.75 per share. Concurrent with the public offering, Fairfax and Ontario Municipal EmployeesRetirement System (‘‘OMERS’’) acquired 12,766,000 and 17,021,500 subordinate voting shares, respectively, at aprice of $11.75 per subordinate voting share in a private placement (the ‘‘Concurrent Private Placement’’ and,together with the public offering, collectively the ‘‘secondary Offerings’’), resulting in net proceeds of $493,504, aftercommissions and expenses of $6,500. Net proceeds from the secondary Offerings were used to acquire additionalIndian Investments, for general corporate purposes, and to repay the 2 year term loan (see note 7).
Subsequent to December 31, 2017
In accordance with the Investment Advisory Agreement (defined in note 12), the performance fee payable to Fairfaxfor the first calculation period (ending on December 31, 2017) was settled on March 9, 2018 by the company issuing7,663,685 subordinate voting shares to Fairfax. The issuance of these subordinate voting shares increased Fairfax’sequity interest in Fairfax India from 30.2% at December 31, 2017 to 33.6% (see note 12 for additional details on theperformance fee).
Repurchase of Shares
During 2017, under the terms of the normal course issuer bid, the company repurchased for cancellation1,900 subordinate voting shares (2016 – 1,797,848) for a net cost of $27 (2016 – $21,178), of which $8 was charged toretained earnings (2016 – $4,160).
Dividends
The company did not pay any dividends on its total outstanding common shares during 2017 and 2016.
9. Net Earnings per Share
Net earnings per share is calculated based on the weighted average common shares outstanding:
2017 2016
Net earnings – basic and diluted 452,509 107,825
Weighted average common shares outstanding – basic 146,035,470 106,517,213Contingently issuable subordinate voting shares 7,663,685 –
Weighted average common shares outstanding – diluted 153,699,155 106,517,213
Net earnings per common share – basic $ 3.10 $ 1.01Net earnings per common share – diluted $ 2.94 $ 1.01
43

FAIRFAX INDIA HOLDINGS CORPORATION
At December 31, 2017 there were 7,663,685 (December 31, 2016 – nil) contingently issuable subordinate votingshares relating to the performance fee payable to Fairfax. The performance fee is accrued quarterly and relates to thethree-year period from January 30, 2015 to December 31, 2017. The performance fee payable to Fairfax for the firstcalculation period (ending on December 31, 2017) was settled on March 9, 2018 by the company issuing7,663,685 subordinate voting shares to Fairfax. Under the terms of the Investment Advisory Agreement, settlementof the performance fee will take place in subordinate voting shares of the company if the market price per share is lessthan two times the then book value per share. The number of subordinate voting shares issued was calculated basedon the volume-weighted average trading price of the company’s subordinate voting shares for the 10 trading daysprior to and including December 31, 2017 (‘‘VWAP’’). Refer to note 12 for additional details on the performancefee payable.
At December 31, 2016 there were no instruments outstanding that could potentially dilute net earnings per share.
10. Income Taxes
The company’s recovery of income taxes for the years ended December 31 was as follows:
2017 2016
Current income tax:Current year recovery (1,768) (4,878)Adjustment to prior years’ income taxes (650) 1,926
(2,418) (2,952)
Deferred income tax:Origination and reversal of temporary differences – 2,070Adjustments to prior years’ deferred income taxes – 1
– 2,071
Recovery of income taxes (2,418) (881)
A significant portion of the company’s earnings before income taxes is earned outside of Canada. The statutoryincome tax rates for jurisdictions outside of Canada generally differ from the Canadian statutory income tax rate(and may be significantly higher or lower).
During the second quarter of 2016, India and Mauritius amended their double income tax treaty (‘‘India-Mauritiustax treaty’’). As a result, investments acquired up to April 1, 2017 will not be assessed by India for tax on their futuredisposition. After April 1, 2017, India will levy capital gains tax at half the India domestic rate on equity investmentspurchased or sold through Mauritius until March 31, 2019 and at the full rate from April 1, 2019 onward.
The company’s earnings (loss) before income taxes by jurisdiction and the associated provision for (recovery of)income taxes for the years ended December 31 is summarized in the following table:
2017 2016
Canada Mauritius Total Canada Mauritius Total
Earnings (loss) before income taxes (28,300) 478,391 450,091 (4,105) 111,049 106,944Provision for (recovery of) income taxes (2,886) 468 (2,418) (4,090) 3,209 (881)
Net earnings (loss) (25,414) 477,923 452,509 (15) 107,840 107,825
The increase in pre-tax profitability in Mauritius during 2017 compared to 2016 primarily reflected increased netchange in unrealized gains on investments and other costs (principally from the company’s Public IndianInvestments) and increased dividend income, partially offset by the performance fee and increased investment andadvisory fees. The increase in pre-tax losses in Canada during 2017 compared to 2016 principally related to theperformance fee and increased investment and advisory fees, interest expense on the term loans, and net realizedforeign exchange losses (primarily on cash equivalents, partially offset by net realized foreign exchange gains on theterm loans).
44

A reconciliation of the provision for income taxes calculated at the Canadian statutory income tax rate to therecovery of income taxes at the effective tax rate in the consolidated financial statements for the years endedDecember 31 are summarized in the following table:
2017 2016
Canadian statutory income tax rate 26.5% 26.5%
Provision for income taxes at the Canadian statutory income tax rate 119,274 28,340Tax rate differential on income earned outside of Canada (154,425) (27,934)Provision (recovery) relating to prior years (650) 1,926Change in unrecorded tax benefit of losses and temporary differences 28,670 1,685Foreign exchange effect 4,713 (4,898)
Recovery of income taxes (2,418) (881)
The tax rate differential on income earned outside of Canada of $154,425 in 2017 and $27,934 in 2016 principallyreflected the impact of net investment income taxed in India and Mauritius at lower rates.
The change in unrecorded tax benefit of losses and temporary differences of $28,670 in 2017 (2016 – $1,685)principally reflected changes in unrecorded deferred tax assets incurred related to foreign accrual property losses of$25,884 (2016 – $1,685) with respect to the company’s wholly-owned subsidiaries. At December 31, 2017 deferredtax assets in Canada of $38,860 (December 31, 2016 – $8,420) were not recorded as it was considered not probablethat those losses could be utilized by the company.
Foreign exchange effect of $4,713 in 2017 (2016 – $4,898) principally reflected the impact of fluctuations in thevalue of the Canadian dollar relative to the U.S. dollar and the Indian rupee as the company computes its corporatetax liability in Canadian dollars pursuant to the requirements of Canadian tax authorities, whereas the functionalcurrency of the company and its Mauritius subsidiaries is the Indian rupee.
Changes in net income taxes refundable (payable) for the years ended December 31 were as follows:
2017 2016
Balance – January 1 7,326 (9,386)Amounts recorded in the consolidated statements of earnings 2,418 2,952Payments made (refunds received) during the year (7,019) 13,500Foreign currency translation 373 260
Balance – December 31 3,098 7,326
Management reviews the recoverability of potential deferred tax assets on an ongoing basis and adjusts, as necessary,to reflect their anticipated realization. Deferred income tax balances were nil at December 31, 2017 and 2016 as thecompany has not recorded deferred tax assets of $5,831 (December 31, 2016 – $6,529) related to the costs of theinitial public offering and secondary Offerings, net operating loss carryforwards of $5,254 (December 31, 2016 – nil)and foreign accrual property losses of $27,775 (December 31, 2016 – $1,891). The net operating loss carryforwardsand foreign accrual property losses expire in 2037, and between 2035 and 2037, respectively.
At December 31, 2017 a deferred income tax liability of approximately $93,000 (December 31, 2016 – approximately$13,000) has not been recognized on unremitted earnings related to the company’s Indian Investments ofapproximately $703,000 (2016 – approximately $100,000) that are not likely to be repatriated in the foreseeablefuture.
Subsequent to December 31, 2017
On February 1, 2018 the Government of India released its Union Budget proposals for fiscal year 2018-19(the ‘‘Budget’’). The Budget proposes to repeal, with effect from April 1, 2018, the long term capital gains taxexemption in India that is available in respect of certain transfers of listed equity shares of Indian companies onwhich Securities Transaction Tax is paid at the time of acquisition and transfer of such shares. Long term capital gainsrealized on such transfers are generally proposed to be taxed at a rate of 10.0%. However, grandfathering of the longterm capital gains exemption in respect of any accrued gain on such shares held as of January 31, 2018 will generally
45

FAIRFAX INDIA HOLDINGS CORPORATION
be available to the extent of the accrued gain as of January 31, 2018. Capital gains realized by a tax resident ofMauritius on a transfer of equity shares of an Indian company which were acquired prior to April 1, 2017 willcontinue to be exempt from capital gains tax in India by virtue of the India-Mauritius tax treaty (as noted above),notwithstanding the repeal of the long term capital gains tax exemption under Indian domestic law. In addition, along term capital gain realized by a Mauritius tax resident on shares acquired after April 1, 2017, and sold prior toMarch 31, 2019, will continue to be taxed at the rate of 50.0% of the prevailing domestic Indian capital gains tax rateby virtue of the India-Mauritius tax treaty. The company is currently evaluating the potential impact of the Budgetand the potential application of capital gains tax in India on any future dispositions of investments in equity sharesheld by FIH Mauritius.
11. Financial Risk Management
Overview
The primary goals of the company’s financial risk management are to ensure that the outcomes of activitiesinvolving elements of risk are consistent with the company’s objectives and risk tolerance, while maintaining anappropriate balance between risk and reward and protecting the company’s consolidated balance sheet from eventsthat have the potential to materially impair its financial strength. The company’s activities expose it to certainfinancial risks during or at the end of the reporting period. These risks, and the company’s management thereof, aredescribed below.
Market Risk
Market risk (comprised of foreign currency risk, interest rate risk and other price risk) is the risk that the fair value orfuture cash flows of a financial instrument will fluctuate because of changes in market prices. The company isexposed to market risk principally in its investing activities and to the extent that those activities expose thecompany to foreign currency risk. The valuation of the company’s investment portfolio is largely dependent on theunderlying performance of the companies within the portfolio, but may also be affected, along with other financialstatement items, by fluctuations in interest rates, foreign currency exchange rates and market prices.
Foreign Currency Risk
Foreign currency risk is the risk that the fair value or future cash flows of a financial instrument or another asset orliability will fluctuate because of changes in exchange rates and as a result, could produce an adverse effect on netearnings and common shareholders’ equity when measured in Indian rupees, the company’s functional currency.The company’s net earnings and common shareholders’ equity may also be significantly affected by foreign currencytranslation movements as the majority of its net assets and net earnings are denominated in a currency other thanthe company’s U.S. dollar presentation currency. The company has not hedged its foreign currency risk.
The company’s net foreign currency exposure on balances denominated in currencies other than the Indian rupee(expressed in U.S. dollars) are comprised as follows:
December 31, 2017 December 31, 2016
Receivablefrom sale Payable
Cash and 1 Year Payable Cash and of 2 Year tocash Short term term to related Net cash Short term investment term related Net
equivalents investments loan parties exposure equivalents investments funds loan parties exposure
U.S. dollars 19,389(1) 27,481 (400,000) (122,791) (475,921) 165,051(1) 27,428 26,525 (223,772) (3,659) (8,427)
All other currencies 4,453 – – (35) 4,418 716 – – – (14) 702
Total 23,842 27,481 (400,000) (122,826) (471,503) 165,767 27,428 26,525 (223,772) (3,673) (7,725)
(1) At December 31, 2017 cash and cash equivalents included restricted cash of $10,598 to fund the 1 year term loan interest payments(December 31, 2016 – restricted cash of $18,810 to fund the 2 year term loan interest payments).
The table above shows the company’s net exposure to the U.S. dollar and all other currencies, other than the Indianrupee. If the Indian rupee appreciated by 5.0% against the U.S. dollar and all other currencies, the effect on pre-taxearnings and net earnings would be a hypothetical increase of $23,575 and $17,328 (December 31, 2016 – $386 and$284). Certain shortcomings are inherent in the method of analysis presented, including the assumption that the5.0% appreciation of the Indian rupee occurred with all other variables held constant.
46

The company’s net liability exposure to the U.S. dollar increased at December 31, 2017 compared to December 31,2016 primarily as a result of the 1 year term loan completed on July 11, 2017 (see note 7) and the performance feeaccrual, partially offset by the impact of the repayment of the 2 year term loan on March 31, 2017 (see note 7).
Interest Rate Risk
Interest rate risk is the risk that the fair values or future cash flows of a financial instrument will fluctuate because ofchanges in market interest rates. Typically, as interest rates rise, the fair value of fixed income investments declineand, conversely, as interest rates decline, the fair value of fixed income investments rise. In each case, the longer thematurity of the financial instrument, the greater the consequence of a change in interest rates. The company’sinterest rate risk management strategy is to position its fixed income portfolio based on its view of future interestrates and the yield curve, balanced with liquidity requirements. General economic conditions, political conditionsand many other factors can also adversely affect the bond markets and, consequently, the value of fixed incomesecurities held. Interest rate movements in India may affect the company’s common shareholders’ equity and netearnings. The Portfolio Advisor and Fairfax actively monitor interest rates in India and the potential impact changesin interest rates may have on the company’s investment portfolio. There were no significant changes to thecompany’s framework used to monitor, evaluate and manage interest rate risk at December 31, 2017 compared toDecember 31, 2016.
The table that follows displays the potential impact of changes in interest rates on the company’s fixed incomeportfolio based on parallel 200 basis point shifts up and down, in 100 basis point increments. This analysis wasperformed on each individual security, with the hypothetical effect on net earnings.
December 31, 2017 December 31, 2016
Fair value of Hypothetical $ Hypothetical % Fair value of Hypothetical $ Hypothetical %fixed income change effect on change in fair fixed income change effect on change in
portfolio net earnings value portfolio net earnings fair value
Change in interest rates200 basis point rise 625,972 (50,186) (9.8)% 468,666 (44,238) (11.4)%100 basis point rise 659,444 (25,584) (5.0)% 498,029 (22,656) (5.8)%No change 694,252 – – 528,857 – –100 basis point decline 733,247 28,661 5.6 % 563,826 25,705 6.6 %200 basis point decline 773,950 58,578 11.5 % 592,543 46,812 12.0 %
Certain shortcomings are inherent in the method of analysis presented above. Computations of the prospectiveeffects of hypothetical interest rate changes are based on numerous assumptions, including the maintenance of thelevel and composition of fixed income securities at the indicated date, and should not be relied on as indicative offuture results. Actual values may differ from the projections presented should market conditions vary fromassumptions used in the calculation of the fair value of individual securities; such variations include non-parallelshifts in the term structure of interest rates and a change in individual issuer credit spreads.
Market Price Fluctuations
Market price fluctuation is the risk that the fair value or future cash flows of an equity investment will fluctuatebecause of changes in market prices (other than those arising from interest rate risk or foreign currency risk), whetherthose changes are caused by factors specific to the individual investment or its issuer, or other factors affecting allsimilar investments in the market. Changes to the company’s exposure to equity price risk through its equityinstruments at December 31, 2017 compared to December 31, 2016 are described below.
The company holds significant equity investments. The market value and the liquidity of these investments arevolatile and may vary dramatically either up or down in short periods, and their ultimate value will therefore only beknown over a period of time or on disposition.
The company’s exposure to market price risk increased during 2017 as a result of the investments in BIAL andSaurashtra (Level 3 investments in the fair value hierarchy), and the additional investments in IIFL (Level 1investment in the fair value hierarchy) and NCML (Level 3 investment in the fair value hierarchy). Refer to note 6 forthe potential impact on net earnings of various combinations of changes in significant unobservable inputs in thecompany’s internal valuation models for the company’s investments classified as Level 3 in the fair value hierarchy.
47

FAIRFAX INDIA HOLDINGS CORPORATION
The following table illustrates the potential impact on pre-tax earnings (loss) and net earnings (loss) of a 10.0%change in the fair value of the company’s equity investments classified as Level 1 in the fair value hierarchy (IIFL,Fairchem and 5paisa).
December 31, 2017 December 31, 2016
Change in Indian equity markets +10.0% �10.0% +10.0% �10.0%
Level 1 equity investments, fair value at December 31 1,057,643 1,057,643 311,439 311,439
Hypothetical $ change effect on pre-tax earnings (loss) 105,764 (105,764) 31,144 (31,144)
Hypothetical $ change effect on net earnings (loss) 91,750 (91,750) 27,017 (27,017)
Credit Risk
Credit risk is the risk of loss resulting from the failure of a counterparty to honour its financial obligations to thecompany and arises predominantly with respect to cash and cash equivalents, short term investments andinvestments in debt instruments. There were no significant changes to the company’s exposure to credit risk (exceptas set out in the discussion which follows) or the framework used to monitor, evaluate and manage credit risk atDecember 31, 2017 compared to December 31, 2016.
Cash and Cash Equivalents, and Short Term Investments
At December 31, 2017 the company’s cash and cash equivalents of $13,244 (December 31, 2016 – $146,960) wereprimarily held at the holding company in major financial institutions (principally in high credit-quality Canadianfinancial institutions). The company monitors risks associated with cash and cash equivalents, and short terminvestments by regularly reviewing the financial strength and creditworthiness of these financial institutions.
At December 31, 2017, the company’s short term investments in U.S. treasury bills of $27,481 (December 31, 2016 –$27,428) were rated Aaa by Moody’s Investors Service, Inc. (‘‘Moody’s’’) and AA+ by Standard & Poor’s FinancialServices LLC (‘‘S&P’’).
Investments in Debt Instruments
The company’s risk management strategy for debt instruments is to invest primarily in high credit quality issuers andto limit the amount of credit exposure with respect to any one corporate issuer. While the company reviews thirdparty credit ratings, it also carries out its own analysis and does not delegate the credit decision to rating agencies.The company endeavours to limit credit exposure by monitoring fixed income portfolio limits on individualcorporate issuers and limits based on credit quality.
At December 31, 2017 and 2016 the company’s debt instruments were all considered to be subject to credit risk with afair value of $694,252 (December 31, 2016 – $528,857), representing 26.1% (December 31, 2016 – 41.9%) of the totalcash and investments portfolio.
The composition of the company’s fixed income portfolio is presented in the table below:
December 31, 2017 December 31, 2016
Fair value Rating Fair value Rating
Government of India bonds(1) 259,356 Baa2/BBB� 130,317 Baa3/BBB�
Indian corporate bonds(2) 101,724 AAA 99,447 AAASanmar bonds(3) 333,172 BBB� 299,093 BBB�
Total bonds 694,252 528,857
(1) Rated BBB – by S&P. On November 16, 2017 Moody’s upgraded the Government of India bonds rating from Baa3 to Baa2.
(2) Rated AAA by subsidiaries of a Designated Rating Organization (‘‘DRO’’), being DBRS Limited, S&P, Fitch Inc. and Moody’s, orsubsidiaries or affiliates of a DRO.
(3) Rated BBB� by Brickwork Ratings, an Indian rating agency.
48
The company’s exposure to credit risk from its investment in fixed income securities increased at December 31, 2017compared to December 31, 2016 reflecting net purchases in 2017 of Government of India bonds from the netproceeds received from the 1 year term loan. Except as described above, there were no other significant changes tothe composition of the company’s fixed income portfolio classified according to each security’s respective issuercredit rating at December 31, 2017 compared to December 31, 2016.
Income Taxes Refundable
The company had income taxes refundable of $3,098 at December 31, 2017 (December 31, 2016 – $7,326).
Liquidity Risk
Liquidity risk is the risk that the company will encounter difficulty in meeting obligations associated with financialliabilities that are settled by delivering cash or another financial asset. The company manages liquidity risk bymaintaining sufficient liquid assets to enable settlement of financial commitments on their respective due dates. Allaccounts payable and accrued liabilities are due within three months, and income taxes payable, if any, must beremitted to the respective tax jurisdictions as they fall due.
The company believes that cash and cash equivalents at December 31, 2017 provides adequate liquidity to meet thecompany’s known significant commitments in 2018, which are principally comprised of the investment in CSB,investment and advisory fees, payable for rights issue (settled January 2018), general and administration expensesand potentially corporate income taxes. The company has the ability to sell a portion of its portfolio investments tosupplement the liquidity requirement to repay the principal amount of the 1 year term loan that matures inJuly 2018. The company expects to continue to receive investment income on its holdings of fixed income securitiesand dividends from its equity investments to supplement its cash and cash equivalents. The company has adequateworking capital to support its operations.
The performance fee payable to Fairfax for the first calculation period (ending on December 31, 2017) was settled onMarch 9, 2018 by the company issuing 7,663,685 subordinate voting shares to Fairfax. Refer to note 12 for additionaldetails on the performance fee payable.
Concentration Risk
The company’s cash and investments are primarily concentrated in India and in Indian businesses or businesses withcustomers, suppliers or business primarily conducted in, or dependent on, India. The market value of the company’sinvestments, the income generated by the company and the company’s performance will be particularly sensitive tochanges in the economic condition, interest rates, and regulatory environment in India. Adverse changes to theeconomic condition, interest rates or regulatory environment in India may have a material adverse effect on thecompany’s business, cash flows, financial condition and net earnings.
49

FAIRFAX INDIA HOLDINGS CORPORATION
The company’s total cash and investments composition by the issuer’s country of domicile was as follows:
December 31, 2017 December 31, 2016
India U.S. Other Total India U.S. Other Total
Cash and cash equivalents – 19,389(1) 4,453(2) 23,842 3 165,051(1) 716(2) 165,770
Short term investments –U.S. treasury bills – 27,481 – 27,481 – 27,428 – 27,428
Bonds:Government of India 259,356 – – 259,356 130,317 – – 130,317Indian corporate 101,724 – – 101,724 99,447 – – 99,447Sanmar 333,172 – – 333,172 299,093 – – 299,093
694,252 – – 694,252 528,857 – – 528,857
Common stocks:IIFL 888,485 – – 888,485 265,951 – – 265,951Fairchem 149,200 – – 149,200 45,488 – – 45,4885paisa 19,958 – – 19,958 – – – –BIAL 608,288 – – 608,288 – – – –NCML 179,054 – – 179,054 146,586 – – 146,586Sanmar 556 – – 556 440 – – 440Saurashtra 28,000 – – 28,000 – – – –NSE 40,452 – – 40,452 26,504 – – 26,504Privi – – – – 54,315 – – 54,315
1,913,993 – – 1,913,993 539,284 – – 539,284
Total cash and investments 2,608,245 46,870 4,453 2,659,568 1,068,144 192,479 716 1,261,339
(1) Included restricted cash of $10,598 at December 31, 2017 (December 31, 2016 – $18,810).
(2) Included cash principally held in Canadian financial institutions.
The company’s holdings of Public and Private Indian Investments (see note 5) at December 31, 2017 and 2016 aresummarized by the issuer’s primary sector in the table below:
December 31, 2017 December 31, 2016
Financial services 948,895 292,455Commercial and industrial 689,982 545,922Infrastructure 608,288 –
2,247,165 838,377
During 2017 the company’s concentration risk in the financial services sector increased primarily due to theadditional investment in IIFL ($75,175) and unrealized appreciation in IIFL and NSE, while the company’sconcentration risk in the commercial and industrial sector increased principally due to the investment in Saurashtra($30,018), the additional investment in NCML ($25,602) and unrealized appreciation primarily in Fairchem andSanmar bonds, and the company’s concentration risk in the infrastructure sector increased due to the investment inBIAL ($585,591).
The company will not make an Indian Investment if, after giving effect to such investment, the total investedamount of such investment would exceed 20.0% of the company’s total assets; provided, however, that the companyis permitted to complete up to two Indian Investments where, after giving effect to each such investment, the totalinvested amount of each such investment would be less than or equal to 25.0% of the company’s total assets(the ‘‘Investment Concentration Restriction’’). The company’s Investment Concentration Restriction increased atDecember 31, 2017 from December 31, 2016 principally as a result of net proceeds received from the secondaryOfferings (see note 8), net change in unrealized gains on investments and other costs (primarily related to thecompany’s Public Indian Investments) recorded in the consolidated statements of earnings in 2017, and net proceedsreceived from the 1 year term loan, partially offset by the repayment of the 2 year term loan (see note 7). IndianInvestments may be financed through equity or debt offerings as part of the company’s objective to reduce its cost ofcapital and provide returns to common shareholders. At December 31, 2017 the company determined that it was incompliance with the Investment Concentration Restriction.
50

Capital Management
The company’s objectives when managing capital are to protect its lenders, to safeguard its ability to continue as agoing concern in order to provide returns for common shareholders, and to maintain an optimal capital structure toreduce the cost of capital. The company will seek attractive risk-adjusted returns, but will at all times seek downsideprotection and attempt to minimize the loss of capital. Total capital increased from $1,299,218 at December 31, 2016(comprised of the 2 year term loan and common shareholders’ equity) to $2,532,464 at December 31, 2017(comprised of the 1 year term loan and common shareholders’ equity), principally reflecting net proceeds receivedfrom the secondary Offerings and the 1 year term loan, and net earnings and other comprehensive income in 2017,partially offset by the repayment of the 2 year term loan.
On July 11, 2017 the company entered into an agreement with a Canadian bank for a 1 year secured term loan with aprincipal amount of $400,000 bearing interest at a rate of LIBOR plus 325 to 375 basis points. On July 13, 2017 thecompany used a portion of the net proceeds from the 1 year term loan to complete the additional 10.0% investmentin BIAL of $200,093 and participate in the NCML rights issue. The 1 year term loan includes a financial covenant thatrequires the company to maintain common shareholders’ equity of not less than $1.3 billion. At December 31, 2017the company was in compliance with the 1 year term loan financial covenant.
On January 13, 2017 the company completed an underwritten public offering and concurrent with the publicoffering, Fairfax and OMERS acquired additional subordinate voting shares resulting in net proceeds of $493,504.Net proceeds from the secondary Offerings were used to acquire additional Indian Investments, for general corporatepurposes, and to repay the 2 year term loan.
On September 16, 2016 the company entered into an agreement with a syndicate of Canadian banks for a 2 yearsecured term loan with a principal amount of $225,000. The 2 year term loan was repaid on March 31, 2017.
Common shareholders’ equity increased to $2,132,464 at December 31, 2017 from $1,075,446 at December 31, 2016primarily reflecting net proceeds received from the secondary Offerings ($493,504), net earnings ($452,509) andunrealized foreign currency translation gains ($110,910).
12. Related Party Transactions
Payable to Related Parties
The company’s payable to related parties was comprised as follows:
December 31, 2017 December 31, 2016
Performance fee 114,437 –Investment and advisory fees 8,293 3,611Other 96 62
122,826 3,673
Investment Advisory Agreement
The company and its subsidiaries have entered into an agreement with Fairfax and the Portfolio Advisor to provideadministration and investment advisory services to the company (the ‘‘Investment Advisory Agreement’’). Ascompensation for the provision of these services, the company pays an investment and advisory fee, and ifapplicable, a performance fee. Such fees are determined with reference to the company’s common shareholders’equity.
Performance Fee
The performance fee is accrued quarterly and paid for the first three-year period from January 30, 2015 toDecember 31, 2017 (the ‘‘first calculation period’’) and is calculated, on a cumulative basis, as 20% of any increase incommon shareholders’ equity per share (including distributions) above a 5% per annum increase. The amount ofcommon shareholders’ equity per share at any time which must be achieved before any performance fee would bepayable is sometimes referred to as the ‘‘hurdle per share’’. The company determined that a performance fee of$114,437 was payable at December 31, 2017 (December 31, 2016 – nil) as the book value per share of $15.24 (beforefactoring in the impact of the performance fee) at December 31, 2017 was greater than the hurdle per share of $11.36at that date.
51

FAIRFAX INDIA HOLDINGS CORPORATION
In 2017 the performance fee recorded in the consolidated statements of earnings was $112,218 (2016 – nil),representing the performance fee accrual translated at the average exchange rate for 2017.
Subsequent to December 31, 2017
On March 9, 2018 the company issued 7,663,685 subordinate voting shares to Fairfax calculated as the performancefee payable at December 31, 2017 of $114,437 divided by the VWAP of $14.93. Under the terms of the InvestmentAdvisory Agreement, settlement of the performance fee will take place in subordinate voting shares of the companyif the market price per share is less than two times the then book value per share. In accordance with the InvestmentAdvisory Agreement, the number of subordinate voting shares issued was calculated based on the VWAP of $14.93.The issuance of these subordinate voting shares increased Fairfax’s equity interest in Fairfax India from 30.2% atDecember 31, 2017 to 33.6%.
The period from January 1, 2018 to December 31, 2020 (the ‘‘second calculation period’’) will be the next consecutivethree-year period after December 31, 2017 for which a performance fee, if applicable, will be accrued quarterly. Theperformance fee for the second calculation period will be calculated as 20% of any increase in the book value pershare at the end of period (before factoring in the impact of the performance fee for the second calculation period)over the higher of: (i) the hurdle per share as described above; or, (ii) the then book value per share at the end of thefirst calculation period (December 31, 2017), adjusted to reflect the issuance of subordinate voting shares onMarch 9, 2018 to settle the first calculation period performance fee, referred to as the ‘‘high water mark per share’’.Under the Investment Advisory Agreement, the performance fee, if applicable, will be paid within 30 days after thecompany issues its annual audited consolidated financial statements for the year ended December 31, 2020, insubordinate voting shares of the company unless the market prices per share of those shares is more than two timesthe then book value per share, in which event Fairfax may elect to receive that fee in cash.
Investment and Advisory Fee
The investment and advisory fee is calculated and payable quarterly as 0.5% of the value of undeployed capital and1.5% of the company’s common shareholders’ equity less the value of undeployed capital. In 2017 the companydetermined that the majority of its assets were invested in Indian Investments, which are considered deployedcapital. In 2017 the investment and advisory fee recorded in the consolidated statements of earnings was $27,531(2016 – $12,552).
Management Compensation
Pursuant to the Investment Advisory Agreement, Fairfax is required to provide a Chief Executive Officer, a ChiefFinancial Officer and a Corporate Secretary to the company. For so long as the Investment Advisory Agreementremains in effect, all compensation payable to the Chief Executive Officer, the Chief Financial Officer, and theCorporate Secretary of the company will be borne by Fairfax.
Director Compensation
Compensation for the company’s Board of Directors for the years ended December 31 determined in accordance withthe company’s IFRS accounting policies was as follows:
2017 2016
Retainers and fees 150 150Share-based payments 122 133Other 50 50
322 333
Other
On February 8, 2017 the company acquired an additional 15,853,000 common shares of IIFL (representing a 4.99%equity interest) (see note 5).
On July 13, 2017 upon the company’s acquisition of the additional 10.0% equity interest in BIAL from GVK, Fairfax’sobligation on behalf of Fairfax India under the Put Option was terminated (see note 5).
52
13. Segment Reporting
A business segment is a group of assets and operations engaged in providing products or services that are subject torisks and returns that are different from those of other business segments. A geographical segment is engaged inproviding products or services within a particular economic environment that is subject to risks and returns, that aredifferent from those of segments operating in other economic environments.
The company has concluded that Fairfax India is engaged in a single geographic and business segment, that ofinvesting in India and Indian Investments.
14. General and Administration Expenses
General and administration expenses for the years ended December 31 were comprised as follows:
2017 2016
Audit, legal and tax professional fees 2,072 2,646Salaries and employee benefit expenses 888 737Administrative expenses 701 811Brokerage fees 36 153Other 469 590
4,166 4,937
15. Supplementary Cash Flow Information
Cash and cash equivalents were included in the consolidated balance sheets and statements of cash flows as follows:
December 31, 2017 December 31, 2016
Cash and balances with banks 13,244 20,019U.S. treasury bills – 126,941
13,244 146,960
Details of certain cash flows included in the consolidated statements of cash flows for the years ended December 31were as follows:
2017 2016
(a) Purchases of investments classified as FVTPLBonds (186,301) (299,642)Common stocks (626,183) (123,997)
(812,484) (423,639)
(b) Sales of investments classified as FVTPLBonds 51,933 280,960Common stocks 26,525 52,631
78,458 333,591
(c) Net interest and dividends receivedInterest received 20,796 31,803Dividends received 8,627 5,611Interest paid on term loans (10,871) (3,190)
18,552 34,224
(d) Income taxes received (paid) 7,019 (13,500)
53

FAIRFAX INDIA HOLDINGS CORPORATION
Index to Management’s Discussion and Analysis of Financial Condition and Results of Operations
Notes to Management’s Discussion and Analysis of Financial Condition and Results of Operations . . . . . . . 55Business Developments . . . . . . . . . . . . . . . . . . . . . . . . . . . . . . . . . . . . . . . . . . . . . . . . . . . . . . . . . . . 55
Overview . . . . . . . . . . . . . . . . . . . . . . . . . . . . . . . . . . . . . . . . . . . . . . . . . . . . . . . . . . . . . . . . . . . 55Capital Transactions . . . . . . . . . . . . . . . . . . . . . . . . . . . . . . . . . . . . . . . . . . . . . . . . . . . . . . . . . . . 55Operating Environment . . . . . . . . . . . . . . . . . . . . . . . . . . . . . . . . . . . . . . . . . . . . . . . . . . . . . . . . . 56
Business Objectives . . . . . . . . . . . . . . . . . . . . . . . . . . . . . . . . . . . . . . . . . . . . . . . . . . . . . . . . . . . . . . 57Investment Objective . . . . . . . . . . . . . . . . . . . . . . . . . . . . . . . . . . . . . . . . . . . . . . . . . . . . . . . . . . . 57Investment Strategy . . . . . . . . . . . . . . . . . . . . . . . . . . . . . . . . . . . . . . . . . . . . . . . . . . . . . . . . . . . . 57Investment Selection . . . . . . . . . . . . . . . . . . . . . . . . . . . . . . . . . . . . . . . . . . . . . . . . . . . . . . . . . . . 58Investment Restrictions . . . . . . . . . . . . . . . . . . . . . . . . . . . . . . . . . . . . . . . . . . . . . . . . . . . . . . . . . 58
Indian Investments . . . . . . . . . . . . . . . . . . . . . . . . . . . . . . . . . . . . . . . . . . . . . . . . . . . . . . . . . . . . . 59Cautionary Statement Regarding Financial Information of Significant Indian Investments . . . . . . . . . . . 59Summary of Indian Investments . . . . . . . . . . . . . . . . . . . . . . . . . . . . . . . . . . . . . . . . . . . . . . . . . . . 59Summary of Changes in the Fair Value of the Company’s Indian Investments . . . . . . . . . . . . . . . . . . . 60Public Indian Investments . . . . . . . . . . . . . . . . . . . . . . . . . . . . . . . . . . . . . . . . . . . . . . . . . . . . . . . 60Private Indian Investments . . . . . . . . . . . . . . . . . . . . . . . . . . . . . . . . . . . . . . . . . . . . . . . . . . . . . . . 66
Results of Operations . . . . . . . . . . . . . . . . . . . . . . . . . . . . . . . . . . . . . . . . . . . . . . . . . . . . . . . . . . . . 77Consolidated Balance Sheet Summary . . . . . . . . . . . . . . . . . . . . . . . . . . . . . . . . . . . . . . . . . . . . . . . . . 79Financial Risk Management . . . . . . . . . . . . . . . . . . . . . . . . . . . . . . . . . . . . . . . . . . . . . . . . . . . . . . . . 80
Capital Resources and Management . . . . . . . . . . . . . . . . . . . . . . . . . . . . . . . . . . . . . . . . . . . . . . . . . 80Book Value per Share . . . . . . . . . . . . . . . . . . . . . . . . . . . . . . . . . . . . . . . . . . . . . . . . . . . . . . . . . . . 81Liquidity . . . . . . . . . . . . . . . . . . . . . . . . . . . . . . . . . . . . . . . . . . . . . . . . . . . . . . . . . . . . . . . . . . . 82Contractual Obligations . . . . . . . . . . . . . . . . . . . . . . . . . . . . . . . . . . . . . . . . . . . . . . . . . . . . . . . . . 84
Related Party Transactions . . . . . . . . . . . . . . . . . . . . . . . . . . . . . . . . . . . . . . . . . . . . . . . . . . . . . . . . . 84Accounting and Disclosure Matters . . . . . . . . . . . . . . . . . . . . . . . . . . . . . . . . . . . . . . . . . . . . . . . . . . . 85
Management’s Evaluation of Disclosure Controls and Procedures . . . . . . . . . . . . . . . . . . . . . . . . . . . . 85Management’s Report on Internal Control Over Financial Reporting . . . . . . . . . . . . . . . . . . . . . . . . . . 85Critical Accounting Estimates and Judgments . . . . . . . . . . . . . . . . . . . . . . . . . . . . . . . . . . . . . . . . . . 85Significant Accounting Policy Changes . . . . . . . . . . . . . . . . . . . . . . . . . . . . . . . . . . . . . . . . . . . . . . . 86Future Accounting Changes . . . . . . . . . . . . . . . . . . . . . . . . . . . . . . . . . . . . . . . . . . . . . . . . . . . . . . 86
Risk Management . . . . . . . . . . . . . . . . . . . . . . . . . . . . . . . . . . . . . . . . . . . . . . . . . . . . . . . . . . . . . . . 86Overview . . . . . . . . . . . . . . . . . . . . . . . . . . . . . . . . . . . . . . . . . . . . . . . . . . . . . . . . . . . . . . . . . . . 86Risks . . . . . . . . . . . . . . . . . . . . . . . . . . . . . . . . . . . . . . . . . . . . . . . . . . . . . . . . . . . . . . . . . . . . . . 86
Other . . . . . . . . . . . . . . . . . . . . . . . . . . . . . . . . . . . . . . . . . . . . . . . . . . . . . . . . . . . . . . . . . . . . . . . 92Quarterly Data . . . . . . . . . . . . . . . . . . . . . . . . . . . . . . . . . . . . . . . . . . . . . . . . . . . . . . . . . . . . . . . 92Stock Prices and Share Information . . . . . . . . . . . . . . . . . . . . . . . . . . . . . . . . . . . . . . . . . . . . . . . . . 93Compliance with Corporate Governance Rules . . . . . . . . . . . . . . . . . . . . . . . . . . . . . . . . . . . . . . . . . 93Forward-Looking Statements . . . . . . . . . . . . . . . . . . . . . . . . . . . . . . . . . . . . . . . . . . . . . . . . . . . . . . 94
54

Management’s Discussion and Analysis of Financial Condition and Results of Operations(as of March 9, 2018)
(Figures and amounts are in US$ and $ thousands except share and per share amounts and as otherwise indicated. Figures maynot add due to rounding.)
Notes to Management’s Discussion and Analysis of Financial Condition and Results of Operations
(1) Readers of the Management’s Discussion and Analysis of Financial Condition and Results of Operations(‘‘MD&A’’) should review the entire Annual Report for additional commentary and information. Additionalinformation relating to the company, including its annual information form, can be found on SEDAR atwww.sedar.com. Additional information can also be accessed from the company’s website www.fairfaxindia.ca.
(2) Unless otherwise noted, consolidated financial information of the company within this MD&A is derivedfrom the consolidated financial statements of the company prepared in accordance with InternationalFinancial Reporting Standards (‘‘IFRS’’) as issued by the International Accounting Standards Board (‘‘IASB’’),and is presented in U.S. dollars with the Indian rupee as the functional currency of the company and itsconsolidated subsidiaries.
(3) The MD&A contains references to book value per share. On any date, book value per share is calculated ascommon shareholders’ equity at the end of the period, determined in accordance with IFRS, divided by thetotal number of common shares of the company outstanding on that date. Book value per share is a keyperformance measure of the company and is closely monitored as it is used to calculate the performance feepayable, if any, to Fairfax Financial Holdings Limited (‘‘Fairfax’’).
Business Developments
Overview
In late 2014, Fairfax took the initiative in creating the company and is Fairfax India’s ultimate parent and acts as itsadministrator. Fairfax is a holding company which, through its subsidiaries, is principally engaged in property andcasualty insurance and reinsurance and the associated investment management. Fairfax is a Canadian reportingissuer with securities listed on the Toronto Stock Exchange (‘‘TSX’’) and trading in Canadian dollars under thesymbol FFH for over 30 years and in U.S. dollars under the symbol FFH.U. On January 30, 2015, upon completion ofthe company’s initial public offering, the company’s subordinate voting shares commenced trading on the TSXunder the symbol FIH.U.
Hamblin Watsa Investment Counsel Ltd. (the ‘‘Portfolio Advisor’’), a wholly-owned subsidiary of Fairfax andregistered portfolio manager in the province of Ontario, is the portfolio advisor of the company and its consolidatedsubsidiaries, responsible to source and advise with respect to all investments.
The following narrative sets out the company’s key business developments in 2017 and 2016.
Capital Transactions
On January 13, 2017 the company completed an underwritten public offering of 12,766,000 subordinate votingshares at a price of $11.75 per share. Concurrent with the public offering, Fairfax and Ontario Municipal EmployeesRetirement System (‘‘OMERS’’) acquired 12,766,000 and 17,021,500 subordinate voting shares, respectively, at aprice of $11.75 per subordinate voting share in a private placement (the ‘‘Concurrent Private Placement’’ and,together with the public offering, collectively the ‘‘secondary Offerings’’), resulting in net proceeds of $493,504, aftercommissions and expenses of $6,500. Net proceeds from the secondary Offerings were used to acquire additionalIndian Investments, as defined in the Business Objectives section of this MD&A, for general corporate purposes, andto repay the 2 year secured term loan with a principal amount of $225,000 (the ‘‘2 year term loan’’).
On July 11, 2017 the company entered into an agreement with a Canadian bank for a 1 year secured term loan with aprincipal amount of $400,000 bearing interest at a rate of LIBOR plus 325 to 375 basis points (the ‘‘1 year term loan’’).On July 13, 2017 the company used a portion of the net proceeds from the 1 year term loan to complete theadditional 10.0% investment in BIAL of $200,093 and participate in the NCML rights issue.
On September 16, 2016 the company entered into an agreement with a syndicate of Canadian banks for the 2 yearterm loan. The 2 year term loan was repaid on March 31, 2017.
55

FAIRFAX INDIA HOLDINGS CORPORATION
For additional details on the term loans refer to note 7 (Term Loans) to the consolidated financial statements for theyear ended December 31, 2017.
Indian Investments
Full descriptions of the Indian Investments committed to subsequent to December 31, 2017 and, acquired in 2017and 2016 are provided in the Indian Investments section of this MD&A.
Operating Environment
Overview
India has emerged as the fastest growing major economy in the world according to the Central StatisticsOrganization and the International Monetary Fund. According to the International Monetary Fund, the Indianeconomy will continue to grow more than 7% in the financial year 2018-19. The improvement in India’s economicfundamentals has accelerated in the recent years with the combined impact of strong government reforms and theReserve Bank of India’s (‘‘RBI’’) inflation focus supported by favourable global commodity prices.
Government Initiatives
Numerous foreign companies are setting up their facilities in India on account of various government initiatives like‘‘Make in India’’ and ‘‘Digital India’’. Mr. Narendra Modi, Prime Minister of India, has launched the Make in Indiainitiative with an aim to boost the manufacturing sector of the Indian economy. This initiative is expected toincrease the purchasing power of an average Indian consumer, which would further boost demand, and hence spurdevelopment, in addition to benefiting investors. Currently, the manufacturing sector contributes over 16% ofIndia’s GDP. The Government of India, under the Make in India initiative, is providing incentives across varioussectors to achieve a higher percentage of GDP from the manufacturing sector. The Digital India initiative focuses onthree core components: creation of digital infrastructure, delivering services digitally and increasing digital literacy.
Goods and Services Tax
On July 1, 2017 the Government of India implemented the Goods and Services Tax (‘‘GST’’) which replaced multipletaxes levied by the Central and State Governments of India. Under the GST, goods and services are taxed at ratesranging from 0% to 28%. The GST is considered to be transformational for the Indian economy in the medium tolong term, simplifying an indirect tax structure, unifying all states into a single tax market, broadening the tax baseand increasing the potential growth rate of the Indian economy. The impact of the implementation of the GST onthe company’s Indian Investments is discussed, if applicable to a particular Indian Investment, in the IndianInvestments section of this MD&A.
Union Budget for Fiscal Year 2018-19
On February 1, 2018 the Government of India released its Union Budget proposals for fiscal year 2018-19(the ‘‘Budget’’). The Budget proposes to repeal, with effect from April 1, 2018, the long term capital gains taxexemption in India that is available in respect of certain transfers of listed equity shares of Indian companies onwhich Securities Transaction Tax is paid at the time of acquisition and transfer of such shares. Long term capital gainsrealized on such transfers are generally proposed to be taxed at a rate of 10.0%. However, grandfathering of the longterm capital gains exemption in respect of any accrued gain on such shares held as of January 31, 2018 will generallybe available to the extent of the accrued gain as of January 31, 2018. Capital gains realized by a tax resident ofMauritius on a transfer of equity shares of an Indian company which were acquired prior to April 1, 2017 willcontinue to be exempt from capital gains tax in India by virtue of the India-Mauritius tax treaty, notwithstanding therepeal of the long term capital gains tax exemption under Indian domestic law. In addition, a long term capital gainrealized by a Mauritius tax resident on shares acquired after April 1, 2017, and sold prior to March 31, 2019, willcontinue to be taxed at the rate of 50.0% of the prevailing domestic Indian capital gains tax rate by virtue of theIndia-Mauritius tax treaty. The company is currently evaluating the potential impact of the Budget and the potentialapplication of capital gains tax in India on any future dispositions of investments in equity shares held by FIHMauritius Investments Ltd (‘‘FIH Mauritius’’), a wholly-owned subsidiary of the company.
56

Demonetization
On November 8, 2016 the Government of India announced the demonetization of all Indian rupee 500(approximately $7.50) and 1,000 (approximately $15) banknotes. The Government of India claimed that the actionwould curtail the shadow economy and suppress the use of illicit and counterfeit cash to fund illegal activity andterrorism. The sudden nature of the announcement and the prolonged cash shortages in the weeks that followed,created significant disruption throughout the economy, threatening economic output. The action was considered tohave reduced India’s GDP and industrial production over the short term but these effects have disappeared in 2017 asthe currency circulation normalized. The impact of demonetization on the company’s Indian Investments isdiscussed, if applicable, in the respective Indian Investments section of this MD&A.
Business Objectives
Investment Objective
Fairfax India is an investment holding company whose objective is to achieve long term capital appreciation, whilepreserving capital, by investing in public and private equity securities and debt instruments in India and Indianbusinesses or other businesses with customers, suppliers or business primarily conducted in, or dependent on, India(‘‘Indian Investments’’). The company makes all or substantially all of its investments either directly or through oneof its wholly-owned subsidiaries, FIH Mauritius and FIH Private Investments Ltd (‘‘FIH Private’’).
Investment Strategy
The company invests in businesses that are expected to benefit from India’s pro-business political environment, itsgrowing middle class and its demographic trends that are likely to underpin strong growth for several years. Sectorsof the Indian economy that the company believes will benefit most from such trends include infrastructure,financial institutions, consumer services, retail and exports. The company is not limited to investing solely in thesesectors and intends to invest in other sectors as and when opportunities arise.
The company utilizes, and expects to benefit significantly from, the experience and expertise of Fairfax and thePortfolio Advisor.
The company employs a conservative, fundamental value-based approach to identifying and investing in highquality public and private Indian businesses. This approach is designed to compound book value per share over thelong term. The company will seek attractive risk-adjusted returns, but will at all times seek downside protection andattempt to minimize the loss of capital.
The company intends to make Indian Investments with a view to be a strategic partner to grow the business and as aresult optimize investment returns for the shareholders of Fairfax India. The level and nature of this strategicrelationship will vary by investment. It may include one or more of the following, as deemed appropriate by thecompany: (i) board appointment or nomination rights; (ii) board observer rights; (iii) input on managementselection; (iv) the provision of managerial assistance; and (v) ongoing monitoring and cooperation with the boardand management of the portfolio business to ensure that its strategy is being implemented in a manner that isconsistent with the investment objectives of the company and with the company’s and Fairfax’s fundamental values(as set forth in Fairfax’s guiding principles which are included in Fairfax’s publicly available annual reports).
Fairfax India’s involvement with the Indian Investments may include providing specialized guidance or expertise inlimited circumstances or on a temporary basis and does not extend to any involvement in the day-to-day operationsof those Indian Investments. Activities are expected to be ancillary and undertaken to maximize returns frominvestments. Board representation is sought only to maintain protective rights and to maximize the value of thecompany’s investment for its shareholders.
The company may from time to time seek to realize on any of its Indian Investments. The circumstances under whichthe company may sell some or all of its investments include: (i) where the company believes that the IndianInvestments are fully valued or that the original investment thesis has played out; or (ii) where the company hasidentified other investment opportunities which it believes present more attractive risk-adjusted returnopportunities and additional capital is needed to make such alternative investments.
The company would exit its private Indian Investments either through initial public offerings or private sales. Forpublicly traded Indian Investments, exit strategies may include selling the investments through private placementsor in public markets.
57

FAIRFAX INDIA HOLDINGS CORPORATION
Investment Selection
To identify potential investments, the company principally relies on the expertise of the Portfolio Advisor andits affiliates.
The following is an illustrative list of criteria that the company and the Portfolio Advisor believe to be paramountwhen identifying and investing in Indian Investments:
Attractive valuation – The company’s conservative fundamental value approach leads it to focus on businesses thathave positive, stable cash flows that can be purchased at discounted multiples. The company does not invest instart-up businesses or businesses that have speculative business plans.
Experienced and aligned management – The company focuses on businesses with experienced, entrepreneurialmanagement teams with strong, long term track records. The company generally requires the portfolio businesses tohave in place, either prior to or immediately following investment by the company, proper incentives to drive thebusinesses’ profitability.
Strong competitive position in industry – The company seeks to invest in businesses that hold leading market positions,possess strong brand power and are well-positioned to capitalize on the growth opportunities in the Indian economy.The company also seeks to invest in businesses that demonstrate significant competitive advantages as compared totheir peers and that position them to protect their market position and profitability.
Alignment of the management team with the values of the company – The company, Fairfax and the Portfolio Advisor allseek to adhere to the highest standards of business practices and ethics. The company requires that the managementteams at each of its portfolio businesses adhere to a similar standard of business practices and ethics and adhere to thecompany’s fundamental values, as described above.
The Portfolio Advisor and its affiliates conduct thorough due diligence investigations when evaluating any IndianInvestment prior to a recommendation to the company and its subsidiaries to make the investment. This generallyincludes consultations with Fairfax’s network of current and former management teams, consultants, competitors,investment bankers and senior executives to assess, among other things, the industry dynamics, the character of themanagement team and the viability of the business plan.
More specifically, due diligence in respect of a particular investment opportunity typically includes, among otheritems as deemed necessary from time to time: (i) review of historical and projected financial information; (ii) on-sitevisits; (iii) interviews with management, employees, customers and vendors; (iv) review of material agreements;(v) background checks; and (vi) research relating to the businesses’ management, industry, markets, products andservices, and competitors.
Investment Restrictions
The company will not make an Indian Investment if, after giving effect to such investment, the total investedamount of such investment would exceed 20.0% of the company’s total assets; provided, however, that the companyis permitted to complete up to two Indian Investments where, after giving effect to each such investment, the totalinvested amount of each such investment would be less than or equal to 25.0% of the company’s total assets(the ‘‘Investment Concentration Restriction’’). The company’s Investment Concentration Restriction increased atDecember 31, 2017 from December 31, 2016 principally as a result of net proceeds received from the secondaryOfferings (see note 8 (Common Shareholders’ Equity) to the consolidated financial statements for the year endedDecember 31, 2017), net change in unrealized gains on investments and other costs (primarily related to thecompany’s Public Indian Investments) recorded in the consolidated statements of earnings in 2017, and net proceedsreceived from the 1 year term loan, partially offset by the repayment of the 2 year term loan (see note 7 (Term Loans)to the consolidated financial statements for the year ended December 31, 2017). Indian Investments may befinanced through equity or debt offerings as part of the company’s objective to reduce its cost of capital and providereturns to common shareholders.
The company intends to make multiple different investments as part of its prudent investment strategy. AtDecember 31, 2017 the company determined that it was in compliance with the Investment ConcentrationRestriction.
58

Indian Investments
Cautionary Statement Regarding Financial Information of Significant Indian Investments
Fairfax India has agreed to voluntarily provide within the MD&A, summarized financial information prepared inaccordance with IFRS for all of its Indian Investments for which it had previously filed a business acquisition reportin accordance with section 8.2 of National Instrument 51-102 Continuous Disclosure Obligations. National CollateralManagement Services Limited, IIFL Holdings Limited, Sanmar Chemicals Group and Bangalore International AirportLimited (collectively, ‘‘Significant Indian Investments’’), the company’s Significant Indian Investments for which ithad previously filed business acquisition reports, previously prepared their financial statements in accordance withIndian Generally Accepted Accounting Principles (‘‘Indian GAAP’’). Effective April 1, 2017 the company’s SignificantIndian Investments have adopted Indian Accounting Standards (‘‘Ind AS’’). Ind AS are based on and substantiallyconverged with IFRS as issued by the IASB. Fairfax India is limited with respect to the amount of independentverification it is able to perform on the Significant Indian Investments’ financial statements. The unauditedsummarized financial information contained in this MD&A was prepared exclusively for Fairfax India. Suchunaudited financial information is the responsibility of the respective managements and has been prepared by themusing recognition, measurement and presentation principles consistent with IFRS as issued by the IASB, andprovided to the company in Indian rupees.
The company’s Significant Indian Investments’ fiscal year ends on March 31. Summarized financial information ofthe company’s Significant Indian Investments has generally been provided for the periods subsequent to thecompany’s investment and to the extent that the most recent interim financial information is available to thecompany’s management.
Significant Indian Investments’ summarized financial information should be read in conjunction with FairfaxIndia’s historical consolidated financial statements including the notes thereto and the related MD&A as well asFairfax India’s other public filings.
Fairfax India has no knowledge that would indicate that the Significant Indian Investments’ summarized financialinformation contained herein requires material modifications. However, readers are cautioned that the SignificantIndian Investments’ summarized financial information contained in the MD&A may not be appropriate fortheir purposes.
Summary of Indian Investments
The table below provides a summary of the company’s Indian Investments:
December 31, 2017 December 31, 2016
Fair value at Fair value atOwnership December 31, Net Ownership December 31, Net
Date Acquired % Cost 2017 change % Cost 2016 change
Public Indian Investments:IIFL(1) December 2015 and February 2017 26.6% 256,976 888,485 631,509 21.7% 201,559 265,951 64,392Fairchem(2) February and August 2016 48.8% 74,384 149,200 74,816 44.9% 74,384 99,803 25,4195paisa(1) October 2017 26.6% 19,758 19,958 200 – – – –
351,118 1,057,643 706,525 275,943 365,754 89,811
Private Indian Investments:BIAL(3) March and July 2017 48.0% 585,591 608,288 22,697 – – – –NCML August 2015 and August 2017 89.5% 174,318 179,054 4,736 88.1% 148,716 146,586 (2,130)Sanmar April 2016 30.0% 1,000 556 (444) 30.0% 1,000 440 (560)Sanmar Bonds April and September 2016 – 299,000 333,172 34,172 – 299,000 299,093 93Saurashtra February 2017 51.0% 30,018 28,000 (2,018) – – – –NSE July 2016 1.0% 26,783 40,452 13,669 1.0% 26,783 26,504 (279)
1,116,710 1,189,522 72,812 475,499 472,623 (2,876)
1,467,828 2,247,165 779,337 751,442 838,377 86,935
(1) On October 20, 2017 IIFL spun-off its wholly-owned subsidiary 5Paisa Digital Undertaking through the formation of a new publiccompany, 5paisa Capital Limited (‘‘5paisa’’). The spin-off of 5paisa from IIFL resulted in the reallocation of the fair value of 5paisa out ofthe cost of IIFL to form the initial cost of 5paisa.
(2) Effective March 14, 2017 the company’s original investments in Fairchem and Privi merged to form Fairchem Speciality Limited. In 2016for comparative purposes Privi has been presented with Fairchem.
(3) Cost and net change includes $74,202 (approximately 4.8 billion Indian rupees) of cash consideration paid attributable to the costsincurred to acquire the additional 10.0% in BIAL.
59
FAIRFAX INDIA HOLDINGS CORPORATION
Summary of Changes in the Fair Value of the Company’s Indian Investments
A summary of changes in the fair value of the company’s Public and Private Indian Investments during 2017 and2016 were as follows:
Public Indian Investments Private Indian Investments
TotalCommon stocks Bonds Common stocksIndian
IIFL Fairchem 5paisa Total Sanmar BIAL NCML Sanmar Saurashtra NSE Privi Total Investments
Balance as of January 1, 2017 265,951 45,488 – 311,439 299,093 – 146,586 440 – 26,504 54,315 526,938 838,377
Purchases 75,175 – – 75,175 – 585,591(1) 25,602 – 30,018 – – 641,211 716,386
Transfer due to Merger(2) / Spin-off(3) (19,758) 54,315 19,758 54,315 – – – – – – (54,315) (54,315) –
Net change in unrealized gains (losses)on investments and other costs 536,121 42,241 (195) 578,167 14,843 10,902(1) (2,298) 86 (3,423) 12,032 – 32,142 610,309
Net unrealized foreign currencytranslation gains 30,996 7,156 395 38,547 19,236 11,795 9,164 30 1,405 1,916 – 43,546 82,093
Balance as of December 31, 2017 888,485 149,200 19,958 1,057,643 333,172 608,288 179,054 556 28,000 40,452 – 1,189,522 2,247,165
Balance as of January 1, 2016 220,747 – – 220,747 – – 146,445 – – – – 146,445 367,192
Purchases – 19,409 – 19,409 299,000 – – 1,000 – 26,783 54,975 381,758 401,167
Net change in unrealized gains (losses)on investments 51,305 26,399 – 77,704 6,907 – 3,879 (545) – – – 10,241 87,945
Net unrealized foreign currencytranslation losses (6,101) (320) – (6,421) (6,814) – (3,738) (15) – (279) (660) (11,506) (17,927)
Balance as of December 31, 2016 265,951 45,488 – 311,439 299,093 – 146,586 440 – 26,504 54,315 526,938 838,377
(1) On July 13, 2017 the company acquired an additional 10.0% equity interest in BIAL for cash consideration of $200,093 (12.9 billionIndian rupees) which the company determined included $74,202 (approximately 4.8 billion Indian rupees) of consideration in excess ofthe fair value of those additional shares acquired. The excess cash consideration paid was attributable to the costs incurred and includedin the table above in purchases, and was recorded in net change in unrealized gains on investments and other costs included in theconsolidated statement of earnings. For additional details, see note 5 (Indian Investments) to the consolidated financial statements for theyear ended December 31, 2017.
(2) The merger of Fairchem and Privi resulted in the reallocation of the investment in Privi from Private Indian Investments to the PublicIndian Investment in Fairchem.
(3) The spin-off of 5paisa from IIFL resulted in the reallocation of the fair value of 5paisa out of the cost of IIFL to form the initial costof 5paisa.
Public Indian Investments
The fair values of Fairfax India’s Public Indian Investments, whose shares are listed on both the BSE (formerly knownas Bombay Stock Exchange Limited) and the National Stock Exchange of India (‘‘NSE of India’’), are determinedusing the bid prices of those investments (without adjustments or discounts) at the balance sheet date.
IIFL Holdings Limited
Business Overview
IIFL Holdings Limited (‘‘IIFL’’) was incorporated in 1995 and is a publicly traded, diversified financial servicesholding company located in Mumbai, India with principal lines of business in wealth management, capital marketsand other activities (comprised of retail investment brokerage, institutional equities, investment banking andfinancial products distribution) and a non-banking finance company. IIFL serves over 4 million customers from2,500 service locations and over 1,300 branches across India. It also has an international presence, with offices inToronto, New York, London, Geneva, Singapore, Hong Kong, Dubai and Mauritius.
IIFL’s principal lines of business are as follows:
Non-Banking Finance Company
IIFL’s non-banking finance company (‘‘NBFC’’) and housing finance company are diversified financing companies,offering loans secured against collaterals of home, property, gold, commercial vehicles, shares and other securities aswell as offering loans to small and medium sized businesses. At December 31, 2017 IIFL’s NBFC managed assets worthapproximately $4 billion (273 billion Indian rupees) (December 31, 2016 – approximately $3 billion (211 billionIndian rupees)) where home and property loans, and construction and real estate loans represented approximately47% and 14%, respectively, of the managed assets. The housing financing company offers home loans in theaffordable housing segment and focuses on mortgage loans to small and medium sized businesses.
60

Wealth Management
Wealth management is the fastest growing line of business of IIFL and is one of the leading wealth managers in India.At December 31, 2017 IIFL’s wealth management division was one of the top ten mutual fund distributors in Indiawith approximately $20 billion (1,282 billion Indian rupees) (December 31, 2016 – approximately $16 billion(1,070 billion Indian rupees)) of assets under advice, distribution and management. This division was a pioneer inlaunching alternate investment funds across equity, real estate and high yield debt. The division’s strong growth isdriven by all of its varied business segments: distribution services, asset management, credit, advisory and wealthstructuring solutions. It has created a niche by providing unique solutions for its clients in the areas of successionplanning, asset protection and administration services. In February 2016 IIFL launched Wealth NBFC that primarilyoffers loans to high net worth clientele secured by investment securities as loan collateral. At December 31, 2017IIFL’s Wealth NBFC had a loan book of approximately $916,000 (58 billion Indian rupees) (December 31, 2016 –approximately $430,000 (29 billion Indian rupees)).
Capital Markets and Other Activities
IIFL is a leading online and offline investment brokerage and financial advisory services provider to retail andinstitutional clients and is well known for high quality research in India.
IIFL is one of the largest non-bank retail investment brokerage houses in India offering trading and advisory servicesto retail clients through its website, mobile application and branch network. Over the past two decades, IIFL hascreated a brand, powered by informed research and cutting-edge technology, extensive footprint, high servicestandards and competitive brokerage. IIFL also offers currency and commodities brokerage and the distribution offinancial service products such as mutual funds and life insurance to retail clients.
Additional information can be accessed from IIFL’s website www.iifl.com.
Transaction Description
On December 1, 2015 Fairfax India acquired 68,788,445 common shares of IIFL (representing a 21.9% equityinterest) for $2.93 per share (195 Indian rupees per share) for cash consideration of $201,559 (approximately13.4 billion Indian rupees).
Prior to the formation of Fairfax India, Fairfax, through its subsidiaries, had acquired an 8.9% equity interest and anadditional 5.2% economic interest in IIFL through derivative financial instruments.
On February 8, 2017 Fairfax India acquired an additional 15,853,000 common shares of IIFL (representing a 4.99%equity interest) for cash consideration of $75,175 (approximately 5.1 billion Indian rupees). In connection with theFairfax India transaction, Fairfax, through its subsidiaries, partially disposed of the derivative financial instrumentsrepresenting an economic interest of 4.99% in IIFL. In accordance with regulations of the Securities and ExchangeBoard of India (‘‘SEBI’’) and the NSE of India, the transaction was subject to certain sale and purchase pricingguidelines and, as a result, the total consideration paid per share approximated fair market value of the equityinterest acquired.
On October 20, 2017 IIFL spun-off its wholly-owned subsidiary 5Paisa Digital Undertaking through the formation ofa new public company, 5paisa in a non-cash transaction. The distribution of 5paisa to IIFL shareholders wascharacterized as a return of capital which resulted in Fairfax India recording the initial cost of its investment in 5paisaat its fair value of $19,758 with a corresponding amount recorded as a reduction of the cost of its investment in IIFL.Additional details on the 5paisa spin-off transaction are disclosed under the sub-heading 5paisa Capital Limitedwithin the Public Indian Investments section of this MD&A.
Fairfax India and Fairfax agreed to limit their voting rights on IIFL shareholder resolutions to 25% of the issued andoutstanding common shares of IIFL at the time of voting, even in circumstances when their actual voting rights mayexceed 25%. Refer to note 5 (Indian Investments) to the consolidated financial statements for the year endedDecember 31, 2017 for additional details.
At December 31, 2017 the company held an aggregate of 84,641,445 common shares of IIFL representing a 26.6%equity interest (December 31, 2016 – 21.7%).
Fairfax had made an investment in IIFL prior to any investment by the company and in that capacity was able torecommend the appointment of one board representative out of the eight-member board of directors. At
61

FAIRFAX INDIA HOLDINGS CORPORATION
December 31, 2017 the company did not have any representation on the board of IIFL other than the board memberappointed by Fairfax.
Key Business Drivers, Events and Risks
IIFL’s key business drivers relate to its ability to grow and penetrate the financial services industry in India,particularly in the areas of lending and wealth management.
The demonetization of the Indian rupee in November 2016 had a negative impact on IIFL’s revenues in the shortterm. Following the announcement of the demonetization, IIFL experienced an initial slowdown in thedisbursement of gold loans, commercial vehicle financing, and home loans in its NBFC. However, IIFL’s continuousfocus on the digitization of its platforms enabled it to benefit from demonetization with its ability to accept cashlesspayments from customers, collections through tablets and a self-help portal for quick issue resolution. IIFL’s NBFCexperienced a significant increase in the number of mobile banking and website users in November andDecember 2016. Commencing in January 2017, IIFL experienced improvements across all its lines of business. IIFL’scapital markets and wealth management lines of business were not significantly impacted by demonetization.
Prior to the implementation of the GST on July 1, 2017, a tax of 15% was levied on services provided by IIFL to itscustomers. That tax was replaced by the GST of 18% for financial service transactions. The implementation of theGST has had a positive impact on IIFL as they are now able to claim the full input tax credit for GST paidon purchases.
Subsequent to December 31, 2017
On January 31, 2018 IIFL’s board of directors approved a draft plan to reorganize IIFL into three listed entities(the ‘‘reorganization’’) consisting of IIFL Finance (currently known as IIFL Holdings Limited comprised of the loansand mortgages businesses), IIFL Wealth (comprised of the wealth, asset management and alternative investmentfund businesses) and IIFL Securities (comprised of all other IIFL businesses including investment brokerage,distribution and investment banking). Shares of IIFL Finance, IIFL Wealth and IIFL Securities will be traded on theBSE and NSE of India as listed public companies. Shareholders of IIFL will receive seven common shares of IIFLSecurities and one common share of IIFL Wealth for every seven IIFL shares held. Completion of the reorganization isanticipated in late 2018 or early 2019, subject to customary closing conditions and applicable regulatory approvals.
Valuation and Consolidated Financial Statement Impact
At December 31, 2017 the fair value of the company’s investment in IIFL was $888,485 (December 31, 2016 –$265,951) with the change in fair value in 2017 and 2016 presented in the table at the outset of the IndianInvestments section of this MD&A. IIFL’s share price increased by 155.3% from 262.40 Indian rupees per share atDecember 31, 2016 to 670.00 Indian rupees per share at December 31, 2017 with the increase appearing to reflect therobust performance in all three lines of businesses, led by its NBFC and wealth management lines of businesses.
In 2017 the consolidated statements of earnings included dividend income earned from the investment in IIFL of$4,625 (2016 – $4,352).
IIFL’s Summarized Financial Information
The company’s fiscal year ends on December 31 and IIFL’s fiscal year ends on March 31. Summarized below are IIFL’sbalance sheets at September 30, 2017 and March 31, 2017.
Balance Sheets(unaudited – US$ thousands)
September 30, 2017(1) March 31, 2017(1)
Current assets 2,028,075 2,824,628Non-current assets 4,339,898 2,422,752Current liabilities 3,144,825 2,332,577Non-current liabilities 2,274,640 2,039,377Shareholders’ equity 948,508 875,426
(1) The net assets of IIFL were translated at September 30, 2017 at $1 U.S. dollar = 65.32 Indian rupees and at March 31, 2017 at $1U.S. dollar = 64.94 Indian rupees. The exchange rates used were the spot rates prevailing on those respective dates.
62

Current assets decreased primarily due to decreased trade and other receivables and other current assets. Non-currentassets increased as a result of the growth in IIFL’s NBFC line of business reflecting increased home loans, loans againstproperty and construction and real estate loans.
Current liabilities increased primarily due to an increase in short term interest bearing loans and borrowings tosupport the growth in the NBFC line of business. Non-current liabilities increased primarily due to an increase inother long term financial liabilities.
Summarized below are IIFL’s statements of earnings for the six months ended September 30, 2017 and 2016.
Statements of Earnings(unaudited – US$ thousands)
Six months ended Six months endedSeptember 30, 2017(1) September 30, 2016(1)
Revenue 494,348 333,009Earnings before income taxes 119,577 77,587Net earnings 84,454 52,260
(1) Amounts for the six months ended September 30, 2017 and 2016 were translated into US$ using the average exchange rates of $1U.S. dollar = 64.38 Indian rupees and $1 U.S. dollar = 66.93 Indian rupees prevailing during those periods.
IIFL’s revenue and net earnings increased primarily due to growth in IIFL’s NBFC line of business reflecting increasedhome loans, loans against property and construction and real estate loans. The wealth management and capitalmarkets lines of business have also contributed to the growth in revenue. IIFL’s management continues to focus onreducing operating costs to achieve better economies of scale and leveraging existing infrastructure to offercomplementary products across multiple line of business.
Fairchem Speciality Limited
Business Overview
On March 14, 2017 Fairchem Speciality Limited (‘‘Fairchem’’, formerly known as Adi Finechem Limited) and PriviOrganics Limited (‘‘Privi’’) were merged with the surviving entity continuing as Fairchem (the ‘‘Merger’’) and with nochanges to management of the underlying companies. The Merger should improve diversification and increasesynergies between the two companies.
Fairchem
Fairchem was incorporated in 1985 and publicly listed its shares on the BSE in 1995 and NSE of India in 2015.Fairchem is a specialty chemical manufacturer located in Ahmedabad, India. Fairchem manufactures oleochemicalsused in the paints, inks and adhesives industries, as well as intermediate nutraceutical and health products. It hasdeveloped an in-house technology that uses machinery designed and manufactured by leading European companiesto physically separate and convert waste generated during the production of soya, sunflower, corn and cotton oilsinto valuable nutraceutical and fatty acids.
Privi
Privi, founded in 1992, is a supplier of aroma chemicals to the fragrance industry and is located in Mumbai, India.Privi’s world-class products are the result of its very strong research and development team that has proven expertisein developing new products, customizing aromas per customer specifications, scaling up products from basicresearch to commercial scale, and designing process improvements to drive quality and cost optimization.
Additional information can be accessed from Fairchem’s and Privi’s websites www.fairchem.in and www.privi.com.
Transaction Description
On February 8, 2016 Fairfax India acquired a 44.7% equity interest in Fairchem for $3.13 per share (212 Indian rupeesper share) for cash consideration of $19,409 (approximately 1.3 billion Indian rupees).
On August 26, 2016 Fairfax India acquired a 50.8% equity interest in Privi for cash consideration of $54,975(approximately 3.7 billion Indian rupees).
63

FAIRFAX INDIA HOLDINGS CORPORATION
On March 14, 2017 Fairchem and Privi completed the Merger. Under the terms of the Merger, Privi shareholdersreceived 27 common shares and 27 compulsorily convertible preference shares (‘‘CCPS’’) of Fairchem for every40 Privi shares exchanged. Concurrent with the Merger, 88.5% of the CCPS received by the Privi shareholders wereconverted into common shares of Fairchem. At December 31, 2017 the company held 18,307,318 common sharesand 738,760 CCPS representing a 48.8% equity interest in Fairchem on a fully diluted basis (or a 48.7% equityinterest excluding the impact of the CCPS).
At December 31, 2017 the company had appointed two of the twelve Fairchem board members.
Key Business Drivers, Events and Risks
Fairchem’s key business drivers relate to the success of its oleochemicals business and vertical integration into valueadded products, such as fatty alcohols and natural vitamin E. As environmental concerns increase, the demand forsustainable and biodegradable oleochemicals used in lubricants, paper printing, paints and coatings, and animalsfeed industries has been experiencing strong growth in recent years.
India is the one of the largest consumers of soft oils which provides Fairchem with a competitive advantage byhaving easy access to the raw materials that it uses in its manufacturing processes. The close proximity to rawmaterials available in Asia (India, Malaysia and Indonesia) has resulted in a shift of oleochemical production awayfrom the U.S. and Europe. Lower cost of raw materials and efficient manufacturing processes have provided Fairchemwith certain competitive advantages in comparison to its global peers. Fairchem has a strong market presence forsome of its products, with little or no direct competition, and is considered to produce a superior quality product incomparison to its competitors in China. Fairchem faces some exposure to limited availability of raw materials(primarily soya oils) which are used in its manufacturing processes which may impact its ability to meethigher demand.
Privi’s key business drivers relate to its ability to: (i) develop, manufacture and supply additional (newer) aromachemicals to existing customers; (ii) create value added products from the by-products of manufacturing aromachemicals; and (iii) strengthen margins by increasing vertical integration capacities.
The merger of Fairchem and Privi has resulted in the following advantages: access to greater breadth in research anddevelopment, range of applications, scope for growth and business networks; stability and enhancement in netearnings and cash flows; operational effectiveness and cost optimization; improved allocation of capital; and broaderaccess to capital markets.
The implementation of the GST on July 1, 2017 has had a positive impact on Fairchem as they are now able to claimthe full input tax credit for GST paid on purchases. In certain cases where historical purchases of raw materials weremade on a tax-exempt basis, Privi is now required to make the GST payment prior to claiming the input tax credit,potentially resulting in additional financing costs for the upfront cash flows required. The implementation of theGST has had a nominal impact on Fairchem’s customers as the tax levied previously was at approximately the samerate of 18% applicable under the GST.
Valuation and Consolidated Financial Statement Impact
At December 31, 2017 the fair value of the company’s investment in the merged entity Fairchem was $149,200,comprised of common shares ($143,413) and CCPS ($5,787), with the change in fair value in 2017 and 2016presented in the table at the outset of the Indian Investments section of this MD&A. While Fairchem’s share priceremained relatively stable, with a modest 0.4% increase to 500.00 Indian rupees per share at December 31, 2017 from498.10 Indian rupees per share at December 31, 2016, the increase in fair value of the company’s investment inFairchem was primarily attributable to the change in valuation techniques for the company’s investment in Privi. AtDecember 31, 2017 the company’s investment in Privi was determined by multiplying the bid price of the publiclytraded Fairchem shares by the number of common shares and CCPS received in the Merger relating to the Privi sharesexchanged compared to December 31, 2016 where Privi’s initial transaction price was determined to approximatefair value.
At December 31, 2016, prior to giving effect to the Merger, the fair value of the company’s investment in Fairchemand Privi was $45,488 (determined using the bid price of the shares) and $54,315 (determined using the initialtransaction price) respectively. Privi’s initial transaction price approximated fair value at December 31, 2016 as therewere no significant changes to its business, capital structure or operating environment and there were no significant
64

changes to any key assumptions in the company’s acquisition valuation model for Privi due to the proximity of theclosing date of the transaction to December 31, 2016.
In 2017 the company’s consolidated statements of earnings included dividend income earned from the company’sinvestment in Fairchem of $281 (2016 – $231).
5paisa Capital Limited
Business Overview
5paisa Capital Limited (‘‘5paisa’’) is a publicly traded online financial services provider with a do-it-yourself basedinvestment brokerage model where the customer can execute investment transactions for a low brokerage fee. 5paisais engaged in providing an online technology platform through Internet terminals and mobile applications fortrading securities on the BSE and the NSE of India.
Additional information can be accessed from 5paisa’s website www.5paisa.com.
Transaction Description
On October 20, 2017 IIFL spun-off its wholly-owned subsidiary 5Paisa Digital Undertaking through the formation ofa new public company, 5paisa Capital Limited, listed on the BSE and the NSE of India effective November 16, 2017.This non-cash transaction resulted in Fairfax India receiving one new common share of 5paisa for every 25 commonshares of IIFL held for a total of 3,385,657 common shares of 5paisa with a fair value of $19,758. The distribution of5paisa to IIFL shareholders was characterized as a return of capital which resulted in Fairfax India recording the initialcost of its investment in 5paisa at its fair value of $19,758 with a corresponding amount recorded as a reduction ofthe cost of its investment in IIFL.
At December 31, 2017 the company held an aggregate of 3,385,657 common shares of 5paisa representing a 26.6%equity interest. Fairfax India and Fairfax provided undertakings to SEBI that were identical to those in respect of itsinvestment in IIFL, specifically they agreed that they would not take certain actions that could result in theacquisition of control of 5paisa.
At December 31, 2017 the company did not have any board representation in 5paisa.
Key Business Drivers, Events and Risks
5paisa’s key business driver relates to its ability to provide a digital method of trading in securities, which is emergingas a new segment with the potential to achieve critical mass and grow in the near future with the spread of theInternet, mobile penetration, telecommunication and data services throughout India. 5paisa’s ability to acquire,service and grow the new emerging do-it-yourself customer segment provides its customers with lower costs forvarious financial products, enabling investors to invest seamlessly, on their own, from anywhere in the world.
The demonetization of the Indian rupee in November 2016 had a short term negative impact on 5paisa’s revenuesdue to the decrease in liquidity and consequently, spending in India. 5paisa has continued to focus on digitizationthrough its online technology platform and mobile applications for the trading of securities which has enabled it tobenefit from the impact of demonetization. As more money enters India’s formal banking system and capitalmarkets, 5paisa will likely benefit over the long term as the demand for its investment services increases.
Valuation and Consolidated Financial Statement Impact
At December 31, 2017 the fair value of the company’s investment in 5paisa was $19,958 with the change in fair valuein 2017 presented in the table disclosed at the outset of the Indian Investments section of this MD&A.
65

FAIRFAX INDIA HOLDINGS CORPORATION
Private Indian Investments
Cautionary Statement Regarding the Valuation of Private Indian Investments
In the absence of an active market for the company’s Private Indian Investments, fair values for these investments aredetermined by management using industry acceptable valuation methodologies after considering the history andnature of the business, operating results and financial conditions, outlook and prospects, general economic, industryand market conditions, contractual rights relating to the investment, public market comparables (if available) and,where applicable, other pertinent considerations. The process of valuing investments for which no active marketexists is inevitably based on inherent uncertainties and the resulting values may differ from values that would havebeen used had an active market existed. The amounts at which the company’s Private Indian Investments could bedisposed of may differ from the fair values assigned and those differences may be material.
Bangalore International Airport Limited
Business Overview
Bangalore International Airport Limited (‘‘BIAL’’) is a private company located in Bengaluru, India. BIAL, under aconcession agreement with the Government of India until the year 2038 (with the right to extend the agreement foran additional 30 years), has the exclusive rights to carry out the development, design, financing, construction,commissioning, maintenance, operation and management of the Kempegowda International Airport Bengaluru(‘‘KIAB’’) through a public-private partnership (the ‘‘concession agreement’’). KIAB is the first greenfield airport inIndia built to the highest level of international standards through a public-private partnership.
BIAL’s principal lines of business are as follows:
Aeronautical revenue from the airport
Aeronautical revenue is revenue earned from airlines for providing services such as landing, parking, housing, anduser development fees (‘‘aeronautical services’’). Tariffs for these aeronautical services, as determined by AirportsEconomic Regulatory Authority of India (the ‘‘regulator’’), are fixed in a manner to generate a 16.0% per annumregulated return on invested equity (the ‘‘Regulatory Asset Base’’) for the airport operator. Under the currentregulatory approach applicable to BIAL, aviation concessions (which includes cargo, ground handling, fuelthroughput, and into-plane services) are treated as aeronautical services. In addition, the regulator also attributes30.0% of non-aeronautical revenue (described below) as a part of aeronautical revenue when computing theregulated return.
Non-aeronautical revenue from the airport
All revenue sources from the airport other than aeronautical revenue (which includes aviation concessions, asdescribed above) are treated as non-aeronautical revenue. This includes revenue from activities such as cateringservices, vehicle parking, advertising, retail and duty free shops, and food and beverages. BIAL earns itsnon-aeronautical revenue from concession arrangements that reflect a percentage of revenue sharing, with aminimum guaranteed revenue, each year. Non-aeronautical revenue is expected to grow substantially due to theincrease in the number of passengers using the airport, the availability of additional space for development and theincreasing propensity of passengers to spend money.
Other non-airport related revenue, including real estate monetization
The airport is located on 4,000 acres of land and the concession agreement provides for development of 1,000 acresof this land for commercial purposes such as hotels, retail establishments, offices and industrial or entertainmentparks. This will permit BIAL to monetize approximately 460 acres after providing land to build roads, utilities,landscaping and other services. With the exception of the five-star Taj hotel next to the airport and operated under amanagement contract with Indian Hotels Company Limited, all other land remains undeveloped. Over time, there ispotential for significant upside from monetization of this real estate.
Additional information can be accessed from BIAL’s website www.bengaluruairport.com.
66

Transaction Description
On March 24, 2017 Fairfax India acquired a 38.0% equity interest in BIAL for cash consideration of $385,498(approximately 25.2 billion Indian rupees). A portion of that equity interest (33.0%) was purchased from a wholly-owned subsidiary of GVK Power and Infrastructure Limited (‘‘GVK’’) where Fairfax issued a put option to GVK whichgave GVK the right to sell some or all of its remaining 10.0% equity interest in BIAL to Fairfax or Fairfax India untilApril 8, 2019 (the ‘‘Put Option’’). The remaining equity interest of 5.0% was purchased from Flughafen ZurichAG (‘‘Zurich’’).
On July 13, 2017 Fairfax India acquired the additional 10.0% equity interest in BIAL from GVK for cash considerationof $200,093 (12.9 billion Indian rupees) which the company determined included $74,202 (approximately4.8 billion Indian rupees) of consideration in excess of the fair value of those additional shares acquired. Theadditional consideration of $74,202 paid to GVK reflected costs attributed by management to: (i) motivate GVK tosell its remaining 10.0% equity interest in BIAL; (ii) increase the company’s holdings in BIAL to enhance thecompany’s investment returns; and, (iii) accelerate the development of a second runway and terminal, and makeimprovements to the existing runway. In 2017, the costs incurred of $74,202 were recorded in net change inunrealized gains on investments and other costs in the consolidated statement of earnings. The Put Option wasterminated upon the company’s acquisition of the additional 10.0% equity interest in BIAL from GVK.
Upon completion of the additional 10.0% investment in BIAL, the company had invested aggregate cashconsideration of $585,591 (inclusive of the $74,202 of costs incurred) for a 48.0% equity interest in BIAL.
At December 31, 2017 the company had appointed six of the sixteen BIAL board members.
Key Business Drivers, Events and Risks
KIAB is the busiest airport in South India, the third largest in the country, and was rated the fastest growing airportglobally during 2017 by FlightGlobal, an international aviation data and analytics company. The airport handledover 25 million passengers during the year ended December 31, 2017 representing growth in overall traffic of 12.9%compared to the year ended December 31, 2016.
Plans are in place to expand the capacity of the airport, which include constructing a second runway and anadditional terminal building, and expanding the related infrastructure. Land preparation for the second runway isunderway, with construction scheduled to begin during the middle of 2018, estimated to be completed bySeptember 2019. Design approvals for the additional terminal building commenced in 2017 and will be constructedin two phases; the first phase will have the capacity to handle 25 million passengers per annum (estimated to becompleted by 2021), while the second phase of the project will add capacity for another 20 million passengers perannum. The combined capacity of the existing and additional terminal will be approximately 65 million passengersper annum.
On March 14, 2017 the KIAB was awarded the SKYTRAX Award for ‘Best Regional Airport in India and Central Asia’by air travelers at the World Airport Awards, held at the Passenger Terminal EXPO in Amsterdam, the Netherlands.The SKYTRAX World Airport Awards is the largest passenger satisfaction assessment and the most prestigiousamongst all the surveys measuring airport service excellence and quality. KIAB was previously recognized as the BestAirport in India by SKYTRAX in 2011 and Best Regional Airport in Central Asia in 2015.
On August 4, 2017 BIAL announced that KIAB will become the first airport in the country to have a helicopter taxiservice. Services commenced in early March 2018, initially operating between KIAB and Electronics City (one ofIndia’s largest electronic industrial parks and an information technology hub in Bengaluru, India).
On August 16, 2017 BIAL completed the expansion of the existing terminal to support the immediate growth inpassenger traffic, which included two new Rapid Exit Taxiways (‘‘RET’’) that increased runway capacity. With theaddition of the two RETs, the Air Traffic Movements (‘‘ATM’’) per hour capacity immediately increased from34 ATMs per hour to 38 ATMs per hour and will progressively increase to 44 ATMs per hour.
Effective October 28, 2017, as a result of continued business development with Jet Airways, daily non-stop flightsbetween Bengaluru, India and Amsterdam, the Netherlands became available.
67

FAIRFAX INDIA HOLDINGS CORPORATION
Valuation and Consolidated Financial Statement Impact
During the second quarter of 2017 the company refined its internal valuation model used in the determination ofthe fair value of BIAL. At December 31, 2017 the company estimated the fair value of its investment in BIAL using adiscounted cash flow analysis based on multi-year free cash flow projections with assumed after-tax discount ratesranging from 10.4% to 11.7% and a long term growth rate of 3.0%. Free cash flow projections were based on EBITDAestimates derived from financial information for BIAL’s business units prepared in the fourth quarter of 2017 byBIAL’s management. Discount rates were based on the company’s assessment of risk premiums to the appropriaterisk-free rate of the economic environment in which BIAL operates. At December 31, 2017 the company’s internalvaluation model indicated that the fair value of the company’s investment in BIAL was $608,288 with the change infair value in 2017 presented in the table at the outset of the Indian Investments section of this MD&A. The netchange in unrealized gains on investments and other costs of $10,902 from the company’s investment in BIALduring 2017 was primarily driven by increases in the projected cash flows in the discounted cash flow analysis(higher projected aeronautical revenue from the first phase of Terminal 2 expected to result in increased passengercapacities), partially offset by the $74,202 of cash consideration paid attributable to the costs incurred to acquire theadditional 10.0% in BIAL, higher related capital expenditure, and an acceleration of the second phase of Terminal 2.
In 2017 the consolidated statements of earnings included dividend income earned from the investment in BIALof $2,241.
BIAL’s Summarized Financial Information
The company’s fiscal year ends on December 31 and BIAL’s fiscal year ends on March 31. Summarized below areBIAL’s balance sheets at September 30, 2017 and March 31, 2017.
Balance Sheets(unaudited – US$ thousands)
September 30, 2017(1) March 31, 2017(1)
Current assets 121,311 113,252Non-current assets 670,988 643,520Current liabilities 64,375 59,752Non-current liabilities 427,450 435,743Shareholders’ equity 300,474 261,277
(1) The net assets of BIAL were translated at September 30, 2017 at $1 U.S. dollar = 65.32 Indian rupees and at March 31, 2017 at $1U.S. dollar = 64.94 Indian rupees. The exchange rates used were the spot rates prevailing on those respective dates.
Current assets increased primarily due to increased trade receivables and bank deposits (original maturities greaterthan three months) as a result of passenger growth, partially offset by decreased cash and cash equivalents.Non-current assets increased as a result of ongoing capital expenditures required to expand the capacity of the airportas described in the Key Business Drivers, Events and Risks section. Current liabilities increased primarily due toincreases in payables to creditors for the capital expenditures. Non-current liabilities decreased as a result ofscheduled repayments on loans and borrowings.
Summarized below are BIAL’s statements of earnings for the six months ended September 30, 2017 and 2016.
Statements of Earnings(unaudited – US$ thousands)
Six months ended Six months endedSeptember 30, September 30,
2017(1) 2016(1)
Revenue 116,543 97,457Earnings before income taxes 48,183 40,325Net earnings 48,400 39,055
(1) Amounts for the six months ended September 30, 2017 and 2016 were translated into US$ using the average exchange rates of $1U.S. dollar = 64.38 Indian rupees and $1 U.S. dollar = 66.93 Indian rupees prevailing during those periods.
68
The increase in revenue (primarily comprised of aeronautical and non-aeronautical revenue) principally reflectedincreased domestic passenger traffic. Revenues also reflect non-airport revenue contribution following the openingof the Taj hotel on September 30, 2016. Earnings before income taxes and net earnings increased primarily due toincreased revenues as noted above, partially offset by increased employee costs, increased depreciation on capitalasset additions, and expenses related to the operations of the Taj hotel.
National Collateral Management Services Limited
Business Overview
National Collateral Management Services Limited (‘‘NCML’’), a private company, is a leading private agriculturalcommodities company located in Gurugram, India, operating for over 13 years in the agriculture value chain andoffering end-to-end solutions in grain procurement, testing, storage and collateral management. NCML waspromoted by a consortium of banks, cooperatives and the National Commodity and Derivatives Exchange Limited(‘‘NCDEX’’) in 2004 as a warehousing and collateral management company to support commodity trading onNCDEX and has since evolved into a significant player in India.
NCML’s principal lines of business are as follows:
Warehousing and Collateral Management
NCML’s warehousing line of business is comprised of over 1.6 million metric tons of storage capacity across785 warehouses in 18 states in India and is a market leader in India. NCML’s collateral management line of businessmanages capacity of over 3.4 million metric tons, has assets under management in excess of $1.7 billion and a marketshare of 36%.
Supply Chain Management
NCML’s supply chain management line of business provides end-to-end procurement, testing and certification,logistics, trading and disposal services, throughout the entire agriculture value chain. NCML’s clients include bulkconsumers, large end users and farmers.
Non-banking Finance Company (‘‘NBFC’’)
NCML Finance Private Ltd (‘‘NFin’’), NCML’s wholly-owned subsidiary, is an RBI registered NBFC with a focus onrural and agri-business financing. With its extensive reach and over a decade of experience, NCML has realized thatdespite the presence of numerous financial entities in the rural and agriculture value chain, the small and marginalfarmer segment remains underpenetrated. NFin provides a seamless facility for NCML’s customers to receivepost-harvest financing.
While NFin intends to offer a complete suite of financial products in the agriculture and rural domain going forward,it initially started its operations by offering loans secured by warehouse receipts for commodities kept in the custodyof NCML to bulk consumers, farmer producers’ organizations and aggregators.
Silo Projects
The Food Corporation of India (‘‘FCI’’) is a government agency responsible for distribution of food grains throughoutIndia. The majority of commodity storage in India is in facilities owned or leased directly by the government withonly about 5% stored in organized private warehouses owned by companies that provide warehousing, storage andpreservation services like NCML. The current storage capacity in India is approximately 125 million metric tons, ofwhich 75% is government owned. The Government of India reviewed the process of acquiring, storing anddistributing food grains resulting in a new distribution model that is focused on a public-private partnership. Thereare a few large national players (similar to NCML) which own and/or run high quality infrastructure and providediverse ancillary services to warehousing customers who have the potential to benefit from changes in the industry.
In 2016, the FCI had called for bids for building 27 additional silos which will be located in the states of Punjab,Haryana, Uttar Pradesh, West Bengal, Bihar and Gujarat, and have an estimated combined grain storage capacity of1.35 million metric tons. On February 3, 2017 NCML was awarded a 30 year concession agreement to build 11 of thelocations with a 550,000 metric ton capacity which will require capital expenditure of an estimated $110,000 atcurrent exchange rates (approximately 7.0 billion Indian rupees). In late 2017 NCML was awarded a bid for two
69

FAIRFAX INDIA HOLDINGS CORPORATION
additional silo locations with a 100,000 metric ton capacity. The silo projects, which are expected to be completed byearly 2019, will be financed through debt and common equity.
Additional information can be accessed from NCML’s website www.ncml.com.
Transaction Description
In the third quarter of 2015 Fairfax India acquired an 88.1% equity interest in NCML for cash consideration of$148,716 (approximately 9.7 billion Indian rupees).
On August 8, 2017 Fairfax India participated in NCML’s rights issue through which it acquired its pro-rata share of18,945,840 common shares of NCML at 86.00 Indian rupees per share for total consideration of $25,602(approximately 1.6 billion Indian rupees) comprised of cash consideration of $9,601 (approximately 611 millionIndian rupees) settled on the closing date and the remaining $16,001 (approximately 1.0 billion Indian rupees)reflected in payable for rights issue on the consolidated balance sheet at December 31, 2017. The payable for rightsissue was settled in January 2018. NCML issued 19,071,602 common shares to the participating shareholders as partof the rights issue and will use the proceeds to supplement its funding requirements for its silo projects, as describedabove.
At December 31, 2017 the company held an aggregate of 131,941,286 common shares of NCML representing an89.5% equity interest (December 31, 2016 – 88.1%).
At December 31, 2017 the company had appointed three of the eight NCML board members.
Key Business Drivers, Events and Risks
NCML’s key business drivers relate to its ability to achieve long term modernization of its grain storage facilities, thedevelopment of its NBFC, the expansion of its supply chain management line of business, and the successfulconstruction of the silos under the concession agreement.
During 2017 the Indian agriculture business environment showed positive signs of recovery from the temporarydisruption in the wake of the demonetization decision taken by the Government of India on November 8, 2016.Storage demand increased as the summer crop harvest, which was held back by large farmers and intermediaries,made its way back into the market, improving NCML’s performance in 2017.
The silo projects, which are expected to be completed by early 2019, will be financed through debt and commonequity. In September 2017 NCML launched its subsidiary NCML KB Private Limited that will be used for theconstruction of the silos on a Build, Operate and Transfer (‘‘BOT’’) basis for the exclusive use by the FCI at twolocations in Bihar, India.
In February 2017 NCML launched its subsidiary NCML MktYard Private Limited which will deal with procurement,trading and disposal of commodities for banks, government organizations and other market participants, enhancingNCML’s supply chain management line of business.
Valuation and Consolidated Financial Statement Impact
At December 31, 2017 the company estimated the fair value of its investment in NCML using a discounted cash flowanalysis based on multi-year free cash flow projections with assumed after-tax discount rates ranging from 12.0% to19.9% and long term growth rates ranging from 2.4% to 6.0% (December 31, 2016 – 11.9% to 15.8%, and 6.0%,respectively). Free cash flow projections were based on EBITDA estimates derived from financial information forNCML’s business units prepared in the fourth quarter of 2017 by NCML’s management. Discount rates were based onthe company’s assessment of risk premiums to the appropriate risk-free rate of the economic environment in whichNCML operates. At December 31, 2017 the company’s internal valuation model indicated that the fair value of thecompany’s investment in NCML was $179,054 (December 31, 2016 – $146,586) with the change in fair value in 2017and 2016 presented in the table at the outset of the Indian Investments section of this MD&A. The net change inunrealized loss of $2,298 from the company’s investment in NCML during 2017 was primarily driven by lowerprojected growth in NCML’s supply chain management line of business and the impact of demonetization on itsNBFC. In 2016 the net change in unrealized gain of $3,879 from the company’s investment in NCML primarilyrelated to the growth in NCML’s supply chain management line of business and the success of the new NBFC.
70

NCML’s Summarized Financial Information
The company’s fiscal year ends on December 31 and NCML’s fiscal year ends on March 31. Summarized below areNCML’s balance sheets at December 31, 2017 and March 31, 2017.
Balance Sheets(unaudited – US$ thousands)
December 31, 2017(1) March 31, 2017(1)
Current assets 184,831 132,680Non-current assets 86,765 67,628Current liabilities 126,947 88,835Non-current liabilities 31,087 29,276Shareholders’ equity 113,562 82,197
(1) The net assets of NCML were translated at December 31, 2017 at $1 U.S. dollar = 63.83 Indian rupees and at March 31, 2017 at $1U.S. dollar = 64.94 Indian rupees. The exchange rates used were the spot rates prevailing on those respective dates.
The increase in current assets primarily reflected an increase in inventory due to increased working capital levels inthe supply chain management line of business, increased other current assets as a result of larger advances in NCML’sNBFC and receivables relating to the rights issue (subsequently called by NCML and settled by participatingshareholders by January 29, 2018) and increased short term investments. The increase in non-current assetsprimarily related to increases in property, plant and equipment from the addition of warehouses and acquisition ofland for the silo projects, as well as increases in deferred and current income tax assets. The increase in currentliabilities primarily reflected increases in short term loans and borrowings by NCML’s NBFC and increased workingcapital levels in the supply chain management line of business. Non-current liabilities comprised long term loansand borrowings relating to the financing obtained for the ongoing warehouse project.
Summarized below are NCML’s statements of earnings for the nine months ended December 31, 2017 and 2016.
Statements of Earnings(unaudited – US$ thousands)
Nine months ended Nine months endedDecember 31, 2017(1) December 31, 2016(1)
Revenue 126,756 75,718Earnings before income taxes 1,624 2,915Net earnings 3,351 315
(1) Amounts for the nine months ended December 31, 2017 and 2016 were translated into US$ using the average exchange rates of $1U.S. dollar = 64.50 Indian rupees and $1 U.S. dollar = 67.07 Indian rupees prevailing during those periods, respectively.
NCML’s revenue for the nine months ended December 31, 2017 and 2016 primarily reflected contributions from thesupply chain management, warehousing and collateral management and NBFC lines of business. The increase inrevenue was principally as a result of growth in the supply chain management and warehousing lines of business aswell as NCML’s NBFC. Earnings before income taxes decreased primarily relating to a one-time charge forimpairment of certain receivables. The increase in NCML’s reported net earnings primarily reflected increasedprofitability in the supply chain management and warehousing lines of business and the benefit of deferred incometax recovery.
Sanmar Chemicals Group
Business Overview
Sanmar Chemicals Group (‘‘Sanmar’’), a private company, is one of the largest suspension polyvinyl chloride(‘‘PVC’’) manufacturers in India, headquartered in Chennai, India with an operational presence in India and Egypt.Sanmar has an installed capacity of approximately 366,000 metric tons per annum in India and is in the process ofexpanding its PVC capacity in Egypt from 200,000 metric tons per annum to 400,000 metric tons per annum. Oncethe expansion is completed, Sanmar will have a total PVC capacity of over 766,000 metric tons per annum.
71

FAIRFAX INDIA HOLDINGS CORPORATION
Sanmar’s principal lines of business are as follows:
Chemplast
Beginning as Chemicals and Plastics India Limited in 1962, Chemplast is currently the second largest suspensionPVC manufacturer and the largest specialty PVC manufacturer in India, with the top three players capturingapproximately 90% of India’s domestic manufacturing capacity. A significant portion of Chemplast’s revenues arederived from integrated operations. Chemplast’s product range falls into four distinct groups: PVC resins, causticsoda / chlorine, chlorinated solvents and refrigerant gases. PVC is primarily used in pipes and fittings, window anddoor profiles, shoes, flooring and cable industries. Caustic soda is primarily used in the manufacturing of paper andpulp, textiles, alumina, petroleum products, soaps and detergents, and is also the basic feedstock for variouschemicals. Chlorinated solvents are primarily used in pharmaceutical sectors. The majority of Chemplast’s revenuesare generated through direct sales to end customers.
TCI Sanmar Chemicals S.A.E. (‘‘Sanmar Egypt’’)
Sanmar Egypt is the largest Indian investor in Egypt’s chemical business and the largest caustic soda and PVCmanufacturer in Egypt. Sanmar has invested approximately $1.2 billion during Phase 1 of its Egypt project and hascreated world-class manufacturing facilities for caustic soda and PVC in Port Said, Egypt. Phase 1 projects werecompleted in April 2012 at which time PVC production commenced. Phase 2 is underway with an additionalinvestment of approximately $300,000, for an aggregate investment of approximately $1.5 billion. Phase 2expansion is expected to be completed by June 2018. On completion of Phase 2, the PVC capacity will double to400,000 metric tons per annum. A new plant to produce calcium chloride granules with a capacity of 130,000 metrictons will also be established under Phase 2. Calcium chloride granules are used worldwide for dust control, de-icing,drilling operations and in bakery products. Sanmar Egypt sells directly to end-user customers and also throughdistributors. PVC is mainly sold in the key target markets like Egypt, Turkey and parts of western Europe.
Specialty Chemicals
Sanmar’s Specialty Chemicals business is engaged in the manufacturing and marketing of phytochemicals andorganic chemicals. The phytochemicals division manufactures an active pharmaceutical ingredient called colchicine(treatment of gout) from plant based raw material. The organic chemical division is involved in the manufacturing ofadvanced organic intermediates for the pharmaceutical, agro chemical, flavours and fragrances, and other finechemical applications.
Additional information can be accessed from Sanmar’s website www.sanmargroup.com.
Transaction Description
On April 28, 2016 Fairfax India invested $250,000 in Sanmar comprised of $1,000 in common shares (representing a30.0% equity interest) and $249,000 in bonds. On September 26, 2016 Fairfax India invested an additional $50,000in Sanmar bonds. Both tranches of Sanmar bonds mature on April 22, 2023 (7 years from the date of issuance of thefirst tranche), subject to earlier redemption at the option of Sanmar under certain circumstances. In lieu of cash, thecoupon payment on the bond is payable in kind in the form of additional Sanmar bonds over the life of the financialinstrument. A redemption premium may also be payable in kind to the company.
At December 31, 2017 the company had appointed two of the six Sanmar board members.
Key Business Drivers, Events and Risks
India continues to be a PVC deficit market with approximately 50% of the demand being met through imports.Egypt and Turkey, which are manufacturing hubs for exports to Europe, currently have a demand gap for PVC ofapproximately 1,000 kilotons per annum which is being met by imports from U.S. and Asia.
Sanmar’s key business drivers relate to its ability to execute its plan to increase PVC manufacturing capacity in Egyptand India that should align with the growing demand for PVC in North Africa, Middle East and India, and to improvethe overall capacity utilization at all of its PVC production facilities. It is very likely that Sanmar will incur losses untilit can complete its manufacturing capacity expansion project in Egypt and sales of PVC grow to match the increasein capacity.
72

Chemplast and Kem One (the second largest producer of PVC in Europe) have entered into an agreement to establishKem One Chemplast, an equal joint venture that will manufacture chlorinated polyvinyl chloride (‘‘CPVC’’). Thejoint venture and new facility will be established at a coastal location in Karaikal, Puducherry, India. The project,estimated to cost approximately $55,000 (approximately 3.5 billion Indian rupees), will utilize the technology ofKem One and have a capacity to manufacture 20,000 metric tons per annum of CPVC resins and will alsomanufacture CPVC compounds. On May 2, 2017 approval from the Government of India’s Ministry ofEnvironment, Forest and Climate Change was received, allowing the joint venture to commence construction of thenew facility.
CPVC is used as a raw material to produce pipes and fittings for supplying water that are required to have a highresistance to heat, pressure and chemicals. More recently in India, there has been a switch from metal pipes to CPVCpipes in building construction combined with an overall increase in construction demand. The Kem One Chemplastjoint venture is well positioned to benefit from the rapidly growing demand for CPVC in India that is currently beingmet through imports.
Valuation and Consolidated Financial Statement Impact
Sanmar Common Shares
At December 31, 2017 the company estimated the fair value of its investment in Sanmar common shares based on aninternal valuation model which consisted of a discounted cash flow analysis based on multi-year free cash flowprojections with assumed after-tax discount rates ranging from 15.2% to 19.5% and long term growth rates rangingfrom 2.0% to 3.6% (December 31, 2016 – 15.5% to 22.5% and 2.0% to 3.6%, respectively). Free cash flow projectionswere based on EBITDA estimates derived from financial information for Sanmar’s three main business units preparedin the fourth quarter of 2017 by Sanmar’s management. Discount rates were based on the company’s assessment ofrisk premiums to the appropriate risk-free rate of the economic environment in which Sanmar operates. AtDecember 31, 2017 the company’s internal valuation model indicated that the fair value of the common shares was$556 (December 31, 2016 – $440) with the change in fair value in 2017 and 2016 presented in the table at the outsetof the Indian Investments section of this MD&A.
Sanmar Bonds
At December 31, 2017 the company estimated the fair value of its investment in Sanmar bonds using an industryaccepted discounted cash flow and option pricing model that incorporated Sanmar’s estimated credit spread of 8.2%(December 31, 2016 – 7.1%) and assumptions related to certain redemption options embedded in the bonds. Theestimated credit spread was based on the credit spreads of a peer group of comparable companies adjusted for creditrisk specific to Sanmar. At December 31, 2017 the company’s internal valuation model indicated that the fair value ofSanmar bonds was $333,172 (December 31, 2016 – $299,093) with the change in fair value in 2017 and 2016presented in the table at the outset of the Indian Investments section of this MD&A. In 2017 and 2016, the netchange in unrealized gains of $14,843 and $6,907 related to the company’s investment in Sanmar bonds primarilyreflecting the impact of the accretion of the cost of Sanmar bonds to their redemption value after givingconsideration to the issuer’s credit risk and the redemption option held by the issuer prior to maturity. AtDecember 31, 2017 and 2016, Sanmar bonds were rated BBB – with a stable outlook by Brickwork Ratings, an Indianrating agency.
73

FAIRFAX INDIA HOLDINGS CORPORATION
Sanmar’s Summarized Financial Information
The company’s fiscal year ends on December 31 and Sanmar’s fiscal year ends on March 31. Summarized below areSanmar’s balance sheets at September 30, 2017 and March 31, 2017.
Balance Sheets(unaudited – US$ thousands)
September 30, 2017(1) March 31, 2017(1)
Current assets 236,712 188,559Non-current assets 1,317,315 1,277,153Current liabilities 454,363 385,253Non-current liabilities 1,359,508 1,296,795Shareholders’ equity (259,844) (216,336)
(1) The net assets of Sanmar were translated at September 30, 2017 at $1 U.S. dollar = 65.32 Indian rupees and at March 31, 2017 at $1U.S. dollar = 64.94 Indian rupees. The exchange rates used were the spot rates prevailing on those respective dates.
The increase in current assets primarily reflected increases in cash and cash equivalents related to proceeds receivedfrom a $99,000 bank loan drawn by Sanmar Egypt to finance the second phase of its expansion project in Egypt thathas not yet been utilized, as well as positive cash flow generated by Chemplast. The increase in non-current assetswas primarily attributable to the capital expenditures made in connection with the Phase 2 expansion at SanmarEgypt. The increase in current liabilities primarily reflected increased funding from working capital loans. Theincrease in non-current liabilities primarily reflected an increase in long term loans and borrowings related to the$99,000 bank loan drawn by Sanmar Egypt.
Summarized below are Sanmar’s statements of earnings for the six months ended September 30, 2017 and 2016.
Statements of Earnings(unaudited – US$ thousands)
Six months ended Six months endedSeptember 30, 2017(1) September 30, 2016(1)
Revenue 315,845 289,204Loss before income taxes (33,427) (35,394)Net loss (46,350) (57,775)
(1) Amounts for the six months ended September 30, 2017 and 2016 were translated into US$ using the average exchange rates of $1U.S. dollar = 64.38 Indian rupees and $1 U.S. dollar = 66.93 Indian rupees prevailing during those periods.
The increase in revenue primarily reflected improvements at Chemplast and Sanmar Egypt where sales of PVCexceeded expectations. The decrease in net loss primarily reflected improved margins at Sanmar Egypt and lowerinterest expense as a result of the refinancing of higher interest short term loans with long term loans at lowerinterest rates, partially offset by temporary pressures on margins as a result of higher production costs at Chemplast.
Saurashtra Freight Private Limited
Business Overview
Saurashtra Freight Private Limited (‘‘Saurashtra’’), a private company headquartered in Mumbai, India, runs one ofthe largest container freight stations at Mundra port (Gujarat), the third largest and fastest growing container port inIndia. Services provided by Saurashtra’s container freight station includes transportation of containers to and fromthe port, stuffing/destuffing of containers, cargo storage, transportation of cargo to the end customer, and thestorage, maintenance and repair of empty containers. During the third quarter of 2017, Saurashtra commencedoperations in a new line of business that focuses on new services for container shipping, offering integrated logisticsolutions to its customers by providing Saurashtra’s own containers to importers and exporters to transport cargo.
Saurashtra’s principal lines of business are as follows:
Container Freight Station
Saurashtra’s container freight station services include transportation of containers to and from the port,stuffing/destuffing of containers, cargo storage, transportation of cargo to the end customer, and the storage,maintenance and repair of empty containers.
74
Fairfreight Lines
During the third quarter of 2017 Saurashtra commenced operations of its newly formed wholly-owned subsidiaryFairfreight Lines. Fairfreight Lines owns its own branded shipping containers which will enable importers andexporters to transport cargo globally, offering an integrated logistic solution to its customers.
Additional information can be accessed from Saurashtra’s website www.saurashtrafreight.com.
Transaction Description
On February 14, 2017 Fairfax India acquired a 51.0% equity interest in Saurashtra for cash consideration of $30,018(approximately 2.0 billion Indian rupees).
At December 31, 2017 the company had appointed two of the six Saurashtra board members.
Key Business Drivers, Events and Risks
Saurashtra has the annual capacity to handle 180,000 standard twenty-foot (shipping container) equivalent units(‘‘TEUs’’) and in 2017 handled 90,554 TEUs, implying capacity utilization of approximately 50%. Saurashtra’s marketshare at Mundra port in India is approximately 14% which is the highest amongst all container freight stations(‘‘CFS’’) at that port. Mundra port is in the process of expanding its capacity from 3.5 million to 6.6 million TEUs.
The CFS industry is correlated with growth in container traffic, which during the last 15 years has increased at a rateof 1.3 to 1.4 times the growth rate of India’s GDP due to increasing containerization of cargo. The CFS industry ishighly fragmented with 13 CFS at Mundra port. Many of these CFS are inefficient and operating below capacityproviding Saurashtra with the opportunity to benefit from industry consolidation.
India has witnessed considerable growth in exports during 2017, primarily due to increased global demand foragricultural products which has directly benefited Mundra port and as a result Saurashtra. During the second quarterof 2017 two new CFS launched their services which has led to increased competition in the container import market,a market that is experiencing short term declines primarily as a result of the effects of demonetization anduncertainty around implications of the GST which has led to conservative buying patterns throughout India.
Saurashtra’s new business initiative in Fairfreight Lines enables Saurashtra to offer integrated logistic solutions to itscustomers. Saurashtra also completed a project during the third quarter of 2017 which was instrumental inenhancing its warehouse capacity and increased the safety of cargo it holds in custody.
During the fourth quarter of 2017 Saurashtra’s management exited the niche shipping line voyages between Indiaand select countries in the Gulf region as a result of the business unit, Fairwind Shipping, experiencing increasedcompetition and the demand for the niche service route not materializing.
The implementation of the GST on July 1, 2017 has resulted in an overall benefit to various sectors of the logisticsindustry including transportation, freight forwarding, warehousing, container services and express cargo delivery.The standardization of tax rates will enable businesses to discontinue their current practice of having warehouses inmultiple states (to minimize taxes) and instead keep larger and more consolidated warehouses in one location. As aresult the demand for inland container depots and container freight stations has increased, enabling Saurashtra togenerate higher revenues from value added activities such as special purpose warehousing and inventorymanagement. In addition, the implementation of the GST allows Saurashtra to claim the full input tax credit for GSTpaid on purchases.
Valuation and Consolidated Financial Statement Impact
The company refined its internal valuation model used in the determination of the fair value of Saurashtra toincorporate the impact of the decision made by management in the fourth quarter of 2017 to exit the niche shippingline voyages between India and select countries in the Gulf region (Fairwind Shipping) due to competitive factorsand demand not materializing as expected. At December 31, 2017 the company estimated the fair value of itsinvestment in Saurashtra using a discounted cash flow analysis based on multi-year free cash flow projections withassumed after-tax discount rates ranging from 14.6% to 14.7% and long term growth rates ranging from 4.0% to5.0%. Free cash flow projections were based on EBITDA estimates derived from financial information for Saurashtra’stwo business units prepared in the fourth quarter of 2017 by Saurashtra’s management. The discount rates were basedon the company’s assessment of risk premiums to the appropriate risk-free rate of the economic environment in
75

FAIRFAX INDIA HOLDINGS CORPORATION
which Saurashtra operates. At December 31, 2017 the company’s internal valuation model indicated that the fairvalue of the company’s investment in Saurashtra was $28,000 with the change in fair value in 2017 presented in thetable at the outset of the Indian Investments section of this MD&A. In 2017 the net change in unrealized loss of$3,423 from the company’s investment in Saurashtra was primarily driven by the impact of Saurashtra discontinuingits Fairwind Shipping operations.
National Stock Exchange of India Limited
Business Overview
National Stock Exchange of India Limited (‘‘NSE’’), a private company located in Mumbai, India, operates India’slargest stock exchange. In addition to providing a platform for exchange-traded financial products in India, NSE’sflagship index, Nifty50, is used extensively by investors in India and around the world as a barometer of the Indiancapital markets.
Additional information can be accessed from NSE’s website www.nseindia.com.
Transaction Description
In the third quarter of 2016 Fairfax India acquired a 1.0% equity interest in NSE for cash consideration of $26,783(approximately 1.8 billion Indian rupees).
At December 31, 2017 the company did not have any board representation in NSE.
Key Business Drivers, Events and Risks
India has two main stock exchanges where the majority of its trading takes place, the BSE and the NSE of India.Although most significant firms in India are listed on both the BSE and the NSE of India, NSE enjoys a dominantmarket share position including an 88% market share in the equity trading segment, a 100% market share in theequity derivatives trading segment and a 58% and 63% market share in the foreign exchange futures and optionsmarkets, respectively.
On December 28, 2016 NSE filed a draft prospectus with SEBI in connection with its proposed initial public offering(‘‘IPO’’). Notwithstanding that certain matters requiring resolution have delayed the process, completion of the IPOis anticipated in the fourth quarter of 2018. NSE will also seek to file for an overseas listing subsequent to closing ofthe IPO. NSE has appointed Citibank, JM Financial, Kotak Mahindra and Morgan Stanley as lead investment banks tomanage the IPO.
On February 3, 2017 NSE appointed Vikram Limaye (formerly the CEO of infrastructure lender IDFC Limited‘‘IDFC’’) as its CEO. Mr. Limaye will be the first head of NSE to come from outside the ranks of NSE’s founding teamsince it was set up in 1992. Mr. Limaye had been with IDFC since 2005 and has served more than 25 years withfinancial institutions, global investment banks, international commercial banks, and global accounting firms.
Valuation and Consolidated Financial Statement Impact
During the first quarter of 2017 the company refined its internal valuation model used in the determination of thefair value of NSE. At December 31, 2017 the fair value of the company’s investment in NSE was based on an internalmarket approach valuation model. The model references the earnings multiple of a peer group of comparablecompanies that had a median earnings multiple of 26.2 times, that when applied to NSE’s earnings resulted in a fairvalue of $40,452 (December 31, 2016 – $26,504) with the change in fair value in 2017 and 2016 presented in thetable at the outset of the Indian Investments section of this MD&A. In 2017 the net change in unrealized gain of$12,032 related to company’s investment in NSE reflected increased net earnings at NSE, and strong growth in theequity markets and other products such as commodities, bonds, currencies and interest rate futures, which are tradedextensively on global exchanges but are only in their infancy in India and are therefore providing strong growthopportunities.
In 2017 the consolidated statements of earnings included dividend income earned from the investment in NSE of$1,480 (2016 – $1,028).
76

Subsequent to December 31, 2017
The Catholic Syrian Bank Limited
On February 20, 2018 the company entered into an agreement to acquire a 51.0% equity interest in The CatholicSyrian Bank Ltd. (‘‘CSB’’) for approximately $186,000 at the exchange rate at that date (approximately 12.1 billionIndian rupees). The transaction is expected to close in the first half of 2018, subject to customary closing conditions.CSB, a private company, was established in 1920 and is a full-service bank offering neighborhood banking,non-resident Indian services, small-to-medium-enterprise and wholesale banking services through 421 branches and251 automated teller machines across India. CSB is headquartered in Thrissur, India.
Results of Operations
Fairfax India’s consolidated statements of earnings for the years ended December 31, 2017, 2016 and 2015 are shownin the following table:
2017 2016 2015
IncomeInterest 21,848 21,343 44,699Dividends 8,627 5,611 –Net realized gains (losses) on investments 1,195 3,392 (209)Net change in unrealized gains on investments and other costs 592,277 104,995 14,190Net foreign exchange gains (losses) (14,277) (6,737) 6,571
609,670 128,604 65,251
ExpensesInvestment and advisory fees 27,531 12,552 5,393Performance fee 112,218 – –General and administration expenses 4,166 4,937 5,515Interest expense 15,664 4,171 –
159,579 21,660 10,908
Earnings before income taxes 450,091 106,944 54,343Provision for (recovery of) income taxes (2,418) (881) 13,404
Net earnings 452,509 107,825 40,939
Net earnings per share $ 3.10 $ 1.01 $ 0.42Net earnings per diluted share $ 2.94 $ 1.01 $ 0.42
Total income of $609,670 in 2017 increased from $128,604 in 2016 principally as a result of increased net change inunrealized gains on investments and other costs, partially offset by increased net foreign exchange losses (primarilyas a result of the strengthening of the Indian rupee relative to the U.S. dollar during 2017) and decreased net realizedgains on investments. In 2017, the net change in unrealized gains on investments and other costs of $592,277 wasprincipally comprised of appreciation in the company’s common stock investments related to IIFL ($536,121),Fairchem ($42,241), NSE ($12,032), BIAL ($10,902, net of $74,202 costs incurred to acquire the additional 10.0%equity interest in BIAL) and Sanmar bonds ($14,843), partially offset by the depreciation of Government of Indiabonds ($14,086) and common stock investments Saurashtra ($3,423) and NCML ($2,298). In 2016, the net change inunrealized gains on investments of $104,995 was principally comprised of appreciation in the company’s commonstock investments related to IIFL ($51,305), Fairchem ($26,399 as a standalone investment) and NCML ($3,879), andIndian corporate bonds (inclusive of unrealized gains on Sanmar bonds ($6,907)). Interest income of $21,848 in 2017and $21,343 in 2016 primarily related to interest earned on investments in Government of India bonds and Indiancorporate bonds which were not yet deployed into Indian Investments. Dividend income of $8,627 in 2017primarily related to dividends received from the company’s investments in IIFL, BIAL and NSE compared to dividendincome of $5,611 in 2016 which was principally received from the company’s investments in IIFL and NSE.
77

FAIRFAX INDIA HOLDINGS CORPORATION
Net gains (losses) on investments and net foreign exchange gains (losses) in 2017 and 2016 were comprisedas follows:
2017 2016
Net NetNet change in Net change in
realized unrealized realized unrealizedgains gains (losses) Net gains gains gains Net gains
(losses) and other costs (losses) (losses) (losses) (losses)
Net gains (losses) on investments:
Short term investments – – – (17) – (17)
Bonds 1,195 (3,189)(1) (1,994) (3,327) 22,318(1) 18,991
Common stocks – 595,466(2) 595,466 4,688 81,038(2) 85,726
Common stocks – Investment funds – – – 2,048 1,639 3,687
1,195 592,277 593,472 3,392 104,995 108,387
Net foreign exchange gains (losses) on:
Cash and cash equivalents (27,531)(3) – (27,531) (3,624) – (3,624)
Investments (1,244) (664) (1,908) 3,005 (3,155) (150)
Term loans 9,812 4,764 14,576 – (2,963) (2,963)
Other 586 – 586 – – –
(18,377) 4,100 (14,277) (619) (6,118) (6,737)
(1) In 2017, comprised of Government of India bonds (unrealized loss of $14,086) and Indian corporate bonds (unrealized loss of $3,946),partially offset by Sanmar bonds (unrealized gain of $14,843). In 2016, comprised of unrealized gains from Government of India bonds($9,419), Sanmar bonds ($6,907) and Indian corporate bonds ($5,992).
(2) Refer to the Indian Investments section of this MD&A for a summary of changes in the fair value of the company’s Public and PrivateIndian Investments during 2017 and 2016.
(3) Primarily related to the U.S. dollar net proceeds received from the secondary Offerings (see note 8 (Common Shareholders’ Equity) to theconsolidated financial statements for the year ended December 31, 2017) that were held in U.S. dollar denominated cash equivalentsuntil the funds were partially deployed to acquire the 38.0% equity interest in BIAL.
The increase in total expenses from $21,660 in 2016 to $159,579 in 2017 primarily related to the performance fee as aresult of common shareholders’ equity increasing to $2,132,464 at December 31, 2017 from $1,075,446 atDecember 31, 2016 (there was no performance fee accrued in 2016), increased investment and advisory fees(principally as a result of increased holdings of Indian Investments) and the impact of increased interest expense andissuance costs incurred on the term loans.
In 2017 the performance fee recorded in the consolidated statements of earnings was $112,218 (2016 – nil),representing the performance fee accrual translated at the average exchange rate for 2017. The performance fee isaccrued quarterly and paid for the first three-year period from January 30, 2015 to December 31, 2017 (the ‘‘firstcalculation period’’) and is calculated, on a cumulative basis, as 20% of any increase in common shareholders’ equityper share (including distributions) above a 5% per annum increase. The amount of common shareholders’ equity pershare at any time which must be achieved before any performance fee would be payable is sometimes referred to asthe ‘‘hurdle per share’’. The company determined that a performance fee of $114,437 should be accrued atDecember 31, 2017 as the book value per share of $15.24 (before factoring in the impact of the performance fee) atDecember 31, 2017 was greater than the hurdle per share of $11.36 at that date. Refer to the Related PartyTransactions section of this MD&A for additional discussion on the performance fee accrued at December 31, 2017and settled on March 9, 2018.
The investment and advisory fee is calculated and payable quarterly as 0.5% of the value of undeployed capital and1.5% of the company’s common shareholders’ equity less the value of undeployed capital. In 2017, the companydetermined that the majority of its assets were invested in Indian Investments, which are considered deployedcapital. In 2017, the investment and advisory fee recorded in the consolidated statements of earnings was $27,531(2016 – $12,552).
The recovery of income taxes of $2,418 in 2017 differed from the provision for income taxes that would bedetermined by applying the company’s Canadian statutory income tax rate of 26.5% to the company’s earningsbefore income taxes primarily as a result of the tax rate differential on income earned outside of Canada, theunrecorded benefit of losses in Canada and foreign exchange fluctuations.
78

The recovery of income taxes of $881 in 2016 differed from the provision for income taxes that would be determinedby applying the company’s Canadian statutory income tax rate of 26.5% to the company’s earnings before incometaxes primarily as a result of the tax rate differential on income earned outside of Canada and foreign exchangefluctuations, partially offset by the unrecorded deferred taxes in Canada.
The company reported net earnings of $452,509 (net earnings of $3.10 per basic share and $2.94 per diluted share) in2017 compared to net earnings of $107,825 (net earnings of $1.01 per basic and diluted share) in 2016. Theyear-over-year increase in profitability in 2017 primarily reflected increased net change in unrealized gains oninvestments and other costs, partially offset by the performance fee and increased investment and advisory fees(principally as a result of increased holdings of Indian Investments) and interest expense.
Consolidated Balance Sheet Summary
The assets and liabilities reflected on the company’s consolidated balance sheet at December 31, 2017 were impactedby the acquisitions of the Indian Investments (BIAL and Saurashtra), additional investments in IIFL and NCML, netproceeds from the secondary Offerings and the 1 year term loan, net purchases of Government of India bonds,repayment of the 2 year term loan and the accrual of the performance fee.
Total Assets
Total assets at December 31, 2017 of $2,672,221 (December 31, 2016 – $1,303,497) were principally comprisedas follows:
Total cash and investments increased to $2,659,568 at December 31, 2017 from $1,261,339 at December 31,2016. The company’s cash and investments composition by the issuer’s country of domicile was as follows:
December 31, 2017 December 31, 2016
India U.S. Other Total India U.S. Other Total
Cash and cash equivalents – 19,389(1) 4,453(2) 23,842 3 165,051(1) 716(2) 165,770
Short term investments – U.S. treasurybills – 27,481 – 27,481 – 27,428 – 27,428
Bonds:
Government of India 259,356 – – 259,356 130,317 – – 130,317
Indian corporate 101,724 – – 101,724 99,447 – – 99,447
Sanmar 333,172 – – 333,172 299,093 – – 299,093
694,252 – – 694,252 528,857 – – 528,857
Common stocks:
IIFL 888,485 – – 888,485 265,951 – – 265,951
Fairchem 149,200 – – 149,200 45,488 – – 45,488
5paisa 19,958 – – 19,958 – – – –
BIAL 608,288 – – 608,288 – – – –
NCML 179,054 – – 179,054 146,586 – – 146,586
Sanmar 556 – – 556 440 – – 440
Saurashtra 28,000 – – 28,000 – – – –
NSE 40,452 – – 40,452 26,504 – – 26,504
Privi – – – – 54,315 – – 54,315
1,913,993 – – 1,913,993 539,284 – – 539,284
Total cash and investments 2,608,245 46,870 4,453 2,659,568 1,068,144 192,479 716 1,261,339
(1) Included restricted cash of $10,598 at December 31, 2017 (December 31, 2016 – $18,810).
(2) Included cash principally held in a Canadian financial institution.
Cash and cash equivalents decreased to $23,842 at December 31, 2017 from $165,770 at December 31, 2016principally reflecting the acquisitions of Indian Investments. Restricted cash of $10,598 and $18,810 atDecember 31, 2017 and December 31, 2016 related to requirements under the term loans for the company to setaside cash to fund term loan interest payments. The 2 year term loan was repaid on March 31, 2017 and the restrictedcash was used to partially fund the repayment.
79

FAIRFAX INDIA HOLDINGS CORPORATION
Bonds and Common stocks – The company is actively seeking investment opportunities in India and willcontinue to redirect capital from its cash and cash equivalents, short term investments and bond portfolio intoIndian Investments as and when those opportunities are identified. For more information about recent IndianInvestments, see the Indian Investments section of this MD&A. For more information on the company’s total cashand investment holdings of $2,659,568 at December 31, 2017 (December 31, 2016 – $1,261,339) see note 6 (Cashand Investments) to the consolidated financial statements for the year ended December 31, 2017.
Interest receivable increased to $9,422 at December 31, 2017 from $7,493 at December 31, 2016 primarilyreflecting increased interest receivable related to holdings of Government of India bonds purchased during 2017.
Income taxes refundable decreased to $3,098 at December 31, 2017 from $7,326 at December 31, 2016 primarilyreflecting an income tax refund received in the third quarter of 2017 relating to the company’s 2016 Canadiancorporate tax return filing.
Other assets decreased to $133 at December 31, 2017 from $27,339 at December 31, 2016 primarily reflecting thereceipt of proceeds in January 2017 of $26,525 on the sale of the company’s investment in investment fundsrecorded as a receivable at December 31, 2016.
Total Liabilities
Total liabilities at December 31, 2017 of $539,757 (December 31, 2016 – $228,051) were comprised as follows:
Payable to related parties increased to $122,826 at December 31, 2017 from $3,673 at December 31, 2016principally relating to the performance fee accrued at December 31, 2017 of $114,437 (December 31, 2016 – nil) andhigher investment and advisory fees payable to Fairfax.
Payable for rights issue of $15,954 at December 31, 2017 (December 31, 2016 – nil) related to the remaining62.5% of the NCML rights issue that was called by NCML and settled by the company in January 2018.
Term loans increased to $400,000 at December 31, 2017 from $223,772 at December 31, 2016 relating to the 1 yearterm loan completed on July 11, 2017, partially offset by the repayment on March 31, 2017 of the 2 year term loan(pursuant to a mandatory prepayment clause that required the company to repay the principal amount from the netproceeds of the secondary Offerings (see note 7 (Term Loans) to the consolidated financial statements for the yearended December 31, 2017)).
Comparison of 2016 to 2015 – Total assets of $1,025,451 at December 31, 2015 increased to $1,303,497 atDecember 31, 2016 primarily due to the net proceeds received from the 2 year term loan and appreciation in thecompany’s Indian Investments related to IIFL and Fairchem (as a stand alone investment). During 2016 the companyredirected capital from its cash and cash equivalents, short term investments and bond portfolio into IndianInvestments. During 2016 the company sold its investment funds and a portion of the Indian corporate bonds, andused those net proceeds and the net proceeds received from the 2 year term loan to acquire additional IndianInvestments (Sanmar (including Sanmar bonds), Privi, Fairchem and NSE). Refer to note 5 (Indian Investments) tothe consolidated financial statements for the year ended December 31, 2017 for details on the Indian Investmentsacquired during 2016.
Financial Risk Management
Capital Resources and Management
The company’s objectives when managing capital are to protect its lenders, to safeguard its ability to continue as agoing concern in order to provide returns for common shareholders, and to maintain an optimal capital structure toreduce the cost of capital. The company will seek attractive risk-adjusted returns, but will at all times seek downsideprotection and attempt to minimize the loss of capital. Total capital increased from $1,299,218 at December 31, 2016(comprised of the 2 year term loan and common shareholders’ equity) to $2,532,464 at December 31, 2017(comprised of the 1 year term loan and common shareholders’ equity), principally reflecting net proceeds receivedfrom the secondary Offerings and the 1 year term loan, and net earnings and other comprehensive income in 2017,partially offset by the repayment of the 2 year term loan.
On July 11, 2017 the company entered into an agreement with a Canadian bank for a 1 year secured term loan with aprincipal amount of $400,000 bearing interest at a rate of LIBOR plus 325 to 375 basis points. On July 13, 2017 thecompany used a portion of the net proceeds from the 1 year term loan to complete the additional 10.0% investment
80

in BIAL of $200,093 and participate in the NCML rights issue. The 1 year term loan includes a financial covenant thatrequires the company to maintain common shareholders’ equity of not less than $1.3 billion. At December 31, 2017the company was in compliance with the 1 year term loan financial covenant.
On January 13, 2017 the company completed an underwritten public offering and concurrent with the publicoffering, Fairfax and OMERS acquired additional subordinate voting shares resulting in net proceeds of $493,504.Net proceeds from the secondary Offerings were used to acquire additional Indian Investments, for general corporatepurposes, and to repay the 2 year term loan.
On September 16, 2016 the company entered into an agreement with a syndicate of Canadian banks for a 2 yearsecured term loan with a principal amount of $225,000. The 2 year term loan was repaid on March 31, 2017.
Common shareholders’ equity at December 31, 2017 increased to $2,132,464 from $1,075,446 at December 31, 2016primarily reflecting the net proceeds received from the secondary Offerings ($493,504), net earnings ($452,509) andunrealized foreign currency translation gains ($110,910) during 2017.
Book Value per Share
Common shareholders’ equity at December 31, 2017 was $2,132,464 (December 31, 2016 – $1,075,446). The bookvalue per share at December 31, 2017 was $14.46 compared to $10.25 at December 31, 2016 representing an increasein 2017 of 41.1%, primarily reflecting net earnings of $452,509 and unrealized foreign currency translation gainsof $110,910.
The table below presents the book value per share before and after the performance fee for the period from thecompany’s IPO date of January 30, 2015 to December 31, 2017 (the first three-year calculation period for theperformance fee in accordance with the Investment Advisory Agreement), and the annual growth rate and thecompound annual growth rate in book value per share before and after the performance fee.
Annual Annualgrowth in growth in
Book value book value Book value book valueper share per share per share per share
after after before beforePerformance Performance Performance Performance
Fee Fee Fee Fee
January 30, 2015(1) $10.00 – $10.00 –
December 31, 2015 $ 9.50 (5.0)% $ 9.50 (5.0)%
December 31, 2016 $10.25 7.9% $10.25 7.9%
December 31, 2017 $14.46 41.1% $15.24 48.7%
Compound annual growth in book value per share(2) 13.5% 15.5%
(1) On January 30, 2015 Fairfax India completed its IPO at an offering price of $10.00 per share.(2) The company’s book value per share of $14.46 at December 31, 2017 represented a compound annual growth rate from the initial public
offering price of $10.00 per share of 13.5% (15.5% prior to accounting for the performance fee).
The company has had excellent performance during the period from the closing of its initial public offering inJanuary 2015 to December 31, 2017. As a result of that excellent performance, the company’s book value per share of$14.46 at December 31, 2017 represented a compound annual growth rate during that period of 13.5% (15.5% priorto the performance fee described in the Related Party Transactions section of this MD&A) from the initial publicoffering price of $10.00 per share, outperforming the compound annual growth rate of the S&P USD BSE Sensexindex of 5.9% during the same period.
During 2017 the total number of shares increased primarily as a result of 42,553,500 subordinate voting shares issuedin the January 13, 2017 secondary Offerings, partially offset by repurchases of 1,900 subordinate voting shares forcancellation under the normal course issuer bid. At December 31, 2017 there were 147,432,631 common shareseffectively outstanding.
81

FAIRFAX INDIA HOLDINGS CORPORATION
The company has issued and repurchased common shares since it was federally incorporated on November 25, 2014as follows:
AverageNumber of Number of issue/
subordinate multiple repurchase Net proceeds/voting voting Total number price per (repurchase
Date shares shares(1) of shares share cost)
2014 – issuance of shares – 1 1 10.00 –2015 – issuance of shares 76,678,879 29,999,999 106,678,878 9.62 1,025,8252016 – repurchase of shares (1,797,848) – (1,797,848) 11.78 (21,178)2017 – issuance of shares 42,553,500 – 42,553,500 11.60 493,5042017 – repurchase of shares (1,900) – (1,900) 14.21 (27)
117,432,631 30,000,000 147,432,631March 9, 2018 – issuance of shares(2) 7,663,685 – 7,663,685 14.93 114,437
125,096,316 30,000,000 155,096,316
(1) Multiple voting shares that may only be issued to Fairfax or its affiliates and are not traded.(2) Subordinate voting shares issued to Fairfax on March 9, 2018 for settlement of the performance fee accrued at December 31, 2017 of
$114,437. Issuance of the subordinate voting shares was a non-cash transaction and were issued at the VWAP of $14.93 in accordancewith the Investment Advisory Agreement.
On October 4, 2017 the company announced that the TSX accepted a notice filed by Fairfax India of its intention tocommence a normal course issuer bid for its subordinate voting shares by which it is authorized, until expiry of thebid on October 5, 2018, to acquire up to 3,500,000 subordinate voting shares representing at that date approximately4.3% of the public float in respect of the subordinate voting shares. Decisions regarding any future repurchases willbe based on market conditions, share price and other factors including opportunities to invest capital for growth. TheNotice of Intention to Make a Normal Course Issuer Bid is available, without charge, by contacting the CorporateSecretary of the company.
During 2017 and 2016 the company repurchased for cancellation 1,900 and 1,797,848 subordinate voting sharesunder the terms of normal course issuer bids.
Liquidity
The company believes that cash and cash equivalents at December 31, 2017 provides adequate liquidity to meet thecompany’s known significant commitments in 2018, which are principally comprised of the investment in CSB,investment and advisory fees, payable for rights issue (settled January 2018), general and administration expensesand potentially corporate income taxes. The company has the ability to sell a portion of its portfolio investments tosupplement the liquidity requirement to repay the principal amount of the 1 year term loan that matures inJuly 2018. The company expects to continue to receive investment income on its holdings of fixed income securitiesand dividends from its equity investments to supplement its cash and cash equivalents. The company has adequateworking capital to support its operations.
Refer to the Related Party Transactions section of this MD&A for details on the March 9, 2018 settlement of theperformance fee through the issuance of subordinate voting shares to Fairfax.
82

Highlights in 2017 (with comparisons to 2016 except as otherwise noted) of major components of the statements ofcash flows are presented in the following table:
2017 2016
Operating activitiesCash provided by (used in) operating activities before the undernoted (71,430) 17,508Net (purchases) sales of short term investments classified as FVTPL (112) 22,590Purchases of bonds and common stocks classified as FVTPL (812,484)(1) (423,639)Sales of bonds and common stocks classified as FVTPL 78,458 333,591Decrease in restricted cash in support of investments – 6,457
Investing activitiesPurchases of premises and equipment – (128)
Financing activitiesNet proceeds from 1 year term loan 396,978 –Net proceeds from 2 year term loan – 222,248Repayment of 2 year term loan (225,000) –Net decrease (increase) in restricted cash in support of term loans 8,212 (18,810)Issuance of subordinate voting shares, net of issuance costs 493,504 –Repurchases of subordinate voting shares (27) (21,178)
Increase (decrease) in cash and cash equivalents during the year (131,901) 138,639
(1) Excludes $74,202 cash consideration paid attributable to the costs incurred to purchase the additional 10.0% equity interest in BIAL(see note 5 to the consolidated financial statements for the year ended December 31, 2017).
Cash provided by (used in) operating activities before the undernoted is comprised of net earnings adjusted for itemsnot affecting cash and cash equivalents and changes in operating assets and liabilities. Cash used in operatingactivities before the undernoted of $71,430 in 2017 compared to cash provided by operating activities before theundernoted of $17,508 in 2016, with the change principally reflecting $74,202 of costs incurred to purchase theadditional 10.0% equity interest in BIAL, higher investment and advisory fees paid to Fairfax, increased interest paidon the term loans and lower interest income received on Government of India and Indian Corporate bonds, partiallyoffset by lower income taxes paid and higher dividend income received.
Net sales of short term investments classified as FVTPL of $22,590 in 2016 primarily related to net sales ofU.S. treasury bills to support the company’s purchases of Indian Investments. Purchases of bonds and commonstocks classified as FVTPL of $812,484 in 2017 primarily related to investments in BIAL and Saurashtra, additionalinvestments in IIFL and NCML, and purchases of Government of India bonds. Purchases of bonds and commonstocks classified as FVTPL of $423,639 in 2016 primarily related to the investments in Sanmar, Privi, NSE andFairchem. Sales of bonds and common stocks classified as FVTPL of $78,458 and $333,591 in 2017 and 2016 wereprincipally related to the sale of Government of India bonds in 2017 and sale of Indian corporate bonds andinvestment funds in 2016 to partially finance the acquisitions of the Indian Investments noted above. Decrease inrestricted cash in support of investments of $6,457 in 2016 reflected the release of cash in escrow related to theinvestments in IIFL ($3,600) and Fairchem ($2,857). Refer to note 15 (Supplementary Cash Flow Information) to theconsolidated financial statements for the year ended December 31, 2017 for details of purchases and sales ofinvestments classified as FVTPL.
Net proceeds from 1 year term loan of $396,978 in 2017 related to the term loan gross proceeds of $400,000 net of$3,022 in issue costs, where the company used a portion of the net proceeds from the term loan to complete theadditional 10.0% investment in BIAL and participate in the NCML rights issue. Net proceeds from the 2 year termloan of $222,248 in 2016 related to the term loan gross proceeds of $225,000 net of $2,752 in issue costs, where thecompany used a portion of the net proceeds from the term loan to complete the investment in the second tranche ofSanmar bonds ($50,000). Repayment of 2 year term loan of $225,000 in 2017 related to the early settlement of theterm loan on March 31, 2017 upon completion of the secondary Offerings. Net decrease in restricted cash in supportof term loans of $8,212 in 2017 and the net increase in restricted cash in support of term loans of $18,810 in 2016related to the changes in the restricted cash accounts required to be maintained to fund the term loans interestpayments. Refer to note 7 (Term Loans) to the consolidated financial statements for the year ended December 31,2017 for additional details. Issuance of subordinate voting shares, net of issuance costs of $493,504 in 2017 reflectednet proceeds received from the secondary Offerings. Issuance costs were primarily comprised of fees paid to
83

FAIRFAX INDIA HOLDINGS CORPORATION
underwriters of the subordinate voting shares. Refer to note 8 (Common Shareholders’ Equity) to the consolidatedfinancial statements for the year ended December 31, 2017 for details. Repurchases of subordinate voting shares of$27 in 2017 and $21,178 in 2016 related to the company’s repurchases for cancellation of 1,900 and1,797,848 subordinate voting shares in the respective periods.
Contractual Obligations
On February 20, 2018 the company entered into an agreement to acquire a 51.0% equity interest in CSB forapproximately $186,000 at the exchange rate at that date (approximately 12.1 billion Indian rupees). Thetransaction is expected to close in the first half of 2018, subject to customary closing conditions.
On August 8, 2017 Fairfax India participated in NCML’s rights issue on a pro-rata basis for total consideration of$25,602 (approximately 1.6 billion Indian rupees). In January 2018 the remaining 62.5% of the rights issue wascalled by NCML, resulting in the payable for rights issue recorded on the consolidated balance sheet at December 31,2017 to be fully settled by the company.
On July 11, 2017 the company entered into an agreement with a Canadian bank for a 1 year secured term loan with aprincipal amount of $400,000 bearing interest at a rate of LIBOR plus 325 to 375 basis points. The company has theability to sell a portion of its portfolio investments to supplement the liquidity requirement to repay the principalamount of the 1 year term loan that matures in July 2018.
Under the terms of the Investment Advisory Agreement, the company and its subsidiaries are contractually obligatedto pay Fairfax an investment and advisory fee and, if applicable, a performance fee. These fees will vary based on thecompany’s common shareholders’ equity and book value per share.
The investment and advisory fee recorded in the consolidated statements of earnings during 2017 was $27,531(2016 – $12,552).
Refer to the Related Party Transactions section of this MD&A that follows for discussion on the performance feeaccrued at December 31, 2017 and settled on March 9, 2018.
Related Party Transactions
Investment Advisory Agreement
The company and its subsidiaries have entered into an agreement with Fairfax and the Portfolio Advisor to provideadministration and investment advisory services to the company (the ‘‘Investment Advisory Agreement’’). Ascompensation for the provision of these services, the company pays an investment and advisory fee, and ifapplicable, a performance fee. Such fees are determined with reference to the company’s common shareholders’equity.
Performance Fee
The performance fee is accrued quarterly and paid for the first three-year period from January 30, 2015 toDecember 31, 2017 (the ‘‘first calculation period’’) and is calculated, on a cumulative basis, as 20% of any increase incommon shareholders’ equity per share (including distributions) above a 5% per annum increase. The amount ofcommon shareholders’ equity per share at any time which must be achieved before any performance fee would bepayable is sometimes referred to as the ‘‘hurdle per share’’. The company determined that a performance fee of$114,437 was payable at December 31, 2017 (December 31, 2016 – nil) as the book value per share of $15.24 (beforefactoring in the impact of the performance fee) at December 31, 2017 was greater than the hurdle per share of $11.36at that date.
Subsequent to December 31, 2017
On March 9, 2018 the company issued 7,663,685 subordinate voting shares to Fairfax calculated as the performancefee payable at December 31, 2017 of $114,437 divided by the volume-weighted average trading price of thecompany’s subordinate voting shares for the 10 trading days prior to and including December 31, 2017 (‘‘VWAP’’) of$14.93 (in accordance with the Investment Advisory Agreement). Under the terms of the Investment AdvisoryAgreement, settlement of the performance fee will take place in subordinate voting shares of the company if themarket price per share is less than two times the then book value per share. After issuance of the subordinate votingshares, Fairfax’s equity interest in Fairfax India increased to 33.6% from 30.2% at December 31, 2017.
84
The period from January 1, 2018 to December 31, 2020 (the ‘‘second calculation period’’) will be the next consecutivethree-year period after December 31, 2017 for which a performance fee, if applicable, will be accrued quarterly. Theperformance fee for the second calculation period will be calculated as 20% of any increase in the book value pershare at the end of period (before factoring in the impact of the performance fee for the second calculation period)over the higher of: (i) the hurdle per share as described above; or, (ii) the then book value per share at the end of thefirst calculation period (December 31, 2017), adjusted to reflect the issuance of subordinate voting shares onMarch 9, 2018 to settle the first calculation period performance fee, referred to as the ‘‘high water mark per share’’.Under the Investment Advisory Agreement, the performance fee, if applicable, will be paid within 30 days after thecompany issues its annual audited consolidated financial statements for the year ended December 31, 2020, insubordinate voting shares of the company unless the market prices per share of those shares is more than two timesthe then book value per share, in which event Fairfax may elect to receive that fee in cash.
For additional details on the company’s related party transactions, see note 12 (Related Party Transactions) to theconsolidated financial statements for the year ended December 31, 2017.
Accounting and Disclosure Matters
Management’s Evaluation of Disclosure Controls and Procedures
Under the supervision and with the participation of the company’s management, including the company’s CEO andCFO, the company conducted an evaluation of the effectiveness of its disclosure controls and procedures as ofDecember 31, 2017, as required by the Canadian securities legislation. Disclosure controls and procedures aredesigned to ensure that the information required to be disclosed by the company in the reports it files or submitsunder securities legislation is recorded, processed, summarized and reported on a timely basis and that suchinformation is accumulated and reported to management, including the company’s CEO and CFO, as appropriate, toallow required disclosures to be made in a timely fashion. Based on their evaluation, the CEO and CFO haveconcluded that as of December 31, 2017, the company’s disclosure controls and procedures were effective.
Management’s Report on Internal Control Over Financial Reporting
The company’s management is responsible for establishing and maintaining adequate internal control over financialreporting (as defined under National Instrument 52-109). The company’s internal control over financial reporting isa process designed to provide reasonable assurance regarding the reliability of financial reporting and thepreparation of financial statements for external purposes in accordance with International Financial ReportingStandards (‘‘IFRS’’) as issued by the International Accounting Standards Board (‘‘IASB’’). A company’s internal controlover financial reporting includes those policies and procedures that (i) pertain to the maintenance of records that, inreasonable detail, accurately and fairly reflect the transactions and dispositions of the assets of the company;(ii) provide reasonable assurance that transactions are recorded as necessary to permit preparation of financialstatements in accordance with IFRS and that receipts and expenditures of the company are being made only inaccordance with authorizations of management and directors of the company; and (iii) provide reasonable assuranceregarding prevention or timely detection of unauthorized acquisition, use, or disposition of the company’s assetsthat could have a material effect on the consolidated financial statements.
Because of its inherent limitations, internal control over financial reporting may not prevent or detectmisstatements. Also, projections of any evaluation of effectiveness to future periods are subject to the risk thatcontrols may become inadequate because of changes in conditions, or that the degree of compliance with thepolicies or procedures may deteriorate.
The company’s management assessed the effectiveness of the company’s internal control over financial reporting asof December 31, 2017. In making this assessment, the company’s management used the criteria set forth by theCommittee of Sponsoring Organizations of the Treadway Commission (‘‘COSO’’) in Internal Control – IntegratedFramework (2013). The company’s management, including the CEO and CFO, concluded that, as of December 31,2017, the company’s internal control over financial reporting was effective based on the criteria in Internal Control –Integrated Framework (2013) issued by COSO.
Critical Accounting Estimates and Judgments
Please refer to note 4 (Critical Accounting Estimates and Judgments) to the consolidated financial statements for theyear ended December 31, 2017.
85

FAIRFAX INDIA HOLDINGS CORPORATION
Significant Accounting Policy Changes
There were no significant accounting policy changes during 2017. Please refer to note 3 (Summary of SignificantAccounting Policies) to the consolidated financial statements for the year ended December 31, 2017 for a detaileddiscussion of the company’s accounting policies.
Future Accounting Changes
Certain new IFRS may have a significant impact on the company’s consolidated financial reporting in the future.Each of those standards will require a moderate degree of implementation effort within the next year as describedbelow. The company does not expect to adopt any of these new standards in advance of their respective effectivedates. New IFRS standards and amendments that have been issued but are not yet effective are also described innote 3 (Summary of Significant Accounting Policies) to the consolidated financial statements for the year endedDecember 31, 2017.
IFRS 9 Financial Instruments (‘‘IFRS 9’’)
In July 2014 the IASB issued the complete version of IFRS 9 which will supersede the 2010 version of IFRS 9 currentlyapplied by the company. This complete version is effective for annual periods beginning on or after January 1, 2018,with retrospective application, and includes: requirements for the classification and measurement of financial assetsand liabilities; an expected credit loss model that replaces the existing incurred loss impairment model; and newhedge accounting guidance.
The company evaluated the impact of IFRS 9 by assessing its business models and the cash flow characteristics of itsfinancial assets to determine their appropriate classifications under the new standard, and is nearing completion ofthat analysis. The company expects equity investments held within the company’s investment portfolio to continueto be classified as FVTPL under IFRS 9, and the classification of financial liabilities to also remain substantiallyunchanged compared to the 2010 version of IFRS 9. The company continues to monitor and consider evolvingguidance and interpretations related to IFRS 9 as it works through the classification analysis for its investments indebt instruments. Upon adopting IFRS 9 on January 1, 2018 the company does not expect to restate comparativeperiods, and will record any necessary adjustments to opening retained earnings as permitted by the standard.
Risk Management
Overview
The primary goals of the company’s financial risk management program are to ensure that the outcomes of activitiesinvolving elements of risk are consistent with the company’s objectives and risk tolerance, while maintaining anappropriate balance between risk and reward and protecting the company’s consolidated balance sheets from eventsthat have the potential to materially impair its financial strength. There were no significant changes in the types ofthe company’s risk exposures or the processes used by the company for managing those risk exposures atDecember 31, 2017 compared to those identified at December 31, 2016 and disclosed in the company’s 2016 AnnualReport, other than as outlined in note 11 (Financial Risk Management) to the consolidated financial statements forthe year ended December 31, 2017.
Risks
The following risks, among others, should be considered in evaluating the outlook for the company. Additional risksnot currently known to the company or that are currently deemed immaterial may also impair business operations.The company, its consolidated subsidiaries, Fairfax and the Portfolio Advisor monitor these risks on an on-goingbasis and take actions as needed to mitigate their impact.
Weather Risk
Certain Indian Investments are operating in industries exposed to weather risk. The revenues of these portfoliocompanies may be adversely affected during a period of severe weather conditions in India. Because weather eventsare unpredictable by nature, historical results of operations of certain Indian Investments may not be indicative oftheir future results of operations. As a result of the occurrence of one or more major weather catastrophes in anygiven period, the expected returns from Indian Investments impacted by weather risk may fall short of thecompany’s expectations.
86

A significant increase in the price of crude oil could adversely affect the Indian economy whichcould adversely affect Indian Investments
India imports a majority of its requirements of petroleum oil and petroleum products. The Government of India hasderegulated prices and has been reducing the subsidy in respect of certain oil products, resulting in internationalcrude prices having a greater effect on domestic oil prices. Global oil prices continue to be volatile, any increase orvolatility in oil prices, as well as the impact of Indian rupee depreciation, which makes imports more expensive, andthe pass-through of such increases to Indian consumers could have a material adverse impact on the Indianeconomy, including a rise in inflation and market interest rates resulting in a significant impact on the profitabilityof certain Indian Investments. Government of India announced plans to increase its crude oil refining capacity, withthe increase happening gradually over the next 12 years as India seeks to satisfy its growing demand for fuel, whichmay result in reducing the affect of global oil prices on the Indian economy.
Geographic Concentration of Investments
All of the company’s investments will be made in India and in Indian businesses or other businesses with customers,suppliers or business primarily conducted in, or dependent on, India. As a result, the company’s performance will beparticularly sensitive to economic changes in India. The market value of the company’s investments, the incomegenerated by the company and the company’s performance will be particularly sensitive to changes in the economiccondition and regulatory environment in India. Adverse changes in the economic condition or regulatoryenvironment of India may have a material adverse effect on the company’s business, cash flows, financial conditionand net earnings.
Foreign Currency Fluctuation
All of the company’s investments will be made in India and Indian businesses or other businesses with customers,suppliers or business primarily conducted in, or dependent on, India, and the financial position and results for theseinvestments are principally denominated in Indian rupees. The functional currency of the company and itsconsolidated subsidiaries (FIH Mauritius and FIH Private) is the Indian rupee and the company’s presentationcurrency is the U.S. dollar.
The company presents its consolidated financial statements in U.S. dollars to provide comparability with otherNorth American investment entities.
Accordingly, the income and expenses are translated at the average rates of exchange in effect during the applicablereporting period. Assets and liabilities are translated at the exchange rates in effect at the balance sheet date. As aresult, the company’s consolidated financial position is subject to foreign currency fluctuation risk, which couldmaterially adversely impact its operating results and cash flows. Although the company may enter into currencyhedging arrangements in respect of its foreign currency cash flows, there can be no assurance that the company willdo so or, if it does, that the full amount of the foreign currency exposure will be hedged at any time.
Volatility of the Indian Securities Markets
Stock exchanges in India have, in the past, experienced substantial fluctuations in the prices of listed securities. Thestock exchanges in India have also experienced temporary exchange closures, broker defaults, settlement delays andstrikes by brokerage firm employees. In addition, the governing bodies of the stock exchanges in India have, fromtime to time, imposed restrictions on trading in certain securities, limitations on price movements and marginrequirements. Furthermore, from time to time, disputes have occurred between listed businesses and stockexchanges and other regulatory bodies, which in some cases may have had a negative effect on market sentiment.
Investments May Be Made In Indian Private Businesses Where Information Is Unreliableor Unavailable
In pursuing the company’s investment strategy, the company may seek to make investments in privately-heldbusinesses. As minimal public information exists about private businesses, the company could be required to makeinvestment decisions on whether to pursue a potential investment in a private business on the basis of limitedinformation, which may result in an investment in a business that is not as profitable as the company initially
87

FAIRFAX INDIA HOLDINGS CORPORATION
believed, if at all. Investments in private businesses pose certain incremental risks as compared to investments inpublic businesses, including that they:
• have reduced access to the capital markets, resulting in diminished capital resources and ability to withstandfinancial distress;
• may have limited financial resources and may be unable to meet their obligations under their debt securitiesthat the company may hold, which may be accompanied by a deterioration in the value of any collateral and areduction in the likelihood of the company realizing any guarantees that it may have obtained in connectionwith its investment;
• may have shorter operating histories, narrower product lines and smaller market shares than larger businesses,which tend to render them more vulnerable to competitors’ actions and changing market conditions, as wellas general economic downturns;
• are more likely to depend on the management talents and efforts of a small group of persons; therefore, thedeath, disability, resignation or termination of one or more of these persons could have a material adverseimpact on an investment and, as a result, the company; and
• generally have less predictable operating results, may from time to time be parties to litigation, may beengaged in rapidly changing businesses with products subject to a substantial risk of obsolescence, and mayrequire substantial additional capital to support their operations, finance expansion or maintain theircompetitive position.
Valuation Methodologies Involve Subjective Judgments
For purposes of IFRS-compliant financial reporting, the company’s financial assets and liabilities are valued inaccordance with IFRS. Accordingly, the company is required to follow a specific framework for measuring the fairvalue of its investments and, in its audited consolidated financial statements, to provide certain disclosures regardingthe use of fair value measurements.
The fair value measurement accounting guidance establishes a hierarchal disclosure framework that ranks theobservability of market inputs used in measuring financial instruments at fair value. The observability of inputsdepends on a number of factors, including the type of financial instrument, the characteristics specific to thefinancial instrument and the state of the marketplace, including the existence and transparency of transactionsbetween market participants. Financial instruments with readily quoted prices, or for which fair value can bemeasured from quoted prices in active markets, generally will have a high degree of market price observability andless judgment applied in determining fair value.
A portion of the company’s portfolio investments may be in the form of securities that are not publicly traded. Thefair value of securities and other investments that are not publicly traded may not be readily determinable. Thecompany will value these securities quarterly at fair value as determined in good faith by the company and inaccordance with the valuation policies and procedures under IFRS. The company may utilize the services of anindependent valuation firm to aid it in determining the fair value of these securities. The types of factors that may beconsidered in fair value pricing of the company’s investments include the nature and realizable value of anycollateral, the portfolio business’ ability to make payments and its earnings, the markets in which the portfolioinvestment does business, comparisons to publicly traded companies, discounted cash flows and other relevantfactors. Because such valuations, and particularly valuations of private securities and private companies, areinherently uncertain, such valuations may fluctuate over short periods of time and may be based on estimates, andthe company’s determinations of fair value may differ materially from the values that would have been used if aready market for these securities existed. The value of the company’s total assets could be materially adverselyaffected if the company’s determinations regarding the fair value of its investments were materially higher than thevalues that it ultimately realizes upon the disposition of such securities.
The value of the company’s investment portfolio may also be affected by changes in accounting standards, policies orpractices. From time to time, the company will be required to adopt new or revised accounting standards orguidance. It is possible that future accounting standards that the company is required to adopt could change thevaluation of the company’s investments.
Due to a wide variety of market factors and the nature of certain securities to be held by the company, there is noguarantee that the value determined by the company or any third-party valuation agents will represent the value
88
that will be realized by the company on the eventual disposition of the investment or that would, in fact, be realizedupon an immediate disposition of the investment. Moreover, the valuations to be performed by the company or anythird-party valuation agents are inherently different from the valuation of the company’s securities that would beperformed if the company were forced to liquidate all or a significant portion of its securities, as liquidation valuationcould be materially lower.
Pace of Completing Investments
The company’s business is to identify, with the assistance of the Portfolio Advisor, suitable investment opportunities,pursuing such opportunities and consummating such investment opportunities. If the company is unable to sourceand manage its investments effectively, it would adversely impact the company’s financial position and net earnings.There can be no assurance as to the pace of finding and implementing investment opportunities. Conversely, theremay only be a limited number of suitable investment opportunities at any given time. This may cause the company,while it deploys cash proceeds not yet invested, to hold significant levels of cash, cash equivalents, short termU.S. treasury bills or Government of India or Indian corporate bonds. A lengthy period prior to which capital isdeployed may adversely affect the company’s overall performance.
Minority Investments
The company may make minority equity investments in businesses in which the company does not participate inthe management or otherwise influence the business or affairs of such businesses. The company will monitor theperformance of each investment and maintain an ongoing dialogue with each business’ management team.However, day-to-day operations will primarily be the responsibility of each business’ management team and thecompany may not have the right to influence such operations.
Reliance on Key Personnel and Risks Associated with the Investment Advisory Agreement
The management and governance of the company depends on the services of certain key personnel, including thePortfolio Advisor, Fairfax, as administrator, and certain executive officers of the company. The loss of the services ofany key personnel, particularly V. Prem Watsa and Chandran Ratnaswami, could have a material adverse effect onthe company and materially adversely affect the company’s financial condition and net earnings.
The company will rely on the Portfolio Advisor and its affiliates, from time to time with respect to the sourcing of itsinvestments. Consequently, the company’s ability to achieve its investment objectives depends in large part on thePortfolio Advisor and its ability to identify and advise the company on attractive investment opportunities. Thismeans that the company’s investments are dependent upon the Portfolio Advisor’s business contacts, its ability tosuccessfully hire, train, supervise and manage its personnel and its ability to maintain its operating systems. If thecompany were to lose the services provided by the Portfolio Advisor or its key personnel or if the Portfolio Advisorfails to satisfactorily perform its obligations under the Investment Advisory Agreement, the company’s investmentsand growth prospects may decline.
The company may be unable to duplicate the quality and depth of management from the Portfolio Advisor if thecompany were to source and manage its own investments or if it were to hire another investment advisor. If thePortfolio Advisor should cease, for whatever reason, to be the investment advisor of the company or if Fairfax shouldcease to provide investment administration services to the company, the cost of obtaining substitute services may begreater than the fees the company will pay the Portfolio Advisor and Fairfax under the Investment AdvisoryAgreement, and this may adversely affect the company’s ability to meet its objectives and execute its strategy whichcould materially and adversely affect the company’s cash flows, net earnings and financial condition.
Lawsuits
The company operates in Canada, Mauritius and India and may, from time to time, become party to a variety of legalclaims and regulatory proceedings. The existence of such claims against the company and its consolidatedsubsidiaries, directors or officers could have adverse effects, including the incurrence of significant legal expensesdefending claims, even those without merit.
The company and its consolidated subsidiaries manage day-to-day regulatory and legal risk primarily byimplementing appropriate policies, procedures and controls. Internal and external counsels also work closely withthe company and its consolidated subsidiaries to identify and mitigate areas of potential regulatory and legal risk.
89

FAIRFAX INDIA HOLDINGS CORPORATION
Use of Leverage
The company may rely on the use of leverage when making its investments. As such, the ability to achieve attractiverates of return on such investments will significantly depend on the company’s continued ability to access sources ofdebt financing on attractive terms. An increase in either market interest rates or in the risk spreads demanded bylenders would make it more expensive for the company to finance its investments and, in turn, would reduce netreturns therein. Increases in interest rates could also make it more difficult for the company to locate andconsummate investments because other potential buyers, including operating companies acting as strategic buyers,may be able to bid for an asset at a higher price due to a lower overall cost of capital. Availability of capital from debtcapital markets is subject to significant volatility and the company may not be able to access those markets onattractive terms, or at all, when completing an investment. Any of the foregoing circumstances could have a materialadverse effect on the financial condition and results of operations of the company.
Significant Shareholder
Fairfax, through its subsidiaries, own 30,000,000 multiple voting shares. During 2016, certain Fairfax subsidiariespurchased 796,864 subordinate voting shares through open market transactions. During 2017, Fairfax acquired anadditional 13,717,873 subordinate voting shares from the company by way of a private placement (see note 8(Common Shareholders’ Equity) to the consolidated financial statements for the year ended December 31, 2017) andopen market transactions. At December 31, 2017 Fairfax’s multiple and subordinate voting share holdingsrepresented 93.6% of the voting rights and 30.2% of the equity interest in Fairfax India (December 31, 2016 – 95.3%and 29.4% respectively). In accordance with the Investment Advisory Agreement, the performance fee payable toFairfax for the first calculation period (ending on December 31, 2017) was settled on March 9, 2018 by the companyissuing 7,663,685 subordinate voting shares to Fairfax. The issuance of these subordinate voting shares increasedFairfax’s equity interest in Fairfax India from 30.2% at December 31, 2017 to 33.6% (see note 12 (Related PartyTransactions) to the consolidated financial statements for the year ended December 31, 2017). Fairfax has the abilityto substantially influence certain actions requiring shareholder approval, including approving an IndianInvestment, liquidation or sale of assets, electing members of the Board of Directors and adopting amendments toarticles of incorporation and by-laws.
Taxation Risks
The company structures its business according to prevailing taxation law and practice in Canada, Mauritius andIndia. Any change in tax policy, tax legislation (including in relation to taxation rates), the interpretation of taxpolicy or legislation or practice could adversely affect the company’s return earned on investments and on the capitalavailable to be invested. Further, taxes and other constraints that would apply to the company and its consolidatedsubsidiaries in such jurisdictions may not apply to other parties, and such parties may therefore have a significantlylower effective cost of capital and a corresponding competitive advantage in pursuing investments. A number ofother factors may increase the effective tax rates, which would have a negative impact on net earnings. Theseinclude, but are not limited to, changes in the valuation of our deferred tax assets and liabilities, and anyreassessment of taxes by a taxation authority.
The company utilizes Fairfax’s tax specialist personnel for assessing the income tax consequences of plannedtransactions and events and undertaking the appropriate tax planning. The company also consults with external taxprofessionals as needed. Tax legislation of each jurisdiction in which the company operates is interpreted todetermine income taxes and expected timing of the reversal of deferred income tax assets and liabilities. Anyamendments to the capital gains and permanent establishment articles in the India-Mauritius Double TaxationAvoidance Agreement may result in capital gains derived from the company or its investments in India becomingsubject to tax in India, which could have a material adverse effect on the company’s business, financial conditionand net earnings. During the second quarter of 2016, India and Mauritius amended their double income tax treaty(‘‘India-Mauritius tax treaty’’). As a result, investments acquired up to April 1, 2017 will not be assessed by India fortax on their future disposition. After April 1, 2017, India will levy capital gains tax at half the India domestic rate onequity investments purchased or sold through Mauritius until March 31, 2019 and at the full rate from April 1,2019 onward.
90

On February 1, 2018 the Government of India released its Union Budget proposals for fiscal year 2018-19(the ‘‘Budget’’). The Budget proposes to repeal, with effect from April 1, 2018, the long term capital gains taxexemption in India that is available in respect of certain transfers of listed equity shares of Indian companies onwhich Securities Transaction Tax is paid at the time of acquisition and transfer of such shares. Long term capital gainsrealized on such transfers are generally proposed to be taxed at a rate of 10.0%. However, grandfathering of the longterm capital gains exemption in respect of any accrued gain on such shares held as of January 31, 2018 will generallybe available to the extent of the accrued gain as of January 31, 2018. Capital gains realized by a tax resident ofMauritius on a transfer of equity shares of an Indian company which were acquired prior to April 1, 2017 willcontinue to be exempt from capital gains tax in India by virtue of the India-Mauritius tax treaty, notwithstanding therepeal of the long term capital gains tax exemption under Indian domestic law. In addition, a long term capital gainrealized by a Mauritius tax resident on shares acquired after April 1, 2017, and sold prior to March 31, 2019, willcontinue to be taxed at the rate of 50.0% of the prevailing domestic Indian capital gains tax rate by virtue of theIndia-Mauritius tax treaty. The company is currently evaluating the potential impact of the Budget and the potentialapplication of capital gains tax in India on any future dispositions of investments in equity shares held byFIH Mauritius.
Emerging Markets
The company’s investment objective is to achieve long-term capital appreciation, while preserving capital, byinvesting in Indian Investments. Foreign investment risk is particularly high given that the company invests insecurities of issuers based in or doing business in an emerging market country.
The economies of emerging market countries have been and may continue to be adversely affected by economicconditions in the countries with which they trade. The economies of emerging market countries may also bepredominantly based on only a few industries or dependent on revenues from particular commodities.
Also, because publicly traded debt instruments of emerging market issuers represent a relatively recent innovation inthe world debt markets, there is little historical data or related market experience concerning the attributes of suchinstruments under all economic, market and political conditions.
Other heightened risks associated with emerging markets investments include without limitation: (i) risks due to lesssocial, political and economic stability, including the risk of war, terrorism, nationalization, limitations on theremoval of funds or other assets, or diplomatic developments that affect investments in these countries; (ii) thesmaller size of the market for such securities and a lower volume of trading, resulting in a lack of liquidity and in pricevolatility; (iii) certain national policies which may restrict the company’s investment opportunities, includingrestrictions on investing in issuers or industries deemed sensitive to relevant national interests and requirements thatgovernment approval be obtained prior to investment by foreign persons; (iv) certain national policies that mayrestrict the company’s repatriation of investment income, capital or the proceeds of sales of securities, includingtemporary restrictions on foreign capital remittances; (v) the lack of uniform accounting and auditing standardsand/or standards that may be significantly different from the standards required in Canada; (vi) less publiclyavailable financial and other information regarding issuers; (vii) potential difficulties in enforcing contractualobligations; and (viii) higher rates of inflation, higher interest rates and other economic concerns. The company mayinvest to a substantial extent in emerging market securities that are denominated in Indian rupees, subjecting thecompany to a greater degree of foreign currency risk.
As reflected in the above discussion, investments in emerging market securities involve a greater degree of risk than,and special risks in addition to the risks associated with, investments in domestic securities or in securities of foreigndeveloped countries.
91

FAIRFAX INDIA HOLDINGS CORPORATION
Economic Risk
The Indian economy has grown rapidly during the past several years and there is no assurance that this growth ratewill be maintained. India may experience substantial (and, in some cases, extremely high) rates of inflation oreconomic recessions causing a negative effect on the Indian economy. India may also impose restrictions on theexchange or export of currency, institute adverse currency exchange rates or experience a lack of available currencyhedging instruments. Any of these events could have a material adverse effect on the Indian economy.
Trading Price of Common Shares Relative to Book Value per Share
The company is neither a mutual fund nor an investment fund, and due to the nature of its business and investmentstrategy, and the composition of its investment portfolio, the market price of its common shares, at any time, mayvary significantly from its book value per share. This risk is separate and distinct from the risk that the market price ofthe common shares may decrease.
Other
Quarterly Data (unaudited)
First Second Third FourthUS$ thousands, except per share amounts Quarter Quarter Quarter Quarter Full Year
2017Income (loss) 208,108 337,980 (66,455) 130,037 609,670Expenses (recovery) 54,117 73,067 (9,190) 41,585 159,579Provision for (recovery of) income taxes 4,988 (3,682) (4,111) 387 (2,418)Net earnings (loss) 149,003 268,595 (53,154) 88,065 452,509Net earnings (loss) per share $ 1.05 $ 1.82 $ (0.36) $ 0.60 $ 3.10Net earnings (loss) per diluted share $ 1.03 $ 1.74 $ (0.36) $ 0.57 $ 2.94
2016Income 7,775 33,917 75,346 11,566 128,604Expenses 3,897 3,967 5,760 8,036 21,660Provision for (recovery of) income taxes 3,136 (8,309) 3,186 1,106 (881)Net earnings 742 38,259 66,400 2,424 107,825Net earnings per share $ 0.01 $ 0.36 $ 0.62 $ 0.02 $ 1.01Net earnings per diluted share $ 0.01 $ 0.36 $ 0.62 $ 0.02 $ 1.01
First Second Third FourthIndian rupees and in millions, except per share amounts(1) Quarter Quarter Quarter Quarter Full Year
2017Income (loss) 13,929 21,937 (4,599) 8,416 39,683Expenses (recovery) 3,622 4,731 (661) 2,695 10,387Provision for (recovery of) income taxes 334 (248) (269) 25 (158)Net earnings (loss) 9,973 17,454 (3,669) 5,696 29,454Net earnings (loss) per share 70.35 118.38 (24.89) 38.63 201.69Net earnings (loss) per diluted share 68.64 113.21 (24.89) 36.73 191.63
2016Income 525 2,276 5,041 784 8,626Expenses 263 265 384 541 1,453Provision for (recovery of) income taxes 212 (559) 216 74 (57)Net earnings 50 2,570 4,441 169 7,230Net earnings per share 0.47 24.10 41.63 1.60 68.00Net earnings per diluted share 0.47 24.10 41.63 1.60 68.00
(1) Presented in the company’s functional currency.
Total income of $130,037 in the fourth quarter of 2017 increased from $11,566 in the fourth quarter of 2016primarily as a result of increased net change in unrealized gains on investments and other costs. Net change inunrealized gains on investments of $113,773 in the fourth quarter 2017 included net unrealized gains on commonstock of $121,274 (principally related to unrealized gains on IIFL and Fairchem, partially offset by unrealized losseson NCML and Saurashtra), partially offset by unrealized losses on bonds of $7,501 (principally related toGovernment of India and Indian corporate bonds, partially offset by unrealized gains on Sanmar bonds). Net changein unrealized gains on investments of $4,765 in the fourth quarter of 2016 included net unrealized gains on bonds of$5,702 (primarily unrealized gains on Sanmar and Government of India bonds).
92

In addition, total income increased in the fourth quarter of 2017 compared to the fourth quarter of 2016 as a result ofincreased net foreign exchange gains (principally as a result of the strengthening of the Indian rupee relative to theU.S. dollar during 2017), and increased interest income (primarily due to increased holdings of Government of Indiabonds), partially offset by decreased net realized gains on investments (principally related the disposition of theremaining investment in investment funds in the fourth quarter of 2016).
Total expenses of $41,585 in the fourth quarter of 2017 increased from $8,036 in the fourth quarter of 2016,primarily related to the performance fee (principally from increased net unrealized gains on investments describedabove) and higher investment and advisory fees (reflecting the increased holdings of Indian Investments). Totalexpenses in the fourth quarter of 2017 also included interest expense related to the 1 year term loan, compared to thefourth quarter of 2016 which included interest expense on the 2 year term loan.
The company reported net earnings of $88,065 (net earnings of $0.60 per basic share) in the fourth quarter of 2017compared to net earnings of $2,424 (net earnings of $0.02 per basic share) in the fourth quarter of 2016. The increasein profitability in the fourth quarter of 2017 primarily reflected increased net unrealized gains on investments andnet foreign exchange gains, partially offset by the performance fee and increased investment and advisory fees andinterest expense.
Individual quarterly results have been (and are expected to continue to be) significantly impacted by net unrealizedgains or losses on investments, the timing of which is not predictable.
Stock Prices and Share Information
At March 9, 2018 the company had 125,096,316 subordinate voting shares and 30,000,000 multiple voting sharesoutstanding (an aggregate of 155,096,316 common shares effectively outstanding). Each subordinate voting sharecarries one vote per share at all meetings of shareholders except for separate meetings of holders of another class ofshares. Each multiple voting share carries fifty votes per share at all meetings of shareholders except for separatemeetings of holders of another class of shares. The multiple voting shares are not traded.
The table that follows presents the TSX high, low and closing U.S. dollar prices of the subordinate voting shares ofFairfax India, trading under the symbol FIH.U, for each quarter of 2017 and 2016.
First Second Third FourthQuarter Quarter Quarter Quarter
(US$)
2017High 13.89 17.22 18.99 18.94Low 11.10 13.01 15.51 14.55Close 13.20 15.99 17.65 15.00
2016High 10.98 12.00 11.36 12.00Low 9.25 10.00 9.97 10.73Close 10.85 10.50 11.00 11.55
Compliance with Corporate Governance Rules
Fairfax India is a Canadian reporting issuer with securities listed on the TSX and trading in U.S. dollars under thesymbol FIH.U. It has in place corporate governance practices that comply with all applicable rules and substantiallycomply with all applicable guidelines and policies of the Canadian Securities Administrators and the practices setout therein.
The company’s Board of Directors has adopted a set of Corporate Governance Guidelines (which include a writtenmandate of the Board), established an Audit Committee and Governance, Compensation and NominatingCommittee, approved written charters for all of its committees, approved a Code of Business Conduct and Ethicsapplicable to all directors, officers and employees of the company and established, in conjunction with the AuditCommittee, a Whistleblower Policy. The company continues to monitor developments in the area of corporategovernance as well as its own procedures.
93

FAIRFAX INDIA HOLDINGS CORPORATION
Forward-Looking Statements
This annual report may contain forward-looking information within the meaning of applicable securities legislation.Forward-looking statements may relate to the company’s or an Indian Investment’s future outlook and anticipatedevents or results and may include statements regarding the financial position, business strategy, growth strategy,budgets, operations, financial results, taxes, dividends, plans and objectives of the company. Particularly, statementsregarding future results, performance, achievements, prospects or opportunities of the company, an IndianInvestment, or the Indian market are forward-looking statements. In some cases, forward-looking statements can beidentified by the use of forward-looking terminology such as ‘‘plans’’, ‘‘expects’’ or ‘‘does not expect’’, ‘‘is expected’’,‘‘budget’’, ‘‘scheduled’’, ‘‘estimates’’, ‘‘forecasts’’, ‘‘intends’’, ‘‘anticipates’’ or ‘‘does not anticipate’’ or ‘‘believes’’, orvariations of such words and phrases or state that certain actions, events or results ‘‘may’’, ‘‘could’’, ‘‘would’’,‘‘might’’, ‘‘will’’ or ‘‘will be taken’’, ‘‘occur’’ or ‘‘be achieved’’.
Forward-looking statements are based on the opinions and estimates of the company as of the date of this annualreport, and they are subject to known and unknown risks, uncertainties, assumptions and other factors that maycause the actual results, level of activity, performance or achievements to be materially different from thoseexpressed or implied by such forward-looking statements, including but not limited to the following factors:taxation of the company and its subsidiaries; substantial loss of capital; long-term nature of investment; limitednumber of investments; geographic concentration of investments; potential lack of diversification; financial marketfluctuations; pace of completing investments; control or significant influence position risk; minority investments;ranking of company investments and structural subordination; follow-on investments; prepayments of debtinvestments; risks upon dispositions of investments; bridge financings; reliance on key personnel; effect of fees;performance fee could induce Fairfax to make speculative investments; operating and financial risks of investments;allocation of personnel; potential conflicts of interest; employee misconduct at the portfolio advisor could harm thecompany; valuation methodologies involve subjective judgments; lawsuits; foreign currency fluctuation; derivativerisks; unknown merits and risks of future investments; resources could be wasted in researching investmentopportunities that are not ultimately completed; investments may be made in foreign private businesses whereinformation is unreliable or unavailable; illiquidity of investments; competitive market for investmentopportunities; use of leverage; investing in leveraged businesses; regulation; investment and repatriation restrictions;aggregation restrictions; restrictions relating to debt securities; pricing guidelines; emerging markets; corporatedisclosure, governance and regulatory requirements; legal and regulatory risks; volatility of the Indian securitiesmarkets; political, economic, social and other factors; governance issues risk; Indian tax law; changes in law;exposure to permanent establishment; enforcement of rights; smaller company risk; due diligence and conduct ofpotential investment entities; Asian economic risk; reliance on trading partners risk; natural disaster risks;government debt risk; and economic risk. Additional risks and uncertainties are described in the company’s annualinformation form which is available on SEDAR at www.sedar.com and on the company’s website atwww.fairfaxindia.ca. These factors and assumptions are not intended to represent a complete list of the factors andassumptions that could affect the company. These factors and assumptions, however, should be considered carefully.
Although the company has attempted to identify important factors that could cause actual results to differ materiallyfrom those contained in forward-looking statements, there may be other factors that cause results not to be asanticipated, estimated or intended. There can be no assurance that such statements will prove to be accurate, asactual results and future events could differ materially from those anticipated in such statements. Accordingly,readers should not place undue reliance on forward-looking statements. The company does not undertake to updateany forward-looking statements contained herein, except as required by applicable securities laws.
94

Directors of the Company Officers of the Company
Anthony F. Griffiths Jennifer AllenCorporate Director Chief Financial Officer
Christopher D. Hodgson Keir HuntPresident General Counsel and Corporate SecretaryOntario Mining Association
Chandran RatnaswamiAlan D. Horn Chief Executive OfficerPresident and Chief Executive Officer
John VarnellRogers Telecommunications LimitedVice President, Corporate Affairs
Deepak ParekhV. Prem WatsaChairmanChairmanHousing Development Finance Corporation Limited
Harsha Raghavan Head OfficeManaging Director and Chief Executive Officer
95 Wellington Street WestFairbridge Capital Private LimitedSuite 800
Chandran Ratnaswami Toronto, Ontario, Canada M5J 2N7Chief Executive Officer of the Company Telephone: (416) 367-4755
Website: www.fairfaxindia.caV. Prem WatsaChairman of the Company
Auditor
Operating Management PricewaterhouseCoopers LLP
FIH Mauritius Investments Ltd.Transfer Agents and Registrars
Amy TanComputershare Trust Company of Canada, TorontoChief Executive Officer
Share Listing
Toronto Stock ExchangeStock Symbol: FIH.U
Annual Meeting
The annual meeting of the shareholders ofFairfax India Holdings Corporation will beheld on Thursday, April 26, 2018 at 2:00 p.m.(Toronto time) at Roy Thomson Hall,60 Simcoe Street, Toronto, Canada
95
