contentslegendmining.com.au/.../2012/02/annual-report-2016.pdf · 2017-04-03 · 4 2016 annual...
TRANSCRIPT

CONTENTS
PageCompany Directory 1Chairman’s Report 2Directors’ Review of Activities 3Corporate Governance Statement 12Directors’ Report 13Consolidated Statement of Comprehensive Income 21Consolidated Statement of Financial Position 22Consolidated Statement of Cash Flows 23Consolidated Statement of Changes in Equity 24Notes to the Financial Statements 25Directors’ Declaration 51Declaration of Auditor’s Independence 52Independent Auditor’s Report 53Shareholder Information 58Tenement Listing 59
Webwww.legendmining.com.au
ASX CodeLEG – ordinary shares
ACN 060 966 145
2016 ANNUAL REPORT
COMPANY DIRECTORYFor the year ended 31 December 2016
LEGEND MINING LIMITED 1
Directors
Michael William Atkins (Chairman)
Mark William Wilson (Managing Director)
Derek William Waterfield (Executive Director-Technical)
Secretary
Tony Walsh
Registered Office
Level 18 Kings Park RoadWEST PERTH WA 6005
Telephone: (08) 9212 0600Facsimile: (08) 9212 0611
Bankers
Australian and New Zealand Banking Group Ltd1275 Hay StreetWEST PERTH WA 6005
Auditors
Ernst & Young11 Mounts Bay RoadPERTH WA 6000
Home Exchange
Australian Securities Exchange2 The EsplanadePERTH WA 6000
Share Registry
Advanced Share Registry Services110 Stirling HighwayNEDLANDS WA 6009
Telephone: (08) 9389 8033Facsimile: (08) 9389 7871

2
CHAIRMAN’S REPORTFor the year ended 31 December 2016
2016 ANNUAL REPORT2
The last year has seen Legend continue to carry out exploration of its Rockford Project, located in the Fraser Range in Western Australia. The Fraser Range hosts Independence Group’s Nova- Bollinger Project which is now commencing first production, having been discovered only four and a half years ago. Legend has circa 2,792 km2 wholly within the Fraser Zone, which Legend regards as the most prospective area of the Fraser Range for a repeat of a Nova-Bollinger style deposit.
Legend continues to use state of the art geo-sensing moving loop electromagnetic surveys (MLTEM) to identify prospective conductors, together with a supporting program of aircore drilling to identify the rock types considered suitable to host a nickel-copper deposit. The MLTEM surveys identified conductors in several areas and follow up reverse circulation and diamond drilling revealed anomalous nickel and copper mineralisation in ultramafic host rock. The aircore drilling program to date, has also provided Legend with geological knowledge that supports Legend’s belief that the Rockford Project is highly prospective for nickel-copper mineralisation associated with mafic/ultramafic intrusive bodies such as those found at Nova-Bollinger.
Whilst we do not wish to get carried away with this initial technical success, we are very pleased with the progress to date and remain optimistic that we are working in an area capable of hosting an economic nickel-copper deposit, but of course on the understanding that considerable work and good fortune is still required.
Legend remains well funded to continue its important work. It is also pleasing that recent corporate activity in the region reaffirms the value of Legend’s considerable acreage. Legend was successful in recently acquiring an additional 238km2 tenement package contiguous with our Rockford Project tenement package, taking our holding to 2,792km2, which further consolidates our tenement package in the Fraser Range.
Legend has a strong managerial and technical team, led by Mark Wilson and Derek Waterfield. I also acknowledge the support and encouragement of our major shareholder Mark Creasy and his technical team. I also would like to thank all our contractors for the work they have done in challenging conditions.
Your Board thanks you the shareholders for your continuing support and we look forward to an exciting year ahead.
Yours sincerely
Michael Atkins
Chairman31 March 2017

3
DIRECTORS’ REVIEW OF ACTIVITIESFor the year ended 31 December 2016
LEGEND MINING LIMITED
ROCKFORD PROJECT – Fraser Range District (Nickel-Copper, Gold)
The Rockford Project is located in the highly prospective Fraser Range district of Western Australia and covers a total area of 2,554km2 (Figure 1). The Project is the subject of a joint venture between Legend (70%) and Creasy Group (30%), with Legend being the operator and manager of the joint venture. Exploration is targeting Nova-Bollinger style nickel-copper and Tropicana style structurally controlled gold mineralisation.
Figure 1: Rockford Project Location
The Rockford Project covers a strike length of 100km over a regional gravity high “ridge” associated with dense mafic/ultramafic intrusive rocks of the Fraser Zone, within the larger Albany-Fraser Orogen. The Nova-Bollinger deposit, which lies within the Fraser Zone, is situated on a similar tenor gravity ridge to that of the Rockford Project, see Figure 1.
During 2016 Legend undertook an extensive exploration programme involving:• Interpretation of aeromagnetic/gravity datasets• RC drilling (five holes for 1,160m at Area D)• Diamond drilling (two holes for 1,302m at Area D)• Downhole electromagnetic surveys - DHTEM
(three holes at Area D)• Moving loop electromagnetic surveys – MLTEM
(Areas G, H, I, J, K, N)• Fixed loop electromagnetic surveys – FLTEM
(Areas A and D)• Gravity survey (2,423 stations)• Aircore drilling (64 holes for 5,115m, eight traverses)

4 2016 ANNUAL REPORT
DIRECTORS’ REVIEW OF ACTIVITIESFor the year ended 31 December 2016
Area D
Exploration activities in the first half of the year focussed on Area D, a discrete 1.5km x 1km gravity high (4mgal) with an associated magnetic signature suggestive of a structural fold closure or intrusive feature. Extensive MLTEM/FLTEM surveys identified eight bedrock conductors (D1-D8), seven of which were successfully followed up with RC and diamond drilling, see Figure 2. The location of Area D with respect to the regional gravity is shown on Figure 3.
The EM surveys and drilling programmes provided valuable geological and geophysical information highlighting three key factors favourable to the potential formation and discovery of massive nickel-copper sulphide mineralisation.
Firstly, the MLTEM/FLTEM surveys were able to detect significant bedrock conductors beneath thick conductive cover at depths up to 500m below surface. These conductors were successfully drill tested and validated in DHTEM surveys.
Figure 2: Area D MLTEM/FLTEM Conductor Plates with RC/Diamond Drillhole Locations on Residual Gravity Image
5LEGEND MINING LIMITED
DIRECTORS’ REVIEW OF ACTIVITIESFor the year ended 31 December 2016
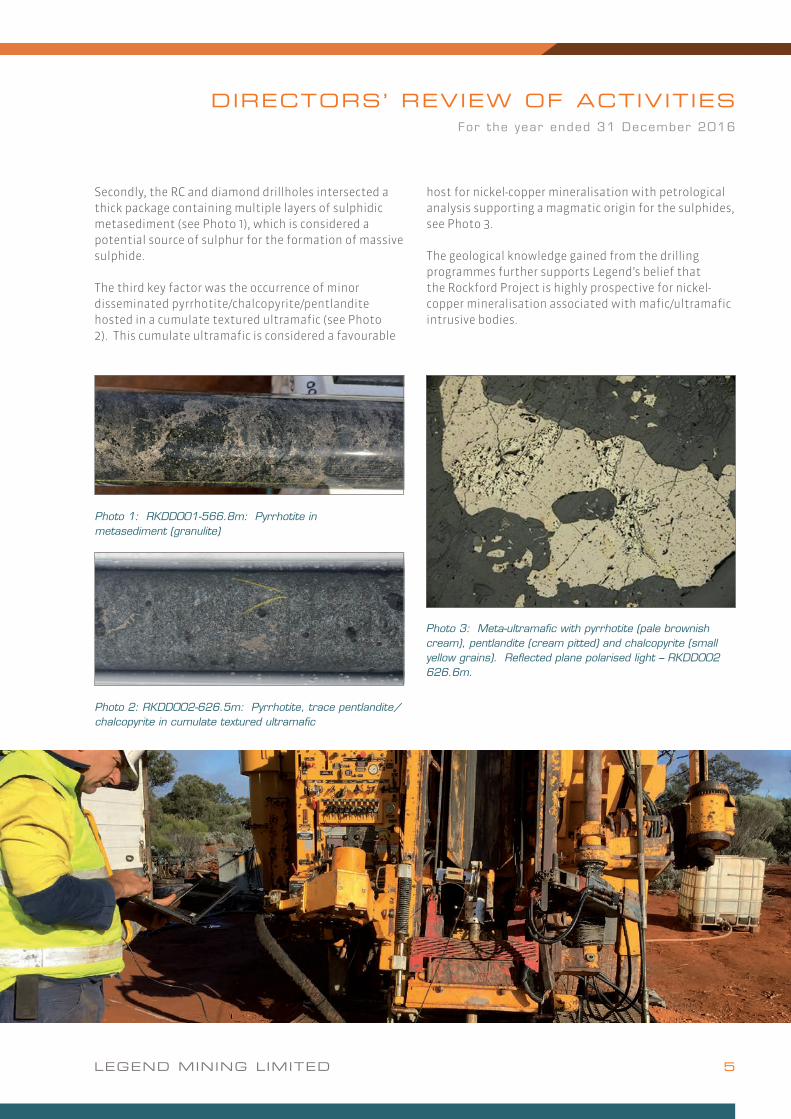
Secondly, the RC and diamond drillholes intersected a thick package containing multiple layers of sulphidic metasediment (see Photo 1), which is considered a potential source of sulphur for the formation of massive sulphide.
The third key factor was the occurrence of minor disseminated pyrrhotite/chalcopyrite/pentlandite hosted in a cumulate textured ultramafic (see Photo 2). This cumulate ultramafic is considered a favourable
host for nickel-copper mineralisation with petrological analysis supporting a magmatic origin for the sulphides, see Photo 3.
The geological knowledge gained from the drilling programmes further supports Legend’s belief that the Rockford Project is highly prospective for nickel-copper mineralisation associated with mafic/ultramafic intrusive bodies.
Photo 2: RKDD002-626.5m: Pyrrhotite, trace pentlandite/chalcopyrite in cumulate textured ultramafic
Photo 1: RKDD001-566.8m: Pyrrhotite in metasediment (granulite)
Photo 3: Meta-ultramafic with pyrrhotite (pale brownish cream), pentlandite (cream pitted) and chalcopyrite (small yellow grains). Reflected plane polarised light – RKDD002 626.6m.

6 2016 ANNUAL REPORT
DIRECTORS’ REVIEW OF ACTIVITIESFor the year ended 31 December 2016
The MLTEM survey utilised an enhanced/reconfigured high power EM system and is proving to be an effective tool in “seeing through” the conductive cover sequence. The combination of high power (~200 amp) and slingram (out loop) reading configuration allows for relatively broad spaced surveying, enabling greater area coverage of targets without compromising the quality of the survey and the ability to detect bedrock conductors.
Two strong-moderate conductors were identified at Area N (N1-N2) and two moderate-weak conductors identified at Area J (J1-J2) and are discussed below.
Regional MLTEM Surveys
Eight areas (Areas G to N) were selected for MLTEM surveying (see Figure 3), based on the interpretation of detailed aeromagnetic/gravity data and from recently gained knowledge from diamond drilling at Area D. Six Areas were tested during 2016, with Areas L and M to be completed in 2017. The encouraging results from Area D including; pentlandite (nickel sulphide) and chalcopyrite (copper sulphide) in cumulate ultramafic host rock associated with sulphidic metasediments, validate the current process of target selection.
Figure 3: Rockford Project Target Areas on Regional Gravity

7LEGEND MINING LIMITED
DIRECTORS’ REVIEW OF ACTIVITIESFor the year ended 31 December 2016
depth to top of source of >300m. N1 is located in the centre of the folded/intrusive feature, as shown on the aeromagnetic and gravity images, making this a compelling target for follow up work.
As mentioned, conductor N2 could not be accurately modelled, however early indications suggest a moderate strength conductor (~3,000S), striking NE-SW, <500m x 500m in size and a depth to top of source of >300m, see Figure 4. Further MLTEM/FLTEM is required at both N1 and N2 to better define the conductors ahead of RC/diamond drill testing.
Area N
Area N contains a large folded and/or intrusive feature with low magnetic response closely associated with a 2.5km x 0.5km NE-SW trending gravity feature. Two strong to moderate conductive bodies (N1-N2) were identified, (see Figure 4), however only preliminary modelling of N1 was possible, while N2 could not be accurately modelled and further infill MLTEM is required.
The preliminary modelling over conductor N1 indicates a strong to moderate bedrock conductor (3,000-5,000S+) with an overall NE-SW strike and an estimated
Figure 4: Area N Conductors on Aeromagnetic (left) and Gravity (right) Images(Note: Conductor N1 defined in preliminary modelling only, while Conductor N2 requires infill MLTEM to enable final modelling)

8 2016 ANNUAL REPORT
DIRECTORS’ REVIEW OF ACTIVITIESFor the year ended 31 December 2016
Conductor J2 represents a weak, extensive (>2km x 2km) conductor interpreted as being related to stratigraphy or a large scale structural feature, see Figure 5. Low conductance levels of ~150-250S were apparent from the modelling, with the associated source having an estimated depth to top of source of 300-500m, orientated NNE-SSW and dipping at 600 to the W.
Further evaluation of conductor J1 is required given its location on the margins of both aeromagnetic and gravity features. Conductor J2 is considered a low priority target as it appears to be stratigraphic in character with low conductance.
Area J
Area J was originally selected for MLTEM follow up based on the coincidence of a broad aeromagnetic low and a subtle 2.5km x 0.6km gravity feature. The MLTEM survey identified two conductors J1-J2, which are located on aeromagnetic and gravity images in Figure 5.
Conductor J1 represents a moderate-weak, broad (300m wide x 1,500m down plunge) conductor interestingly located on the northern margin of a small aeromagnetic body and the southern margin of a localised gravity feature, see Figure 5. Low to moderate conductance levels of ~500-750S were apparent from the modelling, with the associated source having an estimated depth to top of source of 150-250m, orientated NE-SW and dipping at 60-700 to the NW.
Figure 5: Area J Conductors (J1-J2) on Aeromagnetic (left) & Gravity (right) Images

9LEGEND MINING LIMITED
DIRECTORS’ REVIEW OF ACTIVITIESFor the year ended 31 December 2016
The widespread occurrence of this cover sequence illustrates the necessity for aircore drilling to provide reliable geochemical information and further demonstrates the ineffectiveness of surface sampling across the Rockford Project.
Mafic/ultramafic rocks were intersected in seven of the eight drill traverses with Lines 1, 6 and 7 considered the most prospective based on the bedrock intersected along with elevated coincident Ni-Cu assay results. Drillhole RKAC005 (Line 1) returned the most anomalous result of: 13m @ 0.1% Ni and 0.02% Cu from 48m to EOH associated with a fine grained gabbro.
Regional Aircore Drilling Programme
A regional aircore drilling programme comprising 64 holes (RKAC001-064) for 5,115m was completed during October-November 2016, (see Figure 6). The drilling was undertaken over eight areas selected from the interpretation of aeromagnetic/gravity data and EM surveys, with the aim of providing information on the regolith profile, basement lithologies and the lithogeochemical signature of the basement rocks. Holes were spaced at 400m along traverses with minor infill to 200m.
All drillholes intersected a moderate to deep cover sequence including sediments of the Eucla Basin overlying Proterozoic basement of the Fraser Zone.
Figure 6: Aircore Drill Traverses on Regional Aeromagnetic Image
Figure 6: Aircore Drill Traverses on Regional Aeromagnetic Image

10 2016 ANNUAL REPORT
DIRECTORS’ REVIEW OF ACTIVITIESFor the year ended 31 December 2016
2017 Programme
Activities planned for 2017 include the following:• Infill MLTEM/FLTEM at Area N to better define
conductors for follow up RC/diamond drilling• Regional MLTEM surveys aimed at identifying
bedrock conductors• Regional aircore drilling programmes focussing on
aeromagnetic/gravity targets• RC/diamond drill follow up of any significant
bedrock conductors identified by EM and aircore programmes
• Ongoing assessment and interpretation of exploration results
Table 1 below summarises anomalous nickel (>300ppm), copper (>250ppm) and gold (>0.1g/t) results from the aircore drilling. The assays only represent samples from the top 0.5-1m of fresh bedrock and overlying saprock and are considered encouraging given the broad 400m spacing of the drillholes.
The multi-element assay results from the aircore drilling programme further support the nickel-copper prospectivity of the region and provide confidence in Legend’s targeting methodology and area selection in the search for Nova-Bollinger style nickel-copper mineralisation at Rockford.
Note: Table shows anomalous values of Ni >300ppm and/or Cu >250ppm and/or Au >0.1 g/t. BOH – Bottom of Hole
Drillhole From(m)
To(m)
Interval(m)
Ni(ppm)
Cu(ppm)
Au(g/t)
Lithology
RKAC005 48 61 BOH 13 964 175 <0.01 Saprock/Gabbro
Incl. 48 52 4 1,237 390 <0.01 Saprock
Incl. 52 56 4 1,225 81 <0.01 Saprock
RKAC024 32 36 4 330 145 <0.01 Granulite
RKAC030 48 52 4 110 92 0.12 Saprock/Granulite
RKAC047 104 116 12 335 66 <0.01 Saprolite/Ultramafic
RKAC050 48 52 4 41 21 0.12 Saprolite
RKAC050 64 71 BOH 7 589 269 <0.01 Pyroxenite
RKAC052 97 98 BOH 1 142 251 <0.01 Ultramafic
RKAC060 32 36 4 38 36 0.23 Saprock/Gabbro
Table 1: Anomalous Assay Values in Aircore Drillholes

11LEGEND MINING LIMITED
DIRECTORS’ REVIEW OF ACTIVITIESFor the year ended 31 December 2016
Legend has yet to complete an agreement on new payment terms with Jindal. As a result, out of the abundance of caution and in light of the fact that Jindal did not pay the receivable in December 2016 as previously agreed, the directors have decided to provide for the Jindal receivable in full. Despite this provision, your directors believe that it is likely that the Company will complete an agreement on new payment terms with Jindal in the second quarter of 2017.
Annual Tax Return – R & D Claim
On 11 January 2017 Legend submitted its 2016 annual tax return, which includes a research and development (“R&D”) claim for reimbursement of $1.037M. The cornerstone of Legend’s exploration activities at the Rockford Project is using innovative geo-sensing moving loop electromagnetic surveys. These surveys qualify Legend for R&D cash reimbursement for these surveys and other associated core activities via the annual tax return.
Events Subsequent To Balance Date
On 27 February 2017 Legend announced that it had purchased two exploration licences contiguous with the existing Rockford Project tenements from Musgrave Minerals Limited. The tenements cover an area of 238.5 km2 and increase the Rockford Project’s exposure to the western stratigraphy of the Fraser Zone. The consideration was 10,000,000 Legend shares and 10,000,000 Legend options exercisable at 4 cents per option by 30 March 2021. The transaction settled on 28 February 2017 following the satisfaction of sale agreement conditions.
CORPORATE
Treasury – Sale of Independence Group NL Shares
Legend announced on 8 August 2016 that it had sold it’s 990,000 Independence Group Limited (“IGO”) shares for $4,057,162. The sales occurred on market over a period from 5 July to 3 August 2016.
The history of the investment was Legend purchased 1.5m Sirius Resources Ltd (“SIR”) on market in 2012 for $1,874,658. As a result of the IGO Acquisition and S2Resources (“S2R”) Demerger in 2015, Legend received cash ($780,000), 990,000 IGO shares and 750,000 S2R shares (which are still held by Legend).
Change of Company Secretary
Legend appointed Tony Walsh as Company Secretary on 12 December 2016, following the resignation of Dennis Wilkins.
Cameroon Project Sale
On 4 January 2017, the Company announced that it had received a request from Jindal Steel and Power (Mauritius) Limited (“Jindal”) to consider a further deferral of the payment of the final amount of $3 million owing to Legend from the sale of the Cameroon Iron Ore project. At that time, Legend agreed to this request in principle, and expected to report to the ASX as soon as an agreement of new payment terms was reached. Legend has since been advised by Jindal that it is undergoing a major debt rescheduling with its creditors and is unable to make any payments to creditors, including Legend, nor finalise any rescheduling of the Legend debt until its own debt rescheduling expected to complete in the second quarter of 2017.
The information in this report that relates to Exploration Results is based on information compiled by Mr Derek Waterfield, a Member of the Australian Institute of Geoscientists and a full time employee of Legend Mining Limited. Mr Waterfield has sufficient experience that is relevant to the styles of mineralisation and types of deposit under consideration, and to the activity being undertaken, to qualify as a Competent Person as defined in the 2012 Edition of the “Australasian Code for Reporting of Exploration Results, Mineral Resources and Ore Reserves” (JORC Code). Mr Waterfield consents to the inclusion in the report of the matters based on his information in the form and context in which it appears.
The information in this report that relates to Legend’s Exploration Results is a compilation of previously released to ASX by Legend Mining and Mr Derek Waterfield consents to the inclusion of these Results in this report. Mr Waterfield has advised that this consent remains in place for subsequent releases by Legend of the same information in the same form and context, until the consent is withdrawn or replaced by a subsequent report and accompanying consent. Legend confirms that it is not aware of any new information or data that materially affects the information included in the original market announcements and that all material assumptions and technical parameters in the market announcements continue to apply and have not materially changed. Legend confirms that the form and context in which the Competent Person’s findings are presented have not been materially modified from the original market announcements.

12 2016 ANNUAL REPORT
CORPORATE GOVERNANCE STATEMENT
Legend Mining Limited and the Board are committed to achieving and demonstrating the highest standards of corporate governance. Legend Mining Limited has reviewed its corporate governance practices against the Corporate Governance Principles and Recommendations (3rd edition) published by the ASX Corporate Governance Council. The 2016 Corporate Governance Statement was approved by the Board on 30 March 2017 and is current as at 31 March 2017. A description of the Group’s current corporate governance practices is set out in the Group’s Corporate Governance Statement which can be viewed at www.legendmining.com.au

LEGEND MINING LIMITED 13
DIRECTORS’ REPORT F o r t h e y e a r e n d e d 3 1 D e c e m b e r 2 0 1 6
The Directors submit their report for the year ended 31 December 2016.
1. DIRECTORS The names and details of the Company’s directors in office during the financial year and until the date of this report are as below. Directors were in office for this entire period unless otherwise stated.
Michael Atkins (Chairman, Non-Executive Director)
Mark Wilson (Managing Director)
Derek Waterfield (Executive Director - Technical)
2. INFORMATION ON DIRECTORS AND COMPANY SECRETARY Michael Atkins is a Fellow of the Australian Institute of Company Directors.
Mr Atkins was a founding partner of a national Chartered Accounting practice from 1979 to 1987 and was a Fellow of the Institute of Chartered Accountants in Australia between 1984 and 2012.
Between 1987 and 1998 he was involved in the executive management of several publicly listed resource companies with operations in Australia, USA, South East Asia and Africa. From 1990 to 1995 he was managing director and later a non-executive director of Claremont Petroleum NL and Beach Petroleum NL during their reconstruction, and then remained as a non-executive director until 1995. He was also founding executive chairman of Gallery Gold Ltd until 1998, and remained a non-executive director until 2000.
Since February 2011 Mr Atkins has been a Director – Corporate Finance at Patersons Securities Limited where he advises on the formation of, and capital raising for, emerging companies in the Australian resources sector.
He is currently non-executive chairman of Australian listed companies Azumah Resources Ltd and Castle Minerals Ltd, and non-executive director of SRG Limited.
During the past three years, Mr Atkins has also served as a director of Enterprise Uranium Limited (resigned March 2014), a publicly listed company.
Mark Wilson is a Member of the Institution of Engineers, Australia and a Chartered Professional Engineer with an Associateship in Civil Engineering from Curtin University in Western Australia. He has an extensive business background, mainly in corporate management and project engineering. This has included site management of remote construction projects, ten years of commercial construction as a founding proprietor of a Perth based company and the past twenty years in executive, non-executive, consulting and owner roles in resource focused companies. Mr Wilson is presently a non-executive director of Australian listed company Tanga Resources Limited (appointed 20 June 2014). Mr Wilson has not held any former public company directorships in the last three years.
Derek Waterfield is a Member of the Australian Institute of Geoscientists and a graduate of the University of Queensland (B.Sc. Hons). He has over 25 years’ experience in gold, base metals, iron ore, nickel and uranium exploration throughout Australia and Cameroon.
He started his career with CRA Exploration Pty Ltd and has held senior exploration leadership positions with Normandy Mining and Newmont Australia, and led the team that discovered the Moolart Well gold deposit in the Duketon Belt 350km north of Kalgoorlie. He was Exploration Manager at Legend Mining for five years managing Legend’s WA and Cameroon projects. More recently he has been Exploration Manager for Enterprise Metals Ltd, responsible for gold, iron ore, uranium and base metal exploration in WA. Mr Waterfield has not held any former public company directorships in the last three years.
Tony Walsh (Company Secretary) was appointed Company Secretary effective on 12 December 2016.
Mr Walsh has over 30 years’ experience in dealing with listed companies, ASX, ASIC and corporate transactions including 14 years with the ASX in Perth where he acted as ASX liaison with the JORC committee, four years as Chairman of an ASX listed mining explorer and as a director of a London AIM listed explorer. Tony is also currently Company Secretary of Atlas Iron Limited, Battery Minerals Mining Ltd and S2 Resources Limited.
Mr Walsh is a member of the Australian Institute of Company Directors, a Fellow of the Governance Institute of Australia, the Institute of Chartered Secretaries and the Institute of Chartered Accountants in Australia.
He is currently a non-executive director of the Women’s and Infants Research Foundation.

14 2016 ANNUAL REPORT
DIRECTORS’ REPORT F o r t h e y e a r e n d e d 3 1 D e c e m b e r 2 0 1 6
3. EARNINGS PER SHARE Basic loss per share: 0.128 cents
Diluted loss per share: 0.128 cents
4. DIVIDENDS No dividend has been paid or recommended during the financial year.
5. CORPORATE INFORMATION Corporate Structure
Legend Mining Limited is a company limited by shares that is incorporated and domiciled in Australia. Legend Mining Limited has prepared a consolidated financial report incorporating the entities that it controlled during the financial year, which are outlined in the following illustration of the group’s corporate structure.
Nature of Operations and Principal Activities
The principal activities during the year of the entities within the consolidated entity were:
� exploration for nickel and copper, deposits in Australia.
Employees
The consolidated entity had a staff of four employees at 31 December 2016 (2015: 4 employees).
6. OPERATING AND FINANCIAL REVIEW Results of Operations
The net loss after income tax of the consolidated entity for the year was $2,599,591 (2015: loss of $1,311,284).
Review of Operations
The Directors’ Review of Activities for the year ended 31 December 2016 is contained on pages 3 to 11 of the Annual Report.
Summarised Operating Results
Impairment of Deferred Exploration Costs: There was $492,882 impairment of deferred expenditure expensed to the income statement during the year (2015:Nil).
Deferred Exploration Costs: Total acquisition costs and deferred expenditure on tenements capitalised during the year amounted to $2,719,559 (2015: $5,092,136).
Legend Mining Limited
100%Gibson Metals Pty Ltd
100%Legend Cameroon Pty Ltd
LEGEND MINING LIMITED 15
DIRECTORS’ REPORT F o r t h e y e a r e n d e d 3 1 D e c e m b e r 2 0 1 6
7. SIGNIFICANT CHANGES IN THE STATE OF AFFAIRS During 2016 Legend has:
(i) The payment terms under the Jindal Agreement was amended in 2015 were as follows:
� The $6 million payment originally scheduled for 5 August 2015 is now to be paid in two tranches, $3 million on 15 September 2015 (received in 2015) and a further $3 million that was due on or before 15 December 2016 (see below);
� Interest of 4% payable quarterly in arrears will be payable on the second $3 million; and � The $5.5 million payable under the Jindal Agreement upon the grant of a Mining Convention at the Cameroon Iron
Ore Project (“Project”) is now rescheduled to be paid upon the first commercial shipment of iron ore from the Project.
On 4 January 2017, the Company announced that it has received a request from Jindal Steel and Power (Mauritius) Limited (“Jindal”) to consider a further deferral of the payment of the final amount of $3 million owing to Legend from the sale of the Cameroon Iron Ore project. At that time, Legend agreed to this request in principle, and expected to report to the ASX as soon as an agreement of new payment terms was reached. Legend has since been advised by Jindal that it is undergoing a major debt rescheduling with its creditors and is unable to make any payments to creditors, including Legend, nor finalise any rescheduling of the Legend debt until its own debt rescheduling is complete. At the date of this report, Legend has yet to complete an agreement on new payment terms with Jindal. As a result, out of the abundance of caution and in light of the fact that Jindal did not pay the receivable in December 2016 as previously agreed, the directors have decided to provide for the Jindal receivable in full. Despite this provision, your directors believe that it is likely that the Company will complete an agreement on new payment terms with Jindal in the first half of 2017.
8. ENVIRONMENTAL REGULATION AND PERFORMANCE The consolidated entity’s operations are subject to various environmental regulations under both Commonwealth and State legislation in Australia. The Directors have complied with these regulations and are not aware of any breaches of the legislation during the financial year which are material in nature.
9. LIKELY DEVELOPMENTS AND EXPECTED RESULTS Likely developments in the operations of the consolidated entity, and expected results of those operations in subsequent financial years have been discussed, where appropriate, in the Chairman’s Report and Review of Activities.
10. SHARE OPTIONS Unissued shares
As at the date of this report, there were 238,000,000 unissued ordinary shares under options. Refer to note 17 for further details of the options outstanding at 31 December 2016.
Option holders do not have any right, by virtue of the option, to participate in any share issue of the company or any related body corporate.
Shares issued as a result of the exercise of options
There were no shares issued as a result of the exercise of options during the financial year.
11. SIGNIFICANT EVENTS AFTER THE BALANCE DATE On 24 February 2017 Legend announced the acquisition of two tenements in the Fraser Range. Consideration of 10 million fully paid ordinary shares and 10 million 4 cent 30 March 2021 options were issued to the vendor on 28 February 2017.
5,000,000 incentive options issued on 31 January 2017 and granted as an incentive to an employee under the Company’s incentive plan.
In March 2017, the Company received a refund from the Australian Taxation Office of $1,037,084.85 (see Note 6 for details).
No other matters or circumstance has arisen since the end of the financial year which has significantly affected, or may significantly affect the operations of the Group, the result of those operations, or the state of affairs of the Group in subsequent financial years.

16 2016 ANNUAL REPORT
DIRECTORS’ REPORT F o r t h e y e a r e n d e d 3 1 D e c e m b e r 2 0 1 6
12. INDEMNIFICATION AND INSURANCE OF DIRECTORS AND OFFICERS The Company has not, during or since the financial year, in respect of any person who is or has been an officer of the Company or a related body corporate:
(i) indemnified or made any relevant agreement for indemnifying against a liability incurred as an officer, including costs and expenses in successfully defending legal proceedings; or
(ii) paid or agreed to pay a premium in respect of a contract insuring against a liability incurred as an officer for the costs or expenses to defend legal proceedings.
13. INDEMNIFICATION OF AUDITORS To the extent permitted by law, the Company has agreed to indemnify its auditors, Ernst & Young Australia, as part of the terms of its audit engagement agreement against claims by third parties arising from the audit (for an unspecified amount). No payment has been made to indemnify Ernst & Young during or since the financial year.
14. REMUNERATION REPORT (AUDITED) The compensation arrangements in place for key management personnel of Legend are set out below:
Details of key management personnel Directors M Atkins Chairman (non-executive) M Wilson Managing Director D Waterfield Executive Director - Technical
Compensation Philosophy
The performance of the Company depends upon the quality of its directors and executives. To prosper, the Company must attract, motivate and retain highly skilled directors and executives.
The Company embodies the following principle in its compensation framework:
� Provide competitive rewards to attract high-calibre executives.
Group Performance
The Group’s financial performance for the last five years has been as follows:
December 2016
December 2015
December 2014
December 2013
December 2012
Revenue $407,180 $575,162 $371,332 $280,734 $602,416 Net loss after tax ($2,599,591) ($1,311,284) ($2,618,326) ($38,412,494) $2,215,446 Basic earnings/(loss) per share (cents per share)
(0.128) (0.066) (0.128) (1.769) 0.112
Diluted earnings/(loss) per share (cents per share)
(0.128) (0.066) (0.128) (1.769) 0.112
Net assets $14,734,111 $17,127,502 $17,067,286 $22,354,576 $51,900,776 Share price (at balance date) $0.01 $0.008 $0.007 $0.008 $0.02
As the Group is currently in exploration and evaluation phases, historical earnings are not yet an accurate reflection of Group performance and cannot be used as a long term incentive measure. Consideration of the Group’s earnings will be more relevant as the Group matures.
Remuneration Committee
Due to the size of Legend, remuneration is considered by the full Board. The Board reviews remuneration packages and policies applicable to the directors and senior executives. Remuneration levels are competitively set to attract the most qualified and experienced directors and senior executives.
Compensation Structure
In accordance with best practice corporate governance, the structure of non-executive director and senior manager remuneration is separate and distinct.

LEGEND MINING LIMITED 17
DIRECTORS’ REPORT F o r t h e y e a r e n d e d 3 1 D e c e m b e r 2 0 1 6
14. REMUNERATION REPORT (CONTD)
Objective of Non-Executive Director Compensation
The Board seeks to set aggregate compensation at a level that provides the company with the ability to attract and retain directors of the highest calibre, whilst incurring a cost that is acceptable to shareholders.
Structure of Non-Executive Director Compensation
The Constitution and the ASX Listing Rules specify that the aggregate compensation of non-executive directors shall be determined from time to time by a general meeting. An amount not exceeding the amount determined is then divided between the directors as agreed. The latest determination was at the Annual General Meeting held on 16 May 2012 when shareholders approved the aggregate remuneration of $300,000 per year.
The amount of aggregate compensation sought to be approved by shareholders and the manner in which it is apportioned amongst directors is reviewed annually. The Board considers the fees paid to non-executive directors of comparable companies when undertaking the annual review process.
Objective of Senior Management and Executive Director Compensation
The company aims to reward executives with a level and mix of compensation commensurate with their position and responsibilities within the company and so as to:
� reward executives for company and individual performance against targets set by reference to appropriate benchmarks;
� align the interests of executives with those of shareholders; and
� ensure total compensation is competitive by market standards.
Structure of Senior Management and Executive Director Compensation
In determining the level and make-up of executive compensation, the Board may engage external consultants to provide independent advice. No external advice was obtained during the 2016 year.
It is the Board’s policy that an employment contract is entered into with key executives.
Compensation consists of a fixed compensation element and the issue of options from time to time at the directors’ discretion under the Employee Share Option Plan. Any issue of options to directors under the Employee Share Option Plan requires prior shareholder approval.
Fixed Compensation
Fixed compensation is reviewed annually by the Board. The process consists of a review of company and individual performance, relevant comparative compensation in the market and internally and, where appropriate, external advice on policies and practices. No external advice was obtained during the 2016 year.
Structure
Senior managers are given the opportunity to receive their fixed (primary) compensation in a variety of forms including cash and fringe benefits. It is intended that the manner of payment chosen will be optimal for the recipient without creating undue cost for the Company.

18 2016 ANNUAL REPORT
DIRECTORS’ REPORT F o r t h e y e a r e n d e d 3 1 D e c e m b e r 2 0 1 6
14. REMUNERATION REPORT (CONTD)
Employment Contracts
The Managing Director, Mr Mark Wilson, is employed under contract. The current contract commenced on 1 July 2011 and is effective until terminated in accordance with the contract. The significant terms of the contract are:
� Mr Wilson receives remuneration of $320,000 per annum exclusive of superannuation;
� Mr Wilson may resign from his position and thus terminate his contract by giving one month written notice;
� The company may terminate Mr Wilson’s employment contract by providing six months’ written notice if the position has become redundant, or three months’ written notice in all other circumstances; and
� The Company may terminate Mr Wilson’s contract at any time without notice if serious misconduct has occurred.
Mr Michael Atkins, is employed under contract. The current contract commenced on 1 July 2012 and is effective until terminated in accordance with the contract. The significant terms of the contract are:
� Mr Atkins receives remuneration of $80,000 per annum exclusive of superannuation;
� Mr Atkins’ agreement provides for engagement of consultancy services outside of the scope of the ordinary duties of a non-executive chairman. In addition to the director’s fees above, Mr Atkins is paid $2,000 per day (inclusive of superannuation) for the provision of these consultancy services.
� Mr Atkins’ appointment is contingent upon satisfactory performance and successful re-election by shareholders of the Company;
� Mr Atkins may resign from his position and thus terminate his contract by giving written notice; and
� The Company may terminate Mr Atkins’ contract by way of resolution of the Company.
Mr Derek Waterfield, is employed under contract. The current contract commenced on 1 November 2012 and is effective until terminated in accordance with the contract. The significant terms of the contract are:
� Mr Waterfield receives remuneration of $220,000 per annum exclusive of superannuation;
� Mr Waterfield may resign from his position and thus terminate his contract by giving one month written notice;
� The company may terminate Mr Waterfield’s employment contract by providing three months’ written notice if the position has become redundant, or one months’ written notice in all other circumstances; and
� The Company may terminate Mr Waterfield’s contract at any time without notice if serious misconduct has occurred.
Employee Share Option Plan
The Board has in place an Employee Share Option Plan allowing share options to be issued to eligible employees in order to provide them with an incentive to provide growth and value to all shareholders.
At a General Meeting on 4 December 2009 shareholders approved the implementation of Employee Share Option Plan No 3. The new plan differs from the previous plans in that there is no 12 month vesting period on any new options received under plan No 3. There is a significant change in the context of recent proposals by the Federal Government to change the tax treatment of options issued under incentive schemes. Removal of the vesting period requirement allows the Board maximum flexibility to make offers of options on the terms of the plans appropriate at the time, having regard for the tax environment which the proposed participants find themselves in when an offer of options is received from the company.
Share-based Payments
During the year the Company granted incentive options to directors valued at $196,000. 70,000,000 options with an exercise price of 4 cents and expiring on 30 March 2021 were issued to Directors following approval at the Annual General Meeting of the Company held on 28 April 2016. The fair value of the options granted during the half-year was 0.28 cents, for a total value of $196,000 included within share-based payments expense.

LEGEND MINING LIMITED 19
DIRECTORS’ REPORT F o r t h e y e a r e n d e d 3 1 D e c e m b e r 2 0 1 6
14. REMUNERATION REPORT (CONTD)
Compensation of Key Management Personnel for Year Ended 31 December 2016(1)
Name
Year
Short term Salary and
Fees(1)
$
Post-Employment
Super- annuation
$
Share based payments
options
$
Total
$
% of compen-
sation granted as
options
% of performance
related remuneration
Director M Atkins 2016 80,000 7,600 28,000 115,600 24 -
2015 80,000 7,600 - 87,600 - - M Wilson 2016 332,718 35,077 112,000 479,795 23 -
2015 340,102 35,077 - 375,179 - - D Waterfield 2016 226,769 20,900 56,000 303,669 18 -
2015 228,462 20,900 - 249,362 - - Total 2016 639,487 63,577 196,000 899,064 22 -
2015 648,564 63,577 - 712,141 - - (1) Short term salary and fees includes net movements in leave provisions.
Option holdings of Key Management Personnel
Options held in Legend Mining Limited (number) during the year ended 31 December 2016 Name Balance at
beginning of year
1 Jan 2016
Granted as Remuneration
Exercised during
the year
Net Change Other
Balance at end
of year 31 Dec 2016
Not Vested & Not
Exercisable
Vested & Exercisable
Directors M Atkins - 10,000,000 - - 10,000,000 - 10,000,000 M Wilson - 40,000,000 - - 40,000,000 - 40,000,000 D Waterfield - 20,000,000 - - 20,000,000 - 20,000,000 Total - 70,000,000 - - 70,000,000 - 70,000,000
Shareholdings of Key Management Personnel(1)(2)
Shares held in Legend Mining Limited (number) during the year ended 31 December 2016 Name Balance
1 Jan 16 Granted as
remuneration On exercise of options
Net change other
Balance 31 Dec 16
Directors M Atkins (Windamurah P/L), (Alkali Exploration P/L)
4,558,334 - - - 4,558,334
M Wilson (Chester Nominees WA P/L)
80,000,000 - - (2)30,000,000 110,000,000
D Waterfield 1,000,000 - - - 1,000,000 Total 85,558,334 - - 30,000,000 115,558,334
(1) Includes shares held directly, indirectly and beneficially by KMP. (2) On-market purchases made during the year.
END OF REMUNERATION REPORT

20 2016 ANNUAL REPORT
DIRECTORS’ REPORT F o r t h e y e a r e n d e d 3 1 D e c e m b e r 2 0 1 6
15. DIRECTORS’ MEETINGS The number of Meetings of Directors held during the year and the number of Meetings attended by each Director was as follows:
Name
No. of Board Meetings Attended
No. of Meetings Held Whilst A
Director
No of Audit Committee
Meetings Attended
No of Audit Committee
Meetings Held Attended by: Michael Atkins 6 6 2 2 Mark Wilson 6 6 2 2 Derek Waterfield 4 6 1 2
16. DIRECTORS’ INTERESTS The relevant interest of each director in the shares and options issued by the company in accordance with the Corporations Act 2001, at the date of signing this report is as follows:
Name Ordinary shares Options over ordinary shares
M Atkins (Windamurah P/L), (Alkali Exploration P/L)
7,108,334 10,000,000
M Wilson (Chester Nominees WA P/L)
116,000,000 40,000,000
D Waterfield 1,000,000 20,000,000
17. AUDITOR INDEPENDENCE AND NON-AUDIT SERVICES Non-audit services
There were no non-audit services provided by the Company’s auditor, Ernst & Young during the 2016 financial year.
We have received the Declaration of Auditor Independence from Ernst & Young, the Company’s Auditor. This is available for review on page 52 and forms part of this report.
SIGNED in accordance with a Resolution of the Directors on behalf of the Board
__________________________ Mark Wilson Managing Director Dated this 31st day of March 2017
LEGEND MINING LIMITED 21
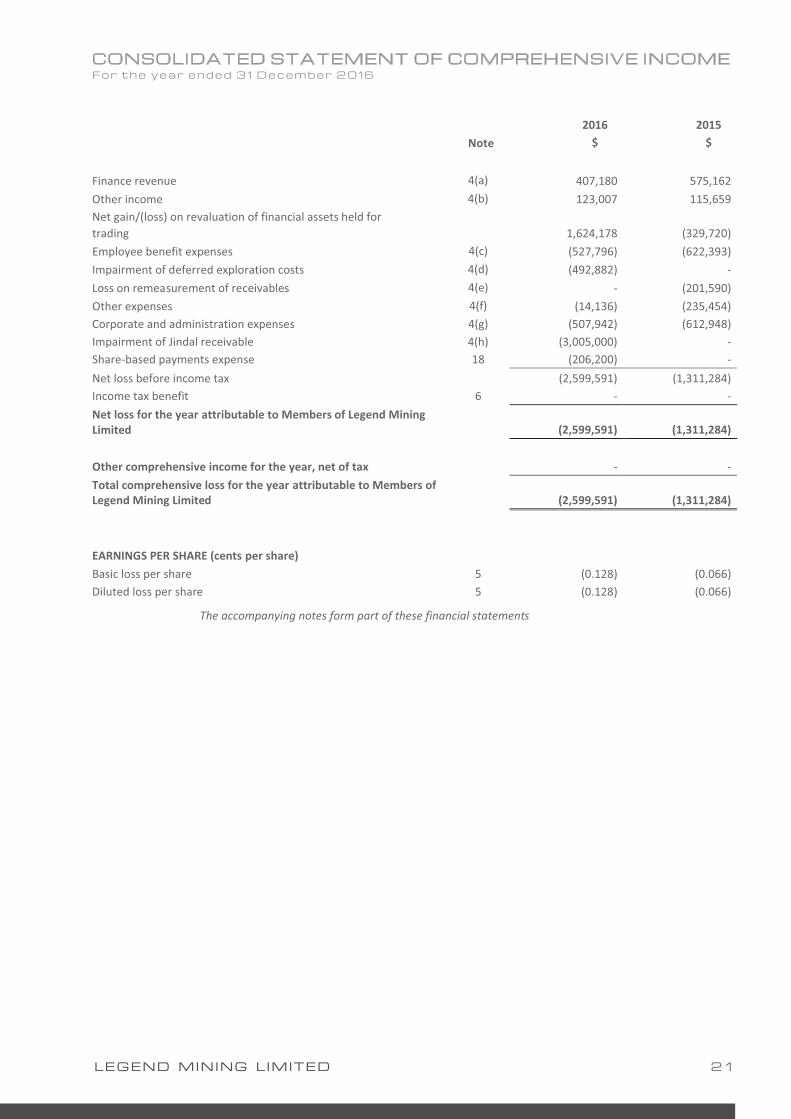
CONSOLIDATED STATEMENT OF COMPREHENSIVE INCOME F o r t h e y e a r e n d e d 3 1 D e c e m b e r 2 0 1 6
Note 2016
$ 2015
$
Finance revenue 4(a) 407,180 575,162 Other income 4(b) 123,007 115,659 Net gain/(loss) on revaluation of financial assets held for trading
1,624,178 (329,720)
Employee benefit expenses 4(c) (527,796) (622,393) Impairment of deferred exploration costs 4(d) (492,882) - Loss on remeasurement of receivables 4(e) - (201,590) Other expenses 4(f) (14,136) (235,454) Corporate and administration expenses 4(g) (507,942) (612,948) Impairment of Jindal receivable 4(h) (3,005,000) - Share-based payments expense 18 (206,200) - Net loss before income tax (2,599,591) (1,311,284) Income tax benefit 6 - - Net loss for the year attributable to Members of Legend Mining Limited
(2,599,591) (1,311,284)
Other comprehensive income for the year, net of tax - - Total comprehensive loss for the year attributable to Members of Legend Mining Limited
(2,599,591) (1,311,284)
EARNINGS PER SHARE (cents per share) Basic loss per share 5 (0.128) (0.066) Diluted loss per share 5 (0.128) (0.066)
The accompanying notes form part of these financial statements

22 2016 ANNUAL REPORT
CONSOLIDATED STATEMENT OF FINANCIAL POSITION A s a t 3 1 D e c e m b e r 2 0 1 6
Notes
2016 $
2015 $
ASSETS Current Assets Cash and cash equivalents 8 6,673,674 6,251,185 Trade & other receivables 9 31,243 2,926,177 Other financial assets 10 402,308 2,760,600 Total Current Assets 7,107,225 11,937,962 Non-current Assets Other financial assets 10 5,775 50,000 Property, plant & equipment 11 156,479 44,486 Deferred exploration costs 12 7,712,131 5,485,454 Total Non-current Assets 7,874,385 5,579,940 TOTAL ASSETS 14,981,610 17,517,902 LIABILITIES Current Liabilities Trade & other payables 13 89,021 225,665 Provisions 14 94,190 107,613 Total Current Liabilities 183,211 333,278 Non-current Liabilities Provisions 14 64,288 57,122 Total Non-current Liabilities 64,288 57,122 TOTAL LIABILITIES 247,499 390,400 NET ASSETS 14,734,111 17,127,502 EQUITY Equity attributable to equity holders of the parent Contributed Equity 15 60,588,031 60,588,031 Reserves 16 23,208,778 23,002,578 Accumulated losses (69,062,698) (66,463,107) TOTAL EQUITY 14,734,111 17,127,502
The accompanying notes form part of these financial statements

LEGEND MINING LIMITED 23
CONSOLIDATED STATEMENT OF CASH FLOWS F o r t h e y e a r e n d e d 3 1 D e c e m b e r 2 0 1 6
CASH FLOWS FROM OPERATING ACTIVITIES Note 2016
$ 2015
$
Receipts from customers - 90,909
Payments to suppliers and employees (1,043,003) (1,244,765)
Payments for exploration expenditure not capitalised - (221,719)
Interest received 302,165 225,266
Income taxes refunded 93,556 -
Net cash flows used in operating activities 20(ii) (647,282) (1,150,309)
CASH FLOWS FROM INVESTING ACTIVITIES
Receipt of Jindal receivable 9(a) - 3,000,000
Purchase of property, plant & equipment 11 (141,907) (10,300)
Payment for the purchase of investments (2,378) (1,979,796)
Proceeds from the sale of investments 4,034,848 3,051,377
Payments for deferred exploration costs (2,820,292) (3,621,876)
Dividends received - 24,750
Net cash flows from investing activities 1,070,271 464,155
Net increase/(decrease) in cash and cash equivalents 422,489 (686,154)
Cash and cash equivalents at the beginning of year 6,251,185 6,937,339
Cash and cash equivalents at end of year 20(i) 6,673,674 6,251,185
The accompanying notes form part of these financial statements

24 2016 ANNUAL REPORT
CONSOLIDATED STATEMENT OF CHANGES IN EQUITY F o r t h e y e a r e n d e d 3 1 D e c e m b e r 2 0 1 6
Contributed Equity
Share Option
Premium Reserve
Accumulated Losses
Total Equity
At 1 January 2016 60,588,031 23,002,578 (66,463,107) 17,127,502 Loss for the year - - (2,599,591) (2,599,591) Total comprehensive loss for the year - - (2,599,591) (2,599,591) Share-based payments - 206,200 - 206,200 At 31 December 2016 60,588,031 23,208,778 (69,062,698) 14,734,111
At 1 January 2015 59,801,531 22,417,578 (65,151,823) 17,067,286 Loss for the year - - (1,311,284) (1,311,284) Total comprehensive expense for the year - - (1,311,284) (1,311,284) Shares issued during the year
786,500 - - 786,500 Share-based payments - 585,000 - 585,000 At 31 December 2015 60,588,031 23,002,578 (66,463,107) 17,127,502
The accompanying notes form part of these financial statements

LEGEND MINING LIMITED 25
NOTES TO THE FINANCIAL STATEMENTS F o r t h e y e a r e n d e d 3 1 D e c e m b e r 2 0 1 6
NOTE 1: CORPORATE INFORMATION The consolidated financial statements of Legend Mining Limited and its subsidiaries (collectively, the Group) for the year ended 31 December 2016 were authorised for issue in accordance with a resolution of the Directors on 30 March 2017.
Legend Mining Limited (the Company or the parent) is a for profit company limited by shares incorporated in Australia whose shares are publicly traded on the Australian Securities Exchange.
The nature of the operations and principal activities of the Group are described in note 3.
NOTE 2: SIGNIFICANT ACCOUNTING POLICIES Basis of preparation
The financial report is a general-purpose financial report, which has been prepared in accordance with the requirements of the Corporations Act 2001, Australian Accounting Standards and other authoritative pronouncements of the Australian Accounting Standards Board. The financial report has also been prepared on a historical cost basis, except for certain financial assets carried at fair value and the disposal group classified as held for sale which was measured at the lower of cost and fair value less costs to sell.
The financial report is presented in Australian dollars and all values are expressed as whole dollars.
The consolidated financial statements have been prepared on a going concern basis which assumes the continuity of normal business activity and the realisation of assets and settlement of liabilities in the ordinary course of business.
Compliance with AASB
The financial report also complies with International Financial Reporting Standards (‘IFRS’) as issued by the International Accounting Standards Board.
Changes in accounting policy, disclosures, standards and interpretations
The accounting policies adopted are consistent with those of the previous financial year except as follows:
(i) New and amended standards and interpretations
The Group has adopted all new and amended Australian Accounting Standards and AASB Interpretations effective as of 1 January 2016, including:
� AASB 2014-3 Amendments to Australian Accounting Standards – Accounting for Acquisitions of Interests in Joint Operations [AASB 1 & AASB 11]
� AASB 2014-4 Clarification of Acceptable Methods of Depreciation and Amortisation (Amendments to AASB 116 and AASB 138)
� AASB 2014-9 Amendments to Australian Accounting Standards – Equity Method in Separate Financial Statements
� AASB 2015-1 Amendments to Australian Accounting Standards Annual Improvements to AASB 2012-2014 Cycle
� AASB 2015-2 Disclosure Initiative – Amendments to AASB 101
� AASB 2015-3 Amendments to Australian Accounting Standards arising from the Withdrawal of AASB 1031 Materiality
The adoption of these amendments has resulted in minor changes to disclosures in the Group’s financial statements. Other than that, the adoption of these amendments did not have any impact on the current period or any prior period and is not likely to affect future periods.
(ii) Accounting Standards and Interpretations issued but not yet effective
Australian Accounting Standards and Interpretations that have recently been issued or amended but are not yet effective and have not been adopted by the Group for the annual reporting period ending 31 December 2016 are outlined below:
AASB 9 Financial Instruments (applicable for annual reporting periods commencing on or after 1 January 2018).
AASB 9 (December 2014) is a new Principal standard which replaces AASB 139. This new Principal version supersedes AASB 9 issued in December 2009 (as amended) and AASB 9 (issued in December 2010) and includes a model for classification and measurement, a single, forward-looking ‘expected loss’ impairment model and a substantially-reformed approach to hedge accounting.
AASB 9 is effective for annual reporting periods beginning on or after 1 January 2018. However, the Standard is available for early adoption. The own credit changes can be early applied in isolation without otherwise changing the accounting for financial instruments.

26 2016 ANNUAL REPORT
NOTES TO THE FINANCIAL STATEMENTS F o r t h e y e a r e n d e d 3 1 D e c e m b e r 2 0 1 6
NOTE 2: SIGNIFICANT ACCOUNTING POLICIES (CONTD)
The final version of AASB 9 introduces a new expected-loss impairment model that will require more timely recognition of expected credit losses. Specifically, the new Standard requires entities to account for expected credit losses from when financial instruments are first recognised and to recognise full lifetime expected losses on a more timely basis.
Amendments to AASB 9 (December 2009 & 2010 editions)(AASB 2013-9) issued in December 2013 included the new hedge accounting requirements, including changes to hedge effectiveness testing, treatment of hedging costs, risk components that can be hedged and disclosures.
AASB 9 includes requirements for a simpler approach for classification and measurement of financial assets compared with the requirements of AASB 139.
The main changes are described below.
(a) Financial assets that are debt instruments will be classified based on (1) the objective of the entity’s business model for managing the financial assets; (2) the characteristics of the contractual cash flows.
(b) Allows an irrevocable election on initial recognition to present gains and losses on investments in equity instruments that are not held for trading in other comprehensive income. Dividends in respect of these investments that are a return on investment can be recognised in profit or loss and there is no impairment or recycling on disposal of the instrument.
(c) Financial assets can be designated and measured at fair value through profit or loss at initial recognition if doing so eliminates or significantly reduces a measurement or recognition inconsistency that would arise from measuring assets or liabilities, or recognising the gains and losses on them, on different bases.
(d) Where the fair value option is used for financial liabilities the change in fair value is to be accounted for as follows:
� The change attributable to changes in credit risk are presented in other comprehensive income (OCI)
� The remaining change is presented in profit or loss
AASB 9 also removes the volatility in profit or loss that was caused by changes in the credit risk of liabilities elected to be measured at fair value. This change in accounting means that gains caused by the deterioration of an entity’s own credit risk on such liabilities are no longer recognised in profit or loss.
Consequential amendments were also made to other standards as a result of AASB 9, introduced by AASB 2009-11 and superseded by AASB 2010-7, AASB 2010-10 and AASB 2014-1 – Part E.
AASB 2014-7 incorporates the consequential amendments arising from the issuance of AASB 9 in December 2014.
AASB 2014-8 limits the application of the existing versions of AASB 9 (AASB 9 (December 2009) and AASB 9 (December 2010)) from 1 February 2015 and applies to annual reporting periods beginning on or after 1 January 2015.
The effect of this amendment on the Group’s financial statements has yet to be determined.
AASB 16 Leases (applicable for annual reporting periods commencing on or after 1 January 2019).
The key features of AASB 16 are as follows:
Lessee accounting
� Lessees are required to recognise assets and liabilities for all leases with a term of more than 12 months, unless the underlying asset is of low value.
� A lessee measures right-of-use assets similarly to other non-financial assets and lease liabilities similarly to other financial liabilities.
� Assets and liabilities arising from a lease are initially measured on a present value basis. The measurement includes non-cancellable lease payments (including inflation-linked payments), and also includes payments to be made in optional periods if the lessee is reasonable certain to exercise an option to extend the lease, or not to exercise an option to terminate the lease.
� AASB 16 contains disclosure requirements for lessees.
Lessor accounting
� AASB 16 substantially carries forward the lessor accounting requirements in AASB 17. Accordingly, a lessor continues to classify its leases as operating leases or finance leases, and to account for those two types of leases differently.
� AASB 16 also requires enhanced disclosures to be provided by lessors that will improve information disclosed about a lessor’s risk exposure, particularly to residual value risk.

LEGEND MINING LIMITED 27
NOTES TO THE FINANCIAL STATEMENTS F o r t h e y e a r e n d e d 3 1 D e c e m b e r 2 0 1 6
NOTE 2: SIGNIFICANT ACCOUNTING POLICIES (CONTD)
AASB 16 supersedes:
a) AASB 17 Leases
b) AASB 4 Determining whether an Arrangement contains a Lease
c) SIC-15 Operating Leases – Incentives
d) SIC-27 Evaluating the Substance of Transactions Involving the Legal Form of a Lease
The new standard will be effective for annual periods beginning on or after 1 January 2019. Early adoption is permitted, provided the new revenue standard, AASB 15 Revenue from Contracts with Customers, has been applied, or is applied at the same date as AASB 16.
The effect of this new standard on the Group’s financial statements has yet to be determined. AASB 15 Revenue from Contracts with Customers (applicable for reporting periods commencing on or after 1 January 2018) AASB 15 Revenue from Contracts with Customers replaces the existing revenue recognition standards AASB 111 Construction Contracts, AASB 118 Revenue and related Interpretations (Interpretation 13 Customer Loyalty Programmes, Interpretation 15 Agreements for the Construction of Real Estate, Interpretation 18 Transfers of Assets from Customers, Interpretation 131 Revenue—Barter Transactions Involving Advertising Services and Interpretation 1042 Subscriber Acquisition Costs in the Telecommunications Industry). AASB 15 incorporates the requirements of AASB 15 Revenue from Contracts with Customers issued by the International Accounting Standards Board (IASB) and developed jointly with the US Financial Accounting Standards Board (FASB). AASB 15 specifies the accounting treatment for revenue arising from contracts with customers (except for contracts within the scope of other accounting standards such as leases or financial instruments).The core principle of AASB 15 is that an entity recognises revenue to depict the transfer of promised goods or services to customers in an amount that reflects the consideration to which the entity expects to be entitled in exchange for those goods or services. An entity recognises revenue in accordance with that core principle by applying the following steps: (a) Step 1: Identify the contract(s) with a customer (b) Step 2: Identify the performance obligations in the contract (c) Step 3: Determine the transaction price (d) Step 4: Allocate the transaction price to the performance obligations in the contract (e) Step 5: Recognise revenue when (or as) the entity satisfies a performance obligation AASB 2015-8 amended the AASB 15 effective date so it is now effective for annual reporting periods commencing on or after 1 January 2018. Early application is permitted. AASB 2014-5 incorporates the consequential amendments to a number Australian Accounting Standards (including Interpretations) arising from the issuance of AASB 15. AASB 2016-3 Amendments to Australian Accounting Standards – Clarifications to AASB 15 amends AASB 15 to clarify the requirements on identifying performance obligations, principal versus agent considerations and the timing of recognising revenue from granting a licence and provides further practical expedients on transition to AASB 15. The impact of this new Standard on the Group’s financial statements is yet to be determined.
Summary of significant accounting policies
(i) Basis of consolidation
The consolidated financial statements comprise the financial statements of Legend Mining Limited and its subsidiaries (‘the Group’) as at 31 December 2016. Control is achieved when the Group is exposed, or has rights, to variable returns from its involvement with the investee and has the ability to affect those returns through its power over the investee. Specifically, the Group controls an investee if and only if the Group has:
� Power over the investee (ie existing rights that give it the current ability to direct the relevant activities of the investee);
� Exposure, or rights, to variable returns from its involvement with the investee; and
� The ability to use its power over the investee to affect its returns.
� When the Group has less than a majority of the voting or similar rights of an investee, the Group considers all relevant facts and circumstances in assessing whether it has power over an investee, including:
� The contractual arrangement with the other vote holders of the investee;
� Rights arising from other contractual arrangements; and
� The Group’s voting rights and potential voting rights.

28 2016 ANNUAL REPORT
NOTES TO THE FINANCIAL STATEMENTS F o r t h e y e a r e n d e d 3 1 D e c e m b e r 2 0 1 6
NOTE 2: SIGNIFICANT ACCOUNTING POLICIES (CONTD)
The Group re-assesses whether or not it controls an investee if facts and circumstances indicate that there are changes to one or more of the three elements of control. Consolidation of a subsidiary begins when the Group obtains control over the subsidiary and ceases when the Group loses control of the subsidiary. Assets, liabilities, income and expenses of a subsidiary acquired or disposed of during the year are included in the statement of comprehensive income from the date the Group gains control until the date the Group ceases to control the subsidiary.
Profit or loss and each component of other comprehensive income (OCI) are attributed to the equity holders of the parent of the Group and to the non-controlling interests, even if this results in the non-controlling interests having a deficit balance. When necessary, adjustments are made to the financial statements of subsidiaries to bring their accounting policies into line with the Group’s accounting policies. All intra-group assets and liabilities, equity, income, expenses and cash flows relating to transactions between members of the Group are eliminated in full on consolidation.
A change in the ownership interest of a subsidiary, without a loss of control, is accounted for as an equity transaction. If the Group loses control over a subsidiary, it derecognises the related assets (including goodwill), liabilities, non-controlling interest and other components of equity while any resultant gain or loss is recognised in profit or loss. Any investment retained is recognised at fair value.
(ii) Significant accounting judgements, estimates and assumptions
The carrying amounts of certain assets and liabilities are often determined based on estimates and assumptions of future events. The key estimate and assumptions that have a significant risk of causing a material adjustment to the carrying amounts of certain assets and liabilities within the next annual reporting period are:
Held for trading investments
The Group has classified equity investments as held for trading. This classification requires significant judgements on the intentions of the Group in relation to the investments held.
Share-based payment transactions
The Group measures the cost of equity-settled share-based payments at fair value at the grant date using a Black-Scholes formula taking into account the terms and conditions upon which the instruments were granted.
Impairment of capitalised exploration and evaluation expenditure
The future recoverability of capitalised exploration and evaluation expenditure is dependent on a number of factors, including whether the Group decides to exploit the related lease itself or, if not, whether it successfully recovers the related exploration and evaluation asset through sale.
Factors which could impact the future recoverability include the level of proved, probable and inferred mineral resources, future technological changes which could impact the cost of mining, future legal changes (including changes to environmental restoration obligations) and changes to commodity prices.
To the extent that capitalised exploration and evaluation expenditure is determined not to be recoverable in the future, this will reduce profits and net assets in the period in which the determination is made.
In addition, exploration and evaluation expenditure is capitalised if activities in the area of interest have not yet reached a stage which permits a reasonable assessment of the existence or otherwise of economically recoverable reserves. To the extent that it is determined in the future that this capitalised expenditure should be written off, this will reduce profits and net assets in the period in which this determination is made.
(iii) Property, plant and equipment
Property, plant and equipment are stated at cost less accumulated depreciation and any accumulated impairment losses.
Depreciation is calculated on a straight line basis over the useful life of the asset from the time the asset is held ready for use.
The depreciation rates used for each class are:
Buildings 10%
Plant and equipment 7.5% - 50%

LEGEND MINING LIMITED 29
NOTES TO THE FINANCIAL STATEMENTS F o r t h e y e a r e n d e d 3 1 D e c e m b e r 2 0 1 6
NOTE 2: SIGNIFICANT ACCOUNTING POLICIES (CONTD)
Impairment
The carrying values of property, plant and equipment are reviewed for impairment at each reporting date, with recoverable amount being estimated when events or changes in circumstances indicate the carrying value may not be recoverable.
For an asset that does not generate largely independent cash inflows, the recoverable amount is determined for the cash-generating unit to which the asset belongs.
If any indication of impairment exists and where the carrying values exceed the estimated recoverable amount, the assets or cash-generating units are written down to their recoverable amounts.
The recoverable amount of property, plant and equipment is the greater of fair value less costs to sell and value in use. In assessing value in use, the estimated future cash flows are discounted to their present value using a pre-tax discount rate that reflects current market assessments of the time value of money and the risks specific to the asset.
Derecognition and disposal
An item of property, plant and equipment is derecognised upon disposal or when no future economic benefits are expected to arise from the continued use of the asset. Any gain or loss arising on derecognition of the asset (calculated as the difference between the net disposal proceeds and the carrying amount of the item) is included in the income statement in the period the item is derecognised.
(iv) Borrowing costs
Borrowing costs directly attributable to the acquisition, construction or production of an asset that necessarily takes a substantial period of time to get ready for its intended use or sale are capitalised as part of the cost of the asset. All other borrowing costs are expensed in the period in which they occur. Borrowing costs consist of interest and other costs that an entity incurs in connection with the borrowing of funds.
(v) Cash and cash equivalents
Cash and cash equivalents in the statement of financial position comprise cash at bank and in hand, short-term deposits with an original maturity of three months or less that are readily convertible to known amounts of cash and which are subject to an insignificant risk of changes in value.
For the purposes of the Statement of Cash Flows, cash and cash equivalents consist of cash and cash equivalents as defined above, net of outstanding bank overdrafts.
(vi) Trade and other receivables
Trade receivables, which generally have 30-90 day terms, are recognised initially at fair value and subsequently measured at amortised cost using the effective interest method, less an allowance for any uncollectible amounts.
Collectability of trade receivables is reviewed on an ongoing basis. Debts that are known to be uncollectible are written off when identified. An allowance for doubtful debts is raised when there is objective evidence that the Group will not be able to collect the debt.
(vii) Other Financial Assets
Financial assets in the scope of AASB 139 Financial Instruments: Recognition and Measurement are classified as either financial assets at fair value through profit or loss, loans and receivables, held-to-maturity investments, or available-for-sale investments, as appropriate. When financial assets are recognised initially, they are measured at fair value, plus, in the case of investments not at fair value through profit or loss, directly attributable transactions costs. The Group determines the classification of its financial assets after initial recognition and, when allowed and appropriate, re-evaluates this designation at each financial year-end.
All regular way purchases and sales of financial assets are recognised on the trade date i.e. the date that the Group commits to purchase the asset. Regular way purchases or sales are purchases or sales of financial assets under contracts that require delivery of the assets within the period established generally by regulation or convention in the marketplace.
Financial assets at fair value through profit or loss
Financial assets classified as held for trading are included in the category ‘financial assets at fair value through profit or loss’. Financial assets are classified as held for trading if they are acquired for the purpose of selling in the near term. Derivatives are also classified as held for trading unless they are designated as effective hedging instruments. Gains or losses on investments held for trading are recognised in profit or loss.

30 2016 ANNUAL REPORT
NOTES TO THE FINANCIAL STATEMENTS F o r t h e y e a r e n d e d 3 1 D e c e m b e r 2 0 1 6
NOTE 2: SIGNIFICANT ACCOUNTING POLICIES (CONTD)
Loans and receivables
Loans and receivables are non-derivative financial assets with fixed or determinable payments that are not quoted in an active market. Such assets are carried at amortised cost using the effective interest method. Gains and losses are recognised in profit or loss when the loans and receivables are derecognised or impaired, as well as through the amortisation process.
(viii) Operating Segments
An operating segment is a component of an entity that engages in business activities from which it may earn revenues and incur expenses (including revenues and expenses relating to transactions with other components of the same entity), whose operating results are regularly reviewed by the entity's chief operating decision maker to make decisions about resources to be allocated to the segment and assess its performance and for which discrete financial information is available. This includes start-up operations which are yet to earn revenues. Management will also consider other factors in determining operating segments such as the existence of a line manager and the level of segment information presented to the board of directors.
Operating segments have been identified based on the information provided to the chief operating decision makers – being the executive management team.
Operating segments that meet the quantitative criteria as prescribed by AASB 8 are reported separately. However, an operating segment that does not meet the quantitative criteria is still reported separately where information about the segment would be useful to users of the financial statements.
Information about other business activities and operating segments that are below the quantitative criteria are combined and disclosed in a separate category for “all other segments”.
(ix) Deferred exploration costs
Deferred exploration and evaluation costs
Exploration and evaluation expenditure is stated at cost and is accumulated in respect of each identifiable area of interest.
Such costs are only carried forward to the extent that they are expected to be recouped through the successful development of the area of interest (or alternatively by its sale), or where activities in the area have not yet reached a stage which permits a reasonable assessment of the existence or otherwise of economically recoverable reserves, and active operations are continuing.
Accumulated costs in relation to an abandoned area are written off to the income statement in the period in which the decision to abandon the area is made.
A regular review is undertaken of each area of interest to determine the appropriateness of continuing to carry forward costs in relation to that area of interest.
Impairment
The carrying values of exploration and evaluation costs are reviewed for impairment when facts and circumstances indicate the carrying value may not be recoverable.
The recoverable amount of exploration and evaluation costs is the greater of fair value less costs to sell and value in use. In assessing the value in use, the estimated future cash flows are discounted to their present value using a pre-tax discount rate that reflects current market assessments of the fair value of money and the risks specific to the asset.
Accumulated costs in relation to an abandoned area are written off in full against the income statement in the year in which the decision to abandon the area is made. A regular review is undertaken of each area of interest to determine the appropriateness of continuing to carry forward costs in relation to that area of interest. Each area of interest is limited to the size related to known or probable mineral resources capable of supporting a mining operation.
(x) Provisions
Provisions are recognised when the Group has a present obligation (legal or constructive) as a result of a past event, it is probable that an outflow of resources embodying economic benefits will be required to settle the obligation and a reliable estimate can be made of the amount of the obligation.
If the effect of the time value of money is material, provisions are determined by discounting the expected future cash flows at a pre-tax rate that reflects current market assessments of the time value of money and, where appropriate, the risks specific to the liability. When discounting is used, the increase in the provision due to the passage of time is recognised as a finance cost.
(xi) Revenue
Revenue is recognised and measured at the fair value of consideration received or receivable to the extent that it is probable that economic benefits will flow to the Group and the revenue can be reliably measured. The following specific recognition criteria must also be met before revenue is recognised:

LEGEND MINING LIMITED 31
NOTES TO THE FINANCIAL STATEMENTS F o r t h e y e a r e n d e d 3 1 D e c e m b e r 2 0 1 6
NOTE 2: SIGNIFICANT ACCOUNTING POLICIES (CONTD)
Sale of goods
Revenue is recognised when the significant risks and rewards of ownership of the goods have passed to the buyer and the costs incurred or to be incurred in respect of the transaction can be measured reliably. Risks and rewards of ownership are considered passed to the buyer at the time of delivery of the goods to the customer.
Interest income
Interest revenue is recognised as it accrues, using the effective interest rate method. This is a method of calculating the amortised cost of a financial asset and allocating the interest income over the relevant period using the effective interest rate, which is the rate that exactly discounts estimated future cash receipts through the expected life of the financial asset to the net carrying amount of the financial asset.
Rental Income
Rental income is accounted for on a straight line basis over the lease term.
All revenue is stated net of the amount of goods and services tax (GST).
Current tax assets and liabilities for the current and prior periods are measured at the amount expected to be recovered from or paid to the taxation authorities. The tax rates and tax law used to compute the amount are those that are enacted or substantively enacted by the reporting date.
Deferred income tax is provided on all temporary differences at the reporting date between the tax bases of assets and liabilities and their carrying amounts for financial reporting purposes.
Deferred income tax liabilities are recognised for all taxable temporary differences:
� Except where the deferred income tax liability arises from the initial recognition of goodwill or of an asset or liability in a transaction that is not a business combination and, at the time of the transaction, affects neither the accounting profit nor taxable profit or loss; and
� In respect of taxable temporary differences associated with investments in subsidiaries, associates and interests in joint ventures, except where the timing of the reversal of the temporary differences can be controlled and it is probable that the temporary differences will not reverse in the foreseeable future.
Deferred income tax assets are recognised for all deductible temporary differences, carry-forward of unused tax assets and unused tax losses, to the extent that it is probable that taxable profit will be available against which the deductible temporary differences, and the carry-forward of unused tax assets and unused tax losses can be utilised:
� Except where the deferred income tax asset relating to the deductible temporary differences arises from the initial recognition of an asset or liability in a transaction that is not a business combination and, at the time of the transaction, affects neither the accounting profit nor taxable profit or loss; and
� In respect of deductible temporary differences associated with investments in subsidiaries, associates and interests in joint ventures, deferred tax assets are only recognised to the extent that it is probable that the temporary differences will reverse in the foreseeable future and taxable profit will be available against which the temporary differences can be utilised.
The carrying amounts of deferred tax assets is reviewed at each reporting date and reduced to the extent that it is no longer probable that sufficient taxable profit will be available to allow all or part of the deferred income tax assets to be utilised. Unrecognised deferred tax assets are reassessed at each reporting date and are recognised to the extent that it has become probable that future taxable profit will allow the deferred tax asset to be recovered.
Deferred income tax assets and liabilities are measured at the tax rates that are expected to apply to the year when the asset is realised or the liability is settled, based on tax rates (and tax laws) that have been enacted or substantively enacted at the reporting date.
Deferred tax relating to items recognised outside profit or loss is recognised outside profit or loss. Deferred tax items are recognised in correlation to the underlying transaction either in other comprehensive income or directly in equity.
Deferred tax assets and deferred tax liabilities are offset only if a legally enforceable right exists to set off current tax assets against current tax liabilities and the deferred tax assets and liabilities relate to the same taxable entity and the same taxation authority.

32 2016 ANNUAL REPORT
NOTES TO THE FINANCIAL STATEMENTS F o r t h e y e a r e n d e d 3 1 D e c e m b e r 2 0 1 6
NOTE 2: SIGNIFICANT ACCOUNTING POLICIES (CONTD)
(xii) Other taxes
Revenue, expenses and assets are recognised net of the amount of GST except:
� Where the amount of the GST incurred is not recoverable from the Australian Taxation Office. In these circumstances the GST is recognised as part of the cost of acquisition of the asset or as part of the expense.
� Receivables and payables are stated with the amount of GST included.
The net amount of GST recoverable from, or payable to, the ATO is included as a current asset or liability in the Statement of Financial Position. Commitments and contingencies are disclosed net of the amount of GST recoverable from, or payable to, the taxation authority.
Cash flows are included in the Consolidated Statement of Cash Flows on a gross basis. The GST components of cash flows arising from investing or financing activities which are recoverable from, or payable to, the ATO are classed as operating cash flows.
(xiii) Business Combinations
Business combinations are accounted for using the acquisition method. The cost of an acquisition is measured as the aggregate of the consideration transferred measured at acquisition date fair value and the amount of any non-controlling interests in the acquiree. For each business combination, the Group elects whether to measure the no n-controlling interests in the acquiree at fair value or at the proportionate share of the acquiree’s identifiable net assets. Acquisition-related costs are expensed as incurred and included in administrative expenses.
When the Group acquires a business, it assesses the financial assets and liabilities assumed for appropriate classification and designation in accordance with the contractual terms, economic circumstances and pertinent conditions as at the acquisition date. This includes the separation of embedded derivatives in host contracts by the acquiree.
If the business combination is achieved in stages, any previously held equity interest is re-measured at its acquisition date fair value and any resulting gain or loss is recognised in profit or loss.
Any contingent consideration to be transferred by the acquirer will be recognised at fair value at the acquisition date. Contingent consideration classified as an asset or liability that is a financial instrument and within the scope of AASB 139 Financial Instruments: Recognition and Measurement is measured at fair value with changes in fair value recognised either in profit or loss or as a change to OCI. If the contingent consideration is not within the scope of AASB 139, it is measured in accordance with the appropriate AASB. Contingent consideration that is classified as equity is not re-measured and subsequent settlement is accounted for within equity.
Goodwill is initially measured at cost, being the excess of the aggregate of the consideration transferred and the amount recognised for non-controlling interests, and any previous interest held, over the identifiable net assets acquired and liabilities assumed. If the fair value of the net assets acquired is in excess of the aggregate consideration transferred, the Group re-assesses whether it has correctly identified all of the assets acquired and all of the liabilities assumed and reviews the procedures used to measure the amounts to be recognised at the acquisition date. If the re-assessment still results in an excess of the fair value of net assets acquired over the aggregate consideration transferred, then the gain is recognised in profit or loss.
After initial recognition, goodwill is measured at cost less any accumulated impairment losses. For the purpose of impairment testing, goodwill acquired in a business combination is, from the acquisition date, allocated to each of the Group’s cash-generating units that are expected to benefit from the combination, irrespective of whether other assets or liabilities of the acquiree are assigned to those units.
Where goodwill has been allocated to a cash-generating unit and part of the operation within that unit is disposed of, the goodwill associated with the disposed operation is included in the carrying amount of the operation when determining the gain or loss on disposal. Goodwill disposed in these circumstances is measured based on the relative values of the disposed operation and the portion of the cash-generating unit retained.
(xiv) Trade and or other payables
Liabilities for trade creditors and other amounts are carried at amortised cost and represent liabilities for goods and services provided to the Group prior to the end of the financial year that are unpaid and arise when the Group becomes obliged to make future payments in respect of these goods and services. The amounts are unsecured and are usually paid within 30 days.
(xv) Interest bearing loans and borrowings
All loans and borrowings are initially recognised at the fair value of the consideration received less directly attributable transaction costs.
After initial recognition, interest bearing loans and borrowings are subsequently measured at amortised cost using the effective interest method. Amortised cost is calculated by taking into account any issue costs, and any discount or premium on settlement.

LEGEND MINING LIMITED 33
NOTES TO THE FINANCIAL STATEMENTS F o r t h e y e a r e n d e d 3 1 D e c e m b e r 2 0 1 6
NOTE 2: SIGNIFICANT ACCOUNTING POLICIES (CONTD)
(xvi) Share based payment transactions
The Group provides benefits to employees (including directors) of the Group and to the providers of services to the Group in the form of share based payment transactions, whereby employees or service providers render services in exchange for shares or rights over shares (‘equity-settled transactions’).
There are currently three scenarios in place to provide these services:
(a) ‘Employees Share Option Plan’, which provides benefits to eligible persons;
(b) Capital raising costs, which provide payment to stockbrokers and finance institutions for capital raising services and commissions; and
(c) Other grants of options to directors on an ad hoc basis.
The cost of the equity-settled transactions with stockbrokers and finance institutions is measured by reference to the fair value of the service received at the date they are granted.
For transactions with employees (including directors), the cost of these equity-settled transactions is measured by reference to the fair value of the options provided. The fair value is determined by an external valuer using a Black-Scholes model.
The cost of these equity-settled transactions with employees is recognised, together with a corresponding increase in equity, over the period in which the performance conditions are fulfilled, ending on the date on which the relevant employee becomes fully entitled to the award (‘vesting date’).
In valuing these equity-settled transactions, no account is taken of any performance conditions, other than conditions linked to the price of the shares of Legend Mining Limited (market conditions) if applicable.
The cumulative expense recognised for these equity-settled transactions at each reporting date until vesting date reflects (i) the extent to which the vesting period has expired and (ii) the Group’s best estimate of the number of equity instruments that wi ll ultimately vest. No adjustment is made for the likelihood of market conditions being met as the effect of these conditions is included in the determination of fair value at grant date. The income statement charge or credit for a period represents the movement in cumulative expenses recognised as at the beginning and end of the period.
No expense is recognised for awards that do not ultimately vest, except for awards where vesting is only conditional upon a market condition.
If the terms of an equity-settled award are modified, as a minimum an expense is recognised as if the terms had not been modified. In addition, an expense is recognised for any modification that increases the total fair value of the share-based payment arrangement, or is otherwise beneficial to the employee, as measured at the date of modification.
If an equity-settled award is cancelled, it is treated as if it had vested on the date of cancellation, and any expense not yet recognised for the award is recognised immediately. However , if a new award is substituted for the cancelled award and designated as a replacement award on the date that it is granted, the cancelled and new award are treated as if they were a modification of the original award, as described in the previous paragraph.
For transactions with other service providers, the cost of these equity-settled transactions is measured by reference to the value of the services provided. The cost of these equity-settled transactions is recognised, together with a corresponding increase in equity, at the time the services are provided unless they are transaction costs arising on the issue of ordinary shares, in which case the transaction costs are recognised directly in equity as a reduction of the proceeds received on the issue of shares.
(xvii) Contributed Equity
Issued and paid up capital is recognised at the fair value of the consideration received by the Company. Any transaction costs net of tax arising on the issue of ordinary shares are recognised directly in equity as a reduction of the proceeds received.
(xviii) Employee Benefits
Provision is made for employee benefits accumulated as a result of employee services up to the reporting date. These employee benefits include wages, salaries, annual leave and include related on-costs such as superannuation and payroll tax.
The Group does not expect its long service leave or annual leave benefits to be settled wholly within 12 months of each reporting date. The Group recognises a liability for long service leave and annual leave measured as the present value of expected future payments to be made in respect of services provided by employees up to the reporting date using the projected unit credit method. Consideration is given to expected future wage and salary levels, experience of employee departures, and periods of service.
Expected future payments are discounted using market yields at the reporting date on national government bonds with terms to maturity and currencies that match, as closely as possible, the estimated future cash outflows.

34 2016 ANNUAL REPORT
NOTES TO THE FINANCIAL STATEMENTS F o r t h e y e a r e n d e d 3 1 D e c e m b e r 2 0 1 6
NOTE 2: SIGNIFICANT ACCOUNTING POLICIES (CONTD)
No provision is made for non-vesting sick leave, as the anticipated pattern of future sick leave taken indicates that accumulated non-vesting sick leave will never be paid.
The liability for long service leave is recognised and measured as the present value of expected future payments to be made in respect of services provided by employees up to the reporting date using the projected unit credit method. Consideration is given to expected future wage and salary levels, experience of employee departures, and period of service. Expected future payments are discounted using market yields at the reporting date on national government bonds with terms to maturity and currencies that match, as closely as possible, the estimated future cash outflow.
Contributions to employee superannuation funds of choice are expensed as incurred.
(xix) Earnings per share
Basic earnings per share (EPS) is calculated as net profit or loss attributable to members, adjusted to exclude costs of servicing equity (other than dividends), divided by the weighted average number of ordinary shares, adjusted for any bonus element.
Diluted EPS is calculated as net profit or loss attributable to members, adjusted for:
(a) Costs of servicing equity (other than dividends).
(b) The after tax effect of dividends and interest associated with the dilutive potential ordinary shares that have been recognised as expenses; and
(c) Other non-discretionary changes in revenues or expenses during the period that would result from the dilution of potential ordinary shares;
divided by the weighted average number of ordinary shares and dilutive potential ordinary shares, adjusted for any bonus element.
(xx) Foreign currency translation
(a) Functional and presentation currency
The Group’s consolidated financial statements are presented in Australian dollars, which is also the Company’s functional currency. For each entity, the Group determines the functional currency and items included in the financial statements of each entity are measured using that functional currency.
(b) Transactions and balances
Transactions in foreign currencies are initially recorded by the Group’s entities at their respective functional currency spot rates at the date the transaction first qualifies for recognition.
Monetary assets and liabilities denominated in foreign currencies are retranslated at the functional currency spot rates of exchange at the reporting date.
Non-monetary items that are measured in terms of historical cost in a foreign currency are translated using the exchanges rates at the dates of the initial transactions. Non-monetary items measured at fair value in a foreign currency are translated using the exchange rates at the date when the fair value is determined. The gain or loss arising on translation of non-monetary items measured at fair value is treated in line with the recognition of gain or loss on change in fair value of the item (ie translation differences on items whose fair value gain or loss is recognised in other comprehensive income or profit or loss are also recognised in other comprehensive income or profit or loss respectively).
(c) Group Companies
On consolidation, the assets and liabilities of foreign operations are translated into Australian dollars at the rate of exchange prevailing at the reporting date and their statements of profit or loss are translated at average rates for the reporting period. The exchange differences arising on translation for consolidation purposes are recognised in other comprehensive income. On disposal of a foreign operation, the component of other comprehensive income relating to that particular foreign operation is recognised in profit or loss.
(xxi) Non-current assets held for sale
The Group classifies non-current assets and disposal groups as held for sale if their carrying amounts will be recovered principally through a sale rather than through continuing use. Such non-current assets or disposal groups classified as held for sale are measured at the lower of their carrying amount and fair value less costs to sell.

LEGEND MINING LIMITED 35
NOTES TO THE FINANCIAL STATEMENTS F o r t h e y e a r e n d e d 3 1 D e c e m b e r 2 0 1 6
NOTE 2: SIGNIFICANT ACCOUNTING POLICIES (CONTD)
The criteria for held for sale classification is regarded as met only when the sale is highly probable and the asset or disposal group is available for immediate sale in its present condition subject only to terms that are usual and customary for sales of such assets. For the sale to be highly probable management must be committed to a plan to sell the asset, and an active program to locate a buyer and complete the plan must have been initiated. In addition, the sale should be expected to qualify for recognition
as a completed sale within one year from the date of classification and actions required to complete the plan should indicate that it is unlikely that significant changes to the plan will be made or that the plan will be withdrawn.
Property, plant and equipment and intangible assets are not depreciated or amortised once classified as held for sale.
Assets and liabilities classified as held for sale are presented separately as current items in the statement of financial position.
(xxii) Current versus non-current classification
The Group presents assets and liabilities in the statement of financial position based on current/non-current classification. An asset is current when it is:
� Expected to be realised or intended to be sold or consumed in the Group’s normal operating cycle;
� Held primarily for the purpose of trading;
� Expected to be realised within twelve months after the reporting period; or
� Cash or cash equivalent unless restricted from being exchanged or used to settle a liability for at least twelve months after the reporting period.
The Group classifies all other assets as non-current.
A liability is current when:
� It is expected to be settled in the Group’s normal operating cycle;
� It is held primarily for the purpose of trading;
� It is due to be settled within twelve months after the reporting period; or
� There is no unconditional right to defer the settlement of the liability for at least twelve months after the reporting period.
The Group classifies all other liabilities as non-current. Deferred tax assets and liabilities are classified as non-current assets and liabilities.
NOTE 3: NATURE OF OPERATIONS AND PRINCIPAL ACTIVITIES The principal activities during the year of the entities within the consolidated entity were exploration for nickel and copper deposits in Australia.

36 2016 ANNUAL REPORT
NOTES TO THE FINANCIAL STATEMENTS F o r t h e y e a r e n d e d 3 1 D e c e m b e r 2 0 1 6
NOTE 4: REVENUE AND EXPENSES Note 2016 $
2015 $
Revenues and expenses a) Finance Revenue
Bank interest received and receivable 183,520 190,833 Interest on receivables 9 223,660 384,329 407,180 575,162
b) Other Income
Other 123,007 115,659 123,007 115,659
c) Employee Benefits Expense Salaries, on-costs and other employee benefits 527,796 622,393
527,796 622,393
d) Impairment of Deferred Exploration Costs Impairment of deferred exploration costs 12 492,882 -
e) Loss on remeasurement of Receivables Loss on remeasurement of Jindal receivable 9 - 201,590
f) Other Expenses Depreciation 14,136 13,735 Exploration expenditure not capitalised - 221,719
14,136 235,454 g) Corporate and administration expenses
Fees – Audit/Tax 66,953 93,681 Fees – ASX 36,121 31,102 Fees – Share Registry 13,440 21,706 Consultancy Fees 55,890 110,207 Office Rent 58,750 70,474 Legal expenses 1,800 18,536 Travel expenses 45,445 37,841 Other expenses 229,543 229,401
507,942 612,948 h) Impairment of Jindal receivable
Impairment of Jindal receivable 9 3,005,000 -
NOTE 5: EARNINGS PER SHARE 2016
$ 2015
$ (a) Reconciliation of earnings to net loss:
Net (Loss) (2,599,591) (1,311,284) Profit/(Loss) used in the calculation of basic earnings per share (2,599,591) (1,311,284)
(b) Weighted average number of shares on issue during the financial year used in the calculation of basic loss per share 2,034,350,801 1,982,243,952
Weighted average number of ordinary shares on issue used in the calculation of diluted loss per share 2,034,350,801 1,982,243,952
(c) Information on classification of options
For the year ended 31 December 2016, all options on issue were antidilutive as the various exercise prices were all greater than the average market price of the Company’s shares during the year. This has resulted in the diluted earnings per share being the same as the basic earnings per share. These options could potentially dilute basic earnings per share in the future.

LEGEND MINING LIMITED 37
NOTES TO THE FINANCIAL STATEMENTS F o r t h e y e a r e n d e d 3 1 D e c e m b e r 2 0 1 6
NOTE 6: INCOME TAX
2016 $
2015 $
The major components of income tax expense are: Income Statement Current income tax Current year income tax charge (benefit) - - Under/Over provision of prior tax year - - Deferred income tax Relating to origination and reversal of temporary differences Under/Over provision of prior tax year
- -
- -
Income tax benefit reported in the income statement - -
A reconciliation between tax expense and the product of accounting profit/(loss) before income tax multiplied by the Group’s applicable income tax rate is as follows:
Accounting loss before tax from ordinary activities (2,599,591) (1,311,284) Accounting loss before income tax (2,599,591) (1,311,284) At the Group’s statutory income tax rate of 30% (779,877) (393,385) Expenditure not allowed for income tax purposes 754,917 63,875 Utilisation of unrecognised capital losses (793,171) (222,244) Movement in unrecognised temporary differences 1,077,633 (44,322) Conversion of franking credits to tax losses - (10,607) Other assessable income - 8,656 Current year tax losses not recognised - 606,966 Recognition of previously unrecognised prior period tax losses (228,056) - Non-assessable income (28,046) - Deductible equity raising costs (3,400) (8,939) Income tax expense attributable to entity reported in the consolidated income statement - - Income tax expensed directly to equity Relating to equity costs - - Deferred tax expense/(income) recognised in equity - - Current Income Tax Asset/(Liability) - -

38 2016 ANNUAL REPORT
NOTES TO THE FINANCIAL STATEMENTS F o r t h e y e a r e n d e d 3 1 D e c e m b e r 2 0 1 6
NOTE 6: INCOME TAX (CONTD)
2016 $
2015 $
Deferred Income Tax Deferred income tax at 31 December related to the following: Consolidated Recognised deferred tax liabilities Capitalised exploration and evaluation expenditure (1,203,910) (455,058) Investments - (98,686) Other (13,945) (7,599) Amounts disclosed as deferred tax liability (1,217,855) (561,343) Set-off of deferred tax assets 1,217,855 561,343 Net deferred tax liabilities disclosed - - Recognised deferred tax assets Tax losses available to offset against future taxable income 1,012,061 292,922 Other provisions 55,794 58,421 Other future blackhole deductions 150,000 210,000 Gross deferred tax assets 1,217,855 561,343 Set-off of deferred tax assets (1,217,855) (561,343) Net deferred tax assets recognised - - Unrecognised deferred tax assets Deferred tax assets have not been recognised in respect of the following as the statutory requirements for recognising those deferred tax assets have not been met
Deductible temporary differences 1,108,731 34,498 Tax revenue losses 547,952 973,532 Tax capital losses 2,309,577 3,102,748 3,966,260 4,110,778
Tax Consolidation
Legend Mining Limited and its 100% owned Australian resident subsidiaries formed a tax consolidated group with effect from 1 July 2004. Legend Mining Limited is the head entity of the tax consolidated group. Members of the group have entered into a tax sharing agreement in order to allocate the income tax liabilities between the entities within the Group should the head entity default on its tax payment obligations. At the balance date, the possibility of default is remote.
Tax effect accounting by members of the tax consolidated group
Tax expense / income, deferred tax liabilities and deferred tax assets arising from temporary differences are recognised in the separate financial statements of the members of the tax consolidated group using the separate taxpayer within a group method. Current tax liabilities and assets and deferred tax assets arising from unused tax losses and tax credits of the members of the tax consolidated group are recognised by the Company (as head entity in the tax consolidated group).
Members of the tax consolidated group have not entered into a tax funding agreement. As a result, the aggregate of the current tax liability or asset and any deferred tax asset arising from unused tax losses and tax credits in respect of that period, assumed by the Company, are recognised as a contribution from (or distribution to) equity participants. There were no contributions (or distributions) made during the year ended 31 December 2016.
2016 Tax Return
On 11 January 2017, the Company lodged its tax return for the tax year ended 30 June 2016 and claimed a refundable Research and Development (R&D) tax offset of $1,037,084.85. In March 2017, the Company received this refund.

LEGEND MINING LIMITED 39
NOTES TO THE FINANCIAL STATEMENTS F o r t h e y e a r e n d e d 3 1 D e c e m b e r 2 0 1 6
NOTE 7: SEGMENT INFORMATION Operating Segments
The group has one reportable operating segment, being exploration and evaluation activities in Australia.
NOTE 8: CASH AND CASH EQUIVALENTS 2016 2015 $ $
Cash at bank and in hand 673,674 251,185 Deposits 6,000,000 6,000,000
6,673,674 6,251,185
Cash at bank earns interest at floating rates based on daily bank deposit rates.
Deposits at call earn interest on a 30, 60 and 90 day term basis at bank deposit rates.
NOTE 9: TRADE AND OTHER RECEIVABLES
2016 2015 $ $
Current Receivable from Jindal Mining & Exploration Limited (a) 3,005,000 2,901,340 Provision for Jindal receivable (3,005,000) - Other receivables (b) 31,243 24,837 31,243 2,926,177
Terms and conditions relating to the above financial instruments:
(a) The receivable from Jindal Mining & Exploration Limited (“Jindal”) shown at 31 December 2015 was for the second tranche of $6 million due on 5 August 2015 following the sale of the Cameroon Project. The repayment terms of this amount were renegotiated on 28 July 2015, with the key amendments being:
� The $6 million payment is now to be paid in two tranches; $3 million on 15 September 2015 (received) and a further $3 million that was due on or before 15 December 2016 (see below);
� Interest of 4% payable quarterly in arrears will be payable on the second $3 million; and � The $5.5 million payable under the Jindal Agreement upon the grant of a Mining Convention at the Cameroon Iron Ore
Project (“Project”) is now rescheduled to be paid upon the first commercial shipment of iron ore from the Project.
On 4 January 2017, the Company announced that it had received a request from Jindal Steel and Power (Mauritius) Limited (“Jindal”) to consider a further deferral of the payment of the final amount of $3 million owing to Legend from the sale of the Cameroon Iron Ore project. At that time, Legend agreed to this request in principle, and expected to report to the ASX as soon as an agreement of new payment terms was reached. Legend has since been advised by Jindal that it is undergoing a major debt rescheduling with its creditors and is unable to make any payments to creditors, including Legend, nor finalise any rescheduling of the Legend debt until its own debt rescheduling is complete. At the date of this report, Legend has yet to complete an agreement on new payment terms with Jindal. As a result, out of the abundance of caution and in light of the fact that Jindal did not pay the receivable in December 2016 as previously agreed, the directors have decided to impair and provide for the Jindal receivable in full. Your directors are currently in discussions with Jindal to complete an agreement on new payment terms in the first half of 2017.
(b) Other receivables are non-interest bearing and have repayment terms of between 30 and 60 days.

40 2016 ANNUAL REPORT
NOTES TO THE FINANCIAL STATEMENTS F o r t h e y e a r e n d e d 3 1 D e c e m b e r 2 0 1 6
NOTE 10: OTHER FINANCIAL ASSETS
2016 2015 $ $ Current Shares in Independence Group NL – at fair value (a) - 2,514,600 Shares in S2 Resources Ltd – at fair value (b) 166,308 120,000 Shares and options in Nemex Resources Ltd – at fair value (c) 66,000 66,000 Shares in Artemis Resources Ltd – at fair value (d) 120,000 60,000 Security bond (e) 50,000 - 402,308 2,760,600 Non-current Security bond (e) - 50,000 Rental property bond (f) 5,775 -
Terms and conditions relating to the above financial instruments:
(a) Shares in Independence Group NL – 990,000 shares were on hand at 31 December 2015 and had a market value of $2.54 each. The shares in Independence Group NL were sold in 2016
(b) Shares in S2 Resources Ltd – 755,946 shares were on hand at 31 December 2016. The shares had a market value of $0.22 each (2015: $0.16).
(c) Shares and options in Nemex Resources Ltd – 3,300,000 shares were on hand at 31 December 2016. The shares had a market value of $0.02 each (2015: 3,300,000 shares at $0.02).
(d) Shares in Artemis Resources Ltd – 60,000,000 shares were on hand at 31 December 2016. The shares had a market value of $0.002 each at 31 December 2016 (2016: 60,000,000 shares at $0.001).
(e) Security bond – bank deposit held as security for credit cards. At 31 December 2016, this deposit is held on a 6 month term deposit with an interest rate of 2.66% per annum (31 December 2015, 6 months at 3.05%pa).
(f) Rental Property Bond – this bond relates to a rental property in Kalgoorlie WA. No interest is received on this bond.
The equity investments are all classified as held for trading. The market value of all equity investments represent the fair value based on quoted prices on active markets (ASX) as at the reporting date without any deduction for transaction costs. These investments are classified as Level 1 financial instruments. There have been no transfers between levels of the fair value hierarchy used in measuring the fair value of these financial instruments, or changes in its classification as a result of a change in the purpose or use of these assets.

LEGEND MINING LIMITED 41
NOTES TO THE FINANCIAL STATEMENTS F o r t h e y e a r e n d e d 3 1 D e c e m b e r 2 0 1 6
NOTE 11: PROPERTY, PLANT AND EQUIPMENT 2016
$ 2015
$ Plant and equipment At 1 January 2016 Net of accumulated depreciation 44,486 47,920 Additions 141,906 10,300 Disposals - - Depreciation expense - Admin (14,136) (13,734) Depreciation expense - Exploration (15,777) - At 31 December 2016 Net of accumulated depreciation 156,479 44,486 At 1 January 2016 Cost 139,537 129,237 Accumulated depreciation (95,051) (81,317) Net carrying amount 44,486 47,920 At 31 December 2016 Cost 281,444 139,537 Accumulated depreciation (124,965) (95,051) Net carrying amount 156,479 44,486
NOTE 12: DEFERRED EXPLORATION COSTS Note 2016
$ 2015
$ Deferred exploration costs 7,712,131 5,485,454 Deferred exploration and evaluation costs At 1 January, at cost 5,485,454 393,318 Acquired during the year (i) - 3,871,500 Impaired during the year (ii) (492,882) - Expenditure incurred during the year 2,719,559 1,220,636 At 31 December, at cost (iii) 7,712,131 5,485,454
Note:
(i) During the 2015 year Legend entered into a Tenement Sale and Exploration Joint Venture Agreement (“Creasy Agreement”) with the Creasy Group in the Fraser Range district of Western Australia. Legend acquired a 70% interest in tenements (E28/2188-2192, E28/1718 and E28/1727) for the following consideration:
� $2.5 million cash payment; � 71.5 million Legend shares were valued at a deemed price of $0.011 ($786,500); and � 150 million five year Legend options exercisable at $0.04, for accounting purposes valued at a deemed price of $0.0039
($585,000). Legend is to sole fund exploration and free carry Creasy Group’s 30% interest through to the signing of Mining Venture Agreements.
(ii) During the year Legend withdrew three tenements, being E28/2342, E28/2408 and E28/2415. As a result, $492,882 of expenditure on these three tenements was written off.
(iii) The future recoverability of capitalised exploration and evaluation expenditure is dependent on a number of factors, including whether the Group decides to exploit the related lease itself or, if not, whether it successfully recovers the related exploration and evaluation asset through sale.
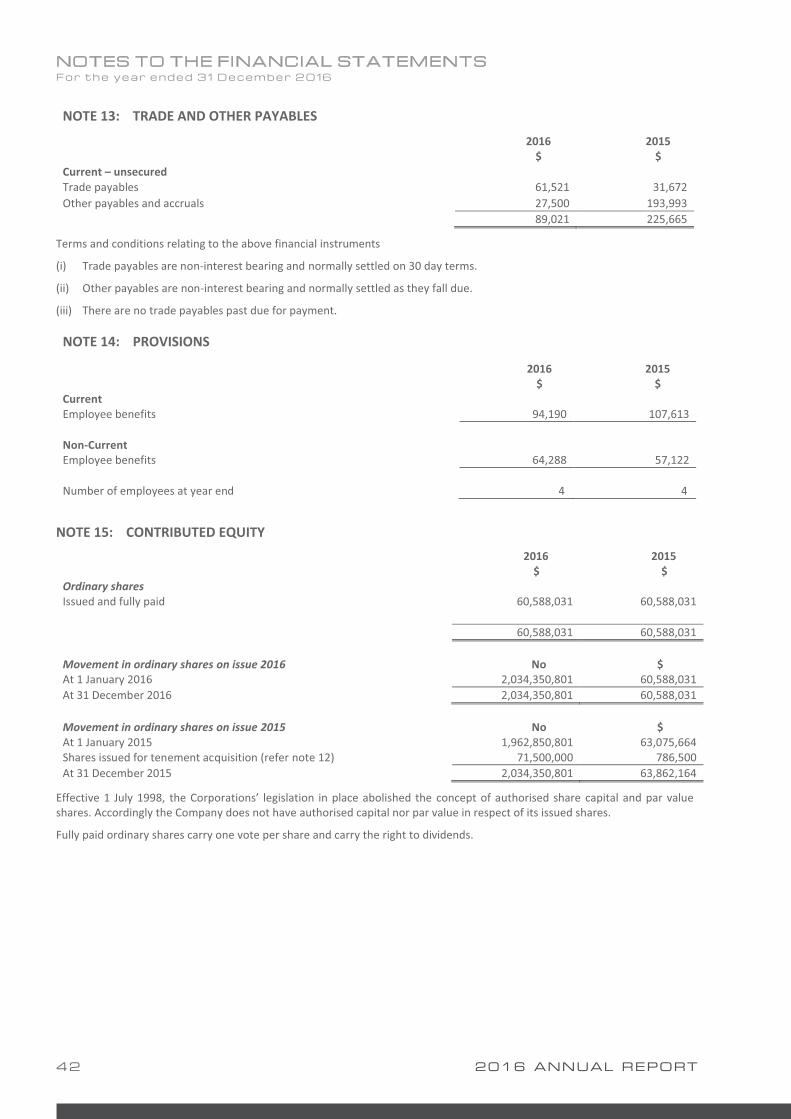
42 2016 ANNUAL REPORT
NOTES TO THE FINANCIAL STATEMENTS F o r t h e y e a r e n d e d 3 1 D e c e m b e r 2 0 1 6
NOTE 13: TRADE AND OTHER PAYABLES
2016 $
2015 $
Current – unsecured Trade payables 61,521 31,672 Other payables and accruals 27,500 193,993 89,021 225,665
Terms and conditions relating to the above financial instruments
(i) Trade payables are non-interest bearing and normally settled on 30 day terms.
(ii) Other payables are non-interest bearing and normally settled as they fall due.
(iii) There are no trade payables past due for payment.
NOTE 14: PROVISIONS
2016 $
2015 $
Current Employee benefits 94,190 107,613 Non-Current Employee benefits 64,288 57,122 Number of employees at year end 4 4
NOTE 15: CONTRIBUTED EQUITY 2016
$ 2015 $
Ordinary shares Issued and fully paid 60,588,031 60,588,031 60,588,031 60,588,031 Movement in ordinary shares on issue 2016 No $ At 1 January 2016 2,034,350,801 60,588,031 At 31 December 2016 2,034,350,801 60,588,031
Movement in ordinary shares on issue 2015 No $ At 1 January 2015 1,962,850,801 63,075,664 Shares issued for tenement acquisition (refer note 12) 71,500,000 786,500 At 31 December 2015 2,034,350,801 63,862,164
Effective 1 July 1998, the Corporations’ legislation in place abolished the concept of authorised share capital and par value shares. Accordingly the Company does not have authorised capital nor par value in respect of its issued shares.
Fully paid ordinary shares carry one vote per share and carry the right to dividends.

LEGEND MINING LIMITED 43
NOTES TO THE FINANCIAL STATEMENTS F o r t h e y e a r e n d e d 3 1 D e c e m b e r 2 0 1 6
NOTE 16: RESERVES Share option
premium reserve
Movement in reserves $ At 1 January 2015 23,002,578 Options issued to employees(refer note 18) 206,200 At 31 December 2016 23,208,778
Share option premium reserve
The share option premium reserve is used to record the value of share based payments provided to employees, directors and contractors, as part of their remuneration.
NOTE 17: SHARE OPTIONS Number Exercise price
cents per share Unlisted options – Expiry date 23 September 2020 At 1 January 2016 150,000,000 4 cents At 31 December 2016 150,000,000 Unlisted options – Expiry date 30 March 2021 At 1 January 2016 - 4 cents Issued during the year 73,000,000 4 cents At 31 December 2015 73,000,000
NOTE 18: SHARE-BASED PAYMENT PLANS (a) Recognised share-based payment expenses During the 2016 Year the following share-based payment transactions occurred:
� 70,000,000 options with an exercise price of 4 cents and expiring on 30 March 2021 were issued to Directors following approval at the Annual General Meeting of the Company held on 28 April 2016. The fair value of the options granted during the half-year was 0.28 cents, for a total value of $196,000 included within share-based payments expense.
� 3,000,000 incentive options with an exercise price of 4 cents and expiring on 30 March 2021 were issued to employees. The fair value of the options granted during the half-year was 0.34 cents, for a total value of $10,200 included within share-based payments expense.
The fair values were calculated by using the Black-Scholes European Option Pricing Model applying the following inputs:
Director Options Incentive Options
Exercise price (cents) 4.0 4.0
Life of the option (years) 5.0 5.0
Underlying share price (cents) 0.9 1.0
Expected share price volatility 75.0% 75.0%
Risk free interest rate 2.06% 2.14%
(b) Types of share-based payment plans
Employee Share Option Plan, ‘ESOP’
Share options are granted to Eligible Persons with more than 6 months service. Eligible Persons are determined by the Board after taking into account the following considerations:
(i) the seniority of the Eligible Person and the position the Eligible Person occupies within the Group;

44 2016 ANNUAL REPORT
NOTES TO THE FINANCIAL STATEMENTS F o r t h e y e a r e n d e d 3 1 D e c e m b e r 2 0 1 6
18. SHARE BASE PAYMENT PLAN (CONTD)
(ii) the length of service of the Eligible Person with the Group;
(iii) the record of employment of the Eligible Person with the Group;
(iv) the contractual history of the Eligible Person with the Group;
(v) the potential contribution of the Eligible Person to the growth of the Group;
(vi) the extent (if any) of the existing participation of the Eligible Person in the Plan; and
(vii) any other matters which the Board considers relevant.
At a General Meeting on the 4 December 2009 shareholders approved the implementation of Employee Share Option Plan No 3. The new plan differs from the previous plans in that there is no 12 month vesting period on any new options received under plan No 3. There is a significant change in the context of recent proposals by the Federal Government to change the tax treatment of options issued under incentive schemes. Removal of the vesting period requirement allows the Board maximum flexibility to make offers of options on the terms of the plans appropriate at the time, having regard for the tax environment which the proposed participants find themselves in when an offer of options is received from the company.
Vendor Options
In 2015 share options were granted, as opposed to cash payments, for the following expenses:
(i) Tenement acquisition – 150,000,000 options were granted as part consideration for the tenement acquisition from the Creasy Group, following shareholder approval at a general meeting on 17 September 2015. The options were issued on 23 September 2015.
(c) Summaries of options granted
ESOP: The following table illustrates the number (No.) and weighted average exercise prices (WAEP) of, and movements in, share options issued during the year:
2016 No.
2016 WAEP
($) 2015 No.
2015 WAEP
($) Outstanding balance at the beginning of the year - - 60,000,000 0.040
Granted during the year 73,000,000 0.040 - -
Expired/lapsed during the year - - (60,000,000) 0.040
Outstanding at the end of the year 73,000,000 0.040 - -
Exercisable at the end of the year 73,000,000 0.040 - -
ExSOP: The following table illustrates the number (No.) and weighted average exercise prices (WAEP) of, and movements in, share options issued during the year:
2016 No.
2016 WAEP
2015 No.
2015 WAEP
Outstanding balance at the beginning of the year 150,000,000 0.040 175,650,000 0.044
Granted during the year - - 150,000,000 0.040
Expired/lapsed during the year - - (175,650,000) 0.044
Outstanding at the end of the year 150,000,000 0.040 150,000,000 0.040
Exercisable at the end of the year 150,000,000 0.040 150,000,000 0.040
The outstanding balance as at 31 December 2016 is represented by:
(i) 150,000,000 options over ordinary shares with an exercise price of $0.04 each, exercisable immediately and expiring on 23 September 2020.
(ii) 73,000,000 options over ordinary shares with an exercise price of $0.04 each, exercisable immediately and expiring on 30 March 2021.

LEGEND MINING LIMITED 45
NOTES TO THE FINANCIAL STATEMENTS F o r t h e y e a r e n d e d 3 1 D e c e m b e r 2 0 1 6
NOTE 19: RELATED PARTIES (i) Wholly-owned group transactions
Loans made by Legend Mining Limited to wholly-owned subsidiaries are repayable on demand and are not interest bearing.
(ii) Other related party transactions
Transactions between related parties are on normal commercial terms and conditions no more favourable than those available to other parties unless otherwise stated.
(iii) Ultimate parent
Legend Mining Limited is the ultimate parent company.
(iv) Compensation of key management personnel of the Group
2016 $
2015 $
Short-term employee benefits 639,487 648,564 Post-employment benefits 63,577 63,577 Other long-term benefits - - Termination benefits - - Share-based payment 196,000 - Total compensation paid to Key Management Personnel 899,064 712,141
The amounts disclosed in the table are the amounts recognised as an expense during the reporting period related to key management personnel.
NOTE 20: CASH FLOW INFORMATION (i) Reconciliation of Cash
For the purposes of the Cash Flow Statement, cash and cash equivalents includes cash on hand and at bank and short term deposits at call, net of outstanding bank overdrafts. Cash as at the end of the financial year as shown in the Cash Flow Statement is reconciled to the related items in the Statement of Financial Position as follows:
Note 2016 $
2015 $
Cash on hand 500 500 Cash at bank 673,174 250,685 Deposits at call 6,000,000 6,000,000 8 6,673,674 6,251,185
(ii) Reconciliation of net loss after income tax to net cash used in operating activities
Net loss after tax (2,599,591) (1,311,284) Depreciation 29,913 13,735 Dividends received - (24,750) Impairment of Jindal receivable 3,005,000 201,590 Share-based payments expense 206,200 - Unwinding of discount on receivables (103,659) (349,329) Fair value (gain)/loss on investments (1,624,178) 329,720 Deferred exploration costs impaired 492,882 -
(593,433) (1,140,318) Change in operating assets and liabilities: (Increase)/decrease in receivables (29,966) 18,660 (Decrease)/increase in provision for annual leave (13,423) (22,616) Increase in provision for long service leave 7,166 7,167 Increase/(decrease) in payables (17,626) (13,202) Net cash used in operating activities (647,282) (1,150,309)
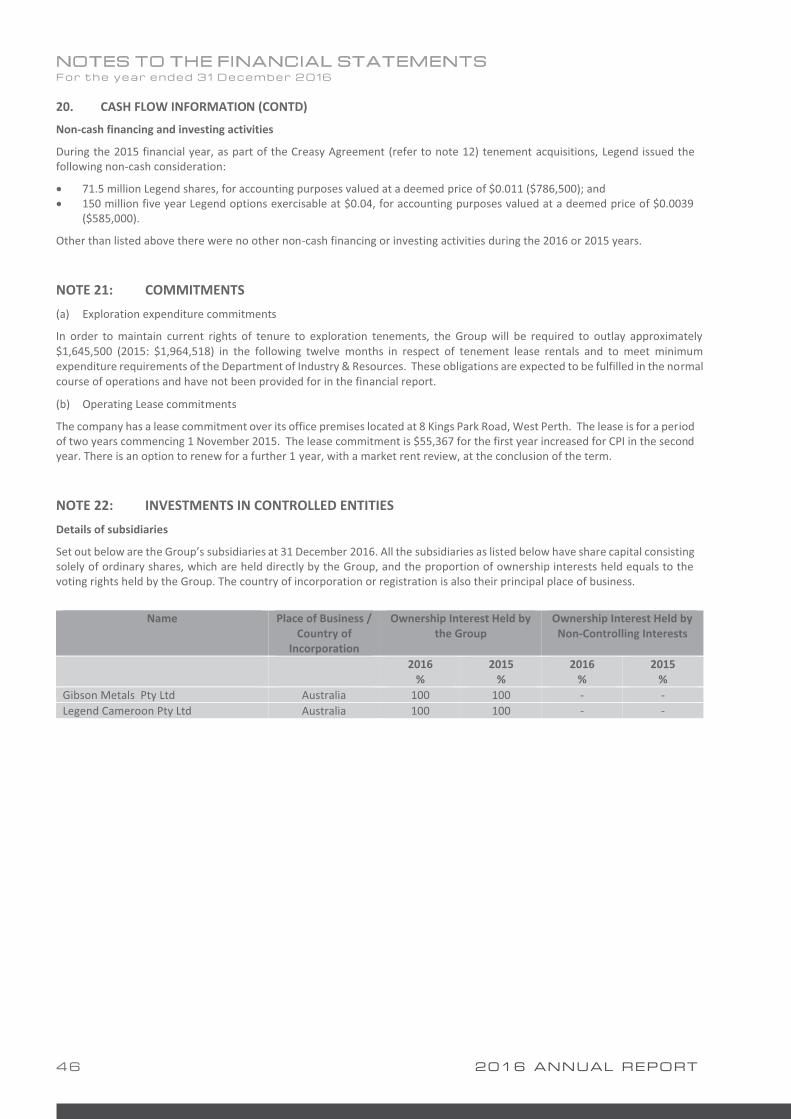
46 2016 ANNUAL REPORT
NOTES TO THE FINANCIAL STATEMENTS F o r t h e y e a r e n d e d 3 1 D e c e m b e r 2 0 1 6
20. CASH FLOW INFORMATION (CONTD)
Non-cash financing and investing activities
During the 2015 financial year, as part of the Creasy Agreement (refer to note 12) tenement acquisitions, Legend issued the following non-cash consideration:
� 71.5 million Legend shares, for accounting purposes valued at a deemed price of $0.011 ($786,500); and � 150 million five year Legend options exercisable at $0.04, for accounting purposes valued at a deemed price of $0.0039
($585,000).
Other than listed above there were no other non-cash financing or investing activities during the 2016 or 2015 years.
NOTE 21: COMMITMENTS (a) Exploration expenditure commitments
In order to maintain current rights of tenure to exploration tenements, the Group will be required to outlay approximately $1,645,500 (2015: $1,964,518) in the following twelve months in respect of tenement lease rentals and to meet minimum expenditure requirements of the Department of Industry & Resources. These obligations are expected to be fulfilled in the normal course of operations and have not been provided for in the financial report.
(b) Operating Lease commitments
The company has a lease commitment over its office premises located at 8 Kings Park Road, West Perth. The lease is for a period of two years commencing 1 November 2015. The lease commitment is $55,367 for the first year increased for CPI in the second year. There is an option to renew for a further 1 year, with a market rent review, at the conclusion of the term.
NOTE 22: INVESTMENTS IN CONTROLLED ENTITIES Details of subsidiaries
Set out below are the Group’s subsidiaries at 31 December 2016. All the subsidiaries as listed below have share capital consisting solely of ordinary shares, which are held directly by the Group, and the proportion of ownership interests held equals to the voting rights held by the Group. The country of incorporation or registration is also their principal place of business.
Name Place of Business /
Country of Incorporation
Ownership Interest Held by the Group
Ownership Interest Held by Non-Controlling Interests
2016 %
2015 %
2016 %
2015 %
Gibson Metals Pty Ltd Australia 100 100 - - Legend Cameroon Pty Ltd Australia 100 100 - -

LEGEND MINING LIMITED 47
NOTES TO THE FINANCIAL STATEMENTS F o r t h e y e a r e n d e d 3 1 D e c e m b e r 2 0 1 6
NOTE 23: FINANCIAL INSTRUMENTS DISCLOSURE The Group’s principal financial instruments comprise loans and borrowings, and cash and short-term deposits and investments held for trading.
The main purpose of these financial instruments is to raise finance for the Group’s operations. The Group has various other financial assets and liabilities such as trade receivables and trade payables, which arise directly from its operations. It is, and has been throughout the period under review, the Group’s policy that no trading in financial instruments shall be undertaken. The main risks arise from the Group’s financial instruments are fair value interest rate risks, liquidity risk, credit risk and equity price risk. The Board reviews and agrees policies for managing each of these risks and they are summarised below.
Details of the significant accounting policies and methods adopted, including the criteria for recognition, the basis of measurement and the basis on which income and expenses are recognised in respect of each class of financial asset, financial liability and equity instrument are disclosed in note 2 to the financial statements.
Fair value interest risk
The Group’s exposure to fair value interest risk is minimal.
Commodity price risk
The Group’s exposure to price risk is minimal as the group is still in an exploration phase and has no revenues from mining.
Credit risk
The Group trades only with recognised, creditworthy third parties.
It is the Group’s policy that all customers who wish to trade on credit terms are subject to credit verification procedures. In addition, receivable balances are monitored on an ongoing basis.
The only significant concentration of credit risk within the Group is the loan receivable from Jindal. Exposure to credit risk is managed through regular analysis of Jindal’s ability and willingness to meet payment obligations. The carrying amount of financial assets represents the maximum credit exposure. The Company has provided in full for the $3million receivable from Jindal (see Note 9 for full details on this impairment). No collateral is held as security. Jindal’s obligations are supported by a guarantee from its parent entity. Jindal’s parent is a large industrial conglomerate listed on both the Bombay Stock Exchange and National Stock Exchange of India. The credit rating and financial health of Jindal and its parent entity are monitored regularly as is Jindal’s exploration activities in-country Cameroon.
With respect to credit risk arising from the other financial assets of the Group, which comprise cash and cash equivalents, the Group’s exposure to credit risk arises from default of the counter party, with a maximum exposure equal to the carrying amount of these instruments.
Since the Group only trades with recognised third parties, there is no requirement for collateral.
Liquidity risk
The Group’s objective is to maintain a balance between continuity of funding and flexibility through the use of a mixture of long and short term debt.
Equity price risk
Equity price risk is the risk that changes in equity prices will affect the fair value of the Group’s holdings of financial instruments. The objective of equity price risk management is to manage and control the risk within acceptable parameters, while optimising the return.
To minimise the risk the Group’s investments are of high quality and are publicly traded on the ASX. The investments are managed on a day to day basis so as to pick up any significant adjustments to market prices.

48 2016 ANNUAL REPORT
NOTES TO THE FINANCIAL STATEMENTS F o r t h e y e a r e n d e d 3 1 D e c e m b e r 2 0 1 6
NOTE 23: FINANCIAL INSTRUMENTS DISCLOSURE (CONTD)
(b) Interest Rate Risk
The consolidated entity’s exposure to cashflow interest rate risk is as follows:
2016 Weighted Average
Interest Rate
Floating Interest
$
Fixed Interest
$
Non-Interest Bearing
$
Total
$ Financial assets: Cash and cash equivalents 2.84% 673,174 6,000,000 500 6,673,674 Other financial assets - 50,000 - 50,000 673,174 6,050,000 500 6,723,674
2015 Financial assets: Cash and cash equivalents 2.87% 250,685 6,000,000 500 6,251,185 Other financial assets 3.24% - 50,000 - 50,000 250,685 6,050,000 500 6,301,185
The maturity date for all financial instruments included in the above tables is 1 year or less from balance date.
A change of 100 basis points in interest rates would result in a net gain/loss before taxation of $64,872 (2015: $66,443). This is based on the interest bearing financial assets as detailed above.
(c) Credit Risk
The carrying amount of the Group’s financial assets represents the maximum credit exposure. The Group’s maximum exposure to credit risk at the reporting date was:
Carrying Amount Note 2016
$ 2015
$ Cash and cash equivalents 8 6,673,674 6,251,185 Trade and other receivables 9 31,243 2,926,177 Rental Bond/Security bond 10 55,775 50,000 6,760,692 9,227,362
The Company’s maximum exposure to credit risk at the reporting date was $6,760,692 (2015: $9,227,362).
Except for the amount receivable from Jindal, all other trade and other receivables are current and have not been impaired.
(d) Liquidity Risk
The following are the contractual maturities of financial liabilities, including estimated interest payments and excluding the impact of netting agreements:
31 December 2016 Carrying Amount
Contractual cash flows
6 mths or less
Non-derivative financial liabilities Trade and other payables 89,021 89,021 89,021 89,021 89,021 89,021
31 December 2015 Carrying
Amount Contractual cash
flows 6 mths or less
Non-derivative financial liabilities Trade and other payables 225,665 (225,665) (225,665) 225,665 (225,665) (225,665)

LEGEND MINING LIMITED 49
NOTES TO THE FINANCIAL STATEMENTS F o r t h e y e a r e n d e d 3 1 D e c e m b e r 2 0 1 6
NOTE 23: FINANCIAL INSTRUMENTS DISCLOSURE (CONTD)
(e) Net Fair Value of Financial Assets and Liabilities
The fair values of financial assets and liabilities, together with the carrying amounts shown in the statement of financial position, are as follows:
31 December 2016 31 December 2015 Carrying
Amount $
Fair Value
$
Carrying Amount
$
Fair Value
$ Held for trading financial assets 352,308 402,308 2,760,600 2,760,600 Cash and cash equivalents 6,673,674 6,673,174 6,251,185 6,251,185 Security bond 50,000 50,000 50,000 50,000 Trade and other receivables 31,243 31,243 2,926,177 2,926,177 Trade and other payables (89,021) (89,021) (225,665) (225,665)
7,018,204 7,017,704 11,762,297 11,762,297
(f) Equity price risk
The Group’s exposure to equity securities is considered high as the company has significant investments in other listed investments totalling $352,308 at 31 December 2016. Such risk is managed through diversification of investments and daily monitoring of price movements.
A change of 10% in the market price of the shares would result in a gain/loss before taxation of $35,231 (2015: $276,060).
(g) Foreign Exchange risk
At balance date, the group had no material foreign currency denominated liabilities and receivables.
NOTE 24: FAIR VALUES The carrying amounts of the Group’s financial assets and financial liabilities at 31 December 2016 and 31 December 2015 are reasonable approximations of its fair value.
Management assessed that cash and cash equivalents, trade and other receivables, and trade and other payables approximate their carrying amounts largely due to the short-term maturities of these instruments.
The following table provides the fair value measurement hierarchy of the Group’s assets measured at fair value:
Asset measured at fair value Date of valuation
Total Quoted prices in active market (Level 1)
Significant observable inputs (Level 2)
Significant unobservable inputs (Level 3)
Recurring Quoted equity investments (Note 10)
31-Dec-2016 352,308 352,308 - -
There have been no transfers between Level 1 and Level 2 during the year.
The fair value of the financial assets is included at the amount at which the instrument could be exchanged in a current transaction between willing parties, other than in a forced or liquidation sale.
Fair value of the quoted equity instruments is based on price quotations at the reporting date.

50 2016 ANNUAL REPORT
NOTES TO THE FINANCIAL STATEMENTS F o r t h e y e a r e n d e d 3 1 D e c e m b e r 2 0 1 6
NOTE 25: INFORMATION RELATING TO LEGEND MINING LIMITED (“THE PARENT ENTITY”)
2016 2015 $ $ Current assets 7,107,225 9,036,621 Total assets 14,981,610 17,736,562 Current liabilities 183,211 390,400 Total liabilities 247,499 390,400 Net assets 14,734,111 17,346,162
Contributed equity 60,588,031 60,588,031 Accumulated losses (69,062,698) (66,244,447) Share option premium reserve 23,208,778 23,002,578 14,734,111 17,346,162
Loss of the parent entity after tax (2,818,251) (1,344,024) Total comprehensive loss of the parent entity (2,818,251) (1,344,024)
NOTE 26: AUDITOR’S REMUNERATION The auditor of Legend Mining Limited is Ernst & Young Australia.
Consolidated 2016
$ 2015
$ Amounts received or due and receivable by Ernst & Young Australia for: - An audit or review of the financial report of the entity and any other entity in the consolidated group 30,900 42,895 30,900 42,895
NOTE 27: CONTINGENT LIABILITIES There are no contingent liabilities at the date of this report.
The consolidated entity’s activities in Australia are subject to the Native Titles Act and the Department of Environment. Uncertainty associated with Native Title issues may impact on the Group’s future plans.
There are no unresolved Native Title issues and the consolidated entity is not aware of any other matters that may impact upon its access to the land that comprises its project areas.
NOTE 28: EVENTS AFTER THE BALANCE SHEET DATE On 24 February 2017 Legend announced the acquisition of two tenements in the Fraser Range. Consideration of 10 million fully paid ordinary shares and 10 million 4 cent 30 March 2021 options were issued to the vendor on 28 February 2017.
5,000,000 incentive options issued on 31 January 2017 and granted as an incentive to an employee under the Company’s incentive plan.
In March 2017, the Company received a refund from the ATO of $1,037,084.85 (see Note 6 for further details).
No matter or circumstance has arisen since the end of the financial year which has significantly affected, or may significantly affect the operations of the Group, the result of those operations, or the state of affairs of the Group in subsequent financial years.
NOTE 29: DIVIDENDS PAID AND PROPOSED No dividends were paid or proposed this financial year. There are no franking credits available for future reporting periods.
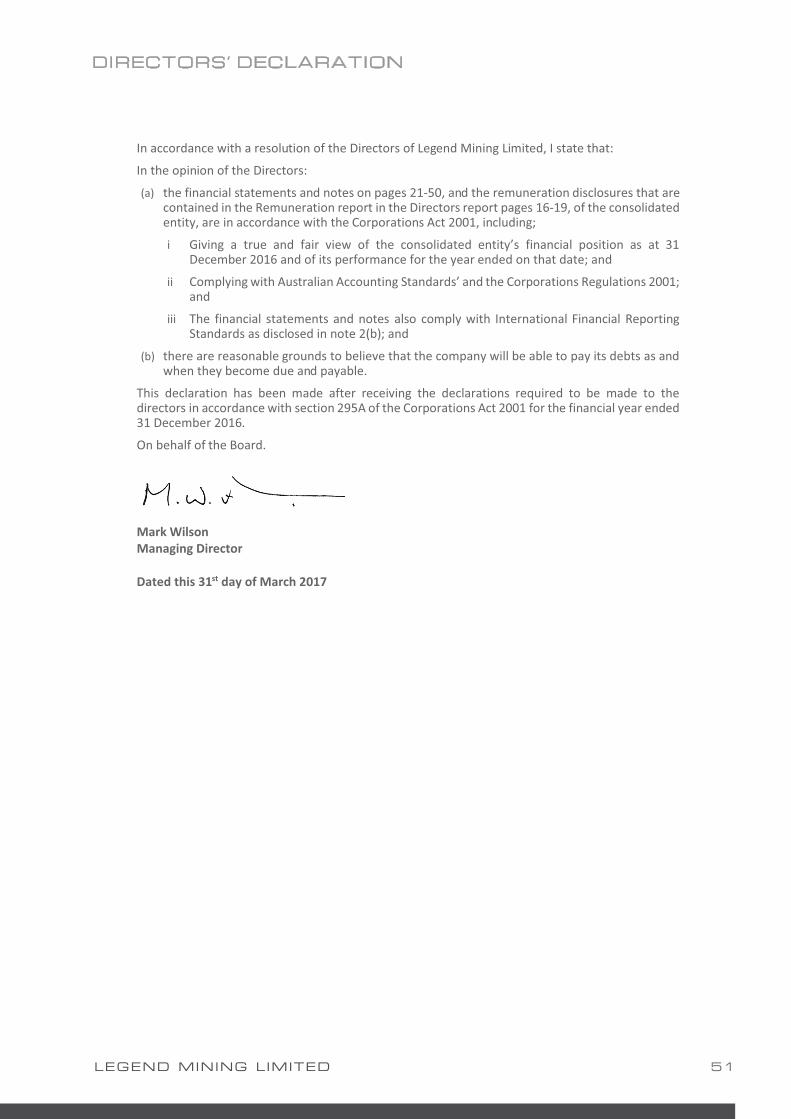
LEGEND MINING LIMITED 51
DIRECTORS’ DECLARATION
In accordance with a resolution of the Directors of Legend Mining Limited, I state that:
In the opinion of the Directors:
(a) the financial statements and notes on pages 21-50, and the remuneration disclosures that are contained in the Remuneration report in the Directors report pages 16-19, of the consolidated entity, are in accordance with the Corporations Act 2001, including;
i Giving a true and fair view of the consolidated entity’s financial position as at 31 December 2016 and of its performance for the year ended on that date; and
ii Complying with Australian Accounting Standards’ and the Corporations Regulations 2001; and
iii The financial statements and notes also comply with International Financial Reporting Standards as disclosed in note 2(b); and
(b) there are reasonable grounds to believe that the company will be able to pay its debts as and when they become due and payable.
This declaration has been made after receiving the declarations required to be made to the directors in accordance with section 295A of the Corporations Act 2001 for the financial year ended 31 December 2016.
On behalf of the Board. Mark Wilson Managing Director Dated this 31st day of March 2017

52 2016 ANNUAL REPORT
DECLARATION OF AUDITOR’S INDEPENDENCE

LEGEND MINING LIMITED 53
INDEPENDENT AUDITOR’S REPORT

54 2016 ANNUAL REPORT
INDEPENDENT AUDITOR’S REPORT

LEGEND MINING LIMITED 55
INDEPENDENT AUDITOR’S REPORT
56 2016 ANNUAL REPORT
INDEPENDENT AUDITOR’S REPORT

LEGEND MINING LIMITED 57
INDEPENDENT AUDITOR’S REPORT

58 2016 ANNUAL REPORT
SHAREHOLDER INFORMATION F o r t h e y e a r e n d e d 3 1 D e c e m b e r 2 0 1 6
The issued capital of the company as at 17 March 2017 is 2,044,350,801 ordinary fully paid shares.
Distribution of Share Holders as at 17 March 2017 Fully Paid Shares Shares Holders 1 – 1,000 27,540 93 1,001 – 5,000 475,451 126 5,001 – 10,000 2,535,177 300 10,001 – 100,000 82,106,683 1,695 100,001 and over 1,959,205,950 1,365 Total 2,044,350,801 3,579
Number of holdings less than a marketable parcel 23,175,316 1,372
Top 20 Shareholders as at 17 March 2017 Name Shares % YANDAL INVESTMENTS PTY LTD 344,750,000 16.86 AUSTRALIAN GOLD RESOURCES PTY LTD 164,985,000 8.07 CHESTER NOMINEES WA PTY LTD 116,000,000 5.67 PONTON MINERALS PTY LTD 48,000,000 2.35 BELLARINE GOLD PTY LTD 45,772,255 2.24 MIKADO CORPORATION PTY LTD 43,000,000 2.1 MOTTE & BAILEY PTY LTD 40,566,140 1.98 CASTLE BAILEY PTY LTD 37,433,860 1.83 SIXTY-EIGHTH STOWAWAY PTY LTD 35,000,000 1.71 ROCKFORD METALS PTY LTD 23,500,000 1.15 MR M MCLEISH 22,000,000 1.08 TOPAZ PTY LTD 19,703,072 0.96 PHH PTY LIMITED 17,800,000 0.87 MR PETER HAWKES WHITCOMBE 15,464,488 0.76 NINO CONSTRUCTIONS PTY LTD 13,161,547 0.64 MR G C DAVIES + MRS C A DAVIES 11,000,000 0.54 CITICORP NOMINEES PTY LIMITED 10,794,000 0.53 MR A N VUKOSAV 10,177,777 0.5 MUSGRAVE MINERALS LIMITED 10,000,000 0.49 MR P R TRAFFORD 10,000,000 0.49 CONTINENTAL GLOBAL INVESTMENT LIMITED 10,000,000 0.49
1,049,108,139 51.31
Substantial shareholders as at 17 March 2017 Name Shares % Creasy Group 581,235,000 28.43 Chester Nominees WA Pty Ltd 116,000,000 5.67
Unlisted Option holders as at 17 March 2017 Class of options Options Holders 23 September 2020 exercisable at 4.0 cents per share 150,000,000 2 30 March 2021 exercisable at 4.0 cents per share 88,000,000 7

LEGEND MINING LIMITED 59
TENEMENT LISTING F o r t h e y e a r e n d e d 3 1 D e c e m b e r 2 0 1 6
AUSTRALIA – FRASER RANGE – ROCKFORD PROJECT
Tenements held at 31 March 2017
Tenement Status Percentage Interest
E28/1718 Granted 70%
E28/1727 Granted 70%
E28/2188 Granted 70%
E28/2189 Granted 70%
E28/2190 Granted 70%
E28/2191 Granted 70%
E28/2192 Granted 70%
E28/2404 *Granted 100%
E28/2405 *Granted 100%
E28/2675 Application 100%
E28/2676 Application 100% E28/2677 Application 100%
*Legend’s interest yet to be transferred

www.legendmining.com.au