2016isoeasianalarasymposium fukushima,iwaki,7-9september ... · pdf...
TRANSCRIPT

KINS
Analysis on Occupational Exposure of Radiation Workers in Koreabased on KISOE Database
(2005~2014)
2016 ISOE Asian ALARA SymposiumFukushima, Iwaki, 7-9 September, 2016
Byeongsoo KIM
8 Sept, 2016
1

Korea Institute of Nuclear Safety
Nuclear Reactors & Licensees of Radiation Sources in Korea
Brief Introduction of KISOE
Radiation Workers in Korea (2005 ~ 2014)
Annual Average Dose (2005 ~ 2014)
Annual Collective Dose (2005~2014)
Overall Analysis on Radiation Protection Program
Conclusion
Contents
2
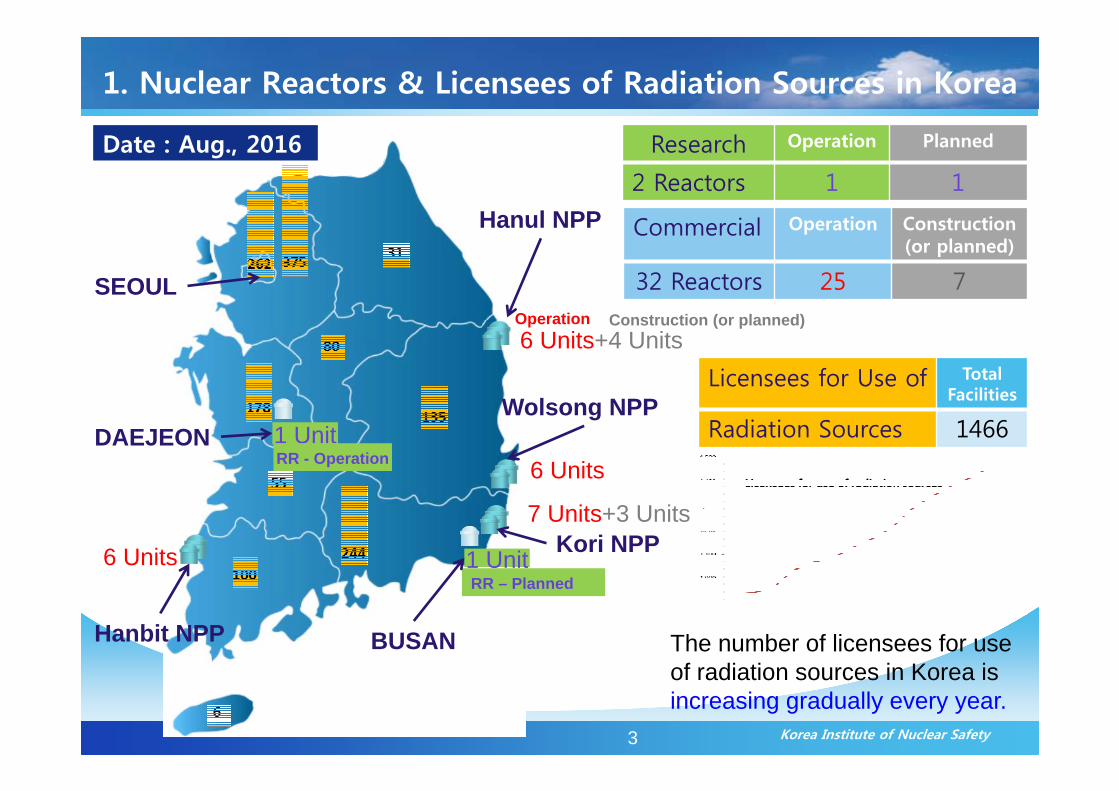
1. Nuclear Reactors & Licensees of Radiation Sources in Korea
3 Korea Institute of Nuclear Safety
6 Units1 Unit
Commercial Operation Construction (or planned)
32 Reactors 25 7
Licensees for Use of Total Facilities
Radiation Sources 1466
Research Operation Planned
2 Reactors 1 1
The number of licensees for use of radiation sources in Korea is increasing gradually every year.
Operation
Date : Aug., 2016
6 Units
6 Units+4 Units
7 Units+3 Units
1 UnitRR – Planned
RR - Operation
Construction (or planned)
SEOUL
DAEJEON
BUSAN
Hanul NPP
Wolsong NPP
Kori NPP
Hanbit NPP

2. Brief Introduction of KISOE
4 Korea Institute of Nuclear Safety
Establishment and Operation of KISOEKISOE Database• Korea Information System on Occupational Exposure (KISOE) in KINS
• Developed in 2002 ~ 2004 & Operated since 2005
• Collect Exposure Doses and Evaluation of Trends in Occupational Radiation
Exposure to Assess Radiation Protection Programs (RPP) in Korea
Analysis for 10 years based on KISOE databaseThis Presentation• In this presentation, analyses on occupational exposure in Korea are summarized
for 10 years from 2005 to 2014.
Korea Government (NSSC)(Nuclear Safety and Security Commission)
RAWIS system of KoFONS(Korea Foundation of Nuclear Safety)
KISOE system of KINS(Korea Institute of Nuclear Safety)
Radiation Workers other than medical diagnostic
radiology
Radiation Workers in medical diagnostic
radiology
Korea Government (MOHW)(Ministry of Health and Welfare)
Korea Centers for Disease Control and Prevention
Framework for Collection of Dose Records in Korea

3. Radiation Workers in Korea (2005~2014)
Radiation workers work for Licensees that are classified into 10 types. Nuclear energy Non-Destructive Testing (NDT) General industry Education institute Medical Use Research institute R.I. Production and distribution Public institute Military activity Others
Number of Radiation Workers Until 2012, increased
about 5% annually. After 2013, however,
remained steady.
5 Korea Institute of Nuclear Safety
Top1Top2Top3
34%
18%
13%
12%
11%
13%
10%
17%
35%
15%
NDT
2005 2014
Nuclear
Industry
Education
Medical
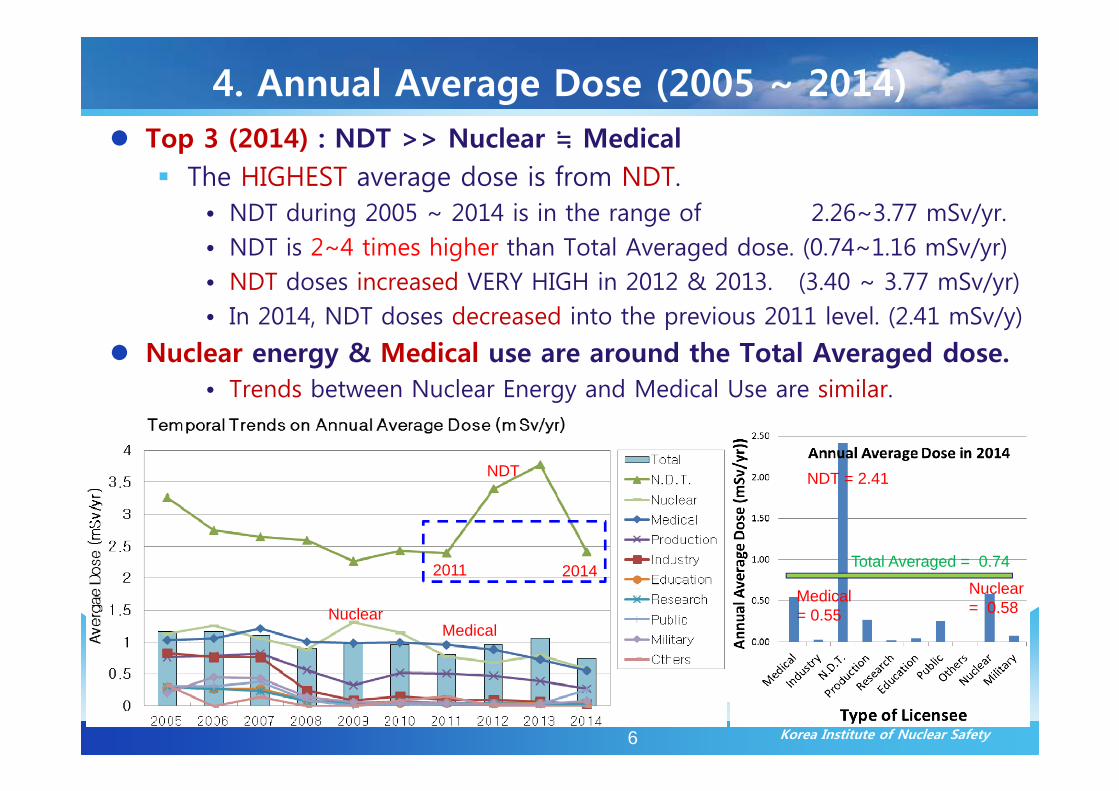
4. Annual Average Dose (2005 ~ 2014) Top 3 (2014) : NDT >> Nuclear ≒ Medical
The HIGHEST average dose is from NDT.• NDT during 2005 ~ 2014 is in the range of 2.26~3.77 mSv/yr.• NDT is 2~4 times higher than Total Averaged dose. (0.74~1.16 mSv/yr)• NDT doses increased VERY HIGH in 2012 & 2013. (3.40 ~ 3.77 mSv/yr)• In 2014, NDT doses decreased into the previous 2011 level. (2.41 mSv/y)
Nuclear energy & Medical use are around the Total Averaged dose.• Trends between Nuclear Energy and Medical Use are similar.
6 Korea Institute of Nuclear Safety
NDT
NuclearMedical
NDT = 2.41
Nuclear = 0.58
Medical= 0.55
Total Averaged = 0.742011 2014

4.1 Detailed Annual Average Dose (2011~2014) Higher than 1 mSv/yr during (2011 ~ 2014)
Nuclear Medicine : the highest dose in Medical Use area. NDT : the highest dose in Industrial Use area RI. Production : the 2nd highest dose in Industrial Use area
Nuclear energy areas are Not HIGHER than 1 mSv/yr (2011~2014) PWR and Fuel fabrication is above 0.5 mSv/yr CANDU is below 0.5 mSv/yr
7 Korea Institute of Nuclear Safety
NDT
Radioisotope ProductionNuclear Medicine
Nuclear energy Medical Use Industrial Use including NDT
PWRCANDU
FuelFab.

4.2 Trends on NDT by using Moving Average Annual Average Dose for NDT
(Radiographic Testing)• increased very high (2012~2013)• Decreased in 2014• Additional analyses by using
Moving Averages which are useful to identify overall trends without interruption of data fluctuations.
8 Korea Institute of Nuclear Safety
• This is Moving average trends of monthly doses.
• In the end of 2011, trends began to increase until Mid-2013.
• However, since Mid-2013, trends began to decrease.
• Numbers of monthly NDT workers began to increase in the end of 2011 ~ 2013.
• Workers increased faster in 2014.
NDT

4.3 Reasons of increment and decrement in NDT Over-exposure and Death of 3 NDT
workers (Mid 2011 ~ 2012)• The accidents were broadcasted
by the public news and many NDT Workers got to know radiation risks REALLY.
Dose began to increase in end-2011.
9 Korea Institute of Nuclear Safety
Strong enforcements to enhance RPP of NDT by regulatory body
• Thorough compliances of Radiation protection programs (RPP), Improvement of RT room where NDT activities are done
Increasing and Decreasing of Doses• Doses kept increasing, as RPP
began to be applied strongly.• Began to decrease, as RPP were
settled down and safety facilities such as RT rooms were enhanced.

5. Trends on Collective Dose (2005 ~ 2014) Top 3 (2014) (NDT > Nuclear Energy > Medical Use) constitute
the most part of collective dose (about ~96%).• Many Workers in the above Top 3 (18%, 34% & 12%, respectivley).• Higher Annual average doses (2.41, 0.58 & 0.55 mSv/yr, respectively)
than other types of licensees.
Collective doses of other types of licensees are very small (below 5%) due to the low annual average doses (<0.3mSv), although workers are not a few (~36%).
10 Korea Institute of Nuclear Safety
NDT
Nuclear
Total
Medical

5.1 Detailed Collective Dose (2011 ~ 2014) Top 3 (NDT > PWR > Nuclear Medicine) collective doses in 2014
• NDT and Nuclear Medicine workers are FEWER than PWR.• Average doses are 4 TIMES and 2 TIMES HIGHER than PWR, respectively.• So, NDT is Top 1 and Nuclear Medicine Top 3.
Collective dose in PWR increased till 2013 but increased in 2014.• Due to an increase of job tasks after Fukushima accident• Due to an increase of workers in new PWRs that began operation.
11 Korea Institute of Nuclear Safety
NDT(2014)
Nuclear Medicine(2013)
Increased (2011~2013) & Decreased (2014) in PWR
PWR(2011~2014)
Nuclear energy Medical Use Industrial Use including NDT

6. Overall Analysis on radiation protection program Numbers of licensees & radiation workers have increased.
• Collective doses have been kept at the same level until 2011.• Average doses have continuously gradually decreased until 2011.
In 2012 & 2013, doses increased very high due to NDT. However, in 2014, doses decreased into the level of 2011.
• By the strong enforcements and thorough application of RPP, trends decreased since Mid-2013 ~ 2014 in NDT areas.
Trends imply the continuous improvement of RPP in Korea.
12 Korea Institute of Nuclear Safety
Average DoseCollective Dose
LicenseesWorkers Moving Averages Trends on NDT

6.1 Trends of Measurable Dose Previous analyses based on Monitored dose (all radiation workers) Monitored Dose (all workers) vs. Measurable Dose (above 0.1 mSv)
• Monitored Dose includes all range of dose including ZERO doses.• ZERO could mean that the workers might NOT be in actual exposures.• To see the trends of radiation workers with actual occupational
exposures, it is Meaningful to utilize Measurable Dose (>= 0.1 mSv)
Measurable Dose in NPP and NDT (2014)• NPP : Measurable is 1.86 mSv, About 3.2 times Higher than Monitored.• NDT : Measurable is 3.48 mSv, About 1.4 times Higher than Monitored.
Workers with actual occupational exposures have doses of several times higher than doses analyzed based on all the workers.
13 Korea Institute of Nuclear Safety
NDTNPP1.86
0.58
3.48
2.41

7. Conclusion Analyses on Occupational Exposure of Radiation Workers in
Republic of Korea were performed. By using KISOE database that collects dose records of radiation
workers in various fields in Republic of Korea.
Based on the analyses for (2005~2014), it is implied that radiation protection programs have been continuously improved in Korea. Number of radiation workers has increased about 5% annually. Nonetheless, annual average dose has continuously gradually
decreased and annual collective doses been kept at the same level. By strong application of RPP in NDT areas since 2012 ~, NDT
doses began to decrease in Mid 2013. • In 2014, The doses returned back into the previous 2011 level.
It is necessary to continue to improve KISOE system, By collecting more detailed data about jobs of radiation workers. By developing more useful method for data analysis.
14 Korea Institute of Nuclear Safety

Thank you.
Q & A
15 Korea Institute of Nuclear Safety