2016farmington public school district • farmington, mi › cms › lib › mi01808718 › ... ·...
TRANSCRIPT

Comprehensive Annual
Financial ReportJune 30, 2016
Farmington Public School District • Farmington, MI2016
Farmington Public School District
Comprehensive Annual Financial Report
with Supplemental Information
Fiscal Year Ended June 30, 2016

Comprehensive
Annual Financial Report of
Farmington Public School District
32500 Shiawassee
Farmington, Michigan 48336
For the Fiscal Year Ended
June 30, 2016
Dr. George C. Heitsch
Superintendent of Schools
Board of Education
Jessica Cummings
President
Terri A. Weems
Treasurer
Terry L. Johnson
Vice President
David N. Turner
Secretary
Murray J. Kahn
Trustee
Sheilah P. Clay
Trustee
James L. Stark
Trustee
Prepared by:
Jennifer F. Kaminski, Chief Financial Officer
Kimberly Pincheck, Finance Director Karla Swanson,
Sue Kubiak, Payroll Bookkeeper Manager of Purchasing & Accounting
Kim Hodges, Payroll Bookkeeper Lesli Svoke, Bookkeeper
Pam Waack, Accounts Payable Bookkeeper George Jackson, Bookkeeper
Cynda Nelson, Secretary
Farmington Public School District
Contents
Introductory Section
Letter of Transmittal i-xiii
District Officials xiv
Organizational Chart xv
ASBO Certificate of Excellence in Financial Reporting xvi
Financial Section
Independent Auditor’s Report 1-2
Management’s Discussion and Analysis 3-15
Basic Financial Statements
Government-wide Financial Statements:
Statement of Net Position 16
Statement of Activities 17
Fund Financial Statements:
Governmental Funds:
Balance Sheet 18
Reconciliation of the Balance Sheet to the Statement of Net Position 19
Statement of Revenue, Expenditures, and Changes in Fund Balances 20
Reconciliation of the Statement of Revenue, Expenditures, and
Changes in Fund Balances of Governmental Funds to the Statement
of Activities 21
Proprietary Fund - Internal Service Fund:
Statement of Net Position 22
Statement of Revenue, Expenses, and Changes in Net Position 23
Statement of Cash Flows 24
Fiduciary Fund - Statement of Fiduciary Assets and Liabilities 25
Notes to Financial Statements 26-51
Farmington Public School District
Contents (Continued)
Required Supplemental Information
Budgetary Comparison Schedule - General Fund 52
Budgetary Comparison Schedule - Special Education Center Program Fund 53
Schedule of Proportionate Share of the Net Pension Liability Michigan Public
School Employees Retirement System 54
Schedule of Contributions Michigan Public School Employees Retirement
System 55
Other Supplemental Information
Combining Balance Sheet - Nonmajor Governmental Funds 56
Combining Statement of Revenue, Expenditures, and Changes in Fund
Balances - Nonmajor Governmental Funds 57
Budgetary Comparison Schedule - Nonmajor Special Revenue Fund 58
Budgetary Comparison Schedule - Nonmajor Debt Service Funds 59
Budgetary Comparison Schedule - Capital Projects Funds 60-61
Schedule of Bonded Indebtedness 62
Statement of Changes in Fiduciary Assets and Liabilities 63
Schedule of Fiduciary Fund Activities 64
Cash and Investments
Schedule of Cash, Cash Equivalents, and Investments 65
Capital Assets and Accumulated Depreciation
Schedule of Capital Assets and Accumulated Depreciation 66-67

Farmington Public School District
Contents (Continued)
Statistical and Other Information (Unaudited)
Statistical Section Summary 68
Financial Trend Information
Net Position by Component - Governmental Activities 69-70
Changes in Governmental Net Position 71-72
Fund Balances - Governmental Funds 73-74
Changes in Fund Balance - Governmental Funds 75-76
Revenue Capacity Information
Taxable Value and Actual Value of Taxable Property 77-78
Direct and Overlapping Property Tax Rates 79-80
Principal Property Taxpayers 81
Property Tax Levies and Collections 82
Debt Capacity Information
Ratios of Bonded Debt Outstanding 83-84
Direct and Overlapping Governmental Activities Debt 85
Legal Debt Margin 86-87
Demographic and Economic Information
Demographic and Economic Statistics 88
Principal Employers 89

Farmington Public School District
Contents (Continued)
Statistical and Other Information (Unaudited) (Continued)
Operating Information
Full-time Equivalent School District Employees 90-91
Operating Indicators 92
Capital Asset Information 93-94
General Information
Points of Pride 95-96
Federal Awards Supplemental Information Issued Under
Separate
Cover

October 5, 2016
Citizens and Board Members:
The Comprehensive Annual Financial Report of Farmington Public School District (the “School
District”) for the fiscal year ended June 30, 2016 is submitted herewith. This report was
prepared by the business department and contains all activities under the control of the Board
of Education. Responsibility for both the accuracy of the presented data and the completeness
and fairness of the presentation, including all disclosures, rests with the School District. We
believe that the data as presented is accurate in all material respects and is presented in a
manner designed to fairly set forth the financial position and results of operations of the School
District as measured by the financial activity of its various funds with all disclosures necessary to
enable the reader to gain the maximum understanding of the School District’s financial affairs.
Reporting Entity and Services
Farmington Public School District is an independent reporting entity established under the laws
of the State of Michigan and governed by an elected, seven-member Board of Education and
fully meets criteria established by the Governmental Accounting Standards Board (GASB). All
funds of the School District are included in this report. The School District does not have
component units.
The School District follows GASB Statement No. 34, a governmental reporting model. The
financial section reports separately the governmental funds and the fiduciary fund administered
by the board. In addition, the financial section includes the School District’s government-wide
financial statements.
Report Organization
The Comprehensive Annual Financial Report was prepared to meet the needs of a broad
spectrum of financial statement readers and is divided into the following major sections:
ii
Introductory Section
This section introduces the reader to Farmington Public School District and to this report.
Included are facts about the School District, this transmittal letter, the School District’s
organizational chart, and the Association of School Business Officials International Certificate of
Excellence in Financial Reporting for the year ended June 30, 2015.
Financial Section
The financial section includes the independent auditor’s report on the financial statements and
schedules, management’s discussion and analysis, government-wide financial statements, the
fund financial statements, notes to the financial statements, and required and other supplemental
information.
The management of the School District is responsible for the financial information and
representations contained in the financial statements and other sections of the annual report. In
preparing the financial statements, it is necessary that management make informed estimates
and judgments based on currently available information of the effects of certain events and
transactions.
The management’s discussion and analysis, which includes an analysis of the School District’s
financial position and results of operations, government-wide financial statements, fund financial
statements, and supplemental statements and schedules presented in the financial section of this
report, present fairly and with full disclosure the financial position and results of the financial
operation at the fund and government-wide levels in conformity with accounting principles
generally accepted in the United States of America and demonstrate compliance with finance-
related legal and contractual provisions. The management’s discussion and analysis provides an
overview and analysis of the School District’s basic financial statements and should be read in
conjunction with the financial statements.
The basis of accounting for each fund is consistent with the activities and objectives of the fund
as a fiscal and accounting entity.
The supplemental statements and schedules contain a more detailed analysis of revenue and
expenditures that are compared to the 2015-2016 budget for the General and Special Education
Center Program Funds, as well as schedules presenting the School District’s proportionate share
of net pension liability and contribution information related to the MPSERS pension plan. Other
supplemental information includes the balance sheet and statement of revenue, expenditures,
and changes in fund balances as well as statements and schedules containing a more detailed
analysis of revenue and expenditures that are compared to the 2015-2016 budget for nonmajor
governmental funds as well as the schedule of bonded indebtedness detailing interest rates and
annual maturities, schedule of fiduciary fund activities, schedule of fixed assets by building, and
schedule of cash, cash equivalents, and investments.
Statistical Section
Although this section contains substantial financial information, these tables differ from financial
statements in that they present some nonaccounting data, compare 10 years of data, and are
intended to reflect economic data, financial trends, and the fiscal capabilities of the School
District.
iii
About Farmington Public School District
The Community
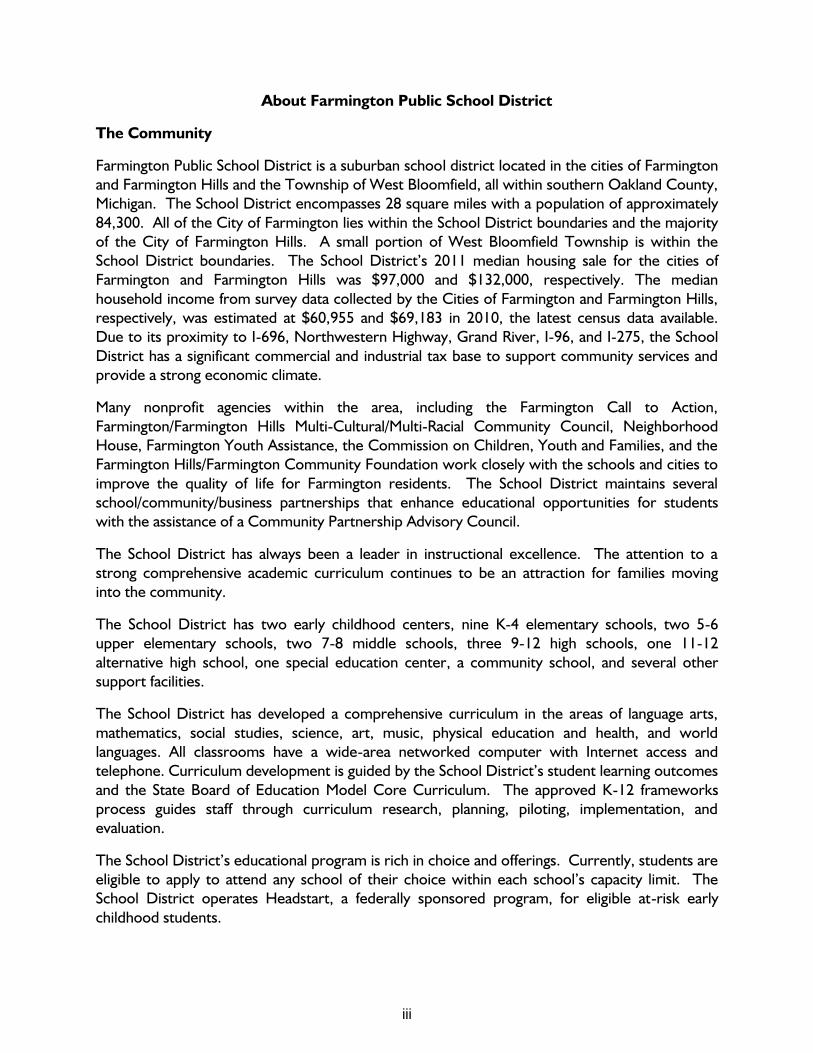
Farmington Public School District is a suburban school district located in the cities of Farmington
and Farmington Hills and the Township of West Bloomfield, all within southern Oakland County,
Michigan. The School District encompasses 28 square miles with a population of approximately
84,300. All of the City of Farmington lies within the School District boundaries and the majority
of the City of Farmington Hills. A small portion of West Bloomfield Township is within the
School District boundaries. The School District’s 2011 median housing sale for the cities of
Farmington and Farmington Hills was $97,000 and $132,000, respectively. The median
household income from survey data collected by the Cities of Farmington and Farmington Hills,
respectively, was estimated at $60,955 and $69,183 in 2010, the latest census data available.
Due to its proximity to I-696, Northwestern Highway, Grand River, I-96, and I-275, the School
District has a significant commercial and industrial tax base to support community services and
provide a strong economic climate.
Many nonprofit agencies within the area, including the Farmington Call to Action,
Farmington/Farmington Hills Multi-Cultural/Multi-Racial Community Council, Neighborhood
House, Farmington Youth Assistance, the Commission on Children, Youth and Families, and the
Farmington Hills/Farmington Community Foundation work closely with the schools and cities to
improve the quality of life for Farmington residents. The School District maintains several
school/community/business partnerships that enhance educational opportunities for students
with the assistance of a Community Partnership Advisory Council.
The School District has always been a leader in instructional excellence. The attention to a
strong comprehensive academic curriculum continues to be an attraction for families moving
into the community.
The School District has two early childhood centers, nine K-4 elementary schools, two 5-6
upper elementary schools, two 7-8 middle schools, three 9-12 high schools, one 11-12
alternative high school, one special education center, a community school, and several other
support facilities.
The School District has developed a comprehensive curriculum in the areas of language arts,
mathematics, social studies, science, art, music, physical education and health, and world
languages. All classrooms have a wide-area networked computer with Internet access and
telephone. Curriculum development is guided by the School District’s student learning outcomes
and the State Board of Education Model Core Curriculum. The approved K-12 frameworks
process guides staff through curriculum research, planning, piloting, implementation, and
evaluation.
The School District’s educational program is rich in choice and offerings. Currently, students are
eligible to apply to attend any school of their choice within each school’s capacity limit. The
School District operates Headstart, a federally sponsored program, for eligible at-risk early
childhood students.
iv
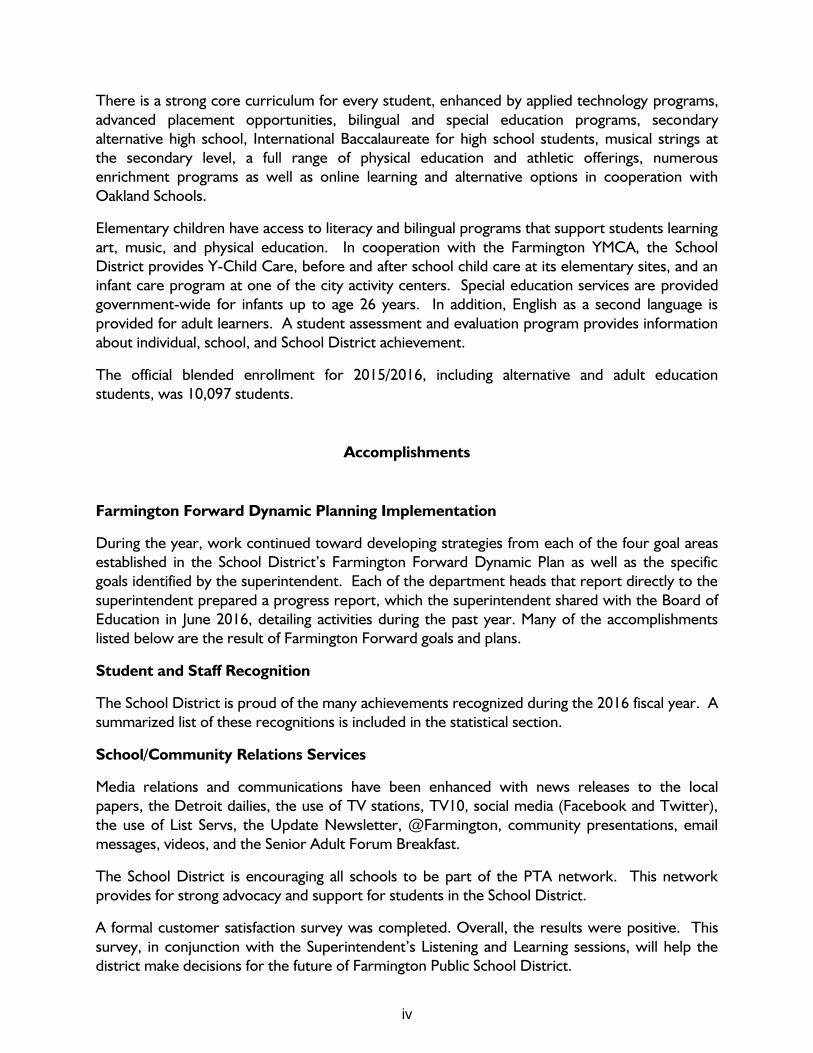
There is a strong core curriculum for every student, enhanced by applied technology programs,
advanced placement opportunities, bilingual and special education programs, secondary
alternative high school, International Baccalaureate for high school students, musical strings at
the secondary level, a full range of physical education and athletic offerings, numerous
enrichment programs as well as online learning and alternative options in cooperation with
Oakland Schools.
Elementary children have access to literacy and bilingual programs that support students learning
art, music, and physical education. In cooperation with the Farmington YMCA, the School
District provides Y-Child Care, before and after school child care at its elementary sites, and an
infant care program at one of the city activity centers. Special education services are provided
government-wide for infants up to age 26 years. In addition, English as a second language is
provided for adult learners. A student assessment and evaluation program provides information
about individual, school, and School District achievement.
The official blended enrollment for 2015/2016, including alternative and adult education
students, was 10,097 students.
Accomplishments
Farmington Forward Dynamic Planning Implementation
During the year, work continued toward developing strategies from each of the four goal areas
established in the School District’s Farmington Forward Dynamic Plan as well as the specific
goals identified by the superintendent. Each of the department heads that report directly to the
superintendent prepared a progress report, which the superintendent shared with the Board of
Education in June 2016, detailing activities during the past year. Many of the accomplishments
listed below are the result of Farmington Forward goals and plans.
Student and Staff Recognition
The School District is proud of the many achievements recognized during the 2016 fiscal year. A
summarized list of these recognitions is included in the statistical section.
School/Community Relations Services
Media relations and communications have been enhanced with news releases to the local
papers, the Detroit dailies, the use of TV stations, TV10, social media (Facebook and Twitter),
the use of List Servs, the Update Newsletter, @Farmington, community presentations, email
messages, videos, and the Senior Adult Forum Breakfast.
The School District is encouraging all schools to be part of the PTA network. This network
provides for strong advocacy and support for students in the School District.
A formal customer satisfaction survey was completed. Overall, the results were positive. This
survey, in conjunction with the Superintendent’s Listening and Learning sessions, will help the
district make decisions for the future of Farmington Public School District.

v
A new content management system, Schoolwires, is being implemented. The District’s website,
as well as all school websites, will be moving to this platform which will enable schools and
departments to update and manage their content more easily. The new website will be fully
responsive and operational with all devices such as phones, tablets, and computers.
Instructional Services
Board reports will include instructional reports to provide updates to the superintendent and the
Board of Education. These are designed to provide an overview of instructional initiatives and
the achievement of our students.
The School District reorganized the development of the District Improvement Plan (DIP) by
ensuring School Improvement Plans (SIP) are completed by the end of May to ensure they
informed the DIP as well as professional development for the upcoming school year.
The School District moved back to a six-period, semester model for our high school schedule.
An implementation plan was developed and included intentional engagement of a diverse
population of secondary educators. Work groups were created for milestone implementation
tasks including: development of new graduation requirements, revision of all courses and course
materials to match the new model, development of a student scheduling process to match the
extended timeline, examination of potential learning extension, and/or support models.
Special education continues to support, align, and integrate special education instructional goals
with the general education curriculum and also worked to develop a model to facilitate the
transition for special education students between levels and programs within the School District.
The School District continues its work in meeting state requirements for the Teacher and
Administrator Evaluation System. The School District implemented its Teacher Professional
Growth and Evaluation model using the final ratings to inform the 2016-2017 staffing process.
The teacher model is being refined through professional development and experience with all
components.
Technology is infused throughout the organization. It supports operations, curriculum, and
instruction, enhances learning, and extends beyond the school faculty and school day. Support
includes the NWEA assessment, M-Step testing as well as the addition of Google Apps for
Education.
The work of the Education Technology Advisory Committee (EdTAC) continued. Technology
advancements include expanded wireless connectivity throughout the School District,
iPad/iPod/chromebook pilot programs, interactive projectors, document cameras, classroom
sound-systems, and interactive whiteboards.
A Multi-Tiered System of Supports, formally known as Response to Instruction (RTI), is
addressed through initiatives including Level Literacy Interventions (LLI), professional
development, implementation of Reader’s and Writer’s Workshop, Instructional Support Time
(IST), and What I Need Time (WIN). Furthermore, the District provides instructional support
with the use of Compass Learning and Moby Max.
Implementation of Positive Behavior Intervention Support (PBIS) and on-going monitoring of
discipline data continues in each school.

vi
Professional Learning Teams (PLTs) are established in all schools and departments. Support for
the work of PLTs is provided through professional development for all staff. Teacher teams are
meeting on a regular basis to review what students must know and be able to do, analyze and
use assessment data to inform instruction and progress, and to identify supports for assisting
students to improve learning. Instructional support teams (Business Services, Facilities, etc.) are
working on effective and efficient practices within their areas of service.
Facilities
The School District continues its work on energy management. The program initiated 11 years
ago has saved over $12.5 million since its inception.
All operational departments continue to practice and investigate sustainable measures, including
recycling, energy management, and industrial storm water management for future generations.
Fifteen schools received Michigan Green School Awards, nine of which were recognized as
Evergreen, the highest level in the program.
With the successful bond proposal in May 2015, the district interviewed and awarded contracts
to the required consultants, including architects and engineers to design and document the work
in the bond proposal. From June 2015 to February 2016, the first five schools listed in the bond
proposal to be remodeled were designed, documented and bid out for construction starting
during the summer of 2016. During the summer, the District completed approximately $18
million of construction work.
Work continues with a four-person citizen’s oversight committee to monitor progress on bond
work.
The facilities department issued a request for proposal for third-party custodial services. The
District hired DM Burr after unsuccessful negotiations with the custodial bargaining unit. Hiring
the third-party company to perform custodial services will save the District approximately $1.4
million per year for the next three years.
The facilities department worked with a Building and Site Utilization Committee (BSUC) to
determine the use of District facilities and the “best space” to be utilized by students and adults.
A recommendation to the Board regarding facilities to be closed and/or repurposed was
presented in November 2015. The Board voted to close a middle school and repurpose it as a
K-8 S.T.E.A.M. school, which will open in September 2017. A high school will also be closed in
June 2019 at the conclusion of the school year.
The facilities department worked with a property consultant to initiate the sale of vacant parcels.
A school site was sold (Wooddale) in 2016 for $523,000. This sale will bring approximately 17
new homes into the community. The Maxfield Training Center in Downtown Farmington is also
for sale with the sale anticipated to be completed in 2017.
Human Resources
Efforts to attract, retain, and develop the best team possible to help our students learn
continued through the year.

vii
The School District has continued to be a leader in the implementation of educator growth and
evaluation. The District has nimbly responded to revisions to state law in this area by combining
the reliability and validity of a nationally known evaluation model, while retaining the highest-
quality elements developed locally through five years of testing and feedback. The results have
been utilized to assure that staffing decisions are made using exacting criteria to have the best
administrators and teachers working with our students.
With grade reconfigurations and a middle school closing, the School District faced significant
challenges and transitions in staffing for the 2016-2017 school year. The School District made
staffing decisions with great intentionality, placing staff members in buildings and teams based
upon effectiveness, relevant experience, and stakeholder input, all with the objective of
supporting the greatest possible growth and learning for students.
Negotiations have been ongoing with employee associations with the goal of recognizing and
valuing the contributions of all employees, and assuring Farmington is well-positioned for long-
term, sustainable academic and financial health. The District and its employee associations were
able to agree upon changes to health insurance benefits that will result in significant savings,
while still supporting the health and well-being of employees and their families.
Business Services
Financial and budget reports are prepared in accordance with standards of the Association of
School Business Officials International criteria and the School District was recognized by each of
the respective programs.
Transparency information continues to be updated on the School District’s website providing
public access to how the School District spends its tax dollars.
Farmington Schools provides the management of the nutrition services program in the Redford
Union School District through a cooperative agreement.
Nutrition Services prepares and serves over 628,000 lunches and 149,000 breakfasts annually.
GASB 72 requirements were completed for inclusion in the June 30, 2016 financial statements.
This Statement requires a government to use valuation techniques that are appropriate under
the circumstances and for which sufficient data are available to measure fair value of
investments.
A financial scorecard for benchmarking data was utilized as well as an operational needs
assessment was completed.
Budget and Financial Report Awards
The School District has received the Association of School Business International Officials
International Meritorious Budget award since 1997-1998 for its budget reports and the
Certificate of Excellence in Financial Reporting since the 1996-1997 fiscal year for its financial
reports.

viii
Economic Outlook
As the School District completes its 22nd
year under Proposal A, approved by Michigan voters in
1994, revenue has not kept pace with inflation. Proposal A substantially shifted funding
responsibility from the local level to the state level and from property tax as the major revenue
source. The School District is dependent upon the state legislature for not only the majority of
its funds, but also its funding level. In addition, various costs were shifted to local districts, which
historically had been paid by the State. These include contributions to the Michigan Public
School Employees’ Retirement System and FICA.
During fiscal year 2013, pension legislation was enacted that froze a portion of the contribution
level paid directly by schools. Any unmet portion of the UAAL (unfunded actuarial accrued
liability) would then be made up by the School Aid Fund, not the school districts. Payments to
the Michigan Public Schools Employees’ Retirement System for all liabilities are required of
school districts, but the State reimburses the School District through the mechanism of the
monthly status payments. The flaw in this mechanism means that if there is not enough money
to pay this section of the School Aid Act, the School District would still be responsible for these
payments to fund the retirement obligations. The State could cut this or other funding based
upon annual budget recommendations. The State has also used these contributions in its
definition of increased funding to school districts, which does not give the complete picture of
funding that supports classroom and district operations.
The cumulative rate of per-pupil revenue increase has been about 16.8 percent since 1994, and
the cumulative rate of inflation just less than 47.0 percent, illustrating that funding has not kept
pace with the rate of inflation. The budget in 2016-2017 was created based upon the
legislature’s approval of $60 per pupil. As Farmington is a hold harmless district, increases in the
foundation allowance cannot exceed the rate of inflation. In order to receive the full $60 per
pupil increase, section 20m was created by the legislature. Approximately $50 per pupil will
come through this new categorical. Creating a separate categorical creates risk for the District
as these sections can be eliminated at any point, as was done several years back with 20j funding.
The School District continues to work diligently in the budget process to reduce costs, increase
revenue, and create additional efficiencies to offset our increasing costs. Our collective
bargaining process over the last few years with our largest groups resulted in either half steps or
frozen steps and other concessionary adjustments including benefit contributions of between 20
percent and 30 percent of healthcare-related expenses. The teacher’s contract expired on
August 31, 2016 and is currently being negotiated. The contract for paraprofessional and
secretarial staff expired on June 30, 2016 and is also being negotiated. The District settled a four-
year contract through June 30, 2019 with the Farmington Association of School Administrators
(FASA) group which included pay and step freezes in the initial year and reductions in
compensation and conference funds for the remaining three years, based upon audited General
Fund fund balance levels established by the Board of Education and included in the agreement.
The District also settled a two-year contract through June 30, 2018 with the Farmington
Transportation Association (FTA), comprised of bus drivers and mechanic staff which included
the elimination of longevity pay and increased contributions for healthcare benefits.
Negotiations for nutrition and maintenance staff are ongoing as their contract expired on June
30, 2016. As part of evaluating the potential cost savings for outsourcing its custodial services as
well as negotiating with its custodial staff, the District decided to contract with a custodial
company for these services on July 1, 2016.
ix
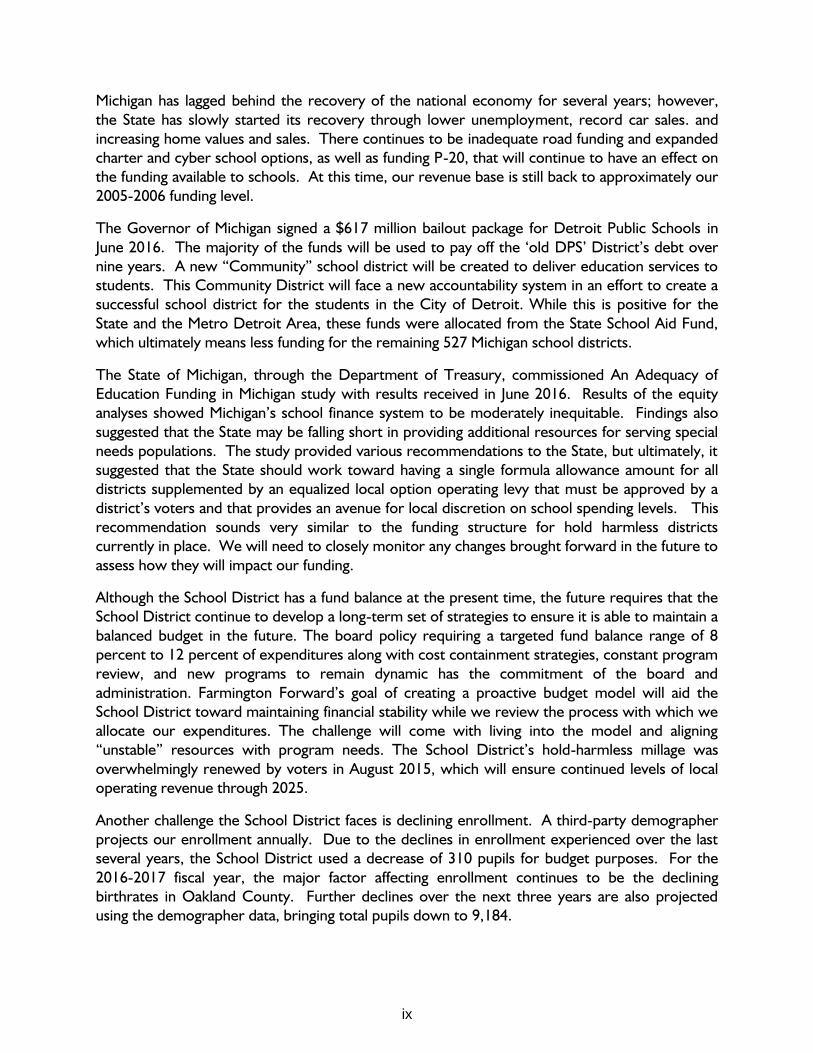
Michigan has lagged behind the recovery of the national economy for several years; however,
the State has slowly started its recovery through lower unemployment, record car sales. and
increasing home values and sales. There continues to be inadequate road funding and expanded
charter and cyber school options, as well as funding P-20, that will continue to have an effect on
the funding available to schools. At this time, our revenue base is still back to approximately our
2005-2006 funding level.
The Governor of Michigan signed a $617 million bailout package for Detroit Public Schools in
June 2016. The majority of the funds will be used to pay off the ‘old DPS’ District’s debt over
nine years. A new “Community” school district will be created to deliver education services to
students. This Community District will face a new accountability system in an effort to create a
successful school district for the students in the City of Detroit. While this is positive for the
State and the Metro Detroit Area, these funds were allocated from the State School Aid Fund,
which ultimately means less funding for the remaining 527 Michigan school districts.
The State of Michigan, through the Department of Treasury, commissioned An Adequacy of
Education Funding in Michigan study with results received in June 2016. Results of the equity
analyses showed Michigan’s school finance system to be moderately inequitable. Findings also
suggested that the State may be falling short in providing additional resources for serving special
needs populations. The study provided various recommendations to the State, but ultimately, it
suggested that the State should work toward having a single formula allowance amount for all
districts supplemented by an equalized local option operating levy that must be approved by a
district’s voters and that provides an avenue for local discretion on school spending levels. This
recommendation sounds very similar to the funding structure for hold harmless districts
currently in place. We will need to closely monitor any changes brought forward in the future to
assess how they will impact our funding.
Although the School District has a fund balance at the present time, the future requires that the
School District continue to develop a long-term set of strategies to ensure it is able to maintain a
balanced budget in the future. The board policy requiring a targeted fund balance range of 8
percent to 12 percent of expenditures along with cost containment strategies, constant program
review, and new programs to remain dynamic has the commitment of the board and
administration. Farmington Forward’s goal of creating a proactive budget model will aid the
School District toward maintaining financial stability while we review the process with which we
allocate our expenditures. The challenge will come with living into the model and aligning
“unstable” resources with program needs. The School District’s hold-harmless millage was
overwhelmingly renewed by voters in August 2015, which will ensure continued levels of local
operating revenue through 2025.
Another challenge the School District faces is declining enrollment. A third-party demographer
projects our enrollment annually. Due to the declines in enrollment experienced over the last
several years, the School District used a decrease of 310 pupils for budget purposes. For the
2016-2017 fiscal year, the major factor affecting enrollment continues to be the declining
birthrates in Oakland County. Further declines over the next three years are also projected
using the demographer data, bringing total pupils down to 9,184.

x
A bond issue approved by voters in 1997 provided many needed additions and upgrades to
building spaces. During 2004, voters approved a bond issue to support secondary outdoor
facility improvements. Even with these past updates to our secondary facilities, the average age
of our school buildings is over 50 years. This provides a challenge in the upkeep of our buildings
in the current economic conditions. The successful ballot proposal in May 2015 for $131.5
million was passed. The first series of bonds for approximately $68 million were sold and
construction began on five school buildings during the summer of 2016. The second series of
bonds is anticipated to be sold in 2018.
Accounting System, Budgetary, and Internal Control
The State of Michigan requires all school districts to comply with Public Act 43 of 1963, Budget
Hearings of Local Governments and Public Act 2 of 1968, Uniform Budgeting and Accounting Act.
These acts require all school districts to prepare budgets for their funds, which account for the
day-to-day operations of the district; however, fiduciary funds are not required to be budgeted.
The budgets are prepared in accordance with generally accepted accounting principles and a
specific uniform chart of accounts established by the State. Budgets must be approved no later
than June 30 for the fiscal year beginning July 1, and ending June 30 the subsequent year. Prior to
adoption, the Board must conduct a public hearing and make the budget available for review as
well as provide notice of the hearing in a newspaper of general circulation at least six days prior
to the hearing. Formal adoption of the budget is accomplished through a general appropriations
resolution approved by the Board which sets forth the amounts to defray the expenditures and
meet the liabilities of the District as well as a statement of estimated revenue by object in each
fund. Once approved, expenditures cannot exceed the budget by function and object during the
fiscal year without Board approval of revisions.
The board maintains a system of budgetary and accounting controls designed to assist
management in meeting its responsibility for reporting reliable information. The system is
designed to provide reasonable assurance that assets are safeguarded and transactions are
recorded and executed with management’s authorization. Internal control systems are subject
to inherent limitations with regard to the necessity to balance cost against the benefits
produced. Management believes that the existing system of budgetary and accounting control
provides reasonable assurance that errors or irregularities that could be material to the financial
statements are prevented or would be detected within a timely period. The board utilizes a
functional budget that is prepared according to the guidelines and requirements set forth in state
law and the State Financial Reporting Manual.
During the fiscal year, reports are generated for the budgetary funds, which include the budget,
current year-to-date revenue and expenditures, revenue and expenditures over or under, and
percentage over or under budget. These reports are provided to the administration and each
budget administrator has the capability to run their own reports as needed. The reports also
detail the monthly transactions and summarize the remaining balances to be spent from the
appropriations allocated for goods and services among the programs managed.
The report of the School District’s independent certified public accountants, Plante & Moran,
PLLC, appears on pages 1-2 of this report. Their audit of the basic financial statements was
performed in accordance with auditing standards generally accepted in the United States of
America and Government Auditing Standards and, accordingly, included a review of the board’s
system of budgetary and accounting controls.

xi
Financial Policies
The following financial policies and practices of the School District had a significant impact on the
School District’s fiscal year 2015-2016 financial statements:
Fund Balance Policy - Financial stability is important to maintain a strong instructional program
for the students in the School District. In order to maintain financial stability, the Board of
Education stipulates that the School District target an 8 percent to 12 percent fund balance in
the General Fund. Maintaining this level of fund balance helps the School District weather
sudden reductions in funding, as well as provide adequate cash flow to meet its payroll and other
financial obligations.
Preventative Maintenance Schedule and Plan - Maintaining the School District’s facilities is
important to provide a safe and healthy learning environment. The School District maintains a
long-range preventative maintenance and capital projects schedule in order to keep its buildings
in good working order as well as to timely identify replacement of significant components within
a building. In 2010, a facilities evaluation was completed by a third-party architect. This facilities
evaluation has aided the School District in identifying future capital needs based upon the ages
and condition of its physical plant. In May 2015, a $131.5 million bond proposal was passed by
the electorate to address facilities needs and the related financing of these needs. The amount
financed also includes dollars to replace a portion of our aging fleet of buses as well as
technology upgrades. The bond financing amount was reduced by a factor to adjust for potential
school closures due to projected declining enrollment.
Meritorious Budget Award - Annually, the School District prepares a budget document that
requires historical, current, and projected financial information. The document requires each
fund of the School District to have a forecast for three years beyond the upcoming fiscal year.
These forecasts assist the School District in identifying financial shortfalls that will require
changes either through revenue enhancements, expenditure reductions, or increased efficiencies
in order to balance the budget and keep the School District in sound financial condition.
Enrollment Projections - Annually, the School District hires a third-party consultant to project
student enrollment figures using live birth statistics and grade progression. This assists the School
District in facilities and budget planning.
Pension and Other Postemployment Benefits - The School District participates in the
Michigan Public Schools Employees’ Retirement System (MPSERS), which is a state-administered
cost-sharing multiple-employer public employee retirement system. The retirement system
consists of three plans: a defined benefit plan, a hybrid plan consisting of a defined benefit plan
and a defined contribution plan, and a defined contribution plan. As part of the MPSERS reform
approved by the Michigan Legislature and signed by the governor on September 4, 2012, all
employees hired prior to July 1, 2010 were required to make an election from four options.
Effective February 1, 2013, and depending on the plan selected, plan member contributions
range from 0 percent up to 7.0 percent of reportable wages. Employees could elect into a
defined contribution plan (DC), whereby they are not required to make additional contributions,
and could also elect out of the healthcare premium subsidy and into the Personal Healthcare
Fund (PHF), depending upon their date of hire and retirement plan election.

xii
Under the MPSERS act, all retirees participating in the MPSERS pension plan have the option of
continuing health, dental, and vision coverage through MPSERS. Retirees electing this coverage
contribute an amount equivalent to the monthly cost for Part B Medicare and 10 percent of the
monthly premium amount for the health, dental, and vision coverage at the time of receiving the
benefits. The MPSERS board of trustees annually sets the employer contribution rate to fund the
benefits on a pay-as-you-go basis. Participating employers are required to contribute at that rate.
Effective February 1, 2013, members can choose to contribute 3 percent of their covered
payroll to the Retiree Healthcare Fund and keep this premium subsidy benefit, or they can elect
not to pay the 3 percent contribution and instead choose the Personal Healthcare Fund, which
can be used to pay healthcare expenses in retirement. Members electing the Personal
Healthcare Fund will be automatically enrolled in a 2 percent employee contribution into their
457 account as of their transition date and create a 2 percent employer match into the
employee’s 401(k) account.
Employer contribution rates are established annually by the Office of Retirement Services based
upon actuarial data and estimates of future retirements in the system. A factor affecting the
retirement rate computation is the number of active members for which contributions are made
into the retirement system. Over the last several years, the trend in Michigan public schools is
to privatize non-instructional services such as substitutes, custodians, transportation,
maintenance, and food service. It has yet to be determined what effect privatization will have on
future employer contribution rates.
Independent Audit
The School District’s financial statements were audited by Plante & Moran, PLLC, certified
public accountants, as of June 30, 2016. Their audit was made in accordance with auditing
standards generally accepted in the United States of America and Government Auditing Standards.
The financial statements present fairly the financial position of Farmington Public School District
at June 30, 2016. Their audit also included the single audit on federal awards, a copy of which
can be obtained from the School District’s business office.
Excellence in Financial Reporting
The School District is committed to providing its citizens and other users with comprehensive
financial reporting. For school districts meeting the requirements of a Comprehensive Annual
Financial Report, the Association of School Business Officials International (ASBO) awards a
Certificate of Excellence in Financial Reporting. The School District received a Certificate of
Excellence in Financial Reporting from the ASBO for its Comprehensive Annual Financial Report
for the fiscal years ended June 30, 1997 through June 30, 2015.
In order to be awarded a certificate of excellence, a governmental unit must publish an easily
readable and efficiently organized Comprehensive Annual Financial Report whose contents
conform to program standards. Such reports must satisfy both accounting principles generally
accepted in the United States of America and applicable legal requirements.
A certificate of excellence is valid for a period of one year only. We believe our current report
conforms to program standards and we are submitting our report to the ASBO to determine its
eligibility for this certificate.

xiii
Acknowledgments
The preparation of this report on a timely basis could not have been accomplished without the
effort and dedicated services of the entire staff of the business department. We would like to
express our appreciation to all the members of this office who assisted in the timely closing of
the School District’s financial records and the preparation of this report.
Also, we would like to express our appreciation to other departments and individuals who
assisted in the preparation of this report.
Sincerely,
George C. Heitsch
Superintendent
Jennifer F. Kaminski
Chief Financial Officer
Kimberly L. Pincheck
Finance Director
xiv
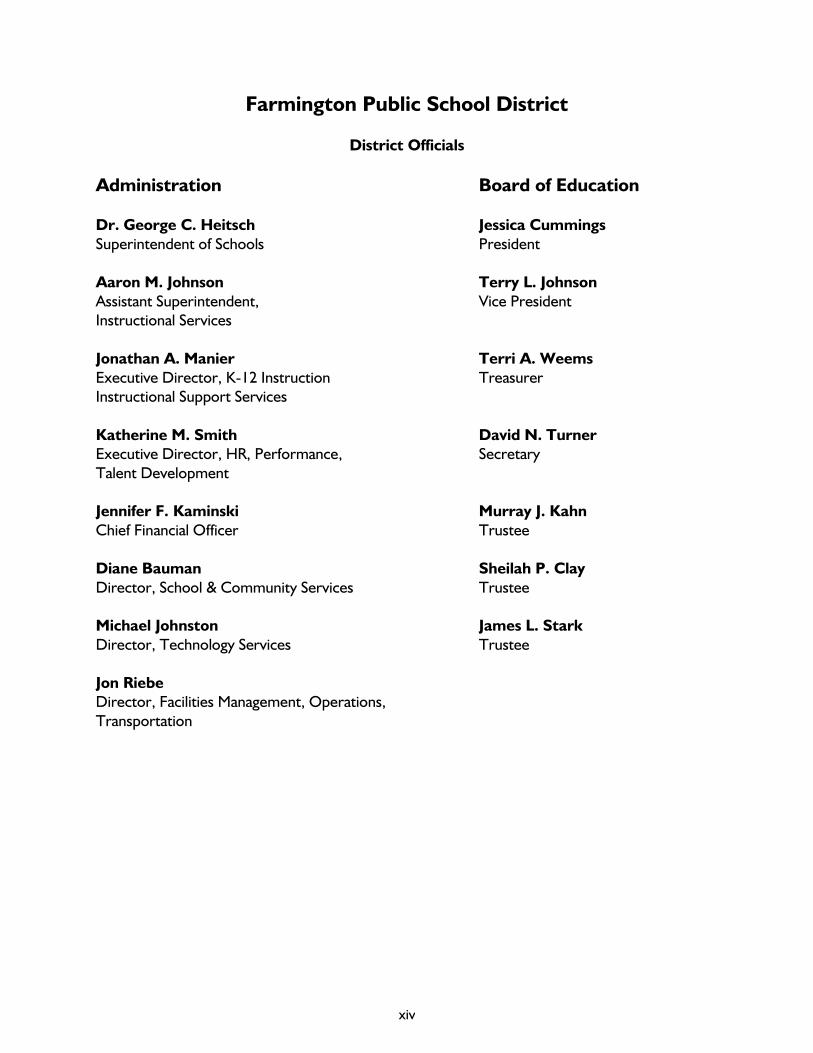
Farmington Public School District
District Officials
Administration Board of Education
Dr. George C. Heitsch Jessica Cummings
Superintendent of Schools President
Aaron M. Johnson Terry L. Johnson
Assistant Superintendent, Vice President
Instructional Services
Jonathan A. Manier Terri A. Weems
Executive Director, K-12 Instruction Treasurer
Instructional Support Services
Katherine M. Smith David N. Turner
Executive Director, HR, Performance, Secretary
Talent Development
Jennifer F. Kaminski Murray J. Kahn
Chief Financial Officer Trustee
Diane Bauman Sheilah P. Clay
Director, School & Community Services Trustee
Michael Johnston James L. Stark
Director, Technology Services Trustee
Jon Riebe
Director, Facilities Management, Operations,
Transportation

ADMINISTRATIVE ORGANIZATIONAL CHART September 2016
xv
Assistant Superintendent, Instructional Services
Superintendent Director, School &
Community
Relations Services
Director,
Facilities and Operations
Chief Financial Officer,
Business Services
Manager Purchasing/
Accounting
Supervisor, Nutrition
Services
Director, Special
Education
Director, Instructional
Equity
Supervisor,
Transportation
Director, Human
Resources
Supervisor,
Maintenance
Energy
Manager
Director, Finance
Community and Students
Board of Education
Benefits
Manager
Supervisor,
Special Ed
Supervisor,
Special Ed
Director, Early Childhood Ed
Early Ch Sp Ed
Supervisor,
Visions
Executive Director,
School Services
Secondary
Principals
Elementary
Principals
Executive Director, Human Resources,
Performance & Talent
Development
Director, PE &
Athletics
Supervisor,
Pupil Accounting

The Certificate of Excellence in Financial Reporting Award is presented to
Farmington Public School District
For Its Comprehensive Annual Financial Report (CAFR) For the Fiscal Year Ended June 30, 2015
The CAFR has been reviewed and met or exceeded
ASBO International’s Certificate of Excellence standards
Brenda R. Burkett, CPA, CSBA, SFO John D. Musso, CAE, RSBA President Executive Director
xvi

Financial Section

Independent Auditor's Report
To the Board of EducationFarmington Public School District
Report on the Financial Statements
We have audited the accompanying financial statements of the governmental activities, each major fund,and the aggregate remaining fund information of Farmington Public School District (the "School District")as of and for the year ended June 30, 2016, and the related notes to the financial statements, whichcollectively comprise Farmington Public School District's basic financial statements as listed in the table ofcontents.
Management’s Responsibility for the Financial Statements
Management is responsible for the preparation and fair presentation of these financial statements inaccordance with accounting principles generally accepted in the United States of America; this includesthe design, implementation, and maintenance of internal control relevant to the preparation and fairpresentation of financial statements that are free from material misstatement, whether due to fraud orerror.
Auditor’s Responsibility
Our responsibility is to express an opinion on these financial statements based on our audit. Weconducted our audit in accordance with auditing standards generally accepted in the United States ofAmerica and the standards applicable to financial audits in Government Audit Standards, issued by theController General of the United States. Those standards require that we plan and perform the audit toobtain reasonable assurance about whether the financial statements are free from material misstatement.
An audit involves performing procedures to obtain audit evidence about the amounts and disclosures inthe financial statements. The procedures selected depend on the auditor’s judgment, including theassessment of the risks of material misstatement of the financial statements, whether due to fraud orerror. In making those risk assessments, the auditor considers internal control relevant to the entity’spreparation and fair presentation of the financial statements in order to design audit procedures that areappropriate in the circumstances, but not for the purpose of expressing an opinion on the effectivenessof the entity’s internal control. Accordingly, we express no such opinion. An audit also includes evaluatingthe appropriateness of accounting policies used and the reasonableness of significant accountingestimates made by management, as well as evaluating the overall presentation of the financial statements.
We believe that the audit evidence we have obtained is sufficient and appropriate to provide a basis forour audit opinions.
Opinions
In our opinion, the financial statements referred to above present fairly, in all material respects, therespective financial position of the governmental activities, each major fund, and the aggregate remainingfund information of Farmington Public School District as of June 30, 2016 and the respective changes inits financial position and cash flows for the year then ended in accordance with accounting principlesgenerally accepted in the United States of America.
1

To the Board of EducationFarmington Public School District
Required Supplemental Information
Accounting principles generally accepted in the United States of America require that the management'sdiscussion and analysis, budgetary comparison schedules for the General Fund and Special EducationCenter Program Fund, and schedules of net pension liability and contribution, as identified in the table ofcontents, be presented to supplement the basic financial statements. Such information, although not apart of the basic financial statements, is required by the Governmental Accounting Standards Board,which considers it to be an essential part of financial reporting for placing the basic financial statements inan appropriate operational, economic, or historical context. We have applied certain limited proceduresto the required supplemental information in accordance with auditing standards generally accepted in theUnited States of America, which consisted of inquiries of management about the methods of preparingthe information and comparing the information for consistency with management's responses to ourinquiries, the basic financial statements, and other knowledge we obtained during our audit of the basicfinancial statements. We do not express an opinion or provide any assurance on the information becausethe limited procedures do not provide us with sufficient evidence to express an opinion or provide anyassurance.
Other Information
Our audit was conducted for the purpose of forming opinions on the financial statements that collectivelycomprise Farmington Public School District's basic financial statements. The other supplementalinformation, as identified in the table of contents, is presented for the purpose of additional analysis andis not a required part of the basic financial statements.
The other supplemental information, as identified in the table of contents, is the responsibility ofmanagement and was derived from and relates directly to the underlying accounting and other recordsused to prepare the basic financial statements. Such information has been subjected to the auditingprocedures applied in the audit of the basic financial statements and certain additional procedures,including comparing and reconciling such information directly to the underlying accounting and otherrecords used to prepare the basic financial statements or to the basic financial statements themselves,and other additional procedures in accordance with auditing standards generally accepted in the UnitedStates of America. In our opinion, the other supplemental information, as identified in the table ofcontents, is fairly stated in all material respects in relation to the basic financial statements as a whole.
The accompaning introductory section and statistical tables, as indentified in the table of contents havenot been subjected to the auditing procedures applied in the audit of the basic financial statements, andaccordingly, we do not express an opinion or provide any assurance on them.
Other Reporting Required by Government Auditing Standards
In accordance with Government Auditing Standards, we have also issued our report dated October 5,2016 on our consideration of Farmington Public School District's internal control over financial reportingand on our tests of its compliance with certain provisions of laws, regulations, contracts, grantagreements, and other matters. The purpose of that report is to describe the scope of our testing ofinternal control over financial reporting and compliance and the results of that testing, and not to providean opinion on the internal control over financial reporting or on compliance. That report is an integralpart of an audit performed in accordance with Government Auditing Standards in considering FarmingtonPublic School District's internal control over financial reporting and compliance.
October 5, 2016
2

Farmington Public School District
Management’s Discussion and Analysis
3
This section of Farmington Public School District’s (the “School District”) annual financial report
presents our discussion and analysis of the School District’s financial performance during the
year ended June 30, 2016. Please read it in conjunction with the School District’s financial
statements, which immediately follow this section.
Using this Annual Report
This annual report consists of a series of financial statements and notes to those statements.
These statements are organized so the reader can understand Farmington Public School District
financially as a whole. The government-wide financial statements provide information about the
activities of the whole School District, presenting both an aggregate view of the School District’s
finances and a longer-term view of those finances. The fund financial statements provide the
next level of detail. For governmental activities, these statements tell how services were
financed in the short term as well as what remains for future spending. The fund financial
statements look at the School District’s operations in more detail than the government-wide
financial statements by providing information about the School District’s most significant funds -
the General Fund, the Special Education Center Program Fund, and the 2015 Building and Site
Fund, with all other funds presented in one column as nonmajor funds. The remaining
statements consist of the Internal Service Fund statements and the statement of fiduciary assets
and liabilities. The Internal Service Fund statements present financial information about benefit
claim costs. The statement of fiduciary assets and liabilities presents financial information about
activities for which the School District acts solely as an agent for the benefit of students and
parents. The School District’s financial statements contain the following elements:
Management’s Discussion and Analysis (MD&A)
(Required Supplemental Information)
Financial Statements
Government-wide Financial Statements Fund Financial Statements
Notes to the Financial Statements
(Required Supplemental Information)
Budgetary Information for Certain Major Funds
Schedule of Proportionate Share of the Net Pension Liability of the Michigan Public School
Employees’ Retirement System
Schedule of Contributions to the Michigan Public School Employees’ Retirement System
Other Supplemental Information
In addition, the School District has added the introductory section and the statistical section to
compile its Comprehensive Annual Financial Report.

Farmington Public School District
Management’s Discussion and Analysis (Continued)
4
Reporting the School District as a Whole - Government-wide Financial Statements
One of the most important questions asked about the School District is, “As a whole, what is the
School District’s financial condition as a result of the year’s activities?” The statement of net
position and the statement of activities, which appear first in the School District’s financial
statements, report information on the School District as a whole and its activities in a way that
helps you answer this question. We prepare these statements to include all assets and liabilities,
using the accrual basis of accounting, which is similar to the accounting used by most private
sector companies. All of the current year’s revenue and expenses are taken into account
regardless of when cash is received or paid.
These two statements report the School District’s position - the difference between the total of
assets and deferred outflows and the total of liabilities and deferred inflows, as reported in the
statement of net position - as one way to measure the School District’s financial health or
financial position. Over time, increases or decreases in the School District’s position - as
reported in the statement of activities - are indicators of whether its financial health is improving
or deteriorating. The relationship between revenue and expenses is the School District’s
operating results. However, the School District’s goal is to provide services to our students, not
to generate profits as commercial entities do. One must consider many other nonfinancial
factors, such as the quality of the education provided and the safety of the schools, to assess the
overall health of the School District.
The statement of net position and the statement of activities report the governmental activities
for the School District, which encompass all of the School District’s services, including
instruction, support services, community services, athletics, and nutrition services. Property
taxes, unrestricted state aid (foundation allowance revenue), and state and federal grants finance
most of these activities.
Reporting the School District’s Most Significant Funds - Fund Financial Statements
The School District’s fund financial statements provide detailed information about the most
significant funds - not the School District as a whole. Some funds are required to be established
by state law and by bond covenants. However, the School District establishes many other funds
to help it control and manage money for particular purposes (the Nutrition Services Fund is an
example) or to show that it is meeting legal responsibilities for using certain taxes, grants, and
other money (such as bond-funded construction funds used for voter-approved capital projects).

Farmington Public School District
Management’s Discussion and Analysis (Continued)
5
The governmental funds of the School District use the following accounting approaches:
Governmental Funds - All of the School District’s services are reported in
governmental funds. Governmental fund reporting focuses on showing how money flows
into and out of funds and the balances left at year end that are available for spending.
They are reported using an accounting method called modified accrual accounting, which
measures cash and all other financial assets that can readily be converted to cash. The
governmental fund statements provide a detailed short-term view of the operations of
the School District and the services it provides. Governmental fund information helps
you determine whether there are more or fewer financial resources that can be spent in
the near future to finance the School District’s programs. We describe the relationship
(or differences) between governmental activities (reported in the statement of net
position and the statement of activities) and governmental funds in a reconciliation.
Proprietary Fund - Internal Service Fund - The purpose of the Internal Service Fund
is to finance services provided to other funds on a cost-reimbursement basis. The School
District maintains this fund for health, dental, and vision care, life insurance coverage, and
long-term disability benefits. The Proprietary Fund is reported on the same basis of
accounting as the government-wide statements.
The School District as Trustee - Reporting the School District’s Fiduciary Responsibilities
The School District is the trustee, or fiduciary, for its student activity funds. All of the School
District’s fiduciary activities are reported in a separate statement of fiduciary assets and liabilities.
We exclude these activities from the School District’s other financial statements because the
School District cannot use these assets to finance its operations. The School District is
responsible for ensuring that the assets reported in these funds are used for their intended
purposes.

Farmington Public School District
Management’s Discussion and Analysis (Continued)
6
The School District as a Whole
Recall that the statement of net position provides the perspective of the School District as a
whole. Table 1 provides a summary of the School District’s net position as of June 30, 2016 and
2015:
TABLE 1
2016 2015
Assets
Current and other assets 113.8$ 115.1$
Capital assets 110.8 106.2
Total assets 224.6 221.3
Deferred Outflows of Resources 24.7 14.1
Total assets and deferred outflows of resources 249.3 235.4
Liabilities
Current liabilities 30.4 35.9
Long-term liabilities 99.4 98.7
Net pension liability 236.9 221.3
Total liabilities 366.7 355.9
Deferred Inflows of Resources 13.7 16.3
Total liabilities and deferred inflows of resources 380.4 372.2
Net Position
Net investment in capital assets 85.9 82.5
Restricted 1.0 3.2
Unrestricted (218.0) (222.5)
Total net position (131.1)$ (136.8)$
Governmental Activities
(in millions)
June 30

Farmington Public School District
Management’s Discussion and Analysis (Continued)
7
The above analysis focuses on the net position (see Table 1). The change in net position (see
Table 2) of the School District’s governmental activities is discussed below. The School
District’s net deficit was $131.1 million and $136.8 million at June 30, 2016 and 2015,
respectively. Capital assets, net of related debt totaling $85.9 million, compares the original cost,
less depreciation of the School District’s capital assets, to long-term debt used to finance the
acquisition of those assets. Most of the debt will be repaid from voter-approved property taxes
collected as the debt service comes due. Restricted net position, totaling $1.0 million, is
reported separately to show legal constraints from debt covenants and enabling legislation that
limit the School District’s ability to use those net assets for day-to-day operations. The remaining
amount of net assets ($218.0 million) was unrestricted.
The ($218.0 million) in unrestricted net position of governmental activities represents the
accumulated results of all past years’ operations less the net pension liability. The unrestricted
net position balance, when positive, enables the School District to meet working capital and cash
flow requirements as well as to provide for future uncertainties. The net position liability as well
as operating results of the General Fund will have a significant impact on the change in
unrestricted net position from year to year.
The results of this year’s operations for the School District as a whole are reported in the
statement of activities, which shows the changes in net position for fiscal years ended June 30,
2016 and 2015 (see Table 2).
TABLE 2
2016 2015
Revenue
Program revenue:
Charges for services 4.5$ 4.5$
Operating grants 32.4 33.8
General revenue:
Property taxes 51.6 48.0
State foundation allowance 68.5 68.7
Other 2.0 2.2
Total revenue 159.0 157.2
Governmental Activities
(in millions)
Year Ended June 30

Farmington Public School District
Management’s Discussion and Analysis (Continued)
8
TABLE 2 (continued)
2016 2015
Functions/Program Expenses
Instruction 89.1$ 95.9$
Support services 50.4 55.6
Nutrition services 3.7 3.7
Athletics 1.8 1.8
Community services 1.6 1.4
Interest on long-term debt 3.7 2.3
Depreciation (unallocated) 3.0 3.0
Total functions/program expenses 153.3 163.7
Change in Net Position 5.7 (6.5)
Net Position - Beginning of year (136.8) (130.3)
Net Position - End of year (131.1)$ (136.8)$
(in millions)
Governmental Activities
Year Ended June 30
As reported in the statement of activities, the cost of all governmental activities this year was
$153.3 million. Certain activities were partially funded from those who benefited from the
programs ($4.5 million) or by other governments and organizations that subsidized certain
programs with grants and contributions ($32.4 million). The School District paid for the
remaining “public benefit” portion of governmental activities with $51.6 million in taxes, $68.5
million in state foundation allowance, and with other revenue (i.e., interest and unrestricted
grants totaling $2.0 million).
The School District experienced an increase in net position. The key reasons for this change are
the net effect of the investment in capital assets offset with the current year depreciation and
General Fund operating revenue exceeding expenditures.
As discussed above, the net cost shows the financial burden that was placed on the State and the
School District’s taxpayers by each of these functions. Since property taxes for operations and
unrestricted state aid constitute the vast majority of district operating revenue sources, the
Board of Education and administration must annually evaluate the needs of the School District
and balance those needs with state-prescribed available unrestricted resources.

Farmington Public School District
Management’s Discussion and Analysis (Continued)
9
The School District’s Funds
As we noted earlier, the School District uses funds to help it control and manage money for
particular purposes. Looking at funds helps the reader consider whether the School District is
being accountable for the resources taxpayers and others provide to it and may provide more
insight into the School District’s overall financial health.
As the School District completed this year, the governmental funds reported a combined fund
balance of $82.6 million, a decrease of approximately $5.7 million from the previous year. The
primary reason for the decrease is the commencement of construction and bus and equipment
purchases charged to the 2015 Building and Site Fund totaling $9.4 million. In the General Fund,
our principal operating fund, the fund balance increased $4.3 million to $12.7 million. Budgeted
revenues were estimated to exceed expenditures by $1.6 million.
The School District continues to work diligently in the budget process to reduce costs, increase
revenue, and create additional efficiencies to offset our increasing costs. Our collective
bargaining process over the last few years with our largest groups resulted in either half steps or
frozen steps and other concessionary adjustments including benefit contributions of between 20
percent and 30 percent of healthcare-related expenses. The teachers’ contract expired on
August 31, 2016 and is currently being negotiated. The contract for paraprofessional and
secretarial staff expired on June 30, 2016 and is also being negotiated. The District settled a four-
year contract through June 30, 2019 with the Farmington Association of School Administrators
(FASA) group which included pay and step freezes in the initial year and reductions in
compensation and conference funds for the remaining three years, based upon audited General
Fund fund balance levels established by the Board of Education and included in the agreement.
The District also settled a two-year contract through June 30, 2018 with the Farmington
Transportation Association (FTA), comprised of bus drivers and mechanic staff which included
the elimination of longevity pay and increased contributions for healthcare benefits.
Negotiations for nutrition and maintenance staff are ongoing as their contract expired on June
30, 2016. As part of evaluating the potential cost savings for outsourcing its custodial services as
well as negotiating with its custodial staff, the District decided to contract with a custodial
company for these services on July 1, 2016.
During fiscal 2016, additional work of the Benefits Advisory Committee concluded with
additional revisions to the benefit plans whereby the employee groups agreed to increased
deductibles and co-pays for both the PPO and HMO medical plans as of July 1, 2016. The
employee groups also agreed to add two Consumer Driven Health Plans (CDHP), with Health
Savings Accounts, on January 1, 2017. These revisions are expected to save the District
approximately $800,000 to $2,100,000 in 2016-2017, as well as reduce employee contributions,
based upon employee plan elections made.
The General Fund fund balance is available to fund costs related to school operating purposes,
for future state funding shortfalls, and for working capital.
Farmington Public School District
Management’s Discussion and Analysis (Continued)
10
The Special Education Center Program Fund fund balance was depleted as the District
completed renovation of a special education building. The District ceased running county special
education center programs during fiscal year 2015.
The 2015 Building and Site Fund was established to record bond proceeds and other revenue
and the disbursement of invoices specifically related to the remodeling of buildings for safety and
security improvements; constructing additions to, equipping, furnishing, re-equipping,
refurnishing and remodeling buildings, including classroom, auditorium, and media center
improvements; improving and developing sites, including outdoor athletic facilities, playgrounds,
and structures; acquiring school buses and acquiring and installing technology infrastructure and
equipment. Bond expenditures for the projects above for the year were $9.4 million. In 2015,
approximately $76 million was received from bond proceeds to fund the listed projects and
refund the remaining balance of the 2005 refunding bonds. A total of $131.5 million was
approved by voters in May 2015, with the balance of the bonds to be sold during fiscal year
2018.
The other nonmajor funds include the Debt Service Funds, Maintenance/Bus Purchases Capital
Projects Fund, the Technology/Other Projects Capital Projects Fund, and Nutrition Services
Fund. Overall, the Debt Service Funds showed a fund balance increase of approximately
$528,000. This increase is due to a higher millage rate to collect the taxes necessary for the debt
service payments on the 2015 bond issue and the 2013 refunding bond. Millage rates are
determined annually to ensure that the School District accumulates sufficient resources to pay
annual bond issue-related debt service. The Debt Service Funds fund balances are restricted
since they can only be used to pay debt service obligations.
The Nutrition Services Fund experienced an increase in fund balance of approximately $88,000.
Lunch and breakfast prices have remained unchanged and the department is addressing future
capital needs.
The Maintenance/Bus Purchases Capital Projects Fund was created during the 2004-2005 fiscal
year to separate large capital and nonoperating expenditures from general operations of the
School District. Transfers from the General Fund are made to this fund based upon the capital
projects budgeted for the fiscal year. No transfers were made during 2016 as the capital
expenditure needs are being satisfied by the 2015 bond construction.

Farmington Public School District
Management’s Discussion and Analysis (Continued)
11
The Technology/Other Projects Capital Projects Fund was previously funded through transfers
from the General Fund. These funds were used to purchase technology-related equipment. As
pressures continued on General Fund operations, limited, if any, dollars were available to fund
technology purchases. Therefore, a portion of the 2015 Building and Site Fund was used to
purchase technology infrastructure and technology-related equipment.
General Fund Budgetary Highlights
Over the course of the year, the School District revises its budget as it attempts to deal with
unexpected changes in revenue and expenditures. State law requires that the budget be
amended to ensure that expenditures do not exceed appropriations. The final amendment to
the budget was adopted before year end (a schedule showing the School District’s original and
final budget amounts compared with amounts actually paid and received is provided in the
required supplemental information of these financial statements).
There were revisions made to the revenue in the 2015-2016 General Fund original budget. The
revisions, totaling a net increase of approximately $0.8 million, consisted mainly of a net increase
in state funding of approximately $1.9 million to reflect additional funding for retirement
obligations, coupled with a loss in state funding of approximately $0.9 million due to a larger than
expected decline in pupils, a decrease in local funding of approximately $0.7 million based upon
revised property tax values and reduced preschool tuition and pay-to-participate fees, a
decrease of $0.6 million to adjust to revised grant awards, and an increase in transfers in to
transfer the remaining balance of the Special Education Center Fund to the General Fund.
There were revisions made to the expenditures in the 2015-2016 General Fund original budget.
Budgeted expenditures were decreased by $2.3 million on a net basis due to a decrease in
wages and benefits which resulted from the District offering a severance incentive reducing
actual staffing in place, an increase in retirement costs for the UAAL (unfunded accrued actuarial
liability) costs, and adjustments of grant awards.
The difference between final budgeted revenue and actual revenue was $628,962, or 0.44
percent less than budgeted. The difference, on a net basis, includes the reconciliation to prior
year special education funding from the state and actual adult education and federal revenue
recorded based upon expenditures made, where these grants are budgeted at the full award
amount.
The difference between final budgeted expenditures and actual expenditures was $3,388,204, or
2.40 percent less than budgeted. The reasons for the differences, on a net basis, are as follows:
Grant expenditures, budgeted upon award amounts, were below projections by
approximately $616,000.
Utility costs were below projections by approximately $269,000.
Substitute costs were below projections by approximately $83,000.

Farmington Public School District
Management’s Discussion and Analysis (Continued)
12
Building budgets and teacher/administrator conference accounts were below projections,
with balances remaining at year end totaling approximately $460,000.
Many departmental budgets were below projections, with balances remaining at year end
totaling approximately $793,000.
Employee wage and wage-related benefit costs were below projections by $1,241,000.
Employee fringe benefit costs were below projections by $25,000.
Advertising costs were below projections by $18,000.
Tax tribunal costs were below projections by $23,000.
Legal costs were over projections by $96,000.
Special education transportation/shuttle costs were below projections by $117,000.
Workers’ compensation costs were over projections by $161,000.
Other financing sources actual balances were lower than the final budget due to higher
expenditures in the Special Education Center Fund, which allowed less funds to be transferred
to the General Fund as well as fewer proceeds from the sale of capital assets.
Capital Assets and Debt Administration
Capital Assets
At June 30, 2016 and 2015, the School District had $110,850,110 and $106,182,971,
respectively, invested in a broad range of capital assets, including land, buildings, and furniture
and equipment. This amount represents a net increase (including additions, deductions, and
depreciation) of $4,667,139 from last year.
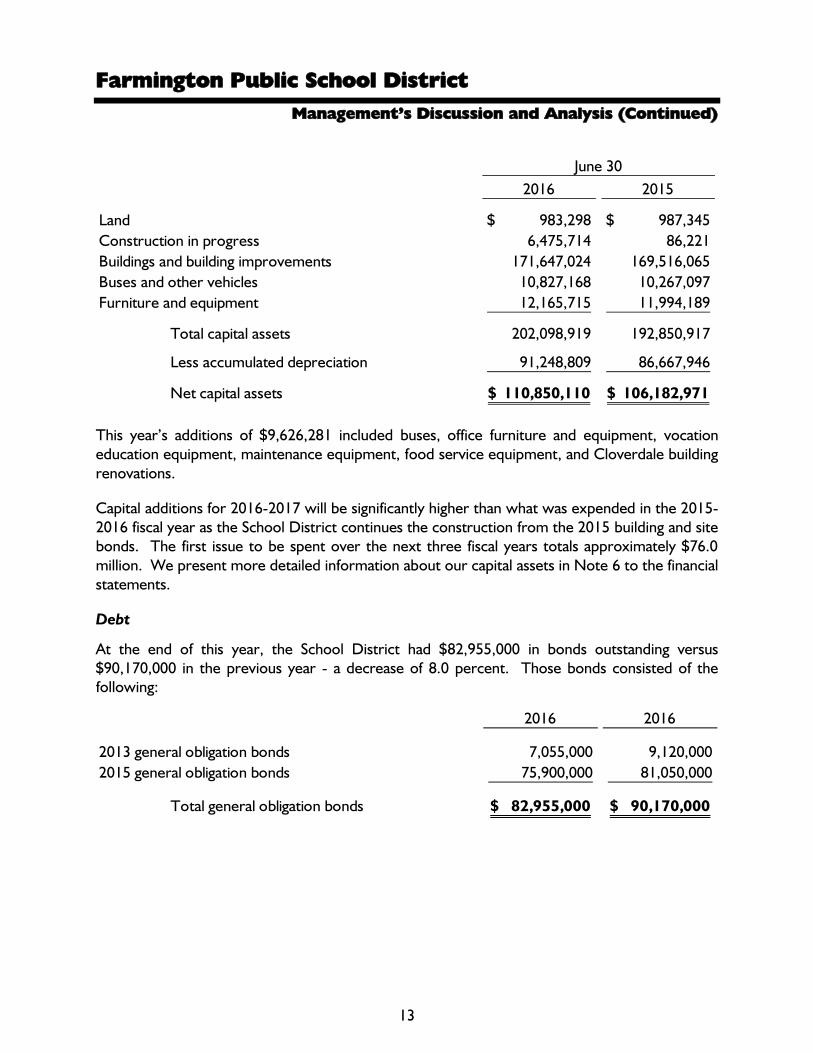
Farmington Public School District
Management’s Discussion and Analysis (Continued)
13
This year’s additions of $9,626,281 included buses, office furniture and equipment, vocation
education equipment, maintenance equipment, food service equipment, and Cloverdale building
renovations.
Capital additions for 2016-2017 will be significantly higher than what was expended in the 2015-
2016 fiscal year as the School District continues the construction from the 2015 building and site
bonds. The first issue to be spent over the next three fiscal years totals approximately $76.0
million. We present more detailed information about our capital assets in Note 6 to the financial
statements.
Debt
At the end of this year, the School District had $82,955,000 in bonds outstanding versus
$90,170,000 in the previous year - a decrease of 8.0 percent. Those bonds consisted of the
following:
2016 2016
2013 general obligation bonds 7,055,000 9,120,000
2015 general obligation bonds 75,900,000 81,050,000
Total general obligation bonds 82,955,000$ 90,170,000$
June 30
2016 2015
Land 983,298$ 987,345$
Construction in progress 6,475,714 86,221
Buildings and building improvements 171,647,024 169,516,065
Buses and other vehicles 10,827,168 10,267,097
Furniture and equipment 12,165,715 11,994,189
Total capital assets 202,098,919 192,850,917
Less accumulated depreciation 91,248,809 86,667,946
Net capital assets 110,850,110$ 106,182,971$

Farmington Public School District
Management’s Discussion and Analysis (Continued)
14
During 2015, Moody’s reviewed and downgraded the School District’s credit rating from Aa2 to
Aa3 with a negative outlook. The current Standard & Poor’s rating given to the School District in
2013 of AA was reviewed and downgraded to AA- with a positive outlook in February 2016.
The State limits the amount of general obligation debt that schools can issue to 15 percent of the
assessed value of all taxable property within the school district’s boundaries. If the school
district issues qualified debt, i.e., debt backed by the State of Michigan, such obligations are not
subject to this debt limit. The School District’s outstanding nonqualified general obligation debt
of $75.9 million is significantly below this $565.6 million statutorily imposed limit.
Other obligations include accrued vacation pay, sick leave, workers’ compensation self-
insurance, and voluntary severance plan incentive obligations. We present more detailed
information about our long-term liabilities in Note 8 to the basic financial statements.
Economic Factors and Next Year’s Budgets and Rates
Our elected officials and administration considered many factors when setting the School
District’s 2017 fiscal year budget. One of the most important factors affecting the budget is our
student count. The state foundation revenue is determined by multiplying the blended student
count by the foundation allowance per pupil. The blended count for the 2017 fiscal year is
90 percent and 10 percent of the October 2016 and February 2016 student counts, respectively.
The 2017 budget was adopted in June 2016, based on an estimate of students that will be
enrolled in September 2016. Approximately 68 percent of total General Fund revenue is from
the foundation allowance. Under state law, the School District cannot assess additional property
tax revenue for general operations. As a result, School District funding is heavily dependent on
the State’s ability to fund local school operations. Based on early enrollment data at the start of
the 2017 school year, we anticipate that the fall student count will be approximately the same as
the estimates used in creating the 2016-2017 budget. Once the final student count and related
per pupil funding are validated, state law requires the School District to amend the budget if
actual School District resources are not sufficient to fund original appropriations. The legislature
approved a $60 increase in the 2016-2017 foundation allowance; however, because districts are
not allowed to receive funding increases in excess of the rate of inflation, Farmington will receive
approximately $50 of its increase in the form of a categorical payment. The risk of this separate
categorical payment is that the legislature could choose to eliminate it in the future as a cost-
savings measure as it did several years ago when it eliminated section 20j. The foundation
allowance is approximately the same as the 2005-2006 level.

Farmington Public School District
Management’s Discussion and Analysis (Continued)
15
Since the School District’s revenue is heavily dependent on state funding and the health of the
State’s School Aid Fund, the actual revenue received depends on the State’s ability to collect
revenue to fund its appropriation to school districts. With the 2012 changes to the MPSERS
pension system, the legislature also included a provision to keep the health portion charged to
school districts at a flat rate and any increase would come from the School Aid Fund. The rate
paid by the School District varies based upon the plan selected by the employee this past year.
This puts additional pressure on the fund for the available resources to distribute to schools. The
State periodically holds a revenue-estimating conference to estimate revenue. The next
revenue-estimating conference has not been scheduled at the present time. The school aid
budget now includes appropriations for community colleges and higher education as well. The
legislature will need to make drastic budget cuts or determine alternate revenue sources should
the funding sources identified fall short of projections. The governor continues to look at
overhauling the current funding structure. Funding P-20 schools is a high priority for the
governor which could have a drastic negative impact on current K-12 school districts and their
available resources.
The District negotiated and settled with two employee groups during 2015-2016. A four-year
contract through June 30, 2019 was settled with the Farmington Association of School
Administrators (FASA) group which included pay and step freezes in the initial year and
reductions in compensation and conference funds for the remaining three years, based upon
audited General Fund fund balance levels established by the Board of Education and included in
the agreement. The District also settled a two-year contract through June 30, 2018 with the
Farmington Transportation Association (FTA), comprised of bus drivers and mechanic staff
which included the elimination of longevity pay and increased contributions for healthcare
benefits. As part of evaluating the potential cost savings for outsourcing its custodial services as
well as negotiating with its custodial staff, the District decided to contract with a custodial
company for these services on July 1, 2016. Several employee groups contract negotiations are
still in progress. The teachers’ contract expired on August 31, 2016 and is currently being
negotiated. The contracts for paraprofessional and secretarial staff as well as nutrition and
maintenance staff expired on June 30, 2016 and are currently being negotiated.
Contacting the School District’s Management
This financial report is intended to provide our taxpayers, parents, and investors with a general
overview of the School District’s finances and to show the School District’s accountability for the
money it receives. If you have any questions about this report or need additional information, we
welcome you to contact the business office.

Farmington Public School District
The Notes to Financial Statements are
an Integral Part of this Statement. 16
Statement of Net Position
June 30, 2016
Governmental
Activities
Assets
Cash and investments (Notes 3 and 4) 95,681,820$
Receivables:
Taxes 62,000
Interest 119,093
Accounts receivable 454,391
Due from other governmental units 16,349,086
Inventories 71,225
Deposits 341,865
Prepaid costs 719,499
Capital assets not being depreciated (Note 6) 7,459,012
Capital assets being depreciated - Less accumulated depreciation of
$91,248,809 (Note 6) 103,391,098
Total assets 224,649,089
Deferred Outflows of Resources - Deferred outflows related to pensions (Note 10) 24,656,573
Total assets and deferred outflows of resources 249,305,662
Liabilities
Accounts payable 5,299,493
Accrued payroll and other liabilities 17,155,646
Interest payable 426,533
Due to other governmental units 1,304,195
Unearned revenue (Note 5) 719,839
State aid note payable (Note 11) 5,528,571
Long-term liabilities (Note 8):
Bonds and contracts payable, due within one year 8,294,306
Compensated absences and other long-term liabilities, due within
one year 2,873,852
Bonds and contracts payable, due in more than one year 83,802,842
Compensated absences and other long-term liabilities, due in more
than one year 4,395,689
Net pension liability (Note 10) 236,872,217
Total liabilities 366,673,183
Deferred Inflows of Resources - Deferred inflows related to pensions and
revenue in support of pension payments (Note 10)13,707,911
Total liabilities and deferred inflows of resources 380,381,094
Net Position
Net investment in capital assets 85,948,397
Restricted for:
Debt service 328,418
Capital projects 714,028
Unrestricted (deficit) (218,066,275)
Total net position (131,075,432)$
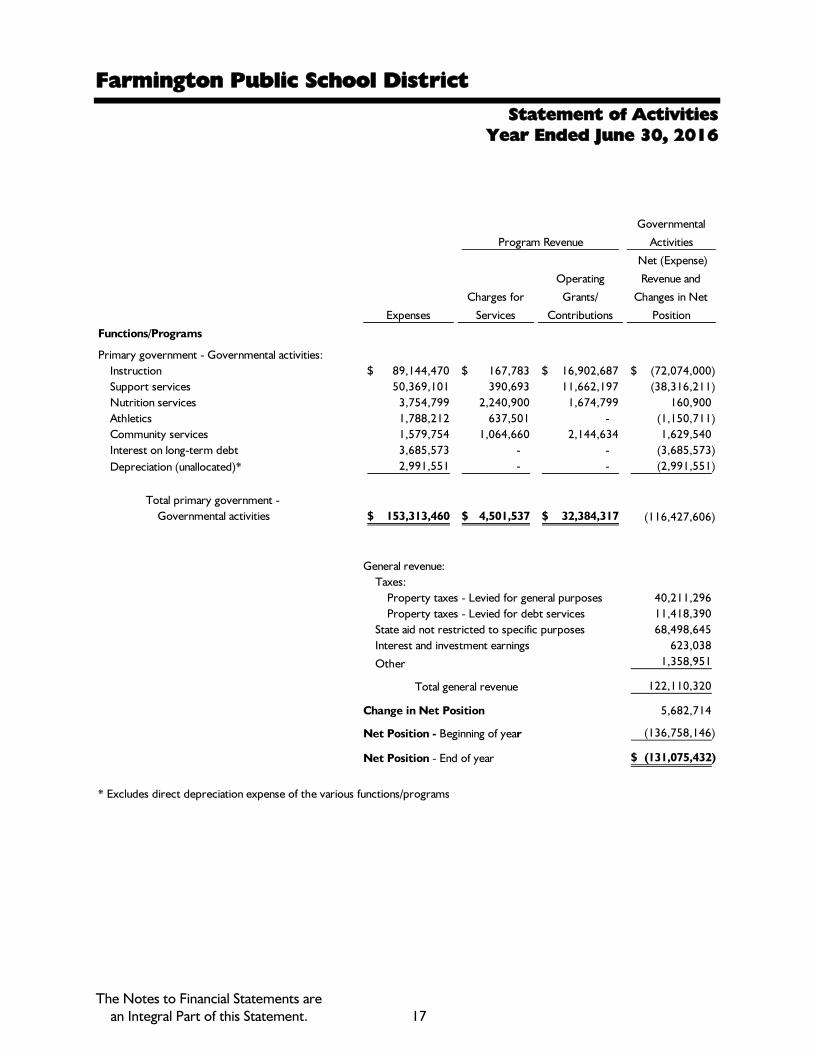
Farmington Public School District
The Notes to Financial Statements are
an Integral Part of this Statement. 17
Statement of Activities
Year Ended June 30, 2016
Program Revenue
Governmental
Activities
Expenses
Charges for
Services
Operating
Grants/
Contributions
Net (Expense)
Revenue and
Changes in Net
Position
Functions/Programs
Primary government - Governmental activities:
Instruction 89,144,470$ 167,783$ 16,902,687$ (72,074,000)$
Support services 50,369,101 390,693 11,662,197 (38,316,211)
Nutrition services 3,754,799 2,240,900 1,674,799 160,900
Athletics 1,788,212 637,501 - (1,150,711)
Community services 1,579,754 1,064,660 2,144,634 1,629,540
Interest on long-term debt 3,685,573 - - (3,685,573)
Depreciation (unallocated)* 2,991,551 - - (2,991,551)
Total primary government -
Governmental activities 153,313,460$ 4,501,537$ 32,384,317$ (116,427,606)
General revenue:
Taxes:
Property taxes - Levied for general purposes 40,211,296
Property taxes - Levied for debt services 11,418,390
State aid not restricted to specific purposes 68,498,645
Interest and investment earnings 623,038
Other 1,358,951
Total general revenue 122,110,320
Change in Net Position 5,682,714
Net Position - Beginning of year (136,758,146)
Net Position - End of year (131,075,432)$
* Excludes direct depreciation expense of the various functions/programs

Farmington Public School District
The Notes to Financial Statements are
an Integral Part of this Statement. 18
Governmental Funds
Balance Sheet
June 30, 2016
2015 Building
and Site
Assets
Cash and investments (Notes 3 and 4) 19,117,048$ - $ - $ 1,320,327$ 20,437,375$
Receivables:
Taxes 62,000 - - - 62,000
Interest - - 119,093 - 119,093
Accounts receivable 415,237 - - 328 415,565
Due from other governmental units 16,237,155 - - 111,931 16,349,086
Due from other funds (Note 7) 268,551 25,815 - 68,832 363,198
Inventories 32,923 - - 38,302 71,225
Prepaid costs 713,981 - - - 713,981
Restricted assets (Notes 3 and 4) - - 71,329,951 778,752 72,108,703
Total assets 36,846,895$ 25,815$ 71,449,044$ 2,318,472$ 110,640,226$
Liabilities and Fund Balances
Liabilities
Accounts payable 1,370,252$ 25,815$ 3,539,581$ 30,351$ 4,965,999$
Accrued payroll 14,450,934 - - 14,119 14,465,053
Other accrued liabilities 65,610 - - - 65,610
State aid note payable (Note 11) 5,528,571 - - - 5,528,571
Due to other funds (Note 7) 768,008 - - 232,371 1,000,379
Due to other governmental units 1,304,195 - - - 1,304,195
Unearned revenue (Note 5) 656,795 - - 63,044 719,839
Total liabilities 24,144,365 25,815 3,539,581 339,885 28,049,646
Fund Balances
Nonspendable:
Inventories 32,923 - - 38,302 71,225
Prepaid costs 713,981 - - - 713,981
Restricted:
Capital projects - - 67,909,463 - 67,909,463
Nutrition services - - - 1,067,900 1,067,900
Debt service - - - 754,951 754,951
Committed:
Contractual obligations - Retirement and sick pay 2,724,002 - - - 2,724,002
Contractual obligations - Vacation pay 235,348 - - - 235,348
Cash flow deficiency for 2016/2017 3,376,950 - - - 3,376,950
Capital projects - - - 117,434 117,434
Assigned - Voluntary severance plan pay 3,359,655 - - - 3,359,655
Unassigned 2,259,671 - - - 2,259,671
Total fund balances 12,702,530 - 67,909,463 1,978,587 82,590,580
Total liabilities and fund
balances 36,846,895$ 25,815$ 71,449,044$ 2,318,472$ 110,640,226$
TotalGeneral Fund
Other
Nonmajor
Governmental
Special
Education
Center
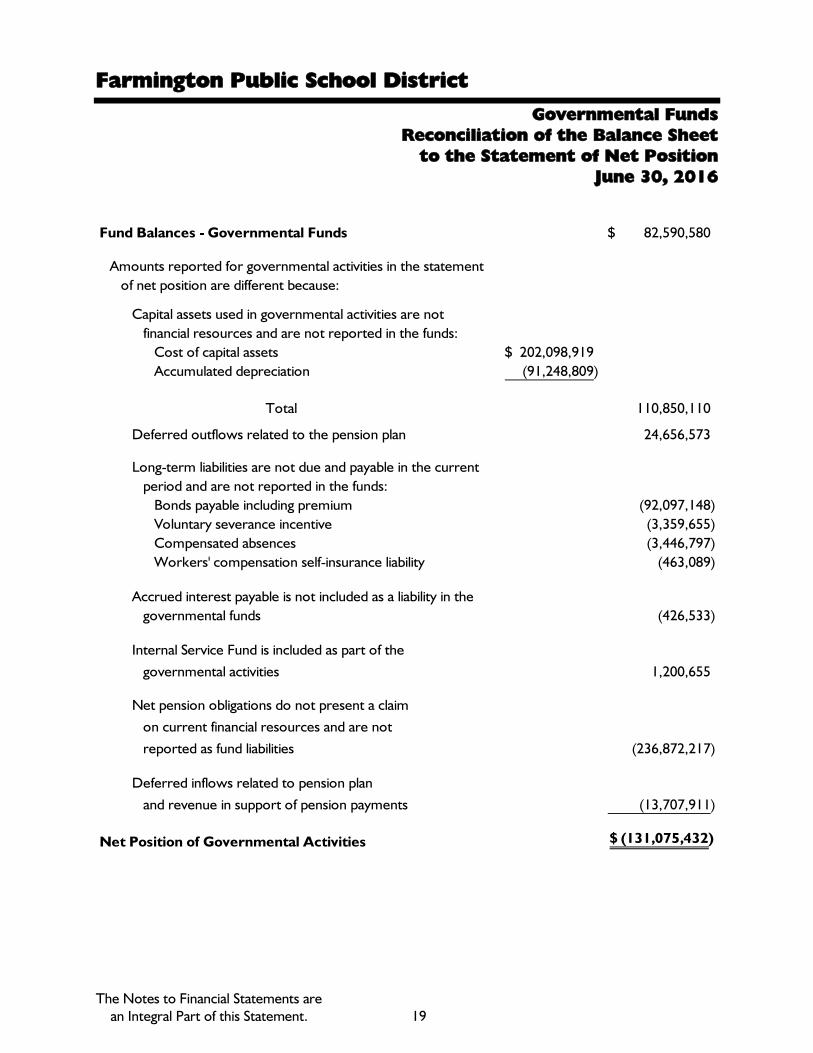
Farmington Public School District
The Notes to Financial Statements are
an Integral Part of this Statement. 19
Governmental Funds
Reconciliation of the Balance Sheet
to the Statement of Net Position
June 30, 2016
Fund Balances - Governmental Funds 82,590,580$
Amounts reported for governmental activities in the statement
of net position are different because:
Capital assets used in governmental activities are not
financial resources and are not reported in the funds:
Cost of capital assets 202,098,919$
Accumulated depreciation (91,248,809)
Total 110,850,110
Deferred outflows related to the pension plan 24,656,573
Long-term liabilities are not due and payable in the current
period and are not reported in the funds:
Bonds payable including premium (92,097,148)
Voluntary severance incentive (3,359,655)
Compensated absences (3,446,797)
Workers' compensation self-insurance liability (463,089)
Accrued interest payable is not included as a liability in the
governmental funds (426,533)
Internal Service Fund is included as part of the
governmental activities 1,200,655
Net pension obligations do not present a claim
on current financial resources and are not
reported as fund liabilities (236,872,217)
Deferred inflows related to pension plan
and revenue in support of pension payments (13,707,911)
Net Position of Governmental Activities (131,075,432)$

Farmington Public School District
The Notes to Financial Statements are
an Integral Part of this Statement. 20
Governmental Funds
Statement of Revenue, Expenditures, and
Changes in Fund Balances
Year Ended June 30, 2016
General Fund
Special
Education
Center
Program 2015 Building and Site
Other Nonmajor
Governmental
Funds Total
Revenue
Local sources 43,577,594$ - $ 713,543$ 13,623,076$ 57,914,213$
State sources 81,868,313 - - 194,537 82,062,850
Federal sources 4,090,646 - - 1,517,728 5,608,374
Interdistrict sources 11,737,572 - - 51,371 11,788,943
Total revenue 141,274,125 - 713,543 15,386,712 157,374,380
Expenditures
Current:
Instruction 85,548,608 - - - 85,548,608
Support services 48,198,423 42,301 - - 48,240,724
Community services 1,496,704 - - - 1,496,704
Nutrition services - - - 3,651,062 3,651,062
Athletics 1,788,212 - - - 1,788,212
Debt service:
Principal - - - 7,215,000 7,215,000
Interest and other - - - 3,725,090 3,725,090
Intergovernmental payments 678,074 - - - 678,074
Capital outlay - 1,859,457 9,406,985 28,885 11,295,327
Total expenditures 137,710,021 1,901,758 9,406,985 14,620,037 163,638,801
Excess of Revenue Over (Under)
Expenditures 3,564,104 (1,901,758) (8,693,442) 766,675 (6,264,421)
Other Financing Sources (Uses)
Transfers in (Note 7) 246,438 - - 20,517 266,955
Transfers out (Note 7) - (67,493) - (199,462) (266,955)
Proceeds from sale of capital assets 532,260 - - - 532,260
Total other financing
sources (uses) 778,698 (67,493) - (178,945) 532,260
Net Change in Fund Balances 4,342,802 (1,969,251) (8,693,442) 587,730 (5,732,161)
Fund Balances - Beginning of year 8,359,728 1,969,251 76,602,905 1,390,857 88,322,741
Fund Balances - End of year 12,702,530$ - $ 67,909,463$ 1,978,587$ 82,590,580$
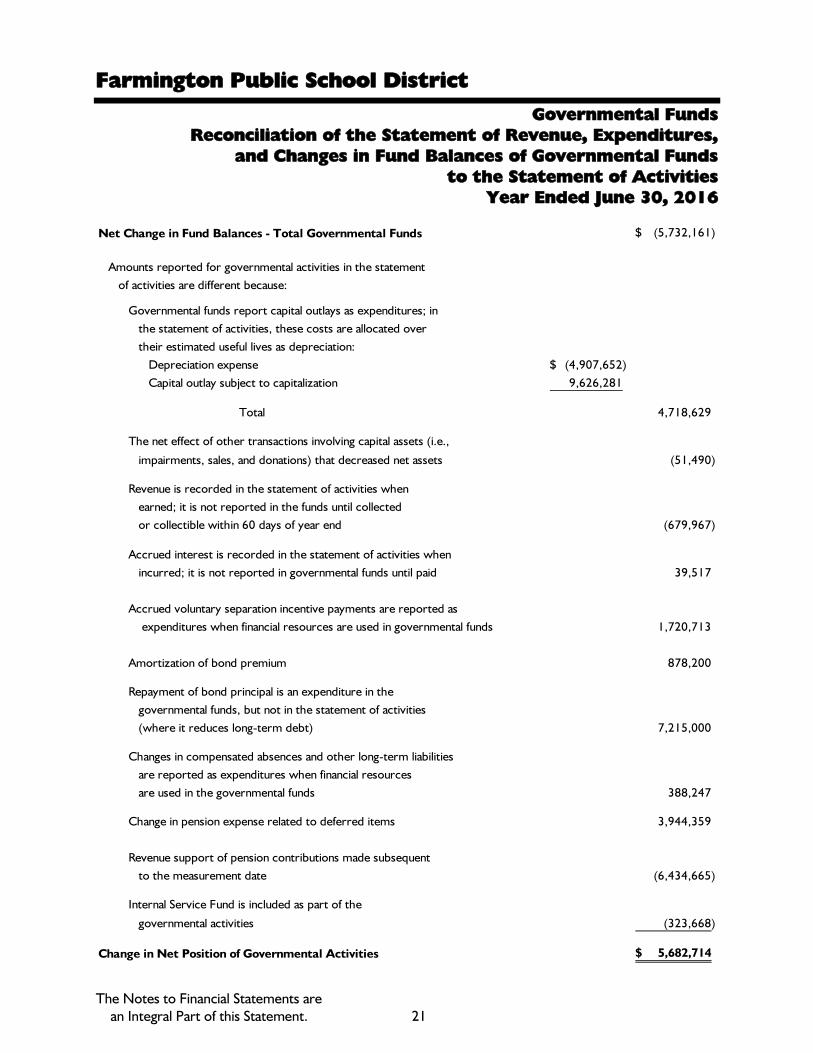
Farmington Public School District
The Notes to Financial Statements are
an Integral Part of this Statement. 21
Governmental Funds
Reconciliation of the Statement of Revenue, Expenditures,
and Changes in Fund Balances of Governmental Funds
to the Statement of Activities
Year Ended June 30, 2016
Net Change in Fund Balances - Total Governmental Funds (5,732,161)$
Amounts reported for governmental activities in the statement
of activities are different because:
Governmental funds report capital outlays as expenditures; in
the statement of activities, these costs are allocated over
their estimated useful lives as depreciation:
Depreciation expense (4,907,652)$
Capital outlay subject to capitalization 9,626,281
Total 4,718,629
The net effect of other transactions involving capital assets (i.e.,
impairments, sales, and donations) that decreased net assets (51,490)
Revenue is recorded in the statement of activities when
earned; it is not reported in the funds until collected
or collectible within 60 days of year end (679,967)
Accrued interest is recorded in the statement of activities when
incurred; it is not reported in governmental funds until paid 39,517
Accrued voluntary separation incentive payments are reported as
expenditures when financial resources are used in governmental funds 1,720,713
Amortization of bond premium 878,200
Repayment of bond principal is an expenditure in the
governmental funds, but not in the statement of activities
(where it reduces long-term debt) 7,215,000
Changes in compensated absences and other long-term liabilities
are reported as expenditures when financial resources
are used in the governmental funds 388,247
Change in pension expense related to deferred items 3,944,359
Revenue support of pension contributions made subsequent
to the measurement date (6,434,665)
Internal Service Fund is included as part of the
governmental activities (323,668)
Change in Net Position of Governmental Activities 5,682,714$

Farmington Public School District
The Notes to Financial Statements are
an Integral Part of this Statement. 22
Proprietary Fund - Internal Service Fund
Statement of Net Position
June 30, 2016
Benefit
Stabilization
Fund
Assets - Current assets
Cash (Notes 3 and 4) 3,135,742$
Receivables 2,646
Due from other funds (Note 7) 673,361
Deposits 341,865
Prepaids 5,518
Total assets 4,159,132
Liabilities - Current liabilities
Accounts payable 333,494
Accrued liabilities (Note 9) 2,624,983
Total current liabilities 2,958,477
Net Position - Unrestricted 1,200,655$

Farmington Public School District
The Notes to Financial Statements are
an Integral Part of this Statement. 23
Proprietary Fund - Internal Service Fund
Statement of Revenue, Expenses, and Change in Net Position
Year Ended June 30, 2016
Benefit
Stabilization
Fund
Operating Revenue
Charges for services 18,311,292$
Other 256,561
Total operating revenue 18,567,853
Operating Expenses
Cost of insurance claims 18,432,980
Premiums 464,804
Total operating expenses 18,897,784
Operating Loss (329,931)
Nonoperating Revenue - Interest income 6,263
Change in Net Position (323,668)
Net Position - Beginning of year 1,524,323
Net Position - End of year 1,200,655$
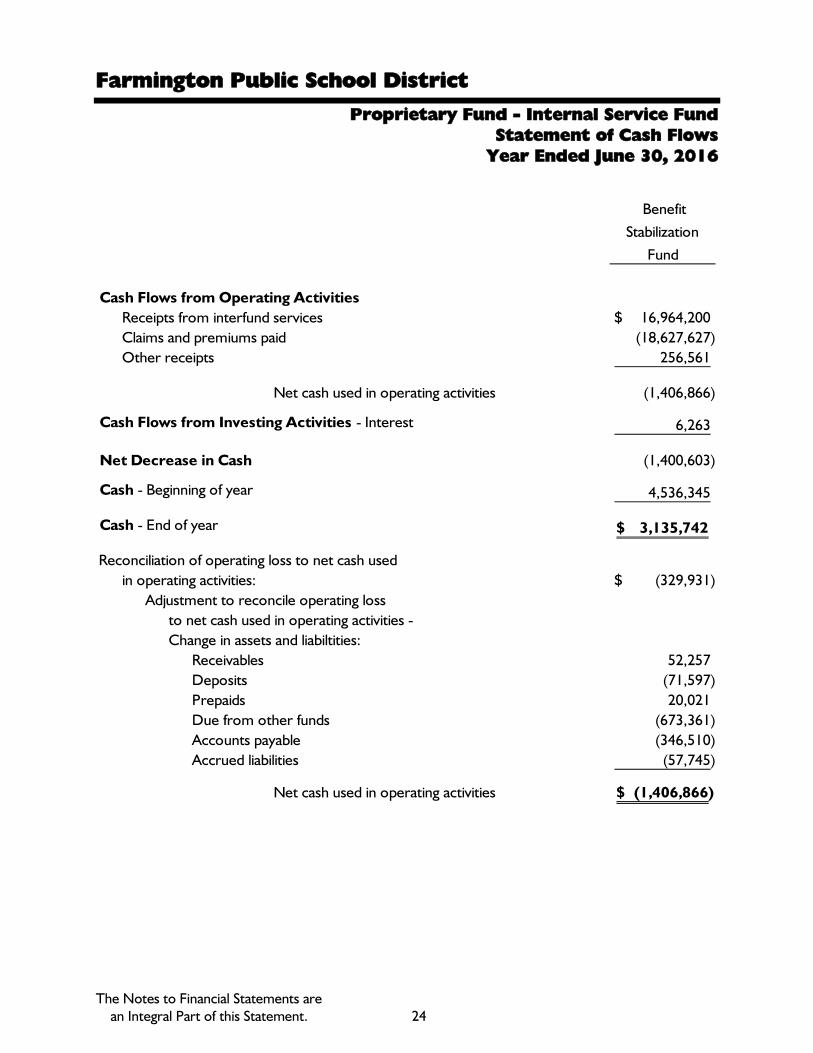
Farmington Public School District
The Notes to Financial Statements are
an Integral Part of this Statement. 24
Proprietary Fund - Internal Service Fund
Statement of Cash Flows
Year Ended June 30, 2016
Benefit
Stabilization
Fund
Cash Flows from Operating Activities
Receipts from interfund services 16,964,200$
Claims and premiums paid (18,627,627)
Other receipts 256,561
Net cash used in operating activities (1,406,866)
Cash Flows from Investing Activities - Interest 6,263
Net Decrease in Cash (1,400,603)
Cash - Beginning of year 4,536,345
Cash - End of year 3,135,742$
Reconciliation of operating loss to net cash used
in operating activities: (329,931)$
Adjustment to reconcile operating loss
to net cash used in operating activities -
Change in assets and liabiltities:
Receivables 52,257
Deposits (71,597)
Prepaids 20,021
Due from other funds (673,361)
Accounts payable (346,510)
Accrued liabilities (57,745)
Net cash used in operating activities (1,406,866)$

Farmington Public School District
The Notes to Financial Statements are
an Integral Part of this Statement. 25
Fiduciary Fund
Statement of Fiduciary Assets and Liabilities
June 30, 2016
Student Activities
Agency Fund
Assets
Cash and investments (Notes 3 and 4) 1,165,079$
Accounts receivable 4,924
Total assets 1,170,003$
Liabilities
Accounts payable 100,223$
Due to other funds (Note 7) 36,180
Due to student groups 1,033,600
Total liabilities 1,170,003$

Farmington Public School District
Notes to Financial Statements
June 30, 2016
26
Note 1 - Summary of Significant Accounting Policies
The accounting policies of Farmington Public School District (the “School District”)
conform to accounting principles generally accepted in the United States of America
(GAAP) as applicable to governmental units. The following is a summary of the significant
accounting policies used by the School District:
Reporting Entity
The School District is governed by an elected seven-member Board of Education. The
accompanying financial statements have been prepared in accordance with criteria
established by the Governmental Accounting Standards Board for determining the
various governmental organizations to be included in the reporting entity. These criteria
include significant operational financial relationships that determine which of the
governmental organizations are a part of the School District’s reporting entity, and which
organizations are legally separate component units of the School District. Based on the
application of the criteria, the School District does not contain any component units.
Government-wide and Fund Financial Statements
The government-wide financial statements (i.e., the statement of net position and the
statement of activities) report information on all of the nonfiduciary activities of the
primary government. For the most part, the effect of interfund activity has been
removed from these statements. Governmental activities, which normally are supported
by taxes and intergovernmental revenue, are reported separately from business-type
activities, which rely to a significant extent on fees and charges for support. All of the
School District’s government-wide activities are considered governmental activities.
The statement of activities demonstrates the degree to which the direct expenses of a
given function or segment are offset by program revenue. Direct expenses are those that
are clearly identifiable with a specific function. Program revenue includes (1) charges to
customers or applicants who purchase, use, or directly benefit from goods, services, or
privileges provided by a given function and (2) grants and contributions that are
restricted to meeting the operational or capital requirements of a particular function.
Taxes, intergovernmental payments, and other items not properly included among
program revenue are reported instead as general revenue.
Separate financial statements are provided for governmental funds, the proprietary fund,
and fiduciary funds, even though the latter are excluded from the government-wide
financial statements. Major individual governmental funds are reported as separate
columns in the fund financial statements.

Farmington Public School District
Notes to Financial Statements
June 30, 2016
27
Note 1 - Summary of Significant Accounting Policies (Continued)
Measurement Focus, Basis of Accounting, and Financial Statement Presentation
Government-wide Financial Statements - The government-wide financial statements
are reported using the economic resources measurement focus and the accrual basis of
accounting. Revenue is recorded when earned and expenses are recorded when a
liability is incurred, regardless of the timing of related cash flows. Property taxes are
recognized as revenue in the year for which they are levied. Grants, categorical aid, and
similar items are recognized as revenue as soon as all eligibility requirements imposed by
the provider have been met.
As a general rule, the effect of interfund activity has been eliminated from the
government-wide financial statements.
When an expense is incurred for purposes for which both restricted and unrestricted net
position or fund balance are available, the School District’s policy is to first apply
restricted resources. When an expense is incurred for purposes for which amounts in
any of the unrestricted fund balance classifications could be used, it is the School
District’s policy to spend funds in this order: committed, assigned, and unassigned.
Amounts reported as program revenue include (1) charges to customers or applicants
for goods, services, or privileges provided, (2) operating grants and contributions, and (3)
capital grants and contributions. Internally dedicated resources are reported as general
revenue rather than as program revenue. Likewise, general revenue includes all taxes
and unrestricted state aid.
Fund-based Financial Statements - Governmental fund financial statements are
reported using the current financial resources measurement focus and the modified
accrual basis of accounting. Revenue is recognized as soon as it is both measurable and
available. Revenue is considered to be available if it is collected within the current period
or soon enough thereafter to pay liabilities of the current period. Revenue not meeting
this definition is classified as a deferred inflow of resources. For this purpose, the
government considers revenue to be available if it is collected within 60 days of the end
of the current fiscal period. Expenditures generally are recorded when a liability is
incurred, as under accrual accounting. However, debt service expenditures, as well as
expenditures related to compensated absences and claims and judgments, are recorded
only when payment is due.
Property taxes, unrestricted state aid, intergovernmental grants, and interest associated
with the current fiscal period are all considered to be susceptible to accrual and have
been recognized as revenue of the current fiscal period. All other revenue items are
considered to be available only when cash is received by the School District.

Farmington Public School District
Notes to Financial Statements
June 30, 2016
28
Note 1 - Summary of Significant Accounting Policies (Continued)
Fiduciary fund statements report assets and liabilities held by the School District in a
trustee capacity or as an agent. They do not involve the measurement of results of
operations. Fiduciary fund statements are reported using the accrual basis of accounting.
Proprietary fund statements are also reported using the economic resources
measurement focus and the accrual basis of accounting. Proprietary funds distinguish
operating revenue and expenses from nonoperating items. Operating revenue and
expenses generally result from providing services and producing and delivering goods in
connection with a proprietary fund’s principal ongoing operations. The principal revenue
of the proprietary fund relates to charges to other funds for benefit services. Operating
expenses for the proprietary fund include the cost of health, dental and vision claims,
administrative expenses, costs for life insurance, and long-term disability benefits. All
revenue and expenses not meeting this definition are reported as nonoperating revenue
and expenses.
The School District reports the following major governmental funds:
General Fund - The General Fund is the School District’s primary operating fund. It
accounts for all financial resources of the School District, except those required to be
accounted for in another fund.
Special Education Center Program Fund - The Special Education Center Program
Fund is a special revenue fund that is used to record all transactions associated with
special education center programs administered by the School District on behalf of the
ISD. The main sources of revenue for this fund are the tuition and PA-18 funds received
from the ISD and the special education funds received from the State. The Special
Education Center Program ceased operations at the end of June 30, 2015 and a majority
of the remaining funds were used to renovate a facility used entirely for special education
instruction. The remaining fund balance was transferred to the General Fund at June 30,
2016.
2015 Building and Site Fund - The 2015 Building and Site Fund is a Capital Projects
Fund used to record bond proceeds and other revenue and the disbursement of invoices
specifically related to the remodeling of buildings for safety and security improvements;
constructing additions to, equipping, furnishing, re-equipping, refurnishing, and
remodeling buildings, including classroom, auditorium, and media center improvements;
improving and developing sites, including outdoor athletic facilities, playgrounds and
structures; acquiring school buses; and acquiring and installing technology infrastructure
and equipment. The fund operates until the purpose for which it was created is
accomplished.

Farmington Public School District
Notes to Financial Statements
June 30, 2016
29
Note 1 - Summary of Significant Accounting Policies (Continued)
The School District reports the following nonmajor funds:
Nutrition Services Fund - The Nutrition Services Fund is a special revenue fund that is
used to record all transactions of food sales to pupils at all School District school
buildings. The main sources of revenue for this fund are food sales to pupils,
free/reduced breakfast and lunch reimbursement from federal funds, and funds received
from the State.
2005, 2013, and 2015 Debt Service Funds - The 2005, 2013, and 2015 Debt Service
Funds are used to record tax and interest revenue and the payment of interest, principal,
and other expenditures on long-term debt.
Technology/Other Projects Capital Project Fund - The Technology/Other Projects
Capital Project Fund is financed by support of the General Fund and is used for the
replacement and addition of computers and other related technology. The fund
operates until the purpose for which it was created is accomplished.
Maintenance/Bus Purchases Fund - The Maintenance/Bus Purchases Fund is a capital
projects fund that is financed by support of the General Fund and is used for purchasing
buses and funding maintenance projects throughout the School District. The fund
operates until the purpose for which it was created is accomplished.
Internal Service Fund - The Internal Service Fund accounts for benefit services
provided to other funds of the School District on a cost-reimbursement basis.
In addition, the School District maintains an Agency Fund. The Agency Fund is used to
record the transactions of student and community groups for school and school-related
purposes. The funds are segregated and held in trust for the students.
Assets, Liabilities, and Net Position or Equity
Deposits and Investments - Cash and cash equivalents include cash on hand, demand
deposits, and short-term investments with a maturity of three months or less when
acquired. Investments with an original maturity of greater than one year are stated at fair
value. Pooled investment income from each of the School District’s funds is generally
allocated to each fund using a weighted average of balance for the principal.
Receivables and Payables - In general, outstanding balances between funds are
reported as “due to/from other funds.” Activities between funds that are representative
of lending/borrowing arrangements outstanding at the end of the fiscal year are referred
to as “advances to/from other funds.”

Farmington Public School District
Notes to Financial Statements
June 30, 2016
30
Note 1 - Summary of Significant Accounting Policies (Continued)
All trade and property tax receivables are shown net of an allowance for uncollectible
amounts. The School District considers all accounts receivable to be fully collectible;
accordingly, no allowance for uncollectible amounts is recorded. Property taxes are
levied on July 1 for taxes due August 31 and December 1 for the remainder on the
taxable valuation of property as of the preceding December 31. Taxes are considered
delinquent on March 1 of the following year. At this time, penalties and interest are
assessed and the total obligation is added to the county tax rolls.
Inventories and Prepaid Costs - Inventories are valued at cost, on a first-in, first-out
basis. Inventories of governmental funds are recorded as expenditures when consumed
rather than when purchased. Certain payments to vendors reflect costs applicable to
future fiscal years and are recorded as prepaid costs in both government-wide and fund
financial statements. Prepaid costs of governmental funds are recorded as expenditures
when consumed rather than when purchased.
Restricted Assets - The unspent bond proceeds and related interest of the 2015
Building and Site Fund require amounts to be set aside for construction. In addition, the
unspent property taxes levied in the Debt Service Funds are required to be set aside for
future bond principal and interest. These amounts have been classified as restricted
assets.
Capital Assets - Capital assets, which include land, buildings, equipment, and vehicles,
are reported in the governmental activities column in the government-wide financial
statements. Capital assets are defined by the government as assets with an initial
individual cost of more than $5,000 and an estimated useful life in excess of one year.
Such assets are recorded at historical cost or estimated historical cost if purchased or
constructed. Donated capital assets are recorded at estimated fair market value at the
date of donation. Costs of normal repair and maintenance that do not add to the value
or materially extend asset life are not capitalized. The School District does not have
infrastructure-type assets.
Buildings, equipment, and vehicles are depreciated using the straight-line method over
the following useful lives:
Construction in progress and land are not depreciated. Construction in progress is
reclassified to the appropriate category once placed in service. It is then depreciated
according to the useful lives listed in the above table.
Buildings and building improvements 20-50 years
Buses and other vehicles 5-10 years
Furniture and equipment 5-10 years

Farmington Public School District
Notes to Financial Statements
June 30, 2016
31
Note 1 - Summary of Significant Accounting Policies (Continued)
Compensated Absences - The liability for compensated absences reported in the
government-wide statements consists of unpaid, accumulated annual vacation and sick
leave balances. The liability has been calculated using the vesting method in accordance
with the six collective bargaining agreements or employment contracts, in which leave
amounts for both employees who are currently eligible to receive termination payments
and other employees who are expected to become eligible in the future to receive such
payments upon termination are included.
Long-term Obligations - In the government-wide financial statements, long-term debt
and other long-term obligations are reported as liabilities in the statement of net
position. Bond premiums and discounts are deferred and amortized over the life of the
bonds using the effective interest method. Bonds payable are reported net of the
applicable bond premium or discount. Bond issuance costs are reported as debt service
expenditures.
The face amount of debt issued is reported as other financing sources. Premiums
received on debt issuances are reported as other financing sources while discounts are
reported as other financing uses. Issuance costs are reported as debt service
expenditures.
In the fund financial statements, governmental fund types recognize bond premiums and
discounts, as well as bond issuance costs, during the current period.
Deferred Outflows/Inflows of Resources - In addition to assets, the statement of net
position will sometimes report a separate section for deferred outflows of resources.
This separate financial statement element represents a consumption of net position or
fund balance that applies to a future period and so will not be recognized as an outflow of
resources (expense/expenditure) until then. The School District only has one item that
qualifies for reporting in this category. It is the deferred outflow related to the pension
plan.
In addition to liabilities, the statement of net position will sometimes report a separate
section for deferred inflows of resources. This separate financial statement element
represents an acquisition of net position that applies to a future period and so will not be
recognized as an inflow of resources (revenue) until that time. The School District has
three types of this item. The first item arises only under a modified accrual basis of
accounting, and is therefore only reported in the governmental funds balance sheet. The
governmental funds report unavailable revenue from grant and categorical aid payments
not collected during the period of availability. The second item, which arises only on the
government-wide statement of net position, is deferred inflows related to the pension
plan of $7,273,246. The third item, which arises only on the government-wide statement
of net position, is deferred inflows related to revenue in support of pension payments
made subsequent to the measurement date of $6,434,665 at June 30, 2016.
Farmington Public School District
Notes to Financial Statements
June 30, 2016
32
Note 1 - Summary of Significant Accounting Policies (Continued)
Fund Balance - In the fund financial statements, governmental funds report the
following components of fund balance:
Nonspendable: Amounts that are not in spendable form or are legally or contractually
required to be maintained intact
Restricted: Amounts that are legally restricted by outside parties, constitutional
provisions, or enabling legislation for use for a specific purpose
Committed: Amounts that have been formally set aside by the Board of Education for
use for specific purposes. Commitments are made and can be rescinded only via
resolution of the Board of Education.
Assigned: Intent to spend resources on specific purposes expressed by the Board of
Education or superintendent, who is authorized by policy approved by the Board of
Education to make assignments.
Unassigned: Amounts that do not fall into any other category above. This is the
residual classification for amounts in the General Fund and represents fund balance
that has not been assigned to other funds and has not been restricted, committed, or
assigned to specific purposes in the General Fund. In other governmental funds, only
negative unassigned amounts are reported, if any, and represent expenditures
incurred for specific purposes exceeding the amounts previously restricted,
committed, or assigned to those purposes.
The Board of Education has adopted a fund balance policy. The fund balance policy
prescribes the minimum fund balance as 8 percent to 12 percent of expenditures in the
General Fund. This is deemed to be the prudent amount to provide working capital to
meet cash flow needs and avoid borrowing, serve as a budget stabilization fund, and
provide for unanticipated or emergency expenditures.
Comparative Data - Comparative data is not included in the School District’s financial
statements.
Use of Estimates - The preparation of financial statements in conformity with
accounting principles generally accepted in the United States of America requires
management to make estimates and assumptions that affect the reported amounts of
assets and liabilities and disclosure of contingent assets and liabilities at the date of the
financial statements and the reported amounts of revenue and expenses during the
period. Actual results could differ from those estimates.

Farmington Public School District
Notes to Financial Statements
June 30, 2016
33
Note 1 - Summary of Significant Accounting Policies (Continued)
Pensions - For purposes of measuring the net pension liability, deferred outflows of
resources and deferred inflows of resources related to pensions, and pension expense,
information about the fiduciary net position of the Michigan Public School Employees’
Retirement System (MPSERS), and additions to/deductions from MPSERS fiduciary net
position have been determined on the same basis as they are reported by MPSERS.
MPSERS uses the economic resources measurement focus and the full accrual basis of
accounting. Contribution revenue is recorded as contributions are due, pursuant to legal
requirements. Benefit payments (including refunds of employee contributions) are
recognized as expense when due and payable in accordance with the benefit terms.
Related plan investments are reported at fair value.
Adoption of New Standard - As of June 30, 2016, the School District adopted
Governmental Accounting Standards Board (GASB) Statements No. 72, Fair Value
Measurement and Application, and No. 79, Certain External Investment Pools and Pool
Participants. GASB Statement No. 72 provides guidance for determining a fair value
measurement for reporting purposes and applying fair value to certain investments and
disclosures related to all fair value measurements. GASB Statement No. 79 provides
guidance for determining whether certain investment pools can continue to be
accounted for using amortized cost. The adoption did not have a significant impact on
amounts reported in the financial statements.
Note 2 - Stewardship, Compliance, and Accountability
Budgetary Information - Annual budgets are adopted on a basis consistent with
accounting principles generally accepted in the United States of America and state law for
the General Fund and special revenue funds. All annual appropriations lapse at fiscal year
end. The School District also elected to adopt annual budgets for its debt service funds
and capital projects funds.

Farmington Public School District
Notes to Financial Statements
June 30, 2016
34
Note 2 - Stewardship, Compliance, and Accountability (Continued)
The budget document presents information by fund and function. The legal level of
budgetary control adopted by the governing body (i.e., the level at which expenditures
may not legally exceed appropriations) is the function level. State law requires the School
District to have its budget in place by July 1. Expenditures in excess of amounts budgeted
are a violation of Michigan law. State law permits districts to amend their budgets during
the year. Two amendments to the General Fund, in December 2015 and June 2016,
were approved by the Board of Education during the year to accommodate significant
changes in revenue and expenditures expected. These changes were highlighted in the
required supplemental information of the General Fund budgetary highlights, and in
summary include revenue revisions totaling a net increase of approximately $0.8 million,
consisted mainly of a net increase in state funding of approximately $1.9 million to reflect
additional funding for retirement obligations, coupled with a loss in state funding of
approximately $0.9 million due to a larger than expected decline in pupils, a decrease in
local funding of approximately $0.7 million based upon revised property tax values and
reduced preschool tuition and pay-to-participate fees, a decrease of $0.6 million to adjust
to revised grant awards, and an increase in transfers in to transfer the remaining balance
in the Special Education Center Fund to the General Fund.
There were revisions made to the expenditures in the 2015-2016 General Fund original
budget. Budgeted expenditures were decreased by $2.3 million on a net basis due to a
decrease in wages and benefits which resulted from the District offering a severance
incentive reducing actual staffing in place, an increase in retirement costs for the UAAL
(unfunded accrued actuarial liability) costs, and adjustments of grant awards
Encumbrance accounting is employed in governmental funds. Encumbrances (e.g.,
purchase orders and contracts) outstanding at year end are reported as assignments of
fund balances and do not constitute expenditures or liabilities because the goods or
services have not been received as of year end; the commitments will be reappropriated
and honored during the subsequent year. Since all encumbrances are budgeted for in
2016-2017, no encumbrances are included in assigned fund balance at June 30, 2016.
Excess of Expenditures Over Appropriations in Budgeted Funds - The School
District had two functions where expenditures exceeded appropriations. The variance in
the general administration line relates to higher than expected legal costs. The other
variance in intergovernmental payments is due to slightly higher tuition costs paid to
other districts than originally anticipated.
Capital Projects Fund Compliance - The 2015 Building and Site Fund includes capital
project activities funded with bonds issued after May 1, 1994. For this capital project, the
School District has complied with the applicable provisions of §1351a of the State of
Michigan’s School Code.
Farmington Public School District
Notes to Financial Statements
June 30, 2016
35
Note 3 - Deposits and Investments
State statutes and the School District’s investment policy authorize the School District to
make deposits in the accounts of federally insured banks, credit unions, and savings and
loan associations that have offices in Michigan. The School District is allowed to invest in
U.S. Treasury or agency obligations, U.S. government repurchase agreements, bankers’
acceptances, commercial paper rated prime at the time of purchase that matures not
more than 270 days after the date of purchase, mutual funds, and investment pools that
are composed of authorized investment vehicles. The School District’s deposits are in
accordance with statutory authority.
The School District has designated one bank for the deposit of its funds.
There are no limitations or restrictions on participant withdrawals for the investment
pools that are recorded at amortized cost except for a one-day minimum investment
period. MAX Class investments may not be redeemed for at least 14 calendar days with
the exception of direct investments of funds distributed by the State of Michigan.
Redemptions made prior to the applicable 14-day period are subject to a penalty equal to
15 days’ interest on the amount so redeemed.
The School District’s cash and investments are subject to several types of risk, which are
examined in more detail below:
Custodial Credit Risk of Bank Deposits
Custodial credit risk is the risk that in the event of a bank failure, the School District’s
deposits may not be returned to it. The School District’s investment policy requires that
financial institutions be evaluated and only those with an acceptable risk level be used for
the School District’s deposits for custodial credit risk. The School District evaluates each
financial institution with which it deposits funds and assesses the level of risk of each
institution; only those institutions with an acceptable estimated risk level are used as
depositories. At June 30, 2016, the School District did not have any deposit balances.
Custodial Credit Risk of Investments
Custodial credit risk is the risk that, in the event of the failure of the counterparty, the
School District will not be able to recover the value of its investments or collateral
securities that are in the possession of an outside party. The School District’s policy for
custodial credit risk states that custodial credit risk will be minimized by limiting
investments to the types of securities allowed by state law and by pre-qualifying the
financial institutions, broker/dealers, intermediaries, and advisors with which the School
District will do business using the criteria established in the investment policy. The
School District does not have investments with custodial credit risk.

Farmington Public School District
Notes to Financial Statements
June 30, 2016
36
Note 3 - Deposits and Investments (Continued)
Interest Rate Risk
Interest rate risk is the risk that the value of investments will decrease as a result of a rise
in interest rates. The School District’s investment policy does not restrict investment
maturities, other than commercial paper which can only be purchased with a 270-day
maturity. The School District’s policy minimizes interest rate risk by structuring the
investment portfolio so that securities mature to meet cash requirements for ongoing
operations, thereby avoiding the need to sell securities in the open market; investing
operating funds primarily in shorter-term securities, liquid asset funds, money market
mutual funds, or similar investment pools; and limiting the average maturity in
accordance with the School District’s cash requirements.
Credit Risk
State law limits investments in commercial paper to the top two ratings issued by
nationally recognized statistical rating organizations. The School District’s investment
policy only allows purchases of commercial paper with ratings of A1/P1 and AA/Aa.
At year end, the credit quality ratings of securities (other than the U.S. government) are
as follows:
Investment Value Maturities Rating
Rating
Organization
Michigan Liquid Asset Fund - Cash Management Class 27,582,516$ N/A 2a7 like pool AAAm S&P
Michigan Liquid Asset Fund - Max Class 12,661,584 N/A AAAm S&P
Federal National Mortgage Association Global Notes 8,418,146 6/12/2017 AA+ S&P
Federal Home Loan Bank Global Notes 5,518,844 8/28/2017 AA+ S&P
Federal Home Loan Bank Global Bonds 1,903,946 5/17/2017 AA+ S&P
Freddie Mac Global Notes 6,651,670 9/29/2017 AA+ S&P
Federal Home Loan Mortgage Global Notes 2,591,827 11/17/2017 AA+ S&P
Federal Home Loan Bank Global Notes 1,422,311 12/19/2017 AA+ S&P
Federal Home Loan Mortgage Notes 1,227,100 1/12/2018 AA+ S&P
RaboBank USA Fin Corp Commercial Paper 3,128,973 7/29/2016 A-1 S&P
Toyota Motor Credit Corp Commercial Paper 1,998,054 8/31/2016 A-1+ S&P
BNP Paribas NY Commercial Paper 4,216,316 8/31/2016 A-1 S&P
Toyota Motor Credit Corp Commercial Paper 1,997,120 9/22/2016 A-1+ S&P
JP Morgan Securities LLC Commercial Paper 3,994,948 9/23/2016 A-1 S&P
U.S. Treasury Notes 3,883,030 10/15/2016 AA+ S&P
U.S. Treasury Notes 2,232,179 11/15/2016 AA+ S&P
U.S. Treasury Notes 1,196,631 12/31/2016 AA+ S&P
U.S. Treasury Notes 1,670,708 1/31/2017 AA+ S&P
U.S. Treasury Notes 4,550,996 10/31/2017 AA+ S&P
Total investments 96,846,899$

Farmington Public School District
Notes to Financial Statements
June 30, 2016
37
Note 3 - Deposits and Investments (Continued)
Concentration of Credit Risk
The School District uses a pooled fund with Michigan Liquid Asset Fund (MILAF) for all of
its cash accounts. A maximum of 30 percent of available funds may be invested in any
one issuer. Since MILAF is a pooled fund, it is not considered a single issuer under School
District policy. The investment advisor for the MILAF pool manages the investments
under Rule 2a-7, which applies to money market funds, of the Securities and Exchange
Commission’s Investment Act of 1940; however, there is no regulatory oversight for the
investment pool. The pool shares are monitored daily using a net asset value shock
test. This daily test ensures the fair value of the pool shares and removes the risk of the
share value dipping below a value of 1.0. The School District’s policy minimizes
concentration of credit risk by requiring diversification of the investment portfolio so that
the impact of potential losses from any one type of security or issuer will be
minimized. More than 5 percent of the School District’s investments are invested in the
following:
Investment Value
Percentage
of Total
Investments
Mortgage-backed securities 27,733,844$ 28.64
Commercial paper 15,335,411 15.83
U.S. Treasury notes 13,533,544 13.97
Total 56,602,799$ 58.44
Foreign Currency Risk
Foreign currency risk is the risk that an investment denominated in the currency of a
foreign country could reduce its U.S. dollar value as a result of changes in foreign
currency exchange rates. State law and the School District’s policy prohibit investment in
foreign currency.
Note 4 - Fair Value Measurement
The School District categorizes its fair value measurements within the fair value
hierarchy established by generally accepted accounting principles. The hierarchy is based
on the valuation inputs used to measure the fair value of the asset. Level 1 inputs are
quoted prices in active markets for identical assets; Level 2 inputs are significant other
observable inputs; Level 3 inputs are significant unobservable inputs. Investments that
are measured at fair value using the net asset value per share (or its equivalent) as a
practical expedient are not classified in the fair value hierarchy below.

Farmington Public School District
Notes to Financial Statements
June 30, 2016
38
Note 4 - Fair Value Measurement (Continued)
In instances where inputs used to measure fair value fall into different levels in the above
fair value hierarchy, fair value measurements in their entirety are categorized based on
the lowest level input that is significant to the valuation. The School District’s assessment
of the significance of particular inputs to these fair value measurements requires
judgment and considers factors specific to each asset or liability.
The School District has the following recurring fair value measurements as of June 30,
2016:
Balance at
June 30, 2016
Quoted Prices in
Active Markets
for Identical
Assets (Level 1)
Significant Other
Observable Inputs
(Level 2)
Significant
Unobservalbe
Inputs
(Level 3)
Mortgage-backed securities 27,733,844$ -$ 27,733,844$ -$
U.S. Treasury securities 6,221,704 - 6,221,704 -
Total 33,955,548$ -$ 33,955,548$ -$
Fair Value Measurement Using
The fair value of mortgage-backed securities and U.S. Treasury securities at June 30,
2016 was determined primarily based on Level 2 inputs. The School District estimates
the fair value of these investments at market value using other inputs such as interest
rates and yield curves that are observable at commonly quoted intervals.
Note 5 - Unavailable/Unearned Revenue
Governmental funds report unavailable revenue in connection with receivables for
revenue that is not considered to be available to liquidate liabilities of the current period.
Governmental funds also defer unearned revenue recognition in connection with
resources that have been received but not yet earned. At the end of the current fiscal
year, the various components of unearned and unavailable revenue are as follows:
Deferred
Inflow -
Unavailable
Liability -
Unearned
Tuition and other - $ 667,966$
Grant and categorical aid payment
to meeting all eligibility requirements - 51,873
Total - $ 719,839$

Farmington Public School District
Notes to Financial Statements
June 30, 2016
39
Note 6 - Capital Assets
Capital asset activity of the School District’s governmental activities was as follows:
Depreciation expense was charged to the following governmental activities for the year
ended June 30, 2016:
Governmental activities:
Instruction 909,057$
Support services 984,952
Community services 22,092
Unallocated 2,991,551
Total governmental activities 4,907,652$
The School District considers many assets to impact multiple activities; therefore,
allocation is not practical. The depreciation expense for these assets has been classified
as unallocated.
Balance
June 30, 2015
Reclassi-
fications Additions
Disposals and
Adjustments
Balance
June 30, 2016
Assets not being depreciated:
Land 987,345$ - $ - $ 4,047$ 983,298$
Construction in progress 86,221 (81,093) 6,470,586 - 6,475,714
Subtotal - Assets not being depreciated 1,073,566 (81,093) 6,470,586 4,047 7,459,012
Capital assets being depreciated:
Buildings and building improvements 169,516,065 81,093 2,105,347 55,481 171,647,024
Buses and other vehicles 10,267,097 - 778,922 218,851 10,827,168
Furniture and equipment 11,994,189 - 271,426 99,900 12,165,715
Subtotal - Capital assets being depreciated 191,777,351 81,093 3,155,695 374,232 194,639,907
Accumulated depreciation:
Buildings and building improvements 68,480,122 - 3,619,613 22,033 72,077,702
Buses and other vehicles 8,520,435 - 719,899 218,851 9,021,483
Furniture and equipment 9,667,389 - 568,140 85,905 10,149,624
Subtotal - Accumulated depreciation 86,667,946 - 4,907,652 326,789 91,248,809
Net capital assets being depreciated 105,109,405 81,093 (1,751,957) 47,443 103,391,098
Net capital assets 106,182,971$ - $ 4,718,629$ 51,490$ 110,850,110$

Farmington Public School District
Notes to Financial Statements
June 30, 2016
40
Note 6 - Capital Assets (Continued)
Construction Commitments - The School District has active construction projects at
year end for the 2015 Bond Issue. At year end, the School District’s commitments with
contractors are as follows:
Spent to Date
Remaining
Commitment
2015 Bond Issue 9,437,519$ 34,103,355$
Note 7 - Interfund Receivables, Payables, and Transfers
The composition of interfund balances is as follows:
Receivable Fund Payable Fund Amount
Due to/from other funds:
General Fund Nonmajor governmental funds 232,371$
General Fund Fiduciary Fund 36,180
Internal Service Fund General Fund 673,361
Special Education Center Fund General Fund 25,815
Nonmajor governmental funds General Fund 68,832
Total 1,036,559$
The General Fund maintains the majority of the cash and investment accounts.
Interfund balances are created upon recording of the revenue and expenditures for each
applicable fund. All interfund balances are expected to be repaid within one year. The
General Fund disburses funds on behalf of the Fiduciary Fund and is reimbursed
accordingly.
Interfund Transfers
Special
Education
Center
Program
Nonmajor
Governmental
Funds Total
Transfers in:
General Fund 67,493$ 178,945$ 246,438$
Nonmajor governmental funds - 20,517 20,517
Total 67,493$ 199,462$ 266,955$
Transfers Out

Farmington Public School District
Notes to Financial Statements
June 30, 2016
41
Note 7 - Interfund Receivables, Payables, and Transfers (Continued)
The Special Education Center Program Fund ceased operations at June 30, 2015 and a
majority of the remaining funds were utilized for capital improvements in a special
education facility during the 2015-2016 school year. The remaining balance in the fund
was transferred to the General Fund to support non-center special education costs.
Nutrition Services Funds are transferred to the General Fund to cover excess costs
related to operations for the Nutrition Services Fund. The liability for the 2005 Debt
Service bonds was removed during the prior year as a result of the issuance of general
obligation bonds. As a result, the remaining fund balance in the 2005 Debt Service Fund
was transferred to the 2015 Debt Service Fund.
Note 8 - Long-term Debt
The School District issues bonds, notes, and other contractual commitments to provide
for the acquisition and construction of major capital facilities and the acquisition of certain
equipment. General obligation bonds are direct obligations and pledge the full faith and
credit of the School District. Qualified bonds are fully guaranteed by the State of
Michigan. Notes and installment purchase agreements are also general obligations of the
School District. Other long-term obligations include compensated absences, termination
benefits, and certain risk liabilities.
Bonds are liquidated using the debt service funds. Compensated absences and workers’
compensation are liquidated in the governmental fund which pays for the applicable
employee’s salary and benefits. These governmental funds include the General Fund and
the Nutrition Services Fund.
Long-term obligation activity can be summarized as follows:
Balance
July 1, 2015 Additions Reductions
Balance
June 30, 2016
Due Within One
Year 2016
Governmental activities:
Bonds 90,170,000$ - $ (7,215,000)$ 82,955,000$ 7,430,000$
Bond premium 10,020,348 - (878,200) 9,142,148 864,306
Total bonds payable 100,190,348 - (8,093,200) 92,097,148 8,294,306
Compensated absences 3,576,055 - (129,258) 3,446,797 722,795
Voluntary severance incentive 5,080,368 10,000 (1,730,713) 3,359,655 1,687,968
Workers' compensation 722,078 632,381 (891,370) 463,089 463,089
Total governmental activities 109,568,849$ 642,381$ (10,844,541)$ 99,366,689$ 11,168,158$
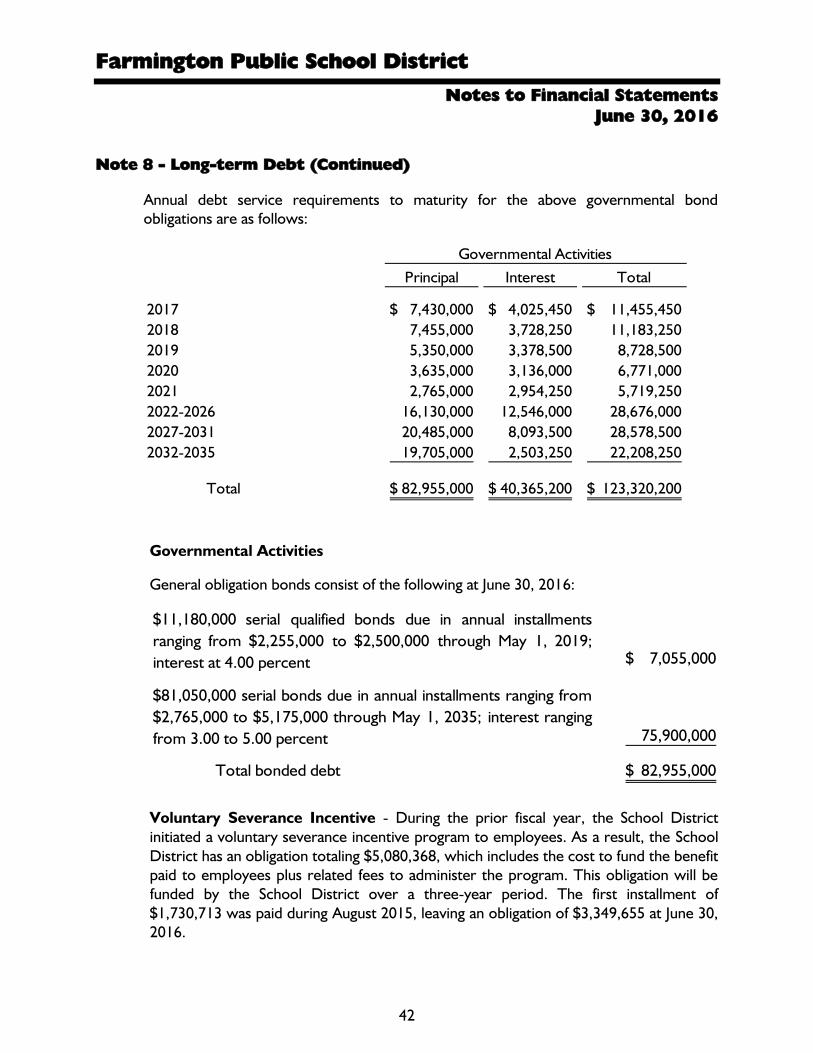
Farmington Public School District
Notes to Financial Statements
June 30, 2016
42
Note 8 - Long-term Debt (Continued)
Annual debt service requirements to maturity for the above governmental bond
obligations are as follows:
Governmental Activities
Principal Interest Total
2017 7,430,000$ 4,025,450$ 11,455,450$
2018 7,455,000 3,728,250 11,183,250
2019 5,350,000 3,378,500 8,728,500
2020 3,635,000 3,136,000 6,771,000
2021 2,765,000 2,954,250 5,719,250
2022-2026 16,130,000 12,546,000 28,676,000
2027-2031 20,485,000 8,093,500 28,578,500
2032-2035 19,705,000 2,503,250 22,208,250
Total 82,955,000$ 40,365,200$ 123,320,200$
Governmental Activities
General obligation bonds consist of the following at June 30, 2016:
$11,180,000 serial qualified bonds due in annual installments
ranging from $2,255,000 to $2,500,000 through May 1, 2019;
interest at 4.00 percent 7,055,000$
$81,050,000 serial bonds due in annual installments ranging from
$2,765,000 to $5,175,000 through May 1, 2035; interest ranging
from 3.00 to 5.00 percent 75,900,000
Total bonded debt 82,955,000$
Voluntary Severance Incentive - During the prior fiscal year, the School District
initiated a voluntary severance incentive program to employees. As a result, the School
District has an obligation totaling $5,080,368, which includes the cost to fund the benefit
paid to employees plus related fees to administer the program. This obligation will be
funded by the School District over a three-year period. The first installment of
$1,730,713 was paid during August 2015, leaving an obligation of $3,349,655 at June 30,
2016.
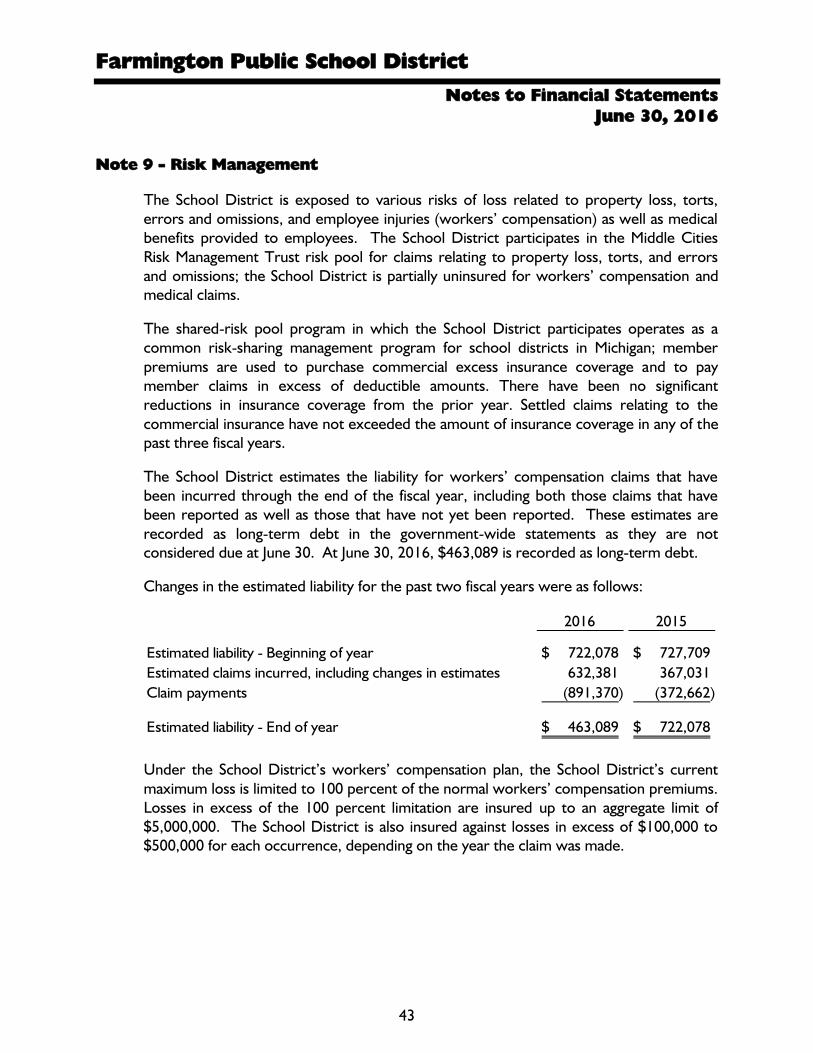
Farmington Public School District
Notes to Financial Statements
June 30, 2016
43
Note 9 - Risk Management
The School District is exposed to various risks of loss related to property loss, torts,
errors and omissions, and employee injuries (workers’ compensation) as well as medical
benefits provided to employees. The School District participates in the Middle Cities
Risk Management Trust risk pool for claims relating to property loss, torts, and errors
and omissions; the School District is partially uninsured for workers’ compensation and
medical claims.
The shared-risk pool program in which the School District participates operates as a
common risk-sharing management program for school districts in Michigan; member
premiums are used to purchase commercial excess insurance coverage and to pay
member claims in excess of deductible amounts. There have been no significant
reductions in insurance coverage from the prior year. Settled claims relating to the
commercial insurance have not exceeded the amount of insurance coverage in any of the
past three fiscal years.
The School District estimates the liability for workers’ compensation claims that have
been incurred through the end of the fiscal year, including both those claims that have
been reported as well as those that have not yet been reported. These estimates are
recorded as long-term debt in the government-wide statements as they are not
considered due at June 30. At June 30, 2016, $463,089 is recorded as long-term debt.
Changes in the estimated liability for the past two fiscal years were as follows:
2016 2015
Estimated liability - Beginning of year 722,078$ 727,709$
Estimated claims incurred, including changes in estimates 632,381 367,031
Claim payments (891,370) (372,662)
Estimated liability - End of year 463,089$ 722,078$
Under the School District’s workers’ compensation plan, the School District’s current
maximum loss is limited to 100 percent of the normal workers’ compensation premiums.
Losses in excess of the 100 percent limitation are insured up to an aggregate limit of
$5,000,000. The School District is also insured against losses in excess of $100,000 to
$500,000 for each occurrence, depending on the year the claim was made.
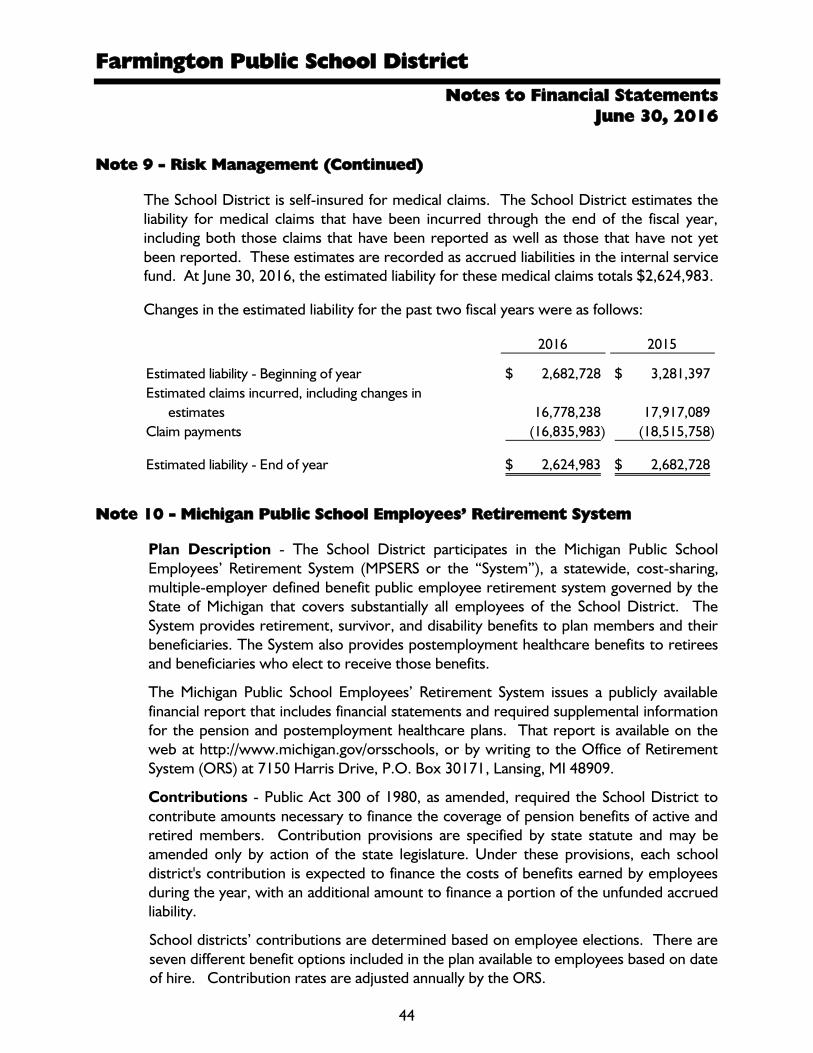
Farmington Public School District
Notes to Financial Statements
June 30, 2016
44
Note 9 - Risk Management (Continued)
The School District is self-insured for medical claims. The School District estimates the
liability for medical claims that have been incurred through the end of the fiscal year,
including both those claims that have been reported as well as those that have not yet
been reported. These estimates are recorded as accrued liabilities in the internal service
fund. At June 30, 2016, the estimated liability for these medical claims totals $2,624,983.
Changes in the estimated liability for the past two fiscal years were as follows:
2016 2015
Estimated liability - Beginning of year 2,682,728$ 3,281,397$
Estimated claims incurred, including changes in
estimates 16,778,238 17,917,089
Claim payments (16,835,983) (18,515,758)
Estimated liability - End of year 2,624,983$ 2,682,728$
Note 10 - Michigan Public School Employees’ Retirement System
Plan Description - The School District participates in the Michigan Public School
Employees’ Retirement System (MPSERS or the “System”), a statewide, cost-sharing,
multiple-employer defined benefit public employee retirement system governed by the
State of Michigan that covers substantially all employees of the School District. The
System provides retirement, survivor, and disability benefits to plan members and their
beneficiaries. The System also provides postemployment healthcare benefits to retirees
and beneficiaries who elect to receive those benefits.
The Michigan Public School Employees’ Retirement System issues a publicly available
financial report that includes financial statements and required supplemental information
for the pension and postemployment healthcare plans. That report is available on the
web at http://www.michigan.gov/orsschools, or by writing to the Office of Retirement
System (ORS) at 7150 Harris Drive, P.O. Box 30171, Lansing, MI 48909.
Contributions - Public Act 300 of 1980, as amended, required the School District to
contribute amounts necessary to finance the coverage of pension benefits of active and
retired members. Contribution provisions are specified by state statute and may be
amended only by action of the state legislature. Under these provisions, each school
district's contribution is expected to finance the costs of benefits earned by employees
during the year, with an additional amount to finance a portion of the unfunded accrued
liability.
School districts’ contributions are determined based on employee elections. There are
seven different benefit options included in the plan available to employees based on date
of hire. Contribution rates are adjusted annually by the ORS.

Farmington Public School District
Notes to Financial Statements
June 30, 2016
45
Note 10 - Michigan Public School Employees’ Retirement System
(Continued)
The range of rates is as follows:
School District
October 1, 2014 - September 30, 2015 18.76% - 23.07%
October 1, 2015 - June 30, 2016 14.56% - 18.95%
Depending on the plan selected, plan member contributions range from 0 percent up to
7.0 percent of gross wages. Plan members electing into the defined contribution plan
are not required to make additional contributions.
The School District’s required and actual contributions to the plan for the year ended
June 30, 2016 was $21,245,174. The School District’s required and actual contributions
include an allocation of $6,736,161 of revenue received from the State of Michigan, and
remitted to the System, to fund the MPSERS Unfunded Actuarial Accrued Liability
(UAAL) Stabilization Rate for the year ended June 30, 2016.
Benefits Provided - Benefit provisions of the defined benefit pension plan are
established by state statute, which may be amended. Public Act 300 of 1980, as
amended, establishes eligibility and benefit provisions for the defined benefit (DB)
pension plan.
Depending on the plan option selected, member retirement benefits are calculated as
final average compensation times years of service times a pension factor ranging from
1.25 percent to 1.50 percent. The requirements to retire range from attaining the age
of 46 to 60 with years of service ranging from 5 to 30 years, depending on when the
employee became a member. Early retirement is computed in the same manner as a
regular pension, but is permanently reduced 0.50 percent for each full and partial month
between the pension effective date and the date the member will attain age 60. There
is no mandatory retirement age.
Members are eligible for non-duty disability benefits after 10 years of service and for
duty-related disability benefits upon date of hire. Disability retirement benefits are
determined in the same manner as retirement benefits but are payable immediately
without an actuarial reduction. The disability benefits plus authorized outside earnings
are limited to 100 percent of the participant’s final average compensation with an
increase of 2 percent each year thereafter.
Benefits may transfer to a beneficiary upon death and are determined in the same
manner as retirement benefits, but with an actuarial reduction.

Farmington Public School District
Notes to Financial Statements
June 30, 2016
46
Note 10 - Michigan Public School Employees’ Retirement System
(Continued)
Benefit terms provide for annual cost-of-living adjustments to each employee’s
retirement allowance subsequent to the employee’s retirement date. The annual
adjustment, if applicable, is 3 percent. For some members who do not receive an
annual increase, they are eligible to receive a supplemental payment in those years when
investment earnings exceed actuarial assumptions.
Net Pension Liability, Deferrals, and Pension Expense - At June 30, 2016, the
School District reported a liability of $236,872,217 for its proportionate share of the net
pension liability. The net pension liability was measured as of September 30, 2015 and
the total pension liability used to calculate the net pension liability was determined by an
actuarial valuation as of September 30, 2014, which used updated procedures to roll
forward the estimated liability to September 30, 2015. The School District’s proportion
of the net pension liability was based on a projection of its long-term share of
contributions to the pension plan relative to the projected contributions of all
participating reporting units, actuarially determined. At September 30, 2015, the School
District’s proportion was 0.969793 percent.
For the year ended June 30, 2016, the School District recognized pension expense of
$18,397,593, exclusive of payments to fund the MPSERS UAAL Stabilization Rate. At
June 30, 2016, the School District reported deferred outflows of resources and deferred
inflows of resources related to pensions from the following sources:
Deferred Outflows
of Resources
Deferred Inflows of
Resources
Difference between expected and actual
experience $ - $ (784,590)
Changes of assumptions 5,832,296 -
Net difference between projected and
actual earnings on pension plan assets 1,209,042 -
Changes in proportion and differences
between the School District's
contributions and proportionate share of
contributions 456,952 (6,488,656)
The School District's contributions
subsequent to the measurement date 17,158,283 -
Total $ 24,656,573 $ (7,273,246)

Farmington Public School District
Notes to Financial Statements
June 30, 2016
47
Note 10 - Michigan Public School Employees’ Retirement System
(Continued)
Amounts reported as deferred outflows of resources and deferred inflows of resources
related to pensions will be recognized in pension expense as follows:
Years Ending
June 30 Amount
2017 $ (958,496)
2018 (958,496)
2019 (1,274,781)
2020 3,416,817
2021 -
Thereafter -
Total $ 225,044
In addition, the contributions subsequent to the measurement date will be included as a
reduction of the net pension liability in the next year.
Actuarial Assumptions - The total pension liability as of September 30, 2015 is based
on the results of an actuarial valuation date of September 30, 2014 and rolled forward:
Actuarial cost method Entry age normal cost actuarial cost method
Investment rate of return 7.00 to 8.00%, net of investment expenses based on the
groups
Salary increases 3.50 - 12.3%, including wage inflation of 3.5%
Mortality basis RP2000 Combined Healthy Mortality Table, adjusted for
mortality improvements to 2025 using projection scale BB
Cost of living pension
adjustments 3% annual non-compounded for MIP members
The actuarial assumptions used for the September 30, 2014 valuation were based on the
results of an actuarial experience study for the period from October 1, 2007 to
September 30, 2012. As a result of this study, the actuarial assumptions were adjusted
to more closely reflect actual experience.
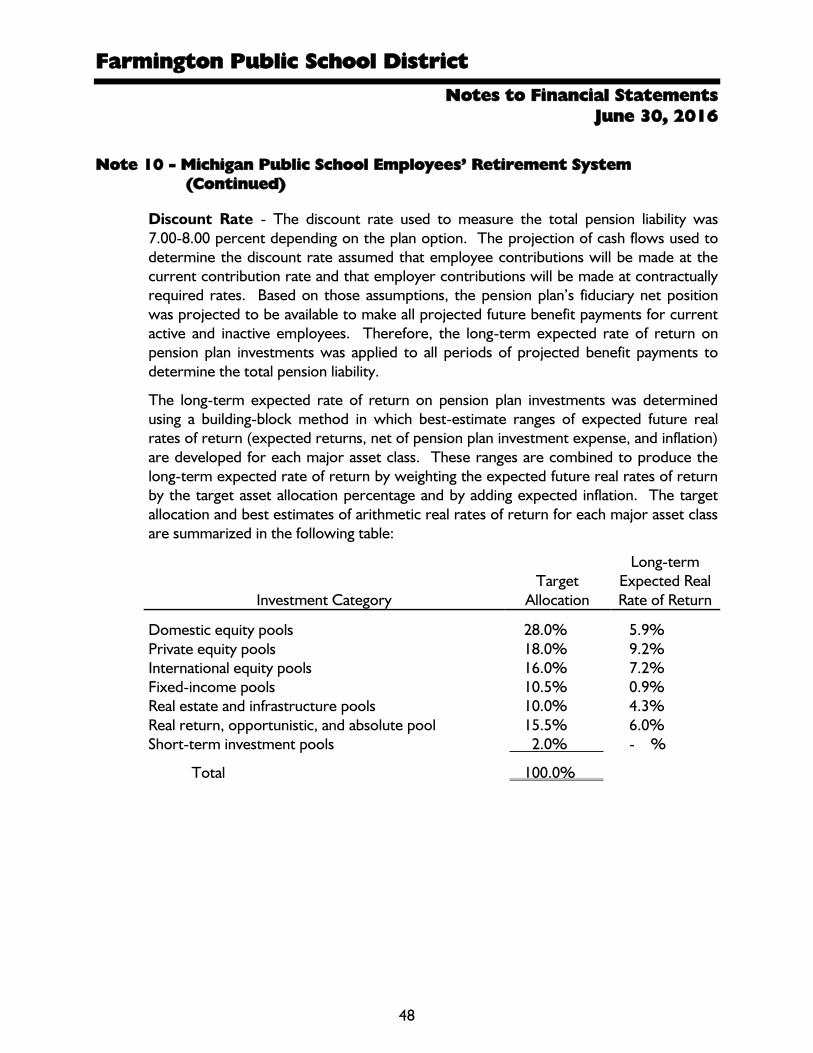
Farmington Public School District
Notes to Financial Statements
June 30, 2016
48
Note 10 - Michigan Public School Employees’ Retirement System
(Continued)
Discount Rate - The discount rate used to measure the total pension liability was
7.00-8.00 percent depending on the plan option. The projection of cash flows used to
determine the discount rate assumed that employee contributions will be made at the
current contribution rate and that employer contributions will be made at contractually
required rates. Based on those assumptions, the pension plan’s fiduciary net position
was projected to be available to make all projected future benefit payments for current
active and inactive employees. Therefore, the long-term expected rate of return on
pension plan investments was applied to all periods of projected benefit payments to
determine the total pension liability.
The long-term expected rate of return on pension plan investments was determined
using a building-block method in which best-estimate ranges of expected future real
rates of return (expected returns, net of pension plan investment expense, and inflation)
are developed for each major asset class. These ranges are combined to produce the
long-term expected rate of return by weighting the expected future real rates of return
by the target asset allocation percentage and by adding expected inflation. The target
allocation and best estimates of arithmetic real rates of return for each major asset class
are summarized in the following table:
Investment Category
Target
Allocation
Long-term
Expected Real
Rate of Return
Domestic equity pools 28.0% 5.9%
Private equity pools 18.0% 9.2%
International equity pools 16.0% 7.2%
Fixed-income pools 10.5% 0.9%
Real estate and infrastructure pools 10.0% 4.3%
Real return, opportunistic, and absolute pool 15.5% 6.0%
Short-term investment pools 2.0% - %
Total 100.0%
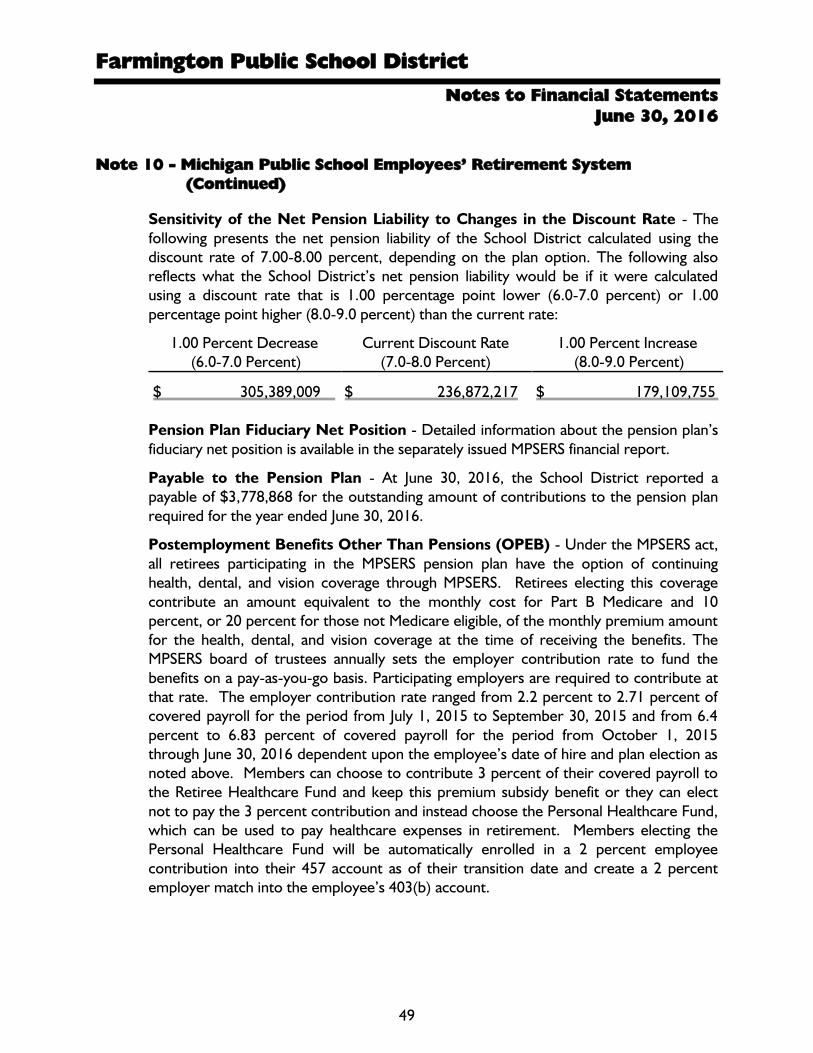
Farmington Public School District
Notes to Financial Statements
June 30, 2016
49
Note 10 - Michigan Public School Employees’ Retirement System
(Continued)
Sensitivity of the Net Pension Liability to Changes in the Discount Rate - The
following presents the net pension liability of the School District calculated using the
discount rate of 7.00-8.00 percent, depending on the plan option. The following also
reflects what the School District’s net pension liability would be if it were calculated
using a discount rate that is 1.00 percentage point lower (6.0-7.0 percent) or 1.00
percentage point higher (8.0-9.0 percent) than the current rate:
1.00 Percent Decrease
(6.0-7.0 Percent)
Current Discount Rate
(7.0-8.0 Percent)
1.00 Percent Increase
(8.0-9.0 Percent)
$ 305,389,009 $ 236,872,217 $ 179,109,755
Pension Plan Fiduciary Net Position - Detailed information about the pension plan’s
fiduciary net position is available in the separately issued MPSERS financial report.
Payable to the Pension Plan - At June 30, 2016, the School District reported a
payable of $3,778,868 for the outstanding amount of contributions to the pension plan
required for the year ended June 30, 2016.
Postemployment Benefits Other Than Pensions (OPEB) - Under the MPSERS act,
all retirees participating in the MPSERS pension plan have the option of continuing
health, dental, and vision coverage through MPSERS. Retirees electing this coverage
contribute an amount equivalent to the monthly cost for Part B Medicare and 10
percent, or 20 percent for those not Medicare eligible, of the monthly premium amount
for the health, dental, and vision coverage at the time of receiving the benefits. The
MPSERS board of trustees annually sets the employer contribution rate to fund the
benefits on a pay-as-you-go basis. Participating employers are required to contribute at
that rate. The employer contribution rate ranged from 2.2 percent to 2.71 percent of
covered payroll for the period from July 1, 2015 to September 30, 2015 and from 6.4
percent to 6.83 percent of covered payroll for the period from October 1, 2015
through June 30, 2016 dependent upon the employee’s date of hire and plan election as
noted above. Members can choose to contribute 3 percent of their covered payroll to
the Retiree Healthcare Fund and keep this premium subsidy benefit or they can elect
not to pay the 3 percent contribution and instead choose the Personal Healthcare Fund,
which can be used to pay healthcare expenses in retirement. Members electing the
Personal Healthcare Fund will be automatically enrolled in a 2 percent employee
contribution into their 457 account as of their transition date and create a 2 percent
employer match into the employee’s 403(b) account.

Farmington Public School District
Notes to Financial Statements
June 30, 2016
50
Note 10 - Michigan Public School Employees’ Retirement System
(Continued)
The School District’s required and actual contributions to the plan for retiree healthcare
benefits for the years ended June 30, 2016, 2015, and 2014 were $4,309,496,
$3,478,315, and $7,302,292, respectively. In addition, a portion ranging from 35-100
percent of the the MPSERS Unfunded Actuarial Accrued Liability (UAAL) Stabilization
Rate is considered a contribution to the retiree healthcare plan.
Note 11 - State Aid Anticipation Nots
At June 30, 2016, the School District had the following state aid anticipation notes
outstanding:
July 1, 2015 Additions Reductions June 30, 2016
$1,687,500 state aid anticipation note due August 20,
2015; effective interest at 1.313 percent 1,687,500$ -$ (1,687,500)$ -$
$2,062,500 state aid anticipation note due August 20,
2015; effective interest at 1.313 percent 2,062,500 - (2,062,500) -
$3,750,000 state aid anticipation note due in seven
monthly installments, including interest, ranging from
$535,889 to $535,714; starting January 20, 2015
through July 20, 2015; effective interest at 0.688
percent 535,714 - (535,714) -
$2,142,157 state aid anticipation note due August 20,
2016; effective interest at 1.462 percent - 2,142,157 - 2,142,157 -
$2,857,843 state aid anticipation note due August 20,
2016; effective interest at 1.4625 percent - 2,857,843 - 2,857,843
$2,514,407 state aid anticipation note due in seven
monthly installments, including interest, ranging from
$359,429 to $359,201, starting January 20, 2016
through July 20, 2016; effective interest at 0.992
percent - 2,514,407 (2,155,206) 359,201
$1,185,593 state aid anticipation note due in seven
monthly installments, including interest, ranging from
$169,461 to $169,370, starting January 20, 2016
through July 20, 2016; effective interest at 0.992
percent - 1,185,593 (1,016,223) 169,370
Total 4,285,714$ 8,700,000$ (7,457,143)$ 5,528,571$
At June 30, 2016, the School District has accrued interest of $318 on these notes.
These notes were paid off on their respective due dates.

Farmington Public School District
Notes to Financial Statements
June 30, 2016
51
Note 12 - Upcoming Accounting Pronouncements
In June 2015, the GASB issued Statement No. 75, Accounting and Financial Reporting for
Postemployment Benefits Other Than Pensions, which addresses reporting by
governments that provide postemployment benefits other than pensions (OPEB) to
their employees and for governments that finance OPEB for employees of other
governments. This OPEB standard will require the School District to recognize on the
face of the financial statements its proportionate share of the net OPEB liability related
to its participation in the MPSERS plan. The statement also enhances accountability and
transparency through revised note disclosures and required supplemental information
(RSI). The School District is currently evaluating the impact this standard will have on
the financial statements when adopted. The provisions of this statement are effective for
the School District’s financial statements for the year ending June 30, 2018.

Required Supplemental Information

Farmington Public School District
52
Required Supplemental Information
Budgetary Comparison Schedule - General Fund
Year Ended June 30, 2016
Original
Budget
Final
Budget Actual
Over (Under) Final
Budget
Revenue
Local sources 44,408,886$ 43,613,165$ 43,577,594$ (35,571)$
State sources 80,227,315 82,126,641 81,868,313 (258,328)
Federal sources 5,051,618 4,428,969 4,090,646 (338,323)
Interdistrict sources 11,581,188 11,734,312 11,737,572 3,260
Total revenue 141,269,007 141,903,087 141,274,125 (628,962)
Expenditures
Current:
Instruction:
Basic programs 67,458,117 67,349,633 67,213,387 (136,246)
Added needs 19,035,514 18,643,651 18,265,131 (378,520)
Adult and continuing education 87,695 92,434 70,090 (22,344)
Support services:
Pupil 15,350,976 14,448,829 13,844,453 (604,376)
Instructional staff 6,185,717 5,216,854 4,471,198 (745,656)
General administration 1,140,473 1,292,805 1,392,791 99,986
School administration 7,470,246 7,281,951 7,200,048 (81,903)
Business services 1,630,509 1,429,134 1,356,190 (72,944)
Operation and maintenance 10,875,752 10,954,162 9,980,530 (973,632)
Transportation 6,659,839 6,690,882 6,415,714 (275,168)
Central services 3,382,819 3,583,391 3,537,499 (45,892)
Community services 1,445,536 1,616,435 1,496,704 (119,731)
Athletics 1,841,422 1,821,878 1,788,212 (33,666)
Intergovernmental payments 876,174 676,186 678,074 1,888
Capital outlay - - - -
Total expenditures 143,440,789 141,098,225 137,710,021 (3,388,204)
Other Financing Sources (Uses)
Transfers in 155,800 255,267 246,438 (8,829)
Proceeds from sale of capital assets 545,000 545,000 532,260 (12,740)
Total other financing
sources 700,800 800,267 778,698 (21,569)
Net Change in Fund Balance (1,470,982) 1,605,129 4,342,802 2,737,673
Fund Balance - Beginning of year 8,359,728 8,359,728 8,359,728 -
Fund Balance - End of year 6,888,746$ 9,964,857$ 12,702,530$ 2,737,673$
Note 1 : The budget has been adopted on a basis consistent with accounting principles generally accepted in the United States
of America.
Note 2: The original adopted budget included payments from other districts in the amount of $11,581,188 within other financing
sources. The final adopted budget and actual results included these payments within interdistrict sources. The original
budgeted amounts have been reclassified from other financing sources to interdistrict sources to align with final adopted
budget and actual results.

Farmington Public School District
53
Required Supplemental Information
Budgetary Comparison Schedule - Special Education
Center Program Fund
Year Ended June 30, 2016
Original
Budget
Final
Budget Actual
Over (Under)
Final Budget
Revenue
State sources - $ - $ - $ - $
Interdistrict sources - - - -
Total revenue - - - -
Expenditures
Current - Instruction - Added needs - - - -
Support services:
Pupil - - - -
Instructional staff - - - -
Operation and maintenance - 42,208 42,301 93
Transportation - - - -
Intergovernmental payments - - - -
Capital outlay 2,050,345 1,849,627 1,859,457 9,830
Total expenditures 2,050,345 1,891,835 1,901,758 9,923
Other Financing Uses - Transfers out - (77,416) (67,493) 9,923
Net Change in Fund Balance (2,050,345) (1,969,251) (1,969,251) -
Fund Balance - Beginning of year 1,969,251 1,969,251 1,969,251 -
Fund Balance (Deficit) - End of year (81,094)$ -$ - $ - $
Note: The budget has been adopted on a basis consistent with accounting principles generally accepted
in the United States of America.
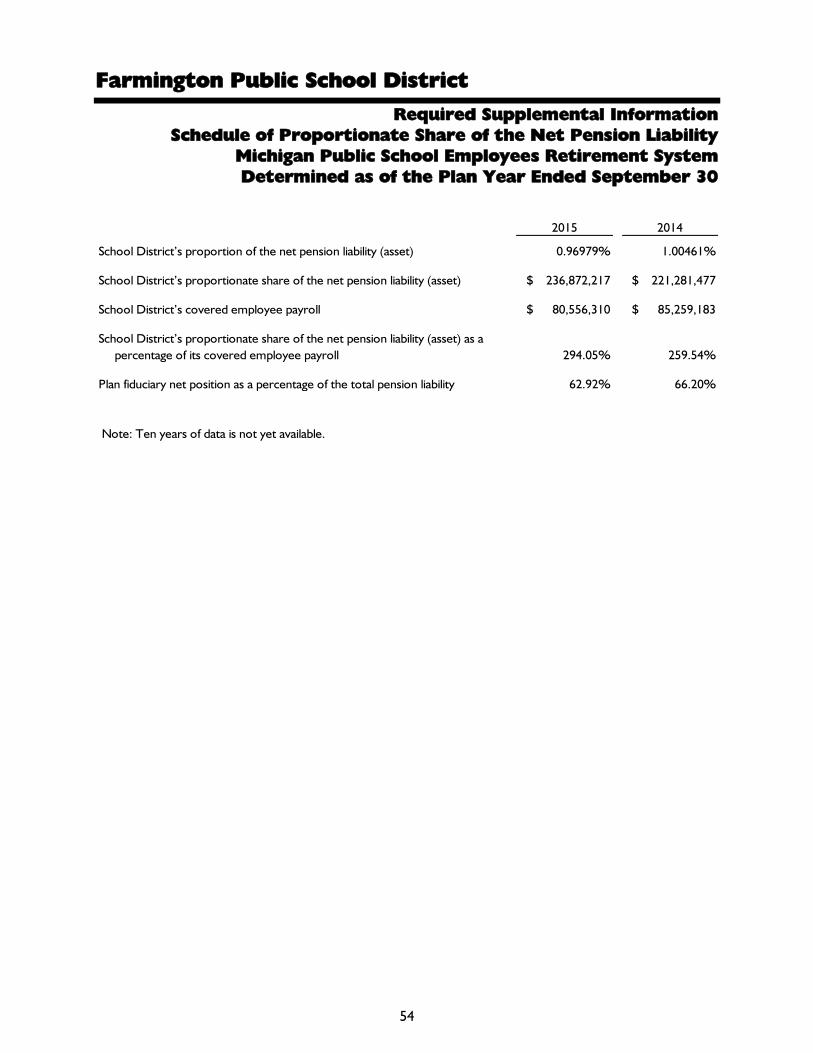
Farmington Public School District
54
Required Supplemental Information
Schedule of Proportionate Share of the Net Pension Liability
Michigan Public School Employees Retirement System
Determined as of the Plan Year Ended September 30
2015 2014
School District’s proportion of the net pension liability (asset) 0.96979% 1.00461%
School District’s proportionate share of the net pension liability (asset) $ 236,872,217 $ 221,281,477
School District’s covered employee payroll $ 80,556,310 $ 85,259,183
School District’s proportionate share of the net pension liability (asset) as a
percentage of its covered employee payroll 294.05% 259.54%
Plan fiduciary net position as a percentage of the total pension liability 62.92% 66.20%
Note: Ten years of data is not yet available.

Farmington Public School District
55
Required Supplemental Information
Schedule of Contributions
Michigan Public School Employees Retirement System
Determined as of the Year Ended June 30
2016 2015
Statutorily required contribution
$ 20,859,210 $ 17,999,760
Contribution in relation to the statutorily required contribution 20,859,210 17,999,760
Contribution deficiency (excess) - -
School District's covered employee payroll 73,117,969 81,965,999
Contribution as a percentage of covered employee payroll 28.52816% 21.96003%
Note: Ten years of data is not yet available.
Note to Pension Required Supplemental Information Schedules
Benefit Changes - There were no changes of benefit terms in 2015.
Changes in Assumptions - There were no changes of benefit assumptions in 2015.

Other Supplemental Information

Farmington Public School District
56
Other Supplemental Information
Combining Balance Sheet
Nonmajor Governmental Funds
June 30, 2016
Special Revenue
Fund
Nutrition
Services 2005 Issue 2013 Issue 2015 Issue
Technology/
Other Projects
Maintenance/
Bus Purchases Total
Assets
Cash and investments 1,242,840$ - $ - $ - $ 77,487$ - $ 1,320,327$
Receivables:
Accounts receivable 328 - - - - - 328
Due from other governmental units 104,931 - 2,000 5,000 - - 111,931
Due from other funds - - - - - 68,832 68,832
Inventories 38,302 - - - - - 38,302
Restricted assets - - 173,269 605,483 - - 778,752
Total assets 1,386,401$ - $ 175,269$ 610,483$ 77,487$ 68,832$ 2,318,472$
Liabilities and Fund Balances
Liabilities
Accounts payable 1,466$ - $ - $ - $ 28,885$ - $ 30,351$
Accrued payroll 14,119 - - - - - 14,119
Due to other funds 201,570 - 6,447 24,354 - - 232,371
Unearned revenue 63,044 - - - - - 63,044
Total liabilities 280,199 - 6,447 24,354 28,885 - 339,885
Fund Balances
Nonspendable - Inventories 38,302 - - - - - 38,302
Restricted:
Nutrition services 1,067,900 - - - - - 1,067,900
Debt service - - 168,822 586,129 - - 754,951
Committed
Committed - Capital projects - - - - 48,602 68,832 117,434
Total fund balances 1,106,202 - 168,822 586,129 48,602 68,832 1,978,587
Total liabilities and fund balances 1,386,401$ - $ 175,269$ 610,483$ 77,487$ 68,832$ 2,318,472$
Capital Projects FundsDebt Service Funds

Farmington Public School District
57
Other Supplemental Information
Combining Statement of Revenue, Expenditures, and
Changes in Fund Balances - Nonmajor Governmental Funds
Year Ended June 30, 2016
Nutrition
Services 2005 Issue 2013 Issue 2015 Issue
Technology/
Other Projects
Maintenance/Bus
Purchases Total
Revenue
Local sources 2,192,327$ - $ 2,393,827$ 9,036,719$ 203$ - $ 13,623,076$
State sources 157,071 - 12,364 25,102 - - 194,537
Federal sources 1,517,728 - - - - - 1,517,728
Interdistrict sources 51,371 - - - - - 51,371
Total revenue 3,918,497 - 2,406,191 9,061,821 203 - 15,386,712
Expenditures
Current - Nutrition services 3,651,062 - - - - - 3,651,062
Debt service:
Principal - - 2,065,000 5,150,000 - - 7,215,000
Interest and other - - 375,838 3,349,252 - - 3,725,090
Capital outlay - - - - 28,885 - 28,885
Total expenditures 3,651,062 - 2,440,838 8,499,252 28,885 - 14,620,037
Excess of Revenue Over (Under)
Expenditures
267,435 - (34,647) 562,569 (28,682) - 766,675
Other Financing Sources (Uses)
Transfers in - - - 20,517 - - 20,517
Transfers out (178,945) (20,517) - - - - (199,462)
Total other financing
(uses) sources (178,945) (20,517) - 20,517 - - (178,945)
Net Change in Fund Balances 88,490 (20,517) (34,647) 583,086 (28,682) - 587,730
Fund Balances - Beginning of year 1,017,712 20,517 203,469 3,043 77,284 68,832 1,390,857
Fund Balances - End of year 1,106,202$ - $ 168,822$ 586,129$ 48,602$ 68,832$ 1,978,587$
Special
Revenue Fund Capital Projects FundsDebt Service Funds

Farmington Public School District
58
Other Supplemental Information
Budgetary Comparison Schedule - Nonmajor Special Revenue Fund
Year Ended June 30, 2016
Original
Budget
Final
Budget Actual
Over
(Under) Final
Budget
Revenue
Local sources 2,226,300$ 2,189,200$ 2,192,327$ 3,127$
State sources 159,077 157,998 157,071 (927)
Federal sources 1,557,802 1,441,000 1,517,728 76,728
Interdistrict sources 51,371 51,371 51,371 -
Total revenue 3,994,550 3,839,569 3,918,497 78,928
Expenditures - Current - Nutrition services 3,917,193 3,746,309 3,651,062 (95,247)
Excess of Revenue Over Expenditures 77,357 93,260 267,435 174,175
Other Financing Uses -
Transfers out (155,800) (177,851) (178,945) (1,094)
Net Change in Fund Balances (78,443) (84,591) 88,490 173,081
Fund Balances - Beginning of year 1,017,712 1,017,712 1,017,712 -
Fund Balances - End of year 939,269$ 933,121$ 1,106,202$ 173,081$
Note: The budget has been adopted on a basis consistent with accounting principles generally accepted
in the United States of America.
Nutrition Services Fund

Farmington Public School District
59
Other Supplemental Information
Budgetary Comparison Schedule - Nonmajor Debt Service Funds
Year Ended June 30, 2016
Original
Budget
Final
Budget Actual Actual Actual Total All Issues
Over (Under)
Final Budget
Revenue
Local sources 11,425,116$ 11,402,339$ - $ 2,393,827$ 9,036,719$ 11,430,546$ 28,207$
State sources 37,800 37,800 - 12,364 25,102 37,466 (334)
Total revenue 11,462,916 11,440,139 - 2,406,191 9,061,821 11,468,012 27,873
Expenditures - Debt service
Principal 7,215,000 7,215,000 - 2,065,000 5,150,000 7,215,000 -
Interest and other 3,753,188 3,753,188 - 375,838 3,349,252 3,725,090 (28,098)
Total expenditures 10,968,188 10,968,188 - 2,440,838 8,499,252 10,940,090 (28,098)
Excess of Revenue Over (Under)
Expenditures 494,728 471,951 - (34,647) 562,569 527,922 55,971
Other Financing Sources (Uses)
Transfers in - 20,517 - - 20,517 20,517 -
Transfers out - (20,517) (20,517) - - (20,517) -
Total other financing
(uses) sources - - (20,517) - 20,517 - -
Net Change in Fund Balances 494,728 471,951 (20,517) (34,647) 583,086 527,922 55,971
Fund Balances - Beginning of year 227,029 227,029 20,517 203,469 3,043 227,029 -
Fund Balances - End of year 721,757$ 698,980$ - $ 168,822$ 586,129$ 754,951$ 55,971$
Note: The budget has been adopted on a basis consistent with accounting principles generally accepted
in the United States of America.
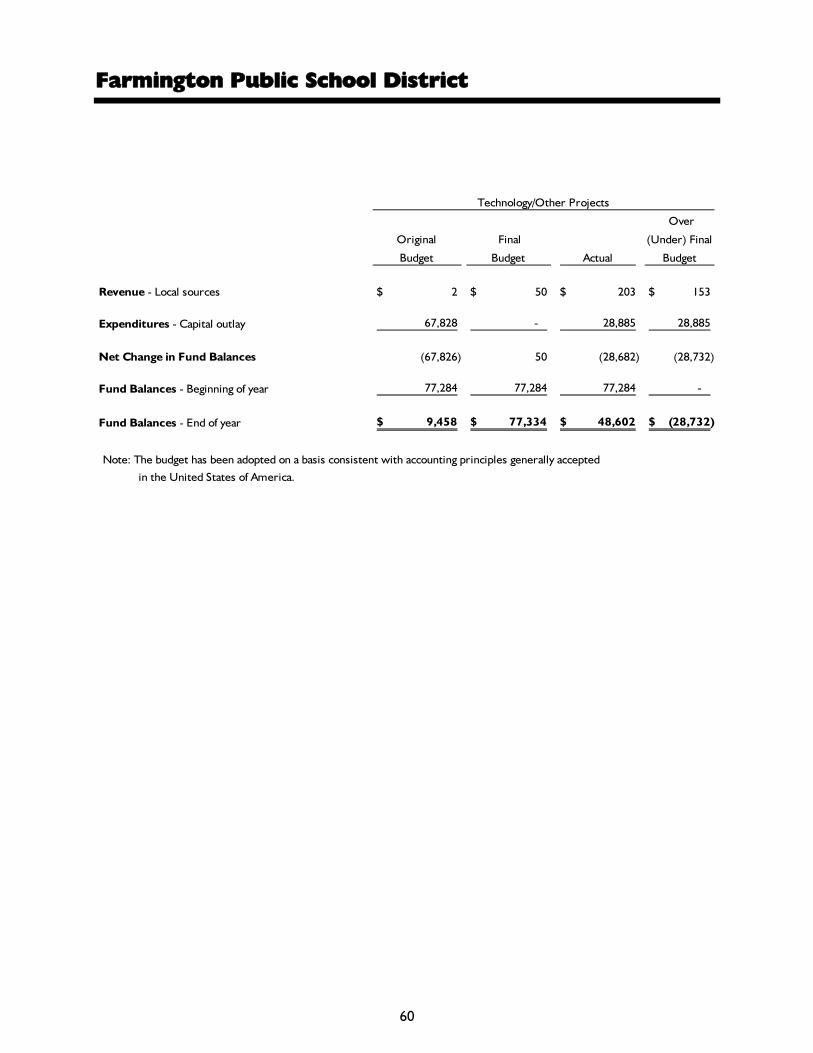
Farmington Public School District
60
Schedule - Capital Projects Funds
Year Ended June 30, 2015
Original
Budget
Final
Budget Actual
Over
(Under) Final
Budget
Revenue - Local sources 2$ 50$ 203$ 153$
Expenditures - Capital outlay 67,828 - 28,885 28,885
Net Change in Fund Balances (67,826) 50 (28,682) (28,732)
Fund Balances - Beginning of year 77,284 77,284 77,284 -
Fund Balances - End of year 9,458$ 77,334$ 48,602$ (28,732)$
Note: The budget has been adopted on a basis consistent with accounting principles generally accepted
in the United States of America.
Technology/Other Projects

61
Other Supplemental Information
Budgetary Comparison Schedule - Capital Projects Funds
Year Ended June 30, 2016
Original
Budget
Final
Budget Actual
Over (Under)
Final Budget
- $ - $ - $ - $
- - - -
- - - -
68,832 68,832 68,832 -
68,832$ 68,832$ 68,832$ - $
Maintenance/Bus Purchases

Farmington Public School District
62
Other Supplemental Information
Schedule of Bonded Indebtedness
June 30, 2016
Years Ending 2013 Issue 2015 Issue
June 30 Principal Principal
2017 2,255,000$ 5,175,000$
2018 2,300,000 5,155,000
2019 2,500,000 2,850,000
2020 - 3,635,000
2021 - 2,765,000
2022 - 2,915,000
2023 - 3,070,000
2024 - 3,215,000
2025 - 3,380,000
2026 - 3,550,000
2027 - 3,725,000
2028 - 3,905,000
2029 - 4,090,000
2030 - 4,285,000
2031 - 4,480,000
2032 - 4,675,000
2033 - 4,845,000
2034 - 5,040,000
2035 - 5,145,000
7,055,000$ 75,900,000$
Principal payments due May 1 May 1
Interest payments due May 1 and
November 1
May 1 and
November 1
Interest rate
4.00%
3.00% to
5.00%
Original issue 11,180,000$ 81,050,000$

Farmington Public School District
63
Other Supplemental Information
Fiduciary Fund
Statement of Changes in Fiduciary Assets and Liabilities
Year Ended June 30, 2016
Balance
July 1, 2015 Additions Deductions
Balance
June 30, 2016
Assets
Cash and investments 1,091,793$ 1,563,629$ 1,490,343$ 1,165,079$
Accounts receivable 5,726 4,924 5,726 4,924
Due from other funds - 290,009 290,009 -
Total assets 1,097,519$ 1,858,562$ 1,786,078$ 1,170,003$
Liabilities
Accounts payable 81,308$ 100,223$ 81,308$ 100,223$
Due to other funds 13,976 70,735 48,531 36,180
Due to student groups 1,002,235 1,687,604 1,656,239 1,033,600
Total liabilities 1,097,519$ 1,858,562$ 1,786,078$ 1,170,003$
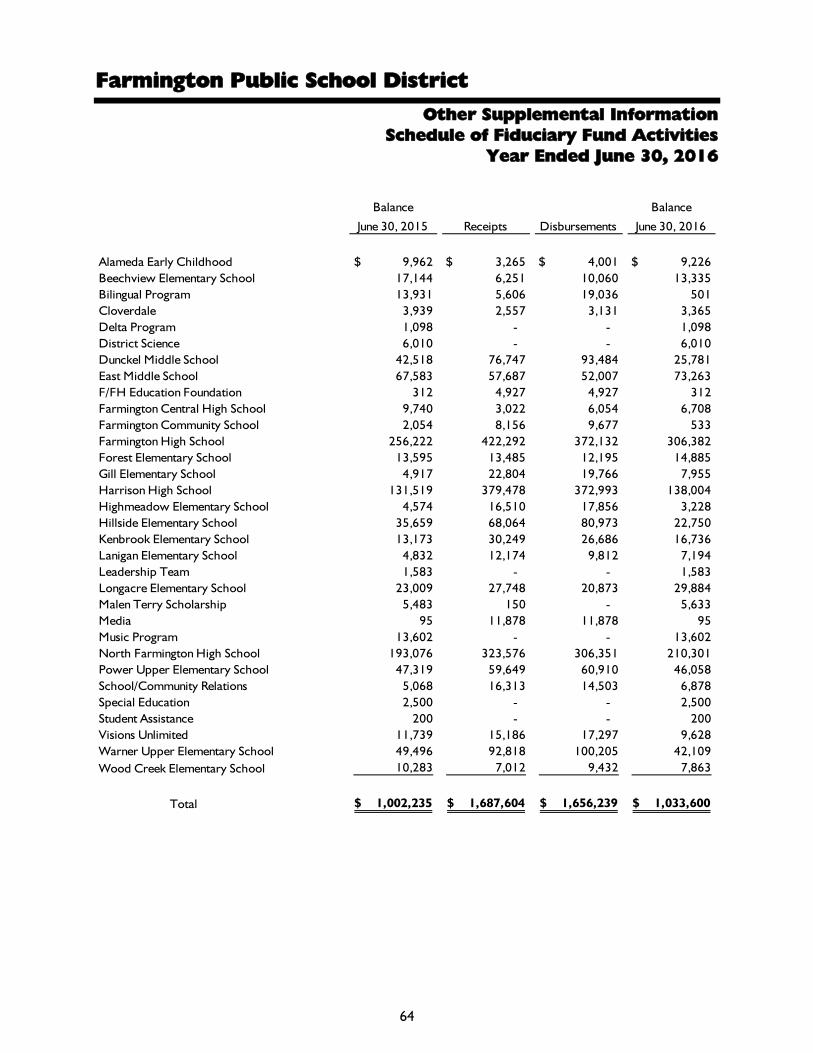
Farmington Public School District
64
Other Supplemental Information
Schedule of Fiduciary Fund Activities
Year Ended June 30, 2016
Balance
June 30, 2015 Receipts Disbursements
Balance
June 30, 2016
Alameda Early Childhood 9,962$ 3,265$ 4,001$ 9,226$
Beechview Elementary School 17,144 6,251 10,060 13,335
Bilingual Program 13,931 5,606 19,036 501
Cloverdale 3,939 2,557 3,131 3,365
Delta Program 1,098 - - 1,098
District Science 6,010 - - 6,010
Dunckel Middle School 42,518 76,747 93,484 25,781
East Middle School 67,583 57,687 52,007 73,263
F/FH Education Foundation 312 4,927 4,927 312
Farmington Central High School 9,740 3,022 6,054 6,708
Farmington Community School 2,054 8,156 9,677 533
Farmington High School 256,222 422,292 372,132 306,382
Forest Elementary School 13,595 13,485 12,195 14,885
Gill Elementary School 4,917 22,804 19,766 7,955
Harrison High School 131,519 379,478 372,993 138,004
Highmeadow Elementary School 4,574 16,510 17,856 3,228
Hillside Elementary School 35,659 68,064 80,973 22,750
Kenbrook Elementary School 13,173 30,249 26,686 16,736
Lanigan Elementary School 4,832 12,174 9,812 7,194
Leadership Team 1,583 - - 1,583
Longacre Elementary School 23,009 27,748 20,873 29,884
Malen Terry Scholarship 5,483 150 - 5,633
Media 95 11,878 11,878 95
Music Program 13,602 - - 13,602
North Farmington High School 193,076 323,576 306,351 210,301
Power Upper Elementary School 47,319 59,649 60,910 46,058
School/Community Relations 5,068 16,313 14,503 6,878
Special Education 2,500 - - 2,500
Student Assistance 200 - - 200
Visions Unlimited 11,739 15,186 17,297 9,628
Warner Upper Elementary School 49,496 92,818 100,205 42,109
Wood Creek Elementary School 10,283 7,012 9,432 7,863
Total 1,002,235$ 1,687,604$ 1,656,239$ 1,033,600$

Cash and Investments
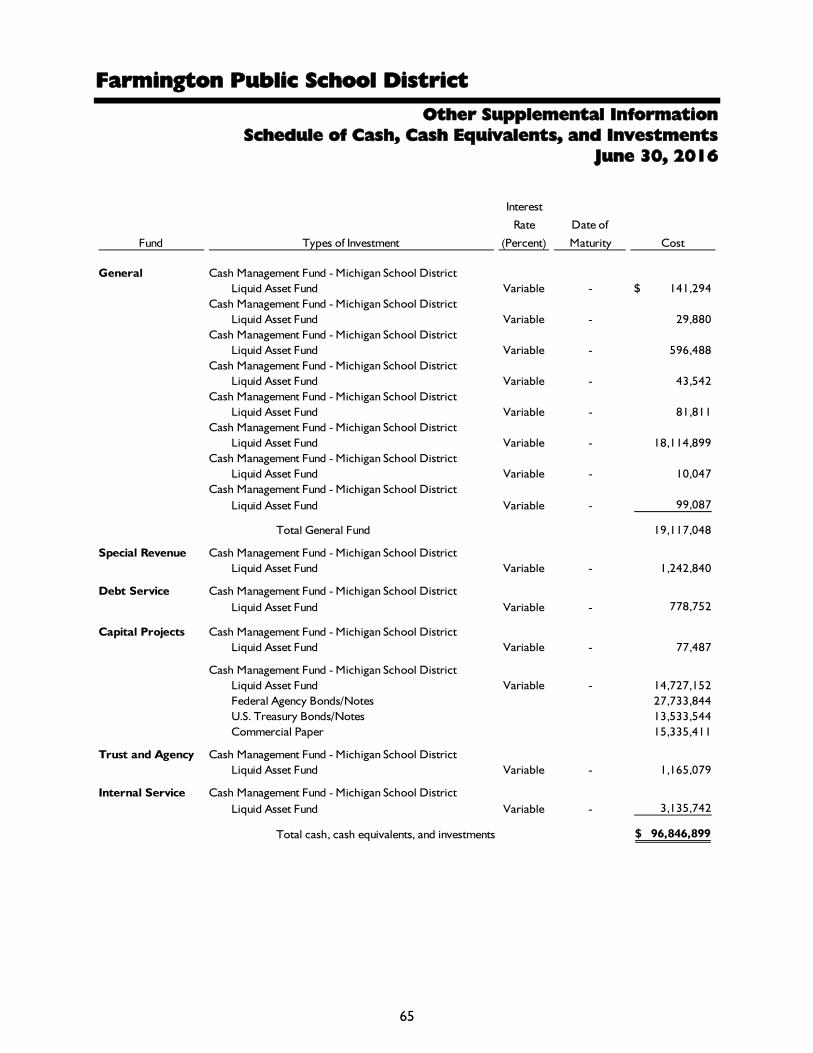
Farmington Public School District
65
Other Supplemental Information
Schedule of Cash, Cash Equivalents, and Investments
June 30, 2016
Fund Types of Investment
Interest
Rate
(Percent)
Date of
Maturity Cost
General Cash Management Fund - Michigan School District
Liquid Asset Fund Variable - 141,294$
Cash Management Fund - Michigan School District
Liquid Asset Fund Variable - 29,880
Cash Management Fund - Michigan School District
Liquid Asset Fund Variable - 596,488
Cash Management Fund - Michigan School District
Liquid Asset Fund Variable - 43,542
Cash Management Fund - Michigan School District
Liquid Asset Fund Variable - 81,811
Cash Management Fund - Michigan School District
Liquid Asset Fund Variable - 18,114,899
Cash Management Fund - Michigan School District
Liquid Asset Fund Variable - 10,047
Cash Management Fund - Michigan School District
Liquid Asset Fund Variable - 99,087
Total General Fund 19,117,048
Special Revenue Cash Management Fund - Michigan School District
Liquid Asset Fund Variable - 1,242,840
Debt Service Cash Management Fund - Michigan School District
Liquid Asset Fund Variable - 778,752
Capital Projects Cash Management Fund - Michigan School District
Liquid Asset Fund Variable - 77,487
Cash Management Fund - Michigan School District
Liquid Asset Fund Variable - 14,727,152
Federal Agency Bonds/Notes 27,733,844
U.S. Treasury Bonds/Notes 13,533,544
Commercial Paper 15,335,411
Trust and Agency Cash Management Fund - Michigan School District
Liquid Asset Fund Variable - 1,165,079
Internal Service Cash Management Fund - Michigan School District
Liquid Asset Fund Variable - 3,135,742
Total cash, cash equivalents, and investments 96,846,899$
Capital Assets and
Accumulated Depreciation

Farmington Public School District
66
Land
Buildings
and Building
Improvements
Furniture
and
Equipment
Buses and Other
Vehicles
Construction in
Progress Total
Elementary Schools
Alameda 53,447$ 1,393,181$ 30,392$ - $ - $ 1,477,020$
Beechview 25,250 3,414,649 112,837 - - 3,552,736
Fairview 17,502 - - - - 17,502
Forest 31,980 2,693,273 100,521 - 1,442,164 4,267,938
Gill 4,137 3,615,224 282,592 - 985,263 4,887,216
Highmeadow 49,226 3,354,044 103,280 - - 3,506,550
Hillside 16,301 7,235,851 165,643 - - 7,417,795
Kenbrook 24,900 4,199,781 132,139 - - 4,356,820
Lanigan 37,800 4,046,579 199,310 - 1,057,137 5,340,826
Longacre 30,300 4,489,611 119,694 - - 4,639,605
William Grace 83,000 - - - - 83,000
Wood Creek 4,391 3,544,759 237,944 - - 3,787,094
Upper Elementary Schools
Power 4,137 7,331,726 406,438 - 19,985 7,762,286
Warner 180,000 8,185,404 291,076 - - 8,656,480
Middle Schools
Dunckel 36,000 10,978,363 325,337 - - 11,339,700
East 57,500 10,497,732 405,534 - 956,238 11,917,004
High Schools
Farmington 1 28,555,852 1,192,635 - 1,898,050 31,646,538
Harrison 199,050 27,125,743 1,319,086 - - 28,643,879
North 117,600 28,940,244 1,736,920 - 116,877 30,911,641
Shiawassee Complex - 3,999,379 4,249,567 - - 8,248,946
Maxfield Training Center 2 2,302,397 5,606 - - 2,308,005
Farmington Community School 6,501 1,668,447 116,126 - - 1,791,074
Maintenance 4,273 311,009 529,776 - - 845,058
Visions - 3,763,776 97,912 - - 3,861,688
Alternative Academy - - 5,350 - - 5,350
Vehicles - - - 10,827,168 - 10,827,168
Total 983,298$ 171,647,024$ 12,165,715$ 10,827,168$ 6,475,714$ 202,098,919$
Cost

67
Other Supplemental Information
Schedule of Capital Assets and Accumulated Depreciation
June 30, 2016
Buildings
and Building
Improvements
Furniture
and
Equipment
Buses and Other
Vehicles Total
583,060$ 16,432$ - $ 599,492$
1,392,902 87,822 - 1,480,724
- - - -
1,233,545 71,691 - 1,305,236
1,536,145 184,425 - 1,720,570
1,357,743 76,663 - 1,434,406
3,306,301 121,365 - 3,427,666
1,735,754 109,295 - 1,845,049
1,692,570 149,361 - 1,841,931
1,645,803 83,017 - 1,728,820
- - - -
1,700,139 128,420 - 1,828,559
- -
- -
3,200,679 258,140 - 3,458,819
3,817,610 192,716 - 4,010,326
- -
- -
4,433,706 241,762 - 4,675,468
4,246,255 314,959 - 4,561,214
- -
- -
12,031,421 918,315 - 12,949,736
11,910,834 1,152,921 - 13,063,755
11,784,179 1,498,839 - 13,283,018
- -
1,355,540 4,005,800 - 5,361,340
1,289,652 5,606 - 1,295,258
788,853 77,585 - 866,438
209,254 407,746 - 617,000
825,757 41,394 - 867,151
- 5,350 - 5,350
- - 9,021,483 9,021,483
72,077,702$ 10,149,624$ 9,021,483$ 91,248,809$
Accumulated Depreciation

Statistical Section

Farmington Public School District
Description of Statistical Section
68
This part of Farmington Public School District’s Comprehensive Annual Financial Report
presents detailed information as a context for understanding what the information in the
financial statements, note disclosures, and required supplemental information says about the
government’s overall financial health. Many of the schedules present data for the past fiscal
years that will allow the reader to discern trends that cannot be seen in a single year’s financial
statements.
Contents
Financial Trend Information
These schedules contain trend information to help the reader understand how the
School District’s financial performance and well-being have changed over time.
Revenue Capacity Information
These schedules contain information to help the reader assess the School District’s most
significant local revenue source, the property tax.
Debt Capacity Information
These schedules present information to help the reader assess the affordability of the
School District’s current levels of outstanding debt and the School District’s ability to
issue additional debt in the future.
Demographic and Economic Information
These schedules offer demographic and economic indicators to help the reader
understand the environment within which the School District’s financial activities take
place.
Operating Information
These schedules contain service and infrastructure data to help the reader understand
how the information in the School District’s financial report relates to the services the
School District provides and the activities it performs.

Farmington Public School District
69
2007 2008 2009 2010 2011
Governmental Activities
Net investment
in capital assets 64,254,664$ 68,749,233$ 72,382,303$ 67,745,598$ 71,908,876$
Restricted 2,032,385 907,407 537,407 3,434,764 2,811,215
Unrestricted 31,721,790 36,870,342 34,388,054 22,595,755 25,492,876
Total primary governmental
net position 98,008,839$ 106,526,982$ 107,307,764$ 93,776,117$ 100,212,967$
Source: Farmington Public School District audited financial statements
June 30
GASB 68 and 71 have been adopted effective July 1, 2014. Net position prior to June 30, 2015 has not been restated in this table.
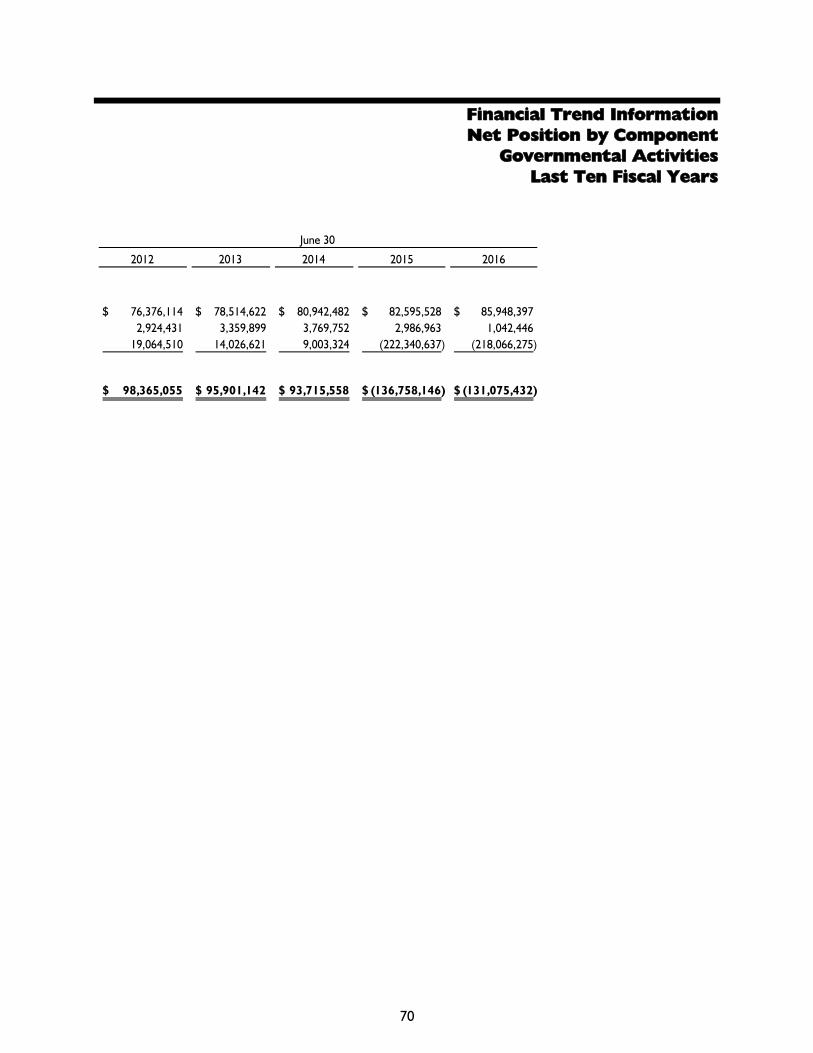
70
Financial Trend Information
Net Position by Component
Governmental Activities
Last Ten Fiscal Years
2012 2013 2014 2015 2016
76,376,114$ 78,514,622$ 80,942,482$ 82,595,528$ 85,948,397$
2,924,431 3,359,899 3,769,752 2,986,963 1,042,446
19,064,510 14,026,621 9,003,324 (222,340,637) (218,066,275)
98,365,055$ 95,901,142$ 93,715,558$ (136,758,146)$ (131,075,432)$
June 30

Farmington Public School District
71
2007 2008 2009 2010 2011
Expenses
Governmental activities:
Instruction 97,793,968$ 92,551,043$ 97,972,023$ 98,749,017$ 93,196,238$
Support services 63,706,879 61,606,469 63,072,628 63,369,009 58,420,931
Nutrition services 3,915,074 3,944,661 4,015,673 4,007,796 3,820,318
Athletics 2,310,316 2,320,740 2,418,962 2,349,801 2,006,621
Community services 1,806,004 1,722,971 1,435,925 1,375,371 1,234,414
Interest on long-term debt 3,024,353 2,838,058 2,597,085 2,644,130 2,358,627
Depreciation (unallocated) 2,705,632 2,802,013 2,845,582 2,905,796 2,870,672
Total governmental activities 175,262,226 167,785,955 174,357,878 175,400,920 163,907,821
Program Revenue
Charges for services: *
Instruction 138,167 308,257 153,850 167,093 185,666
Support services 373,858 631,939 619,956 458,950 481,660
Nutrition services 2,967,053 3,017,669 2,916,709 2,690,018 2,523,645
Athletics 390,851 368,823 428,455 422,652 759,090
Community services 1,591,299 1,610,172 1,168,993 1,035,179 1,034,647
Operating grants and contributions 35,250,506 34,945,819 40,120,616 37,441,769 36,650,588
Total program revenue 40,711,734 40,882,679 45,408,579 42,215,661 41,635,296
Net expense (134,550,492) (126,903,276) (128,949,299) (133,185,259) (122,272,525)
General Revenue
Property taxes 63,520,606 64,489,779 61,475,322 60,381,468 57,793,086
State aid not restricted to specific purposes 65,737,190 65,310,870 63,278,069 62,226,033 67,066,383
Federal sources - Unrestricted - - - 3,396,898 2,741,173
Unrestricted state grants and contributions 2,238,873 2,230,346 2,212,809 - -
Investment earnings 2,520,195 1,931,986 1,371,090 482,437 246,262
Other 788,749 1,458,438 1,392,791 1,951,260 862,471
Total general revenue 134,805,613 135,421,419 129,730,081 128,438,096 128,709,375
Special Item - - - (8,784,484) -
Change in net position 255,121$ 8,518,143$ 780,782$ (13,531,647)$ 6,436,850$
* Historically, approximately 50 percent of charges for services is for nutrition services and the balance is for community education
tuition and facility usage charges.
Source: Farmington Public School District audited financial statements
June 30

72
Financial Trend Information
Changes in Governmental Net Position
Last Ten Fiscal Years
2012 2013 2014 2015 2016
93,536,609$ 94,544,880$ 93,402,687$ 95,922,327$ 89,144,470$
56,592,666 56,068,389 54,103,272 55,576,921 50,369,101
3,607,330 3,676,910 3,648,056 3,676,318 3,754,799
2,117,510 2,030,460 1,972,380 1,799,480 1,788,212
1,277,959 1,453,986 1,351,112 1,441,845 1,579,754
2,178,688 2,584,156 1,682,306 2,313,319 3,685,573
2,993,638 3,041,878 3,054,974 3,012,856 2,991,551
162,304,400 163,400,659 159,214,787 163,743,066 153,313,460
179,451 152,904 141,332 155,792 167,783
325,541 398,305 384,303 386,105 390,693
2,337,041 2,248,048 2,177,921 2,220,997 2,240,900
727,394 668,356 657,129 651,087 637,501
981,483 1,164,022 1,126,506 1,135,108 1,064,660
35,132,402 32,699,534 32,930,138 33,771,843 32,384,317
39,683,312 37,331,169 37,417,329 38,320,932 36,885,854
(122,621,088) (126,069,490) (121,797,458) (125,422,134) (116,427,606)
52,972,802 52,169,541 50,140,673 47,981,086 51,629,686
66,742,219 68,638,365 67,506,547 68,748,701 68,498,645
101,444 - - - -
- - - - -
171,338 54,150 61,865 7,883 623,038
785,373 1,624,004 1,902,789 2,156,945 1,358,951
120,773,176 122,486,060 119,611,874 118,894,615 122,110,320
- 1,119,517 - - -
(1,847,912)$ (2,463,913)$ (2,185,584)$ (6,527,519)$ 5,682,714$
June 30

Farmington Public School District
73
2007 2008 2009 2010 2011
General Fund:
Reserved 2,605,550$ 1,238,991$ 1,788,231$ 2,485,604$ - $
Unreserved 24,540,968 33,776,836 28,984,831 20,806,567 -
Nonspendable - - - - 2,201,374
Restricted - - - - -
Committed - - - - 3,930,879
Assigned - - - - 8,018,924
Unassigned - - - - 13,821,912
Total General Fund 27,146,518$ 35,015,827$ 30,773,062$ 23,292,171$ 27,973,089$
All other governmental funds:
Reserved, reported in:
Special Revenue Funds 207,882$ 43,011$ 39,065$ 41,012$ - $
Capital Project Funds 1,255,342 176,238 1,917,877 858,932 -
Debt Service Funds 777,043 731,169 537,407 557,736 -
Unreserved, reported in:
Special Revenue Funds 6,119,285 3,690,688 3,607,207 3,412,588 -
Capital Project Funds 5,466,103 5,574,676 4,798,195 4,707,552 -
Debt Service Funds - - - - -
Nonspendable, reported in -
Special Revenue Funds - - - - 34,381
Restricted, reported in:
Special Revenue Funds - - - - 2,718,295
Debt Service Funds - - - - 652,072
Capital Projects Fund - bonded - - - - -
Committed, reported in -
Capital Project Funds - - - - 3,753,158
Assigned - - - - -
Unassigned - - - - -
Total all other governmental funds 13,825,655$ 10,215,782$ 10,899,751$ 9,577,820$ 7,157,906$
Source: Farmington Public School District audited financial statements
Note: Years beginning with 2011 have been presented in accordance with GASB No. 54, which was effective July 1, 2010
Years prior to GASB No. 54 presented fund balance into two categories: reserved and unreserved.
Reserved amounts were not available for spending or are legally restricted.
Unreserved amounts contained designated funds, which were determined by the Board of Education or
management, and undesignated funds, which contained all remaining funds.

74
Financial Trend Information
Fund Balances - Governmental Funds
Last Ten Fiscal Years
2012 2013 2014 2015 2016
- $ - $ - $ - $ - $
- - - - -
1,770,361 1,113,025 835,743 661,116 746,904
- - - - -
3,412,671 4,051,511 6,801,338 3,000,517 6,336,300
11,524,781 5,483,769 4,330,988 4,698,095 3,359,655
7,403,671 8,471,478 - - 2,259,671
24,111,484$ 19,119,783$ 11,968,069$ 8,359,728$ 12,702,530$
- $ - $ - $ - $ - $
- - - - -
- - - - -
- - - - -
- - - - -
- - - - -
33,577 35,196 39,470 34,038 38,302
2,729,715 2,830,677 2,943,868 2,952,925 1,067,900
161,139 494,026 786,414 227,029 754,951
- - - 76,602,905 68,361,556
1,348,633 601,477 579,928 146,116 117,434
- - - - -
- - - - -
4,273,064$ 3,961,376$ 4,349,680$ 79,963,013$ 70,340,143$

Farmington Public School District
75
2007 2008 2009 2010 2011
Revenue
Local sources 72,357,730$ 73,829,784$ 69,477,371$ 67,589,057$ 65,032,708$
State sources 80,218,401 80,354,016 77,739,909 75,454,052 78,833,538
Federal sources 4,364,678 5,144,317 9,677,723 11,310,338 10,576,783
Interdistrict sources 17,343,384 18,493,107 17,509,716 16,962,427 15,676,746
Total revenue 174,284,193 177,821,224 174,404,719 171,315,874 170,119,775
Expenditures
Current:
Instruction 94,120,648 91,092,053 95,726,635 97,015,401 90,810,497
Support services 61,322,450 60,402,363 61,319,924 62,000,776 56,670,108
Community services 1,780,866 1,697,832 1,413,738 1,356,136 1,215,179
Nutrition services 3,864,834 3,932,541 4,002,917 3,997,493 3,807,614
Athletics 2,310,316 2,320,740 2,418,962 2,349,801 2,006,621
Debt service:
Principal 5,525,000 5,805,000 5,995,000 5,480,000 5,645,000
Debt issuance costs - - - - -
Interest 3,064,853 2,851,454 2,621,518 2,465,030 2,302,693
Intergovernmental payments 1,332,315 749,394 558,919 750,522 721,407
Capital outlay 9,564,119 4,259,778 3,956,611 4,727,626 4,714,698
Total expenditures 182,885,401 173,111,155 178,014,224 180,142,785 167,893,817
Excess of Revenue (Under) Over Expenditures (8,601,208) 4,710,069 (3,609,505) (8,826,911) 2,225,958
Other Financing Sources (Uses)
Debt issuance - - - - -
Premium on debt issued - - - - -
Sale of capital assets 13,616 39,855 50,709 24,089 35,046
Transfers in 13,401,276 17,437,871 16,710,465 15,186,436 10,380,771
Transfers out (13,401,276) (17,437,871) (16,710,465) (15,186,436) (10,380,771)
Payment to bond escrow agent - - - - -
Total other financing sources 13,616 39,855 50,709 24,089 35,046
Net Change in Fund Balances (8,587,592) 4,749,924 (3,558,796) (8,802,822) 2,261,004
Fund Balances - Beginning of year 49,069,277 40,481,685 45,231,609 41,672,813 32,869,991
Fund Balances - End of year 40,481,685$ 45,231,609$ 41,672,813$ 32,869,991$ 35,130,995$
Debt service as a percentage of noncapital expenditures 5.26% 5.43% 5.23% 4.77% 5.14%
Source: Farmington Public School District audited financial statements

76
Financial Trend Information
Changes in Fund Balances - Governmental Funds
Last Ten Fiscal Years
2012 2013 2014 2015 2016
59,203,322$ 58,180,291$ 56,401,936$ 54,255,170$ 57,914,213$
80,024,841 82,047,166 81,213,142 83,101,032 82,062,850
6,675,500 5,718,440 5,707,257 5,731,381 5,608,374
14,565,989 12,923,811 12,682,208 12,694,664 11,788,943
160,469,652 158,869,708 156,004,543 155,782,247 157,374,380
90,714,416 91,818,639 92,780,320 92,034,829 85,548,608
54,791,172 54,251,823 53,564,499 53,105,932 48,240,724
1,257,702 1,433,219 1,329,693 1,424,828 1,496,704
3,584,696 3,658,731 3,646,676 3,676,318 3,651,062
2,117,510 2,030,460 1,972,380 1,799,480 1,788,212
5,830,000 6,025,000 6,350,000 6,150,000 7,215,000
- 128,622 - 537,564 -
2,207,345 1,983,642 1,638,386 1,771,184 3,725,090
820,803 662,217 592,863 434,061 678,074
5,904,662 3,431,896 901,333 518,875 11,295,327
167,228,306 165,424,249 162,776,150 161,453,071 163,638,801
(6,758,654) (6,554,541) (6,771,607) (5,670,824) (6,264,421)
- 11,180,000 - 81,050,000 -
- 1,304,740 - 9,186,782 -
12,207 1,119,518 8,197 502,255 532,260
11,419,878 9,591,991 8,220,060 8,479,893 266,955
(11,419,878) (9,591,991) (8,220,060) (8,479,893) (266,955)
- (12,353,106) - (13,063,221) -
12,207 1,251,152 8,197 77,675,816 532,260
(6,746,447) (5,303,389) (6,763,410) 72,004,992 (5,732,161)
35,130,995 28,384,548 23,081,159 16,317,749 88,322,741
28,384,548$ 23,081,159$ 16,317,749$ 88,322,741$ 82,590,580$
5.27% 5.31% 5.21% 5.56% 7.77%

Farmington Public School District
77
Real Property
Tax Year Residential Commercial Industrial
2006 3,018,638,560$ 950,426,860$ 274,910,160$ 298,725,070$ N/A
2007 3,128,593,270 987,195,890 280,137,220 299,051,890 N/A
2008 3,097,444,190 1,001,122,800 281,107,040 N/A 160,417,450$
2009 2,852,923,100 1,006,481,180 286,807,880 N/A 156,459,620
2010 2,403,008,210 921,785,410 245,508,730 N/A 146,933,020
2011 2,204,586,330 866,304,300 143,820,720 N/A 141,735,540
2012 2,128,956,830 785,323,570 101,290,930 N/A 135,583,780
2013 2,152,620,080 731,842,410 92,365,090 N/A 137,119,430
2014 2,206,252,830 695,602,580 91,896,530 N/A 120,006,060
2015 2,279,432,190 695,770,180 94,275,590 N/A 124,588,940
Note: Under Michigan law, the revenue base is taxable value. The property tax base in the
School District is contingent upon the taxable property values. Taxable value increases are
limited by variable caps and other restrictions, which generally cause taxable values to be at
or below the state equalized values, which are primarily market-driven. Taxes levied in
a particular "tax year" become revenue of the subsequent fiscal year.
* During fiscal year 2009, the State of Michigan revised the taxable value structure of the
personal property tax base. This change was made to lessen property taxes on
businesses within the state.
Source: Oakland County Form L-4028
Personal Property*
Commercial
Personal Property
Taxable Value by Property Type

78
Revenue Capacity Information
Taxable Value and Actual Value of Taxable Property
Last Ten Fiscal Years
Taxable Value by Property Type
N/A N/A 4,542,700,650$ 10.6511/19.7388 9,085,401,300$ 50.00
N/A N/A 4,694,978,270 10.1784/19.8000 9,389,956,540 50.00
95,137,710$ 36,618,240$ 4,671,847,430 9.6915/19.8000 9,343,694,860 50.00
90,453,690 37,452,570 4,430,578,040 10.1442/19.8000 8,861,156,080 50.00
86,967,220 38,192,480 3,842,395,070 12.0278/20.1000 7,684,790,140 50.00
78,913,080 43,622,360 3,478,982,330 12.3334/20.1800 6,957,964,660 50.00
77,025,150 44,594,630 3,272,774,890 13.3810/20.5600 6,545,549,780 50.00
75,384,170 48,422,550 3,237,753,730 13.0150/20.5600 6,475,507,460 50.00
76,000,470 49,097,810 3,238,856,280 11.7472/20.2600 6,477,712,560 50.00
76,455,060 52,464,870 3,322,986,830 12.4418/21.4400 6,645,973,660 50.00
Taxable
Value as a
% of Actual
Value Total Value
Estimated
Actual Value
Tax Rate (mills)
Homestead/Non-
Homestead
Industrial
Personal
Property
Utility Personal
Property

Farmington Public School District
79
Millage Rates - Direct Farmington Public School District Taxes
Tax Year
Fiscal Year
Ended
June 30 Homestead
Non-
homestead Debt* Homestead
Non-
homestead
2006 2007 8.8511 17.9388 1.8000 10.6511 19.7388
2007 2008 8.3784 18.0000 1.8000 10.1784 19.8000
2008 2009 7.8915 18.0000 1.8000 9.6915 19.8000
2009 2010 8.3442 18.0000 1.8000 10.1442 19.8000
2010 2011 9.9278 18.0000 2.1000 12.0278 20.1000
2011 2012 10.1534 18.0000 2.1800 12.3334 20.1800
2012 2013 10.8210 18.0000 2.5600 13.3810 20.5600
2013 2014 10.4550 18.0000 2.5600 13.0150 20.5600
2014 2015 9.4872 18.0000 2.2600 11.7472 20.2600
2015 2016 9.0018 18.0000 3.4400 12.4418 21.4400
* Debt millage applies to homestead and nonhomestead property.
Sources: Assessment and tax roll certificates and warrants for West Bloomfield
Township, City of Farmington Hills, and City of Farmington
Operating Total Direct Taxes

80
Revenue Capacity Information
Direct and Overlapping Property Tax Rates
Last Ten Fiscal Years
Oakland
County
Oakland
Community
College
Oakland
Intermediate
School District
State
Education
City of
Farmington
City of
Farmington
Hills
Township
of West
Bloomfield
4.6461 1.5844 3.3690 6.0000 16.0019 12.1972 9.5634
4.6461 1.5844 3.3690 6.0000 16.0019 12.1972 9.5894
4.7461 1.5844 3.3690 6.0000 15.4019 12.1972 9.5894
4.7461 1.5844 3.3690 6.0000 15.4019 12.1972 8.9774
4.7461 1.5844 3.3690 6.0000 16.0000 12.1972 9.0074
4.7461 1.5844 3.3690 6.0000 16.5856 12.2036 11.9347
4.9461 1.5844 3.3690 6.0000 16.5856 13.9362 12.2537
4.9461 1.5844 3.3690 6.0000 16.5856 13.9392 12.2550
4.0019 1.5844 3.3690 6.0000 16.5856 13.9394 12.2550
4.0900 1.5819 3.3633 6.0000 15.0000 14.3908 12.2112
Overlapping Taxes
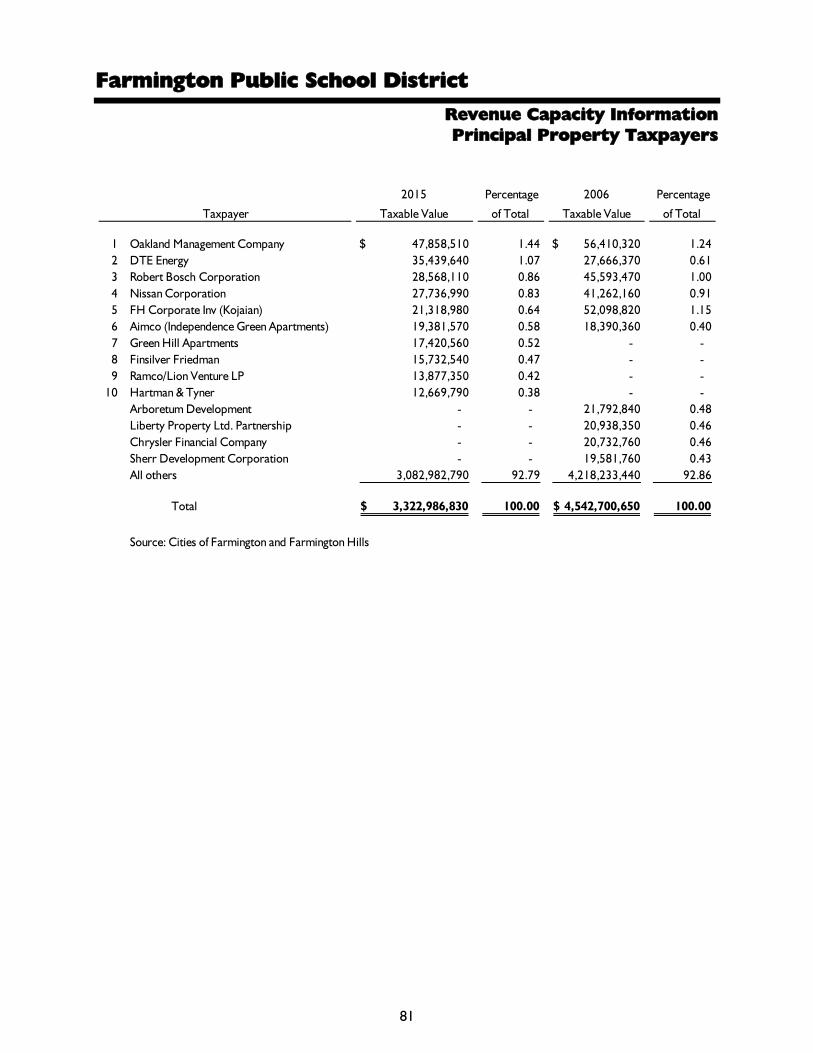
Farmington Public School District
81
Revenue Capacity Information
Principal Property Taxpayers
2015
Taxable Value
Percentage
of Total
2006
Taxable Value
Percentage
of Total
1 Oakland Management Company 47,858,510$ 1.44 56,410,320$ 1.24
2 DTE Energy 35,439,640 1.07 27,666,370 0.61
3 Robert Bosch Corporation 28,568,110 0.86 45,593,470 1.00
4 Nissan Corporation 27,736,990 0.83 41,262,160 0.91
5 FH Corporate Inv (Kojaian) 21,318,980 0.64 52,098,820 1.15
6 Aimco (Independence Green Apartments) 19,381,570 0.58 18,390,360 0.40
7 Green Hill Apartments 17,420,560 0.52 - -
8 Finsilver Friedman 15,732,540 0.47 - -
9 Ramco/Lion Venture LP 13,877,350 0.42 - -
10 Hartman & Tyner 12,669,790 0.38 - -
Arboretum Development - - 21,792,840 0.48
Liberty Property Ltd. Partnership - - 20,938,350 0.46
Chrysler Financial Company - - 20,732,760 0.46
Sherr Development Corporation - - 19,581,760 0.43
All others 3,082,982,790 92.79 4,218,233,440 92.86
Total 3,322,986,830$ 100.00 4,542,700,650$ 100.00
Source: Cities of Farmington and Farmington Hills
Taxpayer

Farmington Public School District
82
Revenue Capacity Information
Property Tax Levies and Collections
Last Ten Fiscal Years
Tax Year
Fiscal Year
Ended
June 30 Total Levy
Current
Collections
Percent
Collected
Delinquent
Collections
Total Tax
Collections
Percent of
Levy
Collected
2006 2007 63,497,573$ 63,362,114$ 99.78 - 63,129,107$ 99.42
2007 2008 64,328,248 64,079,736 99.61 - 63,868,859 99.29
2008 2009 61,463,059 61,297,437 99.73 - 60,964,949 99.19
2009 2010 60,356,441 60,208,132 99.75 - 59,400,205 98.42
2010 2011 57,759,703 57,643,665 99.80 24$ 56,983,596 98.66
2011 2012 52,916,609 52,764,189 99.71 1,398 52,868,451 99.91
2012 2013 52,079,493 51,994,900 99.84 4,548 52,055,771 99.95
2013 2014 50,765,606 50,678,031 99.83 41,439 50,719,470 99.91
2014 2015 47,485,452 47,382,532 99.78 - 47,382,532 99.78
2015 2016 51,359,325 51,260,368 99.81 - 51,260,368 99.81
Source: Farmington Public School District audited financial statements
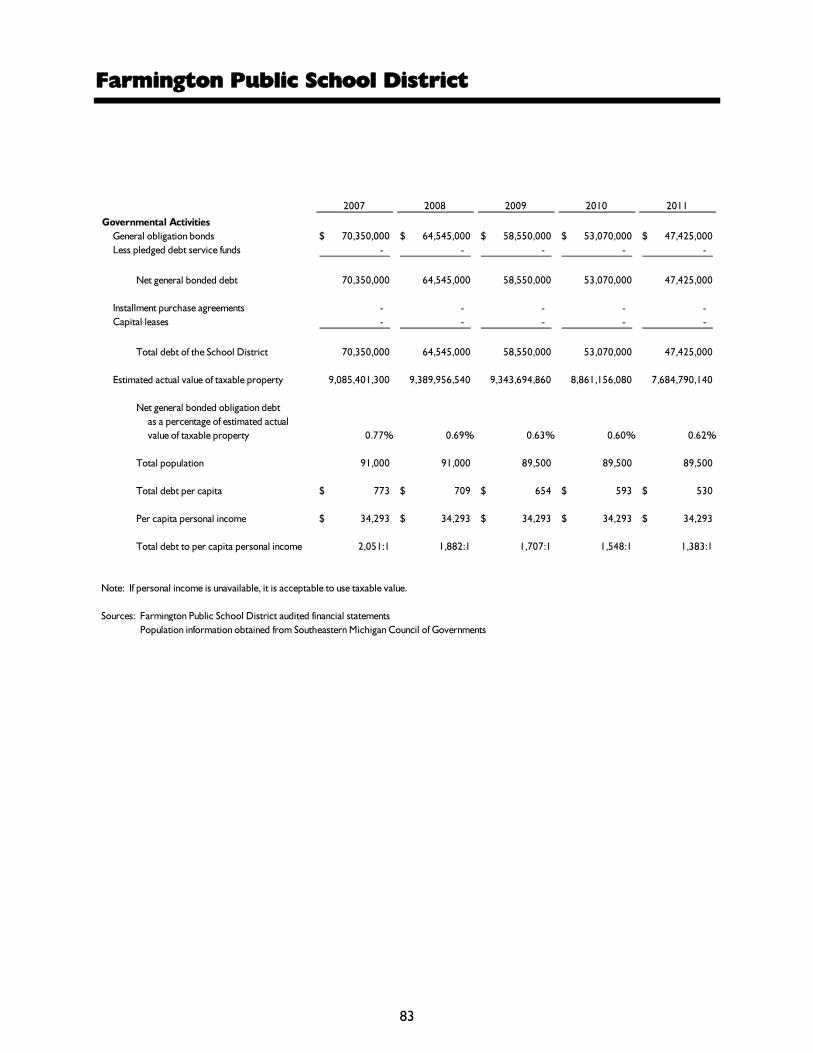
Farmington Public School District
83
2007 2008 2009 2010 2011
Governmental Activities
General obligation bonds 70,350,000$ 64,545,000$ 58,550,000$ 53,070,000$ 47,425,000$
Less pledged debt service funds - - - - -
Net general bonded debt 70,350,000 64,545,000 58,550,000 53,070,000 47,425,000
Installment purchase agreements - - - - -
Capital leases - - - - -
Total debt of the School District 70,350,000 64,545,000 58,550,000 53,070,000 47,425,000
Estimated actual value of taxable property 9,085,401,300 9,389,956,540 9,343,694,860 8,861,156,080 7,684,790,140
Net general bonded obligation debt
as a percentage of estimated actual
value of taxable property 0.77% 0.69% 0.63% 0.60% 0.62%
Total population 91,000 91,000 89,500 89,500 89,500
Total debt per capita 773$ 709$ 654$ 593$ 530$
Per capita personal income 34,293$ 34,293$ 34,293$ 34,293$ 34,293$
Total debt to per capita personal income 2,051:1 1,882:1 1,707:1 1,548:1 1,383:1
Note: If personal income is unavailable, it is acceptable to use taxable value.
Sources: Farmington Public School District audited financial statements
Population information obtained from Southeastern Michigan Council of Governments

84
Debt Capacity Information
Ratios of Bonded Debt Outstanding
Last Ten Fiscal Years
2012 2013 2014 2015 2016
41,595,000$ 34,925,000$ 28,575,000$ 90,170,000$ 82,955,000$
- - - - -
41,595,000 34,925,000 28,575,000 90,170,000 82,955,000
- - - - -
- - - - -
41,595,000 34,925,000 28,575,000 90,170,000 82,955,000
6,957,964,660 6,545,549,780 6,475,507,460 6,477,712,560 6,645,973,660
0.60% 0.53% 0.44% 1.39% 1.25%
89,500 83,700 84,300 84,300 84,300
465$ 417$ 339$ 1,070$ 984$
37,187$ 37,187$ 37,187$ 37,187$ 37,187$
1,119:1 939:1 768:1 2,425:1 2,231:1

Farmington Public School District
85
Debt Capacity Information
Direct and Overlapping Governmental Activities Debt
June 30, 2016
Governmental Unit
Debt
Outstanding
Estimated
Percent
Applicable
Estimated Share
of Overlapping
Debt
City of Farmington 15,344,306$ 100.00% 15,344,306$
City of Farmington Hills 28,260,000 92.72% 26,202,672
Township of West Bloomfield 40,655,471 3.45% 1,402,614
Oakland County 403,351,276 6.48% 26,137,163
Oakland Community College 1,605,000 6.52% 104,646
Oakland Intermediate School District 46,680,000 6.50% 3,034,200
Total overlapping debt 535,896,053 72,225,601
Direct School District debt 82,955,000 82,955,000
Total direct and overlapping debt 618,851,053$ 155,180,601$
Source: Municipal Advisory Council of Michigan, May 2016
The share of overlapping debt is determined by taking the amount of taxable value in each
jurisdiction that is within the boundaries of the School District as a percentage of the
total taxable value of that jurisdiction. That percentage is then applied to the direct tax-
supported debt of the jurisdiction to determine the School District's overlapping share.
Only tax-supported debt is included in the overlapping debt.

Farmington Public School District
86
2007 2008 2009 2010 2011
Calculation of debt limit:
State equalized valuation (SEV) 5,149,032,060$ 5,223,211,550$ 5,017,437,570$ 4,560,420,200$ 3,901,601,510$
15% of SEV* 772,354,809 783,481,733 752,615,636 684,063,030 585,240,227
Calculation of debt subject to limit:
Total debt 70,350,000 64,545,000 58,550,000 53,070,000 47,425,000
Less debt not subject to limit -
State qualified debt issuance (70,350,000) (64,545,000) (58,550,000) (53,070,000) (47,425,000)
Net debt subject to limit** - - - - -
Legal debt margin 772,354,809$ 783,481,733$ 752,615,636$ 684,063,030$ 585,240,227$
Net debt subject to limit as
a percent of debt limit 0.00% 0.00% 0.00% 0.00% 0.00%
* Public Act No. 451 of Michigan 1976, Sec. 1351A provides debt limits as follows: The bonded indebtedness
of a school district shall not exceed 15 percent of all assessed valuation of the district. Bonds not included
in the computation of the legal debt margin are:
1. Defeased bonds
2. Any bond qualified under Article IX, Section 16 of the 1963 Michigan Constitution
3. Deficit budget bonds as authorized by Sec. 1356
**Based upon the strength of the School District's credit rating, along with a projected increase in taxable values in the
foreseeable future, the School District selected the non-qualified bond option; however, it still met all of the
requirements of the qualification process.
Source: School District audited financial statements
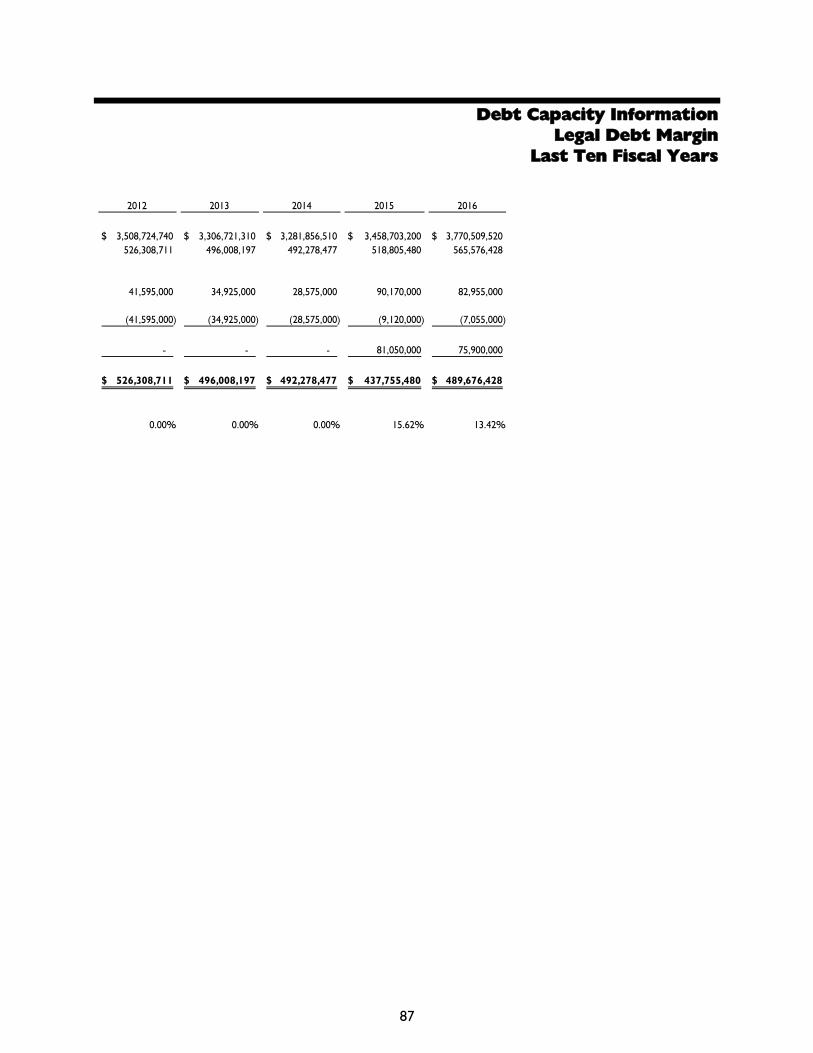
87
Debt Capacity Information
Legal Debt Margin
Last Ten Fiscal Years
2012 2013 2014 2015 2016
3,508,724,740$ 3,306,721,310$ 3,281,856,510$ 3,458,703,200$ 3,770,509,520$
526,308,711 496,008,197 492,278,477 518,805,480 565,576,428
41,595,000 34,925,000 28,575,000 90,170,000 82,955,000
(41,595,000) (34,925,000) (28,575,000) (9,120,000) (7,055,000)
- - - 81,050,000 75,900,000
526,308,711$ 496,008,197$ 492,278,477$ 437,755,480$ 489,676,428$
0.00% 0.00% 0.00% 15.62% 13.42%

Farmington Public School District
88
Demographic and Economic Information
Demographic and Economic Statistics
Last Ten Fiscal Years
Fiscal Year Population
Total Personal
Income
(in thousands)
Per Capita
Personal Income
Unemployment
Rate
2007 91,000 3,120,663$ 34,293$ 5.00%
2008 91,000 3,120,663 34,293 5.70%
2009 89,500 3,069,224 34,293 10.00%
2010 89,500 3,069,224 34,293 11.27%
2011 89,500 3,069,224 34,293 9.02%
2012 89,500 3,328,237 37,187 7.53%
2013 83,700 3,112,552 37,187 7.38%
2014 84,300 3,134,864 37,187 6.26%
2015 84,300 3,134,864 37,187 3.73%
2016 84,300 3,134,864 37,187 2.90%
Sources: U.S. Bureau of the Census, Census 2010
Michigan Department of Labor and Economic Growth
Southeast Michigan Council of Governments

Farmington Public School District
89
Demographic and Economic Information
Principal Employers
2016
Employees
Percentage of
Total Employment
2007
Employees
Percentage of
Total
Employment
Botsford Hospital (Beaumont Health) 2,634 2.86% 2,116 2.86%
Robert Bosch Corporation 1,600 1.74% 1,400 1.89%
Farmington Public School District 1,372 1.49% 1,698 2.30%
Nissan Technical Center North America 1,151 1.25% 1,050 1.42%
Quicken Loans 1,000 1.09% - - %
Cengage Learning (Gale) 850 0.92% - - %
MAHLE Industries, Inc. 850 0.92% - - %
Aditya Birla Minacs 700 0.76% - - %
TRW Automotive Electronics 600 0.65% 589 0.80%
Mercedes-Benz Financial Services 600 0.65% - - %
ACO Incorporated (Great Lakes Ace Hardware) 500 0.54% 190 0.26%
Global Automotive Systems, LLC - - % 999 1.35%
DaimlerChrysler Services North America - - % 953 1.29%
Trinity Health - - % 900 1.22%
Thompson Gale - - % 790 1.07%
Sprint Nextel Corporation - - % 776 1.05%
Total principal employers 11,857 11,461
Total employment 92,066 73,985
Sources: City of Farmington Hills website
Oakland County
Southeast Michigan Council of Governments
Farmington Public School District
Note: Total employment information is obtained from the Bureau of Labor Statistics.
Taxpayer

Farmington Public School District
90
Function/Program 2007 2008 2009 2010 2011
General government:
Instruction 987 935 943 953 841
Support services 580 551 567 579 480
Community service 5 5 5 5 4
Athletics 2 2 2 2 2
Food service 71 71 71 71 69
Total 1,645 1,564 1,588 1,610 1,396
Source: Farmington Public School District Personnel Department
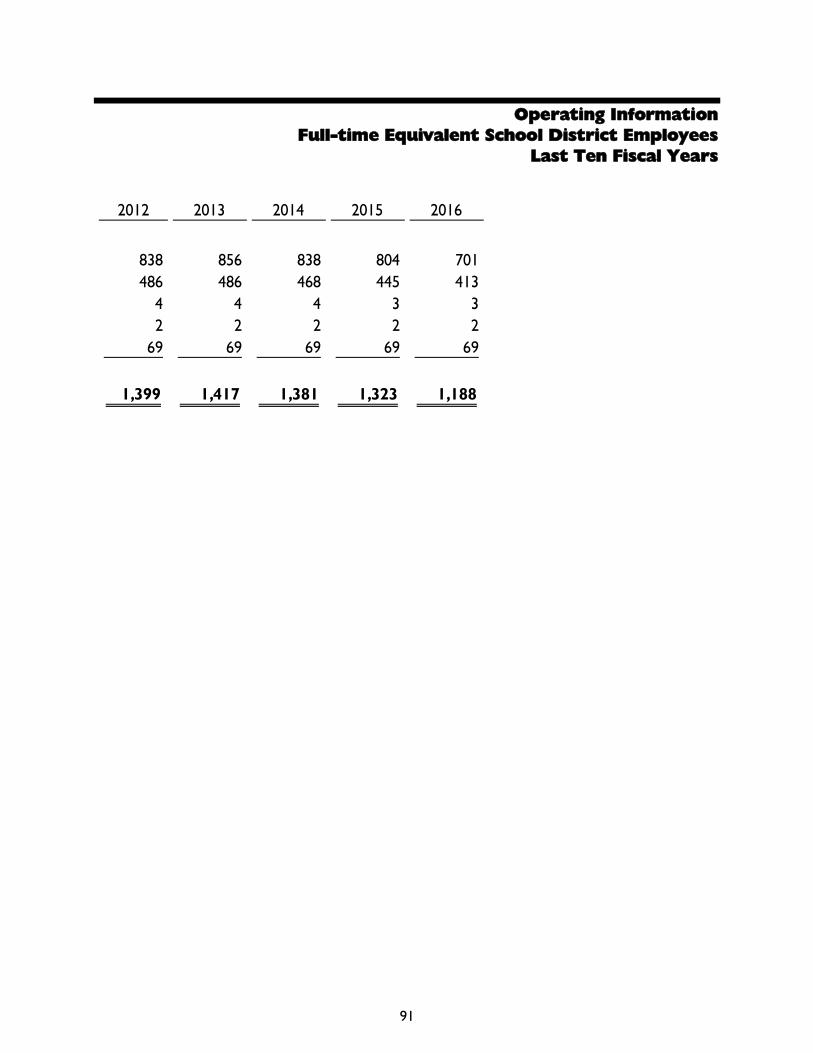
91
Operating Information
Full-time Equivalent School District Employees
Last Ten Fiscal Years
2012 2013 2014 2015 2016
838 856 838 804 701
486 486 468 445 413
4 4 4 3 3
2 2 2 2 2
69 69 69 69 69
1,399 1,417 1,381 1,323 1,188

Farmington Public School District
92
Operating Information
Operating Indicators
Last Ten Fiscal Years
Year Enrollment
Operating
Expenditures
Cost per
Pupil
Operating
Revenue
Revenue per
Pupil
Total
Teaching
Staff
Percentage of
Students
Qualifying for
Free/Reduced
Meals
Average
Teacher
Salary
2007 12,023 145,741,496$ 12,122$ 140,273,367$ 11,667$ 907 12.62% 70,917$
2008 12,018 140,920,297 11,725.77 142,211,296 11,833.19 897 13.61% 71,254
2009 11,908 148,411,803 12,463.20 140,526,434 11,801.01 906 15.50% 74,526
2010 11,832 150,653,406 12,732.71 138,003,848 11,663.61 908 19.23% 75,267
2011 11,567 142,196,852 12,293.32 138,989,831 12,016.07 793 22.72% 78,677
2012 11,335 139,722,381 12,326.63 131,000,331 11,557.15 800 23.80% 76,621
2013 11,149 140,796,620 12,628.63 130,457,034 11,701.23 820 23.08% 75,303
2014 10,776 143,417,384 13,308.96 129,848,413 12,049.78 794 23.68% 75,930
2015 10,332 141,740,089 13,718.55 129,912,019 12,573.75 762 23.51% 76,625
2016 10,097 137,710,021 13,638.71 141,274,125 13,991.69 663 21.80% 75,627
Sources: Farmington Public School District audited financial statements
Michigan Department of Education Bulletin 1014

Farmington Public School District
93
Function/Program 2007 2008 2009 2010 2011
Instructional buildings:
Elementary:
Number of buildings 13 13 13 13 9
Square footage 640,831 640,831 640,831 640,831 459,488
Capacity 5,325 5,325 5,325 5,325 4,389
Enrollment* 4,945 4,879 4,812 4,880 3,879
Upper Elementary:
Number of buildings - - - - 2
Square footage - - - - 209,452
Capacity - - - - 1,830
Enrollment* - - - - 1,655
Middle:
Number of buildings 4 4 4 4 2
Square footage 429,172 429,172 429,172 429,172 232,200
Capacity 3,124 3,124 3,124 3,124 1,848
Enrollment* 2,724 2,651 2,720 2,654 1,752
High:
Number of buildings 3 3 3 3 3
Square footage 734,412 734,412 734,412 734,412 734,412
Capacity 3,856 3,856 3,856 3,856 3,856
Enrollment* 3,949 4,089 3,984 4,054 4,033
Other:
Number of buildings 6 6 6 6 4
Square footage 147,542 147,542 147,542 147,542 112,532
Capacity 755 755 755 755 605
Enrollment* 547 575 488 379 330
Administrative:
Number of buildings 4 4 4 4 3
Square footage 139,853 139,853 139,853 139,853 77,588
Transportation:
Number of garages 1 1 1 1 1
Buses 96 96 96 96 95
Athletics:
Football/Soccer fields 15 15 15 15 15
Running tracks 5 5 5 5 5
Baseball/Softball 31 31 31 31 31
Swimming pools 3 3 3 3 3
Playgrounds 17 17 17 17 14
* Enrollment is based upon the fall head count of pupils.
Source: Farmington Public School District

94
Operating Information
Capital Asset Information
Last Ten Fiscal Years
2012 2013 2014 2015 2016
9 9 9 9 9
459,488 459,488 459,488 459,488 459,488
4,389 4,389 4,389 4,389 4,389
3,773 3,643 3,607 3,431 3,351
2 2 2 2 2
209,452 209,452 209,452 209,452 209,452
1,830 1,830 1,830 1,830 1,830
1,715 1,633 1,523 1,408 1,322
2 2 2 2 2
232,200 232,200 232,200 232,200 232,200
1,848 1,848 1,848 1,848 1,848
1,684 1,704 1,691 1,611 1,530
3 3 3 3 3
734,412 734,412 734,412 734,412 734,412
3,856 3,856 3,856 3,856 3,856
3,944 3,950 3,719 3,639 3,544
4 4 4 4 4
112,532 112,532 112,532 112,532 112,532
605 605 605 605 605
319 300 298 287 248
3 3 3 3 3
77,588 77,588 77,588 77,588 77,588
1 1 1 1 1
96 96 96 96 95
15 15 15 15 15
5 5 5 5 5
31 31 31 31 31
3 3 3 3 3
14 14 14 14 14

32500 Shiawassee StreetFarmington, Michigan 48336 248.489.3349 | Fax 248.489.3314
Our District[ ][ ]
Points of PrideThe District serves approximately 10,000 students in Farmington, Farmington Hills and a portion of West Bloomfield.
The Education Foundation is a community-based organization that provides financial and volunteer support to Farmington Public Schools. Community contributions to the Foundation have enabled the Foundation to award more than $223,400in grants for 212 projects that have touched everyschool, in the form of technology, extra-curricular enrichment, the arts and scholastic achievement.
Involved and supportive parents are one of the many strengths of Farmington Public Schools. Parents are involved in their schools and participate in PTAs/PTSAs, booster groups, the Farmington African American Parent Network (FAAPN), Proud Dads Club and other parent groups.
Since 1996, the City of Farmington Hills, in partnership with the City ofFarmington, Farmington Public Schools and the Farmington Family YMCA,has operated After School Youth Centers which have supportedmore than 8,000 students between the ages of nine through 15.Students can attend the Youth Centers for a nominal fee.
Our District serves students and families who speak morethan 73 languages.
Elementary, Upper Elementary, Middle School and High School Newcomer Centers provide linguistic and educational supports to meet the needs of newly arrived immigrants to the District.
Community
In 2015 IB graduated its first class of
students. Out of the 39 students 64 percent earned the IB Diploma. Ofthe students who did not achieve the
IB Diploma, 18 percent were within 1 point of earning the diploma. Seventy-seven percent of our students who took one or more IB courses
passed with a score of 4 or higher (IB composite assessments are scored on a scale of 1-7). This
is important to note as some universities givestudents credits for scores of 4 or higher.
In Spring of 2013, theInternational Baccalaureate
program achieved World School designation,
the highest endorsementpossible.
In 2015, the community supported a$131.5 million bond proposal for the
improvement of schools, including newbusses and technology.
Since June 2005 through August 2015, Farmington Public Schools have saved $11.7 million in utility costs by reducing
electricity by 36% and natural gas consumption by 36%. For the 2014-2015 fiscal year, the District
has saved more than $1.1 million alone.
AlamedaEarly ChildhoodCenter & FarmingtonCommunity School areaccredited by the NationalAssociation for the Education of Young Children.
Lanigan Elementary School and High-meadow Common Campus have recently been recognized as National PTA Schools of Excellence.
Over the years, seven Farmington Public Schools have been named Michigan Blue Ribbon Exemplary Schools with three also being named National Blue Ribbon Exemplary Schools.
All individual K-12 schools and the District are fully accredited by AdvancED. AdvancED conducts on-site external reviews of schools and districts to ensure that all learners realize their full potential. The District received accreditationin March 2016.
Longacre Elementary School has been awarded the distinction and honor of being named a Leader in Me LIGHTHOUSE School. Longacre is the fifth school in the State of Michigan that has met the rigorous academic and depth of implementation criteria involved in receiving this honor.
95

12
34
56
7
Our Students
32500 Shiawassee StreetFarmington, Michigan 48336 248.489.3349 | Fax 248.489.3314
[ ]
Web Site: www.farmington.k12.mi.usE-mail: [email protected]
Follow us on:
www.facebook.com/FarmingtonPublicSchools
https://twitter.com/fpsinformation
District Mission Statement: Farmington Public Schools, together with our community, will engage every student
in a quality learning experience, empower-ing each student to become a thoughtful, contributing citizen in a changing world.
1 2 3 4 5 6 7
In 2015, Farmington Public Schools graduated 862 students; approximately 94 percent went on to a four-year university, community college or technical school.
94%
TV-10High school students can participate in the District’s student-run television studio, TV-10, which just celebrated more than 32 years of operation.
Points of Pride
• Farmington Public Schools’ students consistently score above state and national averages on the Scholastic Assessment Test (SAT) and the Michigan Student Test of Educational Progress (MSTEP).
• Students from around the District excel in State and National competitions like WordMasters, PTA Reflections and Math Pentathlon.
• Students regularly earn honors as AP Scholars, All State Academic winners and National Merit Award winners. Most recently, nine students earned the distinction of being named National Merit Scholars, and two were finalists for National Achievement Scholarships.
• Approximately 718 students took Advanced Placement exams and 68 percent qualified for college credit on at least one exam in 2014 - 2015. This ultimately saves hundreds of dollars of college tuition for families.
• Students have the opportunity to participate in a wide variety of athletics. Many of the teams have earned divisional, regional and state championship titles.
• The three comprehensive high schools’ musical groups annually compete and win state and national honors.
• The Niche Ranking recently placed Farmington Public Schools 47th on the Niche list of Michigan’s best school districts (19th among metro Detroit schools) with a B+ overall grade.
• The combined high school robotics team, Robohawks, has twice earned the honor to compete in the FIRST Robotics competition.
FACT
S • According to the C.Q. Press Safe City Rankings, Farmington Hills (the 14th largest city in the State) consistently ranks among the top five Safest Cities in Michigan and is the 44th Safest City in the Country.
The District serves approximately 10,000 students in Farmington, Farmington Hills and a portion of West Bloomfield.
96