2016 your publicly owned electric utility
TRANSCRIPT

2016
YOUR PUBLICLY OWNED ELECTRIC UTILITY
City of Healdsburg

ANNUAL ELECTRIC SYSTEM REPORT
CONTENTS 2 – 2015 Power Content Label 3 – Where Does Our Electricity
Come From? 4 – How Does It All Work? 5 – SmartLiving Healdsburg 6 – Rebate Programs: Energy
Efficiency and GHG Reduction
7 – Electric Rate Comparison 8 – System Reliability 9 – Solar10 – Electric Vehicles
MESSAGE FROM THE UTILITY DIRECTORFor more than 100 years, the City of Healdsburg has owned and operated its own Electric Utility. Over the last century, our Utility has grown alongside our community and now serves more than 11,000 residents and 1,000 commercial customers. We obtain electricity from several generation plants throughout northern California that we own, plus maintain over 60 miles of high voltage distribution lines with safety and reliability ratings outperforming other larger utilities. I am proud to say, the City is able to provide this high level of service at a cost 30%+ lower than PG&E, saving the community over 4.7 million dollars each year.
Because we own geothermal (Geysers) and hydroelectric power plants, the City is able to provide electricity with a high renewable and carbon free content. In most years, the City’s electric energy ranges between 50 to 60% carbon free, with roughly 41% of that energy coming from the Geysers. The City’s Power Content allows all of Healdsburg’s customers to show their long standing environmental stewardship while also saving money.
Looking forward, we are excited about our conservation programs and how they support the City’s goals to reduce greenhouse gas emissions. While energy efficiency programs help reduce carbon production, switching from carbon based fuels to carbon free electric energy has a greater impact in reducing greenhouse gas emissions. This is known as “fuel switching.” The City’s Electric Vehicle programs and Green Rate provide the City’s electric customers a path to minimizing carbon production through fuel switching.
It is a privilege to serve the Healdsburg community and I hope that you find this brochure a useful reference for the City’s power supply content, conservation programs, greenhouse gas reduction efforts, and system reliability, as each play a key role in providing service to our community.
Sincerely,
Terry Crowley
Este folleto contiene información acerca de su proveedor de electricidad. Si usted tiene preguntas, favor de llamar 707.431.3346
1
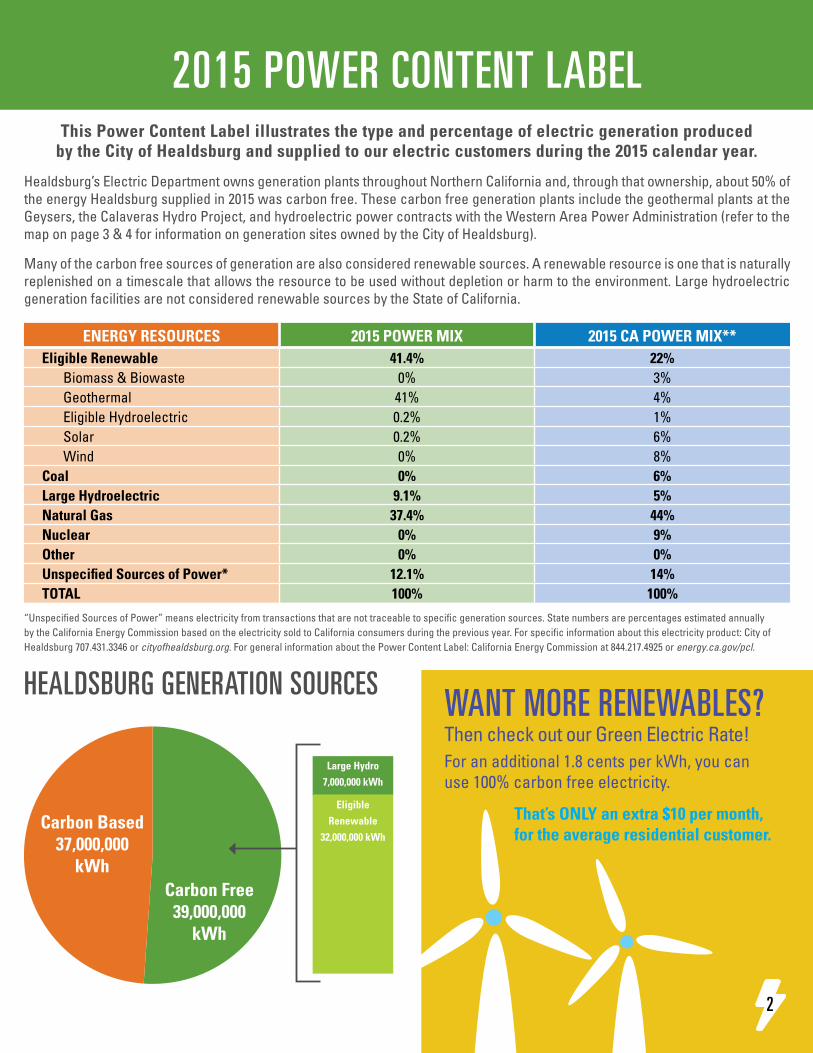
2015 POWER CONTENT LABELThis Power Content Label illustrates the type and percentage of electric generation produced
by the City of Healdsburg and supplied to our electric customers during the 2015 calendar year.
Healdsburg’s Electric Department owns generation plants throughout Northern California and, through that ownership, about 50% of the energy Healdsburg supplied in 2015 was carbon free. These carbon free generation plants include the geothermal plants at the Geysers, the Calaveras Hydro Project, and hydroelectric power contracts with the Western Area Power Administration (refer to the map on page 3 & 4 for information on generation sites owned by the City of Healdsburg).
Many of the carbon free sources of generation are also considered renewable sources. A renewable resource is one that is naturally replenished on a timescale that allows the resource to be used without depletion or harm to the environment. Large hydroelectric generation facilities are not considered renewable sources by the State of California.
“Unspecified Sources of Power” means electricity from transactions that are not traceable to specific generation sources. State numbers are percentages estimated annually by the California Energy Commission based on the electricity sold to California consumers during the previous year. For specific information about this electricity product: City of Healdsburg 707.431.3346 or cityofhealdsburg.org. For general information about the Power Content Label: California Energy Commission at 844.217.4925 or energy.ca.gov/pcl.
ENERGY RESOURCES 2015 POWER MIX 2015 CA POWER MIX**Eligible Renewable 41.4% 22% Biomass & Biowaste 0% 3% Geothermal 41% 4% Eligible Hydroelectric 0.2% 1% Solar 0.2% 6% Wind 0% 8%Coal 0% 6%Large Hydroelectric 9.1% 5%Natural Gas 37.4% 44%Nuclear 0% 9%Other 0% 0%Unspecified Sources of Power* 12.1% 14%TOTAL 100% 100%
WANT MORE RENEWABLES?Then check out our Green Electric Rate! For an additional 1.8 cents per kWh, you can use 100% carbon free electricity.
HEALDSBURG GENERATION SOURCES
That’s ONLY an extra $10 per month, for the average residential customer.
Carbon Based 37,000,000
kWhCarbon Free
39,000,000 kWh
Eligible Renewable
32,000,000 kWh
Large Hydro 7,000,000 kWh
2

WHERE DOES OUR ELECTRICITY COME FROM?
3

Each month, your utility meters are read. The last month’s reading is deducted from the new reading; this difference is your utility usage.
Most residential customers are on a tiered electric rate. Each tier is equal to the baseline usage per day times the number of days in the billing period. Baseline usage per day is 10.2kWh in the Summer and 10.8kWh in the Winter. For this month’s bill, each tier is 296kWh (10.2kWh times 29 days).
The Public Benefits Charge, collected and used to fund our electric customer programs, is located here.
Each bill includes the previous 12 month’s of your utility usage, as well as your average usage per day.
HOW DOES IT ALL WORK?
GENERATIONElectricity is generated at plants or sites for our use. Plants and sites include facilities
that use natural gas, geothermal, and hydroelectric sources to generate electricity.
Average Cost = $0.48 per dollar
TRANSMISSIONPower lines, typically supported by
large towers, transmit electricity between remote generation plants and the
communities that consume the electricity. Average Cost = $0.12 per dollar
DISTRIBUTION Localized high voltage power
lines distribute electricity to our community and neighborhoods.
Average Cost = $0.37 per dollar
Delivering electricity is a complex process. In order to power your lights, electricity must be created at a generation site and travel through a complex web of transmission and distribution lines to reach your home. Every dollar you pay for your electricity is
allocated to the following four categories: Generation, Transmission, Distribution, and Public Benefit Fund.
PUBLIC BENEFITS FUNDEstablished by the State of California in 1996, money collected through this fund is used to support energy efficiency projects and electric rate discounts for low income customers. Average Cost = $0.03 per dollar
4
3
2
1
HOW TO READ YOUR ELECTRIC BILL
4

RESIDENTIAL ELECTRIC REBATES• LED Bulb and Seasonal Lighting• Energy Star® Appliances• Water Heaters• AC and Heat Pumps• Weatherization and Sealing• Pool Pumps
PAY YOUR UTILITY BILL ONLINE• Receive email notifications of new bills.• Make one-time payments or setup automatic payments with a credit/debit card or a bank account.SIGN UP for online bill pay: onlinebiller.com/healdsburg
CARE PROGRAMProvides qualifying residential utility customers with discounted utility rates:
• 25% discount on electricity
• 15% discount on water
• 20% discount on sewer
SMART LIVING HEALDSBURG WHAT CAN WE DO FOR YOU?
COMMERCIAL ELECTRIC REBATESThe City offers a completely customizable energy efficiency rebate program to our commercial customers. Qualifying projects are eligible for both energy reduction and peak demand reduction rebates.
LEARN MORE: SMARTLIVINGHEALDSBURG.ORG5

Rebate Programs kWh Saved That's enough to power this many Healdsburg homes for 1 year
Residential Rebate Programs 52,000 9
Commercial Rebate Programs 262,000 44
City Street Light Conversion 122,000 20
Water Conservation 88,000 15
Total 524,000 87
REBATE PROGRAMS: ENERGY EFFICIENCY & GHG REDUCTION
GAINS IN ENERGY EFFICIENCY THROUGH 2015 REBATE PROGRAMSPAID FOR BY PUBLIC BENEFITS FUNDS
THESE PROGRAMS RESULT IN GREENHOUSE REDUCTIONS OF
In one year, 42 cars emit the same amount of GHG. That’s like taking them all off the road! 6

ELECTRIC RATE COMPARISON
AVERAGE MONTHLY COST FOR RESIDENTIAL CUSTOMER
Healdsburg electric rates are set to cover electric generation, transmission, and distribution costs as well as system and equipment maintenance, staff, and overhead costs. The charts below compares electricity cost for three typical customer types from three local utilities: Healdsburg Electric, PG&E, and Sonoma Clean Power.
HEALDSBURG ELECTRIC $74
SONOMA CLEAN POWER $99
PG&E $111
AVERAGE ANNUAL COST FOR LARGE COMMERCIAL CUSTOMER
32% SAVINGSHEALDSBURG ELECTRIC $160,000
SONOMA CLEAN POWER $231,000
PG&E $237,000
AVERAGE ANNUAL COST FOR SMALL COMMERCIAL CUSTOMER30% SAVINGSHEALDSBURG ELECTRIC $13,100
SONOMA CLEAN POWER $18,400
PG&E $18,700
33% SAVINGS
This analysis was completed using an average Healdsburg household usage of 6,000 kWh per year and the following electric rates: Healdsburg’s D1 tiered rate, PG&E’s E1 tiered rate, and Sonoma Clean Power’s CleanStart E1 rate. Healdsburg residential customers save an average of 33% compared to PG&E, or $450 a year.
A small commercial customer is one whose peak demand is less than 60kW for 10 of the last 12 months. This analysis was completed using an average Healdsburg small business usage of 95,000 kWh per year and the following rates: Healdsburg’s C1 rate, PG&E’s A1 rate, and Sonoma Clean Power’s CleanStart A1 rate. Healdsburg small commercial customers save an average of 30% compared to PG&E, or $5,600 a year.
A large commercial customer is one whose peak demand is more than 60kW for 3 of the last 12 months. This analysis was completed using an average Healdsburg large business usage of 1.2 MWh per year, an average peak demand of 370kW, and the following rates: Healdsburg’s P2 rate, PG&E’s A10 rate, and Sonoma Clean Power’s CleanStart A10 rate. Healdsburg large commercial customers save an average of 32% compared to PG&E, or $77,000 a year.
7

SYSTEM RELIABILITY
AVERAGE INTERRUPTION DURATION (SAIDI) AVERAGE INTERRUPTION FREQUENCY (SAIFI)
HAVE AN OUTAGE? OR ANOTHER URGENT ELECTRIC, WATER, WASTEWATER ISSUE?
The City uses two key measurements to track system reliability. These indices are System Average Interruption Duration Index (SAIDI) and System Average Interruption Frequency Index (SAIFI). SAIDI represents the average customer’s total outage minutes per year and SAIFI represents the average number of outages per year a customer will experience.
The average frequency index represents each customer’s average number of outages per year.
The average interruption index represents the average total outage minutes per year a customer experiences.
Call the 24-Hour Utility Hotline 707.431.7000 or Toll-Free 855.755.6586
LOWER NUMBERS = BETTER SYSTEM PERFORMANCE
0.0
0.2
0.4
0.6
0.8
1.097.4
72.4
2.3
CITY OF HEALDSBURG
CITY OF HEALDSBURG
PG&E SYSTEM WIDE
PG&E SYSTEM WIDE
PG&E NORTH BAY REGION
PG&E NORTH BAY REGION
MIN
UTES
.904
.688
.021
FREQ
UEN
CY
0
20
40
60
80
100
8

The Electric Department connected its first photovoltaic (PV) system in 2002 and today has over 1.1 MW of solar panels interconnected in city limits. The Electric Department has facilitated this with its distribution of over $830,000 in solar incentives to our customers. Although the incentive program is now closed, both residential and commercial customers continue to install PV systems.
Healdsburg electric customers may be eligible to offset part or all of their electric usage with a PV system. Tax credits may also be available to help with the installation of a PV system.
SOLAR
INFORMATION TO CONSIDER WHEN PURCHASING A SOLAR SYSTEM AND SELECTING A CONTRACTOR:1. Make sure you get 3 quotes.2. How much electricity do you use? Because of our rates, it may not be cost effective to offset all of your usage. 3. Healdsburg electricity is already highly renewable and carbon free (see page 2).4. The orientation of your roof - southern exposure is best, western is good as well. Northern and eastern are not.5. Shade and solar panels don’t mix, it will dramatically reduce the system production.6. Call us with any questions, 707.431.3346. We are always happy to help!
The average cost for solar projects completed over that last year was $4.30 per watt. While prices will vary by project, you shouldn’t pay significantly more than the average.
0
100,000
200,000
300,000
400,000
500,000
600,000
SOLAR SYSTEMS INSTALLED EACH YEAR AND THE ELECTRICITY THEY GENERATE
Num
ber o
f Sys
tem
s In
stal
led
Elec
trici
ty G
ener
ated
, kW
h
2005 2006 2007 2008 2009 2010 2011 2012 2013 2014 2015 2016
= systems installed during our rebate period
= systems installed after the rebate program closed
0
5
10
15
20
25
30
Projects installed Generation
9

15% DISCOUNT!Residents who own a plug-in electric vehicle registered in town are eligible to receive a 15% discount on their electricity bill. For more info: healdsburgutilities.org
CITY HALL CHARGING STATION STATS50¢ / HOUR DURING THE DAY, FREE NIGHTS AND WEEKENDS
66,000 kWh used
28 metric tons of GHG saved
8,300 gallons of gasoline saved
7,700 total charge-ups
ELECTRIC VEHICLES
10

EASY WAYS TO MAKE YOUR HOME ENERGY EFFICIENT
Rebates available for many of these improvements.
£Inform Yourself £Install Insulation£Check Your Windows£Install Motion Sensor
Switches & Timers£Caulk & Weather-Strip Doors£Replace Old Electric Appliances£Look for the Energy Star Name & Label£Wash your Laundry in Cold Water£Install a Programmable Thermostat£Set Thermostat to Heat at 68˚ and
Cool at 78˚£Use Led Light Bulbs£Use Led Accent Lighting
24-HOUR UTILITY RESPONSE HOTLINE707.431.7000 or Toll-Free 855.755.6586
✔
PARTICIPATEIf you are interested in learning more about your water utility or water quality, you can direct your questions, concerns or comments to the Electric, Water & Wastewater Department at 401 Grove Street, Healdsburg or by calling 707.431.3346.
You may also present comments directly to the Healdsburg City Council, which meets on the first and third Monday of each month at 6:00 PM, at 401 Grove Street. City Council meetings are open to the public. For meeting dates and agendas, visit cityofhealdsburg.org.
ANNUAL ELECTRIC REPORT
Electric, Water & Wastewater Department
401 Grove Street, Healdsburg, CA 95448
cityofhealdsburg.org