2016 yearbook of natural gas distributors yearbook of natural gas distributors balance sheet assets...
TRANSCRIPT

2016 Yearbook of
Natural Gas Distributors

2016 Yearbook of
Natural Gas Distributors
Table of Contents Page
Industry Metrics Snapshot 2
Balance Sheet 3
Balance Sheet Graphs 4
Income Statement 6
Income Statement Graphs 7
Financial Ratios 8
Financial Ratios Graphs 9
General Customer Information 12
General Customer Information Graphs 14
Service Quality Requirements 15
Cross-Reference to Uniform System 16Of Accounts
Background on Statistical Yearbook of
Natural Gas Distributors
The Ontario Energy Board (OEB) is the regulator of
Ontario's natural gas and electricity sectors. In the
natural gas sector, the OEB reviews and approves
rates proposed to be charged to customers by
regulated natural gas distributors.* The OEB licenses
all marketers who sell natural gas to residential and
small commercial customers.
*There are five small gas companies that are exempt from rate regulation under the OEB Act, as well as two municipally owned gas
companies (City of Kitchener and City of Kingston) that are not rate regulated by the OEB.
The OEB provides this Yearbook of Natural Gas
Distributors to publish the financial and operational
information collected from regulated natural gas
distributors. It is compiled from data submitted by the
distributors through the OEB's Reporting and Record-
Keeping Requirements. This Yearbook is also
available electronically on the OEB's website.
1
2016 Yearbook of
Natural Gas Distributors
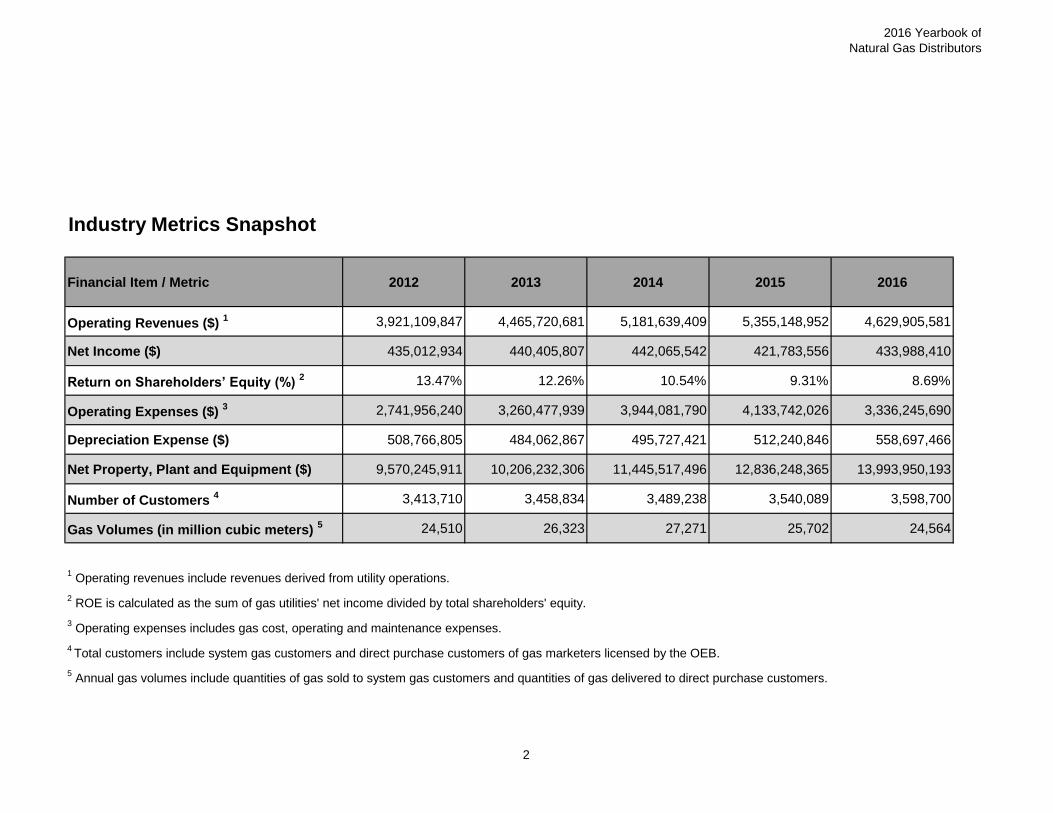
Industry Metrics Snapshot
Financial Item / Metric 2012 2013 2014 2015 2016
Operating Revenues ($) 1 3,921,109,847 4,465,720,681 5,181,639,409 5,355,148,952 4,629,905,581
Net Income ($) 435,012,934 440,405,807 442,065,542 421,783,556 433,988,410
Return on Shareholders’ Equity (%) 2 13.47% 12.26% 10.54% 9.31% 8.69%
Operating Expenses ($) 3 2,741,956,240 3,260,477,939 3,944,081,790 4,133,742,026 3,336,245,690
Depreciation Expense ($) 508,766,805 484,062,867 495,727,421 512,240,846 558,697,466
Net Property, Plant and Equipment ($) 9,570,245,911 10,206,232,306 11,445,517,496 12,836,248,365 13,993,950,193
Number of Customers 4 3,413,710 3,458,834 3,489,238 3,540,089 3,598,700
Gas Volumes (in million cubic meters) 5 24,510 26,323 27,271 25,702 24,564
1 Operating revenues include revenues derived from utility operations.
2 ROE is calculated as the sum of gas utilities' net income divided by total shareholders' equity.
3 Operating expenses includes gas cost, operating and maintenance expenses.
4 Total customers include system gas customers and direct purchase customers of gas marketers licensed by the OEB.
5 Annual gas volumes include quantities of gas sold to system gas customers and quantities of gas delivered to direct purchase customers.
2

2016 Yearbook of
Natural Gas Distributors
BALANCE SHEET
ASSETS ENBRIDGE UNION NRG INDUSTRYCurrent Assets
Cash 55,280,271$ -$ -$ 55,280,271$
Accounts Receivable 503,910,589 710,634,521 926,181 1,215,471,291
Gas Inventories 508,944,627 221,524,426 - 730,469,053
Other Current Assets 122,198,413 35,660,990 72,919 157,932,322
Total Current Assets 1,190,333,900 967,819,937 999,100 2,159,152,937
Non-Current Assets
Property, Plant & Equipment 7,473,331,813 6,507,919,225 12,699,155 13,993,950,193
Long-Term Investments 843,495,686 - - 843,495,686
Deferred Charges 197,012,312 485,441,181 - 682,453,493
Other Non-Current Assets 381,489,698 11,847,180 1,832,079 395,168,957
Total Non-Current Assets 8,895,329,509 7,005,207,586 14,531,234 15,915,068,329
TOTAL ASSETS 10,085,663,409$ 7,973,027,523$ 15,530,334$ 18,074,221,266$
LIABILITIES & SHAREHOLDERS' EQUITY
Current Liabilities
Bank Overdraft, Loans and Notes Payable 344,851,989 269,320,508 501,838 614,674,335 Accounts Payable & Accrued Liabilities 737,781,217 1,052,060,257 2,016,704 1,791,858,178
Other Current Liabilities 95,793,874 44,377,908 2,037 140,173,819
Income Taxes Payable 17,271,753 10,353,799 - 27,625,552
Current Portion of Long-Term Debt 499,803,037 125,000,000 - 624,803,037
Total Current Liabilities 1,695,501,870 1,501,112,472 2,520,579 3,199,134,921
Non-Current Liabilities
Long-Term Debt 3,855,000,000 3,319,858,600 7,657,476 7,182,516,076
Deferred Income Taxes - 515,823,745 (131,000) 515,692,745
Other Non-Current Liabilities 1,352,220,870 832,610,236 743,916 2,185,575,022
Total Non-Current Liabilities 5,207,220,870 4,668,292,581 8,270,392 9,883,783,843
TOTAL LIABILITIES 6,902,722,740 6,169,405,053 10,790,972 13,082,918,764
SHAREHOLDERS' EQUITYShare Capital & Retained Earnings 3,182,940,669 1,803,622,470 4,739,363 4,991,302,502
LIABILITIES & SHAREHOLDERS' EQUITY 10,085,663,409$ 7,973,027,523$ 15,530,334$ 18,074,221,266$
3

2016 Yearbook of
Natural Gas Distributors
0
1
2
3
4
5
6
7
8
2012 2013 2014 2015 2016
$ B
illio
ns
Long-Term Debt & Equity
Long Term Debt Equity
Enbridge Union NRG
Net PP&E 7.47 6.51 0.01
0
1
2
3
4
5
6
7
8
$ B
illio
ns
Net Property and Equipment by Distributor
3B 3B 3B 3B 3B 3B 3B 3B 3B 3B 3B
4

2016 Yearbook of
Natural Gas Distributors
2012 2013 2014 2015 2016
Net PP&E 9.6 10.2 11.4 12.8 14.0
0
2
4
6
8
10
12
14
16
$ B
illio
ns
Net Property Plant and Equipment
5

2016 Yearbook of
Natural Gas Distributors
INCOME STATEMENT
ENBRIDGE UNION NRG INDUSTRYRevenues
Operating Revenues $ 2,812,685,537 $ 1,806,770,389 $ 10,449,655 4,629,905,581$
Other Income 86,774,198 33,241,716 15,114 120,031,028
2,899,459,735 1,840,012,105 10,464,769 4,749,936,609
Expenses
Gas Cost, Operating and Maintenance 2,123,230,699 1,204,512,317 8,502,674 3,336,245,690
Depreciation 318,506,197 239,079,791 1,111,478 558,697,466
Interest 221,298,096 169,776,506 162,489 391,237,091
2,663,034,992 1,613,368,614 9,776,641 4,286,180,247
Income Before Income Taxes 236,424,743 226,643,491 688,128 463,756,362
Income Taxes 8,239,294 21,277,487 203,500 29,720,281
Net Income After Taxes 228,185,449 205,366,004 484,628 434,036,081
Extraordinary Items - - (47,670) (47,670)
Net Income (Loss) $ 228,185,449 $ 205,366,004 $ 436,957 $ 433,988,410
Note: Reported results include certain non-utility activities that are not regulated by the Ontario Energy Board.
6

2016 Yearbook of
Natural Gas Distributors
2012 2013 2014 2015 2016
Total Expenses 2.7 3.3 3.9 4.1 3.3
0.0
0.5
1.0
1.5
2.0
2.5
3.0
3.5
4.0
4.5
$ B
illio
ns
Total Gas Cost, Operating and Maintenance Expense
2012 2013 2014 2015 2016
Net Income 435 440 442 422 434
200
250
300
350
400
450
500
$ M
illio
ns
Net Income
7

2016 Yearbook of
Natural Gas Distributors
FINANCIAL RATIOS
ENBRIDGE UNION NRG INDUSTRY
Liquidity RatiosCurrent Ratio 0.70 0.64 0.40 0.67
(Current Assets/Current Liabilities)
Leverage RatiosDebt Ratio 0.47 0.47 0.53 0.47 (Total Debt/Total Assets)
Debt to Equity Ratio 1.48 2.06 1.72 1.69 (Total Debt/Shareholders' Equity)
Interest Coverage 2.07 2.33 5.23 2.19 (EBIT/Interest Charges)
Profitability RatiosFinancial Statement Return on Assets 2.26% 2.58% 2.81% 2.40%(Net Income/Total Assets)
Financial Statement Return on Equity 7.17% 11.39% 9.22% 8.69%(Net Income/Shareholders' Equity)
8

2016 Yearbook of
Natural Gas Distributors
2012 2013 2014 2015 2016
Current 0.77 0.75 0.72 0.82 0.67
-
0.10
0.20
0.30
0.40
0.50
0.60
0.70
0.80
0.90
Current Ratio (Current Assets/Current Liabilities)
2012 2013 2014 2015 2016
Debt 0.48 0.46 0.47 0.48 0.47
-
0.10
0.20
0.30
0.40
0.50
0.60
0.70
0.80
0.90
Debt Ratio (Total Debt/Total Assets)
7B 7B
9
2016 Yearbook of
Natural Gas Distributors
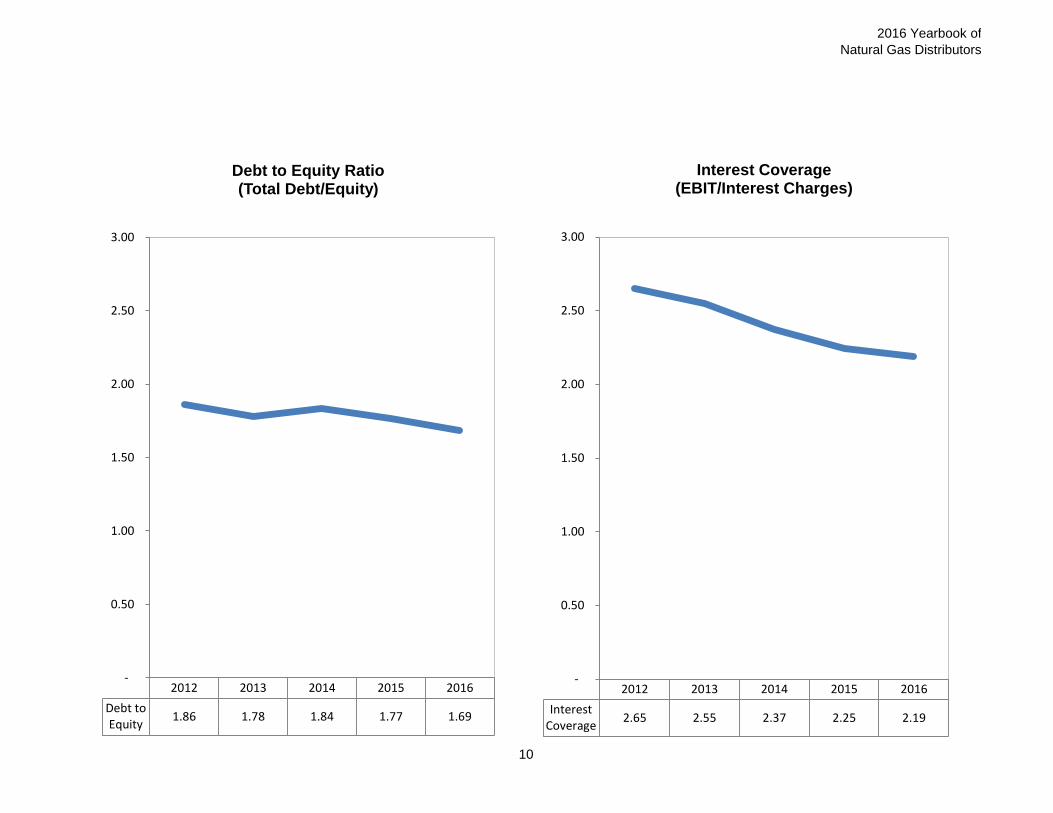
2012 2013 2014 2015 2016
Debt toEquity
1.86 1.78 1.84 1.77 1.69
-
0.50
1.00
1.50
2.00
2.50
3.00
Debt to Equity Ratio (Total Debt/Equity)
2012 2013 2014 2015 2016
InterestCoverage
2.65 2.55 2.37 2.25 2.19
-
0.50
1.00
1.50
2.00
2.50
3.00
Interest Coverage (EBIT/Interest Charges)
10
2016 Yearbook of
Natural Gas Distributors
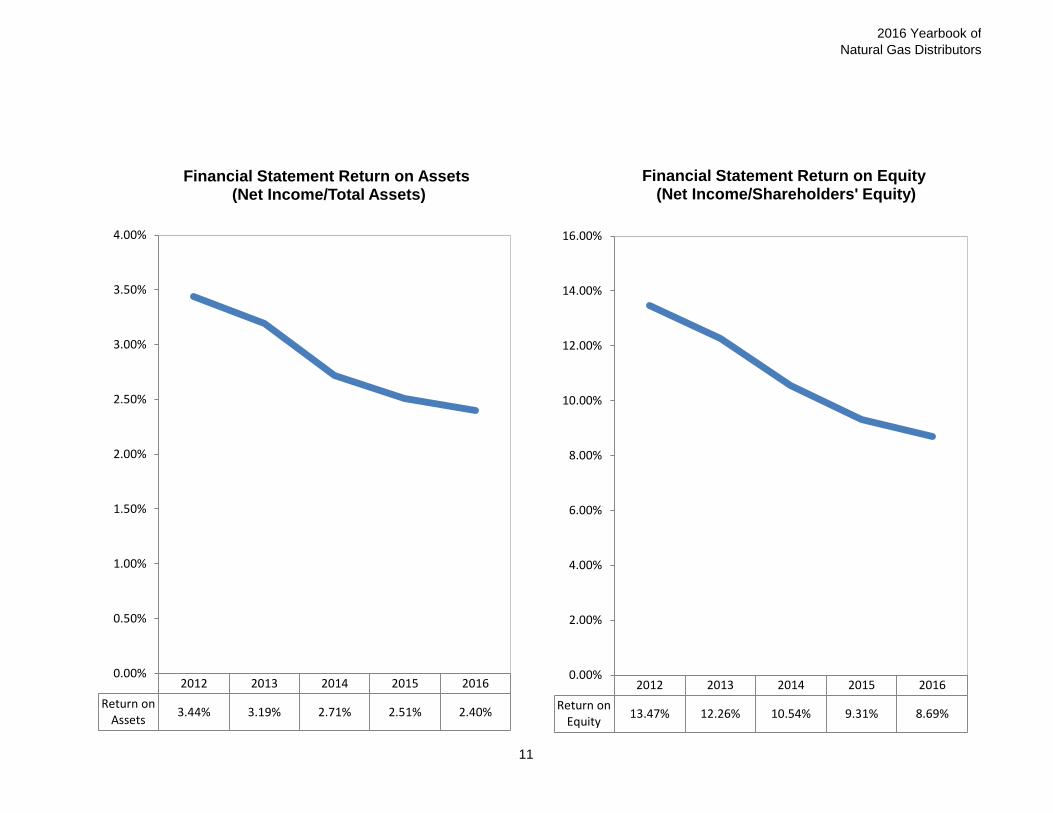
2012 2013 2014 2015 2016
Return onAssets
3.44% 3.19% 2.71% 2.51% 2.40%
0.00%
0.50%
1.00%
1.50%
2.00%
2.50%
3.00%
3.50%
4.00%
Financial Statement Return on Assets (Net Income/Total Assets)
2012 2013 2014 2015 2016
Return onEquity
13.47% 12.26% 10.54% 9.31% 8.69%
0.00%
2.00%
4.00%
6.00%
8.00%
10.00%
12.00%
14.00%
16.00%
Financial Statement Return on Equity (Net Income/Shareholders' Equity)
11

2016 Yearbook of
Natural Gas Distributors
General Customer Information
Total Number of Customers 1
For year ended December 31
ENBRIDGE UNION NRG INDUSTRY
Residential1,987,286 1,336,856 8,054 3,332,196
Non-Residential143,979 121,864 661 266,504
2,131,265 1,458,720 8,715 3,598,700
Total Volumes 2
In million cubic meters
ENBRIDGE UNION NRG INDUSTRY
Residential4,597 2,816 20 7,433
Non-Residential6,528 10,559 45 17,131
11,124 13,375 65 24,564
2 Annual gas volumes include quantities of gas sold to system gas customers and quantities of gas delivered to direct purchase customers.
1 Total number of customers include system gas customers who purchase gas supply from their utility and direct purchase customers of marketers licensed
by the OEB.
12

2016 Yearbook of
Natural Gas Distributors
General Customer Information
System Gas Customers 1
For year ended December 31
ENBRIDGE UNION NRG INDUSTRY
Low Volume2,009,329 1,355,618 8,637 3,373,584
Large Volume6,457 5,732 6 12,195
1 System Gas Customers (subset of Total Customers) refer to customers who purchase gas supply from their utility.
Low Volume Customer - Less than 50,000 cubic meters/year.
Large Volume Customer - Greater than 50,000 cubic meters/year.
13

2016 Yearbook of
Natural Gas Distributors
Enbridge 2,131,265
59.22%
Union 1,458,720
40.53%
NRG 8,715 0.24%
Number of Customers
Enbridge 11,124 45.29%
Union 13,375 54.45%
NRG 65 0.26%
Gas Volumes in million cubic meters
14

2016 Yearbook of
Natural Gas Distributors
Service Quality Requirements
ENBRIDGE UNION NRG
Call Answering Service Level (OEB Minimum Standard: 75%)
82.40% 80.10% 98.50%
Number of Calls Abandon Rate (OEB Standard: not exceed 10%)
1.80% 3.60% 1.50%
Meter Reading Performance (OEB Standard: not exceed 0.5%)
0.40% 0.10% 0.00%
Appointments Met within Designated Time Period (OEB Minimum Standard: 85%)
94.80% 98.90% 99.30%
Time to Reschedule Missed Appointments (OEB Standard: 100%)
94.20% 99.80% 100.00%
Emergency Calls Responded within One Hour (OEB Minimum Standard: 90%)
96.10% 98.80% 93.20%
Number of Days to Provide a Written Response (OEB Minimum Standard: 80%)
95.50% 100.00% 100.00%
Number of Days to Reconnect a Customer (OEB Minimum Standard: 85%)
93.70% 86.20% 91.70%
15

2016 Yearbook of
Natural Gas Distributors
Cross-Reference to Uniform System of Accounts for Gas Utilities
Item Aggregation of Trial Balance (RRR section 2.1.7) accountsCash Accounts 130-131 if debit balance
Accounts Receivable - Net Accounts 132+140-147
Gas Inventories Accounts 152+153
Other Current Assets Accounts 150+151+160-163 + 256 if debit balance
Property, Plant & Equipment Accounts 100-116
Long Term Investments Accounts 120-123
Deferred Charges Accounts 170-179
Other Non-Current Assets Accounts 180-183 + 276 if debit balance
Bank Overdraft, Loans and Notes Payable Accounts 130-131 if credit balance + 250
Accounts Payable & Accrued Liabilities Accounts 251+252+254+259
Other Current Liabilities Accounts 253+255+257+260+263
Income Taxes Payable Account 256 if credit balance
Current Portion of Long-term Loan Accounts 258+262
Long-term Debt Accounts 220-249
Total Debt Accounts 130-131 if credit balance + 220-249 + 250 + 258 + 262
Deferred Income Taxes Account 276 if credit balance
Other Non-Current Liabilities Accounts 270+271+278+279+290
Share Capital Retained Earnings Accounts 200-216
Operating Revenues Account 300
Other Income Accounts 307+308+310+312-316+319+324+325+333
Gas Cost, Operating and Maintenance Expenses Accounts 301+302+305+311+321+326-331
Depreciation Expense Accounts 303+304
Interest Expense Accounts 320+322+323
Income Taxes (Current and Deferred) Account 306
Extraordinary Items Accounts 338-339
16