2016 top markets report environmental...
TRANSCRIPT
2016 ITA Environmental Technologies Top Markets Report | 1 This case study is part of a larger Top Markets Report. For additional content, please visit www.trade.gov/topmarkets.
U.S. Department of Commerce | International Trade Administration | Industry & Analysis
2016 Top Markets Report Environmental Technologies
Overview and Key Findings Introduction The global market for environmental technologies goods and services reached USD 1.05 trillion in 2015. The United States is host to the single largest market and accounted for USD 303.0 billion of the global market. U.S. environmental companies exported USD 51.2 billion worth of goods and services in 2015. The U.S. industry for environmental technologies employed approximately 1.6 million people and had revenues of USD 320.4 billion.1 On May 14, 2012, then-Commerce Secretary Bryson and U.S. Environmental Protection Agency (U.S. EPA) Administrator Jackson announced the creation of the U.S. Environmental Export Initiative (EEI). The EEI is now a sector-specific effort within NEI/Next that addresses the unique role environmental export promotion plays in advancing the economic, environmental, sustainable development and diplomatic goals of the United States. Led by the International Trade Administration (ITA) and the U.S. EPA, the EEI is a government-wide
initiative coordinated through the Environmental Trade Working Group (ETWG) of the Trade Promotion Coordinating Committee (TPCC). The initiative leverages U.S. EPA’s world-renowned regulatory and scientific expertise on solving challenging environmental problems with ITA and other TPCC agencies’ trade policy, promotion and finance capabilities. The overarching goal of the EEI is to deliver, within the context of finite government resources, targeted trade promotion and policy programs that enhance the international competitiveness of the U.S. environmental technologies industry and, in so doing, help mitigate global pollution problems. Specific objectives include the dissemination of U.S. technical knowledge and expertise to foreign environmental regimes, the identification and removal of trade and competitiveness barriers, and the provision of targeted industry specific export promotion services to U.S. companies. Top Markets: Key Findings and Methodology This Top Markets Report supports the efforts of the EEI
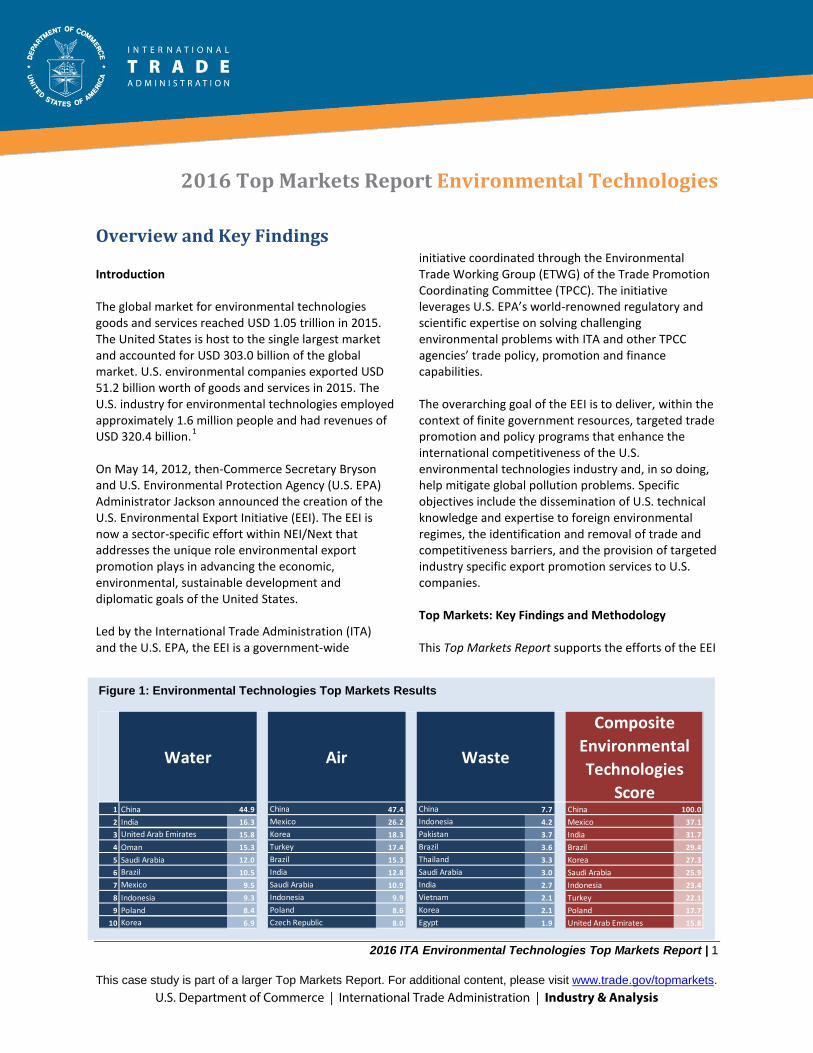
Figure 1: Environmental Technologies Top Markets Results
1 China 44.9 China 47.4 China 7.7 China 100.02 India 16.3 Mexico 26.2 Indonesia 4.2 Mexico 37.13 United Arab Emirates 15.8 Korea 18.3 Pakistan 3.7 India 31.74 Oman 15.3 Turkey 17.4 Brazil 3.6 Brazil 29.45 Saudi Arabia 12.0 Brazil 15.3 Thailand 3.3 Korea 27.36 Brazil 10.5 India 12.8 Saudi Arabia 3.0 Saudi Arabia 25.97 Mexico 9.5 Saudi Arabia 10.9 India 2.7 Indonesia 23.48 Indonesia 9.3 Indonesia 9.9 Vietnam 2.1 Turkey 22.19 Poland 8.4 Poland 8.6 Korea 2.1 Poland 17.7
10 Korea 6.9 Czech Republic 8.0 Egypt 1.9 United Arab Emirates 15.8
Water Air Waste
Composite Environmental Technologies
Score
2016 ITA Environmental Technologies Top Markets Report | 2 This case study is part of a larger Top Markets Report. For additional content, please visit www.trade.gov/topmarkets.
by identifying and ranking export markets where focusing finite government resources will have the greatest impact in terms of increasing commercial opportunity for U.S. companies. This study distills market forecasts and quantitative assessments into overall market scores that identify and rank export markets relative to three critical traits: first, markets that are large and growing in absolute terms; second, those that have a defined and increasing need for imported technology and services; and third, those where U.S. exports are lower than predicted, based on markets with similar characteristics -- this last component indicates that policy and trade barriers might exist and thus where U.S. government intervention is most helpful. The rankings are then filtered further to adjust for mature markets that are relatively frictionless – markets that are large and open to U.S. products and services and that boast relative ease of doing business overall2. The final result is a list of large and growing markets where the scope of opportunity is countered by the presence of policy or other barriers; these are the markets where U.S. government policy and promotion activities have the highest potential for impact relative to the U.S. government resources available for policy and promotion activities. These markets and their environmental subsector are scored on a scale from 0 to 100, with 100 being the highest
score achievable on the Composite Environmental Technologies Score. Utilizing these scores, the reader can assess the relative contribution of a given markets subsectors to its composite score and can compare both subsectors and composite scores across markets. (See Figure 1 for scores and rankings and the methodology section for a detailed description of this study’s methods). The next step is a qualitative assessment of opportunities and challenges in the top 10 ranked markets. Industry and market experts collaborated on this effort to define the scope of opportunity for U.S. companies as well as to identify barriers and obstacles that should be addressed by the U.S. government. This analysis leads to the subsequent identification of programmatic and policy remedies best suited to meet both the challenges and opportunities afforded in these critical markets. This suite of programs forms a nexus of trade promotion and policy interventions that are mutually reinforcing. By considering both promotion opportunities and policy barriers in this context and developing a holistic response, this study serves as a strategic guide and foundational document to drive interagency coordination for environmental export promotion.
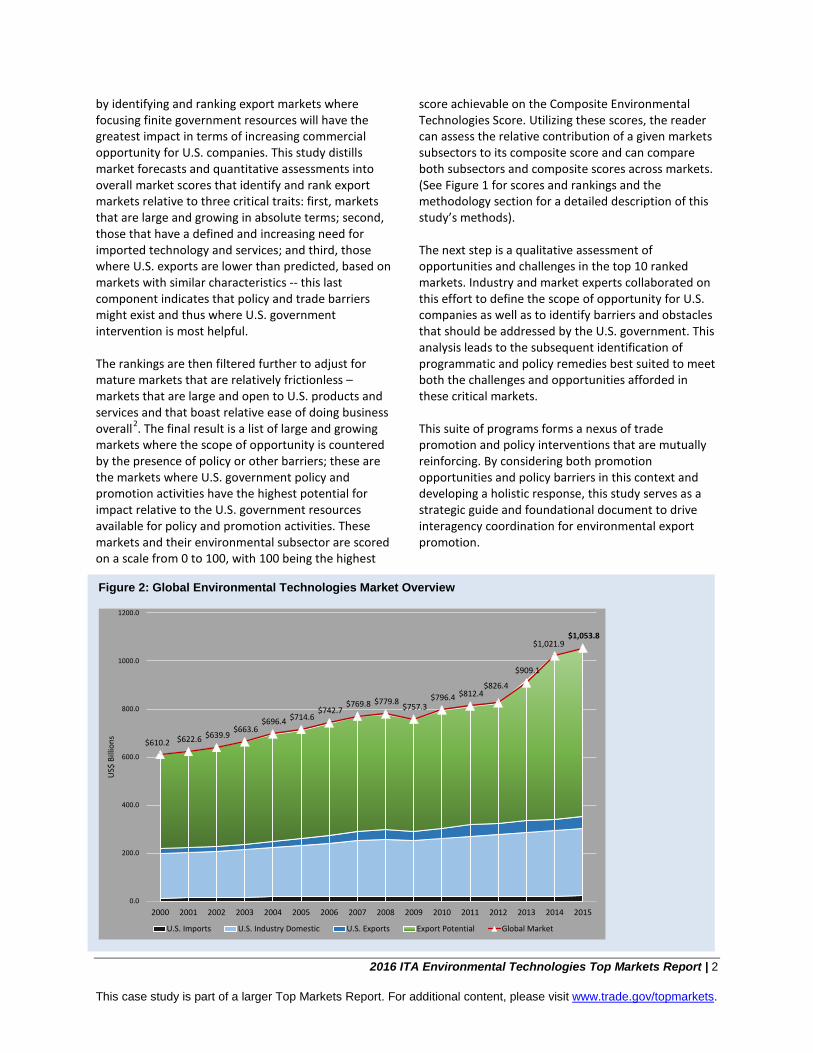
Figure 2: Global Environmental Technologies Market Overview
$610.2 $622.6 $639.9 $663.6
$696.4 $714.6 $742.7
$769.8 $779.8 $757.3 $796.4 $812.4
$826.4
$909.1
$1,021.9 $1,053.8
0.0
200.0
400.0
600.0
800.0
1000.0
1200.0
2000 2001 2002 2003 2004 2005 2006 2007 2008 2009 2010 2011 2012 2013 2014 2015
US$
Bill
ions
U.S. Imports U.S. Industry Domestic U.S. Exports Export Potential Global Market

2016 ITA Environmental Technologies Top Markets Report | 3 This case study is part of a larger Top Markets Report. For additional content, please visit www.trade.gov/topmarkets.
Global Industry Landscape Understanding Global Environmental Markets Before a government strategy to address the opportunities and challenges to environmental technology exports can be developed, a common definition of the environmental technology industry must be established. This is particularly important for environmental technologies, since the term could include any permutation of goods and services that might fall under the nebulous category of environmentally friendly or beneficial. In practice, producers of environmental technology have a clear definition for their sector. From an industry perspective, environmental technologies are defined as all industrial goods and services that:
1. Foster environmental protection and physical resource efficiency in industrial settings;
2. Generate compliance with environmental regulations;
3. Prevent or mitigate pollution; 4. Manage or reduce waste streams; 5. Remediate contaminated sites; 6. Design, develop and operate environmental
infrastructure; and 7. Afford the provision and delivery of
environmental resources. Environmental technologies are generally categorized by the three environmental media they are designed to protect or provide, which are air, water and soil. Water, Wastewater, and Industrial Water The water media category addresses the water and wastewater treatment subsector with key segments that include municipal drinking water treatment and delivery, municipal wastewater conveyance and treatment, ground and surface water remediation, industrial process water treatment, and industrial wastewater treatment. U.S. industry revenue in the water and wastewater treatment subsector in 2014 was USD 154.6 billion; this figure includes analytical services, wastewater treatment services, consulting and engineering, equipment and chemicals, instruments and information systems, and utilities.3 Municipal drinking water treatment and delivery, municipal wastewater conveyance and treatment, and
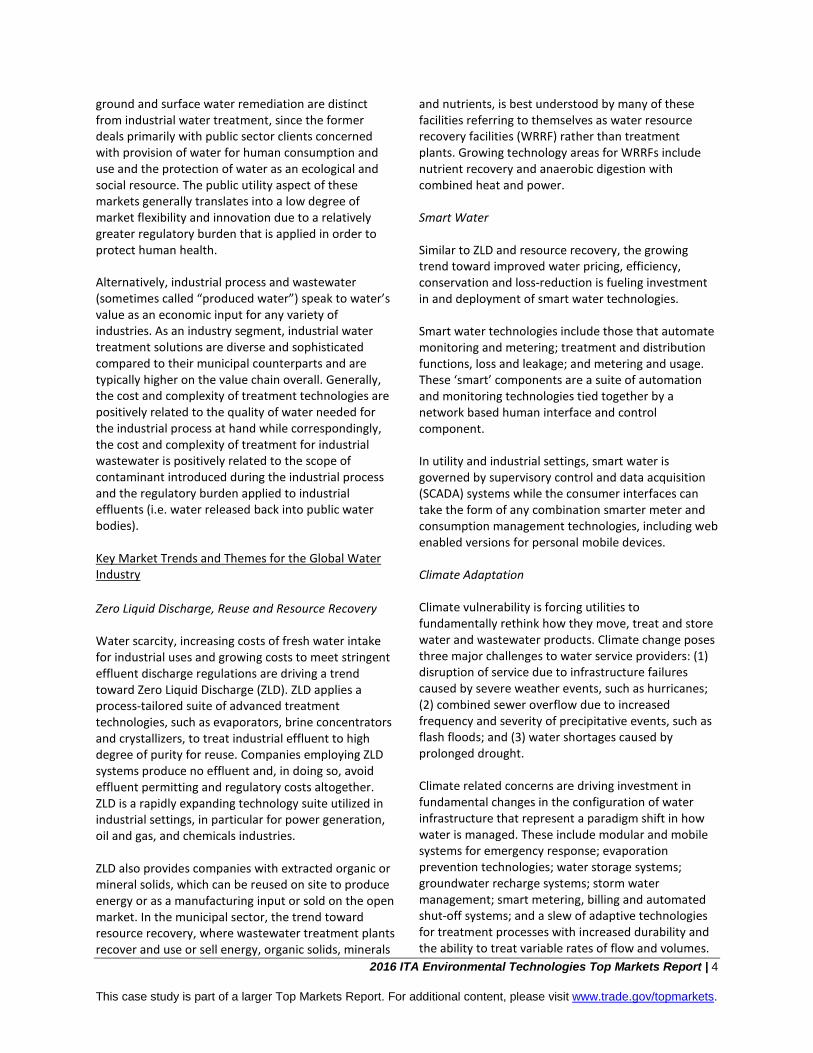
Figure 3: U.S. Industry Revenues by Segment
Source: Environmental Business International with ITA analysis
Services: $253.3 Billion
Manufacturing: $67.1 Billion
2016 ITA Environmental Technologies Top Markets Report | 4 This case study is part of a larger Top Markets Report. For additional content, please visit www.trade.gov/topmarkets.
ground and surface water remediation are distinct from industrial water treatment, since the former deals primarily with public sector clients concerned with provision of water for human consumption and use and the protection of water as an ecological and social resource. The public utility aspect of these markets generally translates into a low degree of market flexibility and innovation due to a relatively greater regulatory burden that is applied in order to protect human health.
Alternatively, industrial process and wastewater (sometimes called “produced water”) speak to water’s value as an economic input for any variety of industries. As an industry segment, industrial water treatment solutions are diverse and sophisticated compared to their municipal counterparts and are typically higher on the value chain overall. Generally, the cost and complexity of treatment technologies are positively related to the quality of water needed for the industrial process at hand while correspondingly, the cost and complexity of treatment for industrial wastewater is positively related to the scope of contaminant introduced during the industrial process and the regulatory burden applied to industrial effluents (i.e. water released back into public water bodies). Key Market Trends and Themes for the Global Water Industry Zero Liquid Discharge, Reuse and Resource Recovery Water scarcity, increasing costs of fresh water intake for industrial uses and growing costs to meet stringent effluent discharge regulations are driving a trend toward Zero Liquid Discharge (ZLD). ZLD applies a process-tailored suite of advanced treatment technologies, such as evaporators, brine concentrators and crystallizers, to treat industrial effluent to high degree of purity for reuse. Companies employing ZLD systems produce no effluent and, in doing so, avoid effluent permitting and regulatory costs altogether. ZLD is a rapidly expanding technology suite utilized in industrial settings, in particular for power generation, oil and gas, and chemicals industries. ZLD also provides companies with extracted organic or mineral solids, which can be reused on site to produce energy or as a manufacturing input or sold on the open market. In the municipal sector, the trend toward resource recovery, where wastewater treatment plants recover and use or sell energy, organic solids, minerals
and nutrients, is best understood by many of these facilities referring to themselves as water resource recovery facilities (WRRF) rather than treatment plants. Growing technology areas for WRRFs include nutrient recovery and anaerobic digestion with combined heat and power. Smart Water Similar to ZLD and resource recovery, the growing trend toward improved water pricing, efficiency, conservation and loss-reduction is fueling investment in and deployment of smart water technologies. Smart water technologies include those that automate monitoring and metering; treatment and distribution functions, loss and leakage; and metering and usage. These ‘smart’ components are a suite of automation and monitoring technologies tied together by a network based human interface and control component. In utility and industrial settings, smart water is governed by supervisory control and data acquisition (SCADA) systems while the consumer interfaces can take the form of any combination smarter meter and consumption management technologies, including web enabled versions for personal mobile devices. Climate Adaptation Climate vulnerability is forcing utilities to fundamentally rethink how they move, treat and store water and wastewater products. Climate change poses three major challenges to water service providers: (1) disruption of service due to infrastructure failures caused by severe weather events, such as hurricanes; (2) combined sewer overflow due to increased frequency and severity of precipitative events, such as flash floods; and (3) water shortages caused by prolonged drought. Climate related concerns are driving investment in fundamental changes in the configuration of water infrastructure that represent a paradigm shift in how water is managed. These include modular and mobile systems for emergency response; evaporation prevention technologies; water storage systems; groundwater recharge systems; storm water management; smart metering, billing and automated shut-off systems; and a slew of adaptive technologies for treatment processes with increased durability and the ability to treat variable rates of flow and volumes.

2016 ITA Environmental Technologies Top Markets Report | 5 This case study is part of a larger Top Markets Report. For additional content, please visit www.trade.gov/topmarkets.
Public Private Partnerships (PPPs) Public Private Partnerships (PPP) in water infrastructure are typically defined as an arrangement between the government and a private entity, often an Engineering, Procurement, and Construction (EPC) firm or private operator, where the private entity invests in partial or whole ownership of capital development and utility service in exchange for a share of tariff revenue and risk. The division of capital, service responsibilities, project and asset risk, and revenue sharing varies greatly among PPPs, and there is no standard model for how PPPs are structured. PPPs can therefore range from basic operations concessions to Build-Own-Operate models where the private entity is the wholesale owner of the water infrastructure and utility service. PPP projects and models are growing rapidly in number and complexity globally. Governments turn to PPPs to meeting funding gaps for infrastructure, provide more efficient service to consumers, and to defray project and asset risk. Businesses find PPPs to be lucrative long-term investments where tariff rates are optimized and tariff avoidance is low. The scope of opportunity for PPPs therefore rests in the quality and consistency of the rate payer, the government’s ability to incentivize PPP projects through appropriate balancing of risk and financial incentives, and private sector willingness to navigate a sometimes complex contractual system of asset and revenue ownership, operation and transfer in order to maximize profitability. Air Pollution Control The air media category deals with air pollution monitoring and control technologies for both stationary and mobile pollution sources. Stationary sources include emissions from thermal energy generation and those from industrial sources, such as boilers, incinerators, smelters and a variety of other emitting industries. A substantial segment of the industry is comprised of monitoring technologies, including the instrumentation and software required for public applications that monitor ambient air quality for the population at large. This segment also includes industrial and fence-line monitoring systems and software that assess specific industrial sites and applications as well as fence-line monitors for trans-boundary sources. U.S. industry
revenues for air pollution control in 2014 totaled USD 19.6 billion, including equipment, instruments and attendance services.4 Control technologies are determined by the scale of the emitting industry and scope of the pollutants that are limited by the control technology. Large emitters, like concrete producers and coal-fired power plants, use systems the size of a city block that cost in the millions to produce and run. Smaller operations, such as those attached to medical incinerators, have a substantially lower footprint and cost profile. Mobile sources, including marine diesel engines, non-road diesel engines and automobile engines, are a primary example of scale driven systems and unit pricing. An example of the scalability of control technologies can be found in passenger vehicles, which have a catalytic converter that does not exceed two feet in length and width. Key Market Trends and Themes for the Global Air Pollution Control Industry Emissions Control for Coal-Fired Power Plants Parts of Asia, especially China and India, are continuing to view coal as a primary power source. A significant percentage (approximately three-quarters) of planned new coal-fired power plants worldwide for the near and medium-term are slated to be installed in one of those two countries. Depending on the stringency of the regulatory environment, if realized, these plans are likely to result in an abundance of both retrofit and new installation opportunities for stationary source emission reduction and control technologies in the next five to 10 years. The types of technologies needed for a given power plant will depend on regulatory requirements. The variety of coal to be burned is also relevant, as pollutant levels differ for different kinds of coal. In addition to demand for more traditional technologies used to limit or control NOx, SOx, particulate matter and mercury emissions, state-of-the-art and new and emerging technologies - particularly those designed for multi-pollutant control - are likely to be of great interest. Emerging technologies include non-carbon sorbents for removal of flue gas mercury, as well as non-thermal plasma (NTP) and treated activated coke for multi-pollutant removal.

2016 ITA Environmental Technologies Top Markets Report | 6 This case study is part of a larger Top Markets Report. For additional content, please visit www.trade.gov/topmarkets.
Municipal Solid Waste, Hazardous Waste, Recycling, and Resource Recovery The soil media category includes solid and hazardous waste management, recycling and resource recovery, and soil pollution prevention and remediation technologies. Like municipal water treatment, solid waste is subject to a high degree of regulatory burden due to the public policy considerations related to waste management. The types of technologies needed depend on the composition and properties of the waste generated. Revenues for the U.S. solid waste and recycling industry equaled USD 96.1 billion in 2014, driven predominantly by waste management services.5 The recycling industry is driven by demand from materials markets, and its growth is positively related to the increase of price for raw materials. The hazardous waste management industry, which deals with industrial wastes that require independent treatment and storage technologies due to the potential for contamination, accounted for USD 19.4 billion in revenues during 2014.6 Key Market Trends and Themes for the Global Waste Management and Recycling Industry Sustainable Materials Management/Circular Economy Sustainable materials management (SMM) is a systemic approach that emphasizes the productive use and reuse of materials throughout their entire life cycle. Historically, societies have viewed the life cycle of a product as linear and unidirectional, e.g. from production to use to disposal. SMM is an alternative approach that emphasizes employing used materials as a resource, rather than discarding them as waste, in a ‘closed loop’ or cyclical process. Beginning with materials extraction and following with each stage in a product’s life, the product – or more precisely, the materials from which it is made – are viewed as key and valuable inputs for other processes. The goal is to reduce consumption of new materials and generate minimal waste. SMM has gained traction among policymakers and the public as an integrated solution to address environmental concerns. It can also help industries decrease costs associated with the purchase of typically expensive virgin materials, as well as enhance efficiency and reduce materials losses during production. It may be more difficult to implement on a municipal scale, however, as MSW reduction is often
labor intensive and can be expensive when compared with the cost of disposal, particularly for areas lacking the necessary infrastructure. Conversion Technologies Solid waste conversion technologies include gasification, plasma arc gasification, pyrolysis and thermal depolymerization. These technologies differ from traditional waste incineration processes because they do not involve combustion. Instead, they typically use thermal degradation or electric current to convert the organic fraction of solid waste to liquid fuels, syngas, biogas, heat, electricity and/or chemical products, depending on the inputs and the process. Most of these conversion technologies are proven for homogenous waste streams and are operating commercially in several locations outside of the United States. There is limited data on their effectiveness for mixed waste or MSW feedstocks, particularly on a larger scale. As population and waste generation rise and disposal becomes more costly, however, interest in and opportunities for conversion technologies are likely to increase. Monitoring and Instrumentation Crosscutting the three media categories is the monitoring and instrumentation subsector, which includes monitors and testing equipment for the air, water and soil; metering technology for water treatment and conveyance; and laboratory equipment and testing services. U.S. industry revenues in 2014 for instruments and information systems totaled USD 6.3 billion, led by instruments for water and wastewater management at USD 2.3 billion, followed by those for air quality at USD 1.3 billion and remediation at USD 1.1 billion.7 Environmental Consulting and Engineering Environmental consulting and engineering also spans all media categories. The industry is underpinned by practitioners who design, develop and operate environmental infrastructure and systems. Environmental projects can be both free-standing and part-and-parcel of larger infrastructure tenders. An example of a free-standing environmental project includes the site assessment, design, engineering, construction and operation of a wastewater treatment facility, whether municipal or industrial. An example of
2016 ITA Environmental Technologies Top Markets Report | 7 This case study is part of a larger Top Markets Report. For additional content, please visit www.trade.gov/topmarkets.
a part-and-parcel project is the site assessment, environmental impact assessment and sustainability design components to building a new hospital. The project definition and scope variability of this services component to the environmental sector contributes to difficulty in establishing reliable environmental industry figures. Nonetheless, Environmental Business International’s (EBI) survey of the industry reports 2014 revenues of USD 28.9 billion in environmental, consulting and engineering. Though interrelated in terms of their collective impact on ecology, the environmental technology media subsectors and segments generally function as independent markets driven by both regulation and demand from client industries. The implications for an environmental technology export promotion strategy are that these diverse and complex markets must be complemented by a promotion strategy appropriate to their respective market drivers.
Challenges, Barriers, and Opportunities Understanding Export Promotion Strategies in the Context of Global Market Drivers Rules Supersede Needs in the Global Market for Environmental Technologies To establish an effective export promotion strategy for U.S. environmental technologies, one must dispel a common misconception of how environmental markets are established and function. Neither environmental needs, like the lack of potable water, nor conservation philosophies, such as desire to steward natural resources for future generations, translate into a tangible market for environmental technologies. Instead, environmental technologies markets develop when galvanized by the creation of an environmental protection regime. Specifically, environmental markets develop in settings where the cost of non-compliance with environmental rules exceeds that of compliance, meaning that the environmental regime must be bound by a functional system of enforcement. In the absence of enforcement, compliance failures negate the implementation and maintenance of
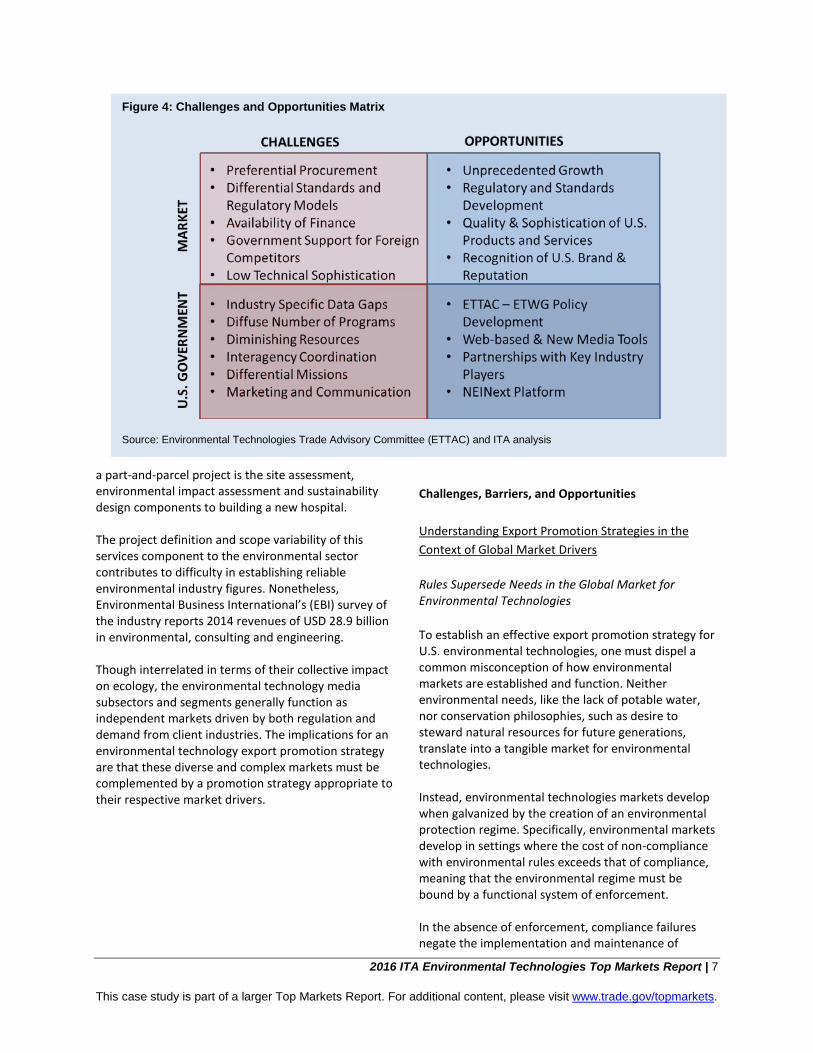
Figure 4: Challenges and Opportunities Matrix
Source: Environmental Technologies Trade Advisory Committee (ETTAC) and ITA analysis

2016 ITA Environmental Technologies Top Markets Report | 8 This case study is part of a larger Top Markets Report. For additional content, please visit www.trade.gov/topmarkets.
environmental protection systems regardless of the scope of environmental challenges in market. A recent example of this is air pollution control in China. The Chinese government articulated its first air pollution control law in 1987 followed by revisions in 1995 and 2000. Despite high legal standards for air pollution mitigation, the absence of an effective enforcement mechanism has led to China’s pervasive and widely reported air pollution problems. Data from the U.S. Embassy in Beijing show that from April 2008 to March 2014, only 25 days qualified as “good” air quality days using U.S. standards.8 The implication for export promotion is that needs-based approaches fail to accurately anticipate market opportunity. While regulatory enforcement is typically the mode of environmental market creation, finance is the means. Environmental technology markets do not catalyze without resources to fund public environmental infrastructure projects and private environmental compliance costs. For this reason, the analysis in this study emphasizes national mechanisms to finance public environmental infrastructure in its assessment of the readiness to implement projects related to stated national environmental goals. Resource Scarcity is an Emerging Driver of Environmental Technologies Resource scarcity and the corresponding demand for resource efficiency are evolving and important drivers of environmental technology markets. Since environmental resources, such as water, play an integral role in industrial production, their value as an input creates demand for technology that enables efficient use and reuse. An example of this relationship is the boom in investment and development of water treatment and reuse technologies for the recovery of natural gas through hydraulic fracturing. The productive value of a cubic meter of water in the hydraulic fracturing process is estimated to be about USD 1.54.9 Comparatively, a cubic meter of water used in agriculture has a productive value of approximately USD 0.13,10 which demonstrates why investments in water efficiency in natural gas extraction are seen as profit enhancing. Between 2005 and 2012, venture capital firms made an estimated USD 415.1 million in investments for new treatment technologies to promote reuse of produced water and better manage the cost of process water in extractive industries.11
Similarly, the entire recycling industry is predicated on the price of materials and the relatively lower cost of non-virgin materials as productive inputs. As the price of virgin materials historically has risen with energy and other associated costs and has been compounded by overall scarcity, the demand for recycled materials has grown along with the technologies required to produce them. Over the past year, however, as the global price of oil and other commodities has fallen, so, too, have prices for recycled materials, which has adversely impacted both recyclers and technology providers. Capital efficiency and industrial hygiene demands also can introduce the need for environmental technologies. An illustrative example is the need for mercury removal technologies in gas combustion power plants since even low levels of mercury present in the natural gas fuel stream can destroy heat exchangers and other essential energy production equipment. Demand for resource efficiency-driven environmental technologies is expected to increase as resource scarcity is compounded by demographic, social and ecological trends, including climate change, population growth, urbanization, and per capita income growth and attendant consumption pattern changes. Export Promotion in Environmental Technologies The United States hosts a comparatively advanced and sophisticated environmental technologies industry. The U.S. brand itself is highly valued globally, and U.S. environmental products are generally recognized for their excellence in innovation, engineering and durability. This reputation stems from the maturity and independence of the regulatory regime through the United States Environmental Protection Agency (U.S. EPA). U.S. EPA’s application of scientific rigor and its separation from industry interests in its rule making process has lent it a global reputation as the gold standard in environmental protection policy making. Thus, the industry that U.S. EPA helped promulgate receives similar respect for the efficacy of its systems. Global buyers also recognize the U.S. brand for the services associated with U.S. environmental technologies, which emphasize long-term business and engineering relationships over short-term sales opportunities. Despite the recognized excellence of the

2016 ITA Environmental Technologies Top Markets Report | 9 This case study is part of a larger Top Markets Report. For additional content, please visit www.trade.gov/topmarkets.
U.S. industry, companies face a variety of challenges in the international market: Business Time Horizons The time horizon for fostering a business relationship that leads to the sale of an environmental system typically is one to five years. For international markets, this translates into a substantial corporate investment in time and resources to develop a business partnership. It also leads to statistics indicating relatively poor success in U.S. export promotion activities and correspondingly a diminished interest within government to support programs for the industry -- the success horizon often exceeds the typical three-year limit for harvesting results from U.S. export programs. Preferential Procurement Practices and Cost/ Quality Trade-offs The sophistication of U.S. products coupled with the cost of production in the United States has a corresponding effect on price. The high price differential for U.S. technologies and systems can negate competitiveness in low-income markets. U.S.
products may also be foregone in the short-term for lower-cost and less durable alternatives despite the long-term operational cost competitiveness of U.S. products. Similarly, preferential procurement practices that favor domestic competitors or competitors from aid-donor countries can create an overall environment of unfair competition for U.S. companies. Tariffs Tariffs remain a substantial and limiting barrier to trade in environmental technologies. The United States Trade Representative (USTR)12 reports tariff peaks in environmental technologies among World Trade Organization (WTO) members of 20 percent for air pollution control, waste management and recycling, and monitoring and instrumentation products. Tariffs for water and wastewater products are as high as 21 percent. In many markets, high tariffs compound the price differential for U.S. environmental technologies, making U.S. products prohibitively expensive in many markets or eroding profitability of U.S. goods in export markets.
Figure 5: Environmental Technologies Export Promotion Process
Source: ITA/Office of Energy and Environmental Industries

2016 ITA Environmental Technologies Top Markets Report | 10 This case study is part of a larger Top Markets Report. For additional content, please visit www.trade.gov/topmarkets.
Standards, Regulation, and Certification Beyond tariffs, substantial and often insurmountable barriers exist for U.S. companies with respect to different standards regimes, lack of regulatory compatibility, and failure to provide mutual recognition of product and professional certifications. The United States drives innovation in part through its approach to standards, which emphasizes performance-based measures of conformity where practicable and predicates standards and testing protocols on the principles of science, risk assessment and cost-benefit analysis. This creates conflict in foreign markets that emphasize design-based standards models and utilize the precautionary principle in developing standards and regulation, an approach which eliminates the practicability of performance-based design, stymies innovation and narrows the field of applicable technologies to those developed within the destination market. It also imposes onerous additional fees for testing and conformity assessment to similarly performing technologies and equally rigorous professional certifications. Data Gaps and Asymmetrical Market Information Weak trade and market data has plagued the environmental technologies industry for some time. Neither the Harmonized Tariff System (HTS) nor the North American Industrial Classification System (NAICS) accurately address the breadth of technologies and services within the industry, and therefore, assessing market size and opportunity is a persistent problem (see methodology section for how these gaps are addressed in this study). The U.S. market is large and, until recently, substantial enough to support the business aspirations of many U.S. environmental technology providers. Saturation in the U.S. market, however, coupled with explosive growth in emerging markets, makes international growth inextricably linked with companies’ growth. Small and medium-sized enterprises need to identify markets where their technologies are in demand and develop the business relationships that will lead to future sales. The lack of market data makes it difficult to determine where opportunities are the greatest and makes it difficult for individual companies to discern where their specific products are in demand.
U.S. Government Resources and Coordination ETWG agencies face a variety of challenges in promoting environmental exports. These challenges include a lack of the time and resources to effectively conduct interagency coordination; different missions, which may subordinate export promotion as a priority; diminishing staff and budget resources for program implementation; and limited mechanisms to transmit market information to industry and individual companies. The Role for U.S. Government Given environmental technologies’ market drivers and challenges both the industry and the U.S. government experience, successful export promotion in this sector has four critical components:
1. Policy dialogue and development, 2. Technical assistance for regulatory
development and environmental management,
3. Direct promotion and advocacy, and 4. Financial vehicles for project development
and export finance. Policy Dialogue and Development The objectives of policy dialogue and development are two-fold: 1) identify and eliminate existing trade barriers, and 2) prevent new barriers from forming in order to generate an enabling environment for environmental technologies exports. This is achieved through bilateral, regional and multilateral fora. Current efforts include elimination of tariffs for environmental goods through plurilateral negotiations to achieve an Environmental Goods Agreement in the World Trade Organization. Important regional discussions and negotiations include the Transatlantic Trade and Investment Partnership with the European Union, the Trans-Pacific Partnership and Asia Pacific Economic Cooperation discussions in Asia, while key bilateral fora include the U.S.–China Joint Commission on Commerce and Trade Environment Working Group and the U.S.–Brazil Commercial Dialogue.
2016 ITA Environmental Technologies Top Markets Report | 11 This case study is part of a larger Top Markets Report. For additional content, please visit www.trade.gov/topmarkets.
Technical Assistance for Regulatory Development and Environmental Management The regulatory nature of the industry means that the U.S. government can be particularly effective in facilitating the creation and expansion of environmental export markets by providing technical assistance that creates opportunities to encourage the development of compatible regulatory approaches and an attendant compatible industrial environment. Technical assistance increases understanding of the efficacy of U.S.-style approaches, particularly the emphasis on solutions underpinned by science. Technical assistance can also yield favorable market results when it facilitates the creation of mechanisms for enforcement as well as knowledge and expertise for the maintenance and management of environmental systems. The interagency ETWG engages in “soft” technical assistance by providing publicly available resources, such as the U.S. Environmental Solutions Toolkit (URL), which is an online searchable database that marries U.S. EPA scientific and regulatory expertise with a catalogue of technology providers for specific environmental issues. There are also a variety of ‘hard’ technical assistance programs, including the series of memoranda of understanding that U.S. EPA develops with partner governments to provide technical know-how to foreign regulators. Since failures of environmental systems can harm human health, the risk associated with implementing new technologies is high and can prevent the introduction of new technologies altogether. Similarly, a lack of technological know-how is a formidable barrier to the development and implementation of environmental systems. The U.S. Trade and Development Agency works to address both of these challenges by funding demonstration projects in select emerging markets and educating foreign officials and buyers through reverse trade missions (RTMs).
Direct Promotion and Policy Advocacy Direct promotion and policy advocacy facilitates company and industry export sales by identifying and advocating for the removal of acute trade barriers and by delineating market opportunities and facilitating subsequent business relationships. ITA, along with other TPCC agencies, provides businesses with market information, trade counseling and opportunities to develop international business relationships. Provision of Financial Vehicles for Project Development and Export Finance Finance is a limiting factor to environmental technologies exports, from both the project development and the export finance perspective. The Overseas Private Investment Corporation helps fill the gap in project development finance by funding and facilitating the development of foreign infrastructure projects. Direct export finance is provided to U.S. companies through the Export-Import Bank of the United States, which provides a suite of export finance and insurance products to facilitate export transactions.
Top Markets in Context The subsequent chapters of this report provide a market and policy overview of the top 10 global markets where U.S. trade policy and promotion interventions can yield the best results for the U.S. environmental industry. The country analysis is supplemented with an overview of existing ETWG programs that support policy and promotion in these markets and recommendations for additional government programs to address trade obstacles and opportunities in the sector.

2016 ITA Environmental Technologies Top Markets Report | 12 This case study is part of a larger Top Markets Report. For additional content, please visit www.trade.gov/topmarkets.
1 Environmental Business International Data Pack, 2014. 2 In 2014 these were: Australia, Austria, Belgium, Canada, Denmark, Finland, France, Germany, Greece, Iceland, Ireland, Italy, Japan, Luxembourg, Netherlands, New Zealand, Norway, Portugal, Spain, Sweden, Switzerland, and United Kingdom. 3 Environmental Business International Data Pack, 2014. 4 Environmental Business International Data Pack, 2014. 5 Environmental Business International Data Pack, 2014. 6 Environmental Business International Data Pack, 2014. 7 Environmental Business International Data Pack, 2014. 8 The Wall Street Journal. China Real Time. “ Beijing’s Bad Air Days; Finally Counted”. April, 14, 2014. 9 Bloomberg New Energy Finance. “Water Leadership Forum” October 23-24, 2012. 10 Bloomberg New Energy Finance. “Water Leadership Forum” October 23-24, 2012. 11 OEEI estimates based on publicly reported venture capital deals. 12 United States Trade Representative. Accessed 2/6/2015. https://ustr.gov/trade-agreements/other-initiatives/environmental-goods-agreement.