2016 - janaagraha · the asics report is a result of hundreds of hours of effort made by members of...
TRANSCRIPT

2016
2016
About Janaagraha Centre for Citizenship and Democracy
Janaagraha Centre for Citizenship and Democracy (Janaagraha) is a Bengaluru based
not-for-profit institution that is a part of the Jana group. Janaagraha’s mission
is to transform quality of life in India’s cities and towns. It defines quality of life
as comprising quality of infrastructure and services and quality of citizenship. To
achieve its mission, Janaagraha works with citizens to catalyse active citizenship in
city neighbourhoods and with governments to institute reforms to City-Systems. You
can read more about Janaagraha at www.janaagraha.org
About Jana Urban Space Foundation (Jana USP)
Jana Urban Space is a Professional Services Social Enterprise (PSSE), delivering
transformational, world-class work on the spatial dimension of India’s cities. Jana
USP has four inter-disciplinary Studios - Urban Planning Studio; Urban Design
Studio; Spatial Mapping and Analytics Studio; and Architecture and Design Studio.
The multiple studios reflect Jana USP’s systems-driven approach to addressing urban
Spatial challenges. Jana Urban Space is a not-for-profit entity.
You can read more about Jana USP at www.jusp.org
About IDFC Foundation
IDFC Foundation is a wholly-owned subsidiary of IDFC and was set up in March
2011 as a not-for-profit company under Section 25 of the Companies Act, 1956 to
oversee and coordinate the various development activities being pursued by IDFC
Group. The objective of the Foundation is to ensure that CSR activities are skilfully and
inextricably woven into the fabric of the Group’s business strategy and ensure that the
Group meets its core objective of creating value for all stakeholders.
Effective April 2014, (post the enactment of the Companies Act, 2013), IDFC Foundation
has been acting as the Implementing Agency of the CSR agenda of IDFC Group.
Supported by:
Authors:Anil Nair, Deputy Head - Advocacy & ReformsVivek Anandan Nair, Senior Associate - Advocacy & ReformsAjesh A Nair, Senior Associate - Advocacy & ReformsV R Vachana, Associate - Advocacy & Reforms
Design:Juby Thomas, Manager - Designing & CommunicationsVigil Raj, Graphic Designer - Designing & CommunicationsAttribution: Please cite this report with the acknowledgement -
Annual Survey of India’s City-Systems 2016: Shaping India’s Urban Agenda,
a publication of Janaagraha Centre for Citizenship and Democracy and Jana USP

Garbageon the street
Bad qualityroads
Landfills are not scientificallydesigned and located
There are no codified design specificationsthat guide urban road projects
The city does not have a decentralised systeminvolving local communities and water
sources to create an efficientdistribution network
The city may not have adequate funds, staff and equipment to ensure 100% waste collection
The city does not spend enough on roadconstruction and maintenance
City Councillors do not need to disclose conflicts of interest, such as owning stakes in SWM agencies employed by their city
The city government is not empowered to make informed discussions on the issue of poor water supply
There are no mechanisms to recover water supply costs adequately thereby affecting maintenance of the city’s water distribution network
Major city road infrastructure projects often require state government approval
Citizens do not have access to formal platformsto hold Solid Waste Management (SWM)
contractors accountable
There is no system to adequately monitorwater usage and leakage
SYMPTOMS ofurban governancefailure
APPARENT CAUSES(What we think it is)
ROOT CAUSES(What it actually is?)
Unaccounted waterloss in distribution
Urban Planning & Design
Transparency, Accountability &
Participation
Empowered & Legitimate Political
Representation
Urban Capacities & Resources
The city does not provide data on road works and projects in ‘open data format’ for citizens
to see and usePipeline
LeakagesLong distance
to source
of water
Delay in major
road works
Missing The Wood For The Trees
CITY-SYSTEMS FRAMEWORKEvery year, we see several of our cities’ challenges making headlines in newspapers and occupying prime time on television news. The same events recur, just like the monsoons that greet us every year and bring with them the familiar sights of waterlogging, potholes and endless traffic jams.
From floods and garbage crises to power cuts and pollution, so many of the issues that our cities and towns face repeat like a looped record, over and over again.
One could say that our cities aren’t faced with a hundred different problems but the same problems repeated a hundred times. What we see on the surface are mere SYMPTOMS of failures in urban governance and we often focus our attention on addressing them and their APPARENT CAUSES using band-aids or spot-fixes. Urban India’s problems are too deep and systemic for us to take just tactical stabs at fixing them. To address the urban challenge, we need to fix the ROOT CAUSES that lie within ‘City-Systems’. City-Systems is a framework consisting of four distinct but inter-related components that together make up urban governance.
Foreword
Abbreviations
Acknowledgements
3
Key Insights1
4
Reforms To City-Systems: A Roadmap
Methodology
33
38
Data Sources41
Annexures43Overall City-System Scores And Rankings57
Data Tables58
6
13
9
ExecutiveSummary
Sizing Up The Urban Challenge
Rankings & Scores
Annual Survey Of India’s City-Systems
The Size Of India’s Urban Challenge : An Unknown
The Challenge Of Poor Service Delivery In Urban India10
9
Urban Planning & Design (UPD)
Urban Capacities & Resources (UCR)
Empowered & Legitimate Political Representation (ELPR)
Transparency, Accountability & Participation (TAP)
17
23
29
13
5
11
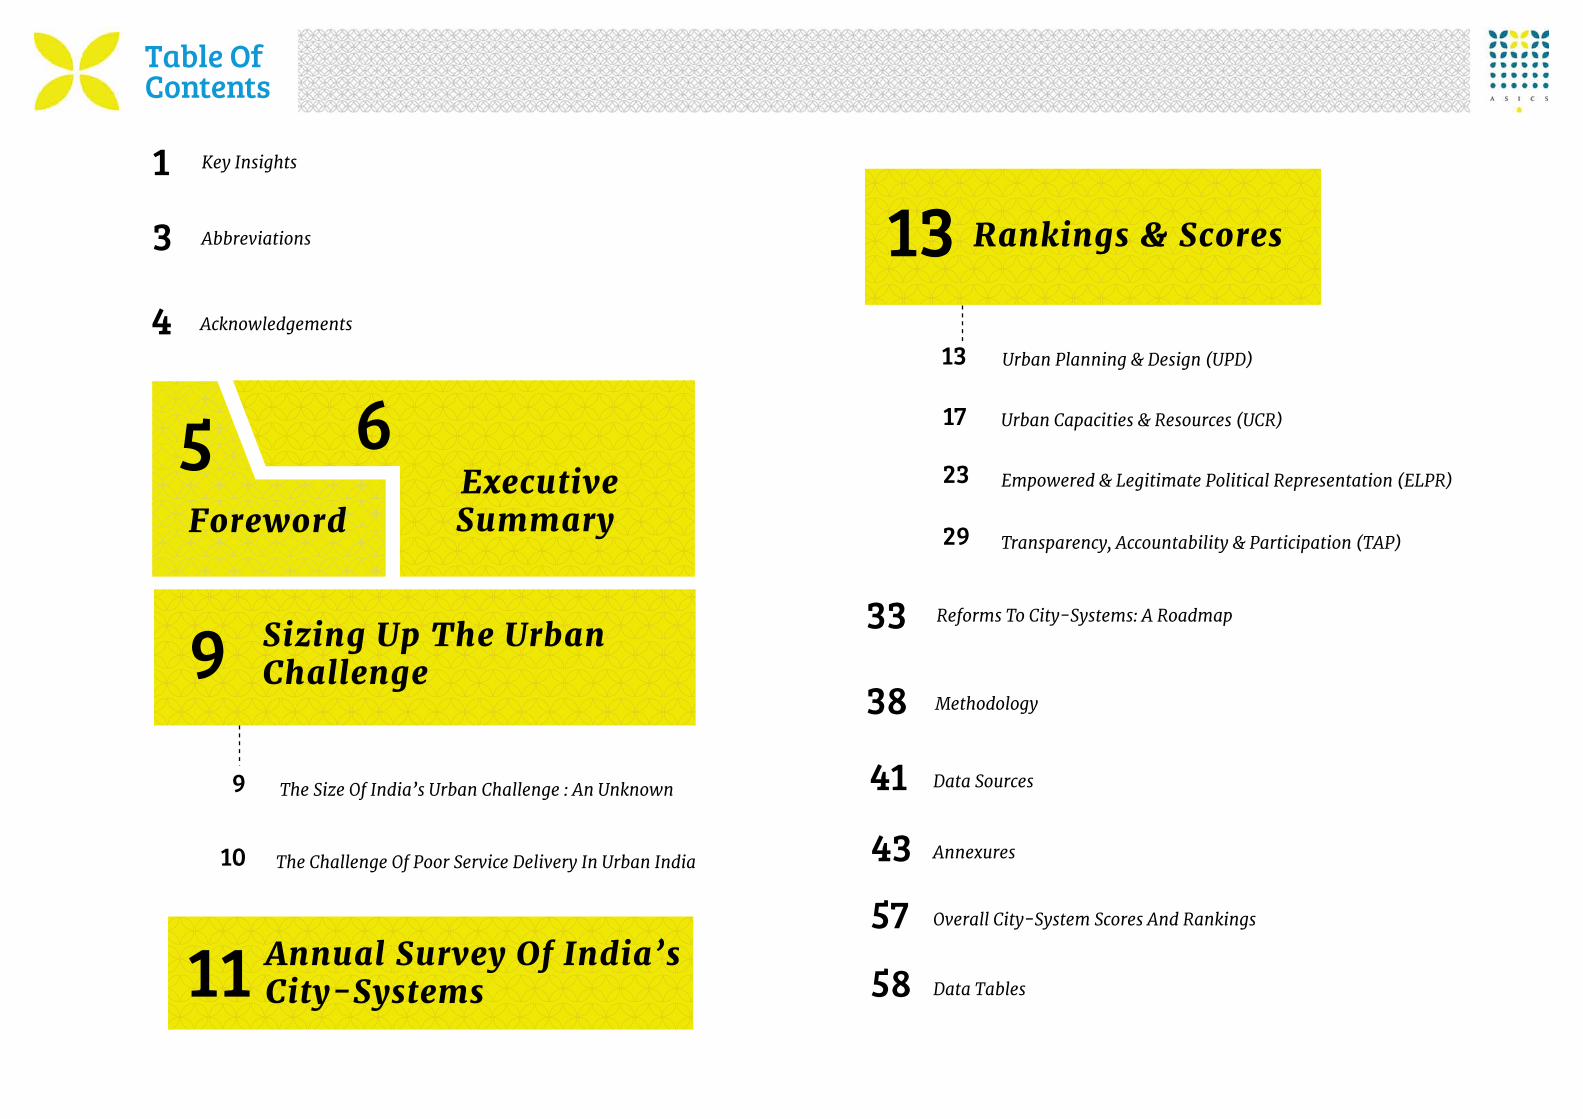
Table Of Contents

1 2
0
2
4
6
8
10
Overall Score Urban Planning& Design
Urban Capacities& Resources
Empowered & LegitimatePolitical
Representation
Transparency,Accountability& Participation
Average Score
Maximum Score
Legend
Minimum Score
London
New York
2.1
3.5
4.4
9.39.8
0.6
2.5
3.7
9.69.9
1.42.2
4.0
6.2
2.6
4.4
6.4
10.010.0
8.2
9.6
3.0
5.2
9.7 9.8
ASIC
S Sc
ores
201
6
IndianCities
Rs. 33,168 Cr. Total Expenditure
MUMBAI
Population12.4 million
Expenditure Per-Capita
Rs. 26,657Expenditure Per-Capita
Expenditure Per-CapitaRs. 6,157 Rs. 3,708
Rs. 33,132 Cr. Total Expenditure
Population54.4 million Rs. 4,505 Cr.
Total Expenditure
Population13.1 million
OTHER 10 ASICS CITIESNEXT 10 MOST POPULOUSASICS CITIES
Key Insights
Urban Planning & Design is the weakest of the 4 City-Systems in India’s cities. Many cities do not generate enough own revenue to even cover staff salaries.
Smaller cities, which will be at the forefront of future urbanisation, invest significantly less in services and infrastructure that can give their citizens better quality of life.
India’s cities face a severe systems problem as none of the cities fare well across all four City-Systems, key components that together are popularly referred to as urban governance.
Larger cities with stronger and sustainable finances have relatively weak Mayors and levels of devolution. This is the opposite in smaller cities.
ASICS cities with population below or equal
to 3.8 million***
ASICS cities with population above 3.8
million*
Average population in millions 1.7 7.2
Proportion of own revenue to total expenditure (%)** 29% 49%
Per capita expenditure of cities (Rs.)** 4,077 9,039
Per capita capital expenditure of cities (Rs.)** 1,854 3,331
Proportion of cities with a directly elected Mayor (%) 46% 0%
Average Mayoral tenure (years) 4.5 3.1
Critical functions*** devolved by the state to the city (%) 27% 39%
Average tenure of Commissioner over the last 5 years (years) 1.2 1.6
Experience of current Commissioner in urban departments (years) 1.3 4.9
Mumbai, home to 12.4 million citizens, had an annual expenditure of Rs. 33,168 crores in 2014-15. This is greater than the combined spends of the next 10 most populous cities in India (Rs. 33,132 crores) where over 54.4 million citizens reside.
In 11 out of the 21 ASICS cities, salary as a proportion of own revenues has increased from 108% in 2013 to 129% in 2015. Cities need to generate far higher levels of own revenues to meet their growing needs.
City 2012-13 2013-14 2014-15
Patna 237% 100% 320%
Kanpur 186% 172% 170%
Jaipur 91% 157% 199%
Ranchi 147% 99% 128%
Chandigarh 129% 144% 129%
Surat 51% 84% 85%
Chennai 46% 89% 80%
Bhubaneswar 75% 58% 75%
Hyderabad 31% 35% 37%
Pune* 27% 30% 47%
Ludhiana 170% 141% 147%
Average 108% 101% 129%
For details, refer to section- Overall Scores on page no. 57
OVERALL SCORE : 4.4 OVERALL SCORE : 4.1OVERALL SCORE : 4.2
UPD UCR
ELPRTAP
2.4 2.6
UPD UCR
ELPRTAP
UPD UCR
ELPRTAP
Thiruvananthapuram KolkataPune
6.46.2
3.0 3.4
4.1 6.0
1.9 4.6
5.1 5.1
For further details, refer to Data Table 1, page no. 58
TOP
3 RA
NKI
NG
CITI
ES
* 3.8 million is the average population size of the 21 ASICS cities **For details on city budgets, refer to Data Table 1, page no.58***Shows the proportion of 10 critical functions, as per 74th CAA and 2nd ARC, devolved to states| refer to annexure section ELPR, question no. 6, page no. 31 and methodology section ELPR-Q1, page no. 40
*Source is JANWANI PMC Budget Simplification & Analysis 2015-16. Salary for 2014-15 has been projected based on previous year numbers

3 4
Abbreviations Acknowledgements
The ASICS report is a result of hundreds of hours of effort made by members of the Janaagraha and Jana Urban Space (Jana-USP) family as well as various other individuals. We would like to thank all those who made the ASICS 2016 report possible.
The report benefited from contributions made by Mr Avinash Madhale, Ms Chinchu, Mr T Krishna Mohan Reddy, Mr Ramesh Singh Chauhan, Mr B S Ramesh, Prof. E.F.N. Ribeiro, Ms Shashibala, and Mr MSS Somaraju.
Members from within Janaagraha and Jana-USP who made significant contributions in various capacities include: Ms Bharathy Jayaprakash, Ms Hiba Hasan, Ms Kartika Nair, Ms Katie Pyle, Mr Manish Jain, Ms Neethu Nair, Ms Priyanka Roy and Mr Shivakeshava M. Able administrative and logistics support was provided by Mr Chennakrishna Reddy, Mr Indukumar C T and Mr Velu Murugan.
Ahd . . . . . . . . . . . . . . . . . . . . . . . . . . Ahmedabad
AMRUT. . . . . . . . . . . . . . . . . . . . . . . Atal Mission for Rejuvenation and Urban Transformation
ASICS . . . . . . . . . . . . . . . . . . . . . . . . Annual Survey of India’s City-Systems
BBMP . . . . . . . . . . . . . . . . . . . . . . . . Bruhat Bengaluru Mahanagara Palike
Bho . . . . . . . . . . . . . . . . . . . . . . . . . . Bhopal
Bhu . . . . . . . . . . . . . . . . . . . . . . . . . . Bhubaneswar
Blr . . . . . . . . . . . . . . . . . . . . . . . . . ... Bengaluru
CA . . . . . . . . . . . . . . . . . . . . . . . . . . ...Chartered Accountant
CAG . . . . . . . . . . . . . . . . . . . . . . . . . . Comptroller and Auditor General of India
Capex . . . . . . . . . . . . . . . . . . . . . . . . Capital Expenditure
Chd . . . . . . . . . . . . . . . . . . . . . . . . .. . Chandigarh
Che . . . . . . . . . . . . . . . . . . . . . . . . . .. Chennai
CPL . . . . . . . . . . . . . . . . . . . . . . . . . . Community Participation Law
DPC . . . . . . . . . . . . . . . . . . . . . . . . . . District Planning Committee
Deh . . . . . . . . . . . . . . . . . . . . . . . . . . Dehradun
Del . . . . . . . . . . . . . . . . . . . . . . . . .. . Delhi
ELPR . . . . . . . . . . . . . . . . . . . . . . . . . Empowered and Legitimate Political Representation
FRBM . . . . . . . . . . . . . . . . . . . . . . ... Fiscal Responsibility and Budget Management
GIS . . . . . . . . . . . . . . . . . . . . . . . . . . Geographic Information System
Hyd . . . . . . . . . . . . . . . . . . . . . . . . . . Hyderabad
ICT . . . . . . . . . . . . . . . . . . . . . . . . . . Information and Communications Technology
JNNURM . . . . . . . . . . . . . . . . . . . . . . Jawaharlal Nehru National Urban Renewal Mission
Jpr . . . . . . . . . . . . . . . . . . . . . . . . . . . Jaipur
Kol . . . . . . . . . . . . . . . . . . . . . . . . . . Kolkata
Kpr . . . . . . . . . . . . . . . . . . . . . . . . . . Kanpur
Lck . . . . . . . . . . . . . . . . . . . . . . . . . . Lucknow
Lon . . . . . . . . . . . . . . . . . . . . . . . . . . London
Lud . . . . . . . . . . . . . . . . . . . . . . . . . . Ludhiana
MA . . . . . . . . . . . . . . . . . . . . . . . . . Metropolitan Area
MC . . . . . . . . . . . . . . . . . . . . . . . . . . Municipal Corporation
MPC . . . . . . . . . . . . . . . . . . . . . . . . . Metropolitan Planning Committee
Mum . . . . . . . . . . . . . . . . . . . . . . . . .Mumbai
NSSO. . . . . . . . . . . . . . . . . . . . . . . . . National Sample Survey Organisation
NUSPD . . . . . . . . . . . . . . . . . . . . . . . .National Urban Spatial Planning & Development Guidelines
Pat . . . . . . . . . . . . . . . . . . . . . . . . . . . Patna
PDL . . . . . . . . . . . . . . . . . . . . . . . . . . Public Disclosure Law
PPP . . . . . . . . . . . . . . . . . . . . . . . . . . Public-Private Partnership
Pun . . . . . . . . . . . . . . . . . . . . . . . . . . Pune
Rai . . . . . . . . . . . . . . . . . . . . . . . . . . Raipur
Ran . . . . . . . . . . . . . . . . . . . . . . . . . . Ranchi
RTI . . . . . . . . . . . . . . . . . . . . . . . . . . Right to Information
2ndARC . . . . . . . . . . . . . . . . . . . . . . . Second Administrative Reforms Commission
SDP . . . . . . . . . . . . . . . . . . . . . . . . . . Spatial Development Plan (Master Plan)
SEC . . . . . . . . . . . . . . . . . . . . . . . . . . State Election Commission
SFC . . . . . . . . . . . . . . . . . . . . . . . . . . State Finance Commission
Sur . . . . . . . . . . . . . . . . . . . . . . . . . . Surat
SWM. . . . . . . . . . . . . . . . . . . . . . . . . . Solid Waste Management
TAP . . . . . . . . . . . . . . . . . . . . . . . . . . Transparency, Accountability and Participation
Thi . . . . . . . . . . . . . . . . . . . . . . . . . . Thiruvananthapuram
UA . . . . . . . . . . . . . . . . . . . . . . . . . . Urban Agglomeration
UCR . . . . . . . . . . . . . . . . . . . . . . . . . . Urban Capacities and Resources
ULB . . . . . . . . . . . . . . . . . . . . . . . . . . Urban Local Body
UPD . . . . . . . . . . . . . . . . . . . . . . . . . . Urban Planning and Design
WC . . . . . . . . . . . . . . . . . . . . . . . . . . Ward Committtee
74th CAA . . . . . . . . . . . . . . . . . . . . . .74th Constitutional Amendment Act 1992
*City _________________ have used 21 ASICS cities and ‘cities’ interchangeably in the report

5 6
Foreword Executive Summary
Delhi
Bhopal
Mumbai
Pune
Chennai
Hyderabad
Bhubaneswar
Kolkata
Kanpur
Score : 3.6
Score : 3.6
Score : 4.1
Score : 3.5
Score : 3.7
Score : 3.9
Score : 3.6
Score : 4.4
Score : 4.1
Score : 4.2
Thiruvananthapuram
9
7
4
8
6
10
5
2
2
1
82
1
2
Rank
Change in Rankover 2015
No Change in Rankover 2015
2016 Rank
Legend
0
0
Rank
2
Rank
3
00
Urban Capacities & Resources (UCR)
Urban Planning & Design (UPD)
2016 Score 2016 Rank Change in rankover 2015
Patna 3.4 11 -Lucknow 3.4 12 -2Ranchi 3.3 13 +1Ahmedabad 3.3 14 +2Raipur 3.3 15 -2Bengaluru 3.3 16 -4Surat 3.2 17 -2Dehradun 3.1 18 -1Ludhiana 3.0 19 -Jaipur 2.7 20 -Chandigarh 2.1 21 -
TOP 10 CITIES 2016
Other 11 Cities
ASICS scores 21 cities across 18 states in India on the four aspects of City-Systems. It does so by evaluating 83 parameters spanning all four components :
Transparency, Accountability & Participation (TAP)
Empowered and Legitimate Political Representation (ELPR)
However, findings also reveal silver linings and aspects where Indian cities can learn a lot from each other. The state of Rajasthan ushering in urban land titling reforms and Odisha’s efforts to increase Municipal Capacities by constituting Municipal Cadres, are excellent examples from this year of how we can move forward and help our cities serve their citizens better.
India’s cities scored between 2.1 and 4.4 out of a total of 10. Contrast this with London and New York, scoring 9.3 and 9.8 respectively, and it becomes clear that our cities need to strengthen their foundations – quality of our laws, policies and institutions significantly to deliver a high quality of life to all citizens. Over the last four years and editions of ASICS, our cities have continued to score low indicating that progress, on fixing City-Systems, has been slow.
This year, Thiruvananthapuram retained its number 1 position on the back of high scores (6+) in TAP and ELPR. However, the city once again scored less than 3 in UPD and UCR. A closer look at scores reveals that none of the top 5 cities scored consistently across the four aspects of City-Systems, meaning top cities do well in one or the other area but not in all. This highlights the fact that our cities face a ‘Systems’ issue where reform measures fail to adequately address each of the four City-Systems that are essential to delivering a high quality of life.
“It was heartening to note that the Economic Survey of India used the findings from our 2015 report to establish a strong correlation between quality of governance and quality of service delivery. We hope this edition of ASICS would prove to be a useful tool for city leaders to identify specific reform agendas for their cities based on the City-Systems framework. It can help them identify the systemic reforms that have to be undertaken to strengthen the governance framework in their cities, ultimately leading to a better quality of life for their citizens. We, at Janaagraha, are committed to partnering with city leaders across the country who are willing to commit to the City-Systems approach for transforming quality of life in their cities.”
Anil Nair
Deputy Head - Advocacy and Reforms, Janaagraha
“Annual Survey of India’s City Systems is a study of “City-Systems” of India’s cities. It aims to serve as an annual health check-up of the quality of laws, policies, institutions and institutional processes underlying quality of life in our cities. ASICS aims to push the envelope on city governance reforms in India through data and insights. We believe ASICS can provide the common frame of reference for political and administrative leaders, business and academia, media and civil society, in different cities to converge on their agenda for transformative reforms in their respective cities. In its 4th edition, ASICS brings insights and data on City-Systems to the foreground.”
Srikanth Viswanathan
CEO - Janaagraha
“‘With the increasing challenges being faced by our cities, we see the term ‘Urban Governance’ becoming more popular, as a high-level diagnosis of the challenges – ‘We have a severe urban governance problem’. But what exactly does ‘Urban Governance’ mean? If it means different things to different people, we will only be propagating a new buzzword to name our urban problems, and not doing much to actually solve them.
Cities are actually complex systems. If we need to diagnose urban problems and – more importantly - solve them, we need to have a way of seeing them in such a systems-based framework. We have developed such a framework, that we call “City-Systems”, to help us identify the root causes of our urban challenges and also areas for urban solutions. The City-Systems framework lays down the four significant aspects for urban transformation - Urban Planning & Design; Urban Capacities & Resources; Empowered & Legitimate Political Representation and Transparency, Accountability & Participation. We believe that fixing India’s City-Systems is crucial to fixing our cities thereby improving the quality of life for our citizens. The time has come to move beyond high-level debates about ‘Urban Governance’ and get into specific discussions on ‘City-Systems’.”
Swati Ramanathan & Ramesh Ramanathan
Co-founders, Jana Group
7 8
Score Rank Rank Change Over 2015
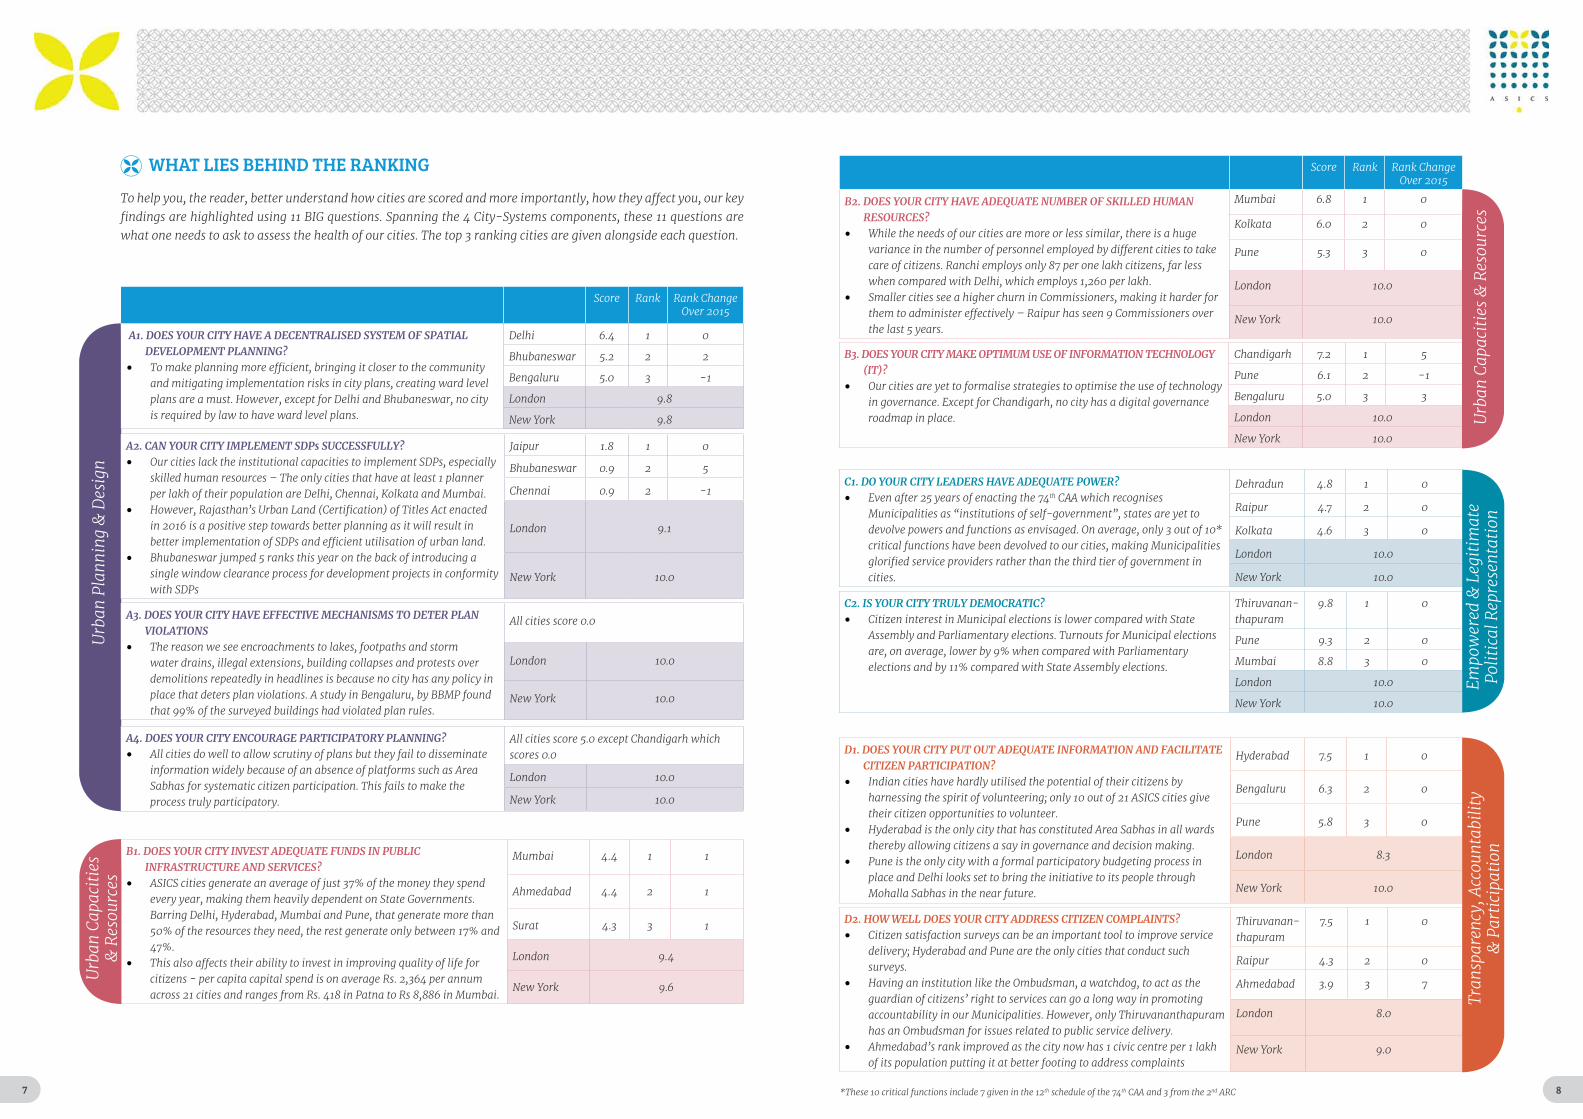
A1. DOES YOUR CITY HAVE A DECENTRALISED SYSTEM OF SPATIAL DEVELOPMENT PLANNING?
• To make planning more efficient, bringing it closer to the community and mitigating implementation risks in city plans, creating ward level plans are a must. However, except for Delhi and Bhubaneswar, no city is required by law to have ward level plans.
Delhi 6.4 1 0
Bhubaneswar 5.2 2 2
Bengaluru 5.0 3 -1
London 9.8
New York 9.8
A2. CAN YOUR CITY IMPLEMENT SDPs SUCCESSFULLY?• Our cities lack the institutional capacities to implement SDPs, especially
skilled human resources – The only cities that have at least 1 planner per lakh of their population are Delhi, Chennai, Kolkata and Mumbai.
• However, Rajasthan’s Urban Land (Certification) of Titles Act enacted in 2016 is a positive step towards better planning as it will result in better implementation of SDPs and efficient utilisation of urban land.
• Bhubaneswar jumped 5 ranks this year on the back of introducing a single window clearance process for development projects in conformity with SDPs
Jaipur 1.8 1 0
Bhubaneswar 0.9 2 5
Chennai 0.9 2 -1
London 9.1
New York 10.0
A3. DOES YOUR CITY HAVE EFFECTIVE MECHANISMS TO DETER PLAN VIOLATIONS
• The reason we see encroachments to lakes, footpaths and storm water drains, illegal extensions, building collapses and protests over demolitions repeatedly in headlines is because no city has any policy in place that deters plan violations. A study in Bengaluru, by BBMP found that 99% of the surveyed buildings had violated plan rules.
All cities score 0.0
London 10.0
New York 10.0
A4. DOES YOUR CITY ENCOURAGE PARTICIPATORY PLANNING?• All cities do well to allow scrutiny of plans but they fail to disseminate
information widely because of an absence of platforms such as Area Sabhas for systematic citizen participation. This fails to make the process truly participatory.
All cities score 5.0 except Chandigarh which scores 0.0
London 10.0
New York 10.0
B1. DOES YOUR CITY INVEST ADEQUATE FUNDS IN PUBLIC INFRASTRUCTURE AND SERVICES?
• ASICS cities generate an average of just 37% of the money they spend every year, making them heavily dependent on State Governments. Barring Delhi, Hyderabad, Mumbai and Pune, that generate more than 50% of the resources they need, the rest generate only between 17% and 47%.
• This also affects their ability to invest in improving quality of life for citizens - per capita capital spend is on average Rs. 2,364 per annum across 21 cities and ranges from Rs. 418 in Patna to Rs 8,886 in Mumbai.
Mumbai 4.4 1 1
Ahmedabad 4.4 2 1
Surat 4.3 3 1
London 9.4
New York 9.6
B3. DOES YOUR CITY MAKE OPTIMUM USE OF INFORMATION TECHNOLOGY (IT)?
• Our cities are yet to formalise strategies to optimise the use of technology in governance. Except for Chandigarh, no city has a digital governance roadmap in place.
Chandigarh 7.2 1 5
Pune 6.1 2 -1
Bengaluru 5.0 3 3
London 10.0
New York 10.0
Score Rank Rank Change Over 2015
B2. DOES YOUR CITY HAVE ADEQUATE NUMBER OF SKILLED HUMAN RESOURCES?
• While the needs of our cities are more or less similar, there is a huge variance in the number of personnel employed by different cities to take care of citizens. Ranchi employs only 87 per one lakh citizens, far less when compared with Delhi, which employs 1,260 per lakh.
• Smaller cities see a higher churn in Commissioners, making it harder for them to administer effectively – Raipur has seen 9 Commissioners over the last 5 years.
Mumbai 6.8 1 0
Kolkata 6.0 2 0
Pune 5.3 3 0
London 10.0
New York 10.0
D1. DOES YOUR CITY PUT OUT ADEQUATE INFORMATION AND FACILITATE CITIZEN PARTICIPATION?
• Indian cities have hardly utilised the potential of their citizens by harnessing the spirit of volunteering; only 10 out of 21 ASICS cities give their citizen opportunities to volunteer.
• Hyderabad is the only city that has constituted Area Sabhas in all wards thereby allowing citizens a say in governance and decision making.
• Pune is the only city with a formal participatory budgeting process in place and Delhi looks set to bring the initiative to its people through Mohalla Sabhas in the near future.
Hyderabad 7.5 1 0
Bengaluru 6.3 2 0
Pune 5.8 3 0
London 8.3
New York 10.0
D2. HOW WELL DOES YOUR CITY ADDRESS CITIZEN COMPLAINTS?• Citizen satisfaction surveys can be an important tool to improve service
delivery; Hyderabad and Pune are the only cities that conduct such surveys.
• Having an institution like the Ombudsman, a watchdog, to act as the guardian of citizens’ right to services can go a long way in promoting accountability in our Municipalities. However, only Thiruvananthapuram has an Ombudsman for issues related to public service delivery.
• Ahmedabad’s rank improved as the city now has 1 civic centre per 1 lakh of its population putting it at better footing to address complaints
Thiruvanan-thapuram
7.5 1 0
Raipur 4.3 2 0
Ahmedabad 3.9 3 7
London 8.0
New York 9.0
C1. DO YOUR CITY LEADERS HAVE ADEQUATE POWER?• Even after 25 years of enacting the 74th CAA which recognises
Municipalities as “institutions of self-government”, states are yet to devolve powers and functions as envisaged. On average, only 3 out of 10* critical functions have been devolved to our cities, making Municipalities glorified service providers rather than the third tier of government in cities.
Dehradun 4.8 1 0
Raipur 4.7 2 0
Kolkata 4.6 3 0
London 10.0
New York 10.0
C2. IS YOUR CITY TRULY DEMOCRATIC?• Citizen interest in Municipal elections is lower compared with State
Assembly and Parliamentary elections. Turnouts for Municipal elections are, on average, lower by 9% when compared with Parliamentary elections and by 11% compared with State Assembly elections.
Thiruvanan-thapuram
9.8 1 0
Pune 9.3 2 0
Mumbai 8.8 3 0
London 10.0
New York 10.0
To help you, the reader, better understand how cities are scored and more importantly, how they affect you, our key findings are highlighted using 11 BIG questions. Spanning the 4 City-Systems components, these 11 questions are what one needs to ask to assess the health of our cities. The top 3 ranking cities are given alongside each question.
WHAT LIES BEHIND THE RANKING
Urb
an P
lann
ing
& D
esig
n
*These 10 critical functions include 7 given in the 12th schedule of the 74th CAA and 3 from the 2nd ARC
Urb
an C
apac
itie
s &
Res
ourc
es
Urb
an C
apac
itie
s &
Res
ourc
es
Tran
spar
ency
, Acc
ount
abili
ty
& P
arti
cipa
tion
Em
pow
ered
& L
egit
imat
e Po
litic
al R
epre
sent
atio
n

9 10
Coverage of IndividualWater Supply Connections
Cost Recovery in Water Supply Services Non-Revenue Water
Per CapitaSupply of Water
Serv
ice
Leve
l Be
nchm
ark*
Curr
ent S
tatu
s Se
rvic
e Le
vel
Benc
hmar
k*Cu
rren
t Sta
tus
Serv
ice
Leve
l Be
nchm
ark*
Curr
ent S
tatu
s
100%
71%1
135
LPCPD**
2981
LPCPD371
LPCPD**
100%
39%3
20%
33%3
Households Resortingto Open Defecation
Coverage of Sewer Network
Households with Drainage Connectivity
Road Network Covered by Storm Water Drain Network
Household Coverageof SWM Services
Waste CollectionEfficiency
100% 100%
<30%4
35%3
Households living in slums : 17%1 Shortage of housing (units) : 19.8 million5 Share of public transport in mobility: 27%2
Water Supply
Sewerage and Sanitation
Solid Waste Management
Slums Affordable Housing Mobility
12%1
0%
12%3
45%1
100% 100%100%
<20%1
Extent of WasteSegregation
1. Census 20112. 12th five year plan, Planning Commision of India3. Brookings analysis of Ministry of Urban Development, Service Level Benchmark Handbook 2012 data
4. HPEC Report, 20115. Amitabh Kundu, Technical Committee Report, 2012* A Handbook on Service Level Bench Mark, 2012, MoUD** Litres Per Capita Per Day
in larger cities
in smaller cities
in larger cities in smaller cities
100%
70-90%4
<50%4
The Size Of India’s Urban Challenge : An Unknown
ESTIMATES FOR HOW ‘URBAN’ INDIA IS, DIFFER VASTLYBetween 2001 and 2011, the number of Census Towns - those defined by the NSSO in the Census as urban settlements, rose by 186%. They now account for 49% of all towns in India. These areas, that will see a bulk of future migration, are today governed as ‘rural’. Moreover, different stakeholders have estimated India’s urbanisation at a much higher level than even the Census definition.
Bihar
Tripura
Chattisgarh
Karnataka
Tamilnadu
Telangana
Madhyapradesh
Uttar Pradesh
MaharashtraOdisha
Punjab
Rajasthan
Utharakhand
Kerala
Haryana
JharkhandWest Bengal
Goa
Gujarat
Area
Population size
Population Density
Occupation
ULB Revenue
Economic importance
Pace of urbanisation
Demand for progressive services
Sikkim
Legend
“Government may consider the adoption
of a common categorisation of urban
bodies across the country to improve
clarity in their definition so as to assist
a systematic planning process and
devolution of funds.”
– 2nd ARC, Government of India
India needs a better definition of urban if not a standard one across states. In the Indian context, the definition of urban will have far reaching consequences on how we manage urbanisation in the next two decades.
Between 61 million and 472 million people could be living in urban areas that are governed as rural.
Statutorydefinition
Censusdefinition
5000+ Population(Ghana’s definition)
2500+ Population(Mexico’s definition)
26% 31%
47%*
65%*
STATES IN INDIA HAVE VARYING DEFINITIONS FOR STATUTORY TOWNSAcross states, there are as many as 8 factors used in 6 varying ways to define a city**. Thresholds within these factors, such as population size, also differ. We have as many definitions as states. Kerala, which is 16% urban as per the statutory definition goes up to 99% urban if the 5000+ population definition used by Ghana is applied.
The Challenge Of Poor Service Delivery In Urban India
* What’s In A Definition?: A Study on Implications and Suitability of Urban Definitions in India through its Employment Guarantee Programme, IDFC Working Paper Series, 2016** City here refers to a Municipal Corporation
Service Delivery: Benchmarks vs. Current Status
Number of parameters that define Municipal Corporations across States
The poor state of service delivery in India’s cities is largely self-evident. Even with the conservative definition that we use to define a city, another 400 million Indians will join the urban fold by 2050 and we could be facing a crisis of urban service delivery.
This uniformly poor state of service delivery across cities points to a failure of urban governance. ASICS uses the City-Systems framework to help identify the root causes of such failures.
For further details, refer to Data Table 7, page no. 63

11 12
Urban India’s challenges are too deep and systemic for us to take just tactical stabs at fixing them. But where does one start while crafting a strategy to improve urban India? How do we ensure that such a strategy addresses issues holistically, especially around key themes such as economy, equity, environment and trust and participation?
We believe that the ‘City-Systems’ framework is the place to start.
QUALITY OF LIFE
Urban Capacities& Resources
Empowered &Legitimate Political
Representation
Transparency,Accountability &
Participation
Urban Planning& Design
Annual Survey Of India’s City-Systems
The Annual Survey of India’s City-Systems uses this framework to diagnose the systemic ills that ail our cities and act as barriers to them achieving their true potential.
ASICS looks at 83 parameters across City-Systems to present a picture of the readiness of 21 of India’s largest cities in delivering high quality of life to their citizens.
Its findings are explained by unravelling 11 big questions that subsume all 83 parameters, and are spread across the four City-Systems.
A
Urban Planning & DesignA1. Does your city have a decentralised system of Spatial Development Planning?A2. Can your city implement Spatial Development Plans successfully?A3. Does your city have effective mechanisms to deter plan violations?A4. Does your city encourage participatory planning?
Urban Capacities & ResourcesB1. Does your city invest adequate funds in public infrastructure and services?B2. Does your city have adequate number of skilled human resources?B3. Does your city make optimum use of Information Technology?
Empowered & Legitimate Political RepresentationC1. Does your city put out adequate information and facilitate citizen participation?C2. How well does your city address citizen complaints?
Transparency, Accountability & ParticipationD1. Do your city leaders have adequate power?D2. Is your city truly democratic?
B
C
D
The framework consists of
four distinct but inter-related
components that together
make up what we popularly
refer to as urban governance.
From “fixing symptoms” to “fixing systems” :
Over the last 15 years, the Janaagraha and Jana-USP have worked with a multitude of stakeholders trying to usher in an urban transformation. The City-Systems framework evolved from the body of knowledge and insights collected over the course of thousands of hours spent enabling this change. It helps focus attention on systemic issues that are the root cause of most of the recurring symptoms we see at the surface and helps us develop systemic rather than symptomatic on-spot fixes.
13 14
Urban Planning & Design
Key Highlights 2016
Raipur
Delhi
Jaipur
Ahmedabad Bhopal
Surat
MumbaiPune
Bengaluru Chennai
Hyderabad
Bhubaneswar
KolkataRanchi
Patna
Lucknow
Dehradun
Thiruvananthapuram
9
16
11
21
5
14
14
10
19
4
7
11
18
6
1119
4No Change in Rankover 2015
Kanpur
8 1
1
1
22
16
3
Change in Rankover 2015
Ludhiana
Chandigarh
Rank
2016 Rank
Legend
0
00
00
0
0
0
0
0
00
0
0
0
Rank
2Rank
3
A
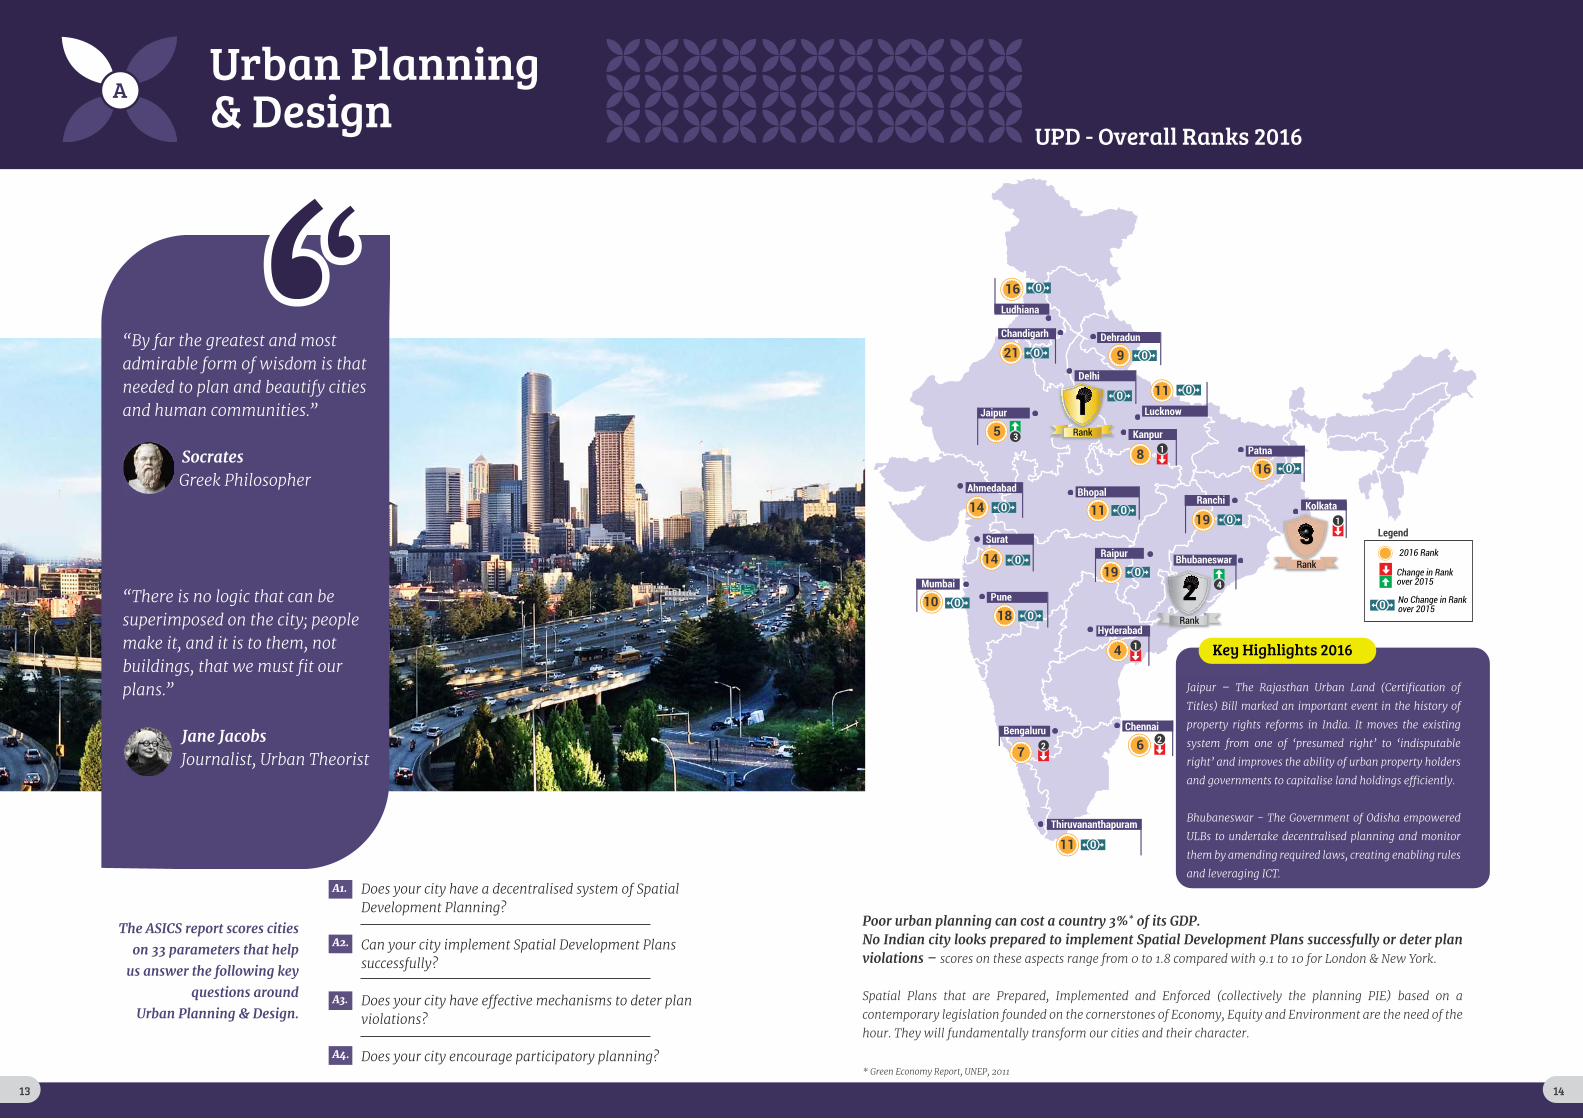
“By far the greatest and most admirable form of wisdom is that needed to plan and beautify cities and human communities.”
SocratesGreek Philosopher
“There is no logic that can be superimposed on the city; people make it, and it is to them, not buildings, that we must fit our plans.”
Jane JacobsJournalist, Urban Theorist
The ASICS report scores cities
on 33 parameters that help
us answer the following key
questions around
Urban Planning & Design.
Does your city have a decentralised system of Spatial Development Planning?
Can your city implement Spatial Development Plans successfully?
Does your city have effective mechanisms to deter plan violations?
Does your city encourage participatory planning?
A1.
A3.
A4.
A2.
Jaipur – The Rajasthan Urban Land (Certification of
Titles) Bill marked an important event in the history of
property rights reforms in India. It moves the existing
system from one of ‘presumed right’ to ‘indisputable
right’ and improves the ability of urban property holders
and governments to capitalise land holdings efficiently.
Bhubaneswar - The Government of Odisha empowered
ULBs to undertake decentralised planning and monitor
them by amending required laws, creating enabling rules
and leveraging ICT.
Poor urban planning can cost a country 3%* of its GDP. No Indian city looks prepared to implement Spatial Development Plans successfully or deter plan violations – scores on these aspects range from 0 to 1.8 compared with 9.1 to 10 for London & New York.
Spatial Plans that are Prepared, Implemented and Enforced (collectively the planning PIE) based on a contemporary legislation founded on the cornerstones of Economy, Equity and Environment are the need of the hour. They will fundamentally transform our cities and their character.
* Green Economy Report, UNEP, 2011
UPD - Overall Ranks 2016
13 14

15 16
India 1 per
400,000
South Africa4 per
400,000
United Kingdom148 per
400,000
United States48 per400,000
ThiruvananthapuramPatnaLudhiana
Dehradun
LucknowBhopal KanpurHyderabad
RaipurSurat
Ahmedabad
Pune
KolkataJaipur
SU MO TU WE TH FR SA
APRIL
1
2 3 4 5 6 7 8
9 10 11 12 13 14 15
16 17 18 19 20 21 22
23 24 25 26 27 28 29
30
SU MO TU WE TH FR SA
APRIL
1
2 3 4 5 6 7 8
9 10 11 12 13 14 15
16 17 18 19 20 21 22
23 24 25 26 27 28 29
30
SU MO TU WE TH FR SA
APRIL
1
2 3 4 5 6 7 8
9 10 11 12 13 14 15
16 17 18 19 20 21 22
23 24 25 26 27 28 29
30
SU MO TU WE TH FR SA
APRIL
1
2 3 4 5 6 7 8
9 10 11 12 13 14 15
16 17 18 19 20 21 22
23 24 25 26 27 28 29
30
SU MO TU WE TH FR SA
APRIL
1
2 3 4 5 6 7 8
9 10 11 12 13 14 15
16 17 18 19 20 21 22
23 24 25 26 27 28 29
30
SU MO TU WE TH FR SA
APRIL
1
2 3 4 5 6 7 8
9 10 11 12 13 14 15
16 17 18 19 20 21 22
23 24 25 26 27 28 29
30
SU MO TU WE TH FR SA
APRIL
1
2 3 4 5 6 7 8
9 10 11 12 13 14 15
16 17 18 19 20 21 22
23 24 25 26 27 28 29
30
SU MO TU WE TH FR SA
APRIL
1
2 3 4 5 6 7 8
9 10 11 12 13 14 15
16 17 18 19 20 21 22
23 24 25 26 27 28 29
30
SU MO TU WE TH FR SA
APRIL
1
2 3 4 5 6 7 8
9 10 11 12 13 14 15
16 17 18 19 20 21 22
23 24 25 26 27 28 29
30
SU MO TU WE TH FR SA
APRIL
1
2 3 4 5 6 7 8
9 10 11 12 13 14 15
16 17 18 19 20 21 22
23 24 25 26 27 28 29
30
SU MO TU WE TH FR SA
APRIL
1
2 3 4 5 6 7 8
9 10 11 12 13 14 15
16 17 18 19 20 21 22
23 24 25 26 27 28 29
30
SU MO TU WE TH FR SA
APRIL
1
2 3 4 5 6 7 8
9 10 11 12 13 14 15
16 17 18 19 20 21 22
23 24 25 26 27 28 29
30
SU MO TU WE TH FR SA
APRIL
1
2 3 4 5 6 7 8
9 10 11 12 13 14 15
16 17 18 19 20 21 22
23 24 25 26 27 28 29
30
SU MO TU WE TH FR SA
APRIL
1
2 3 4 5 6 7 8
9 10 11 12 13 14 15
16 17 18 19 20 21 22
23 24 25 26 27 28 29
30
GreenRevolution
Bengaluru Mumbai
SU MO TU WE TH FR SA
APRIL
1
2 3 4 5 6 7 8
9 10 11 12 13 14 15
16 17 18 19 20 21 22
23 24 25 26 27 28 29
30 1967
Chandigarh
19791982
1995 2012
Ranchi Bhubaneswar Delhi
197319751976
19661954 1956 1957 1961
2016
Chennai
1952
SU MO TU WE TH FR SA
APRIL
1
2 3 4 5 6 7 8
9 10 11 12 13 14 15
16 17 18 19 20 21 22
23 24 25 26 27 28 29
30
EconomicLiberalisation
1991
SU MO TU WE TH FR SA
APRIL
1
2 3 4 5 6 7 8
9 10 11 12 13 14 15
16 17 18 19 20 21 22
23 24 25 26 27 28 29
30
1971
SU MO TU WE TH FR SA
APRIL
1
2 3 4 5 6 7 8
9 10 11 12 13 14 15
16 17 18 19 20 21 22
23 24 25 26 27 28 29
30
India’sIndependence
1947
Timeline : Enactment of Town and Country Planning Acts
Security of land and property title through a guaranteed system of title certification has been one of India’s long-pending reforms, the absence of which has impeded economic growth, development, social justice and judicial efficiency. In today’s system of “presumed ownership” indicated by the sale deed, the urban poor are in a state of constant vulnerability of eviction, with no ability to use their property to access capital, or civic services. Municipal governments, whose primary source of revenue for the city is property taxes, are unable to undertake more than 50% of collections on property taxes or development charges, predominantly due to poor records of property ownership. The Rajasthan Urban Land (Certification of Titles) bill (ULCT) 2016 seeks to fix all this by moving the system to one of “guaranteed ownership” by providing clear land titles.
• To make planning more efficient, bringing it closer to the community and mitigating implementation risks in city plans, creating ward level plans are a must. However, except for Delhi and Bhubaneswar, no city is required by law to have ward level plans.
• A common GIS map, shared between the myriad of planning agencies in our cities, is also missing.
• Indian cities are simply not equipped to implement SDPs! They lack in the institutional resources required to do so. Only Chennai, Delhi, Kolkata and Mumbai have at least 1 planner per 1,00,000 citizens.
• The only silver lining - Rajasthan passing the Urban Land (Certification of Titles) bill (ULCT) 2016 and showing the way for other states to follow in creating enabling policies on efficient land utilisation.
• No Indian city has policies in place to deter plan violations. This is evident in how our cities have grown over the years, haphazard and messy. In a survey done by the BBMP in 2014, out of the 400 buildings they looked at, only 3 conformed to all rules.
• In all cities, laws require the planning authority to encourage public scrutiny and get responses to SDPs. However, no city uses formal platforms of citizen participation such as Area Sabhas, to facilitate participatory planning.
• The fallout is evident in citizen movements such as “Flyover Beda” campaign in Bengaluru to stop the construction of a steel flyover that endangers the green cover and a heritage building.
A1
A2
A3
A4
Does your city have a decentralised system of Spatial Development Planning?
Can your city implement SDPs successfully?
Does your city have effective mechanisms to deter plan violations?
Does your city encourage participatory planning?
City
Del
hi
Bhub
anes
war
Beng
alur
u
Kol
kata
Hyd
erab
ad
Kan
pur
Chen
nai
Deh
radu
n
Bhop
al
Luck
now
Thir
uvan
an-
thap
uram
Ahm
edab
ad
Sura
t
Jaip
ur
Mum
bai
Ludh
iana
Patn
a
Pune
Rai
pur
Ran
chi
Chan
diga
rh
Lond
on
New
Yor
k
Rank 1 2 3 4 5 5 7 8 9 9 9 12 12 14 15 16 16 18 19 19 21 _ _
Score 6.4 5.2 5.0 4.9 4.7 4.7 4.7 4.7 4.4 4.4 4.4 4.3 4.3 4.1 4.0 4.0 4.0 3.3 3.1 3.1 1.9 9.8 9.8
City
Jaip
ur
Bhub
anes
war
Chen
nai
Del
hi
Hyd
erab
ad
Kol
kata
Mum
bai
Ahm
edab
ad
Beng
alur
u
Bhop
al
Chan
diga
rh
Deh
radu
n
Kan
pur
Luck
now
Ludh
iana
Patn
a
Pune
Rai
pur
Ran
chi
Sura
t
Thir
uvan
an-
thap
uram
Lond
on
New
Yor
k
Rank 1 2 2 2 2 2 2 8 8 8 8 8 8 8 8 8 8 8 8 8 8 _ _
Score 1.8 0.9 0.9 0.9 0.9 0.9 0.9 0.0 0.0 0.0 0.0 0.0 0.0 0.0 0.0 0.0 0.0 0.0 0.0 0.0 0.0 9.1 10.0
City
Ahm
edab
ad
Beng
alur
u
Bhop
al
Bhub
anes
war
Chan
diga
rh
Chen
nai
Deh
radu
n
Del
hi
Hyd
erab
ad
Jaip
ur
Kan
pur
Kol
kata
Luck
now
Ludh
iana
Mum
bai
Patn
a
Pune
Rai
pur
Ran
chi
Sura
t
Thir
uvan
an-
thap
uram
Lond
on
New
Yor
kRank - - - - - - - - - - - - - - - - - - - - - - -
Score - - - - - - - - - - - - - - - - - - - - - 10.0 10.0
City
Ahm
edab
ad
Beng
alur
u
Bhop
al
Bhub
anes
war
Chan
diga
rh
Chen
nai
Deh
radu
n
Del
hi
Hyd
erab
ad
Jaip
ur
Kan
pur
Kol
kata
Luck
now
Ludh
iana
Mum
bai
Patn
a
Pune
Rai
pur
Ran
chi
Sura
t
Thir
uvan
an-
thap
uram
Lond
on
New
Yor
k
Rank - - - - - - - - - - - - - - - - - - - - - _ _
Score 5.0 5.0 5.0 5.0 0.0 5.0 5.0 5.0 5.0 5.0 5.0 5.0 5.0 5.0 5.0 5.0 5.0 5.0 5.0 5.0 5.0 10.0 10.0
Enabling cities to make the best of their land - Rajasthan shows the way
Most Town and Country Planning Acts belong to the last century. Since then, our cities have grown several times in size. We owe our cities a comprehensive relook at the planning acts that govern them.
Number of planners in India compared with other countries
Is India trying to build 21st century cities with outdated planning laws?
Timeline : Enactment of Town and Country Planning Acts
And, do we have enough people to build these cities?
Disclosure – Swati Ramanthan, a co- founder of Jana Group is an advisor to the Chief Minister of Rajasthan.
For further details, refer to - Data Table 2, page no.58
Assessing City-Systems : Urban Planning & Design
CASE STUDY
ASKING THE RIGHT QUESTIONS
5 key elements of the bill:1. Land Title Certification (LTC) at a minimal fee of 0.5%.
2. Creation of a robust database - surveying and mapping of all urban immovable property.
3. Computerised Land Evaluation and Administration of Records (CLEAR)-
to be created to record and manage all documents.
4. Independent LTC authority as custodian of Register of Survey Records.
5. Tribunal for appeals and adjudication on orders of the LTC authority.
Source : Rafael Tuts, Director of Programme Division of UN-Habitat

17 18
No Change in Rankover 2015
Change in Rankover 2015
2016 Rank
LegendSurat
Mumbai
Patna
20
913
17
16
18
5
421
10
158
12
147 6
3
5
3
2
3
1
1
2
11 5
19
1
Rank
Raipur
Delhi
Jaipur
Ahmedabad Bhopal
Surat
MumbaiPune
BengaluruChennai
Hyderabad
Bhubaneswar
KolkataRanchi
Patna
Lucknow
Dehradun
Thiruvananthapuram
Ludhiana
Chandigarh
Kanpur
0
0
0 0
0
0
0
0
0
0
0
0
Rank
2
Rank
3
B Urban CapacitiesAnd Resources
Key Highlights 2016
The ASICS report scores cities on 20 parameters that help
us answer the following key questions around Urban Capacities & Resources.
“Indian cities account for barely 1% of the total fiscal wallet available to all governments; the global average is over 7.5%. We cannot build the cities that we deserve on love and fresh air, we need massive injections of sustainable financing. We need to strengthen the institutions in our city on both human and financial capacities”
N R Narayana Murthy Founder, Infosys Ltd.
Does your city invest adequate funds in public infrastructure and services?
Does your city have adequate number of skilled human resources?
Does your city make optimum use of Information Technology?
B1.
B3.
B2.
The 14th Finance Commission’s three-fold increase in total grants, totalling Rs.87,144 Crores, to our cities was a major shot in the arm for India’s urbanisation agenda. An additional welcome step was to link the performance grant component (20%) to - a) audited accounts of the last two years, b) increase in revenue oyer the last year and c) notification of Service Level Improvement Plans for basic services.
The Govt. of Odisha enacted the Odisha Municipal Services Act 2016 which enabled the constitution of a dedicated Municipal Cadre. The move will help all Municipalities in the state plug gaps in skills and expertise to help improve the lives of its citizens.
The Govt. of Rajasthan initiated Municipal Accounting reforms in all 188 Municipalities by empanelling Chartered Accountants to :• Improve transparency in accounting processes and audits• Facilitate access to private capital and• Better inform budget making
Having adequate urban capacities and resources can act as a launch pad from where cities take off for the better. Our cities, however, lack in this regard.
ASICS cities generate just 37% of the money that they spend. Barring Delhi and Mumbai, cities only have an average of under 350 Municipal staff per lakh of the population.
UCR - Overall Ranks 2016
17 18

19 20
City
Mum
bai
Ahm
edab
ad
Sura
t
Ran
chi
Del
hi
Pune
Thir
uvan
an-
thap
uram
Patn
a
Bhub
anes
war
Chen
nai
Hyd
erab
ad
Kan
pur
Jaip
ur
Kol
kata
Chan
diga
rh
Luck
now
Ludh
iana
Deh
radu
n
Beng
alur
u
Rai
pur
Bhop
al
Lond
on
New
Yor
k
Rank 1 2 3 4 5 6 7 8 9 10 11 12 13 14 15 16 17 18 19 20 21 _ _
Score 4.4 4.4 4.3 4.2 4.0 3.9 3.8 3.6 3.3 3.2 3.1 2.8 2.8 2.5 2.0 2.0 1.9 1.9 1.8 1.3 1.3 9.4 9.6
• The 21 ASICS cities generate only 37% of the amount they spend on average with Patna generating only 17% on its own.
• Per Capita Capex spends range from between Rs. 418 in Patna to as high as Rs. 8,389 in Thiruvananthapuram and Rs. 8,886 in Mumbai.
• While the needs of our cities are more or less similar, there is huge variance in the number of personnel they employ to take care of its citizens. Ranchi Municipal Corporation employs only 87 people per lakh of its population. In contrast, Delhi employs 1,260.
• Ahmedabad, Bengaluru, Bhubaneswar and Raipur improved their score in 2016 on the back of providing their citizens e-service delivery mechanisms.
• Pune became the only city to provide comprehensive information on schemes and services to its citizens.
B1
B2
B3
Does your city invest adequate funds in public infrastructure and services?
Does your city have adequate number of skilled human resources?
Does your city make optimum use of Information Technology?
City
Mum
bai
Kol
kata
Pune
Del
hi
Hyd
erab
ad
Ahm
edab
ad
Bhub
anes
war
Patn
a
Bhop
al
Sura
t
Chen
nai
Ran
chi
Kan
pur
Beng
alur
u
Rai
pur
Deh
radu
n
Luck
now
Thir
uvan
an-
thap
uram
Ludh
iana
Chan
diga
rh
Jaip
ur
Lond
on
New
Yor
k
Rank 1 2 3 4 5 6 7 8 9 10 11 12 13 14 15 16 17 18 19 20 21 _ _
Score 6.8 6.0 5.3 5.1 4.2 3.9 3.7 3.6 3.3 3.2 2.9 2.9 2.5 2.4 1.7 1.7 1.6 1.2 1.1 0.6 0.3 10.0 10.0
City
Chan
diga
rh
Pune
Beng
alur
u
Bhop
al
Chen
nai
Del
hi
Mum
bai
Sura
t
Luck
now
Ahm
edab
ad
Bhub
anes
war
Hyd
erab
ad
Jaip
ur
Kan
pur
Kol
kata
Ludh
iana
Patn
a
Ran
chi
Rai
pur
Thir
uvan
an-
thap
uram
Deh
radu
n
Lond
on
New
Yor
k
Rank 1 2 3 3 3 3 3 3 9 10 10 10 10 10 10 10 10 10 19 19 21 _ _
Score 7.2 6.1 5.0 5.0 5.0 5.0 5.0 5.0 3.9 1.7 1.7 1.7 1.7 1.7 1.7 1.7 1.7 1.7 1.1 1.1 0.6 10.0 10.0
ASKING THE RIGHT QUESTIONS
In 2014-15, Bengaluru overestimated its budget
by Rs. 1,821 crores (30% of its budget), an amount
greater than the combined budgets of Lucknow
(Rs. 1,444 crores) & Bhubaneswar (Rs. 244 crores).
13.7 1.3
1.31.3
1.0
1.7
3.6
1.0
1.3
0.6
1.0
0.8
1.7
1.3
2.5
0.7
1.3
2.5
0.7
0.7
0.8
1.0
7.35.5
4.13.9
3.43.0
2.82.7
2.41.8
1.10.7
0.60.6
0.50.5
0.00.0NANA
Years of experience of current Commissioner in urban departments
Average term of Commissioner over the last 5 years
Mumbai
Hyderabad
Ahmedabad
Pune
Chennai
Kolkata
Bhubaneswar
Ludhiana
Delhi
Surat
Bhopal
Ranchi
Kanpur
Jaipur
Raipur
Bengaluru
Patna
Chandigarh
Thiruvanantapuram
Dehradun
Lucknow
City Year Year Year
12-13 13-14 14-15
Bengaluru 61% 64% 30%
Hyderabad 45% 47% 47%
Chennai 10% 10% 0%
Lucknow 26% -45% -36%
Bhubaneswar 40% 47% 47%
Thiruvananthapuram 55% 64% 63%
Assessing City-Systems : Urban Capacities & Resources
For further details, refer to Data Table 3, page no. 59
Chennai has seen low budget variance between 2012-13 and 2014-15, while in Bengaluru, it has been as high as 64% in the same period.
How robust are our city budget estimates?
Are we ignoring small cities? Small cities see a higher churn of Municipal Commissioners; big city Commissioners come with more years of urban experience.
1,444 Cr.
Actuals of Lucknow
Bengaluru’s2015 estimateovershoot
1,821 Cr.
244 Cr.
Actuals of Bhubaneswar
+

21 22
Ahmedabad7,503(41%)
Mumbai 26,658
(66%)
Chandigarh 5,381(29%)
Delhi6,289(67%)
Jaipur 1,834 (25%)
Bengaluru4,474(47%)
Thiruvanantapuram 11,668
(24%)
Bhopal5,246 (27%)
Dehradun1,015 (28%)
Ludhiana3,814 (32%)
Kanpur2,526(22%)
Lucknow3,859 (18%)
Patna1,114 (17%)
Bhubaneswar1,901 (39%)
Kolkata6,844 (40%)
Chennai8,948(28%)
Hyderabad4,207(77%)
Pune10,227 (60%)
Surat7,386 (28%)
Raipur3,009(33%)
Ranchi1,403(24%)
London
Per capita expenditure in Rs.
City
Proportion of own revenue to total expenditure (%)
New York
Johannesburg
46% Own Revenue
68% Own Revenue
68% Own Revenue
Legend
ASKING THE RIGHT QUESTIONS
The big 21 cities are heavily reliant on State Government grants! Only 4 cities Mumbai, Delhi, Hyderabad and Pune generate more than 50% (own revenue) of the amount they spend.
Are our cities sustainable and independent economic units?
For further details, refer to Data Table 4, page no.60
22

23 24
Surat
Patna
6
16
1011
12
20
17
14
15
95
7
8 4
18
19
213
1
1
1
13
Rank
No Change in Rankover 2015
Change in Rankover 2015
2016 Rank
Legend
Raipur
Delhi
Jaipur
Ahmedabad Bhopal
Surat
MumbaiPune
Bengaluru Chennai
Hyderabad
Bhubaneswar
KolkataRanchi
Patna
Lucknow
Dehradun
Thiruvananthapuram
Ludhiana
Chandigarh
Kanpur
0
0
00
00
0
0
0
00
0
0
0
0
00
0 Rank
2
Rank
3
Empowered & Legitimate PoliticalRepresentation
Key Highlights 2016
c
The ASICS report scores cities on 11 parameters that help
us answer the following key questions around Empowered
& Legitimate Political Representation.
“It is a matter of urgent importance that the Central Government takes immediate steps to improve the delivery of public services to our citizens. The best and most effective way to achieve this is through the devolution of power to democratically elected and empowered Mayors and panchayat heads. If we are to build smart cities, we need to provide a smarter and more accountable form of governance in them.”
Dr Shashi Tharoor, Hon’ble Member of Parliament, 16th Lok Sabha of India
Do your city leaders have adequate power?
Is your city truly democratic?
C1.
C2.
Chennai – Tamil Nadu returned to a system of electing Mayors indirectly.
Maharashtra moved to introduce directly elected heads for the Municipal Council but not Municipal Corporations; as a result, Mumbai did not benefit from the move.
Of the 80 million residents in the ASICS cities, 46 million are governed by an indirectly elected Mayor who has tenure for 2.5 years or less, an aspect that significantly weakens city leadership.
ELPR - Overall Ranks 2016
23 24

25 26
Thiruvanan-thapuram Bhopal Bengaluru
Sl.N
o. Functions to be devolved as per the 12th schedule of the 74 th CAA
Clai
med
*
Real
ity*
Clai
med
*
Real
ity*
Clai
med
*
Real
ity*
1 Urban planning including town planning
2 Regulation of land-use and construction of buildings
3 Planning for economic and social development
4 Roads and bridges
5 Water supply for domestic, industrial and, commercial purposes
6 Public health, sanitation conservancy and solid waste management
7 Fire services
8Urban forestry, protection of the environment and promotion of ecological
aspects
9Safeguarding the interests of weaker sections of society, including the
handicapped and mentally retarded
10 Slum improvement and upgradation
11 Poverty alleviation
12Provision of urban amenities and facilities such as parks, gardens,
playgrounds
13 Promotion of cultural, educational and aesthetic aspects
14Burials and burial grounds; cremations, cremation grounds and electric
crematoriums
15 Cattle ponds; prevention of cruelty to animals
16 Vital statistics including registration of births and deaths
17Public amenities including street lighting, parking lots, bus stops and
public conveniences
18 Regulation of slaughterhouses and tanneries
• Even after 25 years of enactment of the 74th CAA which recognises Municipalities as “institutions of self-government”, states are yet to devolve powers and functions to Municipalities as envisaged. On average, only 3 out of 10* critical functions have been devolved to our cities making Municipalities glorified service providers instead of the third tier of government.
• In the absence of formal platforms of participation such as Area Sabhas, how can a Councillor listen to and address the needs of thousands of citizens? A Councillor in Mumbai, the largest city in India, represents over 50,000 people, 7 times the citizens a Councillor in Thiruvananthapuram represents.
• Citizens care more about Assembly and Parliament elections than about Municipal elections. Municipal election turnouts, when compared with state elections, are lower by 9% on average and up to 26% lower (Ranchi). This figure, when compared to Parliamentary elections is 11% and at the bottom, is lower by 30% in Surat
C1
C2
Do your city leaders have adequate power?
Is your city truly democratic?
City
Deh
radu
n
Rai
pur
Kol
kata
Ran
chi
Bhop
al
Kan
pur
Luck
now
Thir
uvan
an-
thap
uram
Patn
a
Bhub
anes
war
Ludh
iana
Chen
nai
Jaip
ur
Hyd
erab
ad
Pune
Ahm
edab
ad
Mum
bai
Sura
t
Chan
diga
rh
Del
hi
Beng
alur
u
Lond
on
New
Yor
k
Rank 1 2 3 4 5 6 7 8 9 10 11 12 13 14 15 16 17 18 19 20 21 _ _
Score 4.8 4.7 4.6 4.5 4.3 4.2 4.2 3.7 2.9 2.8 2.7 2.7 2.4 2.1 1.6 1.3 1.2 1.1 0.8 0.8 0.8 10.0 10.0
City
Thir
uvan
an-
thap
uram
Pune
Mum
bai
Kol
kata
Ahm
edab
ad
Chen
nai
Del
hi
Rai
pur
Sura
t
Patn
a
Ran
chi
Ludh
iana
Chan
diga
rh
Bhop
al
Deh
radu
n
Jaip
ur
Beng
alur
u
Hyd
erab
ad
Kan
pur
Luck
now
Bhub
anes
war
Lond
on
New
Yor
k
Rank 1 2 3 4 5 5 5 5 9 10 10 12 13 14 14 14 17 17 17 17 21 _ _
Score 9.8 9.3 8.8 7.8 7.3 7.3 7.3 7.3 7.0 6.8 6.8 5.8 5.5 5.3 5.3 5.3 4.8 4.8 4.8 4.8 4.5 10.0 10.0
Assessing City-Systems : Empowered & Legitimate Political Representation
Even 25 years after the passing of the 74th CAA, devolution remains an unfinished agenda! INTERESTING NUGGETS
The three cities are chosen to show examples from medium, large and mega city.
*As per CAG reports of respective states
Three functions core to urban governance have not been devolved in a sample of three cities we looked at. Cities continue to have limited say in functions core to urban governance as they are controlled by the state through parastatals.
* Refer to annexure page no. 51, question no.6

27 28
Gender representation in city leadership - 46% of Council seats in the ASICS cities* are held by women.• In cities with 33% reservation for women in the Municipal Council, the average proportion of female Councillors is 39%.• Bhubaneswar, Thiruvananthapuram and Mumbai stand out among cities with 50% reservation for women.
Bhu
(50%
)
Thi (
50%
)
Mum
(50%
)
Hyd
(50%
)
Del*
(50%
)
Ahd
(50%
)
Blr (
50%
)
Pat (
50%
)
Sur (
50%
)
Kol (
33%
)
Deh
(33%
)
Lud
(33%
)
Kan
(33%
)
Lck
(33%
)
Jai (
33%
)
Chd
(33%
)
50%
33%
55% 54%52% 51% 51% 51% 51% 50% 50%
46.5% 45%41%
36% 36% 36%34%
City
(res
erva
tion
)
Lege
nd
�
�
Axis
Municipal Election Turnout - LatestCompared withState Assembly
Compared withLok Sabha
-5%
-14%
-8%
-8%
-10%
-7%
-13%
-7%
-8%
-4%
-26%
-9%
-5%
-24%
2%
-8%
-6%
-13%
-30%
-27%
5%
1%
-8%
-14%
-7%
-9%
-10%
-7%
-1%
-6%
-14%
-6%
-5%
-23%
-13%
-8%
-10%
-11%
-24%
-26%
0% =
NA
72%
69%63%
60%
58%58%
57%
56%
55%
53%
49%
48%
47%
47%
46%
45%
45%
45%
41%
40%
38%
Thiruvananthapuram
Kolkata
Ludhiana
Chandigarh
Delhi
Raipur
Bhopal
Jaipur
Dehradun
Pune
Bengaluru
Chennai
Lucknow
Patna
Ahmedabad
Bhubaneswar
Hyderabad
Mumbai
Kanpur
Surat
Ranchi
INTERESTING NUGGETS
ASKING THE RIGHT QUESTIONS
All cities see a lower voter turnout in Municipal elections in comparison with State Assembly or Parliamentary elections. Notable exceptions to this pattern are the cities of Thiruvananthapuram and Kolkata, where turnouts in Municipal elections are higher than in Parliamentary elections.
CASE STUDY
How empowered are our cities and their leaders? India’s big cities do not have directly elected Mayors and the state of devolution in those are worse than in smaller cities.
The year 2016 marks the 25th year since the 74th CAA accorded formal recognition to City Governments. However, real devolution of funds, functions and functionaries as envisaged, remains an unfinished agenda. This has acted as a barrier to our cities in achieving their true potential. To address this issue, Dr Shashi Tharoor, Member of Parliament, introduced a Private Member Bill in the monsoon session of 16th Lok Sabha to revisit and strengthen the 74th CAA. Some key features of this bill are:
74th CAA Dr Tharoor’s Bill
Political Leadership
• No mention of Mayoral tenure.• No mention of Mayor’s powers and
functions.• States ‘may’ devolve functions to cities as
listed in the 12th schedule of the Act.
• Mayor to be directly elected with tenure co-terminus with the Municipality.
• Mayor to be the executive head with all civic agencies reporting to her/him.
• States ‘shall’ devolve all functions including public transportation & promotion of IT.
Citizen Participation
• Mandates Ward Committees (WCs) be formed comprising one or more wards having a population of 3 lakhs or more.
• No timelines on WC formation mentioned• No provision of citizen involvement in
governance below the level of WCs.
• Mandates WC be formed in each ward (1Lakh and above).
• Committees to be formed within 2 years from the commencenent of the Act.
• Introduces ‘Area Sabha’, a committee comprising 1400 to 7000 registered voters.
SFC • Non-compliance with the SFC’s recommendations only warrant an explanatory note to be laid within the Legislature without any time limit.
• Demands an action-taken report to be laid within the Legislature, 6 months from the submission of recommendation.
MPC/DPC • No timelines on formation. • Demands their constitution within 2 years from the commencenent of the Act.
*Figure is for the 16 ASICS cities for which information on women Councillors was available. In case of unavailability of gender information data was approximated from the names of the Councillors.For further details, refer to Data Table 6, page no. 62
A constitutional bid for better cities : Stronger cities with an empowered Mayor
For
furt
her
deta
ils, r
efer
to D
ata
Tabl
e 5,
pag
e 61
Political Empowerment Resources
CITY Population (Census 2011 Mn)
Is Mayor Directly Elected
Tenure of Mayor
(years)
Critical Functions Devolved*
Power over Taxation**(out of 10)
Power over Employees***
(out of 10)
Bhopal 1.8 Yes 5 30% 2.5 8.3
Dehradun 0.6 Yes 5 10% 7.5 8.3
Kanpur 2.8 Yes 5 20% 7.5 8.3
Lucknow 2.8 Yes 5 20% 7.5 8.3
Raipur 1.0 Yes 5 30% 2.5 8.3
Ranchi 1.1 Yes 5 30% 7.5 6.7
Bhubaneswar 0.8 No 5 10% 5 1.7
Chennai 4.6 No 5 30% 7.5 0
Hyderabad 6.7 No 5 10% 7.5 0
Jaipur 3.0 No 5 20% 7.5 0
Kolkata 4.5 No 5 50% 5 8.3
Ludhiana 1.6 No 5 30% 7.5 0
Patna 1.7 No 5 40% 7.5 10
Thiruvananthapuram 0.7 No 5 20% 10 5
Ahmedabad 5.6 No 2.5 50% 5 8.3
Mumbai 12.4 No 2.5 60% 5 8.3
Pune 3.1 No 2.5 60% 5 8.3
Surat 4.5 No 2.5 50% 5 8.3
Bengaluru 8.4 No 1 30% 5 1.7
Chandigarh 1.0 No 1 30% 7.5 0
Delhi 11.0 No 1 30% 7.5 10
*Refer to annexure page no.51, question no.6
** Refer to annexure page no. 47, question no.1
***Refer to annexure page no. 49, question no.12
Disclosure – Janaagraha worked with the office of Dr Tharoor in the framing of this bill as a principal knowledge partner.
Proportion of women in Municipal Council
29 30
Surat
Patna
16
20
10
135
7
19
21
15
17
12
8
4
14
518
11 1
2
2
5
5
1
2
1
4
1
9
1
2
Rank
No Change in Rankover 2015
Change in Rankover 2015
2016 Rank
LegendSurat
Patna
Raipur
Delhi
Jaipur
Ahmedabad Bhopal
Surat
MumbaiPune
Bengaluru Chennai
Hyderabad
Bhubaneswar
KolkataRanchi
Patna
Lucknow
Dehradun
Thiruvananthapuram
Ludhiana
Chandigarh
Kanpur
0
0
0
0
0
0
0
0
0
0
Rank
2
Rank
3
Transparency,Accountability &Participation
Key Highlights 2016
D
Key Highlights 2016
“Because for all our outward differences we, in fact, all share the same proud title, the most important office in a democracy: Citizens. So you see, that’s what our democracy demands. It needs you. Not just when there is an election, not just when your own narrow interest is at stake, but over the full span of a life time. If you’re tired of arguing with strangers on the internet, try talking with one of them in real life. If something needs fixing, then lace up your shoes and do some organising. If you are disappointed by your elected officials, grab a clipboard, get some signatures, and run for office yourself, Show up. Dive in. Stay at it. ”
Barack Obama,Former President, USA
The ASICS report scores cities on 11 parameters that help us
answer the following key questions around Transparency,
Accountability & Participation.
Does your city put out adequate information and facilitate citizen participation?
How well does your city address citizen complaints?
D1.
D2.
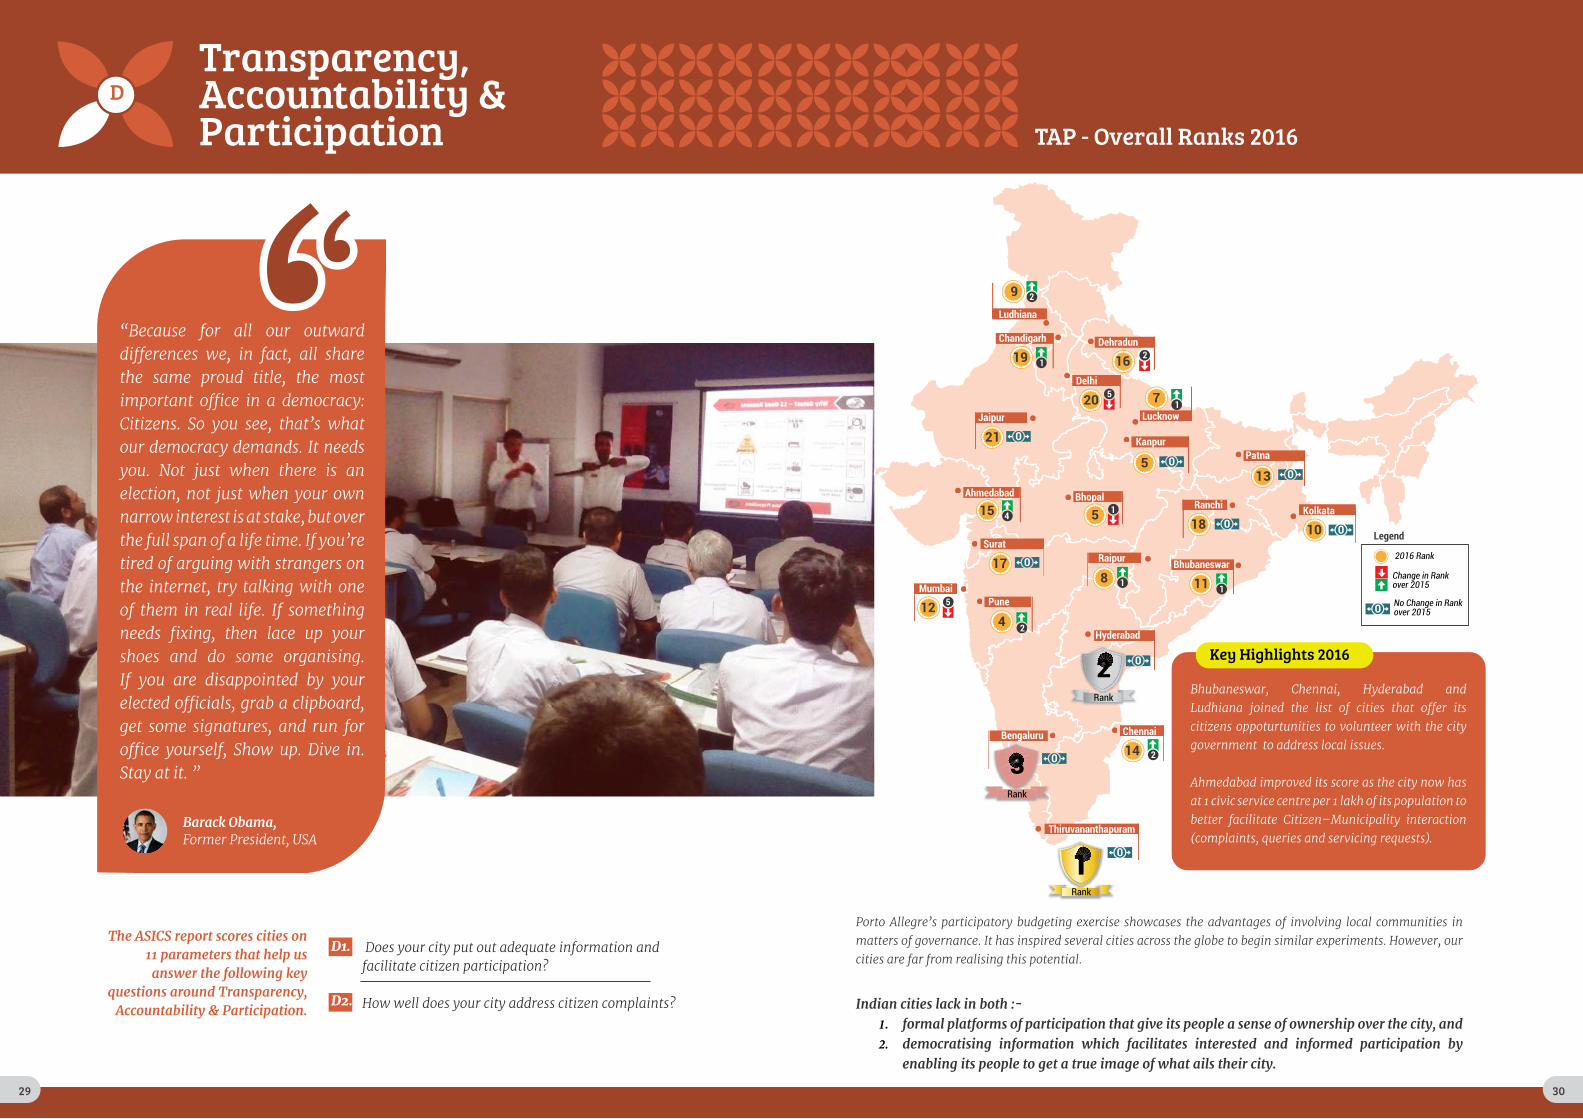
Bhubaneswar, Chennai, Hyderabad and Ludhiana joined the list of cities that offer its citizens oppoturtunities to volunteer with the city government to address local issues.
Ahmedabad improved its score as the city now has at 1 civic service centre per 1 lakh of its population to better facilitate Citizen–Municipality interaction (complaints, queries and servicing requests).
TAP - Overall Ranks 2016
Porto Allegre’s participatory budgeting exercise showcases the advantages of involving local communities in matters of governance. It has inspired several cities across the globe to begin similar experiments. However, our cities are far from realising this potential.
Indian cities lack in both :- 1. formal platforms of participation that give its people a sense of ownership over the city, and 2. democratising information which facilitates interested and informed participation by
enabling its people to get a true image of what ails their city.
29 30
31 32
City
Thir
uvan
an-
thap
uram
Rai
pur
Ahm
edab
ad
Beng
alur
u
Bhop
al
Bhub
anes
war
Hyd
erab
ad
Kan
pur
Pune
Chen
nai
Del
hi
Jaip
ur
Chan
diga
rh
Deh
radu
n
Kol
kata
Luck
now
Sura
t
Mum
bai
Patn
a
Ludh
iana
Ran
chi
Lond
on
New
Yor
kRank 1 2 3 3 3 3 3 3 3 10 10 12 13 13 13 13 13 18 18 20 20 _ _
Score 7.5 4.3 3.9 3.9 3.9 3.9 3.9 3.9 3.9 3.6 3.6 3.2 2.5 2.5 2.5 2.5 2.5 2.1 2.1 1.4 1.4 8.0 9.0
Mohalla Sabha
Implementation of the work usingCitizen-Local Area Development Funds
or through Agencies
Work Completed Discussion on important issues in the Mohalla
Voting and selection of priority issues
�
�
�
�
�
Life Cycle of Mohalla Sabhas
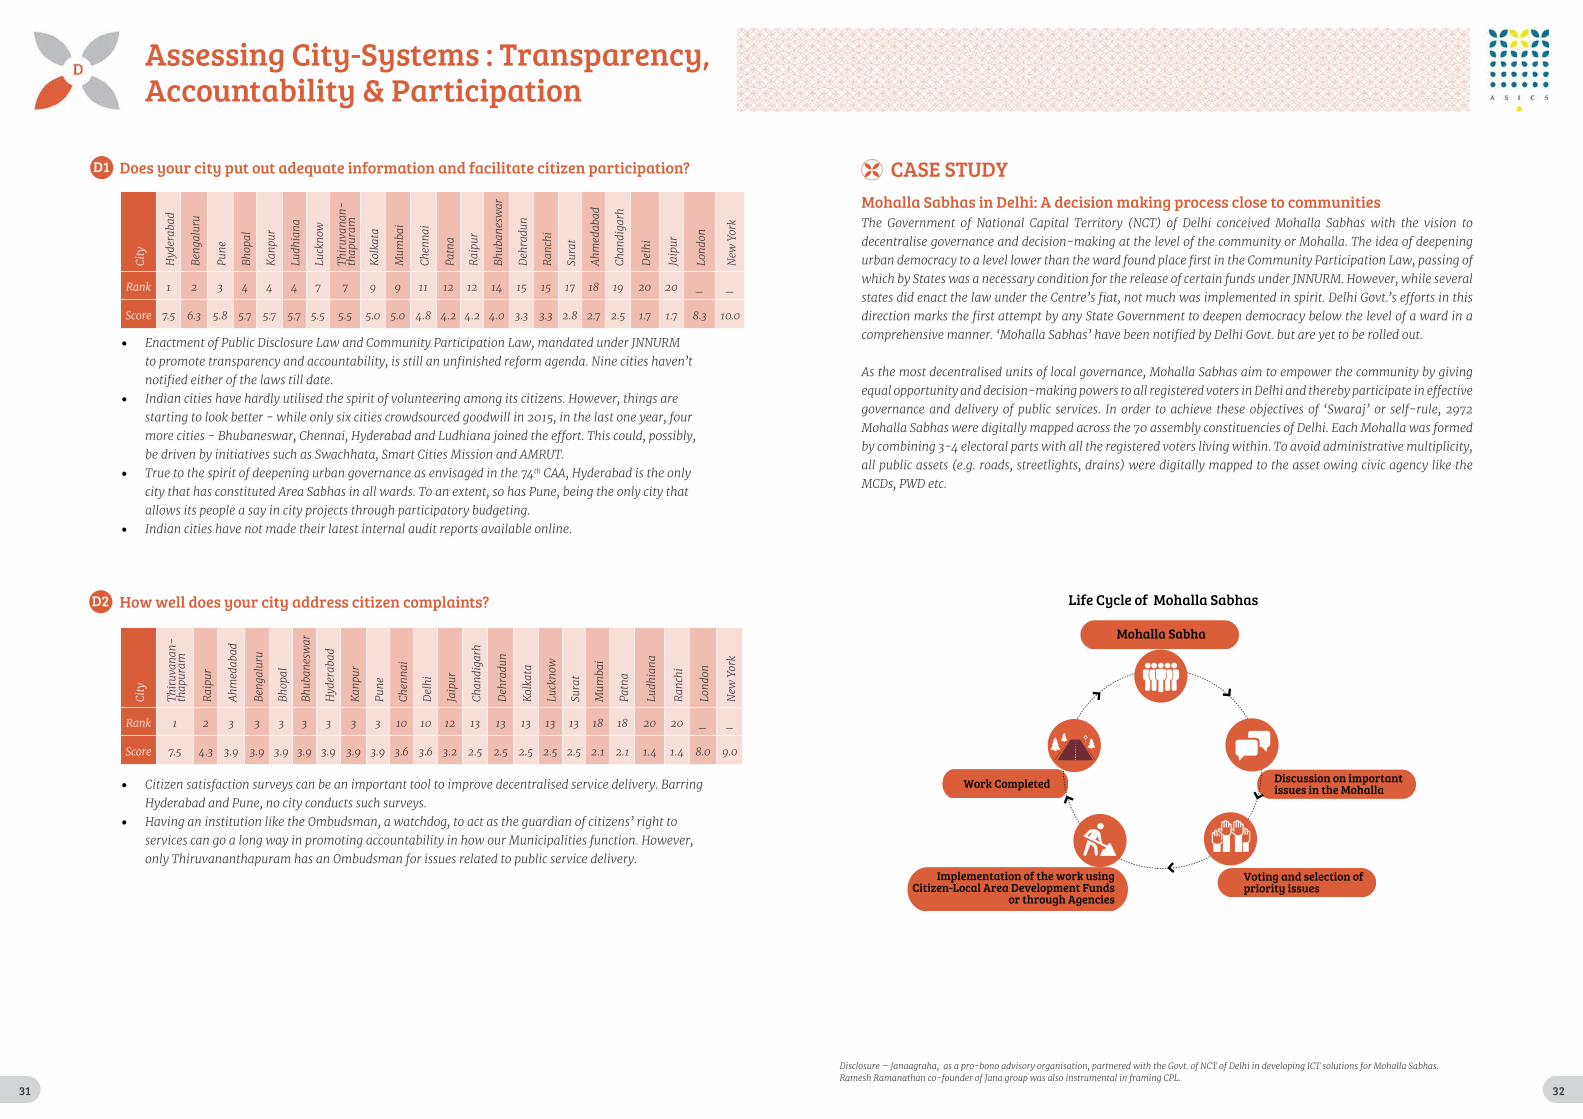
• Enactment of Public Disclosure Law and Community Participation Law, mandated under JNNURM to promote transparency and accountability, is still an unfinished reform agenda. Nine cities haven’t notified either of the laws till date.
• Indian cities have hardly utilised the spirit of volunteering among its citizens. However, things are starting to look better - while only six cities crowdsourced goodwill in 2015, in the last one year, four more cities - Bhubaneswar, Chennai, Hyderabad and Ludhiana joined the effort. This could, possibly, be driven by initiatives such as Swachhata, Smart Cities Mission and AMRUT.
• True to the spirit of deepening urban governance as envisaged in the 74th CAA, Hyderabad is the only city that has constituted Area Sabhas in all wards. To an extent, so has Pune, being the only city that allows its people a say in city projects through participatory budgeting.
• Indian cities have not made their latest internal audit reports available online.
• Citizen satisfaction surveys can be an important tool to improve decentralised service delivery. Barring Hyderabad and Pune, no city conducts such surveys.
• Having an institution like the Ombudsman, a watchdog, to act as the guardian of citizens’ right to services can go a long way in promoting accountability in how our Municipalities function. However, only Thiruvananthapuram has an Ombudsman for issues related to public service delivery.
D1
D2
Does your city put out adequate information and facilitate citizen participation?
How well does your city address citizen complaints?
City
Hyd
erab
ad
Beng
alur
u
Pune
Bhop
al
Kan
pur
Ludh
iana
Luck
now
Thir
uvan
an-
thap
uram
Kol
kata
Mum
bai
Chen
nai
Patn
a
Rai
pur
Bhub
anes
war
Deh
radu
n
Ran
chi
Sura
t
Ahm
edab
ad
Chan
diga
rh
Del
hi
Jaip
ur
Lond
on
New
Yor
k
Rank 1 2 3 4 4 4 7 7 9 9 11 12 12 14 15 15 17 18 19 20 20 _ _
Score 7.5 6.3 5.8 5.7 5.7 5.7 5.5 5.5 5.0 5.0 4.8 4.2 4.2 4.0 3.3 3.3 2.8 2.7 2.5 1.7 1.7 8.3 10.0
Assessing City-Systems : Transparency,Accountability & Participation
Mohalla Sabhas in Delhi: A decision making process close to communitiesThe Government of National Capital Territory (NCT) of Delhi conceived Mohalla Sabhas with the vision to decentralise governance and decision-making at the level of the community or Mohalla. The idea of deepening urban democracy to a level lower than the ward found place first in the Community Participation Law, passing of which by States was a necessary condition for the release of certain funds under JNNURM. However, while several states did enact the law under the Centre’s fiat, not much was implemented in spirit. Delhi Govt.’s efforts in this direction marks the first attempt by any State Government to deepen democracy below the level of a ward in a comprehensive manner. ‘Mohalla Sabhas’ have been notified by Delhi Govt. but are yet to be rolled out.
As the most decentralised units of local governance, Mohalla Sabhas aim to empower the community by giving equal opportunity and decision-making powers to all registered voters in Delhi and thereby participate in effective governance and delivery of public services. In order to achieve these objectives of ‘Swaraj’ or self-rule, 2972 Mohalla Sabhas were digitally mapped across the 70 assembly constituencies of Delhi. Each Mohalla was formed by combining 3-4 electoral parts with all the registered voters living within. To avoid administrative multiplicity, all public assets (e.g. roads, streetlights, drains) were digitally mapped to the asset owing civic agency like the MCDs, PWD etc.
CASE STUDY
Disclosure – Janaagraha, as a pro-bono advisory organisation, partnered with the Govt. of NCT of Delhi in developing ICT solutions for Mohalla Sabhas. Ramesh Ramanathan co-founder of Jana group was also instrumental in framing CPL.

33 34
URBAN PLANNING & DESIGN URBAN CAPACITIES & RESOURCES
Amend Planning Act: • To mandate Regional, Municipal and Ward-level plans in a nested structure with concurrent timelines• To clearly define objective and contents for each level of SDP
Amend Cadre and Recruitment Rules to ensure that adequate skilled workforce is available
Constitute:• A Metropolitan Planning Committee anchored by Municipal elected representatives for formulating city’s metropolitan plan• A State Spatial Planning Board with well-defined composition, powers and functions
Create a common digital base map shared by all Planning Authorities which is updated by all civic agencies through GIS at fixed periodic intervals
Institute:• A robust framework to measure success of the SDP against quantitative benchmarks• A mechanism to ensure adequate institutional capacity to enforce SDPs• Urban design standards to guide the execution of urban projects• Single window clearance for development projects that are in conformity with SDPs
Implement an effective system to monitor and prevent plan violations in a decentralised manner and to penalise the same
Create enabling policies to:• Guarantee land title • Maximise land utilization for development and financing
Enforce:• Participation of agencies and elected representatives at respective levels for SDP, i.e. Metropolitan, Municipal and Ward• Dissemination of SDP and meaningful participation of citizens in its formulation
Amend Municipal Corporation Act to:• To fully devolve powers to set tax rates and the underlying base values to the city in respect of: • Property tax • Profession tax
Establish a Land and Property Management division to:• Create a GIS-based database of all land and property owned by the central, state and city governments in the city • Optimise return on assets• Mark to Market lease agreements
Make all municipal bond issuances tax-exempt, incentivise insurance companies and pension funds to invest in the same
Update Cadre and Recruitment Rules incorporating the following:• Introduction of performance incentives and a robust performance evaluation process
Implement a real-time works management system to track the lifecycle of each civic work with detailed schedule, progress, payment schedule
Reforms Timeline Reforms Timeline
Stat
e
Stat
e
Stat
eSt
ate
City
City
Cent
re
Stat
eSt
ate
City
City
City
Stat
eSt
ate
City
/Sta
teCi
ty/S
tate
Cent
re/ S
tate
City
/Sta
te
Amend Municipal Corporation Act to:• Mandate a medium-term Fiscal Plan • Empanel CAs to audit annual accounts• Make public the Annual Report with audited annual accounts, operational performance, including service levels, significant projects accomplished, best practices, risks and mitigants and plans for subse quent year• To fully devolve powers to set tax rates and the underlying base values to the city in respect of: • Entertainment tax
Establish a comprehensive and integrated financial management information system for the city and its constituent entities, which can serve as a City Resource Planning platform, on the lines of an ERP system for the city.
Update Cadre and Recruitment Rules incorporating the following:• Detailed and specific job descriptions• Dynamic workforce planning• Introduction of performance incentives and a robust performance evaluation process• Lateral hiring in key departments • Security of tenure of at least 3 years for senior leadership
Explore outsourcing of tax and fee collections such as property tax, parking fee and non-core activities
Implement a medium term workforce plan and an annual workforce plan linked to target service levels which is factored into annual budgets
Leverage digital platforms including the ULB website and social media platforms for two-way engagement with citizens for sharing information and soliciting feedback to improve service delivery
Stat
e
Medium-TermImmediateImmediate Medium-Term
Reforms to City-Systems: A Roadmap
33 34
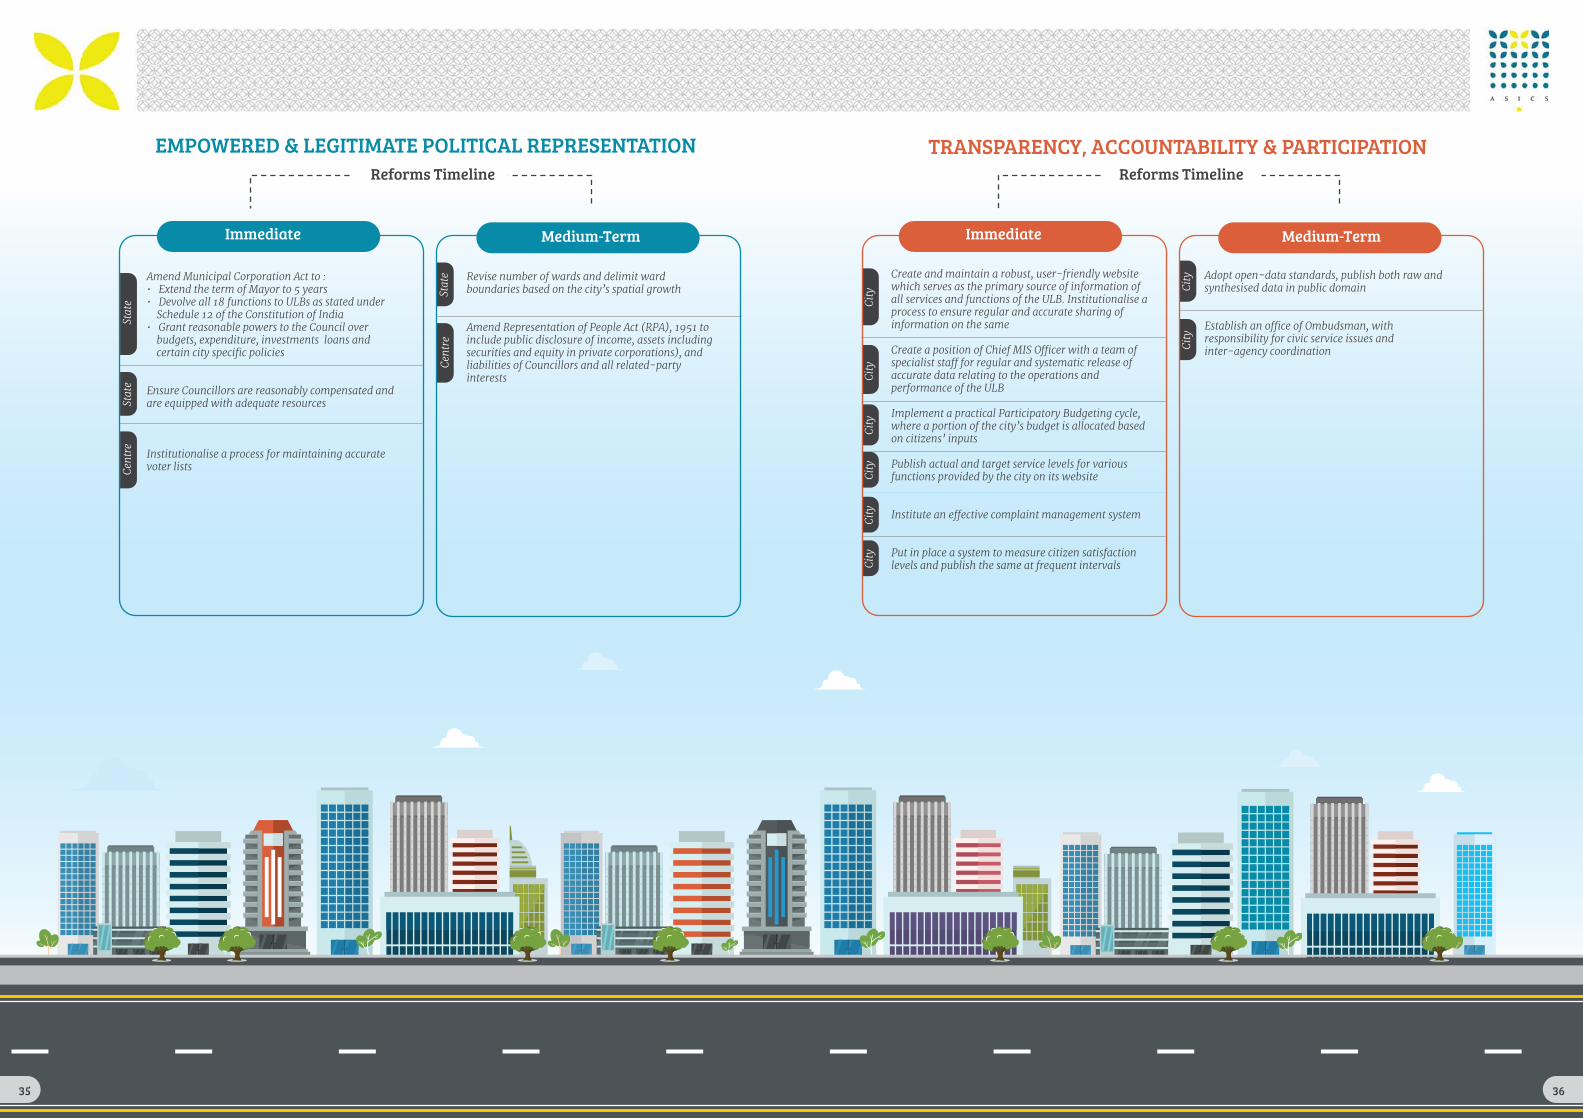
35 36
EMPOWERED & LEGITIMATE POLITICAL REPRESENTATION TRANSPARENCY, ACCOUNTABILITY & PARTICIPATION
Amend Municipal Corporation Act to : • Extend the term of Mayor to 5 years• Devolve all 18 functions to ULBs as stated under Schedule 12 of the Constitution of India• Grant reasonable powers to the Council over budgets, expenditure, investments loans and certain city specific policies
Ensure Councillors are reasonably compensated and are equipped with adequate resources
Institutionalise a process for maintaining accurate voter lists
Revise number of wards and delimit ward boundaries based on the city’s spatial growth
Amend Representation of People Act (RPA), 1951 to include public disclosure of income, assets including securities and equity in private corporations), and liabilities of Councillors and all related-party interests
Adopt open-data standards, publish both raw and synthesised data in public domain
Establish an office of Ombudsman, with responsibility for civic service issues and inter-agency coordination
Reforms Timeline Reforms Timeline
Stat
e City
City
Stat
e
Stat
e
Cent
re
Cent
re
Create and maintain a robust, user-friendly website which serves as the primary source of information of all services and functions of the ULB. Institutionalise a process to ensure regular and accurate sharing of information on the same
Create a position of Chief MIS Officer with a team of specialist staff for regular and systematic release of accurate data relating to the operations and performance of the ULB
Implement a practical Participatory Budgeting cycle, where a portion of the city’s budget is allocated based on citizens’ inputs
Publish actual and target service levels for various functions provided by the city on its website
Institute an effective complaint management system
Put in place a system to measure citizen satisfaction levels and publish the same at frequent intervals
City
City
City
City
City
City
Immediate Immediate Medium-TermMedium-Term
35 36
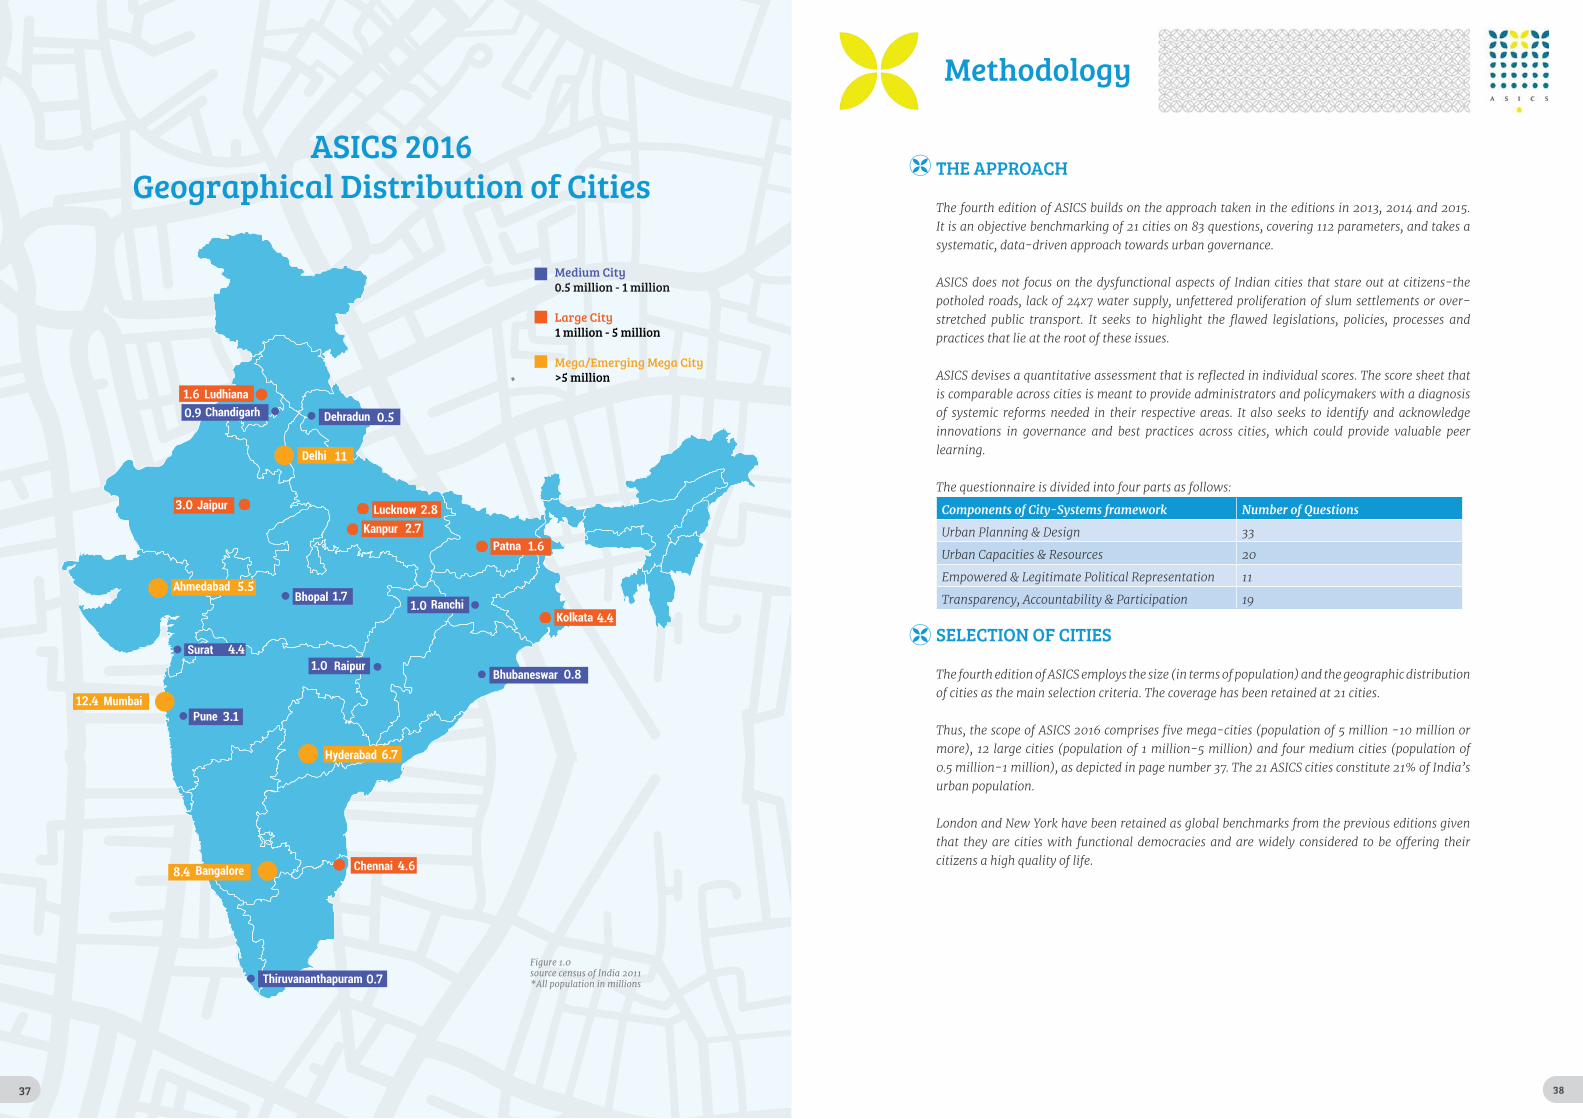
37 38
SuratSuratRaipur
Delhi
Jaipur
AhmedabadBhopal
Surat
MumbaiPune
Bangalore Chennai
Hyderabad
Bhubaneswar
KolkataRanchi
Patna
Lucknow
Dehradun
Thiruvananthapuram
LudhianaChandigarh
Kanpur
Medium City0.5 million - 1 million
Large City1 million - 5 million
Mega/Emerging Mega City>5 million
1.60.9 0.5
11
3.0 2.82.7
1.6
4.41.0
1.7
1.0
5.5
4.4
0.8
3.1
6.7
4.6
0.7
12.4
8.4
ASICS 2016Geographical Distribution of Cities
Figure 1.0 source census of India 2011*All population in millions
Methodology
THE APPROACH
The fourth edition of ASICS builds on the approach taken in the editions in 2013, 2014 and 2015. It is an objective benchmarking of 21 cities on 83 questions, covering 112 parameters, and takes a systematic, data-driven approach towards urban governance.
ASICS does not focus on the dysfunctional aspects of Indian cities that stare out at citizens-the potholed roads, lack of 24x7 water supply, unfettered proliferation of slum settlements or over-stretched public transport. It seeks to highlight the flawed legislations, policies, processes and practices that lie at the root of these issues.
ASICS devises a quantitative assessment that is reflected in individual scores. The score sheet that is comparable across cities is meant to provide administrators and policymakers with a diagnosis of systemic reforms needed in their respective areas. It also seeks to identify and acknowledge innovations in governance and best practices across cities, which could provide valuable peer learning.
The questionnaire is divided into four parts as follows:
Components of City-Systems framework Number of Questions
Urban Planning & Design 33
Urban Capacities & Resources 20
Empowered & Legitimate Political Representation 11
Transparency, Accountability & Participation 19
SELECTION OF CITIES
The fourth edition of ASICS employs the size (in terms of population) and the geographic distribution of cities as the main selection criteria. The coverage has been retained at 21 cities.
Thus, the scope of ASICS 2016 comprises five mega-cities (population of 5 million -10 million or more), 12 large cities (population of 1 million-5 million) and four medium cities (population of 0.5 million-1 million), as depicted in page number 37. The 21 ASICS cities constitute 21% of India’s urban population.
London and New York have been retained as global benchmarks from the previous editions given that they are cities with functional democracies and are widely considered to be offering their citizens a high quality of life.
37

39 40
SELECTION OF CATEGORIES AND QUESTIONS
The questions have been categorised into four parts, drawing from the City-Systems framework of Janaagraha: Urban Planning & Design, Urban Capacities & Resources; Empowered & Legitimate Political Representation; and Transparency, Accountability & Participation.
The questions used to evaluate cities were drawn from Janaagraha’s experience of over a decade in urban governance reforms. We also used as a basis for framing questions some relevant laws, policies and administrative reports. These included the 74th CAA, Report of the 2nd ARC, Report of the 14th Finance Commission, the NUSPD guidelines and reform conditions from JNNURM. A clear rationale was adopted to ensure that the questions comprehensively represented polices, institutions, processes and aspects of implementation which, if fixed, could substantially transform the shape of our cities and ensure a better quality of life to citizens.
DATA COLLECTION
Data collection spanned a period of six months. The latest amendments in laws and policies have been factored in and we have taken care to ensure that the data collected in the early months was re-checked for its latest available form.
We continuously encountered a lack of transparency within governments while seeking information as basic as the budgets of ULBs, SDPs and audit reports. We also relied on phone calls to relevant government and ULB officials and on the opinions of experts such as former Chief Town Planner of the Town and Country Planning Organisation - Government of India - Prof. E F N Ribeiro. For a detailed break-up of sources, please refer to Data Sources on Page 41.
SCORING & WEIGHTAGE
All questions have been scored on a range of 0 to 10, with 10 being the highest that a city can score. Select questions have been divided into sub-questions and given graded scores to ensure that various facets are captured within a single parameter. For instance, ULBs have been assessed for preparing and implementing SDPs. The sub-questions effectively capture the essence of devolution by specifically evaluating cities on three levels of planning – Metropolitan SDPs, Municipal Plans and Ward SDPs. ASICS presents an overall score only to provide a more holistic representation of the data.
Uniform weightage has been assigned to individual questions. We believe each question probes a defining quality and is equally important for building a City-Systems framework. Each category within the City-Systems framework has also been weighted equally.
EXPLANATORY SCHEDULE
We have provided explanations for some of the questions listed below, as their evaluation deserved elucidation beyond the scoring method that is carried in the individual scorecards.
Urban Capacities & ResourcesQ1. What is the percentage of own revenues to total expenditure for the ULB?
We have evaluated this question by computing the revenues generated by the ULB on its own, as a percentage of the ULB’s total expenditure, from the 2016-17 budget actuals of ULBs. In case of Raipur, revised budget estimate of 2012-13 is used due to paucity of data. Similarly for Ludhiana and Kolkata 2013-14 budget actuals are used. Also, for Thiruvananthapuram 2014-15 revised budget estimates are used. This percentage was subsequently converted into a score on 10.
Q2. Does the ULB have adequate staff commensurate with the population?We considered the total number of ULB employees, which included permanent staff as well as contractual workers, wherever available. We subsequently computed the ratio of employees per lakh population and the figure for individual cities was benchmarked against Delhi, which had the highest number of staff.
Q3. Have five SFCs been constituted by the state government?We derived the periodicity for the setting up of SFCs from the 74th CAA. Accordingly, states are required to have constituted five SFCs in the period between 1994 and 2016. We have scored cities as 10 for constituting all five SFCs, 7.0 if they constituted four, 5.0 if they constituted three, 3.0 if they constituted two, and 1.0 if they constituted one. We factored in the requirement for newly-formed states such as Chhattisgarh, Jharkhand and Uttarakhand to have only four SFCs, scoring 10 if four SFCs are constituted,7.0 for three SFCs and 5.0 for two SFCs.
Empowered & Legitimate Political RepresentationQ1. Is the ULB responsible for providing 10 specific and critical functions and the services?
We checked whether 10 critical civic functions have been devolved from State list to the ULB. Seven of these parameters (urban planning, planning for economic and social development, roads and bridges, water supply, fire and emergency services, promotion of cultural, educational and aesthetic aspects, and urban environment management & heritage) were selected from XIIth Schedule functions and the other three (school education, public health including community health centres / area hospitals, traffic management and civic policing activities) from recommendations of the 2nd Administrative Reforms Commission. Each function was scored on 1.0.
Transparency, Accountability & ParticipationQ1. Does the ULB have single-window civic service centres?
We evaluated civic centres on whether they provide services such as issue of birth/death certificates, payment of bills, payment of property tax, and complaint redressal, and whether they meet the criteria of population coverage of one civic service centre per one lakh population.
ADDITIONAL POINTS
• We have used the term ‘city’ throughout the report and have considered the ULB and its population for this purpose.
• The scores for Delhi reflect the jurisdiction covered by North Delhi Municipal Corporation, South Delhi Municipal Corporation and East Delhi Municipal Corporation.
• Delhi has been given zero for Capex as the three Municipal Corporations do not have a capital expenditure/receipts section in the respective budgets.
• In the UPD section, Bhubaneswar and Dehradun have population of less than one million and have been scored as NA. As per the 74th CAA, UAs/ULBs with more than one million population are required to have Metropolitan Authority demarcated and SDPs to be prepared for the same.

41 42
Data Sources
Municipal Corporation Acts City
Bombay Provincial Municipal Corporation Act, 1949 Ahmedabad, Surat, Pune
Karnataka Municipal Corporations Act, 1976 Bengaluru
Madhya Pradesh Municipal Corporation Act, 1956 Bhopal
Orissa Municipal Corporation Act, 2003 Bhubaneswar
Punjab Municipal Corporation Act, 1976 Chandigarh, Ludhiana
The Chennai City Municipal Corporation Act, 1919 Chennai
Uttarakhand Municipal Corporation Act, 1959 Dehradun
Delhi Municipal Corporation Act, 1957 Delhi
Greater Hyderabad Municipal Corporation Act, 1955 Hyderabad
Rajasthan Municipality Act, 2009 Jaipur
Uttar Pradesh Municipal Corporation Act, 1959 Kanpur, Lucknow
Kolkata Municipal Corporation Act, 1980 Kolkata
Mumbai Municipal Corporation Act, 1888 Mumbai
Bihar Municipal Act 2007 Patna
Chhattisgarh Municipal Corporation Act, 1956 Raipur
Jharkhand Municipal Act, 2011 Ranchi
Kerala Municipality Act, 1994 Thiruvananthapuram
Municipal Corporation Budgets 2016-2017, 2015-2016 (Kolkata and Thiru-vananthapuram), 2013-2014 (Raipur)
Websites of Municipal Corporations City
http://ahmedabadcity.gov.in/portal/index.jsp Ahmedabad
http://bbmp.gov.in/ Bengaluru
http://www.bhopalmunicipal.com/ Bhopal
http://bmc.gov.in/ Bhubaneswar
http://mcchandigarh.gov.in/ Chandigarh
http://www.chennaicorporation.gov.in/ Chennai
http://nagarnigamdehradun.com/ Dehradun
http://mcdonline.gov.in/ Delhi
http://www.ghmc.gov.in/ Hyderabad
http://jaipurmc.org/Jp_HomePagemain.aspx Jaipur
http://kmc.up.nic.in/ Kanpur
https://www.kmcgov.in/KMCPortal/jsp/KMCPortalHome1.jsp
Kolkata
http://lmc.up.nic.in/ Lucknow
http://main.mcludhiana.gov.in/ Ludhiana
http://www.mcgm.gov.in/ Mumbai
http://www.patnanagarnigam.in/ Patna
http://www.punecorporation.org/ Pune
http://nagarnigamraipur.nic.in/ Raipur
http://www.ranchimunicipal.com/ Ranchi
https://www.suratmunicipal.gov.in/ Surat
http://www.corporationoftrivandrum.in/ Thiruvananthapuram
Government Reports, Other Acts & Rules
National Urban Spatial Planning & Development Guidelines - 2013
Report on Indian Urban Infrastructure and Services- March 2011 by the
High Powered Expert Committee (HPEC) for Estimating the Investment
Requirements for Urban Infrastructure Services
Report of the Fourteenth Finance Commission
Second Administrative Reforms Commission Report - ‘Sixth Report on Local
Governance’ an inspiring journey into the future’
Audit Reports of the CAG of India
State Advertisement Tax Acts
State Civil Service Rules
State Election Acts/Rules
State Entertainment Tax Acts
State Lokayukta Acts
State Profession Tax Acts
State Public Services Guarantee Acts
State FRBM Acts
Metropolitan/Municipal Master Plans City
AUDA (Ahmedabad Urban Development Authority)
Master Plan 2021
Ahmedabad
BDA (Bengaluru Development Authority) Master Plan
2015
BMRDA (Bengaluru Metropolitan Regional Development
Authority) Master Plan 2031
Bengaluru
Bhopal Development Authority Master Plan 2005 Bhopal
Bhubaneswar Comprehensive Development Plan 2030 Bhubaneswar
Chandigarh Master Plan 2031 Chandigarh
CMDA (Chennai Metropolitan Development Authority)
Master Plan 2026
Chennai
Dehradun Development Authority Master Plan 2021 Dehradun
Delhi Development Authority Master Plan 2021 Delhi
Hyderabad Metropolitan Development Authority Master
Plan 2031
Hyderabad
Jaipur Development Authority Master Plan 2025 Jaipur
Kanpur Development Authority Master Plan 2021 Kanpur
Kolkata Metropolitan Development Authority Master
Plan 2025
Kolkata
Lucknow Development Authority Master Plan 2021 Lucknow
Ludhiana Master Plan 2021 Ludhiana
Mumbai Metropolitan Region Development Authority
Master Plan 2011
Mumbai
Patna Master Plan 2021 Patna
Pune Development Plan 2027 Pune
Raipur Master Plan 2021 Raipur
Ranchi Master Plan 2037 Ranchi
Surat Urban Development Authority Development Plan
2004
Surat
Trivandrum Master Plan 2031 Thiruvananthapuram
Town and Country Planning Acts City
Gujarat Town Planning and Urban Development Act,
1976
Ahmedabad, Surat
Karnataka Town and Country Planning Act, 1961 Bengaluru
Madhya Pradesh Town and Country Planning Act, 1975 Bhopal
Orissa Town Planning and Improvements Trust Act, 1956 Bhubaneswar
The Capital of Punjab (Development and Regulation )
Act, 1952
Chandigarh
Tamil Nadu Town and Country Planning Act, 1971 Chennai
Uttarakhand Urban Planning and Development Act, 1973 Dehradun
Delhi Development Act 1957/Delhi (NCR) Planning
Board Act, 1985
Delhi
Andhra Pradesh Town Planning Act, 1920 Hyderabad
Andhra Pradesh Urban Areas Development Act, 1975 Hyderabad
Hyderabad Metropolitan Development Act, 2008 Hyderabad
Jaipur Development Authority Act,1982 Jaipur
Uttar Pradesh Urban Planning and Development Act,
1973
Kanpur, Lucknow
West Bengal Town and Country (Planning and Develop-
ment) Act,
Kolkata
Punjab Regional and Town Planning and Development
Act, 1995
Ludhiana
Maharashtra Regional and Town Planning Act, 1966 Mumbai, Pune
Bihar Urban Regional Planning and Development Act,
2012
Patna
Jharkhand Town Planning and Improvement Trust Act,
1954
Ranchi
Chhattisgarh Nagar Tatha Gram Nivesh Niyam, 1973 Raipur
Kerala Town and Country Planning Act 2016 Thiruvananthapuram
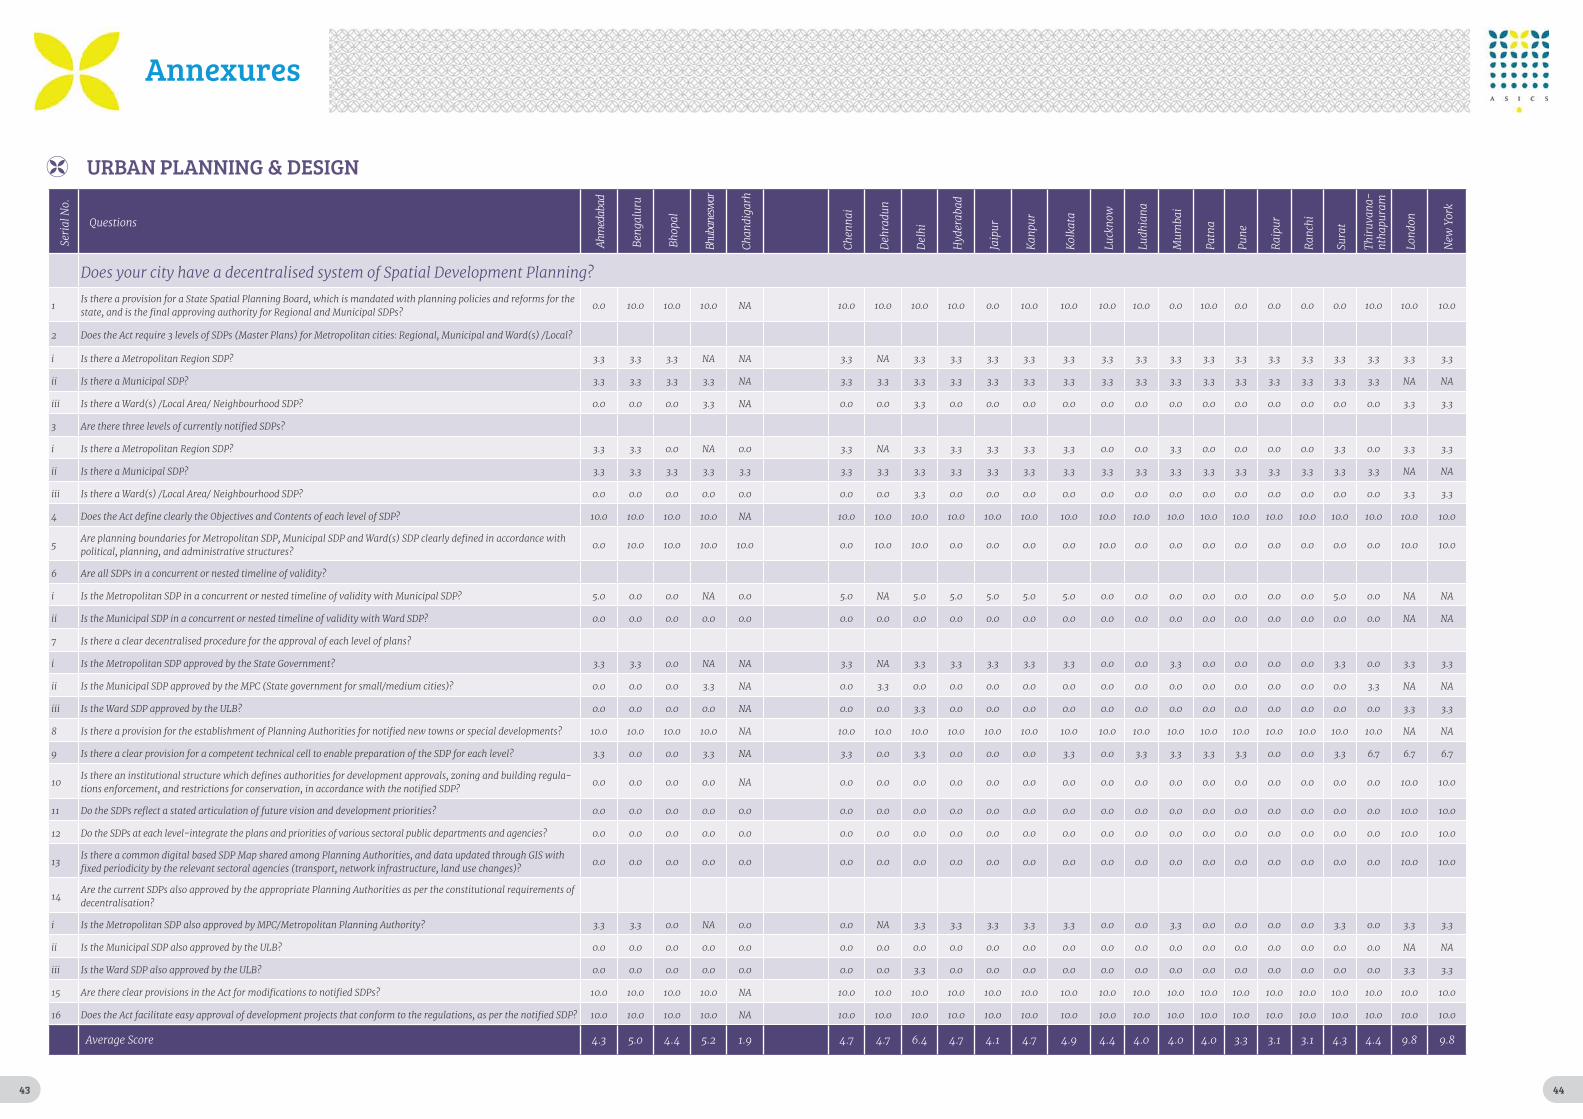
43 44
URBAN PLANNING & DESIGN
Seri
al N
o.
Questions
Ahm
edab
ad
Ben
galu
ru
Bho
pal
Bhub
anes
war
Chan
diga
rh
Chen
nai
Deh
radu
n
Del
hi
Hyd
erab
ad
Jaip
ur
Kan
pur
Kol
kata
Luck
now
Ludh
iana
Mum
bai
Patn
a
Pune
Rai
pur
Ran
chi
Sura
t
Thir
uvan
a-nt
hapu
ram
Lond
on
New
Yor
k
Does your city have a decentralised system of Spatial Development Planning?
1Is there a provision for a State Spatial Planning Board, which is mandated with planning policies and reforms for the state, and is the final approving authority for Regional and Municipal SDPs?
0.0 10.0 10.0 10.0 NA 10.0 10.0 10.0 10.0 0.0 10.0 10.0 10.0 10.0 0.0 10.0 0.0 0.0 0.0 0.0 10.0 10.0 10.0
2 Does the Act require 3 levels of SDPs (Master Plans) for Metropolitan cities: Regional, Municipal and Ward(s) /Local?
i Is there a Metropolitan Region SDP? 3.3 3.3 3.3 NA NA 3.3 NA 3.3 3.3 3.3 3.3 3.3 3.3 3.3 3.3 3.3 3.3 3.3 3.3 3.3 3.3 3.3 3.3
ii Is there a Municipal SDP? 3.3 3.3 3.3 3.3 NA 3.3 3.3 3.3 3.3 3.3 3.3 3.3 3.3 3.3 3.3 3.3 3.3 3.3 3.3 3.3 3.3 NA NA
iii Is there a Ward(s) /Local Area/ Neighbourhood SDP? 0.0 0.0 0.0 3.3 NA 0.0 0.0 3.3 0.0 0.0 0.0 0.0 0.0 0.0 0.0 0.0 0.0 0.0 0.0 0.0 0.0 3.3 3.3
3 Are there three levels of currently notified SDPs?
i Is there a Metropolitan Region SDP? 3.3 3.3 0.0 NA 0.0 3.3 NA 3.3 3.3 3.3 3.3 3.3 0.0 0.0 3.3 0.0 0.0 0.0 0.0 3.3 0.0 3.3 3.3
ii Is there a Municipal SDP? 3.3 3.3 3.3 3.3 3.3 3.3 3.3 3.3 3.3 3.3 3.3 3.3 3.3 3.3 3.3 3.3 3.3 3.3 3.3 3.3 3.3 NA NA
iii Is there a Ward(s) /Local Area/ Neighbourhood SDP? 0.0 0.0 0.0 0.0 0.0 0.0 0.0 3.3 0.0 0.0 0.0 0.0 0.0 0.0 0.0 0.0 0.0 0.0 0.0 0.0 0.0 3.3 3.3
4 Does the Act define clearly the Objectives and Contents of each level of SDP? 10.0 10.0 10.0 10.0 NA 10.0 10.0 10.0 10.0 10.0 10.0 10.0 10.0 10.0 10.0 10.0 10.0 10.0 10.0 10.0 10.0 10.0 10.0
5Are planning boundaries for Metropolitan SDP, Municipal SDP and Ward(s) SDP clearly defined in accordance with political, planning, and administrative structures?
0.0 10.0 10.0 10.0 10.0 0.0 10.0 10.0 0.0 0.0 0.0 0.0 10.0 0.0 0.0 0.0 0.0 0.0 0.0 0.0 0.0 10.0 10.0
6 Are all SDPs in a concurrent or nested timeline of validity?
i Is the Metropolitan SDP in a concurrent or nested timeline of validity with Municipal SDP? 5.0 0.0 0.0 NA 0.0 5.0 NA 5.0 5.0 5.0 5.0 5.0 0.0 0.0 0.0 0.0 0.0 0.0 0.0 5.0 0.0 NA NA
ii Is the Municipal SDP in a concurrent or nested timeline of validity with Ward SDP? 0.0 0.0 0.0 0.0 0.0 0.0 0.0 0.0 0.0 0.0 0.0 0.0 0.0 0.0 0.0 0.0 0.0 0.0 0.0 0.0 0.0 NA NA
7 Is there a clear decentralised procedure for the approval of each level of plans?
i Is the Metropolitan SDP approved by the State Government? 3.3 3.3 0.0 NA NA 3.3 NA 3.3 3.3 3.3 3.3 3.3 0.0 0.0 3.3 0.0 0.0 0.0 0.0 3.3 0.0 3.3 3.3
ii Is the Municipal SDP approved by the MPC (State government for small/medium cities)? 0.0 0.0 0.0 3.3 NA 0.0 3.3 0.0 0.0 0.0 0.0 0.0 0.0 0.0 0.0 0.0 0.0 0.0 0.0 0.0 3.3 NA NA
iii Is the Ward SDP approved by the ULB? 0.0 0.0 0.0 0.0 NA 0.0 0.0 3.3 0.0 0.0 0.0 0.0 0.0 0.0 0.0 0.0 0.0 0.0 0.0 0.0 0.0 3.3 3.3
8 Is there a provision for the establishment of Planning Authorities for notified new towns or special developments? 10.0 10.0 10.0 10.0 NA 10.0 10.0 10.0 10.0 10.0 10.0 10.0 10.0 10.0 10.0 10.0 10.0 10.0 10.0 10.0 10.0 NA NA
9 Is there a clear provision for a competent technical cell to enable preparation of the SDP for each level? 3.3 0.0 0.0 3.3 NA 3.3 0.0 3.3 0.0 0.0 0.0 3.3 0.0 3.3 3.3 3.3 3.3 0.0 0.0 3.3 6.7 6.7 6.7
10Is there an institutional structure which defines authorities for development approvals, zoning and building regula-tions enforcement, and restrictions for conservation, in accordance with the notified SDP?
0.0 0.0 0.0 0.0 NA 0.0 0.0 0.0 0.0 0.0 0.0 0.0 0.0 0.0 0.0 0.0 0.0 0.0 0.0 0.0 0.0 10.0 10.0
11 Do the SDPs reflect a stated articulation of future vision and development priorities? 0.0 0.0 0.0 0.0 0.0 0.0 0.0 0.0 0.0 0.0 0.0 0.0 0.0 0.0 0.0 0.0 0.0 0.0 0.0 0.0 0.0 10.0 10.0
12 Do the SDPs at each level-integrate the plans and priorities of various sectoral public departments and agencies? 0.0 0.0 0.0 0.0 0.0 0.0 0.0 0.0 0.0 0.0 0.0 0.0 0.0 0.0 0.0 0.0 0.0 0.0 0.0 0.0 0.0 10.0 10.0
13Is there a common digital based SDP Map shared among Planning Authorities, and data updated through GIS with fixed periodicity by the relevant sectoral agencies (transport, network infrastructure, land use changes)?
0.0 0.0 0.0 0.0 0.0 0.0 0.0 0.0 0.0 0.0 0.0 0.0 0.0 0.0 0.0 0.0 0.0 0.0 0.0 0.0 0.0 10.0 10.0
14Are the current SDPs also approved by the appropriate Planning Authorities as per the constitutional requirements of decentralisation?
i Is the Metropolitan SDP also approved by MPC/Metropolitan Planning Authority? 3.3 3.3 0.0 NA 0.0 0.0 NA 3.3 3.3 3.3 3.3 3.3 0.0 0.0 3.3 0.0 0.0 0.0 0.0 3.3 0.0 3.3 3.3
ii Is the Municipal SDP also approved by the ULB? 0.0 0.0 0.0 0.0 0.0 0.0 0.0 0.0 0.0 0.0 0.0 0.0 0.0 0.0 0.0 0.0 0.0 0.0 0.0 0.0 0.0 NA NA
iii Is the Ward SDP also approved by the ULB? 0.0 0.0 0.0 0.0 0.0 0.0 0.0 3.3 0.0 0.0 0.0 0.0 0.0 0.0 0.0 0.0 0.0 0.0 0.0 0.0 0.0 3.3 3.3
15 Are there clear provisions in the Act for modifications to notified SDPs? 10.0 10.0 10.0 10.0 NA 10.0 10.0 10.0 10.0 10.0 10.0 10.0 10.0 10.0 10.0 10.0 10.0 10.0 10.0 10.0 10.0 10.0 10.0
16 Does the Act facilitate easy approval of development projects that conform to the regulations, as per the notified SDP? 10.0 10.0 10.0 10.0 NA 10.0 10.0 10.0 10.0 10.0 10.0 10.0 10.0 10.0 10.0 10.0 10.0 10.0 10.0 10.0 10.0 10.0 10.0
Average Score 4.3 5.0 4.4 5.2 1.9 4.7 4.7 6.4 4.7 4.1 4.7 4.9 4.4 4.0 4.0 4.0 3.3 3.1 3.1 4.3 4.4 9.8 9.8
Annexures
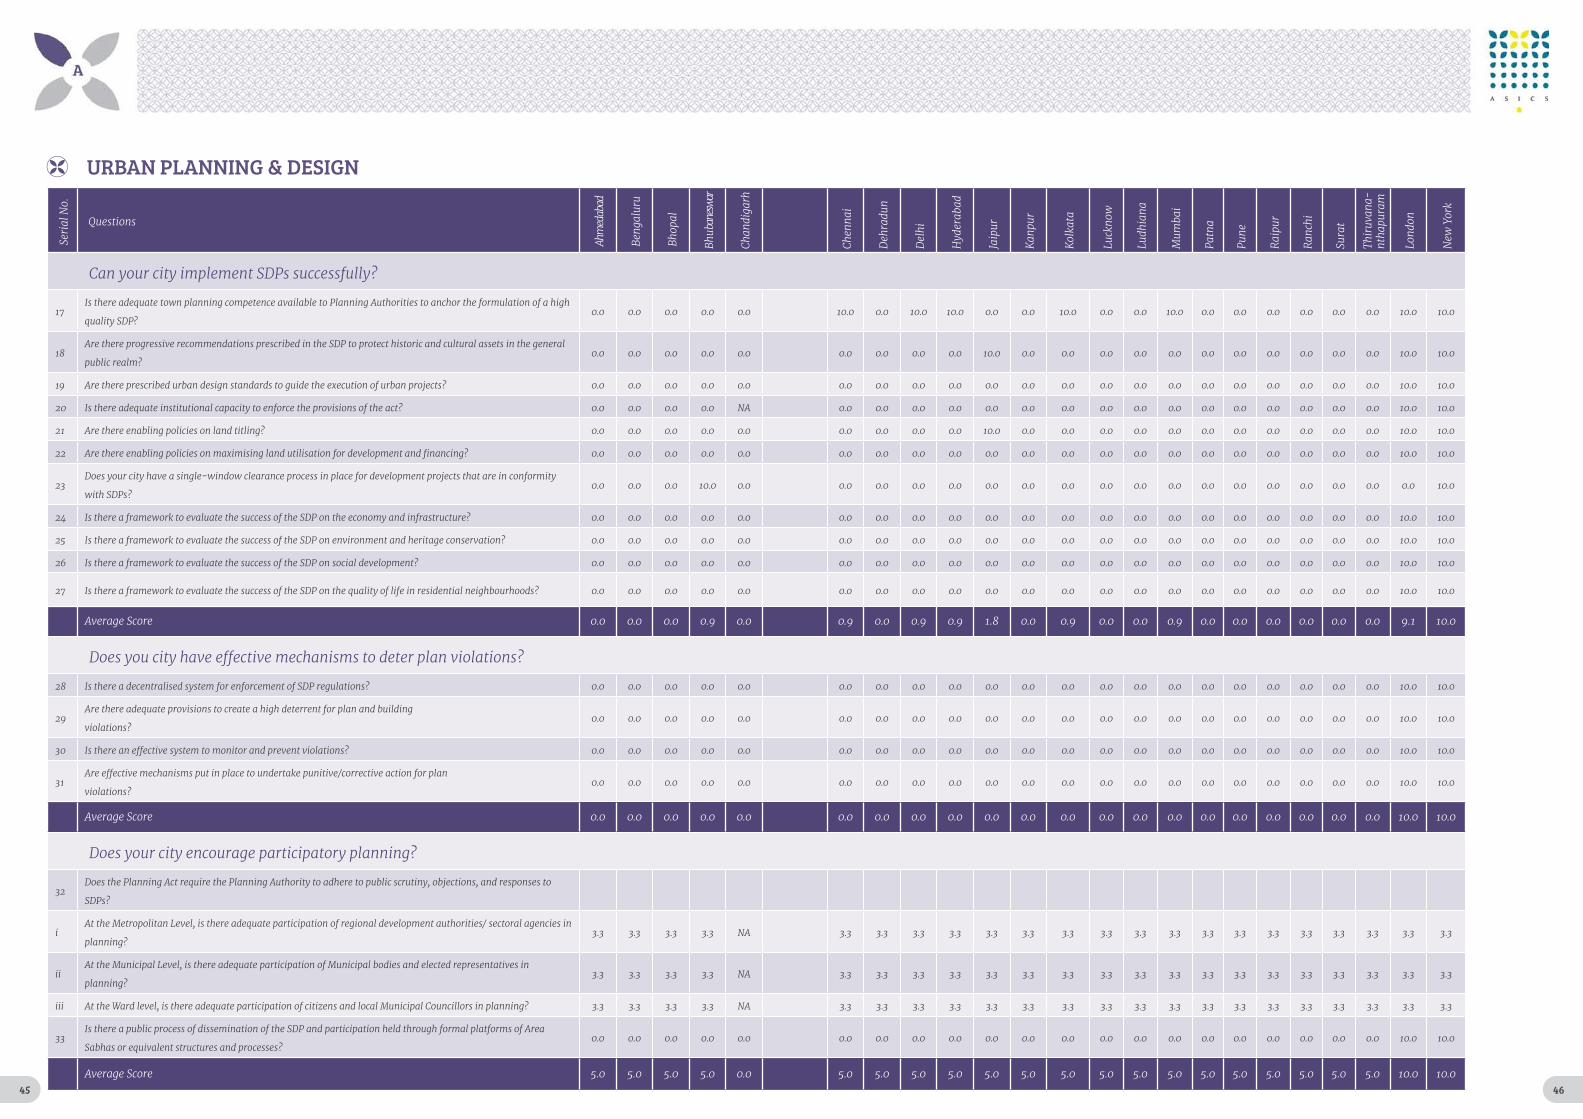
45 46
URBAN PLANNING & DESIGN
Seri
al N
o.
Questions
Ahm
edab
ad
Ben
galu
ru
Bho
pal
Bhub
anes
war
Chan
diga
rh
Chen
nai
Deh
radu
n
Del
hi
Hyd
erab
ad
Jaip
ur
Kan
pur
Kol
kata
Luck
now
Ludh
iana
Mum
bai
Patn
a
Pune
Rai
pur
Ran
chi
Sura
t
Thir
uvan
a-nt
hapu
ram
Lond
on
New
Yor
k
Can your city implement SDPs successfully?
17Is there adequate town planning competence available to Planning Authorities to anchor the formulation of a high
quality SDP?0.0 0.0 0.0 0.0 0.0 10.0 0.0 10.0 10.0 0.0 0.0 10.0 0.0 0.0 10.0 0.0 0.0 0.0 0.0 0.0 0.0 10.0 10.0
18Are there progressive recommendations prescribed in the SDP to protect historic and cultural assets in the general
public realm?0.0 0.0 0.0 0.0 0.0 0.0 0.0 0.0 0.0 10.0 0.0 0.0 0.0 0.0 0.0 0.0 0.0 0.0 0.0 0.0 0.0 10.0 10.0
19 Are there prescribed urban design standards to guide the execution of urban projects? 0.0 0.0 0.0 0.0 0.0 0.0 0.0 0.0 0.0 0.0 0.0 0.0 0.0 0.0 0.0 0.0 0.0 0.0 0.0 0.0 0.0 10.0 10.0
20 Is there adequate institutional capacity to enforce the provisions of the act? 0.0 0.0 0.0 0.0 NA 0.0 0.0 0.0 0.0 0.0 0.0 0.0 0.0 0.0 0.0 0.0 0.0 0.0 0.0 0.0 0.0 10.0 10.0
21 Are there enabling policies on land titling? 0.0 0.0 0.0 0.0 0.0 0.0 0.0 0.0 0.0 10.0 0.0 0.0 0.0 0.0 0.0 0.0 0.0 0.0 0.0 0.0 0.0 10.0 10.0
22 Are there enabling policies on maximising land utilisation for development and financing? 0.0 0.0 0.0 0.0 0.0 0.0 0.0 0.0 0.0 0.0 0.0 0.0 0.0 0.0 0.0 0.0 0.0 0.0 0.0 0.0 0.0 10.0 10.0
23Does your city have a single-window clearance process in place for development projects that are in conformity
with SDPs?0.0 0.0 0.0 10.0 0.0 0.0 0.0 0.0 0.0 0.0 0.0 0.0 0.0 0.0 0.0 0.0 0.0 0.0 0.0 0.0 0.0 0.0 10.0
24 Is there a framework to evaluate the success of the SDP on the economy and infrastructure? 0.0 0.0 0.0 0.0 0.0 0.0 0.0 0.0 0.0 0.0 0.0 0.0 0.0 0.0 0.0 0.0 0.0 0.0 0.0 0.0 0.0 10.0 10.0
25 Is there a framework to evaluate the success of the SDP on environment and heritage conservation? 0.0 0.0 0.0 0.0 0.0 0.0 0.0 0.0 0.0 0.0 0.0 0.0 0.0 0.0 0.0 0.0 0.0 0.0 0.0 0.0 0.0 10.0 10.0
26 Is there a framework to evaluate the success of the SDP on social development? 0.0 0.0 0.0 0.0 0.0 0.0 0.0 0.0 0.0 0.0 0.0 0.0 0.0 0.0 0.0 0.0 0.0 0.0 0.0 0.0 0.0 10.0 10.0
27 Is there a framework to evaluate the success of the SDP on the quality of life in residential neighbourhoods? 0.0 0.0 0.0 0.0 0.0 0.0 0.0 0.0 0.0 0.0 0.0 0.0 0.0 0.0 0.0 0.0 0.0 0.0 0.0 0.0 0.0 10.0 10.0
Average Score 0.0 0.0 0.0 0.9 0.0 0.9 0.0 0.9 0.9 1.8 0.0 0.9 0.0 0.0 0.9 0.0 0.0 0.0 0.0 0.0 0.0 9.1 10.0
Does you city have effective mechanisms to deter plan violations?
28 Is there a decentralised system for enforcement of SDP regulations? 0.0 0.0 0.0 0.0 0.0 0.0 0.0 0.0 0.0 0.0 0.0 0.0 0.0 0.0 0.0 0.0 0.0 0.0 0.0 0.0 0.0 10.0 10.0
29Are there adequate provisions to create a high deterrent for plan and building
violations? 0.0 0.0 0.0 0.0 0.0 0.0 0.0 0.0 0.0 0.0 0.0 0.0 0.0 0.0 0.0 0.0 0.0 0.0 0.0 0.0 0.0 10.0 10.0
30 Is there an effective system to monitor and prevent violations? 0.0 0.0 0.0 0.0 0.0 0.0 0.0 0.0 0.0 0.0 0.0 0.0 0.0 0.0 0.0 0.0 0.0 0.0 0.0 0.0 0.0 10.0 10.0
31Are effective mechanisms put in place to undertake punitive/corrective action for plan
violations?0.0 0.0 0.0 0.0 0.0 0.0 0.0 0.0 0.0 0.0 0.0 0.0 0.0 0.0 0.0 0.0 0.0 0.0 0.0 0.0 0.0 10.0 10.0
Average Score 0.0 0.0 0.0 0.0 0.0 0.0 0.0 0.0 0.0 0.0 0.0 0.0 0.0 0.0 0.0 0.0 0.0 0.0 0.0 0.0 0.0 10.0 10.0
Does your city encourage participatory planning?
32Does the Planning Act require the Planning Authority to adhere to public scrutiny, objections, and responses to
SDPs?
iAt the Metropolitan Level, is there adequate participation of regional development authorities/ sectoral agencies in
planning?3.3 3.3 3.3 3.3 NA 3.3 3.3 3.3 3.3 3.3 3.3 3.3 3.3 3.3 3.3 3.3 3.3 3.3 3.3 3.3 3.3 3.3 3.3
iiAt the Municipal Level, is there adequate participation of Municipal bodies and elected representatives in
planning?3.3 3.3 3.3 3.3 NA 3.3 3.3 3.3 3.3 3.3 3.3 3.3 3.3 3.3 3.3 3.3 3.3 3.3 3.3 3.3 3.3 3.3 3.3
iii At the Ward level, is there adequate participation of citizens and local Municipal Councillors in planning? 3.3 3.3 3.3 3.3 NA 3.3 3.3 3.3 3.3 3.3 3.3 3.3 3.3 3.3 3.3 3.3 3.3 3.3 3.3 3.3 3.3 3.3 3.3
33Is there a public process of dissemination of the SDP and participation held through formal platforms of Area
Sabhas or equivalent structures and processes?0.0 0.0 0.0 0.0 0.0 0.0 0.0 0.0 0.0 0.0 0.0 0.0 0.0 0.0 0.0 0.0 0.0 0.0 0.0 0.0 0.0 10.0 10.0
Average Score 5.0 5.0 5.0 5.0 0.0 5.0 5.0 5.0 5.0 5.0 5.0 5.0 5.0 5.0 5.0 5.0 5.0 5.0 5.0 5.0 5.0 10.0 10.0
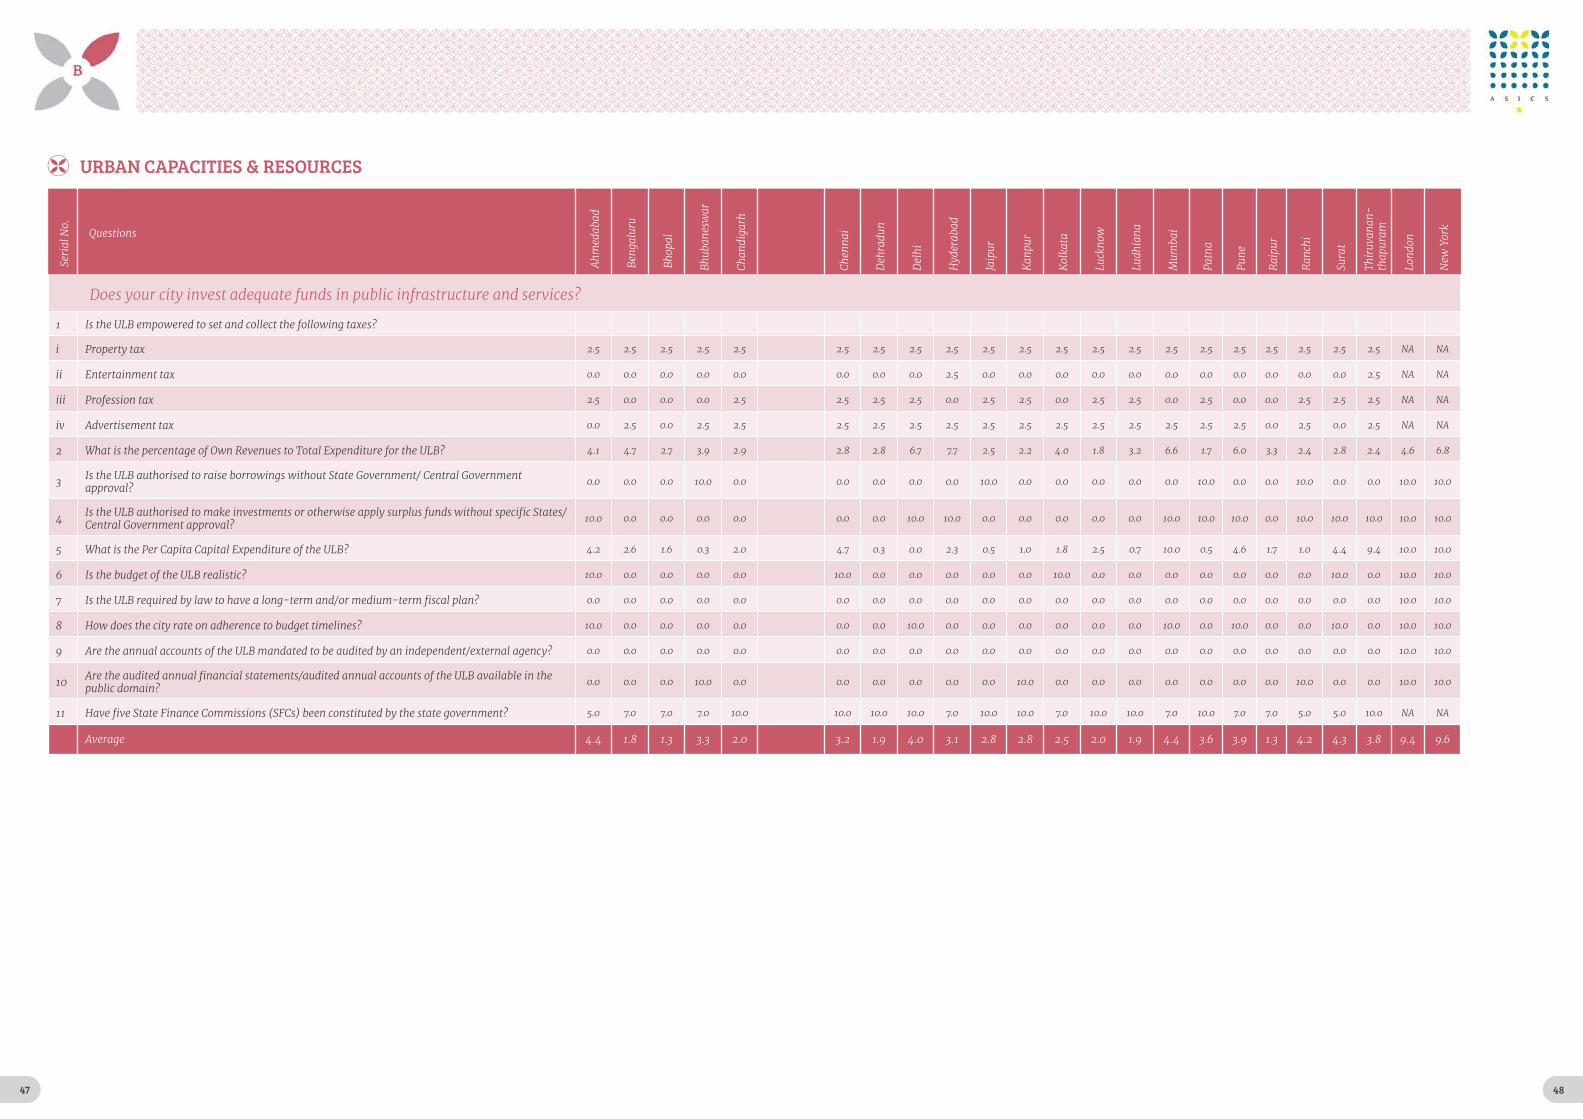
47 48
URBAN CAPACITIES & RESOURCES
Seri
al N
o.
Questions
Ahm
edab
ad
Ben
galu
ru
Bho
pal
Bhub
anes
war
Chan
diga
rh
Chen
nai
Deh
radu
n
Del
hi
Hyd
erab
ad
Jaip
ur
Kan
pur
Kol
kata
Luck
now
Ludh
iana
Mum
bai
Patn
a
Pune
Rai
pur
Ran
chi
Sura
t
Thir
uvan
an-
thap
uram
Lond
on
New
Yor
k
Does your city invest adequate funds in public infrastructure and services?
1 Is the ULB empowered to set and collect the following taxes?
i Property tax 2.5 2.5 2.5 2.5 2.5 2.5 2.5 2.5 2.5 2.5 2.5 2.5 2.5 2.5 2.5 2.5 2.5 2.5 2.5 2.5 2.5 NA NA
ii Entertainment tax 0.0 0.0 0.0 0.0 0.0 0.0 0.0 0.0 2.5 0.0 0.0 0.0 0.0 0.0 0.0 0.0 0.0 0.0 0.0 0.0 2.5 NA NA
iii Profession tax 2.5 0.0 0.0 0.0 2.5 2.5 2.5 2.5 0.0 2.5 2.5 0.0 2.5 2.5 0.0 2.5 0.0 0.0 2.5 2.5 2.5 NA NA
iv Advertisement tax 0.0 2.5 0.0 2.5 2.5 2.5 2.5 2.5 2.5 2.5 2.5 2.5 2.5 2.5 2.5 2.5 2.5 0.0 2.5 0.0 2.5 NA NA
2 What is the percentage of Own Revenues to Total Expenditure for the ULB? 4.1 4.7 2.7 3.9 2.9 2.8 2.8 6.7 7.7 2.5 2.2 4.0 1.8 3.2 6.6 1.7 6.0 3.3 2.4 2.8 2.4 4.6 6.8
3 Is the ULB authorised to raise borrowings without State Government/ Central Government approval?
0.0 0.0 0.0 10.0 0.0 0.0 0.0 0.0 0.0 10.0 0.0 0.0 0.0 0.0 0.0 10.0 0.0 0.0 10.0 0.0 0.0 10.0 10.0
4 Is the ULB authorised to make investments or otherwise apply surplus funds without specific States/ Central Government approval?
10.0 0.0 0.0 0.0 0.0 0.0 0.0 10.0 10.0 0.0 0.0 0.0 0.0 0.0 10.0 10.0 10.0 0.0 10.0 10.0 10.0 10.0 10.0
5 What is the Per Capita Capital Expenditure of the ULB? 4.2 2.6 1.6 0.3 2.0 4.7 0.3 0.0 2.3 0.5 1.0 1.8 2.5 0.7 10.0 0.5 4.6 1.7 1.0 4.4 9.4 10.0 10.0
6 Is the budget of the ULB realistic? 10.0 0.0 0.0 0.0 0.0 10.0 0.0 0.0 0.0 0.0 0.0 10.0 0.0 0.0 0.0 0.0 0.0 0.0 0.0 10.0 0.0 10.0 10.0
7 Is the ULB required by law to have a long-term and/or medium-term fiscal plan? 0.0 0.0 0.0 0.0 0.0 0.0 0.0 0.0 0.0 0.0 0.0 0.0 0.0 0.0 0.0 0.0 0.0 0.0 0.0 0.0 0.0 10.0 10.0
8 How does the city rate on adherence to budget timelines? 10.0 0.0 0.0 0.0 0.0 0.0 0.0 10.0 0.0 0.0 0.0 0.0 0.0 0.0 10.0 0.0 10.0 0.0 0.0 10.0 0.0 10.0 10.0
9 Are the annual accounts of the ULB mandated to be audited by an independent/external agency? 0.0 0.0 0.0 0.0 0.0 0.0 0.0 0.0 0.0 0.0 0.0 0.0 0.0 0.0 0.0 0.0 0.0 0.0 0.0 0.0 0.0 10.0 10.0
10 Are the audited annual financial statements/audited annual accounts of the ULB available in the public domain?
0.0 0.0 0.0 10.0 0.0 0.0 0.0 0.0 0.0 0.0 10.0 0.0 0.0 0.0 0.0 0.0 0.0 0.0 10.0 0.0 0.0 10.0 10.0
11 Have five State Finance Commissions (SFCs) been constituted by the state government? 5.0 7.0 7.0 7.0 10.0 10.0 10.0 10.0 7.0 10.0 10.0 7.0 10.0 10.0 7.0 10.0 7.0 7.0 5.0 5.0 10.0 NA NA
Average 4.4 1.8 1.3 3.3 2.0 3.2 1.9 4.0 3.1 2.8 2.8 2.5 2.0 1.9 4.4 3.6 3.9 1.3 4.2 4.3 3.8 9.4 9.6

49 50
Seri
al N
o.
Questions
Ahm
edab
ad
Ben
galu
ru
Bho
pal
Bhub
anes
war
Chan
diga
rh
Chen
nai
Deh
radu
n
Del
hi
Hyd
erab
ad
Jaip
ur
Kan
pur
Kol
kata
Luck
now
Ludh
iana
Mum
bai
Patn
a
Pune
Rai
pur
Ran
chi
Sura
t
Thir
uvan
an-
thap
uram
Lond
on
New
Yor
k
Does your city have adequate number of skilled human resources?
12 Does the ULB have the following powers with respect to its employees?
i Appointment 1.7 1.7 1.7 1.7 0.0 0.0 1.7 3.3 0.0 0.0 1.7 1.7 1.7 0.0 1.7 3.3 1.7 1.7 0.0 1.7 1.7 3.3 3.3
ii Disciplinary Action 3.3 0.0 3.3 0.0 0.0 0.0 3.3 3.3 0.0 0.0 3.3 3.3 3.3 0.0 3.3 3.3 3.3 3.3 3.3 3.3 3.3 3.3 3.3
iii Termination 3.3 0.0 3.3 0.0 0.0 0.0 3.3 3.3 0.0 0.0 3.3 3.3 3.3 0.0 3.3 3.3 3.3 3.3 3.3 3.3 0.0 3.3 3.3
13 Does the ULB have adequate staff, commensurate with its population? 4.7 2.5 1.6 2.4 3.8 3.5 1.8 10.0 3.0 2.0 1.6 6.4 1.5 3.6 7.4 1.7 4.1 1.9 0.7 3.2 2.2 10.0 10.0
14 Is the staffing data of the ULB available in the public domain? 0.0 0.0 0.0 0.0 0.0 0.0 0.0 0.0 0.0 0.0 0.0 0.0 0.0 0.0 0.0 0.0 0.0 0.0 0.0 0.0 0.0 10.0 10.0
15 Does the ULB have access to a municipal cadre for its staffing? 0.0 10.0 10.0 10.0 0.0 10.0 0.0 0.0 10.0 0.0 0.0 10.0 0.0 0.0 10.0 10.0 10.0 0.0 10.0 0.0 0.0 10.0 10.0
16 Does the Commissioner have adequate experience in urban related departments? 5.5 0.0 0.0 3.0 0.0 3.9 0.0 2.7 7.3 0.0 0.0 3.4 0.0 2.8 10.0 0.0 4.1 0.0 0.0 2.4 0.0 NA NA
17 What is the average tenure of the Commissioner? 5.0 0.0 0.0 5.0 0.0 0.0 0.0 8.0 5.0 0.0 5.0 8.0 0.0 0.0 5.0 0.0 5.0 0.0 0.0 5.0 0.0 NA NA
Average 3.9 2.4 3.3 3.7 0.6 2.9 1.7 5.1 4.2 0.3 2.5 6.0 1.6 1.1 6.8 3.6 5.3 1.7 2.9 3.2 1.2 10.0 10.0
Does your city make optimum use of Information Technology?
18 Has the ULB put in place a Digital Governance Roadmap? 0.0 0.0 0.0 0.0 10.0 0.0 0.0 0.0 0.0 0.0 0.0 0.0 0.0 0.0 0.0 0.0 0.0 0.0 0.0 0.0 0.0 10.0 10.0
19 Does the ULB website incorporate the following:
i Citizen participation 1.7 1.7 1.7 1.7 1.7 1.7 1.7 1.7 1.7 1.7 1.7 1.7 1.7 1.7 1.7 1.7 1.7 0.0 1.7 1.7 0.0 3.3 3.3
ii Basic service delivery 3.3 3.3 3.3 3.3 0.0 3.3 0.0 3.3 3.3 3.3 3.3 3.3 0.0 3.3 3.3 3.3 3.3 3.3 3.3 3.3 3.3 3.3 3.3
iii Schemes and services 0.0 0.0 0.0 0.0 0.0 0.0 0.0 0.0 0.0 0.0 0.0 0.0 0.0 0.0 0.0 0.0 3.3 0.0 0.0 0.0 0.0 3.3 3.3
20 Does the ULB have an e-procurement system (including vendor registration)? 0.0 10.0 10.0 0.0 10.0 10.0 0.0 10.0 0.0 0.0 0.0 0.0 10.0 0.0 10.0 0.0 10.0 0.0 0.0 10.0 0.0 10.0 10.0
Average 1.7 5.0 5.0 1.7 7.2 5.0 0.6 5.0 1.7 1.7 1.7 1.7 3.9 1.7 5.0 1.7 6.1 1.1 1.7 5.0 1.1 10.0 10.0
URBAN CAPACITIES & RESOURCES

51 52
Seri
al N
o.
Questions
Ahm
edab
ad
Ben
galu
ru
Bho
pal
Bhub
anes
war
Chan
diga
rh
Chen
nai
Deh
radu
n
Del
hi
Hyd
erab
ad
Jaip
ur
Kan
pur
Kol
kata
Luck
now
Ludh
iana
Mum
bai
Patn
a
Pune
Rai
pur
Ran
chi
Sura
t
Thir
uvan
an-
thap
uram
Lond
on
New
Yor
k
Do your city leaders have adequate power?
1 Does your city have sufficient number of Councillors commensurate with population? 2.6 1.7 2.9 5.9 2.0 3.2 8.0 1.9 1.7 2.2 3.0 2.3 2.9 3.4 1.4 3.2 3.6 5.2 3.8 1.9 10.0 NA NA
2 Does the Mayor of the ULB have a five year term? 0.0 0.0 10.0 10.0 0.0 10.0 10.0 0.0 10.0 10.0 10.0 10.0 10.0 10.0 0.0 10.0 0.0 10.0 10.0 0.0 10.0 10.0 10.0
3 Is the Mayor directly elected? 0.0 0.0 10.0 0.0 0.0 0.0 10.0 0.0 0.0 0.0 10.0 0.0 10.0 0.0 0.0 0.0 0.0 10.0 10.0 0.0 0.0 10.0 10.0
4 Does the Mayor have the authority to appoint the Municipal Commissioner/Chief Executive of the ULB? 0.0 0.0 0.0 0.0 0.0 0.0 0.0 0.0 0.0 0.0 0.0 0.0 0.0 0.0 0.0 0.0 0.0 0.0 0.0 0.0 0.0 10.0 10.0
5 Has the MPC been constituted with the Mayor as an ex-officio member? 0.0 0.0 0.0 0.0 0.0 0.0 0.0 0.0 0.0 0.0 0.0 10.0 0.0 0.0 0.0 0.0 0.0 0.0 0.0 0.0 0.0 10.0 10.0
6 Is the ULB responsible for providing ten specific and critical functions and services? 5.0 3.0 3.0 1.0 3.0 3.0 1.0 3.0 1.0 2.0 2.0 5.0 2.0 3.0 6.0 4.0 6.0 3.0 3.0 5.0 2.0 10.0 10.0
Average 1.3 0.8 4.3 2.8 0.8 2.7 4.8 0.8 2.1 2.4 4.2 4.6 4.2 2.7 1.2 2.9 1.6 4.7 4.5 1.1 3.7 10.0 10.0
Is your city truly democratic?
7 Has the State Election Commission (SEC) been constituted? 10.0 10.0 10.0 10.0 10.0 10.0 10.0 10.0 10.0 10.0 10.0 10.0 10.0 10.0 10.0 10.0 10.0 10.0 10.0 10.0 10.0 10.0 10.0
8 Is the SEC empowered to decide on matters of electoral delimitation of the Council? 10.0 0.0 0.0 0.0 0.0 0.0 0.0 0.0 0.0 0.0 0.0 10.0 0.0 0.0 10.0 0.0 10.0 0.0 0.0 10.0 10.0 10.0 10.0
9 Have elections to the ULB been conducted every five years? 10.0 0.0 10.0 10.0 10.0 10.0 10.0 10.0 0.0 10.0 10.0 10.0 10.0 10.0 10.0 10.0 10.0 10.0 10.0 10.0 10.0 10.0 10.0
10 Did the city witness a high voter turnout in the last election?
i Council 1.3 1.3 2.5 1.3 3.8 1.3 2.5 2.5 1.3 2.5 1.3 3.8 1.3 3.8 1.3 1.3 2.5 2.5 0.0 1.3 3.8 NA NA
ii Legislative Assembly 5.0 2.5 3.8 1.3 NA 5.0 3.8 3.8 2.5 3.8 2.5 5.0 2.5 5.0 2.5 2.5 3.8 3.8 3.8 3.8 5.0 NA NA
11 Are locally-elected officials required to publicly disclose their income and assets (and those of their immediate family) prior to taking office? (UGI)
0.0 10.0 0.0 0.0 0.0 10.0 0.0 10.0 10.0 0.0 0.0 0.0 0.0 0.0 10.0 10.0 10.0 10.0 10.0 0.0 10.0 10.0 10.0
Average 7.3 4.8 5.3 4.5 5.5 7.3 5.3 7.3 4.8 5.3 4.8 7.8 4.8 5.8 8.8 6.8 9.3 7.3 6.8 7.0 9.8 10.0 10.0
EMPOWERED & LEGITIMATE POLITICAL REPRESENTATION

53 54
Seri
al N
o.
Questions
Ahm
edab
ad
Ben
galu
ru
Bho
pal
Bhub
anes
war
Chan
diga
rh
Chen
nai
Deh
radu
n
Del
hi
Hyd
erab
ad
Jaip
ur
Kan
pur
Kol
kata
Luck
now
Ludh
iana
Mum
bai
Patn
a
Pune
Rai
pur
Ran
chi
Sura
t
Thir
uvan
an-
thap
uram
Lond
on
New
Yor
k
Does your city put out adequate information and facilitate citizen participation?
1 Has the State Government enacted the Public Disclosure Law (PDL)? 0.0 10.0 10.0 10.0 0.0 10.0 0.0 0.0 10.0 10.0 10.0 10.0 10.0 10.0 10.0 10.0 10.0 10.0 10.0 0.0 10.0 10.0 10.0
2 Have Rules implementing the PDL been notified? 0.0 10.0 10.0 0.0 0.0 10.0 0.0 0.0 10.0 0.0 10.0 0.0 10.0 10.0 0.0 0.0 0.0 0.0 0.0 0.0 10.0 NA NA
3 Is the State PDL compliant with the Model PDL with respect to:
i Audited financial statement on quarterly basis 0.0 0.0 0.0 0.0 0.0 0.0 0.0 0.0 2.0 0.0 2.0 0.0 2.0 0.0 2.0 2.0 2.0 0.0 2.0 0.0 0.0 0.0 2.0
ii Audited financial statement on annual basis 0.0 0.0 2.0 2.0 0.0 2.0 0.0 0.0 2.0 0.0 0.0 0.0 0.0 2.0 2.0 2.0 2.0 0.0 2.0 0.0 0.0 2.0 2.0
iii Service level benchmarks 0.0 2.0 2.0 0.0 0.0 2.0 0.0 0.0 2.0 0.0 0.0 0.0 0.0 2.0 2.0 2.0 2.0 0.0 2.0 0.0 2.0 2.0 2.0
iv Particulars of major works 2.0 0.0 2.0 2.0 0.0 2.0 0.0 0.0 2.0 0.0 2.0 0.0 2.0 2.0 2.0 2.0 2.0 0.0 2.0 2.0 2.0 0.0 2.0
v Details of plans, income and budget 0.0 0.0 2.0 2.0 0.0 0.0 0.0 0.0 2.0 0.0 2.0 0.0 2.0 2.0 2.0 2.0 2.0 0.0 2.0 0.0 2.0 2.0 2.0
4 Has the ULB adopted open data standards and principles in respect of:
i Annual report of works done last year 0.0 0.0 0.0 0.0 0.0 0.0 0.0 0.0 0.0 0.0 0.0 0.0 0.0 0.0 0.0 0.0 0.0 0.0 0.0 0.0 0.0 2.0 2.0
ii Financial information (budgets) of the corporation and of respective wards 0.0 0.0 0.0 0.0 0.0 0.0 0.0 0.0 0.0 0.0 0.0 0.0 0.0 0.0 0.0 0.0 0.0 0.0 0.0 0.0 0.0 2.0 2.0
iii Raw and synthesized data on civic works 0.0 2.0 0.0 0.0 0.0 0.0 0.0 0.0 0.0 0.0 0.0 0.0 0.0 0.0 0.0 0.0 0.0 0.0 0.0 0.0 0.0 2.0 2.0
iv Information under Right To Information, Section 4(1) b on minutes of council meetings, rules, regulations and documents of the ULB and its decision-making processes
0.0 2.0 0.0 2.0 0.0 2.0 0.0 0.0 0.0 0.0 2.0 0.0 0.0 0.0 0.0 0.0 0.0 0.0 0.0 2.0 0.0 2.0 2.0
v Quarterly audited financial reports 0.0 0.0 0.0 0.0 0.0 0.0 0.0 0.0 0.0 0.0 0.0 0.0 0.0 0.0 0.0 0.0 0.0 0.0 0.0 0.0 0.0 2.0 2.0
5 Has the State Government enacted the Community Participation Law (CPL)? 0.0 10.0 10.0 0.0 10.0 10.0 10.0 0.0 10.0 10.0 10.0 10.0 10.0 10.0 10.0 10.0 10.0 10.0 10.0 0.0 10.0 NA NA
6 Have Rules implementing the CPL been notified? 0.0 10.0 10.0 0.0 0.0 0.0 10.0 0.0 10.0 0.0 10.0 10.0 10.0 0.0 0.0 10.0 0.0 10.0 0.0 0.0 10.0 NA NA
7 Have Ward Committees been constituted for all wards of the ULB? 10.0 10.0 10.0 10.0 10.0 10.0 10.0 10.0 10.0 0.0 10.0 10.0 10.0 10.0 10.0 0.0 10.0 10.0 0.0 10.0 10.0 10.0 10.0
8 Have Area Sabhas been constituted in all wards of the ULB? 0.0 0.0 0.0 0.0 0.0 0.0 0.0 0.0 10.0 0.0 0.0 0.0 0.0 0.0 0.0 0.0 0.0 0.0 0.0 0.0 0.0 NA NA
9 Does the ULB harness the spirit of volunteering among its citizens and provide such opportunities for them?
10.0 10.0 0.0 10.0 0.0 10.0 0.0 0.0 10.0 0.0 0.0 10.0 0.0 10.0 10.0 0.0 10.0 0.0 0.0 10.0 0.0 10.0 10.0
10 Does the ULB have a participatory budgeting process in place? 0.0 0.0 0.0 0.0 0.0 0.0 0.0 0.0 0.0 0.0 0.0 0.0 0.0 0.0 0.0 0.0 10.0 0.0 0.0 0.0 0.0 0.0 10.0
11 Is the ULB required by its Municipal Act to carry out an internal audit within a predetermined frequency, at least annual?
10.0 10.0 10.0 10.0 10.0 0.0 10.0 10.0 10.0 0.0 10.0 10.0 10.0 10.0 10.0 10.0 10.0 10.0 10.0 10.0 10.0 10.0 10.0
12 Are the internal audits of the ULB available in the public domain? 0.0 0.0 0.0 0.0 0.0 0.0 0.0 0.0 0.0 0.0 0.0 0.0 0.0 0.0 0.0 0.0 0.0 0.0 0.0 0.0 0.0 10.0 10.0
Average 2.7 6.3 5.7 4.0 2.5 4.8 3.3 1.7 7.5 1.7 5.7 5.0 5.5 5.7 5.0 4.2 5.8 4.2 3.3 2.8 5.5 8.3 10.0
TRANSPARENCY, ACCOUNTABILITY & PARTICIPATION
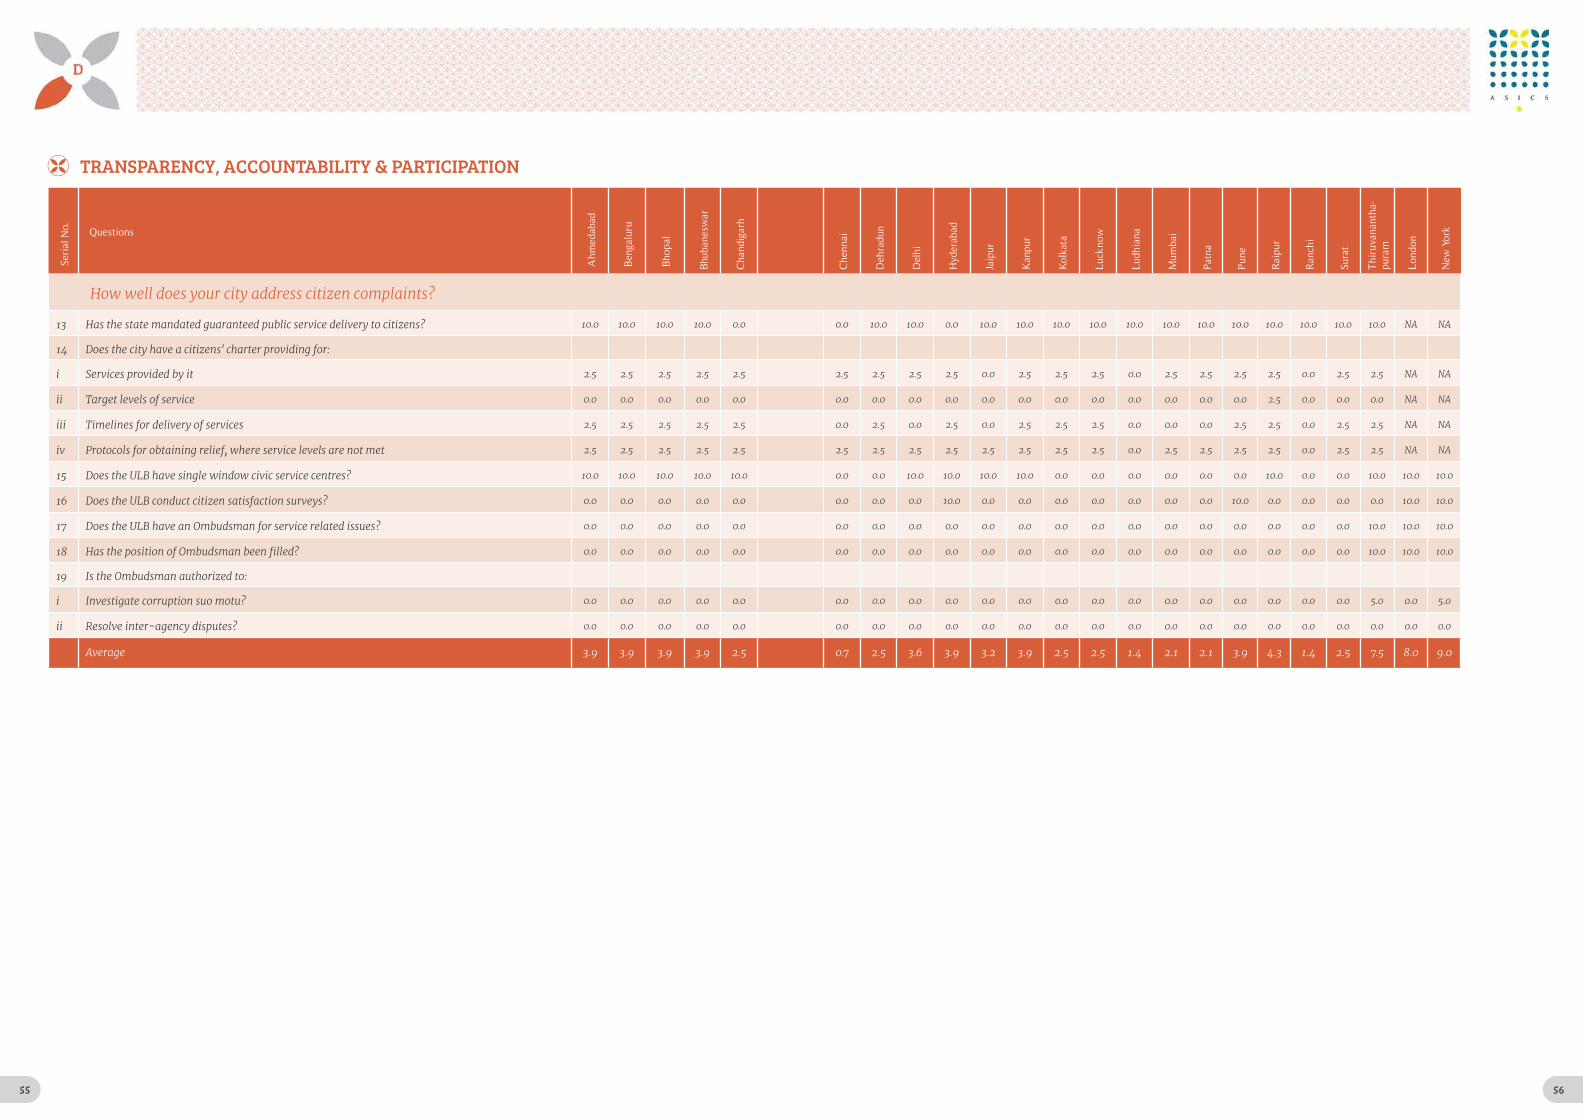
55 56
Seri
al N
o.
Questions
Ahm
edab
ad
Ben
galu
ru
Bho
pal
Bhu
bane
swar
Cha
ndig
arh
Che
nnai
Deh
radu
n
Del
hi
Hyd
erab
ad
Jaip
ur
Kan
pur
Kol
kata
Luck
now
Ludh
iana
Mum
bai
Patn
a
Pun
e
Rai
pur
Ran
chi
Sura
t
Thi
ruva
nant
ha-
pura
m
Lon
don
New
Yor
k
How well does your city address citizen complaints?
13 Has the state mandated guaranteed public service delivery to citizens? 10.0 10.0 10.0 10.0 0.0 0.0 10.0 10.0 0.0 10.0 10.0 10.0 10.0 10.0 10.0 10.0 10.0 10.0 10.0 10.0 10.0 NA NA
14 Does the city have a citizens' charter providing for:
i Services provided by it 2.5 2.5 2.5 2.5 2.5 2.5 2.5 2.5 2.5 0.0 2.5 2.5 2.5 0.0 2.5 2.5 2.5 2.5 0.0 2.5 2.5 NA NA
ii Target levels of service 0.0 0.0 0.0 0.0 0.0 0.0 0.0 0.0 0.0 0.0 0.0 0.0 0.0 0.0 0.0 0.0 0.0 2.5 0.0 0.0 0.0 NA NA
iii Timelines for delivery of services 2.5 2.5 2.5 2.5 2.5 0.0 2.5 0.0 2.5 0.0 2.5 2.5 2.5 0.0 0.0 0.0 2.5 2.5 0.0 2.5 2.5 NA NA
iv Protocols for obtaining relief, where service levels are not met 2.5 2.5 2.5 2.5 2.5 2.5 2.5 2.5 2.5 2.5 2.5 2.5 2.5 0.0 2.5 2.5 2.5 2.5 0.0 2.5 2.5 NA NA
15 Does the ULB have single window civic service centres? 10.0 10.0 10.0 10.0 10.0 0.0 0.0 10.0 10.0 10.0 10.0 0.0 0.0 0.0 0.0 0.0 0.0 10.0 0.0 0.0 10.0 10.0 10.0
16 Does the ULB conduct citizen satisfaction surveys? 0.0 0.0 0.0 0.0 0.0 0.0 0.0 0.0 10.0 0.0 0.0 0.0 0.0 0.0 0.0 0.0 10.0 0.0 0.0 0.0 0.0 10.0 10.0
17 Does the ULB have an Ombudsman for service related issues? 0.0 0.0 0.0 0.0 0.0 0.0 0.0 0.0 0.0 0.0 0.0 0.0 0.0 0.0 0.0 0.0 0.0 0.0 0.0 0.0 10.0 10.0 10.0
18 Has the position of Ombudsman been filled? 0.0 0.0 0.0 0.0 0.0 0.0 0.0 0.0 0.0 0.0 0.0 0.0 0.0 0.0 0.0 0.0 0.0 0.0 0.0 0.0 10.0 10.0 10.0
19 Is the Ombudsman authorized to:
i Investigate corruption suo motu? 0.0 0.0 0.0 0.0 0.0 0.0 0.0 0.0 0.0 0.0 0.0 0.0 0.0 0.0 0.0 0.0 0.0 0.0 0.0 0.0 5.0 0.0 5.0
ii Resolve inter-agency disputes? 0.0 0.0 0.0 0.0 0.0 0.0 0.0 0.0 0.0 0.0 0.0 0.0 0.0 0.0 0.0 0.0 0.0 0.0 0.0 0.0 0.0 0.0 0.0
Average 3.9 3.9 3.9 3.9 2.5 0.7 2.5 3.6 3.9 3.2 3.9 2.5 2.5 1.4 2.1 2.1 3.9 4.3 1.4 2.5 7.5 8.0 9.0
TRANSPARENCY, ACCOUNTABILITY & PARTICIPATION

57 58
City UPD UCR ELPR TAP AVERAGE SCORE RANK 2015
RANK
Ahmedabad 2.4 3.8 4.0 3.1 3.3 14 16
Bengaluru 2.7 2.4 2.6 5.4 3.3 16 12
Bhopal 2.4 2.4 4.7 5.0 3.7 6 5
Bhubaneswar 3.1 3.2 3.6 4.0 3.5 10 18
Chandigarh 0.6 2.4 3.0 2.5 2.1 21 21
Chennai 2.9 3.4 4.8 3.3 3.6 8 8
Dehradun 2.6 1.6 5.0 3.0 3.1 18 17
Delhi 3.7 4.5 3.7 2.4 3.6 9 7
Hyderabad 2.9 3.2 3.3 6.2 3.9 5 6
Jaipur 2.9 1.9 3.7 2.2 2.7 20 20
Kanpur 2.6 2.5 4.4 5.0 3.6 7 9
Kolkata 3.0 3.4 6.0 4.1 4.1 3 3
Lucknow 2.4 2.2 4.4 4.4 3.4 12 10
Ludhiana 2.2 1.6 4.1 4.1 3.0 19 19
Mumbai 2.5 5.2 4.6 3.9 4.1 4 2
Patna 2.2 3.3 4.6 3.4 3.4 11 11
Pune 1.9 4.6 5.1 5.1 4.2 2 4
Raipur 1.8 1.4 5.9 4.2 3.3 15 13
Ranchi 1.8 3.4 5.5 2.6 3.3 13 14
Surat 2.4 4.1 3.8 2.7 3.2 17 15
Thiruvananthapuram 2.4 2.6 6.4 6.2 4.4 1 1
London 9.6 9.7 10.0 8.2 9.3 _ _
New York 9.9 9.8 10.0 9.6 9.8 _ _ _
S. No City Population (Lakh)
Total Expenditure (Cr)
Expenditure Per-Capita
Capex Per-Capita
Proportion of Capex to Total Expenditure
1 Mumbai 124 33,168 26,657 8,886 33%
2 Delhi 110 6,939 6,288 NA NA
3 Bengaluru 84 3,778 4,474 2,332 52%
4 Hyderabad 67 2,832 4,207 2,019 48%
5 Ahmedabad 56 4,185 7,503 3,733 50%
6 Chennai 46 4,158 8,948 4,165 47%
7 Kolkata 45 3,078 6,844 1,604 23%
8 Surat 45 3,300 7,386 3,908 53%
9 Pune 31 3,195 10,227 4,071 40%
10 Jaipur 30 559 1,834 414 23%
11 Lucknow 29 1,108 3,859 2,201 57%
12 Other 10 ASICS Cities 131 4,505 3,708 1,630 37%
*Budgets for the city of Raipur reflect expenditure in 2013 as later budgets were not available | Thiruvananthapuram’s expenditure has been taken from
2014-15 Revised Budgetary estimates.
City Act Year of the Act
Ahmedabad Gujarat Town Planning and Urban Development Act 1976
Bangalore Karnataka Town and Country Planning Act 1961
Bhopal Madhya Pradesh Town and Country Planning Act 1975
Bhubaneswar Orissa Town Planning and Improvements Trust Act 1956
Chandigarh The Capital of Punjab (Development and Regulation ) Act 1952
Chennai Tamil Nadu Town and Country Planning Act 1971
Dehradun Uttarakhand Urban Planning and Development Act 1973
Delhi Delhi Development Act 1957
Hyderabad Andhra Pradesh Urban Areas Development Act 1975
Jaipur Jaipur Development Authority Act 1982
Kanpur Uttar Pradesh Urban Planning and Development Act 1973
Kolkata West Bengal Town and Country (Planning and Development) Act 1979
Lucknow Uttar Pradesh Urban Planning and Development Act 1973
Ludhiana Punjab Regional and Town Planning and Development Act 1995
Mumbai Maharashtra Regional and Town Planning Act 1966
Patna Bihar Urban and Regional Planning and Development Act 2011
Pune Maharashtra Regional and Town Planning Act 1976
Raipur Chhattisgarh Nagar Tatha Gram Nivesh Niyam 1975
Ranchi Jharkhand Town Planning and Improvement Trust Act 1954
Surat Gujarat Town Planning and Urban Development Act 1976
Thiruvananthapuram Kerala Town and Country Planning Act 2016
Data Table 1: Details on budget expenditure heads and population by city
Data Table 2: Details on Town and Country Planning Acts by city
Overall City-System Scores And Rankings Data Tables

59 60
CityYears of experience of current
CommissionerAverage no. of years a Commissioner holds
the post - last 5 years
Mumbai 13.7 1.3
Hyderabad 7.3 1.3
Ahmedabad 5.5 1.3
Pune 4.1 1.3
Chennai 3.9 1.0
Kolkata 3.4 2.5
Bhubaneswar 3.0 1.7
Ludhiana 2.8 0.7
Delhi 2.7 3.6
Surat 2.4 1.3
Bhopal 1.8 1.0
Ranchi* 1.1 2.5
Kanpur 0.7 1.3
Jaipur 0.6 0.7
Raipur 0.6 0.6
Bengaluru 0.5 0.7
Patna* 0.5 1.0
Chandigarh 0.0 0.8
Thiruvanantapuram 0.0 0.8
Dehradun* NA 1.0
Lucknow* NA 1.7
Data Table 3: Details on Municipal Commissioners (urban experience and churn)
City Own Revenue (Crore)
Total Expenditure (Crore)
Population (Lakh)
Proportion of Own Revenue to Total Expenditure(%)
Per Capita Expenditure of Cities (Rs.)
Ahmedabad 1,714 4,185 55.8 41% 7,503
Bengaluru 1,776 3,778 84.4 47% 4,474
Bhopal 255 943 18.0 27% 5,246
Bhubaneswar 63 160 8.4 39% 1,901
Chandigarh 148 517 9.6 29% 5,381
Chennai 1,148 4,158 46.5 28% 8,948
Dehradun 16 58 5.7 28% 1,015
Delhi 4,683 6,939 110.3 67% 6,289
Hyderabad 2,174 2,832 67.3 77% 4,207
Jaipur 139 559 30.5 25% 1,834
Kanpur 153 699 27.7 22% 2,526
Kolkata 1,225 3,078 45.0 40% 6,844
Lucknow 202 1,108 28.7 18% 3,859
Ludhiana 198 617 16.2 32% 3,814
Mumbai 21,789 33,168 124.4 66% 26,658
Patna 31 188 16.8 17% 1,114
Pune 1,916 3,195 31.2 60% 10,227
Raipur 101 304 10.1 33% 3,009
Ranchi 37 151 10.7 24% 1,403
Surat 921 3,300 44.7 28% 7,386
Thiruvanantapuram 211 868 7.4 24% 11,668
Johannesburg* 10,088 14,815 44.3 68% 33,407
New York City* 93,207 1,37,494 85.5 68% 1,61,336
London* 19,631 42,806 86.7 46% 49,352
Data Table 4: Details on budget expenditure heads and population by ASICS cities and benchmark cities
*Figures on tenure of Commissioner are based on the least number of Commissioners in the last 5 years due to unavailability of complete data.
*Calculated figures - using city budgets and Purchasing Power Parity (PPP) conversion rates.
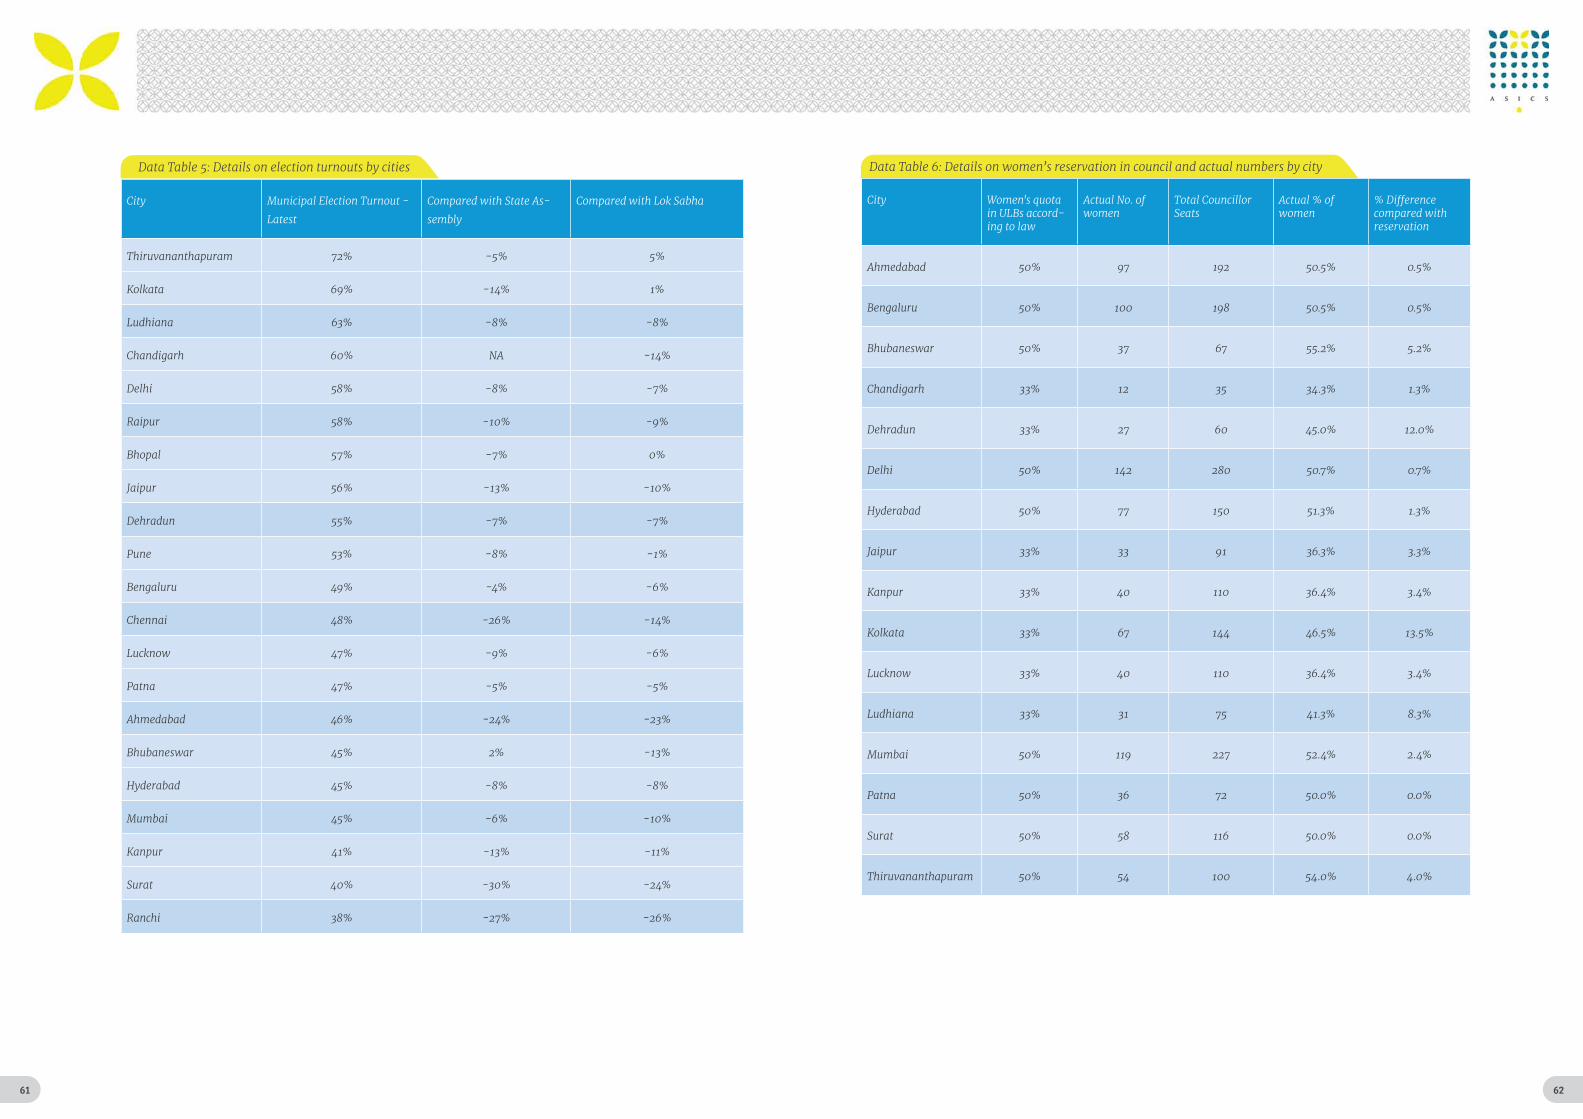
61 62
City Municipal Election Turnout -
Latest
Compared with State As-
sembly
Compared with Lok Sabha
Thiruvananthapuram 72% -5% 5%
Kolkata 69% -14% 1%
Ludhiana 63% -8% -8%
Chandigarh 60% NA -14%
Delhi 58% -8% -7%
Raipur 58% -10% -9%
Bhopal 57% -7% 0%
Jaipur 56% -13% -10%
Dehradun 55% -7% -7%
Pune 53% -8% -1%
Bengaluru 49% -4% -6%
Chennai 48% -26% -14%
Lucknow 47% -9% -6%
Patna 47% -5% -5%
Ahmedabad 46% -24% -23%
Bhubaneswar 45% 2% -13%
Hyderabad 45% -8% -8%
Mumbai 45% -6% -10%
Kanpur 41% -13% -11%
Surat 40% -30% -24%
Ranchi 38% -27% -26%
City Women's quota in ULBs accord-ing to law
Actual No. of women
Total Councillor Seats
Actual % of women
% Difference compared with reservation
Ahmedabad 50% 97 192 50.5% 0.5%
Bengaluru 50% 100 198 50.5% 0.5%
Bhubaneswar 50% 37 67 55.2% 5.2%
Chandigarh 33% 12 35 34.3% 1.3%
Dehradun 33% 27 60 45.0% 12.0%
Delhi 50% 142 280 50.7% 0.7%
Hyderabad 50% 77 150 51.3% 1.3%
Jaipur 33% 33 91 36.3% 3.3%
Kanpur 33% 40 110 36.4% 3.4%
Kolkata 33% 67 144 46.5% 13.5%
Lucknow 33% 40 110 36.4% 3.4%
Ludhiana 33% 31 75 41.3% 8.3%
Mumbai 50% 119 227 52.4% 2.4%
Patna 50% 36 72 50.0% 0.0%
Surat 50% 58 116 50.0% 0.0%
Thiruvananthapuram 50% 54 100 54.0% 4.0%
Data Table 5: Details on election turnouts by cities Data Table 6: Details on women’s reservation in council and actual numbers by city

63 64
State Municipal Corporation Municipal Council Nagar Panchayat
Andhra Pradesh
Municipal Corporation *Population above 3,00,000
Municipality *Population between 40,000 - 3,00,000 *Divided into grades based on annual ULB revenue (₹ crore) Selection Grade - Above 8.00 Special Grade - 6.00 - 8.00 First Grade - 4.00 - 6.00 Second Grade - 2.00 - 4.00 Third Grade - 1.00 - 2.00
Nagar Panchayat *Population between 20,000-40,000 *Classified as third grade municipalities irrespective of their income
Arunachal Pradesh
NA Municipalities NA
Assam Municipal Corporation Municipal Board Town Committee
Bihar Nagar Nigam *Population >2,00,000 *Employment in non agricultural activities 75% or more
Nagar Parishad *Population between 40,000 to 2,00,000 *Employment in non agricultural activities 75% or more Further classified based on population: Class A - 1,50,000 - 2,00,000 Class B - 1,00,000 - 1,50,000 Class C - 40,000 - 1,00,000
Nagar Panchayat *Population between 10,000 - 40,000 *Employment in non agricultural activities 75% or more
Chattisgarh Nagar Nigam Larger urban area
Nagar Palika Smaller urban area
Nagar Parishad Transitional Area
Goa Municipal Corporation *Large urban area
Municipal Council *Small Urban Areas classified as A,B,C based on population A Class - >50,000 B Class - 10,000-50,000 C Class - <10,000
NA
Gujarat Municipal Corporation *Large urban area
Nagar Palika *Division based on population A Class - >1,00,000 B Class - 50,000 to 1,00,000 C Class - 25,000 to 50,000 D Class - 15,000 to 25,000
NA
Haryana Municipal Corporation *Population above 3,00,000
Municipal Council *Population of 50,000 - 3,00,000
Municipal Committee *Poplulation upto 50,000
Himachal Pradesh
Municipal Corporation *Population >50,000 *Annual ULB revenue >Rs. 2,00,00,000
Municipal Council *Population >5,000 *Annual ULB revenue >Rs. 10,00,000
Nagar Panchayat *Population >2,000 *Annual ULB revenue >Rs. 5,00,000
Jammu and Kashmir
Municipal Corporation *Capital cities of Jammu and Srinagar
Municipal Council *Medium town
Municipal Committee Small town
Jharkhand Municipal Corporation *Population above 1,50,000
Municipal Council *Population 40,000 - 1,50,000 *Class A - 1,00,000 -1,50,000 *Class B - 40,000 - 1,00,000
Nagar Panchayat *Population 12,000 - 40,000
Data Table 7: How states define ULBs......(1)
State Municipal Corporation Municipal Council Nagar Panchayat
Karnataka City Corporation * Specified as larger urban area *Area with population above 3,00,000 *Density of population 3,000 per sq. km. *At least Rs. 6,00,00,000 annual tax or non tax revenue or Rs. 200 per capita p.a. whichever is higher *At least 50% employment in non agricultural activities
City Municipal Council *Population between 50,000 to 3,00,000
Town Municipal Council
*Population between 20,000 and 50,000
Town Panchayat *Population between 10,000 and 20,000 *Density of population 400 per sq. km. *At least rs. 9,00,000 annual tax or non tax revenue or Rs. 45 per capita p.a.; whichever is higher *At least 50% employment in non agricultural activities *If an area is a Taluka head quarter, then there is no objection even if the total population is less than 10,000
*Density of population 1,500 per sq. km. *At least Rs. 9,00,000 annual tax or non tax
revenue or Rs. 45 per capita p.a.; whichever is higher
*At least 50% employment in non agricultural activities
Kerala Municipal Corporation *Municiplaities elevated to Corporations on basis of below factors: *Economic importance *Pace of urbanization *Income *Demand for progressive civic services
Municipality *3/4th of adult population must be engaged in non-agricultural profession *Population not less than 20,000 *Density of population not less than 4,000 per 2.59 sq. km. except in hilly areas
NA
Madhya Pradesh
Nagar Nigam Larger urban area
Nagar Palika Smaller urban area
Nagar Parishad Transitional Area
Maharashtra Municipal Corporation *Population above 3,00,000 *Classified as A,B,C,D based on: i)population ii)per capita income iii)per capita area
Municipal Council *Small Urban Areas classified as A,B,C based on population A - > 1,00,000 B - 40,000 - 1,00,000 C - up to 40,000
Nagar Panchayat *Population of 10,000 - 25,000 *Within 20 km distance of a Municipal Corporation or a class A Municipal Council *Non agricultural activities to be above 50%
Manipur NA Municipal Council Nagar Panchayat
Meghalaya NA Municipal Council NA
Mizoram NA Municipal Council NA
Nagaland NA Municipal Council *Population above 20,000
Town Council *Population 5,000 - 20,000
Odisha Municipal Corporation *Popluation above 3,00,000
Municipality *Population 25,000 - 3,00,000
NA
Punjab Municipal Corporation Larger urban area
Municipal Council Smaller urban area
Nagar Panchayat Transitional Area
Rajasthan Nagar Nigam *Larger Urban Area *Population of 5,00,000 or more
Nagar Palika Smaller urban area Classified based on population: Class I : > 1,00,000 Class II : 50,000 - 1,00,000 Class III : 20,000 - 50,000 Class IV : 10,000 - 20,000 Class V : 5,000 - 10,000 Class VI : < 5,000
Municipal Board Transitional area
Data Table 7: How states define ULBs......(2)

65
State Municipal Corporation Municipal Council Nagar Panchayat
Sikkim Municipal Corporation *Population >70,000 *Non agricultural population above 50%
Municipal Council *Population 5,000 - 70,000 *Non agricultural population above 50%
Nagar Panchayat *Population below 5,000 *Non agricultural population above 50%
Tamil Nadu Municipal Corporation *Large urban area
Municipality Divided on basis ULB annual revenue (₹ crore) Special Grade - 10.00 Selection Grade - 6.00 - 10.00 First Grade - 4.00 - 6.00 Second Grade - Below 4.00
Town Panchayat Divided on basis ULB annual revenue (₹ lakhs) Special Grade - Above 20.00 Selection Grade - 16.00 - 20.00 Grade I - 8.00 - 16.00 Grade II - 4.00 - 8.00
Telangana Municipal Corporation *Population above 3,00,000
Municipality *Population between 40,000 - 3,00,000 *Divided into grades based on annual ULB revenue (₹ crore) Selection Grade - Above 8.00 Special Grade - 6.00 - 8.00 First Grade - 4.00 - 6.00 Second Grade - 2.00 - 4.00 Third Grade - 1.00 - 2.00
Nagar Panchayat *Population between 20,000-40,000 *Classified as third grade municipalities irrespective of their income
Tripura Municipal Corporation *Population >5,00,000 *Density of population >500 sq. km. *>50% of population engaged in non agricultural activities
Municipal Council *Population >50,000 *Density of population >500 sq. km. *>50% of population engaged in non agricultural activities
*Population until 50,000 Nagar Panchayat *Density of population >500 sq. km. *>50% of population engaged in non agricultural activities
Uttar Pradesh Nagar Nigam Large urban area
Nagar Palika Parishad *Small urban area
Nagar Panchayat Transitional Area
Uttarakhand Nagar Nigam Large urban area
Nagar Palika Parishad *Small urban area
Nagar Panchayat Transitional Area
West Bengal Municipal Corporation *Population of 5,00,000 and above *Population density of 3,000 per sq km and above *3/4th of adult population engaged in non agricultural activities
Municipality *Population minimum 30,000 *Population density 750 per sq. km. *Atleast 50% of adult male population to be engaged in non agricultural activities *Municipal income to be adequate to discharge day to day functions of the municipality *Further classified based on population Group A - >2,15,000 Group B - 1,70,000 - 2,15,000 Group C - 85,000 - 1,70,000 Group D - 35,000 - 85,000 Group E - Not exceeding 35,000
NA
Data Table 7: How states define ULBs......(1)
Pages left blank intentionally

Pages left blank intentionallyPages left blank intentionally

69
2016
Janaagraha Centre for Citizenship and Democracy 4th Floor, UNI Building, Thimmaiah RoadVasanth Nagar, Bangalore-560052Phone: 080-40790400, Fax: 080-41277104Email: [email protected]
Jana Urban Space Foundation3rd Floor, Centrum, Infantry Road, Next to SBI
Shivaji Nagar, Bangalore - 560001Tel : 080-46680100, Fax : 080-41277104
Email : [email protected]
www.janaagraha.org | www.ipaidabribe.com | www.ichangemycity.com | www.balajanaagraha.org | www.janausp.org