2016 technology industry report
TRANSCRIPT
Risk. Reinsurance. Human Resources.
U.S. Technology & Communications Industry ReportPowered by Aon GRIPSM, February 2016
Aon Risk Solutions
2 Technology and Communications Industry Report
Introduction . . . . . . . . . . . . . . . . . . . . . . . . . . . . . . . . . . . . . . . . . .1
Executive Summary . . . . . . . . . . . . . . . . . . . . . . . . . . . . . . . . . . . . .2
Top 10 Risks . . . . . . . . . . . . . . . . . . . . . . . . . . . . . . . . . . . . . . . . . .4
Risk Preparedness for the Top 10 Risks . . . . . . . . . . . . . . . . . . . . . . . . . . . . 6
Losses Associated with Top 10 Risks . . . . . . . . . . . . . . . . . . . . . . . . . . . . . . 8
Projected 2018 Top Five Risks . . . . . . . . . . . . . . . . . . . . . . . . . . . . . . . . . . . 9
Identifying, Assessing, Measuring and Managing Risks . . . . . . . .10
Identifying & Assessing Major Risks . . . . . . . . . . . . . . . . . . . . . . . . . . . . . 11
Risk Maturity . . . . . . . . . . . . . . . . . . . . . . . . . . . . . . . . . . . . . . . . . . . . . . . 12
Risk Management Department and Function . . . . . . . . . . . . . . .15
Chief Risk Officer . . . . . . . . . . . . . . . . . . . . . . . . . . . . . . . . . . . . . . . . . . . . 16
Risk Management Department . . . . . . . . . . . . . . . . . . . . . . . . . . . . . . . . . 16
External Drivers Strengthening Risk Management . . . . . . . . . . . . . . . . . . 18
Risk Management Budget . . . . . . . . . . . . . . . . . . . . . . . . . . . . . . . . . . . . . 19
Risk Financing . . . . . . . . . . . . . . . . . . . . . . . . . . . . . . . . . . . . . . . .20
Retentions/Deductibles . . . . . . . . . . . . . . . . . . . . . . . . . . . . . . . . . . . . . . . 21
Limits . . . . . . . . . . . . . . . . . . . . . . . . . . . . . . . . . . . . . . . . . . . . . . . . . . . . . 22
Cyber Risk Coverage . . . . . . . . . . . . . . . . . . . . . . . . . . . . . . . . . . . . . . . . . 23
Multinational Programs . . . . . . . . . . . . . . . . . . . . . . . . . . . . . . . . .26
Captives . . . . . . . . . . . . . . . . . . . . . . . . . . . . . . . . . . . . . . . . . . . . .28
Market Insights . . . . . . . . . . . . . . . . . . . . . . . . . . . . . . . . . . . . . . . .31
Priorities in Choice of Insurer . . . . . . . . . . . . . . . . . . . . . . . . . . . . . . . . . . 32
Desired Market Changes . . . . . . . . . . . . . . . . . . . . . . . . . . . . . . . . . . . . . . 33
Carrier/Marketplace Participation . . . . . . . . . . . . . . . . . . . . . . . . . . . . . . . 34
Common Carrier Win Reasons . . . . . . . . . . . . . . . . . . . . . . . . . . . . . . . . . 34
Common Reasons for Carriers Not Quoting . . . . . . . . . . . . . . . . . . . . . . . 34
Common Reasons for Rejecting a Carrier’s Quote . . . . . . . . . . . . . . . . . . 35
Key Carriers Financials . . . . . . . . . . . . . . . . . . . . . . . . . . . . . . . . . . . . . . . . 35
Financial Insights . . . . . . . . . . . . . . . . . . . . . . . . . . . . . . . . . . . . . .36
Key Contacts . . . . . . . . . . . . . . . . . . . . . . . . . . . . . . . . . . . . . . . .39
Table of Contents
Introduction
In today’s global environment, technology and communications companies are facing increasingly complex challenges: weak and uneven global economic recovery, evolving regulatory and industry standards, frequent new product introductions, and large-scale network security breaches, all of which could potentially affect corporate profitability and, for some, survival . The stakes for the sector are high . With increased scrutiny on operating efficiencies and a need to constantly innovate to meet mercurial consumer tastes and demands, it is critical to access accurate and timely information, and proactively address risk at every level of the organization .
At Aon, our 72,000 colleagues in over 120 countries handle more risk and people issues on a daily basis than any company in the world . As the leading provider of risk and human capital solutions, we have an appreciation for the challenges these issues create and the opportunities that can be unlocked if they are identified and addressed .
We believe in the power of data and analytics to provide insight in this era of greater complexity and are committed to leveraging our unmatched global network to provide leading organizations with business intelligence .
Aon’s 2015 Technology and Communications Industry Report provides comprehensive, industry specific data on key issues and concerns . These findings allow organizations to benchmark their risk management and risk financing practices against those of their peers and help identify practices or approaches that may improve the effectiveness of their own risk management strategies .
If you have any comments or questions about the survey, or wish to discuss the findings further, please contact your Aon account executive .
Best regards,
Eric BoyumNational Practice Leader – Technology PracticeAon Risk Solutionseric .boyum@aon .com 1 .303 .639 .4120
2 Technology and Communications Industry Report
In the age of information overload, the technology and
communications industry is facing a barrage of data about
their customers, but many are struggling to make sense of the
information, and figure out how to capitalize on it . Aon aims to
bridge this gap . It is Aon’s belief that information and analytics
will be the way to complement and supplement the knowledge
base of our clients, enabling them to understand the risks and
succeed .
As part of our efforts to help companies stay abreast of emerging
issues and learn what their peers are doing to manage risks and
capture opportunities, we have compiled this report, which
is based on Aon’s 2015 Global Risk Management Survey and
contains some detailed facts and analyses on the technology and
communications sectors . Topics in the report include:
• Current and projected top risks
• Risk readiness and losses
• Techniques utilized to identifying and assessing major risks
• Organizational risk maturity
• Risk management department and function
• Risk financing
• Cyber risk coverage
• Multinational programs
• Captives
• Market insights
• Financial insights
Executive Summary
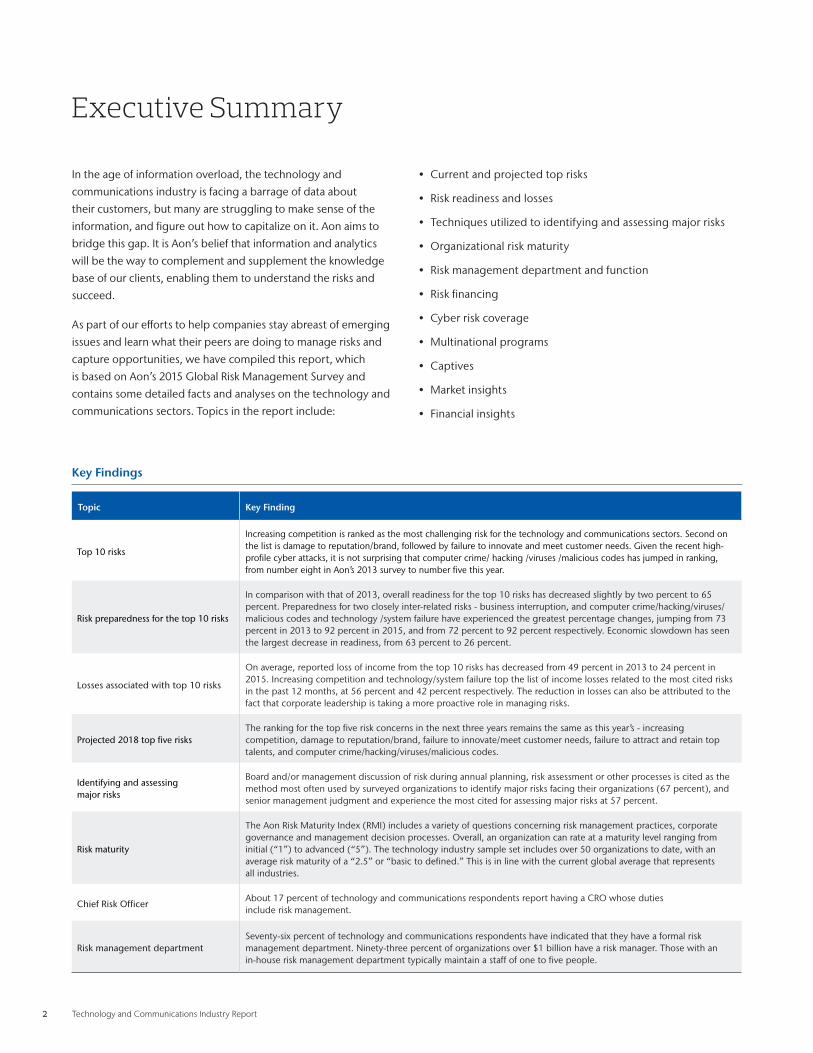
Key Findings
Topic Key Finding
Top 10 risks
Increasing competition is ranked as the most challenging risk for the technology and communications sectors . Second on the list is damage to reputation/brand, followed by failure to innovate and meet customer needs . Given the recent high-profile cyber attacks, it is not surprising that computer crime/ hacking /viruses /malicious codes has jumped in ranking, from number eight in Aon’s 2013 survey to number five this year .
Risk preparedness for the top 10 risks
In comparison with that of 2013, overall readiness for the top 10 risks has decreased slightly by two percent to 65 percent . Preparedness for two closely inter-related risks - business interruption, and computer crime/hacking/viruses/malicious codes and technology /system failure have experienced the greatest percentage changes, jumping from 73 percent in 2013 to 92 percent in 2015, and from 72 percent to 92 percent respectively . Economic slowdown has seen the largest decrease in readiness, from 63 percent to 26 percent .
Losses associated with top 10 risks
On average, reported loss of income from the top 10 risks has decreased from 49 percent in 2013 to 24 percent in 2015 . Increasing competition and technology/system failure top the list of income losses related to the most cited risks in the past 12 months, at 56 percent and 42 percent respectively . The reduction in losses can also be attributed to the fact that corporate leadership is taking a more proactive role in managing risks .
Projected 2018 top five risksThe ranking for the top five risk concerns in the next three years remains the same as this year’s - increasing competition, damage to reputation/brand, failure to innovate/meet customer needs, failure to attract and retain top talents, and computer crime/hacking/viruses/malicious codes .
Identifying and assessing major risks
Board and/or management discussion of risk during annual planning, risk assessment or other processes is cited as the method most often used by surveyed organizations to identify major risks facing their organizations (67 percent), and senior management judgment and experience the most cited for assessing major risks at 57 percent .
Risk maturity
The Aon Risk Maturity Index (RMI) includes a variety of questions concerning risk management practices, corporate governance and management decision processes . Overall, an organization can rate at a maturity level ranging from initial (“1”) to advanced (“5”) . The technology industry sample set includes over 50 organizations to date, with an average risk maturity of a “2 .5” or “basic to defined .” This is in line with the current global average that represents all industries .
Chief Risk OfficerAbout 17 percent of technology and communications respondents report having a CRO whose duties include risk management .
Risk management departmentSeventy-six percent of technology and communications respondents have indicated that they have a formal risk management department . Ninety-three percent of organizations over $1 billion have a risk manager . Those with an in-house risk management department typically maintain a staff of one to five people .
Aon Risk Solutions 3
Key Findings
Topic Key Finding
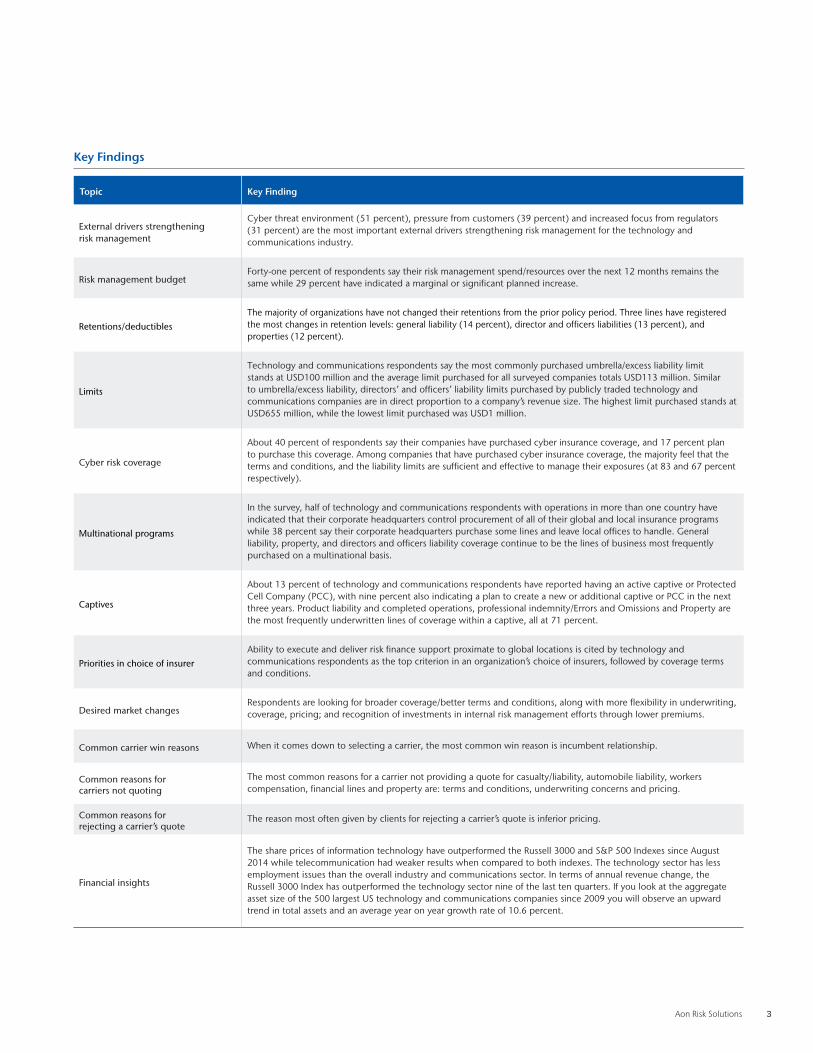
External drivers strengthening risk management
Cyber threat environment (51 percent), pressure from customers (39 percent) and increased focus from regulators (31 percent) are the most important external drivers strengthening risk management for the technology and communications industry .
Risk management budgetForty-one percent of respondents say their risk management spend/resources over the next 12 months remains the same while 29 percent have indicated a marginal or significant planned increase .
Retentions/deductiblesThe majority of organizations have not changed their retentions from the prior policy period . Three lines have registered the most changes in retention levels: general liability (14 percent), director and officers liabilities (13 percent), and properties (12 percent) .
Limits
Technology and communications respondents say the most commonly purchased umbrella/excess liability limit stands at USD100 million and the average limit purchased for all surveyed companies totals USD113 million . Similar to umbrella/excess liability, directors’ and officers’ liability limits purchased by publicly traded technology and communications companies are in direct proportion to a company’s revenue size . The highest limit purchased stands at USD655 million, while the lowest limit purchased was USD1 million .
Cyber risk coverage
About 40 percent of respondents say their companies have purchased cyber insurance coverage, and 17 percent plan to purchase this coverage . Among companies that have purchased cyber insurance coverage, the majority feel that the terms and conditions, and the liability limits are sufficient and effective to manage their exposures (at 83 and 67 percent respectively) .
Multinational programs
In the survey, half of technology and communications respondents with operations in more than one country have indicated that their corporate headquarters control procurement of all of their global and local insurance programs while 38 percent say their corporate headquarters purchase some lines and leave local offices to handle . General liability, property, and directors and officers liability coverage continue to be the lines of business most frequently purchased on a multinational basis .
Captives
About 13 percent of technology and communications respondents have reported having an active captive or Protected Cell Company (PCC), with nine percent also indicating a plan to create a new or additional captive or PCC in the next three years . Product liability and completed operations, professional indemnity/Errors and Omissions and Property are the most frequently underwritten lines of coverage within a captive, all at 71 percent .
Priorities in choice of insurerAbility to execute and deliver risk finance support proximate to global locations is cited by technology and communications respondents as the top criterion in an organization’s choice of insurers, followed by coverage terms and conditions .
Desired market changesRespondents are looking for broader coverage/better terms and conditions, along with more flexibility in underwriting, coverage, pricing; and recognition of investments in internal risk management efforts through lower premiums .
Common carrier win reasons When it comes down to selecting a carrier, the most common win reason is incumbent relationship .
Common reasons forcarriers not quoting
The most common reasons for a carrier not providing a quote for casualty/liability, automobile liability, workers compensation, financial lines and property are: terms and conditions, underwriting concerns and pricing .
Common reasons forrejecting a carrier’s quote
The reason most often given by clients for rejecting a carrier’s quote is inferior pricing .
Financial insights
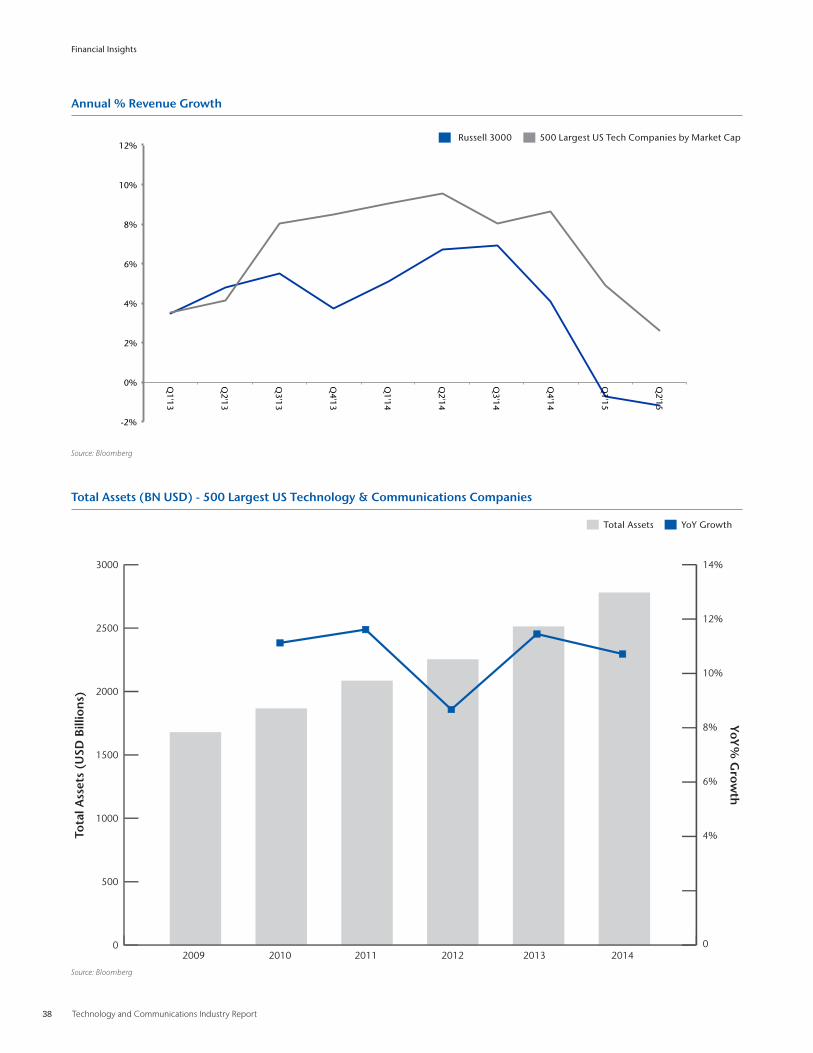
The share prices of information technology have outperformed the Russell 3000 and S&P 500 Indexes since August 2014 while telecommunication had weaker results when compared to both indexes . The technology sector has less employment issues than the overall industry and communications sector . In terms of annual revenue change, the Russell 3000 Index has outperformed the technology sector nine of the last ten quarters . If you look at the aggregate asset size of the 500 largest US technology and communications companies since 2009 you will observe an upward trend in total assets and an average year on year growth rate of 10 .6 percent .

4 Technology and Communications Industry Report
Top 10 Risks
Aon Risk Solutions 5
In Aon’s 2015 Global Risk Management Survey, respondents are
provided a list of 53 risks and asked to select 10 that they believe
to be the top risks facing their own industries and organizations .
Increasing competition is ranked by the technology and
communications sectors as the most challenging risk . Second
on the list is damage to reputation/brand, followed by failure to
innovate and meet customer needs .
Competition, central to the operation of markets, fosters
innovation, productivity and growth . At the same time,
increasing competition can also eat away a company’s market
share and end a business . Increasing competition presents an
acute risk for the technology and communications companies,
which face tougher anti-monopoly rules, competition from
foreign suppliers of basic communications services, rapidly
changing technology, fast-evolving regulatory and industry
standards, frequent new product introductions, and price and
cost reductions . While larger business organizations may be able
to fend off higher amounts of competition than smaller ones
with limited resources, all organizations, regardless of size, see
competition as a priority risk .
If we break down the technology and communications group
further to sub-categories, we’ll see that the communications
sector sees damage to reputation/brand as a number one risk .
This could be attributed to a long list of well-known companies,
which saw their reputation affected by unexpected incidents
–customer services snafus, privacy concerns, inappropriate
remarks or behavior by company executives and large-scale data
breaches . In an age of 24-hour news cycles and instant social
media, crisis could spread globally within hours or minutes .
As a result, reputation, which was categorized by experts as
“priceless” or “an intangible asset,” is becoming increasingly
“pricey,” exerting a direct impact on the company’s bottom line .
For the technology sector, where the lifetime of products
continues to shrink, the race to market has intensified and
consumer needs are fickle, failure to innovation/meet customer
needs pose as the number one risk .
When comparing with the ranking of various risks in the 2013
survey, we have noted that computer crime/ hacking/viruses /
malicious codes has jumped from number eight to number
five . New technologies such as cloud computing, social media,
mobile devices and big data analytics have helped companies
achieve profits and reach operational goals . However, these same
businesses face an increasingly diverse and sophisticated array of
threats to the security of their information management systems .
Each time the industry develops or adds a new feature to a
system, the chance of cyber risks rises .
Each year, the security industry strives to protect companies
with new potent tools, but a new crop of hackers emerges with
more damaging cyber attack techniques . At the same time,
users’ careless online behavior will continue to create exploitable
opportunities for hackers or directly result in security breaches .
As hackers and anti-hackers remain locked into a fierce arms race,
survey participants expect the risk to be a top risk concern three
years from now .
The Center for Strategic and International Studies, a well-known
Washington think tank, has estimated that the annual cost of
cyber crime and economic espionage to the world economy
runs as high as USD 445 billion—or almost one percent of global
income . The average time to resolve a cyber attack is also rising,
climbing to 45 days, up from 32 days in 2013 . As cyber crimes are
becoming more rampant, more costly, and more time consuming
to resolve, businesses are faced with an increased possibility of
legal exposure, reputation damage, and operational interruption
that can wreak havoc on their bottom line .
Similar to the prior survey, our study findings highlight the
interdependency among many of the top risks . For example, a
cyber attack causes disruption to business and IT operations and
a business disruption leads to damage to reputation/brand, which
will dent a business’s competitiveness, making it harder to attract
and maintain top talents . Lack of talents stunts a company’s
ability to stay competitive in a tough business environment . The
list goes on . This interdependency between risks illustrates that
organizations can no longer evaluate risk in isolation but must
consider their interconnectedness .
Top 10 Risks
6 Technology and Communications Industry Report
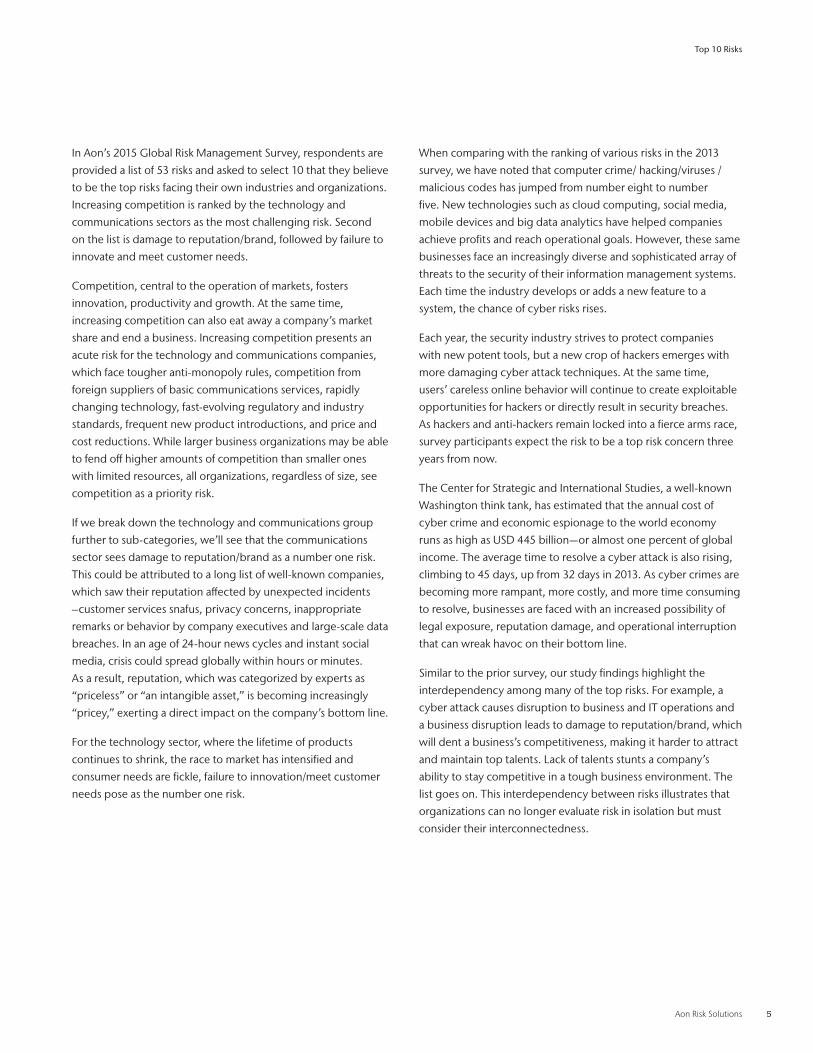
Risk Readiness for the Top 10 Risks
Risk readiness refers to the level of a company’s risk preparedness
—undertaking a formal review of risks and putting in place a
comprehensive risk management plan . In comparison with that
of 2013, overall readiness for the top 10 risks has decreased
slightly by two percent to 65 . The results fall below expectation .
Given the attention and scrutiny that risk management practices
have received from stakeholders, one would expect a dramatic
uptick in the percentage point . The situation may indicate that
insurance markets solutions have not been responsive to key
risk sensitivities and that it is important to manage risk from an
enterprise perspective .
Technology and Communications Industry 2015 Top 10 Risks
Rank Technology & Communications Sectors Technology Communications
1 Increasing competition Failure to innovate/meet customer needs Damage to reputation/brand
2 Damage to reputation/brand Increasing competition Regulatory/legislative changes
3 Failure to innovate/meet customer needs Damage to reputation/brand Increasing competition
4 Failure to attract or retain top talent Economic slowdown/slow recovery Computer crime/hacking/viruses/malicious codes
5 Computer crime/hacking/viruses/malicious codes Failure to attract or retain top talent Failure to attract or retain top talent
6 Economic slowdown/slow recovery Loss of intellectual property/data Directors & Officers personal liability
7 Loss of intellectual property/data Computer crime/hacking/viruses/malicious codes Merger/acquisition/restructuring
8 Regulatory/legislative changes Technology failure/system failure Economic slowdown/slow recovery
9 Technology failure/system failure Regulatory/legislative changes Failure to innovate/meet customer needs
10 Distribution or supply chain failure Distribution or supply chain failure Business interruption
Data Source: Aon’s 2015 Global Risk Management SurveyNote: Where ranking for a risk was tied, the all respondent ranking was utilized to determine what risk would be ranked higher
Top 10 Risks
Aon Risk Solutions 7
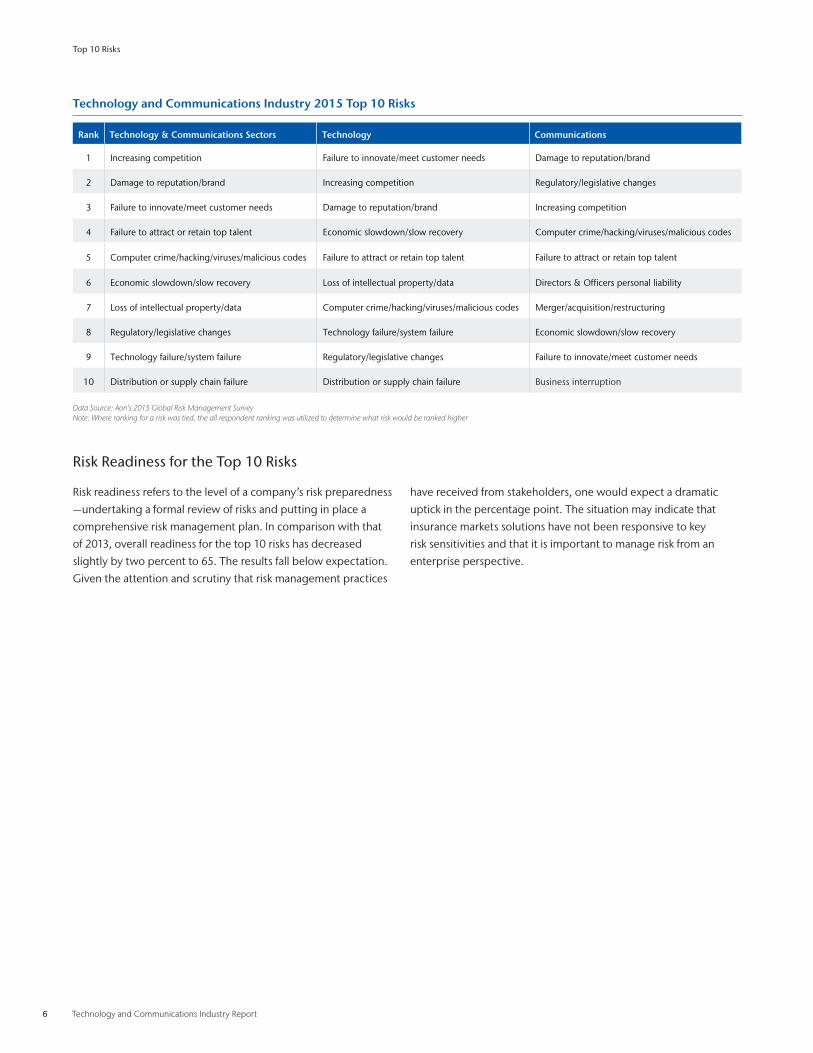
Risk Readiness for the Top 10 Risks – Technology and Communications Sector
2015 Risk Readiness 2013 Risk Readiness
68%
66%
62%
53%
63%
26%
70%
62%
60%
64%
72%92%
75%
58%
92%73%
65%
74%
58%64%
0% 20% 40% 60% 80% 100%
Distribution or supply chain failure
Technology failure/system failure
Regulatory/legislative changes
Loss of intellectual property/data
Economic slowdown/slow recovery
Computer crime/hacking/viruses/malicious codes
Failure to attract orretain top talent
Failure to innovate/meet customer needs
Damage to reputation/brand
Increasing competition
Despite the slight decline in overall risk readiness, two closely
related risks - computer crime/hacking/viruses/malicious codes
and technology failure/system failure, have registered the
highest percentage of risk readiness, both at 92 percent . The
rising preparedness is probably driven by heightened media and
public scrutiny after a series of high-profile computer hacking and
system failure incidents .
In a field, where the lifetime of products continues to shrink, and
consumer needs are fickle, failure to innovation/meet customer
needs is posing an increasingly significant risk . Only 58 percent
say their organizations are ready for the risk of failure to innovate
and meet customer needs, a whopping 17 percent decrease
from that in 2013 . The percentage of readiness for economic
slowdown/slow recovery has slipped from 63 in 2013 to 26 due
to the improvement of overall economic conditions worldwide .
Top 10 Risks
Data Source: Aon’s 2015 Global Risk Management Survey
8 Technology and Communications Industry Report
Losses Associated with Top 10 Risks –Technology and Communications
Distribution orsupply chain failure
Technology failure/system failure
Regulatory/legislative changes
Loss of intellectualproperty/data
Economic slowdown/slow recovery
Computer crime/hacking/viruses/malicious codes
Failure to attract orretain top talent
Failure to innovate/meet customer needs
Damage to reputation/brand
Increasing competition
2015 Loss of Income 2013 Loss of Income
67%
56%
5%44%
32%
74%
46%
24%
49%18%
42%42%
50%37%
43%
8%
39%16%
35%5%
0% 20% 40% 60% 80% 100%
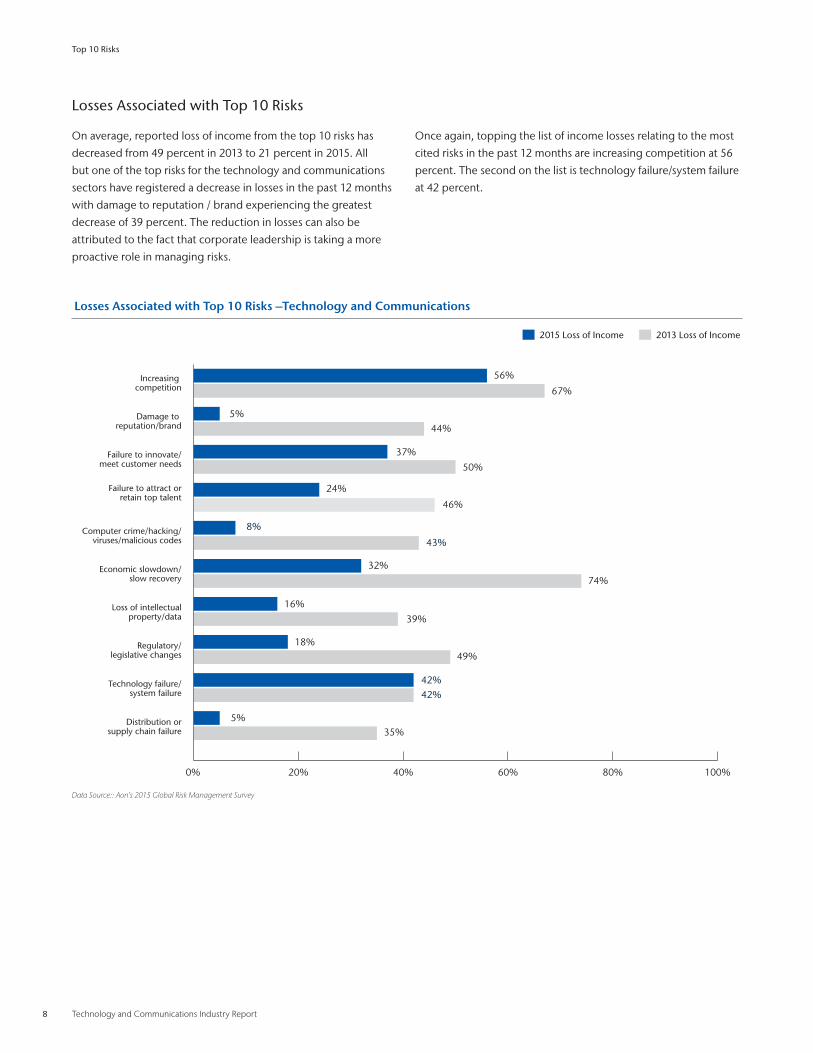
Losses Associated with Top 10 Risks
On average, reported loss of income from the top 10 risks has
decreased from 49 percent in 2013 to 21 percent in 2015 . All
but one of the top risks for the technology and communications
sectors have registered a decrease in losses in the past 12 months
with damage to reputation / brand experiencing the greatest
decrease of 39 percent . The reduction in losses can also be
attributed to the fact that corporate leadership is taking a more
proactive role in managing risks .
Once again, topping the list of income losses relating to the most
cited risks in the past 12 months are increasing competition at 56
percent . The second on the list is technology failure/system failure
at 42 percent .
Top 10 Risks
Data Source:: Aon’s 2015 Global Risk Management Survey
Aon Risk Solutions 9
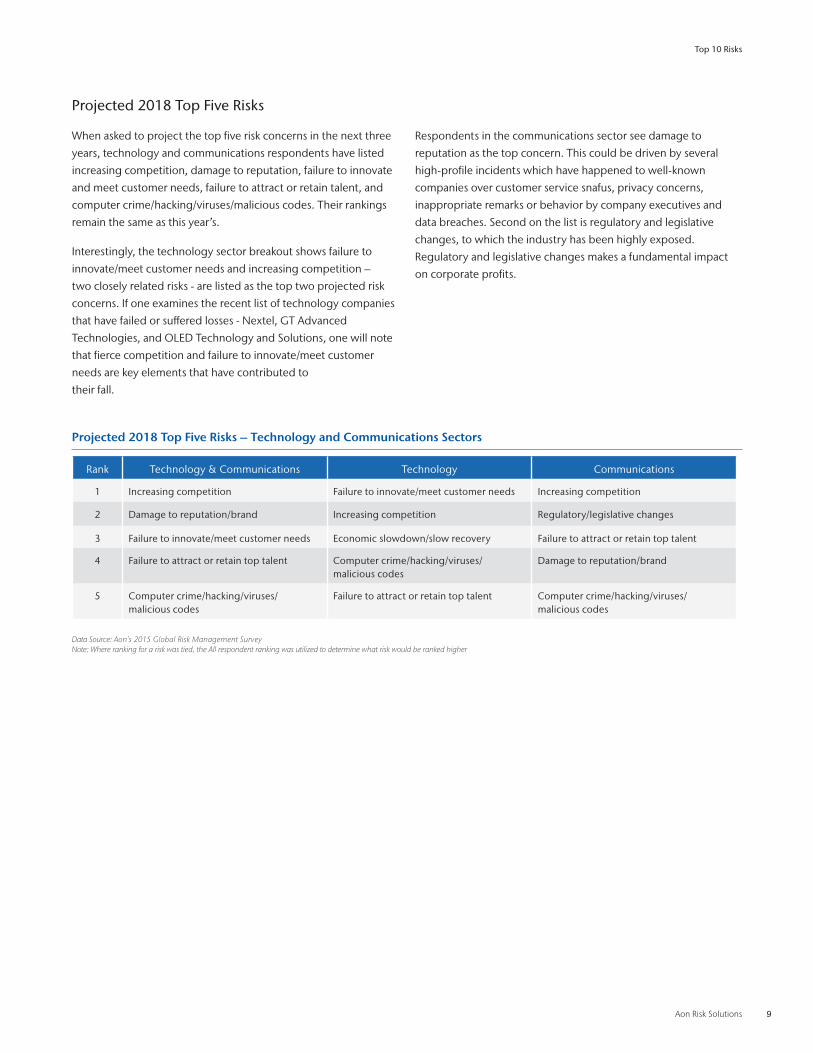
Projected 2018 Top Five Risks
When asked to project the top five risk concerns in the next three
years, technology and communications respondents have listed
increasing competition, damage to reputation, failure to innovate
and meet customer needs, failure to attract or retain talent, and
computer crime/hacking/viruses/malicious codes . Their rankings
remain the same as this year’s .
Interestingly, the technology sector breakout shows failure to
innovate/meet customer needs and increasing competition –
two closely related risks - are listed as the top two projected risk
concerns . If one examines the recent list of technology companies
that have failed or suffered losses - Nextel, GT Advanced
Technologies, and OLED Technology and Solutions, one will note
that fierce competition and failure to innovate/meet customer
needs are key elements that have contributed to
their fall .
Respondents in the communications sector see damage to
reputation as the top concern . This could be driven by several
high-profile incidents which have happened to well-known
companies over customer service snafus, privacy concerns,
inappropriate remarks or behavior by company executives and
data breaches . Second on the list is regulatory and legislative
changes, to which the industry has been highly exposed .
Regulatory and legislative changes makes a fundamental impact
on corporate profits .
Projected 2018 Top Five Risks – Technology and Communications Sectors
Rank Technology & Communications Technology Communications
1 Increasing competition Failure to innovate/meet customer needs Increasing competition
2 Damage to reputation/brand Increasing competition Regulatory/legislative changes
3 Failure to innovate/meet customer needs Economic slowdown/slow recovery Failure to attract or retain top talent
4 Failure to attract or retain top talent Computer crime/hacking/viruses/ malicious codes
Damage to reputation/brand
5 Computer crime/hacking/viruses/ malicious codes
Failure to attract or retain top talent Computer crime/hacking/viruses/ malicious codes
Data Source: Aon’s 2015 Global Risk Management SurveyNote: Where ranking for a risk was tied, the All respondent ranking was utilized to determine what risk would be ranked higher
Top 10 Risks
10 Technology and Communications Industry Report
Identifying, Assessing, Measuring and Managing Risk
Aon Risk Solutions 11
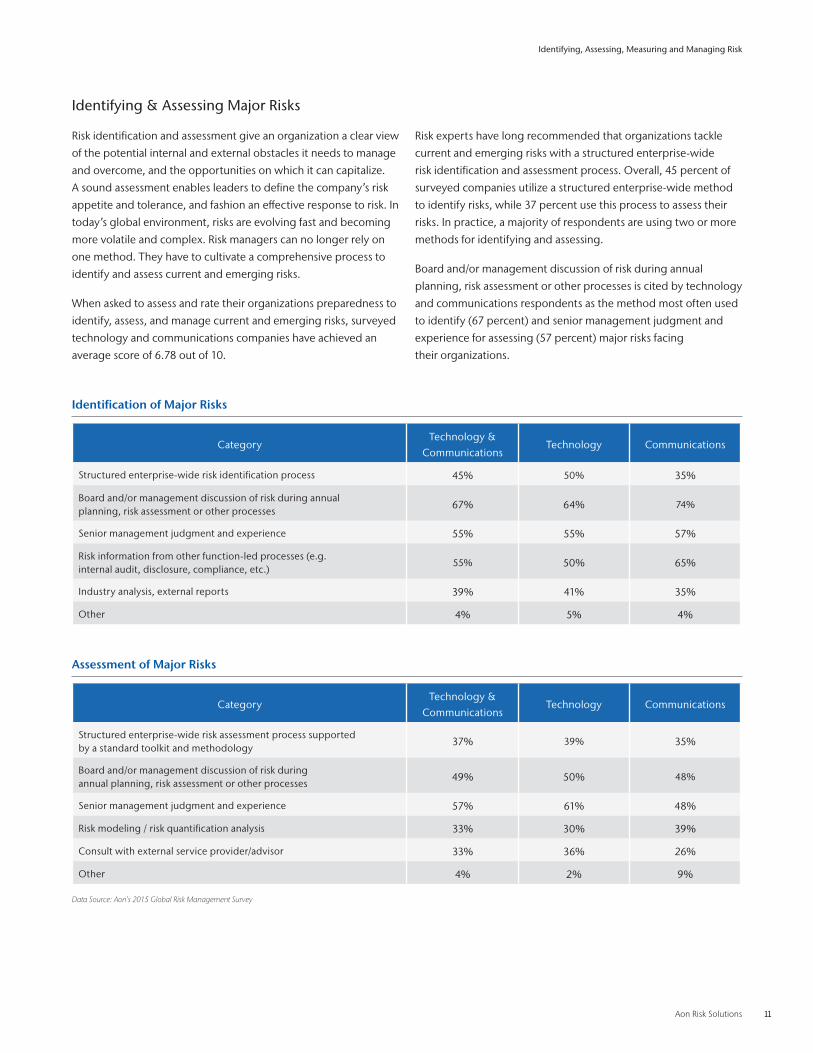
Identifying & Assessing Major Risks
Risk identification and assessment give an organization a clear view
of the potential internal and external obstacles it needs to manage
and overcome, and the opportunities on which it can capitalize .
A sound assessment enables leaders to define the company’s risk
appetite and tolerance, and fashion an effective response to risk . In
today’s global environment, risks are evolving fast and becoming
more volatile and complex . Risk managers can no longer rely on
one method . They have to cultivate a comprehensive process to
identify and assess current and emerging risks .
When asked to assess and rate their organizations preparedness to
identify, assess, and manage current and emerging risks, surveyed
technology and communications companies have achieved an
average score of 6 .78 out of 10 .
Risk experts have long recommended that organizations tackle
current and emerging risks with a structured enterprise-wide
risk identification and assessment process . Overall, 45 percent of
surveyed companies utilize a structured enterprise-wide method
to identify risks, while 37 percent use this process to assess their
risks . In practice, a majority of respondents are using two or more
methods for identifying and assessing .
Board and/or management discussion of risk during annual
planning, risk assessment or other processes is cited by technology
and communications respondents as the method most often used
to identify (67 percent) and senior management judgment and
experience for assessing (57 percent) major risks facing
their organizations .
Identification of Major Risks
CategoryTechnology &
CommunicationsTechnology Communications
Structured enterprise-wide risk identification process 45% 50% 35%
Board and/or management discussion of risk during annualplanning, risk assessment or other processes
67% 64% 74%
Senior management judgment and experience 55% 55% 57%
Risk information from other function-led processes (e .g .internal audit, disclosure, compliance, etc .)
55% 50% 65%
Industry analysis, external reports 39% 41% 35%
Other 4% 5% 4%
Identifying, Assessing, Measuring and Managing Risk
Assessment of Major Risks
CategoryTechnology &
CommunicationsTechnology Communications
Structured enterprise-wide risk assessment process supportedby a standard toolkit and methodology
37% 39% 35%
Board and/or management discussion of risk during annual planning, risk assessment or other processes
49% 50% 48%
Senior management judgment and experience 57% 61% 48%
Risk modeling / risk quantification analysis 33% 30% 39%
Consult with external service provider/advisor 33% 36% 26%
Other 4% 2% 9%
Data Source: Aon’s 2015 Global Risk Management Survey
12 Technology and Communications Industry Report
Risk Maturity
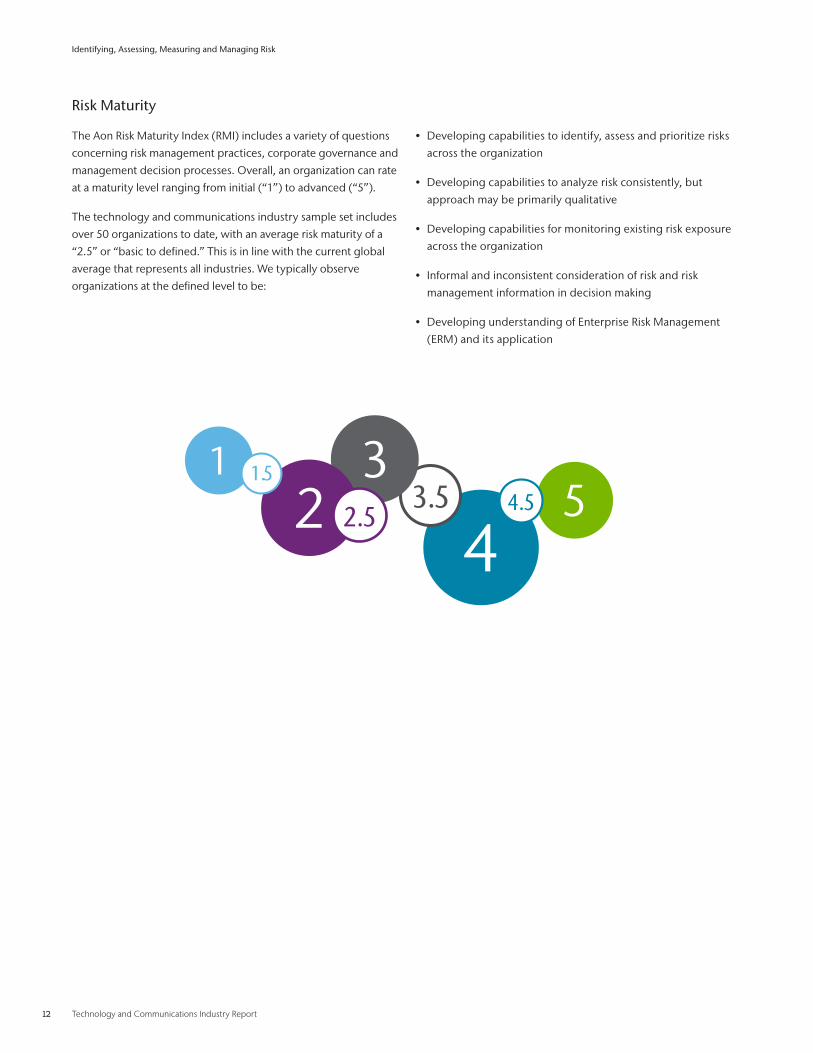
The Aon Risk Maturity Index (RMI) includes a variety of questions
concerning risk management practices, corporate governance and
management decision processes . Overall, an organization can rate
at a maturity level ranging from initial (“1”) to advanced (“5”) .
The technology and communications industry sample set includes
over 50 organizations to date, with an average risk maturity of a
“2 .5” or “basic to defined .” This is in line with the current global
average that represents all industries . We typically observe
organizations at the defined level to be:
• Developing capabilities to identify, assess and prioritize risks
across the organization
• Developing capabilities to analyze risk consistently, but
approach may be primarily qualitative
• Developing capabilities for monitoring existing risk exposure
across the organization
• Informal and inconsistent consideration of risk and risk
management information in decision making
• Developing understanding of Enterprise Risk Management
(ERM) and its application
Identifying, Assessing, Measuring and Managing Risk
54
3.531
2 2.5 4.51.5
Aon Risk Solutions 13
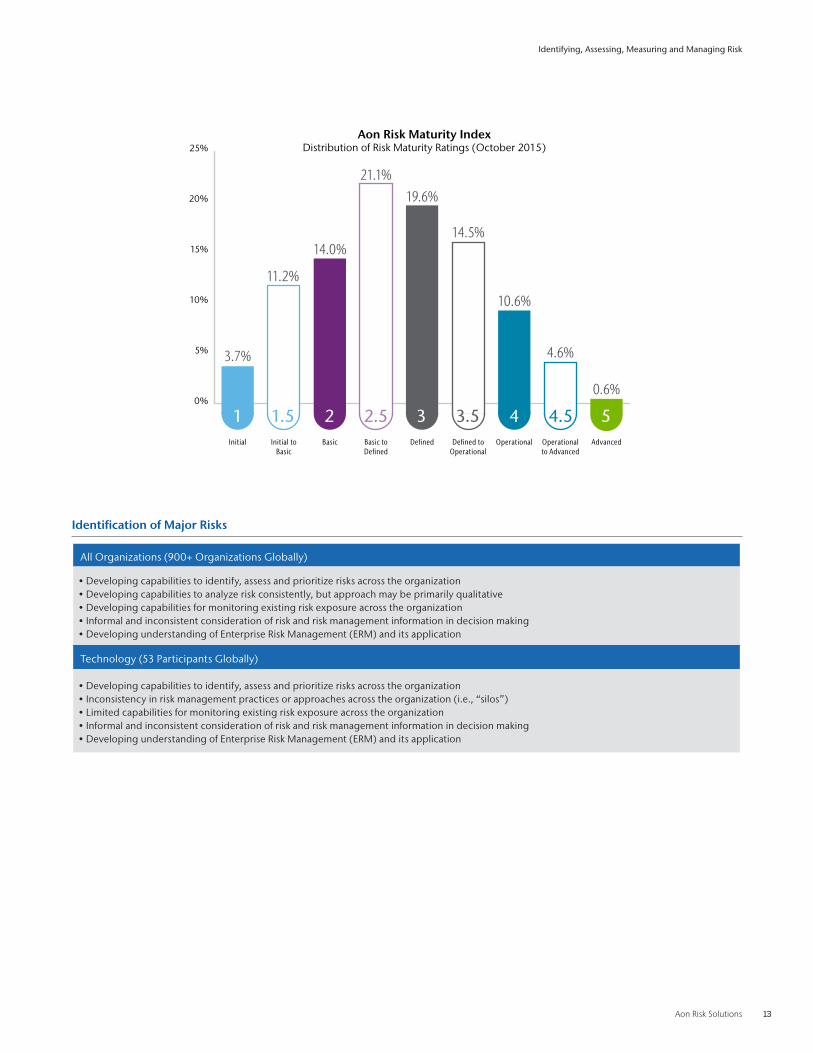
Identification of Major Risks
All Organizations (900+ Organizations Globally)
•Developingcapabilitiestoidentify,assessandprioritizerisksacrosstheorganization•Developingcapabilitiestoanalyzeriskconsistently,butapproachmaybeprimarilyqualitative•Developingcapabilitiesformonitoringexistingriskexposureacrosstheorganization•Informalandinconsistentconsiderationofriskandriskmanagementinformationindecisionmaking•DevelopingunderstandingofEnterpriseRiskManagement(ERM)anditsapplication
Technology (53 Participants Globally)
•Developingcapabilitiestoidentify,assessandprioritizerisksacrosstheorganization•Inconsistencyinriskmanagementpracticesorapproachesacrosstheorganization(i.e.,“silos”)•Limitedcapabilitiesformonitoringexistingriskexposureacrosstheorganization•Informalandinconsistentconsiderationofriskandriskmanagementinformationindecisionmaking•DevelopingunderstandingofEnterpriseRiskManagement(ERM)anditsapplication
Identifying, Assessing, Measuring and Managing Risk
AdvancedOperationalto Advanced
OperationalDefined toOperational
DefinedBasic toDefined
BasicInitial toBasic
Initial
Aon Risk Maturity IndexDistribution of Risk Maturity Ratings (October 2015)
0%
5%
10%
15%
20%
25%
1 1.5 2 2.5 3 3.5 4 4.5 5
0.6%
4.6%
10.6%
14.5%
19.6%21.1%
14.0%
11.2%
3.7%
14 Technology and Communications Industry Report
Technology and communications organizations as a group appear
to have especially strong practices related to risk management
stewardship, and are more mature in their ability to integrate risk
insights into human capital processes . In particular, they are likely
to have the most transparency around their risk communications .
The technology and communications industry tends to score
lower in areas related to the use of quantification methods to
understand risk . In addition, technology and communications
companies seem to have the lowest level of involvement of key
stakeholders in risk management strategy setting . In particular,
they seem less mature with formally collecting and incorporating
risk information into the decision making process .
One section of the RMI is dedicated to best practices regarding
identification of existing and emerging risks . When it comes to
these practices, there are a few interesting differences between
those organizations at lower levels of risk maturity (2 .5-) and
higher levels of risk maturity (3 .5+) .
Specifically, over 60 percent of less mature organizations rarely
or never collaborate with their strategic partners to identify
potential emerging risks, while over 86 percent of more mature
organizations collaborate on an ad-hoc basis, if not more
consistently through a defined process . In an increasingly
interconnected world, this difference illustrates the importance
of collaboration outside of just an internally-focused risk
identification process .
There also appears to be a notable difference between how
organizations measure and track risks once identified . Based
on our research, not only do more mature organizations have
processes in place to identify risks at an enterprise level, but
they are also more than twice as likely to follow through with
implementing, measuring, and tracking risk management
activities to completion .
Identifying, Assessing, Measuring and Managing Risk

Aon Risk Solutions 15
Risk Management Department and Function
16 Technology and Communications Industry Report
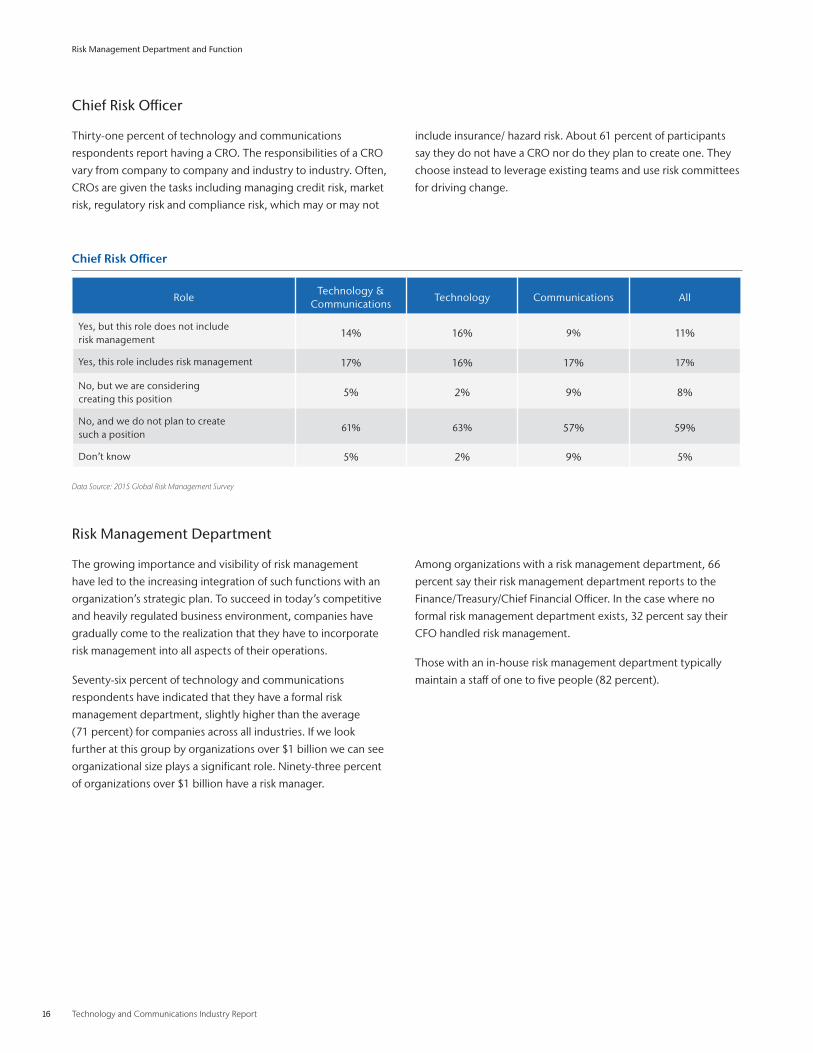
Chief Risk Officer
Thirty-one percent of technology and communications
respondents report having a CRO . The responsibilities of a CRO
vary from company to company and industry to industry . Often,
CROs are given the tasks including managing credit risk, market
risk, regulatory risk and compliance risk, which may or may not
include insurance/ hazard risk . About 61 percent of participants
say they do not have a CRO nor do they plan to create one . They
choose instead to leverage existing teams and use risk committees
for driving change .
Risk Management Department
The growing importance and visibility of risk management
have led to the increasing integration of such functions with an
organization’s strategic plan . To succeed in today’s competitive
and heavily regulated business environment, companies have
gradually come to the realization that they have to incorporate
risk management into all aspects of their operations .
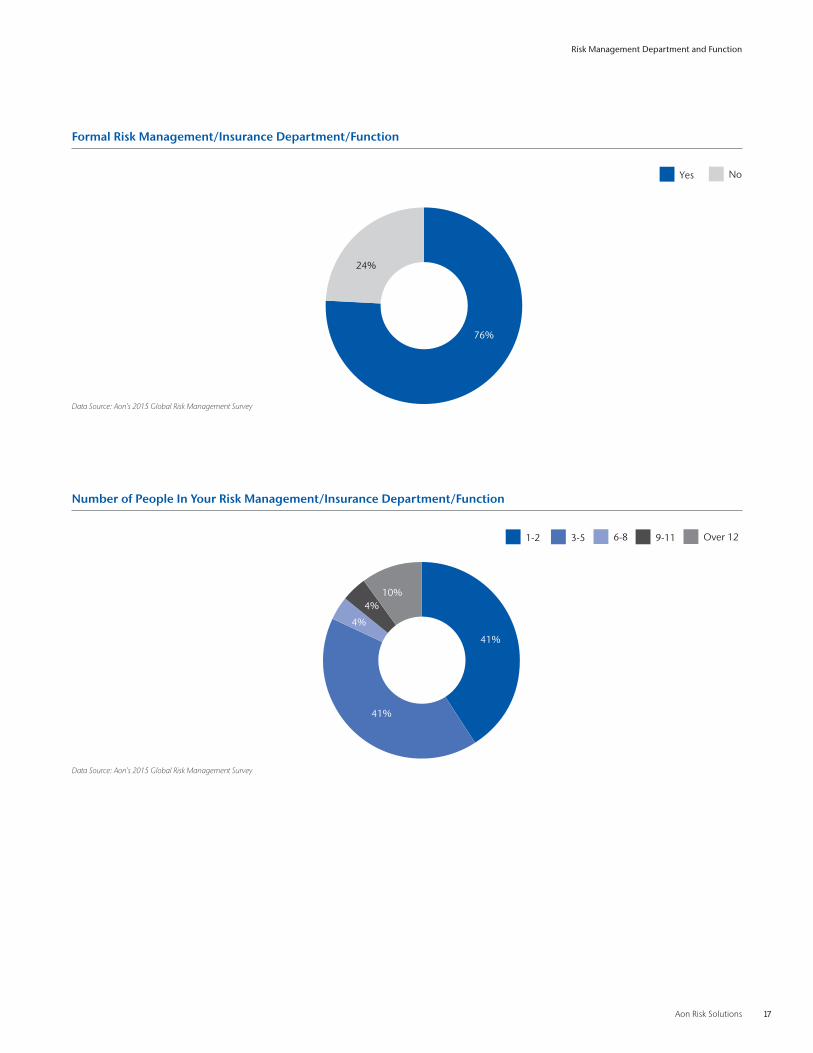
Seventy-six percent of technology and communications
respondents have indicated that they have a formal risk
management department, slightly higher than the average
(71 percent) for companies across all industries . If we look
further at this group by organizations over $1 billion we can see
organizational size plays a significant role . Ninety-three percent
of organizations over $1 billion have a risk manager .
Among organizations with a risk management department, 66
percent say their risk management department reports to the
Finance/Treasury/Chief Financial Officer . In the case where no
formal risk management department exists, 32 percent say their
CFO handled risk management .
Those with an in-house risk management department typically
maintain a staff of one to five people (82 percent) .
Chief Risk Officer
RoleTechnology &
CommunicationsTechnology Communications All
Yes, but this role does not includerisk management
14% 16% 9% 11%
Yes, this role includes risk management 17% 16% 17% 17%
No, but we are consideringcreating this position
5% 2% 9% 8%
No, and we do not plan to createsuch a position
61% 63% 57% 59%
Don’t know 5% 2% 9% 5%
Data Source: 2015 Global Risk Management Survey
Risk Management Department and Function
Aon Risk Solutions 17
Formal Risk Management/Insurance Department/Function
Number of People In Your Risk Management/Insurance Department/Function
Data Source: Aon’s 2015 Global Risk Management Survey
Data Source: Aon’s 2015 Global Risk Management Survey
24%
76%
NoYes
24%
76%
NoYes
10%
41%
4%
4%
41%
Over 129-116-83-51-2
10%
41%
4%
4%
41%
Over 129-116-83-51-2
Risk Management Department and Function
18 Technology and Communications Industry Report
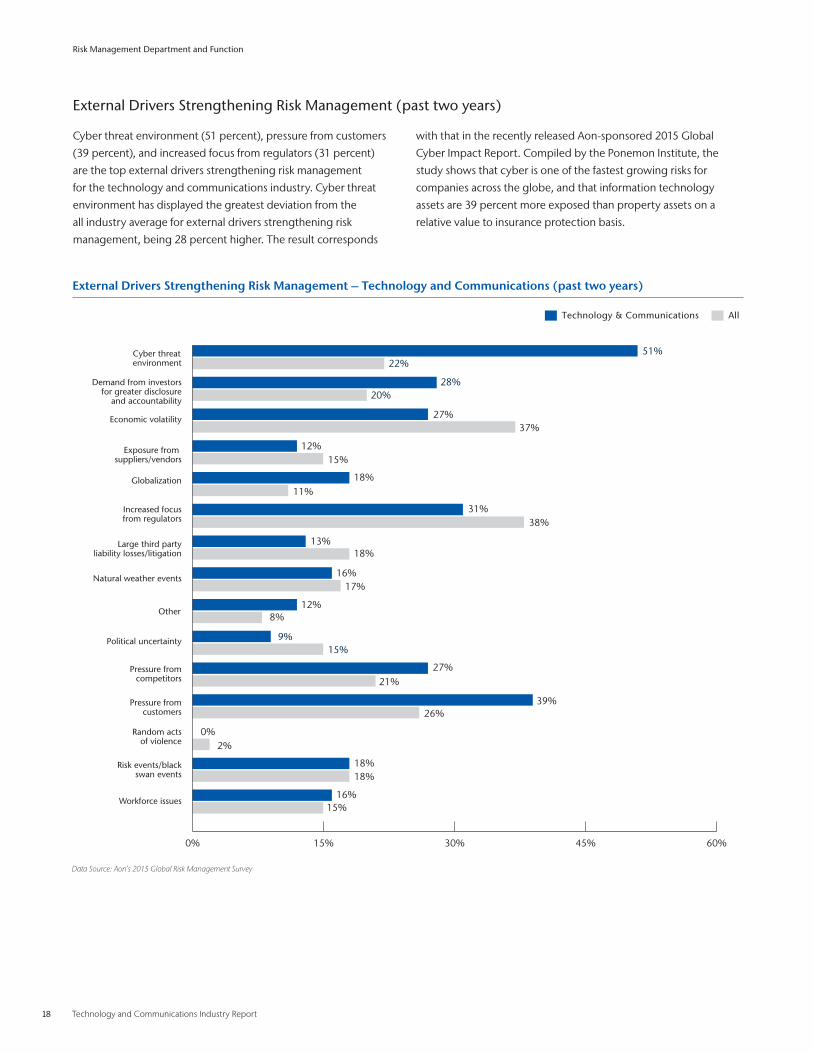
External Drivers Strengthening Risk Management – Technology and Communications (past two years)
0% 15% 30% 45% 60%
Political uncertainty
Pressure fromcompetitors
Pressure fromcustomers
Random actsof violence
Risk events/blackswan events
Workforce issues
Other
Natural weather events
Large third partyliability losses/litigation
Increased focusfrom regulators
Globalization
Exposure from suppliers/vendors
Economic volatility
Demand from investorsfor greater disclosure
and accountability
Cyber threatenvironment
20%28%
11%18%
13%18%
12%8%
15%9%
18%18%
38%31%
22%51%
15%16%
37%27%
15%12%
21%
2%0%
27%
26%39%
17%16%
Technology & Communications All
External Drivers Strengthening Risk Management (past two years)
Cyber threat environment (51 percent), pressure from customers
(39 percent), and increased focus from regulators (31 percent)
are the top external drivers strengthening risk management
for the technology and communications industry . Cyber threat
environment has displayed the greatest deviation from the
all industry average for external drivers strengthening risk
management, being 28 percent higher . The result corresponds
with that in the recently released Aon-sponsored 2015 Global
Cyber Impact Report . Compiled by the Ponemon Institute, the
study shows that cyber is one of the fastest growing risks for
companies across the globe, and that information technology
assets are 39 percent more exposed than property assets on a
relative value to insurance protection basis .
Risk Management Department and Function
Data Source: Aon’s 2015 Global Risk Management Survey
Aon Risk Solutions 19
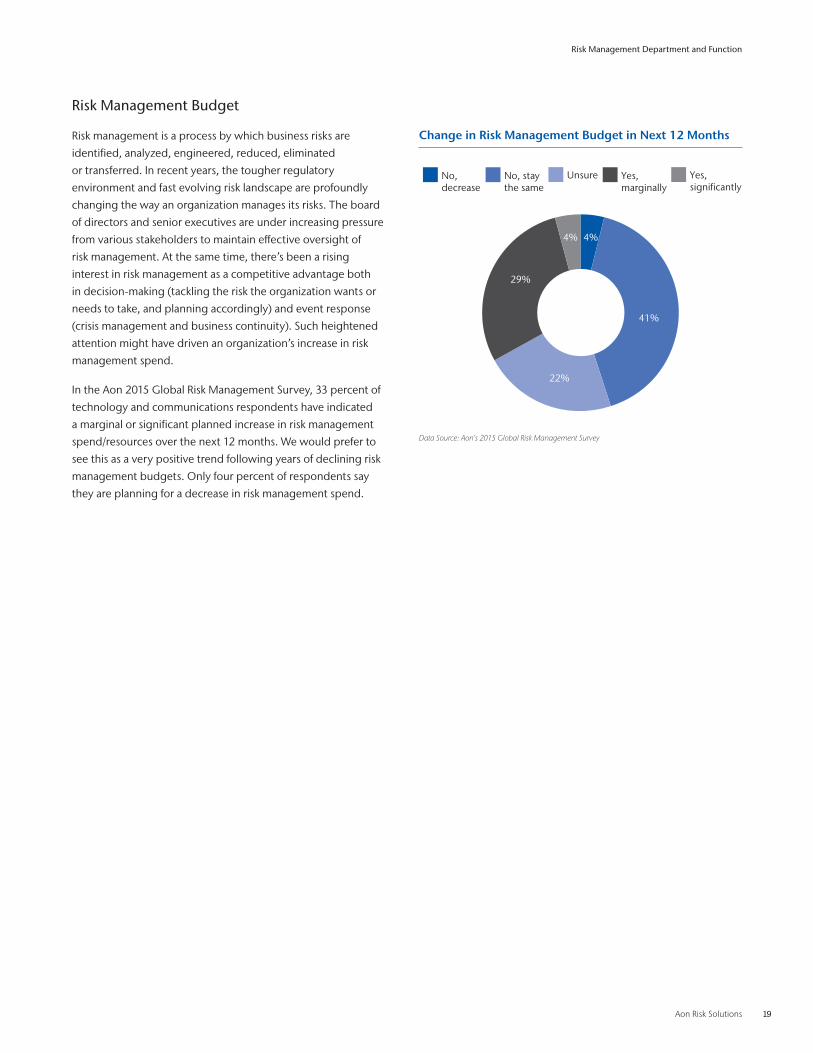
Risk Management Budget
Risk management is a process by which business risks are
identified, analyzed, engineered, reduced, eliminated
or transferred . In recent years, the tougher regulatory
environment and fast evolving risk landscape are profoundly
changing the way an organization manages its risks . The board
of directors and senior executives are under increasing pressure
from various stakeholders to maintain effective oversight of
risk management . At the same time, there’s been a rising
interest in risk management as a competitive advantage both
in decision-making (tackling the risk the organization wants or
needs to take, and planning accordingly) and event response
(crisis management and business continuity) . Such heightened
attention might have driven an organization’s increase in risk
management spend .
In the Aon 2015 Global Risk Management Survey, 33 percent of
technology and communications respondents have indicated
a marginal or significant planned increase in risk management
spend/resources over the next 12 months . We would prefer to
see this as a very positive trend following years of declining risk
management budgets . Only four percent of respondents say
they are planning for a decrease in risk management spend .
Change in Risk Management Budget in Next 12 Months
Data Source: Aon’s 2015 Global Risk Management Survey
4%
22%
29%
4%
41%
Yes, significantly
Yes, marginally
UnsureNo, stay the same
No, decrease
Risk Management Department and Function

20 Technology and Communications Industry Report
Risk Financing
Aon Risk Solutions 21
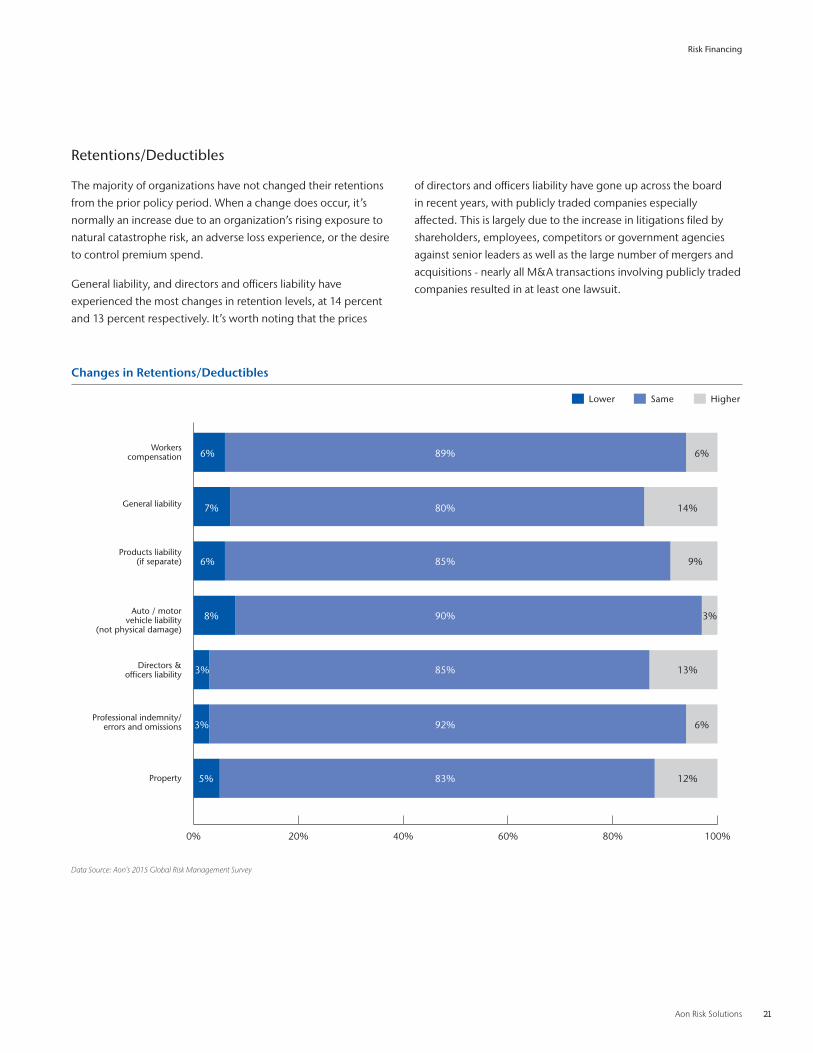
Retentions/Deductibles
The majority of organizations have not changed their retentions
from the prior policy period . When a change does occur, it’s
normally an increase due to an organization’s rising exposure to
natural catastrophe risk, an adverse loss experience, or the desire
to control premium spend .
General liability, and directors and officers liability have
experienced the most changes in retention levels, at 14 percent
and 13 percent respectively . It’s worth noting that the prices
of directors and officers liability have gone up across the board
in recent years, with publicly traded companies especially
affected . This is largely due to the increase in litigations filed by
shareholders, employees, competitors or government agencies
against senior leaders as well as the large number of mergers and
acquisitions - nearly all M&A transactions involving publicly traded
companies resulted in at least one lawsuit .
Changes in Retentions/Deductibles
0% 20% 40% 60% 80% 100%
Property
Professional indemnity/errors and omissions
Directors &officers liability
Auto / motorvehicle liability
(not physical damage)
Products liability(if separate)
General liability
Workerscompensation
Lower Same Higher
89%
80%
85%
90%
85%
92%3%
83%5% 12%
6%
3% 13%
8% 3%
6% 9%
7% 14%
6% 6%
Data Source: Aon’s 2015 Global Risk Management Survey
Risk Financing
22 Technology and Communications Industry Report
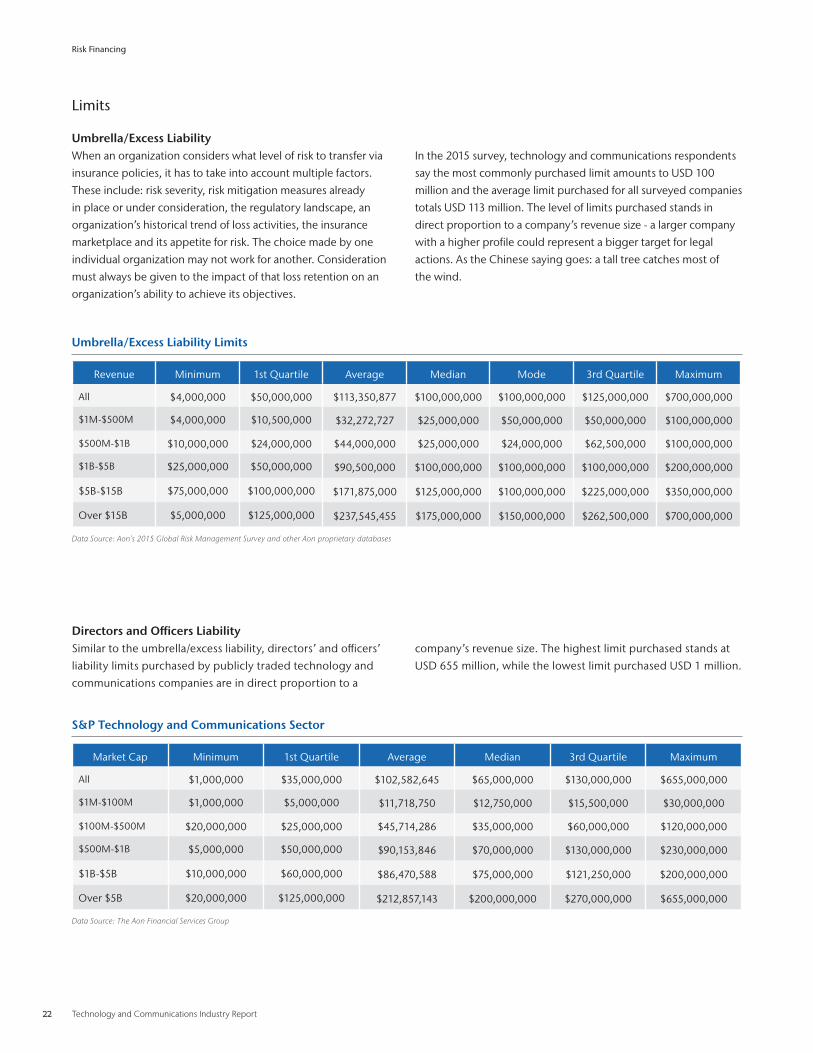
Directors and Officers Liability Similar to the umbrella/excess liability, directors’ and officers’
liability limits purchased by publicly traded technology and
communications companies are in direct proportion to a
company’s revenue size . The highest limit purchased stands at
USD 655 million, while the lowest limit purchased USD 1 million .
Umbrella/Excess Liability Limits
Revenue Minimum 1st Quartile Average Median Mode 3rd Quartile Maximum
All $4,000,000 $50,000,000 $113,350,877 $100,000,000 $100,000,000 $125,000,000 $700,000,000
$1M-$500M $4,000,000 $10,500,000 $32,272,727 $25,000,000 $50,000,000 $50,000,000 $100,000,000
$500M-$1B $10,000,000 $24,000,000 $44,000,000 $25,000,000 $24,000,000 $62,500,000 $100,000,000
$1B-$5B $25,000,000 $50,000,000 $90,500,000 $100,000,000 $100,000,000 $100,000,000 $200,000,000
$5B-$15B $75,000,000 $100,000,000 $171,875,000 $125,000,000 $100,000,000 $225,000,000 $350,000,000
Over $15B $5,000,000 $125,000,000 $237,545,455 $175,000,000 $150,000,000 $262,500,000 $700,000,000
S&P Technology and Communications Sector
Market Cap Minimum 1st Quartile Average Median 3rd Quartile Maximum
All $1,000,000 $35,000,000 $102,582,645 $65,000,000 $130,000,000 $655,000,000
$1M-$100M $1,000,000 $5,000,000 $11,718,750 $12,750,000 $15,500,000 $30,000,000
$100M-$500M $20,000,000 $25,000,000 $45,714,286 $35,000,000 $60,000,000 $120,000,000
$500M-$1B $5,000,000 $50,000,000 $90,153,846 $70,000,000 $130,000,000 $230,000,000
$1B-$5B $10,000,000 $60,000,000 $86,470,588 $75,000,000 $121,250,000 $200,000,000
Over $5B $20,000,000 $125,000,000 $212,857,143 $200,000,000 $270,000,000 $655,000,000
Data Source: Aon’s 2015 Global Risk Management Survey and other Aon proprietary databases
Data Source: The Aon Financial Services Group
Limits
Umbrella/Excess LiabilityWhen an organization considers what level of risk to transfer via
insurance policies, it has to take into account multiple factors .
These include: risk severity, risk mitigation measures already
in place or under consideration, the regulatory landscape, an
organization’s historical trend of loss activities, the insurance
marketplace and its appetite for risk . The choice made by one
individual organization may not work for another . Consideration
must always be given to the impact of that loss retention on an
organization’s ability to achieve its objectives .
In the 2015 survey, technology and communications respondents
say the most commonly purchased limit amounts to USD 100
million and the average limit purchased for all surveyed companies
totals USD 113 million . The level of limits purchased stands in
direct proportion to a company’s revenue size - a larger company
with a higher profile could represent a bigger target for legal
actions . As the Chinese saying goes: a tall tree catches most of
the wind .
Risk Financing
Aon Risk Solutions 23
Cyber Risk Coverage
In the Aon-sponsored 2015 Global Cyber Impact Report (the
research was conducted by the Ponemon Institute), we have found
that cyber is one of the fastest growing risks for companies across
the globe as mobile technologies, cloud computing, corporate
bring-your-own-device policies, and big data analytics are
becoming increasingly popular . About 37 percent of companies
surveyed experienced a “material or significantly disruptive
security exploit or data breach one or more times during the past
two years and the average economic impact of the event was
USD 2 .1 million .”
Given the proliferation of internet-connected devices, which
are expected to grow from 10 to 50 billion within five years,
cyber risk is expected to skyrocket . On average, probable
maximum loss of tangible assets amounts to USD 648 million and
probable maximum loss on intangible assets USD 612 million .
But, organizations buy insurance to cover just over half of the
maximum probable loss of property, plant and equipment, and
only 12 percent of the probable maximum loss of information
assets .
Organizations need to consider cyber assets and exposures in
the context of financial statement impact compared to historical
tangible assets and exposures . According to a sobering new
report from FireEye, on average 96 percent of computer systems
across all industry segments have been breached . Yet, the
Verizon 2015 Data Breach Investigations Report only shows
confirmed data loss in less than three percent of the almost
80,000 incidents reported . As far as financial impact
is concerned, 80 percent of incidents result in less than
USD 1 million in total cost and indemnity, 15 percent in losses
between USD 1 million and USD 20 million, and five percent
in losses over USD 20 million . Identification, quantification,
mitigation, incident response plans and risk transfer are some
of the key issues in macro-level enterprise risk management .
While a cyber attack often causes disruption to business and IT
operations, catastrophic cyber losses can also result in potential
director’s and officer’s liability allegations . In the wake of
numerous publicly reported material incidents in 2015, cyber
insurance gross written premium is forecast to grow at the
same time insurance carriers are limiting capacity, coverage and
raising premiums for certain industry classes, such as large retail,
healthcare and financial institutions .
In the face of more frequent contractual insurance requirements
for cyber liability and potential shareholder derivative actions,
forward-thinking companies are taking proactive steps to
explore and transfer cyber risks . Underwriting and purchasing
of cyber insurance process can assist to:
• Satisfy customer and partner cyber insurance
contract requirements
• Stabilize balance sheet
• Address regulatory (including SEC) guidelines
• Reduce Total Cost of Risk
• Enable organization-wide cyber risk management culture
• Align cyber insurance solution with Enterprise
Risk Management
Finally, despite the growth of cyber insurance sales,
initial insurance carrier denials of 2015 cyber insurance
claims re-emphasize the critical importance of negotiated
customized coverage – the devil is in the details .
Risk Financing
24 Technology and Communications Industry Report
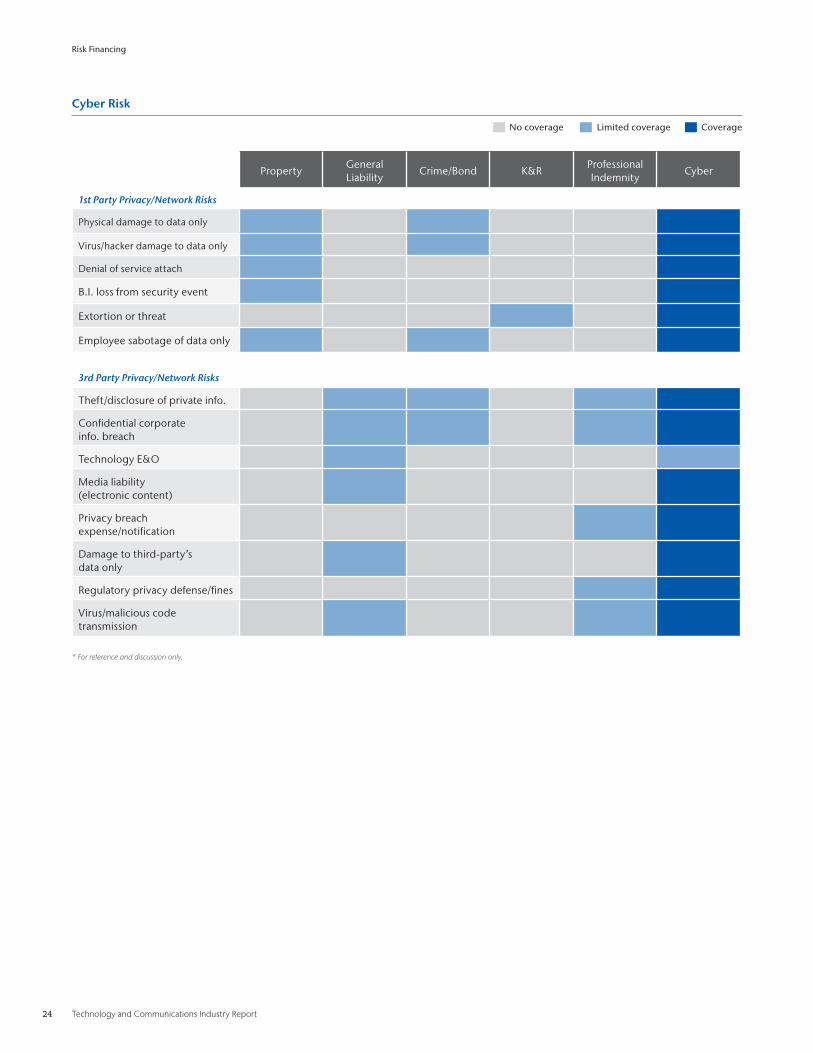
Cyber Risk
PropertyGeneral Liability
Crime/Bond K&RProfessional Indemnity
Cyber
1st Party Privacy/Network Risks
Physical damage to data only
Virus/hacker damage to data only
Denial of service attach
B .I . loss from security event
Extortion or threat
Employee sabotage of data only
3rd Party Privacy/Network Risks
Theft/disclosure of private info .
Confidential corporate info . breach
Technology E&O
Media liability (electronic content)
Privacy breach expense/notification
Damage to third-party’s data only
Regulatory privacy defense/fines
Virus/malicious code transmission
Limited coverage CoverageNo coverage
* For reference and discussion only.
Risk Financing
Aon Risk Solutions 25
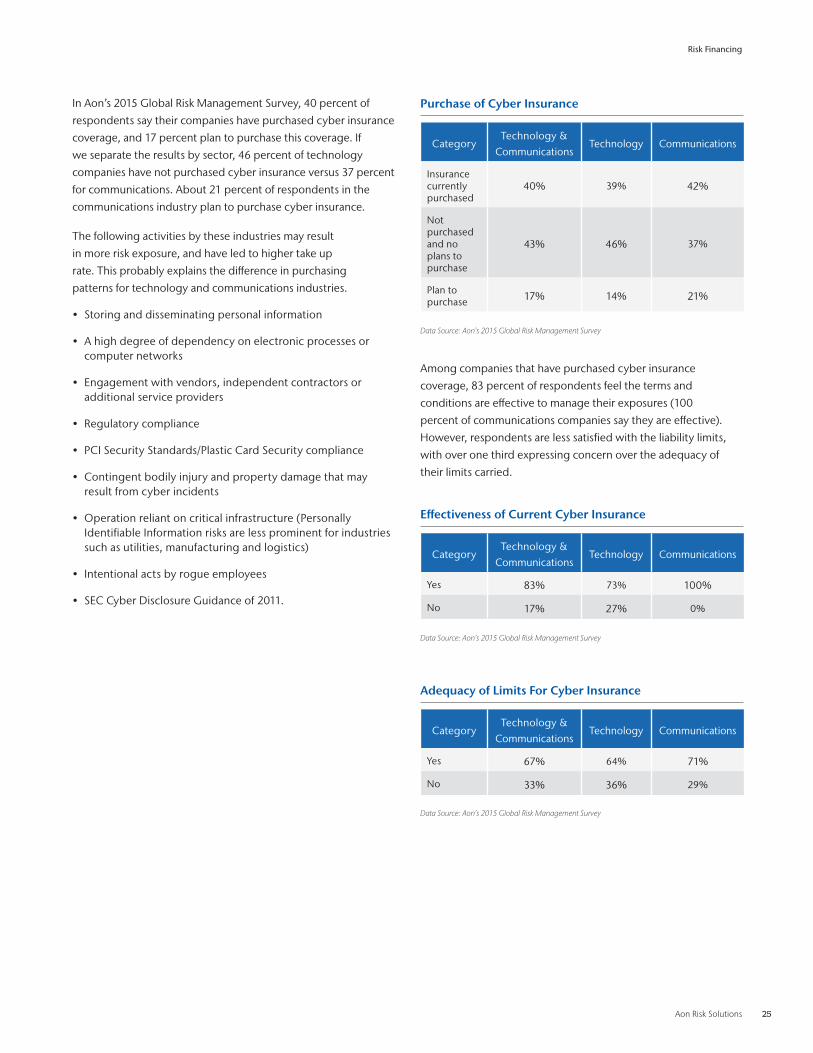
In Aon’s 2015 Global Risk Management Survey, 40 percent of
respondents say their companies have purchased cyber insurance
coverage, and 17 percent plan to purchase this coverage . If
we separate the results by sector, 46 percent of technology
companies have not purchased cyber insurance versus 37 percent
for communications . About 21 percent of respondents in the
communications industry plan to purchase cyber insurance .
The following activities by these industries may result
in more risk exposure, and have led to higher take up
rate . This probably explains the difference in purchasing
patterns for technology and communications industries .
• Storing and disseminating personal information
• A high degree of dependency on electronic processes or computer networks
• Engagement with vendors, independent contractors or additional service providers
• Regulatory compliance
• PCI Security Standards/Plastic Card Security compliance
• Contingent bodily injury and property damage that may result from cyber incidents
• Operation reliant on critical infrastructure (Personally Identifiable Information risks are less prominent for industries such as utilities, manufacturing and logistics)
• Intentional acts by rogue employees
• SEC Cyber Disclosure Guidance of 2011 .
Among companies that have purchased cyber insurance
coverage, 83 percent of respondents feel the terms and
conditions are effective to manage their exposures (100
percent of communications companies say they are effective) .
However, respondents are less satisfied with the liability limits,
with over one third expressing concern over the adequacy of
their limits carried .
Purchase of Cyber Insurance
CategoryTechnology &
CommunicationsTechnology Communications
Insurance currently purchased
40% 39% 42%
Not purchased and no plans to purchase
43% 46% 37%
Plan to purchase 17% 14% 21%
Data Source: Aon’s 2015 Global Risk Management Survey
Effectiveness of Current Cyber Insurance
CategoryTechnology &
CommunicationsTechnology Communications
Yes 83% 73% 100%
No 17% 27% 0%
Data Source: Aon’s 2015 Global Risk Management Survey
Adequacy of Limits For Cyber Insurance
CategoryTechnology &
CommunicationsTechnology Communications
Yes 67% 64% 71%
No 33% 36% 29%
Data Source: Aon’s 2015 Global Risk Management Survey
Risk Financing

26 Technology and Communications Industry Report
Multinational Programs
Aon Risk Solutions 27
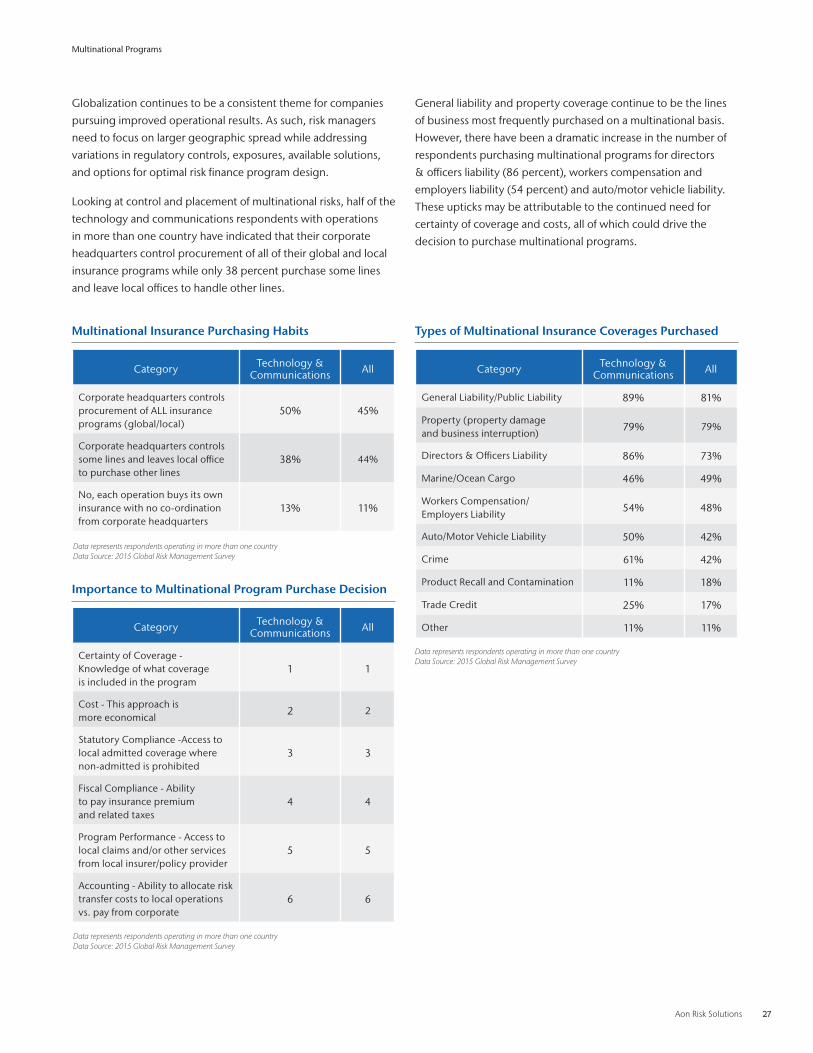
Globalization continues to be a consistent theme for companies
pursuing improved operational results . As such, risk managers
need to focus on larger geographic spread while addressing
variations in regulatory controls, exposures, available solutions,
and options for optimal risk finance program design .
Looking at control and placement of multinational risks, half of the
technology and communications respondents with operations
in more than one country have indicated that their corporate
headquarters control procurement of all of their global and local
insurance programs while only 38 percent purchase some lines
and leave local offices to handle other lines .
General liability and property coverage continue to be the lines
of business most frequently purchased on a multinational basis .
However, there have been a dramatic increase in the number of
respondents purchasing multinational programs for directors
& officers liability (86 percent), workers compensation and
employers liability (54 percent) and auto/motor vehicle liability .
These upticks may be attributable to the continued need for
certainty of coverage and costs, all of which could drive the
decision to purchase multinational programs .
Multinational Insurance Purchasing Habits
Category Technology & Communications All
Corporate headquarters controls procurement of ALL insurance programs (global/local)
50% 45%
Corporate headquarters controls some lines and leaves local office to purchase other lines
38% 44%
No, each operation buys its own insurance with no co-ordination from corporate headquarters
13% 11%
Importance to Multinational Program Purchase Decision
Category Technology & Communications All
Certainty of Coverage - Knowledge of what coverage is included in the program
1 1
Cost - This approach is more economical
2 2
Statutory Compliance -Access to local admitted coverage where non-admitted is prohibited
3 3
Fiscal Compliance - Ability to pay insurance premium and related taxes
4 4
Program Performance - Access to local claims and/or other services from local insurer/policy provider
5 5
Accounting - Ability to allocate risk transfer costs to local operations vs . pay from corporate
6 6
Types of Multinational Insurance Coverages Purchased
Category Technology & Communications All
General Liability/Public Liability 89% 81%
Property (property damage and business interruption)
79% 79%
Directors & Officers Liability 86% 73%
Marine/Ocean Cargo 46% 49%
Workers Compensation/ Employers Liability
54% 48%
Auto/Motor Vehicle Liability 50% 42%
Crime 61% 42%
Product Recall and Contamination 11% 18%
Trade Credit 25% 17%
Other 11% 11%
Data represents respondents operating in more than one countryData Source: 2015 Global Risk Management Survey
Data represents respondents operating in more than one countryData Source: 2015 Global Risk Management Survey
Data represents respondents operating in more than one countryData Source: 2015 Global Risk Management Survey
Multinational Programs

28 Technology and Communications Industry Report
Captives
Aon Risk Solutions 29
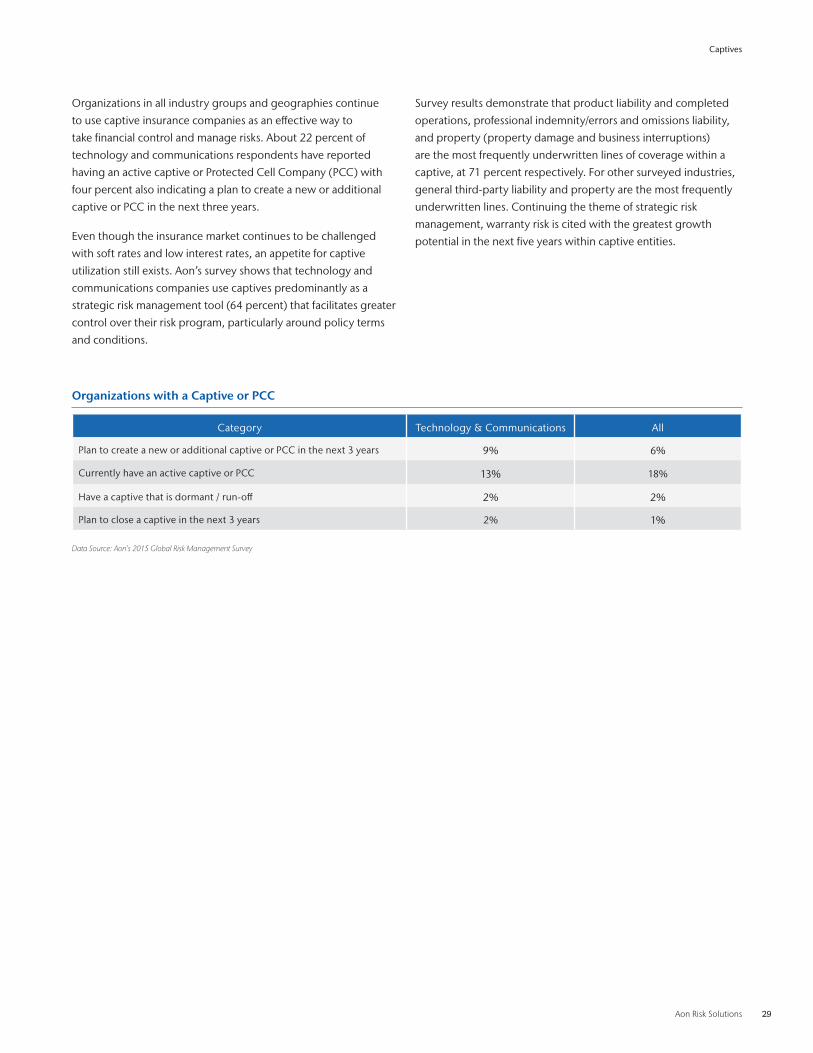
Organizations in all industry groups and geographies continue
to use captive insurance companies as an effective way to
take financial control and manage risks . About 22 percent of
technology and communications respondents have reported
having an active captive or Protected Cell Company (PCC) with
four percent also indicating a plan to create a new or additional
captive or PCC in the next three years .
Even though the insurance market continues to be challenged
with soft rates and low interest rates, an appetite for captive
utilization still exists . Aon’s survey shows that technology and
communications companies use captives predominantly as a
strategic risk management tool (64 percent) that facilitates greater
control over their risk program, particularly around policy terms
and conditions .
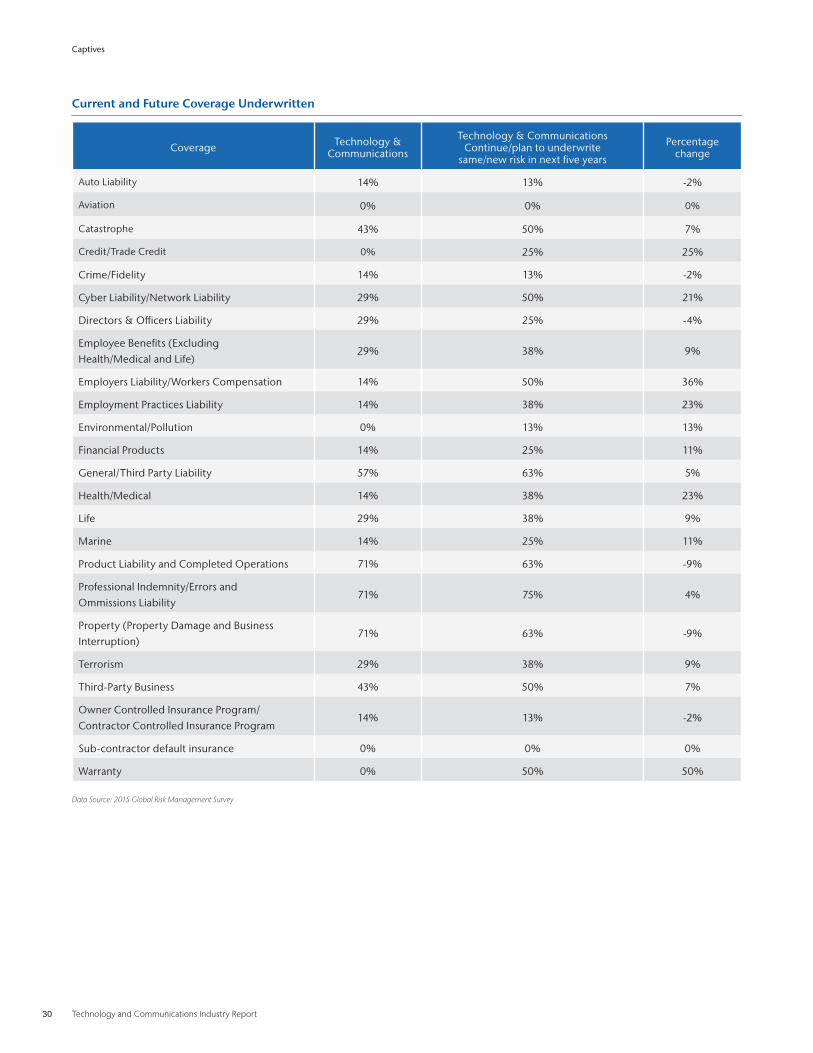
Survey results demonstrate that product liability and completed
operations, professional indemnity/errors and omissions liability,
and property (property damage and business interruptions)
are the most frequently underwritten lines of coverage within a
captive, at 71 percent respectively . For other surveyed industries,
general third-party liability and property are the most frequently
underwritten lines . Continuing the theme of strategic risk
management, warranty risk is cited with the greatest growth
potential in the next five years within captive entities .
Organizations with a Captive or PCC
Category Technology & Communications All
Plan to create a new or additional captive or PCC in the next 3 years 9% 6%
Currently have an active captive or PCC 13% 18%
Have a captive that is dormant / run-off 2% 2%
Plan to close a captive in the next 3 years 2% 1%
Data Source: Aon’s 2015 Global Risk Management Survey
Captives
30 Technology and Communications Industry Report
Current and Future Coverage Underwritten
Coverage Technology & Communications
Technology & Communications Continue/plan to underwrite
same/new risk in next five years
Percentage change
Auto Liability 14% 13% -2%
Aviation 0% 0% 0%
Catastrophe 43% 50% 7%
Credit/Trade Credit 0% 25% 25%
Crime/Fidelity 14% 13% -2%
Cyber Liability/Network Liability 29% 50% 21%
Directors & Officers Liability 29% 25% -4%
Employee Benefits (Excluding Health/Medical and Life)
29% 38% 9%
Employers Liability/Workers Compensation 14% 50% 36%
Employment Practices Liability 14% 38% 23%
Environmental/Pollution 0% 13% 13%
Financial Products 14% 25% 11%
General/Third Party Liability 57% 63% 5%
Health/Medical 14% 38% 23%
Life 29% 38% 9%
Marine 14% 25% 11%
Product Liability and Completed Operations 71% 63% -9%
Professional Indemnity/Errors and Ommissions Liability
71% 75% 4%
Property (Property Damage and Business Interruption)
71% 63% -9%
Terrorism 29% 38% 9%
Third-Party Business 43% 50% 7%
Owner Controlled Insurance Program/Contractor Controlled Insurance Program
14% 13% -2%
Sub-contractor default insurance 0% 0% 0%
Warranty 0% 50% 50%
Data Source: 2015 Global Risk Management Survey
Captives

Aon Risk Solutions 31
Market Insights
32 Technology and Communications Industry Report
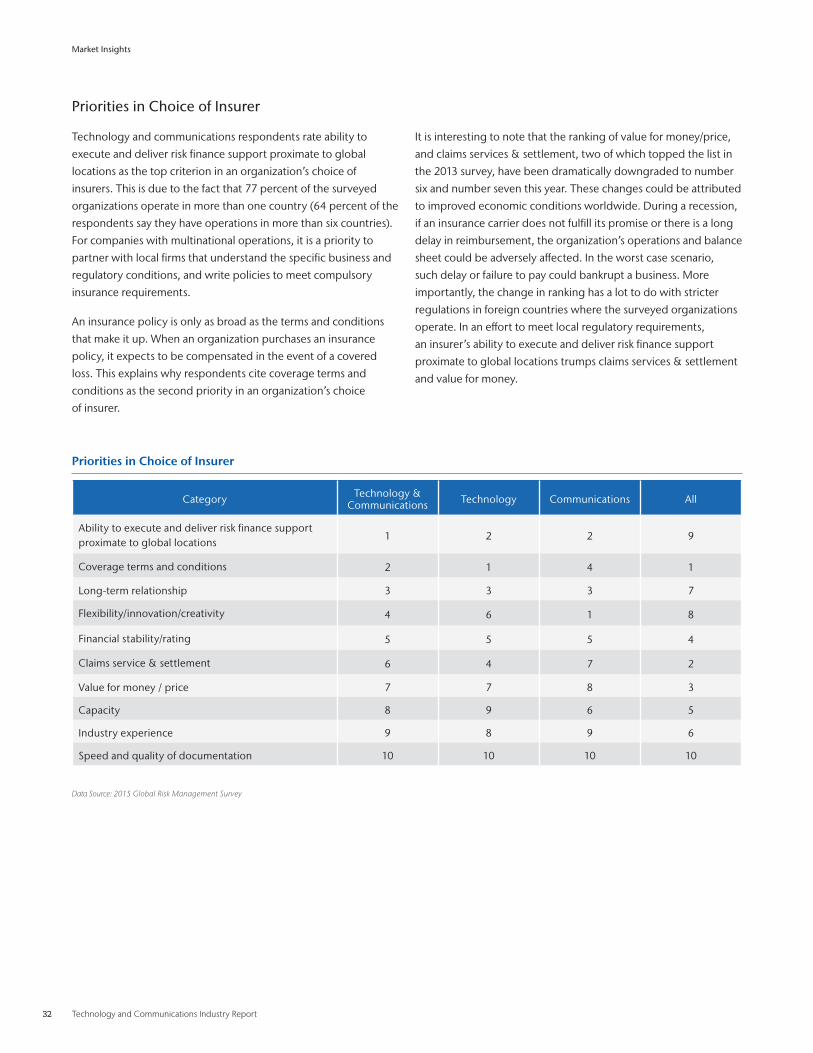
Priorities in Choice of Insurer
Technology and communications respondents rate ability to
execute and deliver risk finance support proximate to global
locations as the top criterion in an organization’s choice of
insurers . This is due to the fact that 77 percent of the surveyed
organizations operate in more than one country (64 percent of the
respondents say they have operations in more than six countries) .
For companies with multinational operations, it is a priority to
partner with local firms that understand the specific business and
regulatory conditions, and write policies to meet compulsory
insurance requirements .
An insurance policy is only as broad as the terms and conditions
that make it up . When an organization purchases an insurance
policy, it expects to be compensated in the event of a covered
loss . This explains why respondents cite coverage terms and
conditions as the second priority in an organization’s choice
of insurer .
It is interesting to note that the ranking of value for money/price,
and claims services & settlement, two of which topped the list in
the 2013 survey, have been dramatically downgraded to number
six and number seven this year . These changes could be attributed
to improved economic conditions worldwide . During a recession,
if an insurance carrier does not fulfill its promise or there is a long
delay in reimbursement, the organization’s operations and balance
sheet could be adversely affected . In the worst case scenario,
such delay or failure to pay could bankrupt a business . More
importantly, the change in ranking has a lot to do with stricter
regulations in foreign countries where the surveyed organizations
operate . In an effort to meet local regulatory requirements,
an insurer’s ability to execute and deliver risk finance support
proximate to global locations trumps claims services & settlement
and value for money .
Priorities in Choice of Insurer
Category Technology & Communications Technology Communications All
Ability to execute and deliver risk finance support proximate to global locations
1 2 2 9
Coverage terms and conditions 2 1 4 1
Long-term relationship 3 3 3 7
Flexibility/innovation/creativity 4 6 1 8
Financial stability/rating 5 5 5 4
Claims service & settlement 6 4 7 2
Value for money / price 7 7 8 3
Capacity 8 9 6 5
Industry experience 9 8 9 6
Speed and quality of documentation 10 10 10 10
Data Source: 2015 Global Risk Management Survey
Market Insights
Aon Risk Solutions 33
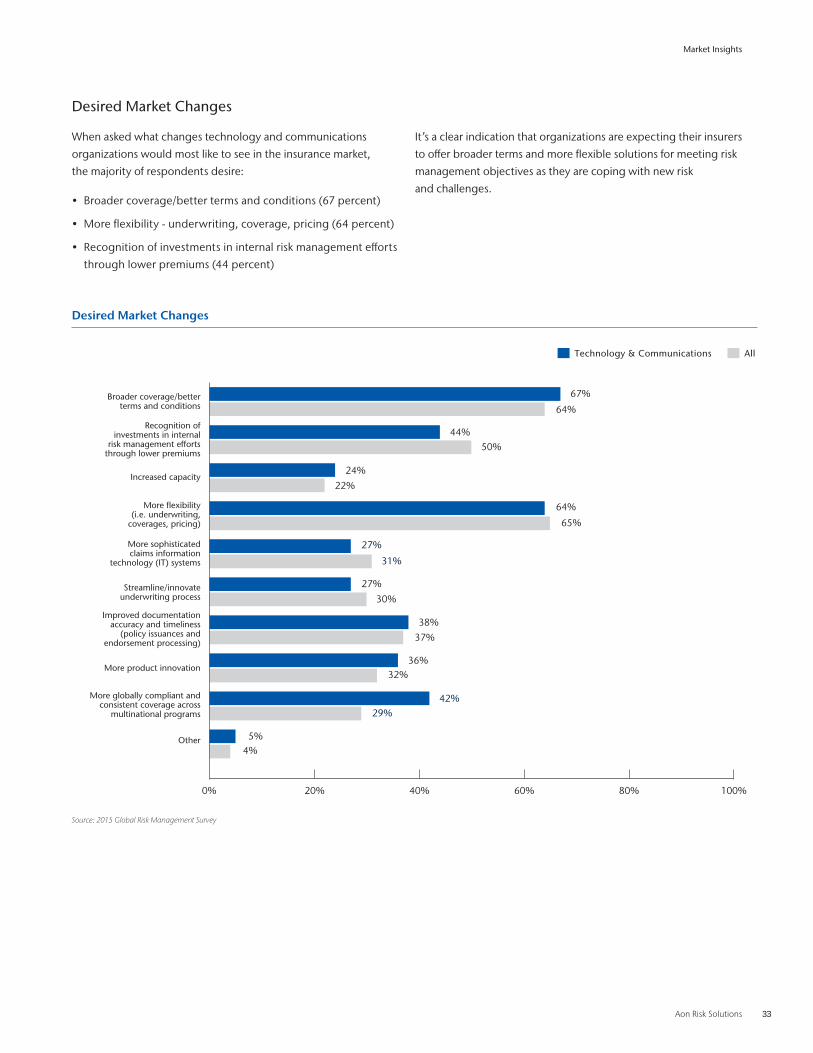
Desired Market Changes
When asked what changes technology and communications
organizations would most like to see in the insurance market,
the majority of respondents desire:
• Broader coverage/better terms and conditions (67 percent)
• More flexibility - underwriting, coverage, pricing (64 percent)
• Recognition of investments in internal risk management efforts
through lower premiums (44 percent)
It’s a clear indication that organizations are expecting their insurers
to offer broader terms and more flexible solutions for meeting risk
management objectives as they are coping with new risk
and challenges .
Desired Market Changes
Other
More globally compliant andconsistent coverage across
multinational programs
More product innovation
Improved documentationaccuracy and timeliness
(policy issuances andendorsement processing)
Streamline/innovateunderwriting process
More sophisticatedclaims information
technology (IT) systems
More flexibility(i.e. underwriting,
coverages, pricing)
Increased capacity
Recognition ofinvestments in internal
risk management effortsthrough lower premiums
Broader coverage/betterterms and conditions
Technology & Communications All
64%
67%
44%50%
27%
30%
65%
64%
32%36%
42%29%
22%24%
31%
27%
37%38%
4%5%
0% 20% 40% 60% 80% 100%
Market Insights
Source: 2015 Global Risk Management Survey
34 Technology and Communications Industry Report
Casualty/Liability Automobile Workers Compensation Financial Lines Property
Ace Ace Ace AIG Ace
AIG AIG AIG Beazley AIG
Alleghany Liberty Mutual CV Starr Chubb Berkshire Hathaway
Swiss Re MS & AD Travelers XL FM Global
Travelers Travelers Zurich Zurich Zurich
* For a Property/Casualty Package AIG, Ace, Chubb and Zurich are the top marketData Source: Global Risk Insight Platform
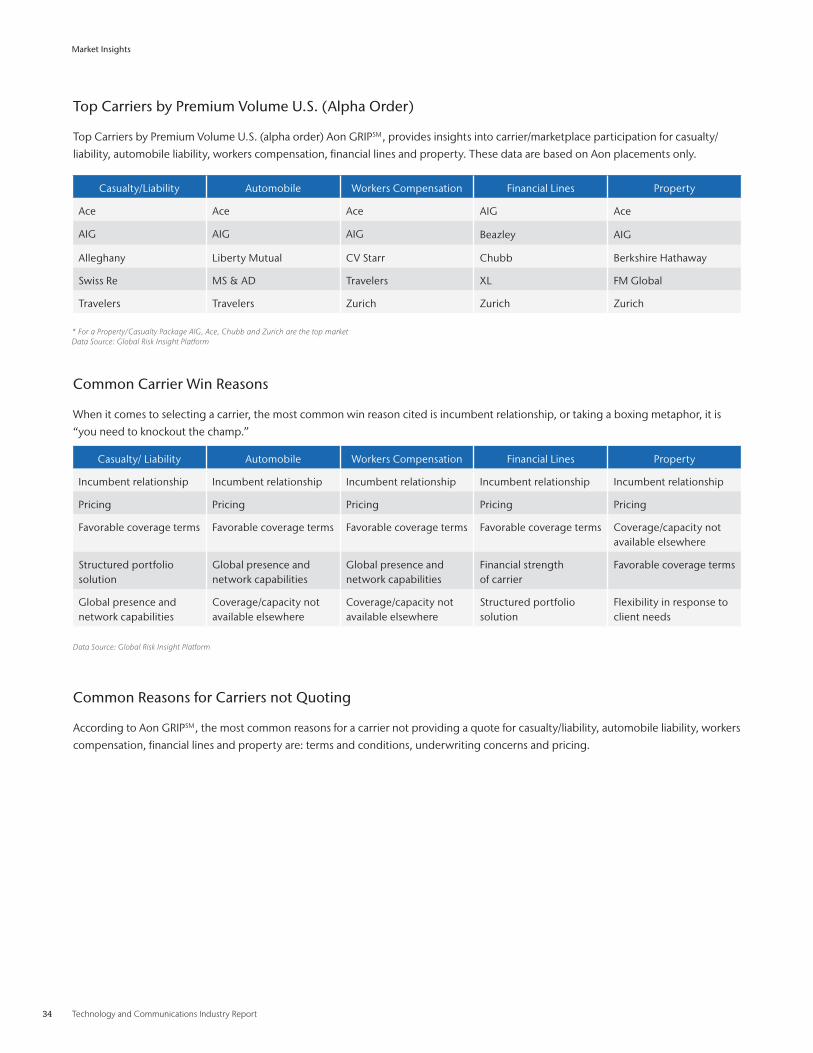
Top Carriers by Premium Volume U .S . (Alpha Order)
Top Carriers by Premium Volume U .S . (alpha order) Aon GRIPSM , provides insights into carrier/marketplace participation for casualty/
liability, automobile liability, workers compensation, financial lines and property . These data are based on Aon placements only .
Casualty/ Liability Automobile Workers Compensation Financial Lines Property
Incumbent relationship Incumbent relationship Incumbent relationship Incumbent relationship Incumbent relationship
Pricing Pricing Pricing Pricing Pricing
Favorable coverage terms Favorable coverage terms Favorable coverage terms Favorable coverage terms Coverage/capacity not available elsewhere
Structured portfolio solution
Global presence and network capabilities
Global presence and network capabilities
Financial strength of carrier
Favorable coverage terms
Global presence and network capabilities
Coverage/capacity not available elsewhere
Coverage/capacity not available elsewhere
Structured portfolio solution
Flexibility in response to client needs
Data Source: Global Risk Insight Platform
Common Carrier Win Reasons
When it comes to selecting a carrier, the most common win reason cited is incumbent relationship, or taking a boxing metaphor, it is
“you need to knockout the champ .”
Common Reasons for Carriers not Quoting
According to Aon GRIPSM , the most common reasons for a carrier not providing a quote for casualty/liability, automobile liability, workers
compensation, financial lines and property are: terms and conditions, underwriting concerns and pricing .
Market Insights
Aon Risk Solutions 35
Casualty/ Liability Automobile Workers Compensation Financial Lines Property
Inferior pricing Inferior pricing Inferior pricing Inferior pricing Inferior pricing
Incumbent offer accepted
Incumbent offer accepted
Incumbent offer accepted
Incumbent offer accepted
Inferior terms & conditions
Inferior terms & conditions
Perceived weakness Perceived weakness Inferior terms & conditions
Incumbent offer accepted
Perceived weakness Inferior terms & conditions
Inferior terms & conditions
Claims paying reputation
Data Source: Global Risk Insight Platform
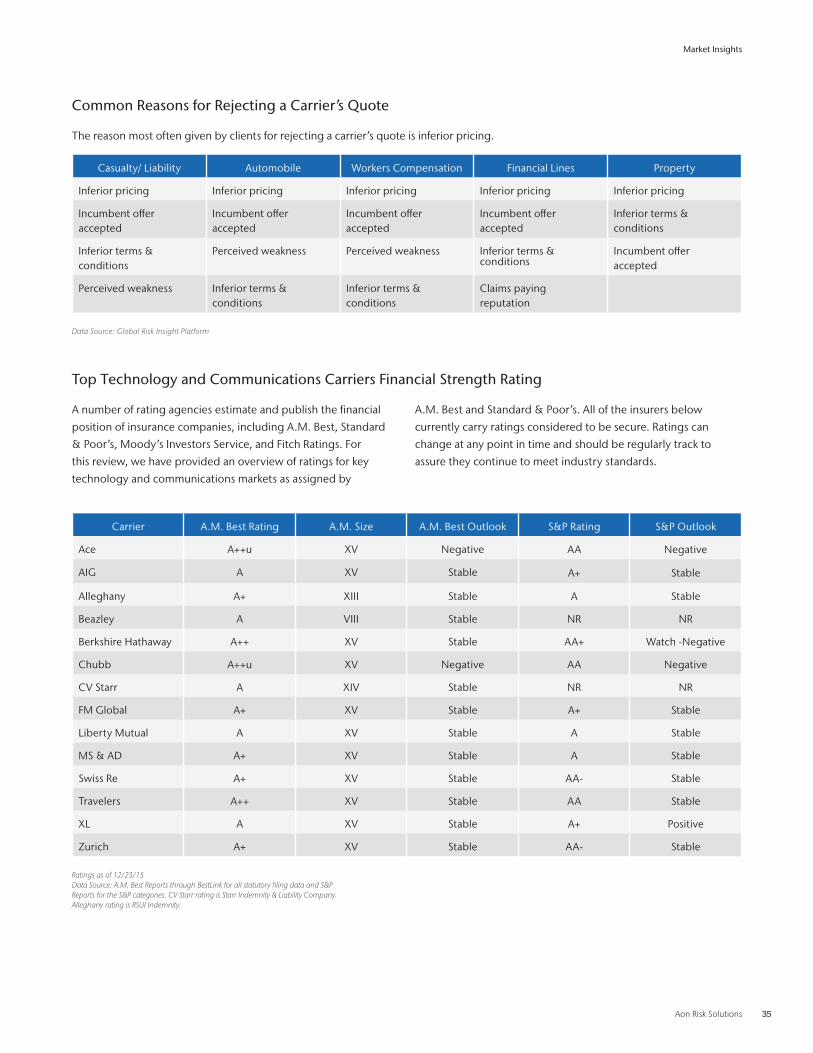
Common Reasons for Rejecting a Carrier’s Quote
The reason most often given by clients for rejecting a carrier’s quote is inferior pricing .
Top Technology and Communications Carriers Financial Strength Rating
A number of rating agencies estimate and publish the financial
position of insurance companies, including A .M . Best, Standard
& Poor’s, Moody’s Investors Service, and Fitch Ratings . For
this review, we have provided an overview of ratings for key
technology and communications markets as assigned by
A .M . Best and Standard & Poor’s . All of the insurers below
currently carry ratings considered to be secure . Ratings can
change at any point in time and should be regularly track to
assure they continue to meet industry standards .
Carrier A .M . Best Rating A .M . Size A .M . Best Outlook S&P Rating S&P Outlook
Ace A++u XV Negative AA Negative
AIG A XV Stable A+ Stable
Alleghany A+ XIII Stable A Stable
Beazley A VIII Stable NR NR
Berkshire Hathaway A++ XV Stable AA+ Watch -Negative
Chubb A++u XV Negative AA Negative
CV Starr A XIV Stable NR NR
FM Global A+ XV Stable A+ Stable
Liberty Mutual A XV Stable A Stable
MS & AD A+ XV Stable A Stable
Swiss Re A+ XV Stable AA- Stable
Travelers A++ XV Stable AA Stable
XL A XV Stable A+ Positive
Zurich A+ XV Stable AA- Stable
Ratings as of 12/23/15Data Source: A.M. Best Reports through BestLink for all statutory filing data and S&P Reports for the S&P categories. CV Starr rating is Starr Indemnity & Liability Company. Alleghany rating is RSUI Indemnity.
Market Insights

36 Technology and Communications Industry Report
Financial Insights
Aon Risk Solutions 37
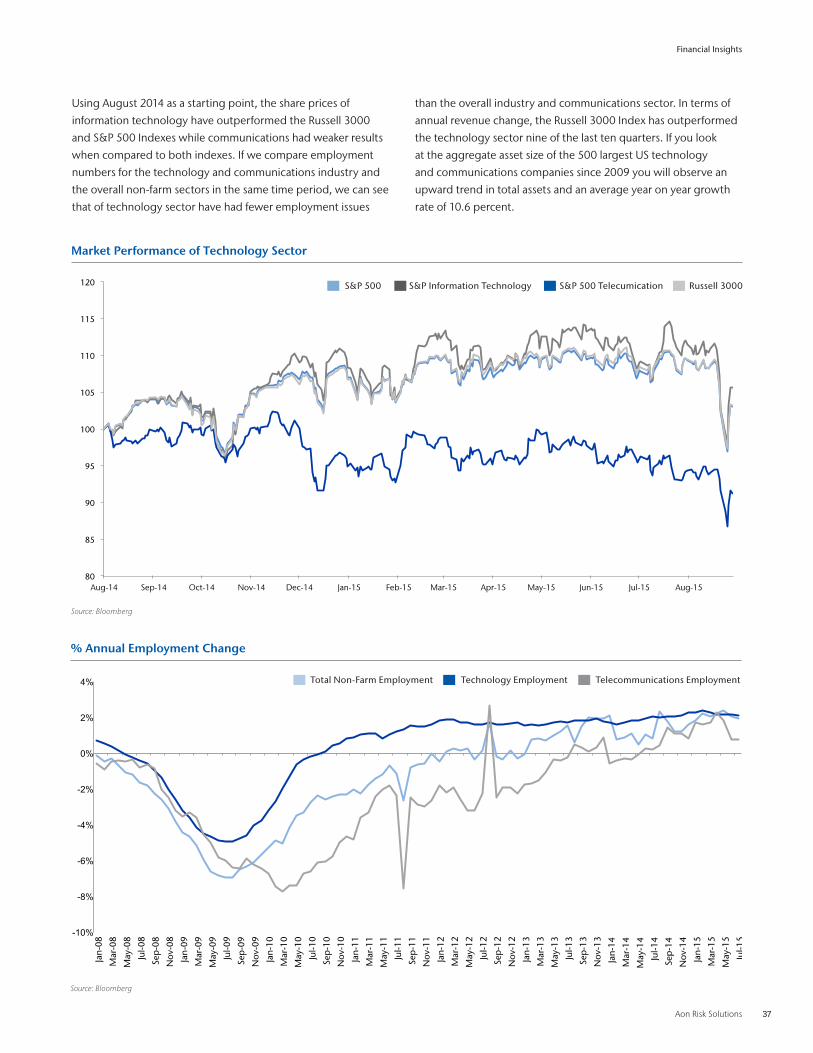
Using August 2014 as a starting point, the share prices of
information technology have outperformed the Russell 3000
and S&P 500 Indexes while communications had weaker results
when compared to both indexes . If we compare employment
numbers for the technology and communications industry and
the overall non-farm sectors in the same time period, we can see
that of technology sector have had fewer employment issues
than the overall industry and communications sector . In terms of
annual revenue change, the Russell 3000 Index has outperformed
the technology sector nine of the last ten quarters . If you look
at the aggregate asset size of the 500 largest US technology
and communications companies since 2009 you will observe an
upward trend in total assets and an average year on year growth
rate of 10 .6 percent .
Market Performance of Technology Sector
Source: Bloomberg
80
85
90
95
100
105
110
115
120
Aug-14 Sep-14 Oct-14 Nov-14 Dec-14 Jan-15 Feb-15 Mar-15 Apr-15 May-15 Jun-15 Jul-15 Aug-15
Market Performance of Technology Sector
S&P 500 S&P 500 Informa.on Technology S&P 500 Telecommunica.on Services Russell 3000
Source: Bloomberg
S&P 500 S&P Information Technology S&P 500 Telecumication Russell 3000
Financial Insights
% Annual Employment Change
Source: Bloomberg
-10%
-8%
-6%
-4%
-2%
0%
2%
4%
Jan-
08
Mar
-08
May
-08
Jul-0
8
Sep
-08
Nov
-08
Jan-
09
Mar
-09
May
-09
Jul-0
9
Sep
-09
Nov
-09
Jan-
10
Mar
-10
May
-10
Jul-1
0
Sep
-10
Nov
-10
Jan-
11
Mar
-11
May
-11
Jul-1
1
Sep
-11
Nov
-11
Jan-
12
Mar
-12
May
-12
Jul-1
2
Sep
-12
Nov
-12
Jan-
13
Mar
-13
May
-13
Jul-1
3
Sep
-13
Nov
-13
Jan-
14
Mar
-14
May
-14
Jul-1
4
Sep
-14
Nov
-14
Jan-
15
Mar
-15
May
-15
Jul-1
5
% Annual Employment Change
Total Non-Farm Employment Technology Employment Telecommunications Employment
Source: Bloomberg
Total Non-Farm Employment Technology Employment Telecommunications Employment
38 Technology and Communications Industry Report
Annual % Revenue Growth
-2%
0%
2%
4%
6%
8%
10%
12%
Q1'13
Q2'13
Q3'13
Q4'13
Q1'14
Q2'14
Q3'14
Q4'14
Q1'15
Q2'15
Annual % Revenue Growth
Russell 3000 500 Largest US Tech Companies by Market Cap
Source: Bloomberg Total Assets (BN USD) - 500 Largest US Technology & Communications Companies
Total Assets YoY Growth
Tota
l Ass
ets
(USD
Bill
ion
s)YoY
% G
row
th
0
500
1000
1500
2000
2500
3000
0
4%
2009 2010 2011 2012 2013 2014
6%
8%
10%
12%
14%
Financial Insights
Russell 3000 500 Largest US Tech Companies by Market Cap
Source: Bloomberg
Source: Bloomberg
Aon Risk Solutions 39
ContactsTechnology and CommunicationsEric BoyumNational Practice Leader – Technology PracticeAon Risk Solutionseric .boyum@aon .com 1 .303 .639 .4120
Aon InpointGeorge M. Zsolnay IVAnalytics ManagerAon Client and Business Analyticsgeorge .zsolnay@aon .com1 .312 .381 .3955
For Media and Press InquiresCybil RoseKemper Lesnickcybil .rose@kemperlesnick .com1 .312 .755 .3537
About Aon Aon plc (NYSE:AON) is a leading global provider of risk management, insurance brokerage and reinsurance brokerage, and human resources solutions and outsourcing services. Through its more than 72,000 colleagues worldwide, Aon unites to empower results for clients in over 120 countries via innovative risk and people solutions. For further information on our capabilities and to learn how we empower results for clients, please visit: http://aon.mediaroom.com.
© Aon plc 2016. All rights reserved.The information contained herein and the statements expressed are of a general nature and are not intended to address the circumstances of any particular individual or entity. Although we endeavor to provide accurate and timely information and use sources we consider reliable, there can be no guarantee that such information is accurate as of the date it is received or that it will continue to be accurate in the future. No one should act on such information without appropriate profes-sional advice after a thorough examination of the particular situation.
www.aon.com
Risk. Reinsurance. Human Resources.