2016 student textbook and course materials survey20150723_task force to study best...office of...
TRANSCRIPT
Office of Distance Learning & Student Services
July 15, 2016
2016 Student Textbookand Course Materials Survey
Results and Findings
DRAFT
Florida Virtual Campus | Distance Learning & Student Services | www.dlss.flvc.org 2DRAFT
2016 Student Textbook and Course Materials Survey 3
Appendix A: Research Questions 17
Research Questions 33
Appendix B: Survey Data 36
Resources 41
Table of Contents
Florida Virtual Campus | Distance Learning & Student Services | www.dlss.flvc.org 3DRAFT
In 2016, more than 22,000 students participated in a Student Textbook and Course Materials Survey conducted by the Florida Virtual Campus’ Office of Distance Learning and Student Services. The survey examined textbook affordability and acquisition in Florida’s higher education institutions. Previous iterations of this survey were conducted in 2010 and again in 2012. Students were asked to use recent personal experiences to provide insight on how the cost of instructional materials and textbooks impact their education, purchasing behaviors, academic completion and success, the study aids they find to be most beneficial to their learning, and their use of financial aid to address these costs.
Most recently, in 2016, the Office of Distance Learning and Student Services within the statewide Florida Virtual Campus conducted a Student Textbook and Course Materials Survey with more than 22,000 students of Florida’s public colleges and universities. The purpose of the 2016 Student Course Materials Survey was to identify:
1. The amount of money that Florida students spent on textbooks during the spring 2016 semester
2. The frequency with which students buy textbooks that are not used
3. How students are affected by the cost of textbooks
4. Which study aids students perceive to be the most beneficial to their learning
5. Identify any changes over time in student responses from previous iterations of the survey
The results of that survey are sobering as the findings suggest the high cost of textbook and instructional materials are forcing many Florida higher education students to make decisions that compromise their academic success.
This report is intended to assist the Florida Legislature and higher education institutions in better understanding the significant impact that high textbook and instructional material costs have on our state’s college and university students, and to support the development of recommendations, best practices, and legislative change that results in an effective, statewide approach to textbook and materials affordability.
Executive Summary
Florida Virtual Campus | Distance Learning & Student Services | www.dlss.flvc.org 4DRAFT
The research questions addressed were as follows:
Question 1: How much do students spend on textbooks and other instructional materials?
Question 2: How many times do students buy textbooks that are not used?
Question 3: How are students affected by the cost of textbooks?
Question 4: What digital study aids do students perceive to be most beneficial to their grades?
Question 5: Compared to the results of the 2012 Student Textbook Survey, what are the differences on the money spent on textbooks?
Question 6: Compared to the results of the 2012 Student Textbook Survey, what are the differences on factors affected by cost of textbooks?
Question 7: Comparing university students and college students, what are the differences on the money spent on textbook, money spent on instructional materials, costs covered by financial aid, and the number of textbooks purchased but never used.
Question 8: What are the differences on the money spent on textbooks for students in different degree level?
Florida Virtual Campus | Distance Learning & Student Services | www.dlss.flvc.org 5DRAFT
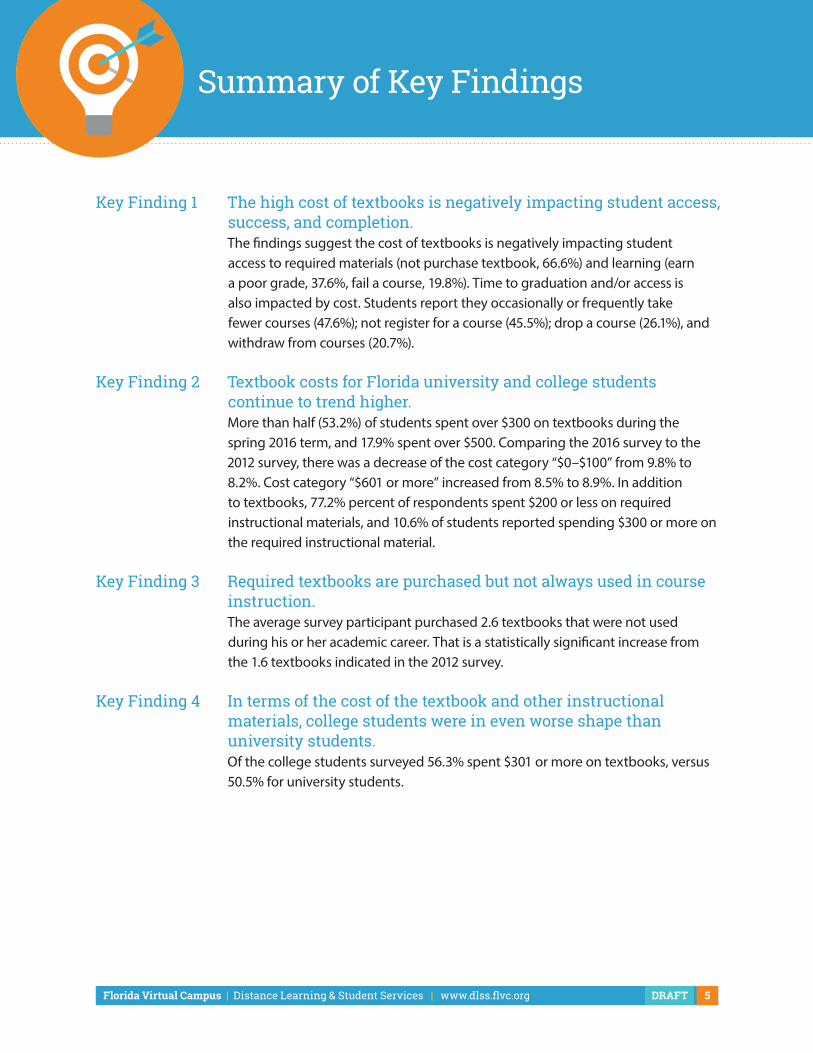
Summary of Key Findings
Key Finding 1 The high cost of textbooks is negatively impacting student access, success, and completion.
The findings suggest the cost of textbooks is negatively impacting student access to required materials (not purchase textbook, 66.6%) and learning (earn a poor grade, 37.6%, fail a course, 19.8%). Time to graduation and/or access is also impacted by cost. Students report they occasionally or frequently take fewer courses (47.6%); not register for a course (45.5%); drop a course (26.1%), and withdraw from courses (20.7%).
Key Finding 2 Textbook costs for Florida university and college students continue to trend higher.
More than half (53.2%) of students spent over $300 on textbooks during the spring 2016 term, and 17.9% spent over $500. Comparing the 2016 survey to the 2012 survey, there was a decrease of the cost category “$0–$100” from 9.8% to 8.2%. Cost category “$601 or more” increased from 8.5% to 8.9%. In addition to textbooks, 77.2% percent of respondents spent $200 or less on required instructional materials, and 10.6% of students reported spending $300 or more on the required instructional material.
Key Finding 3 Required textbooks are purchased but not always used in course instruction.
The average survey participant purchased 2.6 textbooks that were not used during his or her academic career. That is a statistically significant increase from the 1.6 textbooks indicated in the 2012 survey.
Key Finding 4 In terms of the cost of the textbook and other instructional materials, college students were in even worse shape than university students.
Of the college students surveyed 56.3% spent $301 or more on textbooks, versus 50.5% for university students.
Florida Virtual Campus | Distance Learning & Student Services | www.dlss.flvc.org 6DRAFT
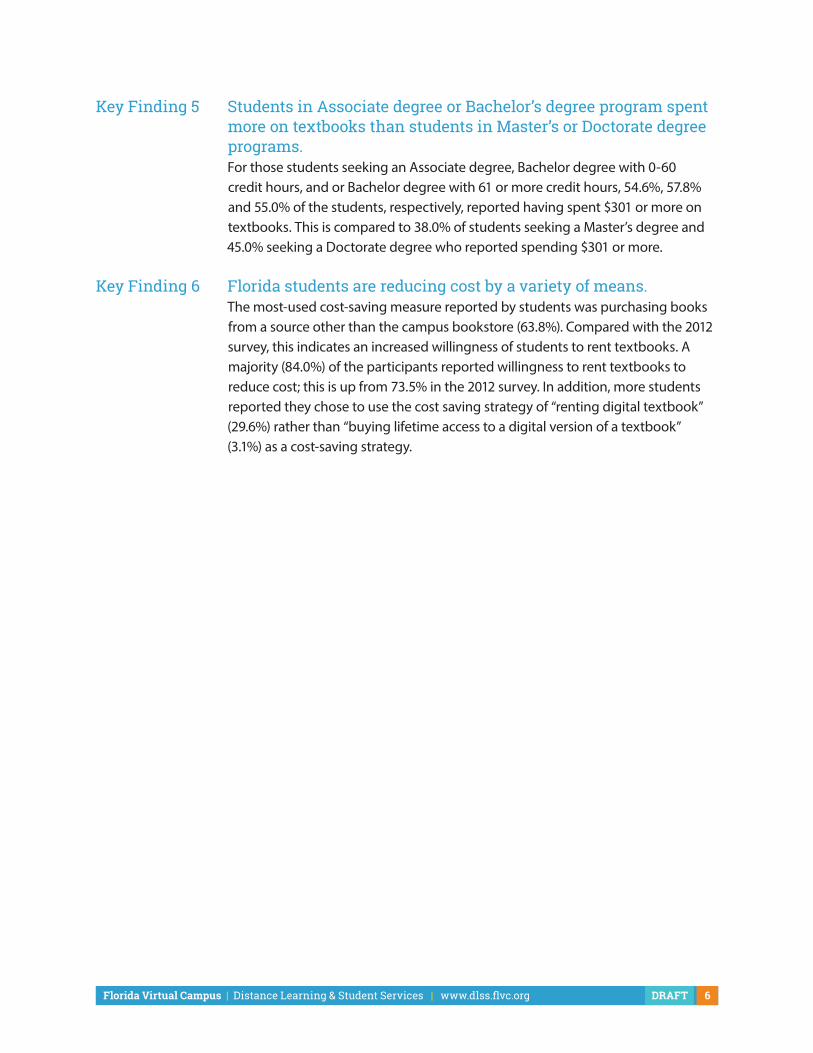
Key Finding 5 Students in Associate degree or Bachelor’s degree program spent more on textbooks than students in Master’s or Doctorate degree programs.
For those students seeking an Associate degree, Bachelor degree with 0-60 credit hours, and or Bachelor degree with 61 or more credit hours, 54.6%, 57.8% and 55.0% of the students, respectively, reported having spent $301 or more on textbooks. This is compared to 38.0% of students seeking a Master’s degree and 45.0% seeking a Doctorate degree who reported spending $301 or more.
Key Finding 6 Florida students are reducing cost by a variety of means. The most-used cost-saving measure reported by students was purchasing books
from a source other than the campus bookstore (63.8%). Compared with the 2012 survey, this indicates an increased willingness of students to rent textbooks. A majority (84.0%) of the participants reported willingness to rent textbooks to reduce cost; this is up from 73.5% in the 2012 survey. In addition, more students reported they chose to use the cost saving strategy of “renting digital textbook” (29.6%) rather than “buying lifetime access to a digital version of a textbook” (3.1%) as a cost-saving strategy.
Florida Virtual Campus | Distance Learning & Student Services | www.dlss.flvc.org 7DRAFT
Introduction
The financial burden that students must bear for textbooks and instructional materials, and its impact on students’ academic choices and their success, is a mounting concern for Florida’s higher education community.
In response to a legislative charge (Section (s.) 1004.091(2)), Florida Statutes (F.S.), a statewide task force was created to explore this issue. The task force produced an Open Access Textbook Task Force Report, which provided rationale for open access textbooks and a plan to promote and increase the use of open access textbooks in Florida. Subsequently, in 2010, and again in 2012, Florida Student Textbook Surveys were conducted to assess student perception of textbook costs and open educational resources (OERs). Findings from the 2012 Student Textbook Survey continue to be used throughout the country in support of legislative decision-making and reports (2016, Taylor, M.), and in Florida to help support requests for institution or legislative action.
Most recently, in 2016, the former FDLC (now the Office of Distance Learning and Student Services within the statewide Florida Virtual Campus) conducted a Student Textbook and Course Materials Survey with more than 22,000 students of Florida’s public colleges and universities. The objective of the survey, which examined textbook affordability and acquisition, was to learn from students’ recent personal experiences how the cost of instructional materials and textbooks are impacting their education, their purchasing behaviors, the study aids they find to be most beneficial to their learning, and their use of financial aid to address these costs.

Florida Virtual Campus | Distance Learning & Student Services | www.dlss.flvc.org 8DRAFT
Methodology
The 2016 Student Textbook Costs Survey was conducted to help education leaders and policy makers better understand how textbook and instructional material costs are impacting student’s perceptions, academic decisions, progress, and perceived value of educational resources.
All 40 of Florida’s public postsecondary institutions were requested to invite their students to take part in the online questionnaire (survey), which was a follow-up to the 2010 and 2012 Student Textbook Surveys. Findings from the 2012 Student Textbook Survey continue to be used throughout the country in support of legislative decision-making and reports (2016, Taylor, M.), and in Florida to help support requests for institution or legislative action.
A. PurposeThe purpose of the 2016 Student Course Materials Survey is to identify:
1. The amount of money that Florida students spent on textbooks during the spring 2016 semester
2. The frequency with which students buy textbooks that are not used
3. How students are affected by the cost of textbooks
4. Which study aids students perceive to be the most beneficial to their learning
5. Identify any changes over time in student responses from previous iterations of the survey
B. ParticipantsAll 40 public colleges and universities in Florida participated in the study. Included in those 40 was the newly created Florida Polytechnic University, which opened after the 2012 survey, and thus was not part of the 2012 Student Textbook Survey.
The Florida College System (FCS) sent requests for participation to Chief Academic Officers at all colleges; the university Board of Governors (BOG) sent requests for participation to university Provosts. The requests for participation contained a link to the questionnaire and its purpose, and instructed that the questionnaire be administered between March 24, 2016 and April 29, 2016. Institutions were asked to use campus communication channels to solicit student participation in the 10-minute survey.
C. QuestionnaireThe questionnaire included 11 multiple choice, multiple select, and constructed response items drawn from the 2012 cost-related questions, as well as additional response items that reflected the current legislative status and concerns in Florida. The goals, research questions, and questionnaire items were developed with consultation with the BOG and FCS.

Florida Virtual Campus | Distance Learning & Student Services | www.dlss.flvc.org 9DRAFT
The estimated time required to complete the questionnaire was 10 minutes. The first few items addressed basic demographics (e.g., degree, institution, area of study). The remainder of the questionnaire addressed money spent on textbooks, textbook use, academic impact of textbook costs, and perceived value of different study aids.
D. Research QuestionsData findings from research questions can be found in Appendix A.
Question 1 How much do students spend on textbooks and other instructional materials?
Question 2 How many times do students buy textbooks that are not used?
Question 3 How are students affected by the cost of textbooks?
Question 4 What digital study aids do students perceive to be most beneficial to their grades?
Question 5 Compared to the results of the 2012 Student Textbook Survey, what are the differences on the money spent on textbook?
Question 6 Compared to the results of the 2012 Student Textbook Survey, what are the differences on factors affected by cost of textbooks?
Question 7 Comparing university students and college students, what are the differences on the money spent on textbook, money spent on instructional materials, costs covered by financial aid, and the number of textbooks purchased but never used.
Question 8 What are the differences on the money spent on textbooks for students in different degree level?
E. Data AnalysesDescriptive statistics were used to calculate all survey items. Means and standard deviations were used to calculate all continuous variables and Likert-type scales. Frequencies and percentages were presented for nominal and ordinal-scaled variables. For research question 1–4, frequencies and percentages were calculated for each category. For research question 5–9, Chi square tests were used to test the statistical differences.
Florida Virtual Campus | Distance Learning & Student Services | www.dlss.flvc.org 10DRAFT
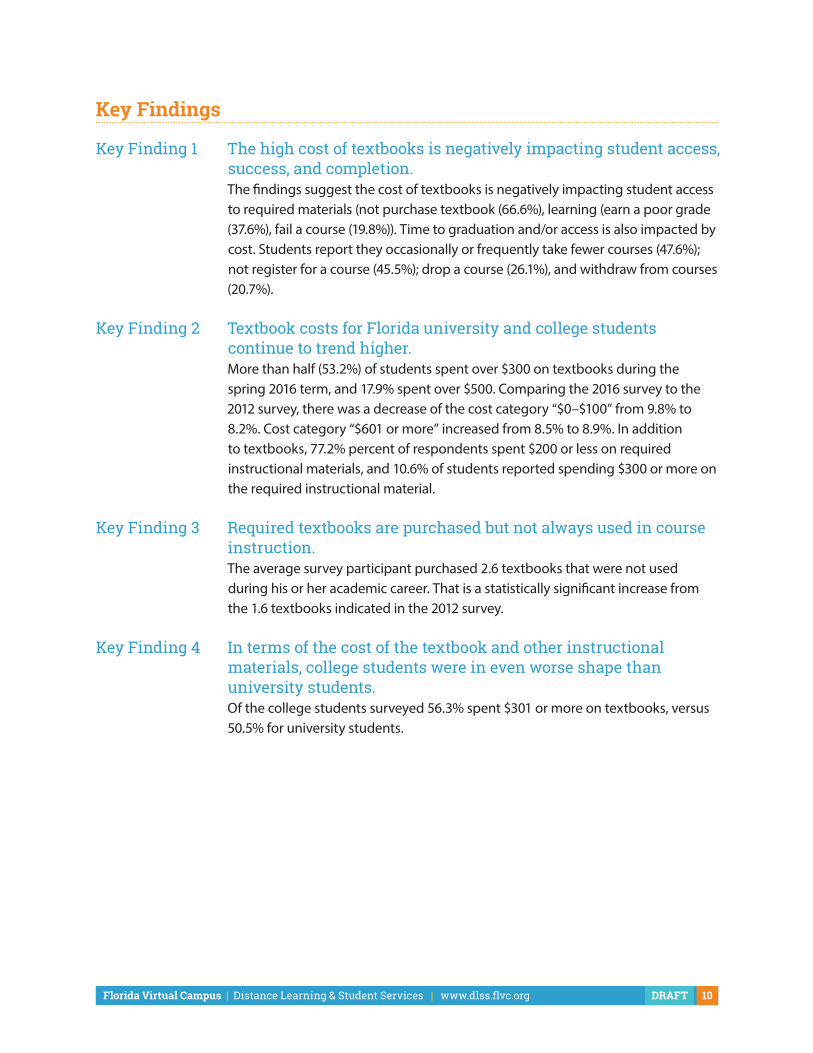
Key Findings
Key Finding 1 The high cost of textbooks is negatively impacting student access, success, and completion.
The findings suggest the cost of textbooks is negatively impacting student access to required materials (not purchase textbook (66.6%), learning (earn a poor grade (37.6%), fail a course (19.8%)). Time to graduation and/or access is also impacted by cost. Students report they occasionally or frequently take fewer courses (47.6%); not register for a course (45.5%); drop a course (26.1%), and withdraw from courses (20.7%).
Key Finding 2 Textbook costs for Florida university and college students continue to trend higher.
More than half (53.2%) of students spent over $300 on textbooks during the spring 2016 term, and 17.9% spent over $500. Comparing the 2016 survey to the 2012 survey, there was a decrease of the cost category “$0–$100” from 9.8% to 8.2%. Cost category “$601 or more” increased from 8.5% to 8.9%. In addition to textbooks, 77.2% percent of respondents spent $200 or less on required instructional materials, and 10.6% of students reported spending $300 or more on the required instructional material.
Key Finding 3 Required textbooks are purchased but not always used in course instruction.
The average survey participant purchased 2.6 textbooks that were not used during his or her academic career. That is a statistically significant increase from the 1.6 textbooks indicated in the 2012 survey.
Key Finding 4 In terms of the cost of the textbook and other instructional materials, college students were in even worse shape than university students.
Of the college students surveyed 56.3% spent $301 or more on textbooks, versus 50.5% for university students.

Florida Virtual Campus | Distance Learning & Student Services | www.dlss.flvc.org 11DRAFT
Key Finding 5 Students in Associate degree or Bachelor’s degree programs spent more on textbook than students in Master’s or Doctorate degree programs.
For those students seeking an Associate degree, Bachelor degree with 0-60 credit hours, and or Bachelor degree with 61 or more credit hours, 54.6%, 57.8% and 55.0% of the students, respectively, reported having spent $301 or more on textbooks. This is compared to 38.0% of students seeking a Master’s degree and 45.0% seeking a Doctorate degree who reported spending $301 or more.
Key Finding 6 Florida students are reducing cost by a variety of means. The most-used cost-saving measure reported by students was purchasing books
from a source other than the campus bookstore (63.8%). Compared with the 2012 survey, this indicates an increased willingness of students to rent textbooks. A majority (84%) of the participants reported willingness to rent textbooks to reduce cost; this is up from 73.5% in the 2012 survey. In addition, more students reported they chose to use the cost saving strategy of “renting digital textbook” (29.6%) rather than “buying lifetime access to a digital version of a textbook” (3.1%) as a cost-saving strategy.

Florida Virtual Campus | Distance Learning & Student Services | www.dlss.flvc.org 12DRAFT
Results
Section 1: Textbook Cost OVERALL During the spring 2016 term 53.2% of students spent more than $301 on textbooks, and 17.9% spent more than $500. The most-frequently selected response reflecting students’ textbook cost was the $201-300 range for the spring 2016 term (21.7%), which was followed closely by $301-400 range (20.7%). Approximately 75% of the respondents reported spending more than $200 on textbooks during the spring 2016 term. Additional details can be found in Table 1.1: 2016 Textbook Costs in Appendix B.
COMPARED TO THE 2012 SURVEYCompared with the 2012 survey, there was a decrease of the cost category $0–$100 from 9.8% to 8.2% in the 2016 survey. The cost category of $601 or more increased from 8.5% to 8.9%. Additional details can be found in Table 1.2: 2012 Textbook Costs in Appendix B.
COLLEGE & UNIVERSITY Compared to university students, there is a higher percentage of college students in high-cost categories. Of the college students surveyed, 56.3% spent $301 or more on textbooks, versus 50.5% for university students. Additional details can be found in Chart 1.1: 2016 Textbook Cost by University and College in Appendix B.
DEGREE LEVEL
Chart 1.2: Percentage of Students Spent $301 or More by Degree
70.0%
60.0%
50.0%
40.0%
30.0%
20.0%
10.0%
0.0%Associate Bachelor
(I have earned0 - 60 credit hours)
Bachelor(I have earned 61
-120+ credit hours)
Master’s Doctorate
Students seeking an Associate degree or Bachelor’s degree spent more on textbooks than students in Master’s or Doctorate degree programs in spring 2016 semester. For students seeking an Associate degree or Bachelor degree with 0-60 credit hours, and Bachelor degree with 61 or more credit hours, 54.6%, 57.8% and 55.0 % percent of students, respectively, reported spending $301 or more in the spring

Florida Virtual Campus | Distance Learning & Student Services | www.dlss.flvc.org 13DRAFT
2016 semester. For students seeking a Master’s degree, 38.0% percent of the students reported they spent $301 or more while 45.0% percent of students in a Doctorate degrees reported they spent $301 or more. Additional details can be found in Table 1.3: Textbook Costs by Degree Level in Appendix B.
Section 2: Textbooks Purchased but not UsedOVERALLTo be consistent with the 2012 textbook survey, answers greater than 15 were set as outliers. After removing outliers, the 2016 survey participant purchased an average of 2.6 textbooks that were not used during the participant’s academic career (See Appendix A).
COMPARED TO THE 2012 SURVEYIn the 2012 survey, the participant purchased an average of 1.6 textbooks that were not used during the participant’s academic career. The difference is statistically significant.
COLLEGE & UNIVERSITY See Chart 2.1: 2016 Textbook Purchased but Not Used in Appendix B, for a breakdown on the number of textbooks purchased, but not used, by university and college.
Section 3: Impact of CostChart 3.3: Percentage of Textbook Cost Impact on Students
70.0%
60.0%
50.0%
40.0%
30.0%
20.0%
10.0%
0.0%Take fewer courses Not register for a
speci�c courseDrop a course Withdraw from a
courseEarn a poor grade
because I could not a�ord to buy
the textbook
Fail a course because I could
not a�ord to buy the textbook
Not purchase the required textbook
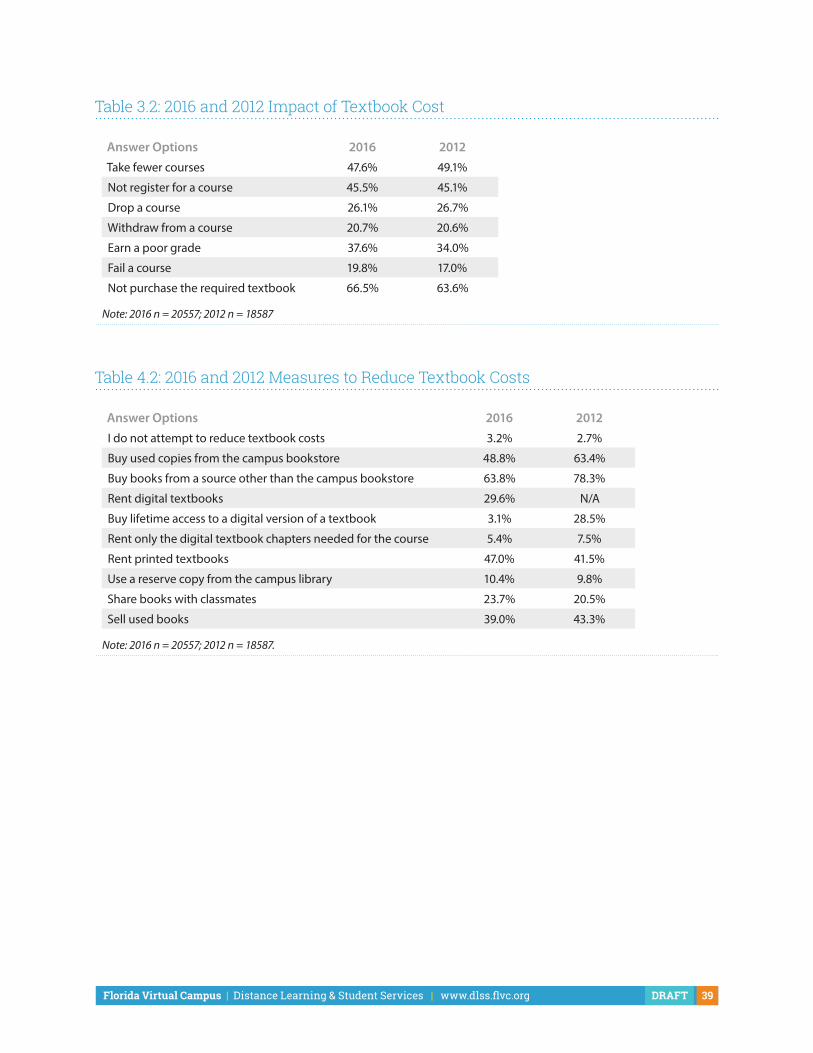
OVERALLStudents reported the high cost of textbooks impacted their learning and academic choices in a variety of ways. Additional details can be found in Table 3.1 and Table 3.2: 2016 Impact of Textbook Cost in Appendix B.

Florida Virtual Campus | Distance Learning & Student Services | www.dlss.flvc.org 14DRAFT
COMPARED TO THE 2012 SURVEY
n Take fewer courses (47.6%, down from 49.1% in 2012 survey)
n Not register for a course (45.5%, up from 45.1% in the 2012 survey)
n Drop a course (26.1% down from 26.7% in 2012 survey)
n Withdraw from a course (20.7%, slightly up from with 20.6% in the 2012 survey)
n Earn a poor grade (37.6%, up from 34.0% in 2012 survey)
n Fail a course (19.8%, up from 17.0% in the 2012 survey)
n Not purchase the required textbook (66.5%, up from 63.6% in the 2012 survey)
Additional details can be found in Table 3.2: 2016 and 2012 Impact of Textbook Cost in Appendix B.
COLLEGE & UNIVERSITY College students responded that they are more likely than university students to take fewer courses, not register for a specific course, drop a course, or withdraw from a course. University students reported that they are more likely to not purchase a required textbook, earn a poor grade, and fail a course than college students. See Chart 3.1: 2016 and 2012 Impact of Textbook Cost in Appendix B.
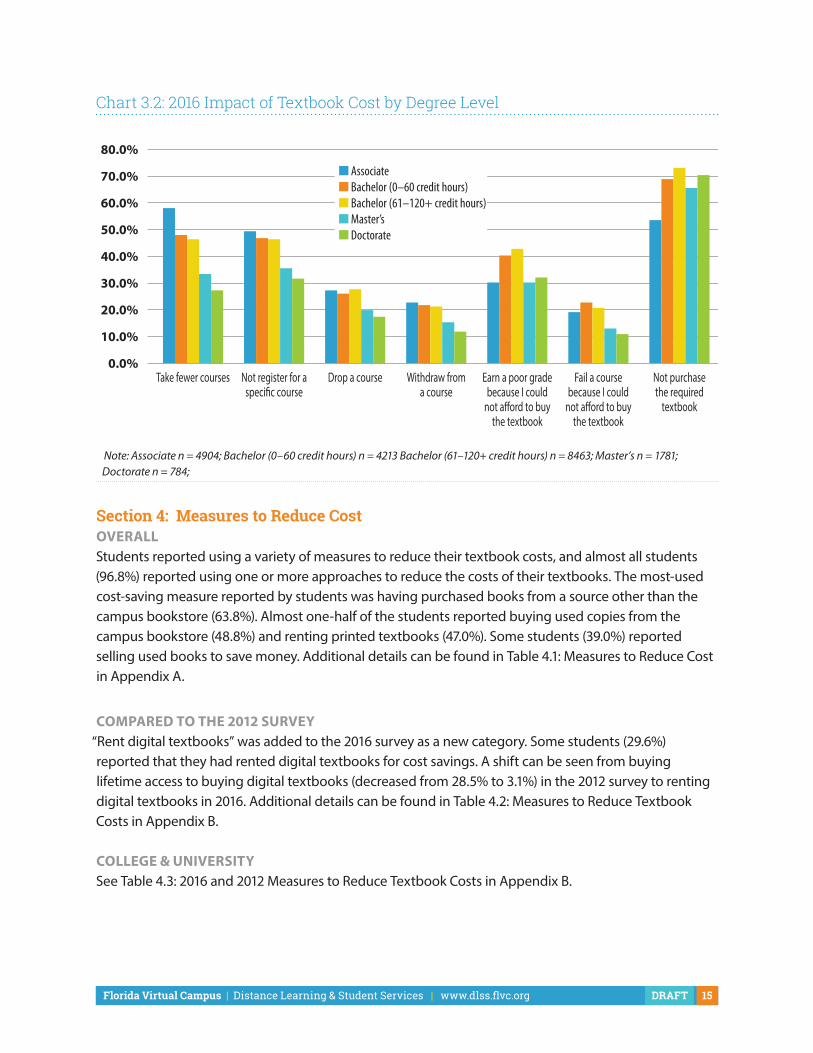
DEGREE LEVELStudents in Associate degree programs reported the highest percentage of taking fewer courses (58.0%), not registering a specific course (49.2%), and withdrawing from a course (22.5%). Students in Bachelor degree with 0–60 credit hours reported the highest percentage of failing a course (22.8%). Students in Bachelor degree programs with 61 or more credits reported the highest percentage of dropping a course (27.6%), earning a poor grade (42.9%) and not purchasing the required textbook (72.8%). It is worth noting that none of the highest percentage category were reported by students in graduate degree programs (master’s and doctorate).
Florida Virtual Campus | Distance Learning & Student Services | www.dlss.flvc.org 15DRAFT
Chart 3.2: 2016 Impact of Textbook Cost by Degree Level
80.0%
70.0%
60.0%
50.0%
40.0%
30.0%
20.0%
10.0%
0.0%Take fewer courses Not register for a
speci�c courseDrop a course Withdraw from
a courseEarn a poor grade
because I could not a�ord to buy
the textbook
Fail a course because I could
not a�ord to buy the textbook
Not purchase the required
textbook
■ Associate■ Bachelor (0–60 credit hours)■ Bachelor (61–120+ credit hours)■ Master’s■ Doctorate
Note: Associate n = 4904; Bachelor (0–60 credit hours) n = 4213 Bachelor (61–120+ credit hours) n = 8463; Master’s n = 1781; Doctorate n = 784;
Section 4: Measures to Reduce CostOVERALL Students reported using a variety of measures to reduce their textbook costs, and almost all students (96.8%) reported using one or more approaches to reduce the costs of their textbooks. The most-used cost-saving measure reported by students was having purchased books from a source other than the campus bookstore (63.8%). Almost one-half of the students reported buying used copies from the campus bookstore (48.8%) and renting printed textbooks (47.0%). Some students (39.0%) reported selling used books to save money. Additional details can be found in Table 4.1: Measures to Reduce Cost in Appendix A.
COMPARED TO THE 2012 SURVEY“Rent digital textbooks” was added to the 2016 survey as a new category. Some students (29.6%) reported that they had rented digital textbooks for cost savings. A shift can be seen from buying lifetime access to buying digital textbooks (decreased from 28.5% to 3.1%) in the 2012 survey to renting digital textbooks in 2016. Additional details can be found in Table 4.2: Measures to Reduce Textbook Costs in Appendix B.
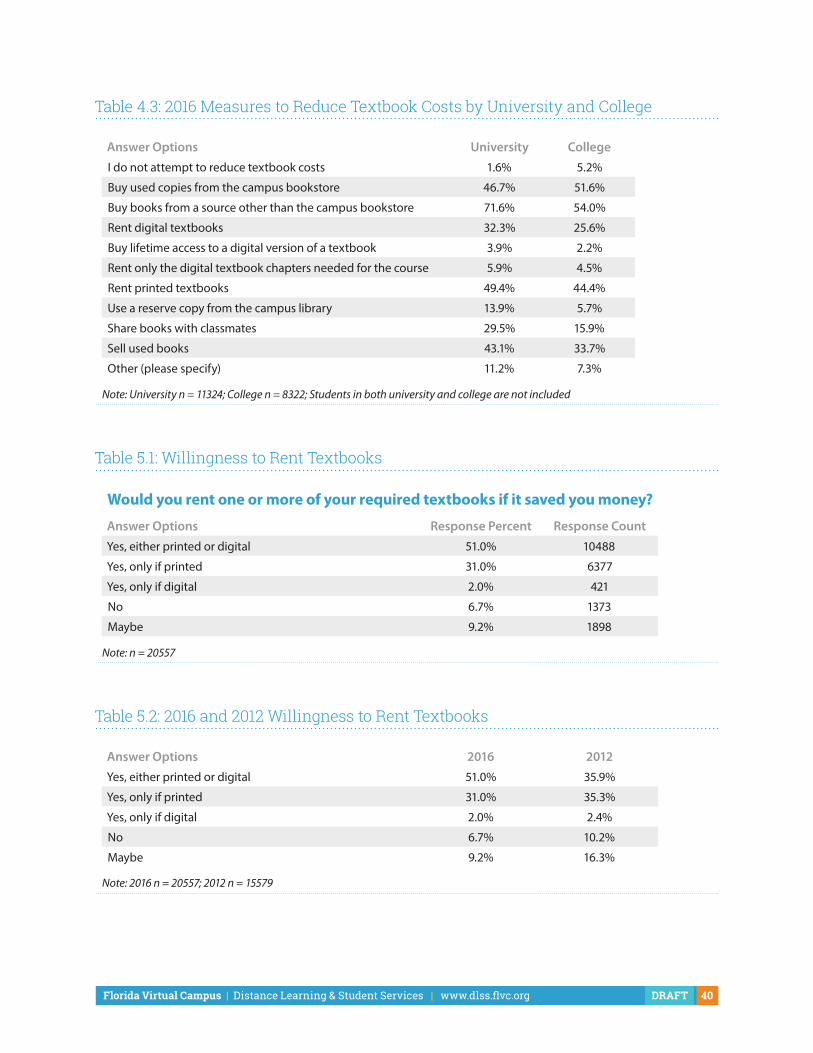
COLLEGE & UNIVERSITY See Table 4.3: 2016 and 2012 Measures to Reduce Textbook Costs in Appendix B.

Florida Virtual Campus | Distance Learning & Student Services | www.dlss.flvc.org 16DRAFT
Section 5: Willingness to Rent Textbooks OVERALLRenting textbooks is a popular option for the majority of students. Among the students who are willing to rent textbooks, a little more half (51.0%) are willing to rent either printed or digital textbooks. It is worth noting that 31.0% of students reported that they will only rent printed textbooks. Table 5.1: 2016 Willingness to Rent Textbooks breaks down the response percentage and the response count. Table 5.1 can be found in Appendix B.
COMPARED TO THE 2012 SURVEYCompared to the 2012 survey, students are increasingly willing to rent textbooks. The No and Maybe category decreased from the 2012 survey (26.5% to 15.9%). A significant number (84.0%) of the participants reported willingness to rent textbooks to reduce cost. This is up from 73.5% in the 2012 survey. Table 5.2: 2012 Willingness to Rent Textbooks compares the 2012 and 2016 survey results. Table 5.2 can be found in Appendix B.

Florida Virtual Campus | Distance Learning & Student Services | www.dlss.flvc.org 17DRAFT
Appendix A: Research Questions
Section 1: Participating Universities and CollegesMore than 22,000 public higher education students from all of Florida’s 40 colleges and universities participated in the survey (n = 22, 906). Of the respondents, 13,537 attend universities, 10,327 attend college, and 968 are enrolled in both a university and a college.
Section 2: Degree Level More than half of the students (61%) indicated that they are pursuing a Bachelor’s degree. 24.3% of students are pursuing an Associate degree, and 12.6% of the students are pursuing Master’s or Doctorate degree. The 2016 survey has a similar degree type composition as compared to the 2012 survey.
Table 6.1
Which degree are you seeking?Answer Options Response Percent Response CountAssociate 24.3% 5566
Bachelor (0–60 credit hours) 20.3% 4639
Bachelor (61 -120+ credit hours) 40.7% 9326
Master's 8.7% 1982
Doctorate 3.9% 903
Does not apply 2.1% 479
Note: n = 22895
Does not apply 2.1%
Doctorate 3.9%
Master's 8.7%
Bachelor 20.3%(0 - 60 credit hours)
Associate 24.3%
Bachelor 40.7%(61 -120+ credit hours)
Florida Virtual Campus | Distance Learning & Student Services | www.dlss.flvc.org 18DRAFT
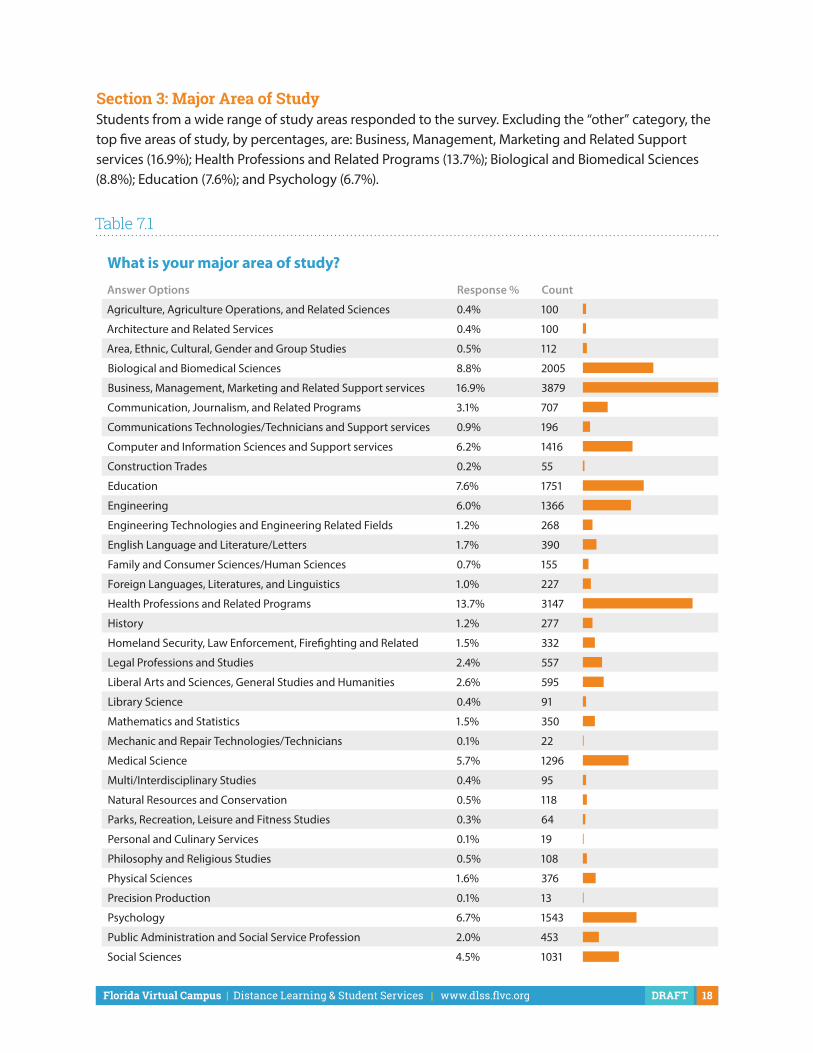
Section 3: Major Area of StudyStudents from a wide range of study areas responded to the survey. Excluding the “other” category, the top five areas of study, by percentages, are: Business, Management, Marketing and Related Support services (16.9%); Health Professions and Related Programs (13.7%); Biological and Biomedical Sciences (8.8%); Education (7.6%); and Psychology (6.7%).
Table 7.1
What is your major area of study?
Answer Options Response % Count
Agriculture, Agriculture Operations, and Related Sciences 0.4% 100
Architecture and Related Services 0.4% 100
Area, Ethnic, Cultural, Gender and Group Studies 0.5% 112
Biological and Biomedical Sciences 8.8% 2005
Business, Management, Marketing and Related Support services 16.9% 3879
Communication, Journalism, and Related Programs 3.1% 707
Communications Technologies/Technicians and Support services 0.9% 196
Computer and Information Sciences and Support services 6.2% 1416
Construction Trades 0.2% 55
Education 7.6% 1751
Engineering 6.0% 1366
Engineering Technologies and Engineering Related Fields 1.2% 268
English Language and Literature/Letters 1.7% 390
Family and Consumer Sciences/Human Sciences 0.7% 155
Foreign Languages, Literatures, and Linguistics 1.0% 227
Health Professions and Related Programs 13.7% 3147
History 1.2% 277
Homeland Security, Law Enforcement, Firefighting and Related 1.5% 332
Legal Professions and Studies 2.4% 557
Liberal Arts and Sciences, General Studies and Humanities 2.6% 595
Library Science 0.4% 91
Mathematics and Statistics 1.5% 350
Mechanic and Repair Technologies/Technicians 0.1% 22
Medical Science 5.7% 1296
Multi/Interdisciplinary Studies 0.4% 95
Natural Resources and Conservation 0.5% 118
Parks, Recreation, Leisure and Fitness Studies 0.3% 64
Personal and Culinary Services 0.1% 19
Philosophy and Religious Studies 0.5% 108
Physical Sciences 1.6% 376
Precision Production 0.1% 13
Psychology 6.7% 1543
Public Administration and Social Service Profession 2.0% 453
Social Sciences 4.5% 1031

Florida Virtual Campus | Distance Learning & Student Services | www.dlss.flvc.org 19DRAFT
Theology and Religious Vocations 0.1% 25
Transportation and Materials Moving 0.4% 85
Visual and Performing Arts 1.9% 428
Technology Education/Industrial Arts 0.5% 104
Other (please specify) 14.3% 3276
Note: n = 22895
Section 4: Textbook CostDuring the spring 2016 term 53.2% of students spent more than $300 on textbooks, and 17.9% spent more than $500. The most-frequently selected response reflecting students’ textbook cost was the $201-300 range for the spring 2016 term (21.7%), followed closely by $301-400 range (20.7%). The majority of (75.0%) respondents reported spending more than $200 on textbooks during the spring 2016 term.
Chart 4.1: Measures to Reduce Cost
$500-600 9.0%
$601 or more 8.9%
Other 1.5%
15.4% $101-200 $401-500
$301-400
14.6%
20.7%$000-100 8.2%
$201-30021.7%
Note: n = 20557
Table 8.1
How much did your textbooks cost for the spring 2016 term?Answer Options Response Percent Response Count$000 – 100 8.2% 1688
$101 – 200 15.4% 3174
$201 – 300 21.7% 4465
$301 – 400 20.7% 4258
$401 – 500 14.6% 2993
$501 – 600 9.0% 1844
$601 or more 8.9% 1830
Other (please specify) 1.5% 305
Answer Options Response % Count

Florida Virtual Campus | Distance Learning & Student Services | www.dlss.flvc.org 20DRAFT
Table 8.2 compares the textbook cost with the 2012 survey.
Table 8.2
Category 2016 % 2012 %$0–$100 8.2% 9.8%
$101–$200 15.4% 14.4%
$201–$300 21.7% 20.6%
$301–$400 20.7% 19.9%
$401–$500 14.6% 15.3%
$501 – $600 9.0% 10.2%
$601 or more 8.9% 8.5%
Other 1.5% 1.3%
2016 n = 20557; 2012 n = 19608
Table 8.3 breaks down the textbook cost by university and college.
Table 8.3
University CollegeAnswer Options Response Percent Response Count Response Percent Response Count
$000 – 100 9.6% 1087 6.6% 548
$101 – 200 16.1% 1827 14.6% 1218
$201 – 300 22.5% 2543 20.8% 1734
$301 – 400 19.9% 2248 21.7% 1806
$401 – 500 14.2% 1611 14.8% 1229
$501 – 600 8.7% 983 9.3% 773
$601 or more 7.7% 877 10.5% 871
Other (please specify) 1.3% 148 1.7% 143
Note: University n = 11324; College n = 8322; Students in both university and college are not included
Florida Virtual Campus | Distance Learning & Student Services | www.dlss.flvc.org 21DRAFT
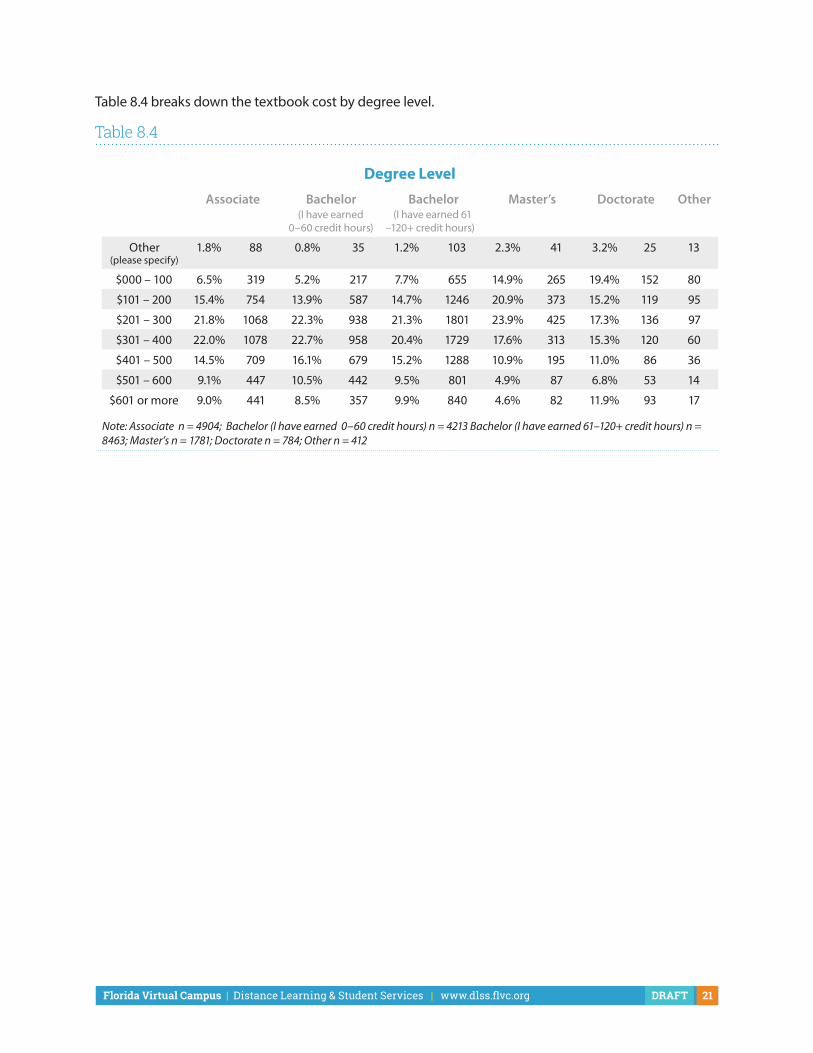
Table 8.4 breaks down the textbook cost by degree level.
Table 8.4
Degree LevelAssociate Bachelor
(I have earned0–60 credit hours)
Bachelor(I have earned 61
–120+ credit hours)
Master’s Doctorate Other
Other(please specify)
1.8% 88 0.8% 35 1.2% 103 2.3% 41 3.2% 25 13
$000 – 100 6.5% 319 5.2% 217 7.7% 655 14.9% 265 19.4% 152 80
$101 – 200 15.4% 754 13.9% 587 14.7% 1246 20.9% 373 15.2% 119 95
$201 – 300 21.8% 1068 22.3% 938 21.3% 1801 23.9% 425 17.3% 136 97
$301 – 400 22.0% 1078 22.7% 958 20.4% 1729 17.6% 313 15.3% 120 60
$401 – 500 14.5% 709 16.1% 679 15.2% 1288 10.9% 195 11.0% 86 36
$501 – 600 9.1% 447 10.5% 442 9.5% 801 4.9% 87 6.8% 53 14
$601 or more 9.0% 441 8.5% 357 9.9% 840 4.6% 82 11.9% 93 17
Note: Associate n = 4904; Bachelor (I have earned 0–60 credit hours) n = 4213 Bachelor (I have earned 61–120+ credit hours) n = 8463; Master’s n = 1781; Doctorate n = 784; Other n = 412

Florida Virtual Campus | Distance Learning & Student Services | www.dlss.flvc.org 22DRAFT
Section 5: Instructional Materials Cost For the spring 2016 term 77.2% percent spent $200 or less on required instructional materials. Whereas 10.6% of students reported spending $300 or more on the required instructional material.
Table 9.1
Excluding textbooks, how much did you spend on required instructional materials for the spring 2016 term (handbooks, guides, course packets, and other print or digital learning materials)?
Answer Options Response Percent Response Count$000 – 100 50.6% 10405
$101 – 200 26.6% 5469
$201 – 300 11.7% 2415
$301 – 400 4.5% 926
$401 – 500 2.2% 442
$501 – 600 1.4% 294
$601 or more 2.3% 482
Other (please specify) 0.6% 124
Note: n = 20557
$000 – 100 50.6%
$101 – 200 26.6%
$201 – 300 11.7%
$301 – 400 4.5%
$401 – 500 2.2%$501 – 600 1.4%
$601 or more 2.3%
Other 0.6%

Florida Virtual Campus | Distance Learning & Student Services | www.dlss.flvc.org 23DRAFT
Table 9.2 breaks down instructional materials cost by university and college.
Table 9.2
University CollegeAnswer Options Response Percent Response Count Response Percent Response Count
$000 – 100 51.7% 5859 50.0% 4165
$101 – 200 26.7% 3025 26.2% 2181
$201 – 300 11.6% 1319 11.7% 974
$301 – 400 4.2% 477 4.8% 397
$401 – 500 1.9% 220 2.3% 188
$501 – 600 1.2% 139 1.6% 137
$601 or more 2.0% 232 2.6% 219
Other (please specify) 0.5% 53 0.7% 61
Note: University n = 11324; College n = 8322; Students in both university and college are not included
Section 6: Percentage of Textbook Covered by Financial Aid
What percentage of your textbook costs is covered by financial aid for the spring 2016 term?
Answer Options Response Percent Response CountI do not receive financial aid 29.3% 6030
None 29.2% 6007
Less than 25% 7.2% 1487
26% to 50% 4.8% 984
51% to 75% 3.3% 688
76% to 99% 3.8% 784
All of my textbook costs 20.6% 4227
Other (please specify) 1.7% 350
For the Spring 2016 term 29.3% of students reported that they did not receive financial aid, and 29.2% reported that financial aid did not cover any of the textbook costs. Among the 39.7% who reported receiving financial aid for textbooks, 20.6% had all of their textbook costs covered, and 19.1% had a portion of their costs covered by financial aid.

Florida Virtual Campus | Distance Learning & Student Services | www.dlss.flvc.org 24DRAFT
Chart 10.1
Less than 25% 7.2%
26 to 50% 4.8%
26 to 50% 3.3%
51 to 75% 3.8%
Other 1.7%
29.2%
None
I do notreceive
financial aid
All of mytextbook
costs
29.3%
20.6%
Note: n = 20687
The following table breaks down the percentage of the textbook financial aid coverage by university and college.
Table 10.2
University CollegeAnswer Options Frequency Percent Frequency Percent
I do not receive financial aid 2844 25.1 2916 35.0
None 4399 38.8 1346 16.2
Less than 25% 974 8.6 431 5.2
26% to 50% 575 5.1 356 4.3
51% to 75% 367 3.2 278 3.3
76% to 99% 356 3.1 397 4.8
All of my textbook costs 1639 14.5 2439 29.3
Other (please specify) 170 1.5 159 1.9
Note: University n = 11324; College n = 8322; Students in both university and college are not included

Florida Virtual Campus | Distance Learning & Student Services | www.dlss.flvc.org 25DRAFT
Section 7: Measures to Reduce Textbook CostStudents reported a variety of measures to reduce their textbook cost, and almost all students (96.8%) reported using one or more approaches to reduce the costs of their textbooks. The most-used cost-saving measure reported by students was having purchased books from a source other than the campus bookstore (63.8%). Almost half of the students reported buying used copies from the campus bookstore (48.8%) and renting printed textbooks (47.0%). Of the responses received, 39.0% of students reported selling used books to save money, and 29.6% reported that they had rented digital textbooks for cost saving. This is a big jump from the 2012 survey’s 10.0% reported usage of rented digital textbooks. Table 11.1 below compares the response percent and response count for each answer.
Table 11.1
What measures have you taken to reduce your required textbook costs?Check all that apply.
Answer Options Response Percent
ResponseCount
I do not attempt to reduce textbook costs 3.2% 659
Buy used copies from the campus bookstore 48.8% 10030
Buy books from a source other than the campus bookstore 63.8% 13109
Rent digital textbooks 29.6% 6083
Buy lifetime access to a digital version of a textbook 3.1% 647
Rent only the digital textbook chapters needed for the course 5.4% 1116
Rent printed textbooks 47.0% 9668
Use a reserve copy from the campus library 10.4% 2128
Share books with classmates 23.7% 4875
Sell used books 39.0% 8025
Other (please specify) 9.5% 1955
Note: n = 20557

Florida Virtual Campus | Distance Learning & Student Services | www.dlss.flvc.org 26DRAFT
Table 11.2 following table breaks down the measure to reduce cost by university and college.
Table 11.2
College UniversityI do not attempt to reduce textbook costs 5.2% 431 1.6% 184
Buy used copies from the campus bookstore 51.6% 4298 46.7% 5283
Buy books from a source other than the campus bookstore 54.0% 4493 71.6% 8106
Rent digital textbooks 25.6% 2130 32.3% 3654
Buy lifetime access to a digital version of a textbook 2.2% 179 3.9% 444
Rent only the digital textbook chapters needed for the course 4.5% 374 5.9% 673
Rent printed textbooks 44.4% 3695 49.4% 5593
Use a reserve copy from the campus library 5.7% 474 13.9% 1574
Share books with classmates 15.9% 1322 29.5% 3338
Sell used books 33.7% 2807 43.1% 4885
Other (please specify) 7.3% 607 11.2% 1265
Table 4.1: Measures to Reduce Cost
What measures have you taken to reduce your required textbook costs?Check all that apply.
Answer Options Response Percent Response CountI do not attempt to reduce textbook costs 3.2% 659
Buy used copies from the campus bookstore 48.8% 10030
Buy books from a source other than the campus bookstore 63.8% 13109
Rent digital textbooks 29.6% 6083
Buy lifetime access to a digital version of a textbook 3.1% 647
Rent only the digital textbook chapters needed for the course 5.4% 1116
Rent printed textbooks 47.0% 9668
Use a reserve copy from the campus library 10.4% 2128
Share books with classmates 23.7% 4875
Sell used books 39.0% 8025
Note: n = 20557.

Florida Virtual Campus | Distance Learning & Student Services | www.dlss.flvc.org 27DRAFT
Section 8: Textbooks not used To be consistent with the 2012 textbook survey, answers greater than 15 were set as outliers. After taking out 429 outliers, the average participant purchased 2.6 textbooks that were not used during the participant’s academic career. In the 2012 survey, the average participant purchased 1.6 textbooks that were not used during the participant’s academic career. The difference is statistically significant. Two independent sample T test show that 2016 Survey (M = 2.60, SD = 2.84) and 2012 Survey (M = 1.60, SD = 2.11), t(-39.251) = 37035.180, p ≤ .001, CI.95 – -1.044,– -.945. Table 12.1 below compares the response count and response percent for the number of textbooks not used.
Table 12.1
Of all the textbooks you have been required to purchase, approximately how many were NOT used during your classes?
Number of Textbook not used Response Count Response Percent.00 5350 26.6%
1.00 2921 14.5%
2.00 3845 19.1%
3.00 2796 13.9%
4.00 1540 7.7%
5.00 1470 7.3%
6.00 532 2.6%
7.00 191 .9%
8.00 298 1.5%
9.00 97 .5%
10.00 726 3.6%
11.00 22 .1%
12.00 110 .5%
13.00 17 .1%
14.00 17 .1%
15.00 176 .9%
Total 20108 100.0%
Note: n = 20108
Table 12.2 breaks down the number of textbook not used by university and college.
Table 12.2
Response Count Mean Std. Deviation
College 8200 2.11 2.491
University 11018 2.96 3.011
Florida Virtual Campus | Distance Learning & Student Services | www.dlss.flvc.org 28DRAFT
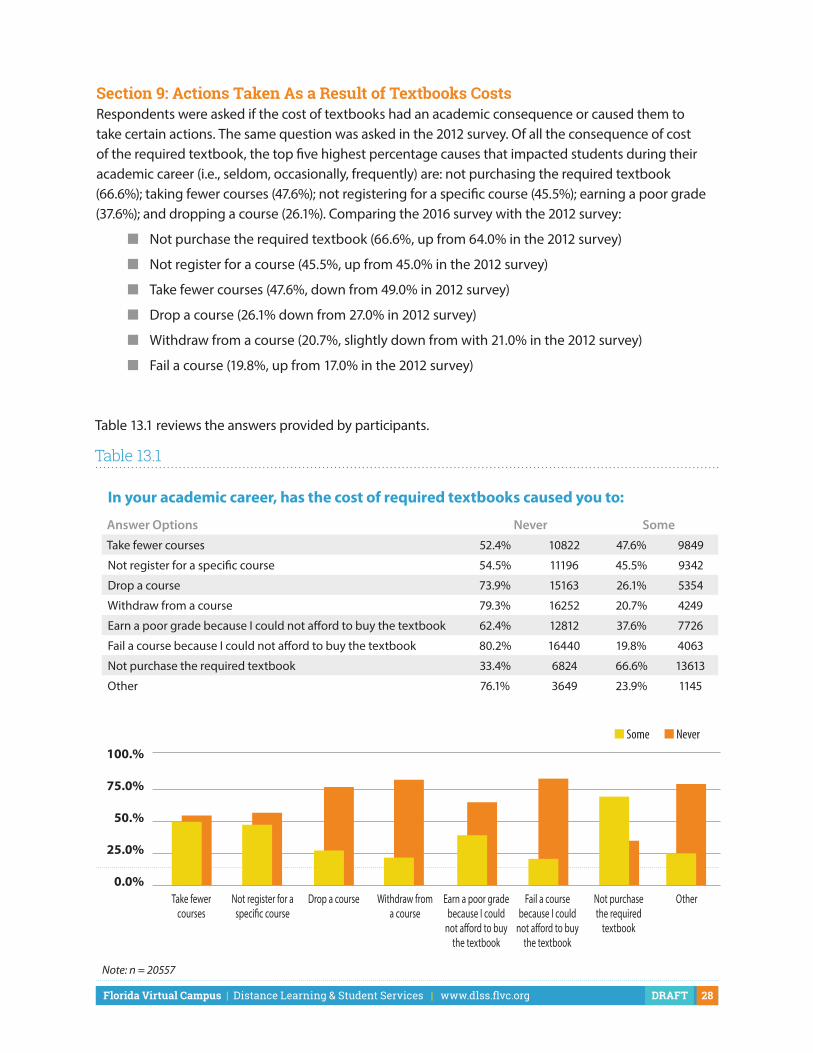
Section 9: Actions Taken As a Result of Textbooks CostsRespondents were asked if the cost of textbooks had an academic consequence or caused them to take certain actions. The same question was asked in the 2012 survey. Of all the consequence of cost of the required textbook, the top five highest percentage causes that impacted students during their academic career (i.e., seldom, occasionally, frequently) are: not purchasing the required textbook (66.6%); taking fewer courses (47.6%); not registering for a specific course (45.5%); earning a poor grade (37.6%); and dropping a course (26.1%). Comparing the 2016 survey with the 2012 survey:
n Not purchase the required textbook (66.6%, up from 64.0% in the 2012 survey)
n Not register for a course (45.5%, up from 45.0% in the 2012 survey)
n Take fewer courses (47.6%, down from 49.0% in 2012 survey)
n Drop a course (26.1% down from 27.0% in 2012 survey)
n Withdraw from a course (20.7%, slightly down from with 21.0% in the 2012 survey)
n Fail a course (19.8%, up from 17.0% in the 2012 survey)
Table 13.1 reviews the answers provided by participants.
Table 13.1
In your academic career, has the cost of required textbooks caused you to:
Answer Options Never SomeTake fewer courses 52.4% 10822 47.6% 9849
Not register for a specific course 54.5% 11196 45.5% 9342
Drop a course 73.9% 15163 26.1% 5354
Withdraw from a course 79.3% 16252 20.7% 4249
Earn a poor grade because I could not afford to buy the textbook 62.4% 12812 37.6% 7726
Fail a course because I could not afford to buy the textbook 80.2% 16440 19.8% 4063
Not purchase the required textbook 33.4% 6824 66.6% 13613
Other 76.1% 3649 23.9% 1145
100.%
75.0%
50.%
25.0%
0.0%Take fewer
coursesNot register for a
speci�c courseDrop a course Withdraw from
a courseEarn a poor grade
because I could not a�ord to buy
the textbook
Fail a course because I could
not a�ord to buy the textbook
Not purchasethe required
textbook
Other
■ Some ■ Never
Note: n = 20557
Florida Virtual Campus | Distance Learning & Student Services | www.dlss.flvc.org 29DRAFT
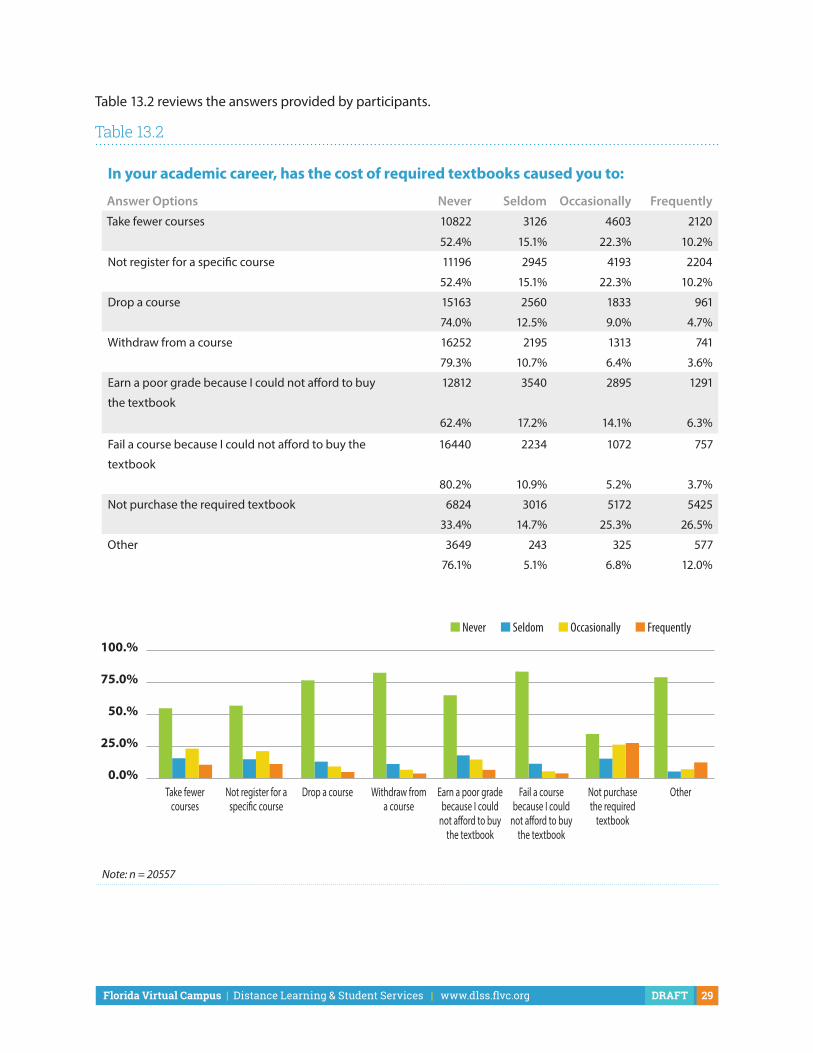
Table 13.2 reviews the answers provided by participants.
Table 13.2
In your academic career, has the cost of required textbooks caused you to:
Answer Options Never Seldom Occasionally FrequentlyTake fewer courses 10822 3126 4603 2120
52.4% 15.1% 22.3% 10.2%
Not register for a specific course 11196 2945 4193 2204
52.4% 15.1% 22.3% 10.2%
Drop a course 15163 2560 1833 961
74.0% 12.5% 9.0% 4.7%
Withdraw from a course 16252 2195 1313 741
79.3% 10.7% 6.4% 3.6%
Earn a poor grade because I could not afford to buy
the textbook
12812 3540 2895 1291
62.4% 17.2% 14.1% 6.3%
Fail a course because I could not afford to buy the
textbook
16440 2234 1072 757
80.2% 10.9% 5.2% 3.7%
Not purchase the required textbook 6824 3016 5172 5425
33.4% 14.7% 25.3% 26.5%
Other 3649 243 325 577
76.1% 5.1% 6.8% 12.0%
Take fewer courses
Not register for a speci�c course
Drop a course Withdraw froma course
Earn a poor grade because I could
not a�ord to buy the textbook
Fail a course because I could
not a�ord to buy the textbook
Not purchasethe required
textbook
Other
■ Never ■ Seldom ■ Occasionally ■ Frequently
100.%
75.0%
50.%
25.0%
0.0%
Note: n = 20557

Florida Virtual Campus | Distance Learning & Student Services | www.dlss.flvc.org 30DRAFT
Table 13.3 breaks down the cost impact by college and university.
Table 13.3
Answer Options Never Some
Take fewer courses College 40.4% 3357 59.6% 4958
University 62.2% 7039 37.8% 4276
Not register for a specific course College 49.1% 4082 50.9% 4233
University 59.2% 6701 40.8% 4612
Drop a course College 71.1% 5902 28.9% 2397
University 76.8% 8682 23.2% 2629
Withdraw from a course College 76.5% 6348 23.5% 1948
University 82.2% 9281 17.8% 2016
Earn a poor grade because I could not afford to
buy the textbook
College 68.8% 5721 31.2% 2594
University 58.6% 6634 41.4% 4679
Fail a course because I could not afford to buy the
textbook
College 80.8% 6712 19.2% 1590
University 80.6% 9106 19.4% 2188
Not purchase the required textbook College 44.9% 3710 55.1% 4561
University 25.2% 2839 74.8% 8421
Other College 77.5% 1605 22.5% 465
University 75.9% 1865 24.1% 591
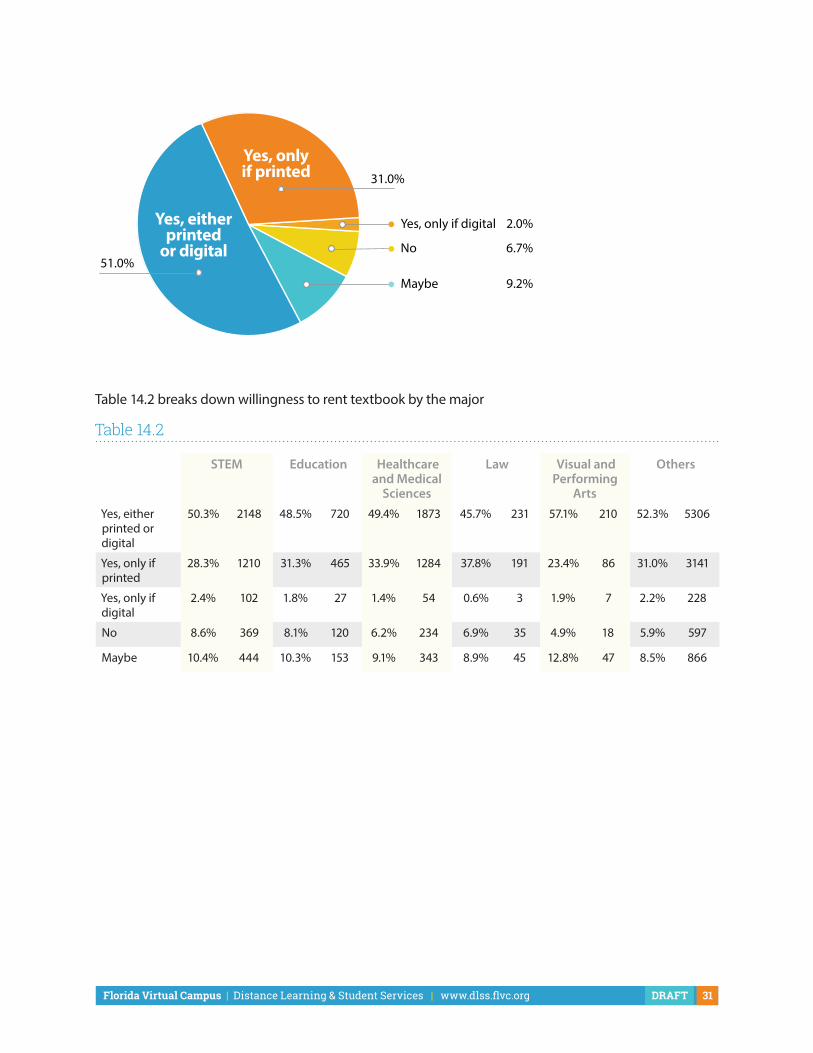
Section 10: Willingness to Rent TextbooksRenting textbooks is a popular option for the majority of students. 84.0% of the participants reported willingness to rent textbooks to reduce cost. This is up from 73.5% in the 2012 survey. Among the students who are willing to rent textbooks, a little more than half (51.0%) are willing to rent either printed or digital. It is worth noting that 31.0% of students reported that they will only rent printed textbooks.
Table 14.1
Would you rent one or more of your required textbooks if it saved you money?
Answer Options Response Percent Response Count
Yes, either printed or digital 51.0% 10488
Yes, only if printed 31.0% 6377
Yes, only if digital 2.0% 421
No 6.7% 1373
Maybe 9.2% 1898
Note: n = 20557
Florida Virtual Campus | Distance Learning & Student Services | www.dlss.flvc.org 31DRAFT
Yes, only if digital 2.0%
No 6.7%
Maybe 9.2%
Yes, eitherprinted
or digital
Yes, onlyif printed
51.0%
31.0%
Table 14.2 breaks down willingness to rent textbook by the major
Table 14.2
STEM Education Healthcare and Medical
Sciences
Law Visual and Performing
Arts
Others
Yes, either printed or digital
50.3% 2148 48.5% 720 49.4% 1873 45.7% 231 57.1% 210 52.3% 5306
Yes, only if printed
28.3% 1210 31.3% 465 33.9% 1284 37.8% 191 23.4% 86 31.0% 3141
Yes, only if digital
2.4% 102 1.8% 27 1.4% 54 0.6% 3 1.9% 7 2.2% 228
No 8.6% 369 8.1% 120 6.2% 234 6.9% 35 4.9% 18 5.9% 597
Maybe 10.4% 444 10.3% 153 9.1% 343 8.9% 45 12.8% 47 8.5% 866

Florida Virtual Campus | Distance Learning & Student Services | www.dlss.flvc.org 32DRAFT
Section 11: Digital Study AidsStudents were asked to rank the top three (out of nine) digital study aids. The study aids ranked highest by students as most supportive of their learning were: Interactive practice questions (73.9%), PowerPoint slide shows (58.4%), and video (57.3%)
Table 15.1
From the types of study aids listed below, select the top three digital study aids you find to be most useful to support your learning.
Answer Options Response Percent Response CountInteractive practice questions 73.9% 15200
Flash cards 46.9% 9640
PowerPoint slide shows 58.4% 12002
Video 57.3% 11781
Audio 16.9% 3466
Animations 22.7% 4663
Interactive ‘try it now’ activities 41.6% 8543
Online study groups 8.8% 1808
Online tutoring system provided by the college 13.9% 2850
(please specify) 528
Note: n = 20557
Florida Virtual Campus | Distance Learning & Student Services | www.dlss.flvc.org 33DRAFT
Research Questions
Research Question 1: How much do students spend on textbooks and other instructional materials?Textbook costs continue to be high for Florida university and college students. During the spring 2016 term, 53.2% of students spent more than $301 on textbooks, and 17.9% spent more than $500. For instructional materials, 10.6% students reported spending $301 or more on the required instructional material.
Research Question 2: How many times do students buy textbooks that are not used?The average participant purchased 2.6 textbooks that were not used during the participant’s academic career. In the 2012 survey, the average participant purchased 1.6 textbooks that were not used during the participant’s academic career. The difference is statistically significant. Two independent sample T test show that 2016 Survey (M = 2.60, SD = 2.84) and 2012 Survey (M = 1.60, SD = 2.11), t(-39.251) = 37035.180, p ≤ .001, CI.95 – -1.044, – -.945.
Research Question 3: How are students affected by the cost of textbooks?The top five highest percentage answer as a result of high cost of textbooks are: not purchasing the required textbook” (66.6%); taking fewer course (47.6%); not registering for a specific course (45.5%); earning a poor grade (37.6%); and dropping a course (26.1%). Comparison with the 2012 survey is explained in research question 6.
Research Question 4: What digital study aids do students perceive to be most beneficial to their grades?The study aids most frequently ranked highest by students as most supportive of their learning were: interactive practice questions (73.9%), PowerPoint slide shows (58.4%), and video (57.3%).
Research Question 5: Compared to the results of 2012 Student Text Book Survey, what are the differences on the money spent on textbooks?The Chi Square A chi-square test of goodness-of-fit was performed to determine the difference between 2016 survey results and the 2012 survey results. The chi-square revealed a significant difference between 2016 and 2012 distribution, x2 (7) = 134.8, p < .0001.
Compared to the 2012 survey, there was a decrease of the cost category “$0–$100” from 9.8% to 8.2% in the2016 survey. We also see the cost category of “$601 or more” increased from 8.5% to 8.9%. There was a slight increase of the cost category “$101–$200,” “$201–$300,” and “$301–$400.” The percentage of cost category of “$401–$500” and “$501–$600” decreased slightly. Table 5.3 compares the surveys.

Florida Virtual Campus | Distance Learning & Student Services | www.dlss.flvc.org 34DRAFT
Table 5.3
Category Observed # 2016% 2012%$0–$100 1688 8.2% 9.8%
$101–$200 3174 15.4% 14.4%
$201–$300 4465 21.7% 20.6%
$301–$400 4258 20.7% 19.9%
$401–$500 2993 14.6% 15.3%
$501 – $600 1844 9.0% 10.2%
$601 or more 1830 8.9% 8.5%
Other 305 1.5% 1.3%
Research Question 6: Compared to the results of the 2012 Student Textbook Survey, what are the differences on factors affected by cost of textbooks?The Chi Square test of goodness-of-fit was used to compare the 2016 survey and the 2012 survey. Compared with the 2012 survey, there is a statistically significant increase in “Fail a course” and “Not purchase the required textbook” category from the 2012 survey. There is a drop from the “Take fewer course” and “Drop a course” category from the 2012 survey. Table 5.4 reviews the data.
Table 5.4
Category Observed # 2016% 2012%Fail a course* 4087 19.8% 17.0%
Not purchase the required textbook ** 13683 66.5% 63.6%
Take fewer courses*** 9849 47.6% 50.8%
Drop a course**** 5387 26.1% 26.7%
$401–$500 2993 14.6% 15.3%
$501 – $600 1844 9.0% 10.2%
$601 or more 1830 8.9% 8.5%
Other 305 1.5% 1.3%
* x2 (1) = 115.4, p < .0001. **x2 (1) =75.9, p < .0001. ***x2 (1) = 82.2, p < .0001. **** x2 (1) = 3.9, p < .05.
Research Question 7: Is there a statistically significant relationship between money spent on textbooks and the type of student.
TEXTBOOK COSTA chi-square test of independence was performed to examine the relation between textbook cost and type of student (university vs. college). The relation between these variables was significant. x2 (7) = 121.4, p < .0001. There is a higher percentage of college students than university students in the high cost category. For example, 10.5% of college students spent $601 or more on textbooks in spring 2016

Florida Virtual Campus | Distance Learning & Student Services | www.dlss.flvc.org 35DRAFT
semester, while only 7.7% of university students spent $601 or more on textbook in the same semester. Using $300 dollar as a cut-off point, 56.2% of college students spent $300 dollars or more on textbook compared to 50.5% of university students. This suggests that college student spent more on textbook than university students in the spring 2016 semester.
INSTRUCTIONAL MATERIALS COSTA chi-square test of independence was performed to examine the relation between instructional materials cost and type of student (university vs. college). The relation between these variables was significant. x2 (7) = 27.7, p < .0001.
Overall, there is a similar trend as the textbook costs question. There is a higher percentage of college students than university students in high cost category. Using $300 as a cut-off point, 11.3% of college students spent $301 or more on instructional materials in the spring 2016 semester, while only 9.4% of university students spent $301 or more on textbook in the same semester.
PERCENTAGE OF TEXTBOOKS COVERED BY FINANCIAL AIDA chi-square test of independence was performed to examine the relation between financial aid and the type of student (university vs. college). The relation between these variables was significant. x2 (7) = 1636.0, p < .0001. Overall, there is a higher percentage of university students who did not receive any type of financial aid (63.9%) than college students (51.2%) not receiving aid. Among the students that received any financial aid for textbooks in the spring 2016 semester, 34.1% of college students had more than half of the textbook costs covered by financial aid. Only 20.8% of university students had more than half of the textbook costs covered by financial aid.
TEXTBOOKS PURCHASED BUT NOT USEDThe average university student has an average of 2.96 required textbooks that were never used during his or her academic life. College students have an average of 2.11 required textbooks that were never used during their academic careers. The difference is statistically significant. The two independent sample T test shows that university students (M = 2.96, SD = 3.01) have more required textbook not used than college students (M = 2.11, SD = 2.49), t(19002.6) = 21.4, p <0001.
Research Question 8: What are the differences on the money spent on textbooks for students in different degree levels?A chi-square test of independence was performed to examine the relation between textbook cost and degree levels. The relation between these variables was significant, x2 (35) = 681.8, p < .0001. Overall, in the spring 2016 term, graduate students spent less on textbook than students in associate and bachelor degree level. Using $301 as a cut-off point, the percentage of students that spent $301 or more in Associate, Bachelor (I have earned 0–60 credit hours), Bachelor (I have earned 61–120+ credit hours), Master’s, and Doctorate is 54.6%, 57.8%, 55.0%, 38.0% and 45.0%, respectively.

Florida Virtual Campus | Distance Learning & Student Services | www.dlss.flvc.org 36DRAFT
Table 1.1: 2016 Textbook Costs
How much did your textbooks cost for the spring 2016 term?
Answer Options Response Percent Response Count$000 – 100 8.2% 1688
$101 – 200 15.4% 3174
$201 – 300 21.7% 4465
$301 – 400 20.7% 4258
$401 – 500 14.6% 2993
$501 – 600 9.0% 1844
$601 or more 8.9% 1830
Other (please specify) 1.5% 305
Note: n = 20557
Chart 1.1: 2016 Textbook Cost by University and College
25%
20%
15%
10%
5%
0%$000–100 $101–200 $201–300 $301–400 $401–500 $501–600 $601 or more Other (please
specify)
■ University ■ College
Note: University n = 11324; College n = 8322; Students in both university and college are not included
Appendix B: Survey Data

Florida Virtual Campus | Distance Learning & Student Services | www.dlss.flvc.org 37DRAFT
Table 1.2: 2012 Textbook Costs
Answer Options 2016 2012 $0–$100 8.2% 9.8%
$101–$200 15.4% 14.4%
$201–$300 21.7% 20.6%
$301–$400 20.7% 19.9%
$401–$500 14.6% 15.3%
$501 – $600 9.0% 10.2%
$601 or more 8.9% 8.5%
Other (please specify) 1.5% 1.3%
Note: 2016 n = 20557; 2012 n = 19608
Table 1.3: Textbook Costs by Degree Level
Associate Bachelor(0-60 hours)
Bachelor(61-120+ hours)
Master’s Doctorate
$000 – 100 6.5% 5.2% 7.7% 14.9% 19.4%
$101 – 200 15.4% 13.9% 14.7% 20.9% 15.2%
$201 – 300 21.8% 22.3% 21.3% 23.9% 17.3%
$301 – 400 22.0% 22.7% 20.4% 17.6% 15.3%
$401 – 500 14.5% 16.1% 15.2% 10.9% 11.0%
$501 – 600 9.1% 10.5% 9.5% 4.9% 6.8%
$601 or more 9.0% 8.5% 9.9% 4.6% 11.9%
Other (please specify) 1.8% 0.8% 1.2% 2.3% 3.2%
Note: Associate n = 4904; Bachelor (0–60 credit hours) n = 4213 Bachelor (61 -120+ credit hours) n = 8463; Master’s n = 1781; Doctorate n = 784;
Chart 2.1: Textbooks Purchased but Not Used by College and University
3.5
3
2.5
2
1.5
1
.5
0College University
Note: University n = 11324; College n = 8322; Students in both university and college are not included
Florida Virtual Campus | Distance Learning & Student Services | www.dlss.flvc.org 38DRAFT
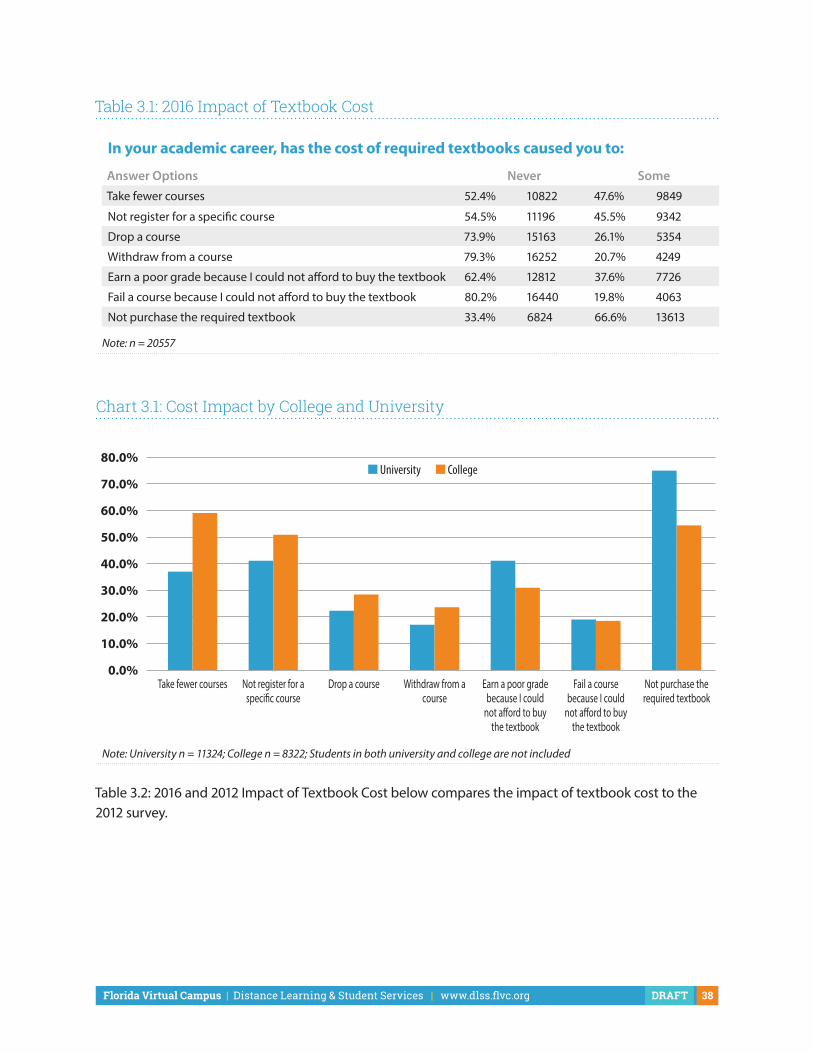
Table 3.1: 2016 Impact of Textbook Cost
In your academic career, has the cost of required textbooks caused you to:
Answer Options Never SomeTake fewer courses 52.4% 10822 47.6% 9849
Not register for a specific course 54.5% 11196 45.5% 9342
Drop a course 73.9% 15163 26.1% 5354
Withdraw from a course 79.3% 16252 20.7% 4249
Earn a poor grade because I could not afford to buy the textbook 62.4% 12812 37.6% 7726
Fail a course because I could not afford to buy the textbook 80.2% 16440 19.8% 4063
Not purchase the required textbook 33.4% 6824 66.6% 13613
Note: n = 20557
Chart 3.1: Cost Impact by College and University
80.0%
70.0%
60.0%
50.0%
40.0%
30.0%
20.0%
10.0%
0.0%Take fewer courses Not register for a
speci�c courseDrop a course Withdraw from a
courseEarn a poor grade
because I could not a�ord to buy
the textbook
Fail a course because I could
not a�ord to buy the textbook
Not purchase the required textbook
■ University ■ College
Note: University n = 11324; College n = 8322; Students in both university and college are not included
Table 3.2: 2016 and 2012 Impact of Textbook Cost below compares the impact of textbook cost to the 2012 survey.
Florida Virtual Campus | Distance Learning & Student Services | www.dlss.flvc.org 39DRAFT
Table 3.2: 2016 and 2012 Impact of Textbook Cost
Answer Options 2016 2012 Take fewer courses 47.6% 49.1%
Not register for a course 45.5% 45.1%
Drop a course 26.1% 26.7%
Withdraw from a course 20.7% 20.6%
Earn a poor grade 37.6% 34.0%
Fail a course 19.8% 17.0%
Not purchase the required textbook 66.5% 63.6%
Note: 2016 n = 20557; 2012 n = 18587
Table 4.2: 2016 and 2012 Measures to Reduce Textbook Costs
Answer Options 2016 2012I do not attempt to reduce textbook costs 3.2% 2.7%
Buy used copies from the campus bookstore 48.8% 63.4%
Buy books from a source other than the campus bookstore 63.8% 78.3%
Rent digital textbooks 29.6% N/A
Buy lifetime access to a digital version of a textbook 3.1% 28.5%
Rent only the digital textbook chapters needed for the course 5.4% 7.5%
Rent printed textbooks 47.0% 41.5%
Use a reserve copy from the campus library 10.4% 9.8%
Share books with classmates 23.7% 20.5%
Sell used books 39.0% 43.3%
Note: 2016 n = 20557; 2012 n = 18587.
Florida Virtual Campus | Distance Learning & Student Services | www.dlss.flvc.org 40DRAFT
Table 4.3: 2016 Measures to Reduce Textbook Costs by University and College
Answer Options University CollegeI do not attempt to reduce textbook costs 1.6% 5.2%
Buy used copies from the campus bookstore 46.7% 51.6%
Buy books from a source other than the campus bookstore 71.6% 54.0%
Rent digital textbooks 32.3% 25.6%
Buy lifetime access to a digital version of a textbook 3.9% 2.2%
Rent only the digital textbook chapters needed for the course 5.9% 4.5%
Rent printed textbooks 49.4% 44.4%
Use a reserve copy from the campus library 13.9% 5.7%
Share books with classmates 29.5% 15.9%
Sell used books 43.1% 33.7%
Other (please specify) 11.2% 7.3%
Note: University n = 11324; College n = 8322; Students in both university and college are not included
Table 5.1: Willingness to Rent Textbooks
Would you rent one or more of your required textbooks if it saved you money?
Answer Options Response Percent Response CountYes, either printed or digital 51.0% 10488
Yes, only if printed 31.0% 6377
Yes, only if digital 2.0% 421
No 6.7% 1373
Maybe 9.2% 1898
Note: n = 20557
Table 5.2: 2016 and 2012 Willingness to Rent Textbooks
Answer Options 2016 2012Yes, either printed or digital 51.0% 35.9%
Yes, only if printed 31.0% 35.3%
Yes, only if digital 2.0% 2.4%
No 6.7% 10.2%
Maybe 9.2% 16.3%
Note: 2016 n = 20557; 2012 n = 15579

Florida Virtual Campus | Distance Learning & Student Services | www.dlss.flvc.org 41DRAFT
Resources
Florida Distance Learning Consortium. Open Access Textbook Task Force Report. (2010). Retrieved from https://florida.theorangegrove.org/og/file/a83149bc-c972-ed56-67ae-b2952115ef08/1/OATTF_Final_Report_All_sections.pdf Florida Virtual Campus. (2012). 2012 Florida Student Textbook Survey. Tallahassee, FL: Author. Retrieved from http://www.openaccesstextbooks.org/pdf/2012_Florida_Student_Textbook_Survey.pdf.
Heiman, J. & Kuhn, J. The 2016-17 Budget: Assessing the governor’s zero-textbook-cost proposal. (2016, March). Retrieved from http://www.lao.ca.gov/reports/2016/3392/zero-textbook-cost-031416.pdf.
Florida Virtual Campus | Distance Learning & Student Services | www.dlss.flvc.org 42DRAFT
2016 Florida Student Textbooks & Instructional Materials Survey
CITATIONFlorida Virtual Campus. (2016). 2016 Florida Student Textbook Survey. Tallahassee, FL: Author.
CONTRIBUTING AUTHORSRobin L. Donaldson, Ph.D.E Shen, Ph.D.
This report is licensed under a Creative Commons Attribution-NonCommercial 3.0 Unported License.