2016 state of the health funds report - ombudsman€¦ · the state of the health funds report...
TRANSCRIPT
PRIVATE HEALTH INSURANCE
OMBUDSMAN
STATE OF THE
HEALTH FUNDS REPORT2016
The Private Health Insurance Ombudsman can be contacted in the following ways:
Post
Private Health Insurance Ombudsman Office of the Commonwealth Ombudsman GPO Box 442, Canberra ACT 2601
Phone
• Private health insurance complaints: 1300 362 072 — 9am to 5pm Australian Eastern Daylight Time, Monday to Friday
• Private health insurance enquiries and advice: 1300 737 299 — 9am to 5pm Australian Eastern Daylight Time, Monday to Friday.
Other
• Email: [email protected] • Website: Ombudsman.gov.au• Consumers requiring translators:
13 14 50 (Translating and Interpreting Service)• Deaf, or hearing or speech impaired:
13 36 77 (National Relay Service)
Readers with enquiries about the Ombudsman or this report should contact the Administration Officer at the above address. Information for senators and members of parliament is available from the Private Health Insurance Ombudsman at the above telephone numbers.
The Coat of Arms
The terms under which the Australian Coat of Arms may be used are detailed on It’s an Honour website (itsanhonour.gov.au).
Copyright statement
This work is copyright. Apart from any use permitted under the Copyright Act 1968, no part may be reproduced without written permission. Requests concerning reproduction and rights should be addressed to the Commonwealth Ombudsman.
© Commonwealth of Australia 2017.
Design by Surveillance.net.au
Private Health Insurance OmbudsmanSTATE OF THE HEALTH FUNDS REPORT 2016
Relating to the financial year 2015–16
Report required by 20D (c) of the Commonwealth Ombudsman Act 1976
iv | COMMONWEALTH OMBUDSMAN STATE OF THE HEALTH FUNDS REPORT | 2016
FOREWORD
I am pleased to present the thirteenth annual State of the Health Funds Report, relating to the financial year 2015–16. The Commonwealth Ombudsman Act 1976 (Cth) requires that the Private Health Insurance Ombudsman (PHIO) publish the report after the end of each financial year to provide comparative information on the performance and service delivery of all health funds1 during that financial year.
The information in the report supplements information available on PHIO’s consumer website Privatehealth.gov.au, which was developed and is maintained by PHIO. The consumer website provides a range of information to assist consumers to understand private health insurance, and to select or update their private health insurance policies. The information on the consumer website, together with the State of the Health Funds Report itself, makes it easier for consumers to choose health insurance policies that better meet their individual needs.
The purpose of this report is to provide consumers with additional information to assist them to make informed decisions about private health insurance. For existing policyholders, the report details information that allows them to compare the performance of their fund with all other health funds. For those considering taking out private health insurance for the first time, the report provides an indication of the services available from each fund and a comparison of some service and performance indicators at the fund level.
The range of issues and performance information contained in the report has been chosen after taking into account the availability of reliable data and whether the information is reasonably comparable across funds. The information included in the report is based on data collected by the Australian Prudential Regulation Authority (APRA), as part of its role in undertaking statistical reporting and monitoring of the financial management of health funds.
Mr Richard GlennActing Commonwealth Ombudsman March 2017
1 For the purposes of this report, Australian registered private health insurers are referred to as ‘health funds’.
. . . . . . . . . . . . . . . . . . . . . . . . . . . . . . . . . . . . . . . . . . . . . . . . . . . . . . . . . . . . . . . . . . .
CONTENTS
Using this report to compare funds 2
About the data used in this report . . . . . . . . . . . . . . . . . . . . . . . . . . . . . . . . . . . . . . . . . . . . . . . . . . . . . . . . . . . . . . . . . . . . . 4
Key consumer issues . . . . . . . . . . . . . . . . . . . . . . . . . . . . . . . . . . . . . . . . . . . . . . . . . . . . . . . . . . . . . . . . . . . . . . . . . . . . . . . . . . . . . . . . . 5
Health fund listing and contact details . . . . . . . . . . . . . . . . . . . . . . . . . . . . . . . . . . . . . . . . . . . . . . . . . . . . . . . . . . . . . . . 9
Service performance . . . . . . . . . . . . . . . . . . . . . . . . . . . . . . . . . . . . . . . . . . . . . . . . . . . . . . . . . . . . . . . . . . . . . . . . . . . . . . . . . . . . . . . . 11
Hospital . . . . . . . . . . . . . . . . . . . . . . . . . . . . . . . . . . . . . . . . . . . . . . . . . . . . . . . . . . . . . . . . . . . . . . . . . . . . . . . . . . . . . . . . . . . . . . . . . . . . . . . . . . 14
Medical gap schemes . . . . . . . . . . . . . . . . . . . . . . . . . . . . . . . . . . . . . . . . . . . . . . . . . . . . . . . . . . . . . . . . . . . . . . . . . . . . . . . . . . . . . . . 16
General treatment (extras) . . . . . . . . . . . . . . . . . . . . . . . . . . . . . . . . . . . . . . . . . . . . . . . . . . . . . . . . . . . . . . . . . . . . . . . . . . . . . . . 19
Finances and costs . . . . . . . . . . . . . . . . . . . . . . . . . . . . . . . . . . . . . . . . . . . . . . . . . . . . . . . . . . . . . . . . . . . . . . . . . . . . . . . . . . . . . . . . . . 23
Health fund operations by state or territory . . . . . . . . . . . . . . . . . . . . . . . . . . . . . . . . . . . . . . . . . . . . . . . . . . . . . 26
About the Private Health Insurance Ombudsman . . . . . . . . . . . . . . . . . . . . . . . . . . . . . . . . . . . . . . . . . . . . . . 36
Your health insurance checklist . . . . . . . . . . . . . . . . . . . . . . . . . . . . . . . . . . . . . . . . . . . . . . . . . . . . . . . . . . . . . . . . . . . . . . . . 38
2016 | COMMONWEALTH OMBUDSMAN STATE OF THE HEALTH FUNDS REPORT | 1
2 | COMMONWEALTH OMBUDSMAN STATE OF THE HEALTH FUNDS REPORT | 2016
USING THIS REPORT TO COMPARE FUNDS
DisclaimerNothing contained in this report should be taken as a recommendation by the Private Health Insurance Ombudsman in favour of any particular health fund or health insurance policy. No single indicator should be used as a measure of overall fund performance. In most cases, a seemingly poor performance on one indicator will be offset by a good performance on other factors.
The information used in the report in order to compare health funds is based on data collected for regulatory purposes. This information is the most appropriate, independent and reliable data available.
The report is intended to help you to decide which health funds to consider, though it won’t necessarily indicate which of the fund’s policies to purchase. Virtually all funds offer more expensive policies that can be expected to provide better than average benefits as well as cheaper policies that provide less.
The State of the Health Funds ReportThe State of the Health Funds Report (SOHFR) compares how health funds perform across the following criteria:
• Service performance;• Hospital benefits;• Medical gap schemes;• General treatment (extras) benefits;• Financial management; and• Health fund operations.
You can use the information contained in this report to identify possible funds to join, or to assess your existing fund’s performance if you’re reviewing your current needs.
You can use the range of indicators included in this report as a menu to choose the factors of most importance to you — not all factors will be of equal importance to every individual or family.
For instance, if you prefer to do business with a health fund in person, then you should consider the availability of retail offices to be an important consideration. However, if you prefer to do as much of your business as possible over the internet, the range of services available through the funds’ websites will be more important.
More information about particular indicators is provided in the explanations preceding each of the tables in this report.
If you’re considering taking out private health insurance for the first time, the Ombudsman suggests you use this report to identify a number of funds — preferably at least three — for further investigation.
Where to find more information about selecting a policyThe PHIO brochure ‘Health Insurance Choice: Selecting a Health Insurance Policy’ includes important advice on what to consider and what questions to ask when selecting a hospital cover policy. It also includes information on government incentives relating to hospital cover such as the ‘Medicare Levy Surcharge Exemption’ and ‘Lifetime Health Cover’.
These brochures, as well as other publications, can be found at Ombudsman.gov.au. Some brochures can be obtained in hard copy on request from the Ombudsman’s office.
This report does not include detailed information on price and benefits for particular health insurance policies. Information on specific policies is available from the Ombudsman’s consumer website Privatehealth.gov.au, where you can search for and compare information about every health fund and policy in Australia.
2016 | COMMONWEALTH OMBUDSMAN STATE OF THE HEALTH FUNDS REPORT | 3
US
ING
TH
IS R
EP
OR
T TO
CO
MPA
RE
FUN
DS
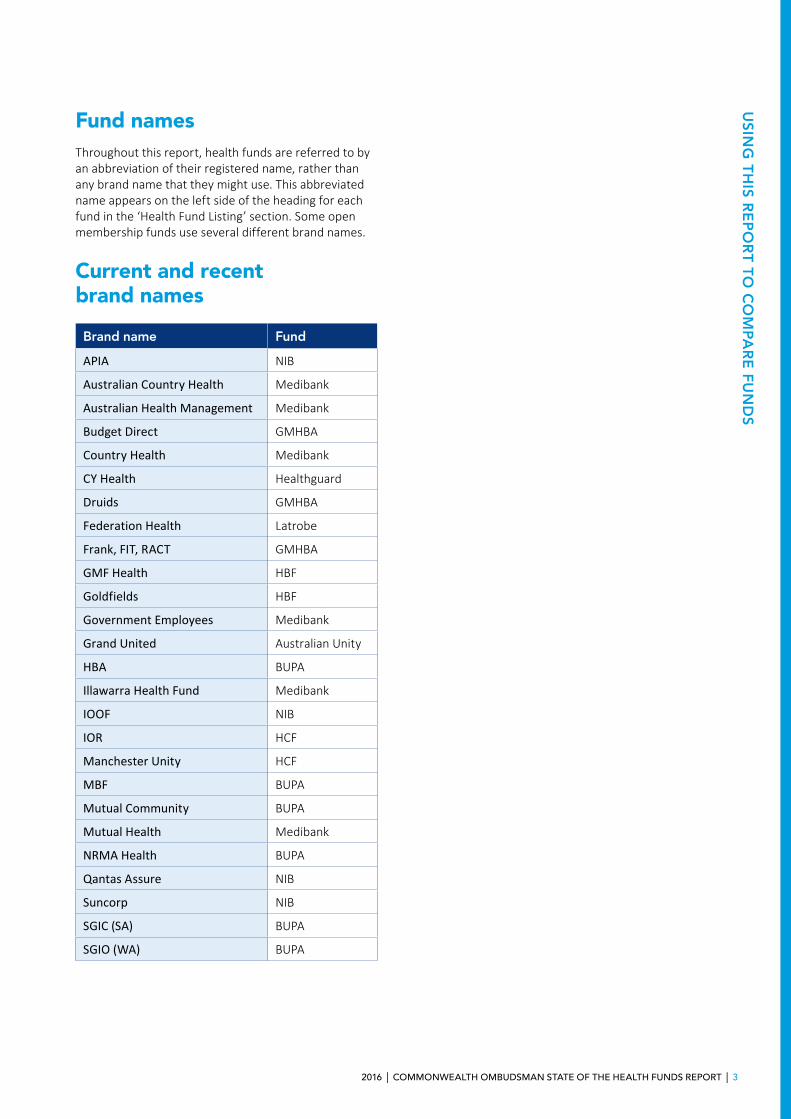
Fund namesThroughout this report, health funds are referred to by an abbreviation of their registered name, rather than any brand name that they might use. This abbreviated name appears on the left side of the heading for each fund in the ‘Health Fund Listing’ section. Some open membership funds use several different brand names.
Current and recent brand names
Brand name Fund
APIA NIB
Australian Country Health Medibank
Australian Health Management Medibank
Budget Direct GMHBA
Country Health Medibank
CY Health Healthguard
Druids GMHBA
Federation Health Latrobe
Frank, FIT, RACT GMHBA
GMF Health HBF
Goldfields HBF
Government Employees Medibank
Grand United Australian Unity
HBA BUPA
Illawarra Health Fund Medibank
IOOF NIB
IOR HCF
Manchester Unity HCF
MBF BUPA
Mutual Community BUPA
Mutual Health Medibank
NRMA Health BUPA
Qantas Assure NIB
Suncorp NIB
SGIC (SA) BUPA
SGIO (WA) BUPA
4 | COMMONWEALTH OMBUDSMAN STATE OF THE HEALTH FUNDS REPORT | 2016
ABOUT THE DATA USED IN THIS REPORT
Open and restricted membership health fundsMembership of ‘open’ health funds is available to everyone.
‘Restricted membership’ health funds have certain membership criteria which mean they aren’t available to all consumers. For example, membership may be restricted to employees of certain companies or occupations, or members of particular organisations.
Where applicable, open and restricted membership funds are listed separately in each of the tables in this report.
Information about policiesThe information included in the report on fund contributions and benefits indicates the average outcomes across all of a fund’s policies and so can’t be taken as an indicator of the price or benefit levels that can be expected for any particular policy.
Virtually all funds offer more expensive policies that can be expected to provide better than average benefits and most also offer cheaper policies that provide less.
This report can help you to decide which health funds to consider, but won’t necessarily help you to decide which of the funds’ policies to purchase.
For information about specific policies, the website Privatehealth.gov.au enables you to view standard information outlining the main features of any health insurance policy. You can compare Standard Information Statements for any policy available for purchase from any fund, including the level of cover, excess and price. The website is also a good resource of independent and reliable information about private health insurance.
Data collection The need to obtain independent, reliable data has been a key consideration in putting together the report. The data selected by the Ombudsman as the most appropriate available is collected by the industry regulator, the Australian Prudential Regulation Authority (APRA). APRA has supplied most of the data published in this report.
Funds report to APRA for regulatory purposes and not all of the data is publicly available. Some of this information is useful to consumers and is therefore reproduced in this report. You should note that the data is collected primarily for regulatory purposes and not for the purposes of the State of the Health Funds Report. Accordingly, it is important to read the accompanying text explaining the data in conjunction with the tables.
As funds differ in size, most of the statistical information is presented as percentages or dollar amounts per membership, for easier comparison. No attempt has been made to weight the importance of various indicators, as these are subjective judgements very much dependent on your particular circumstances, preferences and priorities. For this reason, it would not be valid to average all the scores indicated to obtain some form of consolidated performance or service delivery score.
The report provides you with additional information about the benefits that were paid by each fund over the last year. The report also provides information about the extent of cover provided for hospital, medical and general treatment, and any state based differences in coverage. The selection of indicators used in this report is not intended to represent the full range of factors that should be considered when comparing the performance of health funds. The range of indicators has been limited to those for which there is reliable comparative information available.
2016 | COMMONWEALTH OMBUDSMAN STATE OF THE HEALTH FUNDS REPORT | 5
KEY CONSUMER ISSUES
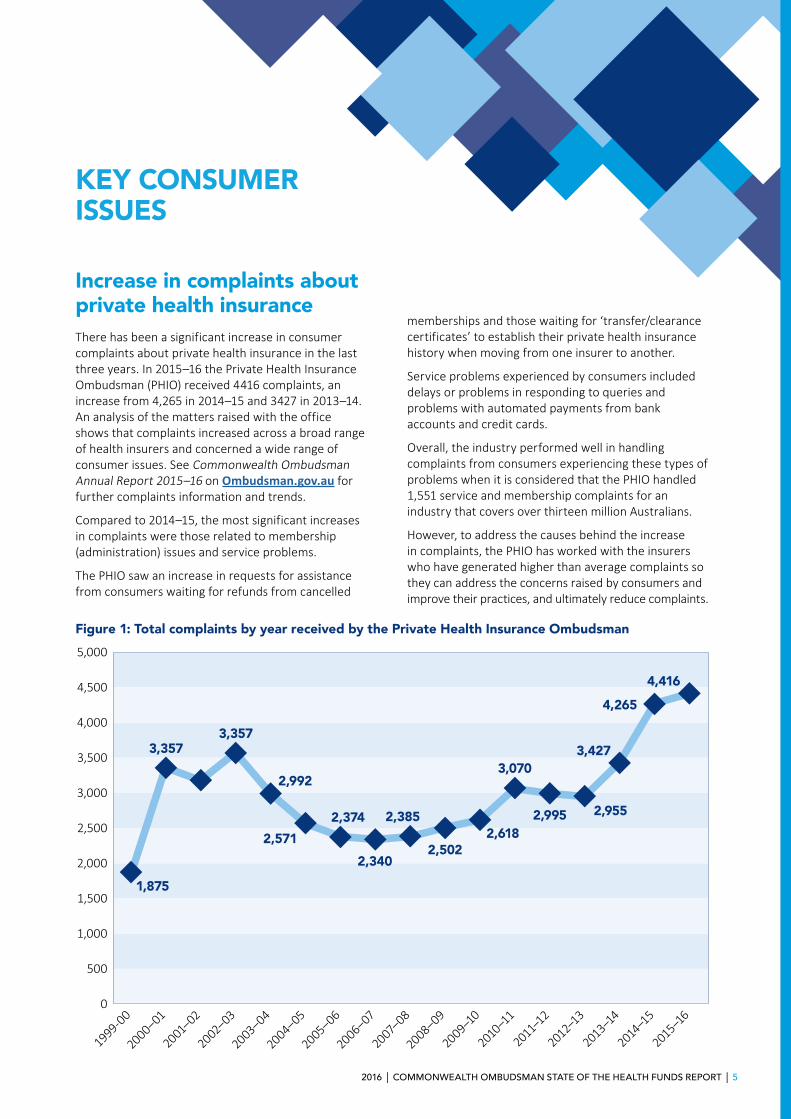
Increase in complaints about private health insuranceThere has been a significant increase in consumer complaints about private health insurance in the last three years. In 2015–16 the Private Health Insurance Ombudsman (PHIO) received 4416 complaints, an increase from 4,265 in 2014–15 and 3427 in 2013–14. An analysis of the matters raised with the office shows that complaints increased across a broad range of health insurers and concerned a wide range of consumer issues. See Commonwealth Ombudsman Annual Report 2015–16 on Ombudsman.gov.au for further complaints information and trends.
Compared to 2014–15, the most significant increases in complaints were those related to membership (administration) issues and service problems.
The PHIO saw an increase in requests for assistance from consumers waiting for refunds from cancelled
memberships and those waiting for ‘transfer/clearance certificates’ to establish their private health insurance history when moving from one insurer to another.
Service problems experienced by consumers included delays or problems in responding to queries and problems with automated payments from bank accounts and credit cards.
Overall, the industry performed well in handling complaints from consumers experiencing these types of problems when it is considered that the PHIO handled 1,551 service and membership complaints for an industry that covers over thirteen million Australians.
However, to address the causes behind the increase in complaints, the PHIO has worked with the insurers who have generated higher than average complaints so they can address the concerns raised by consumers and improve their practices, and ultimately reduce complaints.
Figure 1: Total complaints by year received by the Private Health Insurance Ombudsman
0
500
1,000
1,500
2,000
2,500
3,000
3,500
4,000
4,500
5,000
2015–16
2014–1
5
2013–14
2012–13
2011–12
2010–11
2009–10
2008–09
2007–08
2006–07
2005–06
2004–05
2003–04
2002–03
2001–02
2000–01
1999-00
1,875
3,3573,357
2,992
2,374 2,385
2,5022,618
3,070
2,995 2,955
3,427
4,265
4,416
2,571
2,340
6 | COMMONWEALTH OMBUDSMAN STATE OF THE HEALTH FUNDS REPORT | 2016
KE
Y C
ON
SUM
ER
ISS
UE
S Detrimental rule changes and the Australian Consumer LawDuring 2015–16, the Australian Competition and Consumer Commission (ACCC) released a report to the Australian Senate titled Communicating changes to private health insurance benefits.2 The report highlights the problem that, while health insurers may be complying with health insurance regulations and the Private Health Industry Code of Conduct when notifying their members of detrimental changes to policies, they still have broader obligations under the Australian Consumer Law to consider.
The ACCC’s report also outlines some poor insurer practices when communicating to health insurance consumers. The PHIO has also observed this issue when handling consumer complaints from those who have experienced a reduction in benefits and found they were not advised or were poorly advised about changes to their policies.
The PHIO has raised the ACCC’s report with health insurers who have made, or are considering making a detrimental change to benefits. We encourage all insurers to carefully consider the recommendations made in the report and to improve on, and learn from past experiences.
From the PHIO’s experience in listening to consumer concerns about changes to benefits, it seems that there is little understanding amongst consumers that health insurance products can change over time. It would be preferable for health insurers to provide this advice clearly at the point of sale or upgrade, rather than providing it in fine print at the end of membership guides. If consumers understand that from time to time the insurer may write to them and change their policy, then they are less likely to overlook important letters or emails and to be aware of how policy changes affect them.
The PHIO will continue investigating instances where there has been poor communication of detrimental rule changes. In considering allegations that an insurer did not properly notify affected members of a reduction in benefits, we consider the following key questions:
1. Did the communication unambiguously state that the change was a negative one? Was this message mixed up with positive marketing material?
From the perspective of the consumer, who is likely to have several companies writing to them regularly, an insurer is obliged to ensure important communications are not overlooked because they resemble inessential sales and marketing material. This is particularly important when considering subject lines used in email
messages – the PHIO encourages insurers to use clear and descriptive language to indicate the email contains detrimental or negative changes. Unfortunately the phrase “important changes to your policy” does not make it sufficiently clear to the consumer that the email contains a detrimental change or reduction in benefits.
2. Did the insurer use the address or email address at which the policyholder expected to receive important communications?
The PHIO has observed instances where insurers regularly wrote to a consumer by post, but then switched to email for an important notification, or vice versa. Switching the method of communication when notifying a reduction in benefits can cause some consumers to miss important messages. It is important for communications to be consistent so that consumers don’t overlook messages.
3. Was the consumer notified of their options to upgrade or transfer with continuity to a policy to maintain a benefit?
It is important not to be silent about a consumer’s ability to maintain their benefits by upgrading or transferring to another policy. Looking at this issue from the perspective of the policy holder, the PHIO can appreciate that policyholders may feel aggrieved to learn that they missed out on the opportunity to transfer to a new policy without waiting periods.
The PHIO recommends making upgrade and transfer options clear in the communication to the consumer, rather than offering a statement that a consumer can contact a call centre to discuss their needs. This isn’t particularly helpful advice because it does not convey the message that a person does not lose their existing benefits if they switch to an appropriate policy before the effective date of the policy change.
4. Had the policyholder commenced the policy shortly before the change and were they notified at commencement that it was about to change?
The PHIO’s view is that there can be a problem when a consumer has spent time and effort selecting a policy, only to have it changed shortly afterwards. There is an obligation on the insurer to ensure that changes to policies are communicated to people who commence policies during the lead up to a change in benefits. The PHIO is aware of instances where there seems to be a communication problem between the marketing/planning sections of a health insurer and its sales area, meaning that sales staff continue to sell policies which are shortly to become eliminated or to undergo major detrimental changes.
In instances where it is identified that a consumer was not made aware of an impending change to a policy, for whatever internal business reason, the PHIO’s view is
2 http://www.accc.gov.au/publications/private-health-insurance-reports/private-health-insurance-report-2014-15
2016 | COMMONWEALTH OMBUDSMAN STATE OF THE HEALTH FUNDS REPORT | 7
KE
Y C
ON
SUM
ER
ISSUE
S
that the consumer has a special case to remain under the old policy conditions for an extended period of time, or that some other measure should be taken to address the consumer’s complaint.
Provision of health insurance informationConsumers have a wide range of choice when it comes to selecting a health insurance policy in the Australian market. As at February 2017, the PHIO estimates that there are up to 230 hospital policies, up to 157 general treatment policies and up to 186 packaged combinations of hospital and general treatment policies for sale to the average consumer.3 There are further policies available to those who can access restricted insurers, and additional options for those wanting to mix and match hospital and general treatment policies.
Health insurance consumers looking to purchase a policy are able to make use of a range of tools to assist them choosing between insurers:
1. The website Privatehealth.gov.au lists all the policies and prices available for sale and provides a search facility to select a policy. As a government website, it is designed to show every policy option available to consumers without guiding the consumer to any particular insurer.
2. Consumers who want a service that provides more specific recommendations are able to use a commercial health insurance broker. Some consumers are happy to use a broker service and understand that there would be some form of payment for the service, which the insurer pays to the broker.
3. Health insurance recommendations and advice is provided by consumer organisations such as Choice Magazine and the Australian Consumers Association, who provide regular information to their membership.
From the perspective of the PHIO and the yearly discussions we have with more than 8,000 consumers and complainants, the main problem with information provision is not the number of policies available when a consumer is purchasing a policy, but with the challenges of understanding and using a health insurance policy once it has been purchased.
Confusion over understanding the terminology used by health insurers and what these mean to an individual consumer when they are seeking to claim from their policy are the overriding themes of most of the complaints received by the PHIO.
Examples of terms where the ‘fine print’ meaning varies widely between insurers include: ‘obesity and weight loss surgery’; ‘minor knee/gynaecological/eye surgery’; ‘major dental’; ‘emergency treatment’; ‘emergency ambulance’; ‘accidental injury’; and ‘joint replacement’.
While each insurer develops its own specific definition of the terms contained in its fund rules, the problem is that these terms also have a broad meaning within the general population and the medical profession. In instances where the general meaning of a term conflicts with a more restrictive definition set by the insurer, a consumer can feel aggrieved that the policy has not met their expectations and the insurer is being unreasonable.
The current reform of health insurance being considered by the government, and in particular its work on simplifying and standardising terms used by health insurers, is a welcome change which will hopefully reduce the incidence of problems for consumers.
The performance of private health insurers During the reporting year 2015–16 the health insurance industry returned 86.1% of contributions to policy holders in paying benefits towards hospital and general treatment costs. This compares to the previous year where 87.1% of contributions were returned.4
There are significant differences in performance between insurers in with some returning over 90% of contributions as benefits compared to the industry average of 86.1%.
There are many variables that contribute to the reported performance of an insurer, ranging from its geographic location in Australia to the age composition of its membership and level of surplus/profit or loss. However, the overall return of benefits to contributors is an easy to understand method of comparing different health insurers and how they have performed in providing for the needs of their contributors.
In addition to the financial performance of an insurer, the PHIO considers that the incidence of complaint is a good measure of an insurer’s performance as it is an indicator of which insurers are better at providing benefits and services to policy holders.
3 PHIO Quarterly Bulletin 81 provides further information on the number of policies available to consumers.
4 Australian Prudential Regulation Authority: Operations of the Private Health Insurers Report 2015–16 and 2014–15 http://apra.gov.au/PHI/Publications/Pages/Operations-of-Private-Health-Insurers-Annual-Report.aspx
8 | COMMONWEALTH OMBUDSMAN STATE OF THE HEALTH FUNDS REPORT | 2016
KE
Y C
ON
SUM
ER
ISS
UE
S Consumer information website — Privatehealth.gov.au The consumer website Privatehealth.gov.au was introduced in 2007, publishing Standard Information Statements from all funds as well as providing general private health insurance information. The website has allowed many consumers to compare health insurance policies since it was introduced and its usage has increased annually.
The website aims to foster competition in the industry by helping consumers compare and choose health insurance policies. The website also provides an interface to assist funds in meeting their obligations to provide up-to-date Standard Information Statements.
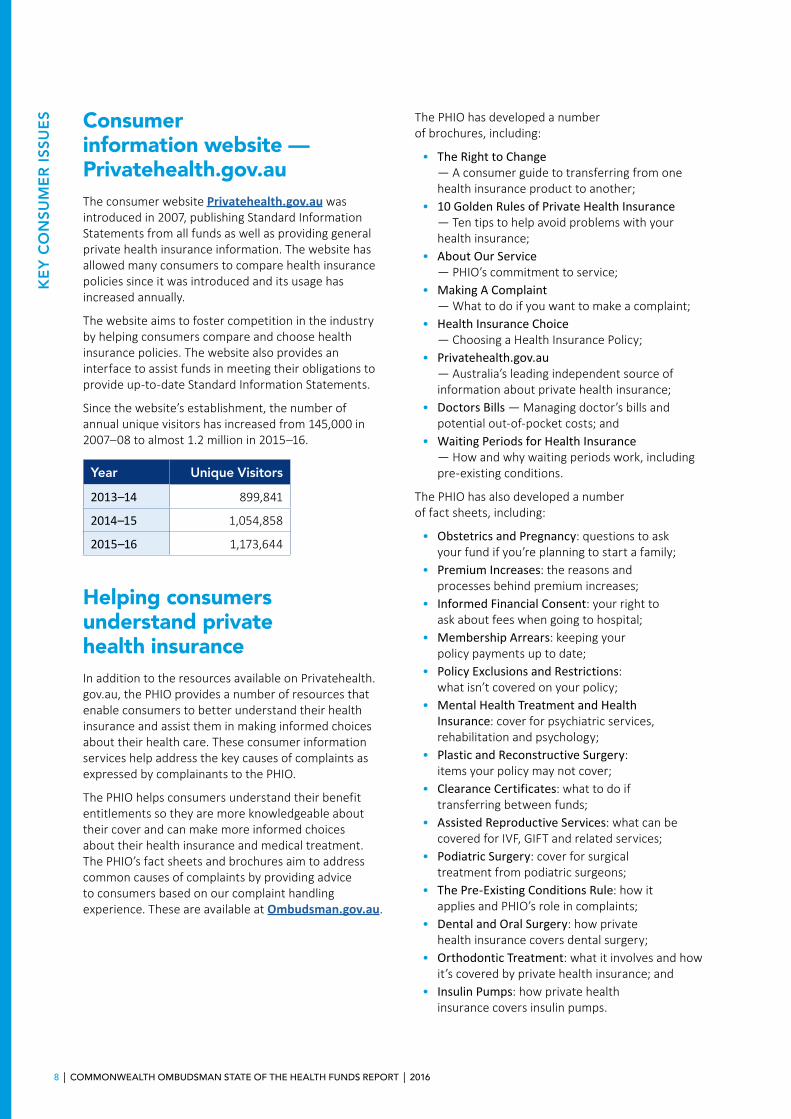
Since the website’s establishment, the number of annual unique visitors has increased from 145,000 in 2007–08 to almost 1.2 million in 2015–16.
Year Unique Visitors
2013–14 899,841
2014–15 1,054,858
2015–16 1,173,644
Helping consumers understand private health insuranceIn addition to the resources available on Privatehealth.gov.au, the PHIO provides a number of resources that enable consumers to better understand their health insurance and assist them in making informed choices about their health care. These consumer information services help address the key causes of complaints as expressed by complainants to the PHIO.
The PHIO helps consumers understand their benefit entitlements so they are more knowledgeable about their cover and can make more informed choices about their health insurance and medical treatment. The PHIO’s fact sheets and brochures aim to address common causes of complaints by providing advice to consumers based on our complaint handling experience. These are available at Ombudsman.gov.au.
The PHIO has developed a number of brochures, including:
• The Right to Change — A consumer guide to transferring from one health insurance product to another;
• 10 Golden Rules of Private Health Insurance — Ten tips to help avoid problems with your health insurance;
• About Our Service — PHIO’s commitment to service;
• Making A Complaint — What to do if you want to make a complaint;
• Health Insurance Choice — Choosing a Health Insurance Policy;
• Privatehealth.gov.au — Australia’s leading independent source of information about private health insurance;
• Doctors Bills — Managing doctor’s bills and potential out-of-pocket costs; and
• Waiting Periods for Health Insurance — How and why waiting periods work, including pre-existing conditions.
The PHIO has also developed a number of fact sheets, including:
• Obstetrics and Pregnancy: questions to ask your fund if you’re planning to start a family;
• Premium Increases: the reasons and processes behind premium increases;
• Informed Financial Consent: your right to ask about fees when going to hospital;
• Membership Arrears: keeping your policy payments up to date;
• Policy Exclusions and Restrictions: what isn’t covered on your policy;
• Mental Health Treatment and Health Insurance: cover for psychiatric services, rehabilitation and psychology;
• Plastic and Reconstructive Surgery: items your policy may not cover;
• Clearance Certificates: what to do if transferring between funds;
• Assisted Reproductive Services: what can be covered for IVF, GIFT and related services;
• Podiatric Surgery: cover for surgical treatment from podiatric surgeons;
• The Pre-Existing Conditions Rule: how it applies and PHIO’s role in complaints;
• Dental and Oral Surgery: how private health insurance covers dental surgery;
• Orthodontic Treatment: what it involves and how it’s covered by private health insurance; and
• Insulin Pumps: how private health insurance covers insulin pumps.
2016 | COMMONWEALTH OMBUDSMAN STATE OF THE HEALTH FUNDS REPORT | 9
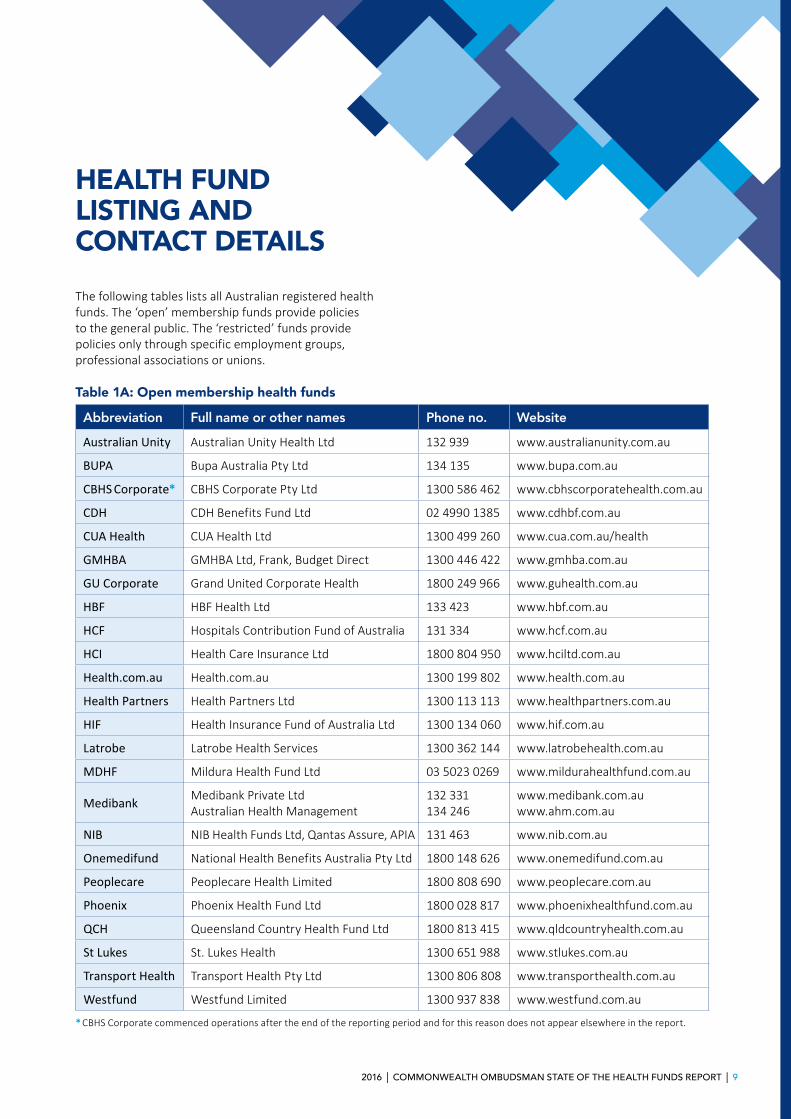
HEALTH FUND LISTING AND CONTACT DETAILS
The following tables lists all Australian registered health funds. The ‘open’ membership funds provide policies to the general public. The ‘restricted’ funds provide policies only through specific employment groups, professional associations or unions.
Table 1A: Open membership health funds
Abbreviation Full name or other names Phone no. Website
Australian Unity Australian Unity Health Ltd 132 939 www.australianunity.com.au
BUPA Bupa Australia Pty Ltd 134 135 www.bupa.com.au
CBHS Corporate* CBHS Corporate Pty Ltd 1300 586 462 www.cbhscorporatehealth.com.au
CDH CDH Benefits Fund Ltd 02 4990 1385 www.cdhbf.com.au
CUA Health CUA Health Ltd 1300 499 260 www.cua.com.au/health
GMHBA GMHBA Ltd, Frank, Budget Direct 1300 446 422 www.gmhba.com.au
GU Corporate Grand United Corporate Health 1800 249 966 www.guhealth.com.au
HBF HBF Health Ltd 133 423 www.hbf.com.au
HCF Hospitals Contribution Fund of Australia 131 334 www.hcf.com.au
HCI Health Care Insurance Ltd 1800 804 950 www.hciltd.com.au
Health.com.au Health.com.au 1300 199 802 www.health.com.au
Health Partners Health Partners Ltd 1300 113 113 www.healthpartners.com.au
HIF Health Insurance Fund of Australia Ltd 1300 134 060 www.hif.com.au
Latrobe Latrobe Health Services 1300 362 144 www.latrobehealth.com.au
MDHF Mildura Health Fund Ltd 03 5023 0269 www.mildurahealthfund.com.au
MedibankMedibank Private Ltd Australian Health Management
132 331 134 246
www.medibank.com.au www.ahm.com.au
NIB NIB Health Funds Ltd, Qantas Assure, APIA 131 463 www.nib.com.au
Onemedifund National Health Benefits Australia Pty Ltd 1800 148 626 www.onemedifund.com.au
Peoplecare Peoplecare Health Limited 1800 808 690 www.peoplecare.com.au
Phoenix Phoenix Health Fund Ltd 1800 028 817 www.phoenixhealthfund.com.au
QCH Queensland Country Health Fund Ltd 1800 813 415 www.qldcountryhealth.com.au
St Lukes St. Lukes Health 1300 651 988 www.stlukes.com.au
Transport Health Transport Health Pty Ltd 1300 806 808 www.transporthealth.com.au
Westfund Westfund Limited 1300 937 838 www.westfund.com.au
* CBHS Corporate commenced operations after the end of the reporting period and for this reason does not appear elsewhere in the report.
10 | COMMONWEALTH OMBUDSMAN STATE OF THE HEALTH FUNDS REPORT | 2016
HE
ALT
H F
UN
D L
IST
ING
AN
D C
ON
TAC
T D
ETA
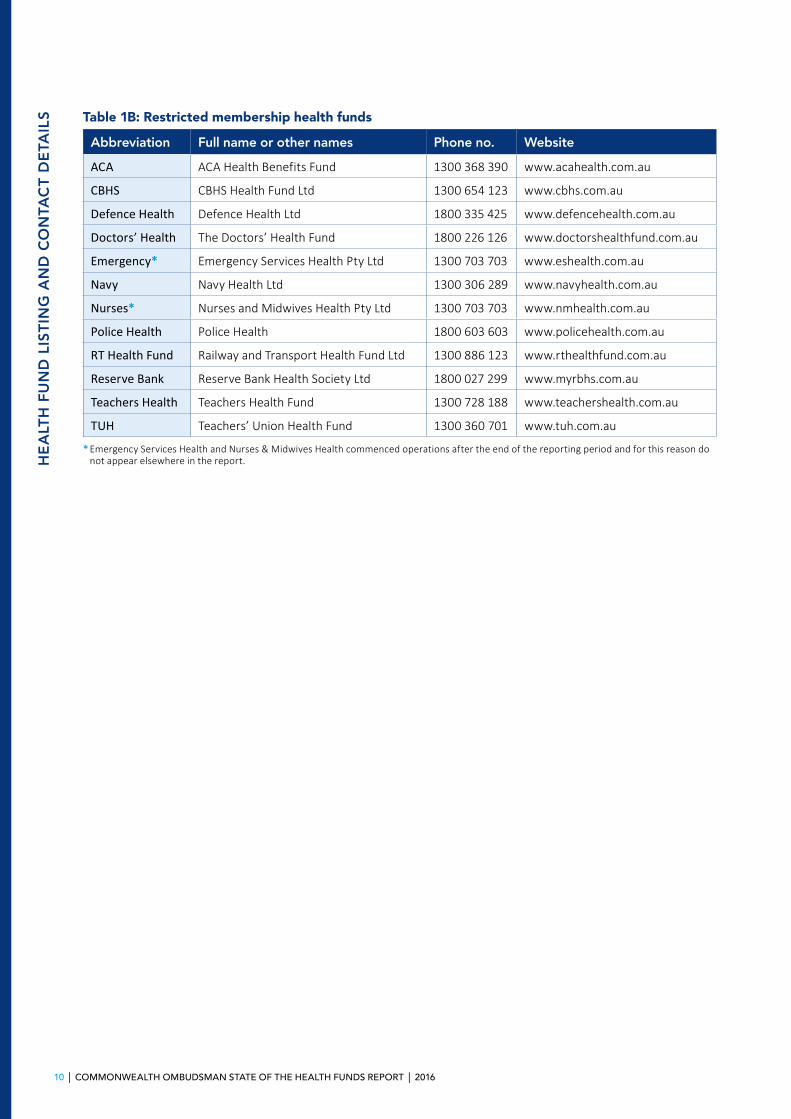
ILS Table 1B: Restricted membership health funds
Abbreviation Full name or other names Phone no. Website
ACA ACA Health Benefits Fund 1300 368 390 www.acahealth.com.au
CBHS CBHS Health Fund Ltd 1300 654 123 www.cbhs.com.au
Defence Health Defence Health Ltd 1800 335 425 www.defencehealth.com.au
Doctors’ Health The Doctors’ Health Fund 1800 226 126 www.doctorshealthfund.com.au
Emergency* Emergency Services Health Pty Ltd 1300 703 703 www.eshealth.com.au
Navy Navy Health Ltd 1300 306 289 www.navyhealth.com.au
Nurses* Nurses and Midwives Health Pty Ltd 1300 703 703 www.nmhealth.com.au
Police Health Police Health 1800 603 603 www.policehealth.com.au
RT Health Fund Railway and Transport Health Fund Ltd 1300 886 123 www.rthealthfund.com.au
Reserve Bank Reserve Bank Health Society Ltd 1800 027 299 www.myrbhs.com.au
Teachers Health Teachers Health Fund 1300 728 188 www.teachershealth.com.au
TUH Teachers’ Union Health Fund 1300 360 701 www.tuh.com.au
* Emergency Services Health and Nurses & Midwives Health commenced operations after the end of the reporting period and for this reason do not appear elsewhere in the report.
2016 | COMMONWEALTH OMBUDSMAN STATE OF THE HEALTH FUNDS REPORT | 11
SERVICE PERFORMANCE
The level of complaints that the PHIO receives about a fund, relative to its market share, is a reasonable indicator of the service performance of most funds.
Whether a fund can attract new members and, more importantly, retain members is also an indicator of member satisfaction.
Member retentionThe member retention indicator is used as one measure of the comparative effectiveness of health funds and their level of member satisfaction. This indicator measures what percentage of fund members (hospital memberships only) have remained with the fund for two years or more. Figures are not adjusted for policies that lapse when a member dies, as these are not reported to APRA.
Most restricted membership funds rate well on this measure compared to open membership funds. This may be due to the particular features of restricted membership funds, especially their links with employment.
Membership changeThe membership change indicator shows the change in the number of policy holders over the year from 30 June 2015 to 30 June 2016. Both the percentage change and number are included. Negative figures indicate that the fund has experienced a net reduction in membership over the period. As indicated above, member deaths would account for some of this figure.
PHIO complaints in contextThe number of complaints received by the PHIO is very small compared to fund membership.
There are a number of factors (other than service performance) that can influence the level of complaints the PHIO receives about a fund. These include the information provided to fund members about the PHIO through general publicity or by the fund and the effectiveness of the fund’s own complaint handling process.
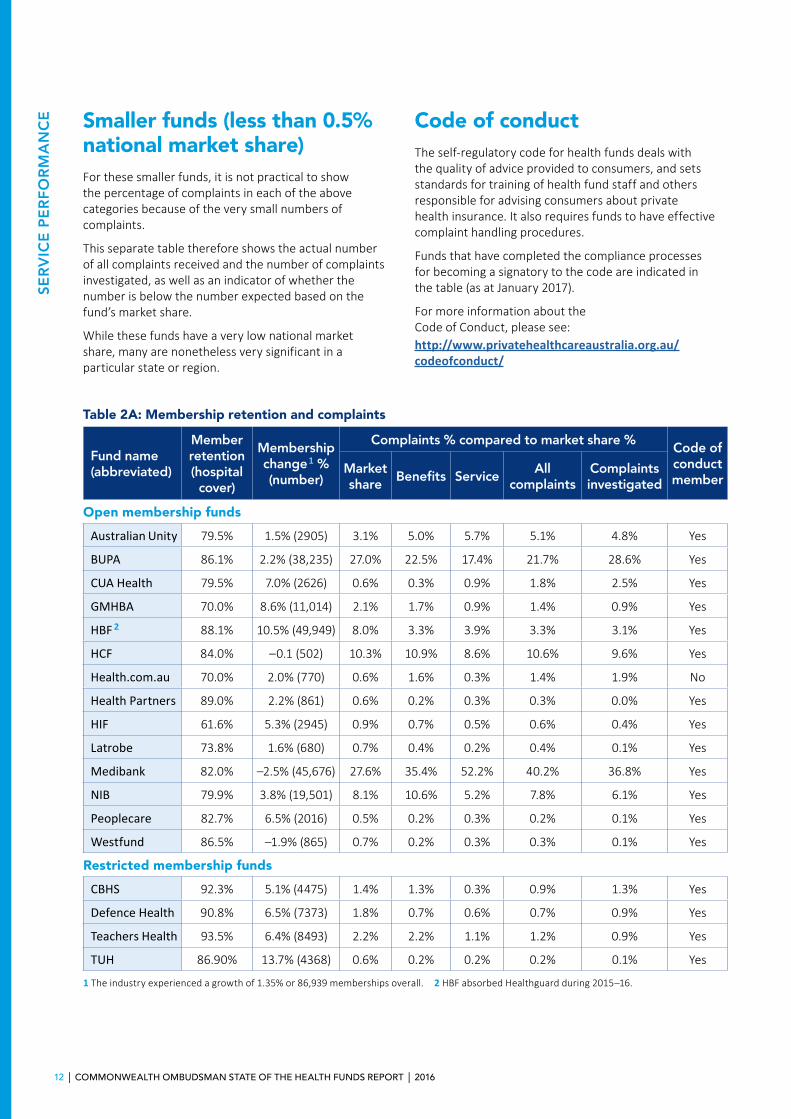
Complaints percentage compared to market share percentageThe first table includes all funds with a national market share of 0.5% or more.
In that table each fund’s market share (as at 30 June 2016) is shown in the ‘market share’ column. Subsequent columns show the percentage of the PHIO complaints in various categories, received about each fund. These percentages should be compared with the market share percentage. If a fund has a higher complaints percentage than its market share, it indicates that members of that fund are more likely, on average, to complain than all fund members.
The table also indicates what percentage of Benefit and Service complaints are received about each fund:
Benefit complaints include problems of non-payment, delayed payment, the level of benefit paid, or the level of gap needing to be paid by the member.
Service complaints are about the general quality of service provided by fund staff, the quality of customer service advice, and premium payment problems.
All Complaints takes account of all complaints received by the PHIO about the fund. All Complaints includes Complaints Investigated as well as complaints that were finalised without the need for investigation.
Complaints Investigated is a measure of how many complaints required a higher level of intervention from the Ombudsman. Most complaints to the Ombudsman can be finalised by referring the matter to fund staff to resolve, or by PHIO staff providing information to the complainant. Complaints which fund staff have not been able to resolve to a member’s satisfaction are investigated by the Ombudsman’s office — so the rating on complaints investigated is an indicator of the effectiveness of each fund’s own internal complaints handling.
12 | COMMONWEALTH OMBUDSMAN STATE OF THE HEALTH FUNDS REPORT | 2016
SE
RV
ICE
PE
RF
OR
MA
NC
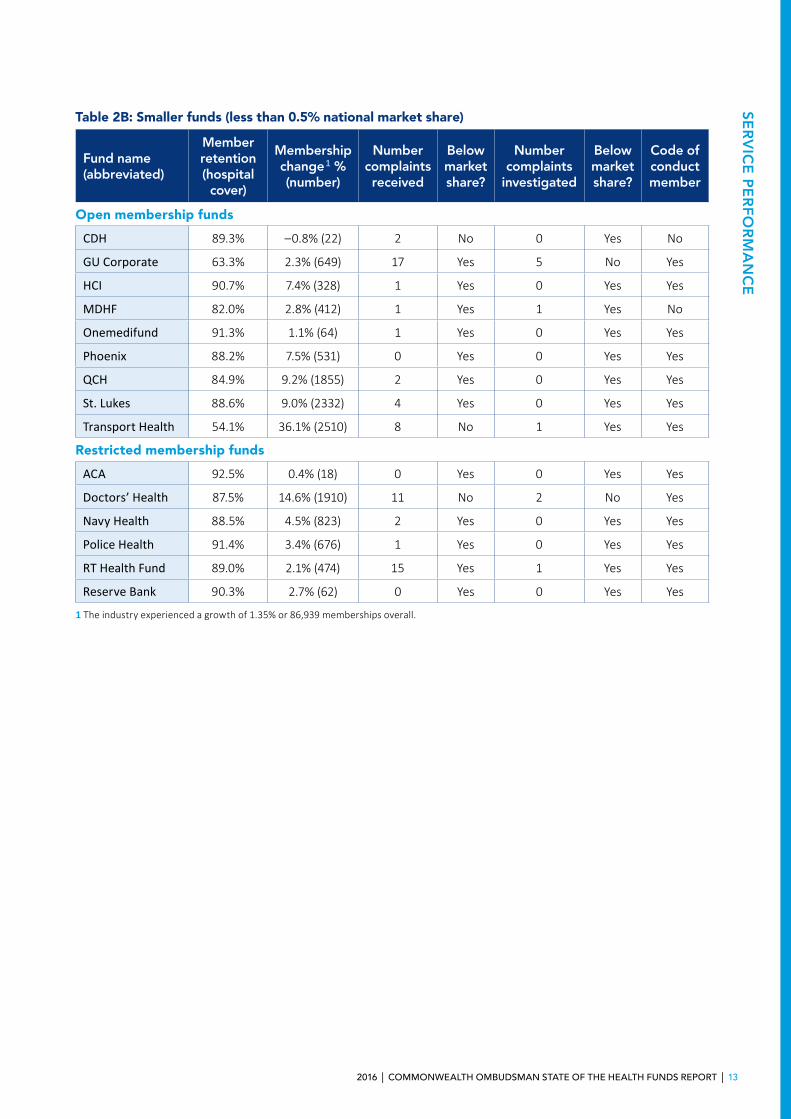
E Smaller funds (less than 0.5% national market share)For these smaller funds, it is not practical to show the percentage of complaints in each of the above categories because of the very small numbers of complaints.
This separate table therefore shows the actual number of all complaints received and the number of complaints investigated, as well as an indicator of whether the number is below the number expected based on the fund’s market share.
While these funds have a very low national market share, many are nonetheless very significant in a particular state or region.
Code of conductThe self-regulatory code for health funds deals with the quality of advice provided to consumers, and sets standards for training of health fund staff and others responsible for advising consumers about private health insurance. It also requires funds to have effective complaint handling procedures.
Funds that have completed the compliance processes for becoming a signatory to the code are indicated in the table (as at January 2017).
For more information about the Code of Conduct, please see:http://www.privatehealthcareaustralia.org.au/codeofconduct/
Table 2A: Membership retention and complaints
Fund name (abbreviated)
Member retention (hospital cover)
Membership change 1 % (number)
Complaints % compared to market share % Code of conduct member
Market share
Benefits ServiceAll
complaints Complaints investigated
Open membership funds
Australian Unity 79.5% 1.5% (2905) 3.1% 5.0% 5.7% 5.1% 4.8% Yes
BUPA 86.1% 2.2% (38,235) 27.0% 22.5% 17.4% 21.7% 28.6% Yes
CUA Health 79.5% 7.0% (2626) 0.6% 0.3% 0.9% 1.8% 2.5% Yes
GMHBA 70.0% 8.6% (11,014) 2.1% 1.7% 0.9% 1.4% 0.9% Yes
HBF 2 88.1% 10.5% (49,949) 8.0% 3.3% 3.9% 3.3% 3.1% Yes
HCF 84.0% –0.1 (502) 10.3% 10.9% 8.6% 10.6% 9.6% Yes
Health.com.au 70.0% 2.0% (770) 0.6% 1.6% 0.3% 1.4% 1.9% No
Health Partners 89.0% 2.2% (861) 0.6% 0.2% 0.3% 0.3% 0.0% Yes
HIF 61.6% 5.3% (2945) 0.9% 0.7% 0.5% 0.6% 0.4% Yes
Latrobe 73.8% 1.6% (680) 0.7% 0.4% 0.2% 0.4% 0.1% Yes
Medibank 82.0% –2.5% (45,676) 27.6% 35.4% 52.2% 40.2% 36.8% Yes
NIB 79.9% 3.8% (19,501) 8.1% 10.6% 5.2% 7.8% 6.1% Yes
Peoplecare 82.7% 6.5% (2016) 0.5% 0.2% 0.3% 0.2% 0.1% Yes
Westfund 86.5% –1.9% (865) 0.7% 0.2% 0.3% 0.3% 0.1% Yes
Restricted membership funds
CBHS 92.3% 5.1% (4475) 1.4% 1.3% 0.3% 0.9% 1.3% Yes
Defence Health 90.8% 6.5% (7373) 1.8% 0.7% 0.6% 0.7% 0.9% Yes
Teachers Health 93.5% 6.4% (8493) 2.2% 2.2% 1.1% 1.2% 0.9% Yes
TUH 86.90% 13.7% (4368) 0.6% 0.2% 0.2% 0.2% 0.1% Yes
1 The industry experienced a growth of 1.35% or 86,939 memberships overall. 2 HBF absorbed Healthguard during 2015–16.
2016 | COMMONWEALTH OMBUDSMAN STATE OF THE HEALTH FUNDS REPORT | 13
SE
RV
ICE
PE
RF
OR
MA
NC
E
Table 2B: Smaller funds (less than 0.5% national market share)
Fund name (abbreviated)
Member retention (hospital cover)
Membership change 1 % (number)
Number complaints received
Below market share?
Number complaints
investigated
Below market share?
Code of conduct member
Open membership funds
CDH 89.3% –0.8% (22) 2 No 0 Yes No
GU Corporate 63.3% 2.3% (649) 17 Yes 5 No Yes
HCI 90.7% 7.4% (328) 1 Yes 0 Yes Yes
MDHF 82.0% 2.8% (412) 1 Yes 1 Yes No
Onemedifund 91.3% 1.1% (64) 1 Yes 0 Yes Yes
Phoenix 88.2% 7.5% (531) 0 Yes 0 Yes Yes
QCH 84.9% 9.2% (1855) 2 Yes 0 Yes Yes
St. Lukes 88.6% 9.0% (2332) 4 Yes 0 Yes Yes
Transport Health 54.1% 36.1% (2510) 8 No 1 Yes Yes
Restricted membership funds
ACA 92.5% 0.4% (18) 0 Yes 0 Yes Yes
Doctors’ Health 87.5% 14.6% (1910) 11 No 2 No Yes
Navy Health 88.5% 4.5% (823) 2 Yes 0 Yes Yes
Police Health 91.4% 3.4% (676) 1 Yes 0 Yes Yes
RT Health Fund 89.0% 2.1% (474) 15 Yes 1 Yes Yes
Reserve Bank 90.3% 2.7% (62) 0 Yes 0 Yes Yes
1 The industry experienced a growth of 1.35% or 86,939 memberships overall.
14 | COMMONWEALTH OMBUDSMAN STATE OF THE HEALTH FUNDS REPORT | 2016
HOSPITAL
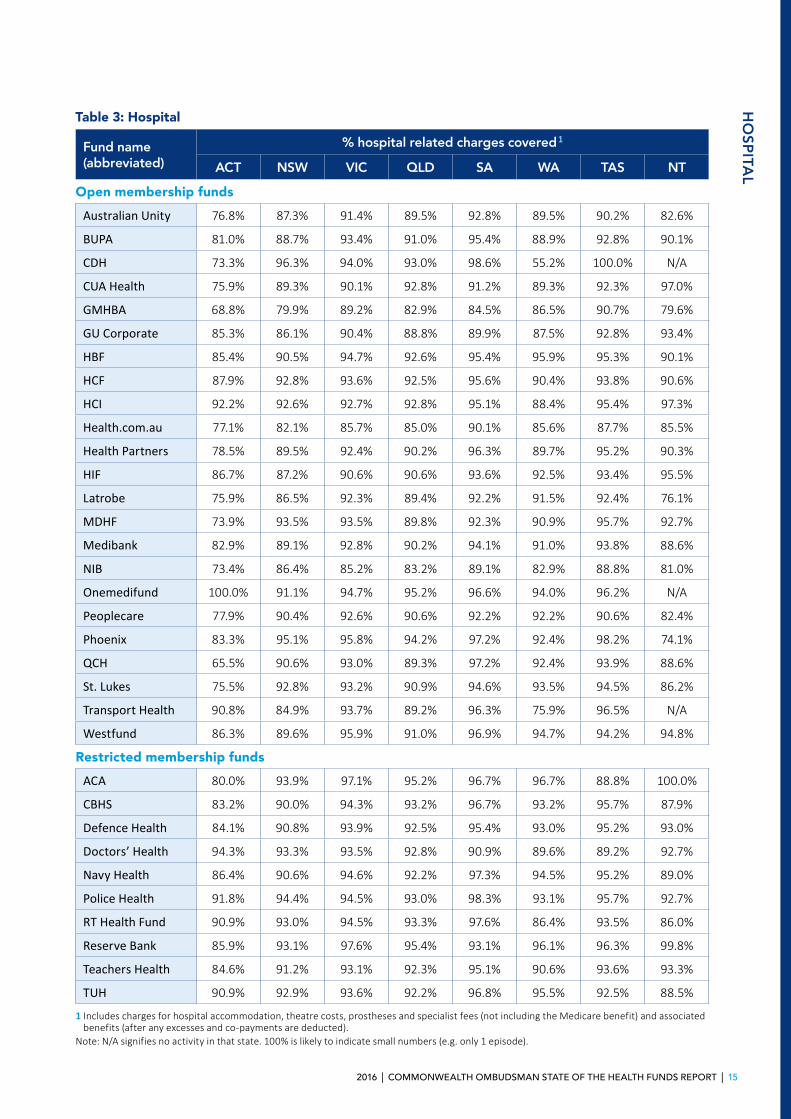
This table provides a general comparison of health insurance for private hospital treatment. A higher percentage indicates that, on average, the fund’s members are covered for a higher proportion of hospital charges.
It’s important to remember most funds offer a choice of different policies — the percentages indicated in this table aren’t indicative of any single policy, but are an average of all policies offered by the fund.
Hospital policiesThis table provides a general comparison of health insurance for private hospital treatment (hospital policies) provided by each fund.
Hospital policies provide benefits towards the following costs if you elect to be a private patient in a private or public hospital:
• hospital fees for accommodation, operating theatre charges and other charges raised by the hospital;
• the costs of drugs or prostheses required for hospital treatment; and
• fees charged by doctors (surgeons, anaesthetists, pathologists, etc) for in-hospital treatment.
Most funds offer a range of different policies providing hospital cover. These policies may differ on the basis of the range of treatments that are covered, to what extent those treatments are covered, the level of excess or co-payments you may be required to pay if you go to hospital, and the price and discounts available to you.
Hospital charges coveredThis column indicates the proportion of total charges associated with treatment of private patients covered by each fund’s benefits. This includes charges for hospital accommodation, theatre costs, prostheses and specialist fees (not including the Medicare benefit), excesses or co-payments and associated benefits.
The figures shown are average outcomes across all of each fund’s hospital policies. Higher cost policies will generally cover a greater proportion of charges than indicated by this average. Cheaper policies, including those with higher excesses or co-payments, may cover less.
The use of an average figure applying across all of each fund’s policies will mean that funds with a high proportion of their membership in lower cost/ restricted and excluded benefit policies will have a lower average figure.
Information is not provided for some funds in some states, where there were insufficient numbers reported to APRA — generally this occurs in states where the fund does not have a large membership.
The information provided in this table presents the position taking account of all of each fund’s policies. It is not indicative of any individual policy offered by the fund but is an average for the total fund membership.
Additional information The separate ‘Health Fund Operations’ by State or Territory tables in this report includes information on the number of “agreement hospitals” under contract to each fund in each state.
For additional information on the medical gap benefits provided through hospital policies, please refer to the separate ‘Medical Gap Schemes’ section.
The PHIO brochure ‘Health Insurance Choice: Selecting a Health Insurance Policy’ includes important advice on what to consider and what questions to ask when selecting a hospital cover policy. It also includes information on government incentives relating to hospital policies such as the ‘Medicare Levy Surcharge Exemption’ and ‘Lifetime Health Cover’. The brochure is available on Ombudsman.gov.au and Privatehealth.gov.au.
PHIO consumer websiteThe Privatehealth.gov.au website provides information about all private health insurance policies available in Australia, including benefits, prices and agreement hospitals for each health fund.
2016 | COMMONWEALTH OMBUDSMAN STATE OF THE HEALTH FUNDS REPORT | 15
HO
SP
ITAL
Table 3: Hospital
Fund name (abbreviated)
% hospital related charges covered 1
ACT NSW VIC QLD SA WA TAS NT
Open membership funds
Australian Unity 76.8% 87.3% 91.4% 89.5% 92.8% 89.5% 90.2% 82.6%
BUPA 81.0% 88.7% 93.4% 91.0% 95.4% 88.9% 92.8% 90.1%
CDH 73.3% 96.3% 94.0% 93.0% 98.6% 55.2% 100.0% N/A
CUA Health 75.9% 89.3% 90.1% 92.8% 91.2% 89.3% 92.3% 97.0%
GMHBA 68.8% 79.9% 89.2% 82.9% 84.5% 86.5% 90.7% 79.6%
GU Corporate 85.3% 86.1% 90.4% 88.8% 89.9% 87.5% 92.8% 93.4%
HBF 85.4% 90.5% 94.7% 92.6% 95.4% 95.9% 95.3% 90.1%
HCF 87.9% 92.8% 93.6% 92.5% 95.6% 90.4% 93.8% 90.6%
HCI 92.2% 92.6% 92.7% 92.8% 95.1% 88.4% 95.4% 97.3%
Health.com.au 77.1% 82.1% 85.7% 85.0% 90.1% 85.6% 87.7% 85.5%
Health Partners 78.5% 89.5% 92.4% 90.2% 96.3% 89.7% 95.2% 90.3%
HIF 86.7% 87.2% 90.6% 90.6% 93.6% 92.5% 93.4% 95.5%
Latrobe 75.9% 86.5% 92.3% 89.4% 92.2% 91.5% 92.4% 76.1%
MDHF 73.9% 93.5% 93.5% 89.8% 92.3% 90.9% 95.7% 92.7%
Medibank 82.9% 89.1% 92.8% 90.2% 94.1% 91.0% 93.8% 88.6%
NIB 73.4% 86.4% 85.2% 83.2% 89.1% 82.9% 88.8% 81.0%
Onemedifund 100.0% 91.1% 94.7% 95.2% 96.6% 94.0% 96.2% N/A
Peoplecare 77.9% 90.4% 92.6% 90.6% 92.2% 92.2% 90.6% 82.4%
Phoenix 83.3% 95.1% 95.8% 94.2% 97.2% 92.4% 98.2% 74.1%
QCH 65.5% 90.6% 93.0% 89.3% 97.2% 92.4% 93.9% 88.6%
St. Lukes 75.5% 92.8% 93.2% 90.9% 94.6% 93.5% 94.5% 86.2%
Transport Health 90.8% 84.9% 93.7% 89.2% 96.3% 75.9% 96.5% N/A
Westfund 86.3% 89.6% 95.9% 91.0% 96.9% 94.7% 94.2% 94.8%
Restricted membership funds
ACA 80.0% 93.9% 97.1% 95.2% 96.7% 96.7% 88.8% 100.0%
CBHS 83.2% 90.0% 94.3% 93.2% 96.7% 93.2% 95.7% 87.9%
Defence Health 84.1% 90.8% 93.9% 92.5% 95.4% 93.0% 95.2% 93.0%
Doctors’ Health 94.3% 93.3% 93.5% 92.8% 90.9% 89.6% 89.2% 92.7%
Navy Health 86.4% 90.6% 94.6% 92.2% 97.3% 94.5% 95.2% 89.0%
Police Health 91.8% 94.4% 94.5% 93.0% 98.3% 93.1% 95.7% 92.7%
RT Health Fund 90.9% 93.0% 94.5% 93.3% 97.6% 86.4% 93.5% 86.0%
Reserve Bank 85.9% 93.1% 97.6% 95.4% 93.1% 96.1% 96.3% 99.8%
Teachers Health 84.6% 91.2% 93.1% 92.3% 95.1% 90.6% 93.6% 93.3%
TUH 90.9% 92.9% 93.6% 92.2% 96.8% 95.5% 92.5% 88.5%
1 Includes charges for hospital accommodation, theatre costs, prostheses and specialist fees (not including the Medicare benefit) and associated benefits (after any excesses and co-payments are deducted).
Note: N/A signifies no activity in that state. 100% is likely to indicate small numbers (e.g. only 1 episode).
16 | COMMONWEALTH OMBUDSMAN STATE OF THE HEALTH FUNDS REPORT | 2016
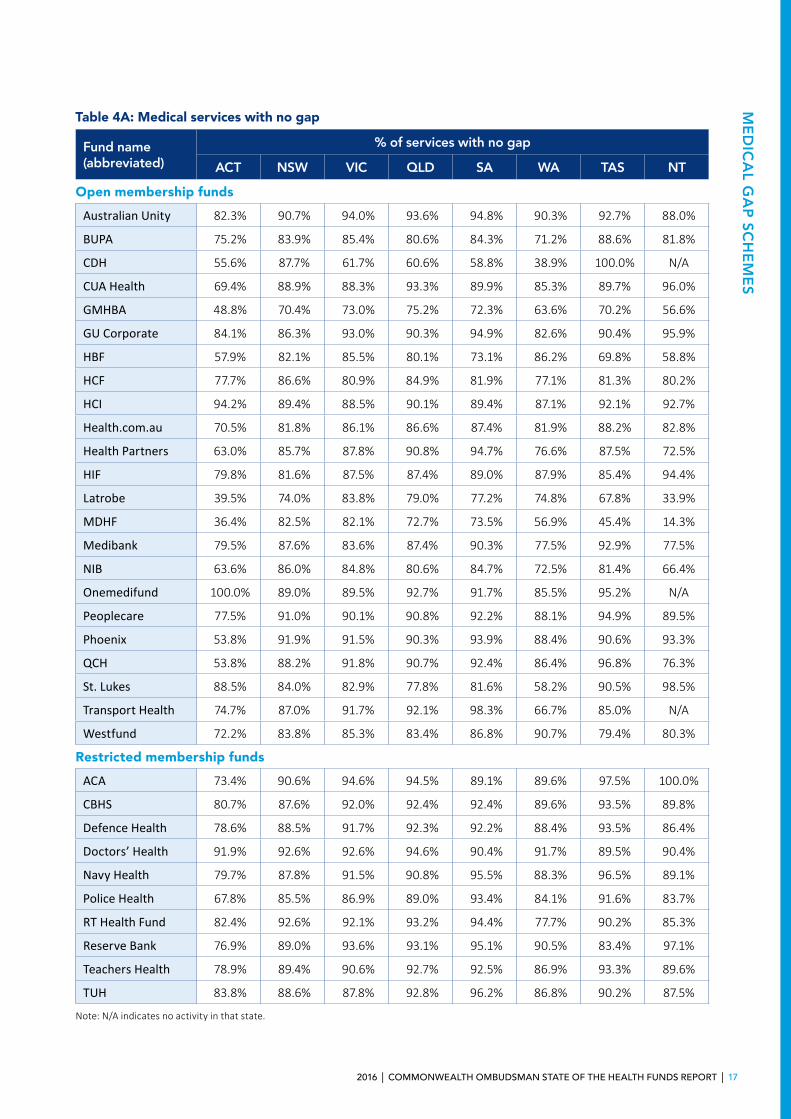
MEDICAL GAP SCHEMES
Health insurer medical gap schemes are designed to eliminate or reduce the out-of-pocket costs incurred by patients for in-hospital medical services. If a service is ‘no gap,’ it means no cost was incurred by the patient as the full cost was covered by Medicare and the health fund. A reduced cost is incurred by the patient for what is called a ‘known gap’ service.
If a health fund has a higher percentage of services covered at no gap than other funds, it indicates the fund has a more effective gap scheme in that state. The figures provided are averages — it is no guarantee that a particular doctor will choose to use the fund’s gap scheme.
Fund gap schemes and agreementsDoctors are free to decide whether or not to use a particular fund’s gap cover arrangements for each individual patient. Factors that can affect the acceptance of the scheme by doctors include:
• whether the fund has a substantial share of the health insurance market in a particular state or region;
• the level of fund benefits paid under the gap arrangements (compared with the doctor’s desired fee); and
• the design of the fund’s gap cover arrangements, including any administrative burden for the doctor.
State-based differencesInformation is provided on a state basis because the effectiveness of some funds’ gap schemes can differ between states and these differences are not apparent in the national figures.
Most differences are due to the level of doctor’s fees, which vary significantly between different states, and between regional areas and capital cities. In some states, funds are able to provide more effective coverage of gaps because doctors charge less than the national average. In addition, where a doctor’s fee for an in-hospital service is at or below the Medicare Benefits Schedule fee, there will be no gap to the fund member.
If a health fund’s percentage of services with no gap is higher than that of a fund in another state, it does not necessarily mean the fund’s scheme is more effective, because state based differences could be the cause.
Information is not provided for some funds in some states, as the numbers are not reported to APRA for states in which the fund does not have a sufficiently large membership (in which case, these figures are included with figures for the state in which a fund has the largest number of members).
Comparing different gap schemesIf a health fund has a higher percentage of services covered at no gap (in the same state/territory) compared with another fund, it is an indicator of a more effective gap scheme in that state. Over the whole fund, it is more likely that a medical service can be provided at no cost to the consumer, but it is no guarantee that a particular doctor will choose to use the fund’s gap scheme.
Percentage of Services With No Gaps — The proportion of services for which a gap is not payable by the patient after the impact of fund benefits, schemes and agreements.
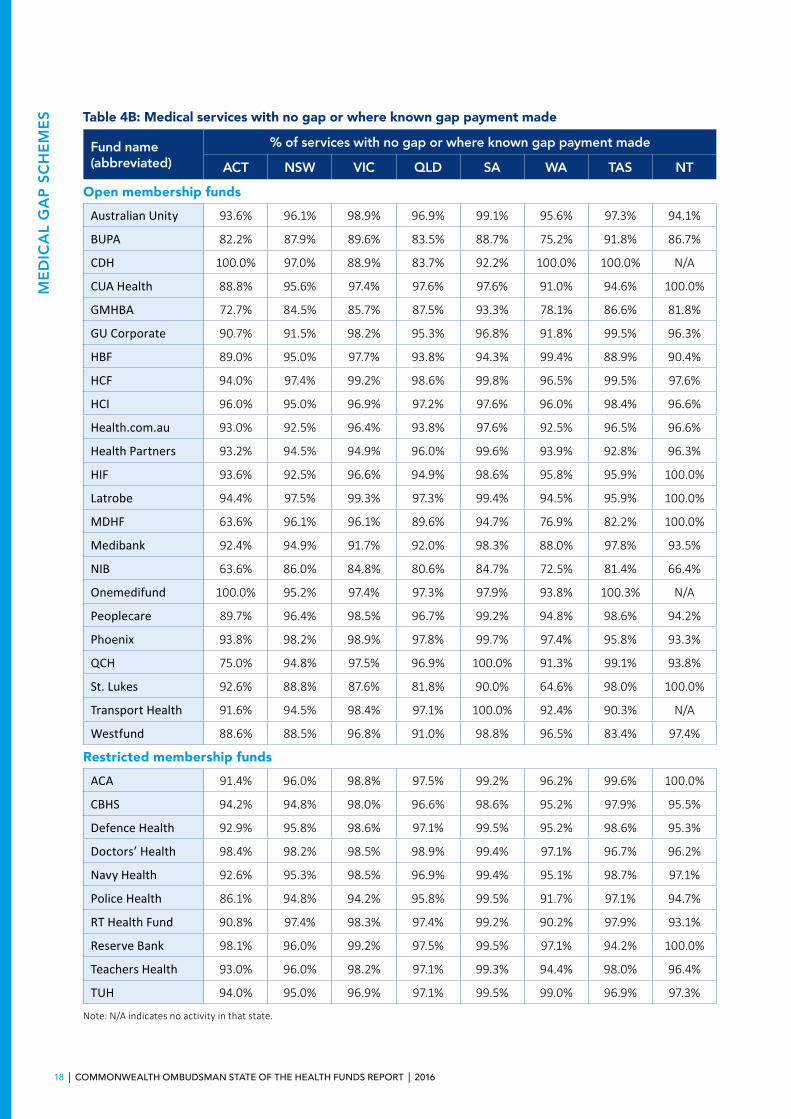
Percentage of Services with No Gap or Where Known Gap Payment Made — This table includes both the percentage of no gap services and what is called “known gap” services. Known gap schemes are an arrangement where the fund pays an additional benefit on the understanding that the provider advises the patient of costs upfront.
These tables take into account all of the fund’s policies. The information in the tables is not indicative of any individual policy offered by the fund but is an average for the total fund membership.
2016 | COMMONWEALTH OMBUDSMAN STATE OF THE HEALTH FUNDS REPORT | 17
ME
DIC
AL G
AP
SC
HE
ME
S
Table 4A: Medical services with no gap
Fund name (abbreviated)
% of services with no gap
ACT NSW VIC QLD SA WA TAS NT
Open membership funds
Australian Unity 82.3% 90.7% 94.0% 93.6% 94.8% 90.3% 92.7% 88.0%
BUPA 75.2% 83.9% 85.4% 80.6% 84.3% 71.2% 88.6% 81.8%
CDH 55.6% 87.7% 61.7% 60.6% 58.8% 38.9% 100.0% N/A
CUA Health 69.4% 88.9% 88.3% 93.3% 89.9% 85.3% 89.7% 96.0%
GMHBA 48.8% 70.4% 73.0% 75.2% 72.3% 63.6% 70.2% 56.6%
GU Corporate 84.1% 86.3% 93.0% 90.3% 94.9% 82.6% 90.4% 95.9%
HBF 57.9% 82.1% 85.5% 80.1% 73.1% 86.2% 69.8% 58.8%
HCF 77.7% 86.6% 80.9% 84.9% 81.9% 77.1% 81.3% 80.2%
HCI 94.2% 89.4% 88.5% 90.1% 89.4% 87.1% 92.1% 92.7%
Health.com.au 70.5% 81.8% 86.1% 86.6% 87.4% 81.9% 88.2% 82.8%
Health Partners 63.0% 85.7% 87.8% 90.8% 94.7% 76.6% 87.5% 72.5%
HIF 79.8% 81.6% 87.5% 87.4% 89.0% 87.9% 85.4% 94.4%
Latrobe 39.5% 74.0% 83.8% 79.0% 77.2% 74.8% 67.8% 33.9%
MDHF 36.4% 82.5% 82.1% 72.7% 73.5% 56.9% 45.4% 14.3%
Medibank 79.5% 87.6% 83.6% 87.4% 90.3% 77.5% 92.9% 77.5%
NIB 63.6% 86.0% 84.8% 80.6% 84.7% 72.5% 81.4% 66.4%
Onemedifund 100.0% 89.0% 89.5% 92.7% 91.7% 85.5% 95.2% N/A
Peoplecare 77.5% 91.0% 90.1% 90.8% 92.2% 88.1% 94.9% 89.5%
Phoenix 53.8% 91.9% 91.5% 90.3% 93.9% 88.4% 90.6% 93.3%
QCH 53.8% 88.2% 91.8% 90.7% 92.4% 86.4% 96.8% 76.3%
St. Lukes 88.5% 84.0% 82.9% 77.8% 81.6% 58.2% 90.5% 98.5%
Transport Health 74.7% 87.0% 91.7% 92.1% 98.3% 66.7% 85.0% N/A
Westfund 72.2% 83.8% 85.3% 83.4% 86.8% 90.7% 79.4% 80.3%
Restricted membership funds
ACA 73.4% 90.6% 94.6% 94.5% 89.1% 89.6% 97.5% 100.0%
CBHS 80.7% 87.6% 92.0% 92.4% 92.4% 89.6% 93.5% 89.8%
Defence Health 78.6% 88.5% 91.7% 92.3% 92.2% 88.4% 93.5% 86.4%
Doctors’ Health 91.9% 92.6% 92.6% 94.6% 90.4% 91.7% 89.5% 90.4%
Navy Health 79.7% 87.8% 91.5% 90.8% 95.5% 88.3% 96.5% 89.1%
Police Health 67.8% 85.5% 86.9% 89.0% 93.4% 84.1% 91.6% 83.7%
RT Health Fund 82.4% 92.6% 92.1% 93.2% 94.4% 77.7% 90.2% 85.3%
Reserve Bank 76.9% 89.0% 93.6% 93.1% 95.1% 90.5% 83.4% 97.1%
Teachers Health 78.9% 89.4% 90.6% 92.7% 92.5% 86.9% 93.3% 89.6%
TUH 83.8% 88.6% 87.8% 92.8% 96.2% 86.8% 90.2% 87.5%
Note: N/A indicates no activity in that state.
18 | COMMONWEALTH OMBUDSMAN STATE OF THE HEALTH FUNDS REPORT | 2016
ME
DIC
AL
GA
P S
CH
EM
ES Table 4B: Medical services with no gap or where known gap payment made
Fund name (abbreviated)
% of services with no gap or where known gap payment made
ACT NSW VIC QLD SA WA TAS NT
Open membership funds
Australian Unity 93.6% 96.1% 98.9% 96.9% 99.1% 95.6% 97.3% 94.1%
BUPA 82.2% 87.9% 89.6% 83.5% 88.7% 75.2% 91.8% 86.7%
CDH 100.0% 97.0% 88.9% 83.7% 92.2% 100.0% 100.0% N/A
CUA Health 88.8% 95.6% 97.4% 97.6% 97.6% 91.0% 94.6% 100.0%
GMHBA 72.7% 84.5% 85.7% 87.5% 93.3% 78.1% 86.6% 81.8%
GU Corporate 90.7% 91.5% 98.2% 95.3% 96.8% 91.8% 99.5% 96.3%
HBF 89.0% 95.0% 97.7% 93.8% 94.3% 99.4% 88.9% 90.4%
HCF 94.0% 97.4% 99.2% 98.6% 99.8% 96.5% 99.5% 97.6%
HCI 96.0% 95.0% 96.9% 97.2% 97.6% 96.0% 98.4% 96.6%
Health.com.au 93.0% 92.5% 96.4% 93.8% 97.6% 92.5% 96.5% 96.6%
Health Partners 93.2% 94.5% 94.9% 96.0% 99.6% 93.9% 92.8% 96.3%
HIF 93.6% 92.5% 96.6% 94.9% 98.6% 95.8% 95.9% 100.0%
Latrobe 94.4% 97.5% 99.3% 97.3% 99.4% 94.5% 95.9% 100.0%
MDHF 63.6% 96.1% 96.1% 89.6% 94.7% 76.9% 82.2% 100.0%
Medibank 92.4% 94.9% 91.7% 92.0% 98.3% 88.0% 97.8% 93.5%
NIB 63.6% 86.0% 84.8% 80.6% 84.7% 72.5% 81.4% 66.4%
Onemedifund 100.0% 95.2% 97.4% 97.3% 97.9% 93.8% 100.3% N/A
Peoplecare 89.7% 96.4% 98.5% 96.7% 99.2% 94.8% 98.6% 94.2%
Phoenix 93.8% 98.2% 98.9% 97.8% 99.7% 97.4% 95.8% 93.3%
QCH 75.0% 94.8% 97.5% 96.9% 100.0% 91.3% 99.1% 93.8%
St. Lukes 92.6% 88.8% 87.6% 81.8% 90.0% 64.6% 98.0% 100.0%
Transport Health 91.6% 94.5% 98.4% 97.1% 100.0% 92.4% 90.3% N/A
Westfund 88.6% 88.5% 96.8% 91.0% 98.8% 96.5% 83.4% 97.4%
Restricted membership funds
ACA 91.4% 96.0% 98.8% 97.5% 99.2% 96.2% 99.6% 100.0%
CBHS 94.2% 94.8% 98.0% 96.6% 98.6% 95.2% 97.9% 95.5%
Defence Health 92.9% 95.8% 98.6% 97.1% 99.5% 95.2% 98.6% 95.3%
Doctors’ Health 98.4% 98.2% 98.5% 98.9% 99.4% 97.1% 96.7% 96.2%
Navy Health 92.6% 95.3% 98.5% 96.9% 99.4% 95.1% 98.7% 97.1%
Police Health 86.1% 94.8% 94.2% 95.8% 99.5% 91.7% 97.1% 94.7%
RT Health Fund 90.8% 97.4% 98.3% 97.4% 99.2% 90.2% 97.9% 93.1%
Reserve Bank 98.1% 96.0% 99.2% 97.5% 99.5% 97.1% 94.2% 100.0%
Teachers Health 93.0% 96.0% 98.2% 97.1% 99.3% 94.4% 98.0% 96.4%
TUH 94.0% 95.0% 96.9% 97.1% 99.5% 99.0% 96.9% 97.3%
Note: N/A indicates no activity in that state.
2016 | COMMONWEALTH OMBUDSMAN STATE OF THE HEALTH FUNDS REPORT | 19
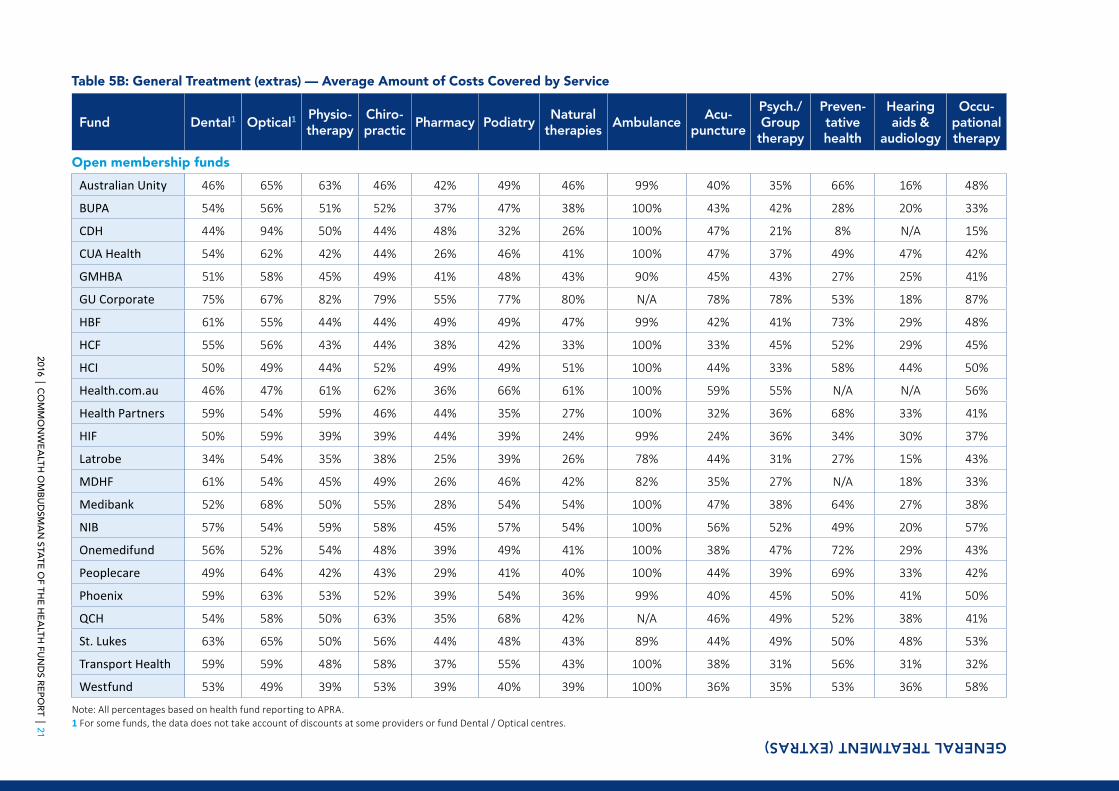
GENERAL TREATMENT (EXTRAS)
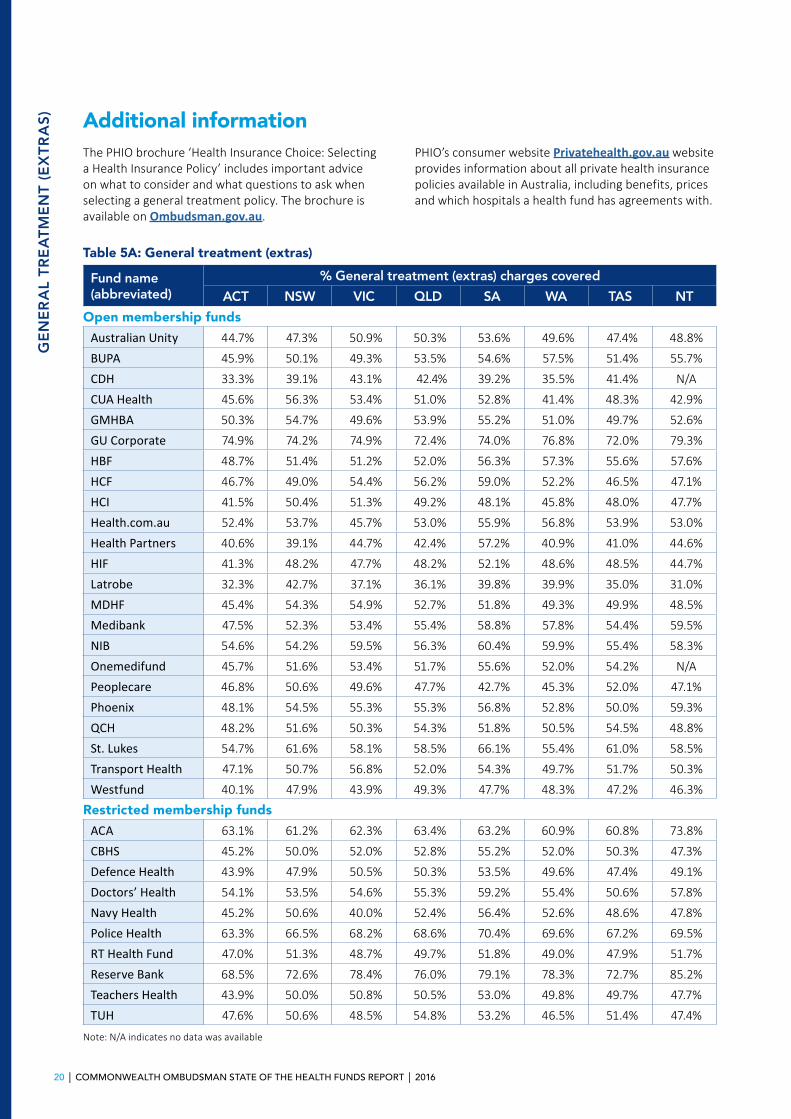
General Treatment or Extras policies provide benefits towards a range of out-of-hospital health services. The most commonly included services are dental, optical, physiotherapy and non-Pharmaceutical Benefits Scheme prescription medicines.
The first table shows the average proportion of service charges covered by each fund for all their policies and services. The second table shows the information according to the service being covered. Generally, higher-cost policies cover a higher proportion of charges.
General treatmentGeneral Treatment policies, also known as ‘Ancillary’ or ‘Extras’,5 provide benefits towards a range of health related services not provided by a doctor, including, but not limited to:
• dental fees and charges;• optometry: cost of glasses and lenses;• physiotherapy, chiropractic services and other
therapies including natural and complementary therapies; and
• prescribed medicines not covered by the Pharmaceutical Benefits Scheme.
Percentage of charges covered, all services, by state This table indicates what proportion of total charges, associated with general treatment services, is covered by each fund’s benefits. This averages outcomes across all of each fund’s general treatment policies and services. Higher cost policies will generally cover a greater proportion of charges than indicated by this average, while cheaper policies may cover less.
Average costs covered for each service typeThis additional table provides information on the proportion of the total charge for each service type covered by each fund on average, across all of the fund’s general treatment policies.
This is intended to provide a broad comparative indicator of fund general treatment benefits to allow comparisons between funds and should not be regarded as an indicator of how much of a bill for any particular service will be covered.
AmbulanceSome funds do not provide ambulance cover through any of their general treatment policies but offer this as a component of hospital cover. These funds show as ‘n/a’ under the ambulance column. Most ambulance services in Queensland and Tasmania are provided free to residents of those states.
Preferred providers Many funds establish ‘preferred provider’ or ‘participating provider’ arrangements with some suppliers of general treatment services. Those providers offer an agreed charge for fund members, resulting in lower out-of-pocket costs for members after fund benefits are taken into account. It is usually worth checking with your fund to see if a suitable preferred provider is available in your area.
Fund dental and eyecare centresIn some states, some funds operate their own dental and optical centres. These are usually only located in capital cities or major population centres.
Consumers who choose to use a fund’s own dental or optical centres will normally get services at a lower out-of-pocket cost.
5 Also known as “Essentials” cover in Western Australia
20 | COMMONWEALTH OMBUDSMAN STATE OF THE HEALTH FUNDS REPORT | 2016
GE
NE
RA
L T
RE
AT
ME
NT
(E
XT
RA
S) Additional information
The PHIO brochure ‘Health Insurance Choice: Selecting a Health Insurance Policy’ includes important advice on what to consider and what questions to ask when selecting a general treatment policy. The brochure is available on Ombudsman.gov.au.
PHIO’s consumer website Privatehealth.gov.au website provides information about all private health insurance policies available in Australia, including benefits, prices and which hospitals a health fund has agreements with.
Table 5A: General treatment (extras)
Open membership funds
Fund name (abbreviated)
% General treatment (extras) charges covered
ACT NSW VIC QLD SA WA TAS NT
Australian Unity 44.7% 47.3% 50.9% 50.3% 53.6% 49.6% 47.4% 48.8%
BUPA 45.9% 50.1% 49.3% 53.5% 54.6% 57.5% 51.4% 55.7%
CDH 33.3% 39.1% 43.1% 42.4% 39.2% 35.5% 41.4% N/A
CUA Health 45.6% 56.3% 53.4% 51.0% 52.8% 41.4% 48.3% 42.9%
GMHBA 50.3% 54.7% 49.6% 53.9% 55.2% 51.0% 49.7% 52.6%
GU Corporate 74.9% 74.2% 74.9% 72.4% 74.0% 76.8% 72.0% 79.3%
HBF 48.7% 51.4% 51.2% 52.0% 56.3% 57.3% 55.6% 57.6%
HCF 46.7% 49.0% 54.4% 56.2% 59.0% 52.2% 46.5% 47.1%
HCI 41.5% 50.4% 51.3% 49.2% 48.1% 45.8% 48.0% 47.7%
Health.com.au 52.4% 53.7% 45.7% 53.0% 55.9% 56.8% 53.9% 53.0%
Health Partners 40.6% 39.1% 44.7% 42.4% 57.2% 40.9% 41.0% 44.6%
HIF 41.3% 48.2% 47.7% 48.2% 52.1% 48.6% 48.5% 44.7%
Latrobe 32.3% 42.7% 37.1% 36.1% 39.8% 39.9% 35.0% 31.0%
MDHF 45.4% 54.3% 54.9% 52.7% 51.8% 49.3% 49.9% 48.5%
Medibank 47.5% 52.3% 53.4% 55.4% 58.8% 57.8% 54.4% 59.5%
NIB 54.6% 54.2% 59.5% 56.3% 60.4% 59.9% 55.4% 58.3%
Onemedifund 45.7% 51.6% 53.4% 51.7% 55.6% 52.0% 54.2% N/A
Peoplecare 46.8% 50.6% 49.6% 47.7% 42.7% 45.3% 52.0% 47.1%
Phoenix 48.1% 54.5% 55.3% 55.3% 56.8% 52.8% 50.0% 59.3%
QCH 48.2% 51.6% 50.3% 54.3% 51.8% 50.5% 54.5% 48.8%
St. Lukes 54.7% 61.6% 58.1% 58.5% 66.1% 55.4% 61.0% 58.5%
Transport Health 47.1% 50.7% 56.8% 52.0% 54.3% 49.7% 51.7% 50.3%
Westfund 40.1% 47.9% 43.9% 49.3% 47.7% 48.3% 47.2% 46.3%
Restricted membership funds
ACA 63.1% 61.2% 62.3% 63.4% 63.2% 60.9% 60.8% 73.8%
CBHS 45.2% 50.0% 52.0% 52.8% 55.2% 52.0% 50.3% 47.3%
Defence Health 43.9% 47.9% 50.5% 50.3% 53.5% 49.6% 47.4% 49.1%
Doctors’ Health 54.1% 53.5% 54.6% 55.3% 59.2% 55.4% 50.6% 57.8%
Navy Health 45.2% 50.6% 40.0% 52.4% 56.4% 52.6% 48.6% 47.8%
Police Health 63.3% 66.5% 68.2% 68.6% 70.4% 69.6% 67.2% 69.5%
RT Health Fund 47.0% 51.3% 48.7% 49.7% 51.8% 49.0% 47.9% 51.7%
Reserve Bank 68.5% 72.6% 78.4% 76.0% 79.1% 78.3% 72.7% 85.2%
Teachers Health 43.9% 50.0% 50.8% 50.5% 53.0% 49.8% 49.7% 47.7%
TUH 47.6% 50.6% 48.5% 54.8% 53.2% 46.5% 51.4% 47.4%
Note: N/A indicates no data was available
2016 | CO
MM
ON
WE
ALTH
OM
BU
DSM
AN
STATE O
F THE H
EA
LTH FU
ND
S RE
PO
RT | 21
GENERAL TREATMENT (EXTRAS)
Table 5B: General Treatment (extras) — Average Amount of Costs Covered by Service
Fund Dental1 Optical1Physio-therapy
Chiro-practic
Pharmacy PodiatryNatural
therapiesAmbulance
Acu-puncture
Psych./Group
therapy
Preven-tative health
Hearing aids &
audiology
Occu-pational therapy
Open membership funds
Australian Unity 46% 65% 63% 46% 42% 49% 46% 99% 40% 35% 66% 16% 48%
BUPA 54% 56% 51% 52% 37% 47% 38% 100% 43% 42% 28% 20% 33%
CDH 44% 94% 50% 44% 48% 32% 26% 100% 47% 21% 8% N/A 15%
CUA Health 54% 62% 42% 44% 26% 46% 41% 100% 47% 37% 49% 47% 42%
GMHBA 51% 58% 45% 49% 41% 48% 43% 90% 45% 43% 27% 25% 41%
GU Corporate 75% 67% 82% 79% 55% 77% 80% N/A 78% 78% 53% 18% 87%
HBF 61% 55% 44% 44% 49% 49% 47% 99% 42% 41% 73% 29% 48%
HCF 55% 56% 43% 44% 38% 42% 33% 100% 33% 45% 52% 29% 45%
HCI 50% 49% 44% 52% 49% 49% 51% 100% 44% 33% 58% 44% 50%
Health.com.au 46% 47% 61% 62% 36% 66% 61% 100% 59% 55% N/A N/A 56%
Health Partners 59% 54% 59% 46% 44% 35% 27% 100% 32% 36% 68% 33% 41%
HIF 50% 59% 39% 39% 44% 39% 24% 99% 24% 36% 34% 30% 37%
Latrobe 34% 54% 35% 38% 25% 39% 26% 78% 44% 31% 27% 15% 43%
MDHF 61% 54% 45% 49% 26% 46% 42% 82% 35% 27% N/A 18% 33%
Medibank 52% 68% 50% 55% 28% 54% 54% 100% 47% 38% 64% 27% 38%
NIB 57% 54% 59% 58% 45% 57% 54% 100% 56% 52% 49% 20% 57%
Onemedifund 56% 52% 54% 48% 39% 49% 41% 100% 38% 47% 72% 29% 43%
Peoplecare 49% 64% 42% 43% 29% 41% 40% 100% 44% 39% 69% 33% 42%
Phoenix 59% 63% 53% 52% 39% 54% 36% 99% 40% 45% 50% 41% 50%
QCH 54% 58% 50% 63% 35% 68% 42% N/A 46% 49% 52% 38% 41%
St. Lukes 63% 65% 50% 56% 44% 48% 43% 89% 44% 49% 50% 48% 53%
Transport Health 59% 59% 48% 58% 37% 55% 43% 100% 38% 31% 56% 31% 32%
Westfund 53% 49% 39% 53% 39% 40% 39% 100% 36% 35% 53% 36% 58%
Note: All percentages based on health fund reporting to APRA.1 For some funds, the data does not take account of discounts at some providers or fund Dental / Optical centres.
22 | CO
MM
ON
WE
ALTH
OM
BU
DSM
AN
STATE O
F THE H
EA
LTH FU
ND
S RE
PO
RT | 2016
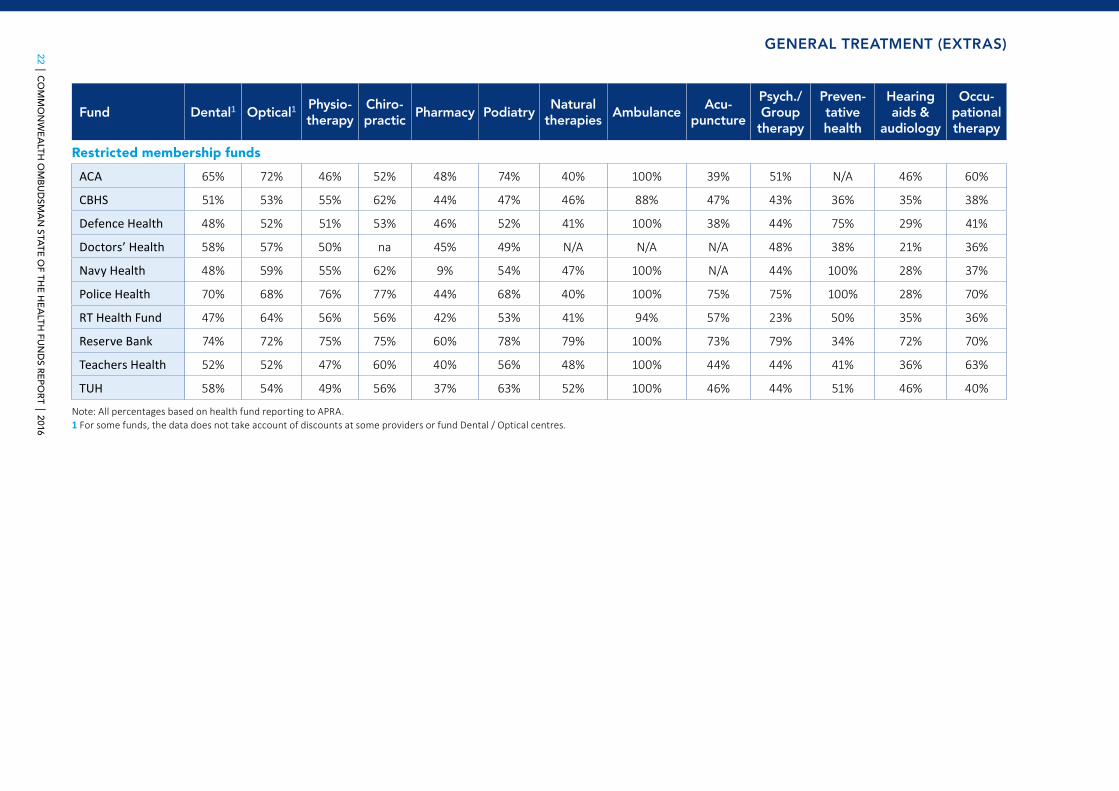
GENERAL TREATMENT (EXTRAS)
Fund Dental1 Optical1Physio-therapy
Chiro-practic
Pharmacy PodiatryNatural
therapiesAmbulance
Acu-puncture
Psych./Group
therapy
Preven-tative health
Hearing aids &
audiology
Occu-pational therapy
Restricted membership funds
ACA 65% 72% 46% 52% 48% 74% 40% 100% 39% 51% N/A 46% 60%
CBHS 51% 53% 55% 62% 44% 47% 46% 88% 47% 43% 36% 35% 38%
Defence Health 48% 52% 51% 53% 46% 52% 41% 100% 38% 44% 75% 29% 41%
Doctors’ Health 58% 57% 50% na 45% 49% N/A N/A N/A 48% 38% 21% 36%
Navy Health 48% 59% 55% 62% 9% 54% 47% 100% N/A 44% 100% 28% 37%
Police Health 70% 68% 76% 77% 44% 68% 40% 100% 75% 75% 100% 28% 70%
RT Health Fund 47% 64% 56% 56% 42% 53% 41% 94% 57% 23% 50% 35% 36%
Reserve Bank 74% 72% 75% 75% 60% 78% 79% 100% 73% 79% 34% 72% 70%
Teachers Health 52% 52% 47% 60% 40% 56% 48% 100% 44% 44% 41% 36% 63%
TUH 58% 54% 49% 56% 37% 63% 52% 100% 46% 44% 51% 46% 40%
Note: All percentages based on health fund reporting to APRA.1 For some funds, the data does not take account of discounts at some providers or fund Dental / Optical centres.
2016 | COMMONWEALTH OMBUDSMAN STATE OF THE HEALTH FUNDS REPORT | 23
FINANCES AND COSTS
All health funds are required to meet financial management standards to ensure their members’ contributions are protected. Generally, funds aim to set premium levels so their income from contributions covers the expected cost of benefits plus the fund’s administration costs.
The percentage of contribution income which goes towards administration and management expenses is a key measure of fund efficiency.
The regulation of health fund financesThe Private Health Insurance Act 2007 (the Act) specifies solvency and capital adequacy standards for funds to meet and outlines financial management and reporting requirements for all funds.
The Private Health Insurance (Prudential Regulation) Act 2015 (the Prudential Regulation Act) ensures that private health insurers must comply with prudential standards made by APRA, and with directions given by APRA. APRA has monitoring and investigative powers in relation to private health insurers in order to monitor the financial performance of the funds and ensure that they meet prudential requirements.
APRA produces an annual publication providing financial and operational statistics for the funds for each financial year.6 Information included in the Financial Performance table is drawn from data collected by APRA for that purpose.
Premium increasesUnder the Act, health funds require the approval of the Minister for Health before they can raise their premiums. This ensures there is rigorous scrutiny of all premium increase applications each year.
The Minister assesses premium applications to ensure proposed increases are kept to the minimum necessary. This takes into consideration fund solvency requirements, forecast benefit payments and prudential requirements, while also ensuring the affordability and value of private health insurance as a product.
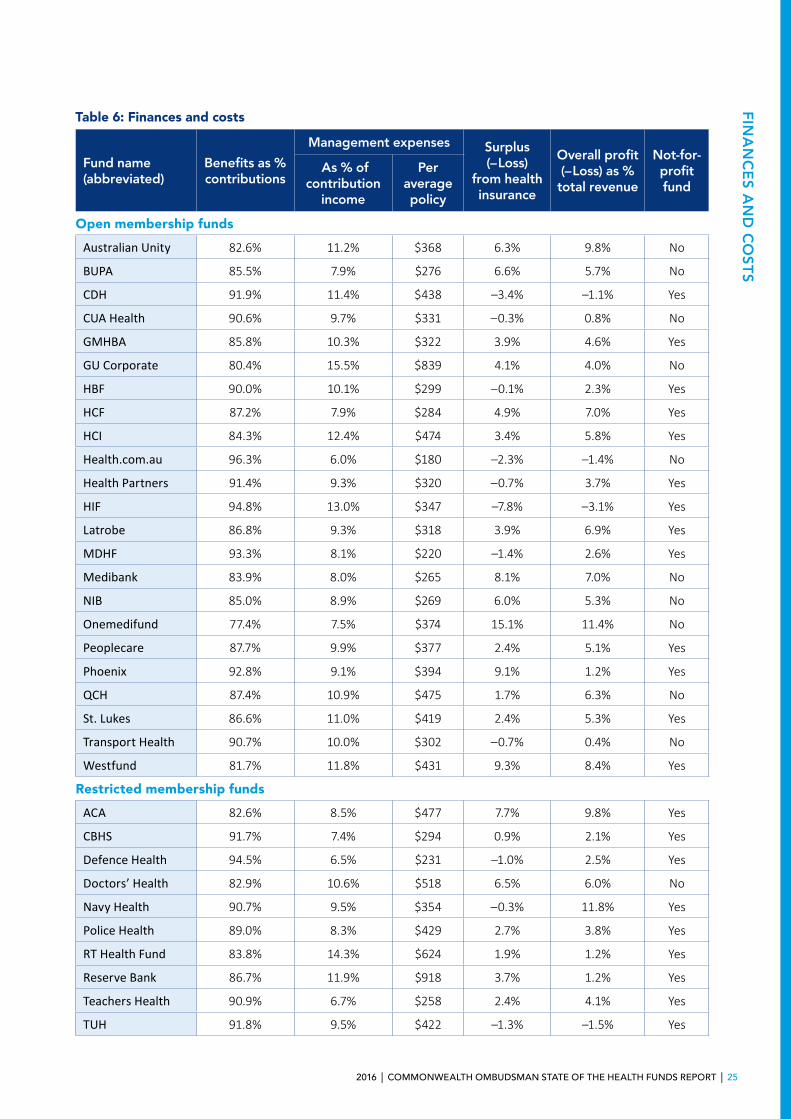
Benefits as a percentage of contributionsThis column shows the percentage of total contributions, received by the fund, returned to contributors in benefits. Funds will generally aim to set premium levels so that contribution income covers the expected costs of benefits plus the fund’s administration costs.
A very high percentage of contributions returned as benefits may not necessarily be a positive factor for consumers, particularly if it means that the fund is making a loss on its health insurance business. This indicator should therefore be considered in conjunction with other factors, such as the Surplus (– Loss) and Management Expenses ratings.
6 The “Operations of the Private Health Insurers” report is available on the APRA website: www.apra.gov.au
24 | COMMONWEALTH OMBUDSMAN STATE OF THE HEALTH FUNDS REPORT | 2016
FIN
AN
CE
S A
ND
CO
ST
S Management expensesManagement expenses are the costs of administering the fund. They include items such as rent, staff salaries, and marketing costs.
As a percentage of contribution income
This figure is regarded as a key measure of fund efficiency. In this table management expenses are shown as a proportion of total fund contributions.
Per average policy
A comparison of the relative amount each fund spends on administration costs is also demonstrated through provision of information on the level of management expenses per membership by each fund.
On average, restricted membership funds have lower management expenses as a proportion of benefits paid then open membership funds. This is partially due to lower expenditure on marketing. However, unusually low management expenses by some restricted membership funds can also be the result of those funds receiving free or subsidised administrative services from the organisations with which they are associated.
Surplus (– Loss) from health insuranceThe surplus or loss (indicated as a negative figure) made by the fund in 2015–16 from their health insurance business is expressed as a percentage of the fund’s contribution income. This does not take account of additional income that the fund may derive from investment or other non-health insurance activities.
All health funds maintain a sufficient level of reserves to cover losses from year to year. However funds with high or continuing losses might be expected to have to increase premiums by a relatively higher amount than other funds.
Overall Profit (– Loss) as a percentage of total revenueThe overall profit or loss (indicated as a negative figure) takes account of additional income made by the fund, mainly through investment. This is shown as a percentage of all revenue received by the fund to allow a comparison of performance between funds of differing sizes. Overall profit takes into account tax that is paid for a small amount of funds.
Not-for-profit fundIf a health fund is listed as ‘not-for-profit’, this means it is a mutual organisation, with the premiums paid into the fund used to operate the business and cover benefits for members.
‘For-profit’ funds aim to return a profit to their owners (which may be another health fund or corporation) or shareholders.
2016 | COMMONWEALTH OMBUDSMAN STATE OF THE HEALTH FUNDS REPORT | 25
FIN
AN
CE
S A
ND
CO
ST
S
Table 6: Finances and costs
Fund name (abbreviated)
Benefits as % contributions
Management expenses Surplus (– Loss)
from health insurance
Overall profit (– Loss) as % total revenue
Not-for-profit fund
As % of contribution
income
Per average policy
Open membership funds
Australian Unity 82.6% 11.2% $368 6.3% 9.8% No
BUPA 85.5% 7.9% $276 6.6% 5.7% No
CDH 91.9% 11.4% $438 –3.4% –1.1% Yes
CUA Health 90.6% 9.7% $331 –0.3% 0.8% No
GMHBA 85.8% 10.3% $322 3.9% 4.6% Yes
GU Corporate 80.4% 15.5% $839 4.1% 4.0% No
HBF 90.0% 10.1% $299 –0.1% 2.3% Yes
HCF 87.2% 7.9% $284 4.9% 7.0% Yes
HCI 84.3% 12.4% $474 3.4% 5.8% Yes
Health.com.au 96.3% 6.0% $180 –2.3% –1.4% No
Health Partners 91.4% 9.3% $320 –0.7% 3.7% Yes
HIF 94.8% 13.0% $347 –7.8% –3.1% Yes
Latrobe 86.8% 9.3% $318 3.9% 6.9% Yes
MDHF 93.3% 8.1% $220 –1.4% 2.6% Yes
Medibank 83.9% 8.0% $265 8.1% 7.0% No
NIB 85.0% 8.9% $269 6.0% 5.3% No
Onemedifund 77.4% 7.5% $374 15.1% 11.4% No
Peoplecare 87.7% 9.9% $377 2.4% 5.1% Yes
Phoenix 92.8% 9.1% $394 9.1% 1.2% Yes
QCH 87.4% 10.9% $475 1.7% 6.3% No
St. Lukes 86.6% 11.0% $419 2.4% 5.3% Yes
Transport Health 90.7% 10.0% $302 –0.7% 0.4% No
Westfund 81.7% 11.8% $431 9.3% 8.4% Yes
Restricted membership funds
ACA 82.6% 8.5% $477 7.7% 9.8% Yes
CBHS 91.7% 7.4% $294 0.9% 2.1% Yes
Defence Health 94.5% 6.5% $231 –1.0% 2.5% Yes
Doctors’ Health 82.9% 10.6% $518 6.5% 6.0% No
Navy Health 90.7% 9.5% $354 –0.3% 11.8% Yes
Police Health 89.0% 8.3% $429 2.7% 3.8% Yes
RT Health Fund 83.8% 14.3% $624 1.9% 1.2% Yes
Reserve Bank 86.7% 11.9% $918 3.7% 1.2% Yes
Teachers Health 90.9% 6.7% $258 2.4% 4.1% Yes
TUH 91.8% 9.5% $422 –1.3% –1.5% Yes
26 | COMMONWEALTH OMBUDSMAN STATE OF THE HEALTH FUNDS REPORT | 2016
HEALTH FUND OPERATIONS BY STATE OR TERRITORY
Some funds have little presence in most states but may have a large market share in one state or territory. Every fund will still have agreements with hospitals throughout Australia even if they don’t have a local branch network or a significant proportion of policy holders in each state. Australian health insurance policies are usually priced according to the policy holder’s state of residence, but the benefits extend nation-wide.
Health fund operations by state or territorySome funds have little presence in most states but may have a large market share in one state or territory. Some funds use different brand names or offer different policies in different states and territories. These separate tables for each state/territory are therefore provided to give an indication of the extent and importance of each fund’s business in each area.
Most fund websites allow members to view fund information, join or change their policy and submit claims. Links to all health fund websites are available at Privatehealth.gov.au.
Percentage market shareThis column indicates how much of the total health insurance business within each state or territory each fund accounts for. It is an indicator of the size and significance of each fund within each state.
Funds with a significant market share in the relevant state or territory can normally be expected to have more extensive networks of branch offices, agencies, agreement hospitals and preferred ancillary providers in those states/territories. They are also more likely to obtain the participation of doctors in their gap cover arrangements. However, funds participating in schemes such as the Australian Health Services Alliance (AHSA) will generally have access to a wide range of agreement hospitals in all states.
Percentage of fund’s membership in stateThis column indicates how much of each fund’s health insurance membership is within each state. It is an indicator of how significant that state is to each fund’s health insurance business.
In general, funds can be expected to design their policies (benefits, conditions, contracts, etc) to suit the arrangements applying in the states in which they do a significant proportion of business. However, some nationally based funds tailor their policies and prices to take account of different state arrangements.
Health fund costs differ from state to state, which accounts for the variation in premiums across states.
2016 | COMMONWEALTH OMBUDSMAN STATE OF THE HEALTH FUNDS REPORT | 27
HE
ALT
H FU
ND
OP
ER
AT
ION
S B
Y S
TAT
E O
R T
ER
RITO
RY
Agreement hospitals7
All health funds establish agreements with some or all private hospitals and day hospitals for the treatment of their members. These agreements generally provide for the fund to meet all of the private hospital’s charges for treatment of the fund’s members. The member would then not be required to pay any amount to the hospital, other than any agreed excess or co-payment and any incidental charges that may apply for certain extra services (e.g. television rental or internet).8
Where a fund has a comparatively low number of agreements with private hospitals or private day hospitals, this is an indicator that consumer choice (as to where to be treated) may be more limited. Treatment at a non-agreement hospital will mean a significantly higher out-of-pocket cost for the patient.
While funds do not have agreements with particular public hospitals, all funds will fully cover hospital costs for treatment as a private patient in a public hospital unless the particular treatment is excluded under the individual’s policy, or there is an extra charge for a private room or similar extra costs.
Fund outlets — retail offices and agenciesRetail offices are full-service offices operated by health funds with staff employed by the fund.
Agencies are generally limited service outlets operated by the fund or under arrangements with pharmacies, credit unions, etc.
The table indicates whether the fund operates retail offices and/or agencies in the state or territory.
7 According to Privatehealth.gov.au, 16 December 2016 or as supplied by the fund.
8 These agreements do not apply to fees charged by private doctors for in-hospital treatment; these medical fees may be covered by a fund’s medical gap scheme arrangements.
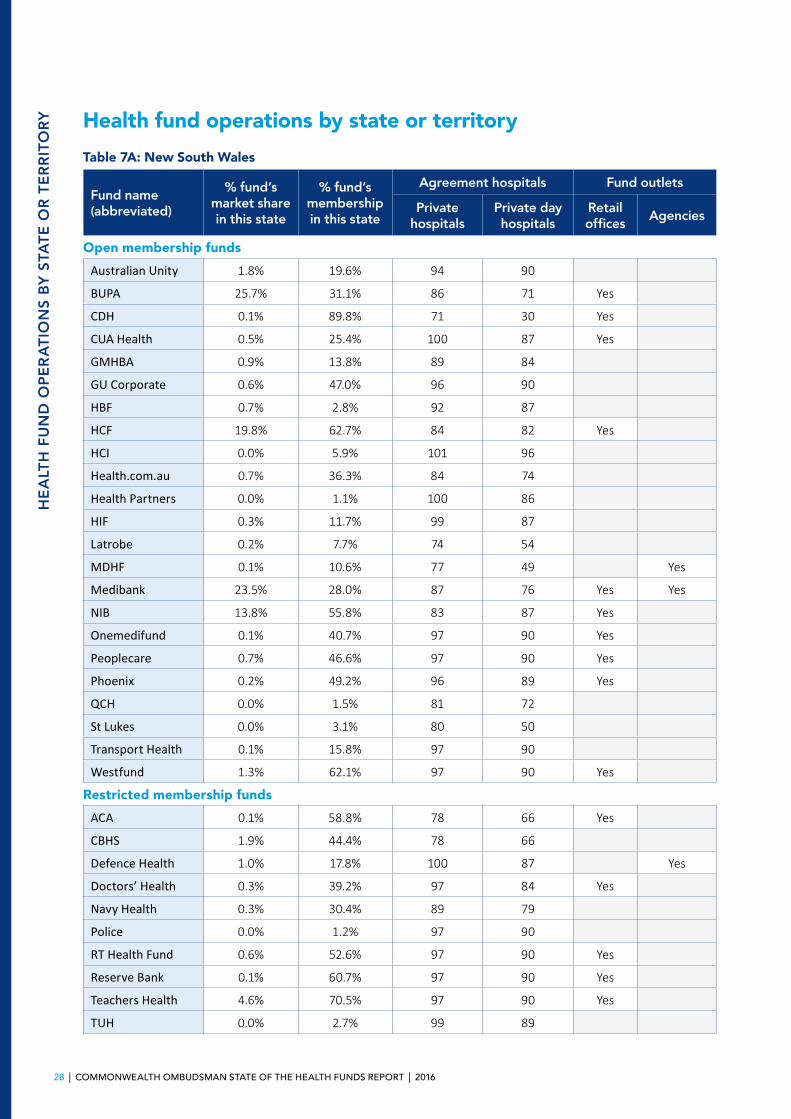
28 | COMMONWEALTH OMBUDSMAN STATE OF THE HEALTH FUNDS REPORT | 2016
HE
ALT
H F
UN
D O
PE
RA
TIO
NS
BY
STA
TE
OR
TE
RR
ITO
RY Health fund operations by state or territory
Table 7A: New South Wales
Fund name (abbreviated)
% fund’s market share in this state
% fund’s membership in this state
Agreement hospitals Fund outlets
Private hospitals
Private day hospitals
Retail offices
Agencies
Open membership funds
Australian Unity 1.8% 19.6% 94 90
BUPA 25.7% 31.1% 86 71 Yes
CDH 0.1% 89.8% 71 30 Yes
CUA Health 0.5% 25.4% 100 87 Yes
GMHBA 0.9% 13.8% 89 84
GU Corporate 0.6% 47.0% 96 90
HBF 0.7% 2.8% 92 87
HCF 19.8% 62.7% 84 82 Yes
HCI 0.0% 5.9% 101 96
Health.com.au 0.7% 36.3% 84 74
Health Partners 0.0% 1.1% 100 86
HIF 0.3% 11.7% 99 87
Latrobe 0.2% 7.7% 74 54
MDHF 0.1% 10.6% 77 49 Yes
Medibank 23.5% 28.0% 87 76 Yes Yes
NIB 13.8% 55.8% 83 87 Yes
Onemedifund 0.1% 40.7% 97 90 Yes
Peoplecare 0.7% 46.6% 97 90 Yes
Phoenix 0.2% 49.2% 96 89 Yes
QCH 0.0% 1.5% 81 72
St Lukes 0.0% 3.1% 80 50
Transport Health 0.1% 15.8% 97 90
Westfund 1.3% 62.1% 97 90 Yes
Restricted membership funds
ACA 0.1% 58.8% 78 66 Yes
CBHS 1.9% 44.4% 78 66
Defence Health 1.0% 17.8% 100 87 Yes
Doctors’ Health 0.3% 39.2% 97 84 Yes
Navy Health 0.3% 30.4% 89 79
Police 0.0% 1.2% 97 90
RT Health Fund 0.6% 52.6% 97 90 Yes
Reserve Bank 0.1% 60.7% 97 90 Yes
Teachers Health 4.6% 70.5% 97 90 Yes
TUH 0.0% 2.7% 99 89
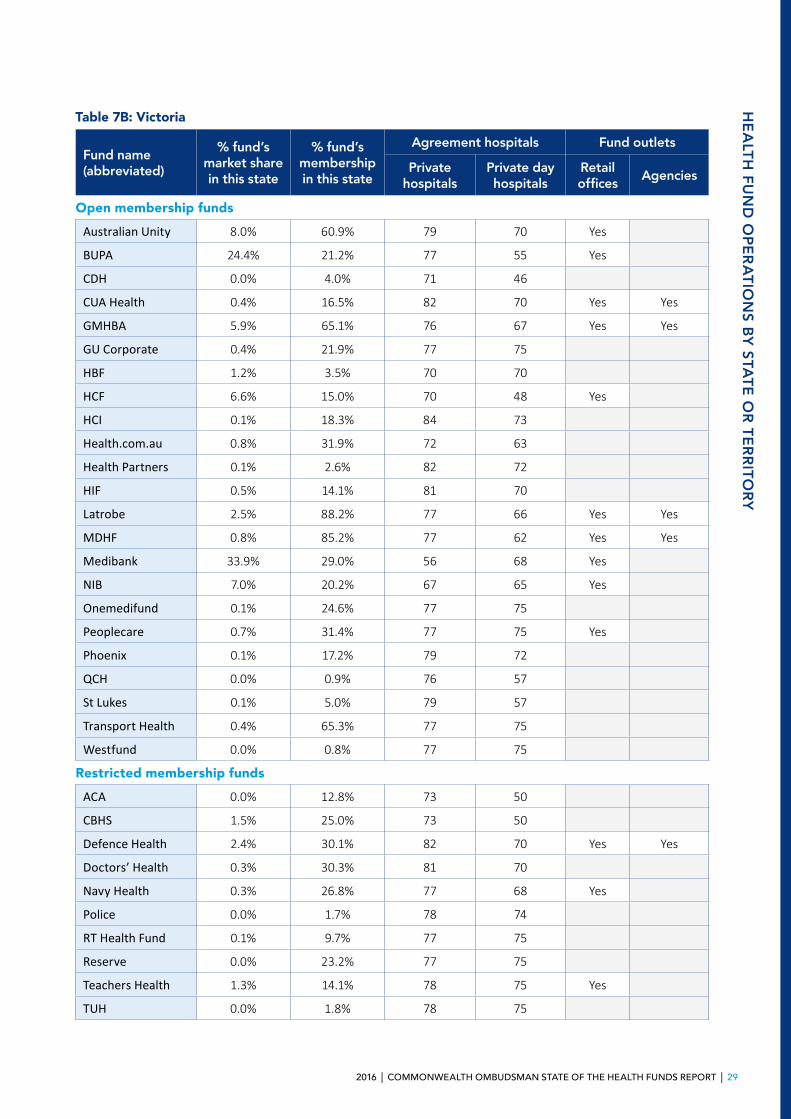
2016 | COMMONWEALTH OMBUDSMAN STATE OF THE HEALTH FUNDS REPORT | 29
HE
ALT
H FU
ND
OP
ER
AT
ION
S B
Y S
TAT
E O
R T
ER
RITO
RY
Table 7B: Victoria
Fund name (abbreviated)
% fund’s market share in this state
% fund’s membership in this state
Agreement hospitals Fund outlets
Private hospitals
Private day hospitals
Retail offices
Agencies
Open membership funds
Australian Unity 8.0% 60.9% 79 70 Yes
BUPA 24.4% 21.2% 77 55 Yes
CDH 0.0% 4.0% 71 46
CUA Health 0.4% 16.5% 82 70 Yes Yes
GMHBA 5.9% 65.1% 76 67 Yes Yes
GU Corporate 0.4% 21.9% 77 75
HBF 1.2% 3.5% 70 70
HCF 6.6% 15.0% 70 48 Yes
HCI 0.1% 18.3% 84 73
Health.com.au 0.8% 31.9% 72 63
Health Partners 0.1% 2.6% 82 72
HIF 0.5% 14.1% 81 70
Latrobe 2.5% 88.2% 77 66 Yes Yes
MDHF 0.8% 85.2% 77 62 Yes Yes
Medibank 33.9% 29.0% 56 68 Yes
NIB 7.0% 20.2% 67 65 Yes
Onemedifund 0.1% 24.6% 77 75
Peoplecare 0.7% 31.4% 77 75 Yes
Phoenix 0.1% 17.2% 79 72
QCH 0.0% 0.9% 76 57
St Lukes 0.1% 5.0% 79 57
Transport Health 0.4% 65.3% 77 75
Westfund 0.0% 0.8% 77 75
Restricted membership funds
ACA 0.0% 12.8% 73 50
CBHS 1.5% 25.0% 73 50
Defence Health 2.4% 30.1% 82 70 Yes Yes
Doctors’ Health 0.3% 30.3% 81 70
Navy Health 0.3% 26.8% 77 68 Yes
Police 0.0% 1.7% 78 74
RT Health Fund 0.1% 9.7% 77 75
Reserve 0.0% 23.2% 77 75
Teachers Health 1.3% 14.1% 78 75 Yes
TUH 0.0% 1.8% 78 75
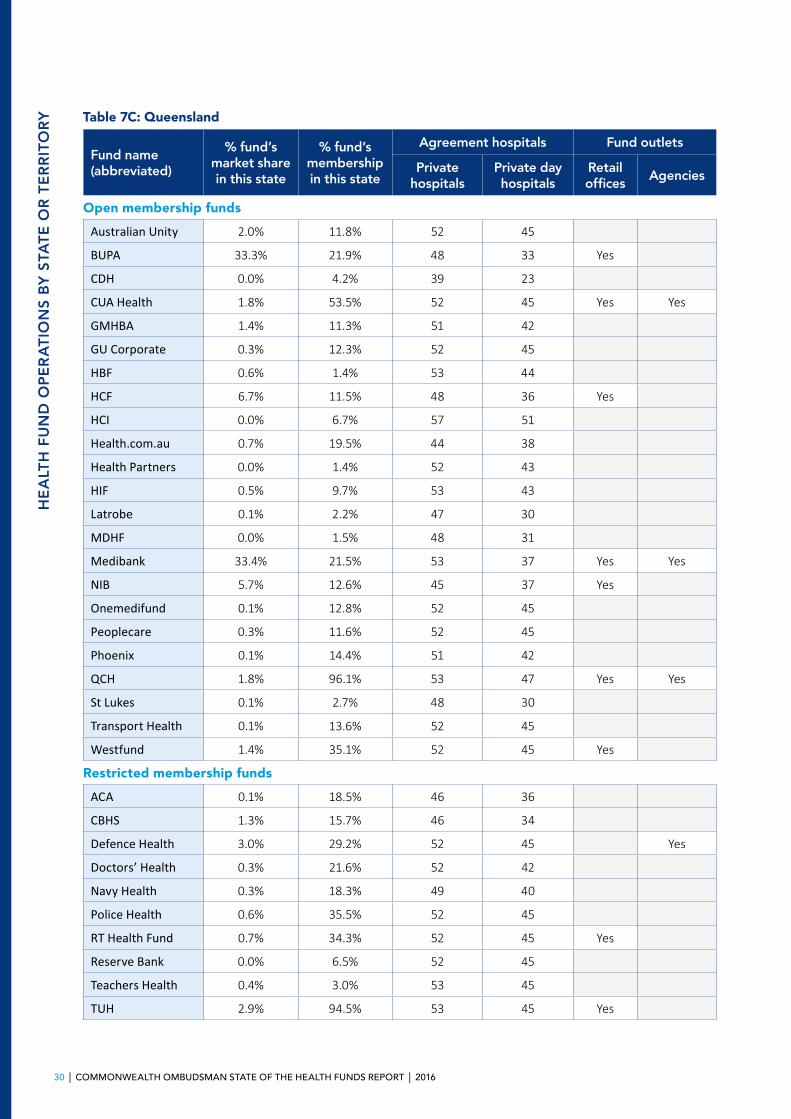
30 | COMMONWEALTH OMBUDSMAN STATE OF THE HEALTH FUNDS REPORT | 2016
HE
ALT
H F
UN
D O
PE
RA
TIO
NS
BY
STA
TE
OR
TE
RR
ITO
RY Table 7C: Queensland
Fund name (abbreviated)
% fund’s market share in this state
% fund’s membership in this state
Agreement hospitals Fund outlets
Private hospitals
Private day hospitals
Retail offices
Agencies
Open membership funds
Australian Unity 2.0% 11.8% 52 45
BUPA 33.3% 21.9% 48 33 Yes
CDH 0.0% 4.2% 39 23
CUA Health 1.8% 53.5% 52 45 Yes Yes
GMHBA 1.4% 11.3% 51 42
GU Corporate 0.3% 12.3% 52 45
HBF 0.6% 1.4% 53 44
HCF 6.7% 11.5% 48 36 Yes
HCI 0.0% 6.7% 57 51
Health.com.au 0.7% 19.5% 44 38
Health Partners 0.0% 1.4% 52 43
HIF 0.5% 9.7% 53 43
Latrobe 0.1% 2.2% 47 30
MDHF 0.0% 1.5% 48 31
Medibank 33.4% 21.5% 53 37 Yes Yes
NIB 5.7% 12.6% 45 37 Yes
Onemedifund 0.1% 12.8% 52 45
Peoplecare 0.3% 11.6% 52 45
Phoenix 0.1% 14.4% 51 42
QCH 1.8% 96.1% 53 47 Yes Yes
St Lukes 0.1% 2.7% 48 30
Transport Health 0.1% 13.6% 52 45
Westfund 1.4% 35.1% 52 45 Yes
Restricted membership funds
ACA 0.1% 18.5% 46 36
CBHS 1.3% 15.7% 46 34
Defence Health 3.0% 29.2% 52 45 Yes
Doctors’ Health 0.3% 21.6% 52 42
Navy Health 0.3% 18.3% 49 40
Police Health 0.6% 35.5% 52 45
RT Health Fund 0.7% 34.3% 52 45 Yes
Reserve Bank 0.0% 6.5% 52 45
Teachers Health 0.4% 3.0% 53 45
TUH 2.9% 94.5% 53 45 Yes
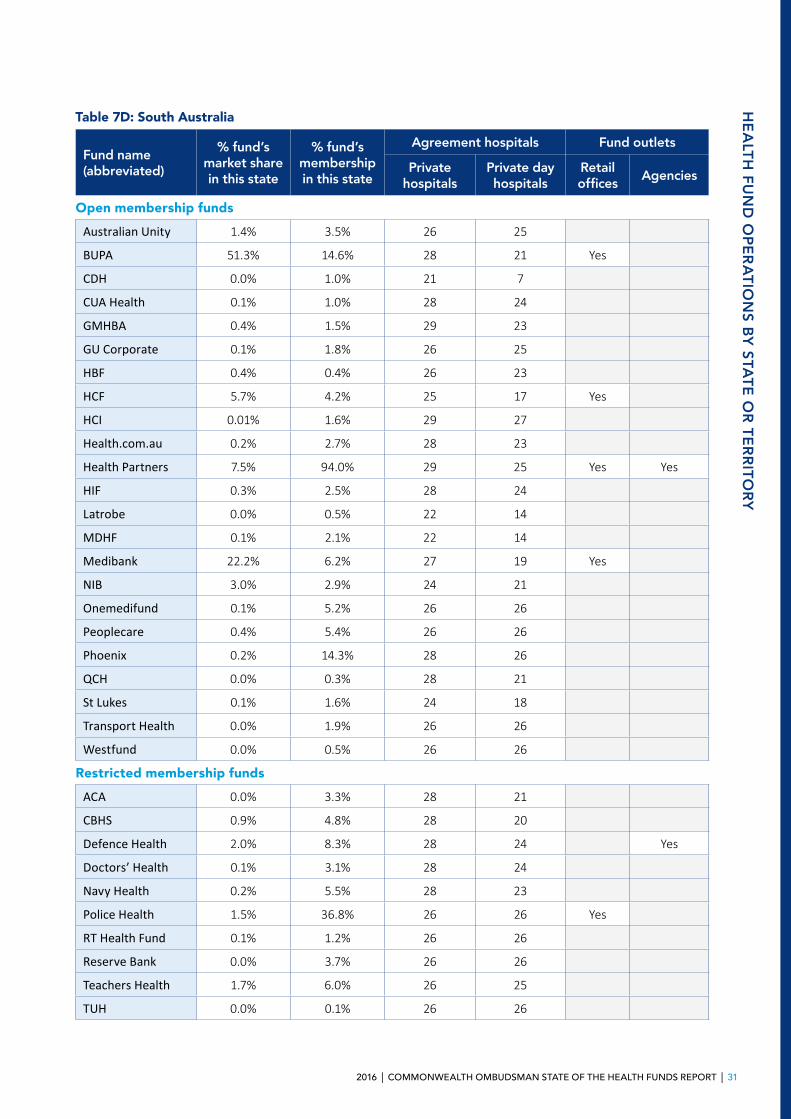
2016 | COMMONWEALTH OMBUDSMAN STATE OF THE HEALTH FUNDS REPORT | 31
HE
ALT
H FU
ND
OP
ER
AT
ION
S B
Y S
TAT
E O
R T
ER
RITO
RY
Table 7D: South Australia
Fund name (abbreviated)
% fund’s market share in this state
% fund’s membership in this state
Agreement hospitals Fund outlets
Private hospitals
Private day hospitals
Retail offices
Agencies
Open membership funds
Australian Unity 1.4% 3.5% 26 25
BUPA 51.3% 14.6% 28 21 Yes
CDH 0.0% 1.0% 21 7
CUA Health 0.1% 1.0% 28 24
GMHBA 0.4% 1.5% 29 23
GU Corporate 0.1% 1.8% 26 25
HBF 0.4% 0.4% 26 23
HCF 5.7% 4.2% 25 17 Yes
HCI 0.01% 1.6% 29 27
Health.com.au 0.2% 2.7% 28 23
Health Partners 7.5% 94.0% 29 25 Yes Yes
HIF 0.3% 2.5% 28 24
Latrobe 0.0% 0.5% 22 14
MDHF 0.1% 2.1% 22 14
Medibank 22.2% 6.2% 27 19 Yes
NIB 3.0% 2.9% 24 21
Onemedifund 0.1% 5.2% 26 26
Peoplecare 0.4% 5.4% 26 26
Phoenix 0.2% 14.3% 28 26
QCH 0.0% 0.3% 28 21
St Lukes 0.1% 1.6% 24 18
Transport Health 0.0% 1.9% 26 26
Westfund 0.0% 0.5% 26 26
Restricted membership funds
ACA 0.0% 3.3% 28 21
CBHS 0.9% 4.8% 28 20
Defence Health 2.0% 8.3% 28 24 Yes
Doctors’ Health 0.1% 3.1% 28 24
Navy Health 0.2% 5.5% 28 23
Police Health 1.5% 36.8% 26 26 Yes
RT Health Fund 0.1% 1.2% 26 26
Reserve Bank 0.0% 3.7% 26 26
Teachers Health 1.7% 6.0% 26 25
TUH 0.0% 0.1% 26 26
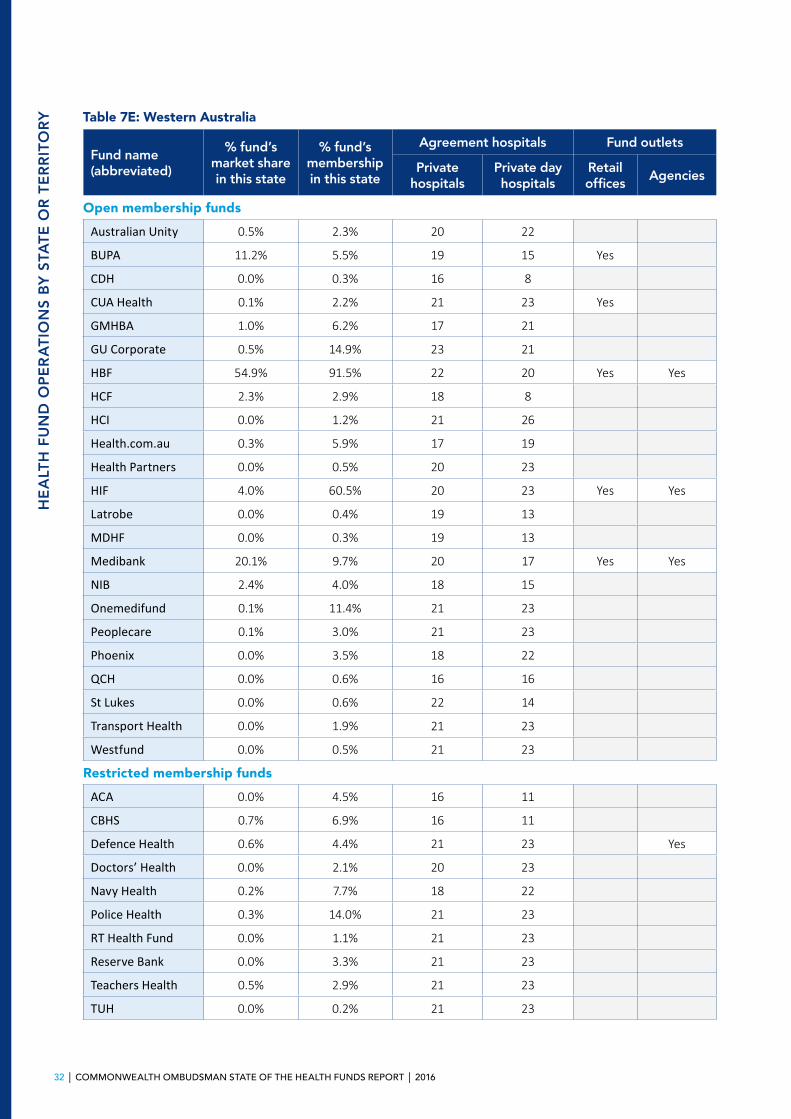
32 | COMMONWEALTH OMBUDSMAN STATE OF THE HEALTH FUNDS REPORT | 2016
HE
ALT
H F
UN
D O
PE
RA
TIO
NS
BY
STA
TE
OR
TE
RR
ITO
RY Table 7E: Western Australia
Fund name (abbreviated)
% fund’s market share in this state
% fund’s membership in this state
Agreement hospitals Fund outlets
Private hospitals
Private day hospitals
Retail offices
Agencies
Open membership funds
Australian Unity 0.5% 2.3% 20 22
BUPA 11.2% 5.5% 19 15 Yes
CDH 0.0% 0.3% 16 8
CUA Health 0.1% 2.2% 21 23 Yes
GMHBA 1.0% 6.2% 17 21
GU Corporate 0.5% 14.9% 23 21
HBF 54.9% 91.5% 22 20 Yes Yes
HCF 2.3% 2.9% 18 8
HCI 0.0% 1.2% 21 26
Health.com.au 0.3% 5.9% 17 19
Health Partners 0.0% 0.5% 20 23
HIF 4.0% 60.5% 20 23 Yes Yes
Latrobe 0.0% 0.4% 19 13
MDHF 0.0% 0.3% 19 13
Medibank 20.1% 9.7% 20 17 Yes Yes
NIB 2.4% 4.0% 18 15
Onemedifund 0.1% 11.4% 21 23
Peoplecare 0.1% 3.0% 21 23
Phoenix 0.0% 3.5% 18 22
QCH 0.0% 0.6% 16 16
St Lukes 0.0% 0.6% 22 14
Transport Health 0.0% 1.9% 21 23
Westfund 0.0% 0.5% 21 23
Restricted membership funds
ACA 0.0% 4.5% 16 11
CBHS 0.7% 6.9% 16 11
Defence Health 0.6% 4.4% 21 23 Yes
Doctors’ Health 0.0% 2.1% 20 23
Navy Health 0.2% 7.7% 18 22
Police Health 0.3% 14.0% 21 23
RT Health Fund 0.0% 1.1% 21 23
Reserve Bank 0.0% 3.3% 21 23
Teachers Health 0.5% 2.9% 21 23
TUH 0.0% 0.2% 21 23

2016 | COMMONWEALTH OMBUDSMAN STATE OF THE HEALTH FUNDS REPORT | 33
HE
ALT
H FU
ND
OP
ER
AT
ION
S B
Y S
TAT
E O
R T
ER
RITO
RY
Table 7F: Tasmania
Fund name (abbreviated)
% fund’s market share in this state
% fund’s membership in this state
Agreement hospitals Fund outlets
Private hospitals
Private day hospitals
Retail offices
Agencies
Open membership funds
Australian Unity 0.9% 0.6% 5 3
BUPA 36.7% 2.8% 5 4 Yes
CDH 0.0% 0.3% 5 2
CUA Health 0.1% 0.3% 5 3
GMHBA 1.1% 1.1% 5 3
GU Corporate 0.1% 0.5% 5 3
HBF 0.8% 0.2% 5 3
HCF 2.6% 0.5% 5 3
HCI 2.3% 65.5% 5 4 Yes
Health.com.au 0.2% 0.6% 5 3
Health Partners 0.1% 0.2% 5 3
HIF 0.2% 0.5% 5 3
Latrobe 0.2% 0.5% 5 5
MDHF 0.0% 0.1% 5 4
Medibank 30.0% 2.3% 5 3 Yes
NIB 2.0% 0.5% 5 3
Onemedifund 0.2% 5.2% 5 3
Peoplecare 0.2% 0.6% 5 3
Phoenix 0.0% 0.6% 5 4
QCH 0.0% 0.2% 5 3
St Lukes 18.0% 86.6% 8 4 Yes Yes
Transport Health 0.0% 0.5% 5 3
Westfund 0.1% 0.2% 5 3
Restricted membership funds
ACA 0.0% 1.2% 5 2
CBHS 1.1% 1.6% 5 2
Defence Health 1.0% 1.1% 5 3
Doctors’ Health 0.1% 0.9% 5 3
Navy Health 0.2% 1.3% 5 3
Police Health 0.5% 3.0% 5 3
RT Health Fund 0.1% 0.4% 5 3
Reserve Bank 0.0% 1.3% 5 3
Teachers Health 1.1% 1.1% 6 3
TUH 0.1% 0.3% 5 3
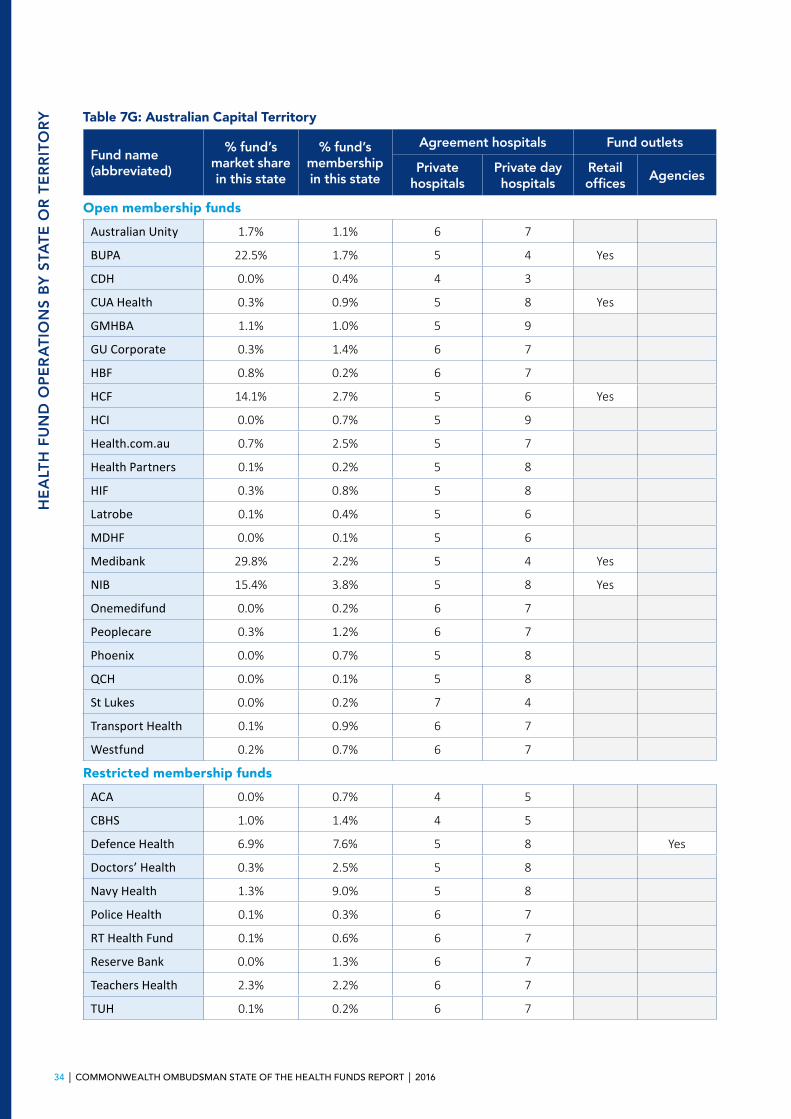
34 | COMMONWEALTH OMBUDSMAN STATE OF THE HEALTH FUNDS REPORT | 2016
HE
ALT
H F
UN
D O
PE
RA
TIO
NS
BY
STA
TE
OR
TE
RR
ITO
RY Table 7G: Australian Capital Territory
Fund name (abbreviated)
% fund’s market share in this state
% fund’s membership in this state
Agreement hospitals Fund outlets
Private hospitals
Private day hospitals
Retail offices
Agencies
Open membership funds
Australian Unity 1.7% 1.1% 6 7
BUPA 22.5% 1.7% 5 4 Yes
CDH 0.0% 0.4% 4 3
CUA Health 0.3% 0.9% 5 8 Yes
GMHBA 1.1% 1.0% 5 9
GU Corporate 0.3% 1.4% 6 7
HBF 0.8% 0.2% 6 7
HCF 14.1% 2.7% 5 6 Yes
HCI 0.0% 0.7% 5 9
Health.com.au 0.7% 2.5% 5 7
Health Partners 0.1% 0.2% 5 8
HIF 0.3% 0.8% 5 8
Latrobe 0.1% 0.4% 5 6
MDHF 0.0% 0.1% 5 6
Medibank 29.8% 2.2% 5 4 Yes
NIB 15.4% 3.8% 5 8 Yes
Onemedifund 0.0% 0.2% 6 7
Peoplecare 0.3% 1.2% 6 7
Phoenix 0.0% 0.7% 5 8
QCH 0.0% 0.1% 5 8
St Lukes 0.0% 0.2% 7 4
Transport Health 0.1% 0.9% 6 7
Westfund 0.2% 0.7% 6 7
Restricted membership funds
ACA 0.0% 0.7% 4 5
CBHS 1.0% 1.4% 4 5
Defence Health 6.9% 7.6% 5 8 Yes
Doctors’ Health 0.3% 2.5% 5 8
Navy Health 1.3% 9.0% 5 8
Police Health 0.1% 0.3% 6 7
RT Health Fund 0.1% 0.6% 6 7
Reserve Bank 0.0% 1.3% 6 7
Teachers Health 2.3% 2.2% 6 7
TUH 0.1% 0.2% 6 7

2016 | COMMONWEALTH OMBUDSMAN STATE OF THE HEALTH FUNDS REPORT | 35
HE
ALT
H FU
ND
OP
ER
AT
ION
S B
Y S
TAT
E O
R T
ER
RITO
RY
Table 7H: Northern Territory
Fund name (abbreviated)
% fund’s market share in this state
% fund’s membership in this state
Agreement hospitals Fund outlets
Private hospitals
Private day hospitals
Retail offices
Agencies
Open membership funds
Australian Unity 0.5% 0.1% 2 1
BUPA 38.8% 1.1% 1 1 Yes
CDH 0.0% 0.0% 1 0
CUA Health 0.1% 0.1% 2 1
GMHBA 0.3% 0.1% 1 1
GU Corporate 0.1% 0.2% 2 1
HBF 1.8% 0.2% 2 1
HCF 5.0% 0.4% 1 1
HCI 0.0% 0.2% 2 1
Health.com.au 0.5% 0.6% 1 1
Health Partners 0.1% 0.1% 2 1
HIF 0.2% 0.2% 2 1
Latrobe 0.1% 0.1% 1 1
MDHF 0.0% 0.1% 1 1
Medibank 41.7% 1.2% 1 1 Yes Yes
NIB 2.2% 0.2% 1 1
Onemedifund 0.0% 0.0% 2 1
Peoplecare 0.1% 0.1% 2 1
Phoenix 0.0% 0.2% 2 1
QCH 0.1% 0.2% 1 1
St Lukes 0.1% 0.1% 1 1
Transport Health 0.0% 0.1% 2 1
Westfund 0.1% 0.1% 2 1
Restricted membership funds
ACA 0.0% 0.2% 1 0
CBHS 0.4% 0.2% 1 0
Defence Health 3.4% 1.5% 2 1 Yes
Doctors’ Health 0.1% 0.3% 2 1
Navy Health 0.4% 1.0% 1 1
Police Health 3.0% 7.4% 2 1
RT Health Fund 0.1% 0.2% 2 1
Reserve Bank 0.0% 0.0% 2 1
Teachers Health 0.8% 0.3% 2 1
TUH 0.1% 0.1% 2 1
36 | COMMONWEALTH OMBUDSMAN STATE OF THE HEALTH FUNDS REPORT | 2016
ABOUT THE PRIVATE HEALTH INSURANCE OMBUDSMAN
The Private Health Insurance Ombudsman protects the interests of people who are covered by private health insurance, through our complaints handling, consumer information and advice services, as well as advice to government and industry about issues of concern to consumers in relation to private health insurance.
The Private Health Insurance OmbudsmanThe Private Health Insurance Ombudsman (PHIO) is one of the roles held by the Commonwealth Ombudsman. The Ombudsman deals with inquiries and complaints about any aspect of private health insurance. Our office is independent of the private health funds, private and public hospitals and health service providers.
We deal with complaints about private health insurance, including private health funds, brokers, hospitals, medical practitioners, dentists or other practitioners. Generally, anyone can make a complaint as long as it relates to private health insurance.
How do I make a complaint?You should first contact your health fund or the organisation or provider you’re complaining about — they may be able to resolve your complaint for you.
If your fund doesn’t provide a satisfactory response, you can contact us in one of the following ways:
• Website: Ombudsman.gov.au (including online complaints form)
• Call: 1300 362 072 (option 4 for private health insurance)
• Write: Private Health Insurance Ombudsman, Commonwealth Ombudsman, GPO Box 442, CANBERRA ACT 2601
• Email: [email protected]
Please include:
• A clear description of your complaint; • The name of your health fund and your
membership number; and • What you think would resolve the matter for you.
We’ll let you know if any other information is needed.
What happens after I make a complaint?Many complaints result from misunderstandings. Your PHIO case officer may be able to resolve your complaint by explaining what has happened and why.
Otherwise, we’ll contact your health fund or the body you are complaining about to get their explanation and any suggestions they have for fixing the problem. We deal with most complaints by phone or email, and most can be settled quickly.
Where complaints are more complex, we will write to the health fund or other body, seeking further information or recommending a certain course of action. Your case officer will keep you regularly informed, usually by telephone. They will give you their name and contact number in case you need to contact them.
2016 | COMMONWEALTH OMBUDSMAN STATE OF THE HEALTH FUNDS REPORT | 37
AB
OU
T T
HE
PR
IVA
TE
HE
ALT
H IN
SUR
AN
CE
OM
BU
DS
MA
N
What if I just want some information about health insurance?We can help with information about private health insurance arrangements:
• Check our website Privatehealth.gov.au; • Call our Hotline on 1300 737 299; and• Email us at [email protected].
We also have brochures and publications about private health insurance arrangements which you can find on our website or which we can post on request.
Who can I contact if my complaint is about a medical issue?Complaints about the quality of service or clinical treatment provided by a health professional or a hospital should be directed to the health care complaints body for your state or territory. These are listed in the state government section of your telephone directory. You can also find a contact list on Privatehealth.gov.au under Links.
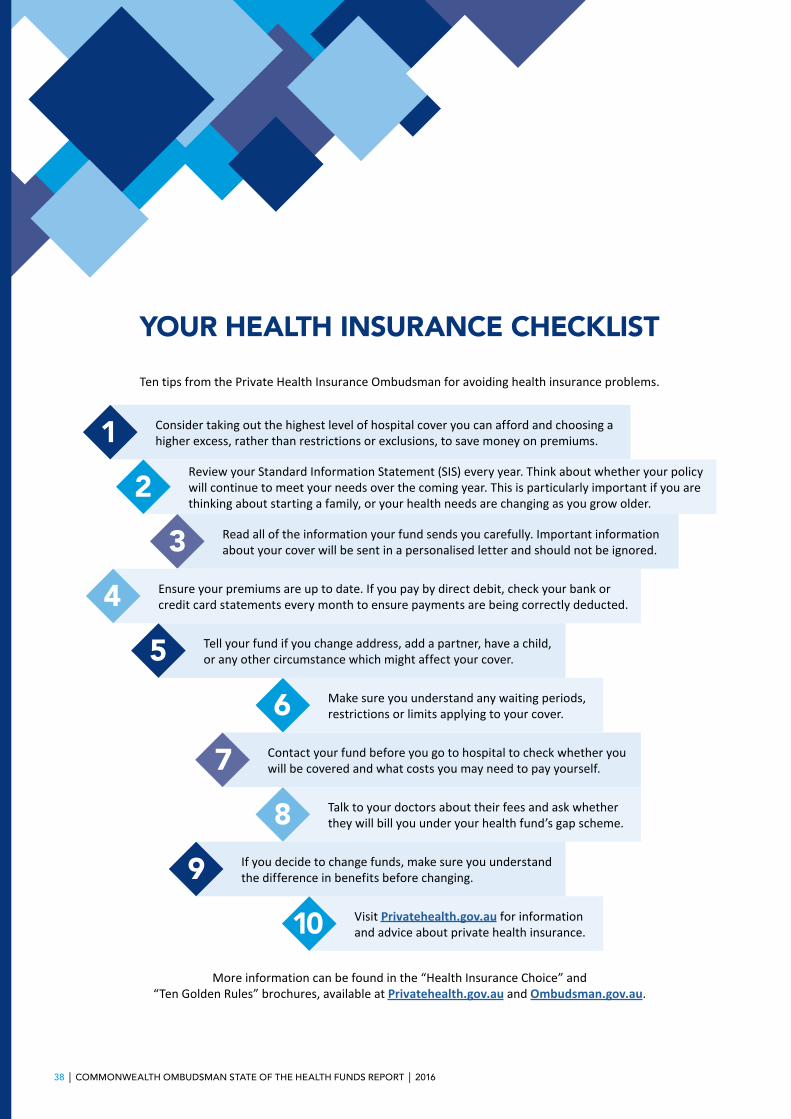
38 | COMMONWEALTH OMBUDSMAN STATE OF THE HEALTH FUNDS REPORT | 2016
YOUR HEALTH INSURANCE CHECKLIST
Ten tips from the Private Health Insurance Ombudsman for avoiding health insurance problems.
1 Consider taking out the highest level of hospital cover you can afford and choosing a higher excess, rather than restrictions or exclusions, to save money on premiums.
2Review your Standard Information Statement (SIS) every year. Think about whether your policy will continue to meet your needs over the coming year. This is particularly important if you are thinking about starting a family, or your health needs are changing as you grow older.
3 Read all of the information your fund sends you carefully. Important information about your cover will be sent in a personalised letter and should not be ignored.
4 Ensure your premiums are up to date. If you pay by direct debit, check your bank or credit card statements every month to ensure payments are being correctly deducted.
5 Tell your fund if you change address, add a partner, have a child, or any other circumstance which might affect your cover.
6 Make sure you understand any waiting periods, restrictions or limits applying to your cover.
7 Contact your fund before you go to hospital to check whether you will be covered and what costs you may need to pay yourself.
8 Talk to your doctors about their fees and ask whether they will bill you under your health fund’s gap scheme.
9 If you decide to change funds, make sure you understand the difference in benefits before changing.
10 Visit Privatehealth.gov.au for information and advice about private health insurance.
More information can be found in the “Health Insurance Choice” and “Ten Golden Rules” brochures, available at Privatehealth.gov.au and Ombudsman.gov.au.