2016 school accountability report card€¦ · providing students with the academic and social...
TRANSCRIPT
2016-17 School Accountability Report Card for Mayfair High Page 1 of 14
Mayfair High
School Accountability Report Card
Reported Using Data from the 2016-17 School Year
Published During 2017-18
By February 1 of each year, every school in California is required by state law to publish a School Accountability Report Card (SARC). The SARC contains information about the condition and performance of each California public school. Under the Local Control Funding Formula (LCFF) all local educational agencies (LEAs) are required to prepare a Local Control and Accountability Plan (LCAP), which describes how they intend to meet annual school-specific goals for all pupils, with specific activities to address state and local priorities. Additionally, data reported in an LCAP is to be consistent with data reported in the SARC. • For more information about SARC requirements, see the California Department of Education (CDE) SARC Web page at
http://www.cde.ca.gov/ta/ac/sa/. • For more information about the LCFF or LCAP, see the CDE LCFF Web page at http://www.cde.ca.gov/fg/aa/lc/. • For additional information about the school, parents/guardians and community members should contact the school principal or
the district office. DataQuest DataQuest is an online data tool located on the CDE DataQuest Web page at http://dq.cde.ca.gov/dataquest/ that contains additional information about this school and comparisons of the school to the district and the county. Specifically, DataQuest is a dynamic system that provides reports for accountability (e.g., test data, enrollment, high school graduates, dropouts, course enrollments, staffing, and data regarding English learners). Internet Access Internet access is available at public libraries and other locations that are publicly accessible (e.g., the California State Library). Access to the Internet at libraries and public locations is generally provided on a first-come, first-served basis. Other use restrictions may include the hours of operation, the length of time that a workstation may be used (depending on availability), the types of software programs available on a workstation, and the ability to print documents.
About This School Contact Information (School Year 2017-18)
School Contact Information
School Name------- Mayfair High
Street------- 6000 N. Woodruff Ave
City, State, Zip------- Lakewood, CA 90713-1124
Phone Number------- 562-925-9981
Principal------- Julie Stanley
E-mail Address------- [email protected]
Web Site------- mayfairmonsoons.org
CDS Code 19643031935618
2016-17 School Accountability Report Card for Mayfair High Page 2 of 14
District Contact Information
District Name------- Bellflower Unified School District
Phone Number------- (562) 866-9011
Superintendent-------
Tracy McSparren
E-mail Address------- [email protected]
Web Site------- http://www.busd.k12.ca.us
School Description and Mission Statement (School Year 2017-18)
Welcome to the 2017-2018 school year. It is with great pride and excitement that I write this letter to you as the Principal of Mayfair Middle/ High School. I am excited and honored to have the opportunity to lead a school with such a rich tradition both in and out of the classroom. Mayfair has earned a reputation of academic excellence through the hard work of our students, teachers, parents, and staff. Mayfair is proud to support numerous challenging academic courses, an outstanding athletic program, second to none visual and performing arts programs and various school clubs for students. We encourage you to experience our school culture, one that is focused on providing students with the academic and social resources that will prepare them to achieve their post-secondary goals. At Mayfair we believe that it is important for our students to be connected to school through positive relationships and a strong sense of community. I believe that every student can learn and be successful if provided the right supports and opportunities. Our teachers and staff are committed to providing all students with an appropriate and challenging educational experience in a respectful environment that fosters learning and growth. When we take the time to strategically plan, forge positive relationships, celebrate our achievements, and continue to build on our successful foundation, we can foster a learning environment where our entire Mayfair community thrives. Mayfair Middle/High School is a place where exceptional teaching and learning is the norm. I am truly honored to be a part of the Monsoon Community. Have a great school year! Mayfair’s campus consists of a middle school and high school that services students in grades seven through twelve. Mayfair currently serves 2,843 students. Mayfair’s mission supports a challenging curriculum, which supports our “Monsoon Motto.” Our motto describes what students will know and be able to do upon graduation from high school: 1. Think Critically and Independently 2. Achieve Maximum Potential 3. Demonstrate a Responsible and Ethical Behavior 4. Communicate Effectively 5. Contribute to Society Our comprehensive, standards-aligned instructional program ensures that all students are connected to Mayfair in meaningful ways through academic programs, extra-curricular activities and curricular paths that enable them to achieve their post-secondary endeavors of higher education or success in the workplace or armed forces. The Western Association of Schools and Colleges (WASC) and the California Department of Education (CDE) granted Mayfair a full-term accreditation, confirming to colleges and universities and the general public that Mayfair meets rigorous qualitative criteria. Our focus on student success is evidenced in our organizational structure. Mayfair Middle/High school is organized into Professional Learning Communities which allows collaboration between core teachers focused on a cohort of students. Professional Learning Teams, or PLT’s, are where teachers collaborate weekly to share best practices, analyze data, and focus on student success. In April of 2017 the WASC team visited for a one day mid-cycle review and reaffirmed the six year accreditation.
2016-17 School Accountability Report Card for Mayfair High Page 3 of 14
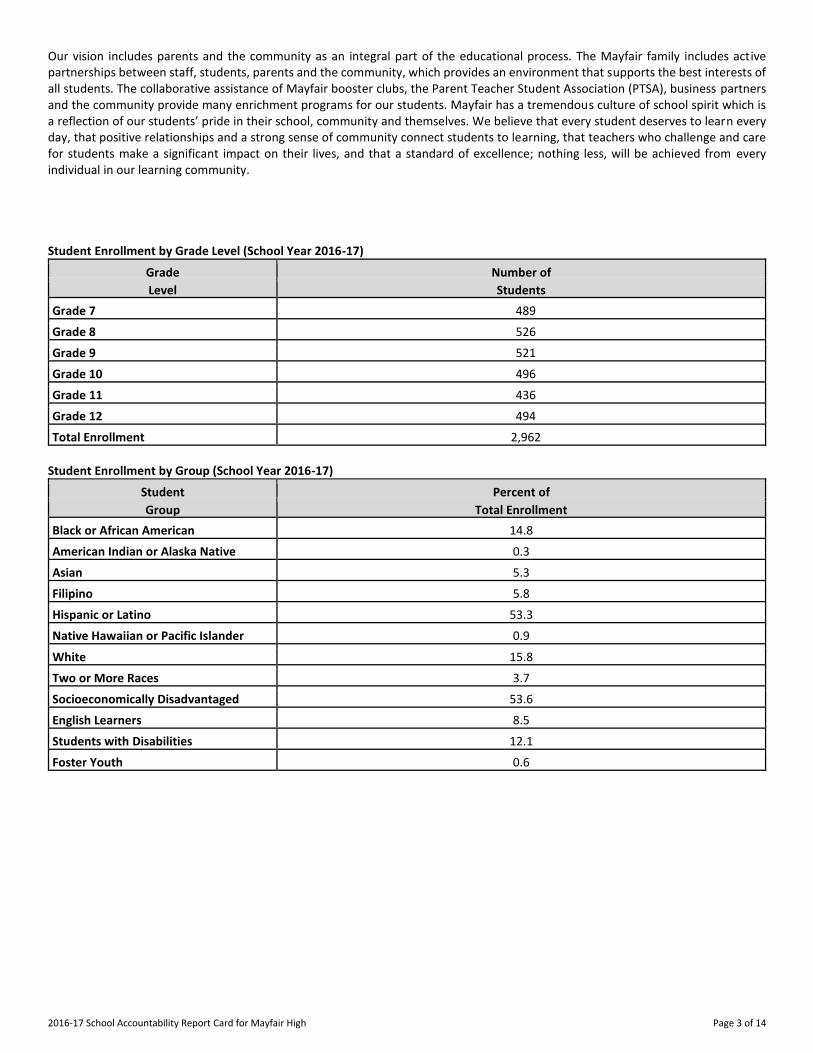
Our vision includes parents and the community as an integral part of the educational process. The Mayfair family includes active partnerships between staff, students, parents and the community, which provides an environment that supports the best interests of all students. The collaborative assistance of Mayfair booster clubs, the Parent Teacher Student Association (PTSA), business partners and the community provide many enrichment programs for our students. Mayfair has a tremendous culture of school spirit which is a reflection of our students’ pride in their school, community and themselves. We believe that every student deserves to learn every day, that positive relationships and a strong sense of community connect students to learning, that teachers who challenge and care for students make a significant impact on their lives, and that a standard of excellence; nothing less, will be achieved from every individual in our learning community. Student Enrollment by Grade Level (School Year 2016-17)
Grade Number of
Level Students
Grade 7 489
Grade 8 526
Grade 9 521
Grade 10 496
Grade 11 436
Grade 12 494
Total Enrollment 2,962
Student Enrollment by Group (School Year 2016-17)
Student Percent of
Group Total Enrollment
Black or African American 14.8
American Indian or Alaska Native 0.3
Asian 5.3
Filipino 5.8
Hispanic or Latino 53.3
Native Hawaiian or Pacific Islander 0.9
White 15.8
Two or More Races 3.7
Socioeconomically Disadvantaged 53.6
English Learners 8.5
Students with Disabilities 12.1
Foster Youth 0.6
2016-17 School Accountability Report Card for Mayfair High Page 4 of 14
A. Conditions of Learning
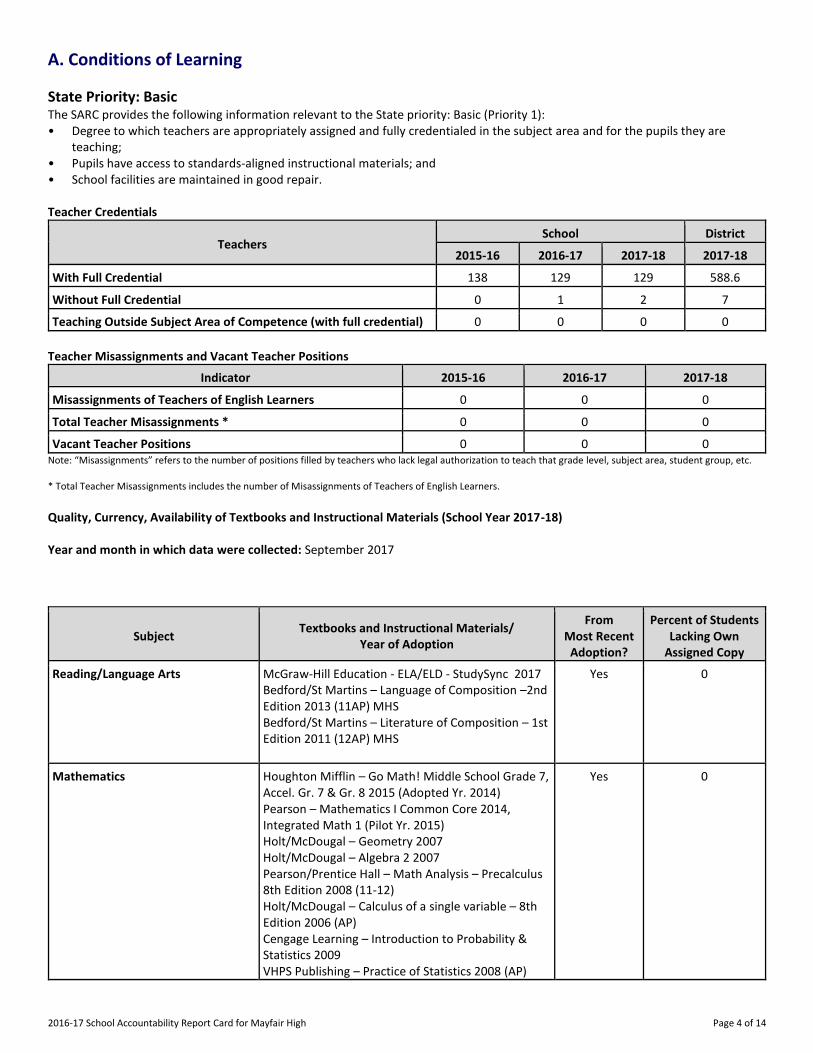
State Priority: Basic The SARC provides the following information relevant to the State priority: Basic (Priority 1): • Degree to which teachers are appropriately assigned and fully credentialed in the subject area and for the pupils they are
teaching; • Pupils have access to standards-aligned instructional materials; and • School facilities are maintained in good repair. Teacher Credentials
Teachers School District
2015-16 2016-17 2017-18 2017-18
With Full Credential 138 129 129 588.6
Without Full Credential 0 1 2 7
Teaching Outside Subject Area of Competence (with full credential) 0 0 0 0
Teacher Misassignments and Vacant Teacher Positions
Indicator 2015-16 2016-17 2017-18
Misassignments of Teachers of English Learners 0 0 0
Total Teacher Misassignments * 0 0 0
Vacant Teacher Positions 0 0 0 Note: “Misassignments” refers to the number of positions filled by teachers who lack legal authorization to teach that grade level, subject area, student group, etc. * Total Teacher Misassignments includes the number of Misassignments of Teachers of English Learners. Quality, Currency, Availability of Textbooks and Instructional Materials (School Year 2017-18) Year and month in which data were collected: September 2017
Subject Textbooks and Instructional Materials/
Year of Adoption
From Most Recent
Adoption?
Percent of Students Lacking Own
Assigned Copy
Reading/Language Arts McGraw-Hill Education - ELA/ELD - StudySync 2017
Bedford/St Martins – Language of Composition –2nd Edition 2013 (11AP) MHS
Bedford/St Martins – Literature of Composition – 1st Edition 2011 (12AP) MHS
Yes 0
Mathematics Houghton Mifflin – Go Math! Middle School Grade 7, Accel. Gr. 7 & Gr. 8 2015 (Adopted Yr. 2014)
Pearson – Mathematics I Common Core 2014, Integrated Math 1 (Pilot Yr. 2015)
Holt/McDougal – Geometry 2007
Holt/McDougal – Algebra 2 2007
Pearson/Prentice Hall – Math Analysis – Precalculus 8th Edition 2008 (11-12)
Holt/McDougal – Calculus of a single variable – 8th Edition 2006 (AP)
Cengage Learning – Introduction to Probability & Statistics 2009
VHPS Publishing – Practice of Statistics 2008 (AP)
Yes 0
2016-17 School Accountability Report Card for Mayfair High Page 5 of 14
Subject Textbooks and Instructional Materials/
Year of Adoption
From Most Recent
Adoption?
Percent of Students Lacking Own
Assigned Copy
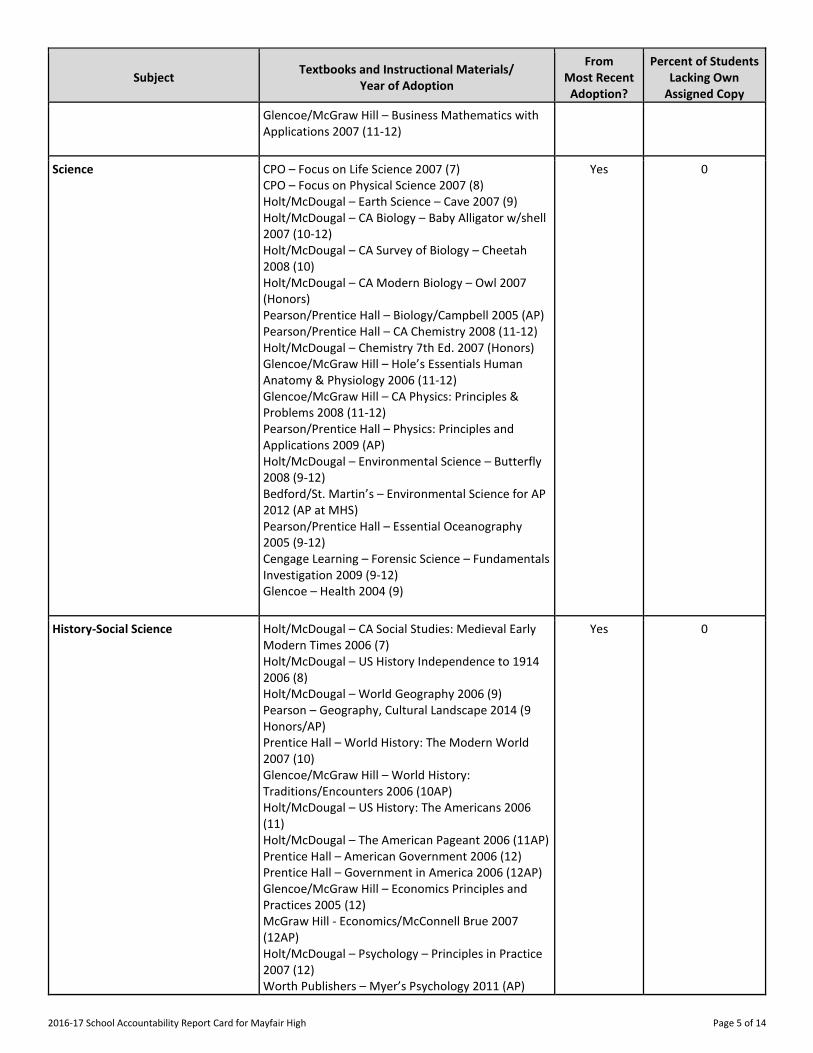
Glencoe/McGraw Hill – Business Mathematics with Applications 2007 (11-12)
Science CPO – Focus on Life Science 2007 (7)
CPO – Focus on Physical Science 2007 (8)
Holt/McDougal – Earth Science – Cave 2007 (9)
Holt/McDougal – CA Biology – Baby Alligator w/shell 2007 (10-12)
Holt/McDougal – CA Survey of Biology – Cheetah 2008 (10)
Holt/McDougal – CA Modern Biology – Owl 2007 (Honors)
Pearson/Prentice Hall – Biology/Campbell 2005 (AP)
Pearson/Prentice Hall – CA Chemistry 2008 (11-12)
Holt/McDougal – Chemistry 7th Ed. 2007 (Honors)
Glencoe/McGraw Hill – Hole’s Essentials Human Anatomy & Physiology 2006 (11-12)
Glencoe/McGraw Hill – CA Physics: Principles & Problems 2008 (11-12)
Pearson/Prentice Hall – Physics: Principles and Applications 2009 (AP)
Holt/McDougal – Environmental Science – Butterfly 2008 (9-12)
Bedford/St. Martin’s – Environmental Science for AP 2012 (AP at MHS)
Pearson/Prentice Hall – Essential Oceanography 2005 (9-12)
Cengage Learning – Forensic Science – Fundamentals Investigation 2009 (9-12)
Glencoe – Health 2004 (9)
Yes 0
History-Social Science Holt/McDougal – CA Social Studies: Medieval Early Modern Times 2006 (7)
Holt/McDougal – US History Independence to 1914 2006 (8)
Holt/McDougal – World Geography 2006 (9)
Pearson – Geography, Cultural Landscape 2014 (9 Honors/AP)
Prentice Hall – World History: The Modern World 2007 (10)
Glencoe/McGraw Hill – World History: Traditions/Encounters 2006 (10AP)
Holt/McDougal – US History: The Americans 2006 (11)
Holt/McDougal – The American Pageant 2006 (11AP)
Prentice Hall – American Government 2006 (12)
Prentice Hall – Government in America 2006 (12AP)
Glencoe/McGraw Hill – Economics Principles and Practices 2005 (12)
McGraw Hill - Economics/McConnell Brue 2007 (12AP)
Holt/McDougal – Psychology – Principles in Practice 2007 (12)
Worth Publishers – Myer’s Psychology 2011 (AP)
Yes 0
2016-17 School Accountability Report Card for Mayfair High Page 6 of 14
Subject Textbooks and Instructional Materials/
Year of Adoption
From Most Recent
Adoption?
Percent of Students Lacking Own
Assigned Copy
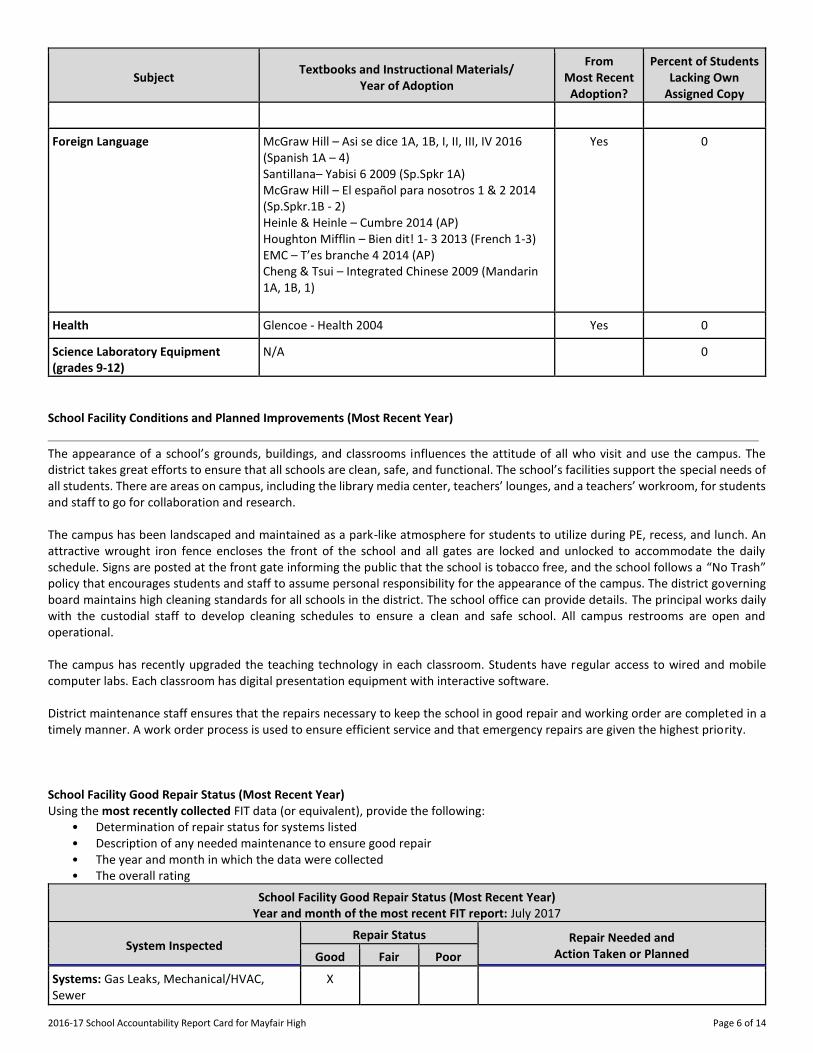
Foreign Language McGraw Hill – Asi se dice 1A, 1B, I, II, III, IV 2016 (Spanish 1A – 4)
Santillana– Yabisi 6 2009 (Sp.Spkr 1A)
McGraw Hill – El español para nosotros 1 & 2 2014 (Sp.Spkr.1B - 2)
Heinle & Heinle – Cumbre 2014 (AP)
Houghton Mifflin – Bien dit! 1- 3 2013 (French 1-3)
EMC – T’es branche 4 2014 (AP) Cheng & Tsui – Integrated Chinese 2009 (Mandarin 1A, 1B, 1)
Yes 0
Health Glencoe - Health 2004 Yes 0
Science Laboratory Equipment (grades 9-12)
N/A 0
School Facility Conditions and Planned Improvements (Most Recent Year)
The appearance of a school’s grounds, buildings, and classrooms influences the attitude of all who visit and use the campus. The district takes great efforts to ensure that all schools are clean, safe, and functional. The school’s facilities support the special needs of all students. There are areas on campus, including the library media center, teachers’ lounges, and a teachers’ workroom, for students and staff to go for collaboration and research. The campus has been landscaped and maintained as a park-like atmosphere for students to utilize during PE, recess, and lunch. An attractive wrought iron fence encloses the front of the school and all gates are locked and unlocked to accommodate the daily schedule. Signs are posted at the front gate informing the public that the school is tobacco free, and the school follows a “No Trash” policy that encourages students and staff to assume personal responsibility for the appearance of the campus. The district governing board maintains high cleaning standards for all schools in the district. The school office can provide details. The principal works daily with the custodial staff to develop cleaning schedules to ensure a clean and safe school. All campus restrooms are open and operational. The campus has recently upgraded the teaching technology in each classroom. Students have regular access to wired and mobile computer labs. Each classroom has digital presentation equipment with interactive software. District maintenance staff ensures that the repairs necessary to keep the school in good repair and working order are completed in a timely manner. A work order process is used to ensure efficient service and that emergency repairs are given the highest priority. School Facility Good Repair Status (Most Recent Year) Using the most recently collected FIT data (or equivalent), provide the following:
• Determination of repair status for systems listed • Description of any needed maintenance to ensure good repair • The year and month in which the data were collected • The overall rating
School Facility Good Repair Status (Most Recent Year) Year and month of the most recent FIT report: July 2017
System Inspected Repair Status Repair Needed and
Action Taken or Planned Good Fair Poor
Systems: Gas Leaks, Mechanical/HVAC, Sewer
X
2016-17 School Accountability Report Card for Mayfair High Page 7 of 14
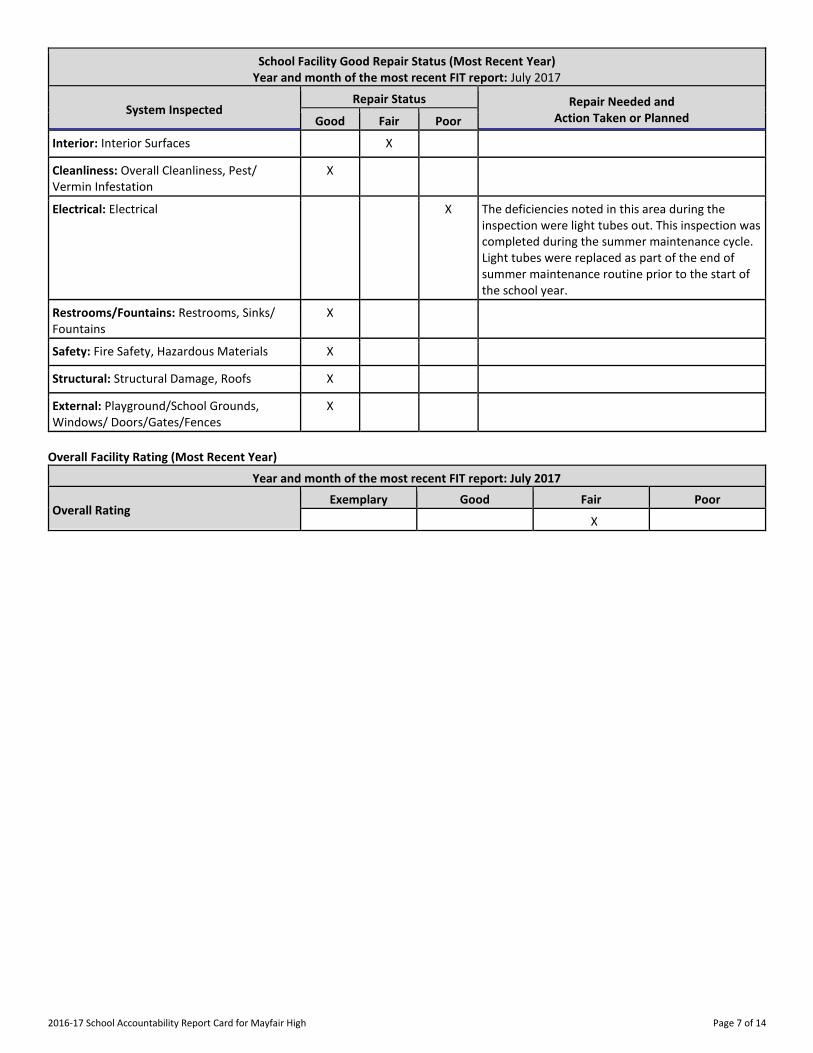
School Facility Good Repair Status (Most Recent Year) Year and month of the most recent FIT report: July 2017
System Inspected Repair Status Repair Needed and
Action Taken or Planned Good Fair Poor
Interior: Interior Surfaces X
Cleanliness: Overall Cleanliness, Pest/ Vermin Infestation
X
Electrical: Electrical X The deficiencies noted in this area during the inspection were light tubes out. This inspection was completed during the summer maintenance cycle. Light tubes were replaced as part of the end of summer maintenance routine prior to the start of the school year.
Restrooms/Fountains: Restrooms, Sinks/ Fountains
X
Safety: Fire Safety, Hazardous Materials X
Structural: Structural Damage, Roofs X
External: Playground/School Grounds, Windows/ Doors/Gates/Fences
X
Overall Facility Rating (Most Recent Year)
Year and month of the most recent FIT report: July 2017
Overall Rating Exemplary Good Fair Poor
X
2016-17 School Accountability Report Card for Mayfair High Page 8 of 14
B. Pupil Outcomes
State Priority: Pupil Achievement The SARC provides the following information relevant to the State priority: Pupil Achievement (Priority 4): • Statewide assessments (i.e., California Assessment of Student Performance and Progress [CAASPP] System, which includes the
Smarter Balanced Summative Assessments for students in the general education population and the California Alternate Assessments [CAAs] for English language arts/literacy [ELA] and mathematics given in grades three through eight and grade eleven. Only eligible students may participate in the administration of the CAAs. CAAs items are aligned with alternate achievement standards, which are linked with the Common Core State Standards [CCSS] for students with the most significant cognitive disabilities); and
• The percentage of students who have successfully completed courses that satisfy the requirements for entrance to the University of California and the California State University, or career technical education sequences or programs of study.
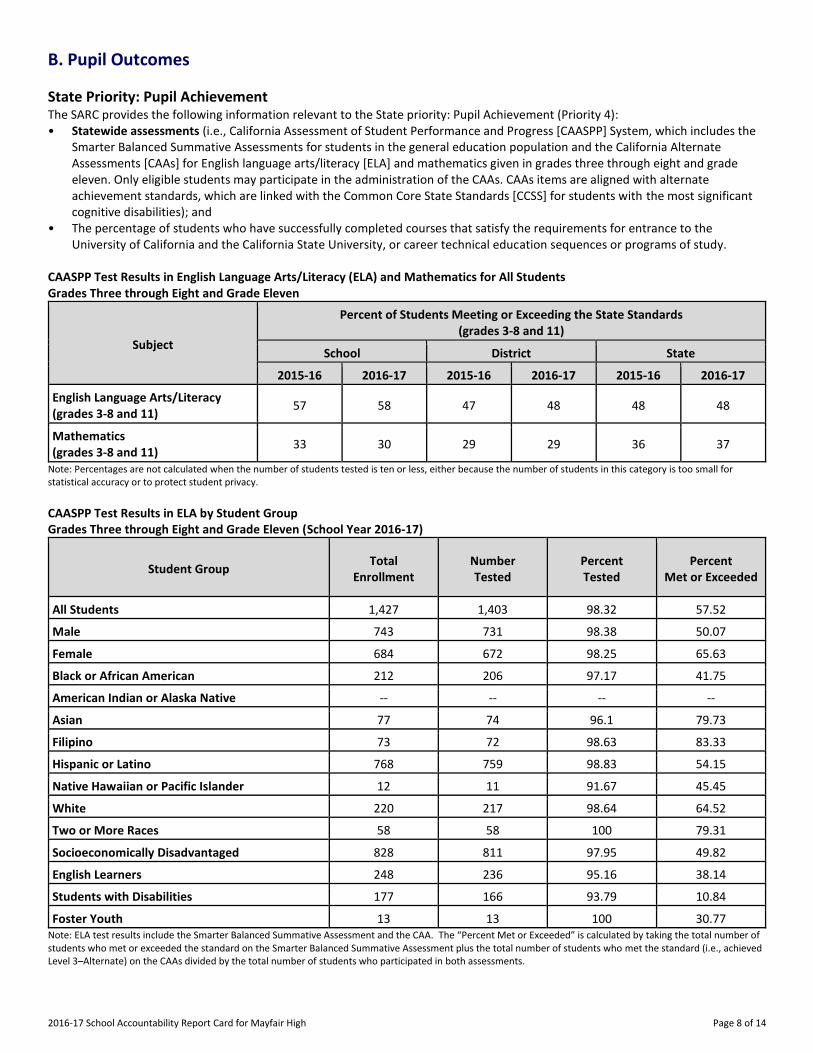
CAASPP Test Results in English Language Arts/Literacy (ELA) and Mathematics for All Students Grades Three through Eight and Grade Eleven
Subject
Percent of Students Meeting or Exceeding the State Standards (grades 3-8 and 11)
School District State
2015-16 2016-17 2015-16 2016-17 2015-16 2016-17
English Language Arts/Literacy (grades 3-8 and 11)
57 58 47 48 48 48
Mathematics (grades 3-8 and 11)
33 30 29 29 36 37
Note: Percentages are not calculated when the number of students tested is ten or less, either because the number of students in this category is too small for statistical accuracy or to protect student privacy.
CAASPP Test Results in ELA by Student Group Grades Three through Eight and Grade Eleven (School Year 2016-17)
Student Group Total
Enrollment Number Tested
Percent Tested
Percent Met or Exceeded
All Students 1,427 1,403 98.32 57.52
Male 743 731 98.38 50.07
Female 684 672 98.25 65.63
Black or African American 212 206 97.17 41.75
American Indian or Alaska Native -- -- -- --
Asian 77 74 96.1 79.73
Filipino 73 72 98.63 83.33
Hispanic or Latino 768 759 98.83 54.15
Native Hawaiian or Pacific Islander 12 11 91.67 45.45
White 220 217 98.64 64.52
Two or More Races 58 58 100 79.31
Socioeconomically Disadvantaged 828 811 97.95 49.82
English Learners 248 236 95.16 38.14
Students with Disabilities 177 166 93.79 10.84
Foster Youth 13 13 100 30.77 Note: ELA test results include the Smarter Balanced Summative Assessment and the CAA. The “Percent Met or Exceeded” is calculated by taking the total number of students who met or exceeded the standard on the Smarter Balanced Summative Assessment plus the total number of students who met the standard (i.e., achieved Level 3–Alternate) on the CAAs divided by the total number of students who participated in both assessments.
2016-17 School Accountability Report Card for Mayfair High Page 9 of 14
Note: Double dashes (--) appear in the table when the number of students is ten or less, either because the number of students in this category is too small for statistical accuracy or to protect student privacy. Note: The number of students tested includes all students who participated in the test whether they received a score or not; however, the number of students tested is not the number that was used to calculate the achievement level percentages. The achievement level percentages are calculated using only students who received scores.
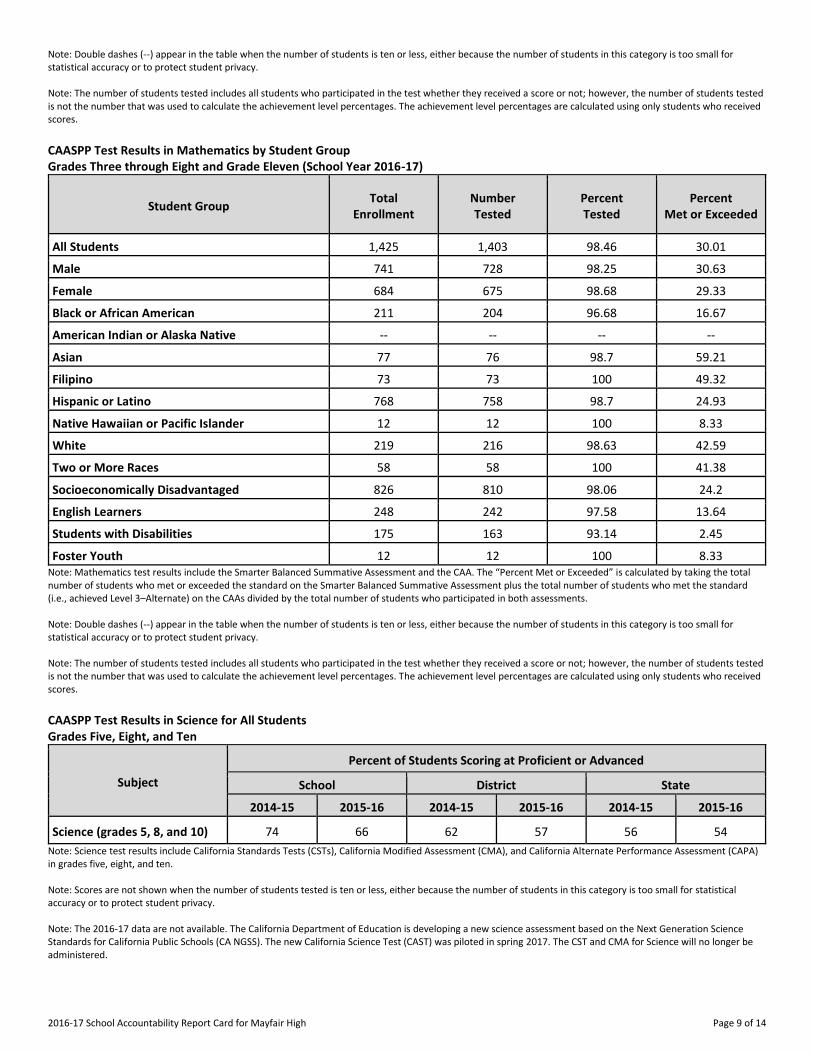
CAASPP Test Results in Mathematics by Student Group Grades Three through Eight and Grade Eleven (School Year 2016-17)
Student Group Total
Enrollment Number Tested
Percent Tested
Percent Met or Exceeded
All Students 1,425 1,403 98.46 30.01
Male 741 728 98.25 30.63
Female 684 675 98.68 29.33
Black or African American 211 204 96.68 16.67
American Indian or Alaska Native -- -- -- --
Asian 77 76 98.7 59.21
Filipino 73 73 100 49.32
Hispanic or Latino 768 758 98.7 24.93
Native Hawaiian or Pacific Islander 12 12 100 8.33
White 219 216 98.63 42.59
Two or More Races 58 58 100 41.38
Socioeconomically Disadvantaged 826 810 98.06 24.2
English Learners 248 242 97.58 13.64
Students with Disabilities 175 163 93.14 2.45
Foster Youth 12 12 100 8.33 Note: Mathematics test results include the Smarter Balanced Summative Assessment and the CAA. The “Percent Met or Exceeded” is calculated by taking the total number of students who met or exceeded the standard on the Smarter Balanced Summative Assessment plus the total number of students who met the standard (i.e., achieved Level 3–Alternate) on the CAAs divided by the total number of students who participated in both assessments. Note: Double dashes (--) appear in the table when the number of students is ten or less, either because the number of students in this category is too small for statistical accuracy or to protect student privacy. Note: The number of students tested includes all students who participated in the test whether they received a score or not; however, the number of students tested is not the number that was used to calculate the achievement level percentages. The achievement level percentages are calculated using only students who received scores.
CAASPP Test Results in Science for All Students Grades Five, Eight, and Ten
Subject
Percent of Students Scoring at Proficient or Advanced
School District State
2014-15 2015-16 2014-15 2015-16 2014-15 2015-16
Science (grades 5, 8, and 10) 74 66 62 57 56 54
Note: Science test results include California Standards Tests (CSTs), California Modified Assessment (CMA), and California Alternate Performance Assessment (CAPA) in grades five, eight, and ten. Note: Scores are not shown when the number of students tested is ten or less, either because the number of students in this category is too small for statistical accuracy or to protect student privacy. Note: The 2016-17 data are not available. The California Department of Education is developing a new science assessment based on the Next Generation Science Standards for California Public Schools (CA NGSS). The new California Science Test (CAST) was piloted in spring 2017. The CST and CMA for Science will no longer be administered.
2016-17 School Accountability Report Card for Mayfair High Page 10 of 14
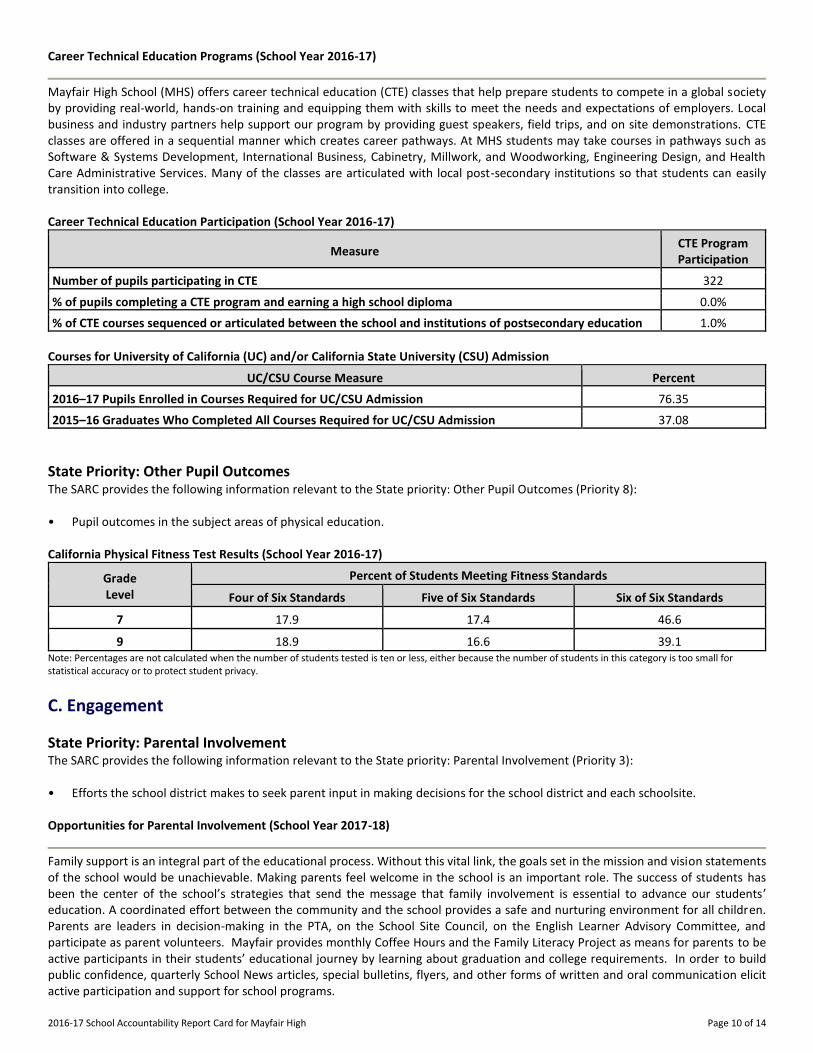
Career Technical Education Programs (School Year 2016-17)
Mayfair High School (MHS) offers career technical education (CTE) classes that help prepare students to compete in a global society by providing real-world, hands-on training and equipping them with skills to meet the needs and expectations of employers. Local business and industry partners help support our program by providing guest speakers, field trips, and on site demonstrations. CTE classes are offered in a sequential manner which creates career pathways. At MHS students may take courses in pathways such as Software & Systems Development, International Business, Cabinetry, Millwork, and Woodworking, Engineering Design, and Health Care Administrative Services. Many of the classes are articulated with local post-secondary institutions so that students can easily transition into college. Career Technical Education Participation (School Year 2016-17)
Measure CTE Program Participation
Number of pupils participating in CTE 322
% of pupils completing a CTE program and earning a high school diploma 0.0%
% of CTE courses sequenced or articulated between the school and institutions of postsecondary education 1.0%
Courses for University of California (UC) and/or California State University (CSU) Admission
UC/CSU Course Measure Percent
2016–17 Pupils Enrolled in Courses Required for UC/CSU Admission 76.35
2015–16 Graduates Who Completed All Courses Required for UC/CSU Admission 37.08
State Priority: Other Pupil Outcomes The SARC provides the following information relevant to the State priority: Other Pupil Outcomes (Priority 8): • Pupil outcomes in the subject areas of physical education. California Physical Fitness Test Results (School Year 2016-17)
Grade Level
Percent of Students Meeting Fitness Standards
Four of Six Standards Five of Six Standards Six of Six Standards
---7--- 17.9 17.4 46.6
---9--- 18.9 16.6 39.1 Note: Percentages are not calculated when the number of students tested is ten or less, either because the number of students in this category is too small for statistical accuracy or to protect student privacy.
C. Engagement
State Priority: Parental Involvement The SARC provides the following information relevant to the State priority: Parental Involvement (Priority 3): • Efforts the school district makes to seek parent input in making decisions for the school district and each schoolsite. Opportunities for Parental Involvement (School Year 2017-18)
Family support is an integral part of the educational process. Without this vital link, the goals set in the mission and vision statements of the school would be unachievable. Making parents feel welcome in the school is an important role. The success of students has been the center of the school’s strategies that send the message that family involvement is essential to advance our students’ education. A coordinated effort between the community and the school provides a safe and nurturing environment for all children. Parents are leaders in decision-making in the PTA, on the School Site Council, on the English Learner Advisory Committee, and participate as parent volunteers. Mayfair provides monthly Coffee Hours and the Family Literacy Project as means for parents to be active participants in their students’ educational journey by learning about graduation and college requirements. In order to build public confidence, quarterly School News articles, special bulletins, flyers, and other forms of written and oral communication elicit active participation and support for school programs.
2016-17 School Accountability Report Card for Mayfair High Page 11 of 14
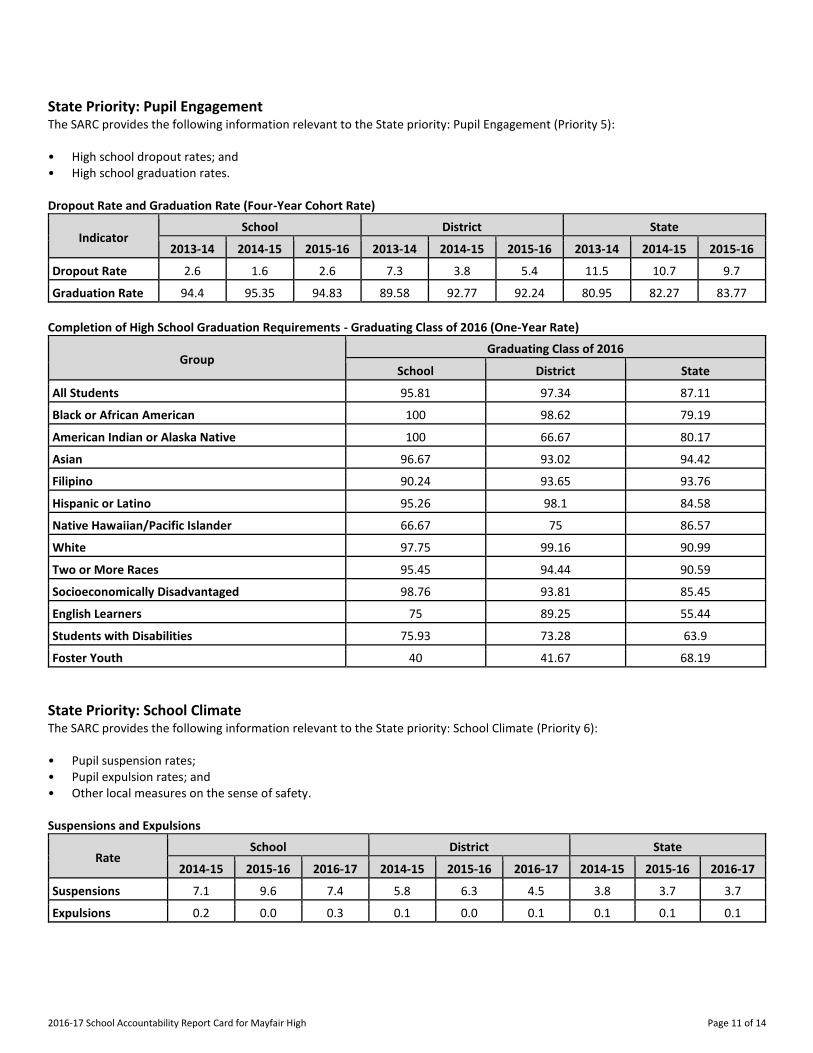
State Priority: Pupil Engagement The SARC provides the following information relevant to the State priority: Pupil Engagement (Priority 5): • High school dropout rates; and • High school graduation rates. Dropout Rate and Graduation Rate (Four-Year Cohort Rate)
Indicator School District State
2013-14 2014-15 2015-16 2013-14 2014-15 2015-16 2013-14 2014-15 2015-16
Dropout Rate 2.6 1.6 2.6 7.3 3.8 5.4 11.5 10.7 9.7
Graduation Rate 94.4 95.35 94.83 89.58 92.77 92.24 80.95 82.27 83.77
Completion of High School Graduation Requirements - Graduating Class of 2016 (One-Year Rate)
Group Graduating Class of 2016
School District State
All Students 95.81 97.34 87.11
Black or African American 100 98.62 79.19
American Indian or Alaska Native 100 66.67 80.17
Asian 96.67 93.02 94.42
Filipino 90.24 93.65 93.76
Hispanic or Latino 95.26 98.1 84.58
Native Hawaiian/Pacific Islander 66.67 75 86.57
White 97.75 99.16 90.99
Two or More Races 95.45 94.44 90.59
Socioeconomically Disadvantaged 98.76 93.81 85.45
English Learners 75 89.25 55.44
Students with Disabilities 75.93 73.28 63.9
Foster Youth 40 41.67 68.19
State Priority: School Climate The SARC provides the following information relevant to the State priority: School Climate (Priority 6): • Pupil suspension rates; • Pupil expulsion rates; and • Other local measures on the sense of safety. Suspensions and Expulsions
Rate School District State
2014-15 2015-16 2016-17 2014-15 2015-16 2016-17 2014-15 2015-16 2016-17
Suspensions------- 7.1 9.6 7.4 5.8 6.3 4.5 3.8 3.7 3.7
Expulsions------- 0.2 0.0 0.3 0.1 0.0 0.1 0.1 0.1 0.1
2016-17 School Accountability Report Card for Mayfair High Page 12 of 14
School Safety Plan (School Year 2017-18)
The staff, students, parents, the Parent Teacher Association (PTA), and community members at the school strive to provide effective ways to give all students the safe, clean, healthy, and disciplined conditions that allow teachers to effectively teach and students to actively learn. The school’s mission and vision statements place the physical, emotional, and psychological safety and well-being of our students and staff among our highest priorities. All elements of the school, the education provided, the student support staff, the school’s leadership, our parents and families, and the school’s surrounding community, combine to produce a positive, safe, and secure environment for all students. The school’s comprehensive safety plan establishes regular review of emergency response plans, expectations for the cleanliness and timely maintenance of facilities, and behavioral norms. The school meets its obligation to provide support systems that promote the health and safety of students and adults alike. The Safety Plan is reviewed and updated annually by staff and the Safety Committee (SSC/PAC). The school committee approves the plan each year. The plans are submitted to the District Office for review by the Assistant Superintendent and the Sheriff and approved by the Board of Education. On December 6, 2016 the members of the School Site Council met and approved the Comprehensive School Safety Plan for the 2017-2018 school year.
D. Other SARC Information
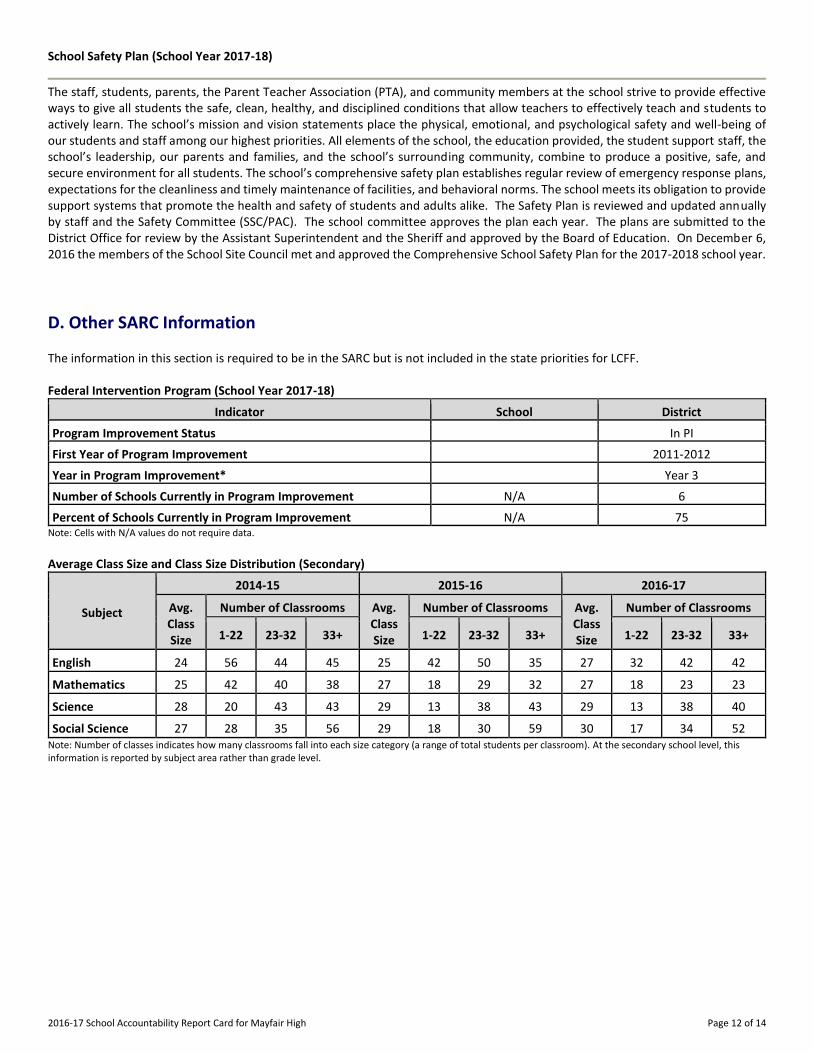
The information in this section is required to be in the SARC but is not included in the state priorities for LCFF. Federal Intervention Program (School Year 2017-18)
Indicator School District
Program Improvement Status In PI
First Year of Program Improvement 2011-2012
Year in Program Improvement* Year 3
Number of Schools Currently in Program Improvement N/A 6
Percent of Schools Currently in Program Improvement N/A 75 Note: Cells with N/A values do not require data.
Average Class Size and Class Size Distribution (Secondary)
Subject
2014-15 2015-16 2016-17
Avg. Class Size
Number of Classrooms Avg. Class Size
Number of Classrooms Avg. Class Size
Number of Classrooms
1-22 23-32 33+ 1-22 23-32 33+ 1-22 23-32 33+
English------- ----------
24 56 44 45 25 42 50 35 27 32 42 42
Mathematics ----------
25 42 40 38 27 18 29 32 27 18 23 23
Science------- ----------
28 20 43 43 29 13 38 43 29 13 38 40
Social Science ----------
27 28 35 56 29 18 30 59 30 17 34 52 Note: Number of classes indicates how many classrooms fall into each size category (a range of total students per classroom). At the secondary school level, this information is reported by subject area rather than grade level.
2016-17 School Accountability Report Card for Mayfair High Page 13 of 14
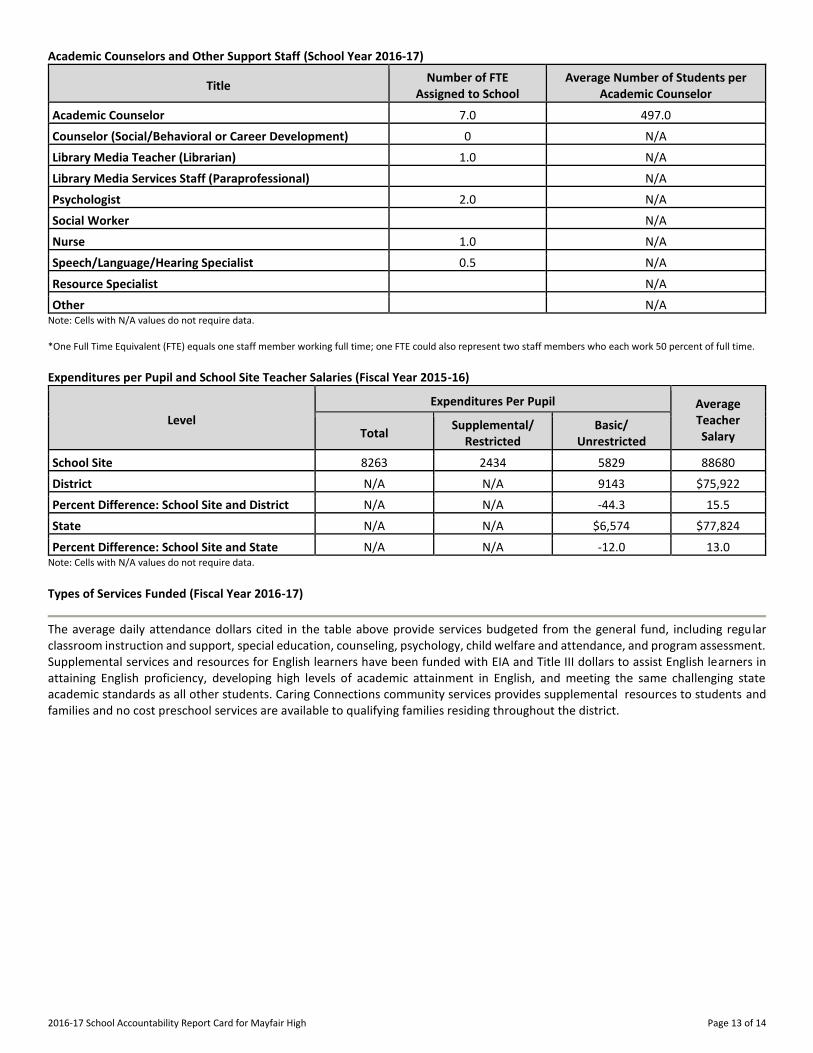
Academic Counselors and Other Support Staff (School Year 2016-17)
Title Number of FTE
Assigned to School Average Number of Students per
Academic Counselor
Academic Counselor------- 7.0 497.0
Counselor (Social/Behavioral or Career Development) 0 N/A
Library Media Teacher (Librarian) 1.0 N/A
Library Media Services Staff (Paraprofessional) N/A
Psychologist------- 2.0 N/A
Social Worker------- N/A
Nurse------- 1.0 N/A
Speech/Language/Hearing Specialist 0.5 N/A
Resource Specialist------- N/A
Other------- N/A Note: Cells with N/A values do not require data. *One Full Time Equivalent (FTE) equals one staff member working full time; one FTE could also represent two staff members who each work 50 percent of full time.
Expenditures per Pupil and School Site Teacher Salaries (Fiscal Year 2015-16)
Level
Expenditures Per Pupil Average Teacher Salary Total
Supplemental/ Restricted
Basic/ Unrestricted
School Site------- 8263 2434 5829 88680
District------- N/A N/A 9143 $75,922
Percent Difference: School Site and District N/A N/A -44.3 15.5
State------- N/A N/A $6,574 $77,824
Percent Difference: School Site and State N/A N/A -12.0 13.0 Note: Cells with N/A values do not require data.
Types of Services Funded (Fiscal Year 2016-17)
The average daily attendance dollars cited in the table above provide services budgeted from the general fund, including regular classroom instruction and support, special education, counseling, psychology, child welfare and attendance, and program assessment. Supplemental services and resources for English learners have been funded with EIA and Title III dollars to assist English learners in attaining English proficiency, developing high levels of academic attainment in English, and meeting the same challenging state academic standards as all other students. Caring Connections community services provides supplemental resources to students and families and no cost preschool services are available to qualifying families residing throughout the district.
2016-17 School Accountability Report Card for Mayfair High Page 14 of 14
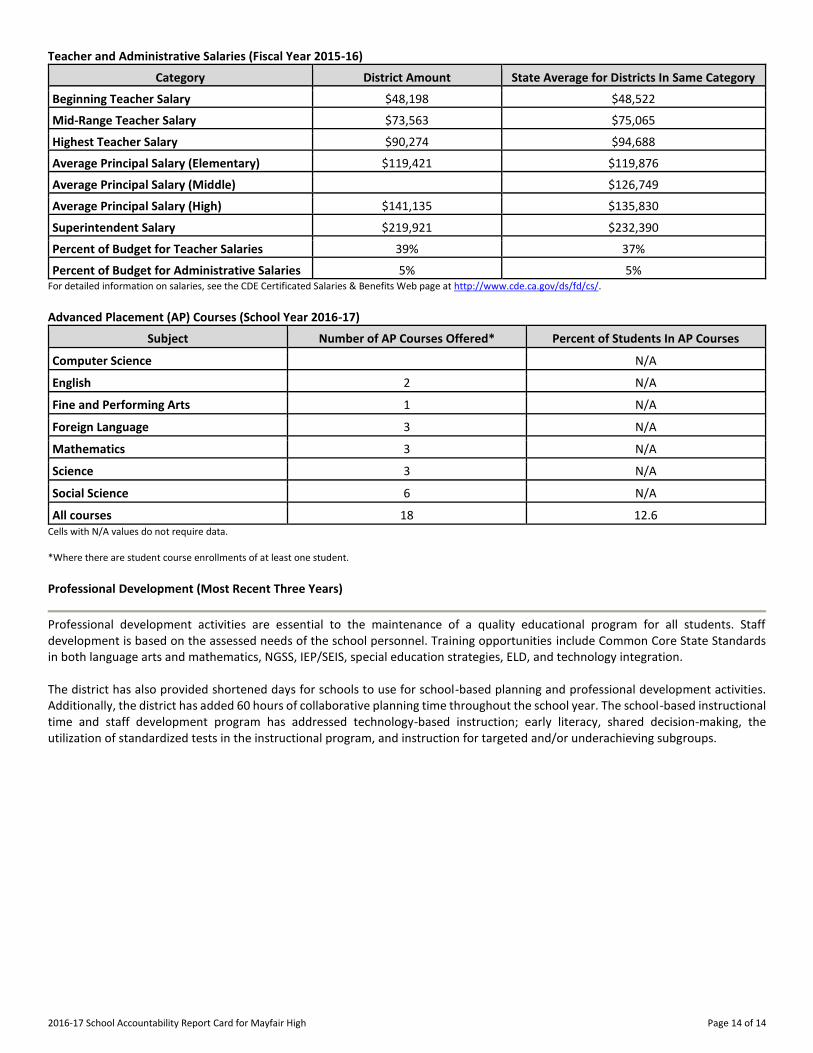
Teacher and Administrative Salaries (Fiscal Year 2015-16)
Category District Amount State Average for Districts In Same Category
Beginning Teacher Salary $48,198 $48,522
Mid-Range Teacher Salary $73,563 $75,065
Highest Teacher Salary $90,274 $94,688
Average Principal Salary (Elementary) $119,421 $119,876
Average Principal Salary (Middle) $126,749
Average Principal Salary (High) $141,135 $135,830
Superintendent Salary $219,921 $232,390
Percent of Budget for Teacher Salaries 39% 37%
Percent of Budget for Administrative Salaries 5% 5% For detailed information on salaries, see the CDE Certificated Salaries & Benefits Web page at http://www.cde.ca.gov/ds/fd/cs/. Advanced Placement (AP) Courses (School Year 2016-17)
Subject Number of AP Courses Offered* Percent of Students In AP Courses
Computer Science N/A
English------- 2 N/A
Fine and Performing Arts 1 N/A
Foreign Language 3 N/A
Mathematics 3 N/A
Science------- 3 N/A
Social Science 6 N/A
All courses 18 12.6 Cells with N/A values do not require data. *Where there are student course enrollments of at least one student.
Professional Development (Most Recent Three Years)
Professional development activities are essential to the maintenance of a quality educational program for all students. Staff development is based on the assessed needs of the school personnel. Training opportunities include Common Core State Standards in both language arts and mathematics, NGSS, IEP/SEIS, special education strategies, ELD, and technology integration. The district has also provided shortened days for schools to use for school-based planning and professional development activities. Additionally, the district has added 60 hours of collaborative planning time throughout the school year. The school-based instructional time and staff development program has addressed technology-based instruction; early literacy, shared decision-making, the utilization of standardized tests in the instructional program, and instruction for targeted and/or underachieving subgroups.