2016 rural transit fact book - surtc · the 2011 edition of the rural transit fact book was the...
TRANSCRIPT

RURAL TRANSIT FACT BOOK | 2016

Rural Transit Fact Book 2016
Prepared by:
Jeremy Mattson Associate Research Fellow
North Dakota State University
Upper Great Plains Transportation Institute Small Urban and Rural Transit Center
Fargo, ND
www.surtc.org
SURLC 16-003 November 2016

Acknowledgements
The funds for this study were provided by the United States Department of Transportation through the Small Urban and Rural Livability Center, a collaboration between the Western Transportation Institute at Montana State University and the Upper Great Plains Transportation Institute at North Dakota State University. The Small Urban and Rural Transit Center within the Upper Great Plains Transportation Institute conducted the research.
Disclaimer
The content presented in this report is the sole responsibility of the Small Urban and Rural Transit Center, the Upper Great Plains Transportation Institute and the authors. NDSU does not discriminate in its programs and activities on the basis of age, color, gender expression/identity, genetic information, marital status, national origin, participation in lawful off-campus activity, physical or mental disability, pregnancy, public assistance status, race, religion, sex, sexual orientation, spousal relationship to current employee, or veteran status, as applicable. Direct inquiries to Vice Provost for Title IX/ADA Coordinator, Old Main 201, NDSU Main Campus, 701-231-7708, [email protected].
CONTENTS INTRODUCTION .......................................................................................................................................... 1
RURAL AMERICA ........................................................................................................................................... 2
RURAL TRANSPORTATION .......................................................................................................................... 5
NATIONAL RURAL TRANSIT ......................................................................................................................... 10
OPERATING STATISTICS ........................................................................................................................... 14
FINANCIAL STATISTICS ............................................................................................................................ 17
FLEET STATISTICS .................................................................................................................................... 18
NATIONAL RURAL TRANSIT PERFORMANCE MEASURES ............................................................................ 22
REGIONAL AND STATE STATISTICS ........................................................................................................... 27
TRIBAL TRANSIT ......................................................................................................................................... 37
REFERENCES ............................................................................................................................................... 39
Glossary of Terms ...................................................................................................................................... 40

LIST OF TABLES Table 1. Characteristics of U.S. Urban and Rural Populations .................................................................. 3 Table 2. Geographic Mobility.................................................................................................................... 4 Table 3. Vehicles Available in Household ................................................................................................. 5 Table 4. Commuting to Work ................................................................................................................... 6 Table 5. Travel Behavior for Urban and Rural Residents, by Age Group .................................................. 7 Table 6. Percentage who Drive, by Age, Geography, and Gender ........................................................... 7 Table 7. Mode Shares ............................................................................................................................... 7 Table 8. Trip Purpose for Transit and Non-Transit Trips .......................................................................... 8 Table 9. Amenities Accessibly by Transit, Use of Transit, and Desirability of Transit in Urban, Suburban, and Rural Areas ......................................................................................................... 9 Table 10. Number of Rural Transit Providers Nationwide ........................................................................ 11 Table 11. Counties with Rural Transit Service .......................................................................................... 12 Table 12. Rural Transit Operating Statistics .............................................................................................. 14 Table 13. Rural Service Provided by Urban Operators ............................................................................. 15 Table 14. Agency Level Changes in Service Miles, Hours, and Trips, 2013-2014 ..................................... 16 Table 15. Rural Transit Operating Statistics, Median and Percentile Rankings per Agency, 2014 ........... 16 Table 16. Rural Transit Financial Statistics: Sources of Funding ............................................................... 17 Table 17. Average Fleet Size ..................................................................................................................... 18 Table 18. Number of Vehicles in Operation ............................................................................................. 18 Table 19. Percentage of Rural Transit Vehicles that are ADA Accessible ................................................. 19 Table 20. Average Vehicle Age ................................................................................................................. 19 Table 21. Average Vehicle Length............................................................................................................. 19 Table 22. Average Seating Capacity .......................................................................................................... 20 Table 23. Vehicle Ownership, 2014 .......................................................................................................... 20 Table 24. Primary Funding Source for Vehicles, 2014 .............................................................................. 21 Table 25. Trips per Mile and Trips per Hour ............................................................................................. 22 Table 26. Trips per Mile by Number of Miles Provided, 2014 .................................................................. 23 Table 27. Trips per Hour by Number of Hours Provided, 2014 ................................................................ 24 Table 28. Trips, Miles, and Hours per Vehicle .......................................................................................... 24 Table 29. Operating Costs per Trip and per Mile and Farebox Recovery Ratio ....................................... 25 Table 30. Operating Costs per Trip and per Mile and Farebox Recovery Ratio, Percentile Rankings, 2014 .......................................................................................................................... 25 Table 31. Operating Statistics and Performance Measures by Size of Operation, 2014 .......................... 26 Table 32. Regional Data, 2014 .................................................................................................................. 28 Table 33. Rural Transit Vehicle Revenue Miles of Service by State, 2011-2014 (million miles) ............... 30 Table 34. State Operating Statistics, 2014 ................................................................................................ 31 Table 35. State Financial Statistics, 2014 .................................................................................................. 32 Table 36. State Fleet Statistics, 2014 ........................................................................................................ 33 Table 37. State Performance Measures, Median Agencies Values, 2014 ................................................ 34 Table 38. Tribal Transit Statistics, 2014 .................................................................................................... 38

LIST OF FIGURES Figure 1. Percentage of Population Aged 65 or Older, 2006-2014 ............................................................ 4 Figure 2. Vehicle Miles Traveled on Urban and Rural Roadways .............................................................. 6 Figure 3. Percentage of Trips by Public Transportation, by Size of Metro Area ........................................ 8 Figure 4. Map of U.S. Counties with Rural Transit Service ...................................................................... 13 Figure 5. FTA Obligations under the Section 5311 Program, FY2006–FY2014 ........................................ 17 Figure 6. Fleet Composition, 2014 ........................................................................................................... 18 Figure 7. FTA Regions ............................................................................................................................... 27 Figure 8. Total Trips by State ................................................................................................................... 35 Figure 9. Total Vehicle Revenue Miles by State ....................................................................................... 35 Figure 10. Trips per Vehicle Revenue Mile by State .................................................................................. 36 Figure 11. Trips per Vehicle Revenue Hour by State ................................................................................. 36


Rural Transit Fact Book • 2016 | 1
INTRODUCTION Public transportation plays a fundamental role in the livability of all communities. The Rural Transit Fact Book provides information on transit service availability and cost to help the transit industry in the United States provide efficient and effective service to meet rural community mobility needs. Financial and operating statistics can be used by agency managers, local decision makers, state directors, the Federal Transit Administration (FTA), and lawmakers to assist in policy making, planning, managing operations, and evaluating performance.
The Rural Transit Fact Book serves as a national resource for statistics and information on rural transit in America. This publication includes rural demographic and travel behavior data as well as financial and operating statistics for agencies receiving section 5311 funding. In addition to national level data, statistics are presented by state, FTA region, tribe, and mode, as well as other agency characteristics.
The rural transit data presented in this report were obtained from the Rural National Transit Database (NTD). The 2011 edition of the Rural Transit Fact Book was the first published by SURTC and included Rural NTD data for 2007-2009. Since 2011, annual updates have been made to the book to provide updated data. The 2016 edition includes 2014 data from the Rural NTD as well as additional data from the American Community Survey, American Housing Survey, and National Household Travel Survey.
As noted, this publication presents data for transit providers receiving section 5311 Non-Urbanized Area Formula Program funding. This program provides funding to states to support public transportation in rural areas with populations of less than 50,000. A number of rural transit providers also receive funding under the section 5310, Transportation for Elderly Persons and Persons with Disabilities Program. However, nationwide data for 5310 services are not available, as providers are not required to report such data to the NTD. Therefore, rural transit providers not funded by the 5311 program but receiving funding from section 5310 are not included in this report. Also excluded from the report are providers that receive both section 5311 funds and section 5307 Urbanized Area Formula Program funding and report their data in the urban NTD.

Rural Transit Fact Book • 2016 | 2
RURAL AMERICA Geography influences the type and level of transit service that best serves a community. About 60 million Americans, or close to one fifth of the country’s population, live in rural areas, according to data from the American Community Survey (ACS). Table 1 shows select demographic data from the 2014 ACS 1-year estimates for the United States and for urban and rural areas. As defined by the Census, “urban” includes urbanized areas and urban clusters. Urbanized areas have 50,000 or more people and urban clusters have at least 2,500 people but less than 50,000 people, and both areas have a core area with a density of at least 1,000 people per square mile. All other areas are defined as rural.
Rural populations tend to be older. The median age is 43 in rural areas and 36 in urban areas. Approximately 17% of residents in rural areas are 65 or older, compared to 14% of those in urban areas. The percentage of residents aged 85 or older, on the other hand, is approximately the same in urban and rural areas. The percentage of people with a disability is slightly higher in rural areas (15%) than in urban areas (12%).
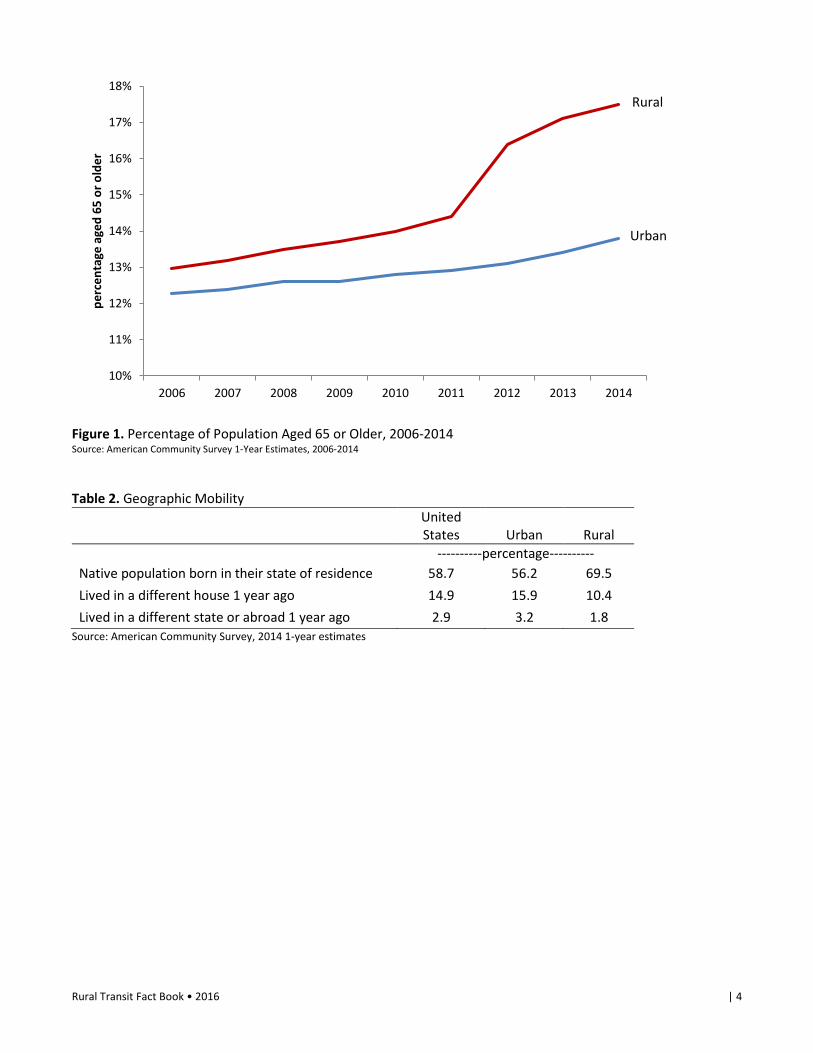
An aging population in rural areas presents a number of transportation challenges. Figure 1 illustrates the growing population of older adults in both urban and rural areas. Median age and the percentage of population aged 65 or older has increased in both urban and rural areas over the past decade, but the increase has been greatest among the rural population. (Note that the significant increases for rural areas from 2011 to 2012 shown in Figure 1 may be partly due to a change in geographic classifications rather than an actual increase.)
Rural areas tend to be less ethnically diverse. Urban residents are more likely than their rural counterparts to be non-white or Hispanic, and the foreign-born population is much higher in urban areas (16%) than in rural areas (3%).
Education levels vary somewhat between urban and rural communities. The percentage of individuals that have completed high school in rural areas is about the same as that for urban areas, but urban areas tend to have a higher percentage of residents with a bachelor’s or advanced degree.
Rural Transit Fact Book • 2016 | 3
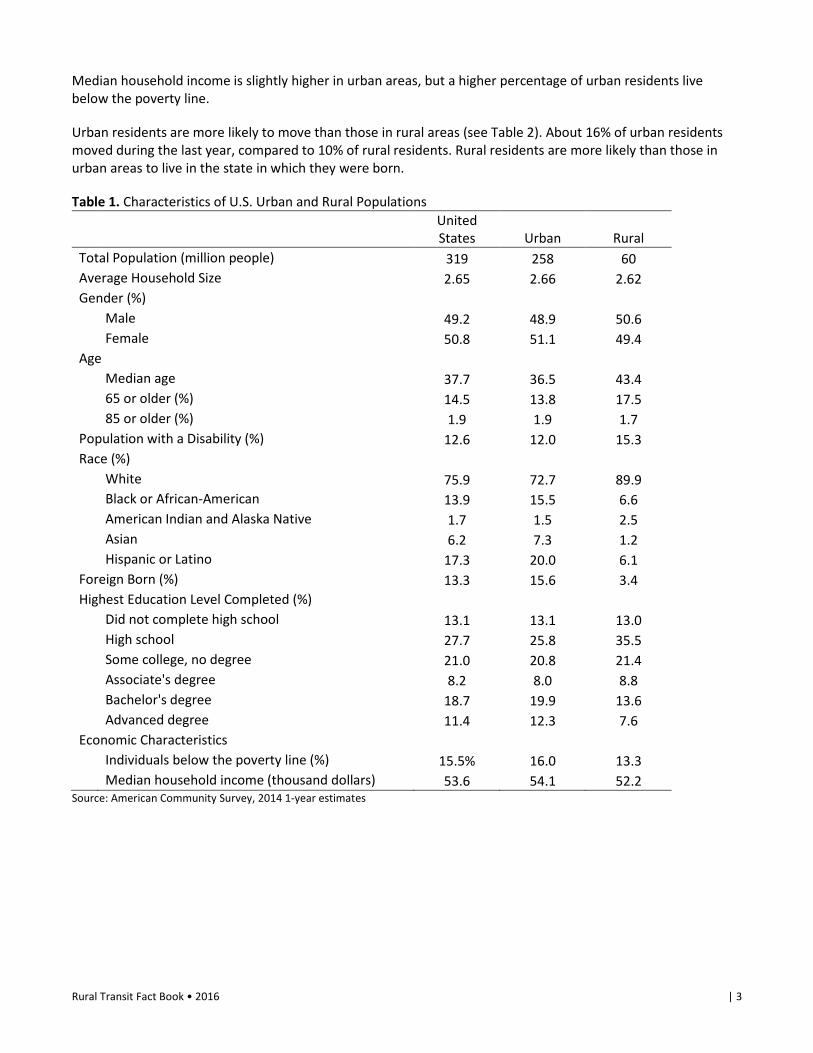
Median household income is slightly higher in urban areas, but a higher percentage of urban residents live below the poverty line.
Urban residents are more likely to move than those in rural areas (see Table 2). About 16% of urban residents moved during the last year, compared to 10% of rural residents. Rural residents are more likely than those in urban areas to live in the state in which they were born.
Table 1. Characteristics of U.S. Urban and Rural Populations
United States Urban Rural
Total Population (million people) 319 258 60 Average Household Size 2.65 2.66 2.62 Gender (%) Male 49.2 48.9 50.6 Female 50.8 51.1 49.4
Age Median age 37.7 36.5 43.4 65 or older (%) 14.5 13.8 17.5 85 or older (%) 1.9 1.9 1.7
Population with a Disability (%) 12.6 12.0 15.3 Race (%) White 75.9 72.7 89.9 Black or African-American 13.9 15.5 6.6 American Indian and Alaska Native 1.7 1.5 2.5
Asian 6.2 7.3 1.2 Hispanic or Latino 17.3 20.0 6.1 Foreign Born (%) 13.3 15.6 3.4 Highest Education Level Completed (%) Did not complete high school 13.1 13.1 13.0 High school 27.7 25.8 35.5 Some college, no degree 21.0 20.8 21.4 Associate's degree 8.2 8.0 8.8 Bachelor's degree 18.7 19.9 13.6 Advanced degree 11.4 12.3 7.6 Economic Characteristics Individuals below the poverty line (%) 15.5% 16.0 13.3 Median household income (thousand dollars) 53.6 54.1 52.2
Source: American Community Survey, 2014 1-year estimates
Rural Transit Fact Book • 2016 | 4
Figure 1. Percentage of Population Aged 65 or Older, 2006-2014 Source: American Community Survey 1-Year Estimates, 2006-2014
Table 2. Geographic Mobility
United States Urban Rural
----------percentage---------- Native population born in their state of residence 58.7 56.2 69.5 Lived in a different house 1 year ago 14.9 15.9 10.4 Lived in a different state or abroad 1 year ago 2.9 3.2 1.8
Source: American Community Survey, 2014 1-year estimates
10%
11%
12%
13%
14%
15%
16%
17%
18%
2006 2007 2008 2009 2010 2011 2012 2013 2014
perc
enta
ge a
ged
65 o
r old
erRural
Urban

Rural Transit Fact Book • 2016 | 5
RURAL TRANSPORTATION Data from the ACS, Federal Highway Administration (FHWA), National Household Travel Survey (NHTS), and American Housing Survey (AHS) show there are differences in transportation and travel behavior between urban and rural areas. One notable difference is a greater reliance on automobiles by rural residents (see Tables 3-7). Just 4% of rural households do not have a vehicle available, compared to 10% of urban households. Meanwhile, 70% of rural households have two or more vehicles, while only 54% of urban households have two or more vehicles.
Rural workers are more likely to drive alone to work and less likely to commute by public transportation than those in urban areas (see Table 4). Only 0.5% of rural residents use public transportation to travel to work, compared to 6.2% of urban residents, and just 1.8% of rural workers aged 16 or older do not have access to a vehicle, compared to 5.1% of their urban counterparts. Rural residents also tend to have slightly longer commutes (measured in minutes).
Despite heavy reliance on automobiles, vehicle miles traveled (VMT) on rural roads has slowly declined during the previous decade (see Figure 2). VMT on urban roads steadily increased until dropping or leveling off after 2007, then began increasing again after 2011. In 2015, VMT decreased 0.7% on rural roads and increased 4.7% on urban roads, according to most recent estimates. The VMT depicted in Figure 2 includes both personal and commercial travel and is total VMT, as opposed to per capita VMT.
Table 3. Vehicles Available in Household Number of Vehicles
United States
Urban
Rural
---------- percentage ---------- None 9.1 10.3 4.2 1 33.7 35.7 25.3 2 37.3 36.6 39.9 3 or more 19.9 17.4 30.5
Source: American Community Survey, 2014 1-year estimates

Rural Transit Fact Book • 2016 | 6
Table 4. Commuting to Work
United States Urban Rural
Mode Used (%) Car, truck, or van – drove alone 76.5 75.3 81.9 Car, truck, or van – carpooled 9.2 9.2 9.3 Public transportation (excluding taxicab) 5.2 6.2 0.5 Walked 2.7 2.9 1.9 Other means 1.8 2.0 1.3 Worked at home 4.5 4.4 5.0 Mean travel time to work (minutes) 26.0 25.8 27.0
Source: American Community Survey, 2014 1-year estimates
Figure 2. Vehicle Miles Traveled on Urban and Rural Roadways Source: Federal Highway Administration
The NHTS contains a variety of statistics on travel behavior. The NHTS is a periodic national survey sponsored by the Bureau of Transportation Statistics and the FHWA. The most recent NHTS for which data are available was conducted in 2009 (a new NHTS is being conducted in 2016). The dataset classifies respondents as urban or rural using the same definition used by the ACS.
Data from the NHTS show that rural residents drive more, on average, than their urban counterparts; are less likely to use public transportation; and drive vehicles that tend to be a bit older with more miles and have slightly lower fuel economy. Table 5 provides data on differences in trips per day, VMT, and use of transit between urban and rural residents by age group. Urban residents, on average, make more trips per day. Although urban residents may make more trips, the distance traveled per individual trip is longer in rural areas.
100
300
500
700
900
1,100
2006 2007 2008 2009 2010 2011 2012 2013 2014 2015
billi
on v
ehic
le m
iles
Urban InterstateOther Urban
Other Rural
Rural Interstate
Urban Other Arterial
Rural Other Arterial
Rural Transit Fact Book • 2016 | 7
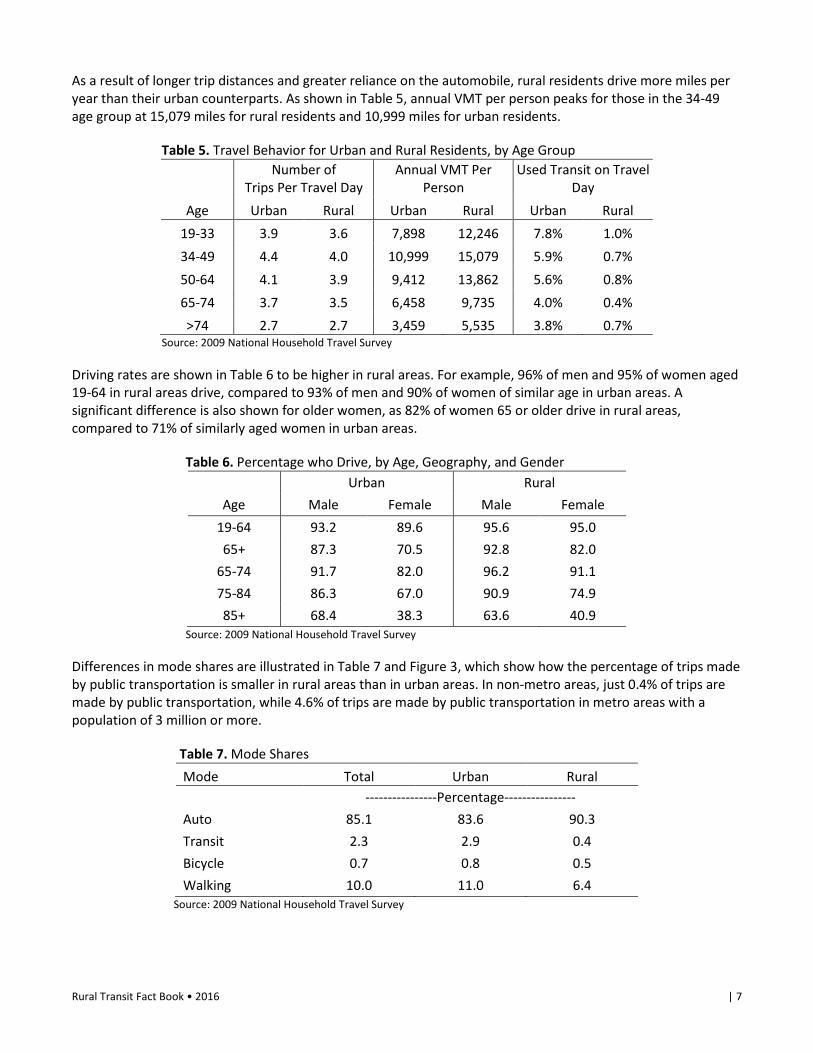
As a result of longer trip distances and greater reliance on the automobile, rural residents drive more miles per year than their urban counterparts. As shown in Table 5, annual VMT per person peaks for those in the 34-49 age group at 15,079 miles for rural residents and 10,999 miles for urban residents.
Table 5. Travel Behavior for Urban and Rural Residents, by Age Group
Number of
Trips Per Travel Day Annual VMT Per
Person Used Transit on Travel
Day Age Urban Rural Urban Rural Urban Rural
19-33 3.9 3.6 7,898 12,246 7.8% 1.0% 34-49 4.4 4.0 10,999 15,079 5.9% 0.7% 50-64 4.1 3.9 9,412 13,862 5.6% 0.8% 65-74 3.7 3.5 6,458 9,735 4.0% 0.4% >74 2.7 2.7 3,459 5,535 3.8% 0.7%
Source: 2009 National Household Travel Survey
Driving rates are shown in Table 6 to be higher in rural areas. For example, 96% of men and 95% of women aged 19-64 in rural areas drive, compared to 93% of men and 90% of women of similar age in urban areas. A significant difference is also shown for older women, as 82% of women 65 or older drive in rural areas, compared to 71% of similarly aged women in urban areas.
Table 6. Percentage who Drive, by Age, Geography, and Gender Urban Rural
Age Male Female Male Female 19-64 93.2 89.6 95.6 95.0 65+ 87.3 70.5 92.8 82.0
65-74 91.7 82.0 96.2 91.1 75-84 86.3 67.0 90.9 74.9 85+ 68.4 38.3 63.6 40.9
Source: 2009 National Household Travel Survey
Differences in mode shares are illustrated in Table 7 and Figure 3, which show how the percentage of trips made by public transportation is smaller in rural areas than in urban areas. In non-metro areas, just 0.4% of trips are made by public transportation, while 4.6% of trips are made by public transportation in metro areas with a population of 3 million or more.
Table 7. Mode Shares Mode Total Urban Rural ----------------Percentage---------------- Auto 85.1 83.6 90.3 Transit 2.3 2.9 0.4 Bicycle 0.7 0.8 0.5 Walking 10.0 11.0 6.4
Source: 2009 National Household Travel Survey

Rural Transit Fact Book • 2016 | 8
Figure 3. Percentage of Trips by Public Transportation, by Size of Metro Area Source: 2009 National Household Travel Survey
Table 8 shows the general purposes for transit and non-transit trips in urban and rural areas, according to data from the NHTS. For rural transit trips, the highest percentage of trips is for work or school/church. Medical trips account for 7.4% of transit trips in rural areas, but only 2.4% of non-transit trips are for medical, indicating a higher propensity for these types of trips to be made by transit. Other reports have found a higher percentage of rural transit trips being for medical purposes. Based on a study of on-board surveys, the American Public Transportation Association (APTA) (2007) found that in areas with a population below 200,000, 8.6% of transit trips are for medical purposes. These percentages vary significantly between individual transit providers depending on the type of service provided. Some rural transit systems provide a significantly higher percentage of trips for medical purposes, while others provide a higher percentage of work trips.
Table 8. Trip Purpose for Transit and Non-Transit Trips
Transit Trips Non-transit trips Trip Purpose Urban Rural* Urban Rural -------------percentage------------- Work 27.3 27.4 15.3 16.5 Work-related business 4.0 1.7 2.8 4.0 Shopping 17.6 7.8 21.3 20.9 Other personal business 9.7 11.5 19.5 19.1 School/church 10.4 20.4 9.6 9.7 Medical/dental 6.3 7.4 2.5 2.4 Vacation 1.6 4.7 1.1 1.2 Visit friends/relatives 6.6 4.3 6.7 7.3 Other social/recreational 12.2 12.3 20.4 18.3 Other 4.4 2.5 0.7 0.6
*Transit in rural areas is defined to include just bus and paratransit. Source: 2009 National Household Travel Survey
0.4% 0.5% 0.6%
1.4% 1.4%
4.6%
0%
1%
2%
3%
4%
5%
Not in MSA <250,000 250,000 -500,000
500,000 - 1million
1-3 million 3 million ormore
Size of Metropolitan Statistical Area (MSA)

Rural Transit Fact Book • 2016 | 9
The data indicate that work, school, and medical trips comprise a much higher percentage of transit trips than non-transit trips, and the opposite is true for shopping and social trips.
The American Housing Survey (AHS) also provides data on availability and use of transit services in urban and rural areas. The AHS is a survey funded by the U.S. Department of Housing and Urban Development (HUD) and conducted by the U.S. Census Bureau in odd-numbered years. This survey collects data on transportation alternatives and travel behavior, including transit availability, accessibility, desirability, and use. A SURTC study (Ripplinger et al. 2012) used data from the 2009 AHS to calculate a series of transit livability statistics, with the intent of investigating and measuring the relationship between transit and community livability.
Data from the 2013 AHS are presented in Table 9 showing the availability, use, and desirability of transit in urban, suburban, and rural areas. Specifically, it shows the percentage of population that can access different amenities by public transit, the percentage of population that uses transit, and the percentage of population that considered convenience to public transportation as a factor when choosing their present neighborhood. Differences are shown between those living in a metropolitan statistical area (MSA) central city, a MSA outside the central city, and rural areas not in a metropolitan area. As the table shows, 24%-27% of rural residents are able to access the different amenities by public transit, compared to 71%-74% of urban residents and 44%-47% of suburban residents. Household use of transit and the consideration of transit in choice of neighborhood are also much higher in urban areas.
Table 9. Amenities Accessibly by Transit, Use of Transit, and Desirability of Transit in Urban, Suburban, and Rural Areas
MSA-Central
City MSA-Not Central
City Outside
MSA -----------------percentage----------------- Amenities Accessible by Public Transportation Grocery store 73 47 27 Personal services 71 45 25 Retail shopping 74 46 25 Entertainment 73 46 24 Health care services 71 44 27 Personal banking 71 44 26
Household Uses Public Transportation 31 15 4
Convenience to Public Transportation a Factor in Choice of Present Neighborhood 7 3 1
Source: 2013 American Housing Survey

Rural Transit Fact Book • 2016 | 10
NATIONAL RURAL TRANSIT This section describes the characteristics of rural transit systems receiving section 5311 funding, using data submitted by these systems to the Rural NTD. Data for 2014 are the most recent data available at the time of publication.
The number of agencies providing rural transit service, as reported in the Rural NTD, increased slightly to 1,333 in 2014 (see Table 10). This does not include urban agencies that also receive 5311 funding to provide service in rural areas because these agencies report their data to the urban NTD. As shown in Table 10, the number of urban systems providing service in rural areas increased in recent years to 270 in 2014.
Many rural transit agencies offer strictly a demand-response service, while 266 offer both demand-response and fixed-route, and some offer just fixed-route.1 A total of 428 systems provided fixed-route service in 2014, including either a traditional fixed-route service or deviated fixed-route service.
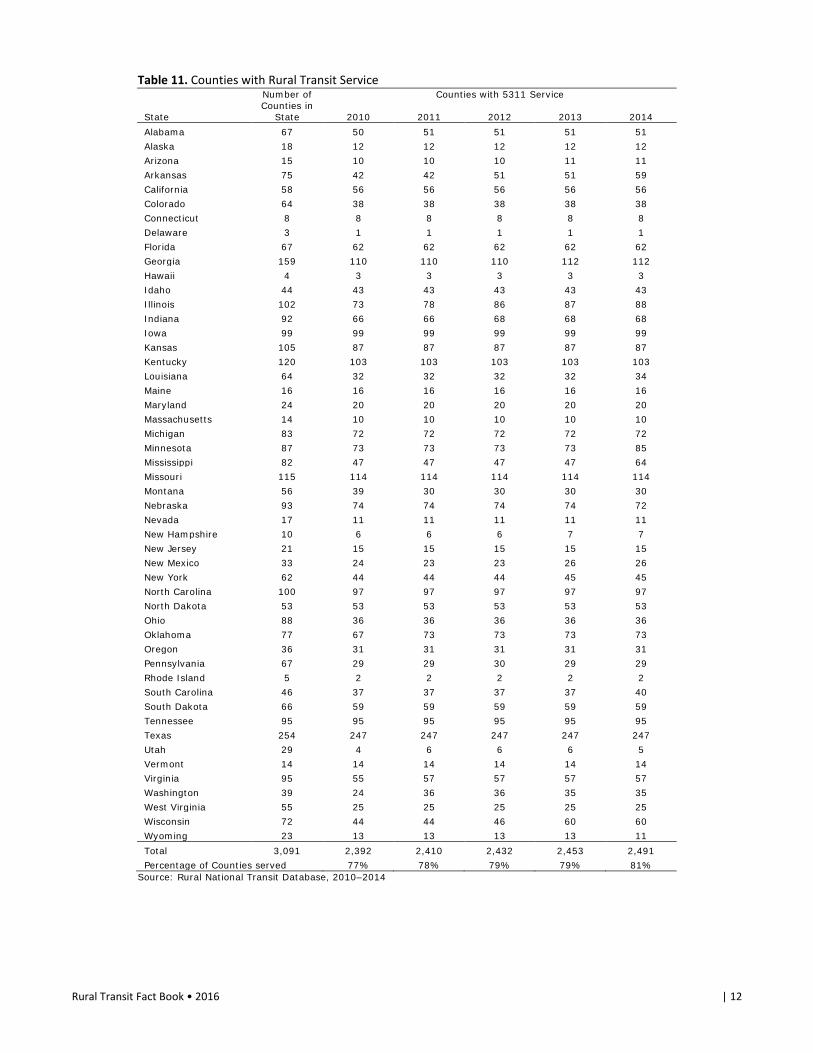
Nationwide, 81% of counties had some level of rural transit service in 2014, a slight increase from the previous year (see Table 11).
1 Although the Americans with Disabilities Act (ADA) requires transit agencies to provide paratransit services that complement their fixed-route services, it is not required for those that provide deviated fixed-route or commuter bus services. Many of those agencies identified as offering just fixed-route service provide these types of services.

Rural Transit Fact Book • 2016 | 11
Table 10. Number of Rural Transit Providers Nationwide 2010 2011 2012 2013 2014 Type of Service Provided
Fixed-route 472 464 430 438 428
Demand-response 1,180 1,121 1,108 1,094 1,092
Fixed-route and demand-response 253 262 246 278 266
Demand-response taxi - 78 56 52 45
Ferryboat - 4 6 6 7
Commuter bus - 58 60 56 73
Van pool 16 18 21 24 21
Other 21 15 13 11 2 Total Rural General Public Transit 1,403 1,392 1,357 1,317 1,333 Urban Systems Providing Rural Service 107 143 204 231 270 Source: Rural National Transit Database, 2010–2014
Rural Transit Fact Book • 2016 | 12
Table 11. Counties with Rural Transit Service Number of
Counties in State
Counties with 5311 Service
State 2010 2011 2012 2013 2014 Alabama 67 50 51 51 51 51 Alaska 18 12 12 12 12 12 Arizona 15 10 10 10 11 11 Arkansas 75 42 42 51 51 59 California 58 56 56 56 56 56 Colorado 64 38 38 38 38 38 Connecticut 8 8 8 8 8 8 Delaware 3 1 1 1 1 1 Florida 67 62 62 62 62 62 Georgia 159 110 110 110 112 112 Hawaii 4 3 3 3 3 3 Idaho 44 43 43 43 43 43 Illinois 102 73 78 86 87 88 Indiana 92 66 66 68 68 68 Iowa 99 99 99 99 99 99 Kansas 105 87 87 87 87 87 Kentucky 120 103 103 103 103 103 Louisiana 64 32 32 32 32 34 Maine 16 16 16 16 16 16 Maryland 24 20 20 20 20 20 Massachusetts 14 10 10 10 10 10 Michigan 83 72 72 72 72 72 Minnesota 87 73 73 73 73 85 Mississippi 82 47 47 47 47 64 Missouri 115 114 114 114 114 114 Montana 56 39 30 30 30 30 Nebraska 93 74 74 74 74 72 Nevada 17 11 11 11 11 11 New Hampshire 10 6 6 6 7 7 New Jersey 21 15 15 15 15 15 New Mexico 33 24 23 23 26 26 New York 62 44 44 44 45 45 North Carolina 100 97 97 97 97 97 North Dakota 53 53 53 53 53 53 Ohio 88 36 36 36 36 36 Oklahoma 77 67 73 73 73 73 Oregon 36 31 31 31 31 31 Pennsylvania 67 29 29 30 29 29 Rhode Island 5 2 2 2 2 2 South Carolina 46 37 37 37 37 40 South Dakota 66 59 59 59 59 59 Tennessee 95 95 95 95 95 95 Texas 254 247 247 247 247 247 Utah 29 4 6 6 6 5 Vermont 14 14 14 14 14 14 Virginia 95 55 57 57 57 57 Washington 39 24 36 36 35 35 West Virginia 55 25 25 25 25 25 Wisconsin 72 44 44 46 60 60 Wyoming 23 13 13 13 13 11 Total 3,091 2,392 2,410 2,432 2,453 2,491 Percentage of Counties served 77% 78% 79% 79% 81%
Source: Rural National Transit Database, 2010–2014

Rural Transit Fact Book • 2016 | 13
Figure 4 is a map of U.S. counties with rural transit service. This includes the service area of agencies reporting in the 2014 Rural NTD as well as the service areas of urban agencies that received section 5311 funding for rural services. Excluded were any agencies that reported to the Rural NTD but did not have any service data listed. Service area information were obtained from the 2013 Rural NTD, which lists counties served by most reporting agencies (this information was not included in the 2014 Rural NTD.) For urban agencies and rural agencies that did not have county information listed in the NTD, counties served by each agency was compiled from agency, state DOT, and transit association websites.
Some of the counties without service are urban counties served by urban transit agencies. Others may have some other type of service not supported by section 5311 funding. Also note that transit agencies may provide varying levels of service within their service area, so some areas of a county may be unserved or may only have limited eligibility service. This map provides a broad overview of rural transit service availability based on available information.
Figure 4. Map of U.S. Counties with Rural Transit Service

Rural Transit Fact Book • 2016 | 14
OPERATING STATISTICS Total annual ridership for rural transit systems decreased 2% in 2014, from 131 million rides in 2013 to 128 million rides (see Table 12). Meanwhile, total vehicle miles decreased 3% and vehicle hours decreased 4%. Rural transit agencies provided 483 million miles of service and 27 million hours of service in 2014.
Table 12. Rural Transit Operating Statistics
2010 2011 2012 2013 2014 % Change 2013-2014
---------------------------millions--------------------------- Annual Ridership Fixed-route 76.1 69.2 66.0 63.0 61.1 -3%
Demand-response 61.0 57.4 55.8 55.5 53.3 -4%
Van pool 0.6 0.8 0.9 0.8 0.9 10%
Commuter bus - 8.4 7.0 6.5 6.8 5%
Demand-response taxi - 2.3 2.0 1.6 1.6 -3%
Ferryboat - 0.8 1.2 1.2 1.4 15%
Bus rapid transit - - - 0.1 0.8 456%
Aerial tramway - - - 2.3 2.4 5%
Other 1.2 0.4 2.2 0.0 0.0 - Total 138.9 139.4 135.1 131.1 128.3 -2%
Annual Vehicle Miles Fixed-route 133.8 125.8 111.6 105.9 97.4 -8%
Demand-response 389.3 376.2 372.1 358.1 349.6 -2%
Van pool 3.6 4.8 4.9 5.2 5.8 11%
Commuter bus - 16.7 17.4 15.9 18.6 17%
Demand-response taxi - 6.7 9.3 6.2 5.9 -5%
Ferryboat - 0.4 0.1 0.1 0.1 10%
Bus rapid transit - - - 0.4 1.8 347%
Aerial tramway - - - 3.3 3.3 0%
Other 23.4 0.2 3.4 0.0 0.0 - Total 550.1 530.8 518.9 495.2 482.6 -3%
Annual Vehicle Hours Fixed-route 7.4 6.9 6.1 5.8 5.6 -4%
Demand-response 23.9 22.7 21.8 20.8 19.9 -4%
Van pool 0.1 0.3 0.2 0.1 0.2 19%
Commuter bus - 0.7 0.7 0.6 0.7 12%
Demand-response taxi - 0.9 0.8 0.5 0.6 2%
Ferryboat - 0.1 0.0 0.0 0.0 9%
Bus rapid transit - - - 0.0 0.1 478%
Aerial tramway - - - 0.3 0.3 0%
Other 0.5 0.0 0.0 0.0 0.0 - Total 32.0 31.5 29.6 28.3 27.3 -4%
Source: Rural National Transit Database, 2010–2014

Rural Transit Fact Book • 2016 | 15
The data in Table 12 do not include rural services provided by transit agencies that also provide urban service. Service statistics for those urban operators providing rural service is shown in Table 13. Rural passenger trips, vehicle miles, and vehicle hours provided by urban operators has increased significantly in recent years to 37 million trips, 82 million miles, and 4.5 million hours in 2014. Combining the data from Tables 12 and 13 shows that 165 million rural transit trips were provided in 2014.
Table 13. Rural Service Provided by Urban Operators 2010 2011 2012 2013 2014 ------------------millions------------------
Unlinked Passenger Trips Fixed-route 10.9 19.4 18.5 19.7 19.4 Demand-response 2.6 4.1 5.0 5.9 5.9 Vanpool 1.1 1.6 1.4 1.3 1.3 Ferry boat 6.9 7.1 7.3 7.5 7.7 Other 1.7 1.1 1.5 1.9 2.3 Total 23.2 33.3 33.7 36.2 36.6 Vehicle Revenue Miles Fixed-route 11.5 18.4 21.8 22.0 23.0 Demand-response 17.4 28.2 34.0 44.4 46.2 Vanpool 6.6 8.9 7.6 7.0 7.0 Ferry boat 0.3 0.3 0.3 0.3 0.3 Other 1.2 1.8 2.8 5.3 5.5 Total 36.9 57.6 66.5 79.0 82.0 Vehicle Revenue Hours Fixed-route 0.7 1.1 1.2 1.3 1.3 Demand-response 1.1 1.7 2.1 2.5 2.7 Vanpool 0.2 0.2 0.2 0.2 0.2 Ferry boat 0.0 0.0 0.0 0.0 0.0 Other 0.1 0.1 0.2 0.3 0.3 Total 2.1 3.2 3.7 4.3 4.5
Source: Rural National Transit Database, 2010–2014
Changes in ridership and service provided are partly due to changes by existing agencies and partly due to the addition or subtraction of transit providers. A small difference could also be due to measurement error. To determine the degree to which ridership and service provided has changed for existing agencies, data for individual transit providers were tracked over time. The data reveal that 50% of existing providers experienced an increase in ridership from 2013 to 2014, while 49% and 53% increased vehicle miles and hours, respectively (see Table 14). The median change from 2013 to 2014 was a 0.1% decrease in vehicle miles, a 0.6% increase in vehicle hours, and a 0.0% change in ridership. Some agencies experienced significant gains. Thirty-four percent had an increase in ridership of 5% or more, 23% increased ridership by 10% or more, and 14% experienced an increase of 20% or more. Some agencies also experienced significant decreases in ridership.

Rural Transit Fact Book • 2016 | 16
Table 14. Agency Level Changes in Service Miles, Hours, and Trips, 2013-2014
Vehicles
Miles Vehicle Hours Total Trips
Median Change -0.1% +0.6% 0.0% Percentage of Agencies with an Increase 49% 53% 50% Percentage of Agencies with an Increase of: 5% or more 31% 33% 34% 10% or more 21% 22% 23% 20% or more 12% 13% 14% 50% or more 4% 5% 5% 100% or more 2% 2% 2% Percentage of Agencies with a Decrease of: 5% or more 31% 27% 33% 10% or more 18% 18% 22% 20% or more 8% 10% 10% 50% or more 2% 2% 3%
Source: Rural National Transit Database, 2013, 2014
Table 15 shows median and percentile rankings for vehicle miles and hours and passenger trips per agency in 2014. The data show that the median vehicle miles provided per system was 178,473, the median hours of service was 10,794, and the median number of trips provided was 33,486. For systems providing fixed-route service, the median fixed-route miles provided was 151,544, the median fixed-route hours of service was 8,051, and the median number of rides provided was 42,519. For demand-response operations, the median values were 127,595 miles, 8,219 hours, and 22,296 rides. These median numbers changed slightly from the previous year. However, as Table 15 shows, there is significant variation between agencies. For example, 10% of the agencies provided 807,154 or more miles of service, and the smallest 10% provided 24,494 miles or less.
Table 15. Rural Transit Operating Statistics, Median and Percentile Rankings per Agency, 2014 Vehicle Miles Vehicle Hours Regular Unlinked Trips
Percentile Fixed-Route
Demand-Response Total
Fixed-Route
Demand-Response Total
Fixed-Route
Demand-Response Total
10th 28,357
16,539
24,494
1,916
1,385
1,842 4,688
3,151
4,458
25th 64,907
50,071
66,952
3,557
3,268
4,333 12,488
8,105
11,603
50th 151,544
127,595
178,473
8,051
8,219
10,794 42,519
22,296
33,486
75th 302,336
318,537
394,568
17,961
19,248
23,744 121,942
52,083
93,005
90th 536,649
713,940
807,154
31,434
40,231
46,083 346,029
116,077
202,292
Number of Agencies Reporting
422
1,089
1,300
422
1,089
1,300
422
1,089
1,300
Source: Rural National Transit Database, 2014

Rural Transit Fact Book • 2016 | 17
FINANCIAL STATISTICS Federal funding for capital projects decreased in 2014 from both federal and local sources (see Table 16) while increasing from state governments. Overall, capital funding decreased.
Federal support of operating costs was largely unchanged in 2014, decreasing slightly from $529 million to $527 million. State funding for operations decreased 13% to $249 million and local funding decreased 23% to $326 million. Total fare revenues decreased 19% to $118 million and contract revenues decreased 4%. Meanwhile, total operating expenses decreased 9%.
The data in Table 16 reflect the dollar amounts reported by rural transit providers to the Rural NTD. Figure 5 shows actual federal obligations by the FTA under the section 5311 Non-Urbanized Area Formula Program, including capital, operating, planning, and administrating expenses. As shown, federal funding has been following a general upward trend, with decreases in a few years.
Table 16. Rural Transit Financial Statistics: Sources of Funding
2010 2011 2012 2013 2014 Change
2013-2014 ----------------------------million dollars---------------------------- Capital Funding Federal 368.4 253.0 225.5 202.2 132.6 -34% State 24.5 22.8 24.6 29.3 31.3 7% Local 19.2 23.3 30.3 41.6 21.7 -48% Operating Federal Assistance 371.7 455.9 499.1 529.1 526.9 0% State Assistance 235.8 242.5 236.9 287.9 249.3 -13% Local Assistance 322.1 323.0 326.1 424.8 326.0 -23% Fare Revenues 99.9 99.9 107.0 144.7 117.8 -19% Contract Revenues 243.7 246.5 250.7 144.8 138.4 -4% Total Operating 1,273.1 1,367.8 1,419.9 1,531.3 1,390.9 -9%
Source: Rural National Transit Database, 2010–2014
Figure 5. FTA Obligations under the Section 5311 Program, FY2006–FY2014 Source: Federal Transit Administration. Grants Data. 2016.
$416$494
$536
$401
$648
$554$516
$613
$745
$0
$100
$200
$300
$400
$500
$600
$700
$800
2006 2007 2008 2009 2010 2011 2012 2013 2014
Mill
ions
Fiscal Year

Rural Transit Fact Book • 2016 | 18
FLEET STATISTICS Average fleet size was 17.3 vehicles in 2014, slightly higher than in previous years, and rural transit providers operated a total of 23,015 vehicles in 2014 (see Tables 17 and 18). Figure 6 shows the fleet composition of rural transit agencies. Cutaways comprise the largest portion (50%) of the vehicle fleet, while minivans account for 16% of the vehicles, vans 16%, and buses 15%. Eighty-three percent of these vehicles are ADA accessible (see Table 19). Most buses (92%) and cutaways (95%) are ADA accessible, whereas 67% of minivans and 66% of vans were ADA accessible in 2014.
Table 18. Number of Vehicles in Operation
Vehicle Type 2010 2011 2012 2013 2014 Bus 3,904 3,605 3,309 3,400 3,383 Cutaway 10,621 10,907 10,668 10,627 11,475 Van 4,459 4,350 3,993 3,525 3,606 Minivan 3,422 3,496 3,521 3,685 3,733 Automobile 420 413 359 358 310 School bus 73 74 69 43 61 Over-the-road bus 84 94 86 86 63 Sports utility vehicle 146 187 208 216 192 Other 4 6 2 2 185 Total 23,133 23,132 22,225 22,018 23,015
Source: Rural National Transit Database, 2010–2014
Figure 6. Fleet Composition, 2014
1%
2%
15%
16%
16%
50%
Automobiles
Other
Buses
Vans
Minivans
Cutaways
Table 17. Average Fleet Size Vehicles per Agency
2010 16.5 2011 16.6 2012 16.4 2013 16.7 2014 17.3
Source: Rural National Transit Database, 2010-2014

Rural Transit Fact Book • 2016 | 19
Table 19. Percentage of Rural Transit Vehicles that are ADA Accessible Vehicle Type 2010 2011 2012 2013 2014 -------------------Percentage------------------- Bus 95 95 95 95 92 Cutaway 94 93 94 94 95 Van 66 65 64 64 66 Minivan 62 65 66 69 67 Automobile 11 13 13 13 7 School bus 15 30 28 30 30 Over-the-road bus 85 82 88 86 83 Sports utility vehicle 5 8 14 13 18 Total 82 82 82 83 83
Source: Rural National Transit Database, 2010-2014
The average age of the vehicles was 6.3 years in 2014. The average vehicle length was 21.7 feet with an average seating capacity of 14.5 (see Tables 20-22). The average bus is about 30 feet and has a seating capacity of 26.3, while the average cutaway is 23.2 feet with a seating capacity of 15.1. Average vehicle age, length, and capacity have changed only slightly from year to year.
Table 20. Average Vehicle Age Vehicle Type 2010 2011 2012 2013 2014 --------------------Years-------------------- Bus 6.8 6.4 6.8 7.2 7.2 Cutaway 5.1 5.4 5.6 6.0 6.1 Van 5.7 5.7 5.9 6.2 6.2 Minivan 4.9 5.2 5.3 5.5 5.7 Automobile 6.9 7.2 6.9 7.5 8.1 School bus 9.7 10.9 11.6 12.9 12.8 Over-the-road bus 6.6 7.5 7.4 8.3 8.6 Sports utility vehicle 3.6 4.0 4.6 5.5 6.2 Total 5.5 5.6 5.8 6.2 6.3
Source: Rural National Transit Database, 2010-2014
Table 21. Average Vehicle Length Vehicle Type 2010 2011 2012 2013 2014 ------------------Feet------------------ Bus 30.6 30.5 30.5 30.6 29.4 Cutaway 23.4 23.5 23.5 23.5 23.2 Van 18.9 19.0 18.8 18.9 16.9 Minivan 16.2 16.2 16.2 16.3 15.4 Automobile 15.5 15.4 15.4 15.5 14.2 School bus 34.2 30.8 30.1 33.8 30.1 Over-the-road bus 43.6 42.3 42.4 43.2 41.9 Sports utility vehicle 14.7 14.4 14.6 15.4 14.8 Total 22.6 22.5 22.5 22.6 21.7
Source: Rural National Transit Database, 2010-2014

Rural Transit Fact Book • 2016 | 20
Table 22. Average Seating Capacity Vehicle Type 2010 2011 2012 2013 2014 Bus 27.2 26.6 26.5 26.5 26.3 Cutaway 15.1 14.9 14.7 14.8 15.1 Van 10.9 10.8 10.4 10.4 10.3 Minivan 6.1 6.0 5.7 5.7 5.7 Automobile 4.5 4.4 4.4 4.3 4.3 School bus 46.5 40.3 39.2 40.0 37.9 Over-the-road bus 48.7 45.0 45.1 45.7 50.9 Sports utility vehicle 4.7 4.7 4.9 5.3 5.0 Total 15.0 14.6 14.3 14.3 14.5
Source: Rural National Transit Database, 2010-2014
Seventy-four percent of the vehicles are owned outright by a public agency, while 15% are owned by a private entity, and most of the remainder is leased or borrowed by a public agency (see Table 23).
Table 23. Vehicle Ownership, 2014
Vehicle Type
Owned Outright by
Public Agency
Owned Outright by
Private Entity
Leased or Borrowed
from Related
Parties by a Public
Agency
Leased Under Lease
Purchase Agreement by a Public
Agency
Leased by a Private Entity Other
--------------------------------Percentage-------------------------------- Bus 76 11 6 3 1 1 Cutaway 73 14 5 5 1 1 Van 83 10 3 3 0 1 Minivan 64 27 3 2 1 2 Automobile 72 18 1 1 2 6 School bus 79 21 0 0 0 0 Over-the-road bus 75 6 0 0 0 0 Sports utility vehicle 74 22 5 2 0 0 Total 74 15 5 4 1 1
Source: Rural National Transit Database, 2014

Rural Transit Fact Book • 2016 | 21
The FTA’s rural area formula program is the primary funding source for a majority of vehicles, though 4% are primarily supported by section 5310 funds, 21% by other federal funds, 9% by non-federal public funds, and 3% by private funds (see Table 24).
Table 24. Primary Funding Source for Vehicles, 2014
Vehicle Type
Rural Area Formula Program
Enhanced Mobility of Seniors &
Individuals with Disabilities
Other Federal Funds
Non-Federal Public Funds
Non-Federal Private Funds
------------------------Percentage------------------------ Bus 49 3 29 14 2 Cutaway 63 5 21 8 2 Van 67 3 16 10 3 Minivan 66 5 19 7 3 Automobile 49 5 8 22 17 School bus 43 0 25 18 15 Over-the-road bus 41 0 11 19 10 Sports utility vehicle 76 2 8 9 4 Total 62 4 21 9 3
Source: Rural National Transit Database, 2014

Rural Transit Fact Book • 2016 | 22
NATIONAL RURAL TRANSIT PERFORMANCE MEASURES A few performance measures can be calculated using the data from the Rural NTD. These include trips per mile, trips per hour, cost per mile, cost per trip, trips per vehicle, hours of service per vehicle, miles of service per vehicle, and the farebox recovery ratio.
Trips per mile was largely unchanged at 0.27 in 2014. As Table 25 shows, trips per mile is significantly higher for fixed-route service (0.63) than it is for demand-response (0.15). Trips per hour increased slightly to 4.7 in 2014. The number of trips per hour was 11.0 for fixed-route service and 2.7 for demand-response.
Table 25. Trips per Mile and Trips per Hour
2010 2011 2012 2013 2014 % Change 2013-2014
Trips Per Vehicle Mile Fixed-route 0.57 0.55 0.59 0.60 0.63 5% Demand-response 0.16 0.15 0.15 0.15 0.15 -2% Van pool 0.17 0.16 0.18 0.16 0.15 -1% Commuter bus - 0.50 0.40 0.41 0.37 -10% Demand-response taxi - 0.34 0.22 0.26 0.26 1% Total 0.25 0.26 0.26 0.26 0.27 0% Trips Per Vehicle Hour Fixed-route 10.2 10.0 10.8 10.8 11.0 1% Demand-response 2.5 2.5 2.6 2.7 2.7 1% Van pool 7.9 3.1 5.9 6.0 5.6 -8% Commuter bus - 12.4 10.6 10.8 10.1 -6% Demand-response taxi - 2.6 2.7 3.0 2.8 -6% Total 4.3 4.4 4.6 4.6 4.7 1%
Source: Rural National Transit Database, 2010-2014

Rural Transit Fact Book • 2016 | 23
These numbers represent industry averages, but there is variation between individual providers. There tends to be some variation in these measures based on the size of the operation. Table 26 groups the transit systems into six categories based on the number of vehicle miles provided. Trips per mile tends to increase with vehicle miles provided for fixed-route systems, as the larger systems provide more trips per mile, though some of the smallest systems also provide a high number of trips per mile. For demand-response systems, on the other hand, trips per mile continually decreases with increases in vehicle miles. The smaller demand-response systems provide more trips per mile, possibly because they serve a smaller area with more concentrated service.
There is a similar trend for trips per hour (see Table 27). For fixed-route systems, trips per vehicle hour is the highest for the largest systems providing the greatest number of service hours, while for demand-response systems, the number of trips per vehicle hour decreases with increases in vehicle hours of service provided.
Table 26. Trips per Mile by Number of Miles Provided, 2014
Percentile Rank Vehicle Miles Provided Average Trips per
Vehicle Mile
Fixed-Route 1-10 <26,766 0.52
11-25 26,766-61,980 0.32 26-50 61,981-146,471 0.39 51-75 146,472-296,091 0.54 76-90 296,092-529,590 0.67 >90 >529,590 0.75
Demand-Response 1-10 <15,944 0.43
11-25 15,944-49,634 0.29 26-50 49,635-127,388 0.23 51-75 127,389-318,737 0.20 76-90 318,738-713,130 0.17 >90 >713,130 0.13
Source: Rural National Transit Database, 2014

Rural Transit Fact Book • 2016 | 24
Table 27. Trips per Hour by Number of Hours Provided, 2014
Percentile Rank Vehicle Hours Provided Average Trips per
Vehicle Hour
Fixed-Route 1-10 <1,873 5.72
11-25 1,873-3,471 4.35 26-50 3,472-7,949 6.07 51-75 7,950-17,795 7.86 76-90 17,796-31,123 9.93 >90 >31,123 14.64
Demand-Response 1-10 <1,380 4.16
11-25 1,380-3,264 3.65 26-50 3,265-8,217 3.23 51-75 8,218-19,262 3.06 76-90 19,263-40,204 2.99 >90 >40,204 2.44
Source: Rural National Transit Database, 2014
Trips per vehicle decreased 6% in 2014 to 5,575. Meanwhile, rural transit vehicles averaged 20,967 miles and 1,185 hours of service in 2014, both decreases from 2013 (see Table 28).
Operating cost per trip was $10.16 in 2014, a 4% increase from the previous year. The costs were significantly higher for demand-response service. The Rural NTD does not report cost data by mode, so it is not possible to compute average fixed-route and demand-response costs. However, many providers offer just one type of service, so averages can be calculated for those systems that offer just demand-response or just fixed-route service. In 2014, 798 such systems operated just demand-response service, and 151 offered just fixed-route service. Their average costs are shown in Table 29. The average operating cost for fixed-route-only systems increased 2% to $7.32 per trip in 2014, while that for demand-response-only systems increased 4% to $14.31 per trip. Operating cost per mile in 2014 was $3.40 for fixed-route-only systems, $2.27 for demand-response-only systems, and $2.71 overall. These were all increases from 2013. Costs tend to be higher per mile for the fixed-route operators but lower per trip because of the greater number of rides provided.
Fare revenues in 2014 covered 9% of the operating costs. The farebox recovery ratio has been averaging 8-9% each year. The ratio is higher for fixed-route-only systems, increasing to 13% in 2014, while the ratio for demand-response-only systems increased to 7%.
Table 28. Trips, Miles, and Hours per Vehicle
2010 2011 2012 2013 2014 % Change 2013-2014
Trips Per Vehicle 6,003 6,024 6,081 5,954 5,575 -6%
Miles Per Vehicle 23,778 22,947 23,345 22,491 20,967 -7%
Hours Per Vehicle 1,383 1,364 1,331 1,284 1,185 -8% Source: Rural National Transit Database, 2010-2014

Rural Transit Fact Book • 2016 | 25
Table 29. Operating Costs per Trip and per Mile and Farebox Recovery Ratio
2010 2011 2012 2013 2014 % Change 2013-2014
Operating Expense per Trip Total 9.09 9.54 9.67 9.74 10.16 4.4% Fixed-route-only 6.84 6.96 7.42 7.18 7.32 1.9% Demand-response-only 12.21 12.85 13.78 13.72 14.31 4.3% Operating Expense per Mile Total 2.32 2.49 2.52 2.58 2.71 5.0% Fixed-route-only 2.93 2.83 3.04 3.09 3.40 9.9% Demand-response-only 2.02 2.06 2.10 2.18 2.27 4.0% Farebox Recovery Ratio Total 0.08 0.08 0.08 0.09 0.09 -1.2% Fixed-route-only 0.08 0.08 0.11 0.12 0.13 8.9% Demand-response-only 0.07 0.06 0.06 0.06 0.07 24.4%
Source: Rural National Transit Database, 2010-2014
While Table 29 shows overall averages, there is significant variation in costs between transit agencies across the country. Table 30 shows percentile rankings for operating costs per trip and per mile and for farebox recovery ratio, including both demand-response and fixed-route service. (The percentile rank is the percentage of transit operators with results at or below the reported number. For example, 10% of transit operators have an operating expense per trip at or below $5.93, while 50% have an operating expense per trip at or below $14.04, and 90% are at or below $33.99.)
Table 30. Operating Costs per Trip and per Mile and Farebox Recovery Ratio, Percentile Rankings, 2014
Percentile Rank
Operating Expense Farebox Recovery Ratio Per Trip Per Mile
Total 10th 5.93 1.46 0.02 25th 9.14 1.95 0.04 50th 14.04 2.71 0.07 75th 21.11 3.91 0.13 90th 33.99 5.37 0.21
Fixed-route-only 10th 4.27 1.74 0.02 25th 6.70 2.42 0.04 50th 10.82 3.35 0.07 75th 21.00 4.86 0.13 90th 42.61 6.65 0.19
Demand-response-only 10th 6.92 1.36 0.02 25th 10.23 1.81 0.04 50th 15.41 2.52 0.07 75th 22.29 3.53 0.12 90th 33.62 4.79 0.19
Source: Rural National Transit Database, 2014
Rural Transit Fact Book • 2016 | 26
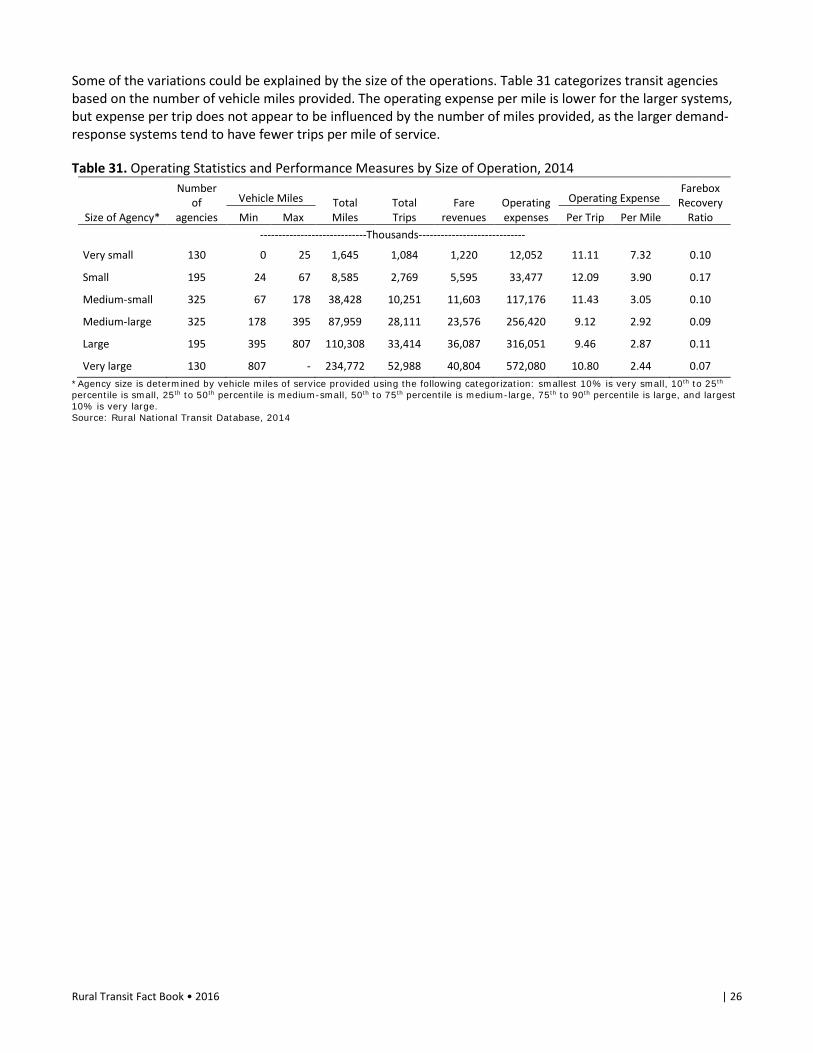
Some of the variations could be explained by the size of the operations. Table 31 categorizes transit agencies based on the number of vehicle miles provided. The operating expense per mile is lower for the larger systems, but expense per trip does not appear to be influenced by the number of miles provided, as the larger demand-response systems tend to have fewer trips per mile of service.
Table 31. Operating Statistics and Performance Measures by Size of Operation, 2014
Size of Agency*
Number of
agencies
Vehicle Miles Total Miles
Total Trips
Fare revenues
Operating expenses
Operating Expense Farebox
Recovery Ratio Min Max Per Trip Per Mile
-----------------------------Thousands----------------------------- Very small 130 0 25 1,645 1,084 1,220 12,052 11.11 7.32 0.10
Small 195 24 67 8,585 2,769 5,595 33,477 12.09 3.90 0.17
Medium-small 325 67 178 38,428 10,251 11,603 117,176 11.43 3.05 0.10
Medium-large 325 178 395 87,959 28,111 23,576 256,420 9.12 2.92 0.09
Large 195 395 807 110,308 33,414 36,087 316,051 9.46 2.87 0.11
Very large 130 807 - 234,772 52,988 40,804 572,080 10.80 2.44 0.07 *Agency size is determined by vehicle miles of service provided using the following categorization: smallest 10% is very small, 10th to 25th percentile is small, 25th to 50th percentile is medium-small, 50th to 75th percentile is medium-large, 75th to 90th percentile is large, and largest 10% is very large. Source: Rural National Transit Database, 2014

Rural Transit Fact Book • 2016 | 27
REGIONAL AND STATE STATISTICS The data described in the previous sections are aggregate national data, but there may be some regional differences. Therefore, data in this section are presented at the regional and state levels. The regions used are based on the FTA’s regional classification. The FTA divides the country into 10 regions, as shown in Figure 7. Table 32 shows how rural transit statistics vary between those regions.
Figure 7. FTA Regions
The greatest number of rural transit agencies is in regions 4, 5, and 7, followed by regions 8 and 6. The operators in these regions are mostly demand-response providers. The northeast and far western regions have a greater orientation toward fixed-route service.

Rural Transit Fact Book • 2016 | 28
Annual ridership in 2014 was highest in regions 5 (23.6 million rides) and 8 (22.1 million rides). Region 4 provided the highest level of service, by a significant margin, with 133 million vehicle miles and 7.2 million vehicle hours of service, most of it being demand-response. Region 4 also had the greatest number of vehicles in service, many of them being vans.
Trips per mile and per hour were highest in region 8, according to the data, and region 8 also provided the most rides per vehicle. The region 8 data are influenced by a few high-ridership agencies in Colorado. These agencies provide fixed-route and commuter bus services in popular resort areas. One agency operates an aerial tramway, and another operates bus rapid transit.
Operating cost per trip was the highest in region 6 and lowest in region 8. For the fixed-route-only agencies, cost per trip was highest in region 1 at $12.49 and lowest in region 6 at $3.29. The lowest cost for demand-response-only providers was $11.61 per trip in region 2. Cost per mile ranged between $1.95 in region 4 to $3.95 in region 9.
State-level statistics are shown in Tables 33-37 and Figures 8-11.
Table 32. Regional Data, 2014
FTA Region
1 2 3 4 5 6 7 8 9 10 Number of Agencies Fixed-route 27 45 41 46 55 29 15 40 63 67 Demand-response 31 13 39 242 220 106 177 115 73 76 Total 36 49 53 251 276 121 189 135 110 113 Counties Served 85% 72% 54% 85% 78% 87% 90% 67% 86% 88%
Annual Ridership (million rides)
Fixed-route 5.1 3.6 7.0 5.4 6.0 3.1 1.9 13.3 6.2 9.5
Demand-response 1.2 0.7 1.6 13.7 15.4 6.9 6.9 3.8 1.6 1.5
Total 6.7 4.3 8.7 19.4 23.6 10.3 9.0 22.1 11.1 12.9
Annual Vehicle Miles (million miles)
Fixed-route 6.4 12.1 12.2 8.2 10.4 6.2 3.5 11.3 13.1 13.6
Demand-response 17.7 2.8 9.9 123.6 72.9 53.6 38.4 14.5 6.6 9.2
Total 25.6 15.3 22.6 133.3 88.8 61.7 42.3 33.8 28.0 30.4
Annual Vehicle Hours (million hours)
Fixed-route 0.4 0.6 0.7 0.5 0.6 0.4 0.2 0.7 0.7 0.7
Demand-response 0.7 0.2 0.6 6.6 4.4 3.0 2.3 1.1 0.4 0.6
Total 1.2 0.8 1.3 7.2 5.5 3.4 2.6 2.3 1.4 1.6
Number of Vehicles
Total 942 673 1,260 5,142 4,434 3,210 2,590 1,815 1,459 1,490
Bus 233 224 399 443 685 146 96 444 413 300
Cutaway 562 436 573 2,019 2,209 1,845 1,664 660 820 687
Van 82 6 182 1,750 581 290 190 225 63 237
Minivan 54 2 86 761 755 831 614 354 78 198
Other 11 4 20 169 203 98 26 132 83 62
Vehicles ADA Accessible 92% 99% 82% 76% 89% 85% 85% 72% 92% 77%

Rural Transit Fact Book • 2016 | 29
Table 32. Regional Data, 2014 (continued) FTA Region 1 2 3 4 5 6 7 8 9 10 Average Vehicle Age 5.6 5.0 5.7 5.6 6.3 6.3 7.1 8.0 6.4 6.9
Average Vehicle Length 25.1 24.1 22.9 20.7 19.7 21.2 22.1 22.8 24.3 23.7
Average Vehicle Capacity 18.0 18.9 16.5 12.2 14.1 12.3 12.5 16.6 20.5 17.1
Trips Per Mile
Total 0.26 0.28 0.39 0.15 0.27 0.17 0.21 0.66 0.40 0.42
Fixed-route 0.80 0.30 0.58 0.66 0.58 0.49 0.55 1.17 0.47 0.70
Demand-response 0.07 0.24 0.16 0.11 0.21 0.13 0.18 0.26 0.24 0.16
Trips Per Hour
Total 5.8 5.1 6.6 2.7 4.3 3.0 3.5 9.6 8.1 8.1
Fixed-route 12.2 5.7 9.9 11.1 9.5 8.5 8.2 18.6 9.3 13.3
Demand-response 1.8 3.2 2.6 2.1 3.5 2.3 3.0 3.4 3.9 2.4
Trips Per Vehicle 7,154 6,438 6,939 3,777 5,312 3,215 3,468 12,200 7,615 8,654
Miles Per Vehicle 27,205 22,672 17,938 25,920 20,028 19,216 16,317 18,608 19,177 20,420
Hours Per Vehicle 1,230 1,258 1,055 1,392 1,243 1,062 987 1,266 945 1,066
Operating Expense Per Trip Total 10.47 10.93 8.60 13.36 10.68 14.22 10.68 5.81 9.96 9.11
Fixed-route only 12.49 11.48 10.13 4.91 7.24 3.29 5.91 5.83 11.75 5.91
Demand-response only 41.46 11.61 14.85 15.27 13.28 16.43 12.05 11.66 19.12 23.63
Operating Expense Per Mile Total 2.75 3.10 3.33 1.95 2.83 2.38 2.27 3.81 3.95 3.86
Fixed-route only 3.55 2.81 2.35 3.56 3.24 2.52 3.57 4.61 3.81 4.96
Demand-response only 2.60 3.47 2.50 1.83 2.73 2.09 2.19 3.10 4.42 3.23
Farebox Recovery Ratio 0.06 0.12 0.11 0.05 0.13 0.05 0.08 0.09 0.15 0.11 Source: Rural National Transit Database, 2014

Rural Transit Fact Book • 2016 | 30
Table 33. Rural Transit Vehicle Revenue Miles of Service by State, 2011-2014 (million miles) Total Fixed-Route Service Demand-Response Service Other Service
2011 2012 2013 2014 2011 2012 2013 2014 2011 2012 2013 2014 2011 2012 2013 2014 Alabama 5.3 4.8 4.6 4.7 .0 .0 .0 .0 5.3 4.8 4.6 4.7 .0 .0 .0 .0 Alaska 2.7 2.2 2.6 2.7 1.4 1.4 1.5 1.5 .8 .7 .7 .9 .5 .1 .4 .4 Arizona 3.7 2.4 2.5 2.4 2.6 1.9 2.1 1.9 .6 .2 .2 .2 .6 .2 .2 .4 Arkansas 8.1 8.7 9.1 10.8 .2 .1 .2 .2 7.9 8.6 8.9 10.6 .0 .0 .0 .0 California 18.5 17.0 16.2 14.0 9.8 9.9 10.0 7.4 4.8 4.0 3.3 3.2 3.9 3.2 2.9 3.5 Colorado 10.7 14.5 14.5 16.2 5.7 5.3 5.6 5.8 2.5 3.1 2.6 3.0 2.4 6.1 6.2 7.4 Connecticut 1.6 1.6 1.6 1.6 .7 .7 .7 .9 .8 .8 .8 .6 .1 .1 .1 .1 Delaware .0 .0 .0 .0 .0 .0 .0 .0 .0 .0 .0 .0 .0 .0 .0 .0 Florida 17.2 14.3 15.3 15.5 5.2 2.2 2.8 3.3 11.8 11.7 11.8 11.2 .2 .5 .7 1.0 Georgia 16.3 16.8 16.5 16.2 .0 .0 .0 .0 16.3 16.8 16.5 16.2 .0 .0 .0 .0 Hawaii 7.0 7.8 4.9 5.4 3.3 2.6 1.4 1.4 1.7 2.0 .3 .7 2.1 3.1 3.1 3.2 Idaho 2.7 2.3 2.4 2.4 1.8 1.1 1.1 1.1 .7 .8 .7 .7 .2 .3 .5 .6 Illinois 15.0 13.9 15.0 15.2 .0 1.1 .9 1.1 13.7 12.7 14.1 14.1 1.4 .0 .0 .0 Indiana 15.0 15.1 14.5 13.4 .7 .7 .8 .8 14.3 14.4 13.6 12.5 .0 .0 .0 .0 Iowa 14.7 14.8 13.6 14.0 2.0 2.0 1.9 1.8 12.7 12.8 11.8 12.2 .0 .0 .0 .0 Kansas 6.9 6.0 6.2 5.8 .8 .9 .9 .9 6.1 5.1 4.7 4.5 .0 .0 .5 .3 Kentucky 27.2 31.3 30.9 33.0 .6 .6 .8 .9 26.6 30.7 30.2 32.1 .0 .0 .0 .0 Louisiana 6.0 5.8 5.8 5.0 .1 .0 .0 .0 6.0 5.8 5.8 5.0 .0 .0 .0 .0 Maine 14.1 10.1 8.8 8.0 2.8 .9 .9 .9 10.1 8.2 7.7 7.0 1.2 1.0 .2 .2 Maryland 7.0 4.0 3.9 3.7 4.2 2.1 2.1 2.1 2.6 1.8 1.8 1.6 .2 .2 .0 .0 Massachusetts 2.2 2.1 2.1 2.0 1.7 1.7 1.7 1.6 .5 .5 .5 .4 .0 .0 .0 .0 Michigan 23.7 22.6 23.1 23.1 .0 .0 .0 .0 23.7 22.6 23.1 23.1 .0 .0 .0 .0 Minnesota 13.9 12.6 12.4 12.9 3.7 3.7 3.7 3.9 10.2 8.9 8.8 9.1 .0 .0 .0 .0 Mississippi 8.1 8.8 10.0 10.2 8.1 .0 .0 .0 .0 8.8 10.0 10.2 .0 .0 .0 .0 Missouri 23.0 22.0 20.1 19.0 .0 .5 .5 .5 22.8 21.5 19.6 18.5 .2 .0 .0 .0 Montana 3.4 3.4 3.8 3.5 1.4 1.3 1.4 1.4 1.5 1.9 2.0 1.7 .4 .3 .5 .4 Nebraska 2.6 2.4 2.6 2.7 .0 .0 .0 .0 2.6 2.4 2.6 2.7 .0 .0 .0 .0 Nevada 1.4 2.3 2.1 2.1 .9 .9 .9 .8 .5 1.3 1.1 1.0 .0 .0 .0 .3 New Hampshire 1.4 1.6 1.6 1.5 1.0 1.1 1.0 1.0 .4 .5 .5 .5 .0 .0 .1 .0 New Jersey 7.5 2.4 2.2 2.0 1.2 .5 .5 .4 6.3 1.9 1.7 1.6 .0 .0 .0 .0 New Mexico 5.0 5.2 5.0 4.8 3.0 2.6 2.6 3.1 1.5 1.6 1.6 1.6 .5 1.0 .8 .1 New York 13.8 14.5 13.6 13.1 13.4 14.4 10.6 11.5 .0 .0 2.7 1.3 .4 .1 .3 .3 North Carolina 41.4 39.1 29.3 28.8 1.6 1.5 1.1 1.5 39.9 35.1 27.6 27.3 .0 2.5 .5 .0 North Dakota 3.1 2.9 2.7 2.8 .0 .2 .2 .2 3.0 2.6 2.4 2.5 .1 .1 .0 .1 Ohio 11.2 10.0 11.1 12.0 .6 .5 .5 .4 10.6 9.5 10.6 11.6 .0 .0 .0 .0 Oklahoma 18.7 19.5 19.7 18.9 1.1 1.0 1.0 .8 17.6 18.5 18.7 18.1 .0 .0 .0 .0 Oregon 9.6 7.3 7.4 7.2 4.4 3.8 3.7 2.4 4.4 2.8 2.9 2.7 .8 .6 .8 2.1 Pennsylvania 11.8 10.7 10.7 7.9 4.4 4.7 4.4 3.7 7.0 6.0 5.9 3.7 .4 .0 .4 .5 Rhode Island .0 .0 .0 .0 .0 .0 .0 .0 .0 .0 .0 .0 .0 .0 .0 .0 South Carolina 7.5 6.9 5.9 4.9 1.2 1.2 .6 .6 5.2 4.9 4.9 4.0 1.1 .9 .5 .4 South Dakota 4.2 4.6 4.2 4.1 .0 .0 .0 .0 4.2 4.6 4.2 4.1 .0 .0 .0 .0 Tennessee 29.4 30.2 19.3 18.2 1.0 1.0 1.5 1.9 27.7 28.9 17.8 16.2 .6 .3 .1 .1 Texas 21.4 21.7 20.7 18.7 1.4 1.8 1.1 1.4 19.1 17.4 18.8 15.5 .8 2.5 .8 1.8 Utah 1.3 1.6 1.4 1.4 1.2 1.3 1.2 1.2 .1 .1 .1 .1 .0 .2 .0 .0 Vermont 8.8 9.3 12.5 12.4 1.8 1.8 1.9 2.0 5.7 6.3 9.3 9.2 1.2 1.2 1.3 1.3 Virginia 11.4 13.2 12.9 6.8 8.2 9.2 9.5 3.5 3.1 3.9 3.4 3.3 .0 .0 .0 .0 Washington 16.9 15.8 16.0 15.1 8.0 7.4 7.7 7.0 5.4 4.7 4.7 4.5 3.5 3.7 3.6 3.7 West Virginia 4.2 4.5 4.3 4.2 4.2 4.5 3.1 2.9 .0 .0 1.2 1.3 .0 .0 .0 .0 Wisconsin 8.3 8.0 7.9 8.5 2.8 2.7 2.5 2.7 .6 .3 .3 .3 5.0 5.0 5.1 5.4 Wyoming 2.4 2.3 2.5 2.4 1.2 1.2 1.2 1.3 1.2 1.2 1.3 1.0 .0 .0 .0 .0 Source: Rural National Transit Database, 2011-2014

Rural Transit Fact Book • 2016 | 31
Table 34. State Operating Statistics, 2014 Number
of Agencies
Counties Served
(%)
Annual Ridership Annual Vehicle Miles Annual Vehicle Hours
Total Fixed- Route
Demand- Response Total Fixed-
Route Demand- Response Total Fixed-
Route Demand- Response
---------thousand rides--------- ---------thousand miles--------- ---------thousand hours--------- Alabama 23 76% 1,350 - 1,350 4,683 - 4,683 276 - 276 Alaska 14 67% 1,944 1,694 124 2,693 1,450 866 174 85 75 Arizona 13 73% 938 722 31 2,424 1,889 182 147 116 12 Arkansas 8 79% 1,036 127 909 10,759 200 10,559 619 17 603 California 52 97% 5,908 3,467 1,092 14,034 7,393 3,164 747 368 252 Colorado 28 59% 14,378 8,638 686 16,225 5,827 3,009 1,121 398 265 Connecticut 4 100% 535 414 75 1,606 871 597 101 54 39 Delaware 0 33% - - - - - - - - - Florida 23 93% 2,003 760 1,112 15,477 3,292 11,194 880 176 687 Georgia 79 70% 1,706 - 1,706 16,219 - 16,219 911 - 911 Hawaii 2 75% 1,976 820 133 5,357 1,391 735 205 64 20 Idaho 11 98% 1,023 839 122 2,439 1,110 698 135 68 54 Illinois 38 86% 4,798 2,437 2,361 15,218 1,141 14,076 852 90 762 Indiana 42 74% 2,409 630 1,780 13,356 811 12,545 876 64 812 Iowa 22 100% 4,526 1,403 3,123 14,006 1,823 12,182 966 143 823 Kansas 79 83% 1,531 434 998 5,807 930 4,539 343 65 256 Kentucky 24 86% 3,266 499 2,767 32,989 862 32,127 1,805 57 1,747 Louisiana 30 53% 495 - 495 4,963 - 4,963 269 - 269 Maine 11 100% 1,109 570 486 8,040 917 6,960 299 59 232 Maryland 7 83% 3,239 2,991 247 3,680 2,100 1,580 263 155 108 Massachusetts 3 71% 1,702 1,647 55 2,010 1,629 381 130 103 28 Michigan 57 87% 6,942 76 6,110 23,138 20 23,091 1,410 2 1,383 Minnesota 46 98% 3,735 1,255 2,480 12,927 3,871 9,056 787 225 562 Mississippi 18 78% 2,576 - 2,576 10,176 - 10,176 455 - 455 Missouri 23 99% 2,206 94 2,112 19,041 528 18,513 1,022 23 998 Montana 29 54% 1,410 807 555 3,549 1,443 1,671 162 55 99 Nebraska 59 77% 660 - 660 2,696 - 2,696 197 - 197 Nevada 16 65% 1,204 854 201 2,144 826 969 135 55 64 New Hampshire 7 70% 1,061 1,002 59 1,476 974 502 126 72 53 New Jersey 5 71% 445 159 286 2,001 447 1,554 145 22 123 New Mexico 18 79% 1,614 1,272 333 4,802 3,060 1,633 302 166 134 New York 43 73% 3,881 3,433 386 13,126 11,549 1,282 697 601 87 North Carolina 55 97% 4,608 1,987 2,621 28,843 1,528 27,313 1,515 114 1,401 North Dakota 21 100% 623 132 471 2,786 224 2,501 215 18 188 Ohio 33 41% 2,525 199 2,326 12,019 380 11,639 726 28 697 Oklahoma 19 95% 3,280 796 2,483 18,902 832 18,069 1,064 52 1,012 Oregon 27 86% 2,750 1,420 601 7,210 2,414 2,701 408 134 196 Pennsylvania 13 43% 2,988 2,307 540 7,901 3,677 3,750 466 234 219 Rhode Island 0 40% - - - - - - - - - South Carolina 11 87% 852 343 393 4,906 553 3,960 240 36 188 South Dakota 20 89% 1,429 - 1,429 4,063 - 4,063 323 - 323 Tennessee 9 100% 2,899 1,808 1,077 18,239 1,923 16,177 979 103 868 Texas 23 97% 3,519 811 2,377 18,661 1,419 15,487 987 92 817 Utah 3 17% 1,879 1,859 20 1,359 1,236 122 99 87 11 Vermont 10 100% 2,331 1,460 544 12,443 1,979 9,211 495 129 319 Virginia 22 60% 1,427 870 557 6,837 3,521 3,316 355 161 194 Washington 26 90% 6,590 5,224 618 15,105 6,977 4,474 683 296 276 West Virginia 11 45% 1,089 866 224 4,185 2,929 1,255 244 161 83 Wisconsin 47 83% 2,641 1,175 63 8,462 2,714 306 689 162 28 Wyoming 14 48% 2,015 1,698 318 2,376 1,337 1,040 218 107 111 Source: Rural National Transit Database, 2014
Rural Transit Fact Book • 2016 | 32
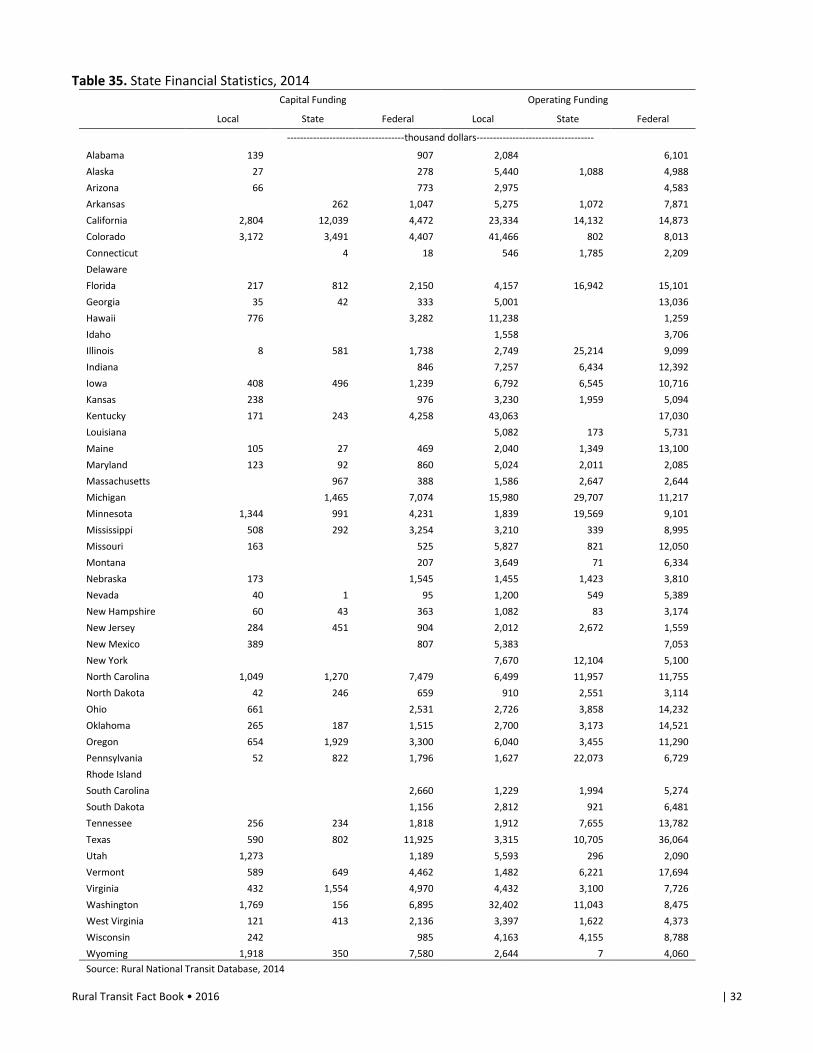
Table 35. State Financial Statistics, 2014 Capital Funding Operating Funding
Local State Federal Local State Federal
------------------------------------thousand dollars------------------------------------
Alabama 139 907 2,084 6,101 Alaska 27 278 5,440 1,088 4,988 Arizona 66 773 2,975 4,583 Arkansas 262 1,047 5,275 1,072 7,871 California 2,804 12,039 4,472 23,334 14,132 14,873 Colorado 3,172 3,491 4,407 41,466 802 8,013 Connecticut 4 18 546 1,785 2,209 Delaware Florida 217 812 2,150 4,157 16,942 15,101 Georgia 35 42 333 5,001 13,036 Hawaii 776 3,282 11,238 1,259 Idaho 1,558 3,706 Illinois 8 581 1,738 2,749 25,214 9,099 Indiana 846 7,257 6,434 12,392 Iowa 408 496 1,239 6,792 6,545 10,716 Kansas 238 976 3,230 1,959 5,094 Kentucky 171 243 4,258 43,063 17,030 Louisiana 5,082 173 5,731 Maine 105 27 469 2,040 1,349 13,100 Maryland 123 92 860 5,024 2,011 2,085 Massachusetts 967 388 1,586 2,647 2,644 Michigan 1,465 7,074 15,980 29,707 11,217 Minnesota 1,344 991 4,231 1,839 19,569 9,101 Mississippi 508 292 3,254 3,210 339 8,995 Missouri 163 525 5,827 821 12,050 Montana 207 3,649 71 6,334 Nebraska 173 1,545 1,455 1,423 3,810 Nevada 40 1 95 1,200 549 5,389 New Hampshire 60 43 363 1,082 83 3,174 New Jersey 284 451 904 2,012 2,672 1,559 New Mexico 389 807 5,383 7,053 New York 7,670 12,104 5,100 North Carolina 1,049 1,270 7,479 6,499 11,957 11,755 North Dakota 42 246 659 910 2,551 3,114 Ohio 661 2,531 2,726 3,858 14,232 Oklahoma 265 187 1,515 2,700 3,173 14,521 Oregon 654 1,929 3,300 6,040 3,455 11,290 Pennsylvania 52 822 1,796 1,627 22,073 6,729 Rhode Island South Carolina 2,660 1,229 1,994 5,274 South Dakota 1,156 2,812 921 6,481 Tennessee 256 234 1,818 1,912 7,655 13,782 Texas 590 802 11,925 3,315 10,705 36,064 Utah 1,273 1,189 5,593 296 2,090 Vermont 589 649 4,462 1,482 6,221 17,694 Virginia 432 1,554 4,970 4,432 3,100 7,726 Washington 1,769 156 6,895 32,402 11,043 8,475 West Virginia 121 413 2,136 3,397 1,622 4,373 Wisconsin 242 985 4,163 4,155 8,788 Wyoming 1,918 350 7,580 2,644 7 4,060 Source: Rural National Transit Database, 2014

Rural Transit Fact Book • 2016 | 33
Table 36. State Fleet Statistics, 2014
Number of Vehicles
ADA Vehicles
(%)
Average Vehicle
Age
Average Vehicle Length
Average Vehicle
Capacity
Trips Per Vehicle
Miles Per Vehicle
Hours Per Vehicle
-------------thousands------------- Alabama 313 73% 6.2 22.5 17.4 4.3 15.0 0.9 Alaska 115 90% 7.6 28.8 20.9 16.9 23.4 1.5 Arizona 85 100% 5.3 25.4 19.1 11.0 28.5 1.7 Arkansas 434 68% 6.8 21.3 11.5 2.4 24.8 1.4 California 930 99% 5.7 24.6 21.5 6.4 15.1 0.8 Colorado 609 72% 8.7 23.0 19.7 23.6 26.6 1.8 Connecticut 73 100% 4.9 24.2 16.3 7.3 22.0 1.4 Delaware 0 - - - - - - - Florida 693 81% 5.8 21.0 11.3 2.9 22.3 1.3 Georgia 461 80% 3.8 21.1 12.6 3.7 35.2 2.0 Hawaii 183 72% 6.5 23.4 20.6 10.8 29.3 1.1 Idaho 121 70% 7.1 24.8 17.8 8.5 20.2 1.1 Illinois 766 99% 8.0 22.6 13.4 6.3 19.9 1.1 Indiana 770 78% 6.4 19.1 8.5 3.1 17.3 1.1 Iowa 883 92% 7.9 25.2 16.0 5.1 15.9 1.1 Kansas 387 78% 6.9 19.4 11.4 4.0 15.0 0.9 Kentucky 1217 70% 6.5 20.5 10.7 2.7 27.1 1.5 Louisiana 283 94% 5.4 20.8 10.2 1.7 17.5 1.0 Maine 217 74% 7.5 23.2 16.4 5.1 37.1 1.4 Maryland 236 93% 8.9 25.4 19.9 13.7 15.6 1.1 Massachusetts 112 95% 5.1 25.6 19.0 15.2 17.9 1.2 Michigan 1028 91% 5.4 23.2 18.8 6.8 22.5 1.4 Minnesota 857 99% 6.5 25.1 17.5 4.4 15.1 0.9 Mississippi 353 71% 5.2 20.7 17.6 7.3 28.8 1.3 Missouri 1036 87% 6.8 21.4 10.5 2.1 18.4 1.0 Montana 327 67% 7.6 25.0 17.3 4.3 10.9 0.5 Nebraska 254 71% 6.9 19.5 10.2 2.6 10.6 0.8 Nevada 121 83% 8.3 20.3 13.5 10.0 17.7 1.1 New Hampshire 71 100% 6.1 28.6 19.4 14.9 20.8 1.8 New Jersey 124 100% 5.7 24.1 18.1 3.6 16.1 1.2 New Mexico 254 89% 5.4 23.5 15.7 6.4 18.9 1.2 New York 547 99% 4.9 24.1 19.1 7.1 24.0 1.3 North Carolina 1020 75% 4.7 20.1 11.5 4.5 28.3 1.5 North Dakota 176 91% 6.7 20.3 11.3 3.5 15.8 1.2 Ohio 551 87% 5.1 - 11.3 4.6 21.8 1.3 Oklahoma 962 86% 6.3 20.9 12.0 3.4 19.6 1.1 Oregon 385 97% 6.4 23.0 16.4 7.1 18.7 1.1 Pennsylvania 439 64% 5.2 22.7 17.3 6.8 18.0 1.1 Rhode Island 0 - - - - - - - South Carolina 195 79% 6.9 24.3 17.5 4.4 25.2 1.2 South Dakota 354 59% 9.0 20.2 12.4 4.0 11.5 0.9 Tennessee 817 82% 5.8 19.9 10.2 3.5 22.3 1.2 Texas 1137 90% 6.6 21.4 12.8 3.1 16.4 0.9 Utah 51 100% 7.5 30.0 24.3 36.8 26.6 1.9 Vermont 463 99% 4.8 25.5 18.6 5.0 26.9 1.1 Virginia 320 97% 4.7 22.6 15.3 4.5 21.4 1.1 Washington 721 69% 7.3 23.7 17.4 9.1 20.9 0.9 West Virginia 265 84% 5.2 21.3 13.6 4.1 15.8 0.9 Wisconsin 296 63% 6.0 18.7 7.9 8.9 28.6 2.3 Wyoming 167 86% 7.1 24.3 17.9 12.1 14.2 1.3 Source: Rural National Transit Database, 2014

Rural Transit Fact Book • 2016 | 34
Table 37. State Performance Measures, Median Agencies Values, 2014 Trips Per Mile Trips Per Hour Operating
Expense Per Trip
Operating Expense Per Mile
Farebox Recovery
Ratio Total Fixed- Route
Demand- Response Total Fixed-
Route Demand- Response
Alabama 0.18 - 0.18 2.82 - 2.82 16.56 2.62 0.08 Alaska 0.30 0.35 0.19 4.64 4.64 1.97 18.05 5.00 0.10 Arizona 0.24 0.31 0.13 4.84 5.68 1.93 11.17 4.15 0.07 Arkansas 0.08 0.55 0.08 1.48 7.26 1.48 18.67 1.92 0.07 California 0.29 0.28 0.26 5.27 5.79 3.19 15.49 4.90 0.10 Colorado 0.40 1.37 0.17 5.50 18.30 2.24 9.96 3.81 0.05 Connecticut 0.28 0.44 0.12 4.23 5.30 1.98 13.06 3.58 0.07 Delaware - - - - - - - - - Florida 0.09 0.22 0.09 2.02 3.39 1.53 21.76 2.53 0.03 Georgia 0.12 - 0.12 1.96 - 1.96 14.76 1.90 0.05 Hawaii 0.41 0.59 0.19 9.93 12.88 8.87 7.46 3.09 0.13 Idaho 0.24 0.67 0.17 2.69 14.73 2.35 9.17 3.04 0.03 Illinois 0.13 0.72 0.13 2.32 10.00 2.32 17.66 2.47 0.04 Indiana 0.15 0.46 0.14 2.30 5.36 2.18 14.42 2.22 0.07 Iowa 0.33 0.70 0.28 5.32 8.81 3.88 8.74 2.96 0.09 Kansas 0.28 0.38 0.27 3.82 5.44 3.40 8.03 2.16 0.13 Kentucky 0.09 0.49 0.09 1.69 6.59 1.52 17.66 1.83 0.02 Louisiana 0.11 - 0.11 2.11 - 2.11 25.97 2.48 0.03 Maine 0.14 0.32 0.08 3.01 5.23 1.90 22.78 2.67 0.05 Maryland 0.18 0.21 0.18 3.57 3.98 1.66 15.88 3.07 0.08 Massachusetts 1.02 1.09 0.16 12.52 14.00 2.49 6.09 5.01 0.29 Michigan 0.26 3.86 0.26 4.00 40.58 3.94 12.56 3.32 0.19 Minnesota 0.31 0.31 0.31 4.30 4.23 4.30 11.32 3.41 0.13 Mississippi 0.16 - 0.16 3.64 - 3.64 12.07 2.18 0.04 Missouri 0.29 0.35 0.29 2.94 5.28 2.80 12.53 2.09 0.08 Montana 0.24 0.34 0.27 4.86 13.29 3.66 11.31 2.88 0.06 Nebraska 0.21 - 0.21 3.07 - 3.07 14.83 2.93 0.09 Nevada 0.29 0.39 0.22 3.90 6.56 3.27 13.03 3.67 0.04 New Hampshire 0.20 0.28 0.13 2.18 4.31 1.10 14.27 3.09 0.05 New Jersey 0.22 0.34 0.18 3.33 6.18 2.22 16.55 3.47 0.02 New Mexico 0.29 0.32 0.20 4.56 6.37 2.70 10.79 2.98 0.07 New York 0.23 0.22 0.19 4.96 4.96 3.30 14.46 3.33 0.08 North Carolina 0.11 0.24 0.11 2.05 3.31 2.04 16.86 1.84 0.03 North Dakota 0.16 0.59 0.15 2.31 7.20 2.30 14.16 3.03 0.10 Ohio 0.17 0.53 0.17 2.59 7.01 2.55 16.50 2.75 0.05 Oklahoma 0.19 0.41 0.19 2.76 6.69 2.68 11.14 2.00 0.06 Oregon 0.38 0.45 0.24 5.15 8.50 2.95 10.47 3.45 0.10 Pennsylvania 0.44 0.48 0.19 5.53 6.82 2.48 11.58 4.49 0.06 Rhode Island - - - - - - - - - South Carolina 0.09 0.27 0.08 2.00 4.48 1.81 20.15 1.96 0.05 South Dakota 0.41 - 0.41 4.30 - 4.30 9.00 3.38 0.12 Tennessee 0.07 0.74 0.06 1.31 10.43 1.27 27.34 1.97 0.04 Texas 0.16 0.17 0.14 2.76 2.33 2.24 18.13 3.04 0.05 Utah 0.34 0.35 0.18 2.76 3.37 1.80 9.45 6.22 0.03 Vermont 0.18 0.63 0.08 3.99 8.92 2.33 13.71 2.34 0.03 Virginia 0.22 0.28 0.19 4.00 4.93 2.78 10.53 2.39 0.05 Washington 0.21 0.40 0.16 4.49 8.11 2.21 14.11 3.15 0.05 West Virginia 0.19 0.18 0.17 3.54 3.66 2.70 12.52 2.41 0.09 Wisconsin 0.27 0.27 0.21 2.67 5.54 2.24 9.62 2.57 0.30 Wyoming 0.30 0.79 0.29 3.60 12.69 2.96 11.66 2.84 0.03 Source: Rural National Transit Database, 2014

Rural Transit Fact Book • 2016 | 35
Figure 8. Total Trips by State
Figure 9. Total Vehicle Revenue Miles by State

Rural Transit Fact Book • 2016 | 36
Figure 11. Trips per Vehicle Revenue Mile by State
Figure 10. Trips per Vehicle Revenue Hour by State

Rural Transit Fact Book • 2016 | 37
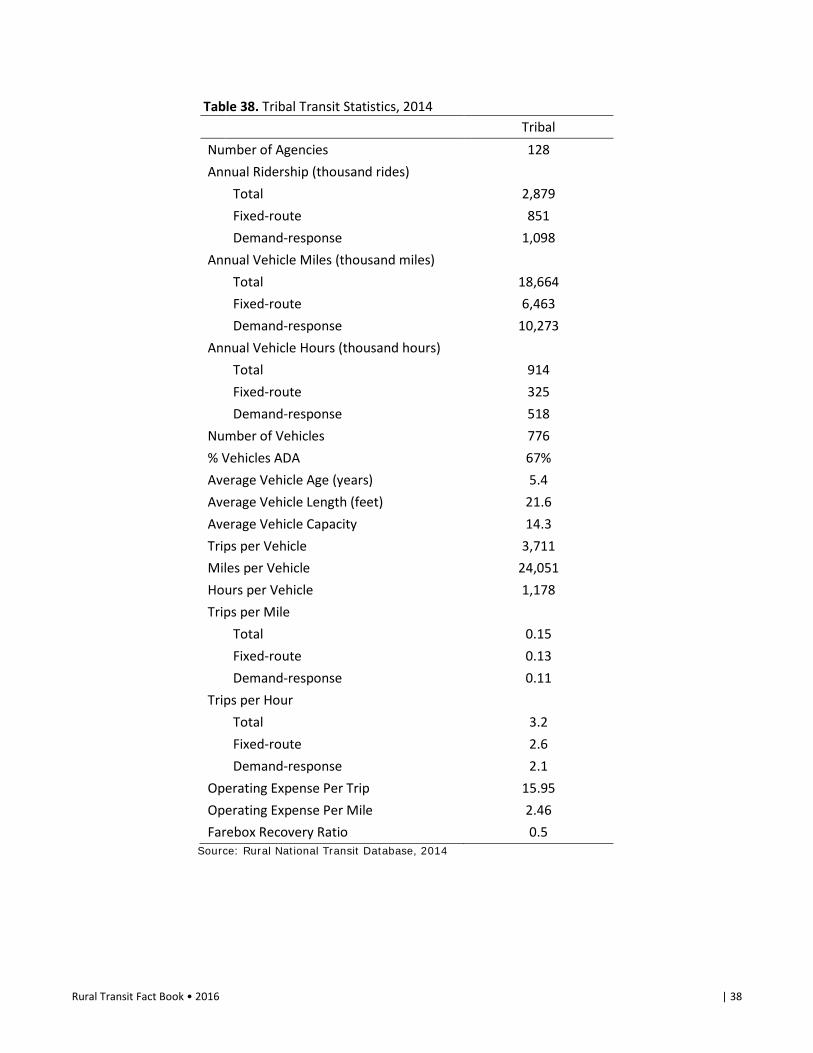
TRIBAL TRANSIT The number of tribal transit providers has grown significantly over the past decade (Mielke 2011). A SURTC report published in 2011, titled “5311(c) Tribal Transit Funding: Assessing Impacts and Determining Future Program Needs,” provides information about existing tribal transit services and funding and discusses transportation needs of Native American and Alaska Native communities. The report provided data for the 180 rural reservations that had at least 500 residents, showing there are several geographic and demographic indicators that suggest that the provision of transit services should be a high priority on many reservations. These indicators include low population densities, long travel distances, and a higher percentage of older adults and low-income households. According to Mielke et al. (2011), there were 118 tribal transit services existing at the time, with an additional 45 tribes in the planning stage. Of these rural tribal transit providers, 128 submitted data to the 2014 Rural NTD. Statistics for these transit agencies are shown in Table 38. These 128 agencies provided a total of 2.9 million rides in 2014.
Rural Transit Fact Book • 2016 | 38
Table 38. Tribal Transit Statistics, 2014 Tribal Number of Agencies 128 Annual Ridership (thousand rides)
Total 2,879 Fixed-route 851 Demand-response 1,098
Annual Vehicle Miles (thousand miles)
Total 18,664 Fixed-route 6,463 Demand-response 10,273
Annual Vehicle Hours (thousand hours)
Total 914 Fixed-route 325 Demand-response 518
Number of Vehicles 776 % Vehicles ADA 67% Average Vehicle Age (years) 5.4 Average Vehicle Length (feet) 21.6 Average Vehicle Capacity 14.3 Trips per Vehicle 3,711 Miles per Vehicle 24,051 Hours per Vehicle 1,178 Trips per Mile
Total 0.15 Fixed-route 0.13 Demand-response 0.11
Trips per Hour
Total 3.2 Fixed-route 2.6 Demand-response 2.1
Operating Expense Per Trip 15.95 Operating Expense Per Mile 2.46 Farebox Recovery Ratio 0.5
Source: Rural National Transit Database, 2014

Rural Transit Fact Book • 2016 | 39
REFERENCES American Public Transportation Association. A Profile of Public Transportation Passenger Demographics and Travel
Characteristics Reported in On-Board Surveys. May 2007.
Federal Transit Administration. U.S. Department of Transportation. 2010-2014 Rural National Transit Database. Retrieved December 2015, from http://www.ntdprogram.gov/ntdprogram/data.htm
Federal Transit Administration. U.S. Department of Transportation. Grants Data. Retrieved September 2016, from http://www.fta.dot.gov/grants/13442.html
Mielke, Jon. (October 2011) 5311(c) Tribal Transit Funding: Assessing Impacts and Determining Future Program Needs. UGPTI Report DP-243, Upper Great Plains Transportation Institute, North Dakota State University, Fargo.
Ripplinger, David, Elvis Ndembe, and Jill Hough. (December 2012) “2011 Transit and Community Livability Report.” UGPTI Report DP-262, Upper Great Plains Transportation Institute, North Dakota State University, Fargo.
U.S. Census Bureau. American Community Survey. Retrieved September 2016, from factfinder.census.gov
U.S. Census Bureau. American Housing Survey. National Summary Tables – AHS 2013. Retrieved March 2015, from http://www.census.gov/programs-surveys/ahs/data/2013/national-summary-report-and-tables---ahs-2013.html
U.S. Department of Transportation, Federal Highway Administration. (February 2011) 2009 National Household Travel Survey, Version 2.1. Retrieved April 2011, from http://nhts.ornl.gov/download.shtml
U.S. Department of Transportation, Federal Highway Administration, Office of Highway Policy Information. Traffic Volume Trends. Various Issues. Retrieved September 2016, from http://www.fhwa.dot.gov/policyinformation/travel_monitoring/tvt.cfm

Rural Transit Fact Book • 2016 | 40
Glossary of Terms ARRA – The American Recovery & Reinvestment Act: Signed into law in February 2009, it included $48.1 billion for
transportation spending, including $8.4 billion for transit.
Cutaways – Bus bodies mounted on varying sizes of truck chassis.
Demand-response – Non-fixed-route service with passengers boarding and alighting at pre-arranged times at any location within the system’s service area.
Deviated fixed-route – Service in which a vehicle operates along a standard route at generally fixed times, from which it may deviate in response to a demand for its service, after which it returns to its standard route.
Fixed-route – Service in which a vehicle operates along a prescribed route according to a fixed schedule.
Section 5309 – Provides capital assistance for new and replacement buses and facilities, as well as fixed-guideway systems.
Section 5310 – Transportation for Elderly Persons and Persons with Disabilities: Formula funding to states for the purpose of assisting private nonprofit groups in meeting transportation needs of the elderly and persons with disabilities.
Section 5311 - Formula Grants for Other than Urbanized Areas: Provides funding to states for the purpose of supporting public transportation in rural areas with population of less than 50,000.
Section 5311(c) – Tribal Transit Program: A transportation funding program for Indian Tribes and Alaska Native Villages.
Section 5316 - Job Access and Reverse Commute Program: Address transportation challenges faced by welfare recipients and low-income persons seeking to obtain and maintain employment.
Section 5317 - New Freedom Program: Additional tools to overcome existing barriers facing Americans with disabilities seeking integration into the work force and society.
Section 5320 - Paul S. Sarbanes Transit in Parks Program: Addresses the challenge of increasing vehicle congestion in and around national parks and other federal lands.
Van pool – A ride sharing service to and from pre-arranged destinations in which a number of people travel together on a regular basis in a van which is designed to carry 7 to 15 passengers.