2016 report card for florida’s infrastructure · 20xx report card for state name(s)...
TRANSCRIPT

20XX REPORT CARD FOR STATE NAME(S) INFRASTRUCTURE I 1
2016 REPORT CARD
FOR FLORIDA’S
INFRASTRUCTURE
An independent review of the current state of infrastructure needs,
capability and funding in the State of Florida by the Florida Section of
the American Society of Civil Engineers

1 | P a g e
What You Should Know About Florida’s Airports In addition to the over 50 million visitors arriving by air, Florida’s large size makes aviation a vital mode
of transportation for resident travel to the far reaches of the state.
Florida has formed the Continuing Florida Aviation System Planning Process (CFASSP) which is a method
used to continually monitor the aviation environment and determine the development requirements to
best meet projected aviation demands. This process is a component of the Federal Aviation
Administration Continuous Airport Systems Planning Process.
Capacity of Florida’s Airports According to the Florida Department of Transportation Aviation and Spaceports Office’s Florida Aviation
System Plan (FASP), by 2025, Florida will be the world’s top destination for family-oriented
entertainment, geriatric healthcare, ecotourism, outdoor recreation, and international nightlife. The
state’s commercial service airports serve over 149 million passengers each year, which is seven times
the amount of permanent Florida residents. In addition to passenger traffic, Florida’s air cargo accounts
for more than $10.3 billion in annual economic activity, almost 130,000 jobs and $5 billion in annual
payroll.
Projects consistent with the goals of the Florida Airports System Plan are eligible for funding through the
Florida Aviation Grant Program, which helps preserve existing airport infrastructure and increase the
capacity of Florida’s airports. Capacity enhancement projects are priorities of the State and are
addressed within the Strategic Intermodal System (SIS) which identifies existing and emerging facilities
that carry more than 99 percent of commercial air passengers and cargo. There are currently 19 airports
that qualify as SIS, Emerging SIS, or SIS General Aviation Reliever which are eligible for SIS capacity
project funding in the form of ground transportation, landside connections, airside connections and
terminal connections.
Operation and Maintenance of the Existing Airports Airports require a minimum level of service from all pavements in order to provide safe operations on
the airport. Deteriorated pavements increase the chance of Foreign Object Debris (FOD) which could
potentially damage aircraft.
The Florida Department of Transportation (FDOT) provides a Statewide Airfield Pavement Management
Program (SAPMP) pursuant to the Florida Statute Section 332.006. This effort incorporates the latest
airfield pavement management procedures and policies from the Federal Aviation Administration (FAA)
and American Society for Testing and Materials (ASTM). A Pavement Condition Index (PCI) for the
airfield pavement is compiled during these inspections. The PCI is used to prioritize pavement
rehabilitation projects and ensure a satisfactory level of service for airfield pavement. The program
provides participating airports with the data necessary to secure grant funding through the FAA for
pavement rehabilitation projects. As a result of the SAPMP, 86 of the 92 airports participating in the
2 | P a g e
program had an overall airfield pavement condition rated as fair or better, meaning over 93% percent of
the airports had well performing pavement.
Funding On a state funding level, Florida airports are fortunate to benefit from the best endowed state-
appropriated airport development funds in the U.S., which is funded from the collection of aviation fuel
taxes. On a Federal/National level, funding through the FAA Airport Improvement Program (AIP) has
been inconsistent. The AIP budget for 2016 is proposed at $3.35 billion. However, the FAA is again
proposing to reduce the AIP pool in exchange for an increase in Passenger Facility Charges (PFCs) from
$4.50 to $8, an opportunity for the airports to charge individual passengers through airline ticket fees.
This would provide more funding for large airports with high passenger volume and increase the portion
of public funding available to smaller airports. According to the State’s aviation work program, total
funding requests by Florida airports over the next 5 years totals approximately $1.1Billion (federal, state
and local). This amount exceeds available State funds by almost 70%. Efforts need to continue to find
ways to at least maintain all funding levels, and to encourage the maximization of other funding
opportunities, such as PFCs, matching grants, and exploring other discretionary funding sources.
Florida Airports have learned to make good use of the funding that they do receive from the FAA and
the FDOT. Florida has 100 airports in the National Plan of Integrated Airport Systems (NPIAS) which are
eligible for federal funding through FAA, and a total of 106 publicly owned / public use airports that are
eligible for State funding.
Let’s Raise the Grades Accelerate efforts to modernize the nation’s air traffic control system by implementing the
NextGen to meet the 2021 deadline.
Increase or eliminate the cap on the Passenger Facilities Charges (PFCs) to allow airports the
flexibility to invest in their own facilities.
The FASP is currently being updated to include a Demand/Capacity Analysis which will look
at current and future (2034) airport and system wide demand and capacity to determine
system requirements for meeting the aviation needs over the next 20 years.
Using the SIS, make improvements to roads, multi-modal connections, and commitments to
maintain the general aviation industry that helps to relieve the congestion from the
commercial service airports.

3 | P a g e
Sources Florida Aviation System Plan 2025, prepared by the Florida Department of Transportation, Aviation
Office, 2005. www.dot.state.fl.us/aviation/FASP_details.shtm#system_plan
Florida Aviation System Plan - 2012 Statewide Overview, prepared by the Florida Department of
Transportation, Aviation Office, 2012.
www.dot.state.fl.us/aviation/FASP_details.shtm#system_plan
“FAA Budget Request Balances Current Needs, NextGen,” Aviation Week,
www.aviationweek.com/aftermarket-solutions/faa-budget-request-balances-current-needs-nextgen
Statewide Airfield Pavement Management Program (SAPMP) Update Summary Report -
http://www.dot.state.fl.us/aviation/pavementManagement.shtm
Florida Aviation Project Handbook - http://www.florida-aviation-
database.com/library/filedownload.aspx?guid=3ae1fcca-5581-4a7e-b602-66c4a5edac10
Florida Transportation Plan – www.floridatransportationplan.com
Continuing Florida Aviation System Planning Process – www.cfaspp.com

1 | P a g e
What You Should Know about Florida’s Bridges FDOT has 12,046 structures in its bridge management system; these include conventional bridges and
also culverts (spanning over 20 feet). About 15% of Florida’s bridges are at least 50 years old. The FDOT
is responsible for the maintenance of 6,753 (56%) of the bridges; County governments maintain
3,860 (32%); and cities and towns maintain 1,221 bridges (10%), while others (railroad, parks, etc.)
maintain the remaining 212 bridges. FDOT has the responsibility of inspecting and rating most of the
bridges in Florida. Currently, Florida has 202 structurally deficient bridges (1.7%), over half of which the
counties have ownership and maintenance responsibility. Also, about 8.5% of Florida bridges were
either weight posted or closed as of January 2015.
Condition & Management of Florida’s Bridges
Condition Condition measures the existing physical condition of the bridges. To quantify the overall condition or
health of bridges, the bridge “health index” (HI) tool is utilized. The health index creates a ratio between
the current condition of a bridge and the cost of an element failure, which may include construction
costs as well as user costs due to the loss of service. The health index is presented as a numerical rating
form 1 – 100. The Florida Department of Transportation’s (FDOT) 2015 Bridge Inventory Report includes
the numerical health indices for all bridges in the State inventory. Considering all bridges in the
inventory, the average bridge health index was approximately 87.2. State-owned bridges had an average
health index of 89.8, while the health indices for bridges maintained by Counties, Cities, and Others
were slightly lower (83.2, 85.9, and 83.1, respectively). A health index below 85 generally indicates that
some repairs are needed although it doesn’t mean the bridge is unsafe.
Operation and Maintenance Operation and Maintenance was measured in terms of the time elapsed between consecutive
inspections for each bridge. The operation and maintenance study considered the time between bridge
inspections during the period from November 2007 to January 2015.
Proportion (%) of bridges with an average time between consecutive inspections less than
or equal to 2 years: 65.3%
Proportion (%) of bridges with a maximum time between any two consecutive inspections
less than 4 years: 100%
Considering all bridges in the State of Florida regardless of ownership, the average time between
inspections was 1.77 years, while that for the State-maintained bridges was 1.58 years. Both values are
within the National Bridge Inventory Standards (NBIS) recommended inspection frequency (≤2 years).
For all bridges throughout the state, regardless of ownership, 65.3% were inspected at a frequency of 2
years or less, while 34.7% were inspected at a frequency of more than 2 years, a reduction in frequency
of inspections of 4.2% from the 2012 report card. 80.7% of state-maintained bridges were inspected at a
frequency of 2 years or less, and 19.3% were inspected at a frequency of more than 2 years, an increase

2 | P a g e
in frequency of inspections of 7.5% from the 2012 report card. All bridges throughout the state
conformed to the maximum allowable inspection frequency requirements set forth by the NBIS
(maximum interval between inspections <4 years).
Public Safety Public Safety evaluates the extent to which the public’s safety is jeopardized by the condition of the
infrastructure and what the consequences of failure may be. To evaluate public safety, the following
specific areas were evaluated in terms of the proportion (%) of the state bridge inventory that satisfied
the following criteria:
Structural deficiency, in terms being not structurally deficient (98.3%)
Load posting or closing, in terms of being not posted nor closed to traffic (91.5%)
Structurally Deficient Bridges The FDOT follows the Federal Highway Association (FHWA)’s definition for structurally deficient (SD)
bridges – bridges with a poor condition rating or worse for its deck, superstructure, substructure
component or culvert. In addition, a bridge is considered structurally deficient if it cannot carry its legal
load or is not serviceable during floods.
The FDOT’s 2015 Bridge Inventory Report provides the sufficiency ratings of all structurally deficient
bridges. Currently, Florida has 202 structurally deficient bridges (about 1.7% of the 12,046 bridges
statewide), with 28.7% of these being state-maintained bridges, while over 54.0% of them are
maintained by the counties. Cities and other local agencies maintain the rest (17.3%). Statewide, 133
(65.8%) of the 202 structurally deficient bridges have sufficiency ratings less than 50, while 68 (33.7%)
bridges have ratings between 50 and 80.
Posted and Closed Bridges A bridge may be open to traffic, closed to traffic, or posted for some traffic restriction. Typically, if a
bridge cannot carry applied legal loads, it is necessary to post weight (gross vehicle weights) restrictions.
This inability may be due to some advanced structural deterioration. According to the FHWA, about
1,030 (8.5%) of Florida bridges are either posted or closed as of January 2015. However, these bridges
only represent about 4 million square feet (2.3%) of the total bridge deck area statewide.
Functionally Obsolete Bridges FHWA and FDOT define bridge obsolescence as its inability to satisfy the level of service desired for its
location on the roadway network, including consideration of geometric constraints that affects the flow
of traffic on, or under the bridge. A functionally obsolete (FO) bridge needs to have at least one of the
following five criteria appraised as intolerable: deck geometry; vertical and horizontal under clearances;
approach roadway alignment; structural evaluation; and waterway adequacy. There are currently 1,540
functionally obsolete bridges in Florida, comprising about 12.8% of the total inventory.

3 | P a g e
Funding & Future Needs for Florida’s Bridges
Funding and Future Need Funding implies the availability of monies to repair and maintain the state bridge inventory. Future Need
(Replacement Costs) refers to the level of funding required to replace the bridge inventory to an
acceptable level of service. FDOT’s current 5-year bridge program (2015/2016 – 2019-2020) contains a
budget of $2 Billion funding repair and replacement of existing bridges. FDOT ‘s objective is to ensure
that 90% of department maintained bridges meet standards while keeping all department-maintained
bridges open to the public safe. There are currently 64 of the 6,403 bridges which the state maintains
that are considered structurally deficient and in need of repair. 58 of the 64 bridges are programmed or
have funds set aside for corrective action in the 5-year work program. There are 331 bridges
programed to be repaired and 31 bridges to be replaced which meet 94% of the standard set by the
objective. The FDOT’s operating policy for strength replacement (structurally deficient bridges) is to
program all SD bridges and bridges posted for weight restriction for construction within 6 years of
deficiency identification. FDOT’s policy for economy replacement is to program all bridges needing
structural repair for construction within 9 years of deficiency identification.
Resilience Resilience refers to the overall bridge and transportation system’s capacity to rebound after an event or
protect against significant multi-hazard threats and incidents and the ability to expeditiously recover and
reconstitute critical services with minimum damage to public safety and health, the economy, and
national security. It has been shown through various studies that a bridge failure is most likely to be
caused by an extreme event, such as flooding and scour. Preventative maintenance will help to reduce
the potential for deterioration that leads to bridge failure. Performing failure analysis during design,
coupled with the review of past bridge failures, can help to avoid the need to initiate investigations and
perform forensic engineering after a failure. Improving durability of concrete increases the strength and
service life of bridges. Updates to the American Association of State Highway Transportation Officials
(AASHTO) Bridge Design Specifications include provisions for improving concrete durability by use of
pre-stressed steel to reduce and control cracking, epoxy-coated or galvanized reinforcement, stainless
steel reinforcing bars, sealants and coatings, special concrete additives and curing procedures, in
addition to low permeability concrete. A Geo-synthetic Reinforced Soil - Integrated Bridge System (GRS-
IBS) is an innovation developed and promoted by FHWA’s Center for Accelerating Innovation – Every
Day Counts program. GRS-IBS reduces bridge construction time, and is a low-cost, strong and durable
structure capable of carrying higher than design bridge loads with predicable and reliable performance.
GRS-IBS can help meet the demand for small, single span bridges, which represent almost two-thirds of
all bridges in the country. In Escambia County, GRS-IBS is being constructed at replacement structures at
Ora Drive over an unnamed branch, CR 99A over Boggy Creek and SR 97 over Sandy Hollow Creek.
Innovation Innovation refers to the implementation and strategic use of innovative techniques and delivery
methods. FDOT has implemented the use of new materials and technologies in its bridge construction

4 | P a g e
and repair/rehabilitation program. FDOT integrates new bridge and pavement materials which require
less frequent maintenance and renovation such as High Performance Concrete (HPC) and Carbon Fiber
Reinforced Polymers. HPC can increase the minimum service life of a bridge to 75 years instead of the
standard 50 years. The new concrete mixtures are less permeable to water and more resistant to
environmental degradation. It takes less time to construct bridges and renew infrastructure when
prefabricated bridge elements are used. The I-75 Bridge over the Caloosahatchee River in Ft Myers was
built using pre-fabricated elements to protect vital vegetative and marine habitat along the river banks.
In addition, FDOT’s State Materials Office is a nationally and internationally recognized leader in
materials testing and research. The FDOT has spearheaded research and evaluation of corrosion
behavior on marine structures and experimentation with new materials for corrosion prevention and
corrosion control for over twenty years. Cathodic Protection Systems have been implemented as an
effective, long term corrosion control method on Florida’s bridges. New coating products are currently
being tested in an effort to identify effective materials and practices to make Florida bridges more
durable and reduce life-cycle maintenance costs. “Smart” bridge technology consisting of wireless
sensors mounted on a bridge can measure vibration, strain, temperature and changes in bridge
condition such as steel corrosion and concrete deterioration. Information is then passed to a computer
for analysis allowing continuous monitoring of the bridge’s structural integrity. The new Flagler Bridge
in West Palm Beach, FL was constructed with smart bridge technology. Public Private Partnerships (P3)’s
Design Build (DB) delivery methods have been proven to save 30% of design and construction costs of
the traditional design-bid-build delivery methods. Recent nationally recognized FDOT projects utilizing
DB are the I-4 Ultimate Improvements project in Orlando, the Port of Miami Tunnel and I-595
Improvements project in Miami.
Let’s Raise the Bridges Grade Advance the adoption of FHWA’s Center for Accelerating Innovation - Every Day Counts (EDC)
program initiatives by the implementation of innovative technologies and to shorten project
development and delivery times.
Fund repair and rehabilitative strengthening measures thereby increasing the service life of existing
bridges to bridge the gap between designated need for replacement and budgeted work programs.
Develop a national strategic plan for addressing the nation’s structurally deficient and functionally
obsolete bridges in the upcoming decades, including long-term transportation research in order to
develop more resilient bridges.
Increase investment from all levels of government and the private sector, to repair, improve, and
expand the nation’s highway and bridge systems. Increase annual investment levels for bridge
repair, reconstruction, and renovation by approximately $8 billion annually from all levels of
government, to a total annual funding level of $20.5 billion.

5 | P a g e
Develop performance-based investment strategies which will ensure available resources are
directed to those projects with the highest performance return on investment, and encourage the
use of asset management programs.
Use freight movement efficiency as a measure of the overall surface transportation system’s
performance and contribution to economic strength.
Find Out More FDOT- Transportation Planning, www.dot.state.fl.us/planning
FDOT MAP-21 – Moving Ahead for Progress in the 21st Century – 2014 Performance Report,
www.dot.state.fl.us/planning/performance/MAP-21/MAP-21PerformanceReport.pdf
FDOT – Invitation to Innovation, www.dot.state.fl.us/officeofdesign/innovation
FHWA – Center for Accelerating Innovation, www.fhwa.dot.gov/innovation

1 | P a g e
Cou
rtes
y: IN
TE
RA
Inco
rpor
ated
COASTAL AREAS
What You Should Know about Florida’s Coastal Areas Florida’s economy relies heavily on its beaches, the state’s “invisible” coastal infrastructure that protects
Florida’s communities. Most of the public view beaches as places where they can participate in outdoor
recreational activities. Florida beaches represent its leading tourist destination with about 810 million
“day visits” to its beaches annually. This number more than double the number of “day visits” made
annually to all U.S. National Parks combined. Notably, net tourism benefits equated to about $25 billion
in 2012. However, beaches also provide another significant benefit — reduction of storm damage to
coastal infrastructure and communities — which often goes unnoticed by the beach-going public. As
recently shown along well-managed beaches in New Jersey after Hurricane Sandy, the beach and dune
systems serve as natural barriers to protect upland properties from damage by dampening the effects of
large waves and increased water levels through erosion. In Florida, beaches also contribute to the
environment by, for example, providing nesting habitat for the threatened Loggerhead sea turtles,
which nest in some of the highest densities in the world. Unfortunately, erosion caused by human
activities (such as navigation inlets and coastal development) and natural changes threaten Florida’s
coastal areas. Of the 825 miles of sandy shoreline, the distance from New York City to Jacksonville, FL,
the state designates nearly 50% as critical erosion areas. Furthermore, more than 500 miles (about 61%)
of Florida’s sandy beaches are eroding. Ameliorating this erosion requires managing sediments “in a
manner that maximizes natural and economic efficiencies to contribute to sustainable water resource
projects, environments, and communities.” Many agencies are currently emphasizing "living shorelines,"
natural or nature-based structures (such as oyster shell breakwaters) designed to protect property from
extreme storms and flooding over hard protection measures (such as seawalls). In Florida, these efforts
have generally limited themselves to individual property owners located on inland waterways. The state
of Florida and the U.S. Army Corps of Engineers (USACE) experience shows the most cost-effective,
socially and environmentally suitable way to reduce storm damages and coastal flooding on most open
coast sites occurs through beach nourishment.
Condition & Management of Florida’s Coastal Areas
Capacity The capacity to implement current and future beach nourishment projects pivots on three main issues:
(1) Diminishing offshore sand resources, (2) Environmental constraints, and (3) Political boundaries.
Many years of active beach nourishment in Florida have depleted or severely diminished many
nearshore sand sources. Southeast Florida counties have especially encountered this issue offshore their
shorelines. However, the Florida Department of Environmental Protection (FDEP) and the USACE, the
state and federal agencies generally charged with managing Florida’s coastal areas, are developing and
implementing regional sediment management (RSM) strategies that encourage the use of beach quality
sand from upland dredged material management areas and the maintenance dredging of navigation
inlet and waterway projects as source materials for maintaining or enhancing Florida’s beaches to lessen
reliance on and conserve dwindling offshore sand resources. Similarly, state and local governments have
opted to obtain sand from inland mines to restore small beach projects.

2 | P a g e
Cou
rtes
y: IN
TE
RA
Inco
rpor
ated
COASTAL AREAS
Environmental concerns could impose another constraint on maintaining wide beaches. The presence of
nearshore hardbottom could
limit nourished beaches’
widths and lengths, both
critical to the longevity and
efficiency of beach
nourishment projects.
Permitting agencies generally
require mitigation when
covering this natural resource
or not covering it at all
depending on the nature of
the hardbottom communities,
which provide a variety of
important ecological
functions.
Politics, in the form of “sand wars,” also play a significant role in the capacity of the state to maintain its
coastal areas. While the state of Florida generally recognizes sand located offshore counties in state
waters follow the county lines until reaching the federal, three-mile offshore limit, it does not regulate
sand taken from federal
waters. In these waters, the
federal government currently
does not follow county
political boundaries. Instead,
any public entity may use this
sand resource. This difference
often results in communities
fighting over use of federal
sand resources.
Condition Of the 825 miles of sandy
shoreline, the state
designates 409.9 miles as
critical erosion areas and 93.9
miles as non-critically
eroding. Nearly 61% of
Florida’s sandy beaches
(503.8 miles) are eroding. The
FDEP designates 8.7 miles of

3 | P a g e
Cou
rtes
y: IN
TE
RA
Inco
rpor
ated
COASTAL AREAS
inlet shoreline as critically eroding and 3.2 miles as non-critically eroding. Since 1989, when the FDEP
generated its first list of erosion areas, the miles of critically eroding shorelines have increased by 88%
(217.6 to 409.9 miles). By inference, the erosive threat to upland development, recreational interests,
wildlife habitat and important cultural resources has increased. Florida has 66 coastal barrier inlets in
Florida (21 on the Atlantic coast and 45 on the Gulf coast). Studies have shown that inlets created and
enhanced to provide more direct access to the ocean from inland waterways (for commercial shipping)
are responsible for approximately 80% to 85% of beach erosion on the east coast of Florida (and to a
lesser extent on the west coast of Florida). The FDEP is currently in the process of updating inlet
management plans across the state to ensure they quantify sediments trapped by inlets and identify
bypassing objectives and actions to balance sediment budgets on adjacent beaches.
Operation and Maintenance Beaches and inlets require ongoing maintenance. Beach nourishment represents a means to turn back
time only. Because in most cases the erosion mechanisms still exist, erosion will return the beach to its
original state and continue to erode further. Similarly, inlet dredging accomplishes the same with any
navigation channels through the inlet. As evidenced by higher priorities on RSM practices at federal and
state levels, managing inlets and continued practices of introducing “lost” sand into the beach system
continue to improve.
Small dredging (construction) windows because of environmental resource and wildlife concerns act to
drive construction costs up. In many cases, permitting agencies limit construction to the winter months,
when wave conditions are usually worst (outside of a tropical storm or hurricane) and for example, sea
turtle nesting usually does not occur. This requirement typically shifts more risk to the contractor and
therefore, results in higher dredging costs. The FDEP and USACE, along with their sister environmental
agencies, have recently begun assessing species data to determine if they could relax (i.e., open) the
windows to allow dredging to occur in other seasons as well on a regional basis. Regionalization of
projects also provides an opportunity for separate political entities to work together to share project
costs (to realize cost savings) and create wider and longer beach projects that improve their longevity
and performance.
Public Safety Developed and natural areas within the coastal regions of Florida incur the risk of short-term effects
from extreme events and long term effects associated with systemic anthropogenic and climate
changes. Many coastal areas in Florida are experiencing erosion, which results in increased risk exposure
to storm damage and public safety effects. Developing and applying local and regional beach
management strategies proves essential to decreasing the risk exposure in coastal areas and providing
storm damage reduction benefits. In addition to typical residential development, many key
infrastructure elements in Florida, such as the St. Lucie Power Plant and the Virginia Key Wastewater
Treatment Plant, lie adjacent to the coast. In the case of severe beach erosion, both infrastructure sites
could result in significant public safety issues as well as financial loss. These areas represent two of many
4 | P a g e
Cou
rtes
y: IN
TE
RA
Inco
rpor
ated
COASTAL AREAS
examples throughout Florida directly affected by coastal management strategies and timely
implementation.
Funding & Future Needs for Florida’s Coastal Areas
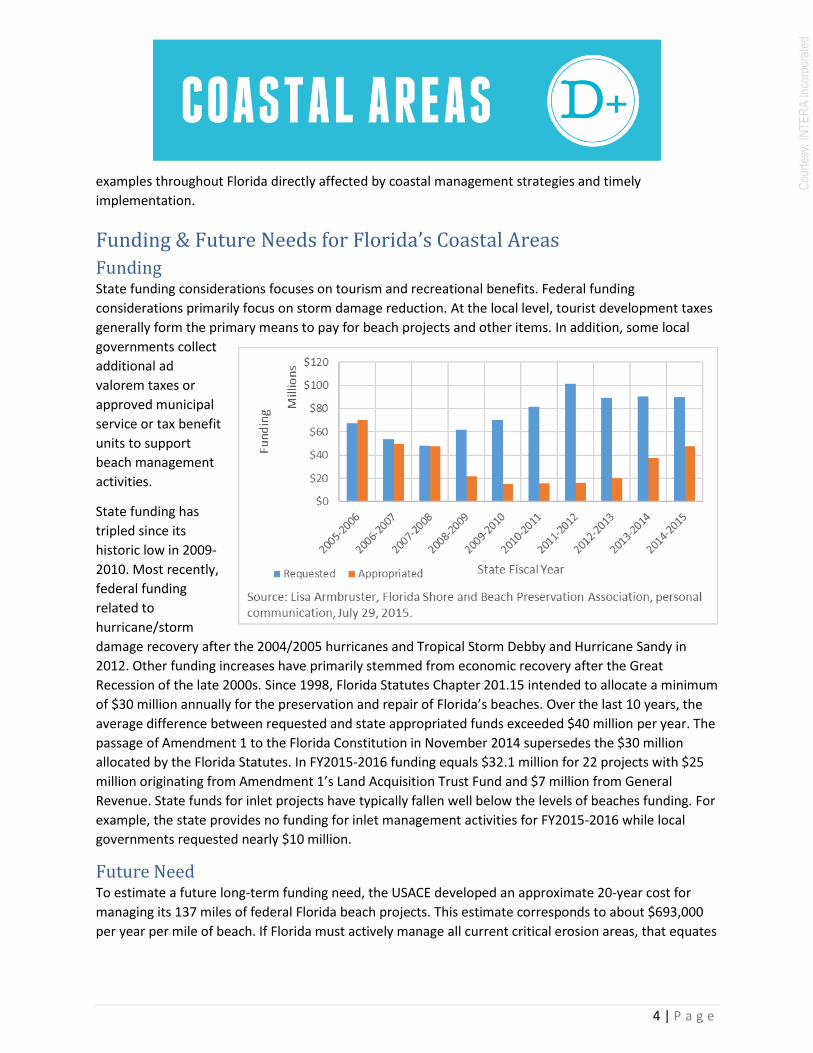
Funding State funding considerations focuses on tourism and recreational benefits. Federal funding
considerations primarily focus on storm damage reduction. At the local level, tourist development taxes
generally form the primary means to pay for beach projects and other items. In addition, some local
governments collect
additional ad
valorem taxes or
approved municipal
service or tax benefit
units to support
beach management
activities.
State funding has
tripled since its
historic low in 2009-
2010. Most recently,
federal funding
related to
hurricane/storm
damage recovery after the 2004/2005 hurricanes and Tropical Storm Debby and Hurricane Sandy in
2012. Other funding increases have primarily stemmed from economic recovery after the Great
Recession of the late 2000s. Since 1998, Florida Statutes Chapter 201.15 intended to allocate a minimum
of $30 million annually for the preservation and repair of Florida’s beaches. Over the last 10 years, the
average difference between requested and state appropriated funds exceeded $40 million per year. The
passage of Amendment 1 to the Florida Constitution in November 2014 supersedes the $30 million
allocated by the Florida Statutes. In FY2015-2016 funding equals $32.1 million for 22 projects with $25
million originating from Amendment 1’s Land Acquisition Trust Fund and $7 million from General
Revenue. State funds for inlet projects have typically fallen well below the levels of beaches funding. For
example, the state provides no funding for inlet management activities for FY2015-2016 while local
governments requested nearly $10 million.
Future Need To estimate a future long-term funding need, the USACE developed an approximate 20-year cost for
managing its 137 miles of federal Florida beach projects. This estimate corresponds to about $693,000
per year per mile of beach. If Florida must actively manage all current critical erosion areas, that equates

5 | P a g e
Cou
rtes
y: IN
TE
RA
Inco
rpor
ated
COASTAL AREAS
to managing 407 miles of shoreline. Applying the above costs per year per mile yields a low 20-year
need of $5.6 billion. Beach and inlet projects are eligible for state funding under Amendment 1.
However, the Land Acquisition Trust Fund does not guarantee any funding for these projects. The FY
2015-2016 allocation represents a one-time appropriation. Federal funding is also unpredictable. Future
federal funding will likely relate to storm recovery efforts. Given these circumstances, local governments
may have to carry a larger financial burden to manage beaches within their communities. Notably,
Florida’s Gulf coast counties will receive funds resulting from the RESTORE Act, which allocates Clean
Water Act administrative and civil penalties paid by parties responsible for the Deepwater Horizon oil
spill in 2012. The five affected Gulf coast states, including Florida, will receive funds to restore and
protect the natural resources, ecosystems, fisheries, marine and wildlife habitats, beaches, coastal
wetlands, and economy of the Gulf coast region. Some of these funds may directly benefit coastal areas
infrastructure.
Resilience Resiliency in Florida’s
coastal areas depends
on the ability to
consistently handle
storm effects and
higher water levels
(short and long term).
Due to significant
coastal development
and associated
infrastructure along
the Florida coast,
maintenance of
beaches, wetlands
and other natural
protective features
proves critical in
limiting risk exposure. Beach nourishment is not highly resilient to short term weather induced impacts;
however, nature may prove resilient to longer term trends if given the opportunity to adapt. The issue
often corresponds with the human footprint, as population growth and development has invaded these
natural systems and limited nature’s ability to recover from extreme events, as well as adapt to
potential long-term changes, such as sea level rise. Therefore, human support is required to maintain
these systems and their ability to protect at a level suitable for the relying infrastructure. Since human
intervention is generally required for the expeditious recovery of a beach and dune system, the
regulatory and funding process to accomplish this task is often the critical path. A holistic, multi-faceted
approach on a regional basis might represent the most ideal means of management; however, it is not
always applied. As result of multiple stakeholders, funding sources, cultural resources, environmental
6 | P a g e
Cou
rtes
y: IN
TE
RA
Inco
rpor
ated
COASTAL AREAS
impacts, and other concerns, the current approach to coastal storm risk management is often a myriad
of individual projects to address independent problems. Recent severe storm impacts along with
expanded research on long-term trends have reinvigorated the topic of coastal resilience, and time will
tell if there is a paradigm shift from reactive to proactive.
Innovation Innovations in Florida’s coastal areas generally revolve around managing sediments within a region in a
sustainable manner. Notably, a recent success story of RSM practices includes a navigation and beach
project involving St. Augustine Inlet in St. Johns County. In 2012, the USACE and St. Johns County
dredged 2.1 million cubic yards from three inlet elements — Porpoise Point area near the inlet, the
inlet’s navigation channel, and a small portion of the inlet’s ebb shoal — to nourish 2.3 miles of critically
eroding St. Augustine Beach. The Porpoise Point and navigation channel dredging served to make the
inlet channel safely navigable while minimizing the amount of sand taken from the ebb shoal, which acts
as a sediment sink that could conceivably adversely affect beaches to the north of inlet.
Together, the USACE and FDEP are also examining nearshore disposal of inlet-trapped sediments that
are too fine for beach placement that otherwise become “lost” from the coastal system. In many cases,
these sediments originate from the ocean but become finer as they move to interior waterways.
Furthermore, the FDEP has periodically evaluated innovative technologies as alternatives to traditional
dredge and fill projects to determine the most effective and less costly techniques for beach
nourishment. While it has not done so since 2008, it has authorized the use of coastal structures to
lengthen intervals between beach nourishments.
Let’s Raise the Coastal Areas Grade Provide for consistent, reliable, and sufficient funding at all levels — federal, state, and local.
Identify, quantify, and implement regional sediment management (RSM) strategies.
Adopt regionalization management approach to constructing and maintaining beaches. RSM
practices has contributed to this approach. Bidding projects together can help spread the
financial burden of maintaining a healthy and protective coastal area.
Improve inlet management. Despite many well-intentioned efforts, sediments still become
captured within flood and ebb shoals and further inland. Implement ways, through for
example nearshore berms, to reintroduce lost sediments into the littoral system that one
cannot place directly on beach.
Reevaluate policies allowing construction seaward of Coastal Construction Control Line.
Strategically acquire coastal lands to protect Florida’s remaining undeveloped coastal lands
and increase the resiliency of Florida’s natural, economic, and social infrastructures.
Consider relocating infrastructure from high risk areas where feasible and/or apply relevant
coastal design conditions.

7 | P a g e
Cou
rtes
y: IN
TE
RA
Inco
rpor
ated
COASTAL AREAS
Find Out More
Florida Department of Environmental Protection Beaches and Coastal Systems
Florida Fish and Wildlife Conservation Commission
Florida Shore and Beach Preservation Association
U.S. Army Corps of Engineers Jacksonville District Civil Works Shore Protection Program
U.S. Army Corps of Engineers North Atlantic Division North Atlantic Coast Comprehensive Study
U.S. Army Corps of Engineers Regional Sediment Management
1 | P a g e
What You Should Know about Florida’s Drinking Water The Florida Department of Environmental Protection (FDEP) currently regulates the operation of 5,275
active public and private drinking (potable) water treatment systems in Florida, which serve the state’s
estimated population of 20.2 million people. Aquifers are the primary source of freshwater for these
drinking water treatment systems. According to FDEP, “90% of this state's [Florida’s] population relies
on these ground water resources [aquifers] for their drinking water. Additionally, over 50% of all other
water needs including agricultural, industry, mining and electric power generation are supplied by
ground water resources. Ground water also serves as the source for Florida’s many springs and provides
a significant input to many of Florida’s lakes and rivers.”
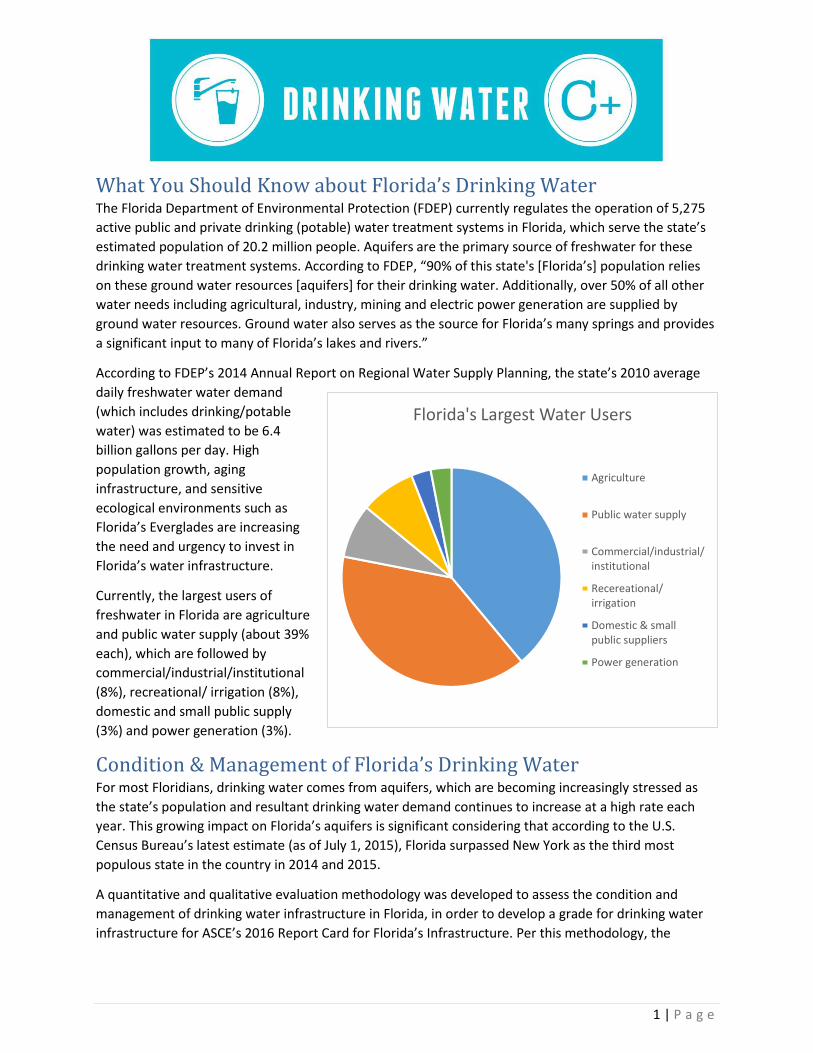
According to FDEP’s 2014 Annual Report on Regional Water Supply Planning, the state’s 2010 average
daily freshwater water demand
(which includes drinking/potable
water) was estimated to be 6.4
billion gallons per day. High
population growth, aging
infrastructure, and sensitive
ecological environments such as
Florida’s Everglades are increasing
the need and urgency to invest in
Florida’s water infrastructure.
Currently, the largest users of
freshwater in Florida are agriculture
and public water supply (about 39%
each), which are followed by
commercial/industrial/institutional
(8%), recreational/ irrigation (8%),
domestic and small public supply
(3%) and power generation (3%).
Condition & Management of Florida’s Drinking Water For most Floridians, drinking water comes from aquifers, which are becoming increasingly stressed as
the state’s population and resultant drinking water demand continues to increase at a high rate each
year. This growing impact on Florida’s aquifers is significant considering that according to the U.S.
Census Bureau’s latest estimate (as of July 1, 2015), Florida surpassed New York as the third most
populous state in the country in 2014 and 2015.
A quantitative and qualitative evaluation methodology was developed to assess the condition and
management of drinking water infrastructure in Florida, in order to develop a grade for drinking water
infrastructure for ASCE’s 2016 Report Card for Florida’s Infrastructure. Per this methodology, the
Florida's Largest Water Users
Agriculture
Public water supply
Commercial/industrial/institutional
Recereational/irrigation
Domestic & smallpublic suppliers
Power generation

2 | P a g e
condition and management of the state’s drinking water infrastructure were evaluated for each of the
following four categories.
Capacity (Level of Service) – Both the near-term (3 to 5 years) and long-term (2025 and beyond)
level of service, which is evaluated by availability of adequate source water, capacity of water supply
facilities, reliability of near-term and long-term water supply and water quality
Condition – The physical condition and age of raw water facilities, water treatment facilities and
distribution system components
Operation & Maintenance (Asset Management) – Reflection of how well the utilities are prepared
to meet their operations and maintenance (O&M) needs, how they will address the retiring
workforce and whether they have an overall asset management plan for the drinking water
infrastructure
Public Safety (Security & Resilience) – The physical security, chemical security and disaster resilience
(extreme weather/disaster survivability and recovery) of critical water infrastructure elements
A survey was developed using a set of criteria for the above categories and was distributed to water
utilities across the state. The completed questionnaires were scored, and an overall grade for the state
was developed by weighting individual utility scores according to the population they serve. The overall
weighted grade of Florida’s drinking water infrastructure is a C+, which is based on individual feedback
received from 6 major drinking water utilities, serving a combined population of approximately 3.1
million people (15.3% of Florida’s estimated population) as well as a review of the published reports and
information listed in the “Find Out More” section of this report.
The findings from this evaluation indicate that Florida’s utilities in general provide a high level of service
to its current customers and are operating safe and resilient facilities. However, asset management and
condition of the infrastructure scored lower. Lower scores in the infrastructure condition category were
due to the significant number of utilities with infrastructure that is older than 30 years as well as the
significant number of unplanned annual service disruptions. Lower scores in the asset management
category were due to the significant number of utilities that inspect less than 20% of their distribution
pipelines annually for leaks as well as a low number of training hours per employee for each utility.
Additionally, capacity of the drinking water infrastructure is considered a looming challenge as the
population of Florida continues to grow.
Funding & Future Needs for Florida’s Drinking Water According to FDEP’s 2014 Annual Report on Regional Water Supply Planning, the demand for freshwater
in Florida, is expected to increase from 6.4 billion gallons per day in 2010, to 7.7 billion gallons per day
by 2030 (a 21% increase). It is also predicted that Florida’s population will grow by more than 25 percent
during this same time period (from 18.8 million in 2010 to 23.6 million in 2030).
3 | P a g e
Figure 1: Estimated Current & Future
Freshwater Demand for Florida
(source: Florida Chamber of Commerce)
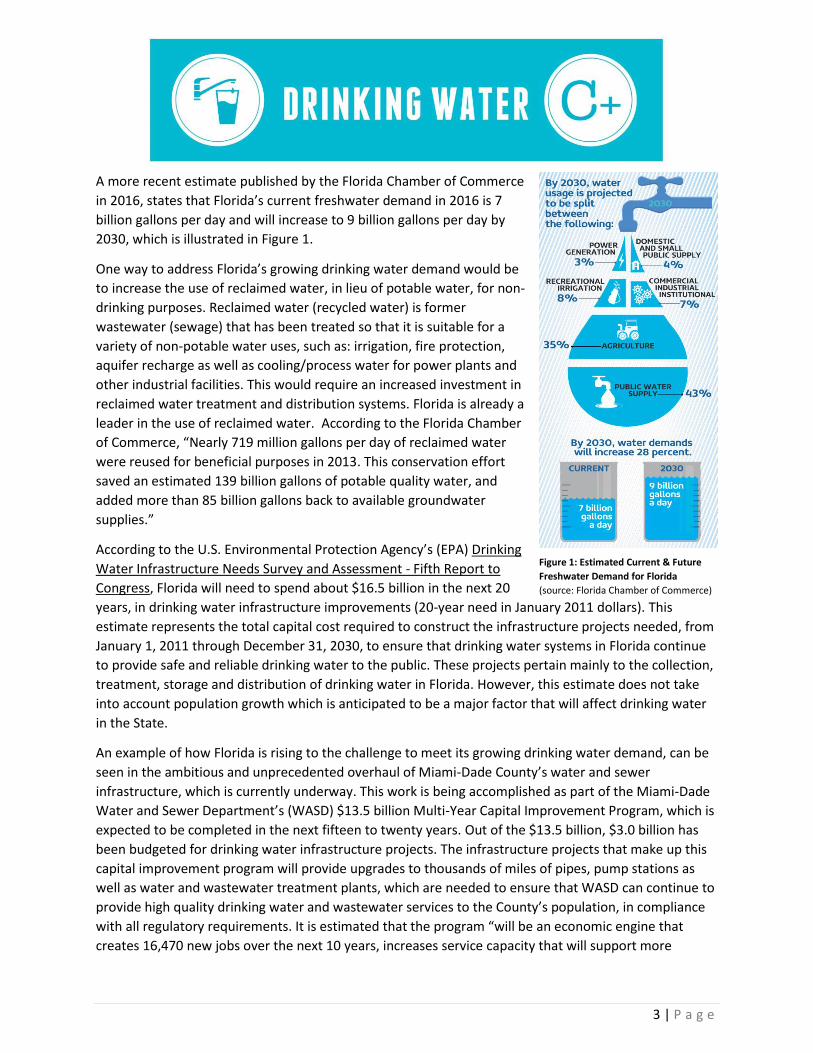
A more recent estimate published by the Florida Chamber of Commerce
in 2016, states that Florida’s current freshwater demand in 2016 is 7
billion gallons per day and will increase to 9 billion gallons per day by
2030, which is illustrated in Figure 1.
One way to address Florida’s growing drinking water demand would be
to increase the use of reclaimed water, in lieu of potable water, for non-
drinking purposes. Reclaimed water (recycled water) is former
wastewater (sewage) that has been treated so that it is suitable for a
variety of non-potable water uses, such as: irrigation, fire protection,
aquifer recharge as well as cooling/process water for power plants and
other industrial facilities. This would require an increased investment in
reclaimed water treatment and distribution systems. Florida is already a
leader in the use of reclaimed water. According to the Florida Chamber
of Commerce, “Nearly 719 million gallons per day of reclaimed water
were reused for beneficial purposes in 2013. This conservation effort
saved an estimated 139 billion gallons of potable quality water, and
added more than 85 billion gallons back to available groundwater
supplies.”
According to the U.S. Environmental Protection Agency’s (EPA) Drinking
Water Infrastructure Needs Survey and Assessment - Fifth Report to
Congress, Florida will need to spend about $16.5 billion in the next 20
years, in drinking water infrastructure improvements (20-year need in January 2011 dollars). This
estimate represents the total capital cost required to construct the infrastructure projects needed, from
January 1, 2011 through December 31, 2030, to ensure that drinking water systems in Florida continue
to provide safe and reliable drinking water to the public. These projects pertain mainly to the collection,
treatment, storage and distribution of drinking water in Florida. However, this estimate does not take
into account population growth which is anticipated to be a major factor that will affect drinking water
in the State.
An example of how Florida is rising to the challenge to meet its growing drinking water demand, can be
seen in the ambitious and unprecedented overhaul of Miami-Dade County’s water and sewer
infrastructure, which is currently underway. This work is being accomplished as part of the Miami-Dade
Water and Sewer Department’s (WASD) $13.5 billion Multi-Year Capital Improvement Program, which is
expected to be completed in the next fifteen to twenty years. Out of the $13.5 billion, $3.0 billion has
been budgeted for drinking water infrastructure projects. The infrastructure projects that make up this
capital improvement program will provide upgrades to thousands of miles of pipes, pump stations as
well as water and wastewater treatment plants, which are needed to ensure that WASD can continue to
provide high quality drinking water and wastewater services to the County’s population, in compliance
with all regulatory requirements. It is estimated that the program “will be an economic engine that
creates 16,470 new jobs over the next 10 years, increases service capacity that will support more

4 | P a g e
businesses to open in the community, improves the reliability and sustainability of the water and sewer
system, as well as generating $24.9 billion in economic output.” WASD is the largest water and sewer
utility in the southeastern region of the country and serves about 2.3 million residents.
Let’s Raise the Drinking Water Grade An immediate investment in Florida’s water infrastructure must be made to ensure that Floridians can
continue to have access to a safe and adequate water supply. The health and welfare of the public, as
well as the economy, depend on it. Florida’s large increase in water demand anticipated as a result of
high population growth will have a major financial impact on the utilities serving Florida residents.
Groundwater resources will no longer be able to support the increased demands. This has already led to
many acrimonious debates and lawsuits among utilities competing for the limited water resources.
Consequently, there will be a growing need to increase conservation and look to alternative sources of
water, such as surface water and brackish water. New treatment technologies will have to be evaluated
and implemented, which will put a tremendous financial burden on the water suppliers. Additionally,
investments should be made in technology implementation and asset management to best maintain and
upkeep these critical assets throughout their useful life.
Find Out More Florida Department of Environmental Protection, 2015 Annual Report on Violations of the U.S. and
Florida Safe Drinking Water Acts in the State of Florida, July 1, 2016.
(http://www.dep.state.fl.us/water/drinkingwater/docs/2015-ACR-Florida.pdf)
Florida Department of Environmental Protection, Drinking Water Database, Basic Facility Report for
All Districts, October 26, 2015. (www.dep.state.fl.us/water/drinkingwater/bfr.htm)
United States Census Bureau Population Estimates
(www.census.gov/popest/data/state/totals/2015/index.html)
Florida Department of Environmental Protection webpage, Ground Water Program description, April
17, 2016.
(www.dep.state.fl.us/water/groundwater/index.htm)
Florida Department of Environmental Protection, “Annual Report on Regional Water Supply
Planning,” 2014. (www.dep.state.fl.us/water/waterpolicy/rwsp.htm)
“Securing Florida’s Water Future,” Florida Chamber of Commerce, 2016.
(www.flchamber.com/wp-content/uploads/Water-Brochure_FINAL_web.pdf)
U.S. Environmental Protection Agency (EPA), Drinking Water Infrastructure Needs Survey and
Assessment, Fifth Report to Congress, April 2013. (https://www.epa.gov/drinkingwatersrf)

5 | P a g e
Miami-Dade Water and Sewer Department Multi-Year Capital Improvement Plan webpage, April 17,
2016. (www.miamidade.gov/water/capital-improvements-plan.asp)

1 | P a g e
What You Should Know about Florida’s Energy Infrastructure The new grade given for Florida’s Energy infrastructure is primarily attributed to three areas;
consumption per capita, production, and pricing. Florida’s consumption per capita is 66% of the national
average and the ranking went from 43rd to 46th nationally indicating that the consumers are becoming
more efficient. Carbon Dioxide emissions from the states’ production facilities have decreased moving
Florida from the 4th largest contributor to the 6th largest contributor. Lastly pricing of electricity has
improved taking Florida to the lower 50% percentile of states across the country.
Florida is a unique state when it comes to energy. Florida ranks top 5 in total energy consumption, this is
primarily due to the hot and humid climate and large tourism industry. The state’s large population
improves the energy consumption per capita rankings. Florida has been making significant
improvements in conservation and energy incentives, which has slowed the demand growth rate since
2008.
Florida’s energy production is far less than its energy demand; this requires the total production to be
supplemented with out-of-state energy. The production of energy primarily comes from electrical
generation with most fuels imported. The electricity production was dominated by natural gas followed
by coal, nuclear and other renewable fuels. Floridians pay more than the national average for natural
gas; however, they pay less than the national average for electricity. Florida has significantly increased
its energy incentive programs five-fold since 2012. Some of the energy incentive programs included
rebate programs for customers who improve efficiency of buildings and equipment, load management,
and for distributed energy resources
Condition & Management of Florida’s Energy Infrastructure
Consumption Based on 2013 data by the U.S. Department of Energy, Energy Information Administration, Florida’s
total energy consumption was third in the nation while its per capita energy consumption is ranked 46
among the 51 states within the U.S. This difference is due to the relatively low energy use by the
industrial sector combined with being the third most populous state in the country. At the same time,
the large population in Florida drives the transportation and residential sectors to lead the State in
energy demand. The Transportation sector is a major user due in part to the tourism industry that
demands transportation fuels such as motor gas and jet fuel, which are imported through Florida’s many
ports. The residential sector creates a large amount of consumption due to the hot and humid weather
that demands energy intensive air conditioning and dehumidification. Since 2008, the electricity
demand growth rate has been less than half its previous 2%. This is expected to continue, allowing more
time and evaluation of additional capacity needs.
Florida energy demand is heavily depended on the energy consumption behavior of residential
customers. Residential customers make up to about 90%of Florida’s electric customers. The residential
consumption dominated by air conditioning (27%) and appliance demands (50%). In recent years the

2 | P a g e
economic conditions have affected Florida population growth and thus reduced significantly the energy
demand forecast. In addition, Florida has increased the standards for appliance efficiency and building
codes, which minimize energy use. Florida homes tend to be newer and smaller which also result in
lower consumption rates per capita.
Energy Transmission Systems The ability to meet energy demand depends on the energy transmission systems and the end-user in
several ways. The transmission systems can be thought of two parts; the first part is how much
electricity utilities can import from the grid. The second part is how much fuel I can transmit from the
fuel production facilities to in-state generation facilities. These two components of transmission drive
Florida’s ability to provide reliable energy to its end users. Many electric utilities are investing significant
funds in repairing and replacing existing electrical transmission and distribution lines. One measurement
of the reliability of the electric distribution system is the Systems Average Interruption Duration Index
(SAIDI). The top three performers in Florida for transmission reliability were Florida Power and Light
(FPL) at 53.8 minutes, TECO at 79.8 minutes, and Florida Municipal Power Agencies (FMPA)
municipalities at 83.5. In the South Atlantic Region, the Average SAIDI is 320 minutes and the national
average is 244 minutes. This indicates Florida’s approach to protecting its electric transmission
infrastructure is successful and is providing positive results. In addition, many utilities are working to
increase their capacity to import electricity from the grid to offset pressures on fuels transmission and
generation.
One challenge that Florida currently faces is gas alert days. The existing gas transmission piping in
Florida does not allow all of the natural gas electric generating units to run on extreme weather days.
This forces utilities to use less economical fuels to supplement the limited natural gas capacity. Florida is
the destination for the newest main-line natural gas transmission called the Sable Trail Transmission line.
The line will originate in Alabama, travel through Georgia, before entering Florida in the north central
part of the state and ending just south of Orlando in Osceola County. The construction is expected to be
complete in early 2017 and will add 266 miles of primarily 36” diameter gas main and 3 new compressor
stations to Florida’s natural gas transmission system. This will provide relief for part of the natural gas
supply problem; however additional upgrades to the pipelines supplying local utility generation facilities
would need to be upgraded to provide the gas flow required on extreme weather days.
Funding & Future Needs for Florida’s Energy Infrastructure
Production Florida’s energy consumption far exceeds the production capabilities within the state. Most of the fuels
are imported in to Florida’s many ports for distribution or also through large scale pipelines such as
those for natural gas. The totally energy profile is dominated by end-used natural gas and electricity.
Florida is working toward building a diverse portfolio of generation types.

3 | P a g e
Renewable Energy Generation Florida is one of the few states that have not enacted a renewable energy standard to encourage the
development of clean energy production. Biomass, ocean currents, offshore wind, and solar are among
the types of viable energy resources Florida can utilize. The Florida Public Service Commission
completed a draft 2008 Renewable Energy Assessment Report to identify renewable energy feasibility in
Florida. The report indicated that the most feasible sources of renewable energy in Florida were from
solar energy sources such as residential rooftop, commercial rooftop, and ground mounted solar system.
Biomass materials, such as agricultural waste products, wood residues, municipal solid waste and
industrial waste heat. Off-shore wind energy with structures in approximately 60 meters of depth or
more show good potential by the year 2020. The most significant challenges to off-shore wind energy
are issues with marine sanctuaries and local opposition. The factors impacting the feasibility of these
renewable energy concepts will be legislation requiring a renewable energy standard, state and federal
energy incentives, and the cost of fossil fuels.
Traditional Energy Generation The traditional energy generation primary fuel has shifted from oil in the early 1970s due to oil prices
increases, natural gas has becoming the chief fuel used in Florida’s electric utilities since the late 1990s.
This trend is expected to continue having natural gas and thus a single fuel source that will supply more
than 50 percent of the fuel used in energy generation. An overdependence in a single fuel leads to
significant risks relating to supply disruptions or price fluctuations. Nuclear energy provides 19 percent
of the electricity that is consumed in Florida. Nuclear energy is efficient and cost-effective because of
stable fuel prices, high plant performance and modernized plants. Use of coal production has declined
due to its price relative to natural gas as well as new emissions regulations. The generation profile of
Florida could drastically change with the implementation of Renewable Portfolio Standards.
Pricing The cost of energy for Florida citizens is ranked 32 and below the National average. The state of Florida
through the Florida Energy and Climate Commission has seen that energy supply and production is of
critical importance for Floridians and has provided that the state implements several renewable energy
incentives.
Fuel price forecast plays an important role in the planning of energy generation facility development and
expansion. The cost differential between natural gas and refined petroleum products are still significant.
Natural gas requires pipelines for transportation where the other fuels can be transported by different
mode of transportation including ground and waterborne transportation. Florida has the third highest
cost of natural gas in the US.
Energy Incentive Programs The Florida utilities budgeted over $550 million dollars for energy efficiency and load management
programs in 2014. The state of Florida compared to states of similar Gross State Product (GSP) is
competitive in its energy incentive programs.

4 | P a g e
Let’s Raise the Energy Grade Create incentives to promote energy conservation and the concurrent development and
installation of a diversified energy mix including highly efficient coal, natural gas, nuclear,
and renewable (solar, wind, hydro, biomass, and geothermal) energy.
Adopt a state energy policy that anticipates and adapts to future energy needs and
promotes the development of sustainable energy sources, while increasing the efficiency of
energy use, promoting conservation, and decreasing dependence on fossil fuels as sources
are depleted.
Continue research to improve and enhance the nation’s transmission and generation
infrastructure as well as the deployment of technologies such as smart grid, real-time
forecasting for transmission capacity, and sustainable energy generation which provide a
reasonable return on investment.
Continue to assess energy infrastructure resilience and how to harden infrastructure for
future events to decrease risks to energy security based on well-developed standards and
guidelines for managing those risks.
Find Out More U.S. Energy Information Administration, State of Florida 2013
www.eia.gov/state/stateenergy-rankings.cfm?keyid=18&orderid=1[February 15, 2016]
Office of Energy Efficiency & Renewable Energy, (2015),
http://energy.gov/eere/femp/energy-incentive-programs-florida
Navigant Consulting, 2008, Florida Renewable Energy Potential Assessment,
www.psc.state.fl.us/Files/PDF/Utilities/Electricgas/RenewableEnergyWorkshops/200812/Pr
esentations/Navigant%20Consulting%20-%20Draft%20Final%20Report.pdf
Sable Trail Transmission, LLC (2013), Sable Trail Transmission – Florida,
www.sabaltrailtransmission.com/florida
Berkeley National Laboratory, 2008, Tracking the Reliability of the US Power System: An
Assessment of Publicly Available Information Reported to State Public Utility Commissions.
Anderson, Jeannine, (July 2015), In Florida, Public Power Utilities Shine on Reliability, FMPA
Report Shows. Public Power Daily,

1 | P a g e
What You Should Know about Florida’s Ports The State of Florida has 15 public seaports on the Atlantic and Caribbean seaboards and on the Gulf of
Mexico. The ports (Port Canaveral, Port Citrus, Port Everglades, Port Fernadina, Port of Fort Pierce, Port
of Jacksonville, Port of Key West, Port of Manatee, Port Miami, Port of Palm Beach, Port of Panama, Port
of Pensacola, Port of St. Joe, Port of St. Petersburg, and Port of Tampa) are managed by local
government entities (municipalities, counties).
Florida’s seaports generate more than 680,000 direct and indirect jobs and contribute $96 billion in
economic value to the state through cargo and cruise activities. Florida maritime activities account for
approximately 13 percent of Florida’s Gross Domestic Product while contributing $2.4 billion in state
and local taxes. Cruise industry activities affect virtually every industry in the country and the state,
alone generating 130,000 jobs and $5.8 billion in wages for Florida workers.
A re-alignment of global trade routes is clearly underway, and Florida ports are strategically positioned
to take maximum advantage of this opportunity. Florida’s goal is to invest in its port infrastructure,
improve the business climate, and above all, seize the opportunity to become a global hub, capturing an
even larger share of international trade and related commercial activities.
Florida’s Seaports were graded overall as a ‘C’ for the 2012 ASCE Report Card. Since then, Florida’s
Seaports have received significant capacity and operational improvements, and the cargo and passenger
operations have continued to improve overall. The investments made since 2012 are improving capacity
to handle larger Post-Panamax vessels (cranes and channel depths), improve cargo/intermodal transfer
efficiency, and enhance the cruise experience for millions of passengers. For these reasons, the grade
overall for Florida’s Seaports has improved to a B-.
Condition & Management of Florida’s Ports Florida’s ports are world leaders for passenger cruises. Florida’s top three cruise ports are also the
world’s top three cruise ports. Florida’s share of national cruise traffic represents 50 percent of the
entire U.S. port cruise traffic. A record 15.6 million passengers were counted at Florida’s seaports in FY
2013/2014, up 10.5% from FY 2012/2013. By FY 2018/2019, 17.8 million passengers are projected.
Florida’s cruise industry is forecasting steady growth with 17.8 million passengers projected by FY
2018/2019, and the industry continues to introduce new generations of cruise ships. Florida still
dominates the industry and will be the homeport for many of the industry’s newest cruise ships. To
continue attracting and serving these larger cruise ships and generating the economic benefits and jobs
this dynamic business sector fosters, Florida’s cruise ports must continue to provide state-of-the art
services and capacity to meet the anticipated demand and industry changes.
Seven of Florida’s ports are now in the top 50 grossing NAFTA container traffic ports. According to the
US DOT Maritime Administration statistics for waterborne foreign container trade data collected at 11
Florida seaports, total twenty-foot equivalent units (TEUs) container traffic has increased at an average

2 | P a g e
annual rate of 3.25% from 1997 to 2014. There is a shift to handling higher value commodities in
general1i. In 2014, cargoes were predominantly containerized cargo and break-bulk, including vehicles,
palletized freight, neo-bulk, and other non- containerized general cargo. There was also a 3.7 percent
increase in TEUs, accompanied by a 0.4 percent increase in container tonnage, representing a noticeable
shift toward lighter containerized products and/or more empties.
Florida’s four largest container ports – Everglades, Jacksonville, Miami and Palm Beach – have
consistently ranked among the top 20 in the nation. These ports, as well as Florida’s other six container
ports are preparing to capture some U.S. West Coast cargo and are projecting substantial increases in
TEU volumes, and non-containerized cargo tonnage, over the next five years. Adequate capital
improvement funding is essential to build and maintain the new capacity Florida’s seaports and their
intermodal partners need now to convert these promising opportunities into tonnage.
Each of Florida’s ports has important projects in the works. Deepening the channels and harbors is
critical for remaining competitive and handling the trend of larger vessels in the world shipping fleet
that require 47- to 50-feet shipping channels. Miami has been dredged to 50 feet. Canaveral, Everglades,
and Jacksonville are in the engineering and permitting stages of deepening their channels. Canaveral is
developing its north side to include new berths and cargo facilities, including post-Panamax ship-to-
shore container cranes. At Everglades, the new Eller Drive Overpass allows the Florida East Coast
Railway to add new rail tracks, which will be able to service a 9,000-linear-foot train for expediting
container movements through the new intermodal container transfer facility. Palm Beach’s
redevelopment of Slip 3 and the surrounding area will improve the efficiency of cargo operations and
help attract roll on/roll off cargo. Tampa’s Hookers Point container projects are adding much-needed
capacity and cranes for Gulf coast carriers serving the fast-growing central Florida market. Almost all of
the cruise ports have maintenance and capacity projects underway. Plans are under way to improve
infrastructure at smaller emerging ports, such as St. Petersburg, Port St. Joe, Citrus, and Fort Pierce.
Funding & Future Needs for Florida’s Ports The ports are funded by a variety of methods including bonds, fees, state and federal grants, leases,
local taxes. The revenues generated by the ports are expended on asset management and capital
development projects. In 1990, the State Legislature created the Florida Seaport Transportation and
Economic Development (FSTED) Program under Chapter 311, Florida Statutes, to finance port
transportation projects on a 50-50 state-local matching basis. Chapter 311 creates a partnership
between the state and its seaports. Ports are public entities, but must function as businesses to fulfill
their public purpose. FSTED accelerated the pace at which our seaports have been able to build the
1 In 2014, the dollar value of international trade through Florida’s air- and sea- ports decreased to $155.8B from $160.5B. However, waterborne cargo value through Florida seaports, which represents 55.7 percent of that total trade, increased 1.1 percent. This 1.1 percent value increase for cargo moving through Florida seaports was accompanied by a slight loss in tonnage, a decrease of 0.7 percent.

3 | P a g e
facilities needed to compete with out of state ports and to sustain and enlarge the state’s share of
international commerce.
Florida has invested $850M over the past five years in port improvements across its 15 seaports. While
more capacity and operational improvements are needed, Florida’s overall seaport competitiveness has
improved in anticipation of the Panama Canal Expansion completion in 2016. For instance, the
completion of a 50-feet deep channel dredge enables Port Miami to accommodate larger TEU Post-
Panamax vessels.
Florida seaports are projecting an overall 17 percent increase in five-year capital spending over plans
prepared two years ago. Cruise terminal developments represent 6.8% of spending. Cargo terminals,
new berths and equipment, such as cranes, represents 20.8% of spending. Channel and harbor
deepening accounts for 37.2% of five-year spending, which indicates commitments to capacity
improvements.
Approximately ten percent of the world fleet consists of container vessels that are capable of
transporting more than 8,000 TEUs. However, more than 50 percent of new vessels on order exceed
8,000 TEU capacity. In order to accommodate these larger vessels, port channels must be 47 feet to 50
feet deep and have larger crane handling capacity. These channel improvements benefit both the cargo
industry, as well as the passenger cruise industry.
Florida’s seaports have programmed nearly $3.7B in capital improvements needed over the next five
years. The five-year planning program through FY 2019/2020 is four percent more than the previous
program that ran through FY 2018/2019. The state’s five busiest seaports by volume (Canaveral,
Everglades, Jacksonville, Miami, and Tampa) account for 95 percent of the capital expenditures. As
major capacity projects in Miami (i.e., Deep Dredge, Tunnel) and Jacksonville (I.e., Blount Island,
intermodal container transfer facility) have completed, Canaveral and Everglades show larger five-year
expenditure plans than in the previous forecast to conduct respective capacity improvements.
Let’s Raise the Ports Grade The continued success, and future grade, of Florida’s seaports depends on multiple factors, including
currency values, trade relations, economic health of the U.S. and its trade partners. However, Florida’s
seaports must continue to improve capacity through channel improvements, crane/cargo handling
equipment, and intermodal transfer capabilities at its major ports. Florida’s cruise ports must continue
to dominate and offer best-in-class cruise experience. The future grade of Florida’s seaports will greatly
depend on the return on investments made in the years following the Panama Canal expansion.
Continue to invest in port infrastructure and channel upgrades that will provide Florida with
the ability to be the first inbound and last outbound port-of-call for import and export
shipments.
Provide necessary state or local incentives to entice import distribution centers and export-
oriented manufacturing companies to locate in Florida.

4 | P a g e
Remove or modify any undue regulatory burdens on Florida’s freight system in order to
increase efficiency in moving trade through Florida seaports.
Streamline the project approval and delivery process at the federal level, so that projects
take years instead of decades.
Continue to use and increase the minimum statutory amount allowable for seaport funding
through the Florida Seaport Transportation and Economic Development (FSTED) Program.
Apply for funding through the FAST Act’s Nationally Significant Freight and Highway Projects
Program, which provides up to $500 million in funding for projects that improve freight
mobility. Florida seaports and other transportation modes are eligible to apply for funding
through this program. The FAST Act also provides $6.3 billion, over five years, to a formula
program. States are eligible to use funds to enhance freight mobility on the national
highway freight network.
Find Out More The Florida System of Seaports, Florida Ports Council, Tallahassee, Florida,
www./flaports.org/about/the-florida-system-of-seaports/
North American Free Trade Agreement (NAFTA) Region Port Cruise Traffic Calendar Year
2013 and 2014, American Association of Port Authorities (AAPA), www.aapa-
ports.org/Industry/content.cfm?ItemNumber=9001 State of Florida Ports 2015, Florida Ports
Council, March 11, 2015, www.flaports.org/2015/04/07/2015sofs
1997 - 2014 U.S. Waterborne Container Trade by U.S. Customs Port (Series), U.S. Dept. of
Transportation Maritime Administration, Released April 9, 2015,
www.marad.dot.gov/resources/data-statistics.
i In 2014, the dollar value of international trade through Florida’s air- and sea- ports decreased to $155.8B from $160.5B. However, waterborne cargo value through Florida seaports, which represents 55.7 percent of that total trade, increased 1.1 percent. This 1.1 percent value increase for cargo moving through Florida seaports was accompanied by a slight loss in tonnage, a decrease of 0.7 percent.

1 | P a g e
Capacity of Florida’s Roads Within Florida’s 65,755 square miles, there are 121,829 public road centerline miles. In 2014, the Florida
Department of Transportation (FDOT) maintained more than 12,000 miles of the state highway system
(SHS); 18% freeways, 42% non-limited access highways and 40% arterial roadways. 42% of FDOT’s
roadways are in rural areas, 37% in cities and just 4% in other urbanized areas. Although this system
consists of 10% of the total public road miles in the state, it carries 54% of Florida's total traffic. The
remaining 90% of roadways are maintained by either expressway authorities, counties or cities.
Florida’s population continues to grow. Over the past 5 years, Florida’s population has grown at a rate of
about 1% per year, adding about 1 million people. This is the equivalent of adding a city the size of
Jacksonville every 5 years. In terms of daily vehicle miles traveled (DVMT), Florida is nearly back up to
the pre-recession high in 2007, and the growth rate is back up to pre-recession levels (over 2%/year).
Since 1984, the number of lane-miles on the SHS have increased by 25%, while the DVMT increased by
84%. County/City road centerline miles increased 30—40% in the same time, while the number of
commuters has more than doubled. In the Orlando area, the number of commuters have grown 3.5
times, since 1984. Florida’s population, and number of visitors, is expected to continue to grow.
Continuing to add capacity on roads alone is not enough. The sustainable solution is to reduce the
demand for roadway capacity be shifting trips to other modes, like walking, biking and transit.
Figure 1 2014 Roadway Performance Summary, Florida DOT

2 | P a g e
Operation and Maintenance of the Existing Highway System Pavement on the state highway system is generally in excellent condition. Ninety-three percent of
pavements met FDOT standards as of 2014. In the past 10 years, overall pavement performance has
improved dramatically.
The Florida Department of Transportation (FDOT) is doing well, by all of its metrics, at maintaining the
existing State Highway System. All measurements of pavement quality and ride are good, and the level
of investment are adequate to sustain their existing roadways. See our Success Stories for more about
how Florida DOT maintains more than 12,000 centerline miles of highways.
Florida’s counties and cities show more mixed results. Local highway budgets suffered during the recent
recession, and maintenance was deferred, although there have been some encouraging signs in recent
years. Some smaller rural counties have only been spending about 10% of what would be required for a
good pavement maintenance program, and even the larger urban counties have been under-funding
their resurfacing programs.
The condition of county roads varies widely around the state. In Orange County, representing Florida’s
more urban counties, 15% of the county-maintained roads were reported to be in a deficient condition.
Lake County, a more rural county, found 46% of roads under their jurisdiction to be deficient.
Meeting the needs of Florida’s Travelers In terms of keeping up with the demand, there are indications that even FDOT has fallen behind the
curve, and the counties and cities have not kept up, in general. Traveler delay and wasted gasoline have
grown significantly, according to estimates by the Texas Transportation Institute’s Urban Mobility
Scorecard. Although Florida’s problems are not the worst in the country, still the levels are
comparatively high, and getting worse. Table 1 shows that, in 2014, Miami ranked highest of Florida
cities in terms of an annual cost of $1,169 for each commuter using an automobile, including 52 hours
sitting in traffic. The total congestion cost for the seven listed cities was $8.75 billion dollars in 2014.
Table 1 Annual Congestion Cost and Travel Delay – 2014
Urban Area Cost per Auto
Commuter Rank
Annual Delay per Auto
Commuter
(Hours) Rank
Total Dollars
(million) Rank
Miami FL $1,169 17 52 24 $4,444 6
Orlando FL $1,044 34 46 27 $1,207 28
Tampa-St. Petersburg FL $907 57 41 45 $1,589 24
Pensacola FL-AL 849 70 38 55 $247 86
Jacksonville FL $842 72 38 55 $659 49
Cape Coral FL $669 88 30 86 $288 79
Sarasota-Bradenton FL $589 92 26 90 $312 75
3 | P a g e
Safety In 2013 the State Safety Office of the Florida Department of Transportation reported 440 crashes
statewide with the “harmful event” type related to roadway conditions. The Insurance Institute for
Highway Safety (IIHS) reported 2,228 fatal crashes in Florida in 2013.
According to the IIHS, in 2014 there were 2,336 fatal motor vehicle crashes in Florida. This resulted in
12.5 deaths per 100,000 people and 1.24 deaths per 100 million vehicle miles traveled. Both of these
rates were higher than the average in the United States. In Florida 65% of motor vehicle deaths in 2014
occurred in urban areas; while 20% were in rural areas however the area type was reported “unknown”
in 15% of Florida crashes.
Based on data available from the Florida Highway Safety and Motor Vehicles Department, in 2015 there
were a total of 374,271 crashes statewide. Of these crashes 159,830 had injuries (43%) and 2,701 had
fatalities (7.2%). Pedestrians and Bicyclists are considered vulnerable users, there were a total of 762
vulnerable user fatalities (2%). Based on the 2015 data, the 5% fatality reduction goal was not met.
The non-profit Smart Growth America in conjunction with other non-profits, such as the American
Association for Retired Persons (AARP) published the Dangerous by Design Report in 2014. This report
evaluates the impact of highway infrastructure to public safety. Pedestrians are the most vulnerable
users of our transportation network. Evaluating pedestrian fatalities provides an insight into the public
safety impact of transportation networks. The Dangerous by Design Report weighs pedestrian fatalities
per capita. In 2014, the top four most dangerous metropolitan areas are all within the State of Florida.
The Orlando, Tampa, Jacksonville and Miami metropolitan areas had between 2.48 to 2.97 pedestrian
fatalities per 100,000 habitants. The next highest down the list is New Orleans, with 2.0 pedestrian
fatalities per 100,000 habitants. The transportation networks in some of Florida’s largest cities are 50%
more dangerous than the next metropolitan area.
Future Need To “bend the curve” to reduce the growth of traveler delay and wasted fuel in Florida’s major urban
areas, several strategies are recommended:
Selective, targeted capacity improvements in heavily-congested corridors
Demand management strategies, including more modal choices
Policies to promote urban clusters and more internal travel
System management/technology improvements to take full advantage of connected-car
technologies and autonomous vehicles
Funding In the fiscal year 2014 – 2015 the Florida Department of Transportation’s total budget was $8,688
million. The Florida DOT is responsible the following “products”: state roads (including interstate

4 | P a g e
highways) and right-of-way, aviation, transit, rail, intermodal access, ports, safety, bridges and
transportation outreach. $5,817 million was spent on delivering the Department’s products. Two-thirds
was invested in roadway and right of way. In 2014 FDOT estimated that $1 billion was needed to replace
existing infrastructure, about $12 million more than available funding. For the majority of Florida
counties and cities, the funding gap was far greater. Based on data provided by counties responding to a
survey conducted in 2015, an average of $7,500 per mile was available to maintain roadways. Using
average construction costs, this is enough to resurface about 2% of a county’s roadway each year. Put
another way, it would take 50 years to resurface all roads in an average Florida county.
Local governments need to take advantage of the Local Option Gas Tax (LOGT), which are approved by a
majority in the county commission, and are fully in local control. In Florida’s 67 counties, only 23 the
maximum state-authorized 12 cents/gallon LOGT rate (primarily in South Florida, plus a few rural
counties in north-central Florida). Thirty-eight (38) of the counties levy only about half of the allowed
gas taxes (including high-growth Central Florida counties—Orange, Brevard, Seminole, Pinellas,
Hillsborough, Lake, and Sumter). Fully utilizing this revenue stream would allow the counties and cities
to begin to address the backlog of maintenance needs on their existing system, and make needed
capacity improvements on the feeder system to the SHS. The article Let’s Fix Funding, in the Spring 2016
issue of the APWA Florida Reporter, counters myths about investing more in transportation
infrastructure, such as “Citizens don’t support increasing gas taxes to pay for infrastructure
improvements”. Public opinion polling performed in 2015 by University of Central Florida and MetroPlan
Orlando, Figure 2 shows broad support for increasing funding for infrastructure improvements.
Figure 2 Dramatic Change in Funding Preferences
5 | P a g e
The need for a more reliable and robust funding source for transportation infrastructure improvements
has been recognized for some time at the National, state and local levels but that has not always
translated into action. In December 2015, the federal Fixing America’s Surface Transportation (FAST)
Act was passed. The bill provides five years of funding, but did not include any long-term fixes to the
federal Highway Trust Fund’s funding mechanism. The federal Highway Trust Fund is primarily funded by
an 18.4 cent/gallon gas tax. The rate has not been raised since 1993, which effectively means that
inflation has cut the rate by 40%. The fund has been propped up by general fund transfers ($140 billion
since 2008). In Florida, the State gas taxes are only partially indexed to inflation, and the majority of the
tax rates have been level for decades. The rates passed on to the local governments have been
unchanged for decades, while the traffic has grown dramatically.
Resilience For the state of Florida, the importance of resilience in the face of potential natural disasters takes on
special meaning. With 80% of our population living in coastal counties, and much developed land lying
below elevation 10 feet above sea level, Florida is particularly vulnerable to hurricanes. Wind damage
and storm-induced flooding have caused great devastation in past decades, even though the past 10
years has not seen a major storm strike the state. The risk to residences, commercial development, and
infrastructure is greater now than ever. The collective memory of past storms (like Hurricane Andrew in
South Florida) is short, and new development encroaching into low-lying areas continues unabated.
Development patterns and countermeasures have been slow to respond to a changing climate.
Contingency planning and preparation should be ramped up. With the rise in sea level and warming of
offshore waters, the potential for stronger storms is continually growing. The recent storms and flooding
in Charlottesville, South Carolina have demonstrated what likely will become the new norm, with
planning for a 1,000-year event being prudent. Identifying and fortifying vulnerable infrastructure will
greatly improve the recovery process. Lack of imagination is not a good excuse, with the evidence
mounting around us.
Let’s Raise the Highways Grade While there have been some positive developments in the past couple of years, Florida still has a lot of
catching up to do. Our existing roads continue to deteriorate each year while our increasing population,
number of visitors and growing economy demand more capacity. In 2012, the statewide grade in the
Florida Infrastructure Report Card was C for highways. When viewed at the statewide level the situation
has not improved over the past four years because many agencies do not have the revenue they need to
maintain existing roads and add capacity. We can change the equation by:
• All counties taking advantage of potential Local Option Gas Tax revenue sources,
• Implementing new, expanded funding sources at the State and National levels, and
• Implementing a Pavement Management in counties and cities that do not already use one.

6 | P a g e
All of Florida’s roadway maintenance agencies should adopt and use an pavement management plan to
better manage facilities throughout their useful life. When applied to roadways, such a plan will enable
these agencies to:
• Achieve and maintain a state of good repair for transportation assets;
• Reduce the vulnerability and increase the resilience of critical infrastructure to the impacts of
extreme weather and events; and,
• Minimize damage to infrastructure from heavy vehicles.

7 | P a g e
Innovation in Florida’s Highway Infrastructure
I-4 Ultimate Improvements in the Orlando area In 2015 construction began on the “I-4 Ultimate” improvement project through downtown Orlando. This
25-mile project will add “managed lanes” in the median of I-4, as well as upgrading substandard lane
geometrics and outdated interchange configurations that routinely broke down because of inadequate
capacity, to serve the “general-use lanes”. The project has been in the planning & design phase for 20
years, and will be a much-needed upgrade to the primary highway in Orlando, to improve capacity,
operations, safety, and reliability of travel times. Already carrying over 200,000 vehicles/day, the
makeover will involve some significant challenges in maintaining the traffic during construction.
The $2.3 billion project is being delivered through a Public Private Partnership (or P-3, PPP)
contracting/funding mechanism, whereby the contracting team actually operates and maintains the
facility for a 40-year period, a first in Central Florida. The overall project is projected to support 64,000
local jobs, either directly or indirectly.
At the same time, FDOT has initiated an alternative commuter rail service in the I-4 corridor. The SunRail
system is focused primarily on commuters, and makes 18 round-trips per day, mostly during rush hours.
A ride-sharing service is also being promoted, and flex-time promotions are underway, all aimed at
easing the inconvenience during I-4 reconstruction.
The project has enjoyed generally favorable coverage in local media, with most commuters recognizing
that the temporary inconvenience will lead to much-needed improvements on I-4.
Wekiva Parkway in the Orlando area The Parkway will complete the northwest segment of the Beltway around Orlando/Central Florida,
comprised of SR 429 and SR 417, offering efficient alternatives to travel on the heavily-congested
corridors of I-4 and US 441. In 2012, FHWA approved the environmental planning process, granting a
Finding of No Significant Impact (FONSI). In the interim, preliminary alignments were selected and
concepts developed, and preliminary and final design have been completed.
Construction has begun in earnest on the 25-mile, $1.6 billion undertaking. Of the eight sections making
up the corridor, four are under construction, with the first projects expected to be opened to traffic in
mid-2017. The Central Florida Expressway Authority and FDOT District 5 will continue building the
remaining sections in phases, with all construction expected to be complete in 2021. Over 35,000 new
jobs are expected to be created by this massive project, either directly or indirectly.
Authorized in 2004 by the Wekiva Parkway and Protection Act (Chapter 369, Part III, F.S.), this
expressway has been heralded as a shining example for transportation planning through an
environmentally sensitive area. Development of the Wekiva Parkway has included setting aside more
than 3,400 acres of land for conservation. The parkway also will include numerous wildlife bridges, and
will be largely elevated to reduce accidents between vehicles and wildlife. A parallel bicycle trail is part
of the plan.
8 | P a g e
“INVEST in Our Homes for Life” in Orange County Orange County, Florida has seen some recent signs of renewing its capital improvements program,
turning the corner after several years of subsistence funding. The recession of 2008 hit Orange County
hard, with practically all of the local development and the transportation projects going into
hibernation, and even the tourist sector seeing declining revenue.
In the summer of 2015, Mayor Teresa Jacobs announced a major capital initiative, titled “INVEST in Our
Homes for Life”, to dedicate $300 million over a five-year period to infrastructure and other quality of
life projects. The targets of the program are:
Infrastructure, ($200 million for roadway projects)
New public safety facilities,
Vibrant neighborhoods and affordable family housing,
Enhanced recreation opportunities,
Safety improvements for pedestrians, and
Transportation connectivity throughout Orange County.
Outside of the new INVEST program, the Orange County Department of Public Works has managed to
keep a robust program of routine maintenance on its existing roadways during the depths of the
recession. A steady funding program of about $28 million/year has been sustained in the past several
years, with the result that all county-owned arterial roadways have been resurfaced on about a 12-year
cycle, and it shows in the ride quality on county arterials.
Orange County has also raised the level of investment in pedestrian safety and A.D.A. compliance (along
with FDOT’s statewide emphasis). Enhanced pavement striping and signing and rapid-flash pedestrian
crossing beacons are only some of the innovations being implemented as part of the Mayor’s “Walk-
Ride-Thrive” Program. A simplified design and contracting process results in shorter implementation
times. The County and other local agencies are determined to address the poor rating of the Orlando
area for pedestrian and bicycle safety.
Find Out More Multimodal Mobility Performance Measures Source Book, Florida Department of Transportation,
Transportation Statistics Office.
The Future of Pavement Management, Federal Highway Administration Research and Technology,
Focus
Florida Reporter Magazine, American Public Works Association, Spring 2016

1 | P a g e
What You Should Know about Florida’s Schools The State of Florida is home to 2,999 public school buildings. The State Department of Education
conducts yearly tests for aptitude in each of the 67 counties of Florida, while the assessment of facilities
is a bit more cumbersome.
The 2013-2014 Florida Department of Education Funding for Florida Schools Booklet states, that “In
1973 the Florida Legislature enacted the Florida Education Finance Program (FEFP) and established the
state policy on equalized funding to guarantee to each student in the Florida public education system
the availability of programs and services appropriate to his or her educational needs that are
substantially equal to those available to any similar student notwithstanding geographic differences and
varying local economic factors.”
The scope of this report includes the K-12 public schools in the State of Florida. The evaluation is based
upon the basis of condition, level of service, safety and security and asset management.
Condition & Management of Florida’s Schools The average age of Florida’s schools is 29 years, which is 3 years older than reported in the 2012 Report
Card Release. The condition of Florida’s schools was evaluated based on funding requests for
improvements to the following eight categories from a sampling of the 67 school districts:
Roof Replacement/Repair
HVAC replacement or repair
Life Safety Issues
Fire Alarm upgrades
Indoor Air Quality Testing/Asbestos/Mold Issues
Plumbing
Physical Distribution Emergency Generator
Site Security/Fencing/Walks
Florida’s 67 school districts have 2,999 schools with a 2014-2015 student population of over 3.2 million
full time equivalent students. The average annual growth rate of Florida’s student population over the
last 25 years has been 3.91%. The growth of the student population is not uniform across the 67
counties. The most growth is seen in Central Florida’s Lake and Orange County population with rates of
7.53% and 9.07% respectively.
Florida has in place a regular, comprehensive and extensive construction and maintenance program
administered by The Office of Educational Facilities. The mission of the Office is to provide technical
support and information for all issues related to educational facility planning, funding, construction, and
operations throughout Florida’s K-12 Education System. While the program is structured to be effective,
the scale of the work and the available funding is not sufficient to meet the needs.

2 | P a g e
The security and safety elements addressed by the report card included those physical improvements
required to assure student and staff protection from identifiable threats (hurricane shelters) and
environmental threats. Only 42% of the state’s schools are designated hurricane shelters. In light of
recent tragic events, the security and safety of the school population is a growing concern to be
accounted for in Florida’s schools.
Funding & Future Needs for Florida’s Schools Funding for Florida’s schools comes mainly from state and local fund sources. State appropriation rely
almost exclusively on lottery funds at this time to maintain facilities, and county government often rely
on penny sales taxes to provide their substantial local portion. These include Public Education Capital
Outlay (PECO), Effort Index Grant and Classrooms First from Lottery proceeds, penny sales tax revenue,
Classrooms for Kids, other state funds, local property taxes and local bond proceeds. As part of the
SMART (Soundly-Made, Accountable, Reasonable and Thrifty) Schools Act of 1997, the Florida
Legislature established a 20-year capital outlay funding program designed to provide approximately $2
billion in lottery funds to school districts for the construction of permanent classrooms, this funding has
since been shifted due to budget issues for the State. The total outlay in 2013-2014 from the
Educational Enhancement (Lottery Fund) Trust Fund for school enhancement was $413 million. Many
counties in the state benefit from sales tax increases to support school funding. Recently, though, these
tax incentives have not been renewed. Florida has one of the lowest overall tax rates in the country.
Since 1998, Florida voters have passed three amendments to increase education spending. In 1998, an
amendment was passed requiring the state to provide “adequate provision… for a uniform, efficient,
safe, secure and high quality system of free public schools.” Two amendments followed in 2002,
requiring free high-quality pre-kindergarten and mandating the reduction of class sizes, commonly
referred to as “class size reduction.” The Classroom for Kids program requires student class sizes for
core curricula classes by 2005-2006 to the following limits:
18 students in pre-kindergarten through grade 3;
22 students in grades 4 through 8; and
25 students in grades 9 through 12.
A school district may only use Classroom for Kids funds to construct, renovate, remodel, or repair
educational facilities that are in excess of projects identified in a district’s five-year work program
adopted prior to March 15, 2003. The first priority is to increase student station capacity. If a district is in
compliance with class size reduction limits referenced above, the district may use these funds to
renovate, remodel, or repair educational facilities.
Estimating the costs to meet these requirements for educational adequacy is difficult and uncertain;
however, by some estimates it will cost $3 billion per year to construct sufficient classrooms to achieve
the class size reductions required for full implementation. The state appropriation for facilities funding
since the 2008-2009 school year has been $0, declining from $650 million in 2007-2008, indicating a
significant shortfall. Most school districts must make up this shortfall in facilities funding from local sales

3 | P a g e
taxes. The total funding dedicated to facilities funding for the 2015-2016 school year is $3.04 billion, all
devoted to operating costs, which with $0 allocated to facilities funding, shows an 8% decline in funding
from 2008 to 2015.
Uncertainties remain as to the effect lowered county impact fees, total new construction allocations and
deferred maintenance costs will have on Florida’s K-12 schools.
Let’s Raise the Schools Grade Continue local county sale tax increases to support education facilities
Evaluate the security and safety of schools in light of recent tragic events
Continue and increase federal grants for high-poverty, high-need school districts
Improve the safety and security of the state’s educational facilities
Find Out More The Office of Educational Facilities - Florida Inventory of School Houses
2015-2016 Funding for Florida School Districts – Statistical Report – Florida Department
of Education
Education Week-2012 “Quality Counts” report
Public Education Capital Outlay Allocations Summary 2005-2015
2012 Florida Building Code-Public Shelter Design Criteria
State Board of Education 2010-2011, Capital Projects Plan
Florida Department of Education, 2010-2011 Appropriations from the Educational
Enhancement (Lottery) Trust Fund
Florida Department of Education Class Size Implementation Budget
1 | P a g e
What you should know about Florida’s climatic features and how
they relate to Florida’s stormwater systems Climate conditions may be one of Florida’s most important factors when designing stormwater
management systems; although it lies along the same latitude as most of the world’s deserts, it is one of
the wettest states in the country. Florida has a special set of natural hydrologic features that need to be
considered when designing any type stormwater management system. On average, Florida receives 53
inches of rainfall annually. Florida ranks third in the nation for the amount of inland water totaling
3,383 square miles, with inland water bodies such as streams, springs, lakes, wetlands, and rivers.
Florida has a humid, sub-tropical climate with a strong, distinctive climatic cycle. Fall and winter storms
are characterized by their long duration, low to moderate rainfall intensities, and coverage of large land
areas. Late spring and summer rainfall is induced by convective storms in the late afternoon and
evenings. The convective storms associated with Florida summers are induced by the diurnal heating of
the land surface along with the sea breeze. Summer, convective storms have notably high rainfall
intensity, short duration, and cover small areas whereas the winter, frontal storms have a longer
duration, a broader land coverage, and traditionally less intensity than the summer storms.
Topography and soils also play a vital role in managing stormwater within Florida. Florida’s peninsula
region is remarkably flat, with little longitudinal topographic relief. It is covered in sandy soils and
porous substrates; therefore, there is a short residence time for stormwater within the soils. Soil type
plays a crucial role in many aspects of drainage associated with stormwater management. For example,
as a general rule, soils on the Central Ridge are very well drained, whereas soils on the Coastal Ridge
may be poorly or very poorly drained. Myakka Fine Sand is the Official Soil of the State of Florida; it is a
native soil of Florida and is not present in any other state. The Myakka series is a deep, sandy soil which
may be poorly or very poorly drained, depending on which sub-class occurs on site. Myakka Fine Sand is
virtually level, with slopes from 0 to 2%. The seasonal high water table fluctuates for one to four months
of year to a depth of 10-12 inches from the land surface and during the remaining months, the water
table recedes to an average depth of 40 inches. The rainfall patterns and soils are not necessarily
complimentary across the entire state. Low topography, soils, and abundant hydrography create an
inter-connected landscape that is highly sensitive to increased impervious area and pollutants from
runoff. These factors are critical in designing a well-functioning stormwater management system within
Florida.
Florida’s Stormwater systems primarily capture excess rain water and transport it for cleaning or
release. About 1 in every 3 localities have established dedicated stormwater programs. Of the 67
counties and over 410 cities in Florida, the Florida Stormwater Association (FSA) estimates that 165 local
governments reported having an established stormwater program to fund and maintain the
infrastructure, which consists of drainage pipes, stormwater ponds and runoff treatment devices. The
average service area of a stormwater program was 98,250 acres, and average population served was
116,665 people per system.
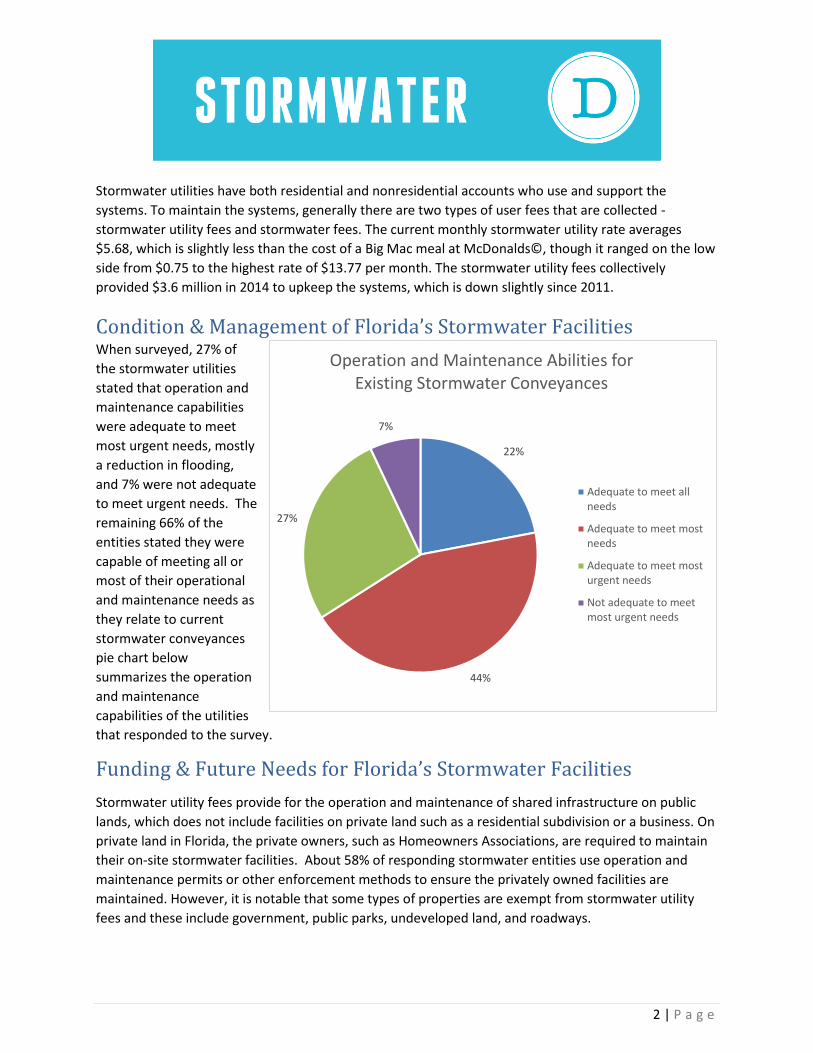
2 | P a g e
Stormwater utilities have both residential and nonresidential accounts who use and support the
systems. To maintain the systems, generally there are two types of user fees that are collected -
stormwater utility fees and stormwater fees. The current monthly stormwater utility rate averages
$5.68, which is slightly less than the cost of a Big Mac meal at McDonalds©, though it ranged on the low
side from $0.75 to the highest rate of $13.77 per month. The stormwater utility fees collectively
provided $3.6 million in 2014 to upkeep the systems, which is down slightly since 2011.
Condition & Management of Florida’s Stormwater Facilities When surveyed, 27% of
the stormwater utilities
stated that operation and
maintenance capabilities
were adequate to meet
most urgent needs, mostly
a reduction in flooding,
and 7% were not adequate
to meet urgent needs. The
remaining 66% of the
entities stated they were
capable of meeting all or
most of their operational
and maintenance needs as
they relate to current
stormwater conveyances
pie chart below
summarizes the operation
and maintenance
capabilities of the utilities
that responded to the survey.
Funding & Future Needs for Florida’s Stormwater Facilities
Stormwater utility fees provide for the operation and maintenance of shared infrastructure on public
lands, which does not include facilities on private land such as a residential subdivision or a business. On
private land in Florida, the private owners, such as Homeowners Associations, are required to maintain
their on-site stormwater facilities. About 58% of responding stormwater entities use operation and
maintenance permits or other enforcement methods to ensure the privately owned facilities are
maintained. However, it is notable that some types of properties are exempt from stormwater utility
fees and these include government, public parks, undeveloped land, and roadways.
22%
44%
27%
7%
Operation and Maintenance Abilities for Existing Stormwater Conveyances
Adequate to meet allneeds
Adequate to meet mostneeds
Adequate to meet mosturgent needs
Not adequate to meetmost urgent needs

3 | P a g e
Stormwater capital construction
programs are funded by stormwater
fee revenue and non-fee funds. Of
the 165 entities, 52% of the
respondents reported only having a
stormwater fee for capital
construction programs, while the
remaining 48% reported the ability to
use stormwater fees and non-fee
funds combined to do capital
projects. The non-fee funds were
identified primarily as “other” at 46%,
ad valorem was 22%, gas tax was
17%, and sales tax was 10%. Of the
jurisdictions that charge stormwater
fees separate from the stormwater
utility fee, 72% responded the funds collected are not directly received by the stormwater section;
therefore, the funding is not dedicated or necessarily going directly to stormwater infrastructure,
instead the monies received go into the “general fund” for the government entity.
To manage their assets, a majority of respondents have adopted a stormwater master plan, but about
20% report having no master plan in place. Of those that have adopted a stormwater master plan, 67%
of the stormwater entities make an effort to coordinate their stormwater master plan with their Local
Government Comprehensive Plan and National Pollution Discharge Elimination Systems (NPDES).
However, 29% stated they made a moderate effort and 4% made no effort to coordinate with other
programs. In addition to master plans, stormwater infrastructure maintenance and inspection relies on
having qualified employees. The average number of full-time staff funded with stormwater fee revenue
is about 17, which was down from 23 in 2011. Only about 75% of these employees have received formal
training or certification to perform their duties.
More than half of Florida’s stormwater entities revealed an inability to address all capital improvement
needs. Surveys (see pie chart on next page) revealed that stormwater entities identified 33% of capital
improvement needs were not adequate to meet “urgent” needs, and an additional 33% were only
adequate to meet “most urgent” needs but not “most” needs. Florida’s capital improvement needs for
stormwater management are estimated to be $1.2 billion over the next five years (2014-2019). The
average need per stormwater entity will be approximately $14 million by 2019. Over the next decade,
the capital improvement needs for stormwater management will more than double to $2.8 billion, and
long-term planning for each stormwater entity would
require $41 million per entity. The table at right
summarizes the outlook estimates for the next 5 and
10 years.
Period of Time
Estimated Need
# of Respondents
Next 5 years 1.2 Billion 81
Next 10 years 2.8 Billion 68
9%
25%
33%
33%
Evaluation of Municipalities (in)Ability to Fund Critical Capital Improvement
Projects
Adequate to meet allneeds
Adequate to meetmost needs
Adequate to meetmost urgent needs
Not adequate to meeturgent needs

4 | P a g e
Stormwater by the Numbers 87% of stormwater programs are city-only
76% of stormwater programs utilize impervious area
75% of stormwater programs generate revenue via user fee
61% of stormwater programs are combined with the Department of Public Works
56% of stormwater programs have mapped and inventoried all of their stormwater
management facilities
Let’s Raise the Stormwater Grade Increase education geared toward public acceptance and understanding of stormwater and the
role it plays in the development process as well as how vital stormwater treatment is needed in
order to protect receiving water bodies.
Increase funding to stormwater programs to address current capacity issues, National Pollution
Discharge Elimination System permit compliance, Total Maximum Daily Load compliance, and
future needs of the municipality.
Organize a comprehensive information survey for the state’s stormwater needs; a survey could
be conducted to by the State, associations, or private entities to assess the needs and
operations of Florida’s stormwater facilities.
Find Out More Florida Stormwater Association, 2014 Stormwater Utilities Survey,
www.fsa.memberclicks.net/assets/MemberServices/Survey-of-SWU/2014%20fsasurvey2.pdf
U.S. EPA, National Pollutant Discharge Elimination System, www.epa.gov/npdes/npdes-
stormwater-program
Rankin, Laura K., "Evaluation of Low-Cost Low Impact Development Practices in Southwest
Florida for the Control of Urban Runoff" (2015). Graduate Theses and Dissertations.
http://scholarcommons.usf.edu/etd/6019

1 | P a g e
What You Should Know about Florida’s Transit Transit is the public transportation of people by bus, paratransit, light rail, commuter rail, subways,
waterborne service, or high-speed rail. Florida’s transit includes Tri-Rail, SunRail, as well as the many bus
services. The transit grade reflects the state of the system and the level of transit investment. Florida
needs to develop, connect, and invest to raise this grade. Investing in a well-connected, high quality
transit system pays dividends in both housing and transport affordability.
Condition & Management of Florida’s Transit Only 2% of Florida journeys to work were made by public transit last year. In comparison, this is behind
the states of Georgia (2%), California (5%), and New York (28%). However, Florida transit availability was
still able to rank 22nd out of 52 states and districts. The condition of Florida transit, when ranked against
other states based on average transit vehicle age, has its highest ranking at 19th out of 53. The average
vehicle age in Florida was 5.6 years, but was still behind the states of Georgia (5.5 years) and the leader
Rhode Island (3.3 years). These availability and condition rankings show Florida is doing better than
most.
Florida transit productivity was ranked based on passenger miles per vehicle revenue miles. It should be
noted that not all transit agencies reported passenger miles and so this metric could only be applied to
the available data. Florida reported 5.44 passenger miles per vehicle revenue mile, which was behind
the states of Georgia (7.38), California (9.21), and New York (18.04). Florida transit productivity ranked
30th out of 51, coming in at the 41.2 percentile.
Funding & Future Needs for Florida’s Transit Florida transit funding was ranked based on funding from all sources and was controlled for population.
Florida transit funding was approximately $66.17 per person in 2013, ahead of Georgia ($63.38 per
person) but behind states like California ($159.12 per person) and New York ($688.79 per capita). Florida
transit funding ranked 22nd out of 53 but could improve it’s standing to 10th in the nation by investing
an additional $1.3 billion per year, or 14% of the states almost $9 billion annual transportation spending.
Florida transit usage was approximately 29 boardings per Floridian in 2013, and in comparison, Georgia
had 32 boardings per capita. Florida usage ranked 20th out of 53 entities reporting to the Federal Transit
Administration.
Let’s Raise the Transit Grade Transit is a critical component of Florida’s transportation infrastructure and one that will need
increasing focus as the population continues to grow. Transit supports resource efficiency, social equity,
sustainable urban development, and reduces traffic congestion. Transit is also a more efficient use of
public road space; forty people travelling in a bus occupy 60 feet of road space compared to 1,000 feet if

2 | P a g e
they were all driving individually. New developments in ridesharing, car-sharing, and mapping
smartphone applications are making transit use and living without a car much more convenient.
Florida has the ability to become a leader in transit by taking three steps: Develop, Connect, and Invest.
Develop walkability with new urbanism; also retrofit the suburbs to enhance walking and cycling
connectivity to transit stops. This will improve transit usage.
Connect regional rail, commuter rail, and local transit. Connected transit networks support
greater availability and productivity.
Invest in transit projects that improve quality of life, social equity and, combined with housing ,
transport affordability. Investing an additional $70 per person ($1.37 billion) could make
Florida’s entire transit system one of the best in the country. By comparison, Florida is planning
to spend $4.27 billion per year on roads.
The American Public Transportation Association estimated personal savings of over $9,000 per year to
Americans who forgo car ownership to take transit. The challenge is that these dividends can only be
obtained when governments invest tax dollars towards the goal of improving quality of life through
transit mobility. The SunRail Commuter Rail project in central Florida is a great example of positive
investment and meaningful improvement in Florida transit, but there are plenty more opportunities!
Find Out More American Community Survey, 2014, Table B08301, accessed Oct. 10, 2015 at
factfinder.census.gov
National Transit Database, 2013, Table 1 Summary of Operating Funds Applied, Table 19 Transit
Operating Stats, & Table 25 RVI Age Distribution, accessed Oct. 10, 2015 at
www.ntdprogram.gov/ntdprogram/pubs/dt/2013/excel/DataTables.htm
U.S. Census Bureau, 2014 Population Estimates, accessed Oct. 10, 2015 at
factfinder.census.gov/faces/tableservices/jsf/pages/productview.xhtml?pid=PEP_2014_PEPANN
RES&src=pt
American Public Transit Association, Press release August 20, 2015, accessed July 8, 2016 at
http://www.apta.com/mediacenter/pressreleases/2016/Pages/160324_Transit-Savings.aspx

1 | P a g e
What You Should Know about Florida’s Wastewater There are over 3,700 wastewater treatment facilities in Florida. One-third of Florida’s population is
served by on-site sewage treatment systems (septic tanks) that are the responsibility of individual
owners, and there are over 1,900 impaired water body segments throughout the State. While Florida is
a national leader in reclaimed water use, which helped offset potable water needs and is a vital
component of water resource and ecosystem management, population growth, aging infrastructure,
and sensitive ecological environments are increasing the need to invest in Florida’s wastewater
infrastructure.
Condition & Management of Florida’s Wastewater An objective and qualitative infrastructure evaluation methodology was developed to address the
diverse set of factors impacting the wastewater infrastructure in Florida. Four fundamental categories of
wastewater infrastructure were evaluated and scored in the development of Report Card grades.
Capacity (Level of Service) – The capacity of wastewater collection systems, wastewater
treatment facilities and reclaimed water systems as compared to their short-term (3 to 5
years) and long-term (2025 and beyond) levels of service, including operation and
maintenance.
Condition – The physical condition of the wastewater collection system, wastewater
treatment facilities and reclaimed water system infrastructure components.
Operation and Maintenance (Asset Management) – Reflection of how well the utilities are
prepared to meet their operations and maintenance (O&M) needs, how they will address
the retiring workforce and whether they have an overall asset management plan for the
wastewater infrastructure.
Public Safety – The physical security, chemical security and the extreme weather
survivability of critical wastewater infrastructure elements.
Florida’s wastewater system is increasing in age and the condition of installed treatment and
conveyance systems is declining. As infrastructure degrades, Florida utilities are increasing their
emphasis on asset management systems to maintain reliable service to their customers. However, the
wastewater industry continues to earn high marks for safety.
Funding & Future Needs for Florida’s Wastewater According to the U.S. Environmental Protection Agency (EPA), the total needs in Florida’s wastewater
infrastructure increased from $12.7 billion in 2004 to $17.1 billion in 2008 to 18.4 billion in 2012. The
state’s wastewater needs are large, and in many locations, local funding sources cannot meet this
challenge alone. Because waters are not limited by regional or national boundaries, clean and safe water
is no less a national priority than defense, interstate highways and aviation systems. However,

2 | P a g e
wastewater infrastructure generally does not have the dedicated, long-term sources of federal funding
that others do.
If Florida fails to meet increasing investment needs in next two decades, it risks reversing the public
health, environmental, and economic gains of the past three decades since the enactment of the 1972
Clean Water Act.
Let’s Raise the Wastewater Grade An immediate investment in the state’s wastewater infrastructure must be made to ensure that
Floridians vital water resources and unique ecosystems are protected. ASCE strongly supports
enactment of a federal and state wastewater infrastructure trust fund act that would provide a reliable
source of federal and state funding to maintain and improve existing facilities and build the wastewater
infrastructures for Florida’s future. The health and welfare of the public, as well as the economy, depend
on it. While Florida’s wastewater infrastructure grade compares favorably with the national grade, the
large increase in population growth will have a major financial impact on the utilities serving Florida
residents. Aging septic systems in environmentally sensitive areas will require significant investment in
wastewater infrastructure. New treatment technologies will have to be evaluated and implemented to
clean up Florida’s impaired waters, which will put a tremendous financial burden on wastewater
utilities.
Find Out More U.S. Environmental Protection Agency (EPA), Clean Watersheds Needs Survey 2008.
http://owpubauthor.epa.gov/scitech/datait/databases/cwns/2008reportdata.cfm
Florida Department of Environmental Protection, General Facts and Statistics about
Wastewater in Florida. http://www.dep.state.fl.us/Water/wastewater/facts.htm
U.S. Environmental Protection Agency (EPA), Clean Watersheds Needs Survey 2012, Florida
Factsheet. www.epa.gov/sites/production/files/2015-10/documents/cwns_fs-fl.pdf

20XX REPORT CARD FOR STATE NAME(S) INFRASTRUCTURE I 2
ASCE FLORIDA SECTION
WWW.FLA-ASCE.ORG
ASCE GOVERNMENT RELATIONS
202/789-7850
WWW.INFRASTRUCTUREREPORTCARD.ORG
ASCE HEADQUARTERS
1801 ALEXANDER BELL DRIVE
RESTON, VA 20191
800/548-2723
WWW.ASCE.ORG