2016 phx east valley economic profile
DESCRIPTION
PHX East Valley is a national initiative led by the East Valley Partnership to advance business and quality of life in the region. Communities in our region are leaders in Arizona economic development and drive business expansion, high-tech job growth, higher wages and innovation.TRANSCRIPT

AVIATION
AEROSPACE
BUSINESS SERVICES
DEFENSE
EDUCATION
ENTERTAINMENT
ENTREPRENEURSHIP
HEALTHCARE
INNOVATION
LIFE SCIENCES
RETAIL
TECHNOLOGY
TOURISM
2016
P H X E A S T V A L L E Y . O R G
PHOENIX SCOTTSDALE
QUEEN CREEK
FOUNTAIN HILLS
Chandler
FORT MCDOWELLYAVAPAI NATION
SALT RIVERPIMA-MARICOPA
INDIAN COMMUNITY
GOLDCANYON
FLORENCE
SUN LAKES
GUADALUPE
AHWATUKEE
GILA RIVERINDIAN COMMUNITY
MARICOPA
SAN TAN VALLEY
NOTE: MAP NOT TO SCALE
LOOP
101
HWY
87
LOOP
20210
10
17
US
60APACHE JUNCTION
24
OVERVIEW
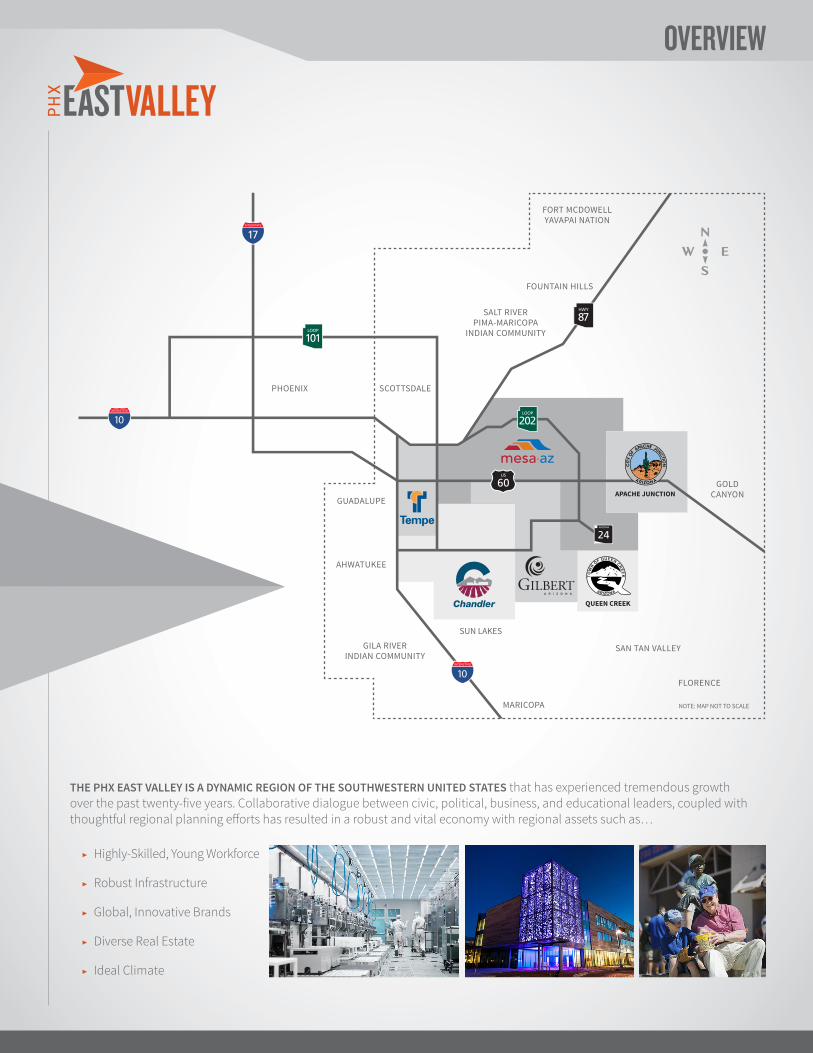
THE PHX EAST VALLEY IS A DYNAMIC REGION OF THE SOUTHWESTERN UNITED STATES that has experienced tremendous growth over the past twenty-five years. Collaborative dialogue between civic, political, business, and educational leaders, coupled with thoughtful regional planning efforts has resulted in a robust and vital economy with regional assets such as…
▶ Highly-Skilled, Young Workforce
▶ Robust Infrastructure
▶ Global, Innovative Brands
▶ Diverse Real Estate
▶ Ideal Climate
TH
RE
E
Chandler
TEMPE: 161,722MESA: 323,187CHANDLER: 159,240GILBERT: 102,575
20
16
PH
OE
NIX
EA
ST
VA
LL
EY
PR
OF
ILE
PH
XE
AS
TV
AL
LE
Y.O
RG
3
TRANSPORTATION / OTHER
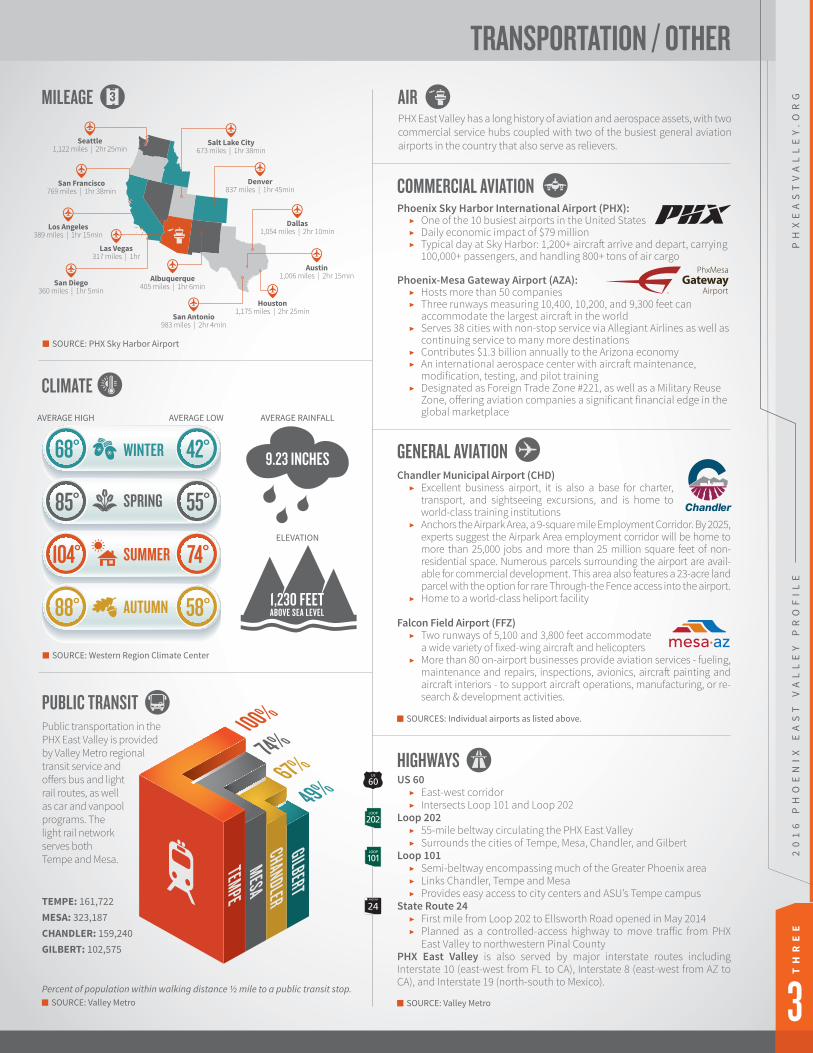
SOURCE: PHX Sky Harbor Airport
SOURCE: Western Region Climate Center
SOURCE: Valley Metro SOURCE: Valley Metro
SOURCES: Individual airports as listed above.
AVERAGE HIGH AVERAGE LOW
San Diego360 miles | 1hr 5min
Las Vegas317 miles | 1hr
PHX East Valley has a long history of aviation and aerospace assets, with two commercial service hubs coupled with two of the busiest general aviation airports in the country that also serve as relievers.
Public transportation in the PHX East Valley is provided by Valley Metro regional transit service and offers bus and light rail routes, as well as car and vanpool programs. The light rail network serves both Tempe and Mesa.
US 60 ▶ East-west corridor ▶ Intersects Loop 101 and Loop 202
Loop 202 ▶ 55-mile beltway circulating the PHX East Valley ▶ Surrounds the cities of Tempe, Mesa, Chandler, and Gilbert
Loop 101 ▶ Semi-beltway encompassing much of the Greater Phoenix area ▶ Links Chandler, Tempe and Mesa ▶ Provides easy access to city centers and ASU’s Tempe campus
State Route 24 ▶ First mile from Loop 202 to Ellsworth Road opened in May 2014 ▶ Planned as a controlled-access highway to move traffic from PHX
East Valley to northwestern Pinal CountyPHX East Valley is also served by major interstate routes including Interstate 10 (east-west from FL to CA), Interstate 8 (east-west from AZ to CA), and Interstate 19 (north-south to Mexico).
Phoenix Sky Harbor International Airport (PHX): ▶ One of the 10 busiest airports in the United States ▶ Daily economic impact of $79 million ▶ Typical day at Sky Harbor: 1,200+ aircraft arrive and depart, carrying
100,000+ passengers, and handling 800+ tons of air cargo
Phoenix-Mesa Gateway Airport (AZA): ▶ Hosts more than 50 companies ▶ Three runways measuring 10,400, 10,200, and 9,300 feet can
accommodate the largest aircraft in the world ▶ Serves 38 cities with non-stop service via Allegiant Airlines as well as
continuing service to many more destinations ▶ Contributes $1.3 billion annually to the Arizona economy ▶ An international aerospace center with aircraft maintenance,
modification, testing, and pilot training ▶ Designated as Foreign Trade Zone #221, as well as a Military Reuse
Zone, offering aviation companies a significant financial edge in the global marketplace
Chandler Municipal Airport (CHD) ▶ Excellent business airport, it is also a base for charter,
transport, and sightseeing excursions, and is home to world-class training institutions
▶ Anchors the Airpark Area, a 9-square mile Employment Corridor. By 2025, experts suggest the Airpark Area employment corridor will be home to more than 25,000 jobs and more than 25 million square feet of non-residential space. Numerous parcels surrounding the airport are avail-able for commercial development. This area also features a 23-acre land parcel with the option for rare Through-the Fence access into the airport.
▶ Home to a world-class heliport facility
Falcon Field Airport (FFZ) ▶ Two runways of 5,100 and 3,800 feet accommodate
a wide variety of fixed-wing aircraft and helicopters ▶ More than 80 on-airport businesses provide aviation services - fueling,
maintenance and repairs, inspections, avionics, aircraft painting and aircraft interiors - to support aircraft operations, manufacturing, or re-search & development activities.
AIR
HIGHWAYS
COMMERCIAL AVIATION
GENERAL AVIATION
PUBLIC TRANSIT
MILEAGE
CLIMATE
Seattle1,122 miles | 2hr 25min
San Francisco769 miles | 1hr 38min
Salt Lake City673 miles | 1hr 38min
Denver837 miles | 1hr 45min
Dallas1,054 miles | 2hr 10min
San Antonio983 miles | 2hr 4min
Albuquerque405 miles | 1hr 6min
Los Angeles389 miles | 1hr 15min
Austin1,006 miles | 2hr 15min
Houston1,175 miles | 2hr 25min
WINTER 9.23 INCHES
SPRING
SUMMER
AUTUMN
68°
85°
104°
88°
49%67%
74%100%
42°
55°
74°
58°
AVERAGE RAINFALL
ELEVATION
1,230 FEETABOVE SEA LEVEL
Percent of population within walking distance ½ mile to a public transit stop.
TEMPEMESA
CHANDLERGILBERT
EV ENROLLMENT
EDUCATION
*East Valley ACT data does not include the Town of Gilbert because scores were not available. ACT composite scores reflect overall performance, with scores ranging from 1 to 36.
Arizona State University ▶ Tempe Campus ▶ Polytechnic (Mesa) Campus
Northern Arizona University (NAU) ▶ Extended Campuses located in: Apache
Junction, Communiversity at Queen Creek, Chandler-Gilbert and Mesa
A.T. Still UniversityBenedictine UniversityOttawa University (Chandler/Queen Creek)University of PhoenixUpper Iowa UniversityWestern International UniversityWilkes University
Maricopa Community College District ▶ Chandler-Gilbert Community College ▶ Mesa Community College ▶ Rio Salado College (total online students)
Central Arizona College ▶ Superstition Mountain Campus,
Maricopa and SanTan Centers
46,9243,778
1,635
1,1992134307,3841151,78725
12,53420,84218,269
925 Note: SAT scores range from 600 to 2400, combining test results from three 800-point sections.
Of the more than 23,000 high schools in the nation:
8 of the top 21 high schools in Arizona are in the PHX East Valley.
2 of the top 32 high schools in the United States are in
the PHX East Valley.
SOURCE: ACT.org
SOURCE: College Board
SOURCE: Washington Post
Most recent publicly available enrollment numbers listed.
PUBLIC
AVERAGE SAT SCORES
EAST VALLEY HIGH SCHOOLS
AVERAGE ACT SCORES
PRIVATE
COMMUNITY COLLEGES
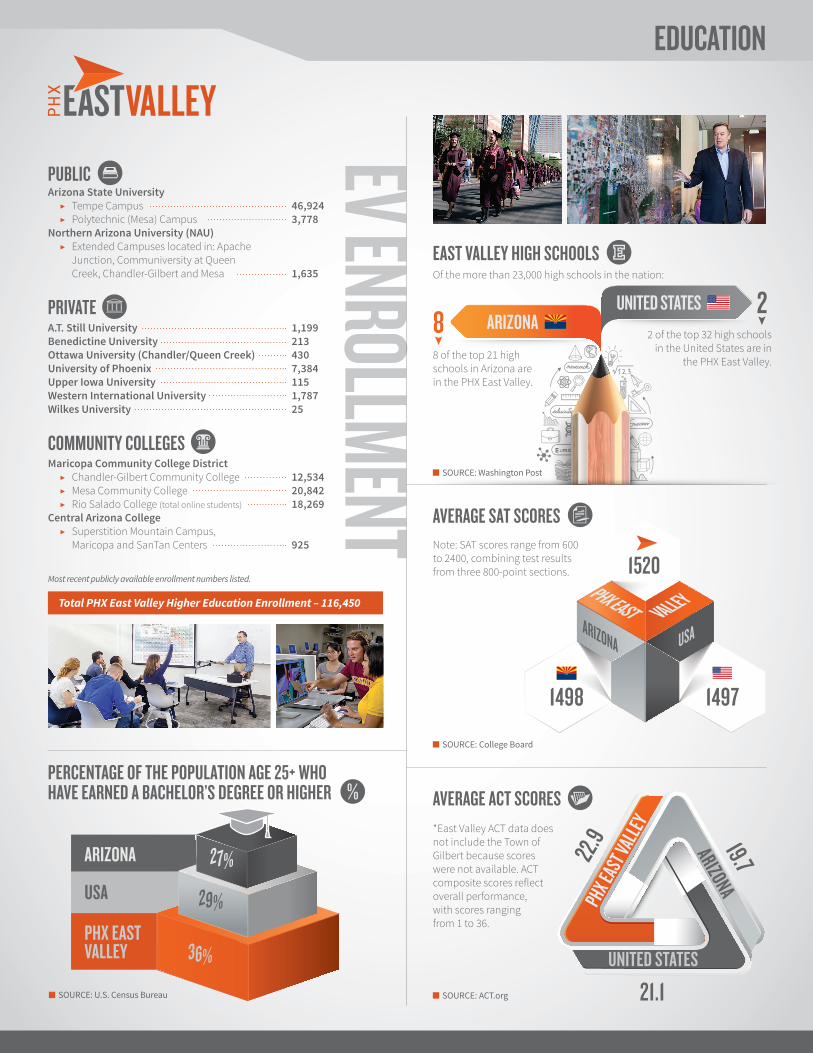
PERCENTAGE OF THE POPULATION AGE 25+ WHO HAVE EARNED A BACHELOR’S DEGREE OR HIGHER
ARIZONA
1520
1498 1497
PHX EAST VALLEY
27%
29%
36%
USA
ARIZONA19.7
UNITED STATES
21.1
PHX E
AST V
ALLE
Y
22.9
ARIZONA USA
PHX EAST VALLEY
%
SOURCE: U.S. Census Bureau
Total PHX East Valley Higher Education Enrollment – 116,450
UNITED STATES8
2ARIZONA
FI
VE
2010
2020
2015
20
16
PH
OE
NIX
EA
ST
VA
LL
EY
PR
OF
ILE
PH
XE
AS
TV
AL
LE
Y.O
RG
5
POPULATION / DEMOGRAPHICS
POPULATION GROWTH
COST OF LIVING
MEDIAN SALES PRICE FOR EXISTING SINGLE FAMILY HOME
MEDIAN HOUSEHOLD INCOME
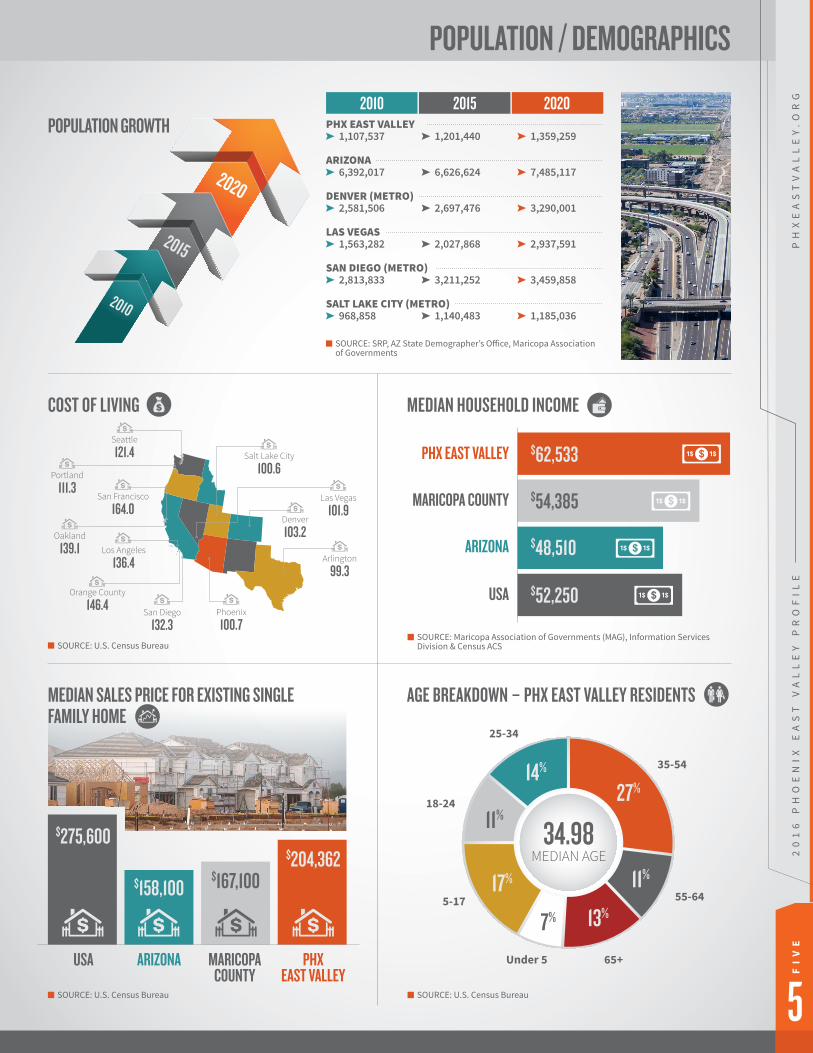
AGE BREAKDOWN – PHX EAST VALLEY RESIDENTS
$275,600
$62,533
$204,362
$52,250
$158,100
$48,510
$167,100
$54,385
ARIZONA
ARIZONA
MARICOPACOUNTY
MARICOPA COUNTY
PHX EAST VALLEY
PHX EAST VALLEY
2010 2015 2020
USA
USA
PHX EAST VALLEY 1,107,537 1,201,440 1,359,259
ARIZONA 6,392,017 6,626,624 7,485,117
DENVER (METRO) 2,581,506 2,697,476 3,290,001
LAS VEGAS 1,563,282 2,027,868 2,937,591
SAN DIEGO (METRO) 2,813,833 3,211,252 3,459,858
SALT LAKE CITY (METRO) 968,858 1,140,483 1,185,036
San Diego
132.3Phoenix
100.7
Arlington
99.3
Las Vegas
101.9San Francisco
164.0
Oakland
139.1
Portland
111.3
Salt Lake City
100.6
Seattle
121.4
Denver
103.2
SOURCE: U.S. Census BureauSOURCE: U.S. Census Bureau
SOURCE: Maricopa Association of Governments (MAG), Information Services Division & Census ACSSOURCE: U.S. Census Bureau
SOURCE: SRP, AZ State Demographer’s Office, Maricopa Association of Governments
Los Angeles
136.4
Orange County
146.4
14%
18-24
35-54
5-17
Under 5 65+
25-34
27%
55-64
34.98MEDIAN AGE
11%
17%
7%
11%
13%
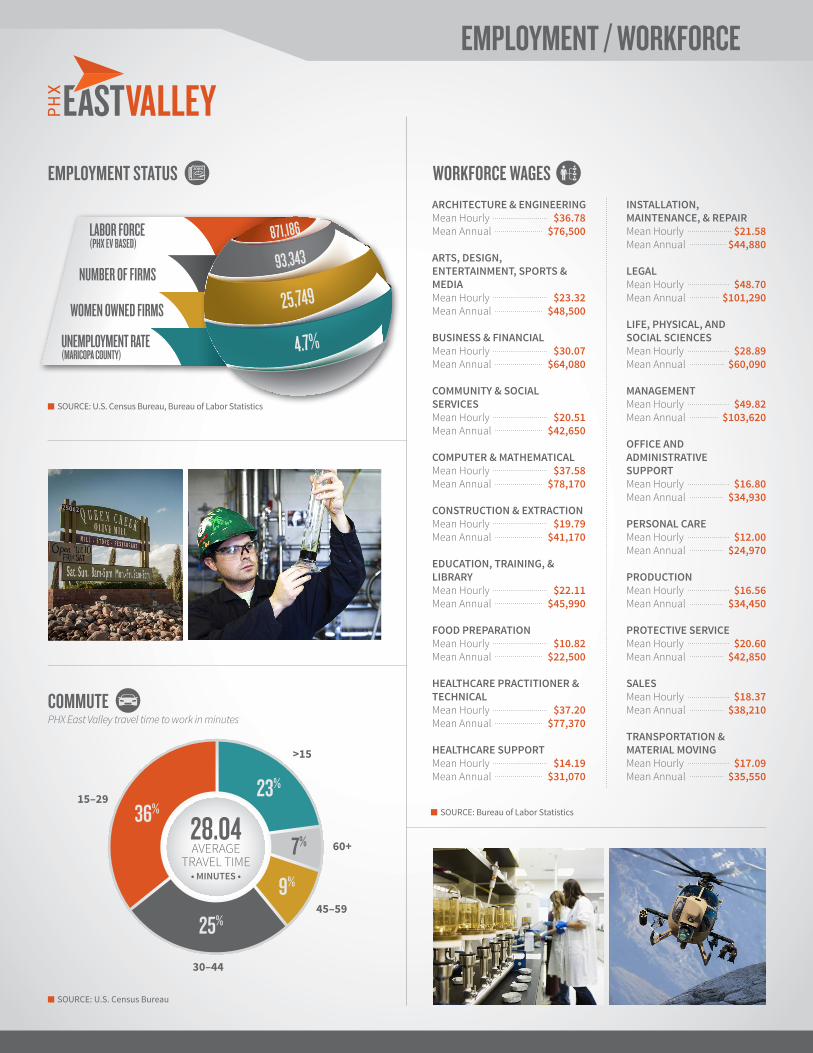
EMPLOYMENT / WORKFORCE
ARCHITECTURE & ENGINEERINGMean HourlyMean Annual
ARTS, DESIGN, ENTERTAINMENT, SPORTS & MEDIAMean HourlyMean Annual
BUSINESS & FINANCIALMean HourlyMean Annual
COMMUNITY & SOCIAL SERVICESMean HourlyMean Annual
COMPUTER & MATHEMATICALMean HourlyMean Annual
CONSTRUCTION & EXTRACTIONMean HourlyMean Annual
EDUCATION, TRAINING, & LIBRARYMean HourlyMean Annual
FOOD PREPARATIONMean HourlyMean Annual
HEALTHCARE PRACTITIONER & TECHNICALMean HourlyMean Annual
HEALTHCARE SUPPORTMean HourlyMean Annual
$36.78
$76,500
$23.32$48,500
$30.07
$64,080
$20.51 $42,650
$37.58$78,170
$19.79$41,170
$22.11$45,990
$10.82$22,500
$37.20$77,370
$14.19$31,070
INSTALLATION, MAINTENANCE, & REPAIRMean HourlyMean Annual
LEGALMean HourlyMean Annual
LIFE, PHYSICAL, AND SOCIAL SCIENCESMean HourlyMean Annual
MANAGEMENTMean HourlyMean Annual
OFFICE ANDADMINISTRATIVE SUPPORTMean HourlyMean Annual
PERSONAL CAREMean HourlyMean Annual
PRODUCTIONMean HourlyMean Annual
PROTECTIVE SERVICEMean HourlyMean Annual
SALESMean HourlyMean Annual
TRANSPORTATION & MATERIAL MOVINGMean HourlyMean Annual
$21.58$44,880
$48.70$101,290
$28.89$60,090
$49.82$103,620
$16.80$34,930
$12.00$24,970
$16.56$34,450
$20.60$42,850
$18.37$38,210
$17.09$35,550
28.04AVERAGE
TRAVEL TIME• MINUTES •
36%
7%
LABOR FORCE (PHX EV BASED)
UNEMPLOYMENT RATE (MARICOPA COUNTY)
871,186
93,343
25,749
4.7%
NUMBER OF FIRMS
WOMEN OWNED FIRMS
15–29
>15
60+
45–59
30–44
25%
23%
9%
SOURCE: U.S. Census Bureau
SOURCE: U.S. Census Bureau, Bureau of Labor Statistics
SOURCE: Bureau of Labor Statistics
EMPLOYMENT STATUS
COMMUTE
WORKFORCE WAGES
PHX East Valley travel time to work in minutes
SE
VE
N2
01
6 P
HO
EN
IX E
AS
T V
AL
LE
Y P
RO
FIL
EP
HX
EA
ST
VA
LL
EY
.OR
G
7
AppleBridgestoneCrown CastleFirst SolarFreescale SemiconductorFUJIFILMGarminGM Arizona IT Innovation CenterHoneywellInfineonInfusionsoftIntel Corp.Isola GroupMicrochip TechnologiesMitsubishi Gas ChemicalsTRW
Able EngineeringArmorWorksAZ LabsThe Boeing CompanyCAE – Oxford AviationCessnaChandler AirportEmbraerFalcon FieldGeneral Dynamics C4 SystemsHoneywellLockheed MartinMD HelicoptersNammo TalleyOrbital ATKPegasus AirparkPhoenix-Mesa Gateway AirportStellar Airpark
AvnetBank of AmericaCDWCenturyLinkChase BankEmpire SouthwestFedExGoDaddyGM FinancialInsightNationstar MortgagePayPalState FarmToyota Financial ServicesUPSVerizon WirelessWells Fargo
Apria Healthcare Arizona Nutritional SupplementsAuer PrecisionsBanner Baywood Medical CenterBanner Desert Medical CenterBanner GoldfieldBanner Heart HospitalBanner Ironwood Medical CenterBanner/MD Anderson Cancer CenterCardinal HealthCelebration Stem CellChandler Regional HospitalCVS Health Specialty Pharmacy CenterDaVita RxEast Valley Diagnostic ImagingGilbert HospitalGuided Therapy SystemsHealthwaysIsagenixMercy Gilbert HospitalMountain Vista Medical CenterPhoenix Children’s Hospital at Dignity Health’s Mercy Gilbert Medical CenterRural Metro/Southwest AmbulanceUlthera
Basha’s Distribution CenterBanner Health Distribution CenterFedEx Regional Distribution CenterOnTrac
ASU GammageChandler Center for the ArtsChandler Downtown StageChandler-Gilbert Community College Performing Arts CenterEvelyn Smith Music Theatre at ASUHale Centre TheatreHigley Center for the Performing ArtsMesa Arts CenterMesa Community College Theatre OutbackQueen Creek Performing Arts CenterTempe Center for the ArtsTempe Performing Arts Center
Arizona State University-Polytechnic CampusArizona State University-TempeA.T. Still UniversityBenedictine UniversityCentral Arizona College-Superstition Mountain CampusChandler Gilbert Community College (Multiple Campuses)Communiversity at Queen CreekEast Valley Institute of TechnologyEverest CollegeGrand Canyon UniversityPima Medical InstituteMaricopa Community College DistrictMesa Community CollegeMesa Community College-Red MountainNAU – East Valley CampusOttawa UniversityRio Salado CollegeScottsdale Community CollegeSaint Xavier University University of Advancing TechnologyUniversity of ArizonaUniversity of PhoenixUpper Iowa UniversityWestern International UniversityWilkes University
Advanced Technology Innovation Center @ ASU PolyASU Research ParkASU SkySongASU Chandler Innovation Center/TechShopBiodesign InstituteGangplankInnovations Science & Technology Incubator ChandlerLaunchPointTHINKspot
Sloan Park (Chicago Cubs)Hohokam Stadium (Oakland A’s)Salt River Fields at Talking Stick (Arizona Diamondbacks, Colorado Rockies)Tempe Diablo Stadium (Los Angeles Angels of Anaheim)
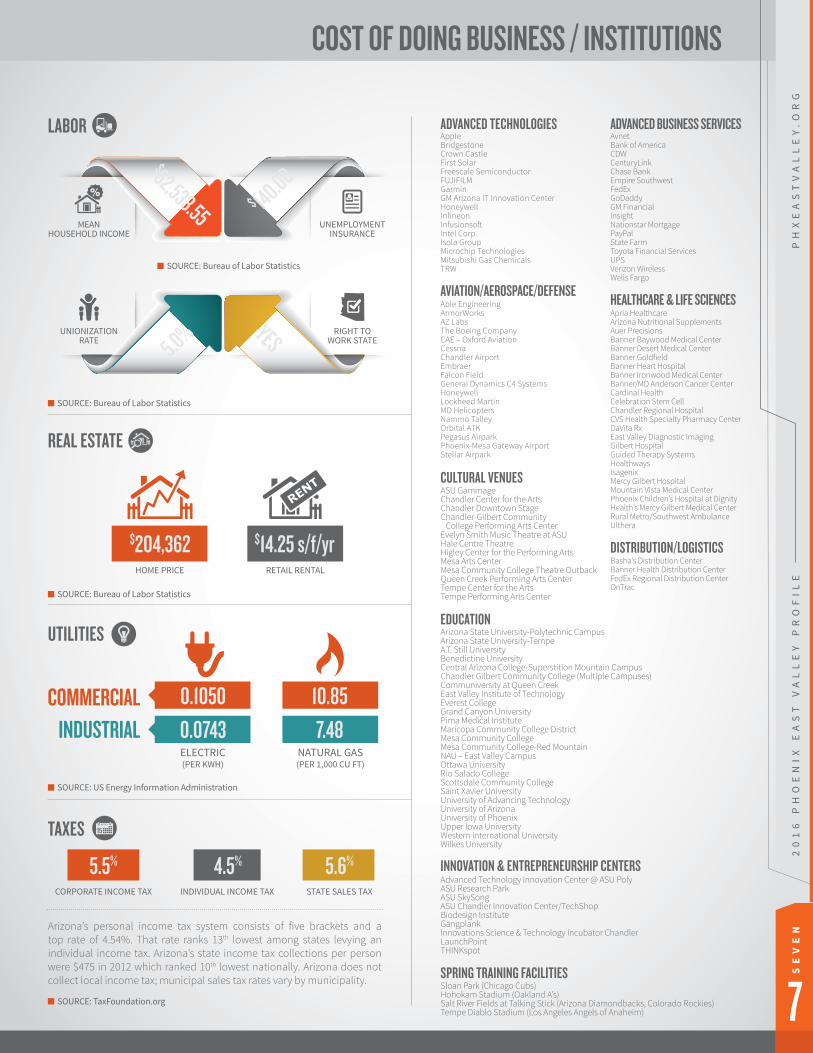
COST OF DOING BUSINESS / INSTITUTIONS
5.5%
$204,362
0.1050COMMERCIALINDUSTRIAL 0.0743
$14.25 s/f/yr
10.85
7.48
4.5% 5.6%
$62,533.55 $ 140.00
YES5.0%
SOURCE: Bureau of Labor Statistics
SOURCE: Bureau of Labor Statistics
SOURCE: US Energy Information Administration
SOURCE: Bureau of Labor Statistics
SOURCE: TaxFoundation.org
LABOR ADVANCED TECHNOLOGIES
AVIATION/AEROSPACE/DEFENSE
CULTURAL VENUES
EDUCATION
INNOVATION & ENTREPRENEURSHIP CENTERS
SPRING TRAINING FACILITIES
ADVANCED BUSINESS SERVICES
HEALTHCARE & LIFE SCIENCES
DISTRIBUTION/LOGISTICS
REAL ESTATE
UTILITIES
TAXES
Arizona’s personal income tax system consists of five brackets and a top rate of 4.54%. That rate ranks 13th lowest among states levying an individual income tax. Arizona’s state income tax collections per person were $475 in 2012 which ranked 10th lowest nationally. Arizona does not collect local income tax; municipal sales tax rates vary by municipality.
MEAN HOUSEHOLD INCOME
CORPORATE INCOME TAX
HOME PRICE
ELECTRIC (PER KWH)
INDIVIDUAL INCOME TAX
RETAIL RENTAL
NATURAL GAS (PER 1,000 CU FT)
STATE SALES TAX
UNIONIZATION RATE
UNEMPLOYMENTINSURANCE
RIGHT TO WORK STATE

BUSINESS BANKINGRhonda Curtis 480-396-1885 • Southeast ValleyKeri Armstrong 480-644-8346 • Mesa/AgricultureTim Billings 480-377-1554 • Tempe
CONTRIBUTORSEDITOR: Megan SterlingLAYOUT & DESIGN: Aaron DeCarlo, Dune MediaPHOTOGRAPHY: Provided by PHX East Valley municipalities, Vist Mesa and ASU. © Copyright Arizona Board of Regents.
Ahwatukee | Florence | For t McDowel l Yavapai Nat ion | Fountain H i l ls | Gi la R iver Indian Community | Gold Canyon | Guadalupe
Mar icopa | Salt R iver Pima-Mar icopa Indian Community | San Tan Val ley | Scottsdale | Sun Lakes
APACHE JUNCTION | CHANDLER | GILBERT | MESA | QUEEN CREEK | TEMPE
SURROUNDING COMMUNITIES
2015 East Valley Profile is sponsored by Wells Fargo Business Banking and SRP.The East Valley Partnership (EVP) is a regional coalition of community, business, educational, and government leaders whose goal is to provide leadership and support in specific areas of focus, thereby improving business and quality of life in the region. EVP is dedicated to the economic development and promotion of the East Valley. EVP actively advocates in areas such as economic development, education, aviation, and aerospace, transportation and others.
For more information, visit www.EVP-AZ.org