2016 outlook in dire straits - nigeria’s no1 economy · pdf file2 research in dire...
TRANSCRIPT

2016 OUTLOOK – IN DIRE STRAITS
JANUARY 14, 2016
2
RESEARCH
In Dire Straits
2016 Outlook
Global Economy – Weak EM Outlook threatens Global Growth Very strong headwinds threaten the overall global economic outlook for 2016. China’s
economic growth has slowed to its lowest in 25 years and low commodity prices
continue to have far reaching implications for growth in other emerging and developing
nations. On the flipside, advanced economies, following reasonable signs of recovery,
are forecast to be at the forefront of global growth in 2016. The International Monetary
Fund (IMF) forecasts global growth at 3.6% noting downside concerns including China’s
new growth model, increased volatility across global financial markets and geopolitical
tensions in the Middle East and parts of Africa. The IMF however sees a potential boost
to global consumption especially in advanced economies, given the muted consumption
response to lower commodity prices in 2015.
Nigeria – High Expectations in Tough Times With oil price at a 12 year low ($31 per barrel), a weakening balance of payment
position (down 38% YoY as at Q3’15), and projections of even lower oil price – Nigeria
faces very tough choices in 2016, key amongst which is currency adjustment and
controlled deregulation of the downstream sector. The interplay of fiscal, monetary and
exchange rate policies will determine growth trajectory in 2016 even as the government
pursues an expansionary budget of N6.07 trillion – $30 billion (with over N2 trillion –
$10 billion deficit) and the central bank pushes easing measures to drive output growth.
Inflationary concerns are paramount, given the uptick in prices throughout 2015. We
project an average inflation rate of 11% in 2016 and a real GDP growth rate in the range
of 2% - 4% with the higher end of the range highly dependent on flexibility to the
current exchange rate regime and improved FX supply. In hindsight, government will
need to pay particular attention to ongoing socio-political tensions including the Boko
Haram insurgency in the Northeast the recent clash between the country’s troops and
the ‘Shiite’ Muslims across the North and other sectional agitations.
Oil Price Correction: the One Vital Catalyst for Market Rebound Despite attractive valuations, the reversal of fortunes for the equities market in 2016
will depend on currency adjustment and a sustained rebound in crude oil price. Given
current depressed prices, dividend yield looks attractive; hence the equity market may
see some respite in Q1 end/early Q2 as local participants position ahead of FY 2015
dividends. Notwithstanding the easing measures of the central bank which resulted in
the correction of the yield curve in Q4’15, the outlook for bond yields is dependent on
the interplay between demand and supply.
Top picks Price (N)
12M TP (N) Upside
Fwd P/E (x)
Div. Yield
GUARANTY 16.39 22.43 36.9% 5.0 9.1%
ZENITHBANK 10.93 16.44 50.4% 3.7 12.2%
GUINNESS 119.98 138.25 15.2% 13.3 3.7%
DANGSUGAR 5.98 9.11 52.3% 5.2 11.7%
DANGCEM 145.45 201.36 38.4% 12.1 7.4%
*Analysts:
Clement Adewuyi
(234) 809 022 1951
Feyisike Ilemore
(234) 809 022 1947
Tiffany Odugwe
(234) 809 044 2501
Damilola Lawal
(234) 818 398 2518
Tosin Ojo, CFA (Team Lead)
(234) 809 041 5178
Team
(234) 7100 433
Sales
080 9041 5168
080 9047 9267
Source: CardinalStone Research

3
RESEARCH
In Dire Straits
2016 Outlook
Table of Contents
Summary ..................................................................................................................................... 2
Recommendation snapshot ................................................................................................................ 3
Global Economy: Increased economic integration threatens global recovery ...................................... 3
Advanced Economies – On the path to recovery ............................................................................... 3
Emerging and Developing Economies ................................................................................................. 3
Commodities – Lower for long ........................................................................................................... 5
Agriculture .......................................................................................................................................... 6
Nigerian Economy: High Expectations in Tough Times ................................................................... 6
Social Democracy Model ..................................................................................................................... 6
Monetary Policy and the Economy ..................................................................................................... 9
Fiscal Policy and the Masses ............................................................................................................. 11
Equities - Market Return heavily Dependent on Macro Events ..................................................... 13
Fixed Income – Yields, What Direction in 2016? ........................................................................... 24
Banking Sector – Murky Waters – Time to be Cautious ...................................................................... 32
Insurance Sector – Premium Growth Threatened in 2016................................................................... 46
Consumer Goods Sector – Many Moving Parts – Mixed Outlook ................................................... 48
Industrial Goods Sector – Budget Allocation to CAPEX supports Construction Outlook ................... 52
Energy Sector – Power and Oil & Gas ........................................................................................... 55
Agriculture Sector – Still a Priority Sector for the Buhari Government ........................................... 58
Companies ................................................................................................................................ 60
Appendix .................................................................................................................................. 76
Financial Statements and Key Ratios ................................................................................................ 77
Disclosure and Disclaimer .............................................................................................................. 107

4
RESEARCH
In Dire Straits
2016 Outlook
*NW – Negative Watch List
Company Ticker Rating TP (N) Current
Price1 (N)
Up/ Mkt Cap (N'Bn)
2016F P/E
2016F D/ Y Down Side
Financial Services
AIICO Buy 1.58 0.90 76% 6.24 2.3x 13.2%
UBA Buy 5.46 2.79 96% 101.22 1.8x 17.8%
ZENITHBANK Buy 16.44 10.93 50% 343.16 3.7x 12.2%
ACCESS Buy 6.00 4.37 37% 126.42 3.0x 11.8%
GUARANTY Buy 22.43 16.39 37% 482.38 5.0x 9.1%
DIAMONDBNK Buy 2.68 2.00 34% 46.32 3.0x 10.2%
CUSTODYINS Buy 5.59 4.20 33% 24.70 5.6x 5.0%
FBNH Buy 5.07 3.99 27% 143.22 2.3x 6.6%
STANBIC Buy 17.72 14.25 24% 142.50 8.4x 5.3%
STERLNBANK Buy 2.10 1.79 17% 51.53 5.4x 7.5%
FIDELITYBK Hold 1.48 1.30 14% 37.67 2.9x 8.5%
ETI Hold 16.79 16.15 4% 296.35 4.7x 6.3%
FCMB *NW N/A 1.36 N/A 26.93 1.4x 27.5%
Consumer Goods
FLOURMILL Buy 66.08 19.76 234% 51.85 22.5x 2.4%
UACN Buy 31.62 18.59 70% 35.71 7.6x 6.5%
DANGSUGAR Buy 9.11 5.98 52% 71.76 5.2x 11.7%
NB Buy 140.12 97.18 44% 770.55 16.7x 3.9%
GUINNESS Buy 138.25 119.98 15% 180.68 13.3x 3.7%
PZ Hold 24.14 21.13 14% 83.90 18.8x 3.2%
NESTLE Sell 763.92 779.00 -2% 617.48 23.8x 2.5%
UNILEVER Sell 15.41 43.25 -64% 163.63 104.0x 0.9%
Industrial Goods
DANGCEM Buy 201.36 145.45 38% 2,478.54 12.1x 7.4%
WAPCO Hold 99.05 91.31 8% 415.91 10.5x 2.9%
Oil & Gas
SEPLAT Buy 312.79 196.07 60% 110.47 5.4x 10.7%
TRANSCORP Sell 1.02 1.14 -11% 44.14 21.8x 1.9%
MOBIL Sell 133.19 151.20 -12% 54.52 9.6x 4.0%
TOTAL Sell 130.47 155.92 -16% 52.94 13.7x 3.2%
OANDO *NW N/A 4.64 N/A 55.84 18.8x 0.0%
Agriculture
PRESCO Hold 32.88 33.00 0% 33.00 5.8x 3.2%
OKOMUOIL Sell 32.02 32.64 -2% 31.14 14.0x 3.3%
Stock Recommendations Overview
Source: CardinalStone Research

5
RESEARCH
In Dire Straits
2016 Outlook
Macro & Markets

6
RESEARCH
In Dire Straits
2016 Outlook
Global Economic Outlook
Weak EM outlook threatens global growth
If there was any doubt before, the year 2015 has shown that the world is more
integrated than ever. The drop in crude oil prices and slowdown in China’s growth have
had far reaching implications for emerging and developing nations in particular, and also
the more advanced nations. Brazil and Russia, two of the BRIC1 nations expected to be
at the forefront of economic growth, slipped into recessions in 2015 due to weak oil
exports, while Chinese GDP growth slowed to an average of 7.0% in 9M’15 - it’s lowest
pace of growth in 25 years. Sub Saharan African economies continue to be hindered by
low commodity prices and will be focused on steering their economies through a weak
global outlook in 2016 while dealing with depreciating currencies. The more advanced
economies especially the United States, previously viewed as ill-equipped to drive
growth in 2015/2016, are now, following reasonable signs of recovery this year since
the 2013 financial crisis, expected to significantly contribute to global growth in 2016.
Broadly reflecting these growth expectations, the IMF recently cut its global growth
forecast for 2016 to 3.6% from 3.8%. The IMF cited increasing downside concerns such
as the increasing difficulty for China in its transition to a new model of growth;
increasing financial market volatility across the globe; and likely economic spill-overs
from increasing geopolitical tensions in the Middle East, and parts of Africa. On the
positive side, the IMF however noted the muted consumption response to lower oil
prices so far, forecasting a greater boost to global consumption in 2016 especially in
more advanced economies.
Advanced Economies – On the path to recovery: While the US (average YoY
GDP growth of 2.2% in 9M’15) has raised rates for the first time in a decade, Japan and
the Eurozone (average GDP growth of 0.2% and 0.4% in 9M’15 respectively) continue
with their asset purchase programs designed to stimulate their respective economies.
The US is clearly on a path of sustained recovery with six consecutive quarters of strong
GDP growth since Q1’14. Weak inflation however remains a concern in the US (inflation
has averaged 0.03% in the first 9mths of 2015), a theme that has played out across most
other developed nations and is being attributed to the sharp decline in crude oil prices.
The United Kingdom also remains on track for modest growth with consumer sentiment
and housing prices in 2015 increasing the likelihood of further growth in 2016. The euro
area’s expansionary program ($65.2 billion monthly asset purchase until September
2016) however seems to be having a delayed effect with mixed growth in Germany and
France evident in the first half of 2015. The IMF has therefore revised its 2016 growth
projection slightly downwards for the euro area to 1.6% from 1.7% previously.
1 1The BRIC nations- Brazil, Russia, India and China- are emerging market economies considered to be at
very advanced stages of economic development, expected to drive global growth in the medium to long
term
For Advanced economies,
2016 is forecast to be a year
of recovery
Global growth for 2016
remains threatened by a
number of downside risks

7
RESEARCH
In Dire Straits
2016 Outlook
The continued influx of refugees from war torn Syria and the Middle East could however
be a blessing in disguise, helping to stimulate rather than hinder economic growth,
forcing euro area countries to spend money on refugees which will eventually filter
through the economy. Overall, despite the sluggish pace of recovery in more advanced
nations, especially in Japan where GDP growth remains muted amidst weak consumer
demand, the IMF forecasts GDP growth of 2.2% for advanced economies in 2016, higher
than the growth rate of 2.0% expected for 2015.
Emerging and Developing Economies – Slowdown complicated by
increased global integration: Perhaps underestimated at first, China’s slowing
growth, a fallout of its deliberate move from an investment-driven, export-driven
economic model to a consumption-driven one, has led to serious repercussions for
emerging markets. China, the largest world exporter and second largest importer, has
seen both its imports and exports dwindle in line with this new economic era. The IMF
forecasts growth of 6.3% for China in 2016 which will even be slower than expected
growth in 2015. The peculiarities of the Chinese economy - centrally planned, with
significant government influence especially in the banking sector - make it unlikely that
growth will accelerate in 2016 especially if the government continues to moderate its
previous reckless spending. As a result, Emerging and Developing economies who
typically conduct a lot of trade with China will see their economic growth and foreign
exchange earnings shrink.
The drop in crude oil price has put an even bigger strain on growth of oil exporting
countries. Large oil producing nations like Russia and Brazil slipped into recessions in
2015 and will have to focus on deep structural reforms to foster a recovery in 2016; the
IMF forecasts weak GDP growth in these economies in 2016. Elsewhere, India is
expected to continue on its current growth trajectory, driven by increasing exports and
a pickup in investments following recent policy reforms. Growth in Sub-Saharan Africa is
expected to average 4.3% in 2016 (compared to an earlier forecast of 5.1%) according to
the IMF. The pace of policy adjustments to current economic realities – falling
commodity prices and a soon-to-be less favourable external environment shapes the
economic outlook for the region in 2016. Fiscal policies will need to be guided by
medium term expenditure frameworks that strike a balance between debt sustainability
and addressing development needs while monetary policies will need to be
accommodative, paying attention to the effect of global shocks on the economy and
allowing for exchange rate depreciations that can absorb the shocks.
Overall, capital inflows to emerging and developing economies have slowed,
exacerbating growth concerns, with investors seeking home comfort and a continuous
lift-off in the US’ fed rate. The IMF however remains relatively bullish on developing
nations’ growth in 2016, forecasting growth of 4.5% in 2016 which represents an
increase in 2015 expected growth of 4.0%.
A combination of weak
commodity prices and
China’s transition to a
consumption-led economy is
likely to place a cap on
growth in emerging
economies
8
RESEARCH
In Dire Straits
2016 Outlook
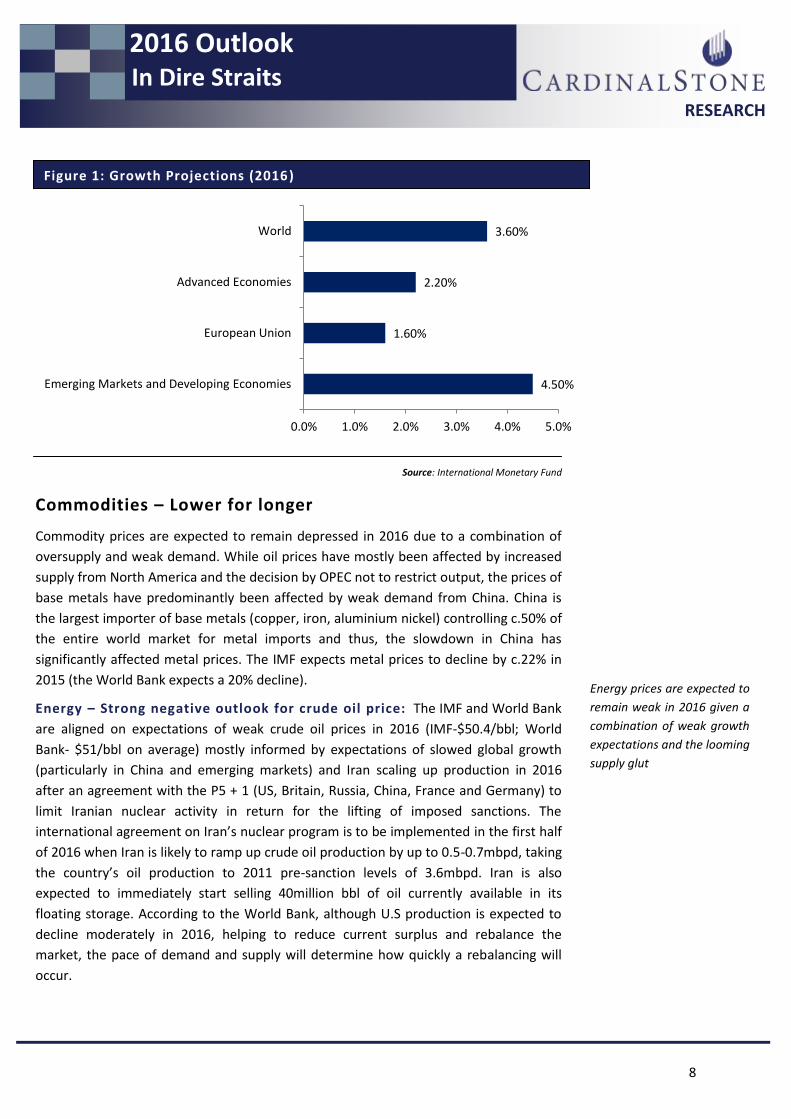
Commodities – Lower for longer
Commodity prices are expected to remain depressed in 2016 due to a combination of
oversupply and weak demand. While oil prices have mostly been affected by increased
supply from North America and the decision by OPEC not to restrict output, the prices of
base metals have predominantly been affected by weak demand from China. China is
the largest importer of base metals (copper, iron, aluminium nickel) controlling c.50% of
the entire world market for metal imports and thus, the slowdown in China has
significantly affected metal prices. The IMF expects metal prices to decline by c.22% in
2015 (the World Bank expects a 20% decline).
Energy – Strong negative outlook for crude oil price: The IMF and World Bank
are aligned on expectations of weak crude oil prices in 2016 (IMF-$50.4/bbl; World
Bank- $51/bbl on average) mostly informed by expectations of slowed global growth
(particularly in China and emerging markets) and Iran scaling up production in 2016
after an agreement with the P5 + 1 (US, Britain, Russia, China, France and Germany) to
limit Iranian nuclear activity in return for the lifting of imposed sanctions. The
international agreement on Iran’s nuclear program is to be implemented in the first half
of 2016 when Iran is likely to ramp up crude oil production by up to 0.5-0.7mbpd, taking
the country’s oil production to 2011 pre-sanction levels of 3.6mbpd. Iran is also
expected to immediately start selling 40million bbl of oil currently available in its
floating storage. According to the World Bank, although U.S production is expected to
decline moderately in 2016, helping to reduce current surplus and rebalance the
market, the pace of demand and supply will determine how quickly a rebalancing will
occur.
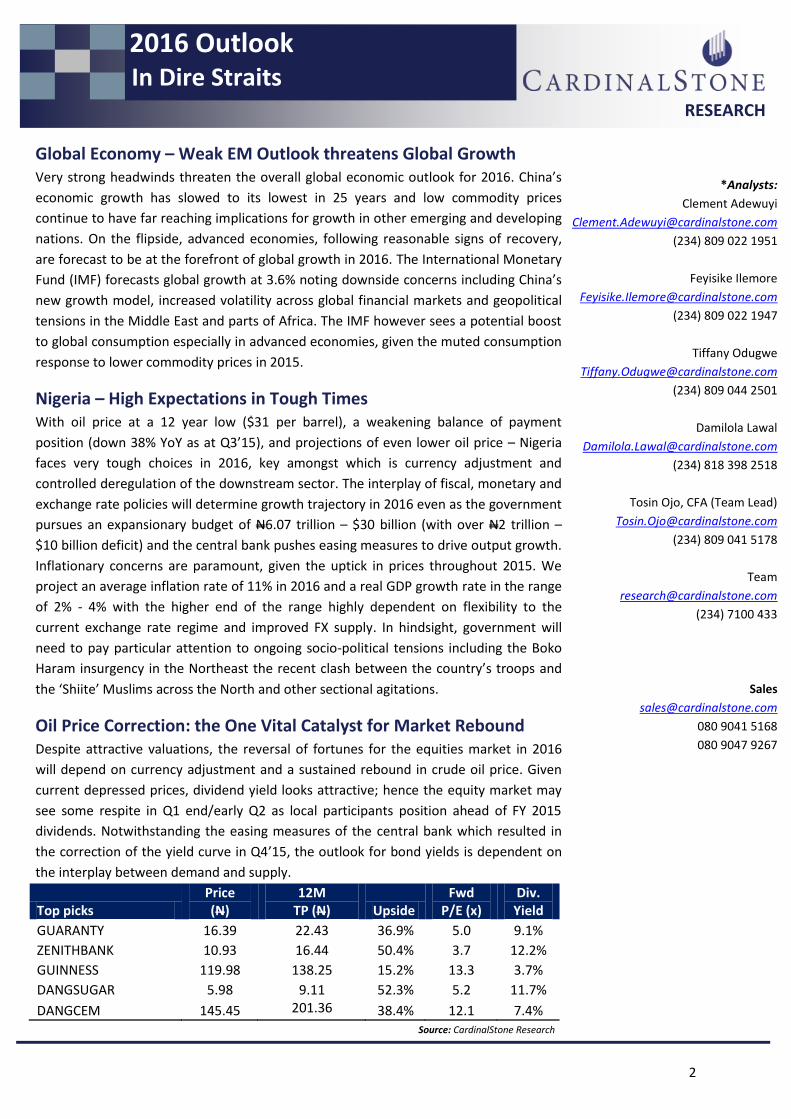
4.50%
1.60%
2.20%
3.60%
0.0% 1.0% 2.0% 3.0% 4.0% 5.0%
Emerging Markets and Developing Economies
European Union
Advanced Economies
World
Figure 1: Growth Projections (2016)
Source: International Monetary Fund
Energy prices are expected to
remain weak in 2016 given a
combination of weak growth
expectations and the looming
supply glut

9
RESEARCH
In Dire Straits
2016 Outlook
With OPEC, in its December 2015 meeting, stating that there will be no supply cuts in
2016 unless non-OPEC oil producing nations agree to cooperate, the outlook for oil
prices remains firmly negative.
Agriculture – Oversupply to weigh down food prices: In the agricultural
commodities market, modest growth in the euro area and the US especially (large
exporters of agricultural produce) has led supply of agricultural commodities to outstrip
demand. Consequently, prices continue to decline with the World Bank’s Food
Commodity Price Index expected to average about 15 percent lower for 2015 compared
to 2014 and growing only marginally by 2 percent in 2016. The World Bank forecasts
rising global stocks of edible oils, meals, and grains next year which are likely to keep
agricultural commodity prices depressed in 2016. Overall, with China determined to
stay on its new growth path, and prospects for economic growth in the US and Euro
area modest at best, metals, oil, and agricultural commodity prices will likely fluctuate
around current lows in 2016 – reinforcing an overall weak outlook for global growth.
Commodity Unit 2014 2015 2016
Crude oil avg. spot $/bbl 96.2 52.5 51.4
Grains – Wheat $/mt 285 205.0 201.0
Oils & meals Soybeans $/mt 492 390.0 401.0
Other food – Sugar $/kg 0.37 0.29 0.29
Figure 2: Average price forecast of select commodities, nominal USD
Source: World Bank
Expectations of a slight
rebound in food prices in
2016

10
RESEARCH
In Dire Straits
2016 Outlook
Nigeria – High Expectations in Tough Times
President Muhammadu Buhari (PMB), a man with whom the people associate with
change, mounted the reins and has opted to run the country in a manner which in our
view is akin to a ‘social democracy’. The Introduction of social welfare spending into
Nigeria’s budget despite expectations of significantly lower government revenue
following the decline in crude oil prices highlights the President's focus on the masses.
Rather than focus on successfully implementing its social and capital ideas, the new
government has to contend with terrorism in the North, nascent socio-political tensions
in the South and corruption in the polity. While we expect the All Progressives Congress
(APC) led government to continue to grapple with these challenges in 2016, on its way
to achieving its manifesto, we examine below the 'social democratic' model and the
potential challenges that the new government could face in its implementation.
Buhari, the social democracy model and parallels with Brazil
PMB, a one-time military head of state of Nigeria and widely regarded as a man of the
people, has openly declared himself a converted democrat. It is however not far-fetched
to expect that he still holds some ideals of a pure socialist and thus may try to pursue
methods in line with a social democratic model. Social democracy is an ideology that a
democratically elected government can, within the boundaries of capitalism, gradually
re-order the society, through social policies and reforms, into a more equitable and
beneficial economy that promotes social justice for the general population. Social
democracy aims to foster an environment for a more egalitarian society within which
capitalism can thrive. It is a system native to Europe and widely practiced in the
Scandinavia and sometimes called the Nordic system of government. In modern-day,
social democracy is characterised by policies aimed at putting a check on poverty,
inequality and the oppression of the underrepresented, key features that resonate with
the propositions and disposition of the current government.
Although Scandinavia is often referred to as "probably the best governed" region in the
world, we align our expectations of the merits of social democracy with that of a
country with similar demographics as Nigeria. One such country is Brazil. Bolsa Familia is
the social welfare program of the Brazilian government which has had positive
implications for its economy and is winning converts worldwide. Although at a much
advanced stage, parallels can be drawn between the ideals of this program and what
the new Nigerian government may be trying to achieve. The Bolsa Familia program has
its roots in an initial program which was initiated in 1998/9 to cater directly to pregnant
women and the low income population through the distribution of foodstuff. This
however impacted negatively on local market output and was redesigned into a
conditional cash transfer scheme such that money was directly transferred to
beneficiaries. This conditional cash transfer scheme is closely related to the monthly
stipend program recently proposed by the Nigerian government.
New government seems to
be pushing a new economic
ideology – ‘social democracy’
with the record introduction
of a social welfare spend in
the 2016 budget
Social democracy aims to
foster a more egalitarian
society. The Brazilian ‘Bolsa
Familia’ is a case in point and
has won many converts
worldwide including Nigeria

11
RESEARCH
In Dire Straits
2016 Outlook
Bolsa Famila has had resounding implications on the economy of Brazil and has been
lauded as contributing to reduced poverty levels as well as to improvements in
employment. Key factors responsible for the success of Bolsa Familia so far are
continuity in implementation by different governments and the presence of a robust
database operated and maintained by Caixa – a Federal Savings Bank in Brazil. Given
that the Brazilian government delivers these monies through bank issued debit cards,
we believe it is no coincidence that the new Nigerian government successfully pushed
forward the implementation of the Bank Verification Number (BVN) scheme. We see
this as a spring board to the successful implementation of its social investment scheme.
While the idea seems laudable, it is no secret that there are other factors - security
concerns and economic instability that threaten to undermine any plans for social
reform. This is because a significant portion of likely beneficiaries live in the towns
encumbered with unrest.
“Boko Haram” in the Northeast, the threat of secession in the
Southeast and the recent clash
Dealing with the Boko Haram insurgency which has plagued Nigeria over the last four (4)
years is a major hurdle for the government. Although commendable steps have been
taken, such as the movement of the military command centre into the heart of the crisis
and the retake of most of the towns earlier captured by the terrorists, the crisis remains
unabating with more deaths reported regularly.
Boko Haram has been termed the most dangerous terrorist group in the world having
reportedly killed more people in the last year compared to the Islamic State of Iraq and
the Levant (ISIS). This does not bode well for the government especially given the
December 2015 deadline which the President had given the military to quell the
insurgency. A lot more would need to be achieved in this year if the stipend program
being launched as well as any other social interventions is to have any far reaching
impact.
There is also the rising threat of loyalists clamouring for a breakout from the country to
form their own nation called ‘Biafra’. These loyalists are known as ‘Movement for the
Actualization of Sovereign State of Biafra’ (MASSOB) and the ‘Indigenous People of
Biafra’ (IPOB). While the presidency has dismissed these protests as non-issues, such
dismissals are reminiscent of the previous government's attitude towards the initial
tensions from the Boko Haram terrorist group; clearly the government would be wise to
look at this nascent issue critically.
The recent clash between Nigeria’s Army troops and Shiite Muslims in the Zaria area of
Northern Kaduna is also a case for concern. Although government will need to check the
activities of the group especially given the complaints by residents of Zaria and
neighbouring environs, we do not see it escalating into a major crisis for the country
given that the group has been in existence since the 1980s and have only operated
within the boundaries of Zaria. Also, with no major uprising after a similar clash with
Nigeria’s troops in 2014, the potential for a crisis is minimal.
The insurgency in the north
and the recent ‘MASSOB’
protests in the Southeast
threaten to undermine
government plans for social
reform

12
RESEARCH
In Dire Straits
2016 Outlook
Still a growing economy: short term pain, long term gain
The interplay of monetary and fiscal policies shapes the economic outlook for 2016.
While Federal Government initiatives are likely to be targeted at huge capital and
infrastructure investments as well as social investments, easing monetary policy will
ensure that cheap funds are availed to the real sector, specifically agriculture,
manufacturing and solid minerals, in order to drive output and employment growth. To
this end, the Federal Government plans to set up a $25 billion (N4.9 trillion)
infrastructure fund to directly invest in the transport and energy sectors. Investors in the
fund will comprise of both local and international investors. The government has also
provided N500 billion ($2.5 billion) in its 2016 budget framework for a pilot social
intervention scheme that will entail cash payments to unemployed individuals and free
meals for primary school children.
The direction of monetary policy points towards easing with Central Bank of Nigeria’s
monetary policy committee recently reducing the benchmark interest rate to 11% (from
13% since November 2014) and also reducing the Cash Reserve Requirement (CRR) to
20% from 25% (mandating that the realized 5% CRR will only be obtained by individual
banks that grant loans to the real sector). The current currency/capital controls in the
economy are, in our view, another by-product of the government's intended focus on
social welfare. Rather than allowing the Naira to continue to weaken as a result of
"speculative activities", the government has decided to keep the Naira strong by
controlling the supply of forex. We opine that the rationale behind this is to keep
domestic prices low (Nigeria depends on imported foods and other inputs) thereby
controlling inflation (inflation remained at an average of 9.3% in 2015 despite
expectations that it would be much higher) and keeping the masses' purchasing power
intact. While we acknowledge that many of the economic policies are somewhat
complimentary, we believe that the potential economic benefits of these policies are
realizable only in the long term at the expense of short term pain. We also feel that the
success of the ongoing policies depend, quite critically, on the effective implementation
by key stakeholders including current members of the government, business owners,
and aggrieved political opponents.
Monetary Policy and the Economy
Inflationary concerns linger – In 2016, given the policy decision of the Central Bank of
Nigeria (CBN) to reduce the monetary policy rate (MPR) to 11% with a corridor of
+200bps/-700bps around the MPR and to reduce the CRR from 25% to 20%, the question
of how the apex bank intends to control consequent inflationary pressures arises. Also,
the heightened possibility of devaluation in the first to second quarter of 2016 and the
resulting pass-through effect, present the likelihood of double-digit inflation in 2016. The
pressure point for headline inflation will stem majorly from the core index (All items less
food) because of higher prices of imported food/items. We therefore expect an uptick in
headline inflation in 2016 and see the average for the year at around 11%.
The interplay of monetary
and fiscal policy will shape
the economic direction for
this year – a combination of
expansionary fiscal policy
and monetary easing

13
RESEARCH
In Dire Straits
2016 Outlook
New monetary stance possible mid-2016 – We opine that devaluation is in the fore
come 2016, as the CBN struggles to meet legitimate dollar obligations from its already
dwindling reserves. So far the government has kept the exchange rate around N198/$ but
with the continued downward spiral in crude oil prices (our major source of foreign
exchange receipts) and very limited foreign participation in the country’s financial
markets, the need for a devaluation cannot be overemphasized. In our view, the federal
government is almost out of policy arsenals (after resorting to foreign exchange controls)
to defend the Naira. With import cover at four (4) months, we believe that government
may not be able to continue its staunch foreign exchange control policy and will allow the
Naira weaken in H1 2016. Using guessestimate, we project an equilibrium value for the
Naira within the range of N240/$1 to N275/$1. However, given the various qualitative
factors affecting the demand/supply dynamics of the NGN/USD exchange rate, we realize
that projecting the true value of the NGN/USD rate will be an inaccurate task.
We anticipate a slowdown in real GDP growth – With continued capital controls
amidst dwindling foreign exchange reserves, we anticipate that real sector output will
continue to slow as manufacturing companies face the difficulty of timely access to raw
materials for production. The expected positive impact on GDP of reduced interest rates
may thus be muted. However, should there be timely devaluation; we forecast real GDP
growth at 4% for 2016. Barring devaluation and a recovery in crude oil prices, we foresee
real GDP slowing to 2%. Although any devaluation is incapable of solving the long term
problem of foreign exchange supply, we think it is a necessary short term tool to eliminate
forex controls and possibly boost necessary economic activity. In the medium to long
term, the need to push for structural economic reforms to diversify the country’s export
base cannot be overemphasized.
Bleak outlook for the Nigerian capital market – Maintaining the exchange rate at
N198/$ will only serve to delay the re-entry of foreign portfolio investments given that
underlying economic realities present a case for a Naira devaluation at least in the short
term. Barring devaluation, a reversal in the current direction of oil prices is the only other
catalyst that could lead to increased foreign participation in Nigeria’s financial market.
This may however not be immediately possible as OPEC will continue in its strategy to
preserve market share rather than prop up prices.
Barring devaluation by Q1
2015 and a reversal in crude
oil prices, we foresee GDP
growth at 2% YoY. On the
flipside we anticipate a YoY
average growth of 4%
Inflationary pressures are
anticipated throughout 2016
given a mix of monetary
easing measures (and thus
buoyant system liquidity) and
a heightened likelihood of
devaluation by Q1 2015
Increased foreign
participation in country’s
financial market highly
dependent on a number of
factors – naira liquidity, oil
prices and US interest rate
hike

14
RESEARCH
In Dire Straits
2016 Outlook
Fiscal Policy and the Masses – Highlights of the 2016 Budget and
analysis of its underlying assumptions
The Medium Term Expenditure Framework (MTEF) and the Fiscal Policy Strategy (FPS)
which outlined the expenditure plans and proposed revenue sources for the period
2016-2018, was submitted to the National Assembly for approval. The 2016, N6.07
trillion ($30.65 billion) spending plan is based on the following macroeconomic
assumptions: (i) real GDP growth of 4.82%; (ii) exchange rate of N198/$1; (iii) $38 per
barrel and (iv) 2.2 million barrels per day (mbpd) of oil production.
Total revenue is forecast at N3.82 trillion ($19.29 billion) approximately 10.6% above
2014 budget levels. Although oil remains the main source of revenue for the federal
government implying a significant decline in revenue considering the massive decline in
oil prices, we opine that this revenue target is still conservative. This is because the
Federal Inland Revenue Service (FIRS) has stated that it will target a 200% increase in tax
revenues above 2015 levels, approximately N4.01 trillion ($20.36 billion). This, in
addition to revenues from Oil and Gas sales, should result in total government revenue
well above N3.82 trillion ($19.39 billion).
The proposed aggregate expenditure of N6.07 trillion ($30.65 billion) reinforces
government’s drive towards stimulating growth and employment especially through
infrastructure investments. Aggregate expenditure comprises a huge N1.82 trillion
($9.19 billion) (30% of total budget) earmarked as Capital Expenditure, N2.9 trillion
($14.68 billion) for Recurrent Expenditure (Non-debt) and N1.36 trillion ($6.90 billion)
for debt service.
The budget deficit is thus N2.22 trillion ($11.21 billion) equal to c.2.16% of GDP, with
total borrowings estimated at N1.82 trillion ($9.19 billion) split into N984 billion ($4.67
billion) of domestic loans and N900 billion ($4.55 billion) of foreign loans.
Rationale
Oil price assumption implies prudence but not in line with reality: The
benchmark oil price of $38 per barrel is about 28.3% below the 2015 budget assumption
of $53 per barrel but still higher than current market price level which is at historic lows
of $31 per barrel. The oil benchmark price may need to be revised to reflect current
market realities.
Exchange rate assumption – still in denial: At an official exchange rate of
N198/$1, the government has refused to acknowledge the reality that the economy
cannot be sustained on a seemingly ‘false’ currency value. Theoretically, by not allowing
the free adjustment of prices (i.e. exchange rate) in the event of any external shock, the
burden of adjustment is automatically laid on real variables such as output and
employment. The parallel market exchange rate, a somewhat realistic market value for
In 2016, the FGN is set to run
an expansionary budget at
N6.07 trillion ($30.65 billion)
with a budget deficit of N2.2
trillion. Non-oil revenue to
form the bulk of revenue
receipts
Basic budget assumptions
may need to be revised to
reflect market realities
including the oil price
benchmark and the
NGN/USD exchange rate. Oil
production volume is
achievable.

15
RESEARCH
In Dire Straits
2016 Outlook
the Naira, hit historic highs at N290/$. Foreign currency reserves have also depleted,
currently at $29.1 billion.
Oil production close to 2015’s target: Oil production volume of 2.20mbpd aligns
with 2015’s budgeted target of 2.27mbpd which is prudent given that Nigeria’s daily
average oil production level for 2015 (Third Quarter) was 2.17mbpd. We believe the
lower target may be to account for issues of pipeline vandalism and consider the target
realizable although conservative when compared with the total spending plan of the
government. According to OPEC2 data, Nigeria is currently producing below its quota
which stands at 3.5mbpd.
Growth Outlook – Sector Winners and Losers
Considering budget provisions, current fiscal & monetary policy, low crude oil prices,
and the overall state of the economy we attempt to identify the sectors that could
significantly benefit from the current policy direction. We think the capex budget (N1.8
trillion – $9 billion) is positive for companies in infrastructure related sectors (cement
producers and power companies). Also, easy monetary policy will favour funding of long
term infrastructure projects at very low costs. With a substantial part of government’s
budget focusing on social spending, we envisage increased consumption (as most of the
social benefits for the poorest Nigerians will filter into staple foods if properly
implemented) which is positive for consumer goods companies especially the food
producers. We however expect the existing capital controls to negatively impact
manufacturers generally, but especially consumer goods companies that import a
significant portion of their inputs. The drop in crude oil prices has already began to
negatively affect the upstream oil & gas sector, while the downstream sector is
embroiled in a subsidy battle but is expected to maintain its steady performance despite
current realities. Overall, we summarize our expectations for the different sectors in the
table below:
Figure 3: Sector Winners and Losers
Sector Contribution to
real GDP (%)3
Winner(W)
/Loser (L)
Rationale
Agriculture 26.79 W Government’s drive towards diversification to influence growth in agriculture
Consumer Goods/Manufacturing
9.67 W Food producers to benefit from federal government’s expenditure on social interventions
Banking & Financial Services
2.76 L Heightened risk of loan default presents weak outlook for Banks
Oil and Gas – Upstream
10.61 L Low international crude oil price to weigh on output growth
Industrial Goods /Construction
3.22 W Huge government spending on infrastructure projects to spur growth in sector
2 OPEC – Organisation of Petroleum Exporting Countries
3 As at Third Quarter 2015
Source: CardinalStone Research
We see the Agricultural,
Industrial and Consumer
Goods sectors as key sector
winners in 2016
16
RESEARCH
In Dire Straits
2016 Outlook
Equities
Market return heavily dependent on macro events
The macroeconomic conditions that ushered in 2015 – the oil glut that saw oil prices
crash to new lows and the consequent adjustment of the Naira - have weighed
negatively on investor sentiment throughout the year. Oil prices averaged $54/barrel in
2015, down 50% from 2014 average of $100/barrel, leading the CBN to change the
foreign exchange allocation policy by scrapping the Retail Dutch Auction System
(following the devaluation in November 2014), which saw NGN/USD exchange rate
move to 198/$1. Expectations of an interest rate hike in the US by the Federal Reserve
also led to significant foreign investment outflows from the Nigerian stock market.
Overall, market participation dipped with the Nigeria Stock Exchange (NGSE) losing
17.36% in 2015. Our outlook on equities considers key factors that could weigh in on
investor sentiments in 2016. We anticipate that the following key events and factors will
influence the performance of the NGSE considering that the 2015 selloff has improved
the risk-reward outlook for equities to outperform fixed income. ;
― The intervention of local investors
― Perceptions of exchange rate stability given global outlook on crude oil prices,
and its attendant implications for the Naira
― Market initiatives by the Nigerian Stock Exchange (“NGSE” or the “Exchange”)
Intervention of locals, the return of FPI’s or death of the equity
market
Local participation to determine market resurgence : The recovery of the
equities market in 2016 will depend on increased local participation by both retail and
institutional investors (pension fund managers etc). Foreign transactions have
dominated market activity, accounting for over 50% of total value traded in the last 3
years and dictating direction and market fortunes over the same period. Negative stock
market returns and overall market volatility have historically been associated with huge
foreign capital outflows and thus to ensure market stability there is the need for policies
and strategies that will attract and sustain local interest in the market. Local
participation forms the bedrock of any market and thus a huge local market presence
serves to check any economic eventualities that could have a run on the market. The
NGSE recently implementing the X-BOSS (“Broker Oversight & Supervision System”)
initiative, the first in West Africa, holds the optimism that stricter oversight function is
necessary to boost investor confidence and enhance capabilities for market integrity.
The initiative is geared towards the automation of the regulatory and oversight function
of the Exchange over dealing members with a focus on the automation of regulatory
filings, the analysis of various ratios of financial renditions, capital and liquidity
monitoring as well as compliance monitoring.
Increased local retail and
institutional participation
will be a key determinant of
market recovery in 2016
Asides macro factors, local
intervention, exchange rate
stability and NGSE market
initiatives will primarily
influence equity market
performance in 2016

17
RESEARCH
In Dire Straits
2016 Outlook
According to the NGSE, the system is poised to offer investors access, on a near real
time basis, to dealing members information including corporate profile, compliance
history, regulatory reports submitted to the Securities and Exchange Commission (SEC)
as well as complaints management and tracking solutions.
The equities market is dominated by foreign investors seeking higher returns than
obtainable in their domestic, usually more developed markets. We see less interest in
frontier emerging markets if the Federal Reserve commences its mooted rate hike cycle
due to the narrowing of interest rate differentials. The benchmark rate has been at a
low of 0.25% since 2009, which in addition to surplus liquidity from quantitative easing
programs, spurred inflows to emerging and frontier markets. If the US benchmark rate
is hiked (median estimates by Federal Reserve officials indicate a hike to 1.125% in
H2’15), we expect a much slower pace of capital flows into Nigerian equities.
Furthermore, quickening growth in the US (with the Federal Reserve forecasting an
increase in real GDP growth of 3.1% in 2015 from an average of 2.4% in 2014), which
may be better-than-projected as a result of falling gasoline prices, makes a case for
better performance of US equities especially on the back of the strong performance
seen in 2015 (-0.73% S&P return vs. NGSE return of -17.36%). The UK, another Country
with considerable interest in our market, is also expected to hike its 0.5% interest rate
to 0.75% in Q3’16 according to the British Chambers of Commerce. We expect this rate
hike to also spur reversal of funds flow from the UK.
51% 58%
52%
73%
56% 50%
55%
34%
63% 56% 53% 51%
57%
49% 42%
48%
27%
44% 50%
45%
66%
37% 44% 47% 49%
43%
Total Foreign Transaction Total Domestic Transaction
Figure 4: Foreign vs. Domestic Transactions
Source: Nigerian Stock Exchange
The Nigerian equities
market is dominated by
foreign players

18
RESEARCH
In Dire Straits
2016 Outlook
Pension funds and the multi-fund structure: Pension funds play a huge role in
the development of an economy and with favourable regulatory climate; have the
potential to positively impact the capital market. The Nigerian Pensions Industry, with
pension Assets under Management (AUM) totalling N5.149 trillion ($26 billion) as at
October 2015, is rife with the potential to revive the local equities market. Total AUM is
split between four asset classes which include Approved Existing Scheme (AES) –
N659.49 billion - $3.3 billion (12.8% of AUM), Closed Pension Fund Account (CPFA) –
N719.24 billion - $3.6 billion (14.0% of AUM), RSA4 ‘Active’ Fund – N3,363 billion - $17
billion (65.3% of AUM) and RSA ‘Retiree’ Fund – N407.51 billion - $2 billion (7.9% of
AUM). The regulation on the investments of pension fund assets is such that Pension
Fund Administrators (PFAs) are permitted to allocate not more than 25% of total RSA
‘Active’ Fund (equal to N840.8 billion - $4.3 billion) to equities and up to 80% in Fixed
Income Securities while RSA ‘Retiree’ Funds are to be heavily weighted in fixed income
assets. The total value of RSA ‘Active’ Funds invested in both public equities as at
October 2015 however is N341.45 billion - $1.7 billion or 10.0% compared to the
industry limit of 25%. PFAs have a strong capacity to influence market stability but have
not been able to because of regulatory constraints including the focus on short-term
performance reporting and the lack of a multi-fund structure. The constraint of the lack
of a multi-fund structure is being addressed as the RSA ‘Active’ and ‘Retiree’ Funds will
be replaced with a multi-fund structure as follows:
Fund I: 10% – 70% of total fund to be invested in variable income instruments
(explained below) and open to contributors under the age of 35 years.
Fund II: 5% – 50% of total fund to be invested in variable income instruments and
open to contributors between the ages of 36 – 45 years
Fund III: 0% – 30% of total fund to be invested in variable income instruments and
open to contributors above 46 years
Fund IV: The current RSA ‘Retiree’ fund open only to Retirees
Fund V: A non-interest/ethical fund with strict compliance to Islamic Shariah
Principles
The lower end of the range represents the compulsory minimum exposure to variable
income instruments. The implementation of the multi-fund structure is scheduled to
commence in 2016 and could help kick-start increased interest from PFAs in the equities
market.
Modalities and potential impact of the multi -fund structure: According to the
National Pension Commission (PenCom), a PFA’s exposure to variable income
instruments is defined as the sum of investments in ordinary shares, open and closed-
end funds, infrastructure funds and private equity funds including the PFAs current
holdings and any future acquisition of additional investment units. The focus is on the
first three (3) funds where PFAs are expected to invest in such a way that actual variable
income exposure in Fund I is higher than exposures in Fund II and exposures in Fund II
higher than that of Fund III.
4 RSA – Retirement Savings Account
The proposed multi-fund
structure will help boost local
equity play by PFAs and
hopefully contribute to
market recovery
19
RESEARCH
In Dire Straits
2016 Outlook
We believe this multi-fund structure will drive increased local participation and thus
boost activity and ensure stability in the equities market. Other considerations capable
of boosting local participation include the deliberate inclusion of the informal sector of
the economy which will increase pension fund assets available for investments.
Attractive dividend yields to spur local interest in 2016 : At current depressed
stock prices, dividend yields are very attractive. Dividend yields calculated using closing
stock prices as at December 2015 and 2014 full year company results, stand between
7%-15% especially for banks. Savvy local investors are likely to ride on this earlier in the
year, paying particular attention to companies with very good dividend paying history
and strong earnings potential. We therefore expect a dividend yield play this year with
the potential to boost market activity and maybe reverse market fortunes.
The return of Foreign Portfolio Investors (FPIs) – Clearly, over the last few
years, the direction of activities in the equities market has been influenced mostly by
the activities of foreign portfolio investors. With the drop in crude oil prices, FPI’s began
to pull out of the market as fears of an economic slowdown, increased exchange
controls, and unmet foreign exchange demand became rife. With the official exchange
rate maintained at N198/$1, the re-entry of foreign investments into the equities
market in 2016 is unlikely given that underlying economic realities present a case for
exchange rate adjustment. This will be further aggravated if the current direction of oil
prices is not reversed. With forecasts by the US Energy Information Agency (EIA) that
crude oil prices will only pick up in 2018, the only other catalyst capable of attracting
foreign portfolio investments is an adjustment of the Naira to a fair equilibrium level.
Low-level crude oil prices seem to have come to stay as the Organization for Petroleum
Exporting Countries (OPEC) continues its strategy to preserve market share by pumping
oil rather than its default approach of propping up prices by modifying production
limits.
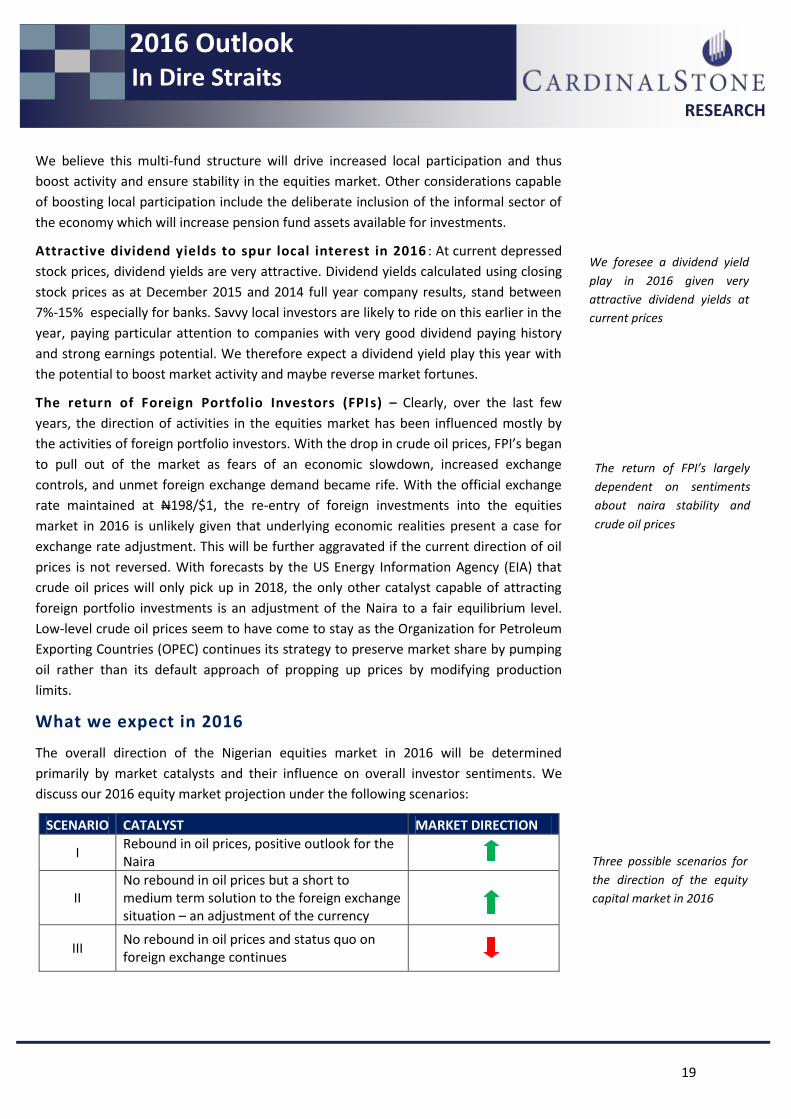
What we expect in 2016
The overall direction of the Nigerian equities market in 2016 will be determined
primarily by market catalysts and their influence on overall investor sentiments. We
discuss our 2016 equity market projection under the following scenarios:
SCENARIO CATALYST MARKET DIRECTION
I Rebound in oil prices, positive outlook for the Naira
II No rebound in oil prices but a short to medium term solution to the foreign exchange situation – an adjustment of the currency
III No rebound in oil prices and status quo on foreign exchange continues
The return of FPI’s largely
dependent on sentiments
about naira stability and
crude oil prices
We foresee a dividend yield
play in 2016 given very
attractive dividend yields at
current prices
Three possible scenarios for
the direction of the equity
capital market in 2016

20
RESEARCH
In Dire Straits
2016 Outlook
Scenario I – Oil price outlook and the possibility of a reversal in 2016 :
Historical numbers lay credence to the fact that a rebound in crude oil price in 2016 is
the single most crucial catalyst for the redirection of equity market fortunes. Figure 3
shows the direct correlation between the price of crude oil and the direction of the ASI
which measures overall equity market performance in Nigeria. According to the U.S
Energy Information Administration (EIA) however, the crude oil market faces a number
of uncertainties heading into 2016 given that the pace and volume of Iran’s re-entry, the
response of non-OPEC production to low oil prices and the strength of consumption
growth will all jostle to determine market’s new equilibrium. An oil price rebound is
highly uncertain therefore in the short to medium term.
It will take an output concession by OPEC to prop up oil prices and that seems unlikely
as data has led the cartel to believe that the strategy to achieve market share by
increasing production (and influencing prices) and driving out higher-cost producers
seems to be paying off. OPEC’s revised forecast (December 2015) for non-OPEC oil
supply growth in 2015 stands at 1.00mbpd from an earlier forecast of 1.31mbpd citing
the impact of low oil prices and declining investments in the oil industry, with
expectations of a further contraction in 2016 by 0.38mbpd. The 2016 outlook is a
further dip in oil prices.
Scenario II – Possible Uhuru for the Naira?: Nigeria’s foreign exchange earnings
are primarily from crude oil exports (86.8% of Q3 2015 exports) and, with oil prices at
currently low levels, the Naira has come under immense pressure. Foreign exchange
reserves stood at $29.1 billion as at December 2015, an equivalent of approximately
four (4) months worth of imports.
0
20
40
60
80
100
120
140
160
Jan
-85
Ap
r-8
6
Jul-
87
Oct
-88
Jan
-90
Ap
r-9
1
Jul-
92
Oct
-93
Jan
-95
Ap
r-9
6
Jul-
97
Oct
-98
Jan
-00
Ap
r-0
1
Jul-
02
Oct
-03
Jan
-05
Ap
r-0
6
Jul-
07
Oct
-08
Jan
-10
Ap
r-1
1
Jul-
12
Oct
-13
Jan
-15
Crude Oil Price All Share Index Figure 5: Crude oil price ($/bbl) and the ASI (‘000)
Source: CardinalStone Research
An oil price rebound will
redirect equity market
fortunes however the 2016
outlook for oil prices is
negative

21
RESEARCH
In Dire Straits
2016 Outlook
In the absence of devaluation, the CBN will continue to grapple with maintaining the
exchange rate at N198/$1 in the coming year, meanwhile rates at parallel markets
reached an all time high at N290/$1. In theory, when currency demand far outweighs
supply, the currency (in this case the Dollar) appreciates in search of a new equilibrium.
Nigeria operates a fixed exchange rate regime and thus a new equilibrium can only be
reached through currency devaluation, a path the CBN is wary of threading. The only
other catalyst for a reversal of equity market fortunes, asides a rebound in crude oil
price and increased local participation, is improved liquidity in the foreign exchange
market. This begs the question of the possible existence of a short term fix to the
unavailability of foreign exchange to meet demand. Policies capable of encouraging the
inflow of forex directly through increased earnings receipts and/or indirectly through
reduced savings on imports, are needed to ease liquidity pressures which in turn will
boost investor sentiment and reverse market direction in 2016. There are two options –
reducing the country’s import base to increase forex savings and possibly reducing
leakages in reserves and/or shoring up the export base in order to generate inflows and
boost supply. The latter is however long term, as a complete diversification from oil can
only come on the heels of improved critical infrastructure needed for local production
to compete favourably with international brands. Reducing the import base through
strategic import substitution policies is therefore the most practical immediate solution.
Although substantial savings on imports may not be realisable within one year, the
removal of the import subsidy on petroleum products can generate sufficient forex
savings for the country. Total dollar value of petroleum subsidy claims (excluding the
Nigerian National Petroleum Corporation- NNPC’s subsidy bill) between 2013 and 2015
was approximately $8.5 billion (N1.7 trillion) and with a major bulk of that amount
funding spurious and speculative demands and encouraging round tripping. Given that
substantial amounts can be generated in foreign exchange savings, and thus a boost in
forex supply, there is the hope of equity capital market resurgence in 2016.
Scenario III – A looming doomsday?: If crude oil prices continue to decline
coupled with no respite in the foreign exchange market, the capital market will continue
on its southward trajectory in 2016.
A short to medium term
solution for the naira can
positively influence market
direction
Barring a rebound in crude
oil price and no respite for
the naira, a southward
direction is expected

22
RESEARCH
In Dire Straits
2016 Outlook
2015 Review – Bears Held Sway
Macro dynamics hamper stock market returns for Nigeria - The NGSE
recorded a 17.36% decline in 2015 following the continued decline in crude oil prices
and the overall impact on government finances and the currency. Foreign participation
declined, triggered majorly by heightened uncertainties about the general elections in
March 2015. The stock market attempted a recovery in April 2015 (see Figure 6) gaining
9.3% MoM and 0.15% YTD (as at April 30 2015), after the peaceful outcome of the
general elections. The gains were however short-lived with market returns reversing
and then remaining mostly negative throughout the year. The Banking and Consumer
Goods sectors recorded the biggest losses at -23.59% and -17.41% respectively.
Figure 6: NGSE Sector Indices Performance in 2015
Macro factors primarily
influenced NGSE
performance in 2015
Source: CardinalStone Research
-23.59%
-17.41%
-6.20%
-4.70%
1.27%
-25.00% -20.00% -15.00% -10.00% -5.00% 0.00% 5.00%
Banking
Consumer Goods
Oil & Gas
Insurance
Industrial Goods

23
RESEARCH
In Dire Straits
2016 Outlook
Negative YTD equity return across African markets – African stock
markets performance was largely lacklustre in 2015. Measured by the year-to-date
return in local currency of each country’s equity benchmark index, the best performer
was the South African Johannesburg Stock Exchange (+1.85. The Nairobi Stock Exchange
was second with a return of (-10.55%) and Ghana was next with a return of (-11.76%).
20,000
25,000
30,000
35,000
40,000
6,000
7,000
8,000
9,000
10,000
11,000
12,000
13,000
14,000
Dec
14
Jan
15
Feb
15
Mar
15
Ap
r 1
5
May
15
Jun
15
Jul 1
5
Au
g 1
5
Sep
15
Oct
15
No
v 1
5
Dec
15
Market Cap. (N'Bn) ASI
-
5
10
15
20
25
30
35
01
-Dec
-14
01
-Jan
-15
01
-Feb
-15
01
-Mar
-15
01
-Ap
r-1
5
01
-May
-15
01
-Ju
n-1
5
01
-Ju
l-1
5
01
-Au
g-1
5
01
-Sep
-15
01
-Oct
-15
01
-No
v-1
5
01
-Dec
-15
Trade Value (N'Bn)
Figure 7: NGSE Market Performance (2015)
Overall bleak macro
outlook lead ASI to
negative YTD return
Foreign investors
stay on the sidelines
awaiting policy
clarity
Source: CardinalStone Research, NGSE
Eve
nt Concerns about 2015
general elections lead
to negative ASI return
Re
turn
(%
)
QTD: -10.3
YTD: -10.3
Rally following
successful elections
lead to +ve return
QTD: +5.4
YTD: -3.5
QTD: -6.7
YTD: -9.9%
QTD: -14.3
YTD: -22.9
-
1,000
2,000
3,000
4,000
01
-Dec
-14
01
-Jan
-15
01
-Feb
-15
01
-Mar
-15
01
-Ap
r-1
5
01
-May
-15
01
-Ju
n-1
5
01
-Ju
l-1
5
01
-Au
g-1
5
01
-Sep
-15
01
-Oct
-15
01
-No
v-1
5
01
-Dec
-15
Trade Volume ('Mn)
Figure 8: Trading Activity (2015)
Source: NGSE
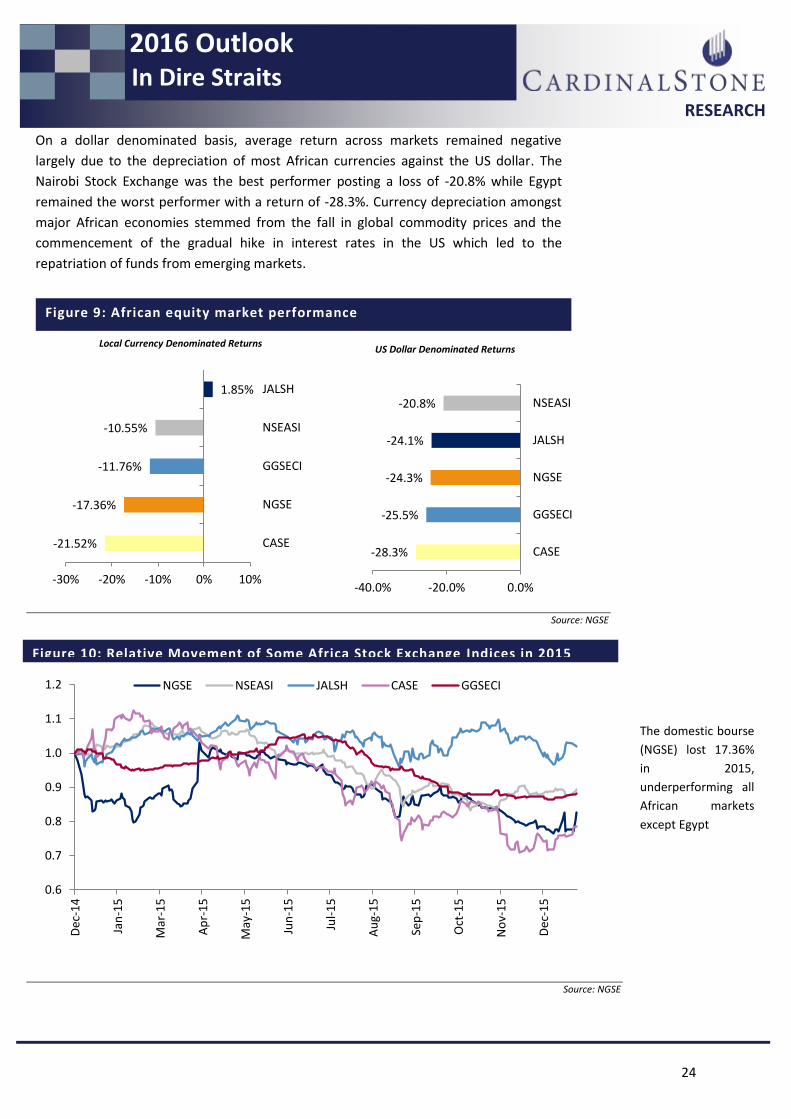
Lacklustre returns across
major African markets
throughout 2015
24
RESEARCH
In Dire Straits
2016 Outlook
On a dollar denominated basis, average return across markets remained negative
largely due to the depreciation of most African currencies against the US dollar. The
Nairobi Stock Exchange was the best performer posting a loss of -20.8% while Egypt
remained the worst performer with a return of -28.3%. Currency depreciation amongst
major African economies stemmed from the fall in global commodity prices and the
commencement of the gradual hike in interest rates in the US which led to the
repatriation of funds from emerging markets.
Figure 10: Relative Movement of Some Africa Stock Exchange Indices in 2015
Sources: Bloomberg, CardinalStone Research
The domestic bourse
(NGSE) lost 17.36%
in 2015,
underperforming all
African markets
except Egypt
Figure 9: African equity market performance
Local Currency Denominated Returns US Dollar Denominated Returns
-28.3%
-25.5%
-24.3%
-24.1%
-20.8%
-40.0% -20.0% 0.0%
CASE
GGSECI
NGSE
JALSH
NSEASI
-21.52%
-17.36%
-11.76%
-10.55%
1.85%
-30% -20% -10% 0% 10%
CASE
NGSE
GGSECI
NSEASI
JALSH
0.6
0.7
0.8
0.9
1.0
1.1
1.2
Dec
-14
Jan
-15
Mar
-15
Ap
r-1
5
May
-15
Jun
-15
Jul-
15
Au
g-1
5
Sep
-15
Oct
-15
No
v-1
5
Dec
-15
NGSE NSEASI JALSH CASE GGSECI
Source: NGSE
Source: NGSE

25
RESEARCH
In Dire Straits
2016 Outlook
0.5
0.7
0.9
1.1
1.3
1.5
1.7
Dec-2010 Dec-2011 Dec-2012 Dec-2013 Dec-2014 Dec-2015
NGSEASI MSCI Frontier
Figure 11: NGSE and MSCI Frontier Index – 5 year relative movement
Source: Bloomberg

26
RESEARCH
In Dire Straits
2016 Outlook
Fixed Income
Yields, what direction in 2016?
The 2016 budget deficit financing to influence bond yields : On the
backdrop of major fiscal pressures expected in 2016 – the continued downward spiral in
oil prices and the debt-ridden financial position of state governments - the Federal
Government has put forward a total budget of N6.07 trillion ($30.71 billion) with a
projected N2.2 trillion ($11.21 billion) deficit to be financed through domestic and
foreign borrowings estimated at N984 billion ($4.97 billion) and N900 billion ($4.55
billion) respectively. Following from this, Nigeria is positioned to issue more bonds in
2016 relative to 2015 (total bonds issued in 2015 was N788.72 billion - $4 billion) which
will ordinarily imply that bond yields should rise. With a bleak outlook for crude oil
prices and the Naira – crude oil accounting for about 70% of consolidated government
revenues and over 90% of foreign exchange earnings, Nigeria’s perceived credit
worthiness may have been weakened and as such investors are likely to demand for
higher returns.
Heightened liquidity to boost demand in bond market : A second key
determinant of the direction of yields is the signalled path of monetary policy – an era of
low interest rates targeted primarily at boosting output growth. The CBN reviewed its
policy rate from 13% to 11%, the CRR from 25% to 20% and halted its Open Market
Operation (OMO) for a two-month period, aiming primarily to boost system liquidity
and redirect cheap funds to the real sector. The impact has however been a downward
spiral in yields as it is customary that such liquidity first finds its way to the fixed income
market. Furthermore, considering the current pressures which have led to slowing
economic growth in the country, we think Deposit Money Banks (DMBs) will remain
reluctant to lend to the real sector especially in Q1 2016 despite increasing liquidity.
Therefore, the sustained high level of liquidity in the banking sector (average of about
N1 trillion - $5 billion) and the additional liquidity from debt servicing by the federal
government (estimated at N1.36 trillion - $6.9 billion) in 2016 budget proposal implies
that demand may outweigh supply thus keeping yields relatively low. We expect this to
continue at least till Q1 2016 as DMBs, primary players in the fixed income market, take
some time to make adequate preparations against credit risks and default associated
with increased/aggressive lending.
Inflationary expectations and Interest rates : Critical fallout of increased
liquidity in the system is the possible impact on inflation and the consequent impact of
inflation expectations on market yields. High inflation expectations generally drive rates
north as investors seek to be compensated for rising prices. For Nigeria, this may not
pose major concerns as there’s usually a lag effect from the impact of rising inflation on
real returns.
Budget deficit financing and
negatively perceived credit
worthiness will see yields
rise in 2016
Buoyant system liquidity
given monetary easing will
boost demand and influence
direction of fixed income
yields downwards
High inflationary
expectations to drive yields
northwards

27
RESEARCH
In Dire Straits
2016 Outlook
US Interest rate lift-off and the Naira’s many woes : The commencement
of a gradual hike in US interest rates may likely slow the comeback of foreign investors
into the fixed income market in 2016. This is particularly the case as Nigeria continues to
manage currency pressures with dwindling oil prices impacting on the foreign exchange
earnings. We analyzed the possibility of a comeback by looking at the interest rate
differential between similar tenured instruments trading in both the US and the
Nigerian market. Using current yields on US treasury bonds and assuming that the Fed
will gradually increase rates on average by 25 bps every two-months, the interest rate
differential is approximately 8.93%5 - calculated as the 12.54% yield on 10 year FGN
bonds minus a 3.61% yield on 10 year US treasury assuming that current yields (at
2.11%) increase by a total of 1.50% in 2016 were the Fed raises rates by 0.25% every
two-months. Although attractive, the average foreign investor will pay particular
attention to the ease of repatriating potential investment profits. This is the game
changer for the market as foreign investors would only return if they can be certain of
improved foreign exchange supply over their investment horizon.
Likelihood of increased corporate issuances : With average FGN bond yields
going as low as 9%, there is an opportunity for large and medium corporates to consider
issuing bonds in the market at lower rates than were historically possible. While many
banks are comfortable issuing bonds, only a few large companies have been willing to
raise money from the capital market. One of the reasons for this reluctance was the
typically high yields on FGN bonds which are deemed as nearly risk free; however the
increased system liquidity which has forced yields down is a positive trend that could
lead to the rebirth of corporate bond issues.
The 2016 Q1 treasury bills calendar : The government plans to raise N1.22
trillion ($6.13 billion) from treasury bills in the first quarter of 2016 split between
N245.77 billion ($1.24 billion) worth of 91-day bills, N238.51 billion ($1.20 billion) worth
of 182-day bills and N735.54 billion ($3.71 billion) worth of 364-day bills. The amount to
be raised however is the exact amount maturing into the system during the period, an
indication that government intends to keep yields low on the short end of the curve by
not increasing borrowing.
Demand and supply to determine overall direction of yields : We
anticipate that the fixed income market will primarily be a local play with the weightier
of the two of demand – buoyed by system liquidity and supply – fueled by the need for
the government to bridge financing gaps, determining the overall direction of market
yields in 2016.
5 Calculated as at January 12, 2016
The gradual lift off in US
interest rate will stall
comeback of foreign
investors even with a high
interest rate differential
A high likelihood of
corporate bond issues in
2016 given current low
yields
FG not increasing short term
borrowing, a strategy to
keep yields on short tenured
instruments low
2016 will primary be a local
play with the weightier of
the two of demand and
supply determining overall
direction for yields

28
RESEARCH
In Dire Straits
2016 Outlook
2015 Review – A volatile year for yields
Nigeria’s 2015 presidential election : 2015 stood out as a very volatile year for
the fixed income market. Yields were driven to both high and low extremes as varying
macroeconomic and political events influenced investor confidence. The socio-political
uncertainties that surrounded the 2015 general elections saw market yields at 15%
levels (compared to 12-13% levels as at December 2014) as investors sold off, worried
primarily about the outcome of the March 2015 presidential elections and JP Morgan
placing Nigeria on a negative index watch. 2015 Q1 average bond return stood at 0.6%,
staying negative throughout the month of March. For the first time and in a tightly
contested election, Nigeria witnessed the ‘peaceful’ defeat of an incumbent with a calm
post-election period triggering a bullish momentum for the market – the Financial
Market Dealers Quotation (FMDQ) overall bond market index grew by 6.5% mid April
(see chart below).
Cautious trading at mid-year as investors sought policy clarity:
Following the election however, it took the new government a long time to take a stand
on its intended policies especially with regards to exchange rate as a result of dwindling
crude oil prices. Market yields remained relatively flat around 13-14% levels during the
period, with investors trading cautiously and waiting for clarity on fiscal and monetary
policies.
10.0
11.0
12.0
13.0
14.0
15.0
16.0
17.0
18.0
1,000.0
1,050.0
1,100.0
1,150.0
1,200.0
1,250.0
1,300.0
1,350.0
1,400.0
Overall Market Index Implied Yields
Figure 12: FMDQ Bond Index and Implied Market Yields, 2015
Source: FMDQ
Overall bond index grew by
6.5% mid April following the
successful presidential election
which took place in March
Market yields remained flat
around 13-14% as the new
government took a long time
to give clarity on policies
29
RESEARCH
In Dire Straits
2016 Outlook
JP Morgan’s announcement and heightened expectations of a US
interest rate hike sends yields back up again : The announcement of a likely
phase out of Nigeria’s FGN bonds from the JP Morgan Emerging Markets Bond Index
saw major funds which tracked the index exiting huge positions. Market yields inched
up during the period (August-September), with the benchmark FGN bonds reaching
record levels of 17% in September. Meanwhile, there was a heightened likelihood
during the same period, of a lift-off in US interest rates as strong positive economic data
showed healthy signs of economic recovery. This further served to drive yields upward
as investors priced in a possible rate hike.
CBN’s interest rate cut reverses yield directions : In a sudden twist, the
CBN, working to manage continuing pressures on the economy, cut interest rates to
record lows of 11% at its November MPC meeting. Also, given that the TSA policy served
to tighten system liquidity, the apex bank reduced the Cash Reserve Requirement (CRR)
from 25% to 20%. This shored up system liquidity consequently driving market yields to
record lows of 10-11%. Q4 2015 thus witnessed the return to normality of the yield
curve.
Following JP Morgan’s
announcement to phase out
Nigeria from its Emerging
Markets Bond Index and the
anticipation of a US interest
rate hike, yields went higher
to record levels of 17%
CBN’s interest rates cut in
the MPR to 11% and the
reduction in the CRR to 20%
drove market yields to
record lows of 10%-11%

30
RESEARCH
In Dire Straits
2016 Outlook
15.30
15.40
15.50
15.60
15.70
15.80
15.10 APR 2017
15.54 FEB 2020
14.2 MAR 2024
12.14 JUL 2034
Mar-15
13.60
13.80
14.00
14.20
14.40
15.10 APR 2017
15.54 FEB 2020
14.2 MAR 2024
12.14 JUL 2034
Apr-15
15.15
15.20
15.25
15.30
15.35
15.40
15.45
15.10 APR 2017
15.54 FEB 2020
14.2 MAR 2024
12.14 JUL 2034
Aug-15
7.00
8.00
9.00
10.00
11.00
12.00
13.00
15.10 APR 2017
15.54 FEB 2020
14.2 MAR 2024
12.14 JUL 2034
Nov - Dec 15
The period of the 2015 general election marked
with fears of a probable post election crisis sets
off abnormal direction of the yield curve
Post election calm saw a bit of correction in the
yield curve
Foreign investors priced in the likelihood of a
phase out of the FGN bond from the JP Morgan
Bond Index amidst currency demand pressures
and the lack of policy clarity
The CBN interest rate cut and the consequent
liquidity driven demand that saw yields crash to
record lows and the yield curve return to
normality
Figure 13: The many shapes of the yield curve through 2015
Source: FMDQ, CardinalStone Research

31
RESEARCH
In Dire Straits
2016 Outlook
0
100
200
300
400
500
600
20
15
Jan
-27
Feb
-19
Mar
-16
Ap
r-1
0
May
-22
Jun
-17
Jul-
10
Au
g-0
5
Sep
-04
Oct
-02
Oct
-27
No
v-1
9
Dec
-14
0
0.1
0.2
0.3
0.4
0.5
0.6
20
15
Jan
-29
Feb
-25
Mar
-24
May
-11
Jun
-08
Jul-
03
Jul-
31
Sep
-03
Oct
-05
Oct
-30
No
v-2
6
Dec
-23
Source: FMDQ
Total Value Traded (N’millions) Total Volume Traded (‘millions)
Figure 14: Total value (N’millions) and volume (‘millions) traded

32
RESEARCH
In Dire Straits
2016 Outlook
Sectors
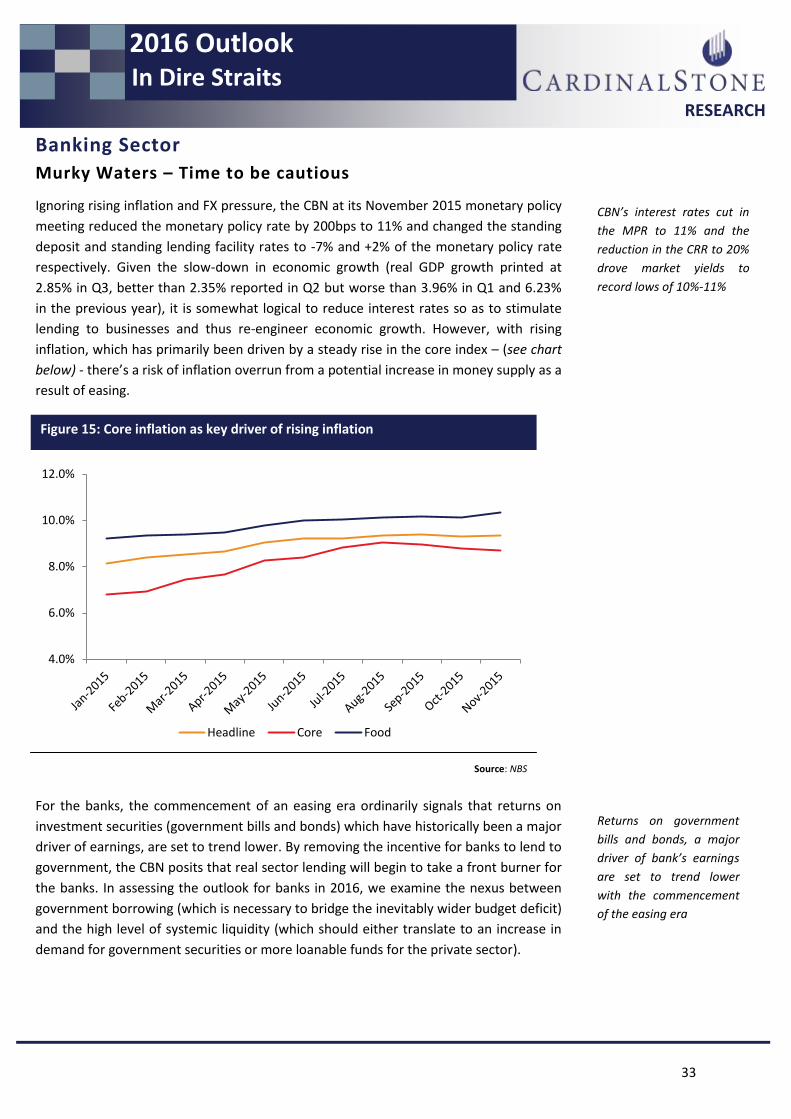
33
RESEARCH
In Dire Straits
2016 Outlook
Banking Sector
Murky Waters – Time to be cautious
Ignoring rising inflation and FX pressure, the CBN at its November 2015 monetary policy
meeting reduced the monetary policy rate by 200bps to 11% and changed the standing
deposit and standing lending facility rates to -7% and +2% of the monetary policy rate
respectively. Given the slow-down in economic growth (real GDP growth printed at
2.85% in Q3, better than 2.35% reported in Q2 but worse than 3.96% in Q1 and 6.23%
in the previous year), it is somewhat logical to reduce interest rates so as to stimulate
lending to businesses and thus re-engineer economic growth. However, with rising
inflation, which has primarily been driven by a steady rise in the core index – (see chart
below) - there’s a risk of inflation overrun from a potential increase in money supply as a
result of easing.
For the banks, the commencement of an easing era ordinarily signals that returns on
investment securities (government bills and bonds) which have historically been a major
driver of earnings, are set to trend lower. By removing the incentive for banks to lend to
government, the CBN posits that real sector lending will begin to take a front burner for
the banks. In assessing the outlook for banks in 2016, we examine the nexus between
government borrowing (which is necessary to bridge the inevitably wider budget deficit)
and the high level of systemic liquidity (which should either translate to an increase in
demand for government securities or more loanable funds for the private sector).
4.0%
6.0%
8.0%
10.0%
12.0%
Headline Core Food
Figure 15: Core inflation as key driver of rising inflation
Source: NBS
CBN’s interest rates cut in
the MPR to 11% and the
reduction in the CRR to 20%
drove market yields to
record lows of 10%-11%
Returns on government
bills and bonds, a major
driver of bank’s earnings
are set to trend lower
with the commencement
of the easing era

34
RESEARCH
In Dire Straits
2016 Outlook
Will banks really lend to the private sector?
What does history say – historical correlation between monetary easing
and credit growth: Recent history of the banking sector in Nigeria shows that there is
a weak correlation between low interest rate (monetary policy rate) and lending to the
private sector. From a high of 20.50% in 2002, the monetary policy rate was gradually
reduced to 18.50% by July of 2002, in an easing cycle that saw a further 200bps
reduction in monetary policy rate to 16.50% by December 2002. The easing cycle
continued in August 2003 when the MPR was further reduced to 15% and remained
there until May 2004 when Prof. Charles Soludo became the CBN governor. The average
monthly growth in credit to the private sector was just about 2% despite the 550bps
reduction in MPR over the 24 month period. This period coincided with a beginning of
an oil price rally (up +3% monthly on average) which implied that the government had a
strengthening foreign exchange reserve to support the currency and therefore could
pursue an easing/accommodative monetary policy.
The accommodative monetary policy continued under Soludo as the benchmark rate
gradually inched lower to 13% by February 2005 (raised to 14% in June 2006 for a brief 6
months period), 10% by December 2006 and eventually stayed at a low of 8% for about
3 months – June to September 2007. The easing cycle was temporarily interrupted for
about a year during which we saw steady rate increases (9% in Oct 2007, 9.5% in Dec.
2007, 10% in April 2008 and 10.25% in August 2008). After this temporary change of
course, the accommodative monetary policy continued, as MPR was at 8% by the end of
Soludo’s tenure in June 2009. Monthly average growth rate in credit to the private
sector for the 5 year period (during which monetary policy was accommodative for the
most part) was just about 3% - not significantly different from the earlier 3 to 5 year
period (2002 – 2005) when monetary policy rate averaged about 17%. Average
monetary policy rate was 11.64% during Prof. Soludo’s tenure as CBN governor –
552bps lower compared to the last 2 years of Joseph Sanusi’s tenure (Jan 2002 to May
2004).
During the early days of the Mallam Sanusi Lamido Sanusi’s era as CBN governor (which
commenced in June 2009), we saw an accommodative monetary policy regime, though
counter-cyclical as this was a period of falling oil price. The monetary policy rate was
reduced by 200bps to 6% in July 2009 (from 8% previously) and remained at this historic
low level for about 1 year. Once again, the low interest rate did not spur any substantial
credit growth (monthly average credit growth = +1% between August 2009 and August
2010 when MPR was at 6%). Eventually, we saw a switch in monetary policy focus which
led to steady increases in MPR until it reached 12% in October 2011 (from 9.25%
previously).
Historically in the banking
sector, there has been a
weak correlation between
reduction in the monetary
policy rate and lending to
the private sector

35
RESEARCH
In Dire Straits
2016 Outlook
-10%
-5%
0%
5%
10%
15%
0.00
5.00
10.00
15.00
20.00
25.00
Jan
-02
May
-02
Sep
-02
Jan
-03
May
-03
Sep
-03
Jan
-04
May
-04
Sep
-04
Jan
-05
May
-05
Sep
-05
Jan
-06
May
-06
MPR GCPS
Period 1: Monthly Average growth in Credit to Private Sector = 2%, MPR down to 13% from 20.5% over the period
Figure 16: Monetary Policy Rate and Growth in Credit
to the Private Sector 2002 - 2006
-4%
-2%
0%
2%
4%
6%
8%
10%
12%
0.00
4.00
8.00
12.00
16.00
Jun
-06
Oct
-06
Feb
-07
Jun
-07
Oct
-07
Feb
-08
Jun
-08
Oct
-08
Feb
-09
Jun
-09
Oct
-09
Feb
-10
Jun
-10
MPR GCPS
Peirod 2: Monthly Average growth in Credit to Private Sector = 3%, MPR down to 6% from 14% over the period
-10%
-5%
0%
5%
10%
15%
20%
0.00
3.50
7.00
10.50
14.00
Sep
-10
Feb
-11
Jul-
11
Dec
-11
May
-12
Oct
-12
Mar
-13
Au
g-1
3
Jan
-14
Jun
-14
No
v-1
4
Ap
r-1
5
Sep
-15
MPR GCPS
Peirod 3: Monthly Average growth in Credit to Private Sector = 1%, MPR raised to 13% from 6% over the period
Figure 17: Monetary Policy Rate and Growth in Credit
to the Private Sector 2006 - 2010
Figure 18: Monetary Policy Rate and Growth in Credit to
the Private Sector 2010 - 2015

36
RESEARCH
In Dire Straits
2016 Outlook
Why the historically weak transmission of monetary easing to lending?: As
explained above, the evidence clearly shows that there is low correlation between lower
monetary policy rate and credit growth over the period examined (2002 to 2015), which
is rather counter-intuitive as the reduction of interest rate is one of the policy tools of
monetary authorities to stimulate growth through credit expansion. The case for Nigeria
has historically defied this logic for a number of reasons:
1. Attractive risk-free instruments – federal government debt instruments (treasury
bills and bonds) have historically been offered at attractive yields given government'
high borrowing needs (necessary to bridge budget deficits) and hence the increased
supply of available debt securities. For this reason, the banks had little incentive to
embark on riskier lending to the private sector.
2. High risk profile of private sector lending (especially mid-tier corporates and SMEs)
given the dearth of infrastructure (power, roads, and rail) which increases the cost of
doing business and invariably raises the risk profile of businesses.
Will 2016 be any different?: The infrastructural problems of the Nigerian economy
– inadequate power supply, poor transportation network etc – which makes lending to
SMEs and mid-tier companies unattractive to Nigerian banks, are still very much
inherent. Hence, the economic structure of Nigeria still doesn’t incentivise the banks to
lend to the real sector. It seems, however, that there is sincerity and renewed
commitment by the government to resolve these problems. Whilst the government is
still in its early days, some concrete steps are being taken to deal decisively with these
problems and de-risk major sectors of the economy with the hope that the banking
sector will provide the required financing support.
The planned $25 billion (N4.9 trillion) infrastructure fund meant to be an extra-
budgetary allocation to improve power, road and rail networks and other related
infrastructure, the significant increase in federal government’s proposed 2016 budget
(34% higher than 2015 budget) and the concurrent increase in the allocation to capital
spending (c.N1.8 trillion or $9 billion), which is a huge 81% rise in the average CAPEX
budget of the last 3 years, are major steps from the fiscal authorities to improve the
operating environment for businesses and ensure that the easing in monetary policy
adequately translates into increased lending to the real sector as intended. Therefore,
we believe the underlying fiscal regime for this monetary easing cycle is very supportive
and committed to seeing that banks give out low interest loans. The CBN also indicated
further monetary accommodation – a reduction in cash reserve ratio to 20% from 25% -
for banks that show the proof of commitment to lend to the agricultural, manufacturing
and solid mineral sectors. We have measured faith in the ability of the federal
government to see through the fiscal interventions meant to improve Nigeria’s ease of
doing business and we therefore expect a gradual and steady correlation between low
interest rate (monetary policy rate) and credit growth.
High risk profile of the
private sector and attractive
yields on government’s
domestic borrowing are
reasons for the low credit
growth between 2002-2015
The planned $25 billion
infrastructure fund and the
increase in the allocation to
capital spending in the 2016
budget are positive steps
taken by the government to
improve the operating
environment and ensure
lending to the real sector

37
RESEARCH
In Dire Straits
2016 Outlook
Experiences of similar economies – any lessons for the banking sector in
2016?: On the back of the financial sector crisis of 2008/09, Nigerian banks more or
less abandoned their primary responsibility of financial intermediation in the Economy,
as shown by the contraction in the sector’s loan to deposit ratio to about 60% by April
2015 from over 100% in 2008/09. This was further compounded by government
borrowing as the government offered attractive yields on treasuries in a bid to raise
sufficient funds to bridge fiscal deficits. With banks going on to focus on top tier
corporations, mid-tier and small scale businesses, which are typically the engine of
growth and job creation in an economy, have had to grapple with the burden of poor
access to financing. The overall effect has been an increase in unemployment and an
output gap. With a loan to deposit ratio of 59.9% as at Q3’14 and a credit penetration
(credit to the private sector as % of GDP) of about 14% (data from the International
Monetary Fund - IMF), Nigeria’s banking sector is far from its peers- the lowest amongst
the frontier markets examined.
46.0%
84.3%
163.7%
56.5%
109.1%
86.1%
100.2%
82.0%
108.9%
59.9%
73.4%
114.1%
149.9%
78.1%
187.7%
109.4%
124.0%
97.0%
63.0% 69.0%
79.0%
142.0%
43.0% 51.0%
33.0%
125.0%
23.0% 14.0%
39.0%
52.0% 59.0%
45.0%
67.0%
125.0%
70.0% 65.0%
0.0%
40.0%
80.0%
120.0%
160.0%
200.0%
Loan-to-deposit ratio Domestic credit to private sector (% of GDP)
EM AVERAGE: LDR -101.6%, CPS (as % of GDP) 64.7%
Figure 19: Emerging Market Peers – Loan to Deposit Ratio (LDR) and Domestic Credit to the
Private Sector (CPS) as % of GDP (as at April 2015)
Source: IMF – Financial Stability Report
The Nigerian banking sector
loan to deposit ratio and
credit penetration is the
lowest among its peers in
frontier markets

38
RESEARCH
In Dire Straits
2016 Outlook
Despite the weak credit penetration in Nigeria, the country’s real GDP growth in the
last five years compares favourably with peers and in some cases even better. But
beyond real GDP growth, many of the peer economies with better credit penetration
have better human development indicators and low poverty rates. These countries
(for example Brazil, Russia, UAE, Indonesia, Malaysia, Turkey, South Africa etc) also
have better developed infrastructures – electricity and physical infrastructure like
roads, rails etc, which in our view, strongly underlies the improved quality of life and
relatively lower poverty incidences in these countries. This therefore brings to mind
the question of which should come first – infrastructure development or strong credit
growth, as Nigerian banks frequently cite the dearth of infrastructure as an
impediment to lending. In understanding the role of fiscal and monetary policy in
driving credit expansion in some of these peer frontier/emerging market economies,
we examined the evolution of credit growth in Turkey (see below).
Many of the peer
economies that have better
credit penetration have
developed infrastructures;
therefore it’s a chicken and
egg situation for
infrastructure development
and strong credit growth.

39
RESEARCH
In Dire Straits
2016 Outlook
Case – Study: Turkey’s Credit Expansion in the last decade
Turkey’s economy witnessed a substantial rise in credit growth
following the financial crisis of 2001 when the Turkish Lira depreciated
sharply. The credit expansion was driven by a number of government
reforms key amongst which was fiscal consolidation. Prior to 2001, the
Turkish government had a huge public debt. After the financial crisis,
the government scaled down on borrowing as debt to GDP ratio fell
while bank deposits to GDP ratio remained relatively constant –
implying that the banks had replaced government securities with
private credit. By mid 2005, total credits given by Turkish banks had
tripled with more than 90% extended to the private sector. Loan to
deposit ratio had risen to 62.9% in 2005 (124% as at Q3 2014) from
43.1% in 2002. The government also enacted other fiscal policies
relating to tax incentives on some types of credits which served to
further support the growth in credit during this period. For example,
taxes such as banking and insurance transaction tax as well as stamp
duties and fees, were eliminated on export credits. Monetary policy was
also very coherent and cohesive focusing on disinflation as a means to
spur credit demand. Following the establishment of an independent
central bank with the primary goal of price stability in 2001 by the
Turkish parliament, the bank switched to a floating exchange rate
regime and announced implicit inflation targeting as its policy focus. In
the aftermath of this, inflation fell to single digit after about 30 years.
The decline in inflation lead to improvement in both consumer and
corporate confidence which subsequently manifested in increased
credit demand.
Lessons for Nigeria – It is evident that cohesive fiscal and monetary
policies are very key drivers of credit growth and until this is achieved
we do not foresee credit growth in the private sector.
0.0
10.0
20.0
30.0
40.0
50.0
60.0
70.0
20
01
20
02
20
03
20
04
20
05
20
06
20
07
20
08
20
09
20
10
20
11
20
12
20
13
20
14
20
15
Credit to Private Sector (% of GDP)
Debt to GDP ratio (%)
Non-performing loans (%)

40
RESEARCH
In Dire Straits
2016 Outlook
What if government inadvertently bows to the pressure to borrow
more?
With budgetary deficit at N2.2 trillion - $11.1 billion (37% of planned budgetary
expenditure), it appears government is contradicting itself, as the monetary easing of
the CBN (reduction in MPR and CRR) which was in a bid to stimulate lending may not be
successful. As we had earlier noted, one of the primary reasons for low credit
penetration in Nigeria is because the government continues to borrow at attractive
yields thus crowding out the private sector; hence banks are not incentivized to take on
higher risk by availing credit to the private sector. The actual fiscal deficit in 2015 (main
and supplementary budgets) mirrors that of the 2016 budget as total bond issuances for
2015 stood at N788.72 billion ($4 billion). Though federal government bond yields have
tapered off significantly (given the excess liquidity of about N1.1 trillion - $5.6 billion as
at the start of 2016), the likelihood of a significant surge in government borrowing for
the year implies yields would eventually have to rise above current levels. It is therefore
likely that banks will be back to ‘business as usual’ with the implication that the
monetary easing of the CBN may not amount to much.
According to the President’s budget speech, only about N984 billion ($4.97 billion) will
be borrowed locally – which the fixed income market participants – especially Banks and
PFAs can adequately accommodate. We however do not discount the likelihood of a
supplementary budget and further borrowing as government may fall short of revenue
targets if oil price drops substantially from current levels. In addition, the government
intends to source about N900 billion ($4.5 billion) from foreign borrowing. Except the
funding gap is filled from multilateral agencies, either local or foreign (through
Eurobonds), Nigerian banks can access these instruments and thus their primary
financial intermediation role for economic growth may not see a significant
improvement in 2016.
Efficiency and Asset Quality – key watchwords to profitability in
2016
Lending highly dependent on macroeconomic clarity: We believe Nigerian
banks will be very conservative in lending and thus credit growth may well be at its
lowest in 2016, especially if foreign exchange availability remains a problem. Even if
government takes a decisive step to address forex availability by allowing a currency
adjustment, the significant decline in oil price which has led to a widening trade balance
implies that there may still be substantial supply deficit, at least in H1 until the impact of
any import substitution policy is felt. In addition to the numerous macroeconomic
weaknesses, we believe that the recent increase in general provisioning of banks by the
apex bank (the CBN raised general provisioning to 2% of gross loans from 1% in
November 2015), is negative for lending. Therefore, we reiterate that the outlook for
banks this year is at best modest, if not negative as we expect much slower loan growth
especially in H1 which is worsened by the recent fall in government yields.
More likely that the monetary
easing of the CBN will
amount to nothing if the
Federal Government borrows
more to fund its budget
deficit
Modest outlook for banks as
credit growth is expected to
slow especially if foreign
exchange scarcity continues
to persist.
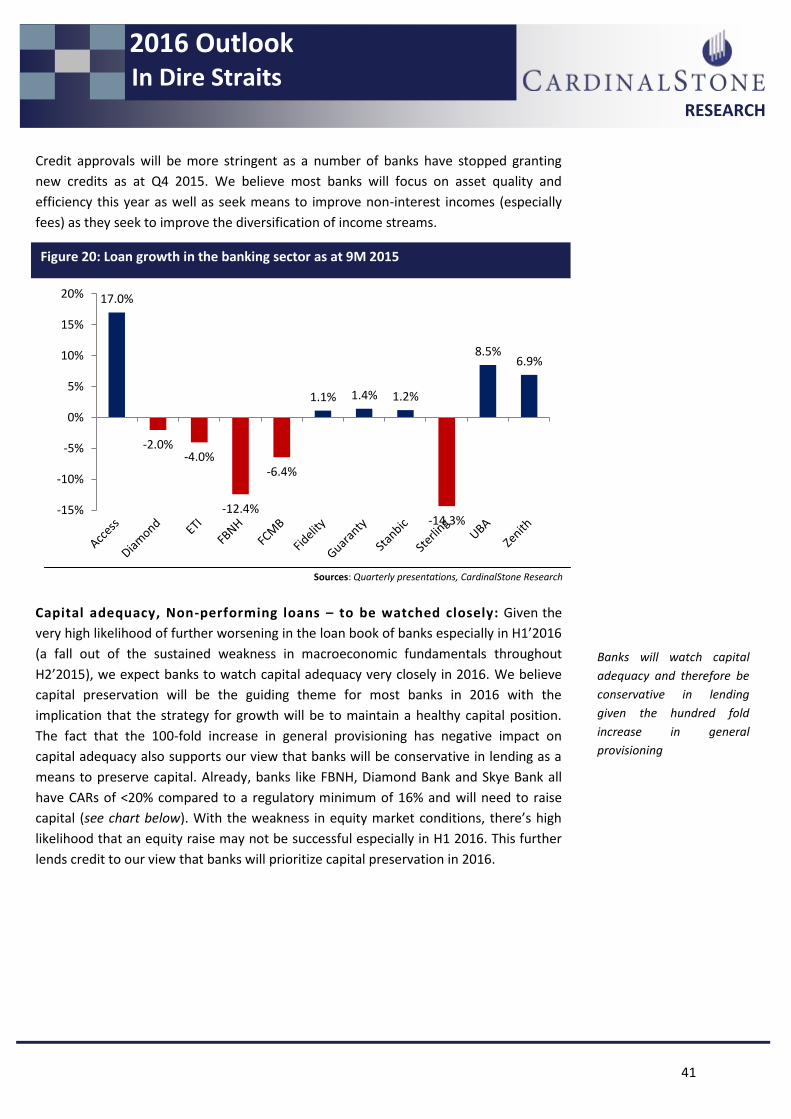
41
RESEARCH
In Dire Straits
2016 Outlook
Credit approvals will be more stringent as a number of banks have stopped granting
new credits as at Q4 2015. We believe most banks will focus on asset quality and
efficiency this year as well as seek means to improve non-interest incomes (especially
fees) as they seek to improve the diversification of income streams.
Capital adequacy, Non-performing loans – to be watched closely: Given the
very high likelihood of further worsening in the loan book of banks especially in H1’2016
(a fall out of the sustained weakness in macroeconomic fundamentals throughout
H2’2015), we expect banks to watch capital adequacy very closely in 2016. We believe
capital preservation will be the guiding theme for most banks in 2016 with the
implication that the strategy for growth will be to maintain a healthy capital position.
The fact that the 100-fold increase in general provisioning has negative impact on
capital adequacy also supports our view that banks will be conservative in lending as a
means to preserve capital. Already, banks like FBNH, Diamond Bank and Skye Bank all
have CARs of <20% compared to a regulatory minimum of 16% and will need to raise
capital (see chart below). With the weakness in equity market conditions, there’s high
likelihood that an equity raise may not be successful especially in H1 2016. This further
lends credit to our view that banks will prioritize capital preservation in 2016.
Figure 20: Loan growth in the banking sector as at 9M 2015
17.0%
-2.0% -4.0%
-12.4%
-6.4%
1.1% 1.4% 1.2%
-14.3%
8.5% 6.9%
-15%
-10%
-5%
0%
5%
10%
15%
20%
Sources: Quarterly presentations, CardinalStone Research
Banks will watch capital
adequacy and therefore be
conservative in lending
given the hundred fold
increase in general
provisioning

42
RESEARCH
In Dire Straits
2016 Outlook
Figure 21: Non Performing Loan ratio – Average by tier
Source: Quarterly Presentations, CardinalStone Research
2.67% 2.76% 2.90% 3.28%
4.56% 4.78% 4.92%
5.53%
0.00%
1.00%
2.00%
3.00%
4.00%
5.00%
6.00%
FY14 Q1'15 Q2'15 Q3'15
TIER 1 Banks TIER 2 Banks
21.7%
18.8%
22.8%
19.0% 18.6%
20.6% 20.3%
20.6%
19.3%
20.0%
21.1%
16.0%
17.0%
18.0%
19.0%
20.0%
21.0%
22.0%
23.0%
Figure 22: Capital Adequacy Ratios as at 9M 2015
Source: Quarterly Presentations, CardinalStone Research

43
RESEARCH
In Dire Straits
2016 Outlook
Good corporate governance again comes to the fore: In November 2015, the
CBN announced that 3 banks failed the capital adequacy test and were consequently
given until June 2016 to recapitalize. This brings to mind the series of events that began
in August 2009, when a number of banks that failed the CBN’s stress test were
subsequently “bailed-out” and given a timeline to recapitalize. The events culminated in
the acquisition of Intercontinental Bank and Oceanic Bank by Access Bank and Ecobank
respectively and the subsequent take-over of 3 banks by the CBN (through the bad bank
vehicle – Asset Management Corporation of Nigeria (AMCON)). Unlike in 2009, we do
not expect any intervention from the CBN (in the form of a bail out), as the affected
banks (going by CBN comments) are not likely to pose any systemic risk and AMCON is
still grappling under the pressure to fully dispose of the bad assets acquired in 2009 –
2011. We recall that the CBN also hinted that the 3 banks are not amongst the regional
and national lenders (which are not part of the group classified as ‘Systemically
Important’). Therefore, with the announcement of a recapitalization deadline set for
June 2016, the sector may witness a round of acquisitions as in the period from 2009 to
2011. The affected banks may be able to do a successful capital raise and therefore
recapitalize without acquisition, be acquired by another bank or even fail out-rightly.
And so there is the possibility that some banks may fail in 2016 if they do not meet the
recapitalization deadline. We believe the scenario will have a net positive impact on
banks perceived to have high corporate governance in the banking sector. Guaranty
Trust Bank and Zenith Bank readily come to mind in this regard.
Efficiency will be important in 2016: With our expectations of a sluggish loan
growth (if not a decline) and higher impairment charges, banks will seek to be more
efficient in managing costs as a means to remain profitable. Many banks will readily
review staff costs (one of the biggest overheads for a bank) and try to eliminate
redundancies – as 2016 presents the perfect opportunity to do so. We therefore expect
operating expenses to come down in 2016. Banks will also reassess the profitability of
many branches to prune down operating expenses per branch as the outright closure of
branches may be difficult to achieve as it requires regulatory approval. First Bank
commenced right-sizing in Q4’2015, as management seeks to reposition the bank
competitively (the banking group has one of the highest cost to income ratio – 61.3% vs.
peer average of 57.9% as at 9M 2015). The reduction in OPEX will also help manage the
impact of a substantial loan loss charge on the bank’s profitability. GTBank will have a
clear advantage in terms of efficiency given its systemic lower cost base relative to
peers.
Operating expenses should
come down in 2016 to
manage the impact of
substantial impairment
charges on the bank’s
profitability
Three Nigerian banks
required to recapitalize
before June 2016, a net
positive impact on banks
with high corporate
governance

44
RESEARCH
In Dire Straits
2016 Outlook
Clarity on fiscal reforms may induce loan growth in H2 ’2015: We believe loan
growth will gradually resume in H2 when there will be more clarity on key government
reforms. Since the start of the Buhari administration, there has not been coherence on
some of the key reforms of the Jonathan’s administration – most especially the power
sector reform with only isolated pronouncements and administrative changes. For
instance, the Ughelli power company was discouraged from expanding output capacity
with government citing transmission losses and also changes in the organizational
structure of the Transmission Company of Nigeria (TCN). One key positive that was
applauded by the power operators, is the increase in electricity tariffs as indicated in the
Multi Year Tariff Order (MYTO) upon which the privatization assumptions were built
with an implementation date of February 2016.
Whilst the government has indicated that the agricultural sector agenda of the last
administration will be continued, the delay in the swearing-in of ministers (which
eventually took place in November 2015) meant that very little was achieved in 2015.
Hence, even if banks decide to be opportunistic and aggressive in lending, we believe a
clear and strategic framework on key reforms is necessary. We expect that such might
not happen until Q2’2016 – our optimistic scenario.
40%
45%
50%
55%
60%
65%
70%
75%
-
5
10
15
20
25
30
35
Opex/Staff Cost to Income
Figure 23: OPEX per Staff (N’Million) and Cost to Income ratio (%) as at 9M 2015
Source: Quarterly Presentations, CardinalStone Research
A clear and strategic
framework on key
reforms by the Federal
Government will likely
induce loan growth to
the real sector

45
RESEARCH
In Dire Straits
2016 Outlook
Quality names are undervalued despite all – From a long term point of view, a
number of Nigerian banks offer opportunity for major upsides at current valuation.
Whilst we are wary of many banking stocks in 2016 – given the myriad of issues
enumerated earlier, banks such as GTBank and Zenith Bank are still favourites. These
are banks with strong corporate governance and relatively better quality loan books.
We are very wary of Tier 2 banks in 2016, given their relatively weaker competitive
positioning.
Figure 24: Four year P/B trend of NSE Banking Sector Index (NGSE B10) and MSCI
Emerging Markets Banking Index (MSCI EMBK)
0.0
0.2
0.5
0.7
0.9
1.1
1.4
1.6
1.8
Jan
-12
Ap
r-1
2
Jul-
12
Oct
-12
Jan
-13
Ap
r-1
3
Jul-
13
Oct
-13
Jan
-14
Ap
r-1
4
Jul-
14
Oct
-14
Jan
-15
Ap
r-1
5
Jul-
15
Oct
-15
Jan
-16
NGSEB10 P/B MSCI EMBK Index
Source: Bloomberg, CardinalStone Research
GTBank and Zenith Bank offer
opportunity for major upsides
at current valuation given
their corporate governance
and quality loan books

46
RESEARCH
In Dire Straits
2016 Outlook
Insurance Sector
Premium growth threatened in 2016
Sluggish short-term growth outlook for gross premium: The insurance sector
has maintained an annual average growth of about 10% in gross premium since 2012
majorly on the back of a growing population and an expanding middle-income class.
Despite this however, we expect a slowdown in premium growth in the short to
medium term on account of frail economic activities stemming from the ongoing rout in
crude oil prices and its effect on the economy. We expect the impact to be more on the
gross life premium as demand is largely dependent on excess disposable income
excluding group life which is compulsory under a joint PENCOM and NAICOM regulation.
Discounting the short term economic crises, we believe the long term growth outlook
for the industry is positive given the very low insurance penetration in Nigeria compared
to other emerging markets. We foresee increased foreign investments and regulatory
reforms targeted at deepening penetration in the medium to long term.
Falling interest rate expected to shrink investment income: We have seen
very strong commitment towards reducing interest rates so as to stimulate the
economy. This is evidenced by the significant slump in yields on fixed income
instruments. Average yields on FGN bonds declined from 15% to 10% in the second half
of 2015. High interest rates have been significant drivers of profitability in the Nigerian
insurance industry as more than half of the premiums are invested to earn guaranteed
returns to easily fund future claims and to boost profit. The low interest regime will
thus result in insurers reinvesting premiums at considerably lower yields, causing
investment income to shrink significantly and invariably reducing bottom line.
0.31
0.32
0.33
0.34
0.35
0.36
0.37
0.38
0
50
100
150
200
250
2010 2011 2012 2013 2014
NON LIFE LIFE Total premium% of GDP
Figure 25: Insurance sector penetration in Nigeria (2014)
Source: NAICOM
Insurance premium
growth may slow down in
2016 on account of frail
economic activities
Insurers may increase
premium prices or invest
in riskier asset to cushion
the impact of declining
interest rates

47
RESEARCH
In Dire Straits
2016 Outlook
We foresee a gradual upward review in premiums (removing the significant discounts)
and possibility of taking on riskier assets. We also foresee weak demand for long term
savings and retirement-income products as expectations of low investment income
compounded by the eroding effect of high inflation will impact potential investors.
Dexterity in underwriting - a key differential : Dexterity in underwriting will be
central to maximizing profitability and minimizing claims and underwriting expenses in
2016. The current macroeconomic pressures may tempt insurers to be lax in their
adherence to underwriting standards in order to boost cash flows and grow revenues at
the expense of adequately pricing the risk. Underpricing of risk has been the antithesis
for high underwriting expenses and insurance claims in Nigeria, as underwriters fail to
match risks adequately to returns. The meagre outlook of investment income combined
with the possibility of increased claims may intensify the negative impact of under
pricing on their bottomline. With the new trend of low interest rate, insurers now need
to re-examine their approach to underwriting for opportunities to enhance efficiency.
This will prevent underwriting leakages or erosion of income due to previously adopted
sub-optimal underwriting strategies, processes and pricing. However certain insurance
companies like Custodian & Allied Plc and AIICO Insurance Plc have shown a good track
record of underwriting performance. We also expect the synergy from the
AXAMANSARD merger to translate to enlarged technical capability and quality
underwriting.
Long term optimism for the sector: The government has reiterated its
commitment to drive economic development by stimulating real sector lending,
increase capital expenditure and implement social welfare benefits. The staunch
commitment to invest in infrastructure and diversify the economy, if properly
implemented, will boost national output, employment and most importantly consumer
income, which will enhance property and home ownership in the long term as well as
demand for both life and non life insurance. We therefore expect significant growth in
the insurance sector in the medium to long term as the benefits of economic
diversification and sound policy implementation comes to fruition. However, in the
short term, the growth in premium will slowdown relative to historic performance as
the country navigates its difficult phase created by the plunge in oil price coupled with
refusal to save for rainy days and past corruption culture.
Current economic pressures
may tempt Insurers to be lax
in underwriting standards so
as to gain transactions
We expect significant growth
in the insurance sector in the
medium to long term as
economic diversification and
sound policy reforms come to
fruition

48
RESEARCH
In Dire Straits
2016 Outlook
The Consumer Goods Sector
Many Moving Parts – Mixed Outlook
There are a number of factors shaping the business outlook for consumer goods
companies in 2016. These include the domestic fiscal and monetary policy (and their
resulting impact on interest rate, inflation, accessibility to foreign exchange, and
aggregate consumption) and global commodity price. Amongst these factors, we
consider the accessibility to foreign exchange the biggest factor that would influence
the performance of the sector. We examine these factors below and assess the impact
on the 2016 economic performance of the consumer goods sector:
Accessibility to FX: The President during his budget speech acknowledged the biting
impact of foreign exchange controls on the performance of businesses, and the need for
the central bank to re-evaluate and modify the current exchange rate policy to create
some flexibility. We believe an expected change in the FX policy will restore confidence
and stimulate interest of international and local investors in the economy and thus we
may see a gradual return of both foreign portfolio and foreign direct investments which
will then help improve the availability of FX. In addition, the government intends to
source close to $4.5 billion (N900 million) in foreign loans, which will further help
improve the supply of FX. Therefore, we envisage that these steps will help alleviate the
FX problems facing the consumer goods sector and improve the overall performance of
the sector. We note however, that these steps may not happen until Q2 2016 as the
apex bank may delay to make the anticipated changes to FX policy. Consumer goods
companies – from food producers to home and personal care companies – currently rely
on imported commodities as inputs in production. We estimate that imported inputs
account for 58.9% on average of production inputs for the consumer companies under
our coverage.
Figure 26: Percentage contribution of imports to production inputs
Company Name % of Imported Inputs Major Imported Inputs
Flour Mills of Nigeria Plc 99.5% Wheat, Raw Sugar
Dangote Sugar Refinery Plc 95.9% Raw Sugar
PZ Cussons Plc 72.0% Palm Oil Derivatives
Unilever Nigeria Plc 60.0% Palm Oil Derivatives, Fat and
Butter Oil
Guinness Nigeria Plc 35.5% Malted Barley, Hops
Nigerian Breweries Plc 13.0% Malted Barley, Hops
UAC of Nigeria Plc 0.6% Fat and Butter Oil
Nestle Nigeria Plc 36.9% Maize, Coffee bean
The unavailability of foreign exchange in the Nigerian economy (a direct fall out of the
drastic drop in the price of crude oil and the weakening of the nation’s export base cum
FX receipts of the country), has significantly hampered the manufacturing sector at
Sources: Annual Reports, CardinalStone Research
Accessibility to foreign
exchange will be the
major factor that will
influence the performance
of the consumer goods
sector in 2016
A favourable change in
the FX policy and the
Federal Government plans
to source foreign loans
will help alleviate the FX
problems facing the sector

49
RESEARCH
In Dire Straits
2016 Outlook
large. Earlier in H2 2015, the CBN restricted many items, classifying them as ‘ineligible’
for the purchase of FX after many attempts to manage FX demand proved abortive. In
Q4 2015, the restriction informally extended to even the so called eligible items given
the waiting periods (sometimes up to 60days or more) experienced by most
manufacturing companies after applying for foreign exchange. As a result of this and the
fuel shortage that persisted for most of 2015 (worst in Q2 when there was 2 weeks of
complete shut-down), the performance of the manufacturing sector has been very
dismal as the sector’s GDP has contracted consistently from Q1 to Q3 (see chart below)
– a complete irony to the past performance of the sector (14.72% growth – quarterly
average for 2014).
Aggregate consumption – dissecting the twin impact of government’s
social investment and shrinking aggregate disposable income: The weak
macroeconomic outlook for 2016 doesn’t bode well for consumption. With low
federation account disbursement to state and local governments, many state
government workers are owed salaries – even after the so called “bail-out” package
availed some states after the inauguration of the new government in May. The weak
business outlook across many sectors implies that there will be job losses, as inflation
has been on an uptrend with the outlook for 2016 not benign. As at December 2015,
some banks had commenced right sizing – as a means of pruning costs. The fallout will
be a reduction in aggregate disposable income and decline (or slower rate of growth) in
private sector/household consumption. However, the government – for the first time –
will directly be spending up to N500 billion (about $2.5 billion) on social investments
with about N300 billion ($1.5 billion) expected to be expended on the school feeding
program (1 meal per day for primary school pupils) and stipends (N5,000 - $25 per
month) to the most vulnerable Nigerians.
15.41%
14.01%
16.00%
13.47%
-0.70%
-3.82%
1.75%
-0.10
0.00
0.10
0.20
Q1 Q2 Q3 Q4 Q1 Q2 Q3
2014 2015 Nominal GDP Growth Real GDP Growth
Figure 27: Manufacturing sector GDP (2015)
Sources: NBS, CardinalStone Research
Unavailability of foreign
exchange in the Nigerian
economy led to the dismal
growth rate in the
manufacturing sector in
2015, a departure from its
high levels in 2014
Possible decline in
aggregate consumption due
to shrinkage in disposable
income, however, the
Federal Government plans
to spend N500 billion on
social investments

50
RESEARCH
In Dire Straits
2016 Outlook
This is significantly positive for the consumer goods sector especially for the food
producers given the direct positive impact on revenue. Overall, we believe the net
impact of government’s expenditure on social investment and lower aggregate
disposable income will vary for each sub-sector. The impact will be stronger for the food
and beverage producers and much lower for brewers and companies in the home and
personal care segment. In our opinion, the brewers (NB, Guinness) will be more directly
impacted by the shrinkage in middle class income. The impact on home and personal
care companies will be mixed depending on their portfolio mix as some of these
companies also produce food products.
Falling commodity price – impact doused by weak currency: Agricultural
commodities which are mainly input materials for consumer companies have declined
by 11.6% in 2015, according to the Bloomberg Agriculture Commodity Index.
The key agricultural inputs for Nigerian consumer companies – wheat, raw sugar and
crude palm oil, have all declined by an average of 28.8%, 17.9% and 5.1% in 2015. This
ideally should have translated into improved margins for Nigerian consumer companies
but the steep depreciation in USD/NGN exchange rate (-38% in 2015) at the parallel
market (where most companies have resorted to sourcing for their FX given the
difficulty in accessing FX at the interbank window) overshadowed the impact of lower
commodity prices. With a further devaluation likely in 2016, consumer companies are
not likely to benefit from the weak outlook of agric commodities and therefore we
expect a decline in gross profit margins for the companies in our coverage universe.
Figure 28: Bloomberg Agriculture Commodity index (Jan. to Dec. 2015)
220
240
260
280
300
Sources: Bloomberg, CardinalStone Research
Net impact of government’s
expenditure on social
investment and lower
aggregate income to be
strongly positive for the
food sub-sector
Decline in gross profit margins
despite the decrease in
agricultural commodities given
the weakening naira and
scarcity of foreign currency

51
RESEARCH
In Dire Straits
2016 Outlook
220
240
260
280
300
320
340
360
380
Dec
-13
Feb
-14
Ap
r-1
4
Jun
-14
Au
g-1
4
Oct
-14
Dec
-14
Feb
-15
Ap
r-1
5
Jun
-15
Au
g-1
5
Oct
-15
Figure 29: Gross profit margins of Consumer Companies (as at 9M 2015)
Figure 30: Trend in commodities as at 9M 2015 (Oct.2014 – Oct.2015)
Sources: Company Filings, CardinalStone Research
10.6%
22.6% 24.2%
27.4%
38.4%
43.2%
46.6% 48.8%
10.3%
22.0%
25.7% 27.1%
34.8%
44.5% 46.9% 46.9%
0%
10%
20%
30%
40%
50%
FlourMills UACN Dangote Sugar
PZ Unilever Nestle Guinness NB
9-Month 2014 9-Month 2015
Sources: Company Filings, CardinalStone Research

52
RESEARCH
In Dire Straits
2016 Outlook
The Industrial Goods Sector
Budget Allocation to CAPEX supports Construction Outlook
Government’s expected spend on capital projects may likely boost
cement demand: The government, particularly at the federal level, is likely to be a
major driver of cement demand in 2016 evidenced by the proposed 2016 budget of N6
trillion ($30.45 billion) which is the country’s most ambitious since 1999. In our view,
the expected CAPEX on infrastructural development (N1.8 trillion – about $9 billion)
should boost construction activity (-0.11% in Q3’15), if adequately implemented.
Cement which constitutes about 7% to 15% of concrete - (a mixture of cement and
other aggregates), is a key material in construction; thus an increase in construction
activities naturally means a rise in demand for cement as well. On the contrary, we see
limited upside for building and construction activities by the states as squeezed monthly
revenue distributions by the Federation Account Allocation Committee (FAAC) bites
hard. With reduced allocation already taking a toll on state finances, especially in
meeting their recurrent expenditure, we think funding capital projects in 2016 might be
a challenge, particularly in states where internally generated revenue (IGR) accounts for
a small portion of total revenue.
Figure 31: 2016 budgeted CAPEX rises above recent average
Source: Central Bank of Nigeria, CSP Research
0%
5%
10%
15%
20%
25%
30%
35%
-
0.40
0.80
1.20
1.60
2.00
2010 2011 2012 2013 2014 2015 2016
CAPEX % OF Total Budget
The expected CAPEX on
infrastructure
development will drive
cement demand in 2016
53
RESEARCH
In Dire Straits
2016 Outlook
Private sector to take a cue from government efforts to boost
infrastructure: Nigeria's construction market witnessed slow growth in 2015 due to
the weak macroeconomic environment. We think that a large chunk of the activity
recorded in the building and construction sector in 2015 could be attributable to the
private sector given that government activity would have been modest in an election
year. We foresee a more aggressive roll-out of building and construction projects from
the private sector in 2016 with an attendant positive implication for cement demand.
Firstly, much of the uncertainty that characterised the pre 2015 election appears to
have dissipated with the smooth transition of power, appointment of cabinet members
and a clear economic policy regarding a wide range of issues (except devaluation).
Secondly, an examination of data for the last three years reveals that demand for
building and construction has been driven more from the private sector with a
correlation factor of 91%. This data also reveals that private sector expenditure confirms
a strong correlation with government expenditure with a correlation factor of 96%,
meaning an uptick in government expenditure is likely to affect private expenditure cum
spend on building and construction activities. Our optimism on private sector
construction activities in 2016 is however doused by fallouts from broader macro-
economic issues such as depressed oil revenue and weaker currency, and these could
potentially taper the anticipated improvement in private sector driven construction
activities.
Key points from the maiden press briefing by the Minister of Works,
Power and Housing: The Minister of Power, Works and Housing, Babatunde
Fashola (SAN), officially unveiled his short term plans to address housing deficits and
improve road infrastructure: 1) The Lagos-Ibadan expressway which has been under
construction and the second Niger Bridge are of paramount importance and will receive
urgent attention; 2) re-introduce highway tolling to raise additional funds to finance
road infrastructure and ensure efficient road maintenance; 3) reclaim the full width of
all Federal roads; and 4) replicate the Lagos Home Ownership Mortgage Scheme across
the federation with an initial pilot of 40 blocks per state. These steps are positive in our
view, however we think the minister will need to work hard to find extra budgetary
sources of finance to be successful in achieving these targets. The value of contracts
with the Ministry of Works is valued in excess of N2 trillion ($10.15 billion). As it is, the
proposed CAPEX spend of N1.8 trillion ($9 billion) will not be sufficient to fund these
projects and other areas that need attention – housing, transport. Nonetheless, these
plans bode well for the cement sector over the next two years.
Pricing Dynamics: Likelihood of crashing? Notwithstanding the boost to
cement capacity anticipated this year, we do not see major cuts in cement prices in
2016. To stimulate sales in 2015, Dangote Cement Plc, also Africa’s largest producer of
the product, cut prices in the local market by N300 per 50kg bag for its 3X cement
brand. The price slash was a game changer and increased sales pressure on key
competitors. We expect demand would increasingly become stronger, especially from
the government’s focus on capital expenditure.
Private sector construction
activities may be doused by
macroeconomic issues
regardless of its correlation
with government expenditure
Despite strong demand
expectations, we believe the
industry strategy will tilt
towards volume play and not
price hike

54
RESEARCH
In Dire Straits
2016 Outlook
Despite our expectation of a resumption of increased demand this year, we do not see
producers hiking prices as we believe volume play would be a core strategy, given the
need for the likes of DANGCEM and WAPCO to roll out higher volumes from their latest
additional capacities. Furthermore, we are of the view that the lingering risk of further
currency devaluation might keep cement prices in check. We therefore reiterate that
cement prices would at best, remain constant.
Cement market growth seen at 25% in 2016: In the first nine months of
2015, output declined by 6%, at odds with its five year average growth rate of 12%;
impacted by the general negative trickle-down effect from depressed oil prices and
political uncertainty on economic activities for the period. Even though we expect
macro headwinds to dampen demand expectations in 2016, we foresee a more
aggressive roll-out of building and construction projects from both the private and
public sector. Consequently, we estimate cement consumption in 2016 will grow by up
to 25% from 19 million metric tonnes to 23 million metric tonnes.
We expect cement
consumption to grow despite
macro headwinds

55
RESEARCH
In Dire Straits
2016 Outlook
Power Sector
Awaiting Clarity and Progress on Reform
Power infrastructure inefficiencies to drive renewables
opportunities: Nigeria has plentiful renewable energy resources, led by solar
energy, biomass and wind - with potential existing for geothermal and tidal power. At
the stage of development of Nigeria's power sector, renewable power generation is
negligible as the policy and regulatory framework needed to stimulate demand and
attract investors into the renewable industry is inadequate. Another key barrier to the
successful commissioning of large-scale renewable projects is the country's
underdeveloped grid infrastructure and inefficient transmission and distribution
network. Such deficiencies mean that connecting utility-scale renewable energy project
to the grid will be difficult, and large line losses are likely. The push for renewable and
greater energy efficiency in the power sector is in line with the government's aspiration
to diversify from its heavy reliance on hydropower and natural gas. We do believe there
is scope in particular for localised renewable systems as these hold greater promise than
commercial scale projects. In fact, the inefficiencies within the power infrastructure and
low electrification rates actually provide opportunities for this decentralised approach
to renewable power generation.
Electricity prices rise in 2016 following MYTO review : The Nigerian
Electricity Regulatory Commission (NERC) has increased electric tariffs by 45% in a bid to
encourage investment into the sector as the non-reflective tariff was a major deterrent
to further investment. The tariff increase was delayed to allow the NERC sensitise the
citizens on the need for the increase. The new price is expected to allow effective pass-
through of cost to customers and allow investors earn a competitive rate of return on
their investments. The new electricity tariff regime removes fixed charges for all classes
of electricity consumers. Fixed charge is that component of the tariff that commits all
electricity consumers to pay an approved amount of money not minding if electricity
was consumed during the billing period. Asides this cost saving element, the new tariff
regime comes with renewed commitments by the distribution companies to rapidly
improve on the downtime and quality of electricity supply. There are concerns of the
increase resulting in higher inflation; inflation already stands at a 9.4%. However, we
believe making electricity available for consumption outweighs any concern about
inflation.
Weak transmission, debt overhang threaten power sector: A combination of
weak transmission grid and debt overhang has stalled generation capacity and
continued to weigh down the nation’s power sector. A liquidity crunch in the energy
sector has hit the country’s growth and stalled fresh investment in power generation. A
glance at the structure of the country’s power sector shows an energy supply chain
comprising generation (GENCO) and distribution (DISCO) companies. The GENCOs sell
electricity to the DISCOs, which supply electricity to the consumers. Collection rate by
the DISCOs has been poor and has affected their ability to pay the GENCOs with total
The inefficiencies within the
power infrastructure may
provide opportunities for
decentralised renewable
energy generation
The new tariff regime will
renew the commitments of
DISCOs to improve downtime
and quality of electricity
supply

56
RESEARCH
In Dire Straits
2016 Outlook
debt outstanding rising to N68 billion ($345 million) as at July 2015. This in turn has
made it difficult for the GENCOs to sustain investment and pay off acquisition loans.
Facing the prospect of huge and increasing non-performing assets, lenders are pulling
the plug. Added to this is the weak transmission network which has limited the GENCO’s
capacity to improve supply in the country. A recent study of power generation statistics
between January and August 2015 conducted by the Power Advisory Group within the
presidency showed that only 25% of Nigeria’s 12,522MW of installed capacity reaches
the end user. Widespread inefficiency means that only 3,879 MW of this capacity is
operational, with 3,600 MW transmitted and 3,100 MW distributed. Most of the short
fall which was about 5,381 MW is capacity that is unavailable due to obsolete
equipment and poor maintenance or to ongoing maintenance and repair activities at
existing power plants. Also, about 3,262 MW is non-operational primarily due to gas,
water, high frequency, and transmission line constraints.

57
RESEARCH
In Dire Straits
2016 Outlook
Oil and Gas Sector – Upstream
Grim Oil Price Outlook Threaten Funding
Hope rises for the Petroleum Industry Bill (PIB): The government is
breaking up the PIB, which has been stuck in parliament for years, replacing it with
several smaller bills. The first, a 45-page Petroleum Industry Governance and
Institutional Framework (PIGIF) bill which splits the Nigerian National Petroleum
Corporation into two, the Nigerian Petroleum Assets Management company (NPAM)
and a National Oil Company (NOC), which will be an integrated oil and gas company
operating as a commercial entity and partly privatized (at least 30%). It will pay
dividends from its operations to the federation account in addition to royalty and taxes.
NPAM will own and manage petroleum assets on behalf of the government. It will be
responsible for the management of the oil and gas assets that do not require cash calls
(upfront funding). The bill also creates the Nigeria Petroleum Regulatory Commission
(NPRC), which will serve as the regulator for the entire industry, from licensing rounds
to fuel prices. The new bill strips the president of discretionary powers to allocate oil
blocks and also places significant limits on the powers of the minister compared to the
PIB. Expectations are high but no one should expect that this will be a quick fix and
complications may arise not from the content of the PIGIF but rather from what it does
not contain such as the host community issues, local content and special provisions for
indigenous petroleum companies which we think a separate bill will address.
Lower-for-longer oil price deals blow to the growth of domestic E &
P companies: The rapid growth of oil prices between 2009 and 2014 spurred a cycle
of historic demand for oil and gas assets by Independents. These wave of acquisitions
have seen local oil production reach c.215,000 bopd, representing 10% of Nigeria’s
overall production. However, the dramatic fall in oil and gas prices beginning in the
summer of 2014 and the uncertain outlook could see indigenous appetite decline as
funding becomes more difficult to attract even if assets are cheaper. The fall in global oil
prices and the corresponding rise in Non-Performing Loans (NPLs) have caused Nigerian
banks to reassess their upstream portfolios. Nonetheless, we expect that select names
that have built viable businesses over the years will continue to grow albeit at a less
than previously conceived rate. 2016 could well be known as the Year of the Cutbacks,
as companies dial back on capital expenditures amid tough markets, refocus their
spending and see the completion or push-back of major projects. The two Independents
we cover on the Nigerian Stock Exchange – SEPLAT and OANDO – have both guided to
lower CAPEX in 2016 compared to 2015 which could impact future production guidance.
FGN is breaking up the PIB
into smaller bills to enable
easy passage
2016 could well be known as
the Year of the cutbacks, as
companies dial back on
capital expenditures and
tough markets

58
RESEARCH
In Dire Straits
2016 Outlook
Oil and Gas Sector – Downstream
Government Shying from Full Deregulation of Sector
Price modulation commences: The fuel subsidy program has been fraught with
lots of opacity, scandals and disagreements over inclusion of interest payments and
exchange rate differentials. Nigeria is set to re-jig its costly fuel subsidy program as it
adopts a policy of price modulation which entails an elastic price mechanism regime to
be reviewed periodically to reflect the prevailing international price of crude. The novel
price modulation system will place a possible N97 per litre cap on the price of fuel to
ensure that Nigerians are insulated from the vagaries of the global crude price.
Elimination of the subsidy will be a welcome relief for the government’s tight budget
which annually allocate huge sums for petroleum subsidies. The savings that accrue can
therefore be targeted towards critical infrastructure and social welfare programs. We
however see some potential problem with the new policy as landing costs change daily,
the PPPRA would have to change pump prices frequently to avoid accruing subsidies
and the NNPC would then need to communicate new changes to all market participants
and monitor for compliance daily.
Refineries to operate semi-autonomously: Conflicting reports have emerged
over the future of Nigeria’s three refineries. While the first information was a product of
a panel set up by the NNPC to assess the performance of the refineries and associated
logistics, the second statement conveyed a political undertone. The NNPC, leaning on
the outcome of its Stock Reconciliation Committee, had recommended the sale of the
refineries located in Port-Harcourt, Warri and Kaduna. But few days after, the NNPC
made a volte-face, stating that the refineries would not be sold. The committee had
made a strong case, citing the huge cost components of running the refineries and
concluded that it would be unprofitable to continue with their operation. However,
from all indications the government is set to adopt the NLNG model which would give
the refineries some sort of autonomy without privatising them. In the new model, the
refineries would buy their own crude oil, refine it and make remittances to the
Federation Account Allocation Committee. There is an urgent need to revitalise the
refineries as failure to do so would make them ill-equipped to compete with the US$9
billion (N1.7 trillion) Dangote Refining Company which is expected to come on stream in
2018. The consequence could be a natural death for these government refineries as was
the case when the emergence of MTN Nigeria sounded a death knell on Nigerian
Telecommunications Limited (NITEL), two years after it commenced operations.
Nigeria is set to re-jig its
costly fuel subsidy program
as it adopts a policy of price
modulation
FGN is set to adopt the
NLNG model which would
give the refineries some sort
of autonomy without
privatising them

59
RESEARCH
In Dire Straits
2016 Outlook
The Agricultural Sector
Still a Priority Sector for the Buhari Government
Policies shaping the sector in 2016 : In a time of plunging oil prices and bleak
outlook on oil revenues, the present administration has identified agriculture as a sector
of interest to drive economic growth given its vast potential to generate revenues,
shore up the nation’s foreign reserve and ensure economic prosperity. Certainly, after
decades of neglect, the sector has begun to receive the much-needed attention it
deserves. To unlock the sector’s potential and drive growth in 2016, the government
aims to pursue a private sector led agricultural transformation following the footsteps of
the former Minister of Agriculture (Akinwunmi Adesina) in the immediate past
administration, by ensuring food security and making the industry more productive,
efficient and competitive. Currently the sector is still largely subsistence with
commercial farming accounting for less of agricultural activities. The lack of access to
cheap finance and poor infrastructure still remain an impediment to domestic and
foreign investments in the sector. To combat this, the government has put together
proposed regulations, policies and programmes to take effect in the next fiscal year
which we believe will encourage private sector investments across the entire value
chain. This includes: Agricultural credit fund worth N500 billion ($2.5 billion) to commercial
farms/agro enterprises to promote commercial agriculture, develop agricultural
enterprise and provide credit support for production, storage and processing of
target commodities which includes cassava, rice, oil palm, rubber, wheat,
cotton, fisheries and livestock. This would be given to farmers at single digit
interest rates provided they are large scale commercial farmers with assets of at
least N200 million ($1 million) with prospect of growing the assets to N350
million ($1.8 million) within three years.
CBN anchor borrowers programme worth N40 billion ($203 million) for rice and
wheat farmers with the aim of advancing farmers from subsistence farming to
the commercial production. It further aims to create economic linkages
between 600,000 small scale farmers and reputable large scale processors to
increase agricultural output and improve capacity of integrated mills.
The FG plans to set up a $25 billion (N4.9 trillion) infrastructure fund to address
the nation’s poor power and transport (road and rail) infrastructure. Lack of
good electricity supply, road and rail networks have increased the cost of
agricultural activities and made locally sourced agro raw materials less cost
competitive to similar imported products.
We believe that these steps taken will not only induce local and foreign investments but
also ensure growth in agricultural output and a steady supply of raw material inputs for
industries. Furthermore, if properly implemented we see growth in the number of jobs
created by the agriculture sector and a steady decline of the food import bill.
Agriculture Identified as
a priority sector to drive
economic growth in
2016
N500 billion agriculture
credit fund to promote
commercial agriculture
in Nigeria
$25 billion Infrastructure
fund would reduce the cost
of domestic agricultural
activities

60
RESEARCH
In Dire Straits
2016 Outlook
A new Minister for Agriculture: Audu Ogbeh, a renowned farmer is the current
Minister for Agriculture. His appointment closely aligns with his wealth of experience in
agriculture, having run a farm covering a variety of produce for over 30 years. His
passion and commitment to farming has lead to pace setting achievements to show for
it. For example, he was the first Nigerian to produce stone free rice in 1986 after he
established a stone-free rice mill in Markurdi. Also, he set up the first castor oil
production factory in Africa in 2014. After his tenure as PDP chairman in 2005, he
became the Managing Director of Efugo farms and initiated an out-growers programme
to engage 20,000 farmers. His competence, interest and passion to reform the sector,
ensure food security and develop young farmers are not in doubt. With him at the helm
of affairs, we see a year of development and growth in the agriculture sector.
Livestock and Dairy Production: The ministry of agriculture plans to embark on
an overhaul of dairy production in Nigeria to support the school feeding plan under the
government social investment programme which aims to give 30 million students a litre
of milk daily. We see this as an opportunity to unlock the potential in the sub- sector
and end the associated high import bill which currently stands at $1.3 billion (N256
billion). Currently, the sub sector lacks new investments, due to inherent challenges and
other difficulties farmers face in producing fresh milk in the country, predominantly the
northern region. These challenges include low milk yield of cattle, low level of cattle
nutrition, poor husbandry practices and animal health challenges. In addition, low
utilization of improved livestock technologies and inadequate infrastructure has also
contributed to the lack of investment and farmer’s interest in dairy production. This
resulted in substantial importation of dairy products. In 2014, domestic production of
milk was 50,000 litres per day which is low compared with other African countries.
Figure 32: Livestock and diary statistics in key Africa countries
Nigeria Kenya South Africa
Cows (Millions) 2.37 5.74 1.00
Milk Yields (kg/cow) 241 653.3 3400
Annual Milk Production (Millions) 0.57 3.75 3.40
To address these problems, the ministry plans to open 200 artificial insemination
centres throughout the country to improve livestock production and produce cows with
high dairy yields. Also it plans to embark on a dairy production programme which will be
private sector driven to develop massive grazing grounds for cattle and irrigation field to
bring an end to roaming and its attendant problems. The government has reached an
agreement with Ireland Republic to begin improved cattle breeding to address dairy
deficits. Also, Friesland Campina West Africa Milk Company Plc (WAMCO)
manufacturers of Peak Milk and other milk brands have indicated interest and readiness
to partner with the ministry to develop livestock and milk production.
Source: Food and Agriculture Organisation (FAO)
A new minister for
Agriculture with wealth of
experience that closely
aligns with the sector
Investment in the livestock
sub-sector to support the
school feeding plan under
the FG social investment
programme

61
RESEARCH
In Dire Straits
2016 Outlook
Companies

62
RESEARCH
In Dire Straits
2016 Outlook
Zenith Bank Plc Buy TP: N16.44
TSA impact emphasize the need to diversify client base
ZENITHBANK was adversely affected by the TSA directive. We expect the TSA deficit to create the need to drive liabilities and further diversify its client base by growing deposit from the retail sector in the coming year. We expect the bank to achieve this by leveraging on its wide branch network and strong IT platform.
Bank will need to grow risk asset to remain profitable
The outlook on interest rate suggests the bank may not be able to support its interest income effectively with gains from government securities and may need to generate more risk assets to be profitable at the low rates. Also, with the complete elimination of COT this year, non-interest incomes may be lower. We project a 12% decline in 2016 PAT as Zenith Bank navigates the tough operating environment in FY’16.
Valuation
We have reduced our target price for ZENITHBANK to N16.44 but retain our BUY rating. Our target price implies a 50% on upside current price of N10.93.
Stock Data
Bloomberg Ticker: ZENITHBANK: NL
Market Price (N) 10.93
Shares Outs (Mn) 31,396
Market cap (N’Bn) 343.16
Price Perf. ZENITHBANK NSE
3-month -17.4% -14.39%
QTD -28.7% -8.25%
YTD -23.7% -17.36%
United Bank for Africa Plc Buy TP: N5.46
Transactional revenue to drive earnings growth
We believe the bank will maintain the quality of its loan books, as its NPL ratio of 2.1% in 9M’15 is one of the lowest in the Industry. Which means management may be more conservative in lending as it carefully treads the uncertain economic environment in FY’16 and will hope to grow earnings by improving its Transactional revenue and income from other foreign subsidiaries.
Earnings Outlook
Considering our expectations that the bank may wait for clarity on economic policies and opportunities in major sectors like power before going aggressive, we expect loans to grow by just c.5%. Consequently, we also expect gross earnings and after tax profit to decline by 6% and 23% respectively which translates to an EPS of N1.15 and ROE of 13%.
Valuation
Our target price stands at N5.46 which implies a 96% upside from current price of N2.79. Thus we maintain a buy rating on UBA.
Stock Data
Bloomberg Ticker: UBA: NL
Market Price (N) 2.79
Shares Outs (Mn) 36,279
Market cap (N’Bn) 101.22
Price Perf. UBA NSE
3-month -18.8% -14.39%
QTD -32.6% -8.25%
YTD -21.6% -17.36%
0
0.2
0.4
0.6
0.8
1
1.2
1.4
1.6
ASI ZENITHBANK
0
0.2
0.4
0.6
0.8
1
1.2
1.4
ASI UBA

63
RESEARCH
In Dire Straits
2016 Outlook
FBN Holdings Plc Buy TP: N5.07
Rising Impairment cost may pressure earnings in 2016 Deteriorating asset quality took its toll on FBNH’s 9M’15 earnings as loan loss expenses rose by 249% YoY to N46.6 billion (9M’14: N13.4 billion). We expect impairment cost to increase by 101% in FY’2016 as management will look to increase provisioning for non performing loans in its books.
Earnings to decline as focus shifts to quality We forecast a top line and after tax profit of N479bn and N26.6bn which reflects a 3% and 21% decline respectively compared to FY’15. Our projection follows from our expectation that the bank will increase provisioning for non performing loan and will be more conservative in creating risk asset as it looks to improve the quality of its loan portfolio. However, we expect operating expenses to decline by 35% and cost to income ratio to decline to c.46% as management is determined to improve the bank’s efficiency being the most inefficient among the tier one banks.
Valuation We have reduced our target price for FBNH to N5.07 as we revise our earnings expectation downwards. Nonetheless this implies a 27% upside to its current price of N3.99.
Stock Data
Bloomberg Ticker: FBNH: NL
Market Price (N) 3.99
Shares Outs (Mn) 35,895
Market cap (N’Bn) 143.22
Price Perf. FBNH NSE
3-month -17.5% -14.39%
QTD -36.1% -8.25%
YTD -42.2% -17.36%
Guaranty Trust Bank Plc Buy N22.43
Relying on efficiency to weather storms in hard times
GTBank can leverage on its strong track and culture of operating efficiency to limit the impact of slower growth in 2016 given the weak outlook on interest incomes and non-interest income in light of the low yields on government instruments, tepid loan growth expectations and complete elimination of COT.
Risk aversion may slow earnings growth in 2016 As the outlook of 2016 seems to be full of unconventional political and economic reforms, we expect GTBank (with a track record of conservatism) to approach risk asset generation in emerging spot light sectors with caution. This may see the bank lose potential head start in revenue generation causing us to moderate our gross earnings and PAT expectation to a 2% and 15% decline respectively in FY’16. We however expect GTBank to play catch up as the outlook of the economy becomes clearer.
Valuation Our target price stands at N22.43 (previously N25.93) which implies a c.37% return potential from current price of N16.39. Thus we maintain a buy rating on GUARANTY.
Stock Data
Bloomberg Ticker: GUARANTY: NL
Market Price (N) 16.39
Shares Outs (Mn) 29,431
Market cap (N’Bn) 482.38
Price Perf. GUARANTY NSE
3-month -25.5% -14.39%
QTD -33.7% -8.25%
YTD -28.1% -17.36%
0
0.2
0.4
0.6
0.8
1
1.2
1.4
ASI FBNH
0
0.2
0.4
0.6
0.8
1
1.2
1.4
ASI GUARANTY

64
RESEARCH
In Dire Straits
2016 Outlook
Ecobank Transnational Inc Hold TP: N16.79
Weak Commodities prices may hike impairments
Giving the current impact of the rout in commodities on Africa coupled with the fact that 90% of ETI subsidiaries are located in Africa, it is probable that ETI impairment charges may increase significantly considering it currently operates c.75% loan to deposit ratio as at 9M’15. The resultant effect of the commodity slide on currency depreciation may also negatively impact its bottom-line. However, the bank may be able to leverage on its wide branch network to drive transactional revenue and be less impacted by the complete phase out of COT in Nigeria.
Earnings Outlook We see ETI gross earnings sliding by 2% in the coming year giving the tough economic outlook in Africa. Following our expectation of high impairment charges and the impact of currency devaluation, we see after tax profit retreating by 23% in FY’16 which translate to an EPS of $0.015 (N2.95).
Valuation We have revised our TP for ETI downwards to N16.79 (previously N20.11) which implies a 4% upside to the current price of N16.15. Hence, we downgrade our rating to Hold
Stock Data
Bloomberg Ticker: ETI: NL
Market Price (N) 16.15
Shares Outs (Mn) 18,349
Market cap (N’Bn) 296.35
Price Perf. ETI NSE
3-month -13.8% -14.39%
QTD -28.9% -8.25%
YTD -13.9% -17.36%
Access Bank Plc Buy TP: N6.00
Non-interest Income to normalise in 2016 Access bank reported a significant 42% YoY growth in gross earnings (c. N257.6 billion) in 9M’15, as a result of the sharp rise in non- Interest revenue (105.9%) due to derivative contracts entered by the bank when issuing its Eurobond in FY’14. We expect earnings to normalise as contracts mature. Net interest income dropped marginally by 0.1% YoY to N75.9 billion as interest expenses continued its uptrend, up by 42.5% YoY, giving the increase in cost of funds from 4.9% to 5.4%
Bank may tap into government reforms to grow aggressively We expect gross earnings to decline by 16% as spikes from non interest income begins to normalise. Despite tough economic conditions we project interest and discount income to drop marginally by 1%. This is because we believe the bank will lead opportunities in creating risk assets in government reforms sectors owing to its aggressive track record. Finally we expect the bank to deploy measures to improve efficiency and cut operating expenses in order to boost bottom-line.
Valuation Putting into consideration the current macroeconomic realities we revise our revised TP downwards to N6.00 (Previous: N8.00), which represents a c.37% upside to its current price of N4.37. Hence we retain our Buy rating.
Stock Data
Bloomberg Ticker: ACCESS: NL
Market Price (N) 4.37
Shares Outs (Mn) 28,927
Market cap (N’Bn) 126.42
Price Perf. ACCESS NSE
QTD -6.6% -14.39%
6-Month -14.2% -8.25%
YTD -24.0% -17.36%
0
0.2
0.4
0.6
0.8
1
1.2
1.4
ASI ETI
0
0.2
0.4
0.6
0.8
1
1.2
ASI ACCESS

65
RESEARCH
In Dire Straits
2016 Outlook
Fidelity Bank Plc Hold TP: N1.48
Tough outlook may further hike cost of funds . The deteriorating economic condition resulted in a significant loan loss expense of N3.9 billion (107.6% growth) in 9M’15, a trend we predict may extend into 2016 except macro conditions improves. The grim economic outlook may be worsened for Fidelity Bank in 2016 as the bank may struggle to replace the deficit created by the TSA due to its relatively weak retail presence, which may worsen the already high funding cost and reduce net interest margin (NIM).
Earnings Outlook As macroeconomic condition continues to deteriorate, we expect top-line to decline marginally by c.1% and interest income to remain flat. We also expect a significant uptick in interest expense given the anticipated rise in funding cost. We see after tax profit coming in at N4.85 billion ($24.6 million) resulting in an EPS of N0.15 and ROAE of 2.4%.
Valuation We have revised our FY’16 TP for FIDELITYBK downwards to N1.48 which implies a c.14% upside to the current price of N1.30. Hence, we maintain a Hold recommendation.
Stock Data
Bloomberg Ticker: FIDELITYBK: NL
Market Price (N) 1.30
Shares Outs (Mn) 28,974
Market cap (N’Bn) 37.67
Price Perf. FIDELITYBK NSE
3-month -6.4% -14.39%
QTD -14.5% -8.25%
YTD -9.3% -17.36%
Diamond Bank Plc Buy TP: N2.68
Heightened attention to loan book as quality may worsen
The retail strategy of Diamond Bank exposed its loan portfolio to the retail sector which has come under intense economic pressure as the unavailability of FX impacted negatively on businesses in our import driven economy. If FX problems remain unresolved, we expect a significant increase in NPL in FY’16 which will substantially increase the bank’s provisioning. All hope however is not lost as we see the bank leveraging on its retail deposit access to keep cost low and NIM stable despite lower yields in government securities.
Earnings Outlook We project earnings to decline by 3% as we expect growth in loans to slow down to c.4.4%, following management decision to tighten credit approval process in order to reduce its nonperforming loans. We project a c.15% increase in after tax earnings compared to FY’15 estimate resulting in an EPS of N0.42 and ROAE of 4.5%.
Valuation We have revised our medium term estimate resulting in a TP of N2.68 (previously N5.30) which implies a 34% upside from current price of N2.00. Thus we retain a buy rating on Diamond.
Stock Data
Bloomberg Ticker: DIAMONDBNK: NL
Market Price (N) 2.00
Shares Outs (Mn) 23,160
Market cap (N’Bn) 46.32
Price Perf. DIAMOND NSE
3-month -32.4% -14.39%
QTD -47.6% -8.25%
YTD -57.8% -17.36%
0
0.2
0.4
0.6
0.8
1
1.2
1.4
ASI FIDELITYBK
0
0.2
0.4
0.6
0.8
1
1.2
ASI DIAMONDBNK
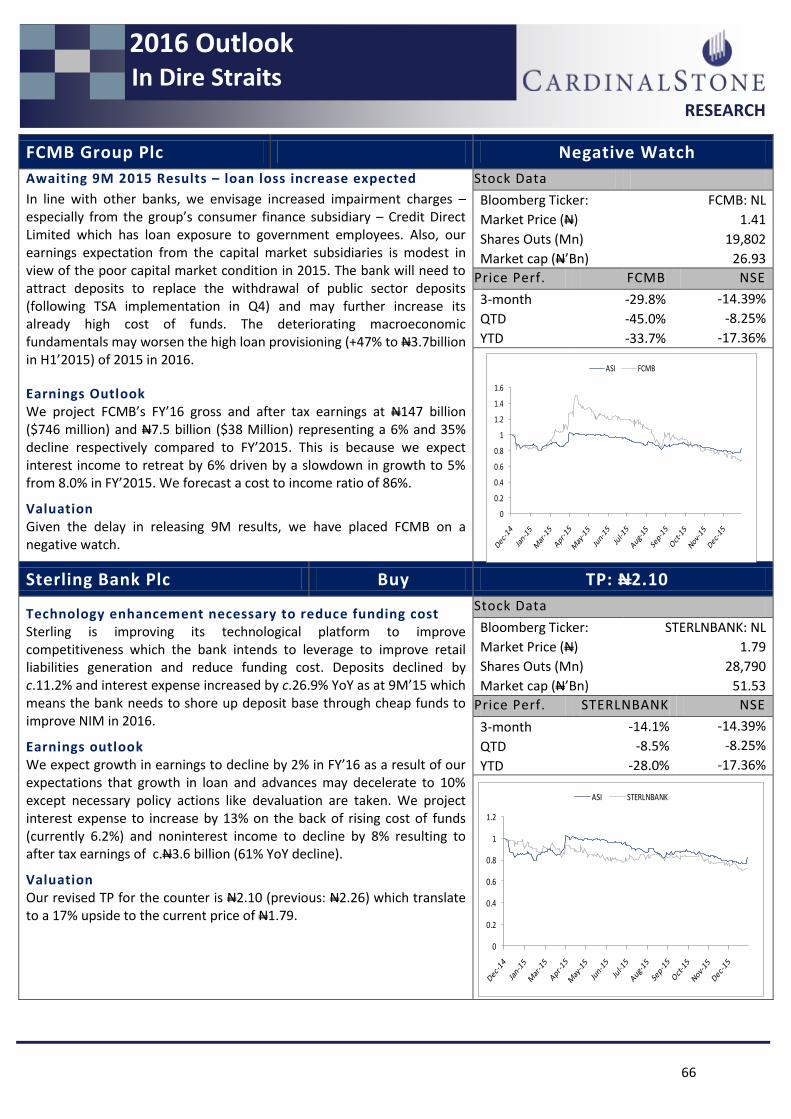
66
RESEARCH
In Dire Straits
2016 Outlook
FCMB Group Plc Negative Watch
Awaiting 9M 2015 Results – loan loss increase expected
In line with other banks, we envisage increased impairment charges – especially from the group’s consumer finance subsidiary – Credit Direct Limited which has loan exposure to government employees. Also, our earnings expectation from the capital market subsidiaries is modest in view of the poor capital market condition in 2015. The bank will need to attract deposits to replace the withdrawal of public sector deposits (following TSA implementation in Q4) and may further increase its already high cost of funds. The deteriorating macroeconomic fundamentals may worsen the high loan provisioning (+47% to N3.7billion in H1’2015) of 2015 in 2016.
Earnings Outlook We project FCMB’s FY’16 gross and after tax earnings at N147 billion ($746 million) and N7.5 billion ($38 Million) representing a 6% and 35% decline respectively compared to FY’2015. This is because we expect interest income to retreat by 6% driven by a slowdown in growth to 5% from 8.0% in FY’2015. We forecast a cost to income ratio of 86%.
Valuation Given the delay in releasing 9M results, we have placed FCMB on a negative watch.
Stock Data
Bloomberg Ticker: FCMB: NL
Market Price (N) 1.41
Shares Outs (Mn) 19,802
Market cap (N’Bn) 26.93
Price Perf. FCMB NSE
3-month -29.8% -14.39%
QTD -45.0% -8.25%
YTD -33.7% -17.36%
Sterling Bank Plc Buy TP: N2.10
Technology enhancement necessary to reduce funding cost Sterling is improving its technological platform to improve competitiveness which the bank intends to leverage to improve retail liabilities generation and reduce funding cost. Deposits declined by c.11.2% and interest expense increased by c.26.9% YoY as at 9M’15 which means the bank needs to shore up deposit base through cheap funds to improve NIM in 2016.
Earnings outlook We expect growth in earnings to decline by 2% in FY’16 as a result of our expectations that growth in loan and advances may decelerate to 10% except necessary policy actions like devaluation are taken. We project interest expense to increase by 13% on the back of rising cost of funds (currently 6.2%) and noninterest income to decline by 8% resulting to after tax earnings of c.N3.6 billion (61% YoY decline).
Valuation Our revised TP for the counter is N2.10 (previous: N2.26) which translate to a 17% upside to the current price of N1.79.
Stock Data
Bloomberg Ticker: STERLNBANK: NL
Market Price (N) 1.79
Shares Outs (Mn) 28,790
Market cap (N’Bn) 51.53
Price Perf. STERLNBANK NSE
3-month -14.1% -14.39%
QTD -8.5% -8.25%
YTD -28.0% -17.36%
0
0.2
0.4
0.6
0.8
1
1.2
1.4
1.6
ASI FCMB
0
0.2
0.4
0.6
0.8
1
1.2
ASI STERLNBANK

67
RESEARCH
In Dire Straits
2016 Outlook
Stanbic IBTC Holding Plc Buy TP: N17.72
A challenging year ahead The grim macroeconomic outlook may see the pressure in earnings from impairment charges hike in the retail sector (c.521% YoY increase in impairment at 9M’15) to extend into 2016. We also see pressure in earnings from the capital market subsidiary due to the bearish sentiments rising from weak economic activities. However, though the Pension subsidiary seems to be a bright spot, contribution may decline if job losses increase. Stanbic challenging year may be further compounded by the litigation expenses of about N5.5 billion arising from regulatory issues and court cases which will significantly pressure earnings if expensed.
Earnings Outlook In FY’16, we expect gross earnings to rise by c.2% to N141 billion ($715 million) and after tax earnings to decline by c.15% to N15.16 billion ($76.9 million). Our expectation is based on a probable increase in expenses from litigation and an estimated 2% decline in interest income a weighed down by c.4.1% fall in loans and advances. We forecast a drop in ROAE to about 8.7% from our FY’15E of 12.2%.
Valuation We have revised our TP significantly downwards to N17.72 (previously N25.41) following the steep decline in 2015 earnings as a result of the significant surge in impairments and the not-so-bright outlook for the banking sector in 2016. However, our revised TP implies a c.24% upside from current price of N14.25. Thus we retain our Buy rating on STANBIC.
Stock Data
Bloomberg Ticker: STANBIC: NL
Market Price (N) 14.25
Shares Outs (Mn) 10
Market cap (N’Bn) 142.50
Price Perf. STANBIC NSE
3-month -29.2% -14.39%
QTD -41.6% -8.25%
YTD -41.7% -17.36%
0
0.2
0.4
0.6
0.8
1
1.2
1.4
ASI STANBIC

68
RESEARCH
In Dire Straits
2016 Outlook
Custodian and Allied Plc Buy TP: N5.59
Strong investment income bolstered earnings Custodian and Allied plc (CUSTODYINS) reported a 7% YoY increase in its gross premium income to N15.6 billion ($79 million) for 9M’15, a much slower growth compared to c.18% in 9M’14 as a response to weak economic activities. Nonetheless the strong investment return (38% YoY growth) which has been a result of the high yield in the fixed income market cushioned the slow growth in gross premium, seeing 9M gross revenue rise by 10.2%.
Revenue diversification to keep bottom-line resilient We expect gross premium to maintain its momentum and grow at 5% and after tax profit to grow marginally at c.0.3%. Whilst the investment income cushion to the bottom-line may be waning as yields continue to decline, we believe CUSTODYINS’s diversified revenue through its pension business will position it competitively amongst peers during this tough economic condition.
Valuation In light of the envisaged tough economic environment in 2016, we revise target price down to N5.59. However, our revised TP still represent an upside of 33% from the current price of N4.20
Stock Data Bloomberg Ticker: CUSTODYIN: NL
Market Price (N) 4.20
Shares Outs (Mn) 5,881
Market cap (N’Bn) 24.70
Price Perf. CUSTODYIN NSE 6M 2.5% -14.39%
QTD 0.0% -8.25%
YTD 13.3% -17.36%
AIICO Insurance Plc Buy TP: N1.58
Investment Income Supported Earnings The impact of cost cutting in the corporate sector and strained consumer wallet is evident as AIICO reported a 7.9% YoY decline in gross premium income to N12.7 billion ($64 million) for 9M’15. Despite the 3% YoY drop in net premium (due to the drop in gross premium income) to N9.9 billion ($50 million), the company’s total revenue increased during the period, largely reflecting a significant jump (9% YoY) in fee & commission income to N1.2 billion (from N443 million in H1’15), and 76% YoY (+26% QoQ) growth in investment income to N5.1 billion ($26 billion).
Earnings Outlook We project gross premium written to increase moderately by 2% as we expect demand for life insurance and annuity products to decline as consumers may begin to cut-back on Insurance expenditures on the back of tightening disposable income. We expect reduced investment income on the back of declining yields in the fixed income market and therefore project a 14% decline in profit after tax.
Valuation We maintain a BUY rating on AIICO as its current price of N0.90 present a 76% upside potential to our target price of N1.58.
Stock Data Bloomberg Ticker: AIICO:NL
Market Price (N) 0.90
Shares Outs (Mn) 6,930
Market cap (N’Bn) 6.24
Price Perf. AIICO NSE
6M -3.2% -14.39%
QTD 4.6% -8.25%
YTD 12.3% -17.36%
0.6
0.8
1
1.2
1.4
1.6
De
c-1
4
Jan
-15
Ma
r-1
5
Ap
r-1
5
Ma
y-1
5
Jun
-15
Jul-
15
Au
g-1
5
Se
p-1
5
Oc
t-1
5
No
v-1
5
De
c-1
5
ASI AIICO
0.6
0.8
1
1.2
1.4
Dec
-14
Jan-
15
Mar
-15
Apr
-15
May
-15
Jun-
15
Jul-1
5
Aug
-15
Sep-
15
Oct
-15
Nov
-15
Dec
-15
ASI Custodyin

69
RESEARCH
In Dire Straits
2016 Outlook
Nigerian Breweries Plc Buy TP: N140.12
Merger yet to translate to improved bottom-line Following the merger between Nigerian Breweries (NB) and Consolidated Breweries in December 2014, the top-line of NB has grown steadily, posting a 10% YoY turnover growth in its 9M’15 results. However, operating and administrative efficiencies which the merger is also intended to attain is yet to be achieved as bottom-line declined by 12% YoY.
Earnings outlook We forecast a modest 7% growth in revenue in NB’s FY’16 results given an expected challenging operating environment in FY’16. We further estimate gross margins of 52.5% and a 16% growth in EPS to N5.59 as costs savings resulting from the merger begin to take effect to boost earnings.
Valuation We retain our target price of N140.12 for NB which translates to a 44% upside and therefore assign a BUY rating to the stock.
Stock Data
Bloomberg Ticker: NB:NL
Market Price (N) 97.18
Shares Outs(Mn) 7,929.10
Market cap (N’Bn) 770.55
Price Perf. NB NSE
6-month -9.32% -14.39%
QTD -7.48% -8.25%
YTD -17.73% -17.36%
Guinness Nigeria Plc Buy TP: N138.25
Expansion of its Premium Segment Guinness Nigeria (GN) recently acquired the exclusive distribution rights to the International Premium Spirits brands (IPS) of Diageo Plc in Nigeria. We view this strategic move by GN as an opportunity to accelerate and garner market share in the premium segment of the Nigeria brewery industry, especially in the long term.
Earnings Outlook Net sales from IPS sales in Nigeria amounted to £20 million (N6 billion) as at 30th June 2015. However, we revised our FY’16 revenue growth downward to 5% YoY as consumers are likely to shift from premium to value brands due to weakening naira and inflation expected to weigh on disposable income. Thus, we estimate PAT to drop by 42% to N4.3 billion ($21.8 million) in FY’16 following from the weak start in Q1’16 when earnings plunged 76%.
Valuation After adjusting for the medium term impact of Guinness exclusive distribution for Diageo, our revised TP estimate stands at N138.25 (Previous: N115.44) which translates to 15% upside relative to current price of N119.98.
Stock Data
Bloomberg Ticker: GUINNESS:NL
Market Price (N) 119.98
Shares Outs(Mn) 1,505.89
Market cap (N’Bn) 180.68
Price Perf. GUINNESS NSE
6-month -26.05% -14.39%
QTD -23.07% -8.25%
YTD -28.40% -17.36%
0.0
0.2
0.4
0.6
0.8
1.0
1.2
De
c-1
4
Jan
-15
Mar
-15
Ap
r-1
5
May
-15
Jun
-15
Jul-
15
Au
g-1
5
Sep
-15
Oct
-15
No
v-1
5
De
c-1
5
ASI GUINNESS
0.0
0.2
0.4
0.6
0.8
1.0
1.2
Dec
-14
Jan-
15
Mar
-15
Apr
-15
May
-15
Jun-
15
Jul-1
5
Aug
-15
Sep-
15
Oct
-15
Nov
-15
Dec
-15
ASI NB

70
RESEARCH
In Dire Straits
2016 Outlook
Unilever Nigeria Plc Sell TP: N15.41
Depressed earnings performance The challenging business environment that occurred in the consumer goods sector in 2015 weighed significantly on Unilever Nigeria as the company reported dismal performance in its 9M’15 results. Particularly, gross margin contracted by 360bps YoY while net income was down drastically by 92% YoY.
Earnings outlook In spite of its weak performance, we expect some recovery in 2016 and project 5% growth in Sales to N58 billion ($294 million). We further estimate EPS to inch up by 2.8% to N0.42 in FY’16 from our FY’15E of N0.11 as the company focus efforts to improve costs efficiencies to enhance margin.
Valuation Based on a weighted DCF and P/E valuation method, we arrived at a TP of N15.41 (Previous: N19.98) which translates to a downside of 64% from its current price of N43.25.
Stock Data
Bloomberg Ticker: UNILEVER:NL
Market Price (N) 43.25
Shares Outs(Mn) 3,783.29
Market cap (N’Bn) 163.63
Price Perf. UNILEVER NSE
6-month -4.95% -14.39%
QTD -4.17% -8.25%
YTD -20.81% -17.36%
PZ Cussons Plc Hold TP: N24.14
Merger to improve tax efficiency PZ Cussons is set to merge with its subsidiaries – PZ Towers Limited and PZ Energy Limited. We anticipate that the entity be fully consolidated by H1’16 to achieve improved operations efficiency and cost savings. We view this synergy as a strategic move to improve tax efficiency and boost its weakening earnings given the tougher operating environment expected for FMCG in FY’16.
Earnings Outlook: PZ Cussons’s Q1’16 report came in with a marginal revenue decline and a 33% decrease in earnings. Therefore, we have revised our 2016E revenue estimate downward to N72 billion ($365 million) reflecting increased competition and weak sales in the North. Despite expected depressed CPO prices, we see a muted impact on gross profit due to naira devaluation. Thus, we expect a 5% YoY decline in PAT to N4 billion ($20 million).
Valuation Based on a weighted DCF and PE valuation method, we arrived at a TP of N24.14 (Previous: N24.81) which translates to an upside of 14% from its current price of N21.13.
Stock Data
Bloomberg Ticker: PZ:NL
Market Price (N) 21.13
Shares Outs(Mn) 3,970.47
Market cap (N’Bn) 83.90
Price Perf. PZ NSE
6-month -15.60% -14.39%
QTD -1.91% -8.25%
YTD 7.98% -17.36%
0.2
0.4
0.6
0.8
1.0
1.2
1.4
1.6
Dec
-14
Jan-
15
Mar
-15
Apr
-15
May
-15
Jun-
15
Jul-1
5
Aug
-15
Sep-
15
Oct
-15
Nov
-15
Dec
-15
ASI PZ
0.2
0.4
0.6
0.8
1.0
1.2
1.4
Dec
-14
Jan-
15
Mar
-15
Apr
-15
May
-15
Jun-
15
Jul-1
5
Aug
-15
Sep-
15
Oct
-15
Nov
-15
Dec
-15
ASI UNILEVER

71
RESEARCH
In Dire Straits
2016 Outlook
Nestle Nigeria Plc Sell TP: N763.92
Resilience in the face of headwinds Although reporting modest turnover growth of 5.2% in its 9M’15 result, Nestle Nigeria outperformed competition in the face of macro-economic headwinds that hit the manufacturing sector in 2015. Its addition of Wyeth Nutrition products contributed to revenue growth during the period. Furthermore, the company is set to commission its N4.6 billion ($23 million) water project to broaden its water operations in Nigeria and improve turnover.
Earnings outlook We expect Nestlé’s Nigeria revenue to rise by 8% YoY to N165 billion ($838 million) in FY’16. Notwithstanding the weak outlook on the Naira which affects the company’s input costs and interest expense on its foreign currency loans, we estimate a 7% YoY growth in EPS to N32.43.
Valuation Our target price has been revised to N763.29 (Previous: N613.69). Our revised TP presents a 2% downside from its current price and thus we retain our SELL recommendation on the counter.
Stock Data
Bloomberg Ticker: NESTLE:NL
Market Price (N) 779.00
Shares Outs(Mn) 792.65
Market cap (N’Bn) 617.48
Price Perf. NB NSE
6-month 0.35% -14.39%
QTD -1.15% -8.25%
YTD -15.00% -17.36%
Dangote Sugar Refinery Plc Buy TP: N9.11
Turnover strengthened by output price Dangote Sugar’s (DSR) 9M’15 results showed increased demand for its product in the north, but the company couldn’t meet demand due to insufficient distribution capacity. Therefore, sales volume declined by 12% YoY to 530,925MT from 609,765MT. However, revenue only fell by 1% YoY to N73 billion ($371 million) as average realised price for the 9 months period was higher than the corresponding year.
Earnings Outlook We envisage an upward price review in price to minimise the impact of higher input cost as a result of a possible devaluation of the Naira. We expect this in combination with recovery in production volumes to deliver an 8% YoY revenue growth in FY’16. However, raw sugar prices may continue the uptrend that started in September 2015, thus raising input costs. Overall, we expect the rise in revenue to trickle to earnings and forecast an 18% YoY increase in EPS to N1.16 for FY’16.
Valuation Following a downward review, our TP estimate stands at N9.11 (Previous: N9.82) which translates to 52% upside relative to the current price of N5.98.
Stock Data
Bloomberg Ticker: DANGSUGAR:NL
Market Price (N) 5.98
Shares Outs(Mn) 12,000.00
Market cap (N’Bn) 71.76
Price Perf. DANGSUGAR NSE
6-month -12.61% -14.39%
QTD -8.64% -8.25%
YTD -5.04% -17.36%
0.0
0.2
0.4
0.6
0.8
1.0
1.2
1.4
Dec
-14
Jan-
15
Mar
-15
Apr
-15
May
-15
Jun-
15
Jul-1
5
Aug
-15
Sep-
15
Oct
-15
Nov
-15
Dec
-15
ASI DANGSUGAR
0.0
0.2
0.4
0.6
0.8
1.0
1.2
Dec
-14
Jan-
15
Mar
-15
Apr
-15
May
-15
Jun-
15
Jul-1
5
Aug
-15
Sep-
15
Oct
-15
Nov
-15
Dec
-15
ASI NESTLE

72
RESEARCH
In Dire Straits
2016 Outlook
Flour Mills of Nigeria Plc Buy TP: N66.08
Gain in UNICEM disposal offset debt In its H1’16 results, Flour Mills of Nigeria (FMN) reported a 7.6% YoY revenue growth driven by its expanded capacity to boost top-line and retain market share. FMN sold the remaining of its 15% stake in UNICEM amounting to N23 billion ($117 million). The gain was able to bolster its earnings in the face of a 7.6% and 21% YoY rise in inputs costs and finance charges respectively.
Earnings outlook We forecast a 5% YoY growth in revenue in FY’16 to N323 billion ($1.6 billion). We further estimate a marginal increase of 0.7% in cost of sales to N275 billion ($1.4 billion) by FY 2016 despite falling commodity prices. We anticipate that the weakening naira and the scarcity of FX would erode the savings in lower input prices.
Valuation We retain our TP estimate of N66.08 for Flour-Mills which translates to an upside potential of 234% from its current price of N19.76.
Stock Data
Bloomberg Ticker: FLOURMILL:NL
Market Price (N) 19.76
Shares Outs(Mn) 2,624.23
Market cap (N’Bn) 51.85
Price Perf. FLOURMILL NSE
6-month -38.82% -14.39%
QTD -6.35% -8.25%
YTD -46.94% -17.36%
UAC of Nigeria Plc Buy TP: N31.62
Impairment charge negatively impact on earnings UACN reported a decline of 79.4% YoY in 9M 2015, mainly driven by a N2.56 billion ($13 million) in total impairment charge in UPDC Hotel Equity Investment and Golden Tulip Hotel assets. Rising borrowing costs and insecurity the north were also negatives which affected the bottom-line of most its portfolio companies.
Earnings Outlook Shoprite and other line shops opened up outlets in Festival mall (UPDC real estate asset) in Q3’15. On the back of this, we estimate a 5% YoY growth in its real estate revenue in FY’16. In addition, we forecast an overall 5% YoY growth in top-line and a normalised 100% growth in EPS in the absence of any further impairment charges.
Valuation Our revised TP for UACN stands at N31.62 (Previous: N40.19) which translates to an upside of 70% from its current price of N18.59.
Stock Data
Bloomberg Ticker: UACN:NL
Market Price (N) 18.59
Shares Outs(Mn) 1,920.86
Market cap (N’Bn) 35.71
Price Perf. UACN NSE
6-month -51.18% -14.39%
QTD -34.13% -8.25%
YTD -38.97% -17.36%
0.2
0.4
0.6
0.8
1.0
1.2
1.4
Dec
-14
Jan-
15
Mar
-15
Apr
-15
May
-15
Jun-
15
Jul-1
5
Aug
-15
Sep-
15
Oct
-15
Nov
-15
Dec
-15
ASI UACN
0.0
0.2
0.4
0.6
0.8
1.0
1.2
Dec
-14
Jan-
15
Mar
-15
Apr
-15
May
-15
Jun-
15
Jul-1
5
Aug
-15
Sep-
15
Oct
-15
Nov
-15
Dec
-15
ASI FLOURMILL

73
RESEARCH
In Dire Straits
2016 Outlook
Mobil Oil Nigeria Plc Sell TP: N133.19
Earnings cushioned by strong rental income Amidst a challenging environment in the core marketing business, earnings from Mobil Oil Nigeria’s (Mobil) robust real estate portfolio (which accounts for the bulk of the “Other Income” line), continues to support group earnings – accounting for 63% of total operating income in 9M’15.
Earnings Outlook We expect stronger volume growth in 2016 for Mobil as the decline in crude oil prices, and by extension petroleum products, infer subsidy payments would be less of an issue. We estimate revenue of N64 billion ($325 million), an 8% YoY growth from FY’15E, and PAT of at N4.7 billion ($24 million).
Valuation We lower our target price for MOBIL to N133.19 (Previous: N160.00). Our new price target implies a potential downside of 12% from current levels). Its shares are trading on a 2015E P/E multiple of 13.2x.
Stock Data
Bloomberg Ticker: MOBIL:NL
Market Price (N) 151.20
Shares Outs(Mn) 360.60
Market cap (N’Bn) 54.52
Price Perf. MOBIL NSE
6M 0.00% -14.39%
QTD 6.90% -8.25%
YTD -5.06% -17.36%
Total Oil Nigeria Plc Sell TP: N130.47
Product distribution challenges continue to bite Total’s sales volume for the nine month period ended September 2015 was considerably constrained by the prolonged distribution challenges over the course of the year. The impact was evident in the company’s Q3 standalone performance where it reported a net profit of N165 million ($0.8 million), its lowest quarterly figure in recent history.
Earnings Outlook Our 201F sales growth forecast for Total Nigeria (Total) is little shy of 10% YoY and is reflective of our growth expectations in that sector. We expect double-digit YoY increase in unit volumes to lead to a recovery in earnings, after a forecast -35% YoY decline in 2015E EPS. We estimate revenue of N226 billion ($1.1 billion), an 8% YoY growth from FY’15E, and PAT of N3.9 billion ($19.8 million).
Valuation Our new TP of N130.47 is 16% lower than our previous TP because of downward revisions to our previous medium term earnings growth rates.
Stock Data
Bloomberg Ticker: TOTAL:NL
Market Price (N) 155.92
Shares Outs(Mn) 339.52
Market cap (N’Bn) 52.94
Price Perf. TOTAL NSE
6M -10.90% -14.39%
QTD -1.99% -8.25%
YTD 3.16% -17.36%
0
0.2
0.4
0.6
0.8
1
1.2
ASI MOBIL
0
0.2
0.4
0.6
0.8
1
1.2
1.4
ASI TOTAL

74
RESEARCH
In Dire Straits
2016 Outlook
Oando Plc Negative Watch
Quid deinde pro Oando? Key moves for OANDO in 2016 would be the sale of its struggling energy services division and the completion of the downstream divestment to Helios. These moves will further optimize balance sheet and enable the Group focus on the E&P division.
Earnings outlook We have assumed that the sale of the downstream business will be completed this financial year and therefore excluded that division from the balance sheet and income statement. Earnings from the division will be recognized as an equity investee level. We estimate revenue of N165 billion ($838 million) and a loss after tax of N6.9 billion ($35 million) in FY’16 given low crude oil price, associated high operating costs and likely impairment charges.
Valuation Our SOTP valuation of the Group comes to N6.13 per share after adding the Enterprise Values of the different business divisions, adjusting for debt and corporate costs and incorporating a HoldCo discount of 25%. However, we have placed the company on negative watch as they may provide for additional impairments in their upstream division – exploration and services – given the slide in crude oil prices.
Stock Data
Bloomberg Ticker: OANDO:NL
Market Price (N) 4.64
Shares Outs(Mn) 12,034.62
Market cap (N’Bn) 55.84
Price Perf. OANDO NSE
6M -62.42% -14.39%
QTD -43.81% -8.25%
YTD -65.05% -17.36%
Seplat Petroleum Devt Corp Buy TP: N312.79
Sales supported by gas revenues Q3’15 revenues fell by 10% YoY but was 70% higher QoQ, on the back of strong contribution from gas sales to the top line. Commissioning of the new Oben gas plant in June has boosted the company’s gas output from 118.3 mmscfd to 170mmscfd by the end of September.
Earnings Outlook Oil revenue is likely to remain a drag (given low oil price), however partly offset by increased oil production. With the phase 2 of the Oben gas project that will deliver an additional 225 mmscfd of gas capacity expected to come on stream in Q1’16, we remain constructive on SEPLAT’s gas business and expect this more predictable revenue source to cushion volatility from oil sales. We estimate revenues to rise by 2% from FY’15E to US$539 million (N106 billion) whilst PAT is forecast at US$104 million (N20 billion).
Valuation: We have adjusted our TP downward to N312.79 (Previous: N589.70) following a revision of our 2016 and 2017 average oil price assumption to $40/bbl and $50/bbl.
Stock Data
Bloomberg Ticker: SEPLAT
Market Price (N) 196.07
Shares Outs(Mn) 563.44
Market cap (N’Bn) 110.47
Price Perf. SEPLAT NSE
6M -40.30% -14.39%
QTD -18.77% -8.25%
YTD -45.28% -17.36%
0
0.2
0.4
0.6
0.8
1
1.2
1.4
ASI OANDO
0
0.2
0.4
0.6
0.8
1
1.2
1.4
ASI SEPLAT

75
RESEARCH
In Dire Straits
2016 Outlook
Transcorp Nigeria Plc Sell N1.02
Bowing to elevated costs, 9M’15 EPS declines 40% YoY Cumulative revenue for the nine month period was down by 3.1% YoY as both the hospitality and power segments continue to face operational challenges arising from lower occupancy levels and transmission losses. Operating expenses and interest charges tracked higher due to the devaluation impact on the currency. As such, PAT came in 29% lower to N5.8 billion ($29 million).
Earnings outlook The hospitality segment which had been the major contributor to earnings before the company’s foray into power has suffered an occupancy setback amidst lower disposable income. Capacity limitations will also constrain the growth of the power subsidiary. We expect FY’16 revenue will remain sticky at N41.2 billion ($209 million) as discretionary spending remains sticky. Nonetheless, PAT is forecast to rise by 10% YoY, buoyed by lower operating and finance costs.
Valuation We revised our target price downward which now stands at N1.02 (Previous: N6.35). This translates to a downside potential of 11% from its current price of N1.14.
Stock Data
Bloomberg Ticker: TRANSCORP:NL
Market Price (N) 1.14
Shares Outs(Mn) 38,721.00
Market cap (N’Bn) 44.14
Price Perf. TRANSCORP NSE
6-month -43.91% -14.39%
QTD -33.62% -8.25%
YTD -53.23% -17.36%
0.0
0.2
0.4
0.6
0.8
1.0
1.2
ASI TRANSCORP

76
RESEARCH
In Dire Straits
2016 Outlook
Dangote Cement Plc Buy TP: N201.36
Strong performance in other African operations offset weak volumes in Nigeria… DANGCEM’s is starting to reap the dividends from its expansion projects as contribution to volume sales from Non-Nigerian operations increased to a record high of 39% over the quarter (Q1:18%, Q2: 26%).
Earnings outlook We have increased our volume estimate for Nigeria to 16.4MT given our expectations of improved demand from both the private and public sector. In addition, we expect that operations in the rest-of-Africa will continue to wax stronger. We estimate FY’16 revenue to rise 25% to N607 billion ($3 billion) whilst net profit is forecast at N266 billion ($1.4 billion), a 17% YoY growth.
Valuation Following adjustments to our risk free rate and earnings assumptions, we arrive at a TP of N201.36 (Previous: N242.52).
Stock Data
Bloomberg Ticker: DANGCEM:NL
Market Price (N) 145.45
Shares Outs(Mn) 17,040.51
Market cap (N’Bn) 2,478.54
Price Perf. DANGCEM NSE
3-month -8.40% -14.39%
QTD -8.40% -8.25%
YTD -24.10% -17.36%
Lafarge Africa Plc Hold TP: N99.05
Further consolidation may be on the cards Following the completion of the LafargeHolcim merger, we see a potential transfer of LafargeHolcim’s stake in UNICEM to WAPCO to allow for easier management of the subsidiaries. Beyond this, we see scope for further consolidation of LafargeHolcim’s other Africa interests to WAPCO.
Earnings Outlook Unlike 2015 when it had a challenging time, WAPCO is set to deliver strong double-digit earnings growth in 2016E due to improved demand outlook for cement as well as favourable base effects in the prior year. We expect consolidated revenue growth of 8% to N219 billion ($1.1 billion) whilst PAT should come in at N40 billion ($203 million), a 14% growth.
Valuation Our target price has been revised downward to N99.05 (Previous: N106.71). The stock seems fairly priced at the moment as it is currently trading at a 13.2x 2015 P/E compared to EMEA average of 12.6x.
Stock Data
Bloomberg Ticker: WAPCO
Market Price (N) 91.31
Shares Outs(Mn) 4,554.90
Market cap (N’Bn) 415.91
Price Perf. WAPCO NSE
3-month -9.30% -14.39%
QTD -5.61% -8.25%
YTD 14.91% -17.36%
0
0.2
0.4
0.6
0.8
1
1.2
ASI DANGCEM
0
0.2
0.4
0.6
0.8
1
1.2
1.4
ASI WAPCO

77
RESEARCH
In Dire Straits
2016 Outlook
Presco Plc Hold TP: N32.88
Gains on Biological asset boost earnings A significant positive swing in biological asset revaluation gains, which came in at N2.2 billion ($11 million) in 9M 2015 compared to N1.6 billion ($8 million) in 9M 2014 (H1:15 – N97 million), resulted in an impressive 59% YoY PAT growth for the period.
Earnings outlook Topline should grow by double digits reflecting better volume growth from improved yields as more plants are moved from nursery to the plantation. In addition, savings in energy costs from the company’s renewable energy project among other factors should continue to boost gross margins. We expect sales and underlying PAT to grow by 15% YoY and 13% YoY respectively in 2016F.
Valuation: Our revised target price for PRESCO is N32.88 (Previous: N31.41), implying a 0% upside at current price of N33.00. Hence we retain our Hold recommendation on the ticker.
Stock Data
Bloomberg Ticker: PRESCO:NL
Market Price (N) 33.00
Shares Outs(Mn) 1,000.00
Market cap (N’Bn) 33.00
Price Perf. PRESCO NSE
6-month -5.4% -14.39%
QTD 8.0% -8.25%
YTD 34.7% -17.36%
Okomu Oil Palm Plc Sell TP: N32.02
Double-digits growth in 9M’15 Sales and PBT 9M 2015 sales of N7.8 billion ($40 million) were up by 12% YoY, while PBT grew by 23% YoY to N2.6 billion ($13 million). The CBN barred palm oil importers from accessing forex from the official window and this move positively impacted the top-line of local producers. The slower YoY PBT growth relative to sales growth was partly driven by a significant YoY rise in interest expense and a 48% YoY decline in other income.
Earnings outlook We expect top-line growth to be driven by increased volumes as the company continues its aggressive expansion plans. The company is set to deliver its three year target of cultivating an additional 12,000 hectares of palm trees by 2018 year-end. We see sales and PBT growing by 10% YoY and 22% YoY respectively in 2016.
Valuation Our FY’16 target price for OKOMUOIL stands at N32.02, which translate to an 2% downside from the current price of N32.64. Thus, we assign a SELL rating on the counter.
Stock Date
Bloomberg Ticker: OKOMUOIL: NL
Market Price (N) 32.64
Shares Outs(Mn) 953.91
Market cap (N’Bn) 31.14
Price Perf. OKOMUOIL NSE
6-month 5.4% -14.39%
QTD 8.2% -8.25%
YTD 19.5% -17.36%
0
0.2
0.4
0.6
0.8
1
1.2
1.4
1.6
NGSEASI PRESCO
0
0.2
0.4
0.6
0.8
1
1.2
1.4
1.6
NGSEASI OKOMUOIL

78
RESEARCH
In Dire Straits
2016 Outlook
Appendix

79
RESEARCH
In Dire Straits
2016 Outlook
Financial Statements and Key Ratios – Zenith Bank Plc Income Statement 2013A 2014A 2015E 2016F 2013A 2014A 2015E 2016F
N'Mn $'Mn
Gross Earnings 351,470 403,343 450,164 441,648 2,206 2,442 2,260 2,111
Interest Income 260,059 313,422 348,964 350,514 1,633 1,898 1,752 1,676
Interest expense (70,796) (106,919) (140,547) (142,420) (444) (647) (705) (681)
Loan loss provisions (11,067) (13,064) (15,110) (13,218) (56) (66) (76) (66)
Net interest income 189,263 206,503 208,417 208,094 1,188 1,250 1,046 995
Non-interest income 75,209 90,059 101,200 91,134 472 545 508 436
Operating income 253,405 283,498 294,506 286,010 1,591 1,717 1,478 1,367
Operating expenses (147,196) (163,702) (176,502) (181,794) (924) (991) (886) (869)
Exceptional item 4,388 - - - 28 - - -
Pre-tax earnings 110,597 119,796 118,005 104,215 694 725 592 498
Taxation (15,279) (20,341) (16,521) (14,590) (96) (123) (83) (70)
Profit after tax 95,318 99,455 101,484 89,625 598 602 509 428
Statement of financial position 2013A 2014A 2015E 2016F 2013A 2014A 2015E 2016F
Assets N'Mn $'Mn
Cash and Short term funds 603,851 752,580 967,356 719,208 3,747 4,566 4,875 3,452
Interbank placements 256,729 506,568 462,649 439,516 1,593 3,073 2,332 2,110
Treasury bills and Govt. bonds 892,247 647,222 693,973 659,274 5,537 3,927 3,497 3,164
Loans and Advances 1,251,355 1,729,507 1,925,280 2,023,102 7,765 10,493 9,703 9,710
Other Assets 69,541 47,816 80,932 86,576 432 290 408 416
Property and Equipment 69,410 71,571 75,706 67,925 431 434 382 326
Total Assets 3,143,133 3,755,264 4,205,896 3,995,601 19,504 22,783 21,196 19,177
Liabilities
Customer deposits 2,212,420 2,537,311 2,838,980 2,557,185 13,729 15,394 14,307 12,274
Due to other banks 64,335 68,344 84,118 79,912 399 415 424 384
Other Liabilities 289,282 295,931 357,501 333,633 1,795 1,795 1,802 1,601
Taxation 7,695 10,042 25,878 26,288 48 61 130 126
Borrowings 60,150 290,998 290,998 340,998 373 1,765 1,467 1,637
Total Liabilities 2,633,882 3,202,626 3,597,474 3,338,016 16,344 19,430 18,130 16,021
Capital and Reserves
Share capital 15,698 15,698 15,698 15,698 97 95 79 75
Share Premium 255,047 255,047 255,047 255,047 1,583 1,547 1,285 1,224
Other reserves 234,491 281,341 337,058 386,253 1,455 1,707 1,699 1,854
Minority Interest 4,015 552 618 587 25 3 3 3
Total Equity 509,251 552,638 608,421 657,585 3,160 3,353 3,066 3,156
Total liabilities and equity 3,143,133 3,755,264 4,205,896 3,995,601 19,504 22,783 21,196 19,177
Key Ratios 2013A 2014A 2015E 2016F 2013A 2014A 2015E 2016F
Profitability
Net Interest Margin 8.8% 8.3% 7.5% 7.1% 8.8% 8.3% 7.5% 7.1%
Cost to Income Ratio 59.8% 59.6% 61.9% 65.2% 59.8% 59.6% 61.9% 65.2% Cost of Risk 0.9% 0.7% 0.8% 0.7% 0.9% 0.7% 0.8% 0.7%
Loan to Deposit Ratio 56.6% 68.2% 67.8% 79.1% 56.6% 68.2% 67.8% 79.1%
Non Performing Loan ratio 2.9% 1.8% 2.5% 2.8% 2.9% 1.8% 2.5% 2.8%
Return on Average Equity 19.6% 18.8% 17.5% 14.1% 19.6% 18.8% 17.5% 14.1%
Return on Average Assets 3.3% 2.9% 2.5% 2.2% 3.3% 2.9% 2.5% 2.2%
Valuation Multiples
P/E (x) 3.6 3.5 3.4 3.8 3.6 3.5 3.4 3.8
P/B (x) 0.7 0.6 0.6 0.5 0.7 0.6 0.6 0.5
Dividend Yield 16.0% 16.0% 13.3% 11.7% 16.0% 16.0% 13.3% 11.7%
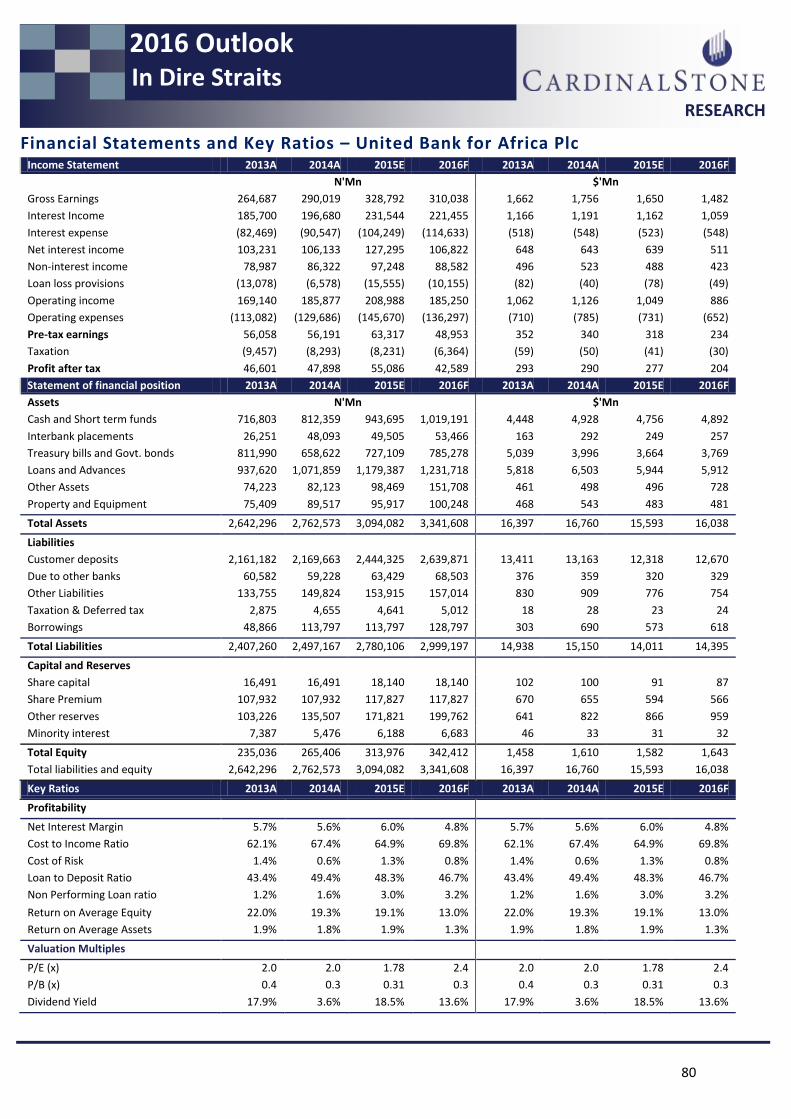
80
RESEARCH
In Dire Straits
2016 Outlook
Financial Statements and Key Ratios – United Bank for Africa Plc Income Statement 2013A 2014A 2015E 2016F 2013A 2014A 2015E 2016F
N'Mn $'Mn
Gross Earnings 264,687 290,019 328,792 310,038 1,662 1,756 1,650 1,482
Interest Income 185,700 196,680 231,544 221,455 1,166 1,191 1,162 1,059
Interest expense (82,469) (90,547) (104,249) (114,633) (518) (548) (523) (548)
Net interest income 103,231 106,133 127,295 106,822 648 643 639 511
Non-interest income 78,987 86,322 97,248 88,582 496 523 488 423
Loan loss provisions (13,078) (6,578) (15,555) (10,155) (82) (40) (78) (49)
Operating income 169,140 185,877 208,988 185,250 1,062 1,126 1,049 886
Operating expenses (113,082) (129,686) (145,670) (136,297) (710) (785) (731) (652)
Pre-tax earnings 56,058 56,191 63,317 48,953 352 340 318 234
Taxation (9,457) (8,293) (8,231) (6,364) (59) (50) (41) (30)
Profit after tax 46,601 47,898 55,086 42,589 293 290 277 204
Statement of financial position 2013A 2014A 2015E 2016F 2013A 2014A 2015E 2016F
Assets N'Mn $'Mn
Cash and Short term funds 716,803 812,359 943,695 1,019,191 4,448 4,928 4,756 4,892
Interbank placements 26,251 48,093 49,505 53,466 163 292 249 257
Treasury bills and Govt. bonds 811,990 658,622 727,109 785,278 5,039 3,996 3,664 3,769
Loans and Advances 937,620 1,071,859 1,179,387 1,231,718 5,818 6,503 5,944 5,912
Other Assets 74,223 82,123 98,469 151,708 461 498 496 728
Property and Equipment 75,409 89,517 95,917 100,248 468 543 483 481
Total Assets 2,642,296 2,762,573 3,094,082 3,341,608 16,397 16,760 15,593 16,038
Liabilities
Customer deposits 2,161,182 2,169,663 2,444,325 2,639,871 13,411 13,163 12,318 12,670
Due to other banks 60,582 59,228 63,429 68,503 376 359 320 329
Other Liabilities 133,755 149,824 153,915 157,014 830 909 776 754
Taxation & Deferred tax 2,875 4,655 4,641 5,012 18 28 23 24
Borrowings 48,866 113,797 113,797 128,797 303 690 573 618
Total Liabilities 2,407,260 2,497,167 2,780,106 2,999,197 14,938 15,150 14,011 14,395
Capital and Reserves
Share capital 16,491 16,491 18,140 18,140 102 100 91 87
Share Premium 107,932 107,932 117,827 117,827 670 655 594 566
Other reserves 103,226 135,507 171,821 199,762 641 822 866 959
Minority interest 7,387 5,476 6,188 6,683 46 33 31 32
Total Equity 235,036 265,406 313,976 342,412 1,458 1,610 1,582 1,643
Total liabilities and equity 2,642,296 2,762,573 3,094,082 3,341,608 16,397 16,760 15,593 16,038
Key Ratios 2013A 2014A 2015E 2016F 2013A 2014A 2015E 2016F
Profitability
Net Interest Margin 5.7% 5.6% 6.0% 4.8% 5.7% 5.6% 6.0% 4.8%
Cost to Income Ratio 62.1% 67.4% 64.9% 69.8% 62.1% 67.4% 64.9% 69.8%
Cost of Risk 1.4% 0.6% 1.3% 0.8% 1.4% 0.6% 1.3% 0.8%
Loan to Deposit Ratio 43.4% 49.4% 48.3% 46.7% 43.4% 49.4% 48.3% 46.7%
Non Performing Loan ratio 1.2% 1.6% 3.0% 3.2% 1.2% 1.6% 3.0% 3.2%
Return on Average Equity 22.0% 19.3% 19.1% 13.0% 22.0% 19.3% 19.1% 13.0%
Return on Average Assets 1.9% 1.8% 1.9% 1.3% 1.9% 1.8% 1.9% 1.3%
Valuation Multiples
P/E (x) 2.0 2.0 1.78 2.4 2.0 2.0 1.78 2.4
P/B (x) 0.4 0.3 0.31 0.3 0.4 0.3 0.31 0.3
Dividend Yield 17.9% 3.6% 18.5% 13.6% 17.9% 3.6% 18.5% 13.6%

81
RESEARCH
In Dire Straits
2016 Outlook
Financial Statements and Key Ratios – FBN Holdings Plc Income Statement 2013A 2014A 2015E 2016F 2013A 2014A 2015E 2016F
N'Mn $'Mn
Gross Earnings 389,640 473,797 492,500 479,245 2,446 2,869 2,472 2,291
Interest Income 323,621 362,579 384,766 380,353 2,032 2,195 1,931 1,818
Interest expense (93,506) (118,725) (139,165) (141,134) (587) (719) (699) (675)
Loan loss provisions (20,309) (25,942) (76,802) (154,246) (127) (157) (386) (737)
Net interest income 230,115 243,854 245,601 239,219 1,445 1,477 1,233 1,144
Non-interest income 66,019 111,218 107,734 98,892 414 673 541 473
Operating income 275,825 329,130 276,533 183,866 1,732 1,993 1,388 879
Operating expenses (185,494) (236,845) (239,148) (155,211) (1,165) (1,434) (1,200) (742)
Exceptional item 1,006 599 1,299 1,999 6 4 7 10
Pre-tax earnings 91,337 92,884 38,685 30,654 573 562 194 147
Taxation (20,706) (10,045) (4,836) (3,985) (130) (61) (24) (19)
Profit after tax 70,631 82,839 33,849 26,669 443 502 170 127
Statement of financial position 2013A 2014A 2015E 2016F 2013A 2014A 2015E 2016F
Assets N'Mn $'Mn
Cash and Short term funds 594,234 698,104 852,031 809,430 3,687 4,235 4,294 3,885
Interbank placements 430,586 460,911 520,686 494,651 2,672 2,796 2,624 2,374
Treasury bills and Govt. bonds 888,000 807,723 852,031 809,430 5,510 4,900 4,294 3,885
Loans and Advances 1,769,130 2,178,980 2,175,411 2,324,268 10,978 13,220 10,963 11,156
Other Assets 105,752 108,740 238,677 -26,388 656 660 1,203 (127)
Property and Equipment 81,299 88,208 94,670 85,440 504 535 477 410
Total Assets 3,869,001 4,342,666 4,733,506 4,496,831 24,009 26,346 23,855 21,583
Liabilities
Customer deposits 2,929,081 3,050,853 3,390,610 3,136,539 18,176 18,509 17,087 15,054
Due to other banks 82,032 171,151 170,406 161,886 509 1,038 859 777
Other Liabilities 225,605 216,048 231,942 201,458 1,400 1,311 1,169 967
Taxation 34,204 12,017 17,041 19,336 212 73 86 93
Borrowings 126,302 369,707 369,707 399,707 784 2,243 1,863 1,918
Total Liabilities 3,397,224 3,819,776 4,179,706 3,918,927 21,081 23,174 21,064 18,809
Capital and Reserves
Share capital 16,316 16,316 17,948 17,948 101 99 90 86
Share Premium 254,524 254,524 254,524 254,524 1,579 1,544 1,283 1,222
Minority Interest 4,505 4,033 4,479 5,914 28 24 23 28
Other reserves 196,432 248,017 276,849 299,518 1,219 1,505 1,395 1,438
Total Equity 471,777 522,890 553,800 577,904 2,928 3,172 2,791 2,774
Total liabilities and equity 3,869,001 4,342,666 4,733,506 4,496,831 24,009 26,346 23,855 21,583
Key Ratios 2013A 2014A 2015E 2016F 2013A 2014A 2015E 2016F
Profitability
Net Interest Margin 7.9% 7.5% 7.0% 6.7% 7.9% 7.5% 7.0% 6.7%
Cost to Income Ratio 62.6% 66.7% 67.7% 45.9% 62.6% 66.7% 67.7% 45.9%
Cost of Risk 1.1% 1.2% 3.4% 6.2% 1.1% 1.2% 3.4% 6.2%
Loan to Deposit Ratio 61.9% 72.8% 66.8% 78.7% 61.9% 72.8% 66.8% 78.7% Non Performing Loan ratio 3.0% 3.6% 4.0% 5.9% 3.0% 3.6% 4.0% 5.9%
Return on Average Equity 15.5% 16.8% 6.3% 4.7% 15.5% 16.8% 6.3% 4.7%
Return on Average Assets 2.0% 2.0% 0.7% 0.6% 2.0% 2.0% 0.7% 0.6%
Valuation Multiples
P/E (x) 1.9 1.6 4.3 5.4 1.9 1.6 4.3 5.4
P/B (x) 0.3 0.3 0.3 0.3 0.3 0.3 0.3 0.3
Dividend Yield 27.6% 2.5% 2.3% 2.8% 27.6% 2.5% 2.3% 2.8%

82
RESEARCH
In Dire Straits
2016 Outlook
Financial Statements and Key Ratios – Guaranty Trust Bank Plc Income Statement 2013A 2014A 2015E 2016F 2013A 2014A 2015E 2016F
N'Mn $'Mn Gross Earnings 242,665 278,521 298,033 289,135 1,523 1,686 1,496 1,382 Interest Income 185,383 200,603 222,413 219,042 1,164 1,215 1,116 1,047 Interest expense (48,444) (58,211) (68,682) (72,637) (304) (352) (345) (347) Net interest income 136,939 142,392 153,730 146,405 860 862 772 700 Non-interest income 55,457 75,804 75,620 70,093 348 459 380 335 Loan loss provisions (2,886) (7,098) (12,191) (15,490) (18) (43) (61) (74) Operating income 189,510 211,097 217,160 201,008 1,190 1,278 1,090 961 Total operating expenses (82,419) (94,712) (100,351) (102,112) (517) (573) (504) (488) Pre-tax earnings 107,091 116,386 116,809 98,896 672 705 586 473 Taxation (17,067) (17,691) (18,689) (15,823) (107) (107) (94) (76) Profit after tax 90,024 98,695 98,119 83,073 565 598 493 397 Statement of financial position 2013A 2014A 2015E 2016F 2013A 2014A 2015E 2016F
Assets N'Mn $'Mn
Cash and Short term funds 455,988 507,950 606,874 649,355 2,830 3,082 3,058 3,117
Interbank placements 5,596 5,696 13,193 14,116 35 35 66 68
Investment Securities 144,198 94,783 131,929 141,164 895 575 665 678
Treasury bills and Govt. bonds 360,883 333,674 356,209 381,143 2,239 2,024 1,795 1,829
Loans and Advances 1,002,371 1,275,681 1,390,662 1,448,427 6,220 7,739 7,008 6,952
Other Assets 65,503 61,856 60,558 107,202 406 375 305 515
Property and Equipment 68,306 76,236 79,157 81,875 424 463 399 393
Total Assets 2,102,846 2,355,876 2,638,582 2,823,282 13,049 14,293 13,297 13,551
Liabilities Customer deposits 1,427,494 1,618,208 1,799,513 1,897,246 8,858 9,817 9,069 9,106 Due to other banks 15,208 31,662 31,663 47,595 94 192 160 228 Other Liabilities 153,154 148,752 184,701 169,397 950 902 931 813 Taxation 18,139 15,601 23,747 23,998 113 95 120 115 Borrowings 156,498 167,321 167,321 207,321 971 1,015 843 995
Total Liabilities 1,770,493 1,981,544 2,206,945 2,345,557 10,987 12,022 11,122 11,258
Capital and Reserves
Share capital 14,716 14,716 14,716 14,716 91 89 74 71
Share Premium 123,471 123,471 123,471 123,471 766 749 622 593
Other reserves 189,083 230,467 289,338 335,028 1,173 1,398 1,458 1,608
Minority Interest 5,084 5,679 4,112 4,511 32 34 21 22
Total Equity 332,353 374,332 431,637 477,726 2,062 2,271 2,175 2,293
Total liabilities and equity 2,102,846 2,355,876 2,638,582 2,823,282 13,049 14,293 13,297 13,551
Key Ratios 2013A 2014A 2015E 2016F 2013A 2014A 2015E 2016F
Profitability
Net Interest Margin 10.0% 8.8% 8.5% 7.6% 10.0% 8.8% 8.5% 7.6%
Cost to Income Ratio 43.5% 44.9% 46.2% 50.8% 43.5% 44.9% 46.2% 50.8%
Cost of Risk 0.3% 0.6% 0.9% 1.1% 0.3% 0.6% 0.9% 1.1%
Loan to Deposit Ratio 70.2% 78.8% 77.3% 76.3% 70.2% 78.8% 77.3% 76.3%
Non Performing Loan ratio 3.6% 3.2% 3.5% 4.0% 3.6% 3.2% 3.5% 4.0%
Return on Average Equity 29.1% 27.7% 24.2% 18.1% 29.1% 27.7% 24.2% 18.1%
Return on Average Assets 4.7% 4.4% 3.9% 3.0% 4.7% 4.4% 3.9% 3.0%
Valuation Multiples
P/E (x) 5.4 4.9 5.0 5.9 5.4 4.9 5.0 5.9 P/B (x) 1.5 1.3 1.1 1.0 1.5 1.3 1.1 1.0 Dividend Yield 10.4% 10.7% 8.1% 7.7% 10.4% 10.7% 8.1% 7.7%

83
RESEARCH
In Dire Straits
2016 Outlook
Financial Statements and Key Ratios – Ecobank Transnational Incorporated Income Statement 2013A 2014A 2015E 2016F 2013A 2014A 2015E 2016F
N'Mn $'Mn
Gross Earnings 406,580 479,282 613,785 632,495 2,552 2,902 3,081 3,024
Interest Income 254,825 285,978 378,879 397,795 1,600 1,732 1,902 1,902
Interest expense (87,450) (102,760) (137,928) (156,251) (549) (622) (692) (747)
Loan loss provisions (60,009) (44,088) (61,257) (59,084) (377) (267) (307) (282)
Net interest income 167,375 183,219 240,952 241,544 1,051 1,109 1,209 1,155
Non-interest income 151,755 193,304 234,905 234,699 953 1,170 1,179 1,122
Operating income 259,121 332,434 414,600 417,159 1,627 2,013 2,081 1,994
Operating expenses (223,797) (246,261) (305,432) (328,317) (1,405) (1,491) (1,533) (1,569)
Exceptional item 3 (370) (446) (468) 0 (2) (2) (2)
Pre-tax earnings 35,327 85,804 108,722 88,374 222 520 546 422
Taxation (10,470) (20,152) (26,093) (21,210) (66) (122) (131) (101)
Profit after tax 24,857 65,651 82,629 67,164 156 398 415 321
Statement of financial position 2013A 2014A 2015E 2016F 2013A 2014A 2015E 2016F Assets N'Mn $'Mn Cash and Short term funds 463,768 584,577 808,189 891,022 2,878 3,547 4,073 4,277 Interbank placements 211,453 310,293 404,095 445,511 1,312 1,883 2,036 2,138 Treasury bills and Govt. bonds 711,173 703,980 883,957 974,556 4,413 4,271 4,455 4,677 Loans and Advances 1,840,592 2,029,328 2,520,733 2,749,770 11,422 12,312 12,703 13,198 Other Assets 263,572 216,132 247,315 307,550 1,636 1,311 1,246 1,476 Property and Equipment 140,546 151,757 186,894 200,480 872 921 942 962
Total Assets 3,631,105 3,996,066 5,051,183 5,568,889 22,532 24,244 25,456 26,729
Liabilities Customer deposits 2,657,348 2,874,136 3,662,107 4,037,444 16,490 17,437 18,455 19,378 Due to other banks 113,925 150,464 166,689 193,317 707 913 840 928 Other Liabilities 288,342 257,784 298,020 322,996 1,789 1,564 1,502 1,550 Taxation 17,447 22,164 40,409 44,551 108 134 204 214 Borrowings 210,044 253,882 305,635 320,914 1,303 1,540 1,540 1,540
Total Liabilities 3,287,106 3,558,429 4,472,860 4,919,222 20,398 21,588 22,541 23,610
Capital and Reserves
Share capital 227,061 326,285 392,886 412,527 1,409 1,980 1,980 1,980
Share Premium 84,996 77,685 142,884 190,150 527 471 720 913
Shareholders' funds 312,057 403,969 535,770 602,677 1,936 2,451 2,700 2,893
Minority Interest 31,942 33,668 42,552 46,990 198 204 214 226
Total Equity 343,999 437,638 578,322 649,667 2,135 2,655 2,914 3,118
Total liabilities and equity 3,631,105 3,996,066 5,051,183 5,568,889 22,532 24,244 25,456 26,729
Key Ratios 2013A 2014A 2015E 2016F 2013A 2014A 2015E 2016F
Profitability
Net Interest Margin 6.6% 6.2% 6.4% 5.9% 6.6% 6.2% 6.4% 5.9% Cost to Income Ratio 70.1% 65.4% 64.2% 68.9% 70.1% 65.4% 64.2% 68.9% Cost of Risk 3.1% 2.1% 2.3% 2.0% 3.1% 2.1% 2.3% 2.0% Loan to Deposit Ratio 69.3% 70.6% 68.8% 68.1% 69.3% 70.6% 68.8% 68.1% Non Performing Loan ratio 6.2% 4.4% 5.1% 5.1% 6.2% 4.4% 5.1% 5.1% Return on Average Equity 4.8% 15.4% 13.8% 9.8% 4.8% 15.4% 13.8% 9.8% Return on Average Assets 0.7% 1.7% 1.7% 1.2% 0.7% 1.7% 1.7% 1.2%
Valuation Multiples
P/E (x) 14.6 4.1 4.19 5.4 14.6 4.1 4.19 5.4 P/B (x) 0.7 0.6 0.6 0.5 0.7 0.6 0.6 0.5 Dividend Yield 0.0% 0.0% 7.2% 5.5% 0.0% 0.0% 7.2% 5.5%

84
RESEARCH
In Dire Straits
2016 Outlook
Financial Statements and Key Ratios – Access Bank Plc 2013A 2014A 2015E 2016F 2013A 2014A 2015E 2016F
N'Mn US$’Mn Gross Earnings 206,786 245,181 322,887 271,522 1,298 1,485 1,621 1,298 Interest Income 145,961 176,918 199,313 196,755 916 1,071 1,000 941 Interest expenses (68,237) (76,901) (94,810) (105,411) (428) (466) (476) (504) Net interest income 77,724 100,017 104,503 91,344 488 606 525 437 Non-interest income 60,825 68,263 123,574 74,767 382 413 620 357 Loan loss provisions 6,164 (11,652) (18,308) (13,103) 39 (71) (92) (63) Operating income 144,712 156,627 209,769 153,008 908 948 1,053 731 Operating expenses (101,181) (104,605) (145,144) (129,529) (635) (633) (729) (619) Exceptional item 266 (87) (87) (87) 2 (1) (0) (0) Pre-tax earnings 43,796 51,935 64,538 23,392 275 314 324 112 Taxation (7,499) (8,959) (9,681) (3,509) (47) (54) (49) (17) Profit after tax 36,298 42,976 54,857 19,883 228 260 275 95
Statement of financial position 2013A 2014A 2015E 2016F 2013A 2014A 2015E 2016F
Assets N'Mn US$’Mn
Cash and Short term funds 439,460 405,015 521,461 578,821 2,727 2,457 2,628 2,778
Interbank placements 90,837 68,303 86,910 96,470 564 414 438 463
Treasury bills and Govt. bonds 357,791 329,827 397,303 441,007 2,220 2,001 2,002 2,117
Loans and Advances 786,170 1,110,464 1,196,195 1,295,600 4,878 6,737 6,028 6,218
Other Assets 93,965 121,091 204,299 261,705 583 735 1,030 1,256
Property and Equipment 67,243 69,660 76,978 82,689 417 423 388 397
Total Assets 1,835,466 2,104,361 2,483,145 2,756,291 11,390 12,767 12,514 13,229
Liabilities
Customer deposits 1,331,419 1,454,419 1,710,887 1,901,841 8,262 8,824 8,622 9,128
Due to other banks 72,148 119,045 148,855 193,950 448 722 750 931
Other Liabilities 60,313 26,948 37,992 60,914 374 163 191 292
Taxation 6,937 8,240 10,429 11,576 43 50 53 56
Term loan 120,167 218,297 218,297 218,297 746 1,324 1,100 1,048
Total Liabilities 1,590,984 1,826,950 2,126,461 2,386,579 9,873 11,084 10,716 11,455
Capital and Reserves
Share capital 11,441 11,441 14,464 14,464 71 69 73 69
Share Premium 161,036 161,036 199,725 199,725 999 977 1,007 959
Minority Interest 1,768 3,531 4,173 4,641 11 22 26 22
Other reserves 70,236 101,402 138,324 150,883 436 615 697 724
Total Equity 244,482 277,410 356,685 369,712 1,517 1,683 1,798 1,774
Total liabilities and equity 1,835,466 2,104,360 2,483,145 2,756,291 11,390 12,767 12,514 13,229
Key Ratios 2013A 2014A 2015E 2016F 2013A 2014A 2015E 2016F
Profitability
Net Interest Margin 7.1% 6.4% 5.4% 4.5% 7.1% 6.6% 6.3% 6.5%
Cost to Income Ratio 69.9% 66.8% 69.2% 84.7% 69.9% 65.6% 68.0% 67.4%
Cost of Risk -0.8% 1.0% 1.5% 1.0% -0.8% 1.0% 1.1% 1.1% Loan to Deposit Ratio 59.0% 76.4% 69.9% 68.1% 59.0% 67.8% 68.3% 67.8% Non Performing Loan ratio 2.7% 2.2% 3.5% 3.5% 3.0% 2.5% 2.6% 2.7% Return on Average Equity 15.2% 16.4% 17.3% 5.4% 15.2% 17.4% 15.0% 14.8%
Return on Average Assets 2.0% 2.2% 2.4% 0.8% 2.0% 2.2% 2.0% 2.0%
Valuation Multiples
P/E (x) 2.8 2.4 2.04 6.5 2.8 2.4 2.04 6.5 P/B (x) 0.4 0.4 0.31 0.34 0.4 0.4 0.3 0.4 Dividend Yield 13.7% 13.7% 15.7% 5.3% 13.7% 13.7% 15.7% 5.3%
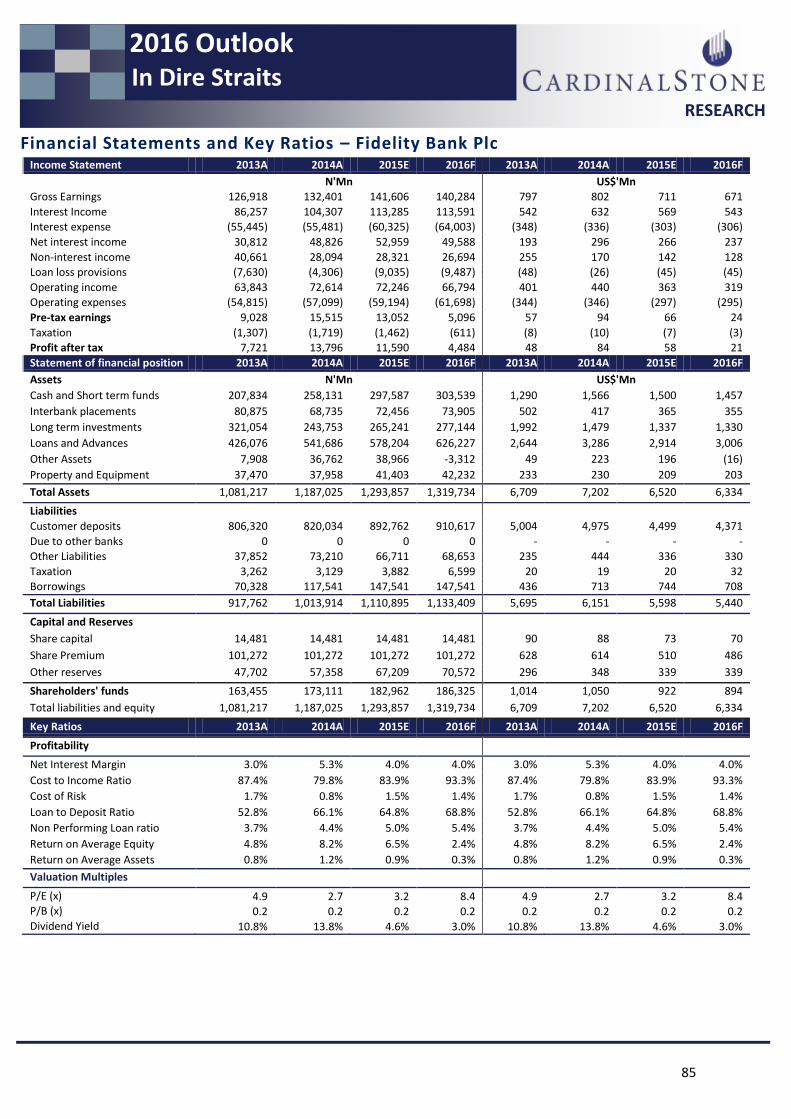
85
RESEARCH
In Dire Straits
2016 Outlook
Financial Statements and Key Ratios – Fidelity Bank Plc Income Statement 2013A 2014A 2015E 2016F 2013A 2014A 2015E 2016F
N'Mn US$'Mn
Gross Earnings 126,918 132,401 141,606 140,284 797 802 711 671
Interest Income 86,257 104,307 113,285 113,591 542 632 569 543
Interest expense (55,445) (55,481) (60,325) (64,003) (348) (336) (303) (306)
Net interest income 30,812 48,826 52,959 49,588 193 296 266 237
Non-interest income 40,661 28,094 28,321 26,694 255 170 142 128
Loan loss provisions (7,630) (4,306) (9,035) (9,487) (48) (26) (45) (45)
Operating income 63,843 72,614 72,246 66,794 401 440 363 319
Operating expenses (54,815) (57,099) (59,194) (61,698) (344) (346) (297) (295)
Pre-tax earnings 9,028 15,515 13,052 5,096 57 94 66 24
Taxation (1,307) (1,719) (1,462) (611) (8) (10) (7) (3)
Profit after tax 7,721 13,796 11,590 4,484 48 84 58 21
Statement of financial position 2013A 2014A 2015E 2016F 2013A 2014A 2015E 2016F
Assets N'Mn US$'Mn
Cash and Short term funds 207,834 258,131 297,587 303,539 1,290 1,566 1,500 1,457
Interbank placements 80,875 68,735 72,456 73,905 502 417 365 355
Long term investments 321,054 243,753 265,241 277,144 1,992 1,479 1,337 1,330
Loans and Advances 426,076 541,686 578,204 626,227 2,644 3,286 2,914 3,006
Other Assets 7,908 36,762 38,966 -3,312 49 223 196 (16)
Property and Equipment 37,470 37,958 41,403 42,232 233 230 209 203
Total Assets 1,081,217 1,187,025 1,293,857 1,319,734 6,709 7,202 6,520 6,334
Liabilities
Customer deposits 806,320 820,034 892,762 910,617 5,004 4,975 4,499 4,371
Due to other banks 0 0 0 0 - - - -
Other Liabilities 37,852 73,210 66,711 68,653 235 444 336 330
Taxation 3,262 3,129 3,882 6,599 20 19 20 32
Borrowings 70,328 117,541 147,541 147,541 436 713 744 708
Total Liabilities 917,762 1,013,914 1,110,895 1,133,409 5,695 6,151 5,598 5,440
Capital and Reserves
Share capital 14,481 14,481 14,481 14,481 90 88 73 70
Share Premium 101,272 101,272 101,272 101,272 628 614 510 486
Other reserves 47,702 57,358 67,209 70,572 296 348 339 339
Shareholders' funds 163,455 173,111 182,962 186,325 1,014 1,050 922 894
Total liabilities and equity 1,081,217 1,187,025 1,293,857 1,319,734 6,709 7,202 6,520 6,334
Key Ratios 2013A 2014A 2015E 2016F 2013A 2014A 2015E 2016F
Profitability
Net Interest Margin 3.0% 5.3% 4.0% 4.0% 3.0% 5.3% 4.0% 4.0%
Cost to Income Ratio 87.4% 79.8% 83.9% 93.3% 87.4% 79.8% 83.9% 93.3%
Cost of Risk 1.7% 0.8% 1.5% 1.4% 1.7% 0.8% 1.5% 1.4%
Loan to Deposit Ratio 52.8% 66.1% 64.8% 68.8% 52.8% 66.1% 64.8% 68.8%
Non Performing Loan ratio 3.7% 4.4% 5.0% 5.4% 3.7% 4.4% 5.0% 5.4%
Return on Average Equity 4.8% 8.2% 6.5% 2.4% 4.8% 8.2% 6.5% 2.4%
Return on Average Assets 0.8% 1.2% 0.9% 0.3% 0.8% 1.2% 0.9% 0.3%
Valuation Multiples
P/E (x) 4.9 2.7 3.2 8.4 4.9 2.7 3.2 8.4 P/B (x) 0.2 0.2 0.2 0.2 0.2 0.2 0.2 0.2 Dividend Yield 10.8% 13.8% 4.6% 3.0% 10.8% 13.8% 4.6% 3.0%

86
RESEARCH
In Dire Straits
2016 Outlook
Financial Statements and Key Ratios – Diamond Bank Plc Income Statement 2013A 2014A 2015E 2016F 2013A 2014A 2015E 2016F
N'Mn $'Mn
Gross Earnings 181,155 208,402 210,311 204,983 1,137 1,262 1,056 980
Interest Income 143,128 161,130 172,386 169,407 899 976 865 810
Interest expense (38,500) (51,553) (56,237) (64,523) (242) (312) (282) (308)
Net interest income 104,628 109,576 116,150 104,884 657 663 583 501
Non-interest income 34,938 44,178 37,925 35,575 219 268 190 170
Loan loss provisions (23,297) (26,371) (44,668) (30,042) (146) (160) (224) (144)
Operating income 116,269 127,383 109,407 110,418 730 771 549 528
Operating expenses (84,184) (99,282) (99,910) (99,299) (528) (601) (502) (475)
Exceptional item (5) - - - (0) - - -
Pre-tax earnings 32,080 28,101 9,497 11,120 201 170 48 53
Taxation (3,535) (2,616) (855) (1,223) (22) (16) (4) (6)
Profit after tax 28,544 25,485 8,642 9,896 179 154 43 47
Statement of financial position 2013A 2014A 2015E 2016F 2013A 2014A 2015E 2016F
Assets N'Mn $'Mn
Cash and Short term funds 228,322 301,393 364,780 383,019 1,536 2,027 2,454 2,576
Interbank placements 129,362 296,099 278,950 292,897 803 1,796 1,406 1,406
Long term investments 383,210 449,714 525,713 551,999 2,378 2,728 2,649 2,649
Loans and Advances 689,168 791,095 850,773 887,811 4,277 4,799 4,288 4,261
Other Assets 38,966 39,761 61,178 71,991 242 241 308 346
Property and Equipment 49,827 55,062 64,373 65,339 309 334 324 314
Total Assets 1,518,856 1,933,123 2,145,767 2,253,055 9,425 11,728 10,814 10,814
Liabilities
Customer deposits 1,206,044 1,493,081 1,652,241 1,734,853 7,484 9,058 8,327 8,327
Due to other banks 54,579 68,760 87,719 87,644 339 417 442 421
Other Liabilities 48,323 53,118 78,222 76,604 300 322 394 368
Taxation & Deferred Tax 2,662 2,643 5,150 4,506 17 16 26 22
Borrowings 68,395 106,496 106,496 126,496 424 646 537 607
Total Liabilities 1,380,003 1,724,099 1,929,827 2,030,102 8,563 10,460 9,725 9,744
Capital and Reserves
Share capital 7,238 11,580 11,580 11,580 45 70 58 56
Share Premium 89,629 134,533 134,533 134,533 556 816 678 646
Other reserves 41,833 62,694 69,546 76,420 260 380 350 367
Minority Interest 154 218 281 420 1 1 1 2
Total Equity 138,854 209,025 215,940 222,953 862 1,268 1,088 1,070
Total liabilities and equity 1,518,856 1,933,123 2,145,767 2,253,055 9,425 11,728 10,814 10,814
Key Ratios 2013A 2014A 2015E 2016F 2013A 2014A 2015E 2016F
Profitability
Net Interest Margin 9.6% 8.0% 7.3% 6.2% 9.6% 8.0% 7.3% 6.2% Cost to Income Ratio 60.3% 64.6% 64.8% 70.7% 60.3% 64.6% 64.8% 70.7% Cost of Risk 3.2% 3.2% 4.9% 3.2% 3.2% 3.2% 4.9% 3.2% Loan to Deposit Ratio 57.1% 53.0% 51.5% 51.2% 57.1% 53.0% 51.5% 51.2% Non Performing Loan ratio 3.5% 5.1% 5.8% 5.8% 3.5% 5.1% 5.8% 5.8%
Return on Average Equity 23.1% 14.6% 4.0% 4.5% 23.1% 14.6% 4.0% 4.5%
Return on Average Assets 2.1% 1.5% 0.4% 0.4% 2.1% 1.5% 0.4% 0.4%
Valuation Multiples
P/E (x) 1.0 1.3 5.4 4.7 1.0 1.3 5.4 4.7 P/B (x) 0.2 0.2 0.2 0.2 0.2 0.2 0.2 0.2 Dividend Yield 15.0% 5.0% 3.7% 6.4% 15.0% 5.0% 3.7% 6.4%

87
RESEARCH
In Dire Straits
2016 Outlook
Financial Statements and Key Ratios – FCMB Group Plc Income Statement 2013A 2014A 2015E 2016F 2013A 2014A 2015E 2016F
N'Mn $'Mn
Gross Earnings 130,995 146,169 147,124 137,661 822 885 739 658
Interest Income 101,640 117,984 122,604 115,682 638 714 615 553
Interest expense (45,507) (45,351) (54,398) (59,464) (286) (275) (273) (284)
Net interest income 56,134 72,634 68,205 56,218 352 440 342 269
Non-interest income 28,116 28,185 24,521 21,980 177 171 123 105
Loan loss provisions (7,983) (10,640) (30,773) (13,913) (50) (64) (154) (67) Operating income 76,267 90,179 61,953 64,284 479 546 311 307
Operating expenses (58,151) (66,304) (66,067) (67,087) (365) (401) (332) (321)
Exceptional item 68 68 88 108 0 0 0 1
Pre-tax earnings 18,184 23,943 (4,026) (2,695) 114 145 (20) (13)
Taxation (2,183) (1,810) 282 269 (14) (11) 1 1
Profit after tax 16,001 22,133 -3,744 -2,425 100 134 -19 -12
Statement of financial position 2013A 2014A 2015E 2016F 2013A 2014A 2015E 2016F
Assets N'Mn $'Mn
Cash and Short term funds 199,700 126,294 152,953 187,367 1,239 766 771 899
Interbank placements 73,473 146,106 131,285 139,187 456 886 662 668
Treasury bills and Govt. bonds 218,774 202,841 216,683 200,751 1,358 1,231 1,092 964
Loans and Advances 450,533 617,980 646,765 677,185 2,796 3,749 3,259 3,250
Other Assets 38,987 47,753 96,331 101,727 242 290 485 488
Property and Equipment 26,812 28,392 30,591 32,120 166 172 154 154
Total Assets 1,008,280 1,169,365 1,274,608 1,338,338 6,257 7,094 6,423 6,424
Liabilities
Customer deposits 715,214 733,797 816,514 868,683 4,438 4,452 4,115 4,169
Due to other banks - 4,797 7,648 8,030 - 29 39 39
Other Liabilities 85,746 125,373 146,595 158,443 532 761 739 760
Taxation 4,369 4,405 5,105 5,353 27 27 26 26
Borrowings 59,244 140,628 140,628 140,628 368 853 709 675
Total Liabilities 864,573 1,008,999 1,116,489 1,181,138 5,365 6,121 5,627 5,669
Capital and Reserves
Share capital 9,901 9,901 9,901 9,901 61 60 50 48
Share Premium 115,392 115,392 115,392 115,392 716 700 582 554
Other reserves 18,422 35,072 32,826 31,370 114 213 165 151
Total Shareholders' funds 143,716 160,366 158,119 156,664 892 973 797 752
Total liabilities and equity 1,008,289 1,169,365 1,274,609 1,337,802 6,257 7,094 6,423 6,421
Key Ratios 2013A 2014A 2015E 2016F 2013A 2014A 2015E 2016F
Profitability
Net Interest Margin 5.6% 6.3% 3.5% 3.6% 5.6% 6.3% 3.5% 3.6%
Cost to Income Ratio 76.2% 73.5% 71.2% 85.8% 76.2% 73.5% 71.2% 85.8%
Cost of Risk 1.7% 1.7% 4.5% 1.9% 1.7% 1.7% 4.5% 1.9%
Loan to Deposit Ratio 63.0% 84.2% 79.2% 78.0% 63.0% 84.2% 79.2% 78.0%
Non Performing Loan ratio 3.9% 3.6% 5.0% 5.3% 3.9% 3.6% 5.0% 5.3%
Return on Average Equity 11.6% 14.6% -2.4% -1.5% 11.6% 14.6% -2.4% -1.5%
Return on Average Assets 1.7% 2.0% -0.3% -0.2% 1.7% 2.0% -0.3% -0.2%
Valuation Multiples
P/E (x) 2.1 1.5 N/M N/M 2.1 1.5 N/M N/M
P/B (x) 0.2 0.2 0.2 0.2 0.2 0.2 0.2 0.2
Dividend Yield 17.8% 14.8% 0.0% 0.0% 17.8% 14.8% 0.0% 0.0%

88
RESEARCH
In Dire Straits
2016 Outlook
Financial Statements and Key Ratios – Sterling Bank Plc Income Statement 2013A 2014A 2015E 2016F 2013A 2014A 2015E 2016F
N'Mn $'Mn
Gross Earnings 91,629 103,679 112,676 110,087 575 628 566 526
Interest Income 69,973 77,932 85,039 84,682 439 472 427 405
Interest expense (34,160) (34,915) (39,156) (44,093) (214) (211) (197) (211)
Net interest income 35,813 43,017 45,883 40,589 225 260 230 194
Non-interest income 21,656 25,747 27,638 25,405 136 156 139 121
Loan loss provisions (8,259) (7,389) (10,852) (8,516) (52) (45) (54) (41)
Operating income 49,210 61,375 62,668 57,478 309 372 315 275
Operating expenses (39,899) (50,627) (52,151) (53,336) (250) (307) (262) (255)
Pre-tax earnings 9,310 10,748 10,517 4,142 58 65 53 20
Taxation (1,035) (1,743) (1,315) (559) (6) (11) (7) (3)
Profit after tax 8,275 9,005 9,203 3,583 52 55 46 17
Statement of financial position 2013A 2014A 2015E 2016F 2013A 2014A 2015E 2016F
Assets N'Mn $'Mn
Cash and Short term funds 96,901 174,760 205,887 222,358 601 1,060 1,038 1,067 Interbank placements 85,601 67,330 63,490 68,569 531 408 320 329
Treasury bills and Govt. bonds 177,593 175,322 199,539 215,502 1,102 1,064 1,006 1,034
Loans and Advances 321,744 371,246 401,854 439,277 1,997 2,252 2,025 2,108
Other Assets 16,890 21,930 21,712 19,154 105 133 109 92 Property and Equipment 9,069 13,952 14,512 14,693 56 85 73 71
Total Assets 707,797 824,539 906,993 979,553 4,392 5,002 4,571 4,701
Liabilities Customer deposits 570,511 655,944 710,176 773,847 3,540 3,980 3,579 3,714 Other Liabilities 29,358 32,143 13,912 19,526 182 195 70 94 Taxation 1,112 1,802 1,814 2,939 7 11 9 14 Borrowings 43,358 49,935 89,935 89,935 269 303 453 432
Total Liabilities 644,339 739,824 815,836 886,246 3,998 4,488 4,111 4,254
Capital and Reserves
Share capital 10,796 14,395 14,395 14,395 67 87 73 69
Share Premium 27,872 42,759 42,759 42,759 173 259 215 205
Other reserves 24,790 27,561 34,003 36,152 154 167 171 174
Shareholders' funds 63,458 84,715 91,157 93,307 394 514 459 448
Total liabilities and equity 707,797 824,540 906,993 979,553 4,392 5,002 4,571 4,701
Key Ratios 2013A 2014A 2015E 2016F 2013A 2014A 2015E 2016F
Profitability
Net Interest Margin 5.1% 5.9% 5.5% 4.6% 5.1% 5.9% 5.5% 4.6%
Cost to Income Ratio 69.4% 73.6% 70.9% 80.8% 69.4% 73.6% 70.9% 80.8%
Cost of Risk 2.4% 1.9% 2.6% 1.8% 2.4% 1.9% 2.6% 1.8% Loan to Deposit Ratio 56.4% 56.6% 56.6% 56.8% 56.4% 56.6% 56.6% 56.8%
Non Performing Loan ratio 3.2% 3.1% 4.0% 4.6% 3.2% 3.1% 4.0% 4.6%
Return on Average Equity 14.2% 12.2% 10.5% 3.9% 14.2% 12.2% 10.5% 3.9%
Return on Average Assets 1.3% 1.2% 1.1% 0.4% 1.3% 1.2% 1.1% 0.4%
Valuation Multiples
P/E (x) 4.9 5.7 5.6 14.4 4.9 5.7 5.6 14.4 P/B (x) 0.6 0.6 0.6 0.6 0.6 0.6 0.6 0.6 Dividend Yield 14.0% 3.4% 5.4% 2.8% 14.0% 3.4% 5.4% 2.8%

89
RESEARCH
In Dire Straits
2016 Outlook
Financial Statements and Key Ratios – Stanbic IBTC Holdings Plc Income Statement 2013A 2014A 2015E 2016F 2013A 2014A 2015E 2016F
N'Mn $'Mn Gross Earnings 111,226 130,611 138,169 140,570 698 791 694 672 Interest Income 62,585 72,156 81,969 79,981 393 437 411 382 Interest expense (25,572) (25,498) (38,758) (39,152) (161) (154) (195) (187) Net interest income 37,013 46,658 43,211 40,829 232 283 217 195 Non-interest income 48,219 57,944 56,200 60,588 303 351 282 290 Loan loss provisions (2,667) (3,217) (13,878) (17,251) (17) (19) (70) (82) Operating Income 82,565 101,385 85,532 84,167 518 614 429 402 Operating expenses (57,948) (61,315) (63,932) (65,902) (364) (371) (321) (315) Pre-tax earnings 24,617 40,070 21,600 18,265 155 243 108 87 Taxation (3,844) (8,005) (3,672) (3,105) (24) (48) (18) (15) Profit after tax 20,773 32,065 17,928 15,160 130 194 90 72 Statement of financial position 2013A 2014A 2015E 2016F 2013A 2014A 2015E 2016F
Assets N'Mn $'Mn
Cash and Short term funds 120,312 143,171 185,206 219,663 747 869 933 1,054
Interbank placements 94,180 8,814 107,678 109,831 584 53 543 527
Treasury bills and Govt. bonds 206,274 335,019 269,194 241,629 1,280 2,033 1,357 1,160
Loans and Advances 289,747 398,604 427,272 444,025 1,798 2,418 2,153 2,131
Other Assets 27,545 34,930 62,662 60,101 171 212 316 288
Property and Equipment 24,988 24,004 24,766 23,065 155 146 125 111
Total Assets 763,046 944,542 1,076,778 1,098,313 4,735 5,730 5,426 5,271
Liabilities Customer deposits 416,352 494,935 576,076 587,598 2,584 3,003 2,903 2,820 Due to other banks 51,686 59,121 67,837 68,095 321 359 342 327 Other Liabilities 134,423 173,313 183,052 171,353 834 1,051 923 822 Taxation 7,788 9,774 10,768 10,983 48 59 54 53 Borrowings 55,163 93,124 93,124 113,124 342 565 469 543
Total Liabilities 665,412 830,267 930,857 951,153 4,129 5,037 4,691 4,565
Capital and Reserves
Share capital 5,000 5,000 5,400 5,400 31 30 27 26
Share Premium 65,450 65,450 85,450 85,450 406 397 431 410
Other reserves 23,863 39,602 48,544 55,358 148 240 245 266
Minority Interest 3,321 4,223 6,526 953 21 26 33 5
Total Equity 97,634 114,275 145,921 147,160 606 693 735 706
Total liabilities and equity 763,046 944,542 1,076,778 1,098,313 4,735 5,730 5,426 5,271
Key Ratios 2013A 2014A 2015E 2016F 2013A 2014A 2015E 2016F
Profitability
Net Interest Margin 5.1% 5.4% 3.1% 2.4% 5.1% 5.4% 3.1% 2.4%
Cost to Income Ratio 70.2% 60.5% 74.7% 78.3% 70.2% 60.5% 74.7% 78.3%
Cost of Risk 0.9% 0.8% 3.1% 3.6% 0.9% 0.8% 3.1% 3.6%
Loan to Deposit Ratio 69.6% 80.5% 74.2% 75.6% 69.6% 80.5% 74.2% 75.6%
Non Performing Loan ratio 4.4% 4.3% 5.2% 5.8% 4.4% 4.3% 5.2% 5.8%
Return on Average Equity 21.0% 28.7% 12.2% 8.7% 21.0% 28.7% 12.2% 8.7%
Return on Average Assets 2.9% 3.8% 1.8% 1.4% 2.9% 3.8% 1.8% 1.4%
Valuation Multiples
P/E (x) 6.9 4.4 8.2 10.2 8.0 5.2 9.5 11.8 P/B (x) 1.5 1.3 1.0 1.1 1.8 1.5 1.2 1.2 Dividend Yield 5.6% 8.7% 5.0% 4.4% 4.8% 7.5% 4.3% 3.8%

90
RESEARCH
In Dire Straits
2016 Outlook
Financial Statements and Key Ratios – Custodian and Allied Plc Income Statement 2013A 2014A 2015E 2016F 2013A 2014A 2015E 2016F
N'Mn $'Mn
Gross Premium Written 22,963 25,200 26,460 27,783 144 153 133 139 Gross Premium Income 18,797 18,663 19,845 21,671 118 113 100 109 Net Premium Income 8,417 8,719 9,327 10,185 53 53 47 51 Fees and Commission Income 2,327 2,387 2,745 3,157 15 14 14 16 Net Underwriting Income 10,744 11,106 12,072 13,342 67 67 61 67 Total Underwriting Expenses (6,749) (6,653) (7,153) (7,723) (42) (40) (36) (39) Underwriting Profit 3,995 4,453 4,919 5,619 25 27 25 28 Total Investment Income 4,138 4,802 5,058 4,610 26 29 25 23 Expenses (3,584) (4,118) (4,763) (5,001) (22) (25) (24) (25) Results Of Operating Activ ity 4,550 5,137 5,214 5,228 29 31 26 26 PBT 4,337 5,149 5,239 5,244 27 31 26 26 Income Tax Expense (733) (1,060) (1,048) (1,049) (5) (6) (5) (5) Profit For the Period 3,603 4,089 4,192 4,195 23 25 21 21 Statement of Financial Position 2013A 2014A 2015E 2016F 2013A 2014A 2015E 2016F Assets N'Mn $'Mn Cash and Short term funds 15,420 15,868 19,316 22,453 96 96 97 112 Financial Assets 7,462 11,947 14,415 17,690 46 72 73 89 Trade Receivables 107 191 173 204 1 1 1 1 Other Receivables 737 1,118 951 1,157 5 7 5 6 Reinsurance Assets 11,042 7,761 9,226 10,886 69 47 46 55 Deferred Acquisition Cost 372 557 461 476 2 3 2 2 Investments in Associates 557 668 865 1,157 3 4 4 6 Investment Properties 6,309 7,351 8,649 10,206 39 45 44 51 Intangible Assets 333 84 159 171 2 1 1 1 Property and Equipment 2,464 2,469 2,595 2,790 15 15 13 14
Statutory Deposit 850 850 850 850 5 5 4 4
Total Assets 45,654 48,864 57,660 68,039 283 296 291 341
Liabilities
Insurance Liabil ities 17,658 15,807 19,604 23,133 110 96 99 116 Invst Contract L iabil it ies 3,080 3,030 4,036 4,763 19 18 20 24 Trade Payables 826 1,709 1,730 1,701 5 10 9 9 Other Payables 1,079 1,482 1,730 2,041 7 9 9 10 Current Income Tax Liabilities 1,208 1,098 1,499 1,769 7 7 8 9 Borrowings 1,974 2,125 2,422 3,402 12 13 12 17
Deferred Tax Liabi lities 305 579 1,627 3,083 2 4 8 15
Total L iabil it ies 26,131 25,830 32,648 39,892 162 157 165 200
Capital and Reserves
Share capital 2,941 2,941 2,941 2,941 18 18 15 15 Share Premium 6,406 6,406 6,406 6,406 40 39 32 32 Contingency Reserves 4,128 4,779 5,496 6,241 26 29 28 31 Retained Earnings 5,554 7,837 9,675 11,951 34 48 49 60 Treasury Shares (140) (140) (140) (140) (1) (1) (1) (1) Other Reserves (AFS Reserve) 204 664 - - 1 4 - -
Minority Interest 430 547 634 748 3 3 3 4
Shareholders' funds 19,523 23,034 25,012 28,146 121 140 126 141
Total l iabil ities and equity 45,654 48,864 57,660 68,039 283 296 291 341
Key Ratios 2013A 2014A 2015E 2016F 2013A 2014A 2015E 2016F
Profitability
Loss ratio 53.8% 53.6% 54.0% 54.0% 53.8% 30.1% 22.2% 23.5% Underwriting expense rat io 68.9% 69.9% 73.8% 70.9% 68.9% 8.2% 5.6% 6.6% P/E (x) 6.9 6.0 5.9 5.9 6.9 6.0 5.9 5.9 P/B (x) 1.3 1.1 1.0 0.9 1.3 1.1 1.0 0.9
Dividend Yield (%) 3.8% 4.3% 4.4% 4.8% 3.8% 4.3% 4.4% 4.8%

91
RESEARCH
In Dire Straits
2016 Outlook
Financial Statements and Key Ratios – AIICO Insurance Plc Income Statement 2013A 2014A 2015E 2016F 2013A 2014A 2015E 2016F
N'Mn $'Mn
Gross Premium Written 23,603 33,648 33,312 33,978 148 204 167 170 Gross Premium Income 23,316 20,928 16,656 20,387 146 127 84 102 Net Premium Income 18,228 16,222 13,158 16,106 114 98 66 81 Fees and Commission Income 1,515 1,833 1,577 1,734 10 11 8 9 Net Underwriting Income 19,743 18,055 14,735 17,840 124 109 74 89 Total Underwriting Expenses (17,012) (12,832) (12,147) (13,310) (107) (78) (61) (67) Underwriting Profit 2,731 5,223 2,588 4,530 17 32 13 23 Total Investment Income 3,169 4,258 6,517 5,874 20 26 33 29 Expenses (7,179) (6,204) (5,448) (7,271) (45) (38) (27) (36) PBT (1,280) 3,277 3,656 3,134 (8) 20 18 16 Income Tax Expense 540 (1,044) (731) (627) 3 (6) (4) (3) Profit For the Period (739) 2,233 2,925 2,507 (5) 14 15 13
Statement of f inancial position 2013A 2014A 2015E 2016F 2013A 2014A 2015E 2016F Assets
N'Mn
$'Mn
Cash and Short term funds 8,542 7,954 7,001 15,695 53 48 35 79 Financial Assets 19,046 38,173 47,604 48,372 118 232 240 242 Trade Receivables 36 210 280 233 0 1 1 1 Other Receivables 1,804 322 420 1,497 11 2 2 7 Reinsurance Assets 2,255 1,699 2,338 3,197 14 10 12 16 Deferred Acquisition Cost 285 444 853 848 2 3 4 4 Deferred Tax Assets 2,908 1,697 3,341 3,897 18 10 17 20 Investment Properties 1,190 1,203 1,470 1,924 7 7 7 10 Intangible Assets 879 923 553 506 5 6 3 3 Property and Equipment 4,657 5,183 5,646 5,937 29 31 28 30 Statutory Deposit 500 530 500 500 3 3 3 3
Total Assets 42,101 58,338 70,006 82,607 261 354 353 414
Liabilities
Insurance Liabil ities 21,870 35,071 39,560 47,294 136 213 199 237 Invst Contract L iabil it ies 6,356 6,608 9,717 11,259 39 40 49 56 Overdraft 11 - - - 0 - - - Trade Payables 59 644 681 851 0 4 3 4 Other Payables 1,776 3,702 4,791 6,232 11 22 24 31 Dividend Payable 34 - - - 0 - - - Current Income Tax Liabilities 691 559 1,076 1,236 4 3 5 6 Finance Lease Obligation - 49 140 165 - 0 1 1 Retirement Benefit Obligations 528 - 379 202 3 - 2 1 Irredeemable Preference Shares 50 - 50 50 0 - 0 0
Total L iabil it ies 31,528 46,641 56,499 67,406 196 283 285 337
Equity
Paid Up Share capital 3,465 3,465 3,465 3,465 22 21 17 17 Share Premium 2,824 2,824 2,824 2,824 18 17 14 14 Contingency Reserves 2,507 3,019 3,604 4,106 16 18 18 21 Preference Shares - 50 - - - 0 - - Retained Earnings (1,407) 276 1,988 3,241 (9) 2 10 16 Other Reserves (AFS Reserve) 2,943 1,818 1,275 1,151 18 11 6 6
Shareholders' funds 10,332 11,453 13,157 14,787 64 69 66 74 Minority Interest 241 245 350 413 1 1 2 2 Total Equity 10,573 11,697 13,507 15,200 66 71 68 76 Total l iabil ities and equity 42,101 58,338 70,006 82,607 261 354 353 414 Key Ratios 2013A 2014A 2015E 2016F 2013A 2014A 2015E 2016F Loss ratio 37.2% 56.1% 67.0% 61.5% 37.2% 56.1% 67.0% 61.5% Underwriting expense rat io 46.2% 60.5% 63.3% 63.3% 46.2% 60.5% 63.3% 63.3% Combined rat io 83.4% 116.6% 130.3% 124.8% 83.4% 116.6% 130.3% 124.8% RoAE N/M 20.5% 23.8% 17.9% N/M 20.5% 23.8% 17.9% P/E N/M 3.5 2.1 2.5 N/M 3.3 2.0 2.3 P/B 0.8 0.7 0.5 0.4 0.7 0.6 0.4 0.4 Dividend Yield 0.0% 0.0% 11.7% 12.1% 0.0% 0.0% 12.7% 13.1%
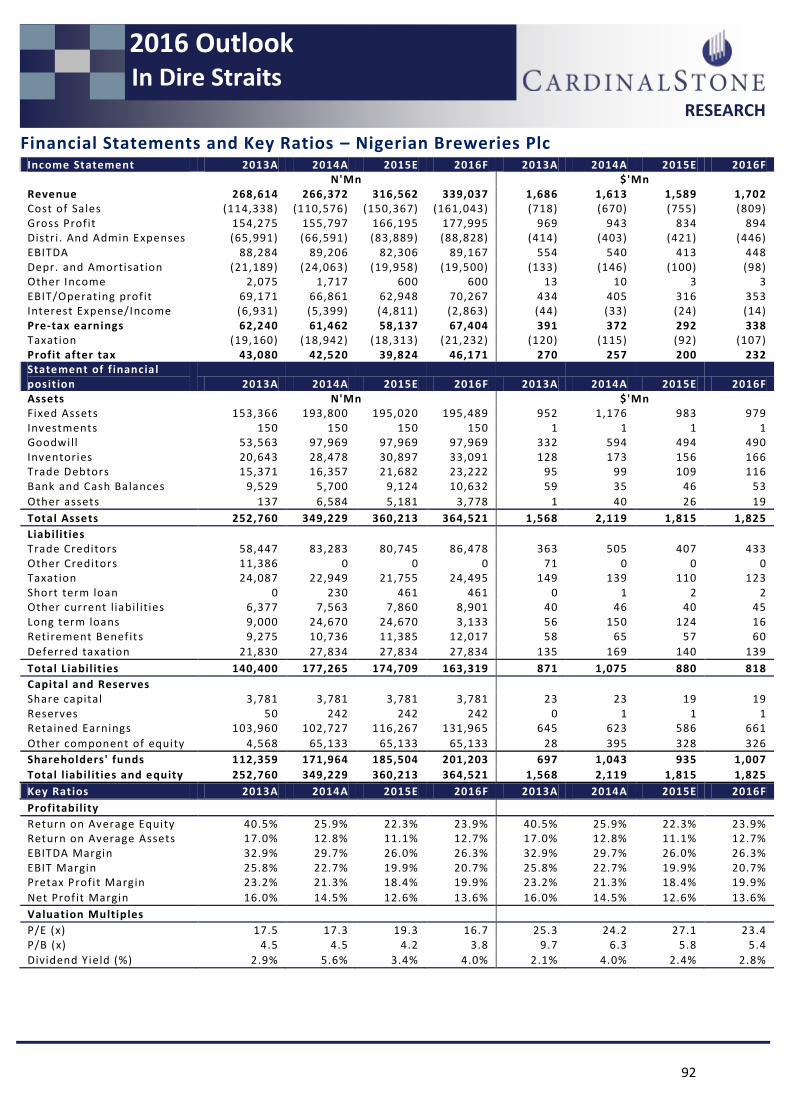
92
RESEARCH
In Dire Straits
2016 Outlook
Financial Statements and Key Ratios – Nigerian Breweries Plc Income Statement 2013A 2014A 2015E 2016F 2013A 2014A 2015E 2016F N'Mn $'Mn Revenue 268,614 266,372 316,562 339,037 1,686 1,613 1,589 1,702 Cost of Sales (114,338) (110,576) (150,367) (161,043) (718) (670) (755) (809) Gross Profit 154,275 155,797 166,195 177,995 969 943 834 894 Distr i. And Admin Expenses (65,991) (66,591) (83,889) (88,828) (414) (403) (421) (446) EBITDA 88,284 89,206 82,306 89,167 554 540 413 448 Depr. and Amortisat ion (21,189) (24,063) (19,958) (19,500) (133) (146) (100) (98) Other Income 2,075 1,717 600 600 13 10 3 3 EBIT/Operating prof it 69,171 66,861 62,948 70,267 434 405 316 353 Interest Expense/Income (6,931) (5,399) (4,811) (2,863) (44) (33) (24) (14) Pre-tax earnings 62,240 61,462 58,137 67,404 391 372 292 338 Taxation (19,160) (18,942) (18,313) (21,232) (120) (115) (92) (107) Profit after tax 43,080 42,520 39,824 46,171 270 257 200 232 Statement of f inancial posit ion 2013A 2014A 2015E 2016F 2013A 2014A 2015E 2016F Assets N'Mn $'Mn Fixed Assets 153,366 193,800 195,020 195,489 952 1,176 983 979 Investments 150 150 150 150 1 1 1 1 Goodwill 53,563 97,969 97,969 97,969 332 594 494 490 Inventories 20,643 28,478 30,897 33,091 128 173 156 166 Trade Debtors 15,371 16,357 21,682 23,222 95 99 109 116 Bank and Cash Balances 9,529 5,700 9,124 10,632 59 35 46 53
Other assets 137 6,584 5,181 3,778 1 40 26 19
Total Assets 252,760 349,229 360,213 364,521 1,568 2,119 1,815 1,825
Liabilities Trade Creditors 58,447 83,283 80,745 86,478 363 505 407 433
Other Creditors 11,386 0 0 0 71 0 0 0 Taxation 24,087 22,949 21,755 24,495 149 139 110 123 Short term loan 0 230 461 461 0 1 2 2 Other current l iabil ities 6,377 7,563 7,860 8,901 40 46 40 45 Long term loans 9,000 24,670 24,670 3,133 56 150 124 16 Retirement Benefit s 9,275 10,736 11,385 12,017 58 65 57 60
Deferred taxation 21,830 27,834 27,834 27,834 135 169 140 139
Total L iabil it ies 140,400 177,265 174,709 163,319 871 1,075 880 818
Capital and Reserves Share capital 3,781 3,781 3,781 3,781 23 23 19 19
Reserves 50 242 242 242 0 1 1 1 Retained Earnings 103,960 102,727 116,267 131,965 645 623 586 661
Other component of equity 4,568 65,133 65,133 65,133 28 395 328 326
Shareholders' funds 112,359 171,964 185,504 201,203 697 1,043 935 1,007
Total l iabil ities and equity 252,760 349,229 360,213 364,521 1,568 2,119 1,815 1,825
Key Ratios 2013A 2014A 2015E 2016F 2013A 2014A 2015E 2016F
Profitability Return on Average Equity 40.5% 25.9% 22.3% 23.9% 40.5% 25.9% 22.3% 23.9%
Return on Average Assets 17.0% 12.8% 11.1% 12.7% 17.0% 12.8% 11.1% 12.7% EBITDA Margin 32.9% 29.7% 26.0% 26.3% 32.9% 29.7% 26.0% 26.3% EBIT Margin 25.8% 22.7% 19.9% 20.7% 25.8% 22.7% 19.9% 20.7% Pretax Profit Margin 23.2% 21.3% 18.4% 19.9% 23.2% 21.3% 18.4% 19.9%
Net Prof it Margin 16.0% 14.5% 12.6% 13.6% 16.0% 14.5% 12.6% 13.6%
Valuation Multiples P/E (x) 17.5 17.3 19.3 16.7 25.3 24.2 27.1 23.4
P/B (x) 4.5 4.5 4.2 3.8 9.7 6.3 5.8 5.4
Dividend Yield (%) 2.9% 5.6% 3.4% 4.0% 2.1% 4.0% 2.4% 2.8%

93
RESEARCH
In Dire Straits
2016 Outlook
Financial Statements and Key Ratios – Guinness Nigeria Plc Income Statement 2014A 2015A 2016E 2017F 2014A 2015A 2016E 2017F N'Mn $'Mn Revenue 109,202 118,496 124,820 134,115 686 718 627 641 Cost of Sales (54,397) (62,604) (74,892) (69,740) (341) (379) (376) (333) Gross Profit 54,805 55,892 49,928 64,375 344 338 251 308 Distr i. And Admin Expenses (33,469) (40,947) (36,822) (38,223) (210) (248) (185) (183) EBITDA 21,337 14,945 13,106 26,152 134 90 66 125 Other Income 734 723 723 723 5 4 4 3 Depr. and Amortisat ion (5,948) - (5,552) (5,971) (37) - (28) (29) EBIT/Operating prof it 16,123 15,667 8,277 20,904 101 95 42 100 Interest Expense/Income (4,442) (4,872) (2,061) (1,498) (28) (30) (10) (7) Pre-tax earnings 11,682 10,795 6,216 19,406 73 65 31 93 Taxation (2,108) (3,000) (1,740) (5,822) (13) (18) (9) (28) Profit after tax 9,573 7,795 4,475 13,584 60 47 22 65 Statement of f inancial position 2014A 2015A 2016E 2017F 2014A 2015A 2016E 2017F Assets N'Mn $'Mn Fixed Assets 90,683 87,754 88,443 89,178 563 532 446 428 Inventories 13,469 10,751 12,861 11,976 84 65 65 57 Trade Debtors 19,415 15,542 16,369 18,410 120 94 82 88 Bank and Cash Balances 6,291 5,805 5,981 3,785 39 35 30 18
Other current assets 2,470 2,395 2,470 2,470 15 15 12 12
Total Assets 132,328 122,247 126,124 125,819 821 742 636 604
Liabilities Trade Creditors 30,724 31,482 37,661 35,070 191 191 190 168 Other Creditors 4,680 1,472 0 0 29 9 0 0 Taxation 1,585 2,276 2,008 3,915 10 14 10 19 Short term loan 3,149 6,968 6,672 4,672 20 42 34 22 Other current l iabil ities 4,110 3,903 1,842 2,590 26 24 9 12 Long term loans 21,600 11,131 11,131 6,131 134 68 56 29 Retirement Benefit 3,029 2,213 2,414 2,626 19 13 12 13
Deferred taxation 18,389 14,461 12,960 12,587 114 88 65 60
Total L iabil it ies 87,267 73,905 74,689 67,591 542 448 376 324
Capital and Reserves Share capital 753 753 753 753 5 5 4 4 Share Premium 8,961 8,961 8,961 8,961 56 54 45 43 Retained Earnings 35,347 38,609 41,721 48,513 219 234 210 233
Other component of equity 0 19 0 0 0 0 0 0
Shareholders' funds 45,062 48,341 51,435 58,227 280 293 259 279
Total l iabil ities and equity 132,328 122,247 126,124 125,819 821 742 636 604
Key Ratios 2014A 2015A 2016E 2017F 2014A 2015A 2016E 2017F
Profitability
Return on Average Equity 21.0% 16.7% 9.0% 24.8% 21.0% 16.7% 9.0% 24.8% Return on Average Assets 7.2% 6.4% 3.5% 10.8% 7.2% 6.4% 3.5% 10.8% EBITDA Margin 19.5% 12.6% 10.5% 19.5% 19.5% 12.6% 10.5% 19.5% EBIT Margin 14.8% 13.2% 6.6% 15.6% 14.8% 13.2% 6.6% 15.6% Pretax Profit Margin 10.7% 9.1% 5.0% 14.5% 10.7% 9.1% 5.0% 14.5%
Net Prof it Margin 8.8% 6.6% 3.6% 10.1% 8.8% 6.6% 3.6% 10.1%
Valuation Multiples
P/E (x) 18.9 23.3 40.5 13.3 18.9 23.3 40.5 13.3 P/B (x) 4.0 3.8 3.5 3.1 4.0 3.8 3.5 3.1 Dividend Yield (%) 2.7% 0.0% 1.2% 3.7% 2.7% 0.0% 1.2% 3.7%

94
RESEARCH
In Dire Straits
2016 Outlook
Financial Statements and Key Ratios – Unilever Nigeria Plc Income Statement 2013A 2014E 2015E 2016F 2013A 2014E 2015F 2016F
N'Mn $'Mn
Revenue 60,004 55,754 56,033 58,835 377 338 281 281
Cost of Sales (37,554) (35,584) (35,861) (37,066) (236) (216) (180) (177)
Gross Profit 22,450 20,170 20,172 21,769 141 122 101 104
Distr i. Expenses (12,826) (15,561) (14,849) (14,709) (81) (94) (75) (70)
EBITDA 9,624 4,609 5,323 7,060 60 28 27 34
Depreciation (1,719) - (2,247) (2,519) (11) - (11) (12)
Other Income (24) 6 140 6 (0) 0 1 0
EBIT 7,881 4,615 3,216 4,547 49 28 16 22
Interest Expense/Income (969) (1,742) (2,615) (2,268) (6) (11) (13) (11)
Pre-tax earnings 6,911 2,873 601 2,279 43 17 3 11
Taxation (2,105) (461) (186) (707) (13) (3) (1) (3)
Profit after tax 4,807 2,412 415 1,573 30 15 2 8 Statement of f inancial posit ion 2013A 2014E 2015E 2016F 2013A 2014E 2015F 2016F
Assets N'Mn $'Mn
Fixed Assets 23,225 24,831 28,187 29,198 144 136 142 140
Other Assets 2,128 2,334 2,334 2,334 13 13 12 11
Inventories 6,988 8,615 6,877 7,109 43 47 35 34
Trade Debtors 8,229 8,622 8,597 8,060 51 47 43 39
Bank and Cash Balances 3,184 1,335 2,500 2,500 20 7 13 12
Total Assets 43,754 45,736 48,573 49,278 272 250 245 237
Liabilities Trade Creditors 21,092 15,111 20,141 20,818 131 83 102 100
Taxation 1,360 213 239 568 8 1 1 3
Short term loan 5,598 16,014 13,307 12,541 35 88 67 60
Other current l iabil ities 108 33 33 33 1 0 0 0
Long term loans 782 1,277 763 763 5 7 4 4
Retirement Benefit 2,707 2,757 3,223 3,610 17 15 16 17
Deferred taxation 2,466 2,853 2,853 2,853 15 16 14 14
Total L iabil it ies 34,114 38,257 41,073 41,700 212 209 207 200
Capital and Reserves Share capital 1,892 1,892 1,892 1,892 12 10 10 9
Share Premium 46 46 46 46 0 0 0 0
Retained Earnings 7,702 5,541 5,562 5,641 48 30 28 27
Shareholders' funds 9,640 7,479 7,500 7,578 60 41 38 36 Total l iabil ities and equity 43,754 45,736 48,573 49,278 272 250 245 237
Key Ratios 2013A 2014E 2015E 2016F 2013A 2014E 2015F 2016F
Profitability Return on Average Equity 48.3% 28.2% 5.5% 20.9% 48.3% 28.2% 5.5% 20.9%
Return on Average Assets 11.0% 5.3% 0.9% 3.2% 11.0% 5.3% 0.9% 3.2%
EBITDA Margin 16.0% 8.3% 9.5% 12.0% 16.0% 8.3% 9.5% 12.0%
EBIT Margin 13.1% 8.3% 5.7% 7.7% 13.1% 8.3% 5.7% 7.7%
Pretax Profit Margin 11.5% 5.2% 1.1% 3.9% 11.5% 5.2% 1.1% 3.9%
Net Prof it Margin 8.0% 4.3% 0.7% 2.7% 8.0% 4.3% 0.7% 2.7%
Valuation Multiples P/E (x) 34.0 67.8 394.5 104.0 34.0 67.8 394.5 104.0
P/B (x) 17.0 21.9 21.8 21.6 17.0 21.9 21.8 21.6
Dividend Yield (%) 3.2% 0.2% 0.2% 0.9% 3.2% 0.2% 0.2% 0.9%
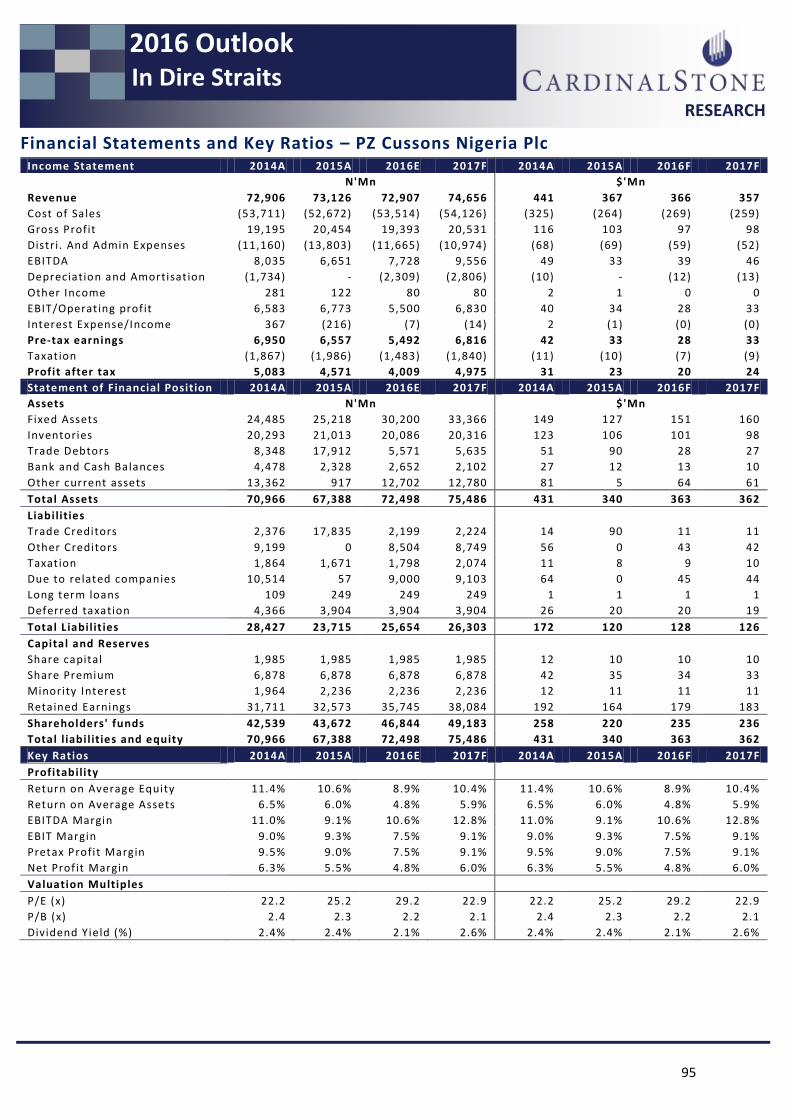
95
RESEARCH
In Dire Straits
2016 Outlook
Financial Statements and Key Ratios – PZ Cussons Nigeria Plc Income Statement 2014A 2015A 2016E 2017F 2014A 2015A 2016F 2017F
N'Mn $'Mn
Revenue 72,906 73,126 72,907 74,656 441 367 366 357
Cost of Sales (53,711) (52,672) (53,514) (54,126) (325) (264) (269) (259)
Gross Profit 19,195 20,454 19,393 20,531 116 103 97 98
Distr i. And Admin Expenses (11,160) (13,803) (11,665) (10,974) (68) (69) (59) (52)
EBITDA 8,035 6,651 7,728 9,556 49 33 39 46
Depreciation and Amortisat ion (1,734) - (2,309) (2,806) (10) - (12) (13)
Other Income 281 122 80 80 2 1 0 0
EBIT/Operating prof it 6,583 6,773 5,500 6,830 40 34 28 33
Interest Expense/Income 367 (216) (7) (14) 2 (1) (0) (0)
Pre-tax earnings 6,950 6,557 5,492 6,816 42 33 28 33
Taxation (1,867) (1,986) (1,483) (1,840) (11) (10) (7) (9)
Profit after tax 5,083 4,571 4,009 4,975 31 23 20 24
Statement of Financial Position 2014A 2015A 2016E 2017F 2014A 2015A 2016F 2017F
Assets N'Mn $'Mn
Fixed Assets 24,485 25,218 30,200 33,366 149 127 151 160
Inventories 20,293 21,013 20,086 20,316 123 106 101 98
Trade Debtors 8,348 17,912 5,571 5,635 51 90 28 27
Bank and Cash Balances 4,478 2,328 2,652 2,102 27 12 13 10
Other current assets 13,362 917 12,702 12,780 81 5 64 61
Total Assets 70,966 67,388 72,498 75,486 431 340 363 362
Liabilities Trade Creditors 2,376 17,835 2,199 2,224 14 90 11 11
Other Creditors 9,199 0 8,504 8,749 56 0 43 42
Taxation 1,864 1,671 1,798 2,074 11 8 9 10
Due to related companies 10,514 57 9,000 9,103 64 0 45 44
Long term loans 109 249 249 249 1 1 1 1
Deferred taxation 4,366 3,904 3,904 3,904 26 20 20 19
Total L iabil it ies 28,427 23,715 25,654 26,303 172 120 128 126
Capital and Reserves Share capital 1,985 1,985 1,985 1,985 12 10 10 10
Share Premium 6,878 6,878 6,878 6,878 42 35 34 33
Minority Interest 1,964 2,236 2,236 2,236 12 11 11 11
Retained Earnings 31,711 32,573 35,745 38,084 192 164 179 183
Shareholders' funds 42,539 43,672 46,844 49,183 258 220 235 236
Total l iabil ities and equity 70,966 67,388 72,498 75,486 431 340 363 362
Key Ratios 2014A 2015A 2016E 2017F 2014A 2015A 2016F 2017F
Profitability Return on Average Equity 11.4% 10.6% 8.9% 10.4% 11.4% 10.6% 8.9% 10.4%
Return on Average Assets 6.5% 6.0% 4.8% 5.9% 6.5% 6.0% 4.8% 5.9%
EBITDA Margin 11.0% 9.1% 10.6% 12.8% 11.0% 9.1% 10.6% 12.8%
EBIT Margin 9.0% 9.3% 7.5% 9.1% 9.0% 9.3% 7.5% 9.1%
Pretax Profit Margin 9.5% 9.0% 7.5% 9.1% 9.5% 9.0% 7.5% 9.1%
Net Prof it Margin 6.3% 5.5% 4.8% 6.0% 6.3% 5.5% 4.8% 6.0%
Valuation Multiples P/E (x) 22.2 25.2 29.2 22.9 22.2 25.2 29.2 22.9
P/B (x) 2.4 2.3 2.2 2.1 2.4 2.3 2.2 2.1
Dividend Yield (%) 2.4% 2.4% 2.1% 2.6% 2.4% 2.4% 2.1% 2.6%

96
RESEARCH
In Dire Straits
2016 Outlook
Financial Statements and Key Ratios – Nestle Nigeria Plc Income Statement 2013A 2014A 2015E 2016F 2013A 2015E 2016F 2016F
N'Mn $'Mn
Revenue 133,084 143,329 153,362 165,631 835 869 770 792
Cost of Sales (76,298) (82,099) (84,349) (94,741) (479) (498) (423) (453)
Gross Profit 56,786 61,230 69,013 70,890 356 371 346 339
Distr i. And Admin Expenses (24,256) (32,030) (32,666) (32,629) (152) (194) (164) (156)
EBITDA 32,530 34,996 36,347 38,261 204 212 182 183
Investment Income - 552 - - - 3 - -
Depreciation (4,697) - (5,158) (5,868) (29) - (26) (28)
EBIT/Operating prof it 28,194 35,548 31,189 32,393 177 215 157 155
Interest Expense/Income (2,147) (5,306) (2,801) (1,672) (13) (32) (14) (8)
Pre-tax earnings 26,048 24,446 28,388 30,720 164 148 142 147
Taxation (3,789) (2,210) (4,434) (4,799) (24) (13) (22) (23)
Profit after tax 22,258 22,236 23,954 25,922 140 135 120 124 Statement of f inancial posit ion 2013A 2014A 2015E 2016F 2013A 2015E 2016F 2016F
Assets N'Mn $'Mn
Fixed Assets 65,878 67,515 69,533 71,517 409 369 350 343
Inventories 9,854 10,956 10,630 11,457 61 60 54 55
Trade Debtors 17,885 22,331 22,689 22,689 111 122 114 109
Bank and Cash Balances 13,717 3,705 14,291 13,239 85 20 72 64
Other current assets 874 1,556 1,530 1,845 5 9 8 9
Total Assets 108,208 106,062 118,673 120,747 671 580 598 580
Liabilities Trade Creditors 29,066 26,657 27,500 31,407 180 146 139 151
Due to Group Companies 0 0 2,884 3,240 0 0 15 16
Taxation 2,804 3,479 4,273 4,899 17 19 22 24
Short term loan 948 13,968 11,968 9,968 6 76 60 48
Other current l iabil ities 416 535 2,709 3,204 3 3 14 15
Long term loans 26,471 18,386 16,386 4,386 164 101 83 21
Retirement Benefit s 1,822 1,828 2,162 2,484 11 10 11 12
Deferred taxation 6,086 5,271 5,271 5,271 38 29 27 25
Total L iabil it ies 67,613 70,122 73,152 64,858 420 384 369 311
Capital and Reserves Share capital 396 396 396 396 2 2 2 2
Share Premium 32 32 32 32 0 0 0 0
Retained Earnings 40,117 35,462 45,043 55,412 249 194 227 266
Other component of equity 50 50 50 50 0 0 0 0
Shareholders' funds 40,595 35,940 45,521 55,890 252 197 229 268
Total l iabil ities and equity 108,208 106,062 118,673 120,747 671 580 598 580
Key Ratios 2013A 2014A 2015E 2016F 2013A 2015E 2016F 2016F
Profitability
Return on Average Equity 54.7% 58.1% 58.8% 36.7% 54.7% 58.1% 58.8% 36.7%
Return on Average Assets 20.6% 21.0% 20.2% 21.5% 20.6% 21.0% 20.2% 21.5%
EBITDA Margin 24.4% 24.4% 23.7% 23.1% 24.4% 24.4% 23.7% 23.1%
EBIT Margin 21.2% 24.8% 20.3% 19.6% 21.2% 24.8% 20.3% 19.6%
Pretax Profit Margin 19.6% 17.1% 18.5% 18.5% 19.6% 17.1% 18.5% 18.5%
Net Prof it Margin 16.7% 15.5% 15.6% 15.7% 16.7% 15.5% 15.6% 15.7%
Valuation Multiples
P/E (x) 30.6 30.7 28.5 26.3 30.6 30.7 28.5 26.3
P/B (x) 16.8 19.0 15.0 12.2 16.8 19.0 15.0 12.2
Dividend Yield (%) 3.0% 3.2% 2.1% 2.3% 3.0% 3.2% 2.1% 2.3%

97
RESEARCH
In Dire Straits
2016 Outlook
Financial Statements and Key Ratios – Dangote Sugar Refinery Plc Income Statement 2013A 2014E 2015E 2016F 2013A 2014E 2015F 2016F N'Mn $'Mn Revenue 103,154 94,855 98,527 105,939 648 575 586 601 Cost of Sales (77,524) (76,227) (72,334) (76,275) (487) (462) (431) (432) Gross Profit 25,630 18,628 26,194 29,664 161 113 156 168 Admin Expenses (12,146) (8,600) (6,995) (7,522) (76) (52) (42) (43) EBITDA 13,484 10,028 19,198 22,142 85 61 114 126 Depreciation (1,032) 0 (3,474) (3,818) (6) 0 (21) (22) Other Income 3,880 5,352 500 500 24 32 3 3 EBIT/Operating prof it 16,332 15,380 16,224 18,824 103 93 97 107 Interest Expense/Income (67) (106) 584 1,069 (0) (1) 3 6 Pre-tax earnings 16,265 15,273 16,809 19,894 102 93 100 113 Taxation (5,419) (3,637) (5,043) (5,968) (34) (22) (30) (34) Profit after tax 10,846 11,636 11,766 13,926 68 71 70 79 Statement of Financial Position 2013A 2014E 2015E 2016F 2013A 2014E 2015F 2016F Assets N'Mn $'Mn Fixed assets 41,847 50,473 50,644 50,746 260 276 255 244 Deferred tax assets 555 2,489 2,489 2,489 3 14 13 12 Stocks 11,827 15,099 14,328 15,108 73 83 72 73 Other Assets 1,202 4,526 4,526 4,526 7 25 23 22 Trade debtors 19,274 14,013 14,555 15,650 120 77 73 75 Bank and cash balances 8,455 6,202 8,392 13,758 52 34 42 66
Total Assets 83,160 92,801 94,934 102,278 516 508 478 491
Liabilities Bank overdrafts 536 2,385 848 - 3 13 4 0
Trade creditors 24,406 25,227 23,938 25,243 151 138 121 121 Other creditors - 1,700 1,613 1,701 0 9 8 8 Taxation 4,757 5,936 3,623 3,165 30 32 18 15 Employees' gratuity 1,356 1,528 1,920 2,311 8 8 10 11 Long term debt 385 - - - 2 0 0 0 Deferred taxation 4,742 4,611 4,611 4,611 29 25 23 22
Total L iabil it ies 36,182 41,388 36,554 37,032 225 226 184 178
Capital and Reserves
Share Capital 6,000 6,000 6,000 6,000 37 33 30 29 Share Premium 6,321 6,321 6,321 6,321 39 35 32 30 Revenue reserve 34,657 39,093 46,059 52,925 215 214 232 254
Shareholders' funds 46,978 51,414 58,380 65,246 292 281 294 313
Total l iabil ities and equity 83,160 92,801 94,934 102,278 516 508 478 491
Key Ratios 2013A 2014E 2015E 2016F 2013A 2014E 2015F 2016F Profitability
Return on Average Equity 23.2% 23.6% 21.4% 22.5% 23.2% 23.6% 21.4% 22.5% Return on Average Assets 13.0% 12.5% 12.4% 13.6% 13.0% 12.5% 12.4% 13.6% EBITDA Margin 13.1% 10.6% 19.5% 20.9% 13.1% 10.6% 19.5% 20.9% EBIT Margin 15.8% 16.2% 16.5% 17.8% 15.8% 16.2% 16.5% 17.8% Pretax Profit Margin 15.8% 16.1% 17.1% 18.8% 15.8% 16.1% 17.1% 18.8% Net Prof it Margin 10.5% 12.3% 11.9% 13.1% 10.5% 12.3% 11.9% 13.1%
Valuation Multiples P/E (x) 12.8 6.2 6.1 5.2 12.8 6.2 6.1 5.2
P/B (x) 3.0 1.4 1.2 1.1 3.0 1.4 1.2 1.1 Dividend Yield (%) 6.6% 10.0% 10.8% 11.6% 6.6% 10.0% 10.8% 11.6%
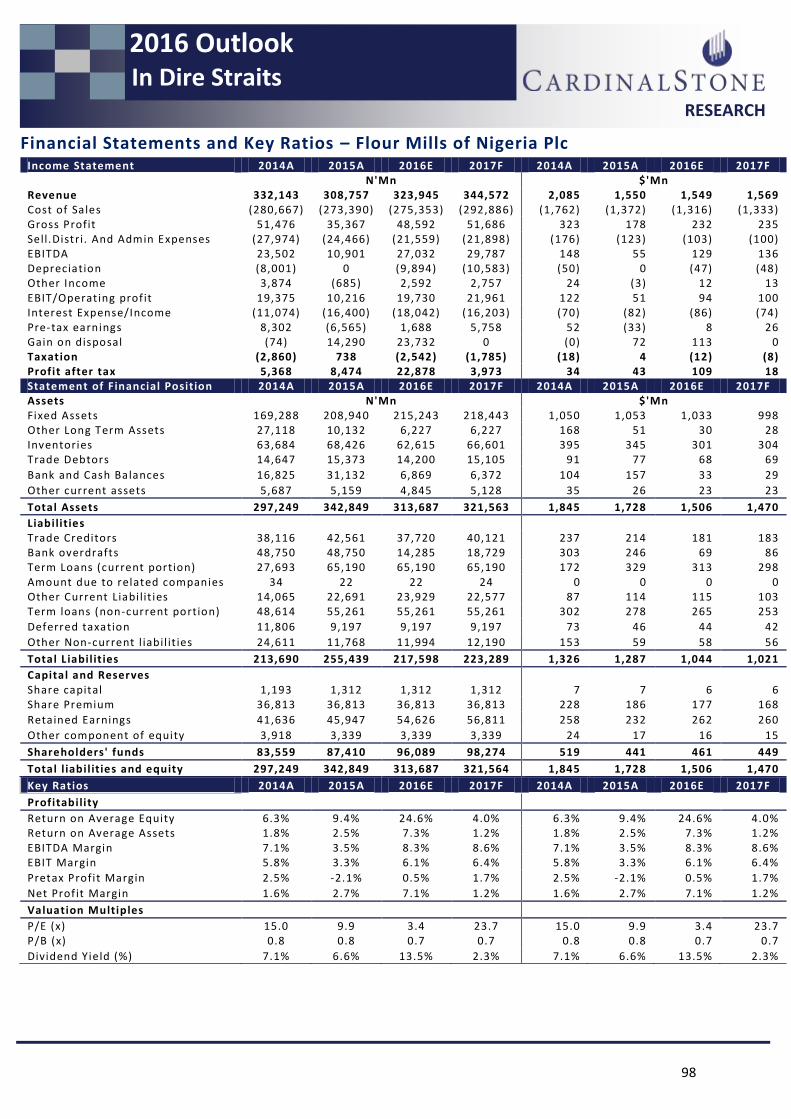
98
RESEARCH
In Dire Straits
2016 Outlook
Financial Statements and Key Ratios – Flour Mills of Nigeria Plc Income Statement 2014A 2015A 2016E 2017F 2014A 2015A 2016E 2017F
N'Mn $'Mn
Revenue 332,143 308,757 323,945 344,572 2,085 1,550 1,549 1,569 Cost of Sales (280,667) (273,390) (275,353) (292,886) (1,762) (1,372) (1,316) (1,333) Gross Profit 51,476 35,367 48,592 51,686 323 178 232 235 Sell.Distri. And Admin Expenses (27,974) (24,466) (21,559) (21,898) (176) (123) (103) (100) EBITDA 23,502 10,901 27,032 29,787 148 55 129 136 Depreciation (8,001) 0 (9,894) (10,583) (50) 0 (47) (48) Other Income 3,874 (685) 2,592 2,757 24 (3) 12 13 EBIT/Operating prof it 19,375 10,216 19,730 21,961 122 51 94 100 Interest Expense/Income (11,074) (16,400) (18,042) (16,203) (70) (82) (86) (74) Pre-tax earnings 8,302 (6,565) 1,688 5,758 52 (33) 8 26 Gain on disposal (74) 14,290 23,732 0 (0) 72 113 0 Taxation (2,860) 738 (2,542) (1,785) (18) 4 (12) (8) Profit after tax 5,368 8,474 22,878 3,973 34 43 109 18 Statement of Financial Position 2014A 2015A 2016E 2017F 2014A 2015A 2016E 2017F Assets N'Mn $'Mn Fixed Assets 169,288 208,940 215,243 218,443 1,050 1,053 1,033 998 Other Long Term Assets 27,118 10,132 6,227 6,227 168 51 30 28 Inventories 63,684 68,426 62,615 66,601 395 345 301 304 Trade Debtors 14,647 15,373 14,200 15,105 91 77 68 69
Bank and Cash Balances 16,825 31,132 6,869 6,372 104 157 33 29
Other current assets 5,687 5,159 4,845 5,128 35 26 23 23
Total Assets 297,249 342,849 313,687 321,563 1,845 1,728 1,506 1,470
Liabilities Trade Creditors 38,116 42,561 37,720 40,121 237 214 181 183 Bank overdrafts 48,750 48,750 14,285 18,729 303 246 69 86 Term Loans (current portion) 27,693 65,190 65,190 65,190 172 329 313 298 Amount due to related companies 34 22 22 24 0 0 0 0 Other Current Liabi lit ies 14,065 22,691 23,929 22,577 87 114 115 103 Term loans (non-current portion) 48,614 55,261 55,261 55,261 302 278 265 253
Deferred taxation 11,806 9,197 9,197 9,197 73 46 44 42
Other Non-current l iabil it ies 24,611 11,768 11,994 12,190 153 59 58 56
Total L iabil it ies 213,690 255,439 217,598 223,289 1,326 1,287 1,044 1,021
Capital and Reserves Share capital 1,193 1,312 1,312 1,312 7 7 6 6 Share Premium 36,813 36,813 36,813 36,813 228 186 177 168
Retained Earnings 41,636 45,947 54,626 56,811 258 232 262 260
Other component of equity 3,918 3,339 3,339 3,339 24 17 16 15
Shareholders' funds 83,559 87,410 96,089 98,274 519 441 461 449
Total l iabil ities and equity 297,249 342,849 313,687 321,564 1,845 1,728 1,506 1,470
Key Ratios 2014A 2015A 2016E 2017F 2014A 2015A 2016E 2017F
Profitability
Return on Average Equity 6.3% 9.4% 24.6% 4.0% 6.3% 9.4% 24.6% 4.0% Return on Average Assets 1.8% 2.5% 7.3% 1.2% 1.8% 2.5% 7.3% 1.2% EBITDA Margin 7.1% 3.5% 8.3% 8.6% 7.1% 3.5% 8.3% 8.6% EBIT Margin 5.8% 3.3% 6.1% 6.4% 5.8% 3.3% 6.1% 6.4%
Pretax Profit Margin 2.5% -2.1% 0.5% 1.7% 2.5% -2.1% 0.5% 1.7%
Net Prof it Margin 1.6% 2.7% 7.1% 1.2% 1.6% 2.7% 7.1% 1.2%
Valuation Multiples
P/E (x) 15.0 9.9 3.4 23.7 15.0 9.9 3.4 23.7 P/B (x) 0.8 0.8 0.7 0.7 0.8 0.8 0.7 0.7
Dividend Yield (%) 7.1% 6.6% 13.5% 2.3% 7.1% 6.6% 13.5% 2.3%

99
RESEARCH
In Dire Straits
2016 Outlook
Financial Statements and Key Ratios – UAC OF Nigeria Plc Income Statement 2013A 2014E 2015E 2016F 2013A 2014E 2015F 2016F N'Mn $'Mn Revenue 78,714 85,654 77,674 81,594 494 519 390 390 Cost of Sales (59,878) (66,472) (59,032) (62,011) (376) (403) (296) (296) Gross Profit 18,836 19,183 18,642 19,583 118 116 94 94 Distr i. And Admin Expenses (6,276) (10,180) (9,405) (6,854) (39) (62) (47) (33) EBITDA 12,560 9,003 9,236 12,729 79 55 46 61 Depreciation and Amortisat ion (2,962) 0 (3,997) (4,603) (19) 0 (20) (22) EBIT/Operating prof it 9,598 9,003 5,240 8,125 60 55 26 39 Other Income 5,669 3,391 2,500 2,000 36 21 13 10 Interest Expense/Income (1,257) (1,276) (2,427) (2,034) (8) (8) (12) (10) Pre-tax earnings 14,010 14,097 5,543 11,063 88 85 28 53 Taxation (4,062) (4,370) (1,491) (2,976) (25) (26) (7) (14) Profit after tax 9,949 9,727 4,052 8,087 62 59 20 39 Statement of f inancial position 2013A 2014E 2015E 2016F 2013A 2014E 2015F 2016F Assets N'Mn $'Mn Fixed Assets 35,764 36,613 38,830 40,346 222 200 196 194 Investment Properties 18,402 20,891 20,891 20,891 114 114 105 100 Long term investments 17,991 19,101 19,101 19,101 112 104 96 92 Inventories 10,012 27,767 2,171 2,280 62 152 11 11 Trade Debtors 13,796 15,950 13,407 14,083 86 87 68 68 Bank and Cash Balances 8,894 7,957 6,603 6,471 55 44 33 31 Other assets 20,155 2,057 13,980 14,099 125 11 70 68
Total Assets 125,015 130,361 115,007 117,297 776 713 580 563
Liabilities Trade Creditors 17,254 14,789 2,843 2,986 107 81 14 14 Other Creditors 2,133 0 2,623 1,938 13 0 13 9 Taxation 2,774 4,478 3,386 3,608 17 24 17 17 Short term loan 20,286 22,937 18,558 16,558 126 125 94 79 Long term loans 5,910 7,951 6,737 5,737 37 43 34 28 Other Liabil ities 310 196 196 196 2 1 1 1 Deferred taxation 5,029 5,559 5,559 5,559 31 30 28 27
Total L iabil it ies 53,696 55,909 39,901 36,582 333 306 201 176
Capital and Reserves Share capital 960 960 960 960 6 5 5 5 Share Premium 3,935 3,935 3,935 3,935 24 22 20 19 Retained Earnings 38,013 40,042 39,658 43,193 236 219 200 207 Other component of equity 29 29 29 29 0 0 0 0 Non Control ling Interest 28,384 29,486 30,525 32,598 176 161 154 156
Shareholders' funds 71,320 74,451 75,106 80,715 443 407 379 387
Total l iabil ities and equity 125,015 130,361 115,007 117,297 776 713 580 563
Key Ratios 2013A 2014E 2015E 2016F 2013A 2014E 2015F 2016F
Profitability
Return on Average Equity 15.1% 13.3% 5.4% 10.4% 15.1% 13.3% 5.4% 10.4% Return on Average Assets 8.0% 7.5% 3.5% 6.9% 8.0% 7.5% 3.5% 6.9% EBITDA Margin 16.0% 10.5% 11.9% 15.6% 16.0% 10.5% 11.9% 15.6% EBIT Margin 12.2% 10.5% 6.7% 10.0% 12.2% 10.5% 6.7% 10.0% Pretax Profit Margin 17.8% 16.5% 7.1% 13.6% 17.8% 16.5% 7.1% 13.6% Net Prof it Margin 12.6% 11.4% 5.2% 9.9% 12.6% 11.4% 5.2% 9.9%
Valuation Multiples
P/E (x) 7.0 7.2 17.0 8.5 7.0 7.2 17.0 8.5 P/B (x) 0.6 0.5 0.5 0.5 0.6 0.5 0.5 0.5
Dividend Yield (%) 7.2% 6.9% 2.9% 5.8% 7.2% 6.9% 2.9% 5.8%

100
RESEARCH
In Dire Straits
2016 Outlook
Financial Statements and Key Ratios – Mobil Nigeria Plc Income Statement 2013A 2014A 2015E 2016F 2013A 2014A 2015E 2016F (N'Mn) (US$'Mn) Revenue 78,744 79,584 59,688 64,463 494 482 300 324 Cost of Sales (68,804) (68,846) (50,138) (54,149) (432) (417) (252) (272) Gross Profit 9,940 10,737 9,550 10,314 62 65 48 52 Distr i. And Admin Expenses (7,373) (7,490) (7,163) (7,736) (46) (45) (36) (39) EBITDA 2,568 3,248 2,388 2,579 16 20 12 13 Other Income 2,657 2,374 4,200 4,410 17 14 21 22 Exceptional Item - 2,852 - - - 17 - - EBIT/Operating prof it 5,224 8,474 6,588 6,989 33 51 33 35 Interest Expense/Income (101) (27) (123) (54) (1) (0) (1) (0) Pre-tax earnings 5,123 8,446 6,465 6,934 32 51 32 35 Taxation (1,642) (2,053) (2,069) (2,219) (10) (12) (10) (11) Profit after tax 3,481 6,393 4,396 4,715 22 39 22 24 Statement of Financial Position 2013A 2014A 2015E 2016F 2013A 2014A 2015E 2016F Assets Inventories 4,510 4,364 3,107 3,356 28 26 16 17 Trade and Other Receivables 5,152 7,381 5,536 5,979 32 45 28 30 Prepayments 159 143 107 116 1 1 1 1 Cash and Bank 962 373 50 50 6 2 0 0 Non-Current Assets Held For Sale 128 - - - 1 - - - Investment Property 20,695 26,955 29,340 30,637 128 164 148 153 Property, Plant & Equipment 7,111 7,275 7,360 7,441 44 44 37 37 Lease Assets 1 12 12 12 0 0 0 0 Intangible Assets 135 122 122 122 1 1 1 1 Deferred Tax 351 1,049 1,049 1,049 2 6 5 5
Prepayments 1,525 1,553 1,553 1,553 9 9 8 8
Total Assets 40,729 49,227 48,237 50,314 241 283 230 239
Liabilities Borrowing - 1,709 1,080 84 - 10 5 0
Current Tax Payable 1,941 2,349 2,416 2,535 12 14 12 13 Finance Lease Obligation - 6 6 6 - 0 0 0 Trade and Other Payables 7,914 9,877 7,031 7,595 49 60 35 38 Deferred Income 4,526 2,402 2,402 2,402 28 15 12 12 Borrowing 1,086 - - - 7 - - - Retirement Benefit Obligations 1,253 1,854 1,677 1,517 8 11 8 8
Deferred Income 14,471 17,482 17,482 17,482 90 106 88 88
Total L iabil it ies 31,191 35,677 32,094 31,620 194 216 162 158
Capital and Reserves Equity 195 195 195 195 1 1 1 1
Reserves 9,343 13,355 15,948 18,500 58 81 80 93
Shareholders' funds 9,538 13,549 16,143 18,694 59 82 81 94
Total l iabil ities and equity 40,729 49,227 48,237 50,314 253 299 243 252
Key Ratios 2013A 2014A 2015E 2016F 2013A 2014A 2015E 2016F
Profitabi lity
Return on Average Equity 43.0% 55.4% 29.6% 27.1% 43.0% 55.4% 29.6% 27.1% Return on Average Assets 9.0% 14.2% 9.0% 9.6% 9.0% 14.2% 9.0% 9.6% EBITDA Margin 3.3% 4.1% 4.0% 4.0% 3.3% 4.1% 4.0% 4.0% EBIT Margin 6.6% 10.6% 11.0% 10.8% 6.6% 10.6% 11.0% 10.8% Pretax Profit Margin 6.5% 10.6% 10.8% 10.8% 6.5% 10.6% 10.8% 10.8%
Net Prof it Margin 4.4% 8.0% 7.4% 7.3% 4.4% 8.0% 7.4% 7.3%
Valuation Multiples
P/E (x) 13.8 7.5 10.9 10.2 13.8 7.5 10.9 10.2 P/B (x) 5.0 3.5 3.0 2.6 5.0 3.5 3.0 2.6
Dividend Yield (%) 3.8% 3.8% 3.1% 3.8% 3.8% 3.8% 3.1% 3.8%

101
RESEARCH
In Dire Straits
2016 Outlook
Financial Statements and Key Ratios – Total Nigeria Plc Income Statement 2013A 2014A 2015E 2016F 2013A 2014A 2015E 2016F
(N'Mn) (US$'Mn)
Revenue 238,163 240,619 209,338 226,085 1,495 1,511 1,314 1,419
Cost of Sales (209,462) (212,714) (185,055) (200,312) (1,315) (1,335) (1,162) (1,258)
Gross Profit 28,702 27,904 24,283 25,774 180 175 152 162
Distr i. And Admin Expenses (21,050) (21,240) (20,934) (20,574) (132) (133) (131) (129)
EBITDA 7,652 6,665 3,349 5,200 48 42 21 33
Other Income 1,217 1,172 1,160 1,172 8 7 7 7
EBIT/Operating prof it 8,869 7,837 4,510 6,372 56 49 28 40
Interest Expense/Income (749) (2,278) (158) (514) (5) (14) (1) (3)
Pre-tax earnings 8,120 5,558 4,352 5,857 51 35 27 37
Taxation (2,786) (1,135) (1,488) (2,003) (17) (7) (9) (13)
Profit after tax 5,334 4,424 2,864 3,854 33 28 18 24
Statement of Financial Position 2013A 2014A 2015E 2016F 2013A 2014A 2015E 2016F
Assets Fixed assets & Leased assets 20,852 21,922 22,414 22,923 129 133 113 115
Intangible Assets 172 172 172 172 1 1 1 1
Long -term prepayments 2,290 3,085 3,085 3,085 14 19 16 15
Inventory 14,641 19,827 15,078 16,320 91 120 76 82
Trade and other receivables 31,119 35,380 31,544 34,068 193 215 159 171
Prepayments and other debtors 919 659 574 619 6 4 3 3
Cash and Bank balances 9,445 14,468 5,319 4,114 59 88 27 21
Total Assets 79,437 95,512 78,187 81,302 493 579 394 407
Liabilities Trade and other payables 43,536 61,773 49,256 53,312 270 375 248 267
Current Tax L iabil it ies 3,016 1,104 1,073 1,867 19 7 5 9
Short-term Borrowings 16,608 15,683 11,683 8,683 103 95 59 43
Deferred Taxation 3,003 2,768 2,861 2,988 19 17 14 15
Long -term Borrowings - - - - - - - -
Total L iabil it ies 66,163 81,328 64,873 66,850 411 493 327 335
Capital and Reserves Share capital 170 170 170 170 1 1 1 1
Revenue reserve 13,071 13,760 12,889 14,027 81 83 65 70
Shareholders' funds 13,241 13,930 13,059 14,197 82 85 66 71
Total l iabil ities and equity 79,404 95,258 77,932 81,047 493 578 393 406
Key Ratios 2013A 2014A 2015E 2016F 2013A 2014A 2015E 2016F
Profitabi l ity Return on Average Equity 43.5% 32.6% 21.2% 28.3% 43.5% 30.1% 22.2% 23.5%
Return on Average Assets 6.9% 5.1% 3.3% 4.8% 6.9% 8.2% 5.6% 6.6%
EBITDA Margin 3.2% 2.8% 1.6% 2.3% 3.2% 2.8% 1.6% 2.3%
EBIT Margin 3.7% 3.3% 2.2% 2.8% 3.7% 3.3% 2.2% 2.8%
Pretax Profit Margin 3.4% 2.3% 2.1% 2.6% 3.4% 2.3% 2.1% 2.6%
Net Prof it Margin 2.2% 1.8% 1.4% 1.7% 2.2% 1.8% 1.4% 1.7%
Valuation Multiples
P/E (x) 9.4 11.3 17.4 12.9 9.4 11.3 17.4 12.9
P/B (x) 3.8 3.6 3.8 3.5 3.8 3.6 3.8 3.5
Dividend Yield (%) 7.5% 7.5% 5.4% 3.4% 7.5% 7.5% 5.4% 3.4%

102
RESEARCH
In Dire Straits
2016 Outlook
Financial Statements and Key Ratios – Oando Plc Income Statement 2013A 2014A 2015E 2016F 2013A 2014A 2015E 2016F N’Mn US$’Mn Revenue 449,873 424,678 122,732 165,811 2,824 2,574 731 987 Cost of Sales (380,605) (355,496) (70,087) (75,205) (2,389) (2,155) (417) (448) Gross Prof i t 69,269 69,182 52,644 90,605 435 419 313 539 Distr i . And Admin Expenses (47,875) (277,634) (87,753) (101,974) (301) (1,683) (522) (607) EBITDA 21,394 (208,452) (35,109) (11,368) 134 (1,264) (209) (68) Depreciation and Amort isation (9,980) 0 (15,825) (15,991) (63) 0 (94) (95) Other Income 5,135 68,785 41,271 42,509 32 417 246 253 EBIT/Operat ing prof it 16,550 (139,667) (9,663) 15,151 104 (847) (58) 90 Interest Expense/Income (15,833) (31,439) (45,910) (28,868) (99) (191) (273) (172) Pre-tax earnings 713 (171,323) (55,572) (13,718) 4 (1,039) (331) (82) Taxation (5,389) (7,959) 4,000 6,859 (34) (48) 24 41 Prof it f rom continued operat ions (4,676) (179,282) (51,572) (6,859) (29) (1,087) (307) (41) Prof it f rom discontinued operations 6,073 (4,611) 0 0 38 (28) 0 0 Prof it for the year 1,397 (183,893) (51,572) (6,859) 9 (1,115) (307) (41) Statement of F inancia l Posit ion 2013A 2014A 2015E 2016F 2013A 2014A 2015E 2016F Assets Property, p lant and equipment 172,210 314,042 300,672 287,998 1,069 1,718 1,704 1,633 Intang ible assets 82,233 245,705 245,705 245,705 510 1,344 1,393 1,393 Investments 2,880 3,409 3,409 3,409 18 19 19 19 Deferred income tax assets 4,995 12,328 12,328 12,328 31 67 70 70 Other F inancial Assets 9,504 101,204 101,204 101,204 59 554 574 574 Deposit for acquis it ion of a business 69,840 0 0 0 433 0 0 0 Non-current receivables 15,413 3,427 3,427 3,427 96 19 19 19 Restr icted cash 3,798 14,194 14,194 14,194 24 78 80 80 Inventories 19,446 26,971 5,317 5,706 121 148 30 32 Trade and other receivables 143,739 140,652 40,648 54,916 892 769 230 311 Cash and cash equivalents 23,887 27,440 -15,316 -58,053 148 150 (87) (329) Assets class if ied as held for sa le 37,483 0 0 0 233 0 0 0
Total Assets 585,429 889,373 711,590 670,834 3,633 4,865 4,034 3,803
Liabi li t ies Trade and other payables 124,059 156,628 30,880 33,135 770 857 175 188 Der ivative f inancial l iab il it ies 1,527 3,609 3,609 3,609 9 20 20 20 Current income tax l iabi l i t ies 5,644 44,963 6,559 -115 35 246 37 (1) Div idend payable 645 1,651 1,651 1,651 4 9 9 9 Borrowings 255,285 473,342 453,342 423,342 1,584 2,589 2,570 2,400 Liab. c lassi f ied as held for sa le 14,230 0 0 0 88 0 0 0 Deferred income tax l iabi l i t ies 13,905 148,728 148,728 148,728 86 814 843 843 Provisions 5,091 11,923 11,923 11,923 32 65 68 68 Ret irement benef it obligation 2,468 2,903 3,365 3,900 15 16 19 22 Government Grant 207 119 119 119 1 1 1 1
Total L iabil it ies 423,061 843,866 660,176 626,292 2,625 4,616 3,742 3,550
Capita l and Reserves Share Capita l 3,411 4,542 6,017 6,017 21 25 34 34
Share Premium Account 98,425 131,554 175,622 175,622 611 720 996 996 Revaluat ion reserve 60,532 (90,590) (130,225) (137,097) 376 (496) (738) (777)
Shareholders' funds 162,368 45,507 51,414 44,542 1,008 249 291 253 Total l iabi li t ies and equity 585,429 889,373 711,590 670,834 3,633 4,865 4,034 3,803
Key Ratios 2013A 2014A 2015E 2016F 2013A 2014A 2015E 2016F
Prof itabi l i ty Return on Average Equity 0.9% N/M N/M N/M 0.9% N/M N/M N/M
Return on Average Assets 0.2% N/M N/M N/M 0.2% N/M N/M N/M EBITDA Marg in 4.8% -49.1% -28.6% -6.9% 4.8% -49.1% -28.6% -6.9% EBIT Marg in 3.7% -32.9% -7.9% 9.1% 3.7% -32.9% -7.9% 9.1% Pretax Prof it Marg in 0.2% -40.3% -45.3% -8.3% 0.2% -40.3% -45.3% -8.3% Net Profi t Margin 0.3% -43.3% -42.0% -4.1% 0.3% -43.3% -42.0% -4.1%
Valuation Mult iples P/E (x) 75.9 N/M N/M 23.9 75.9 N/M N/M 23.9
P/B (x ) 3.1 3.6 4.2 3.6 3.1 3.6 4.2 3.6 Div idend Y ie ld (%) 1.9% 0.0% 0.0% 0.0% 1.9% 0.0% 0.0% 0.0%
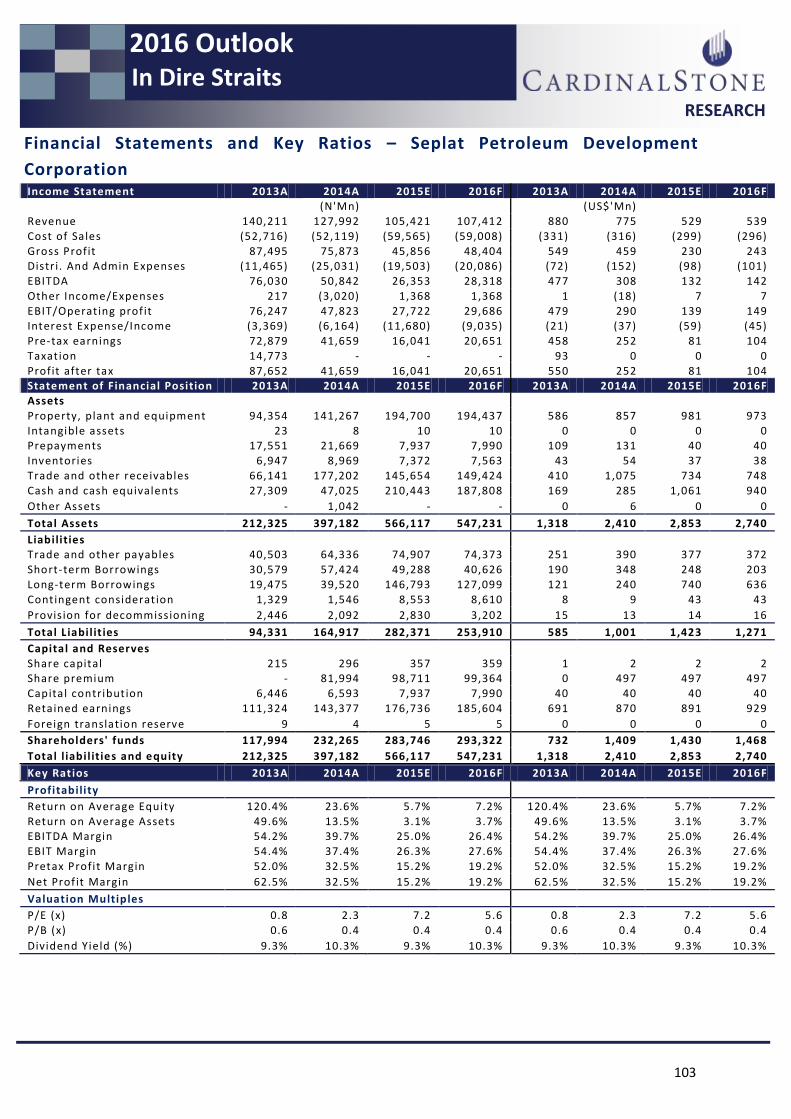
103
RESEARCH
In Dire Straits
2016 Outlook
Financial Statements and Key Ratios – Seplat Petroleum Development
Corporation Income Statement 2013A 2014A 2015E 2016F 2013A 2014A 2015E 2016F (N'Mn) (US$'Mn)
Revenue 140,211 127,992 105,421 107,412 880 775 529 539
Cost of Sales (52,716) (52,119) (59,565) (59,008) (331) (316) (299) (296)
Gross Profit 87,495 75,873 45,856 48,404 549 459 230 243 Distr i. And Admin Expenses (11,465) (25,031) (19,503) (20,086) (72) (152) (98) (101)
EBITDA 76,030 50,842 26,353 28,318 477 308 132 142
Other Income/Expenses 217 (3,020) 1,368 1,368 1 (18) 7 7
EBIT/Operating prof it 76,247 47,823 27,722 29,686 479 290 139 149 Interest Expense/Income (3,369) (6,164) (11,680) (9,035) (21) (37) (59) (45)
Pre-tax earnings 72,879 41,659 16,041 20,651 458 252 81 104
Taxation 14,773 - - - 93 0 0 0
Profit after tax 87,652 41,659 16,041 20,651 550 252 81 104 Statement of Financial Position 2013A 2014A 2015E 2016F 2013A 2014A 2015E 2016F
Assets
Property, plant and equipment 94,354 141,267 194,700 194,437 586 857 981 973
Intangible assets 23 8 10 10 0 0 0 0 Prepayments 17,551 21,669 7,937 7,990 109 131 40 40
Inventories 6,947 8,969 7,372 7,563 43 54 37 38
Trade and other receivables 66,141 177,202 145,654 149,424 410 1,075 734 748
Cash and cash equivalents 27,309 47,025 210,443 187,808 169 285 1,061 940
Other Assets - 1,042 - - 0 6 0 0
Total Assets 212,325 397,182 566,117 547,231 1,318 2,410 2,853 2,740
Liabilities Trade and other payables 40,503 64,336 74,907 74,373 251 390 377 372
Short-term Borrowings 30,579 57,424 49,288 40,626 190 348 248 203
Long-term Borrowings 19,475 39,520 146,793 127,099 121 240 740 636
Contingent consideration 1,329 1,546 8,553 8,610 8 9 43 43
Provision for decommissioning 2,446 2,092 2,830 3,202 15 13 14 16
Total L iabil it ies 94,331 164,917 282,371 253,910 585 1,001 1,423 1,271
Capital and Reserves Share capital 215 296 357 359 1 2 2 2
Share premium - 81,994 98,711 99,364 0 497 497 497
Capital contribution 6,446 6,593 7,937 7,990 40 40 40 40
Retained earnings 111,324 143,377 176,736 185,604 691 870 891 929
Foreign translation reserve 9 4 5 5 0 0 0 0
Shareholders' funds 117,994 232,265 283,746 293,322 732 1,409 1,430 1,468
Total l iabil ities and equity 212,325 397,182 566,117 547,231 1,318 2,410 2,853 2,740
Key Ratios 2013A 2014A 2015E 2016F 2013A 2014A 2015E 2016F
Profitability
Return on Average Equity 120.4% 23.6% 5.7% 7.2% 120.4% 23.6% 5.7% 7.2%
Return on Average Assets 49.6% 13.5% 3.1% 3.7% 49.6% 13.5% 3.1% 3.7% EBITDA Margin 54.2% 39.7% 25.0% 26.4% 54.2% 39.7% 25.0% 26.4%
EBIT Margin 54.4% 37.4% 26.3% 27.6% 54.4% 37.4% 26.3% 27.6%
Pretax Profit Margin 52.0% 32.5% 15.2% 19.2% 52.0% 32.5% 15.2% 19.2%
Net Prof it Margin 62.5% 32.5% 15.2% 19.2% 62.5% 32.5% 15.2% 19.2%
Valuation Multiples
P/E (x) 0.8 2.3 7.2 5.6 0.8 2.3 7.2 5.6
P/B (x) 0.6 0.4 0.4 0.4 0.6 0.4 0.4 0.4
Dividend Yield (%) 9.3% 10.3% 9.3% 10.3% 9.3% 10.3% 9.3% 10.3%

104
RESEARCH
In Dire Straits
2016 Outlook
Financial Statements and Key Ratios – Transnational Corporation of Nigeria Plc
Income Statement 2013A 2014A 2015E 2016F 2013A 2014A 2015E 2016F
N'Mn $'Mn
Revenue 18,800 41,338 39,271 41,235 118 251 197 197
Cost of sales (4,289) (9,186) (15,708) (16,494) (27) (56) (79) (79)
Gross Profit 14,510 32,152 23,563 24,741 91 195 118 118
Admin Expenses (7,869) (10,198) (10,996) (11,546) (49) (62) (55) (55)
Other Operating Income 5,090 (1,728) 2,000 1,000 32 (10) 10 5
EBITDA 11,732 20,226 14,567 14,195 74 123 73 68
Depreciation and Amortisat ion (1,507) (6,600) (4,746) (4,820) (9) (40) (24) (23)
EBIT 10,225 13,626 9,821 9,375 64 83 49 45
Net interest income/(expense) (1,218) (5,894) (6,199) (5,409) (8) (36) (31) (26)
Profit Before Tax 9,007 7,732 3,622 3,966 57 47 18 19
Taxation (2,074) (4,427) (1,123) (1,229) (13) (27) (6) (6)
Profit After Tax 6,932 3,304 2,499 2,737 44 20 13 13 Statement of f inancial posit ion 2013A 2014A 2015E 2016F 2013A 2014A 2015E 2016F
Assets N'Mn $'Mn
Fixed Assets 122,212 134,743 131,960 129,202 758 737 665 620
Inventories 8,181 3,462 3,462 3,462 51 19 17 17
Trade Debtors 1,431 1,682 3,228 3,389 9 9 16 16 Receivables Prepayments and Trade 8,446 27,938 27,974 27,113 52 153 141 130
Bank and cash balances 9,195 2,931 2,176 2,219 57 16 11 11
Total Assets 149,464 170,755 168,800 165,386 927 934 851 794
Liabilities Payables and Accrued Expenses 6,283 13,769 21,393 20,204 39 75 108 97
Income Tax Payable 3,922 5,985 2,918 2,105 24 33 15 10 Borrowings Fal ling Due Within the Year 3,657 10,639 20,639 18,586 23 58 104 89
Advance Deposit 1,875 1,875 1,875 1,875 12 10 9 9
Deferred Tax Liabi lity 7,599 11,594 11,594 11,594 47 63 58 56 Borrowings Fal ling After one Year 39,452 37,139 19,001 18,001 245 203 96 86
Total L iabil it ies 62,788 81,001 77,421 72,365 390 443 390 347
Capital and Reserves Share Capital 19,360 19,360 19,360 19,360 120 106 98 93
Share Premium 7,213 7,213 7,213 7,213 45 39 36 35
Revenue reserve 31,678 30,070 31,695 33,337 197 164 160 160
Treasury shares -26 -138 -138 -138 0 -1 -1 -1
Non-controll ing Interest 28,450 33,249 33,249 33,249 177 182 168 160
Shareholders' funds 86,676 89,755 91,379 93,021 538 491 461 446
Total l iabil ities and equity 149,464 170,755 168,800 165,386 927 934 851 794
Key Ratios 2013A 2014A 2015E 2016F 2013A 2014A 2015E 2016F
Profitability Return on Average Equity 10.8% 3.7% 2.8% 3.0% 10.8% 3.7% 2.8% 3.0%
Return on Average Assets 4.6% 1.9% 1.5% 1.7% 4.6% 1.9% 1.5% 1.7%
EBITDA Margin 62.4% 48.9% 37.1% 34.4% 62.4% 48.9% 37.1% 34.4% EBIT Margin 54.4% 33.0% 25.0% 22.7% 54.4% 33.0% 25.0% 22.7%
Pretax Profit Margin 47.9% 18.7% 9.2% 9.6% 47.9% 18.7% 9.2% 9.6%
Net Prof it Margin 36.9% 8.0% 6.4% 6.6% 36.9% 8.0% 6.4% 6.6%
Valuation Multiples P/E (x) 11.5 24.1 31.9 29.1 11.5 24.1 31.9 29.1
P/B (x) 0.9 0.9 0.9 0.9 0.9 0.9 0.9 0.9
Dividend Yield (%) 2.4% 2.9% 1.0% 1.4% 2.4% 2.9% 1.0% 1.4%

105
RESEARCH
In Dire Straits
2016 Outlook
Financial Statements and Key Ratios – Dangote Cement Plc
Income Statement 2013A 2014A 2015E 2016F 2013A 2014A 2015E 2016F
(N'Mn) (US$'Mn)
Revenue 386,177 391,639 484,507 607,601 2,424 2,371 2,432 2,905
Cost of Sales (108,961) (*121,411) (141,030) (183,059) (684) (735) (708) (875)
Gross Prof i t 277,216 270,228 343,477 424,541 1,740 1,636 1,724 2,029
Distr i . And Admin Expenses (49,502) (65,088) (96,901) (109,368) (311) (394) (486) (523)
EBITDA 227,714 205,140 246,575 315,173 1,430 1,242 1,238 1,507
Depr . and Amortisat ion (33,556) (21,647) (43,446) (45,269) (211) (131) (218) (216)
Other Income 1,724 3,609 31,000 3,038 11 22 156 15
EBIT/Operat ing prof it 195,882 187,102 234,129 272,942 1,230 1,133 1,175 1,305
Interest Expense/Income (5,121) (2,413) (7,461) (6,902) (32) (15) (37) (33)
Pre-tax earnings 190,761 184,689 226,668 266,040 1,198 1,118 1,138 1,272
Taxation 10,437 (25,187) (22,667) (26,604) 66 (153) (114) (127)
Prof it after tax 201,198 159,501 204,001 239,436 1,263 966 1,024 1,145
Statement of Financial Posit ion 2013A 2014A 2015E 2016F 2013A 2014A 2015E 2016F
Assets
F ixed Assets 603,407 768,126 845,806 836,994 3,744 4,660 4,262 4,017
Investments 91,716 79,491 79,491 79,491 569 482 401 382
Inventories 27,667 42,688 26,889 36,732 172 259 136 176
Trade Debtors 10,266 15,640 13,336 16,020 64 95 67 77
Bank and Cash Balances 70,502 20,593 15,000 15,000 437 125 76 72
Other current assets 39,646 58,183 41,150 51,604 246 353 207 248
Total Assets 843,203 984,721 1,021,672 1,035,840 5,232 5,974 5,149 4,972
Liabi li t ies
Trade Creditors 22,211 34,535 32,456 43,132 138 210 164 207
Other Creditors 60,546 66,395 74,572 96,796 376 403 376 465
Taxation 566 2,481 15,982 27,063 4 15 81 130
Short term loan 55,434 106,450 69,454 43,386 344 646 350 208
Other current l iabil i t ies 24,788 23,087 44,411 56,156 154 140 224 270
Long term loans 124,850 131,942 104,181 65,079 775 800 525 312
Ret irement Benef it Obl igation 1,963 2,069 1,656 1,324 12 13 8 6
Deferred taxat ion 507 20,473 20,473 20,473 3 124 103 98
Other long-term liabi l it ies 2,245 5,401 5,401 5,401 14 33 27 26
Total L iabil it ies 293,110 392,834 368,586 358,810 1,819 2,383 1,858 1,722
Capital and Reserves Share capital 8,520 8,520 8,520 8,520 53 52 43 41
Share Premium 42,430 42,430 42,430 42,430 263 257 214 204
Retained Earnings 496,456 537,751 598,039 620,912 3,081 3,262 3,014 2,980
Other component of equity 2,687 3,185 4,097 5,168 17 19 21 25
Shareholders' funds 550,093 591,886 653,086 677,030 3,414 3,591 3,291 3,249
Total l iabi li t ies and equity 843,203 984,721 1,021,672 1,035,840 5,232 5,974 5,149 4,972
Key Ratios 2013A 2014A 2015E 2016F 2013A 2014A 2015E 2016F
Profitabi li ty
Return on Average Equity 41.5% 27.9% 32.8% 36.0% 41.5% 27.9% 32.8% 36.0%
Return on Average Assets 26.5% 17.5% 20.3% 23.3% 26.5% 17.5% 20.3% 23.3%
EBITDA Marg in 59.0% 52.4% 50.9% 51.9% 59.0% 52.4% 50.9% 51.9%
EBIT Marg in 50.7% 47.8% 48.3% 44.9% 50.7% 47.8% 48.3% 44.9%
Pretax Prof it Marg in 49.4% 47.2% 46.8% 43.8% 49.4% 47.2% 46.8% 43.8%
Net Profi t Margin 52.1% 40.7% 42.1% 39.4% 52.1% 40.7% 42.1% 39.4%
Valuat ion Multip les
P/E (x) 14.4 18.2 14.2 12.1 14.4 18.2 14.2 12.1
P/B (x ) 4.8 4.4 4.0 3.9 4.8 4.4 4.0 3.9
Div idend Y ie ld (%) 4.1% 3.5% 4.9% 7.4% 4.1% 3.5% 4.9% 7.4%

106
RESEARCH
In Dire Straits
2016 Outlook
Financial Statements and Key Ratios – Lafarge Africa Plc Income Statement 2013A 2014A 2015E 2016F 2013A 2014A 2015E 2016F (N'Mn) (US$'Mn)
Revenue 98,798 205,845 202,666 219,220 620 1,246 1,017 1,048
Cost of Sales (59,969) (137,364) (131,733) (142,493) (376) (832) (661) (681)
Gross Prof i t 38,829 68,481 70,933 76,727 244 415 356 367
Distr i. And Admin Expenses (7,532) (24,303) (26,347) (24,882) (47) (147) (132) (119)
EBITDA 31,298 44,178 44,587 51,846 196 268 224 248
Other Income 267 - 750 750 2 - 4 4
EBIT/Operat ing prof it 31,565 44,178 45,337 52,596 198 268 228 251
Interest Expense/Income (3,841) (542) 2,428 1,171 (24) (3) 12 6
Share of profi t - (2,437) 3,572 3,572 - (15) 18 17
Pre-tax earnings 27,724 41,198 51,336 57,338 174 249 258 274
Taxation 552 (6,538) (7,807) (8,778) 3 (40) (39) (42)
Prof it after tax 28,276 34,661 36,051 40,535 178 210 181 194
Statement of Financial Position 2013A 2014A 2015E 2016F 2013A 2014A 2015E 2016F
Assets
Fixed Assets 213,276 209,145 211,800 214,735 1,323 1,269 1,067 1,031
Deferred tax assets 97 295 295 295 1 2 1 1
Investment in associate - 31,734 31,734 31,734 - 193 160 152
Intang ible assets 2,361 2,191 2,191 2,191 15 13 11 11
Long Term Investments 13,476 6,256 6,256 6,256 84 38 32 30
Stocks 21,566 24,263 23,459 25,376 134 147 118 122
Debtors & Prepayments 13,349 17,457 22,210 24,024 83 106 112 115
Current Tax Receivable - 509 509 509 - 3 3 2
Cash & Bank Balances 31,021 14,029 74,719 103,986 192 85 377 499
Total Assets 295,146 305,879 373,173 409,105 1,831 1,856 1,881 1,964
Liabi li t ies Trade Creditors 47,145 51,305 84,815 89,790 293 311 427 431
Current Financia l L iabil it ies 13,069 5,017 12,993 14,054 81 30 65 67
Short Term Provis ion 1,754 1,334 1,334 1,334 11 8 7 6
Taxation 1,080 1,554 1,710 1,886 7 9 9 9
Deferred taxat ion 30,885 34,173 34,173 34,173 192 207 172 164
Long term financia l l iabi l i t ies 11,577 9,629 9,629 9,629 72 58 49 46
Long Term Provis ions 10,771 11,224 11,224 11,224 67 68 57 54
Liabil i t ies class if ied as held for sa le 7,839 - - - 49 - - -
Total L iabil it ies 124,121 114,236 155,877 162,090 770 693 786 778
Capita l and Reserves Share capital 1,501 2,202 2,202 2,202 9 13 11 11
Share Reserves 9,489 173,998 173,998 173,998 59 1,056 877 835
Reserves 160,036 15,443 41,096 70,815 993 94 207 340
Shareholders' funds 171,025 191,643 217,296 247,015 1,061 1,163 1,095 1,186
Total l iabi li t ies and equity 295,146 305,879 373,173 409,105 1,831 1,856 1,881 1,964
Key Ratios 2013A 2014A 2015E 2016F 2013A 2014A 2015E 2016F
Profitabi li ty
Return on Average Equity 23.6% 19.1% 17.6% 17.5% 23.6% 19.1% 17.6% 17.5%
Return on Average Assets 9.4% 7.7% 7.3% 7.0% 9.4% 7.7% 7.3% 7.0%
EBITDA Marg in 31.7% 21.5% 22.0% 23.7% 31.7% 21.5% 22.0% 23.7%
EBIT Marg in 31.9% 21.5% 18.7% 20.3% 31.9% 21.5% 18.7% 20.3%
Pretax Prof it Marg in 28.1% 20.0% 21.6% 22.5% 28.1% 20.0% 21.6% 22.5%
Net Profi t Margin 28.6% 16.8% 17.8% 18.5% 28.6% 16.8% 17.8% 18.5%
Valuat ion Multip les
P/E (x) 15.1 12.3 11.8 10.5 15.1 12.3 11.8 10.5
P/B (x ) 2.5 2.2 2.0 1.7 2.5 2.2 2.0 1.7
Div idend Y ie ld (%) 2.3% 2.4% 2.5% 2.9% 2.3% 2.4% 2.5% 2.9%
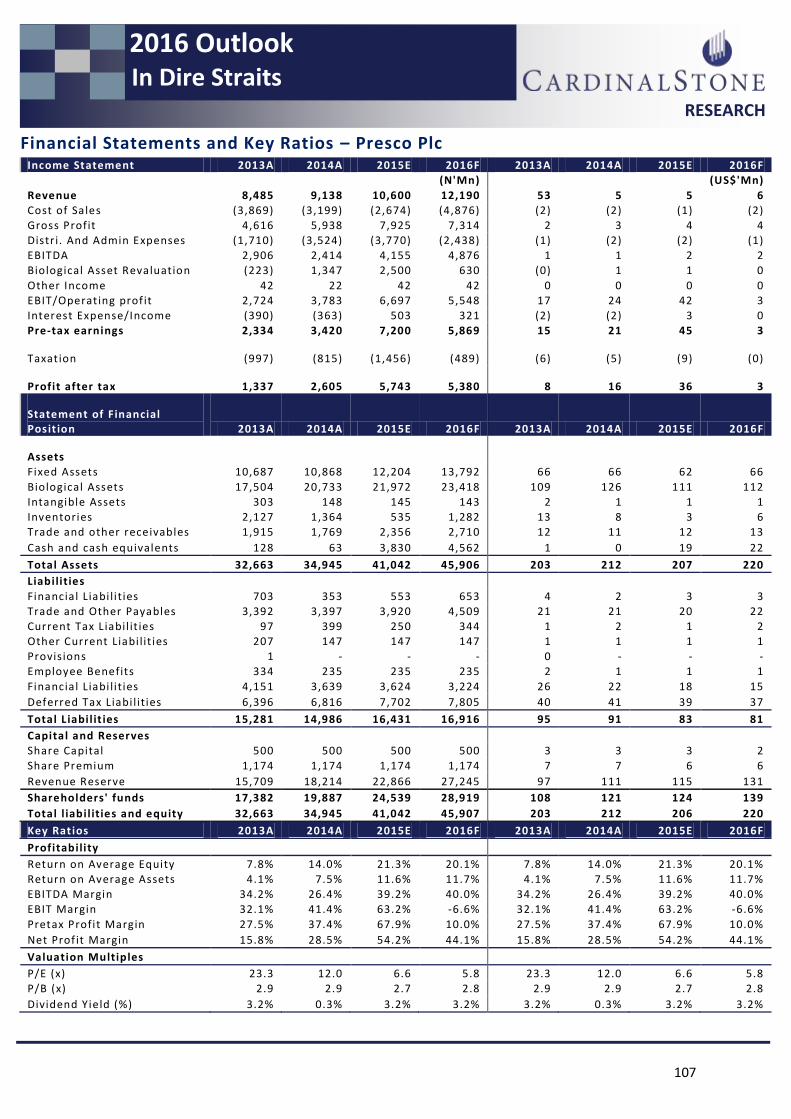
107
RESEARCH
In Dire Straits
2016 Outlook
Financial Statements and Key Ratios – Presco Plc Income Statement 2013A 2014A 2015E 2016F 2013A 2014A 2015E 2016F
(N'Mn) (US$'Mn)
Revenue 8,485 9,138 10,600 12,190 53 5 5 6
Cost of Sales (3,869) (3,199) (2,674) (4,876) (2) (2) (1) (2)
Gross Profit 4,616 5,938 7,925 7,314 2 3 4 4
Distr i. And Admin Expenses (1,710) (3,524) (3,770) (2,438) (1) (2) (2) (1)
EBITDA 2,906 2,414 4,155 4,876 1 1 2 2
Biological Asset Revaluation (223) 1,347 2,500 630 (0) 1 1 0
Other Income 42 22 42 42 0 0 0 0
EBIT/Operating prof it 2,724 3,783 6,697 5,548 17 24 42 3
Interest Expense/Income (390) (363) 503 321 (2) (2) 3 0
Pre-tax earnings 2,334 3,420 7,200 5,869 15 21 45 3
Taxation (997) (815) (1,456) (489) (6) (5) (9) (0)
Profit after tax 1,337 2,605 5,743 5,380 8 16 36 3
Statement of Financial Posit ion 2013A 2014A 2015E 2016F 2013A 2014A 2015E 2016F
Assets Fixed Assets 10,687 10,868 12,204 13,792 66 66 62 66
Biological Assets 17,504 20,733 21,972 23,418 109 126 111 112
Intangible Assets 303 148 145 143 2 1 1 1
Inventories 2,127 1,364 535 1,282 13 8 3 6
Trade and other receivables 1,915 1,769 2,356 2,710 12 11 12 13
Cash and cash equivalents 128 63 3,830 4,562 1 0 19 22
Total Assets 32,663 34,945 41,042 45,906 203 212 207 220
Liabilities Financial Liabi li ties 703 353 553 653 4 2 3 3
Trade and Other Payables 3,392 3,397 3,920 4,509 21 21 20 22
Current Tax L iabil it ies 97 399 250 344 1 2 1 2
Other Current Liabi lit ies 207 147 147 147 1 1 1 1
Provisions 1 - - - 0 - - -
Employee Benefits 334 235 235 235 2 1 1 1
Financial Liabi li ties 4,151 3,639 3,624 3,224 26 22 18 15
Deferred Tax Liabi lities 6,396 6,816 7,702 7,805 40 41 39 37
Total L iabil it ies 15,281 14,986 16,431 16,916 95 91 83 81
Capital and Reserves Share Capital 500 500 500 500 3 3 3 2
Share Premium 1,174 1,174 1,174 1,174 7 7 6 6
Revenue Reserve 15,709 18,214 22,866 27,245 97 111 115 131
Shareholders' funds 17,382 19,887 24,539 28,919 108 121 124 139
Total l iabil ities and equity 32,663 34,945 41,042 45,907 203 212 206 220
Key Ratios 2013A 2014A 2015E 2016F 2013A 2014A 2015E 2016F
Profitability Return on Average Equity 7.8% 14.0% 21.3% 20.1% 7.8% 14.0% 21.3% 20.1%
Return on Average Assets 4.1% 7.5% 11.6% 11.7% 4.1% 7.5% 11.6% 11.7%
EBITDA Margin 34.2% 26.4% 39.2% 40.0% 34.2% 26.4% 39.2% 40.0%
EBIT Margin 32.1% 41.4% 63.2% -6.6% 32.1% 41.4% 63.2% -6.6%
Pretax Profit Margin 27.5% 37.4% 67.9% 10.0% 27.5% 37.4% 67.9% 10.0%
Net Prof it Margin 15.8% 28.5% 54.2% 44.1% 15.8% 28.5% 54.2% 44.1%
Valuation Multiples P/E (x) 23.3 12.0 6.6 5.8 23.3 12.0 6.6 5.8
P/B (x) 2.9 2.9 2.7 2.8 2.9 2.9 2.7 2.8
Dividend Yield (%) 3.2% 0.3% 3.2% 3.2% 3.2% 0.3% 3.2% 3.2%

108
RESEARCH
In Dire Straits
2016 Outlook
Financial Statements and Key Ratios – Okomu Oil Palm Plc Income Statement (N'Mn) 2013A 2014A 2015E 2016F 2013A 2014A 2015E 2016F
(US$'Mn)
Revenue 8,860 8,656 9,435 10,284 56 54 59 65
Cost of Sales (4,648) (4,295) (4,491) (4,819) (29) (27) (28) (30)
Gross Profit 4,212 4,361 4,943 5,465 26 27 31 34
Distr i. And Admin Expenses (2,708) (2,369) (2,733) (2,897) (17) (15) (17) (18)
EBITDA 1,505 1,992 2,211 2,568 9 13 14 16
Operating Income 1,120 192 535 535 7 1 3 3
EBIT/Operating prof it 2,625 2,184 2,745 3,103 16 14 17 19
Interest Expense/Income 69 (56) (269) (307) 0 (0) (2) (2)
Pre-tax earnings 2,694 2,128 2,477 2,796 17 13 16 18
Taxation (601) (575) (513) (579) (4) (4) (3) (4)
Profit after tax 2,092 1,553 1,964 2,217 13 10 12 14
Statement of Financial Position 2013A 2014A 2015E 2016F 2013A 2014A 2015E 2016F
Assets
(US$'Mn)
Fixed Assets 6,507 10,255 11,900 13,672 40 62 60 66
Biological Assets 19,693 20,120 20,784 21,516 122 122 105 103
Stocks 1,320 1,416 1,615 1,726 8 9 8 8
Receivables 1,348 732 798 870 8 4 4 4
Cash and bank balances 1,182 358 1,556 658 7 2 8 3
Total Assets 30,051 32,881 36,652 38,443 186 199 185 185
Liabilities
Trade Payables 744 1,217 3,226 3,517 5 7 16 17
Short Term Borrowings 400 2,286 2,706 3,126 2 14 14 15
Current Tax Payable 1,303 1,003 1,094 1,123 8 6 6 5
Retirement Benefit Obligations 73 20 20 20 0 0 0 0
Dividend Payable 63 63 63 63 0 0 0 0
Deferred taxation 2,924 3,085 3,226 3,385 18 19 16 16
Retirement Benefits 660 496 496 496 4 3 3 2
Non Current Financial Liab. 1,267 1,477 1,577 1,682 8 9 8 8
Total L iabil it ies 7,433 9,648 12,409 13,413 46 59 63 64
Capital and Reserves Share capital 477 477 477 477 3 3 2 2
Revenue Reserves 20,273 20,889 21,900 22,686 126 127 110 109
Share Premium 1,867 1,867 1,867 1,867 12 11 9 9
Shareholders' funds 22,617 23,233 24,244 25,030 140 141 122 120
Total l iabil ities and equity 30,051 32,881 36,652 38,443 186 199 185 185
Key Ratios 2013A 2014A 2015E 2016F 2013A 2014A 2015E 2016F
Profitability
Return on Average Equity 7.0% 4.7% 5.4% 5.8% 7.0% 4.7% 5.4% 5.8%
Return on Average Assets 8.7% 6.8% 8.3% 9.0% 8.7% 6.8% 8.3% 9.0%
EBITDA Margin 17.0% 23.0% 23.4% 25.0% 17.0% 23.0% 23.4% 25.0%
EBIT Margin 29.6% 25.2% 29.1% 30.2% 29.6% 25.2% 29.1% 30.2%
Pretax Profit Margin 30.4% 24.6% 26.3% 27.2% 30.4% 24.6% 26.3% 27.2%
Net Prof it Margin 23.6% 17.9% 20.8% 21.6% 23.6% 17.9% 20.8% 21.6%
Valuation Multiples
P/E (x) 13.8 18.6 14.7 13.0 13.8 18.6 14.7 13.0
P/B (x) 1.3 1.2 1.2 1.2 1.3 1.2 1.2 1.2
Dividend Yield (%) 3.3% 5.0% 5.0% 6.6% 3.3% 5.0% 5.0% 6.6%

109
RESEARCH
In Dire Straits
2016 Outlook
Disclosure
Analyst Certification
The research analyst(s) denoted by an “*” on the cover of this report certifies (or, where multiple research analysts are primarily responsible
for this report, the research analysts denoted by an “*” on the cover or within the document individually certifies, with respect to each
security or issuer that the research analyst(s) cover in this research) that: (1) all of the views expressed in this report accurately articulate the
research analyst(s) independent views/opinions, based on public information regarding the companies, securities, industries or markets
discussed in this report. (2) The research analyst(s) compensation or remuneration is in no way connected (either directly or indirectly) to the
specific recommendations, estimates or opinions expressed in this report.
Analysts’ Compensation: The research analyst(s) responsible for the preparation of this report receive compensation based upon various
factors, including the quality and accuracy of research, client feedback, competitive factors, and overall firm revenues, which include
revenues from, among other business units, Investment Banking and Asset Management.
Investment Ratings
CardinalStone employs a 3-step rating system for equities under coverage: Buy, Hold, and Sell.
Buy ≥ +15.00% expected share price performance
Hold +0.00% to +14.99% expected share price performance
Sell < 0.00% expected share price performance
A BUY rating is given to equities with strong fundamentals, which have the potential to rise by at least +15.00% between the current price
and the analyst’s target price
An HOLD rating is given to equities with good fundamentals, which have upside potential within a range of +0.00% and +14.99%,
A SELL rating is given to equities that are highly overvalued or with weak fundamentals, where potential returns of less than 0.00% is
expected, between the current price and analyst’s target price.
A NEGATIVE WATCH is given to equities whose fundamentals may deteriorate significantly over the next six (6) months, in our view.
CardinalStone Research distribution of ratings/Investment banking relationships as of December 31, 2015
Rating Buy Sell Hold Negative Watch
% of total recommendations 57% 17% 23% 3%
% with investment banking
relationships
33% 0% 50% 17%
Valuation and Risks: Please see the most recent company-specific research report for an analysis of valuation methodology and risks on any
security recommended herein. You can contact the analyst named on the front of this note for further details.
Frequency of Next Update: An update of our view on the company (ies) would be provided when next there are substantial
developments/financial news on the company.
Conflict of Interest: It is the policy of CardinalStone Partners Limited and its subsidiaries and affiliates (individually and collectively referred to as “CardinalStone”) that research analysts may not be involved in activities that suggest that they are representing the interests of Cardinal Stone in a way likely to appear to be inconsistent with providing independent investment research. In addition, research analysts’ reporting lines are structured to avoid any conflict of interests. For example, research analysts are not subject to the supervision or control of anyone in CardinalStone’s Investment Banking or Sales and Trading departments. However, such sales and trading departments may trade, as principal, based on the research analyst’s published research. Therefore, the proprietary interests of those Sales and Trading departments may conflict with your interests.

110
RESEARCH
In Dire Straits
2016 Outlook
Company Disclosure: CardinalStone may have financial or beneficial interest in securities or related investments discussed in this report, which could,
unintentionally, affect the objectivity of this report. Material interests, which CardinalStone has with companies or in securities discussed in
this report, are disclosed hereunder:
Company Disclosure
Guaranty Trust Bank Plc
Zenith Bank Plc
FBN Holdings
Access Bank Plc
United Bank for Africa Plc
Diamond Bank Plc
FCMB j
Sterling Bank Plc g
ETI
Fidelity Bank Plc
Stanbic IBTC Holding Plc j
Custodian and Allied Insurance Plc
AIICO Insurance Plc
Guinness Nigeria Plc
Nigerian Breweries Plc
Nestle Nigeria Plc
PZ Cussons Plc
UAC of Nigeria Plc
Unilever Nigeria Plc
Flour Mills of Nigeria Plc
Dangote Sugar Refinery Plc
Ashaka Cement Plc
Dangote Cement Plc
Cement Co of Northern Nigeria Plc
Lafarge Cement WAPCO Nigeria Plc
Total Nigeria Plc
Mobil Nigeria Plc
Oando Plc
Seplat Petroleum Development Company Plc
Presco Plc h
Okomu Oil Palm Plc h

111
RESEARCH
In Dire Straits
2016 Outlook
a. The analyst holds personal positions (directly or indirectly) in a class of the common equity securities of the company b. The analyst responsible for this report as indicated on the front page is a board member, officer or director of the Company c. CardinalStone is a market maker in the publicly traded equities of the Company d. CardinalStone has been lead arranger or co-lead arranger over the past 12 months of any publicly disclosed offer of securities of the Company e. CardinalStone beneficially own 1% or more of the equity securities of the Company f. CardinalStone holds a major interest in the debt of the Company g. CardinalStone has received compensation for investment banking activities from the Company within the last 12 months h. CardinalStone intends to seek, or anticipates to receive compensation for investment banking services from the Company in the next 3 months i. The content of this research report has been communicated with the Company, following which this research report has been materially amended before its distribution j. The Company is a client of CardinalStone k. The Company owns more than 5% of the issued share capital of CardinalStone l. CardinalStone has other financial or other material interest in the Company
Important Regional Disclosures
The analyst(s) involved in the preparation of this report may not have visited the material operations of the subject Company (ies) within the
past 12 months. To the extent this is a report authored in whole or in part by a Non-U.S. analyst and is made available in the U.S., the
following are important disclosures regarding any Non-U.S. analyst contributors: The Non-U.S. research analysts (denoted by an * in the
report) are not registered/qualified as research analysts with FINRA; and therefore, may not be subject to the NASD Rule 2711 and NYSE Rule
472 restrictions on communications with a subject company, public appearances and trading securities held by a research analyst account.
Each analyst (denoted by an *) is a Non-U.S. Analyst and is currently employed by Cardinal Stone.
Legal Entities
Legal entity disclosures: CardinalStone Partners is authorized and regulated by the Securities and Exchange Commission (SEC) to conduct
investment business in Nigeria.