2016 national survey of children’s health analysis - · pdf fileabout the study all...
TRANSCRIPT

About the Study
All findings reported here are based on analysis of data from the 2016 National Survey of Children’s Health (NSCH). This brief includes U.S. maps and a table of findings across U.S. states on key topics. All comparisons by ACE status are statistically significant unless otherwise noted. Most findings replicate those also found and published using the 2011–12 NSCH. See methods notes for more details.
TABLE 1: National and Across-State Prevalence of ACEs among Children and Youth
Adverse Childhood Experiences (ACEs)National Prevalence, by Age of Child
Range Across StatesAll Children Age 0-5 Age 6-11 Age 12-17
Child had ≥ 1 Adverse Childhood Experience 46.3% 35.0% 47.6% 55.7% 38.1% (MN) – 55.9% (AR)
Child had ≥ 2 Adverse Childhood Experiences 21.7% 12.1% 22.6% 29.9% 15.0% (NY) – 30.6% (AZ)
Nine assessed on the 2016 NSCH1 % with 1+ Additional ACEs
Somewhat often/very often hard to get by on income* 25.5% 24.1% 25.7% 26.5% 54.4%
Parent/guardian divorced or separated 25.0% 12.8% 27.5% 34.2% 68.0%
Parent/guardian died 3.3% 1.2% 2.9% 5.9% 74.7%
Parent/guardian served time in jail 8.2% 4.5% 9.2% 10.6% 90.6%
Saw or heard violence in the home 5.7% 3.0% 6.1% 8.0% 95.4%
Victim of violence or witnessed neighborhood violence 3.9% 1.2% 3.7% 6.5% 92.1%
Lived with anyone mentally ill, suicidal, or depressed 7.8% 4.4% 8.6% 10.3% 82.4%
Lived with anyone with alcohol or drug problem 9.0% 5.0% 9.3% 12.7% 90.7%
Often treated or judged unfairly due to race/ethnicity** 3.7% 1.2% 4.1% 5.7% 75.3%
*47% of children in households with poverty level incomes have parents who reported “often hard to get by on income”. **1 in 10 black and “other” race/ethnicity children had parents who reported their children often were treated or judged unfairly. 4.4% of Hispanic and Asian/Non-Hispanic children had parents who reported this (1% for white children)
ISSUE BRIEFOctober 2017
A national and across-state profile on Adverse Childhood Experiences among U.S. children and possibilities to heal and thriveThis issue brief offers hope and a way forward so that all children and their families can attain optimal physical, social, and emotional development and well-being. Presented are the latest data documenting the prevalence of Adverse Childhood Experiences (ACEs) among children in the United States. ACEs include a range of experiences that can lead to trauma and toxic stress and impact children’s brain development and physical, social, mental, emotional, and behavioral health and well-being (Table 1).1,2 There is growing evidence that it is the general experience of multiple ACEs, rather than the specific individual impact of any one experience, that matters.3,4 The impact of ACEs extends beyond children and can have far-reaching consequences for entire communities;5
consequently, this brief also points to strategies that families, caregivers, providers, and communities can implement to reduce the negative health effects associated with ACEs, heal, and help children thrive in the face of adversity.5-9
Citation: Bethell, CD, Davis, MB, Gombojav, N, Stumbo, S, Powers, K. Issue Brief: A national and across state profile on adverse childhood experiences among children and possibilities to heal and thrive. Johns Hopkins Bloomberg School of Public Health, October 2017. http://www.cahmi.org/projects/adverse-childhood-experiences-aces/

TABLE 2: Prevalence of ACEs by Race/Ethnicity and Income
All Children
White, NH*
HispanicBlack, NH*
Asian, NH*
Other, NH*
% of all US children 51.9% 24.5% 12.7% 4.5% 6.3%
% 1+ ACEs 46.3% 40.9% 51.4% 63.7% 25.0% 51.5%
% 2+ ACEs 21.7% 19.2% 21.9% 33.8% 6.4% 28.3%
% among children with 1+ ACES
46.0% 27.0% 17.4% 2.4% 7.1%
Income < 200% of Federal Poverty Level (43.7% of all US children; 58% of children with 1+ ACEs)
% 1+ ACEs 61.9% 63.3% 57.0% 70.5% 36.4% 70.6%
% 2+ ACEs 31.9% 34.7% 25.1% 39.9% 9.0% 44.4%
Income 200-399% of Federal Poverty Level (26.8% of all US Children; 25.1% of children with 1+ ACEs)
% 1+ ACEs 43.2% 39.7% 46.8% 59.1% 24.8% 50.7%
% 2+ ACEs 19.0% 17.2% 19.8% 29.4% 7.0% 24.5%
Income ≥ 400% of Federal Poverty Level (29.5% of all US Children; 17.0% of children with 1+ ACEs)
% 1+ ACEs 26.4% 24.4% 35.5% 41.2% 14.3% 27.3%
% 2+ ACEs 9.2% 8.6% 12.1% 14.1% 3.6% 10.5%
*NH=Non-Hispanic
The importance of a population-wide, multi-systems approach
In 2016, 34 million children, nearly half of all U.S. children ages 0-17, had at least one of nine ACEs, and more than 20 percent experienced two or more (Table 1). These findings are similar to those reported for the 2011-12 NSCH.11 ACEs are common among all children; and most who have experienced one often experience at least one other.10
KEY FINDINGS
� The rate of children across U.S. states with one or more of nine ACEs assessed varies from 38.1 percent to 55.9 percent. Those with two or more ACEs varies from15.0 percent to 30.6 percent. Most children with any one ACE had at least one other, ranging from 54.4 percent to 95.4 percent.
� ACEs are prevalent among children with both public and private health insurance coverage. Nearly two-thirds of publicly insured children have ACEs (65.2 percent), yet they represent 45 percent of children with ACEs.
� ACEs are also common across all income groups, though 58 percent of U.S. children with ACEs live in homes with incomes less than 200 percent of the federal poverty level (Table 2).
� Black children are disproportionately represented among children with ACEs. Six in 10 have ACEs and represent 17.4 percent of all children in the United States with ACEs (Table 2).
ACEs impact not just the individual child who has them, but their friends, families, neighbors, and entire communities. Three factors support a population-wide, multi-systems approach to ACEs in the United States: (1) high rates for all children as well as among the adults that care for them; (2) similar risks to children’s health status and school engagement once ACEs do occur; and (3) the intergenerational and cascading effects of ACEs for all children and the communities they live in. Recognizing the lifelong impact from childhood trauma
Social and emotional skills, along with school attendance and engagement, are important predictors of lifelong health and well-being for children. Most children will experience a social, emotional, or school engagement challenge at some point. Yet those with ACEs face greater risks and challenges. Knowing this changes how we support children with challenges. SOCIAL AND EMOTIONAL CHALLENGES COMPOUNDED
� Compared to those with no ACEs, children ages 3-5 with 2+ ACEs are over four times more likely to have three or more of the six social and emotional challenges that can impact learning listed in Figure 1.
� About two-thirds of children ages 6-17 who bully, pick on, or exclude other children—or are themselves bullied, picked on, or excluded—have ACEs.11
SCHOOL SUCCESS IMPACTED
� More than three in four (76.3 percent) U.S. children ages 3-5 who were expelled (“asked to stay home”) from preschool had ACEs.
� Children ages 6-17 with no ACEs are half as likely to be disengaged in school compared to those with 2+ACEs (24.1 percent vs. 49.0 percent).11
Citation: Bethell, CD, Davis, MB, Gombojav, N, Stumbo, S, Powers, K. Issue Brief: A national and across state profile on adverse childhood experiences among children and possibilities to heal and thrive. Johns Hopkins Bloomberg School of Public Health, October 2017. http://www.cahmi.org/projects/adverse-childhood-experiences-aces/

Resilience and supporting family relationships are the key
Teaching resilience and promoting positive family communication, routines, and habits are important for all children and are powerful protective and healing factors for children with ACEs. Children and families with ACEs can become among the most resilient and healthiest when they learn to cope and heal from the physical, emotional, and social effects of trauma and toxic stress associated with ACEs. The most effective ways to address trauma and toxic stress require full engagement of children and families to practice resilience skills and community environments that help them do so.
� Children age 6-17 with 2+ ACEs who learn to stay calm and in control when faced with challenges are over three times more likely to be engaged in school compared to children who have not learned these skills (71.4 percent vs. 19.2 percent).11
� Children with 2+ ACEs are nearly six times more likely to have learned this resilience skill when parents do very well in sharing ideas and about things that matter with their child versus not well.12
Consistently trusting and respectful relationships matter
Research shows that patients with trusting and respectful relationships with their health care providers are more likely to discuss potentially sensitive issues like ACEs, and have better health outcomes.13 Consistently positive communication between parents and their children’s health care providers is linked to stronger family resilience and a higher number of nationally recommended family routines and habits. For children ages 0-5, recommended family routines and habits include limiting TV/screen time, ensuring no tobacco use in the home, reading to children daily, breastfeeding, and sharing family meals (Table 3).14
� Children with 2+ ACEs whose parents report that their child’s health care providers “always” listen, spend needed time, and give needed information are over 1.5 times more likely to live in families that practice four basic resilience skills when they face problems.
� Children whose parents report “always” having positive communication with their child’s health care providers are over 1.5 times more likely to practice three or more (of five) recommended protective family routines and habits.
TABLE 3: Prevalence of all children with 2+ ACEs whose families practice resilience when facing problems and practice protective routines and habits, by experiences during health care visits
Family often practices 4 qualities of resilience when facing problems
3 or more of 5 protective family routines and
habits practiced
How often providers spend enough time*
Always 73.1% 74.7%
Sometimes/Never 47.9% 53.6%
How often providers listen carefully to parents*
Always 71.0% 72.6%
Sometimes/Never 46.1% 56.0%
How often specific information needed is provided*
Always 70.7% 72.5%
Sometimes/Never 45.9% 51.9%
*Odds ratios adjusted for income/FPL and race/ethnicity all significant: With “always” responses to each experience of health care factors, odds are 2.68-2.79 greater that families often practice 4 resilience qualities than with “sometimes/never” (1.46-1.54 for “usually”). Odds.41-.50 less for practicing 2 or fewer (vs. 3-5) protective family routines and habits with “always” responses compared to “sometimes/never” (“usually” responses did not differ from “sometimes/never”).
FIGURE 1: Prevalence of Social and Emotional Skills and Challenges of Children and Youth, by ACEs
0 ACEs 1 ACE
Often cannot calm self down when excited/wound up (age 3-5)
Loses control of temper all or most of
the time (age 3-5)
Doesn’t often play well with others (age 3-5)
Easily distracted all or most of the time
(age 3-5)
Doesn’t often keep working at something
until finished (age 3-5)
Difficulty making and keeping friends
(age 3-5)
Has 3 or more of 6 social or emotional
challenges (age 3-5)
Meets each of 3 flourishing criteria
(age 6-17)
Definitely engaged in school (age 6-7)
15.8%
28.4%
10.2%
20.8%
4.1%
10.6%
12.7%
23.6%
23.8%
38.5%
10.2%
18.1%
7.3%
19.7%
48.4%
32.7%
75.9%
57.9%
Citation: Bethell, CD, Davis, MB, Gombojav, N, Stumbo, S, Powers, K. Issue Brief: A national and across state profile on adverse childhood experiences among children and possibilities to heal and thrive. Johns Hopkins Bloomberg School of Public Health, October 2017. http://www.cahmi.org/projects/adverse-childhood-experiences-aces/

A pivotal role for health care, social, and community services
Children who have ACEs are more likely to have a chronic condition that requires above routine health care services and mothers who are not in very good physical and mental health.11 As a result, health care providers and services can play an especially important role in their direct patient interactions, to learn about ACEs and by ensuring families connect with other supports and resources in their communities.13 Addressing ACEs can also reduce health care costs by addressing the roots of many health problems.15
Because children with ACEs are also less likely to live in neighborhoods described by parents as “supportive” (see methods notes), it follows that the families requiring the greatest community supports and services are least likely to have them (Figure 2). Building the resilience of entire communities is pivotal in addressing ACEs.16-19
� Nearly three in four children with chronic conditions involving emotional, mental or behavioral (EMB) problems have ACEs.11
� Children with 2+ ACEs are 2.76 times more likely to live in families where parents had to cut back on or stop working due to their child’s health.11
Creating “through any door” coping and healing supports
A strong family unit is essential when it comes to addressing ACEs, but broader community support is critical to strengthen families. Health care providers, early child care professionals, teachers, home visitors, and community health workers all play a pivotal role. The relational skills of those who work with children is especially important.20,21 Importantly, research shows that professionals who practice mindfulness skills, like being open, calm, mentally and emotionally present, flexible, and responsive during interactions with children—and encourage families to practice similar skills—helps children.22 These skills and practical tools to effectively engage and coach families to reflect and identify strengths, needs, and priorities for well-visits, for example, have been shown to increase conversations about a child’s social and emotional well-being and family and household issues that can impact children.23,24
Building a Culture of Health for children and families
All children need nurturing environments to grow up healthy, and all families should have the opportunity to provide those environments for their children. A child’s physical, social, and emotional well-being are inextricably linked. A child’s experiences can determine health and well-being throughout life. This brief demonstrates that despite the significant prevalence of ACEs, policymakers, families, community leaders, and health care service providers can create environments where children can flourish and thrive.25 The earlier we nurture children’s well-being—beginning while they are in utero—the more likely that they will have the love and support needed for lifelong health and happiness.
FIGURE 2: Child and Parent Health and Neighborhood Support, by ACEs
0 ACEs 1 ACE 2+ ACEs
Prevalence of children with chronic
conditions and special health care needs
Prevalence of children whose parent reports living in a supportive
neighborhood
Prevalence of children whose mother’s
health is very good or excellent
13.6%
20.3%
33.3%
61.3%
40.1%
50.7%
75.3%
57.0%
40.2%
Citation: Bethell, CD, Davis, MB, Gombojav, N, Stumbo, S, Powers, K. Issue Brief: A national and across state profile on adverse childhood experiences among children and possibilities to heal and thrive. Johns Hopkins Bloomberg School of Public Health, October 2017. http://www.cahmi.org/projects/adverse-childhood-experiences-aces/

Percent of Children Age 0-17 with One or More Adverse Childhood Experiences in the US
Percent of Children Age 0-5 with One or More Adverse Childhood Experiences in the US
Nationwide: 35.0%
State Range: 23.1%–49.1%
Nationwide: 46.3%
State Range: 38.1%–55.9%
Citation: Bethell, CD, Davis, MB, Gombojav, N, Stumbo, S, Powers, K. Issue Brief: A national and across state profile on adverse childhood experiences among children and possibilities to heal and thrive. Johns Hopkins Bloomberg School of Public Health, October 2017. http://www.cahmi.org/projects/adverse-childhood-experiences-aces/

Percent of Children Age 0-17 or with Two More Adverse Childhood Experiences in the US
TABLE 4. Description of the Measures Presented in Table 5
Measure Labels Description of the Measures
1+ ACEs, 0-17 years
Prevalence of children with one or more adverse childhood experiences (ACEs), age 0-17 years. The NSCH includes nine ACEs items:
• Hard to get by on income (somewhat or very often)• Parent/guardian divorced or separated• Parent/guardian died• Parent/guardian served time in jail• Saw or heard violence in the home
• Victim/witness of neighborhood violence• Lived with anyone mentally ill, suicidal, or depressed• Lived with anyone with alcohol or drug problem• Often treated or judged unfairly due to race/ethnicity
For more information about the methods to assess ACEs click here.
2+ ACEs, 0-17 years Prevalence of children with two or more ACEs, age 0-17 years.
1+ ACEs, 0-5 years Prevalence of children with one or more ACEs, age 0-5 years.
Chronic Health Condition
Prevalence of children with chronic health conditions identified by the Children with Special Health Care Needs (CSHCN) Screener, among children age 0-17 years with one or more ACEs. To learn about the CSHCN Screener click here.
CSHCN with EMB Conditions
Prevalence of CSHCN with ongoing emotional, developmental and/or behavioral (EBD) health conditions identified by the CSHCN Screener, among children age 0-17 years with one or more ACEs.
Mother’s HealthPrevalence of children whose mother’s physical and mental health are both either excellent or very good, among children age 0-17 years with one or more ACEs.
Parent CopingPrevalence of children whose parents reported that they handle the day-to-day demands of raising children very well, among children age 0-17 years with one or more ACEs.
School EngagementPrevalence of children definitely engaged in school, among children age 6-17 years with one or more ACEs. In the 2016 NSCH, children are considered to be engaged in school if their parents reported “definitely true” to both of the following: their child cares about doing well in school and their child does all required homework.
Resilience, 6-17 years
Prevalence of children demonstrating resilience, among children age 6-17 years with one or more ACEs. In the 2016 NSCH, resilience is defined as definitely staying calm and in control when faced with a challenge.
Supportive Neighborhood
Prevalence of children who live in supportive neighborhoods, among children age 0-17 years with one or more ACEs. In the 2016 NSCH, children are considered to live in supportive neighborhoods if their parents reported “definitely agree” to at least one of the items below and “somewhat agree” or “definitely agree” to the other two: People in my neighborhood help each other out; we watch out for each other’s children in this neighborhood; when we encounter difficulties, we know where to go for help in our community.
Cut Back or Stopped Working
Prevalence of children whose parents either cut back on their work hours or stopped working because of their child’s health or health conditions, among children age 0-17 years with one or more ACEs.
Family Routines and Habits
Prevalence of children who live in families with fewer than 3 out of 5 family routines and habits, among children age 0-17 years with one or more ACEs. The 5 family routines and habits for different age groups are:
Children age 0-5:• No tobacco use in the home• Family shares a meal at least 4 days/week• Child has no more than 2 hours of screen time/day• Child is read to every day• Child was ever fed breast milk
Children age 6-17:• No tobacco use in the home• Family shares a meal at least 4 days/week• Child has no more than 2 hours of screen time/day• Child does required homework• Parents participate in their child’s events/activities
Nationwide: 21.7%
State Range: 15.0%–30.6%
Citation: Bethell, CD, Davis, MB, Gombojav, N, Stumbo, S, Powers, K. Issue Brief: A national and across state profile on adverse childhood experiences among children and possibilities to heal and thrive. Johns Hopkins Bloomberg School of Public Health, October 2017. http://www.cahmi.org/projects/adverse-childhood-experiences-aces/
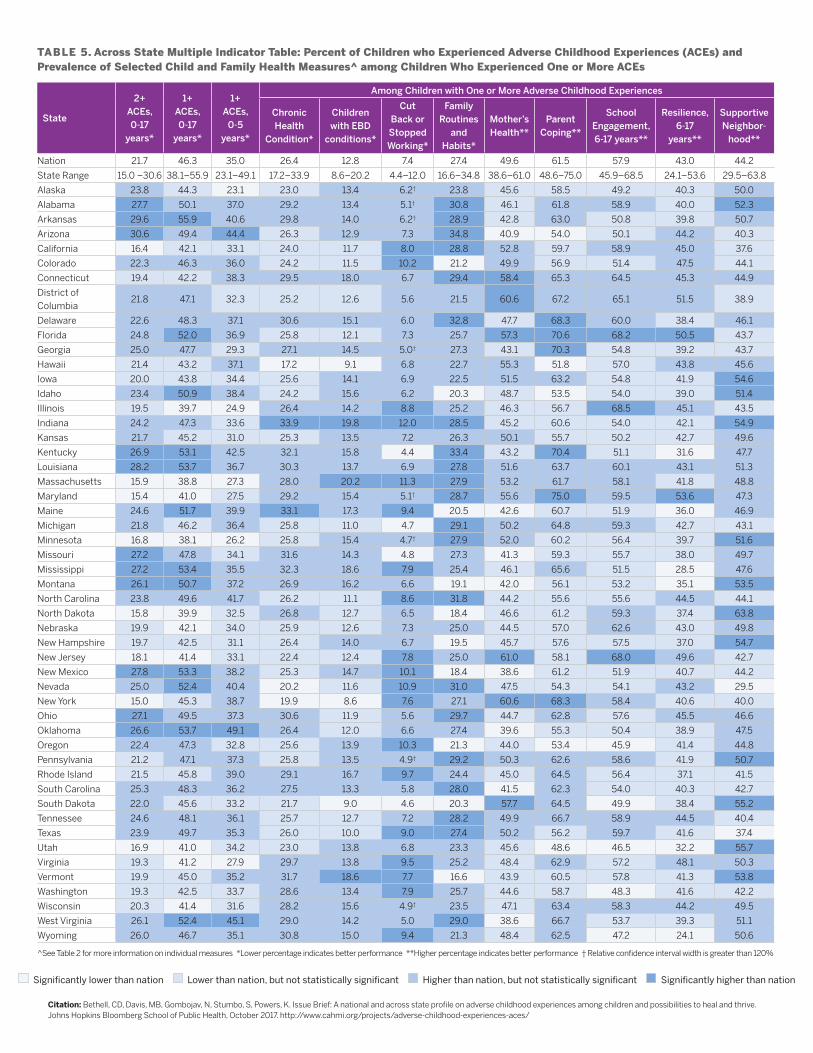
TABLE 5. Across State Multiple Indicator Table: Percent of Children who Experienced Adverse Childhood Experiences (ACEs) and Prevalence of Selected Child and Family Health Measures^ among Children Who Experienced One or More ACEs
State
2+ ACEs, 0-17
years*
1+ ACEs, 0-17
years*
1+ ACEs,
0-5 years*
Among Children with One or More Adverse Childhood Experiences
Chronic Health
Condition*
Children with EBD
conditions*
Cut Back or Stopped Working*
Family Routines
and Habits*
Mother’s Health**
Parent Coping**
School Engagement, 6-17 years**
Resilience, 6-17
years**
Supportive Neighbor-
hood**
Nation 21.7 46.3 35.0 26.4 12.8 7.4 27.4 49.6 61.5 57.9 43.0 44.2
State Range 15.0 –30.6 38.1–55.9 23.1–49.1 17.2–33.9 8.6–20.2 4.4–12.0 16.6–34.8 38.6–61.0 48.6–75.0 45.9–68.5 24.1–53.6 29.5–63.8
Alaska 23.8 44.3 23.1 23.0 13.4 6.2† 23.8 45.6 58.5 49.2 40.3 50.0
Alabama 27.7 50.1 37.0 29.2 13.4 5.1† 30.8 46.1 61.8 58.9 40.0 52.3
Arkansas 29.6 55.9 40.6 29.8 14.0 6.2† 28.9 42.8 63.0 50.8 39.8 50.7
Arizona 30.6 49.4 44.4 26.3 12.9 7.3 34.8 40.9 54.0 50.1 44.2 40.3
California 16.4 42.1 33.1 24.0 11.7 8.0 28.8 52.8 59.7 58.9 45.0 37.6
Colorado 22.3 46.3 36.0 24.2 11.5 10.2 21.2 49.9 56.9 51.4 47.5 44.1
Connecticut 19.4 42.2 38.3 29.5 18.0 6.7 29.4 58.4 65.3 64.5 45.3 44.9
District of Columbia
21.8 47.1 32.3 25.2 12.6 5.6 21.5 60.6 67.2 65.1 51.5 38.9
Delaware 22.6 48.3 37.1 30.6 15.1 6.0 32.8 47.7 68.3 60.0 38.4 46.1
Florida 24.8 52.0 36.9 25.8 12.1 7.3 25.7 57.3 70.6 68.2 50.5 43.7
Georgia 25.0 47.7 29.3 27.1 14.5 5.0† 27.3 43.1 70.3 54.8 39.2 43.7
Hawaii 21.4 43.2 37.1 17.2 9.1 6.8 22.7 55.3 51.8 57.0 43.8 45.6
Iowa 20.0 43.8 34.4 25.6 14.1 6.9 22.5 51.5 63.2 54.8 41.9 54.6
Idaho 23.4 50.9 38.4 24.2 15.6 6.2 20.3 48.7 53.5 54.0 39.0 51.4
Illinois 19.5 39.7 24.9 26.4 14.2 8.8 25.2 46.3 56.7 68.5 45.1 43.5
Indiana 24.2 47.3 33.6 33.9 19.8 12.0 28.5 45.2 60.6 54.0 42.1 54.9
Kansas 21.7 45.2 31.0 25.3 13.5 7.2 26.3 50.1 55.7 50.2 42.7 49.6
Kentucky 26.9 53.1 42.5 32.1 15.8 4.4 33.4 43.2 70.4 51.1 31.6 47.7
Louisiana 28.2 53.7 36.7 30.3 13.7 6.9 27.8 51.6 63.7 60.1 43.1 51.3
Massachusetts 15.9 38.8 27.3 28.0 20.2 11.3 27.9 53.2 61.7 58.1 41.8 48.8
Maryland 15.4 41.0 27.5 29.2 15.4 5.1† 28.7 55.6 75.0 59.5 53.6 47.3
Maine 24.6 51.7 39.9 33.1 17.3 9.4 20.5 42.6 60.7 51.9 36.0 46.9
Michigan 21.8 46.2 36.4 25.8 11.0 4.7 29.1 50.2 64.8 59.3 42.7 43.1
Minnesota 16.8 38.1 26.2 25.8 15.4 4.7† 27.9 52.0 60.2 56.4 39.7 51.6
Missouri 27.2 47.8 34.1 31.6 14.3 4.8 27.3 41.3 59.3 55.7 38.0 49.7
Mississippi 27.2 53.4 35.5 32.3 18.6 7.9 25.4 46.1 65.6 51.5 28.5 47.6
Montana 26.1 50.7 37.2 26.9 16.2 6.6 19.1 42.0 56.1 53.2 35.1 53.5
North Carolina 23.8 49.6 41.7 26.2 11.1 8.6 31.8 44.2 55.6 55.6 44.5 44.1
North Dakota 15.8 39.9 32.5 26.8 12.7 6.5 18.4 46.6 61.2 59.3 37.4 63.8
Nebraska 19.9 42.1 34.0 25.9 12.6 7.3 25.0 44.5 57.0 62.6 43.0 49.8
New Hampshire 19.7 42.5 31.1 26.4 14.0 6.7 19.5 45.7 57.6 57.5 37.0 54.7
New Jersey 18.1 41.4 33.1 22.4 12.4 7.8 25.0 61.0 58.1 68.0 49.6 42.7
New Mexico 27.8 53.3 38.2 25.3 14.7 10.1 18.4 38.6 61.2 51.9 40.7 44.2
Nevada 25.0 52.4 40.4 20.2 11.6 10.9 31.0 47.5 54.3 54.1 43.2 29.5
New York 15.0 45.3 38.7 19.9 8.6 7.6 27.1 60.6 68.3 58.4 40.6 40.0
Ohio 27.1 49.5 37.3 30.6 11.9 5.6 29.7 44.7 62.8 57.6 45.5 46.6
Oklahoma 26.6 53.7 49.1 26.4 12.0 6.6 27.4 39.6 55.3 50.4 38.9 47.5
Oregon 22.4 47.3 32.8 25.6 13.9 10.3 21.3 44.0 53.4 45.9 41.4 44.8
Pennsylvania 21.2 47.1 37.3 25.8 13.5 4.9† 29.2 50.3 62.6 58.6 41.9 50.7
Rhode Island 21.5 45.8 39.0 29.1 16.7 9.7 24.4 45.0 64.5 56.4 37.1 41.5
South Carolina 25.3 48.3 36.2 27.5 13.3 5.8 28.0 41.5 62.3 54.0 40.3 42.7
South Dakota 22.0 45.6 33.2 21.7 9.0 4.6 20.3 57.7 64.5 49.9 38.4 55.2
Tennessee 24.6 48.1 36.1 25.7 12.7 7.2 28.2 49.9 66.7 58.9 44.5 40.4
Texas 23.9 49.7 35.3 26.0 10.0 9.0 27.4 50.2 56.2 59.7 41.6 37.4
Utah 16.9 41.0 34.2 23.0 13.8 6.8 23.3 45.6 48.6 46.5 32.2 55.7
Virginia 19.3 41.2 27.9 29.7 13.8 9.5 25.2 48.4 62.9 57.2 48.1 50.3
Vermont 19.9 45.0 35.2 31.7 18.6 7.7 16.6 43.9 60.5 57.8 41.3 53.8
Washington 19.3 42.5 33.7 28.6 13.4 7.9 25.7 44.6 58.7 48.3 41.6 42.2
Wisconsin 20.3 41.4 31.6 28.2 15.6 4.9† 23.5 47.1 63.4 58.3 44.2 49.5
West Virginia 26.1 52.4 45.1 29.0 14.2 5.0 29.0 38.6 66.7 53.7 39.3 51.1
Wyoming 26.0 46.7 35.1 30.8 15.0 9.4 21.3 48.4 62.5 47.2 24.1 50.6
^See Table 2 for more information on individual measures *Lower percentage indicates better performance **Higher percentage indicates better performance † Relative confidence interval width is greater than 120%
Significantly lower than nation Lower than nation, but not statistically significant Higher than nation, but not statistically significant Significantly higher than nation
Citation: Bethell, CD, Davis, MB, Gombojav, N, Stumbo, S, Powers, K. Issue Brief: A national and across state profile on adverse childhood experiences among children and possibilities to heal and thrive. Johns Hopkins Bloomberg School of Public Health, October 2017. http://www.cahmi.org/projects/adverse-childhood-experiences-aces/
REFERENCES
1. Shonkoff, et al: https://www.ncbi.nlm.nih.gov/pubmed/222011562. Jones, et al: http://doi.org/10.2105/AJPH.2015.3026303. Arkin, et al: https://www.rwjf.org/content/dam/farm/reports/reports/2014/
rwjf409002#page=444. RWJF Commission: http://www.commissiononhealth.org/Recommendations.aspx5. National Child Traumatic Stress Network: http://www.nctsn.org/resources 6. Sesame Street In Communities: https://sesamestreetcommunities.org/7. Provider Resources: http://www.cahmi.org/wp-content/uploads/2015/01/ACEs-
Resource-Packet_ all-pages_12_06-16.pdf8. Academic Pediatrics, 17(7S): S51-S69. Academic Pediatrics supplement,
Sept/Oct 2017 – Child Well-being and Adverse Childhood Experiences in the US: http://www.academicpedsjnl.net/issue/S1876-2859(17)X0002-8
9. Sege, et al: http://www.academicpedsjnl.net/article/S1876-2859(17)30107-9/pdf 10. NSCH ACEs Measure: http://www.academicpedsjnl.net/article/S1876-
2859(17)30324-8/pdf11. Bethell, et al: https://www.ncbi.nlm.nih.gov/pubmed/2548902812. Bethell, et al: https://www.ncbi.nlm.nih.gov/m/pubmed/2698012013. Szilagyi, et al: https://www.ncbi.nlm.nih.gov/m/pubmed/2715704514. Bright Futures Guidelines: https://brightfutures.aap.org/materials-and-tools/
guidelnes-and-pocketguide/Pages/default.aspx15. Bellis, et al: https://www.ncbi.nlm.nih.gov/pmc/articles/PMC5549819/16. Porter, et al: http://www.academicpedsjnl.net/article/S1876-2859(16)30496-X/pdf17. Pachter, et al: http://www.academicpedsjnl.net/article/S1876-2859(17)30168-7/pdf18. Bruner, et al: http://www.academicpedsjnl.net/article/S1876-2859(17)30352-2/pdf19. Ellis, et al: http://www.academicpedsjnl.net/article/S1876-2859(16)30552-6/pdf
http://www.academicpedsjnl.net/article/S1876-2859(17)30352-2/pdfBruner20. Brown, et al: http://www.academicpedsjnl.net/article/S1876-2859(17)30015-3/pdf21. Becker, et al: https://link.springer/com/article/10.1007/s10826-015-0352-y22. Magen, et al: http://www.academicpedsjnl.net/article/S1876-2859(17)30106-7/pdf 23. Cocker, et al: https://www.ncbi.nlm.nih.gov/pmc/articles/PMC477112824. Head Start Tool: https://eclkc.ohs.acf.hhs.gov/webinar/introducing-well-visit-
planner-tool-family-engagement-head-start-early-head-start-centers25. National Agenda: http://www.academicpedsjnl.net/article/S1876-2859(17)30354-
6/pdf
Citation: Bethell, CD, Davis, MB, Gombojav, N, Stumbo, S, Powers, K. Issue Brief: A national and across state profile on adverse childhood experiences among children and possibilities to heal and thrive. Johns Hopkins Bloomberg School of Public Health, October 2017. http://www.cahmi.org/projects/adverse-childhood-experiences-aces/
ABOUT THE DATA
The 2016 NSCH surveyed a representative sample of children ages 0–17 (50, 212 children, with representative samples per state). Child level household surveys were conducted with parents or guardians under the leadership of the Maternal and Child Health Bureau (MCHB) and implemented through the U.S. Bureau of the Census. Data were weighted to represent the population of noninstitutionalized children ages 0–17 nationally and in each state. With funding from MCHB, the Child and Adolescent Health Measurement Initiative (CAHMI), a national initiative based in the Johns Hopkins Bloomberg School of Public Health, partners with MCHB and the US Bureau of the Census to develop the NSCH and disseminates data files, variable coding and micro-data findings on its Data Resource Center website (www.childhealthdata.org). See the CAHMI Data Resource Center website’s NSCH Learn About the Survey information on the sampling, administration and content for the 2016 NSCH.
ABOUT THE STUDY
CAHMI used 2016 NSCH public use files to construct variables and conduct analysis and statistical tests for this study. The national and across state profile of adverse childhood experiences and opportunities to promoting healing and thriving largely represented updated results on previously published peer reviewed publications led by CAHMI using the 2011-12 NSCH. See references noted throughout this Issue Brief. Note that all differences in key variables by a child’s ACEs status reported here are statistically significant using standard tests of differences or regression analysis.
ACKNOWLEDGEMENTS
Work to conduct this study and prepare the issue brief report was supported through grants to CAHMI/JHU by the Children’s Hospital Association in partnership with AcademyHealth. The Robert Wood Johnson Foundation has supported the work of CAHMI to advance a national and state policy agenda to address ACEs and promote child well-being in children’s health services in the US, as set forth in a recently published national agenda for doing so.
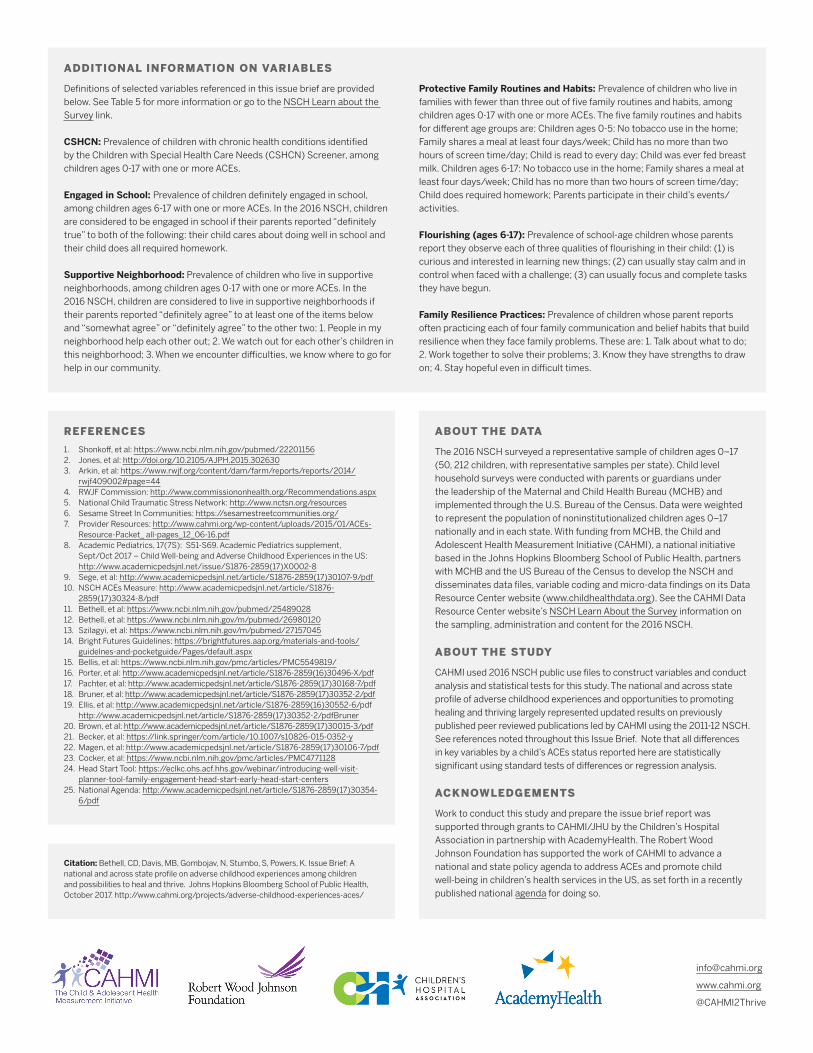
ADDITIONAL INFORMATION ON VARIABLES
Definitions of selected variables referenced in this issue brief are provided below. See Table 5 for more information or go to the NSCH Learn about the Survey link.
CSHCN: Prevalence of children with chronic health conditions identified by the Children with Special Health Care Needs (CSHCN) Screener, among children ages 0-17 with one or more ACEs.
Engaged in School: Prevalence of children definitely engaged in school, among children ages 6-17 with one or more ACEs. In the 2016 NSCH, children are considered to be engaged in school if their parents reported “definitely true” to both of the following: their child cares about doing well in school and their child does all required homework.
Supportive Neighborhood: Prevalence of children who live in supportive neighborhoods, among children ages 0-17 with one or more ACEs. In the 2016 NSCH, children are considered to live in supportive neighborhoods if their parents reported “definitely agree” to at least one of the items below and “somewhat agree” or “definitely agree” to the other two: 1. People in my neighborhood help each other out; 2. We watch out for each other’s children in this neighborhood; 3. When we encounter difficulties, we know where to go for help in our community.
Protective Family Routines and Habits: Prevalence of children who live in families with fewer than three out of five family routines and habits, among children ages 0-17 with one or more ACEs. The five family routines and habits for different age groups are: Children ages 0-5: No tobacco use in the home; Family shares a meal at least four days/week; Child has no more than two hours of screen time/day; Child is read to every day; Child was ever fed breast milk. Children ages 6-17: No tobacco use in the home; Family shares a meal at least four days/week; Child has no more than two hours of screen time/day; Child does required homework; Parents participate in their child’s events/activities.
Flourishing (ages 6-17): Prevalence of school-age children whose parents report they observe each of three qualities of flourishing in their child: (1) is curious and interested in learning new things; (2) can usually stay calm and in control when faced with a challenge; (3) can usually focus and complete tasks they have begun.
Family Resilience Practices: Prevalence of children whose parent reports often practicing each of four family communication and belief habits that build resilience when they face family problems. These are: 1. Talk about what to do; 2. Work together to solve their problems; 3. Know they have strengths to draw on; 4. Stay hopeful even in difficult times.
www.cahmi.org
@CAHMI2Thrive