2016 market report_midyear
TRANSCRIPT

Here is the housing report skinny from Linda O’Koniewski, CEO of RE/MAX Leading Edge. “The lack of inventory is feeding on itself. Folks are reluctant to put their house on the market to trade up or down if they are fearful a quality and worthy house won’t come along, or if it does, that they won’t be able to buy it because of competition. So that’s another house that isn’t up for sale in our market.”
Additionally, reports O’Koniewski, “Anecdotal reports of buyer remorse from our agents is at an all-time high. Buyers are second guessing what they are paying and how they had to give up some of their protection to secure a property. Homes with home inspections are falling apart, not because of unusual problems, because we are reselling them with full disclosure, but because buyers are suffering from commitment phobia. Almost like the single guy who finds the right woman, but just can’t go down the aisle. Our yenta skills are being challenged, as we resell the same home three or four times.”
Here’s the data…According to the RE/MAX Leading Edge Mid-Year Housing Report, lack of inventory has caused a decrease in overall housing sales. Sales of combined condo and single family homes in Massachusetts decreased 5.8% year-over-year. Inventory is down 15.5% year-over-year and prices have remained unchanged.
MASSACHUSETTS OVER THE PAST 6 MONTHS
LEADING EDGE
2016 MID-YEAR MARKET REPORT
Source: Single Family Sales, Active & Pending Trends for all of MA extracted on (06/13/16) via imaxwebsolutions.com Current period: 1/1/15-6/10/16
UNITS SOLD 26,893
-5.8%
INVENTORY 64,072
-15.5%
DAYS ON MARKET 81
-1.2%
MEDIAN SALE $ $335,000
0%
PENDING SALES 32,922
-3.6%

UNITS
-20.7%
MEDIAN $
+7.8%
MEDIAN $
-14.5%
UNITS
-17.7%
BACK BAY 2016 2015
BEACON HILL 2016 2015
CHARLESTOWN 2016 2015
DORCHESTER 2016 2015
UNITS 153 186
INVENTORY 327 373
DOM 63 51
MEDIAN $ $1,025,000 $1,200,000
PENDING 173 221
UNITS 65 82
INVENTORY 153 151
DOM 51 47
MEDIAN $ $799,000 $740,650
PENDING 77 84
UNITS 94 82
INVENTORY 182 236
DOM 43 39
MEDIAN $ $680,000 $651,250
PENDING 128 173
UNITS 94 86
INVENTORY 181 228
DOM 45 60
MEDIAN $ $371,000 $345,000
PENDING 103 120
MEDIAN $
+4.4%
UNITS
-36%
UNITS
+9.3%
MEDIAN $
+7.5%
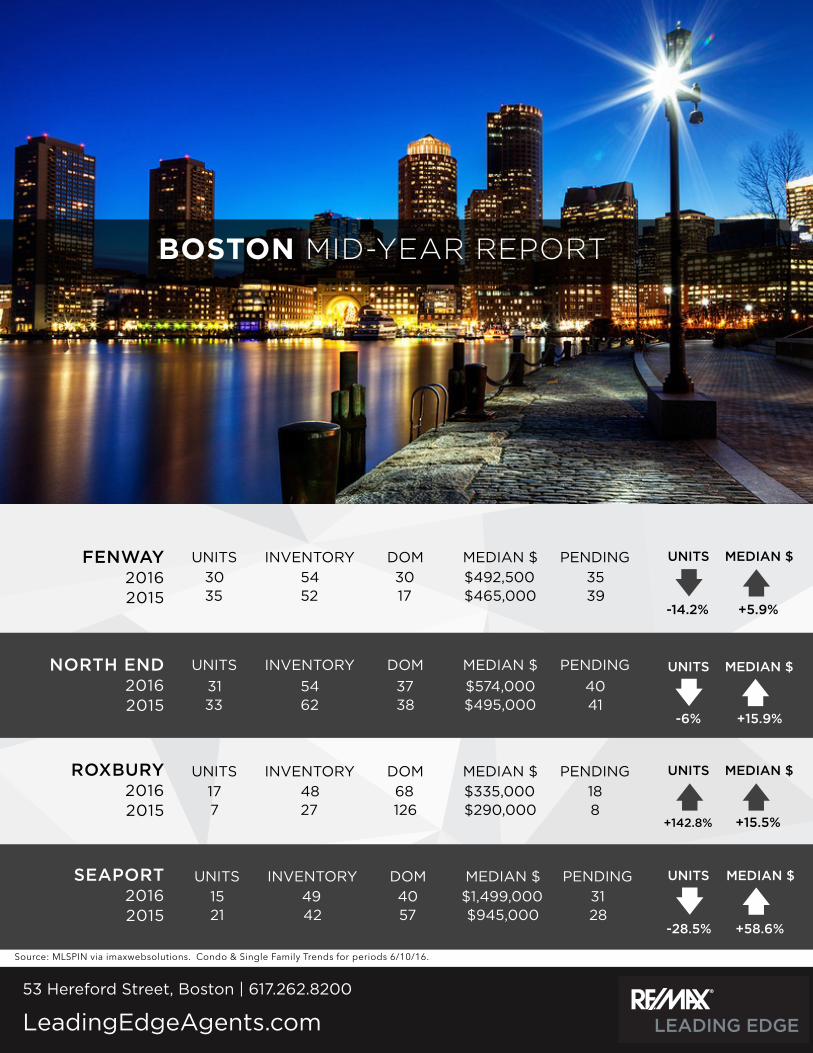
BOSTON MID-YEAR REPORT
LEADING EDGE
53 Hereford Street, Boston | 617.262.8200
LeadingEdgeAgents.com
Source: MLSPIN via imaxwebsolutions. Condo & Single Family Trends for periods 6/10/16.
UNITS
-6%
MEDIAN $
+15.9%
MEDIAN $
+5.9%
UNITS
-14.2%
FENWAY 2016 2015
NORTH END 2016 2015
ROXBURY 2016 2015
SEAPORT 2016 2015
UNITS 30 35
INVENTORY 54 52
DOM 30 17
MEDIAN $ $492,500 $465,000
PENDING 35 39
UNITS 31 33
INVENTORY 54 62
DOM 37 38
MEDIAN $ $574,000 $495,000
PENDING 40 41
UNITS 17 7
INVENTORY 48 27
DOM 68 126
MEDIAN $ $335,000 $290,000
PENDING 18 8
UNITS 15 21
INVENTORY 49 42
DOM 40 57
MEDIAN $ $1,499,000 $945,000
PENDING 31 28
MEDIAN $
+15.5%
UNITS
+142.8%
UNITS
-28.5%
MEDIAN $
+58.6%
BOSTON MID-YEAR REPORT
LEADING EDGE
53 Hereford Street, Boston | 617.262.8200
LeadingEdgeAgents.com
Source: MLSPIN via imaxwebsolutions. Condo & Single Family Trends for periods 6/10/16.

UNITS
-17.3%
MEDIAN $
+12%
MEDIAN $
+5%
UNITS
-10.7%
SOUTH END 2016 2015
SOUTH BOSTON 2016 2015
WATERFRONT 2016 2015
WEST ROXBURY 2016 2015
UNITS 225 252
INVENTORY 395 447
DOM 39 43
MEDIAN $ $840,000 $800,000
PENDING 280 317
UNITS 229 277
INVENTORY 384 552
DOM 47 49
MEDIAN $ $610,500 $545,000
PENDING 277 356
UNITS 58 62
INVENTORY 139 129
DOM 61 66
MEDIAN $ $849,000 $856,500
PENDING 67 77
UNITS 112 130
INVENTORY 199 230
DOM 49 48
MEDIAN $ $460,000 $425,000
PENDING 135 159
MEDIAN $
-0.8%
UNITS
-6.4%
UNITS
-13.8%
MEDIAN $
+8.2%
BOSTON MID-YEAR REPORT
LEADING EDGE
53 Hereford Street, Boston | 617.262.8200
LeadingEdgeAgents.com
Source: MLSPIN via imaxwebsolutions. Condo & Single Family Trends for periods 6/10/16.

MEDIAN SALE PRICE -2.3%
AVERAGE DAYS ON MARKET +5.8%
PENDING SALES -11.1%
NUMBER OF UNITS SOLD -19.3%2016
2015
TOTAL INVENTORY -8%1 10 100
100 UNITS
124 UNITS
ARLINGTON MID-YEAR REPORT | SINGLE FAMILIES
2016
2015
184 UNITS
200 UNITS
2016
2015
1000 1000000
$673,500
$689,500
2016
2015
36 DAYS
34 DAYS
2016
2015
10 100
143 UNITS
161 UNITS
319 Massachusetts Ave, Arlington | 781.643.0430
LeadingEdgeAgents.com LEADING EDGE
Source: MLSPIN via imaxwebsolutions. Single Family Trends for period ending 6/10/16.

MEDIAN SALE PRICE +6.4%
AVERAGE DAYS ON MARKET 0%
PENDING SALES -4%
NUMBER OF UNITS SOLD +9.2%2016
2015
TOTAL INVENTORY -3.3%10 100
1 18 UNITS
108 UNITS
ARLINGTON MID-YEAR REPORT | CONDOMINIUMS
2016
2015
174 UNITS
180 UNITS
2016
2015
1000 1000000
$504,750
$474,300
2016
2015
22 DAYS
22 DAYS
2016
2015
10 100
142 UNITS
148 UNITS
319 Massachusetts Ave, Arlington | 781.643.0430
LeadingEdgeAgents.com LEADING EDGE
Source: MLSPIN via imaxwebsolutions. Condo Trends for period ending 6/10/16.

MEDIAN SALE PRICE +5%
AVERAGE DAYS ON MARKET 0%
PENDING SALES -28.5%
NUMBER OF UNITS SOLD -14.8%2016
2015
TOTAL INVENTORY -18.1%10 100
46 UNITS
54 UNITS
BELMONT MID-YEAR REPORT | SINGLE FAMILIES
2016
2015
99 UNITS
121 UNITS
2016
2015
1000 1000000
$935,000
$890,000
2016
2015
55 DAYS
55 DAYS
2016
2015
1 10 100
60 UNITS
84 UNITS
LeadingEdgeAgents.com LEADING EDGE
Source: MLSPIN via imaxwebsolutions. Single Family Trends for period ending 6/10/16.

MEDIAN SALE PRICE +7.7%
AVERAGE DAYS ON MARKET +10.5%
PENDING SALES -13.4%
NUMBER OF UNITS SOLD -9.5%2016
2015
TOTAL INVENTORY -14.6%10 100
38 UNITS
42 UNITS
BELMONT MID-YEAR REPORT | CONDOMINIUMS
2016
2015
64 UNITS
75 UNITS
2016
2015
1000 1000000
$520,000
$482,750
2016
2015
42 DAYS
38 DAYS
2016
2015
10 100
45 UNITS
52 UNITS
LeadingEdgeAgents.com LEADING EDGE
Source: MLSPIN via imaxwebsolutions. Condo Trends for period ending 6/10/16.

MEDIAN SALE PRICE +2.2%
AVERAGE DAYS ON MARKET +5.1%
PENDING SALES -33.3%
NUMBER OF UNITS SOLD +28.5%2016
2015
TOTAL INVENTORY -35.2%1 10 100
9 UNITS
7 UNITS
BELMONT MID-YEAR REPORT | MULTI FAMILIES
2016
2015
1 1 UNITS
17 UNITS
2016
2015
1000 1000000
$900,000
$880,000
2016
2015
41 DAYS
39 DAYS
2016
2015
1 10 100
8 UNITS
12 UNITS
LeadingEdgeAgents.com LEADING EDGE
Source: MLSPIN via imaxwebsolutions. Multi Family Trends for period ending 6/10/16.

MEDIAN SALE PRICE +21.1%
AVERAGE DAYS ON MARKET +2.9%
PENDING SALES -29.5%
NUMBER OF UNITS SOLD -26.9%2016
2015
TOTAL INVENTORY -14.9%1 10 100
38 UNITS
52 UNITS
CAMBRIDGE MID-YEAR REPORT | SINGLE FAMILIES
2016
2015
91 UNITS
107 UNITS
2016
2015
1 1000 1000000
$1,712,500
$1 ,413,500
2016
2015
35 DAYS
34 DAYS
2016
2015
1 10 100
50 UNITS
71 UNITS
LeadingEdgeAgents.comLEADING EDGE
Source: MLSPIN via imaxwebsolutions. Single Family Trends for period ending 6/10/16.

MEDIAN SALE PRICE +16.2%
AVERAGE DAYS ON MARKET -6.4%
PENDING SALES -4.4%
NUMBER OF UNITS SOLD -6.1%2016
2015
TOTAL INVENTORY -7.7%10 100
230 UNITS
245 UNITS
CAMBRIDGE MID-YEAR REPORT | CONDOMINIUMS
2016
2015
407 UNITS
441 UNITS
2016
2015
1000 1000000
$715,000
$615,000
2016
2015
29 DAYS
31 DAYS
2016
2015
10 100
304 UNITS
318 UNITS
LeadingEdgeAgents.comLEADING EDGE
Source: MLSPIN via imaxwebsolutions. Condo Trends for period ending 6/10/16.

MEDIAN SALE PRICE +4.4%
AVERAGE DAYS ON MARKET +3%
PENDING SALES 0%
NUMBER OF UNITS SOLD +11.4%2016
2015
TOTAL INVENTORY +11.4%10 100
39 UNITS
35 UNITS
CAMBRIDGE MID-YEAR REPORT | MULTI FAMILIES
2016
2015
78 UNITS
70 UNITS
2016
2015
1000 1000000
$1,201 ,500
$1 ,150,000
2016
2015
34 DAYS
33 DAYS
2016
20151 10 100
43 UNITS
43 UNITS
LeadingEdgeAgents.comLEADING EDGE
Source: MLSPIN via imaxwebsolutions. Multi Family Trends for period ending 6/10/16.
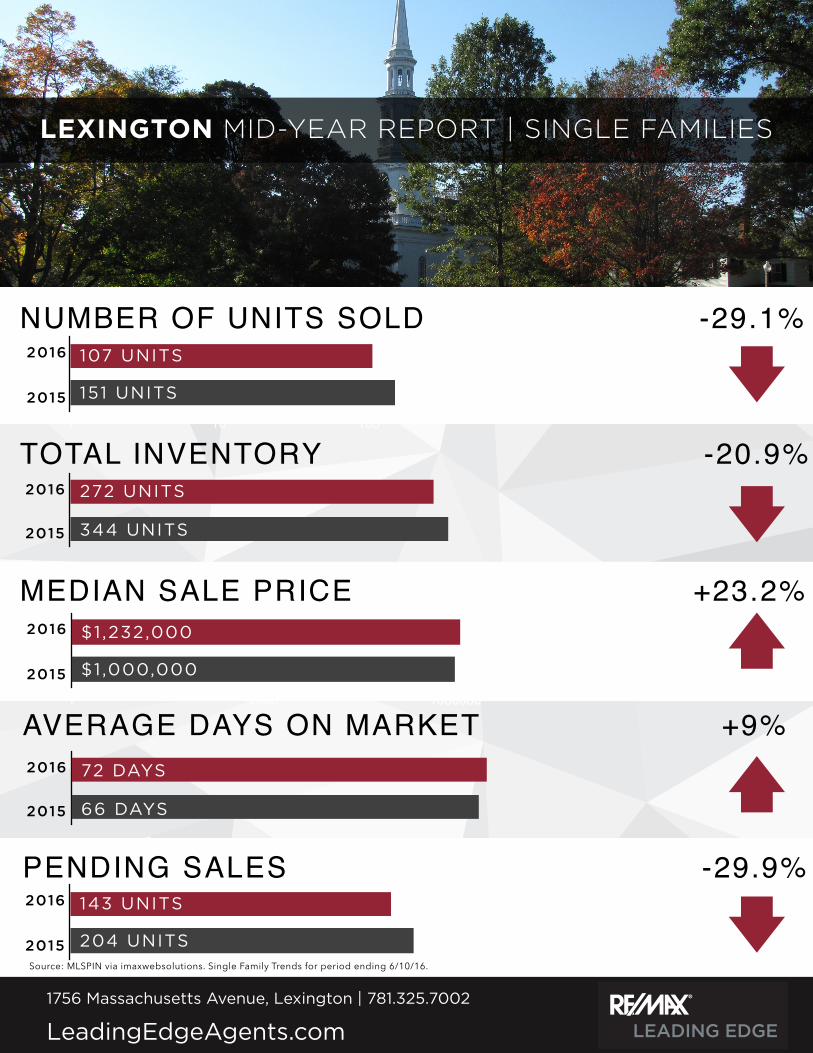
MEDIAN SALE PRICE +23.2%
AVERAGE DAYS ON MARKET +9%
PENDING SALES -29.9%
NUMBER OF UNITS SOLD -29.1%2016
2015
TOTAL INVENTORY -20.9%1 10 100
107 UNITS
151 UNITS
LEXINGTON MID-YEAR REPORT | SINGLE FAMILIES
2016
2015
272 UNITS
344 UNITS
2016
2015
1 1000 1000000
$1,232,000
$1 ,000,000
2016
2015
72 DAYS
66 DAYS
2016
2015
1 10 100
143 UNITS
204 UNITS
1756 Massachusetts Avenue, Lexington | 781.325.7002
LeadingEdgeAgents.com LEADING EDGE
Source: MLSPIN via imaxwebsolutions. Single Family Trends for period ending 6/10/16.
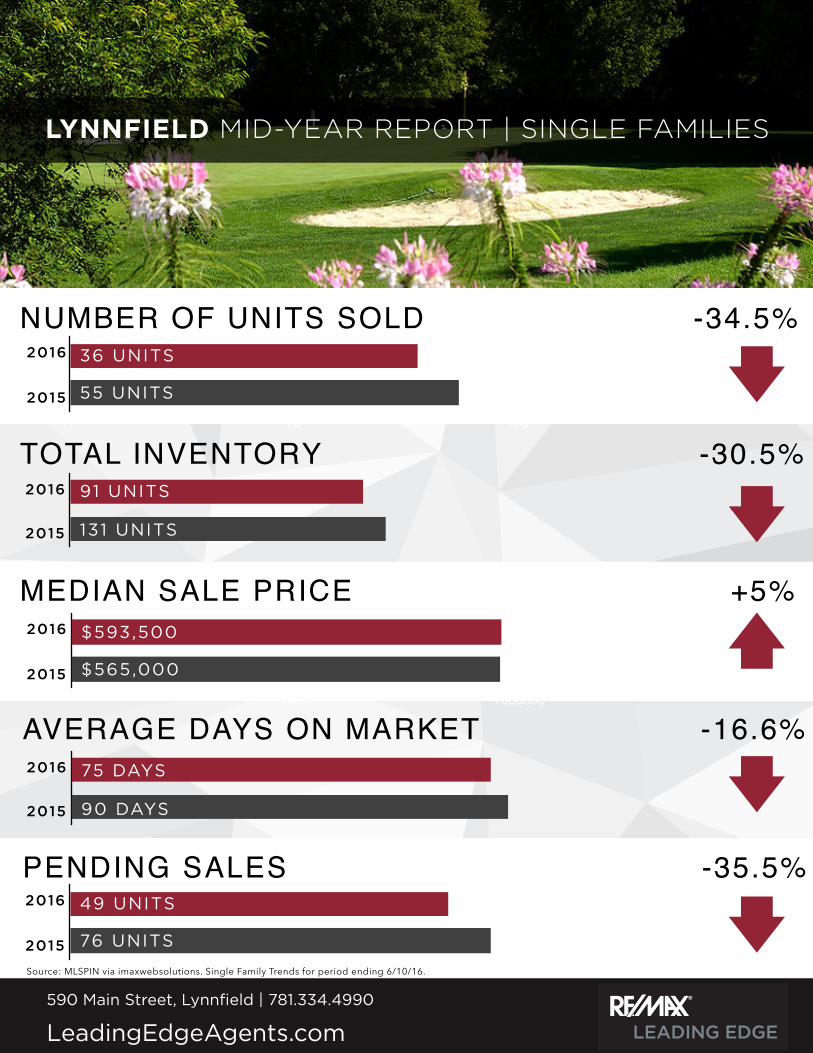
MEDIAN SALE PRICE +5%
AVERAGE DAYS ON MARKET -16.6%
PENDING SALES -35.5%
NUMBER OF UNITS SOLD -34.5%2016
2015
TOTAL INVENTORY -30.5%1 10 100
36 UNITS
55 UNITS
LYNNFIELD MID-YEAR REPORT | SINGLE FAMILIES
2016
2015
91 UNITS
131 UNITS
2016
2015
1000 1000000
$593,500
$565,000
2016
2015
75 DAYS
90 DAYS
2016
2015
1 10 100
49 UNITS
76 UNITS
590 Main Street, Lynnfield | 781.334.4990
LeadingEdgeAgents.com LEADING EDGE
Source: MLSPIN via imaxwebsolutions. Single Family Trends for period ending 6/10/16.

MEDIAN SALE PRICE +2.1%
AVERAGE DAYS ON MARKET +10%
PENDING SALES -19%
NUMBER OF UNITS SOLD -20.4%2016
2015
TOTAL INVENTORY -27.7%1 10 100
97 UNITS
122 UNITS
MEDFORD MID-YEAR REPORT | SINGLE FAMILIES
2016
2015
156 UNITS
216 UNITS
2016
2015
1000 1000000
$481,000
$471 ,000
2016
2015
44 DAYS
40 DAYS
2016
2015
1 10 100
1 15 UNITS
142 UNITS
LeadingEdgeAgents.com LEADING EDGE
Source: MLSPIN via imaxwebsolutions. Single Family Trends for period ending 6/10/16.

MEDIAN SALE PRICE +9.4%
AVERAGE DAYS ON MARKET -10%
PENDING SALES +4.1%
NUMBER OF UNITS SOLD -20.9%2016
2015
TOTAL INVENTORY -2.8%1 10 100
68 UNITS
86 UNITS
MEDFORD MID-YEAR REPORT | CONDOMINIUMS
2016
2015
136 UNITS
140 UNITS
2016
2015
1000 1000000
$416,000
$380,140
2016
2015
36 DAYS
40 DAYS
2016
2015
10 100
100 UNITS
96 UNITS
LeadingEdgeAgents.com LEADING EDGE
Source: MLSPIN via imaxwebsolutions. Condo Trends for period ending 6/10/16.

MEDIAN SALE PRICE +2.2%
AVERAGE DAYS ON MARKET -17.3%
PENDING SALES +15%
NUMBER OF UNITS SOLD +41.3%2016
2015
TOTAL INVENTORY -6.2%1 10 100
41 UNITS
29 UNITS
MEDFORD MID-YEAR REPORT | MULTI FAMILIES
2016
2015
60 UNITS
64 UNITS
2016
2015
1000 1000000
$616,000
$602,600
2016
2015
43 DAYS
52 DAYS
2016
2015
10 100
46 UNITS
40 UNITS
LeadingEdgeAgents.com LEADING EDGE
Source: MLSPIN via imaxwebsolutions. Multi Family Trends for period ending 6/10/16.

MEDIAN SALE PRICE +11.7%
AVERAGE DAYS ON MARKET +25.7%
PENDING SALES -1.6%
NUMBER OF UNITS SOLD +24.3%2016
2015
TOTAL INVENTORY -14.2%1 10 100
102 UNITS
82 UNITS
MELROSE MID-YEAR REPORT | SINGLE FAMILIES
2016
2015
150 UNITS
175 UNITS
2016
2015
1000 1000000
$546,000
$488,500
2016
2015
44 DAYS
35 DAYS
2016
2015
10 100
1 17 UNITS
119 UNITS
536 Main Street, Melrose | 781.979.0100
LeadingEdgeAgents.com LEADING EDGE
Source: MLSPIN via imaxwebsolutions. Single Family Trends for period ending 6/10/16.

MEDIAN SALE PRICE -2.8%
AVERAGE DAYS ON MARKET -13.4%
PENDING SALES -11.7%
NUMBER OF UNITS SOLD -21.1%2016
2015
TOTAL INVENTORY -9.8%1 10 100
205 UNITS
260 UNITS
NEWTON MID-YEAR REPORT | SINGLE FAMILIES
2016
2015
540 UNITS
599 UNITS
2016
2015
1000 1000000
$1,165,000
$1 ,198,568
2016
2015
45 DAYS
52 DAYS
2016
2015
10 100
292 UNITS
331 UNITS
294 Walnut Street, Newton | 617.244.4499
LeadingEdgeAgents.com LEADING EDGE
Source: MLSPIN via imaxwebsolutions. Single Family Trends for period ending 6/10/16.

MEDIAN SALE PRICE -5.3%
AVERAGE DAYS ON MARKET +40.5%
PENDING SALES -27.9%
NUMBER OF UNITS SOLD -24.5%2016
2015
TOTAL INVENTORY -26%1 10 100
83 UNITS
110 UNITS
READING MID-YEAR REPORT | SINGLE FAMILIES
2016
2015
142 UNITS
192 UNITS
2016
2015
1 1000 1000000
$486,000
$513,250
2016
2015
52 DAYS
37 DAYS
2016
2015
1 10 100
98 UNITS
136 UNITS
248 Main Street, Reading | 781.944.6060
LeadingEdgeAgents.com LEADING EDGE
Source: MLSPIN via imaxwebsolutions. Single Family Trends for period ending 6/10/16.
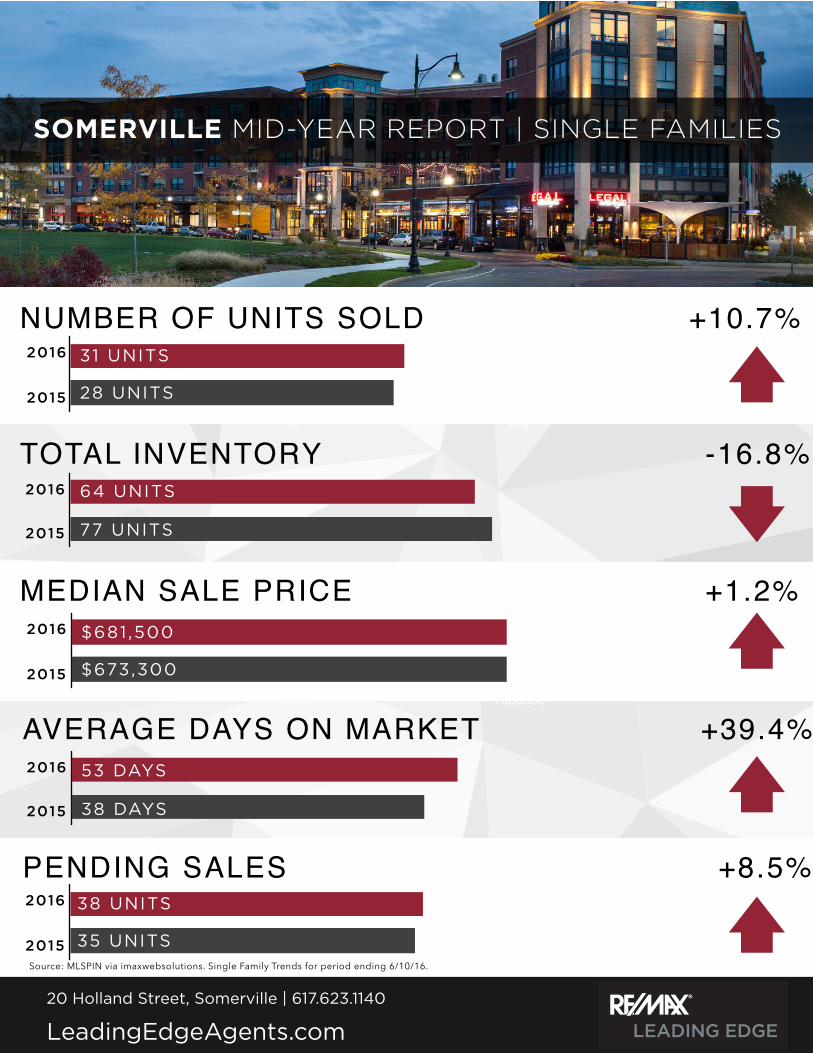
MEDIAN SALE PRICE +1.2%
AVERAGE DAYS ON MARKET +39.4%
PENDING SALES +8.5%
NUMBER OF UNITS SOLD +10.7%2016
2015
TOTAL INVENTORY -16.8%10 100
31 UNITS
28 UNITS
SOMERVILLE MID-YEAR REPORT | SINGLE FAMILIES
2016
2015
64 UNITS
77 UNITS
2016
2015
1000 1000000
$681,500
$673,300
2016
2015
53 DAYS
38 DAYS
2016
2015
10 100
38 UNITS
35 UNITS
20 Holland Street, Somerville | 617.623.1140
LeadingEdgeAgents.com LEADING EDGE
Source: MLSPIN via imaxwebsolutions. Single Family Trends for period ending 6/10/16.

MEDIAN SALE PRICE +10.8%
AVERAGE DAYS ON MARKET -2.6%
PENDING SALES +1.4%
NUMBER OF UNITS SOLD +6.4%2016
2015
TOTAL INVENTORY 0%10 100
183 UNITS
172 UNITS
SOMERVILLE MID-YEAR REPORT | CONDOMINIUMS
2016
2015
303 UNITS
303 UNITS
2016
2015
1000 1000000
$609,650
$550,000
2016
2015
37 DAYS
38 DAYS
2016
2015
10 100
213 UNITS
210 UNITS
20 Holland Street, Somerville | 617.623.1140
LeadingEdgeAgents.com LEADING EDGE
Source: MLSPIN via imaxwebsolutions. Condo Trends for period ending 6/10/16.

MEDIAN SALE PRICE +5%
AVERAGE DAYS ON MARKET +60.5%
PENDING SALES -1.3%
NUMBER OF UNITS SOLD -3.2%2016
2015
TOTAL INVENTORY -3.2%10 100
67 UNITS
60 UNITS
SOMERVILLE MID-YEAR REPORT | MULTI FAMILIES
2016
2015
120 UNITS
124 UNITS
2016
2015
1000 1000000
$900,000
$857,000
2016
2015
61 DAYS
38 DAYS
2016
2015
10 100
71 UNITS
72 UNITS
20 Holland Street, Somerville | 617.623.1140
LeadingEdgeAgents.com LEADING EDGE
Source: MLSPIN via imaxwebsolutions. Multi Family Trends for period ending 6/10/16.

MEDIAN SALE PRICE -0.8%
AVERAGE DAYS ON MARKET -12.7%
PENDING SALES -12.2%
NUMBER OF UNITS SOLD -2.5%2016
2015
TOTAL INVENTORY -17.2%10 100
76 UNITS
78 UNITS
STONEHAM MID-YEAR REPORT | SINGLE FAMILIES
2016
2015
1 15 UNITS
139 UNITS
2016
2015
1000 1000000
$460,500
$464,250
2016
2015
55 DAYS
63 DAYS
2016
2015
10 100
79 UNITS
90 UNITS
LeadingEdgeAgents.com LEADING EDGE
Source: MLSPIN via imaxwebsolutions. Single Family Trends for period ending 6/10/16.

MEDIAN SALE PRICE +3.6%
AVERAGE DAYS ON MARKET 0%
PENDING SALES -21.1%
NUMBER OF UNITS SOLD -2.5%2016
2015
TOTAL INVENTORY -31.7%1 10 100
78 UNITS
80 UNITS
WAKEFIELD MID-YEAR REPORT | SINGLE FAMILIES
2016
2015
127 UNITS
186 UNITS
2016
2015
1 10 100
$472,000
$455,500
2016
2015
43 DAYS
43 DAYS
2016
2015
1 10 100
82 UNITS
104 UNITS
25 Tuttle Street, Wakefield | 781.245.8100
LeadingEdgeAgents.com LEADING EDGE
Source: MLSPIN via imaxwebsolutions. Single Family Trends for period ending 6/10/16.

MEDIAN SALE PRICE +9.3%
AVERAGE DAYS ON MARKET -9.8%
PENDING SALES -5.2%
NUMBER OF UNITS SOLD -11.2%2016
2015
TOTAL INVENTORY -14.9%10 100
134 UNITS
151 UNITS
WALTHAM MID-YEAR REPORT | SINGLE FAMILIES
2016
2015
227 UNITS
267 UNITS
2016
2015
1000 1000000
$508,500
$465,000
2016
2015
46 DAYS
51 DAYS
2016
2015
10 100
164 UNITS
173 UNITS
LeadingEdgeAgents.com LEADING EDGE
Source: MLSPIN via imaxwebsolutions. Single Family Trends for period ending 6/10/16.

MEDIAN SALE PRICE +16.2%
AVERAGE DAYS ON MARKET +25%
PENDING SALES 0%
NUMBER OF UNITS SOLD 0%2016
2015
TOTAL INVENTORY -10.8%1 10 100
1 12 UNITS
112 UNITS
WALTHAM MID-YEAR REPORT | CONDOMINIUMS
2016
2015
180 UNITS
202 UNITS
2016
2015
1000 1000000
$436,000
$375,000
2016
2015
45 DAYS
36 DAYS
2016
2015
1 10 100
145 UNITS
145 UNITS
LeadingEdgeAgents.com LEADING EDGE
Source: MLSPIN via imaxwebsolutions. Condo Trends for period ending 6/10/16.

MEDIAN SALE PRICE +6.4%
AVERAGE DAYS ON MARKET +47.3%
PENDING SALES -46.1%
NUMBER OF UNITS SOLD +47.8%2016
2015
TOTAL INVENTORY -30.9%1 10 100
12 UNITS
23 UNITS
WALTHAM MID-YEAR REPORT | MULTI FAMILIES
2016
2015
29 UNITS
42 UNITS
2016
2015
1000 1000000
$596,250
$560,000
2016
2015
56 DAYS
38 DAYS
2016
2015
1 10 100
14 UNITS
26 UNITS
LeadingEdgeAgents.com LEADING EDGE
Source: MLSPIN via imaxwebsolutions. Multi Family Trends for period ending 6/10/16.

MEDIAN SALE PRICE +1.4%
AVERAGE DAYS ON MARKET -12.8%
PENDING SALES -5.8%
NUMBER OF UNITS SOLD -4.7%2016
2015
TOTAL INVENTORY -1.4%10 100
40 UNITS
42 UNITS
WATERTOWN MID-YEAR REPORT | SINGLE FAMILIES
2016
2015
68 UNITS
69 UNITS
2016
2015
1000 1000000
$620,000
$611 ,250
2016
2015
34 DAYS
39 DAYS
2016
2015
10 100
48 UNITS
51 UNITS
142 Galen Street, Watertown | 617.926.5400
LeadingEdgeAgents.com LEADING EDGE
Source: MLSPIN via imaxwebsolutions. Single Family Trends for period ending 6/10/16.

MEDIAN SALE PRICE +6.3%
AVERAGE DAYS ON MARKET +2.7%
PENDING SALES +11.6%
NUMBER OF UNITS SOLD +24.3%2016
2015
TOTAL INVENTORY -1.8%1 10 100
102 UNITS
82 UNITS
WATERTOWN MID-YEAR REPORT | CONDOMINIUMS
2016
2015
160 UNITS
163 UNITS
2016
2015
1000 1000000
$452,000
$425,000
2016
2015
37 DAYS
36 DAYS
2016
2015
10 100
125 UNITS
112 UNITS
142 Galen Street, Watertown | 617.926.5400
LeadingEdgeAgents.com LEADING EDGE
Source: MLSPIN via imaxwebsolutions. Condo Trends for period ending 6/10/16.
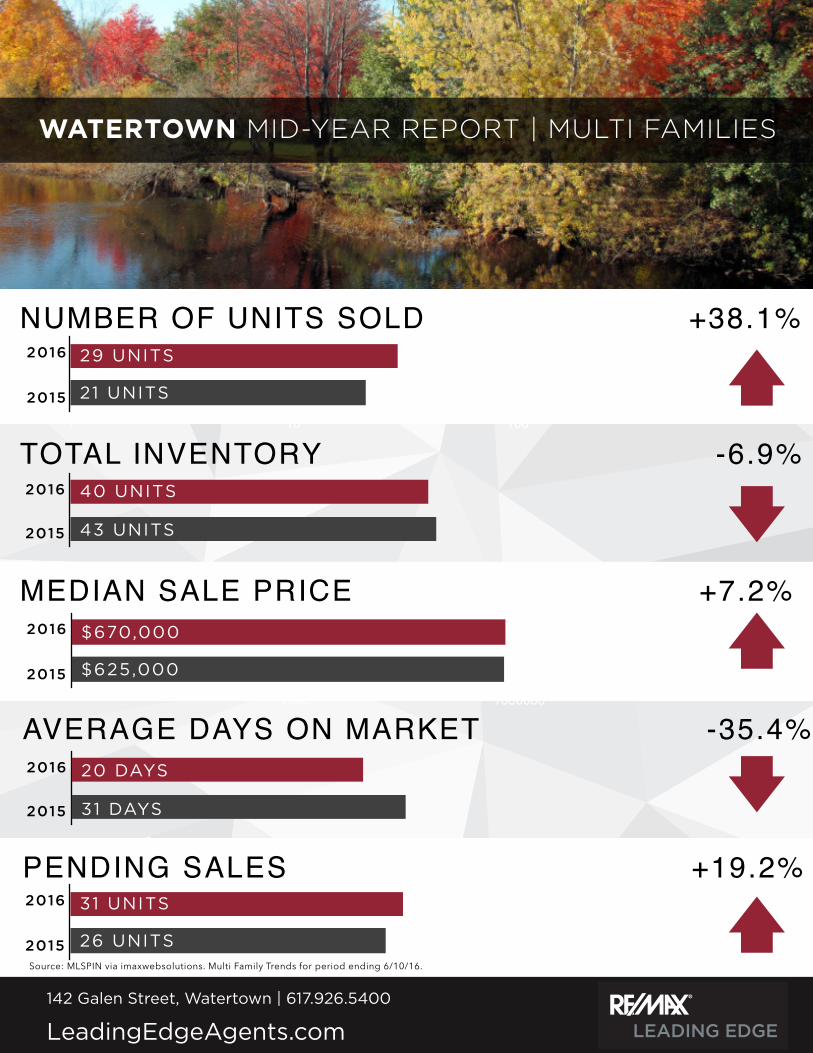
MEDIAN SALE PRICE +7.2%
AVERAGE DAYS ON MARKET -35.4%
PENDING SALES +19.2%
NUMBER OF UNITS SOLD +38.1%2016
2015
TOTAL INVENTORY -6.9%1 10 100
29 UNITS
21 UNITS
WATERTOWN MID-YEAR REPORT | MULTI FAMILIES
2016
2015
40 UNITS
43 UNITS
2016
2015
1000 1000000
$670,000
$625,000
2016
2015
20 DAYS
31 DAYS
2016
2015
10 100
31 UNITS
26 UNITS
142 Galen Street, Watertown | 617.926.5400
LeadingEdgeAgents.com LEADING EDGE
Source: MLSPIN via imaxwebsolutions. Multi Family Trends for period ending 6/10/16.
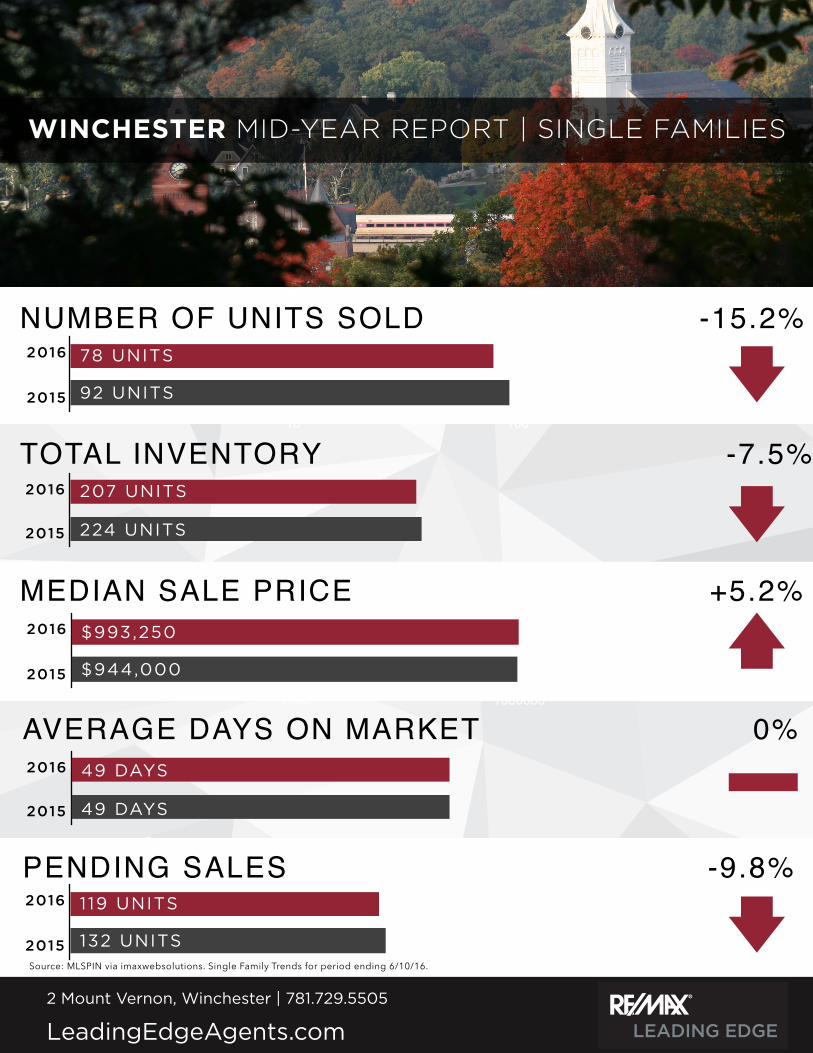
MEDIAN SALE PRICE +5.2%
AVERAGE DAYS ON MARKET 0%
PENDING SALES -9.8%
NUMBER OF UNITS SOLD -15.2%2016
2015
TOTAL INVENTORY -7.5%10 100
78 UNITS
92 UNITS
WINCHESTER MID-YEAR REPORT | SINGLE FAMILIES
2016
2015
207 UNITS
224 UNITS
2016
2015
1000 1000000
$993,250
$944,000
2016
2015
49 DAYS
49 DAYS
2016
2015
10 100
1 19 UNITS
132 UNITS
2 Mount Vernon, Winchester | 781.729.5505
LeadingEdgeAgents.com LEADING EDGE
Source: MLSPIN via imaxwebsolutions. Single Family Trends for period ending 6/10/16.