2016: issue 533, week: 27th - 30th june wise m ney : 91-33-39847000 fax no : 91-33-39847004...
TRANSCRIPT

WISE M NEY2016: Issue 533, Week: 27th - 30th June
A Weekly Update from SMC(For private circulation only)
Let Your Life Lightly DanceOn The Edges Of TimeLike Dew On The Tip Of A Leaf.
Bra
nd
sm
c 3
57

Contents
Equity 4-7
Derivatives 8-9
Commodity 10-13
Currency 14
IPO 15
FD Monitor 16
Insurance 17
Mutual Fund 18
SMC RESEARCH TEAMREGISTERED OFFICES:
11 / 6B, Shanti Chamber, Pusa Road, New Delhi 110005.
Tel: 91-11-30111000, Fax: 91-11-25754365
MUMBAI OFFICE:
Dheeraj Sagar, 1st Floor, Opp. Goregaon sports Club, Link Road
Malad (West), Mumbai 400064
Tel: 91-22-67341600, Fax: 91-22-28805606
KOLKATA OFFICE:
18,Rabindra Sarani, Poddar Court, Gate No-4,5th Floor, Kolkata-700001
Tel : 91-33-39847000 Fax No : 91-33-39847004
AHMEDABAD OFFICE :
10/A, 4th Floor, Kalapurnam Building, Near Municipal Market,
C G Road, Ahmedabad-380009, Gujarat
Tel : 91-79-26424801 - 05, 40049801 - 03
CHENNAI OFFICE:
Salzburg Square, Flat No.1, III rd Floor, Door No.107, Harrington Road,
Chetpet, Chennai - 600031.
Tel: 044-39109100, Fax -044- 39109111
SECUNDERABAD OFFICE:
206, 3rd Floor, above CMR Exclusive, Bhuvana Towers, S.D.Road,
Secunderabad - 500003
Tel: 91-40-30780298/99, 39109536
DUBAI OFFICE:
312, Belshalat Building, Al Karama, Dubai, P.O. Box 117210, U.A.E.
Tel: 97143963120, Mobile : 971502612483
Fax : 9714 3963122
Email ID : [email protected]
Printed and Published on behalf of
Mr. Saurabh Jain @ Publication Address
11/6B, Shanti Chamber, Pusa Road, New Delhi-110005
Website: www.smcindiaonline.com
Investor Grievance : [email protected]
Printed at: S&S MARKETING
102, Mahavirji Complex LSC-3, Rishabh Vihar, New Delhi - 110092 (India)
Ph.: +91-11- 43035012, 43035014, Email: [email protected]
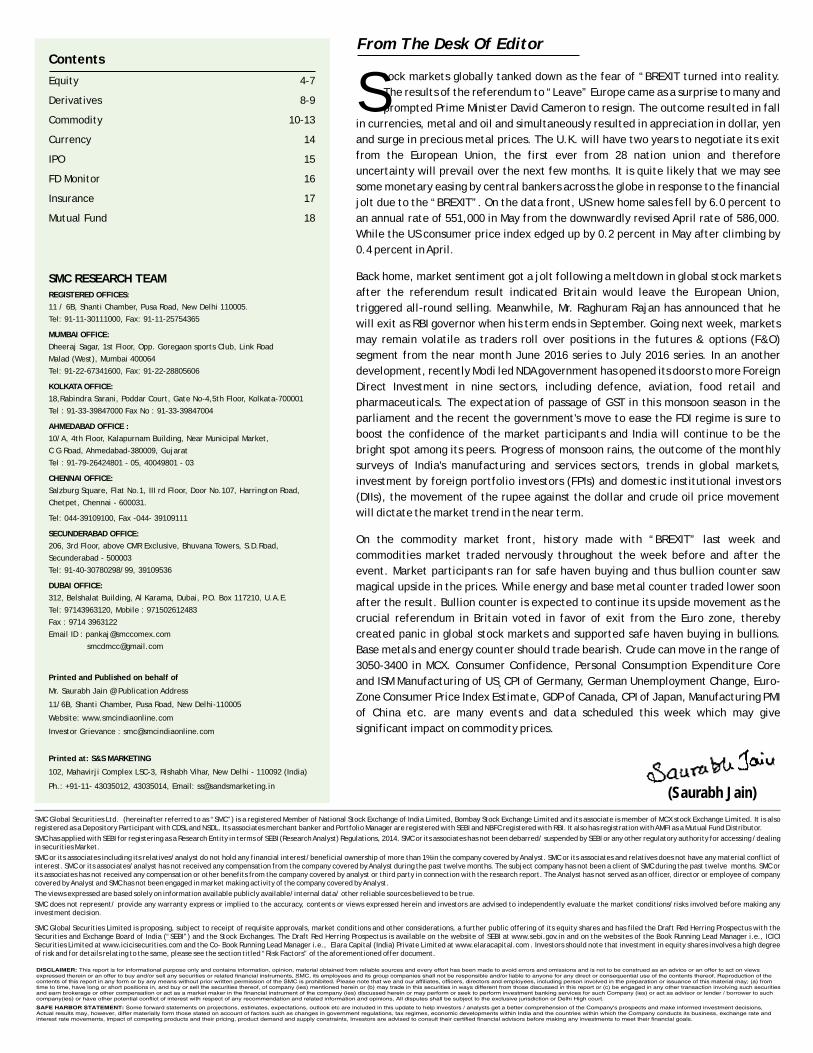
tock markets globally tanked down as the fear of “BREXIT turned into reality.
The results of the referendum to “Leave” Europe came as a surprise to many and Sprompted Prime Minister David Cameron to resign. The outcome resulted in fall
in currencies, metal and oil and simultaneously resulted in appreciation in dollar, yen
and surge in precious metal prices. The U.K. will have two years to negotiate its exit
from the European Union, the first ever from 28 nation union and therefore
uncertainty will prevail over the next few months. It is quite likely that we may see
some monetary easing by central bankers across the globe in response to the financial
jolt due to the “BREXIT”. On the data front, US new home sales fell by 6.0 percent to
an annual rate of 551,000 in May from the downwardly revised April rate of 586,000.
While the US consumer price index edged up by 0.2 percent in May after climbing by
0.4 percent in April.
Back home, market sentiment got a jolt following a meltdown in global stock markets
after the referendum result indicated Britain would leave the European Union,
triggered all-round selling. Meanwhile, Mr. Raghuram Rajan has announced that he
will exit as RBI governor when his term ends in September. Going next week, markets
may remain volatile as traders roll over positions in the futures & options (F&O)
segment from the near month June 2016 series to July 2016 series. In an another
development, recently Modi led NDA government has opened its doors to more Foreign
Direct Investment in nine sectors, including defence, aviation, food retail and
pharmaceuticals. The expectation of passage of GST in this monsoon season in the
parliament and the recent the government's move to ease the FDI regime is sure to
boost the confidence of the market participants and India will continue to be the
bright spot among its peers. Progress of monsoon rains, the outcome of the monthly
surveys of India's manufacturing and services sectors, trends in global markets,
investment by foreign portfolio investors (FPIs) and domestic institutional investors
(DIIs), the movement of the rupee against the dollar and crude oil price movement
will dictate the market trend in the near term.
On the commodity market front, history made with “BREXIT” last week and
commodities market traded nervously throughout the week before and after the
event. Market participants ran for safe haven buying and thus bullion counter saw
magical upside in the prices. While energy and base metal counter traded lower soon
after the result. Bullion counter is expected to continue its upside movement as the
crucial referendum in Britain voted in favor of exit from the Euro zone, thereby
created panic in global stock markets and supported safe haven buying in bullions.
Base metals and energy counter should trade bearish. Crude can move in the range of
3050-3400 in MCX. Consumer Confidence, Personal Consumption Expenditure Core
and ISM Manufacturing of US¸CPI of Germany, German Unemployment Change, Euro-
Zone Consumer Price Index Estimate, GDP of Canada, CPI of Japan, Manufacturing PMI
of China etc. are many events and data scheduled this week which may give
significant impact on commodity prices.
From The Desk Of Editor
(Saurabh Jain)
SMC Global Securities Limited is proposing, subject to receipt of requisite approvals, market conditions and other considerations, a further public offering of its equity shares and has filed the Draft Red Herring Prospectus with the Securities and Exchange Board of India (“SEBI”) and the Stock Exchanges. The Draft Red Herring Prospectus is available on the website of SEBI at www.sebi.gov.in and on the websites of the Book Running Lead Manager i.e., ICICI Securities Limited at www.icicisecurities.com and the Co- Book Running Lead Manager i.e., Elara Capital (India) Private Limited at www.elaracapital.com . Investors should note that investment in equity shares involves a high degree of risk and for details relating to the same, please see the section titled “Risk Factors” of the aforementioned offer document.
SMC Global Securities Ltd. (hereinafter referred to as “SMC”) is a registered Member of National Stock Exchange of India Limited, Bombay Stock Exchange Limited and its associate is member of MCX stock Exchange Limited. It is also registered as a Depository Participant with CDSL and NSDL. Its associates merchant banker and Portfolio Manager are registered with SEBI and NBFC registered with RBI. It also has registration with AMFI as a Mutual Fund Distributor.
SMC has applied with SEBI for registering as a Research Entity in terms of SEBI (Research Analyst) Regulations, 2014. SMC or its associates has not been debarred/ suspended by SEBI or any other regulatory authority for accessing /dealing in securities Market.
SMC or its associates including its relatives/analyst do not hold any financial interest/beneficial ownership of more than 1% in the company covered by Analyst. SMC or its associates and relatives does not have any material conflict of interest. SMC or its associates/analyst has not received any compensation from the company covered by Analyst during the past twelve months. The subject company has not been a client of SMC during the past twelve months. SMC or its associates has not received any compensation or other benefits from the company covered by analyst or third party in connection with the research report. The Analyst has not served as an officer, director or employee of company covered by Analyst and SMC has not been engaged in market making activity of the company covered by Analyst.
The views expressed are based solely on information available publicly available/internal data/ other reliable sources believed to be true.
SMC does not represent/ provide any warranty express or implied to the accuracy, contents or views expressed herein and investors are advised to independently evaluate the market conditions/risks involved before making any investment decision.

NEWS
DOMESTIC NEWS
Information Technology
• Tata Consultancy Services announced that CHROMA - the TCS' cloud based HR solution platform will be implemented at Bajaj Finance. The platform will enable and enhance the new generation HR experience to over 6000 employees in Bajaj Finance.
• Tech Mahindra has acquired The BIO Agency (BIO). It is a UK-based agency that offers digital services to global clients and engages with their customers. Tech Mahindra acquired the British firm for 45 million pounds (Rs 445 crore).
Cement
• Shree Cement has completed the expansion of grinding unit at Aurangabad (Bihar) from 2.0 Million Tons Per Annum (MTPA) to 3.60 MTPA.
Capital Goods
• Siemens has won an order worth approximately `83 crore from Indian Railways' Diesel Locomotive Works (DLW), Varanasi. The order is to design, supply and install 40 Alternating Current (AC) Traction Systems for dual-cab high horsepower diesel engine locomotives. The AC Traction Systems will be produced at Nashik Factory of Siemens.
Oil & Gas
• GAIL India Limited has awarded ̀ 550 crore worth of contracts for laying part of 'Urga Ganga' gas pipeline from Phulpur in Uttar Pradesh (UP) to Haldia in West Bengal (WB).
Automobile
• Force Motors inaugurated its brand new facility here, entailing an investment of ̀ 100 crore, to supply engines and axles to Mercedes-Benz India.
Pharmaceuticals
• Lupin has received final approval from the US health regulator to market generic Voriconazlole tablets as well as oral suspension for treatment of fungal infections in the American market.
Agro Chemicals
• Insecticides (India) has set up a manufacturing facility at Shamli district in Uttar Pradesh (UP). The facility also houses a Research & Development (R&D) unit.
Power
• Tata Power's 100% subsidiary Tata Power Renewable Energy (TPRE) has won 30 MW solar gird connected PV project in Maharashtra under the National Solar Mission. TPRE has received the letter of intent to develop the project and it will sign a 25-year power purchase agreement with NTPC Vidyut Vyapar Ltd.
Media & Entertainment
• Eros International has entered a strategic alliance with producer Vashu Bhagnani, signed a term sheet to acquire a 50% stake in his film company, Puja Entertainment & Films Ltd. Under this joint venture, successful titles of the 90s, the 'No 1' series including Hero No 1, Coolie No 1 and Biwi No 1 will be the among the first of Vashu Bhagnani films to be remade.
INTERNATIONAL NEWS
• US leading economic index edged down by 0.2 percent in May after climbing by 0.6 percent in April. The modest decrease by the leading index came as a surprise to economists, who had expected the index to rise by 0.2 percent.
• US new home sales fell by 6.0 percent to an annual rate of 551,000 in May from the downwardly revised April rate of 586,000. Economists had expected housing starts to slump by 8.7 percent to a rate of 565,000 from the 619,000 originally reported for the previous month.
• US new home sales fell by 6.0 percent to an annual rate of 551,000 in May from the downwardly revised April rate of 586,000. Economists had expected housing starts to slump by 8.7 percent to a rate of 565,000 from the 619,000 originally reported for the previous month.
• US consumer price index edged up by 0.2 percent in May after climbing by 0.4 percent in April. Economists had expected prices to rise by 0.3 percent. The uptick in consumer prices was partly due to a continued increase in energy prices, which jumped by 1.2 percent in May after spiking by 3.4 percent in April.
• US initial jobless claims rose to 277,000, an increase of 13,000 from the previous week's unrevised level of 264,000. Economists had expected jobless claims to edge up to 270,000. With the bigger than expected increase, jobless claims rebounded after falling to their lowest level in over a month in the previous week.
• Producer prices in Japan were up 0.2 percent on year in May. That topped forecasts for 0.1 percent following the upwardly revised 0.3 percent gain in the previous month (originally 0.2 percent). On a monthly basis, producer prices were flat following the 0.1 percent contraction in April.
Ex-Date Company Purpose
27-Jun-16 Pfizer Dividend - Rs.15/- Per Share29-Jun-16 Havells India Dividend -Rs 3/- Per Share29-Jun-16 HDFC Bank Dividend - Rs 9.50/- Per Share29-Jun-16 Dabur India Dividend - Re 1/- Per Share30-Jun-16 Birla Corporation Dividend - Rs 6/- Per Share30-Jun-16 The South Indian Bank Dividend - Re 0.50/- Per Share1-Jul-16 Century Enka Dividend - Rs 7.50/- Per Share1-Jul-16 ITC Bonus 1:24-Jul-16 JSW Steel Dividend - Rs 7.50/- Per Share4-Jul-16 eClerx Services Dividend Re 1/- Per Share4-Jul-16 UltraTech Cement Dividend -Rs 9.50/- Per Share4-Jul-16 Radico Khaitan Dividend -Re 0.80/- Per Share5-Jul-16 Can Fin Homes Dividend - Rs 10 Per Share5-Jul-16 Sundaram Finance Dividend - Re 1/- Per Share5-Jul-16 Greenply Industries Dividend - Re 0.60/- Per Share5-Jul-16 Hindustan Construction
Company Annual General Meeting5-Jul-16 LG Balakrishnan & Bros Dividend - Re 1/- Per Share7-Jul-16 Axis Bank Dividend-Rs 5/- Per Share7-Jul-16 Swaraj Engines Final Dividend - Rs 15/- And Special
Dividend - Rs. 18/-8-Jul-16 Cairn India Dividend - Rs 3/- Per Share8-Jul-16 Dewan Housing Finance
Corporation Final Dividend - Rs 2/- Per Share8-Jul-16 MindTree Dividend Rs 3/- Per Share
Meeting Date Company Purpose
28-Jun-16 Atlas Cycles (Haryana) Results30-Jun-16 Agro Dutch Industries Results30-Jun-16 Zylog Systems Results5-Jul-16 GM Breweries Results6-Jul-16 Goa Carbon Results/Others18-Jul-16 Exide Industries Results21-Jul-16 HDFC Bank Results22-Jul-16 Axis Bank Results22-Jul-16 Equitas Holdings Results
FORTHCOMING EVENTS
NOTES:1) These levels should not be confused with the daily trend sheet, which is sent every morning by e-mail in the name
of "Morning Mantra ".2) Sometimes you will find the stop loss to be too far but if we change the stop loss once, we will find more strength
coming into the stock. At the moment, the stop loss will be far as we are seeing the graphs on weekly basis and taking a long-term view and not a short-term view.
TREND SHEET
Stocks *Closing Trend Date Rate SUPPORT RESISTANCE Closing
Price Trend Trend
Changed Changed
S&P BSE SENSEX 26398 UP 13.04.16 25627 25200 24700
NIFTY50 8089 UP 13.04.16 7850 7750 7550
NIFTY IT 11203 UP 23.03.16 11207 10900 10700
NIFTY BANK 17426 UP 18.03.16 15655 16400 16000
ACC 1568 UP 18.03.16 1337 1530 1490
BHARTIAIRTEL 356 UP 04.03.16 332 340 330
BHEL 118 DOWN 13.08.15 259 125 135
CIPLA 477 DOWN 03.09.15 691 520 530
DLF 133 UP 04.03.16 108 120 115
HINDALCO 117 UP 11.03.16 84 105 100
ICICI BANK* 231 UP 10.06.16 253 - 230
INFOSYS 1195 UP 04.03.16 1173 1180 1150
ITC 354 UP 18.03.16 325 335 325
L&T 1431 UP 22.04.16 1265 1340 1320
MARUTI 4070 UP 20.05.16 3927 3900 3800
NTPC 149 UP 13.04.16 137 140 135
ONGC 209 DOWN 17.10.14 397 225 235
RELIANCE 951 DOWN 29.04.16 983 980 1000
TATASTEEL** 313 UP 04.03.16 289 - 300
S/l
4
®
Closing as on 24-06-2016ICICIBANK has broken the support of 235TATASTEEL has broken the support of 315

BSE SENSEX GAINERS & LOSERS TOP (% Change) NSE NIFTY GAINERS TOP & LOSERS (% Change)
SECTORAL INDICES (% Change)
SMC Trend
FMCGHealthcare
Auto BankRealty
Cap GoodsCons Durable
Oil & GasPower
ITMetal
Down SidewaysUp
GLOBAL INDICES (% Change)
INDIAN INDICES (% Change)
5
®
SMC Trend
Nifty Sensex BSE Midcap BSE Smallcap Nifty Junior S&P CNX 500
SMC Trend
FTSE 100CAC 40
NasdaqDow jonesS&P 500
NikkeiStrait times
Hang SengShanghai
-1.00
-0.86
-0.40
-1.37
-0.48
-0.98
-1.60
-1.40
-1.20
-1.00
-0.80
-0.60
-0.40
-0.20
0.00
Nifty Sensex BSE Midcap BSE Smallcap
Nifty Next 50
S&P CNX 500
-0.30
-1.64
-2.46
0.35
-1.38
0.55
-0.15
-1.95
-0.42
-2.34
-3.59
-4.00
-3.50
-3.00
-2.50
-2.00
-1.50
-1.00
-0.50
0.00
0.50
1.00
Auto Index Bankex Cap Goods Index
Cons Durable Index
FMCG Index Healthcare Index
IT Index Metal Index Oil & Gas Index
Power Index Realty Index
2.29
1.90 2.03
0.440.23
-4.15
-1.01 -1.09
-0.35
-5.00
-4.00
-3.00
-2.00
-1.00
0.00
1.00
2.00
3.00
Nasdaq Comp. Dow Jones S&P 500 Nikkei Strait Times Hang Seng Shanghai Comp.
FTSE 100 CAC 40
4.82
3.953.56
1.47 1.37
-3.99
-3.10 -3.07 -3.06 -3.02
-5.00
-4.00
-3.00
-2.00
-1.00
0.00
1.00
2.00
3.00
4.00
5.00
6.00
Dr Reddy's Labs
Bajaj Auto M & M Sun Pharma.Inds.
Infosys Tata Steel Axis Bank Tata Motors ICICI Bank Larsen & Toubro
5.17 5.01
3.773.34
1.55
-5.27
-4.45-4.15 -4.10 -3.93
-6.00
-4.00
-2.00
0.00
2.00
4.00
6.00
Ambuja Cem. Dr Reddy's Labs
Bajaj Auto M & M Sun Pharma.Inds.
Tech Mahindra
Tata Motors-DVR
Bosch Bharti Infra. Tata Steel
53.31
-527.59
421.09
-31.86
55.50
459.10
-237.80
-7.00
-600.00
-400.00
-200.00
0.00
200.00
400.00
600.00
Friday Monday Tuesday Wednesday Thursday
FII / FPI Activity MF Activity
INSTITUTIONAL ACTIVITY (Equity) (` Crore)
Closing as on 21.10.15
Closing as on 24.06.16
Closing as on 24.06.16
US Markets Closing as on 23.06.16 Asian Markets Closing as on 24.06.16 Europe Markets Prices at 4:30PM on 24.06.16

Beat the street - Fundamental Analysis
Above calls are recommended with a time horizon of 8 to 10 months. Source: Company Website Reuters Capitaline
6
®
GABRIEL INDIA LIMITED CMP: 89.80 Upside: 25%Target Price: 112.00
Investment Rationale strength and capabilities, improve cost �Gabriel India Limited provides a range of ride management, strengthen process optimisation,
control products in India, consisting of shock enhance product quality and reinforce product absorbers, struts and front forks for every engineering. The Company is pursuing global automotive segment. The Company operates businesses, which should balance its already-through four business units: commercial vehicle diversified portfolio even better.and railways, two and three wheelers, passenger �The company has reported 25% rise in net profit to cars and aftermarket. `75.2 crore. Sales were stagnant at ̀ 1438.2 crore
�The company has solid brand value and it hopes to for the year ended March 2016. Net sales for the cash -in on the same. Going forward the company fourth quarter ended March 2016 rose 5% at will focus on debt reduction and automation. `366.19 crore. The OPM during the fourth quarter
ended March 2016 rose by 70 bps to 8.9%.�Gabriel's continued focus on customer-centric R&D has yielded substantial benefits to its Valuationesteemed customers. The Company's clientele The company has strongly adopted innovation in include Bajaj, Mahindra, TVS, Honda, Mahindra, Gabriel and Anand group. Innovations have helped in Maruti Suzuki, TATA Motors, Ashok Leyland, Force coming out thru some breakthrough ideas which has Motors and Ride Control LLC. helped it to reduce energy cost and raw material cost,
�There will be no major greenfield capex for the thus it is expected that the stock will see a price target year. Regular capex will be in the range of `40 of `112 in 8 to 10 months time frame on a one year crore during the year FY 17. average P/E of 112x and FY17 (E) earnings of ̀ 5.93.
�The measures to boost the rural economy announced in the Budget are expected to shore up rural incomes and consumption over the next one to two years. The Seventh Pay Commission awards and lower borrowing costs should also increase disposable income of consumers.
�With improved infrastructure, commercial vehicles can access distant markets in less time. The easy availability of auto-finance makes vehicle purchases convenient Cost-competitiveness.
�Gabriel's brand in India and overseas is synonymous with shock absorbers. Going forward, the Company expects to continuously enhance its
Face Value (`) 1.00
52 Week High/Low 101.85/72.00
M.Cap (`Cr.) 1289.92
EPS (`) 5.27
P/E Ratio (times) 17.04
P/B Ratio (times) 3.39
Dividend Yield (%) 1.17
Stock Exchange BSE
% OF SHARE HOLDING
P/E Chart
` in cr
Actual EstimateFY Mar-15 FY Mar-16 FY Mar-17
Revenue 1,429.80 1,426.40 1,608.10EBITDA 116.40 127.60 130.50EBIT 85.32 94.37 106.80Pre-Tax Profit 84.15 96.09 111.10Net Income 60.62 75.84 85.43EPS 4.22 5.28 5.93BVPS 22.66 26.45 30.00ROE (%) 19.90 21.50 20.40
VALUE PARAMETERS
Investment Rationale •Healthy profitability with strong cash generations from operations, maintaining low debt at present •IGL continues to augment its infrastructure in with debt equity ratio of 0.03:1 and comfortable order to meet the increasing demand of CNG working capital position would give further arising out of growing number of CNG vehicles in strength to generate financial growth of the Delhi. The growth drivers for increase in demand company.of CNG are - car manufacturers coming up with
CNG variants and Delhi Government's directive Valuationmaking it mandatory for all LCVs operating in Factors such as low global natural gas prices, Delhi to run on CNG. The company is in the favourable government policies, a surge in liquefied process of enhancing its compression capacity by natural gas (LNG) regassification capacities, revival adding new stations. in gas demand from price-sensitive segments, better
•On the PNG front, IGL has planned to expand its prospects for pipeline and LNG infrastructure and business activities in Delhi and its neighbouring improving clarity on Petroleum & Natural Gas towns like Noida, Greater Noida and Ghaziabad. It Regulatory Board's (PNGRB) role are likely to drive would now be benefited with supply of PNG for growth of the company. Thus, it is expected that the non cooking applications like Geysers also. stock will see a price target of ̀ 740 in 8 to 10 months Moreover, it is also working towards expanding its time frame on a current P/E of 20.40x and FY17 (E) PNG network to cover all allocated areas of Delhi earnings of ̀ 36.25.and further Industrial and commercial segments would be the focus areas for the organization in the future.
•Oil Ministry allows IGL to open CNG pumps at OMC outlets. Therefore, it is planning to start selling CNG from Indian Oil Company (IOC), Hindustan Petroleum (HPCL) and Bharat Petroleum (BPCL) petrol pumps.
•Recently, government's move to cut natural gas price to $3.2 per mmBtu from $3.82 per mmBtu.would help in supporting the LNG pooling mechanism, and therefore, offer an excellent opportunity for a re.vival in consumption growth from power and fertilizer sectors.
P/E Chart
INDRAPRASTHA GAS LIMITED (IGL) CMP: 605.85 Upside: 22%Target Price: 740.00
Face Value (`) 10.00
52 Week High/Low 634.00/387.40
M.Cap (`Cr.) 8481.91
EPS (`) 29.73
P/E Ratio (times) 20.38
P/B Ratio (times) 3.51
Dividend Yield (%) 0.99
Stock Exchange BSE
` in cr
% OF SHARE HOLDING
VALUE PARAMETERS
Actual EstimateFY Mar-15 FY Mar-16 FY Mar-17
REVENUE 3,669.90 3,673.70 3,901.90
EBITDA 793.00 771.70 891.40
EBIT 644.30 614.10 714.80
Net Income 437.70 464.10 503.90
EPS 31.27 33.15 36.25
BVPS 149.87 176.97 202.98
ROE 22.70 20.30 18.90
10.81
7.19
0
54.63
27.37
Foreign
Institutions
Non Promoter Corporate Holding
Promoters
Public & Others
21.04
15.96
57.09
45
5.91
Foreign
Institutions
Govt Holding
Non Promoter Corp. Hold.
Promoters
Public & Others

Charts by Spider Software India Ltd
7
EQUITY
Above calls are recommended with a time horizon of 1-2 months
Disclaimer : The analyst and its affiliates companies make no representation or warranty in relation to the accuracy, completeness or reliability of the information contained in its research. The analysis contained in the analyst research is based on numerous assumptions. Different assumptions could result in materially different results.The analyst, not any of its affiliated companies, not any of their members, directors, employees or agents accepts any liability for any loss or damage arising out of the use of all or any part of the analysis research.
SOURCE: CAPITAL LINE
®
The stock closed at ̀ 175.25 on 24thJune 2016. It made a 52-week low at ̀ 128 on
25th August 2015 and a 52-week high at ̀ 217.75 on 30th December 2015. The 200
days Exponential Moving Average (EMA) of the stock on the daily chart is
currently at ̀ 159.88.
It is clearly visible that this particular scrip remained in an uptrend for a longer
duration. But after making its 52 week high it fell down up to 135 levels. Then
again, it made fresh buying pivot near 135 levels and recovered its lost value
which indicates that it may remain on upside course in the near term. One can
buy in the range of 173-175 levels for the target of 186-190 levels with SL of 168
levels.
Allcargo Logistics Limited
The stock closed at ̀ 378.15 on 24th June 2016. It made a 52-week low at ̀ 290 on
01st March 2016 and a 52-week high of `412 on 10th August 2015. The 200 days
Exponential Moving Average (EMA) of the stock on the daily chart is currently at
`352.89.
It has formed Inverted head and shoulder pattern on daily charts and then slowly
managed to move upwards with the increase in price and volume .Looking at the
momentum we anticipate that this particular scrip will be successful in reaching
its 52 week high of 412 levels in near term. One can buy in the range of 372-376
levels for the target of 390-400 levels with strict SL of 360 levels.
Godrej Industries Limited

DERIVATIVES
CHANGE IN NIFTY OPTION OI (IN QTY)
WEEKLY VIEW OF THE MARKET
NIFTY OPTION OI CONCENTRATION (IN QTY)
CHANGE IN BANKNIFTY OPTION OI (IN QTY)BANKNIFTY OPTION OI CONCENTRATION (IN QTY)
®
With Brexit becoming a reality, global markets crashed and Nifty fell more than 2%. Nifty witnessed sharp 180 points correction from a level of 8300 on the back of uncertainty over Euro zone future and volatile currency markets. Most of the sectors started trading below their short term averages and this indicates shift of sentiments towards bears. FII turned net seller in derivative market throughout the week and every bounce was used to liquidate longs. Hereafter, the range of 8200-7900 levels will remain crucial in the near term, and the move is expected to remain volatile with negative bias, as indicated by option open interest concentration. If Nifty fell below the 8000 mark, it could correct to 7900 levels on the back of further selling. On bounce the index will face strong resistance at 8150-8200 levels. The put-call ratio of open interest closed up at 1.38 levels, on the back of OTM put buying for portfolio hedging. The options open interest concentration continued to be at the 8000-strike put with the highest open interest of above 80 lakh shares; this is followed by 7800-strike put with open interest of 55 lakhs. Among the call options, the 8400-strike taking the total open interest to 57 lakh shares, with the highest open interest among call options followed by 8300-strike call with total open interest of 56 lakh shares. The Implied Volatility (IV) of call options up at 18.25%, while the average IV of put options closed at 17.77%. The VIX index moved up to 18.63% from 13.84% and here on there is high probability of further surge in volatility from current levels. It is advisable to use bounce to exit longs and initiate fresh shorts.
In lakhs
In 10000 In 10000
EXIDEIND (JUN FUTURE)
Buy: Above `168
Target: `174
Stop loss: `165
IDBI
Buy JUN 65. PUT 0.85
Sell JUN 62.5. PUT 0.30
Lot size: 8000
BEP: 64.55
Max. Profit: 15600.00 (1.95*8000)
Max. Loss: 4400.00 (0.55*8000)
OPTIONSTRATEGY
FUTURE
TITAN
Buy JUN 400. CALL 7.90
Sell JUN 410. CALL 3.60
Lot size: 1500
BEP: 404.30
Max. Profit: 8550.00 (5.70*1500)
Max. Loss: 6450.00 (4.30*1500)
PNB
Buy JUN 105. CALL 1.75
Sell JUN 107.5. CALL 1.20
Lot size: 4000
BEP: 105.55
Max. Profit: 7800.00 (1.95*4000)
Max. Loss: 2200.00 (0.55*4000)
DERIVATIVE STRATEGIES
CAIRN (JUN FUTURE)
Sell: Below `129
Target: `121
Stop loss: `133
BHEL (JUN FUTURE)
Sell: Below `115
Target: `107
Stop loss: `119
BULLISH STRATEGY BEARISH STRATEGY
Call Put
11
.78
4.4
7
4.0
3 9.2
5
11
.17
31
.26 3
8.9
2 44
.06 49
.44 55
.18
49
.48
49
.47
48
.40
32
.39
50
.70
49
.09
65
.86
34
.60
21
.31
13
.90
3.5
2
4.8
8
0.00
10.00
20.00
30.00
40.00
50.00
60.00
70.00
7000 7500 7700 7800 7900 8000 8100 8200 8300 8400 8500
Call Put
-0.0
6
-0.2
3
-0.8
4
-1.1
5
3.0
6
7.6
3
13
.82
1.9
9
-15
.76
7.2
2
1.8
2
0.7
2
7.9
5
4.6
1
17
.57
9.9
5
-13
.09
-11
.71
-6.4
4
-1.8
5
-3.0
0 -0.5
8
-20.00
-15.00
-10.00
-5.00
0.00
5.00
10.00
15.00
20.00
7000 7500 7700 7800 7900 8000 8100 8200 8300 8400 8500
Call Put
2.2
3
3.7
5
6.6
5
20
.99
9.5
5
10
.70
36
.62
12
.87
57
.84
41
.41
18
.56
19
.61 2
8.6
1
41
.18
82
.87
19
.33
7.4
1
25
.52
3.2
3
14
.70
1.6
1
0.1
7
0.00
10.00
20.00
30.00
40.00
50.00
60.00
70.00
80.00
90.00
15500 16000 16500 17000 17200 17300 17500 17800 18000 18500 19000
Call Put
-0.1
4
-0.9
3
-0.9
8
6.4
2 8.5
3
15
.53
4.8
2
3.1
6
-0.5
8
-5.6
7 -1.7
4
-0.1
2
6.2
4
11
.63
18
.59
5.2
4
- 11
.34
-1.5
8
-0.2
8
0.0
0
-0.1
2
-0.0
1
-15.00
-10.00
-5.00
0.00
5.00
10.00
15.00
20.00
25.00
15500 16000 16500 17000 17200 17300 17500 17800 18000 18500 19000
8
In lakhs

9
DERIVATIVES
®
FII’s ACTIVITY IN DERIVATIVE SEGMENT
SENTIMENT INDICATOR (NIFTY)
24-Jun 23-Jun 22-Jun 21-Jun 20-Jun
Discount/Premium -13.00 11.80 1.35 5.20 13.40
PCR(OI) 1.28 1.38 1.27 1.31 1.31
PCR(VOL) 1.01 1.14 1.00 0.93 0.91
A/D RATIO(Nifty 50) 1.27 2.85 0.88 0.35 4.33
A/D RATIO(All FO Stock)* 0.20 1.42 0.38 0.52 3.50
Implied Volatality 18.25 15.88 15.95 15.23 15.35
VIX 18.63 18.02 18.19 17.26 17.52
HISTORY. VOL 18.28 14.93 14.72 15.13 15.53
*All Future Stock
SENTIMENT INDICATOR (BANKNIFTY)
24-Jun 23-Jun 22-Jun 21-Jun 20-Jun
Discount/Premium -56.15 -1.95 -28.35 4.00 9.75
PCR(OI) 1.03 1.19 1.14 1.12 1.10
PCR(VOL) 0.65 0.87 0.97 0.87 0.85
A/D RATIO(BANKNIFTY) 0.09 All up 0.33 0.00 5.00
#A/D RATIO 0.10 20.00 0.24 0.00 6.00
Implied Volatality 21.29 20.77 22.44 21.63 22.16
HISTORY. VOL 22.98 19.69 18.97 19.57 20.00
FII’S ACTIVITY IN NIFTY FUTURE
**The highest call open interest acts as resistance and highest put open interest acts as support.# Price rise with rise in open interest suggests long buildup | Price fall with rise in open interest suggests short buildup # Price fall with fall in open interest suggests long unwinding | Price rise with fall in open interest suggests short covering
# All BANKING Future Stock
Top 10 short build up
In Cr. In Cr.
Top 10 long build up
LTP % Price Change Open interest %OI Chng
ARVIND 315.65 1.97% 4188800 12.36%
ABIRLANUVO 1056.45 1.58% 1308000 5.31%
PNB 101.1 7.10% 36404000 2.38%
GODREJIND 380.25 7.34% 1431300 2.23%
IOC 419.3 1.10% 9553200 2.17%
ALBK 64.7 10.69% 12282000 1.74%
LTP % Price Change Open interest %OI Chng
KPIT 178.15 -3.60% 1724000 11.08%
SUNTV 350.6 -5.58% 5994000 5.45%
INDUSINDBK 1094.35 -0.32% 4329600 4.64%
UPL 540.4 -4.93% 7802000 3.28%
RCOM 47.2 -0.11% 110808000 2.44%
AJANTPHARM 1476.5 -1.86% 320800 1.91%
TATAMOTORS 450.7 -2.99% 23791500 1.66%
69
8
-6
16
-1
88
1
-6
39 -4
39
-4
80
-1
33
6
-5
70
-4
97
32
0
-1
76
8
-2500
-2000
-1500
-1000
-500
0
500
1000
10-Jun 13-Jun 14-Jun 15-Jun 16-Jun 17-Jun 20-Jun 21-Jun 22-Jun 23-Jun 24-Jun
-4
96
-1
35
7
-1
63
8
-1
0
-1
65
5 -1
27
3
-2
10
7
-1
19
3
-5
06
11
29
56
7
-2500
-2000
-1500
-1000
-500
0
500
1000
1500
10-Jun 13-Jun 14-Jun 15-Jun 16-Jun 17-Jun 20-Jun 21-Jun 22-Jun 23-Jun 24-Jun

10
®
Turmeric futures (July) is expected to come out of its consolidation phase & may witness an upside momentum to test 8300-8400 levels. The spot turmeric prices at Erode markets are increasing as some traders have received orders from North India. Also, fresh buying is observed from the upcountry traders as supplies may drop in the coming days due to monsoon season. However, the overall trend in turmeric will be dependent on monsoon progress in key turmeric producing belts, as the sowing is taking place in Andhra Pradesh, Karnataka and Telangana. The downside in cardamom futures (July) is likely to get extended towards 835-820 levels, if the counter breaks the support near 850 levels. As the spot prices of these aromatic capsules had moved up in past sessions, the exporters have slowed down the buying. Moreover, the prices are comparatively lower at the auctions due to inferior quality of the material. Jeera futures (July) is likely to trade with an upside bias in the range of 17300-18000 levels. The counter is getting support by good demand from local and upcountry buyers. The demand & supply balance projects that crop is estimated between 42-45 lakh bags, Opening stock projected at 7-8 lakh bags, domestic demand is estimated at 30 lakh bags & export demand is anticipated to be at 20 lakh bags. Coriander futures (July) is likely to gain further towards 7400-7500 levels. Demand in coriander is hand-to-mouth at present from upcountry buyers; however farmers and stockists are reluctant to offload their produce at the lower level. Rajasthan based farmers are unlikely to dispose their crop around these level, which may later on led to short supply and may spur prices.
SPICES
Soybean futures (July) will possibly take support near 3750 levels, as the supply side fundamentals may add cushion to the prices. It is reported that India's soybean acreage was down 35.3% on year at 44,200 ha as on June 20, due to delay in the onset of monsoon, according to data from the agriculture ministry. In Karnataka, soybean was sown over 22,000 ha, down from 57,000 ha a year ago, while the acreage was 4,100 ha in Maharashtra, down nearly 5% from a year ago. Sowing is yet to commence in the other key soybean-growing states such as Madhya Pradesh, Rajasthan, Andhra Pradesh, and Chhattisgarh. Mustard futures (July) is likely to trade sideways in the range of 4600-4790 levels. At present, mustard oil is in great demand from north-eastern states, which has prompted crushers to source mustard seed to increase crushing in order to meet demand. The only negative factor in mustard seed is disparity in crushing, which is around `3,500 per tonne. However, downside for mustard seed is seen limited due to low arrivals and millers are facing supply shortage. Refined soy oil futures (Aug) is expected to get more slippery towards 630 levels, while CPO futures (July) is expected to witness an extended downfall towards 495 levels. The sentiments of edible oil counters are bearish on the international market owing to improved weather condition in U.S sowing area which has raised hopes for big crop this season and big supply for by-products. On the Bursa Malaysia Derivatives Exchange, Malaysian palm oil futures are trading near the lowest since December on expectations for supply to rise on a seasonal production gain and exports to decline.
OIL AND OILSEEDS
OTHER COMMODITIES
The bull-run in maize futures (July) is expected to sustain as the counter has the potential to test 1800 levels. As maize is produced in Rabi season only in Bihar at large scale and crops is reported weak, hence, production is down. Also, farmers have sold most of their crops; hence, there is least possibility of much bearish tone in maize prices in near term. There is news that government is considering to import another 5 lakh tonnes of corn on demand of the industry as prices have rallied recently. Kapas futures (April) is likely to remain stable & trade in the range of 890-950 levels. The domestic fundamentals are very strong due to tight supply, with almost all crop from 2015-16 has almost arrived, and now the mills are mainly dependent on privates traders/ginners for their requirements and still around 4 month left for new crop to start. Sowing in Maharashtra and Madhya Pradesh has already started after recent precipitation, while in some belts farmers are still waiting for rain due to lack of sufficient moisture in soil for cotton sowing. Cottonseed quoted in Gujarat at `600/20kg, Kapas was available at `1,100-1,200/20kg. In Maharashtra and Madhya Pradesh cotton seed & cotton oil Y5cakes prices reported at `2,800-3,050/100kg & `2,675-2,850/100kg respectively. The downtrend in sugar futures (July) is likely to get extended for the third consecutive week as it can fall towards 3530-3500 levels. At the spot markets, sugar prices are falling as delivery orders and resale pressure increased amid normal demand. At the Vashi market, the inventory level stable is at 110-115 truckloads. On the international market, raw sugar futures on ICE are declining as port congestion in top grower Brazil eased.
Bullion counter is expected to continue its upside movement as the crucial referendum in Britain voted in favour of exit from Euro zone thereby created panic in global stock markets and supported safe haven buying in bullions. Meanwhile, SPDR gold trust holdings and physical demand will also give further direction to the prices. Recently increase in investment demand has supported its prices. Meanwhile weaker local currency rupee can also support the domestic prices as it can move in the range of 67-69 in MCX. Gold can trade in the range of 30900-32400 while silver can move in the range of 41000-44500 in near term. Gold surged to the highest level in more than two years in a frantic global hunt for haven assets as Britain's voters backed leaving the European Union after a historic poll. Bullion powered ahead amid turmoil in global financial markets as the pound fell to the lowest level in more than three decades, equities tanked and investors fled from risky assets. Holdings in exchange-traded funds have kept expanding as the assets were little changed at 1,904.3 metric tonnes after rising for 16 days to the highest level since October 2013. Meanwhile according to the testimony by the Fed Chairperson, the slowdown in the labor market for the month of May was transitory and overall consumer spending remains strong and Fed would adopt a cautious approach on raising the further interest rates. According to International Monetary Fund Managing Director “Federal Reserve should avoid "abrupt" interest rate moves and focus on stability in its monetary policy”.
BULLIONS
Crude oil prices can trade on weaker side continuing last week losses after Britain exited from euro zone and falling global equity markets will dampen investor's sentiment. Recently supply disruptions and improved demand outlook have lifted the prices higher. Overall it can move in the range of 3050-3400 in MCX. The amount of Saudi crude in domestic and overseas storage facilities stood at 290.9 million barrels at the end of April, the lowest level since August 2014. The International Energy Agency stated this month that Saudi Arabia could increase production beginning in June to cover increased power needs during the summer. The kingdom’s production has been around 10.2 million barrels since the start of the year. OPEC's crude oil exports rose only "slightly" last year to 23.60 million barrels per day (bpd), up 1.7 percent from 23.20 million bpd the previous year. Natural gas may trade on volatile path as it can move in the range of 170-190 in MCX. The U.S. Energy Information Administration stated in its weekly report that natural gas storage in the U.S. in the week ended June 17 rose by 62 billion cubic feet, above forecasts for an increase of 58 billion. Meanwhile, updated weather forecasting models continued to show above normal temperatures across most parts of the U.S. over the next two weeks. Natural gas prices are up nearly 40% since late May as expectations have grown that hot summer weather will lead to heavy demand. Demand for natural gas tends to rise in the summer months as warmer temperatures increase the need for gas-fired electricity to power air conditioning.
ENERGY COMPLEX
Base metals counter may remain on weaker note as Britain exited from euro zone and fears of China slowdown concerns to keep the prices under pressure. Copper may move in the range of 300-322. Stockpiles in LME depots expanded by a quarter this month as China built up enough part-processed copper for its needs last year. Adding to a surfeit of global mine supply, Zambia's copper production will rise by 5.5 percent to 750,000 tonnes this year and output is expected to double to 1.5 million tonnes in 2017. Lead can hover in the range of 110-117. Zinc can move in the range of 130-139. China's environmental awakening is going to limit its ability to expand zinc output beyond its current level which has given support to zinc prices. The International Lead and Zinc Study Group's (ILZSG's) latest release shows that refined zinc metal consumption has been virtually flat in the January-April period, compared with a year ago, at 4.4 million tonnes. Aluminum can move in the range of 104-111. Nickel may remain in the range of 580-620. Nickel ore shipments from the Philippines may be jeopardized by President-elect Rodrigo Duterte's appointment of an anti-mining crusader to head the country's environment department, a move that may potentially disrupt supplies to Chinese buyers. Concerns that the new government will limit ore exports helped push nickel higher. The Philippines has emerged as the key supplier of nickel ore to Asia's top economy after Indonesia halted shipments in January 2014 in a bid to promote local processing.
BASE METALS

11
TECHNICAL RECOMMENDATIONS
COMMODITY
TMC NCDEX (JULY) contract closed at ̀ 8192 on 23rd June'16. The contract made its high of 11510 on
15th Dec'15 and a low of `7850 on 25th May'16. The 18-day Exponential Moving Average of the
commodity is currently at ̀ 8092.3.
On the daily chart, the commodity has Relative Strength Index (14-day) value of 45. One can buy in the
range of ̀ 8000-7900 with the stop loss of ̀ 7800 for a target of ̀ 8400.
`
SOYABEAN NCDEX (JULY) contract closed at 3812 on 23rd June'16. The contract made its high of 4400
on 21st Apr'16 and a low of `3812 on 23rd June'16. The 18-day Exponential Moving Average of the
commodity is currently at ̀ 3887.7.
On the daily chart, the commodity has Relative Strength Index (14-day) value of 40. One can buy in the
range of ̀ 3770-3720 with the stop loss of ̀ 3670 for a target of ̀ 3950.
` `
JEERA NCDEX (JULY) contract closed at 17670 on 23rd June'16. The contract made its high of 18190
on 2nd May'16 and a low of `15830 on 2nd June'16. The 18-day Exponential Moving Average of the
commodity is currently at ̀ 17205.
On the daily chart, the commodity has Relative Strength Index (14-day) value of 55. One can buy in the
range of ̀ 17500-17300 with the stop loss of ̀ 17100 for a target of ̀ 18000.
` `
®
TMC NCDEX (JULY)
SOYABEAN NCDEX (JULY)
JEERA NCDEX (JULY)
NOTES : 1) These levels should not be confused with the daily trend sheet, which is sent every morning by e-mail in the name of Daily report- commodities (Morning Mantra).
2) Sometimes you will find the stop loss to be too far but if we change the stop loss once, we will find more strength coming into the commodity. At the moment, the stop loss will be far as we are seeing the graphs on weekly basis and taking a long-term view and not a short-term view.
EXCHANGE COMMODITY CONTRACT CLOSING DATE TREND TREND RATE TREND SUPPORT RESISTANCE CLOSING
PRICE CHANGED CHANGED STOP/LOSS
NCDEX SOYABEAN JULY 3807.00 12.05.16 Down 4037.00 - 4050.00 4100.00
NCDEX JEERA JULY 17625.00 16.06.16 Up 17140.00 16700.00 - 16000.00
NCDEX REF.SOY OIL JULY 642.80 16.06.16 Down 633.15 - 645.00 650.00
NCDEX RM SEEDS JULY 4695.00 09.06.16 Up 4666.00 4500.00 - 4400.00
MCX MENTHA OIL JULY 852.70 19.05.16 Up 890.40 840.00 - 830.00
MCX CARDAMOM JULY 862.00 22.03.16 UP 738.80 840.00 - 780.00
MCX SILVER JULY 42636.00 09.06.16 UP 40909.00 40500.00 - 39500.00
MCX GOLD AUG 31535.00 16.06.16 Up 30607.00 30500.00 - 30000.00
MCX COPPER AUG 321.45 24.06.16 Sideways
MCX LEAD JULY 116.10 07.04.16 Down 114.05 - 117.00 118.00
MCX ZINC JULY 135.65 03.03.16 UP 123.85 130.00 - 128.00
MCX NICKEL JULY 611.70 28.04.16 Sideways
MCX ALUMINUM JULY 109.40 12.05.16 Down 103.20 - 109.70 110.00
MCX CRUDE OIL JULY 3278.00 12.04.16 Up 2889.00 3150.00 - 3100.00
MCX NATURAL GAS JULY 185.40 17.03.16 Up 133.40 175.00 - 170.00
TREND SHEET
*Closing as on 24.06.16 at 3:30pm

COMMODITY
NEWS DIGEST
History made with “BREXIT” last week and market traded nervously throughout the week
before and after the event. Wild moves were witnessed in commodities. Market participants
ran for safe haven buying and thus bullion counter saw magical upside in the prices. It was a
tough situation to guess the outcome as it was a neck to neck fight situation. Hence in the
beginning market witnessed mix movements but after the result bullion counter jumped,
energy counter traded in lower circuits and base metals showed the panic side. Major move
came in gold which hit 6% upper circuit. In Comex, it breached the mark of $1325 and in MCX it
crossed the upside level of 31700. Even silver saw some upside and traded near 42700 in mcx.
Currency reaction was equally strong. Dollar index jumped from 93 to 96, it was a rare intraday
upside in the recent months. British pound was down by more than 9%. The rupee posted its
biggest intraday fall since August 2015, breached the mark of 68.10. In energy counter, earlier
crude traded up on little hope that Britain will stay with EU, but soon after the result prices
shed its previous gain. Natural gas futures traded lower after the US Energy Information
Administration reported that US natural gas stocks increased by 62 billion cubic feet for the
week ending June 17. Base metals earlier showed some strength on weakness in dollar index,
later on after the result, prices slashed.
Maize saw stunning rise. The spot NCDEX prices of maize in Sangli market had increased by
about 20% in the past three months to ̀ 1,750/quintal on June 14 from 1,460/quintal on March
14. India has been a traditional exporter of maize to the neighboring as well as South East Asian
countries, but back-to-back droughts forced India to go for imports after a gap of 16 year.
Cotton counter saw some profit booking at higher side. Sugar prices fell for the same reason.
Oil seeds and edible oil counter performed mix. Soyabean was in a range whereas mustard
seed and refined soya oil prices augmented. In spices, turmeric, jeera and dhaniya flavoured
up whereas cardamom prices slipped. Low demand from consuming industries in the spot
market against adequate stocks position on higher supplies from producing regions mainly
kept mentha oil prices lower at futures trade.
`
WEEKLY COMMENTARY
COMMODITY UNIT 23.06.16 DIFFERENCEQTY. QTY.
29MM COTTON NEW BALES 27700.00 17800.00 -9900.00BARLEY MT 12504.00 10755.00 -1749.00CASTOR SEED MT 3330.00 2563.00 -767.00CHANA MT 1568.00 1094.00 -474.00CORIANDER NEW MT 3496.00 3667.00 171.00COTTON SEED OILCAKE MT 36827.00 36156.00 -671.00GUARGUM MT 37149.00 35564.00 -1585.00GUARSEED MT 30775.00 30681.00 -94.00JEERA NEW MT 3475.00 3358.00 -117.00MAIZE MT 90.00 90.00 0.00RM SEED MT 51362.00 52568.00 1206.00SOYABEAN MT 25675.00 23067.00 -2608.00SUGAR MT 10060.00 10710.00 650.00TURMERIC MT 5656.00 5735.00 79.00WHEAT MT 21009.00 18893.00 -2116.00
16.06.16 COMMODITY UNIT 23.06.16 DIFFERENCE
QTY. QTY.
CARDAMOM MT 26.70 20.30 -6.40
COTTON BALES 69900.00 52200.00 -17700.00
GOLD KGS 58.00 62.00 4.00
GOLD MINI KGS 123.30 126.00 2.70
GOLD GUINEA KGS 13.74 13.74 0.00
MENTHA OIL KGS 1260575.53 1279653.13 19077.60
SILVER (30 KG Bar) KGS 104353.26 104353.26 0.00
16.06.16
•Britain has voted to leave the European Union, with the Leave campaign securing around 51.8% of the vote.
•Australian mining giant BHP Billiton pulled a $500 million debt refinancing plan at one of Australia's biggest coal export terminals after banks were reluctant to lend to the sector.
•According to OPEC report “OPEC's proven crude oil reserves rose by 0.1% last year and it maintained its share of 81.2% of the world total”.
•According to ILZSG “global zinc market reported an estimated surplus of 24,000 tonnes in the January-April 2016 period”.
•The government has allowed export of another 1,146 tonnes raw sugar to the US under the preferential trade quota for 2015-16 (Oct-Sep), in addition to the 9,147 tonnes permitted in October and March.
•All India, the percentage departure from Long Period Average of seasonal Rainfall (in mm) from 1 June to 22 June, 2016 is -18%. Region wise: East & Northeast India (-25%), Northwest India (3%), Central India (-37%) & South Peninsula (15%). – Indian Meteorological Department
•NCDEX will soon conduct e-auctions to buy kabuli chana and pulses such as tur, urad, masur and chana on behalf of the Army Purchase Organisation.
•Turmeric became the first commodity to be traded on the e-National Agriculture Market at Nizamabad Agriculture Produce Market Committee in Telangana.
•Shree Renuka Sugars (SRSL) has signed a share sale agreement with a large Mauritius-based fund to sell its 5% remaining stake in NCDEX.
WEEKLY STOCK POSITIONS IN WAREHOUSE (MCX)
12
®
WEEKLY STOCK POSITIONS IN WAREHOUSE (NCDEX)
NCDEX TOP GAINERS & LOSERS (% Change) MCX TOP GAINERS & LOSERS (% Change)
3.90
3.303.12
2.62
2.19
-2.97
-1.08
-0.44 -0.35-0.16
-4.00
-3.00
-2.00
-1.00
0.00
1.00
2.00
3.00
4.00
5.00
COPPERNATURAL
GAS SILVER GOLD ZINC CARDAMOM COTTONMENTHA
OIL CPO NICKEL
6.87
3.80
2.85 2.71 2.68
- 0.93 - 0.90 - 0.81
- 0.26- 0.09
-2.00
-1.00
0.00
1.00
2.00
3.00
4.00
5.00
6.00
7.00
8.00
MAIZE RABI CORIANDER
GUAR GUM TURMERIC JEERA SUGAR M WHEAT KAPAS SOYABEAN BARLEY
*Closing as on 24.06.16 at 3:30pm *Closing as on 24.06.16 at 3:30pm
COMMODITY
COMMODITY EXCHANGE CONTRACT 17 24.06.16 CHANGE%
ALUMINIUM LME 3 MONTHS 1615.00 1642.00 1.67
COPPER LME 3 MONTHS 4552.00 4780.00 5.01
LEAD LME 3 MONTHS 1693.00 1730.00 2.19
NICKEL LME 3 MONTHS 9065.00 9225.00 1.77
ZINC LME 3 MONTHS 1981.00 2039.00 2.93
GOLD COMEX AUG 1294.80 1321.80 2.09
SILVER COMEX JULY 17.41 17.87 2.64
LIGHT CRUDE OIL NYMEX JULY 47.98 47.71 -0.56
NATURAL GAS NYMEX JULY 2.62 2.67 1.75
.06.16
PRICES OF METALS IN LME/ COMEX/ NYMEX (in US $)
WEEKLY STOCK POSITIONS IN LME (IN TONNES)
COMMODITY STOCK POSITION STOCK POSITION DIFFERENCE
16.06.16 23.06.16
ALUMINIUM 2458850 2427950 -30900
COPPER 202150 190700 -11450
NICKEL 389136 385566 -3570
LEAD 185750 185675 -75
ZINC 383200 395075 11875
INTERNATIONAL COMMODITY PRICES
COMMODITY EXCHANGE CONTRACT UNIT 17.06.16 24.06.16 CHANGE(%)
Soybean CBOT NOV Cent per Bushel 1148.25 1084.00 -5.60
Maize CBOT JULY Cent per Bushel 437.75 379.50 -13.31
CPO BMD AUG MYR per MT 2450.00 2382.00 -2.78
Sugar LIFFE AUG 10 cents per MT 536.00 527.80 -1.53
13
®
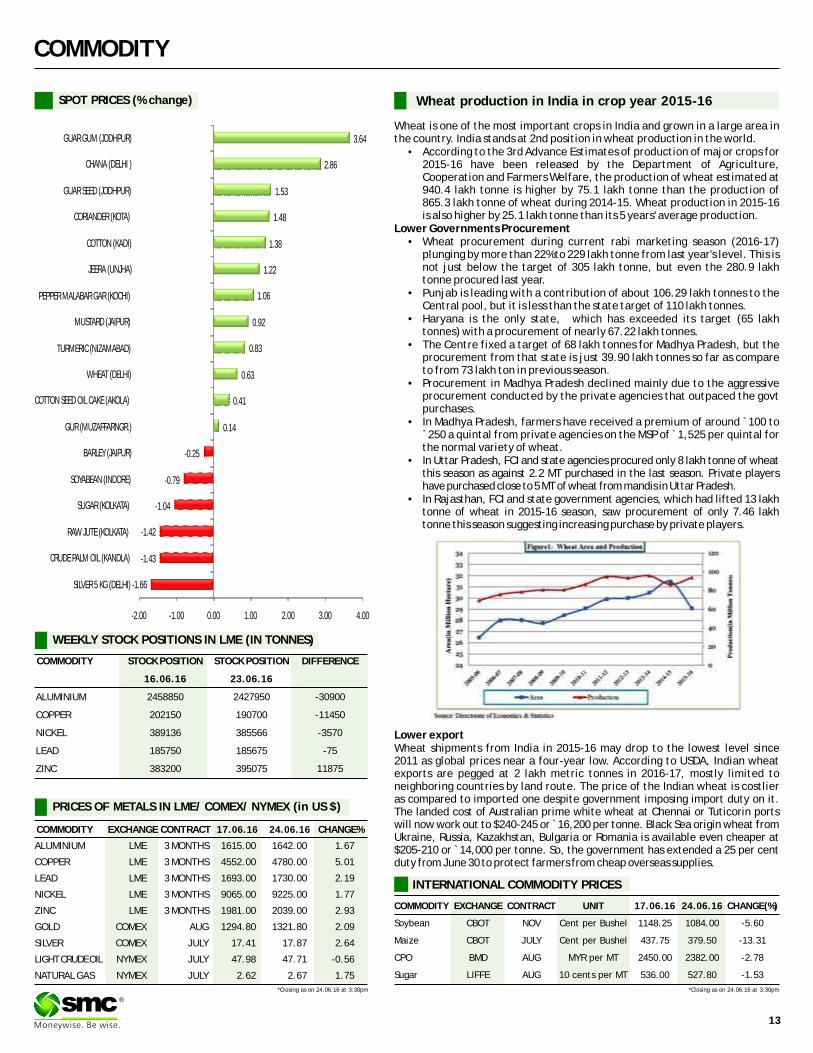
SPOT PRICES (% change) Wheat production in India in crop year 2015-16
Wheat is one of the most important crops in India and grown in a large area in the country. India stands at 2nd position in wheat production in the world.
• According to the 3rd Advance Estimates of production of major crops for 2015-16 have been released by the Department of Agriculture, Cooperation and Farmers Welfare, the production of wheat estimated at 940.4 lakh tonne is higher by 75.1 lakh tonne than the production of 865.3 lakh tonne of wheat during 2014-15. Wheat production in 2015-16 is also higher by 25.1 lakh tonne than its 5 years' average production.
Lower Governments Procurement • Wheat procurement during current rabi marketing season (2016-17)
plunging by more than 22% to 229 lakh tonne from last year's level. This is not just below the target of 305 lakh tonne, but even the 280.9 lakh tonne procured last year.
• Punjab is leading with a contribution of about 106.29 lakh tonnes to the Central pool, but it is less than the state target of 110 lakh tonnes.
• Haryana is the only state, which has exceeded its target (65 lakh tonnes) with a procurement of nearly 67.22 lakh tonnes.
• The Centre fixed a target of 68 lakh tonnes for Madhya Pradesh, but the procurement from that state is just 39.90 lakh tonnes so far as compare to from 73 lakh ton in previous season.
• Procurement in Madhya Pradesh declined mainly due to the aggressive procurement conducted by the private agencies that outpaced the govt purchases.
• In Madhya Pradesh, farmers have received a premium of around ̀ 100 to `250 a quintal from private agencies on the MSP of ̀ 1,525 per quintal for the normal variety of wheat.
• In Uttar Pradesh, FCI and state agencies procured only 8 lakh tonne of wheat this season as against 2.2 MT purchased in the last season. Private players have purchased close to 5 MT of wheat from mandis in Uttar Pradesh.
• In Rajasthan, FCI and state government agencies, which had lifted 13 lakh tonne of wheat in 2015-16 season, saw procurement of only 7.46 lakh tonne this season suggesting increasing purchase by private players.
Lower export Wheat shipments from India in 2015-16 may drop to the lowest level since 2011 as global prices near a four-year low. According to USDA, Indian wheat exports are pegged at 2 lakh metric tonnes in 2016-17, mostly limited to neighboring countries by land route. The price of the Indian wheat is costlier as compared to imported one despite government imposing import duty on it. The landed cost of Australian prime white wheat at Chennai or Tuticorin ports will now work out to $240-245 or ̀ 16,200 per tonne. Black Sea origin wheat from Ukraine, Russia, Kazakhstan, Bulgaria or Romania is available even cheaper at $205-210 or ̀ 14,000 per tonne. So, the government has extended a 25 per cent duty from June 30 to protect farmers from cheap overseas supplies.
-1.66
-1.43
-1.42
-1.04
-0.79
-0.25
0.14
0.41
0.63
0.83
0.92
1.06
1.22
1.38
1.48
1.53
2.86
3.64
-2.00 -1.00 0.00 1.00 2.00 3.00 4.00
SILVER 5 KG (DELHI)
CRUDE PALM OIL (KANDLA)
RAW JUTE (KOLKATA)
SUGAR (KOLKATA)
SOYABEAN (INDORE)
BARLEY (JAIPUR)
GUR (MUZAFFARNGR.)
COTTON SEED OIL CAKE (AKOLA)
WHEAT (DELHI)
TURMERIC (NIZAMABAD)
MUSTARD (JAIPUR)
PEPPER MALABAR GAR (KOCHI)
JEERA (UNJHA)
COTTON (KADI)
CORIANDER (KOTA)
GUAR SEED (JODHPUR)
CHANA (DELHI )
GUAR GUM (JODHPUR)
*Closing as on 24.06.16 at 3:30pm *Closing as on 24.06.16 at 3:30pm
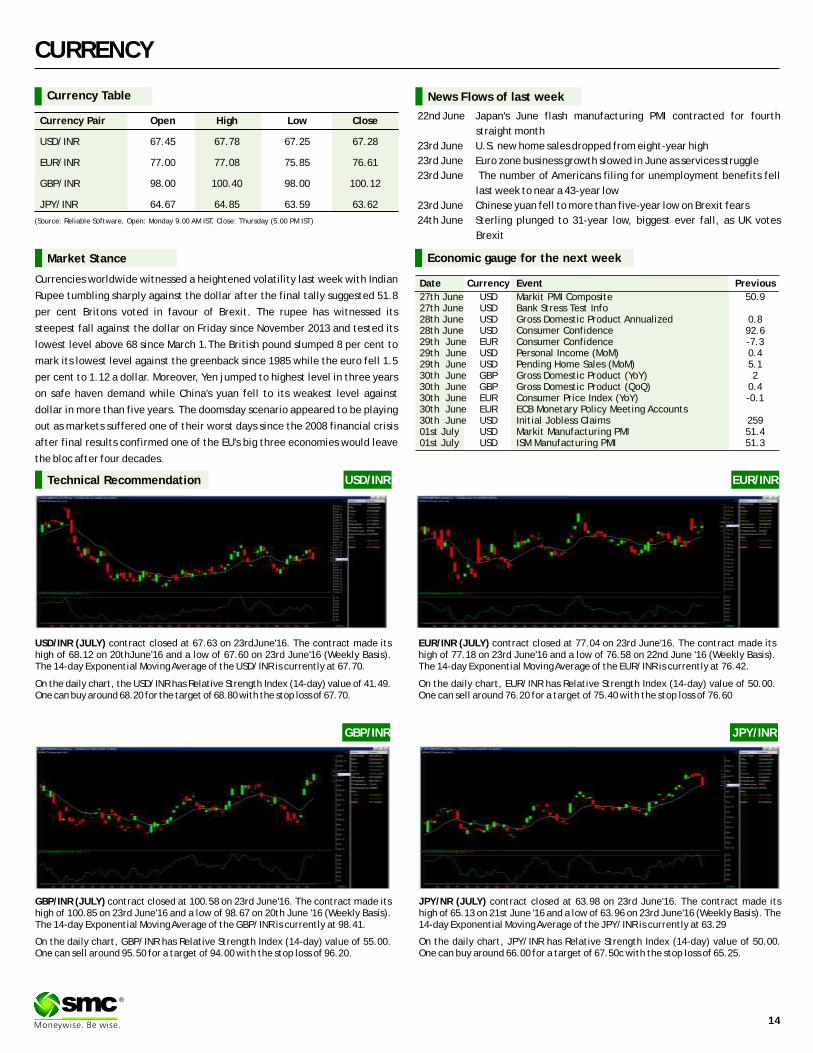
CURRENCY
Currency Table
Currency Pair Open High Low Close
USD/INR 67.45 67.78 67.25 67.28
EUR/INR 77.00 77.08 75.85 76.61
GBP/INR 98.00 100.40 98.00 100.12
JPY/INR 64.67 64.85 63.59 63.62
(Source: Reliable Software, Open: Monday 9.00 AM IST, Close: Thursday (5.00 PM IST)
News Flows of last week
22nd June Japan's June flash manufacturing PMI contracted for fourth
straight month
23rd June U.S. new home sales dropped from eight-year high
23rd June Euro zone business growth slowed in June as services struggle
23rd June The number of Americans filing for unemployment benefits fell
last week to near a 43-year low
23rd June Chinese yuan fell to more than five-year low on Brexit fears
24th June Sterling plunged to 31-year low, biggest ever fall, as UK votes
Brexit
EUR/INR (JULY) contract closed at 77.04 on 23rd June'16. The contract made its high of 77.18 on 23rd June'16 and a low of 76.58 on 22nd June '16 (Weekly Basis). The 14-day Exponential Moving Average of the EUR/INR is currently at 76.42.
On the daily chart, EUR/INR has Relative Strength Index (14-day) value of 50.00. One can sell around 76.20 for a target of 75.40 with the stop loss of 76.60
JPY/NR (JULY) contract closed at 63.98 on 23rd June'16. The contract made its high of 65.13 on 21st June '16 and a low of 63.96 on 23rd June'16 (Weekly Basis). The 14-day Exponential Moving Average of the JPY/INR is currently at 63.29
On the daily chart, JPY/INR has Relative Strength Index (14-day) value of 50.00. One can buy around 66.00 for a target of 67.50c with the stop loss of 65.25.
Market Stance
Currencies worldwide witnessed a heightened volatility last week with Indian
Rupee tumbling sharply against the dollar after the final tally suggested 51.8
per cent Britons voted in favour of Brexit. The rupee has witnessed its
steepest fall against the dollar on Friday since November 2013 and tested its
lowest level above 68 since March 1.The British pound slumped 8 per cent to
mark its lowest level against the greenback since 1985 while the euro fell 1.5
per cent to 1.12 a dollar. Moreover, Yen jumped to highest level in three years
on safe haven demand while China's yuan fell to its weakest level against
dollar in more than five years. The doomsday scenario appeared to be playing
out as markets suffered one of their worst days since the 2008 financial crisis
after final results confirmed one of the EU's big three economies would leave
the bloc after four decades.
EUR/INR
USD/INR (JULY) contract closed at 67.63 on 23rdJune'16. The contract made its high of 68.12 on 20thJune'16 and a low of 67.60 on 23rd June'16 (Weekly Basis). The 14-day Exponential Moving Average of the USD/INR is currently at 67.70.
On the daily chart, the USD/INR has Relative Strength Index (14-day) value of 41.49. One can buy around 68.20 for the target of 68.80 with the stop loss of 67.70.
GBP/INR (JULY) contract closed at 100.58 on 23rd June'16. The contract made its high of 100.85 on 23rd June'16 and a low of 98.67 on 20th June '16 (Weekly Basis). The 14-day Exponential Moving Average of the GBP/INR is currently at 98.41.
On the daily chart, GBP/INR has Relative Strength Index (14-day) value of 55.00. One can sell around 95.50 for a target of 94.00 with the stop loss of 96.20.
USD/INRTechnical Recommendation
Economic gauge for the next week
Date Currency Event Previous
27th June USD Markit PMI Composite 50.927th June USD Bank Stress Test Info28th June USD Gross Domestic Product Annualized 0.828th June USD Consumer Confidence 92.629th June EUR Consumer Confidence -7.329th June USD Personal Income (MoM) 0.429th June USD Pending Home Sales (MoM) 5.130th June GBP Gross Domestic Product (YoY) 230th June GBP Gross Domestic Product (QoQ) 0.430th June EUR Consumer Price Index (YoY) -0.130th June EUR ECB Monetary Policy Meeting Accounts30th June USD Initial Jobless Claims 25901st July USD Markit Manufacturing PMI 51.401st July USD ISM Manufacturing PMI 51.3
GBP/INR JPY/INR
14
®

IPO
Issue Composition
Total Issue for Sale 12,618,297QIB 9,463,722 NIB 1,892,744 Retail 1,261,830
In shares
Book Running Lead ManagerAxis Capital LimitedICICI Securities LimitedIIFL Holdings LimitedYES Securities (India) Limited
Name of the registrarLink Intime India Private Limited
Issue Highlights
Industry Services
Total Issue (Shares) - Fresh Issue 12,618,297
Net Offer to the Public 12,618,297
Issue Size (`Cr.) 391-400
Price Band (`) 310-317
Offer Date 29-Jun-16
Close Date 1-Jul-16
Face Value Rs. 10
Lot Size 45
QUESS CORP LIMITED
Shareholding Pattern (%)
Particulars Pre-issue Post issue
Promoters & promoters group 99.51% 89.54%
QIB 0.00% 7.51%
NIB 10.00% 1.50%
Retail 0.49% 1.45%
Total 100.00% 100.00%
Objects of the Issue
1. Repayment of debt availed by our Company;
2. Funding capital expenditure requirements of our Company and our Subsidiary, MFX US;
3. Funding incremental working capital requirement of our Company;
4. Acquisitions and other strategic initiatives; and
5. General corporate purposes
Business OverviewIncorporated in 2007, Quess Corp Limited is integrated business services provider in India mainly focused on emerging as the preferred partner for handling end-to-end business functions of their clients. Quess offers services across many sectors like IT and ITES staffing, managing facilities, F&B sector, skill development training, general staffing, HR solutions, engineering services, etc. Headquartered in Bengaluru, the Company has pan-India presence with 47 offices across 26 cities, as well as operations in North America, the Middle East and South East Asia. It serves over 1300+ customers across 4 segments namely, Global Technology Solutions, People & Services, Integrated Facility Management and Industrial Asset Management.
StrengthsLeading integrated business services provider in diversified business segments, industries and geographies: The Company is a leading integrated business services provider in India providing comprehensive business solutions to a wide range of industries. As of March 31, 2016, its operations are spread across India with 47 offices across 26 cities in India. The company also offers certain of its services in a number of jurisdictions in North America, the Middle East and South East Asia. Track record of successful inorganic growth with improved financial performance: The company has established a track record of successful inorganic growth through strategic acquisitions to supplement its business verticals, diversify its revenue streams, and integrate such acquired businesses to further strengthen its service portfolio. Track record of growth and improved operating efficiencies and margins through business cycles: The Company has established a track record of rapid growth as well as improved operating margins in recent years. The company believes that it's strong performance through the recent economic downturn in India and internationally reflects the inherent essential nature of the business services the Company provides its strong value proposition and its management's focus on financial performance. Robust recruitment capability, deep domain knowledge and knowledge of labor regulations: The company believes that its ability to meet the staffing and other business service requirements of its clients across various jurisdictions and industries in a timely manner provides it a significant competitive advantage. As of February 29, 2016, the Company employed over 1,050 full-time specialized recruiters across various business segments and industries. Established relationship with clients leading to recurring business: The company believes it has over the years developed long-term established relationships with its clients leading to recurrent business. The company believes that its client retention levels reflect its ability to deliver complex business processes across various industries, the value-added nature of its business services and solutions, and the quality of its consistent client servicing standards.
StrategyExpand its service portfolio and its operations globally through strategic acquisitions: The company believes that the highly fragmented nature of the industries the company operates in will, continue to offer consolidation opportunities, and the company intends to continue its strategic expansion plans through inorganic growth opportunities in underserved markets and geographies that complement its existing operations. Through strategic acquisitions, the Company intends to increase its market share, enable access to new clients and enter high-growth geographies in a cost effective manner. Continue to improve operating margins: The company continues to improve its operating margins through a gradual shift of its service portfolio towards higher margin businesses and actively investing in developing such businesses. The company also continues to pursue higher margin business opportunities internationally, including in the Middle East and in South East Asia, for Its IAM business.Capitalize on the rapid growth of e-commerce in India and pursue other B2C opportunities: The company intends to capitalize on the rapid growth of the e-commerce ecosystem in India. The company continues to move away from “personnel and material” contracts to SLA based contracts, in particular providing last mile delivery services under the Dependo brand. As of March 31, 2016 the Company operates last mile delivery services across seven cities.Focus on domain depth and operational excellence: The company has in recent years streamlined its sales and client delivery teams according to specific business verticals and industry segments. The company believes that its industry specific and business service specific operations will result in increased domain knowledge, higher client focus, and industry specific skill sets for its Associate Employees, client account managers and recruitment personnel.
Risks�Business and operations are subject to various risks relating to the recent acquisitions�The company is subject to certain terms and conditions under the share purchase agreement relating
to the acquisition of MFX�Acquisition of Brainhunter Systems Limited is challenged under Indian laws�Three companies and entities acquired are loss making�Negative cash flows in the past
ValuationConsidering the P/E valuation on the upper end of the price band of ̀ 317, the stock is priced at pre issue P/E of 40.59x on its FY16 EPS of ̀ 7.81. Post issue, the stock is priced at a P/E of 45.10x on its EPS of ̀ 7.03. Looking at the P/B ratio at `317 the stock is priced at P/B ratio of 10.40x on the pre issue book value of `30.49 and on the post issue book value of ̀ 59.19 the P/B comes out to 5.36x.On the lower end of the price band of ̀ 310 the stock is priced at pre issue P/E of 39.69x on its FY16 EPS of `7.81. Post issue, the stock is priced at a P/E of 44.11x on its EPS of ̀ 7.03. Looking at the P/B ratio at ̀ 310, the stock is priced at P/B ratio of 10.17x on the pre issue book value of ̀ 30.49 and on the post issue book value of ̀ 59.19, the P/B comes out to 5.24x.
SMC Ranking
Outlook
Quess Corp offers comprehensive solutions to its clients including recruitment, temporary staffing, technology staffing, IT products and solutions, skill development, payroll, compliance management, integrated facility management and industrial asset management services.
The capital so raised will be majorly utilised for debt repayment, Capex of Quess and its subsidiary MFXchange US, incremental working capital requirement and acquisitions if any.
A long term investor can opt this issue.
(2/5)
15
®

®
17
FIXED DEPOSIT MONITOR
• Interest structure may be revised by company from time to time. Pls confirm Interest rates before submitting the application.
* For Application Greater Than Rs. Fifty Lakhs Or equal to Fifty Lakhs, Please Contact to Head Office.
* Email us at [email protected]
FIXED DEPOSIT COMPANIES
PERIOD MIN.ADDITIONAL RATE OF INTEREST (%)
S.NO (NBFC COMPANY -NAME)12M 18M 24M 36M 45M 48M 60M 84M INVESTMENT
1 BAJAJ FINANCE LTD.(UPTO RS. 5 CR.) 8.55 8.65 8.65 8.65 - 8.65 8.65 - 0.25% FOR SR. CITIZEN, 0.10% FOR DELHI NCR &
EXISTING LOAN CUSTOMER AND ON MUMBAI-75000,
RENEWAL UPTO RS. 1CRORE OTHER-50000/-
2 DEWAN HOUSING FINANCE CORPORATION LTD 13M=8.75% 14M=8.75% 18M=8.85% 40M=8.90% 0.25% EXTRA FOR SR. CITIZEN,WIDOW, 13M=50000;
ARMED, PERSONNEL, EXISTING DHFL HOME 14M=10000;
BORROWERS, 0.25% EXTRA FOR DEPOSIT 40M=2000
50 LAC AND ABOVE
3 DEWAN HOUSING FINANCE CORPORATION LTD (AASHRAY) 8.50 - 8.75 8.75 - 8.75 - 8.75 10,000/-
4 GRUH FINANCE LTD. 7.50 13M=7.50 7.75 8.00 - 8.00 8.00 8.00 96-120M=8.00%; 0.25% FOR FEMALE,
SR. CITIZEN & TRUST 1000/-
5 HDFC PREMIUM DEPOSIT FOR INDIVIUAL (UPTO RS. 2 CR.) 15M=8.35 22M=8.40 30M=8.35 44M=8.40 - 0.25% FOR SR. CITIZEN UPTO RS. 1 CR. 20000/-, 40000/-
IN MONTHLY
6 HDFC PREMIUM DEPOSIT FOR TRUST & INSTITUTION (UPTO RS. 10 CR.) 20M=8.30 - 40M=8.30 -
7 HDFC LTD FOR INDIVIDUAL & TRUST (UPTO RS.5 CR.) 8.25 - 8.25 8.25 - 8.25 8.25 - 0.25% FOR SR. CITIZEN UPTO RS. 1 CR.
8 HDFC LTD FOR INDIVIDUAL & TRUST (ABOVE RS.5 CR. TO RS.10 CR.) 8.15 - 8.15 8.15 - 8.15 8.15 - 0.25% FOR SR. CITIZEN UPTO RS. 1 CR.
9 HUDCO LTD.(IND & HUF) 7.70 - 7.70 7.70 - 7.70 7.55 7.55 0.25% FOR SR. CITIZEN 10000/-
10 HUDCO LTD.(TRUST/CO/INSTITUTION) 7.50 - 7.50 7.50 - 7.50 7.50 7.50 - 10000/-
11 LIC HOUSING FINANCE LTD.(UPTO RS. 5 CR.) 8.25 8.25 8.35 8.40 - - 8.50 - 0.25% FOR SR. CITIZEN IF APP ABOVE 10000/-
RS. 50,000/- & 0.10% IF APP UPTO RS. 50,000/-
12 M&M FINANCIAL SERVICES LTD (FOR BELOW RS. 1 CRORE) 8.45 8.45 8.45 8.45 - 8.45 8.45 - 0.25% FOR SR. CITIZEN 10000/-
13 PNB HOUSING FINANCE LTD.(UPTO RS. 5 CR.) 8.00 - 8.00 8.25 - 8.25 8.25 8.25 0.25% EXTRA FOR SR. CITIZEN UPTO RS.1 CRORE 20000/-
14 PNB HOUSING FINANCE LTD.(UPTO RS. 5 CR.) 15M=8.05 22M=8.05 30M=8.35 44M=8.45 - 0.25% FOR SR. CITIZEN
15 SHRIRAM TRANSPORT FINANCE-UNNATI SCHEME 8.25 - 8.25 8.50 - 8.75 8.75 - 0.25% FOR SR. CITIZEN 5000/-
16 SHRIRAM CITY UNION SCHEME 8.25 - 8.25 8.50 - 8.75 8.75 - 0.25% FOR SR. CITIZEN 5000/-
(FOR TRUST ONLY) (FOR WOMEN ONLY)

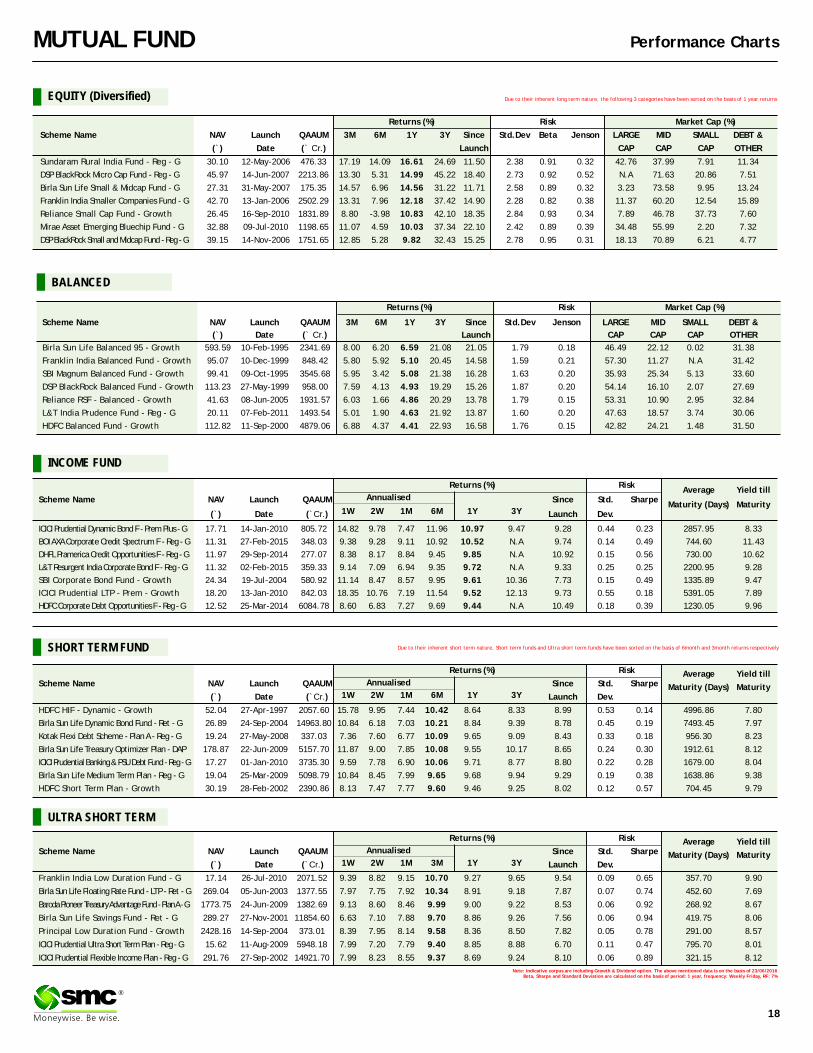
Returns (%) Risk Market Cap (%)
Scheme Name NAV Launch QAAUM 3M 6M 1Y 3Y Since Std.Dev Jenson LARGE MID SMALL DEBT &
(`) Date (` Cr.) Launch CAP CAP CAP OTHER
Birla Sun Life Balanced 95 - Growth 593.59 10-Feb-1995 2341.69 8.00 6.20 6.59 21.08 21.05 1.79 0.18 46.49 22.12 0.02 31.38
Franklin India Balanced Fund - Growth 95.07 10-Dec-1999 848.42 5.80 5.92 5.10 20.45 14.58 1.59 0.21 57.30 11.27 N.A 31.42
SBI Magnum Balanced Fund - Growth 99.41 09-Oct-1995 3545.68 5.95 3.42 5.08 21.38 16.28 1.63 0.20 35.93 25.34 5.13 33.60
DSP BlackRock Balanced Fund - Growth 113.23 27-May-1999 958.00 7.59 4.13 4.93 19.29 15.26 1.87 0.20 54.14 16.10 2.07 27.69
Reliance RSF - Balanced - Growth 41.63 08-Jun-2005 1931.57 6.03 1.66 4.86 20.29 13.78 1.79 0.15 53.31 10.90 2.95 32.84
L&T India Prudence Fund - Reg - G 20.11 07-Feb-2011 1493.54 5.01 1.90 4.63 21.92 13.87 1.60 0.20 47.63 18.57 3.74 30.06
HDFC Balanced Fund - Growth 112.82 11-Sep-2000 4879.06 6.88 4.37 4.41 22.93 16.58 1.76 0.15 42.82 24.21 1.48 31.50
Annualised
Returns (%) RiskAverage Yield till
Scheme Name NAV Launch QAAUM Since Std. SharpeMaturity (Days) Maturity
1W 2W 1M 6M 1Y 3Y(`) Date (`Cr.) Launch Dev.
ICICI Prudential Dynamic Bond F - Prem Plus - G 17.71 14-Jan-2010 805.72 14.82 9.78 7.47 11.96 10.97 9.47 9.28 0.44 0.23 2857.95 8.33
BOI AXA Corporate Credit Spectrum F - Reg - G 11.31 27-Feb-2015 348.03 9.38 9.28 9.11 10.92 10.52 N.A 9.74 0.14 0.49 744.60 11.43
DHFL Pramerica Credit Opportunities F - Reg - G 11.97 29-Sep-2014 277.07 8.38 8.17 8.84 9.45 9.85 N.A 10.92 0.15 0.56 730.00 10.62
L&T Resurgent India Corporate Bond F - Reg - G 11.32 02-Feb-2015 359.33 9.14 7.09 6.94 9.35 9.72 N.A 9.33 0.25 0.25 2200.95 9.28
SBI Corporate Bond Fund - Growth 24.34 19-Jul-2004 580.92 11.14 8.47 8.57 9.95 9.61 10.36 7.73 0.15 0.49 1335.89 9.47
ICICI Prudential LTP - Prem - Growth 18.20 13-Jan-2010 842.03 18.35 10.76 7.19 11.54 9.52 12.13 9.73 0.55 0.18 5391.05 7.89
HDFC Corporate Debt Opportunities F - Reg - G 12.52 25-Mar-2014 6084.78 8.60 6.83 7.27 9.69 9.44 N.A 10.49 0.18 0.39 1230.05 9.96
Returns (%) Risk Average Yield tillScheme Name NAV Launch QAAUM Since Std. Sharpe Maturity (Days) Maturity
1W 2W 1M 6M 1Y 3Y(`) Date (`Cr.) Launch Dev.
HDFC HIF - Dynamic - Growth 52.04 27-Apr-1997 2057.60 15.78 9.95 7.44 10.42 8.64 8.33 8.99 0.53 0.14 4996.86 7.80
Birla Sun Life Dynamic Bond Fund - Ret - G 26.89 24-Sep-2004 14963.80 10.84 6.18 7.03 10.21 8.84 9.39 8.78 0.45 0.19 7493.45 7.97
Kotak Flexi Debt Scheme - Plan A - Reg - G 19.24 27-May-2008 337.03 7.36 7.60 6.77 10.09 9.65 9.09 8.43 0.33 0.18 956.30 8.23
Birla Sun Life Treasury Optimizer Plan - DAP 178.87 22-Jun-2009 5157.70 11.87 9.00 7.85 10.08 9.55 10.17 8.65 0.24 0.30 1912.61 8.12
ICICI Prudential Banking & PSU Debt Fund - Reg - G 17.27 01-Jan-2010 3735.30 9.59 7.78 6.90 10.06 9.71 8.77 8.80 0.22 0.28 1679.00 8.04
Birla Sun Life Medium Term Plan - Reg - G 19.04 25-Mar-2009 5098.79 10.84 8.45 7.99 9.65 9.68 9.94 9.29 0.19 0.38 1638.86 9.38
HDFC Short Term Plan - Growth 30.19 28-Feb-2002 2390.86 8.13 7.47 7.77 9.60 9.46 9.25 8.02 0.12 0.57 704.45 9.79
Returns (%) Risk Average Yield tillScheme Name NAV Launch QAAUM Since Std. Sharpe Maturity (Days) Maturity
1W 2W 1M 3M 1Y 3Y(`) Date (`Cr.) Launch Dev.
Franklin India Low Duration Fund - G 17.14 26-Jul-2010 2071.52 9.39 8.82 9.15 10.70 9.27 9.65 9.54 0.09 0.65 357.70 9.90
Birla Sun Life Floating Rate Fund - LTP - Ret - G 269.04 05-Jun-2003 1377.55 7.97 7.75 7.92 10.34 8.91 9.18 7.87 0.07 0.74 452.60 7.69
Baroda Pioneer Treasury Advantage Fund - Plan A - G 1773.75 24-Jun-2009 1382.69 9.13 8.60 8.46 9.99 9.00 9.22 8.53 0.06 0.92 268.92 8.67
Birla Sun Life Savings Fund - Ret - G 289.27 27-Nov-2001 11854.60 6.63 7.10 7.88 9.70 8.86 9.26 7.56 0.06 0.94 419.75 8.06
Principal Low Duration Fund - Growth 2428.16 14-Sep-2004 373.01 8.39 7.95 8.14 9.58 8.36 8.50 7.82 0.05 0.78 291.00 8.57
ICICI Prudential Ultra Short Term Plan - Reg - G 15.62 11-Aug-2009 5948.18 7.99 7.20 7.79 9.40 8.85 8.88 6.70 0.11 0.47 795.70 8.01
ICICI Prudential Flexible Income Plan - Reg - G 291.76 27-Sep-2002 14921.70 7.99 8.23 8.55 9.37 8.69 9.24 8.10 0.06 0.89 321.15 8.12
Returns (%) Risk Market Cap (%)
Scheme Name NAV Launch QAAUM 3M 6M 1Y 3Y Since Std.Dev Beta Jenson LARGE MID SMALL DEBT &
(`) Date (` Cr.) Launch CAP CAP CAP OTHER
Sundaram Rural India Fund - Reg - G 30.10 12-May-2006 476.33 17.19 14.09 16.61 24.69 11.50 2.38 0.91 0.32 42.76 37.99 7.91 11.34
DSP BlackRock Micro Cap Fund - Reg - G 45.97 14-Jun-2007 2213.86 13.30 5.31 14.99 45.22 18.40 2.73 0.92 0.52 N.A 71.63 20.86 7.51
Birla Sun Life Small & Midcap Fund - G 27.31 31-May-2007 175.35 14.57 6.96 14.56 31.22 11.71 2.58 0.89 0.32 3.23 73.58 9.95 13.24
Franklin India Smaller Companies Fund - G 42.70 13-Jan-2006 2502.29 13.31 7.96 12.18 37.42 14.90 2.28 0.82 0.38 11.37 60.20 12.54 15.89
Reliance Small Cap Fund - Growth 26.45 16-Sep-2010 1831.89 8.80 -3.98 10.83 42.10 18.35 2.84 0.93 0.34 7.89 46.78 37.73 7.60
Mirae Asset Emerging Bluechip Fund - G 32.88 09-Jul-2010 1198.65 11.07 4.59 10.03 37.34 22.10 2.42 0.89 0.39 34.48 55.99 2.20 7.32
DSP BlackRock Small and Midcap Fund - Reg - G 39.15 14-Nov-2006 1751.65 12.85 5.28 9.82 32.43 15.25 2.78 0.95 0.31 18.13 70.89 6.21 4.77
Note: Indicative corpus are including Growth & Dividend option. The above mentioned data is on the basis of 23/06/2016Beta, Sharpe and Standard Deviation are calculated on the basis of period: 1 year, frequency: Weekly Friday, RF: 7%
Annualised
18
MUTUAL FUND Performance Charts
EQUITY (Diversified)
INCOME FUND
ULTRA SHORT TERM
SHORT TERM FUND
Due to their inherent long term nature, the following 3 categories have been sorted on the basis of 1 year returns
Due to their inherent short term nature, Short term funds and Ultra short term funds have been sorted on the basis of 6month and 3month returns respectively
Annualised
®
BALANCED

Mr. S C Aggarwal (CMD, SMC Group) with H E Mr. Prayut Chan-o-cha, Prime Minister of Thailand on 17th June 2016 at Hotel ITC Maurya Hotel, New Delhi
during the Business Seminar “India-Thailand: Partners in Progress for Greater Economic Cooperation” organized by Assocham.
Inauguration of SMC's new branch at Kanpur, (UP) on 24th June 2016.
