2016 integrated report - schneider electric integrated report schneider-electric.com. ... 2016) and...
TRANSCRIPT

2016 Integrated report
schneider-electric.com
Envisioning a sustainable future by solving the energy paradox
Table of contents
Who: This report aims to initiate a dialogue with all our stakeholders about our strategy to create and share value.
What: This integrated report presents a global vision of Schneider Electric in its environment, its value creation strategy, business model and governance. It includes the main key performance indicators and presents relations with its stakeholders and the significant achievements of the year.
How: This report is based on the principles of integrated thinking and the framework proposed by the IIRC (International Integrated Reporting Council). The Group also uses the Global Reporting Initiative (GRI), the United Nations’ Global Compact and the ISO 26000 norm, which are international standards for reporting and information.
Why: This report forms part of a proactive approach towards dialogue and progress, and is an extension of our Planet & Society Barometer, which since 2005 has guided our commitments when it comes to sustainable development.
When and where: This report covers the fiscal year 2016 (January 1, 2016, to December 31, 2016) and Schneider Electric's entities consolidated in the financial scope. It is available in both French and English from April 2017.
About this report
Editorial 1
Profile of the Group 2
Our ecosystem Market trends creating opportunities 3
Our strategy A strategy serving energy transition technologies 5
Our business model An integrated offer and leadership positions in our businesses 6
Our products and solutions Our products and services to meet tomorrow's challenges 8
Our objectives and results Three-year targets and tangible progress 10
Our value creation Creating shared value with our stakeholders 15
Our governance Mobilized governance for sustainable growth 25
@schneiderelec

Schneider Electric | 2016 INTEGRATED REPORT 1
Fortune Magazine24th/50 “Companies That Are Changing the World”
DJSI1st in our sector for the 4th year in a row
CDP Climate LeaderOn the “Climate A” list for the 6th year running
Ethisphere®,most ethical companiesListed for the 7th consecutive year
FTSE4GoodListed for the 1st time since this index was launched in 2001
3rd company worldwide for energy transitionOn the Carbon Clean 200 List
27th most sustainable corporationOn the Global 100 most sustainable corporations in the world
10th greenest companyOn the NewsWeek Global Green Ranking
Vigeo Eiris1st in our sector
Oekom1st in our sector
Emmanuel LagarrigueExecutive Vice-President Strategy,Schneider Electric
EDITORIAL
As a company involved in energy transition, Schneider Electric is committed to creating sustainable value that is shared with its customers and all its stakeholders.
Performance recognized by our stakeholders
At Schneider Electric, we are convinced that better climate means better economy. This is why we have built our strategy around sustainable development and why we strive to create long-term value that is shared with all our customers and stakeholders. This objective is embodied in our commitments – achieving carbon neutrality by 2030 has become a strategic priority – and we share it on a daily basis with our 144,000 employees.
In 2016, the second year of our company program Schneider is On, we made steady progress, and we passed the benefits of the five pillars of the program on to our customers: Do More, Simplify, Digitize, Innovate and Step Up. We achieved all our main financial targets and, in earning a score of 8.48/10, surpassed the target set by our Planet & Society Barometer.
At this critical juncture, when new technologies enable us to completely rethink the way we deal with energy, our role is to make sure that Life Is On for everyone, everywhere, at every moment. This is accomplished through the rollout of connected solutions for energy management and efficiency, improved access to energy, and ongoing investment in our talent and the transformation of our processes.
Consequently, our innovation capacity, which is constantly being rejuvenated, is a key component that helps us better meet the expectations of our customers and stakeholders and anticipate their future needs. It helps us do more with less in order to address the world’s major challenges, both present and future. Through our businesses and expertise – renewable energies, digitization, smart grids, buildings and cities – we are also working toward the achievement of the United Nations Sustainable Development Goals. Innovation and sustainable development therefore need to become synonyms.
In terms of operations, this dynamic is manifested in the 2016 launch of many products and our EcoStruxure™ digital architecture. With its potential in the areas of buildings, electrical distribution, data centers, machines, factories and electricity grids, EcoStruxure™ embodies what we call « innovation at every level » and is a way for us to provide our customers with additional value. We now have 15% more connected products, and the proportion of our connected customers has jumped by 40%.
We invite you to learn more about our initiatives in this second integrated report.

2 2016 INTEGRATED REPORT | Schneider Electric
PROFILE OF THE GROUP
Profile of the Group
Schneider Electric, the global specialist in energy management and automation, brings together its expertise and solutions for its customers to make sure that energy is safe, reliable, efficient, connected and sustainable.
144,000 employees
in over 100 countries 44% of revenues as solutions
22.8 m3 water consumption per employee
467,121 tCO2 scopes 1 and 2
€ 24.7 billion
revenues
41% of revenues in new economies
€ 3.5 billion adjusted EBITA
200 plants and
90 distribution centers around the world
0.75 frequency rate of accidents per
million hours worked
5% of revenues devoted to
R&D
Four integrated and synergetic businesses (2016 revenues)
28%North
America 27%Asia
Pacific
18%Rest of the
world
27%Western Europe
Balanced geographies (2016 revenues)
43%Building
22%Industry
15%IT
20%Infrastructure
2016 key figures

Schneider Electric | 2016 INTEGRATED REPORT 3
OUR ECOSYSTEM
Market trends creating opportunitiesUrbanization, industrialization and digitization create numerous opportunities for Schneider Electric: from rising needs in automation and connectivity to the enormous need for energy efficiency, which requires an optimized use of resources.
TREND
Cities today are the home to over 50% of the world’s population, consume more than 70% of global energy consumption and are responsible for 75% of greenhouse gas emissions. Cities are continuing to grow: by 2040, they will house an additional 1.9 billion people.
CHALLENGES FOR OUR CUSTOMERS
Cities face challenges of unprecedented scale:• Scarcity of resources such as energy and water;• Environmental pressure and pollution;• Aging and overloaded infrastructure;• Traffic congestion and security concerns.
OPPORTUNITIES FOR SCHNEIDER
ELECTRIC
What cities need today are solutions that:• Deliver the services and savings that inhabitants deserve (integrated services for
security, mobility, weather forecasting, management of energy, water, waste, etc.);• Provide visible, measurable results that increase their appeal;• Limit upfront investments so they can balance their budget.
TREND
Manufacturing activities rise as new economies develop. The needs in terms of global energy demand of economies outside the OECD are poised to grow from 59% in 2014 to nearly 65% by 2030, against a backdrop of increasing population growth and increased industrialization, urbanization and wealth. This global industrial energy use is projected to double by 2050 in the absence of any new environmental measures.
CHALLENGES FOR OUR CUSTOMERS
Industries have a major impact on energy and environmental challenges:• Increase in total world energy consumption, given that industries account today for
one-third;• Increase in associated greenhouse gas emissions.
OPPORTUNITIES FOR SCHNEIDER
ELECTRIC
Industries need innovative solutions and further services to:• Support development in new economies, and meet their growing needs in energy;• Achieve efficiency gains and proceed with facility upgrades in mature countries.
Urbanization: +1.9 billion people in cities in 2040 (Source: IEA, World Energy Outlook 2016)
Industrialization: +50% energy consumption by 2050 (Source : IEA, World Energy Outlook 2016)

4 2016 INTEGRATED REPORT | Schneider Electric
OUR ECOSYSTEM
• Electric: By 2040, electricity demand will grow 2 times faster than energy demand. 3 times more energy efficiency will be necessary to solve the climate challenge by then.
• Digital: New technologies enable us to completely rethink the way we deal with energy in a far more sustainable and efficient manner. They make our customers’ life easier, increase productivity, create new business models that provide new value propositions for their own customers. In 2020, there will be 20 times more connected devices than connected people.
• Decarbonized: Renewable energy sources will account for 60% of all new power generation capacity by 2040. 79% of the economic potential of energy efficiency in buildings, and more than half in industry, remains untapped.
• Decentralized: Microgrids, distributed energy resources (DER) and energy storage allow consumers to produce their own energy and shift to a greener energy mix. By 2040, renewable energies will constitute 70% of new capacity in rural areas.
The impact of these challenges on our markets: our world will be more…
+ Registration Document 2016 Chapter 1 - Section 1.2
+ http://www.schneider-electric.com/b2b/en/campaign/innovation/overview.jsp
TRENDIn the past 20 years, the Internet has connected 3.5 billion people together. In the coming ten years, this number will grow by over 70%. Additionally, the Internet will connect 30 billion devices by 2020.
CHALLENGES FOR OUR CUSTOMERS
Increased connectivity and real-time access to information are having an overwhelming impact on our personal and professional lives:• Digitization of operations;• Online information (e-training, digital customer service, e-orders);• Online platforms and tools to collaborate more efficiently.
OPPORTUNITIES FOR SCHNEIDER
ELECTRIC
Customers expect:• Products with open interfaces and functionality meeting mobile devices;• Active implementation of energy efficiency through new business models in smart
products, systems and services.
Digitization: 30 billion connected things by 2020 (Source : IHS Markit)

Schneider Electric | 2016 INTEGRATED REPORT 5
OUR STRATEGY
A strategy serving energy transition technologies
Schneider Electric’s strategy is responding to today’s market trends and new customer needs in six strategic ways.
DIGITIZATION
INDUSTRIALIZATION
URBANIZATION
We strive to answer the world’s new energy challenges by providing energy efficiency everywhere: in our homes, buildings and cities, in industry, the grid and throughout remote communities.
We serve the increasing need for automation as a proven way to help customers thrive. Customers have asked for improved productivity, precision, and efficiency. We’re answering them.
We pledge to support the digital transformation of customers and partners through continuous innovations in converged technologies to increase productivity, facilitate new business models, and make life easier all around.
We are expanding our presence in new economies to leverage opportunities to respond to ever-growing energy, infrastructure, and industrialization needs through dedicated offers.
We advance both product and solution business models to create new opportunities for customers, distributors, and direct partners as we work together to improve efficiency everywhere.
We care about profit but only within the context of responsible, sustainable growth that nurtures concrete efficiency improvements based on our trusted research and development.
Leveraging new energy challenges
Investing while driving efficiency
Building two complementary business models
Serving the increasing need for automation
Supporting the digital transformation
Leveraging the opportunity from new economies
2
3
4
5
6
1
+ Registration Document 2016 Chapter 1 - Section 1.3
A strategy that leverages market opportunities

6 2016 INTEGRATED REPORT | Schneider Electric
OUR BUSINESS MODEL
An integrated offer and leadership positions in our businessesAs the global specialist in energy management and automation, our mission is to make sure that Life is On for everyone, everywhere and at every moment with our technology. Schneider Electric proposes an integrated offer of technologies and market-leading solutions tailored to customer needs, supporting a more decarbonized, digitized, decentralized and electric energy.
Our end-markets (2016 revenues)
36%BuildingsNon-residential (public, commercial and industrial) and residential buildings
28%IndustriesIndustries and machine manufacturers
21%InfrastructureUtilities and infrastructure
15%Data centersSecure, precision-cooled sites that process and store very large quantities of digital data
Weight of our expertise by market Energy management Automation and Software
Our expertise
Energy management• Electrical distribution and
transformation• Measurement and control
of energy consumption and quality
• Energy security
Automation• Utility management (lighting,
air conditioning, heating)• Automation, control and
supervision of processes• Control and supervision
of machines• Decentralized site management
Software• Creation and management
of smart grids• Digitization of operations
+ Registration Document 2016 Chapter 1 Sections 2.1 et 2.2

Schneider Electric | 2016 INTEGRATED REPORT 7
OUR BUSINESS MODEL
Our products and solutions (2016 revenues)
43%Building
Low voltageN°1 worldwide
• Low voltage electrical distribution products and solutions
Building automation N°1 worldwide
• Building comfort and energy efficiency
22%Industry
Discrete industrial automationN°2 worldwide
• Comprehensive products and solutions for automation and control of machines, manufacturing plants and industrial sites
Process automation N°4 worldwide
• Distributed control, instrumentation and safety systems
• Industrial software offer for manufacturing operations management, modeling/simulation and asset management
20%Infrastructure
Medium voltageN°1 worldwide
• Medium voltage electrical distribution products and solutions
Grid automation N°1 worldwide
• Electricity grid protection and automation solutions
• Integrated management software for mission-critical infrastructure (distribution management, traffic management, etc.)
15%IT
Critical Power, Cooling & Services N°1 worldwide
• Critical power products and solutions that guarantee the continuity and quality of the electrical power
+ Registration Document 2016 Chapter 1 Sections 2.1 et 2.2

8 2016 INTEGRATED REPORT | Schneider Electric
OUR PRODUCTS AND SOLUTIONS
Our products and services to meet tomorrow's challenges
Although Schneider Electric’s four markets consume 70% of energy worldwide, the Group continues to innovate at every level in order to redefine energy management and automation.
Combined with digitization, the convergence of operational technology (OT) and information technology (IT) creates many opportunities for customers. It makes their lives easier, increases their productivity and promotes the emergence of innovative value propositions for their customers. At the center of this future growth and through continuous innovation, Schneider Electric engineers products and solutions that help them unlock this potential.
This work culminated in the November 2016 launch of EcoStruxure™, Schneider Electric’s architecture and platform for the large-scale rollout of IoT (Internet of Things) solutions for the building, data center, industry and network markets.
With EcoStruxure™, we have harnessed technological advances to provide innovation at every level of a company or organization, products that are connected to data management and control, to applications, analytical data and services. Our aim is to enable Internet of Things solutions to connect to one another transparently and to collect, analyze and take action on data in real time, and thus offer improved security, efficiency, reliability and sustainability.
+ Strategy & Sustainability Highlights 2016-2017 Section our solutions and customers
Building Data center Industry Grid
Building Power Data Center Machine Plant Grid
Apps, Analytics, and Services
Edge Control
Connected Products
End-to-end Cyber
Security
Cloud and/or
On-premise
EcoStruxure™ Platform
EcoStruxure™: Innovation at every level

Schneider Electric | 2016 INTEGRATED REPORT 9
OUR PRODUCTS AND SOLUTIONS
Our integrated and open solutions, which are structured around four businesses, improve the energy and economic performance of facilities while conserving resources and helping to create a more sustainable world.
More than 300 innovative solutionslaunched in 2016 in Schneider Electric’s four business segments
+ Strategy & Sustainability Highlights 2016-2017 Section our solutions and customers
Low Voltage electrical distribution products and solutions address the needs of all end-markets from residential to commercial buildings, spanning industries, infrastructures and data centers. Building automation helps to enhance the comfort and energy efficiency of non-residential buildings.
Inno
vatio
nThe Masterpact™ MTZ air circuit breaker improves performance, power uptime, reliability, and efficiency via new digital capabilities.
The Industry business scope includes both process and discrete automation, providing comprehensive products and solutions for the automation and control of machines, manufacturing plants and industrial sites.
Inno
vatio
n
The AltivarTM 340 variable speed drive makes building high-performance machines simpler and more cost-effective with application control and automation.
The Infrastructure business provides our customers with the answer to the complex equation of the energy transition.
Inno
vatio
n
The PACiS 5.4 digital control system increases system availability, optimizes existing assets and adapts to the ever-changing environment.
The IT business specializes in critical power products and solutions for data centers and other applications where power continuity and quality is essential.
Inno
vatio
n
The StruxureOn™ digital service improves operations with data-driven insights, smart alarms, and access to data center experts 24/7.
Building
Infrastructure
IT
Industry

10 2016 INTEGRATED REPORT | Schneider Electric
OUR OBJECTIVES AND RESULTS
Do more for the customers to create more opportunities for them, and for Schneider Electric, developing a closer relationship and better access to specialists, a consistent project execution and a unique and flexible delivery experience;
Simplify work and operations to make the company leaner, further increase supply-chain productivity, optimize R&D efficiency, sales force efficiency, and solution execution;
Propose more connected solutions, enabling new services and improving customers’ life through an end-to-end simple and intuitive customer experience;
Innovate to support growth, focusing on delivering the right products and solutions for customers in a focused and short timeframe, and being a partner of choice in sustainability;
“Step Up” employees through stronger collaboration, enhanced training and a culture of high performance while continuing to have a strong engagement for diversity and workspace satisfaction.
Schneider is On, Schneider Electric’s company program for 2015–2020, is based on five initiatives that aim to create further value for customers and shareholders:
Three-year targets and tangible progress
In 2016, the Group turned in a solid performance and achieved all its main financial targets. The Group is targeting increased profitability in 2017. Schneider Electric is well positioned to benefit over the coming years from two major global investment drivers - energy transition and the industry of the future - by drawing on its global coverage and the complementarity of its business models.

Schneider Electric | 2016 INTEGRATED REPORT 11
OUR OBJECTIVES AND RESULTS
Initiatives Indicators and Objectives 2015–2017
Related stakes 2015 results 2016 results
Growth in service, software and products
Services organic growth ~+7% +5%
Project execution Project hit rate, gross margin Project hit rate and gross margin at booking improved. Gross margin deviation between booking and during execution reduced
Systems gross margin up ~+40 bps (~+70 bps before forex impact) thanks to greater selectivity and better execution
Industrial productivity ~€ 1 billion of industrial productivity
~€0.36 billion €620 million gross support function cost reduction plus industrial productivity (€1.3 billion since 2015)Support Function Costs ~€ 700-800 million gross* SFC
savings~€0.3 billion
Development of connected offers
Number of connected assets +45% +15% vs. 2015
Development of connected customers
Number of connected customers
Undisclosed Unique connected customers: +40% vs. 2015
Growth by innovation Delivering the right products and solutions for customers in a focused and short timeframe
New offer launches aligned with our value proposition
Numerous key launches of products, control platforms and software within EcoStruxure.io
Partner & investment of choice in sustainability
8/10 achieved by the Planet & Society Barometer
6.33/10 8.48/10
Employee engagement 64% scored in the Employee Engagement Index
61% 64%
Gender pay equity 85% of employees in countries with Schneider Electric gender pay equity plan
57% 75%
(*) Before inflation and reinvestment.
Initiatives Indicators and Objectives across the economic cycle
2015 results 2016 results
Average organic revenue growth
3%-6% throughout the cycle -1.0% -0.9 %
Adjusted EBITA Margin between 13% and 17% of revenues 13.7% 14.1 %
Cash conversion ~100% of net profit converted into free cash flow 113% 118 %
ROCE Between 11% and 15% 11 % 10.7 %
Dividend Payout ~50% of net income ~50% ~54%
Capital structure Retain a strong investment grade credit rating A- A-
+ Registration Document 2016 Chapter 1 - Section 4.4
+ Registration Document 2016 Chapter 1 - Section 3
Focus on our financial objectives
Objectives of the Schneider is On company program

12 2016 INTEGRATED REPORT | Schneider Electric
OUR OBJECTIVES AND RESULTS
Focus on our non-financial objectives
Materiality matrix
Green IT
Sustainable Innovation
Access to energy Eco-Design
Renewables Sustainable supply chain
Business ethical standards
Dialog with stakeholders
Energy poverty Energy storage
Sustainable branding Employee health & safety
Eco-ProductionDiversity
Hazardous substances
Interests, compensation and bene�ts
Water usage & pollution
Socially Responsible Investment (SRI)
Social dialog and relations
Developing countries
Human rights
Circular economy
Smart mobility
Energy e�ciency in homes
Sustainable purchases
Digital economy
Climate change
Energy e�ciency in buildings
Sustainable cities
Smart grids
Resource scarcity
Employee engagementand talent attraction
Urbanization
Energy e�ciencyin industry
Energy transition
l
Raising awarenesson sustainability
Impo
rtan
ce fo
r st
akeh
olde
rs
Importance for Schneider Electric
Internal signals
Positive agreement
External signals
2.3
2.3
3.2 4.1
3.2
4.1
5.0
5.0
In 2013, Schneider Electric conducted a materiality analysis by questioning relevant external stakeholders (e.g. customers, media, distributors, international organizations, experts, etc.), and top and senior managers within the Group (Environment, Global Supply Chain, Finance, Human Resources, Business, etc.):
• Six nationalities• 37% women, 63% men• Assessment of the importance of the issues on a scale of 1 to 5• Individual follow-up interviews
The aim is to ensure that Schneider Electric reports against the most important economic, social and environmental issues; identifies current and future opportunities and risks for the business; and updates its sustainability agenda with the key stakeholder expectations. This materiality matrix was one of the sources used for designing the 2015–2017 Planet & Society Barometer.
+ schneider-electric.com “Materiality matrix” section

Schneider Electric | 2016 INTEGRATED REPORT 13
OUR OBJECTIVES AND RESULTS
A tool for engaging, acting and reporting
In devising our sustainable development approach in 2002, we were seeking to answer two simple, but significant, questions:
• How could we mobilize employees to achieve the Group’s sustainable development objectives?• How could we provide our stakeholders with regular, overarching reporting on our sustainable
development initiatives? We found an answer in 2005 by designing the Planet & Society Barometer. This is a tool that offers a comprehensive view of our performance and progress. It presents the Group’s principal three-year targets and the quarterly results for its key performance indicators, and converts them into a score out of 10. For each company program, we design a new Planet & Society Barometer, which is an excellent source of renewal and progress.
CLIMATE
CIRCULARECONOMY
CLIMATE +DEVELOPMENT(Sustainabilityo�ers)
ETHICS
DEVELOPMENT
HEALTH& EQUITY
Start01/2015
Results2015
Target12/2017
Planet & Society barometer(objectives for 2017)
3.00 6.33
Results2016
8.48 9/10Overall score (out of10)
73,339 102,884 123,839 150,000150,000 underprivileged people trained in energy management
460 878 1,065 1,3001,300 missions within Schneider Electric Teachers NGO **
30% reduction in the Medical Incident Rate (MIR) - 17% 33% 30%
61% 61% 64% 64%64% scored in our Employee Engagement Index
79% 85.6% 92% 85%One day training for every employee every year
- 57% 75% 85%85% of employees work in countries with Schneider gender pay equity plan
The 2014 performance serves as a starting value for the Planet & Society barometer of the Schneider is On company program
between 2015 and 2017.
2016 audited indicators.
* This indicators is followed from 2016.
** A methodological change was made in Q4 2016, see Registration Document 2016 Chapter 2 - Section 6.1.
All our entities pass our internalEthics & Responsibility assessment
- 88% 93.4% 100%
75% of product revenue with Green PremiumTM
eco-label60.5% 67.1% 74.8% 75%
100% of new large customer projects with CO2impact quanti�cation
- - * 16% 100%
10% energy savings - 10%7.1% 4.5%
- 10%11.2% 8.4%10% CO2 savings from transportation
10034 64 99 Towards zero waste to land�ll for 100 industrial sites
- 100%13.3% 81.6% 100% of products in R&D designed with Schneider ecoDesign WayTM
- 44,777 101,508 120,000120,000 tons of CO2 avoided through maintenance, retro�t and end-of-life services
- x2.07 x2.1 x5x5 turnover of Access to Energy program to promote development **
48% 64.7% 82.3% 100%100% of our recommended suppliers embraceISO 26000 guidelines
+ Registration Document 2016 Chapter 2 - Section 6.1

14 2016 INTEGRATED REPORT | Schneider Electric
OUR OBJECTIVES AND RESULTS
Schneider Electric’s mission helps to address the energy challenge in its ecosystem: keeping global warming below the critical 2°C while achieving greater operational efficiency.
In 2016, Schneider Electric was one of 193 companies to secure a place on the Climate A list of all the companies participating in the CDP program and the only company in its industry to achieve an A rating for the 6th year running.
On the eve of COP21, Schneider Electric presented ten commitments for sustainability. The objective is to reduce the Group’s emissions across the three scopes of the GHG Protocol and to develop new technologies for energy efficiency so that Schneider Electric and its ecosystem demonstrate carbon neutrality by 2030.
At COP22, Chairman and CEO Jean-Pascal Tricoire signed the Science-based targets initiative on behalf of Schneider Electric. This initiative aims to set greenhouse gas (GHG) emissions reduction targets in line with the worldwide effort to keep global warming below 2°C. With regard to its scopes 1 and 2, the Group has already formulated the objective of cutting its CO2 emissions by 53% in absolute terms from 2015 levels by 2050.
Our ten commitments to achieving carbon neutrality by 2030
Toward carbon neutrality
100% Ensure carbon impact quantification for 100% of new large customer projects (2015–2017)
100% Design 100% of new offers with Schneider Electric ecoDesign Way™ and realize 75% of product revenue with Green Premium™ eco-label (2015-2017)
120,000 Avoid 120,000 metric tons of CO2 through Circular Economy “end-of-life” services (2015–2017)
50 million Facilitate access to lighting and communication with low carbon solutions for 50 million inhabitants at the Base of the Pyramid in ten years (2015–2025)
Storage initiatives Implement storage initiatives to develop renewable energy and microgrids (2015 and beyond)
5 years Solve SF6 issues with new alternatives in five years (2015–2020) and eliminate SF6 from Schneider Electric products in ten years (2015–2025)
3.5 % Reduce Schneider Electric’s energy intensity by 3.5% per year (2015 and beyond)
3.5% Reduce Schneider Electric’s transportation CO2 emissions by 3.5% per year (2015 and beyond)
€10 billion Invest €10 billion in sustainability-related R&D and innovation in the next ten years (2015–2025)
Climate Bond Issue a climate bond to finance low carbon R&D across Schneider Electric businesses (issued at the end of 2015)
101 2 3 4 5 6 7 8 9
The barometer's indicators are notified in green.
Schneider Electric | 2016 INTEGRATED REPORT 15
OUR VALUE CREATION
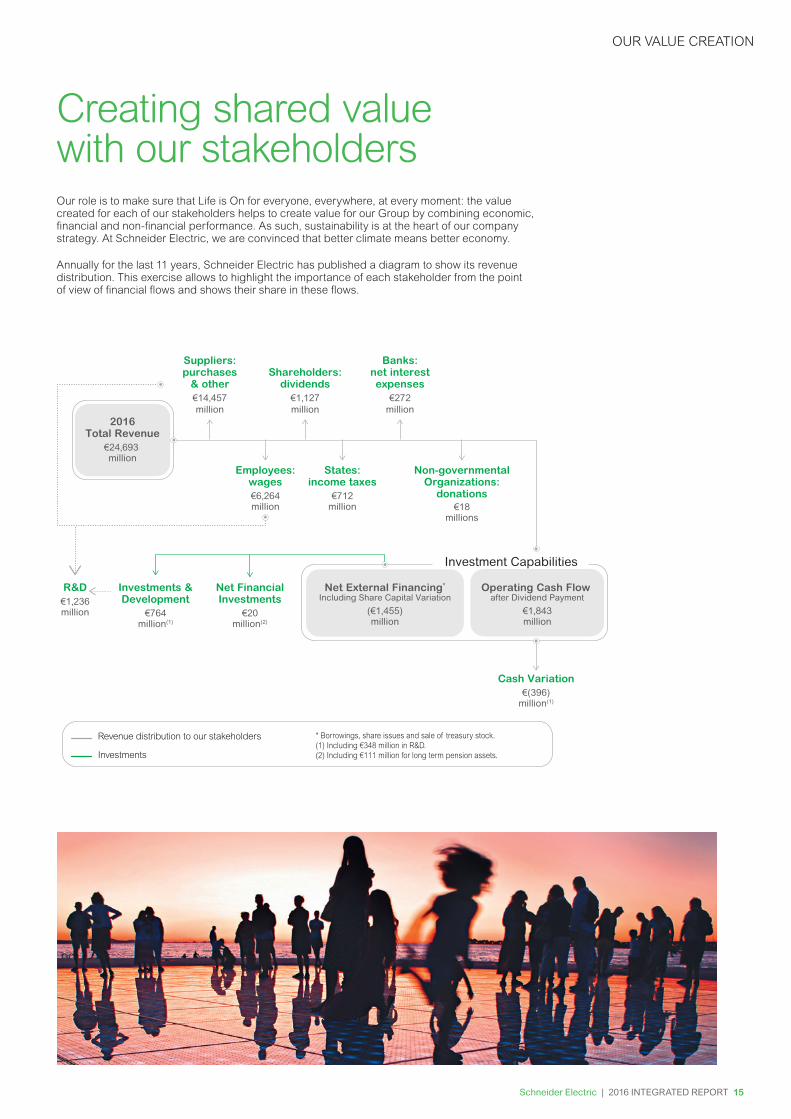
Creating shared value with our stakeholdersOur role is to make sure that Life is On for everyone, everywhere, at every moment: the value created for each of our stakeholders helps to create value for our Group by combining economic, financial and non-financial performance. As such, sustainability is at the heart of our company strategy. At Schneider Electric, we are convinced that better climate means better economy.
Annually for the last 11 years, Schneider Electric has published a diagram to show its revenue distribution. This exercise allows to highlight the importance of each stakeholder from the point of view of financial flows and shows their share in these flows.
Suppliers:purchases
& otherShareholders:
dividends
Banks:net interestexpenses
€14,457million
€1,127million
€272million
R&D€1,236million
Cash Variation€(396)
million(1)
Investments &Development
€764million(1)
Net External Financing*
Including Share Capital Variation
(€1,455)million
Operating Cash Flow after Dividend Payment
€1,843million
Net FinancialInvestments
€20million(2)
Employees:wages€6,264million
States:income taxes
€712million
Non-governmentalOrganizations:
donations€18
millions
million
2016Total Revenue
€24,693
* Borrowings, share issues and sale of treasury stock.(1) Including €348 million in R&D.(2) Including €111 million for long term pension assets.
Revenue distribution to our stakeholders
Investments
Investment Capabilities

16 2016 INTEGRATED REPORT | Schneider Electric
OUR VALUE CREATION
Civil Society
Social
Institutional
Technical
Financial
Partners
Customers
Buildings, Industry,
Infrastructure and Energy
Giméleccompanies
Non-GovernmentalOrganizations,
Media, etc.
Local Residentsand TerritorialCollectivities
Contractors,Integrators,
OEM, SystemsManufacturers,
DistributorsSocial
Partners & Bodies,UIMM, etc.
Employees
Authorities andGlobal Compact
Legislators,European Commission
ILO, OECD, etc.
Other StandardizationBodies, Teaching and
Research, IndependentExperts, etc.
StandardizationBodies IECand ProductCerti�cation
Shareholders,Investors, Banks
and Insurers
SRI, Financial &Extra-FinancialAnalysts, etc.
Groups& Professional
Unions,Consortiums,
Joint Ventures, etc.Suppliers and
Subcontractors
The diagram below is an overview of sector stakeholders proposed in France by Gimélec(1), the French trade association for electrical equipment, automation and related services.
Schneider Electric engages in an open and continuous dialog with each of its stakeholders. The Group takes into account the comments and assessments that apply to its sustainable development policies. This feedback is incorporated during the preparation of institutional documents and the implementation of new improvement plans throughout the company program and during the design of the Planet & Society Barometer.
(1) Source: CSR Sector Reporting Guide, 2017.
Open and continuous dialogue with clearly identified stakeholders

Schneider Electric | 2016 INTEGRATED REPORT 17
OUR VALUE CREATION
1 Employees
Commitments and priorities of Schneider Electric
Value created for employees Results and impacts
Schneider Electric’s people are critical to its success. Its ultimate ambition is to generate higher performance and employee engagement, through world-class people practices that are supported by a global/local and scalable model. When our customers come to us, we want to provide them with the best professionals in their field, able to understand their needs.
• Global employee well-being program, which takes a holistic approach by incorporating the four dimensions of the individual: physical, psychological, emotional and social
• A training culture that aims to offer each person one day training each year; the development of “academies” for each function with targeted courses; a global training platform, My Learning Link; and the establishment of an on boarding process centered around a series of trainings and interviews that are performed for every new employee
• Inclusive culture where all forms of diversity are considered a real value for the company, symbolized by the support of the Group, and more than 34,000 of its employees, for the UN HeForShe campaign for women empowerment
• Operating gender pay equity plan in all countries
• Carrying out the OneVoice satisfaction and engagement survey twice a year: a tool to assess employee engagement and to measure motivation factors – diversity, training, well-being, etc. – the survey helps identify key areas of improvement. The results are analyzed by country and by unit, and there are follow-up feedback sessions in order to continue the dialogue and devise corresponding action plans
• Global Safety Day 2016, an event organized by Schneider Electric on the theme “We Care” focusing on workplace safety in order to spotlight and celebrate safety at all Group sites
• Rollout of well-being trainings: classroom and online trainings, particularly global webinars that in 2016 addressed topics such as how to recognize signs of stress and burnout, the importance of sleep for optimal performance, how recognition creates value, and a global week on well-being education organized by the Group
2016 key figures• 64% on our Employee Engagement Index (vs.
the industry average of 59%)
• A participation rate at 79%, steadily improving, which reflects robust internal motivation (up from 62% in 2011)
• More than 400 sustainable solutions and 1,200 “We Care” publications shared on Spice Social, our social networking portal
• 33% drop in the Medical Incident Rate (MIR) from 2014
• Frequency rate of accidents at 0.75 per million hours worked
• More than 1,500 managers and 500 well-being champions trained in classroom sessions and 6,000 employees trained online
• More than 500 “well-being laboratories” created by employees in 43 countries in order to share, experiment and implement actions to take care of their well-being
+ Registration Document 2016 Chapter 2 - Section 4

18 2016 INTEGRATED REPORT | Schneider Electric
OUR VALUE CREATION
2 End customers
Commitments and priorities of Schneider Electric
Value created for end customers Results and impacts
Our mission is to serve our customers by developing innovative products and solutions that simplify the lives of those who use them. We bring together our expertise and solutions to drive new possibilities for efficiency and savings. We are committed to the worldwide improvement in connectivity, sustainability, efficiency, reliability and safety in five major areas: in our homes, buildings, cities, industries and in the cloud.
• Large-scale rollout of IoT (Internet of Things) solutions through the launch of the latest version of the EcoStruxure™ architecture and platform, which provides increased value in terms of safety, reliability, efficiency, sustainability and connectivity for the Group’s four markets
• International helpline, online diagnostic and technical support services, and numerous services over the Internet, including Partner Relationship Management (PRM), the customer relationship management platform
• Special organization for the 89 international customers that are categorized as “strategic accounts” based on the “preferred supplier contracts”, and exclusive customer support
• A dedicated program for multi-site and/or global OEMs (equipment manufacturers) that enhances their ability to offer superior solutions on an international scale
• Green Premium™ innovative ecolabel: in 2016, this label, which pertains to more than €10 billion of transactional sales growth, was enhanced by additional innovations, such as new functions on MySchneiderApp with a QR code that gives customers, channel partners and other electricians 24/7 access to digitized environmental information
• Quantification of CO2 improvements: a tool that helps calculate CO2 impacts and savings on major customer projects, and relevant strategies for using the CO2 calculator commercially
2016 key figures• 74.8% of product revenue with Green
Premium™ eco-label
• MySchneiderApp introduced in 70 countries and ~320,000 subscribers to the MyElectrician app
• 16% of new large customer projects with impact quantification
• Up to 30% savings on a building’s energy needs thanks to our automation solutions
• 101,508 metric tons of CO2 avoided in 2015 and 2016 thanks to our Repair and Service Centers that are devoted to the reconditioning, repair and maintenance of our products, as well as those of other brands in selected locations
+ Registration Document 2016 Chapter 1 - Section 2

Schneider Electric | 2016 INTEGRATED REPORT 19
OUR VALUE CREATION
3 Intermediate customers
Commitments and priorities of Schneider Electric
Value created for intermediate customers Results and impacts
A large portion of Schneider Electric’s revenues is made through intermediaries such as distributors, systems integrators, contractors and purchasing advisors, who all bring their own added value and know-how. Thanks to this distribution network, which with a presence in 190 countries is the most extensive in the industry, the Group can reach a wide range of markets and a large number of small and medium-sized customers. In order to maintain stable, long-term relationships with its partners, the Group is perpetually striving to improve the value it offers them and to boost operational efficiency while improving the safety and security of the operators and the environment.
• Policy of close collaboration with distributors in terms of supply chain improvement, technical training, support services and joint marketing initiatives, guaranteeing the performance of the distribution network
• The e-Shop tool, which links distributors’ e-commerce sites to the entire database of Schneider Electric’s products, thus offering 24/7 access to current, reliable information
• Provision of a suite of digital tools known as Building Life Management to help electricians and DIY stores keep up with the fast pace of changes in residential solutions and technologies
• Expertise sharing through the EcoXpert program, supporting preferred partners with specialized contractors
• Schneider Electric named a market leader for advanced electrical distribution management systems by Gartner’s Magic Quadrant: the ADMS (Advanced Distribution Management Systems), electrical distribution network unified management platforms, provide the operators of these networks with numerous capabilities (surveillance, analysis of network performances, incident management, etc.); they are central to the strategy of electrical distributors to optimize the operation of their networks by improving their functioning, speeding up their deployment and reducing operating costs
2016 key figures• 69 electricity distributors equipped by
Schneider Electric, serving 66 million customers around the world
• More than 2,000 companies in 30 countries, including more than 300 in France, have been awarded the EcoXpert label since 2011
+ Registration Document 2016 Chapter 1 - Section 2

20 2016 INTEGRATED REPORT | Schneider Electric
OUR VALUE CREATION
4 Partners
Commitments and priorities of Schneider Electric
Value created for partners Results and impacts
Schneider Electric strives to constantly improve the capacity and responsiveness of its supply chain while bolstering its economic and ecological efficiency in order to offer its customers a logistical solution that perfectly meets their needs while guaranteeing its longevity. The Group has also committed to an ambitious approach that aims to incorporate sustainability issues into the process of selecting and working with its suppliers.
• Rollout of the “Purchasing Excellence System” to involve suppliers in the supply chain in order to enhance customer satisfaction
• Digitization of the supply chain, capitalizing on new technologies in order to offer new capabilities and increased responsiveness
• Continuous improvement approach for suppliers in terms of sustainable development according to ISO 26000
• Co-construction of innovative, integrated offerings in partnership with R&D teams and the option to take part in the Open Innovation program
• Schneider Electric’s supply chain was ranked 5th in Europe by Gartner and 18th in the world, up 5 and 15 positions respectively in one year. In addition, for the first time it made Gartner’s ranking of the top 25 supply chains
• Renewal in 2016 of the “Responsible Supplier Relations” label, which recognizes French companies that have demonstrated sustainable, balanced relationships with their suppliers
• 5th Global Supplier Day, organized by the Purchasing Department to share the aspiration of innovation at all levels with our top suppliers, through demonstrations, presentations, roundtables and workshops on topics such as quality, innovation and competitive partnership
2016 key figures• 120 suppliers from 25 countries gathered in
Hong Kong for Global Supplier Day, and nine companies honored for their performance, a source of gratification and value created for Group customers
• 520 audits conducted on site to select new suppliers, sustainability criteria accounting for nearly 15% in the evaluation
• 64.7% of our recommended suppliers embrace ISO 26000 guidelines
+ Registration Document 2016 Chapter 1 – Section 2 Chapter 2 – Section 2
Schneider Electric | 2016 INTEGRATED REPORT 21
OUR VALUE CREATION
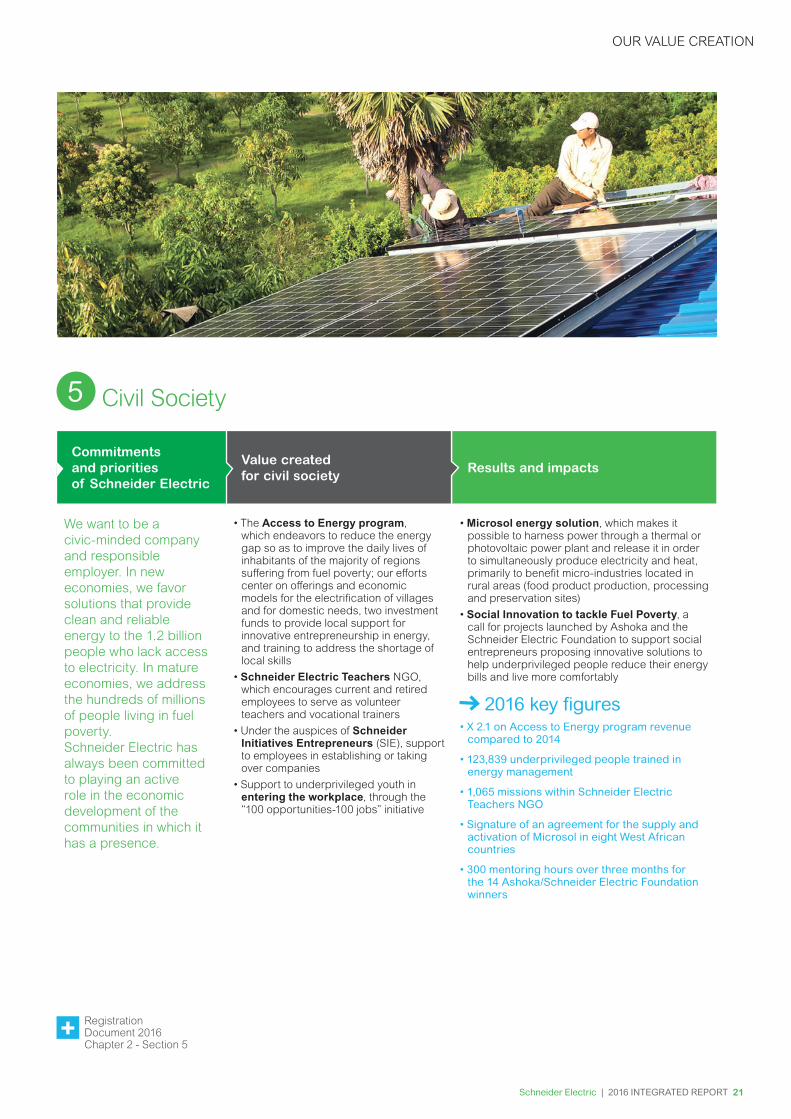
5 Civil Society
Commitments and priorities of Schneider Electric
Value created for civil society Results and impacts
We want to be a civic-minded company and responsible employer. In new economies, we favor solutions that provide clean and reliable energy to the 1.2 billion people who lack access to electricity. In mature economies, we address the hundreds of millions of people living in fuel poverty.Schneider Electric has always been committed to playing an active role in the economic development of the communities in which it has a presence.
• The Access to Energy program, which endeavors to reduce the energy gap so as to improve the daily lives of inhabitants of the majority of regions suffering from fuel poverty; our efforts center on offerings and economic models for the electrification of villages and for domestic needs, two investment funds to provide local support for innovative entrepreneurship in energy, and training to address the shortage of local skills
• Schneider Electric Teachers NGO, which encourages current and retired employees to serve as volunteer teachers and vocational trainers
• Under the auspices of Schneider Initiatives Entrepreneurs (SIE), support to employees in establishing or taking over companies
• Support to underprivileged youth in entering the workplace, through the “100 opportunities-100 jobs” initiative
• Microsol energy solution, which makes it possible to harness power through a thermal or photovoltaic power plant and release it in order to simultaneously produce electricity and heat, primarily to benefit micro-industries located in rural areas (food product production, processing and preservation sites)
• Social Innovation to tackle Fuel Poverty, a call for projects launched by Ashoka and the Schneider Electric Foundation to support social entrepreneurs proposing innovative solutions to help underprivileged people reduce their energy bills and live more comfortably
2016 key figures• X 2.1 on Access to Energy program revenue
compared to 2014
• 123,839 underprivileged people trained in energy management
• 1,065 missions within Schneider Electric Teachers NGO
• Signature of an agreement for the supply and activation of Microsol in eight West African countries
• 300 mentoring hours over three months for the 14 Ashoka/Schneider Electric Foundation winners
+ Registration Document 2016 Chapter 2 - Section 5

22 2016 INTEGRATED REPORT | Schneider Electric
OUR VALUE CREATION
6 Financial partners
Commitments and priorities of Schneider Electric
Value created for financial partners Results and impacts
Schneider Electric aims to create attractive shareholder value over the coming years, grounded in an efficient, stable model. Profitable growth is a central priority. We are committed to maintaining a close relationship with our shareholders.
• Objective to continue performance growth by combining sales growth with margin expansion. Average organic growth targeted is ~3% between 2017 and 2019 in three businesses (Building, IT and Industry), which represent around 80% of our portfolio
• Significant attention given to the Group’s operating efficiency, particularly through initiatives to streamline costs (objective of €1.7-€1.8 billion between 2015 and 2017), and through increased selectivity when it comes to Infrastructure projects
• Average annual organic improvement objective of the operating margin from 20 to 50 base points over the next three fiscal years. This objective should translate into steady growth in net profit
• Combined with a strong free cash flow conversion rate and our stable balance sheet, all these factors allow us to offer our shareholders an attractive return through a progressive dividend policy, without a reduction from one year to the next, and through possible new share buyback/special dividend programs
• Transparent communication system with our shareholders and investors: Investor days, shareholder letters, site visits, etc.
• Achievement of the main financial targets, good progress on initiatives in the Schneider is On company program and acceleration of the execution of our strategy
• Non-financial performance recognized by main SRI (Socially Responsible Investment) funds
2016 key figures• €24.7 billion in revenues
• 14.1% adjusted EBITA margin, up 90 bps before forex impact
• Record cash conversion rate with free cash flow of €2.2 billion and solid cash conversion of 118%
• Proposed dividend of €2.04, up by 2%
• 10th company worldwide with the most SRI funds in its capital (128 funds) according to Ipreo (SRI Leaders Index Fall 2016)
• For four years, an industry leader on the Dow Jones Sustainability Index (DJSI)
• 12 events with individual shareholders: Shareholders’ Meetings and trade shows in France and London, Shareholders’ Advisory Committee meetings, viewing of the “Vivre et travailler en 2030” exhibition in Paris, Schneider Electric Paris Marathon, Annual Shareholders’ Meeting, web conference on “Schneider Electric, a stock for your portfolio in 2017?”
• Investor day in October with more than 100 investors in attendance, and more than 200 investors met over the course of the year
+ Registration Document 2016 Chapter 1 – Section 3

Schneider Electric | 2016 INTEGRATED REPORT 23
OUR VALUE CREATION
7 Institutions and technical bodies
Commitments and priorities of Schneider Electric
Value created for institutions and technical bodies Results and impacts
Schneider Electric works with different local and international organizations and associations on economic, social and environmental issues to foster sustainable development in cooperation with various players from society, and – at the sectoral level – with technical bodies.
• Active participation in public debate, particularly on climate change issues
• Participation of 500 experts in national and international standardization bodies
• Contribution to scientific research and involvement with academic chairs and business associations
• Advanced Level of the Global Compact, which the Group signed in 2002; Jean-Pascal Tricoire has been serving as Chairman of Global Compact France since 2013
• Group’s commitment to helping to accomplish the 17 Sustainable Development Goals (SDG), a universal call to action by the United Nations to end poverty, protect the planet, and ensure that all people enjoy peace and prosperity by 2030
• R&D partnerships forged by Schneider Electric: founding partnership of the Internet of Things (IoT) chair launched by ESCP Europe; inauguration with the Fondation Partenariale Grenoble INP of the new MINT (Innovating for Molded & Printed Electronics Devices) industrial excellence chair; strategic research partnership with CEA Tech, the technological research division of the CEA (the French Atomic Energy and Alternative Energy Commission)
• Chairmanship of the Smart Energy Grid coordination group of CEN-CENELEC-ETSI (European Committee for Standardization – European Committee for Electrotechnical Standardization – European Telecommunications Standards Institute): Schneider Electric is responsible for ensuring the availability of a suitable set of standards for the rollout of smart grids in Europe; CEN-CENELEC-ETSI are the three official European standardization bodies
• Participation in COP22 in Marrakesh: mobilization for access to energy in Africa with Homaya, partnership of the Schneider Electric Foundation with Art of Change 21, lectures and events at Riad Yima
2016 key figures• 5% of revenue (€1.2 billion) invested in R&D
• 20,000+ patents active or in application
• As part of the European Commission’s Circular Economy package, CEN-CENELEC-ETSI will, between now and 2019, develop a set of standards covering repairability, reuse, recycling, refurbishment, etc., of products which fall within the scope of the Eco-design directive; Schneider Electric has appointed experts in each of the working groups
+ Registration Document 2016 Chapter 2 - Section 1

24 2016 INTEGRATED REPORT | Schneider Electric
OUR VALUE CREATION
8 Planet
Commitments and priorities of Schneider Electric
Value created for the planet Results and impacts
Schneider Electric is committed to green growth and to acting in line with the principles of sustainability in respect of current and future generations. The Group is particularly committed to integrating environmental protection in its strategic decisions, including engaging in design, production, distribution and recycling processes; and to bringing to market products that optimize energy use and natural resources.
• Clear environmental strategy by 2020 identifying 15 high-priority initiatives matched with corresponding objectives in six areas: CO2 and resources, production line, waste, commercial offerings, circular economy and governance
• Schneider Energy Action flagship program for the continuous reduction of energy consumption at Group sites
• Improved energy and environmental performance of our customers
• Support of Aster Capital fund for innovative start-ups specializing in energy, mobility and the environment
• Signature by Schneider Electric of the Science-based targets initiative to support the commitment to carbon neutrality in 2030 in its value chain and ecosystem
2016 key figures• No. 3 company in the world for energy
transition on the Carbon Clean 200 List
• 10th greenest company on the Newsweek Global Green Ranking
• On the CDP’s Climate A list for the last six years
• 7.1% reduction in our energy footprint compared with 2014, savings of around €5 million and 70 million kWh, against investment of around €9 million, of which €8.7 million in capital costs and €0.3 million in operational costs
• 11.2% reduction of our carbon footprint related to logistics compared with 2014, for savings of €5 million
• 81.6% of products in R&D designed with Schneider Electric ecoDesign Way™, a methodology that measures the improvement of: impact on climate change, particularly CO2 footprint; consumption of raw materials; reduction in toxic chemical substances; energy efficiency; product “serviceability” (repair, recycling, reuse, etc.); circularity enabling end-of-life recycling; and product packaging.
+ Registration Document 2016 Chapter 2 – Sections 3

Schneider Electric | 2016 INTEGRATED REPORT 25
OUR GOVERNANCE
Mobilized governance for sustainable growth
Human Resources and CSR Committee
Activity in 2016:• Review of the
compensation policy for executive officers
• Review of the compensation, performance and succession plans for members of the Executive Committee
• Review of the policy for male/female equal opportunities and compensation
• Assessment of the CSR policy
• Review of long-term incentive plans
Strategy Committee
Activity in 2016:• Preparation of the board
of directors Strategy days• Identification of topics
related to organic growth• Joint review of risk
mapping
Governance & Remuneration Committee
Activity in 2016:•Composition of the board
and its committees• Continued the unification of
the functions of Chairman and CEO
• Compensation of executive officers
• Review of the succession plan for executive officers
• Review of the amounts and distribution rules for attendance fees
• Oversight and preparation of the self-assessment of the board of directors
• Presentation of the Say on Pay to the Annual Shareholders’ Meeting
Audit and risk Committee
Activity in 2016:• Review of financial
statements and financial information
• Risk management in line with a schedule prepared on the basis of the risk mapping
• Oversight of the internal audit and internal control
• Review of the statutory auditors’ due diligence and their independence
• Review of the distribution policy
Each committee is composed of directors whose skills are matched with the committee’s expectations
• Corporate governance (composition of the board and its committees, unification of the functions of Chairman and CEO, succession plan for corporate officers, self-assessment of the board, rules on compensation of the corporate officers, long-term incentive plan)
Activity in 2016
Board of directors
Jean-Pascal Tricoire, Chairman and CEO
Léo Apotheker, Vice-Chairman and independent lead director- Ensures proper governance- Helps prepare the agendas for the meetings of the board of directors- Meets with shareholders- Chairs executive sessions- Manages the board’s self-assessment
• Strategy and its implementation (during a multi-day meeting in Silicon Valley)
• Activity and results (business market, financial statements, risk mapping, specific surveys)
• Annual Shareholders’ Meeting (agenda, draft resolutions, report to shareholders, shareholders’ questions and answers)
Activity of the board and its committees, and role of the independent lead director
The board of directors is a collegial body mandated by all shareholders. It defines the corporation's strategic orientations, appoints and revokes the mandates of the company Officers, sets their compensation, selects the form of organisation and governance (separation of the offices of Chairman and Chief Executive Officer or combination of such offices), monitors the management as well as the quality of information provided to shareholders and to the markets.
The board held 8 meetings in 2016. The meetings lasted 6 hours on average with an average participation rate of directors of 94%. They were primarily devoted to discussing the Company’s corporate governance, strategy and its implementation, reviewing operations and the annual and interim financial statements, which it approved, and preparing the Annual Shareholders’ Meeting.
The board of directors, a key actor and a guide for the good governance of Schneider Electric

26 2016 INTEGRATED REPORT | Schneider Electric
Board of directors’ self-assessment
OUR GOVERNANCE
Schneider Electric’s board of directors discusses its composition, organization, operation and committees every year, and it conducts periodic assessments. The self-assessment helps determine key performance areas and gives direction for progress.
Follow-up to the conclusions of the board of directors’ self-assessment conducted in 2015:
Board’s strengths
• Very high level of transparency of the top and executive management with regard to the board
• Productive dialogue and initiation of discussions within the board
• Mix of skills and expertise and high level of director involvement
• Remarkable "fit" between board members
Lines of progress
• Continue the “regeneration” policy of the board of directors• Coordinate the work of the Strategy Committee with that of
the board of directors• Review the connection between the work of the board of
directors and that of the Strategy Committee and Audit and Risk Committee in the examination of strategic risks
• Provide the board with more detailed information on the competitive environment and its evolution
2016 key figures
75%Share of independent
directors*
38.5 % Share of directors who are women
46% Share of directors
of non-French origin or nationality
59.3 yearsAverage age of directors
* Calculated in accordance with the criteria of the AFEP/MEDEF Code. ** Without voting rights or dividends.
A diverse shareholding structure reflecting substantial employee investment
5.8%MFS Investment Management
5.2%BlackRock, Inc
4.5%Employees
6.3%Treasury shares**
78.2%Public
In 2016, the board of directors discussed the self-assessment it completed in 2015 and examined the progress it had made and the steps taken for each of these items. In particular, the board highlighted progress made on internationalization, diversification of skills and gender parity: the number of women on the board of directors rose from 31% in 2015 to 38.5% in 2016 and will be above 40% after the 2017 Annual Shareholders’ Meeting.An external assessment will be conducted in 2017.

Schneider Electric | 2016 INTEGRATED REPORT 27
OUR GOVERNANCE
Ethics: a fundamental value at Schneider Electric
Extending up to the highest levels in the company, our Principles of Responsibility are at the root of our commitment and apply to all employees and entities around the world.
Driven by Group values, the Responsibility & Ethics Dynamics program forms the basis
of common references and processes. It provides employees with a method for asking themselves the right questions and turning to the right people, in accordance with a detailed examination process and an alert procedure so they can be guided to the proper bodies by:
1. Contacting their manager; or
2. Using existing internal departments (legal, financial, HR, environment, etc.); or
3. Contacting the Group Fraud Committee via the professional alert system (accessible via Internet or multilingual telephone line).
Fraud Committee
Compliance O�cers
Strategic
De�ne, explain & communicate the rules Detect & manage non compliance
Awareness Enablers Investigation Enablers
Operational
Executive Level
Corporate Level
Zone Level
Executive Committee
Ethics & Responsibility Committee
Principles of Responsability Advisors
Key facts 2016• Our Principles of
Responsibility have been translated into 30 languages and sent to all Group employees. They are also accessible on the Group’s official website and intranet.
• Rollout of the Agents policy and the Gifts & Hospitality policy in the different business units and subsidiaries; new anti-corruption policy approved.
• Ethics indicator on the 2015–2017 Planet & Society Barometer: 93.4% of entities passed the internal assessment of Ethics & Responsibility by the end of 2016.
• 236 ethics alerts were escalated through the R&ED Line in 2016: 47% of them concerned potential violations of our code of conduct applying to financial matters; 34% related to potential cases of discrimination, harassment or unfair treatment; the remaining 19% related to potential violations of other company policies.
Schneider Electric’s commitment to promoting Human Rights
In 2011, the United Nations issued the Guiding Principles on Business and Human Rights that precisely defined the roles and responsibilities of States and businesses on that matter. Based on the “Protect, Respect, Remedy” framework, Schneider Electric’s new Human Rights policy is the first step toward implementing the Guiding Principles on Business and Human Rights within the Group’s value chain.
We have already started the second step concerning the assessment of current and potential risks by mapping the countries where we are the most exposed, based
on internal and external indicators. We will reinforce our prevention initiatives in these countries by training our employees who are in the most exposed positions, such as the Purchasing Department. Training sessions will also be scheduled for some suppliers who are from these countries, depending on the products they provide to us. In addition, the Human Rights policy will serve as a benchmark for the selection of our main business partners. In 2017, we plan to deploy a dedicated grievance mechanism for our external stakeholders to report any breach of the Human Rights policy.
+ schneider-electric.com “Responsibility & Ethics” section

28 2016 INTEGRATED REPORT | Schneider Electric
OUR GOVERNANCE
The compensation policy rewards each employee’s performance and value creation. As such, performance criteria related to sustainable development are incorporated into the compensation of our senior management and employees.
Management and employees’ compensationSchneider Electric is committed to providing a competitive and comprehensive compensation and benefits offering that is cost effective in each market and country in which the Group operates in order to attract, motivate and retain talents. Schneider Electric ensures that all compensation and benefits decisions and policies are based on the principles of fairness, equity and non-discrimination. Wherever it operates, Schneider Electric guarantees the minimum wages set by local regulations. Where there is no such regulation or where the minimum wage is insufficient to meet basic needs, Schneider Electric strives to compensate its employees to meet them. By basic needs, we shall not only consider food, water, housing and clothing but also sanitation, education and health care.
Sustainable development criteria
Since 2011, sustainable development criteria that are directly tied to the targets of the Planet & Society Barometer have been incorporated into the incentive targets of the Executive Committee and then, by extension, those of Schneider Electric’s leaders and global functions, particularly the zone and Country Presidents, the heads of central functions (Finance, HR, Strategy, Information, Technology, Marketing) and the leaders of Global Supply Chain.
Gender pay equity
Schneider Electric introduced a gender pay equity indicator that measures the percentage of employees working in countries where there is an operating gender pay equity plan and where corrective measures are in place to reduce so-called “inexplicable” pay gaps. In 2016, the process was deployed in 35 countries and covered 75% of our employees. The goal is to expand it around the world so it applies to 85% of employees in 2017. Schneider Electric Industries and Schneider Electric France (SEI/SEF) have been applying this method since 2006, through the allocation of an annual budget to reduce salary gaps between men and women, creating a framework of individual increases, and individual salary reviews for employees returning from maternity or adoption leave.
Compensation of corporate officersThe general principles underlying compensation policy for corporate officers and their individual analyses are reviewed by the Governance and remunerations committee, who make proposals to the board of directors.
Executive compensation set by the board of directors is aligned with the Group’s global strategy and is based on three pillars:
• Competitiveness: incentivize and retain Group Senior Management in a highly competitive international market;
• Pay for performance: reward individual and collective performance by aligning the levels of compensation with the Group’s results, through a pay mix largely composed of performance linked elements fairly balancing Financial and Sustainability & transformation objectives, distributed between Short-Term (STIP) and Long-Term (LTIP) components;
• Alignment with shareholders’ long-term interests, by allocating a greater weight to the share-based benefits, making up more than 50% of the target package for the corporate officers.
Compensation of senior management and employees: criteria aligned with the strategy and sustainable development
The Group’s senior management’s pay mix is heavily weighted toward variable performance criteria, which represent 70% of the compensation package of the Executive Committee members and around 80% of the package of the corporate officers. The compensation and benefits due to Jean-Pascal Tricoire, Chairman and CEO, for fiscal year 2016 (presentation based on AFEP/MEDEF recommendation), without pension cash benefit, were €5,137,298.
54%Performance Shares 26%
Annual Incentive
20%Base Salary
Jean-Pascal Tricoire - 2016
Compensation of Jean-Pascal Tricoire. Chairman and CEO, for 2016
+ Registration Document 2016 Chapter 3 - Section 7

Design and editing: CAPITALCOM - Layout and production: LabradorPhoto/graphics credit: Getty Images – Yvan Brien Photographies – Gautier Demouveaux/ASO – Cécile Liénaux – Nathalie Wirth
Studio US/Global Marketing/Schneider Electric – Photothèque Schneider Electric
This document demonstrates our commitments to sustainable development. We have tried to reduce its environmental footprint as much as possible. This document is printed with vegetable oil based ink on FSC-certified, 100% recycled paper that is manufactured without chlorine. Printed on Oxygen Inapa
Offset New paper, 100% recycled in 140 g/m2 and 250 g/m2.The management system governing the printing of this document is ISO14001:2004 certified.
WhoCustomers, employees, journalists, general public, etc.
WhatOur actions related to the strategy and sustainable development: you will find an engaging presentation of our organization, case studies of featured customers, internal and external testimonials and our vision for the years to come.
WhyOpen dialogue: our goal is to engage in a transparent, comprehensive and targeted conversation about our company, including the voices of our internal and external stakeholders.
WhoExperts, investors, shareholders, national authorities.
WhatInformation regulated by the French Financial Market Authority (AMF), including the annual financial report, the board of directors’ management report and financial statements and information about sustainable development and corporate governance.
WhyProvide a detailed snapshot of the Group’s strategy, core businesses, governance, performance and strong commitment to sustainable development.
Our other publications
Schneider Electric SE
35, rue Joseph Monier–CS 30323
F-92506 Rueil-Malmaison Cedex (France)
Tel: +33 (0) 1 41 29 70 00
Fax: +33 (0) 1 41 29 71 00
www.schneider-electric.com/en/
Incorporate in France
Governed by a Board of Directors
with issued capital of EUR2,369,995,036
Registered in Nanterre R.C.S. 542048574
Siret: 542 048 574 01 091@schneiderelec
schneider-electric.com