2016 integrated annual report - assore iar 2016... · 2016 integrated annual report assore ......
TRANSCRIPT
2016 integrated annual report
AS
SO
RE
INT
EG
RA
TE
D A
NN
UA
L R
EP
OR
T 2
01
6
Contents Scope and boundary
Overview
Scope and boundary IFC
Profile 1
Group at a glance 2
Location of markets and operations 4
Group timeline 6
Group structure 8
Assurance 9
Strategy and risk
Strategic objectives 12
Business model 13
Risks and opportunities 14
Financial highlights 17
Future performance objectives 18
Remuneration 19
Review and reports
Mineral Resources and Reserves summary 22
Chairman’s statement 24
Board of directors 26
Operational review and commentary 28
Corporate governance and risk management report 32
Black economic empowerment status report 38
Group sustainability performance 42
Five-year summary 44
Financial statements
Annual financial statements 48
Notice of Annual General Meeting 122
Form of proxy 127
Corporate information IBC
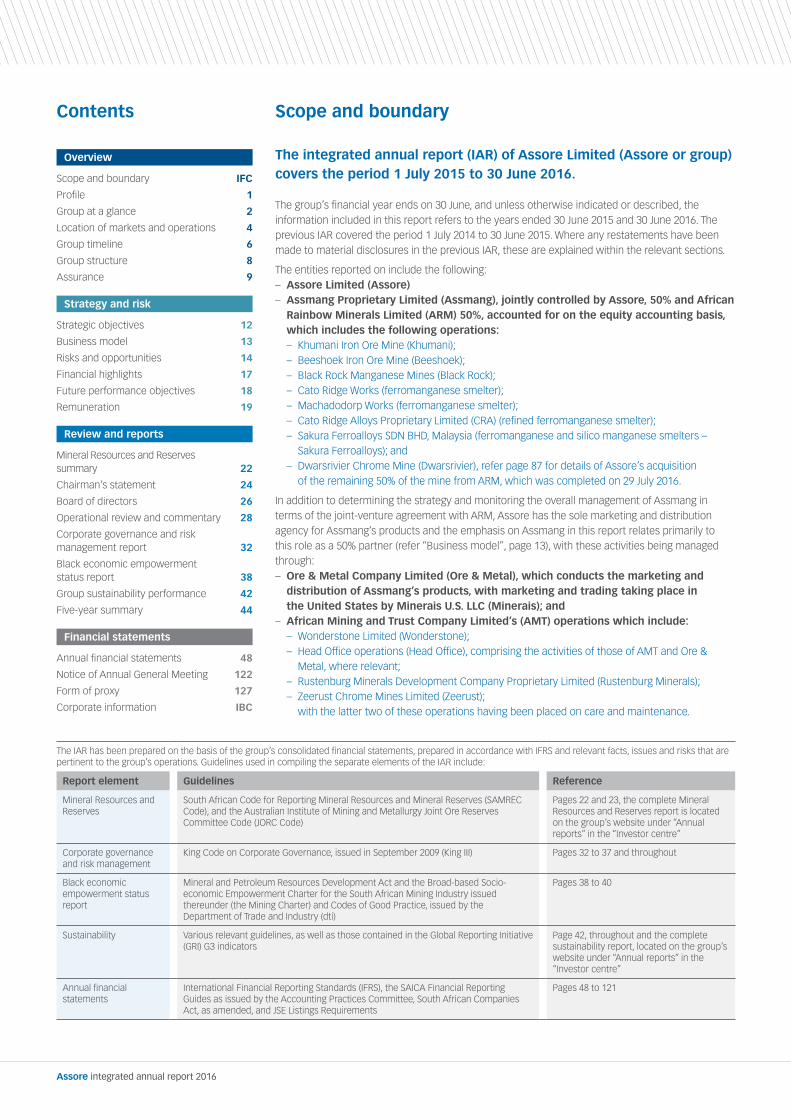
The integrated annual report (IAR) of Assore Limited (Assore or group) covers the period 1 July 2015 to 30 June 2016.
The group’s financial year ends on 30 June, and unless otherwise indicated or described, the information included in this report refers to the years ended 30 June 2015 and 30 June 2016. The previous IAR covered the period 1 July 2014 to 30 June 2015. Where any restatements have been made to material disclosures in the previous IAR, these are explained within the relevant sections.
The entities reported on include the following: – Assore Limited (Assore) – Assmang Proprietary Limited (Assmang), jointly controlled by Assore, 50% and African Rainbow Minerals Limited (ARM) 50%, accounted for on the equity accounting basis, which includes the following operations: – Khumani Iron Ore Mine (Khumani); – Beeshoek Iron Ore Mine (Beeshoek); – Black Rock Manganese Mines (Black Rock); – Cato Ridge Works (ferromanganese smelter); – Machadodorp Works (ferromanganese smelter); – Cato Ridge Alloys Proprietary Limited (CRA) (refined ferromanganese smelter); – Sakura Ferroalloys SDN BHD, Malaysia (ferromanganese and silico manganese smelters –
Sakura Ferroalloys); and – Dwarsrivier Chrome Mine (Dwarsrivier), refer page 87 for details of Assore’s acquisition
of the remaining 50% of the mine from ARM, which was completed on 29 July 2016.
In addition to determining the strategy and monitoring the overall management of Assmang in terms of the joint-venture agreement with ARM, Assore has the sole marketing and distribution agency for Assmang’s products and the emphasis on Assmang in this report relates primarily to this role as a 50% partner (refer “Business model”, page 13), with these activities being managed through: – Ore & Metal Company Limited (Ore & Metal), which conducts the marketing and distribution of Assmang’s products, with marketing and trading taking place in the United States by Minerais U.S. LLC (Minerais); and
– African Mining and Trust Company Limited’s (AMT) operations which include: – Wonderstone Limited (Wonderstone); – Head Office operations (Head Office), comprising the activities of those of AMT and Ore &
Metal, where relevant; – Rustenburg Minerals Development Company Proprietary Limited (Rustenburg Minerals); – Zeerust Chrome Mines Limited (Zeerust);
with the latter two of these operations having been placed on care and maintenance.
The IAR has been prepared on the basis of the group’s consolidated financial statements, prepared in accordance with IFRS and relevant facts, issues and risks that are pertinent to the group’s operations. Guidelines used in compiling the separate elements of the IAR include:
Report element Guidelines Reference
Mineral Resources and Reserves
South African Code for Reporting Mineral Resources and Mineral Reserves (SAMREC Code), and the Australian Institute of Mining and Metallurgy Joint Ore Reserves Committee Code (JORC Code)
Pages 22 and 23, the complete Mineral Resources and Reserves report is located on the group’s website under “Annual reports” in the “Investor centre”
Corporate governance and risk management
King Code on Corporate Governance, issued in September 2009 (King III) Pages 32 to 37 and throughout
Black economic empowerment status report
Mineral and Petroleum Resources Development Act and the Broad-based Socio-economic Empowerment Charter for the South African Mining Industry issued thereunder (the Mining Charter) and Codes of Good Practice, issued by the Department of Trade and Industry (dti)
Pages 38 to 40
Sustainability Various relevant guidelines, as well as those contained in the Global Reporting Initiative (GRI) G3 indicators
Page 42, throughout and the complete sustainability report, located on the group’s website under “Annual reports” in the “Investor centre”
Annual financial statements
International Financial Reporting Standards (IFRS), the SAICA Financial Reporting Guides as issued by the Accounting Practices Committee, South African Companies Act, as amended, and JSE Listings Requirements
Pages 48 to 121
Assore integrated annual report 2016

Profile
Assore is a mining holding company engaged principally in ventures involving
base minerals and metals.
The group’s principal investment is a 50% interest in Assmang Proprietary
Limited (Assmang) which it controls jointly with African Rainbow Minerals
Limited (ARM). The group, through its various joint-venture entities and
subsidiary companies, is involved in the mining of iron, manganese and
chrome ores together with other industrial minerals and the production of
manganese alloys. The group is also responsible for marketing all products
produced by the Assore and Assmang groups, the bulk of which is exported
and the remainder either used in the group’s beneficiation processes or
sold locally.
The company was incorporated in 1950 and its shares are listed on the JSE
Securities Exchange (JSE) under “Assore” in the general mining sector.
26,07% of the company’s shares are controlled by two broad-based black
economic empowerment community trusts: the Boleng Trust (14,28%), and
the Fricker Road Trust (11,79%). The Minerals and Petroleum Resources
Development Act required that by 1 May 2014, 26% of mining companies’
shares are controlled by historically disadvantaged South Africans.
Report feedbackFeedback on this Assore report can be made directly to Mr RA Davies at: [email protected].
This report is also available at
www.assore.com
Page 1
Assore integrated annual report 2016
Overview Strategy and risk Reviews and reports Financial statements

Group at a glance
Joint-venture entity (Assmang)
Iron Ore division (refer page 28) Manganese division (refer page 29) Chrome division (refer page 30)
Iron ore Manganese ore and alloys Chrome ore
Type of operation Type of operation Type of operation
– Mining, crushing, screening and jigging of run-of-mine ore and tertiary recovery of fine iron ore product
– Mining, crushing, washing and screening of ore
– Smelting of ferromanganese – Production of refined ferromanganese
– Mining, crushing and concentrating of ore
Description Description Description
Iron ore is mined in the Northern Cape province in open-cast operations at the Khumani Iron Ore Mine which is located near Kathu in the Northern Cape and at the Beeshoek Iron Ore Mine which is located outside Postmasburg. The ore produced is sold both on the export market and locally.
Various grades of manganese ore are mined at the Nchwaning and Gloria mines, located in the Black Rock area of the Northern Cape province, and manganese alloys are produced at the Cato Ridge Works in KwaZulu-Natal. Cato Ridge Alloys, a joint venture with Japanese partners, produces refined ferromanganese at the Cato Ridge Works. Feed for the Cato Ridge Works is derived mainly from Assmang’s manganese mines. The ore and alloy produced are both sold on the export market and locally.
Chrome ore is mined at the Dwarsrivier Chrome Mine in the Limpopo province, located near Steelpoort and Lydenburg. The ore produced is sold both on the export market and locally. With effect from 1 July 2016, Assore owned 100% of Dwarsrivier Chrome Mine (refer note 36 to the consolidated financial statements).
Attributable profit Attributable profit Attributable profit
2016
R1 220,1 million(2015: R1 190,7 million)
2016
R51,9 million(2015: R47,1 million)
2016
R21,5 million(2015: R91,9 million)
Revenue generated* Revenue generated* Revenue generated*
2016
R6 266,3 million(2015: R6 311,2 million)
2016
R3 333,1 million(2015: R3 576,2 million)
2016
R946,9 million(2015: R899,4 million)
* Note that, in terms of International Financial Reporting Standards (IFRS), Assmang is accounted for on the equity accounting basis. Therefore, “Revenue generated”, which is stated at 50% of its reported figure, as included in this analysis, does not form part of the group’s reported revenue as reported in terms of IFRS.
Page 2
Assore integrated annual report 2016

Subsidiary companies
Wonderstone (refer page 30)
Rustenburg Minerals Development Company (refer page 30) Zeerust Chrome Mines (refer page 30)
Wonderstone Chrome ore Chrome ore
Type of operation Type of operation Type of operation
– Mining and beneficiation of Wonderstone, and manufacture and installation of ceramic products
– Open-cast mine, on care and maintenance
– Open-cast mine, on care and maintenance
Description Description Description
The company mines a type of pyrophyllite which, for trade purposes, is referred to as Wonderstone. The bulk of the material mined is beneficiated to produce high-precision components manufactured to customers’ specification and are exported to the United States of America, the United Kingdom and the Far East. The company also produces a range of wear and acid-resistant tiles and ceramic products used mainly for chute liners in the local mining industry and installed on a project basis in certain instances.
Chrome ore is mined near Rustenburg in open-cast operations and production is supplied mainly to the local market. The open-cast pits have reached the point of depletion and the mine continues to process existing mined and waste materials. Once this process is complete, the mine is scheduled to be placed on care and maintenance.
Current market conditions have necessitated that the mine be placed on care and maintenance.
Attributable loss Attributable loss Attributable loss
2016
R(22,0) million‡
(2015: R(9,6) million)
2016
R(114,2) million#
(2015: R(179,7) million)
2016
R(0,5) million(2015: R(12,2) million)
Contribution to group revenue Contribution to group revenue Contribution to group revenue
2016
R98,2 million(2015: R99,3 million)
2016
R173,8 million(2015: R163,9 million)
2016
R6,4 million(2015: R76,4 million)
‡ After impairment charge of R24,3 million charged against goodwill, previously recorded pursuant to the acquisition of Groupline Projects in 2012 (refer page 64).# After impairment charge of R23,2 million (2015: R180,4 million) (attributable to the group) recorded against the remaining net book value of assets in Rustenburg
Minerals (refer page 62).
Ore & Metal Company (refer page 31) Minerais U.S. LLC (refer page 31)
African Mining and Trust Company (refer page 31)
Marketing and distribution Marketing and distribution, USA Operational and technical advice
Type of operation Type of operation Type of operation
– Marketing, sales and shipping of ores and alloys
– Marketing of minerals and alloys in the USA
– Operational management, exploration and technical adviser
Description Description Description
Ore & Metal Company Limited is responsible for the marketing, sales and shipping of all the group’s products, including those produced by the three divisions of Assmang. Strong relationships have been established with customers in Europe, North America, South America, India and the Far East.
Minerais U.S. LLC is responsible for marketing and sales administration of the group’s products in the United States of America (USA), in particular manganese alloys, and trades in various related commodities.
African Mining and Trust Company Limited is technical adviser to Assmang and other group companies and provides operational management services to group mines and plants.
Attributable profit Attributable profit Attributable profit
2016
R271,3 million(2015: R223,5 million)
2016
R11,4 million(2015: R32,2 million)
2016
R101,5 million(2015: R109,8 million)
Contribution to group revenue Contribution to group revenue Contribution to group revenue
2016
R511,5 million(2015: R428,8 million)
2016
R1 763,7 million(2015: R2 222,1 million)
2016
R334,9 million(2015: R318,8 million)
Page 3
Assore integrated annual report 2016
Overview Strategy and risk Reviews and reports Financial statements

Fe – Iron ore
Mn – Manganese ore
FeMn – Ferromanganese
Cr – Chrome ore
Wonderstone
Mine
Processing plant
Cities
Malaysia
Location of Sakura Ferroalloys, Malaysia
Location of South African operations
Kuala Lumpur
Kuching
Bintulu
Indonesia
Borneo
Miri
Singapore
Indonesia
Japan
Australia
ChinaKorea
India
Middle East
South Africa
Europe
South America
North America
Malaysia
Saldanha Bay
RMDC
RustenburgJohannesburg
Zeerust
Durban
Richards BayPostmasburg
Cape TownPort Elizabeth
South Africa
MaputoDwarsrivier
Black RockGloria
NchwaningKathu
Khumani
Beeshoek
Ottosdal
Cato Ridge
Machadodorp
Location of markets
Page 4
Assore integrated annual report 2016

Fe – Iron ore
Mn – Manganese ore
FeMn – Ferromanganese
Cr – Chrome ore
Wonderstone
Mine
Processing plant
Cities
Malaysia
Location of Sakura Ferroalloys, Malaysia
Location of South African operations
Kuala Lumpur
Kuching
Bintulu
Indonesia
Borneo
Miri
Singapore
Indonesia
Japan
Australia
ChinaKorea
India
Middle East
South Africa
Europe
South America
North America
Malaysia
Saldanha Bay
RMDC
RustenburgJohannesburg
Zeerust
Durban
Richards BayPostmasburg
Cape TownPort Elizabeth
South Africa
MaputoDwarsrivier
Black RockGloria
NchwaningKathu
Khumani
Beeshoek
Ottosdal
Cato Ridge
Machadodorp
Page 5
Assore integrated annual report 2016
Overview Strategy and risk Reviews and reports Financial statements

Group timeline
1997
1999
2000
2001
2002
2004
2005
2006
2009
2010
2012
2014
2015
19961981
1979
1930
1931
1935
1936
1937
1939
1940
1950
1957
1959
1960
1961
1973
1928 2 0 1 6
Gloucester Manganese Mines (Postmasburg) Limited established by Guido Sacco
Formation of Ore & Metal Company Limited (Ore & Metal)
Formation of African Mining and Trust Company Limited (AMT)
AMT partnered with Anglo Transvaal Consolidated Investment Company Limited (Anglovaal), now African Rainbow Minerals (ARM), to form The
Associated Manganese Mines of South Africa Limited (Assmang)
Acquisition of the Wonderstone Mine
Various prospecting activities and mining manganese deposit on farm
Gloucester and adjoining farms
Export of manganese through Durban
Obtaining of mining lease at Black Rock where initial manganese mining operation commenced
The listing of Assore on the JSE as The Associated Ore & Metal Corporation Limited
Alloy producer, Ferroalloys Limited, incorporated by Assmang
First production of ferromanganese at the Cato Ridge Works by Assmang
First mining of iron ore by Assmang at Beeshoek, and exported through Durban
Agency relationship established with Sumitomo Corporation of Japan
Commissioning of the Nchwaning Manganese Ore Mine
Gloria Manganese Ore Mine commissioned
Nchwaning II Mine came into production
Cato Ridge Alloys (CRA), a joint venture to produce refined ferromanganese for export at Cato Ridge, between Assmang’s Ferroalloys Limited and Japanese partners
Page 6
Assore integrated annual report 2016

1997
1999
2000
2001
2002
2004
2005
2006
2009
2010
2012
2014
2015
19961981
1979
1930
1931
1935
1936
1937
1939
1940
1950
1957
1959
1960
1961
1973
1928 2 0 1 6
Beeshoek South Mine expansion commissioned
Mining of chrome deposit by Assmang at Dwarsrivier
Change of name to Assore Limited and 20-for-1 subdivision of ordinary shares
Commissioning of Nchwaning III Manganese Ore Mine
First mining of manganese ore from Nchwaning III
Assmang’s Khumani Iron Ore Mine established, following issue of new-order mining rights, and increase of production to 10 million sales tonnes per annum
First empowerment transaction, whereby 11,76% and 3,26% of Assore’s shares in issue at the time were sold to Shanduka Resources and the Boleng Trust respectively (refer “Black economic empowerment status report”)
Acquisition of minorities in, and delisting of, Assmang and finalisation of 50/50 joint-venture agreement with African Rainbow Minerals Limited (ARM) in relation to Assmang’s operations
Approval of the Khumani Expansion Project to increase design capacity of iron ore output to 14 million tonnes per annum, to be completed in 2012, on time and within budget
5-for-1 subdivision of ordinary shares. Conclusion of second empowerment transaction, whereby a further effective 11,05% of Assore’s shares were acquired by the Boleng Trust
Conclusion of third empowerment transaction, whereby 11,79% of Assore shares were bought back from Shanduka Resources and disposed of to its broad-based empowerment trusts being the Fricker Road Trust and the Assore Employee Trust (refer “Black economic empowerment status report”)
First distributions made by empowerment trusts (R7,2 million) and to employees by employee trust (R13,2 million) and commencement of construction of offshore ferromanganese smelters in Sarawak province of Malaysia (Sakura Ferroalloys)
Purchase of the remaining 50% of Dwarsrivier Chrome Mine (Dwarsrivier) from ARM, subject to regulatory approval for R450 million and exploration for iron ore deposits in Gabon through investment in IronRidge commences
Conclusion of the acquisition of the remaining 50% of Dwarsrivier from ARM. Commissioning of ferromanganese furnaces at Sakura Ferroalloys, within budget
Page 7
Assore integrated annual report 2016
Overview Strategy and risk Reviews and reports Financial statements

Group structure
Safety and health
Risk
Environment
QualityCorporate governance
AssuranceAssoreLimited
Oresteel Investments Proprietary
Limited
Public shareholders
Fricker Road Trust 2, 5/Assore
EmployeeTrust 2, 5
Empowermententities
BolengTrust 1, 5
Cato Ridge Alloys
Proprietary Limited
SakuraFerroalloysSDN BHD
Cato RidgeDevelopment
CompanyProprietary
Limited
Khumani Housing
Development Company
Proprietary Limited
MineraisU.S. LLC
Rustenburg Minerals
Development Company
Proprietary Limited4
52,43%
21,50%
14,28%
11,79%
26,07%
50,0% 54,36% 100% 100% 51% 56%
AssmangProprietary
Limited
WonderstoneLimited
ZeerustChrome Mines
Limited
100% 100%
IronRidgeResources
Limited
29,9%100%
Ore & Metal Company Limited
100%
African Mining and Trust Company
100%
DwarsrivierChrome MineProprietary
Limited3
50,0%
1 The Boleng Trust is a black economic empowered entity which controls the majority of the voting rights in a special-purpose vehicle that owns 14,28% of Assore’s issued ordinary shares (refer note 4 below and “Black economic empowerment status report”).
2 The Fricker Road Trust is a black economic empowered entity which controls the majority of the voting rights in a special-purpose vehicle that owns 11,79% of Assore’s issued ordinary shares. The Assore Employee Trust controls the remainder of the voting rights (refer note 4 below and “Black economic empowerment status report”).
3 Subsequent to the financial year-end, Assore acquired the remaining 50% interest in Assmang’s Dwarsrivier Chrome Mine from ARM, completing the transaction on 29 July 2016 (refer page 87 for more detail).
4 A black economic empowerment entity, Mampa Investment Holdings Proprietary Limited, has a 44% equity interest in Rustenburg Minerals Development Company Proprietary Limited (refer “Black economic empowerment status report”).
5 More detail on the impact of the requirement of IFRS to consolidate these trusts is included on pages 44, 45 and 109 of this report.
Page 8
Assore integrated annual report 2016
Assurance
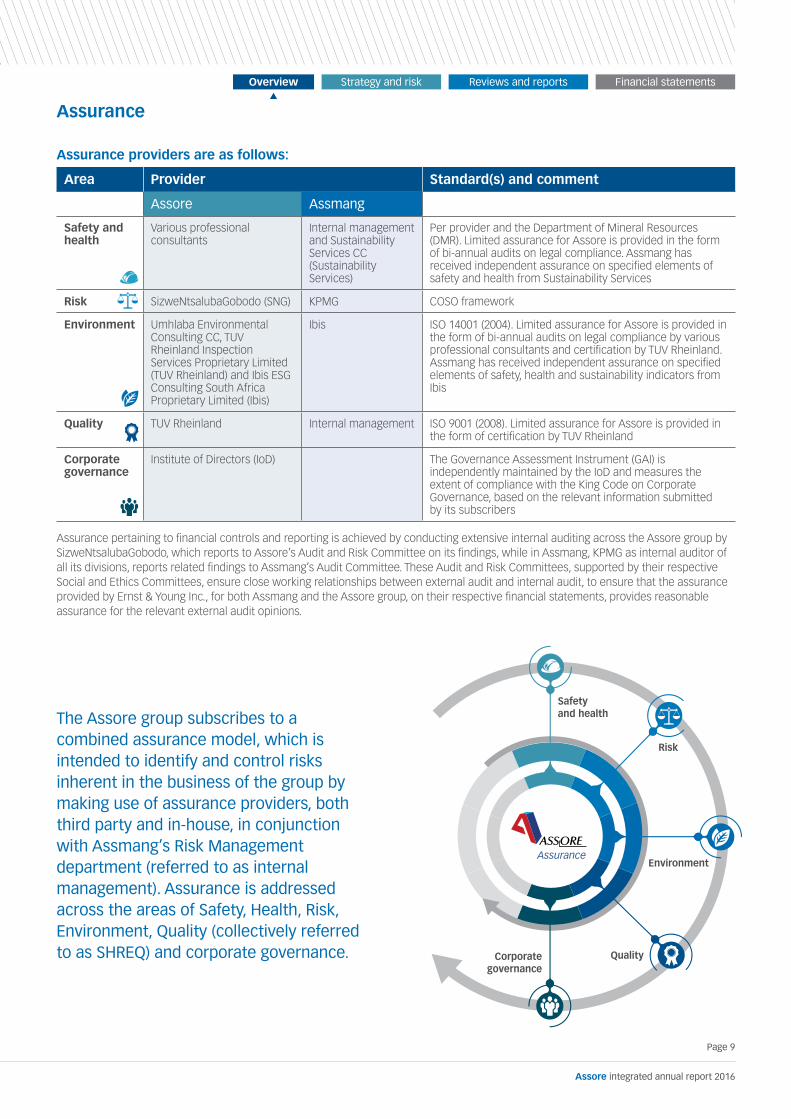
Assurance providers are as follows:
Area Provider Standard(s) and comment
Assore Assmang
Safety and health
Various professional consultants
Internal management and Sustainability Services CC (Sustainability Services)
Per provider and the Department of Mineral Resources (DMR). Limited assurance for Assore is provided in the form of bi-annual audits on legal compliance. Assmang has received independent assurance on specified elements of safety and health from Sustainability Services
Risk SizweNtsalubaGobodo (SNG) KPMG COSO framework
Environment Umhlaba Environmental Consulting CC, TUV Rheinland Inspection Services Proprietary Limited (TUV Rheinland) and Ibis ESG Consulting South Africa Proprietary Limited (Ibis)
Ibis ISO 14001 (2004). Limited assurance for Assore is provided in the form of bi-annual audits on legal compliance by various professional consultants and certification by TUV Rheinland. Assmang has received independent assurance on specified elements of safety, health and sustainability indicators from Ibis
Quality TUV Rheinland Internal management ISO 9001 (2008). Limited assurance for Assore is provided in the form of certification by TUV Rheinland
Corporate governance
Institute of Directors (IoD) The Governance Assessment Instrument (GAI) is independently maintained by the IoD and measures the extent of compliance with the King Code on Corporate Governance, based on the relevant information submitted by its subscribers
Assurance pertaining to financial controls and reporting is achieved by conducting extensive internal auditing across the Assore group by SizweNtsalubaGobodo, which reports to Assore’s Audit and Risk Committee on its findings, while in Assmang, KPMG as internal auditor of all its divisions, reports related findings to Assmang’s Audit Committee. These Audit and Risk Committees, supported by their respective Social and Ethics Committees, ensure close working relationships between external audit and internal audit, to ensure that the assurance provided by Ernst & Young Inc., for both Assmang and the Assore group, on their respective financial statements, provides reasonable assurance for the relevant external audit opinions.
The Assore group subscribes to a combined assurance model, which is intended to identify and control risks inherent in the business of the group by making use of assurance providers, both third party and in-house, in conjunction with Assmang’s Risk Management department (referred to as internal management). Assurance is addressed across the areas of Safety, Health, Risk, Environment, Quality (collectively referred to as SHREQ) and corporate governance.
Safety and health
Risk
Environment
QualityCorporate governance
Assurance
AssoreLimited
Oresteel Investments Proprietary
Limited
Public shareholders
Fricker Road Trust2, 5/Assore
EmployeeTrust2
Empowermententities
Boleng1, 5
Trust1
AssmangProprietary
Limited
IronRidgeResources
LimitedWonderstone
Limited
ZeerustChrome Mines
Limited
Ore & Metal Company Limited
African Mining and Trust Company
Cato Ridge Alloys
Proprietary Limited
SakuraFerroalloysSDN,BHD
Cato RidgeDevelopment
CompanyProprietary
Limited
Khumani Housing
Development Company
Proprietary Limited
MineraisU.S. LLC
Rustenburg Minerals
Development Company
Proprietary Limited4
52,43%
21,50%
14,28%
26,07%
50,0%
29,9%
100%
50,0% 54,36% 100% 100% 51% 56%
11,79%
Page 9
Assore integrated annual report 2016
Overview Strategy and risk Reviews and reports Financial statements

Underground dump truck at Nchwaning Manganese Mine
Assore integrated annual report 2016
Page 10

In this section:
Strategy and risk
Strategic objectives 12
Business model 13
Risks and opportunities 14
Financial highlights 17
Future performance objectives 18
Remuneration 19
Assore integrated annual report 2016
Page 11

Strategic objectives
Interaction with customers and
agents
Assessment of customers’
needs
Management of activities
pursuant to the requirements
of the Mining Charter# as well as the group’s
established empowerment
trusts
Management of environmental
impact by the group’s operations
within legal tolerances
# Pursuant to the Mineral and Petroleum Resources and Development Act (the MPRD Act).
1
2
3
4
5
Satis�ed communities living in unspoilt environments
Satis�ed customers, who are willing to continue to purchase the group’s products and services
Content and productive employees, who are secure in their working environment
Secure and reliable logistical channels
Increased pro�tability and shareholder returns
Matching ofcustomers’ needs
with available mineral resources and
production facilities
Arrangement of cost-effective
and reliable logistical channels
Customer and agency
relationships
Legal requirements
and safety standards
Customer needs and
requirements
Geological and technical information
O
utco
mes
Out
put
s
Act
ivit
ies
Inputs
Mat
erial
pro
duced
in a
cc
ordan
ce
with
cus
to
mers’ needs
Ongoing maintenance
of production
facilities
Focused expansionand increased ef�ciencyof production facilities
safety
re
cord
impro
vem
ent i
n
Continued
group’s operations
im
pact of
Minim
ised environmental
the group’s operationsprojects in the vicinity of
Execution of social upliftment
Material delivered tocustomers on timeand within budget
Optimise prices and tonnages sold per segment and regional concentration of customersmeasured in “Operational review and commentary”
1Expansion and replacement projects completed on time, to specification and within budgetmeasured in “Operational review and commentary”
5Ongoing improvement in the group’s safety recordmeasured in “Sustainability report”, located on the group’s website under “Annual reports” in the “Investor centre”
4Compliance with the requirements of the Mining Charter, specifically those relating to black economic empowerment (BEE)measured in “Black economic empowerment status report”
3Sustainable exploitation of mineral depositsmeasured in “Mineral Resources and Reserves report”, located on the group’s website under “Annual reports” in the “Investor centre”
2
Fundamental understanding of the markets in which the
group operates and their evolution.
Management’s understanding
of the characteristics
of the orebodies.
The logistical arrangements
across the range of the
group’s commodities.
The configuration
of the works in combination
with customer requirements,
taking practical limitations into
account.
Strategy
The strategy of the Assore group is to anticipate and react to changes in the markets in which it operates, to align existing and available minerals and production with international market expectations and to optimise logistical capacities, both local and globally, in a manner that is consistent with production by group operations, and to do so on a sustainable basis. Key performance indicators (KPIs) for the group include the following elements, as more fully set out and measured below:
Key performance indicatorsIn order to achieve the KPIs, the following requirements are essential to optimise the group’s
performance and results:
Page 12
Assore integrated annual report 2016

Business model
Interaction with customers and
agents
Assessment of customers’
needs
Management of activities
pursuant to the requirements
of the Mining Charter# as well as the group’s
established empowerment
trusts
Management of environmental
impact by the group’s operations
within legal tolerances
# Pursuant to the Mineral and Petroleum Resources and Development Act (the MPRD Act).
1
2
3
4
5
Satis�ed communities living in unspoilt environments
Satis�ed customers, who are willing to continue to purchase the group’s products and services
Content and productive employees, who are secure in their working environment
Secure and reliable logistical channels
Increased pro�tability and shareholder returns
Matching ofcustomers’ needs
with available mineral resources and
production facilities
Arrangement of cost-effective
and reliable logistical channels
Customer and agency
relationships
Legal requirements
and safety standards
Customer needs and
requirements
Geological and technical information
O
utco
mes
Out
put
s
Act
ivit
ies
Inputs
Mat
erial
pro
duced
in a
cc
ordan
ce
with
cus
to
mers’ needs
Ongoing maintenance
of production
facilities
Focused expansionand increased ef�ciencyof production facilities
safety
re
cord
impro
vem
ent i
n
Continued
group’s operations
im
pact of
Minim
ised environmental
the group’s operationsprojects in the vicinity of
Execution of social upliftment
Material delivered tocustomers on timeand within budget
Page 13
Assore integrated annual report 2016
Overview Strategy and risk Reviews and reports Financial statements

Risks and opportunities
Operating contextThe performance of the Assore group is largely dependent on the level of global economic growth, as almost all its commodities are used in the production of crude and stainless steel, the consumption of which is intimately related to the incidence of global capital spend. Global economic growth, in turn, together with demand and supply dynamics, drives, inter alia, US dollar prices for commodities, while the level of exchange rates, combined with these prices, has a direct bearing on the group’s financial performance. In assessing the group’s risks and analysing its performance, it is essential to understand that by its nature, mining is a long-term business and these analyses should be conducted bearing this in mind.
1 2
3
4
5
6
7
Political conditions in the countries in which customers and competitors are located
The establishment of new, technologically advanced facilities
Exploration for and development of new and existing mineral deposits
The ability and cost competitiveness of existing facilities, taking planned capital improvements into account, to meet global demand
The availability of suitable vessels, and the ef�ciency and capacity of the South African and overseas ports
Global inventory levels of inputs into steelmaking processes
The existence or establishment of suf�cient overland logistical capacity (railage capacity)
Factors thatinfluence the group’soperatingcontext
Fluctuations in exchange rates
Changes in international commodity prices
Financial risks
Operationalrisks
Impact
Mitigation measures
Impact
Mitigation measures
World economic growth
South African labour market
Resources and Reserves
Mining Charter
South African logistical infrastructure
Page 14
Assore integrated annual report 2016

While ensuring that every reasonable opportunity is pursued to add value to shareholders’ returns, management is aware of the impact of the group’s activities on other stakeholders as well as on the environment. The manner in which the group interacts with its stakeholders and its impact on the environment is addressed in the “Sustainability report”, located on the group’s website under “Annual reports” in the “Investor centre”.
The table on page 16 sets out the most significant material risks to which the group is exposed and describes the mitigation measures adopted.
1 2
3
4
5
6
7
Political conditions in the countries in which customers and competitors are located
The establishment of new, technologically advanced facilities
Exploration for and development of new and existing mineral deposits
The ability and cost competitiveness of existing facilities, taking planned capital improvements into account, to meet global demand
The availability of suitable vessels, and the ef�ciency and capacity of the South African and overseas ports
Global inventory levels of inputs into steelmaking processes
The existence or establishment of suf�cient overland logistical capacity (railage capacity)
Factors thatinfluence the group’soperatingcontext
Fluctuations in exchange rates
Changes in international commodity prices
Financial risks
Operationalrisks
Impact
Mitigation measures
Impact
Mitigation measures
World economic growth
South African labour market
Resources and Reserves
Mining Charter
South African logistical infrastructure
Page 15
Assore integrated annual report 2016
Overview Strategy and risk Reviews and reports Financial statements

Risks and opportunities continued
Risk description Impact Mitigation measures
Financial risks
Fluctuations in exchange rates
Since most sales are denominated in foreign currency, fluctuations in exchange rates (the level of the rand against the US dollar and the euro) can have a significant impact on the group’s earnings
Assore has an established Treasury Committee, the purpose of which is to limit exposure to exchange rate fluctuations. A limited degree of natural hedging occurs, given that some capital expenditure occurs in foreign currency as well
Changes in international commodity prices
Most iron ore sales are priced on a quarterly basis retrospectively while manganese ore is priced quarterly in advance or on a shipment-by-shipment basis. Most other commodities are priced quarterly in advance. Fluctuations in these prices can have a significant impact on the profitability of the group
Market prices of commodities are continually monitored by Ore & Metal, and the diversified portfolio of commodities provides a degree of hedging against variable commodity prices
Operational risks
World economic growth
Since most of the group’s commodities are used as inputs in the steel industry, the group’s ability to continue to distribute and sell its commodities is largely dependent on the level of demand for steel, which in turn is linked to economic growth
Management continually monitors market conditions and developments in the steel industry, and ensures that ore reserves are exploited in a manner that ensures suitable sustainable supply of material to our customers
South African logistical infrastructure
The available channels for the export of commodities from the mines to the ports, and the facilities in South Africa’s ports, are both dependent on the level of infrastructural investment by the state through Portnet and Transnet. The level of maintenance and quality of management of the logistical facilities have a direct bearing on the group’s sales volumes
Assmang management and representatives of Ore & Metal meet regularly with all levels of Transnet’s port and rail management to ensure optimum use of the existing channels and to explore expansion and optimal maintenance of these channels
South African labour market
The labour market in South Africa has become increasingly volatile, with prolonged strikes in certain sectors, which usually carry unrealistic demands from trade unions on employers, resulting in protracted negotiations with negative effects on productivity
Management attempts as far as is practical to commence wage negotiations at an early stage, and in an attempt to gain certainty on operating costs; these usually encompass negotiations towards agreements that cover more than one year
Resources and reserves
By nature, the metal content of orebodies can vary over the course of the life of the mine and, depending on commodity prices, their lives can either increase or decrease, given that mining deeper becomes increasingly more costly. Customer choices and preferences, therefore, have a direct bearing on the economic lives of the deposits
Orebodies are continually monitored, using modelling techniques, and are exploited in conjunction with market demand. Customer relationships are carefully managed in order to ensure that customer requirements are met within physical, chemical and economic constraints. For a detailed analysis of the group’s orebodies, refer to the “Mineral Resources and Reserves report”, located on the group’s website under “Annual reports” in the “Investor centre”
Mining Charter The Mining Charter places onerous requirements on the operations in order to meet its requirements
Management of the compliance aspects of the Charter is undertaken at all operations and every attempt is made to ensure compliance, both at the operations and at a corporate level (refer “Black economic empowerment status report” on pages 38 to 40)
Page 16
Assore integrated annual report 2016

Financial highlights
12 13 14 15 16
1 7001 964
2 895
3 3572 941
Revenue – R million
12 13 14 15 16
3 519 3 424
4 098
1 6901915
Headline earnings per share – Cents
12 13 14 15 16
550600
1 000
600700
Dividends per share - R million
Group highlights
Assmang highlights
The highlights included in these graphs give effect to the requirement of IFRS to apply the equity accounting basis in the group’s results, for its 50% share in the results of Assmang, which are reflected at 100% above. Therefore, ”Group highlights” does not include its proportion of Assmang’s turnover in its revenue. “Assmang highlights” include continuing and discontinued operations (refer notes 1, 8 and 36 to the consolidated financial statements).
12 13 14 15 16
23 941 24 63427 562
21 121 20 654
Turnover – R million
12 13 14 15 16
4 4874 064
3 643 3 837
2 975
Capital expenditure – R million
12 13 14 15 16
6 8846 210
7 169
2 659 2 655
Earnings – R million
Revenue – R million Headline earnings per share – cents Dividends per share – cents
Turnover – R million Capital expenditure – R million Earnings – R million
Page 17
Assore integrated annual report 2016
Overview Strategy and risk Reviews and reports Financial statements

Future performance objectives
Taking into account management’s assessment of the risks and opportunities identified under “Risks and opportunities”, and its responsibilities and involvement relating to Assmang and other group entities, the specific key performance indicators (KPIs) for the short and medium term include:Assmang – maintaining steady-state production performance from Khumani Iron Ore Mine, by optimising the off-grade washing plant and modification of the Wet High Intensity Magnetic Separation (WHIMS) plant, to ensure realisation of planned life of mine;
– the substitution of ore from other pits at Beeshoek Iron Ore Mine with the ore from the Village Pit, which is now in operation;
– the execution of the sustainability and expansion project at Black Rock Manganese Mines to increase and sustain production from the various
shafts at higher volumes, achieving sustainable production of 4 million tonnes per annum of manganese ore in the long term;
– continuing to develop the group’s market for the material produced from the upper seam at Nchwaning Manganese Mine;
– following the successful commissioning of both furnaces at Sakura Ferroalloys in Malaysia, to successfully ramp up these furnaces to full production, to be followed by converting Furnace 2 from the production of high-carbon ferromanganese to silico manganese in the first calendar quarter of 2017; and
– the continued optimisation of alloy production at the group’s ferromanganese facilities in order to mitigate increases in the prices of electricity, which are expected to exceed inflation rates.
Assore subsidiaries – enhancing the group’s position in South Africa’s chrome ore market and to ensure a smooth transition of all of Dwarsrivier’s operations into the group (refer “Operational review and commentary”);
– continuing with the development of North Shaft at Dwarsrivier and proceed with beneficiation plant upgrades to process the run-of-mine (ROM) material from both shafts; and
– continuing to explore early-stage opportunities in iron ore (in Gabon) and other commodities, focused in Africa, through IronRidge.
Page 18
Assore integrated annual report 2016

Remuneration
Remuneration policyThe remuneration policy of the group aims to ensure that all staff are remunerated fairly and in accordance with the levels of responsibility they assume in performing their duties. In applying the policy the following factors are taken into account: – Both mining and the marketing and selling of commodities, whether locally or internationally, are long-term businesses and certain essential skills are required to ensure the sustainability of the group’s operations through the various international commodity and economic cycles to which the group is exposed.
– The sustainability of the group’s business depends on it being able to attract and retain individuals with appropriate skills, knowledge and experience in all aspects of the group’s activities, particularly where long-term contracts are involved.
– The group’s products are sold locally and internationally and the customer base has to be managed carefully to ensure profitability and sustainability.
Determination of remunerationThe remuneration of the group executive directors is determined by the Remuneration Committee (refer below), applying the group’s policy on remuneration. The executive directors in turn determine the remuneration of the group’s employees in conjunction with the Human Resources department and the relevant departmental heads. Independent remuneration consultants are employed when considered necessary.
The levels of remuneration are benchmarked annually against remuneration paid to executives in other listed companies in the resources sector and, where appropriate, against levels of remuneration paid within the relevant professions of individual employees. The remuneration of directors and senior staff depends on the size and complexity of the operations of the group and the level of professional input required within the business environment concerned, and has due regard to the calibre, expertise and seniority of the person required for the position.
All employees are remunerated on the basis of a fixed salary and variable bonus awards. Bonus awards are made to all staff and are based on the performance of the group and the successful achievement of its long-term strategic objectives. Limited reliance is placed on the achievement of short-term performance indicators in determining group and individual levels of
remuneration, with emphasis being placed rather on contribution to group effort and achievement in the long term. Bonuses are determined on the basis of the results and performance of the group for the year in question, taking into account conditions applicable in the particular commodity cycle, and are reviewed and approved by the Remuneration Committee. The impact on earnings per share for the year of the bonuses after the tax effect paid to executive directors of Assore was 21 cents (2015: 29 cents), amounting to 1,41% (2015: 2,13%) of earnings per share. The group does not operate a share incentive scheme or share option scheme for executive directors or senior staff. However, these members of staff are the beneficiaries of certain performance bonus arrangements and incentive schemes.
In order to incentivise and create value for all the group’s employees, the group operates a dividend and equity participation scheme through the Assore Employee Trust (refer “Black economic empowerment status report”, page 39), whereby non-managerial staff who do not participate in pre-existing incentive schemes or performance bonus arrangements, participate in dividends declared by Assore as well as in the growth in Assore’s share price over a predetermined vesting period. Directors and senior staff do not participate in this scheme.
Remuneration CommitteeSince salaries and bonuses are reviewed on an annual basis, the committee meets formally at least once a year, in addition to ad hoc meetings that may be necessary from time to time. The Chief Executive Officer attends meetings of the committee by invitation but is not entitled to vote. The committee met once in the year under review and attendance was as follows:
Possibleattendance Attended
EM Southey (Chair) 1 1Desmond Sacco 1 1WF Urmson 1 1
The Remuneration Committee is chaired by the lead independent director and consists of a majority of independent non-executive directors. Group Chairman Desmond Sacco is appointed as a member of this committee, based on his interest as controlling shareholder of the company, which the board believes adds to the overall appropriateness of the decisions
and policies of the committee. Its terms of reference have been approved by the board and are reviewed annually by the board.
Recommendations on the broad framework and cost of executive remuneration are made annually to the committee for approval. To do so, the committee is required to determine: – the group’s general policy on executive remuneration;
– specific remuneration packages for executive directors;
– where necessary, criteria to assess the required performance of executive directors; and
– the necessity to take independent professional advice on remuneration issues.
Due to the sensitivity of individual remuneration levels, the remuneration of senior employees, other than directors, is not disclosed. However, the total cost of the remuneration of senior employees is disclosed in the consolidated financial statements (refer note 34.1), and directors’ remuneration of the holding company directors for the current and previous financial year is set out on page 53.
Service agreementsNone of the executive directors has signed a service agreement with the group. Accordingly, there are no contractual or financial obligations on the group in the event of premature termination of employment.
Non-executive directorsNon-executive directors are remunerated by means of annual fees, payable quarterly, which are not dependent on attendance at meetings. Fees for non-executive directors are reviewed regularly and are adjusted whenever necessary taking into account the remuneration of non-executive directors of companies with similar complexity profiles in the South African resources sector, and the degree of skill, time and experience required to discharge their duties.
Shareholders’ approvalThe board acknowledges the requirements of King III for shareholders annually to pass a non-binding advisory vote on the company’s remuneration policy. Directors’ fees are approved by means of special resolution as required by section 66(9) of the Companies Act, No 71 of 2008, as amended (the Companies Act). Details of these procedures and relevant information are set out in the notice of Annual General Meeting (AGM).
Page 19
Assore integrated annual report 2016
Overview Strategy and risk Reviews and reports Financial statements

Sakura Ferroalloys, Malaysia
Assore integrated annual report 2016
Page 20

In this section:
Reviews and reports
Mineral Resources and Reserves summary 22
Chairman’s statement 24
Board of directors 26
Operational review and commentary 28
Corporate governance and risk management report 32
Black economic empowerment status report 38
Group sustainability performance 42
Five-year summary 44
Assore integrated annual report 2016
Page 21

Mineral Resources and Reserves summary
The summaries below reflect the Measured and Indicated Resources and the corresponding Proved and Probable Reserves for each mine or project. The complete Mineral Resources and Reserves report is located on the group’s website under “Annual reports” in the “Investor centre”. The Mineral Resources are inclusive of those modified to produce Mineral Reserves.
Joint-venture entity – Assmang, as at 30 June 2016
Iron Ore
Mineral Resources Mineral Reserves
Measured IndicatedMeasured and
Indicated Proved ProbableProved and
Probable
Mt Fe% Mt Fe% Mt Fe% Mt Fe% Mt Fe% Mt Fe%
Beeshoek Mine
All pits 98,08 64,09 9,63 63,81 107,71 64,06 42,94 64,74 3,85 63,95 46,79 64,67Stockpiles 6,06 55,15 6,06 55,15
Khumani Mine
Bruce 110,74 64,47 81,97 64,42 192,71 64,45 83,94 64,44 73,96 64,47 157,90 64,46King 284,04 64,24 94,39 64,16 378,43 64,22 259,02 64,32 9,09 65,19 268,11 64,35Stockpiles 4,45 60,00 4,45 60,00
Manganese
Mineral Resources Mineral Reserves
Measured IndicatedMeasured and
Indicated Proved ProbableProved and
Probable
Mt Mn% Mt Mn% Mt Mn% Mt Mn% Mt Mn% Mt Mn%
Nchwaning Mine
Seam 1 57,78 45,2 72,11 41,7 129,89 43,3 44,10 45,2 52,90 41,8 97,00 43,3Seam 2 65,01 42,6 114,77 42,2 179,78 42,3 47,80 41,6 76,20 41,5 124,00 41,5
Black Rock (Koppie Area)
Seam 1 9,03 40,3 34,57 40,7 43,60 40,6 Seam 2 8,23 37,4 18,58 39,2 26,81 38,6
Gloria Mine
Seam 1 51,40 37,5 97,85 37,3 149,25 37,4 42,60 36,3 79,60 36,0 122,20 36,1Seam 2 32,04 28,3 32,04 28,3
Chromite
Mineral Resources Mineral Reserves
Measured IndicatedMeasured and
Indicated Proved ProbableProved and
Probable
Mt Cr2O3% Mt Cr2O3% Mt Cr2O3% Mt Cr2O3% Mt Cr2O3% Mt Cr2O3%
Dwarsrivier Mine*
LG6 Chromitite Seam 28,38 37,56 40,66 38,41 69,04 38,06 18,01 32,81 30,33 33,23 48,34 33,07
* With effect from 1 July 2016, Assore owns 100% of Dwarsrivier Chrome Mine (refer note 36 to the consolidated financial statements).
Subsidiary companies, as at 30 June 2016
Mineral Resources Mineral Reserves
MineralMeasured
MtIndicated
MtInferred
MtTotal
ResourceProved
MtProbable
MtTotal
Reserve
Wonderstone Pyrophyllite 3,6 9,9 107,2 120,7 3,4 9,4 12,8Rustenburg Minerals (LG6#) Chromite 3,6 1,7 9,8 15,1 0,0 0,0 0,0Zeerust Chrome (LG1, 2 and 3#) Chromite 0,3 1,1 6,6 8,0 0,0 0,0 0,0
# The chromite grades of individual seams are included in the complete Mineral Resources and Reserves report.
Page 22
Assore integrated annual report 2016

Joint-venture entity – Assmang, as at 30 June 2015
Iron Ore
Mineral Resources Mineral Reserves
Measured IndicatedMeasured and
Indicated Proved ProbableProved and
Probable
Mt Fe% Mt Fe% Mt Fe% Mt Fe% Mt Fe% Mt Fe%
Beeshoek Mine
All Pits 104,10 64,07 9,63 63,81 113,73 64,05 47,64 64,63 3,86 63,95 51,50 64,58Stockpiles 7,42 55,38 7,42 55,38
Khumani Mine
Bruce 119,58 64,48 83,39 64,42 202,97 64,46 90,35 64,38 73,48 64,37 163,83 64,37King 301,04 64,23 96,24 64,13 397,28 64,21 274,72 64,30 9,40 65,11 284,12 64,33Stockpiles 4,76 55,79 4,76 55,79
Manganese
Mineral Resources Mineral Reserves
Measured IndicatedMeasured and
Indicated Proved ProbableProved and
Probable
Mt Mn% Mt Mn% Mt Mn% Mt Mn% Mt Mn% Mt Mn%
Nchwaning Mine
Seam 1 57,13 44,5 75,89 41,9 133,02 43,0 45,02 43,9 59,19 41,8 104,21 42,7Seam 2 66,31 41,2 117,85 40,5 184,16 40,8 43,08 41,5 75,45 40,6 118,53 40,9
Black Rock (Koppie Area)
Seam 1 9,03 40,3 34,57 40,7 43,60 40,6 Seam 2 8,23 37,4 18,58 39,2 26,81 38,6
Gloria Mine
Seam 1 49,01 37,3 77,44 36,7 126,45 36,9 35,69 37,3 56,93 36,5 92,62 36,8Seam 2 30,73 28,0 30,73 28,3
Chromite
Mineral Resources Mineral Reserves
Measured IndicatedMeasured and
Indicated Proved ProbableProved and
Probable
Mt Cr2O3% Mt Cr2O3% Mt Cr2O3% Mt Cr2O3% Mt Cr2O3% Mt Cr2O3%
Dwarsrivier Mine
LG6 Chromitite Seam 22,34 37,92 30,73 37,87 53,07 37,89 14,32 33,88 23,27 34,53 37,60 34,28
Subsidiary companies, as at 30 June 2015
Mineral Resources Mineral Reserves
MineralMeasured
MtIndicated
MtInferred
MtTotal
ResourceProved
MtProbable
MtTotal
Reserve
Wonderstone Pyrophyllite 3,6 11,8 107,2 122,6 3,4 11,2 14,6Rustenburg Minerals (LG6#) Chromite 3,9 1,7 9,8 15,4 2,4 1,0 3,5Zeerust Chrome (LG1, 2 and 3#) Chromite 0,3 1,1 6,6 8,0 0,0 0,0 0,0
# The chromite grades of individual seams are included in the complete Mineral Resources and Reserves report.
Page 23
Assore integrated annual report 2016
Overview Strategy and risk Reviews and reports Financial statements

Chairman’s statement
Prices for the group’s products recovered during the second half of the financial year. However, global economic conditions remain challenging, with continued oversupply in the group’s markets. Despite these dynamics, record sales volumes of iron and chrome ores were achieved by the group for the second year in a row. The level of profitability in the second half has recovered to levels similar to those achieved during the previous financial year.
The year under reviewThe past financial year has yielded higher earnings than originally anticipated. This was particularly evident in the second half of the year, with prices for iron and manganese ores making a sustained recovery since January. Average prices for iron ore for the second half were approximately 3% higher than the first half, while those for manganese ore were 18% higher. However, in rand terms, prices for chrome ore were 13% lower in this period.
In addition to the improved prices for iron ore, the premium for “lumpy” grade iron ore in the second half of the year was approximately US$4 higher per tonne than in the first half. While the gains in the prices of iron and manganese ores noted above appear to be modest, the group benefited from improved production at its mines and higher railings in the second half, which led to record sales volumes being achieved for iron and chrome ores for 2016. This, coupled with a weaker rand/US dollar exchange rate, which was approximately 12% weaker during the second half at R/US$15,38, gave rise to more favourable trading conditions compared with the first half of the year. These factors resulted in a recovery of profitability, giving rise to headline earnings for the year of R1,7 billion, compared with R2,0 billion in 2015, with just over R1,0 billion of these headline earnings recorded in the second half of the financial year. The contributions to headline earnings by the divisions of Assmang (Iron Ore, Manganese and Chrome) and the other business conducted by the group over the past five years are illustrated in Figure 1.
Market conditionsThe main factors during the previous financial year which gave rise to depressed commodity prices, remained evident during the first half of this financial year. Firstly, additional volumes of both iron and manganese ores entered the market, with little tonnage being removed from the market. Secondly, world crude steel production declined by 2% in the 2015 calendar year, and this trend is expected to continue in this calendar year. Chinese crude steel production for this year has, however, remained at a similar level to that achieved in 2015, with excess production being exported, placing pressure on steel prices and consequently on prices of the group’s base mineral products. The market for manganese alloys remained in
oversupply, despite the closure of more than 3 million tonnes of worldwide capacity per annum.
The group has benefited from the application of tighter environmental controls being imposed in China, which has increased the demand and pricing for the higher-grade products which the group produces. In addition, the Chinese government launched economic stimulus measures, creating temporary pricing gains for the group’s products. With low inventory levels of chrome ore in China not being met with sufficiently decreased levels of stainless steel production, prices for chrome ore increased sharply towards the end of the financial year. A stagnant freight market kept freight rates low throughout the year, largely as a result of low crude oil prices, and this provided the group with opportunities to optimise net landed prices for its customers.
Expansion and capital expenditureThe acquisition of Dwarsrivier Chrome Mine (Dwarsrivier) was concluded on 29 July 2016 and is expected to improve the balance in the group’s product risk. Initial improvements in productivity have already been implemented and the mine is planning to produce approximately 1,3 million tonnes of saleable ore in the forthcoming year, which is 13% more than the sales volumes recorded for 2016. Sakura Ferroalloys, in which Assmang holds a 54,36% interest, has successfully commissioned its two recently constructed ferromanganese furnaces, within the original budget of US$328 million. The second furnace achieved first production of alloy in September and it is expected that it will be converted from high-carbon ferromanganese to silico manganese in the first quarter of 2017.
Several initiatives are currently under way in IronRidge Resources Limited (IronRidge), an AIM (London) – listed exploration company in which the group holds a 29,9% equity interest. Satisfactory progress has been made in prospecting for iron ore in Gabon, while recent developments include assessing bauxite, lithium and gold deposits in Australia, Ghana and Chad respectively.
The most significant feature in Assmang’s capital expenditure, which amounted to R3,0 billion for the year (2015: R3,8 billion), is the expansion project at its Black Rock
– Commodity prices recover in the second half
– Headline earnings decline by 11,7%
– Acquisition of Dwarsrivier Chrome Mine completed
– First furnace at Sakura Ferroalloys in production, second commissioned
– Dividends for the year increased to R7,00 per share
– Strong cash position maintained
Page 24
Assore integrated annual report 2016

Manganese Mines, on which R1,7 billion was spent (2015: R1,3 billion). R383 million was spent on waste-stripping at its iron ore mines, with remainder of the expenditure on replacement items. The allocation of capital expenditure over the past five years across the divisions of Assmang is set out in Figure 2.
DividendsDespite difficult trading conditions, the group has managed to retain cash within the business, and capital projects remain funded from these reserves. Accordingly, with the improved level of earnings in the second half of the year, the final dividend was increased from R3,00 per share to R5,00 per share, making the total dividend for the year R7,00 (2015: R6,00) per share.
OutlookThe better than expected level of Chinese steel production in recent months is encouraging. However, the supply of iron ore worldwide has increased, causing price levels to remain under pressure. The impact of prospective interest rate increases in the United States of America remains unclear, while conditions in the Chinese economy, which have been the driver of increased demand for
commodities over the recent past, remains relatively weak and the continued economic impact of the stimulus measures introduced by its government is also in doubt. The result of these and other global factors has a major impact on the level of certainty required for additional steel-producing capacity, with world economic growth expected to be 2,9% for 2016 with a projected increase to 3,4% in 2017.
Prices for the group’s products have increased over the levels achieved in the first half of the year, which has encouraged additional sales volumes of ores, particularly for the lower grades. Although the group is favourably placed in terms of its ratios of production of higher grade ores, pricing pressure is expected to remain a feature of the markets for the medium term. In the near term, prices for iron ore are expected to remain under pressure, with additional capacity entering the market from Australia and Brazil as well as certain high-cost producers re-entering the market following improved sales prices for ore. For manganese and chrome ores, prices have improved markedly, with current published prices for manganese ore approximately 50% higher than the average prices achieved in the
second half of the financial year. Drivers behind these higher prices include inventory shortages and environmental controls, which favour the use of high-grade products by steel producers. Additional upward pressure on manganese ore prices has arisen as a result of logistical concerns at the export facilities for manganese in Port Elizabeth.
AppreciationTaking into account the uncertainties pervading the mining industry both locally and overseas, this year has been a successful year for the group, with the acquisition of Dwarsrivier and the commissioning of the low-cost producing manganese alloy furnaces in Malaysia. I thank my fellow directors, the management and staff for their ongoing support and commitment during the year. Additionally, I remain very appreciative of the roles played by our customers, agents, suppliers and bankers who continue to contribute greatly to the group’s achievements.
Desmond SaccoChairman
19 October 2016
12 13 14 15 16(44)
3 534
4 230
1 976 1 744
(86) 64 92 21611
259 317 494 368 394
2 9683 708
(19)
470
2 766
(36)
529
3 179
(21)
289
1 248
(83)
197
1 215 ■ Iron ore■ Manganese■ Chrome■ Commissions, fees and interest earned■ Other operations
Figure 1: Headline earnings/(loss) – R million
12 13 14 15 16
4 0643 643
3 837
2 975
291 132 244 207 149
856
3 340
4 487
1 223
2 709
1 341
2 058
1 984
1 646
1 925
901
■ Iron ore■ Manganese■ Chrome
Figure 2: Assmang’s capital expenditure – R million
Page 25
Assore integrated annual report 2016
Overview Strategy and risk Reviews and reports Financial statements

Bastiaan H van Aswegen
BEng (Metallurgy), BCom, MEng
Tiaan obtained a BEng (Metallurgy) from the University of Pretoria (UP) in 1982 and later obtained BCom (Unisa) and MEng (UP) degrees. After working for Iscor and Samancor in production and on projects, he was appointed by Samancor as General Manager of the Palmiet Ferrochrome Operation (Mogale) in 1999. He joined Assore in 2003 as Consulting Metallurgist and is a member of the Assmang Operations Committee. In September 2012, he was appointed Group Technical and Operations Director of Assore and a director of Assmang. In June 2014, he was appointed as Chairman of Assmang subsidiary, Sakura Ferroalloys SDN BHD, Malaysia.
Patrick E Sacco
BA (Indus Psych), MA (Marketing)
Pat joined the Assore group in 2003 after completing a master’s degree at the University of Colorado (USA). He was appointed a director of Ore & Metal, the selling and marketing agent for all the group’s products, in 2007, and as from 1 March 2016, has been appointed as its Managing Director. Pat was appointed as a director of Assmang in 2008, and is on the board of Oresteel Investments Proprietary Limited, the ultimate holding company of Assore. On 1 July 2015, he was appointed as a director of the International Manganese Institute (IMnI) and was appointed as Group Marketing Director on 1 March 2016.
Christopher J Cory
BA, CA(SA), MBA (Wits)
Chris completed articles with Alex, Aiken & Carter (now KPMG) and qualified as a chartered accountant in 1982. In 1989, he joined the Assore group as Group Accountant. In 1992, he was appointed Group Financial Director and made Chief Executive Officer in June 2004 when the roles of Chairman and Managing Director were split. He was appointed to the Assmang board as a non-executive director in 1993 and currently chairs the Assmang Audit Committee. He is a member of the South African Institute of Chartered Accountants (SAICA).
Desmond Sacco
BSc (Hons) (Geology)
Des qualified as a geologist and joined the Assore group in 1968. He was appointed to the Assore board in 1974 and, on the retirement of his father, Guido, in 1992, was appointed Chairman and Managing Director. In that year, he was also appointed Deputy Chairman of Assmang Limited and in 1999 he became Chairman of Assmang. He is a fellow of the Institute of Directors (IoD) and of the Geological Society of South Africa (GSSA).
Board of directors
Chairman Chief Executive OfficerGroup Marketing Director
Group Operations and Growth Director
Executive directors
Page 26
Assore integrated annual report 2016

William F Urmson
CA(SA)
Bill was appointed as an independent non-executive director in October 2010 and chairs the group’s Social and Ethics Committee. He also serves on the group’s Audit and Risk, and Remuneration Committees. He is a former Deputy Chairman of Ernst & Young and has served the accounting profession as Chairman of the Accounting Practices and Ethics Committees of the South African Institute of Chartered Accountants. He is a former director: surveillance of the JSE and consulted to the exchange on a part-time basis until December 2013.
Sydney Mhlarhi
BCom, BAcc, CA(SA)
Sydney qualified as a chartered accountant in 1998 following the completion of his articles at Ernst & Young in 1997. He co-founded Tamela Holdings Proprietary Limited (Tamela) in 2008, which holds investments in various industries. Sydney has held various senior positions in the investment banking sector, including those of divisional director at Standard Bank and Chief Investment Officer of Makalani Holdings Limited, a mezzanine financier which listed on the JSE in 2005. Sydney was appointed to the board on 15 October 2012 and serves on the group’s Audit and Risk Committee.
Thandeka N Mgoduso
BA, MA (Clinical Psychology)
Thandeka is a clinical psychologist and obtained her qualifications at the universities of Fort Hare and the Witwatersrand. While in commerce, she held various leadership positions in operations, as well as in human resources, including a non-executive directorship of the South African Reserve Bank, and currently consults in strategy and human resources. She chairs her company, Jojose Investments, and is a non-executive director on the board of Tongaat Hulett. She was appointed to the board with effect from 2 February 2015 and serves on the Social and Ethics Committee.
Edward M Southey
BA, LLB
Ed was admitted as an attorney, notary and conveyancer in 1967 and practiced as a partner of Webber Wentzel until his retirement as senior partner of that firm in 2006. He remains an executive consultant to the firm. He is a former president of the Law Society of the Northern Province and of the Law Society of South Africa and is a director of a number of companies. He joined the Assore board as a non-executive director in January 2009, and was appointed as Deputy Chairman and lead independent director in November 2010. He is the chairman of the group’s Audit and Risk, and Remuneration Committees.
Independent non-executive director
Independent non-executive director
Independent non-executive director
Independent non-executive directors
Deputy Chairman and lead independent non-executive director
Page 27
Assore integrated annual report 2016
Overview Strategy and risk Reviews and reports Financial statements

Operational review and commentary
The groupThe group’s markets are mostly centred in the Far East, India, Europe, North America and South Africa. The market into which the group sells the majority of its products is the Chinese market. The group continues to develop other markets in an attempt to diversify this risk.
Customers in the group’s markets continue to show strong support for its products, but constrained economic growth during the year has limited real growth in their overall demand. India and China have demonstrated the highest potential for growth and relationships continue to be built in these markets.
As anticipated, world crude steel production declined by 2% in the 2015 calendar year, with a further decline expected for the 2016 calendar year. China continued to dominate world crude steel production, producing approximately 50% of the world total production, but following reduced demand for crude steel, production slowed. In order to maintain production levels, Chinese steel mills increased the level of exports from approximately 94 million tonnes in 2014 to approximately 112 million tonnes in 2015, with most of the product being sold into Southeast Asian markets. This caused a major disruption in all markets and contributed extensively to the decrease in pricing across all steel products.
Early in 2016, Chinese authorities applied economic stimulus measures, which, in conjunction with heightened environmental restrictions, assisted in maintaining or in some cases, strengthening the prices of the group’s commodities to more profitable levels
Contributions to the group’s headline earnings/(losses) by commodity were as follows:
2016R million
2015R million
Iron ore 1 215 1 248
Manganese 198 289
Chrome (20) 81
Other group transactions 351 358
Per consolidated income statement 1 744 1 976
The group, through its wholly owned subsidiary Ore & Metal, is the sole marketing and distribution agent for all the group’s products, including those of Assmang.
The sales volumes for Assmang for the current and previous years were as follows:
2016Metric tonnes
’000
2015Metric tonnes
’000
% increase/(decrease)
Iron ore 17 008 16 185 5
Manganese ore* 3 030 2 736 11
Manganese alloys 175 223 (22)
Chrome ore 1 147 1 068 7
* Excludes intra-group sales to alloy plants.
Iron oreIron ore sales volumes for the year increased to a record 17,0 million tonnes (2015: 16,2 million tonnes), up 5% compared to the previous year, mainly as a result of local sales volumes increasing by 15%. Export sales increased by 3% over the previous year on the back of improved production at the Khumani Iron Ore Mine and improved rail performance from the mine to Saldanha Bay port.
The geographical sales distribution was further optimised during the year, with specific focus applied to achieving improved diversification of sales to regions and customers, where higher net prices were realised. Sales volumes into Asia increased from 68% to 73% mainly as a result of a higher proportion of spot sales volume to the Chinese market due to increased production of steel, which also assisted in higher price realisation. The proportion of sales into India remained similar to the previous year, while export sales to the European market declined to 10% of total sales (2015: 14%).
The supply of global seaborne iron ore continued to grow over the year. As was the case in 2015, the major contributors to the increased supply of iron ore were the low-cost producers in Australia and Brazil.
Higher than anticipated Chinese steel production supported iron ore prices during the second half of the financial year. The average price for 62% iron content fines grade, delivered into China was 28% lower for the current financial year, at US$51 per tonne (2015: US$72 per tonne). The premium for lumpy grade ores (lumpy premium) has, on
The financial results of the Assore group are largely dependent on the level of global economic growth, as almost all commodities produced are used in the production of crude and stainless steels, the consumption of which is intimately related to the incidence of global capital spend.
Group results are significantly affected by US dollar commodity prices, exchange rates and world economic growth, all of which are risks that cannot be directly controlled.
Refer “Risks and opportunities” on pages 14 and 15.
Page 28
Assore integrated annual report 2016

average, also been lower across the year at approximately US$7,80 per tonne (2015: US$12,00 per tonne). However, the average lumpy premium recovered during the second half of the financial year and increased to approximately US$10 per tonne as demand out of China increased as productivity improvements in blast furnaces were prioritised and steel demand improved. Approximately half of the group’s iron ore sold is “lumpy grade” product, which results in lower emission levels, when used in blast furnaces in the steel production process due to it replacing higher polluting sinter capacity.
Lower ocean freight rates also supported margins during the financial year, due in part to the continued excess global shipping capacity and lower oil prices. On a per-region basis, the sales volumes for the year and the previous financial year are illustrated as follows:
%
Sales of iron ore on a per-region basis – %
2016
2015
73
10
17
68
16
16
■ Asia■ Europe■ Africa and Middle East
The contribution to Assore’s headline earnings by Assmang’s Iron Ore division decreased marginally by 2,6% to R1 215 million (2015: R1 248 million). Capital expenditure during the year in Assmang’s Iron Ore division amounted to R901 million (2015: R1,6 billion) of which R383 million was spent on waste-stripping at both mines, with replacement capital comprising most of the balance spent.
Manganese ore and alloysThe manganese ore market during the year under review was marked by extreme volatility. Fairly rapid cycles of demand and lack of demand resulted in notable price instability. As in the past, China’s demand, resulting from internal factors and
government stimulus, had the most significant influence on the seaborne market.
The oversupply of semi-carbonate ores from South Africa continued during the year, with miners in the Kalahari increasing both their production and export volumes in recent years. The lowest prices were experienced in January 2016 and these price levels prompted the significant withdrawal of export volumes and production cuts. A cycle of high demand followed with prices recovering gradually towards April, which in turn prompted increased supplies, causing the price to recede again. The average medium grade (lumpy) ore price index (36% manganese content) for the financial year was US$2,31 per dry metric tonne unit (dmtu), free on board from South Africa (2015: US$2,94 per dmtu).
The supply of high-grade ores (oxide ores) was steadier, but prices for these grades followed a pattern similar to the semi-carbonate ores, since these two ore types are partly interchangeable. International suppliers also took advantage of the periodically higher prices, which compounded the overall lower price environment throughout the year. The average high-grade lumpy ore price index (44% manganese content) was US$2,88 per dmtu, delivered in China (2015: US$3,90 per dmtu). The distribution of manganese ore sales on a per-region basis for the current and previous financial year is illustrated as follows:
%
Sales of manganese ore on a per-region basis – %
2016
2015
81
162 1
78
211
■ Australasia■ Europe■ Americas■ Africa and Middle East
The global oversupplied situation that has lingered since the middle of 2015 and the reduced crude steel capacity utilisation (which has dropped below 70% from as high as 76%) have resulted in manganese alloy demand over the past 12 months remaining weak. As a result, world manganese alloy production has reduced in an attempt to match this lower demand, evidenced by the numerous plant closures over the past few months in comparison to new global projects. Notwithstanding these supply cuts, which net of new capacity of 840 000 tonnes, amounted to 2,7 million tonnes, the supply/demand balance is yet to be restored. A further obstacle to improved demand during the year has been the negative impact that the increased export of cheap Chinese steel has had on the global market. This has caused a reduction in domestic crude steel production in steel producing countries. Market prices therefore remained weak over the year and particularly over the past few months; however, some recent strengthening in prices has commenced, mainly on the back of stronger prices for manganese ores.
Sales volumes of manganese alloys for the year were lower than during the previous year as a result of the mothballing of the last operating furnace at Assmang’s Machadodorp Works. The distribution of ferromanganese sales on a per-region basis for the current and previous financial year are illustrated as follows:
%
Sales of ferrochrome on aper-region basis – %
2016
2015
18
38
39
5
5237
8 3
■ Australasia■ Europe■ Americas■ Africa and Middle East
Page 29
Assore integrated annual report 2016
Overview Strategy and risk Reviews and reports Financial statements

Operational review and commentary continued
The contribution to Assore’s headline earnings from Assmang’s Manganese division decreased by 31,5% to R198 million for the current year (2015: R289 million). Capital expenditure during the year in Assmang’s Manganese division amounted to R1,9 billion (2015: R2,0 billion), most of which (R1,7 billion) was spent on the expansion and continued sustainability of the Black Rock mines to reach a sustainable output capacity of at least four million tonnes of manganese product per annum by 2020.
Sakura Ferroalloys, Assmang’s joint-venture ferromanganese smelting project in Malaysia, in which it has a 54,36% stake, commissioned one of its two furnaces in May 2016 to produce high-carbon ferromanganese. The construction of the second furnace has continued and remains within budget (US$328 million) and on time to be commissioned in September 2016. Once fully commissioned, the plant will be able to produce 110 000 tonnes of high-carbon ferromanganese and 70 000 tonnes of silico manganese annually.
ChromeIn 2015, global stainless steel production contracted slightly to 42 million tonnes, with China’s contribution remaining at approximately half of this volume. In line with the contraction in the stainless steel market, global ferrochrome production also reduced.
China continues to be the driving force for demand of both chrome ore and ferrochrome. Lower than usual levels of port stocks towards the middle of 2016 resulted in prices recovering from the lows seen during December 2015 and January 2016. South Africa remains the world’s largest chrome ore supplier, with approximately 7,6 million tonnes supplied into China during the 2015 calendar year, representing 73% of this market. Prices for chrome ore (LG6 concentrate 44% grade, delivered in China) dropped from US$180 per tonne to lows of approximately US$90 per tonne in the early part of the 2016 calendar year, but recovered to levels of US$165 per tonne towards the end of the financial year. Due to South Africa’s contribution to the level of global supply of chrome ore, much of the pricing dynamic in this market is derived from the rand/US dollar
exchange rate and the weaker rate during the year has supported favourable net prices. Combined with lower logistical costs, this has resulted in Dwarsrivier Chrome Mine (Dwarsrivier) recording a profit for the second consecutive year. Dwarsrivier achieved record sales volumes for the year, with sales of ore on a per-region basis for the current and previous financial years illustrated as follows:
%
Sales of chrome ore on a per-region basis – %
2016
2015
82
14
13
631
6
30
■ Asia■ Europe■ United States■ South Africa (including export agents)
Subsequent to the end of the financial year, the group acquired the remaining indirect 50% interest in Dwarsrivier from ARM (refer note 36 to the consolidated financial statements). Dwarsrivier spent R149 million on capital items during the year, of which approximately one-third was spent on shaft development.
During the year, Rustenburg Minerals sold approximately 135 000 tonnes (2015: 137 000 tonnes) of lumpy and concentrate grades and Zeerust sold approximately 4 000 tonnes of waste material. The open-cast resources at Rustenburg Minerals have been depleted and the underground shaft development was suspended in 2015, while the remaining waste material at Zeerust has been processed and sold. Accordingly, the facilities of these operations have been impaired in full (refer note 2 to the consolidated financial statements) and attempts are being made to dispose of these mines.
WonderstoneSince 1937, the group has mined a type of pyrophyllite which, for trade purposes, is referred to as Wonderstone. The deposit, which is located outside Ottosdal approximately 300 kilometres west of Johannesburg, is volcanic in origin and displays unique heat holding, insulation and pressure-resistant properties. The bulk of the material mined is beneficiated and reworked into components for export to the USA, the United Kingdom and the Far East. These components are utilised in various high-tech industrial applications, including the manufacture of synthetic diamonds and consumable products for the welding and electronics industries, and are sold as specialist ceramic products. The most significant market for Wonderstone products is its use in the manufacture of polycrystalline diamond (PCD) cutters for drilling in the oil and gas well industries. Other uses for Wonderstone occur in insecticides, while investigations into heat and energy storage are being undertaken.
The significant reduction in the oil price in the past few years has impacted on oil drilling activity with a resultant decline in demand for Wonderstone. However, the market is recovering and improved levels of sales are being recorded. There has also been growth in demand from local customers for Wonderstone powders and the sale of Wonderstone run-of-mine (ROM) material to China is growing steadily.
Alumina wear-resistant tiles are produced by Ceramox, a division of Wonderstone (Ceramox), most of which are supplied to local installers of wear-resistant linings, which have shown significant sales growth over the recent past. Wonderstone, through its division Groupline Projects (Groupline), specifies, selects and installs a range of lining products, including Ceramox alumina tiles, to assist in solving a wide range of industrial wear and flow problems associated with mined commodities. On account of depressed economic growth in South Africa, local market conditions in the past year were difficult and Ceramox and Groupline recorded losses for the year. Due to a shortage of its traditional project work, Groupline adopted a turnaround strategy, which includes expanding its footprint in South Africa, with branches established in Rustenburg, the Northern Cape and Richards Bay, which have improved its ability to deliver maintenance services.
Page 30
Assore integrated annual report 2016

Sales of Wonderstone’s various divisions for the current and previous financial years are illustrated as follows:
%
Sales of Wonderstone by division – %
2016
2015
44
26
30
36
31
33
■ Mine and machining■ Ceramox■ Groupline
Capital expenditure by Wonderstone for the year amounted to R2,0 million (2015: R4,6 million), most of which was spent on mining and machining equipment.
Marketing and shippingWholly owned subsidiary Ore & Metal Company Limited is responsible for the marketing and shipping of all the group’s products, including those produced by the three divisions of Assmang. Strong relationships have been established with customers in the Far East, Europe, North America, South America, Africa and India, and products with a market value of approximately R21,1 billion (2015: R21,6 billion) were marketed and distributed in these regions during the year. The company is an established supplier to steel and allied industries worldwide and has operated effectively in these markets for over 80 years. Commission income is based on the value of sales negotiated during the year, and attributable profit after taxation for the year improved to R271,3 million (2015: R222,9 million) for the year under review, due mainly to higher sales volumes of ores, increased interest income and lower operating costs.
Minerais U.S. LLCThe group holds a 51% share in Minerais U.S. LLC (Minerais) which is a limited liability company registered in the state of New Jersey in the United States of America (USA). Minerais is responsible for marketing and sales administration of the group’s products in the USA, in particular manganese alloys, and it trades in other commodities related to the steelmaking industry. Reduced levels of sales of alloy products in the USA resulted in Minerais’ contribution to the group’s attributable profit for the year declining to R11,4 million (2015: R31,2 million).
Technical and operational managementAs technical adviser to Assmang and other group companies, African Mining and Trust Company Limited provides operational management services to the group’s mines and plants. For these services it receives fee income, which is related to turnover in Assmang and other group companies. The impact of increased commissions received, arising from higher sales volumes of ores in Assmang and higher interest rates, in the amount of R17,0 million, was negated by increased operating costs (R5,5 million) and the cost of the exit from the iCerMax business (R18,3 million) (refer note 34.3 to the consolidated financial statements), resulting in its attributable net profit after taxation for the year decreasing to R101,5 million (2015: R109,8 million).
The group holds a 29,9% interest in IronRidge Resources Limited (IronRidge), which is accounted for using the equity method (refer note 5 to the consolidated financial statements for more detail). Exploration activities by IronRidge continue, with reconnaissance prospecting for iron ore in Gabon at an advanced stage. Other deposits, which are at various stages of assessment, include bauxite in Queensland, Australia, gold in Chad and lithium in the Ivory Coast. The market value of the group’s investment in IronRidge has increased from GBP2,9 million (R56,5 million) at 30 June 2015 to GBP9,0 million (R160,7 million) at 23 September 2016.
InvestmentsThe group maintains a limited portfolio of listed shares which are selected and held in accordance with long-term investment criteria. In accordance with IFRS, the portfolio is valued in the financial statements at market value. During the year, the market value of this portfolio declined and the group recorded a loss of R41,8 million (2015: R93,0 million loss) on its revaluation (after allowing for capital gains taxation relief). At 30 June 2016, the market value of the portfolio was R180,1 million (2015: R233,9 million), based on a cost of R293,4 million (2015: R293,4 million). Other income for the group includes interest received of R210,4 million (2015: R155,3 million) generated on cash in excess of current requirements which was invested on a short-term basis in the money market. The higher amount of interest received is due to higher average available cash balances and higher rates of interest.
Page 31
Assore integrated annual report 2016
Overview Strategy and risk Reviews and reports Financial statements

Corporate governance and risk management report
The Assore board (the board) is of the opinion that strong corporate governance and risk management not only enhance sustainability of the organisation but are essential to preserving organisational reputation, investor confidence, access to capital when required and sustainable employee motivation.
The group subscribes in all its activities to principles of best practice in business management and corporate governance for South African companies, as set out in the King Report on Corporate Governance (King III), which it implements in accordance with the following framework: – Establishing a risk and control environment within each of its business entities where management, in conjunction with the necessary support from the Audit and Risk, and Social and Ethics Committees, is responsible for identifying, quantifying and managing risks related to the achievement of the organisation’s objectives on a sustainable basis. The process of quantification takes into account qualitative aspects in addition to their potential financial impact.
– Creating a process which provides the board, through the Audit and Risk, and Social and Ethics Committees, with assurance regarding the adequacy of internal control within the organisation, ie that the risk and control environment in place is appropriate for the business concerned and that the business is operated in a manner which provides the board with reasonable assurance that the group’s assets are appropriately safeguarded.
– Implementing a formalised review process to identify the effectiveness of both the risk management environment and the assurance processes. This is generally the role of the internal audit function and other independent technical assurance specialists used on a consultancy basis.
The company’s shares are listed on the JSE, which requires all listed companies to comply with the Code of Corporate
Practices as set out in King III. Management reviews business practice across the group on an ongoing basis and ensures wherever possible that the group is substantially compliant with all the material requirements of King III. Where it is not practical for the group to adopt these requirements, relevant comment is provided and reference is made in this report to the alternative procedures which the board has adopted in each instance to compensate for not applying the requirements of King III. The group’s application of King III has been assessed and rated by the Institute of Directors as AAA (2015: AAA), utilising its Governance Assessment Instrument. The detailed governance register is located on the group’s website, under the “About us” tab.
Board of directorsThe directors are committed to the principles of corporate discipline, transparency, independence, accountability, fairness, employment equity and social responsibility.
CompositionThe Assore board has a unitary structure, comprising eight directors, four of whom are executive and four non-executive. Since the Chairman represents the controlling shareholder, and in order to enhance the balance of power and authority on the board, the Chairman does not have a casting vote. Additionally, the board has appointed a lead independent director, who also occupies the position of Deputy Chairman.
The independent non-executive directors have, between them, considerable experience gained at senior management levels in diverse listed and unlisted companies and professional firms operating in South Africa and abroad.
Independent non-executive directors are appointed in terms of three-year renewable contracts and the board evaluates their independence annually, based on returns submitted by each director. The roles of the Chairman and
CEO are separate and non-executive directors are not permitted to serve for periods longer than nine years in the aggregate and do not receive any benefits from the company other than their fees for services as directors.
Election and successionAppointments to the board in an executive directorship capacity are based on the nominees holding appropriate professional qualifications and having had substantial exposure to business as a whole, and in particular in the mining industry, in senior managerial roles and/or related professional practice, including knowledge of applicable legislation, rules, codes and standards. Incoming non-executive directors are fully appraised on appointment of the group’s activities, and on all issues relevant to the business, by the executive directors. Assore believes that these requirements and processes obviate the necessity for a formalised orientation and mentorship programme for its directors, as recommended by King III.
In accordance with the company’s Memorandum of Incorporation (MoI), all non-executive directors are subject to retirement by rotation and re-election by shareholders at least once every three years, provided that at least one-third of their number offer themselves for re-election at each Annual General Meeting (AGM) as required by the Listings Requirements of the JSE. In addition, all directors are subject to re-election by shareholders at the first AGM following their initial appointment. A brief curriculum vitae of each director is set out on pages 26 and 27. The appointment to the board and the assessment of continued eligibility on the board are made by the executive directors with the oversight of the non-executive directors and in consultation with the board as a whole. Therefore, a formal policy for appointing board members and a nomination committee are not considered necessary.
Page 32
Assore integrated annual report 2016

Each executive director is understudied by appropriately qualified and experienced senior staff members, ensuring sufficient depth of expertise in areas that are critical to the continuation of the group’s business activities. Therefore, taking the managerial structure and the current make-up of the board into account, a detailed succession plan is not warranted. The CEO assumes ultimate responsibility for all executive issues, including the information technology (IT) function, and ensures that issues raised within the group’s various committees and subcommittees are addressed by the responsible staff and, further, that these issues are elevated to the appropriate level when it is apparent that more senior management involvement is necessary. Based on a submission by the Audit and Risk Committee, dispensation has been granted by the JSE for the roles of CEO and Financial Director to be combined on condition that the appropriateness of the situation is reviewed and confirmed by the Audit and Risk Committee on an annual basis. The most recent review in this regard was undertaken on 17 February 2016.
MeetingsThe board meets at least four times per annum on predetermined dates, with meetings convened on an ad hoc basis when considered necessary. The board met four times in the year under review and attendance at these meetings is tabled below:
Possibleattendance Attended
Desmond Sacco 4 4EM Southey 4 4CJ Cory 4 4PE Sacco# 1 1AD Stalker* 3 3BH van Aswegen 4 4TN Mgoduso 4 4S Mhlarhi 4 3IN Mkhari^ 4 3WF Urmson 4 4
* Resigned 29 February 2016.# Appointed 1 March 2016.^ Resigned 26 May 2016.
Board and committee performance evaluationOngoing evaluation of the board and its various committees does not occur on a formal basis. However, due to the fact that the Chairman represents the controlling shareholder, and due to the structure of the management of the business, regular interaction occurs between all levels of management to ensure that the various structures in the Assore group operate in accordance with their terms of reference. As stated in the section on remuneration (refer page 19), executive directors are not appointed in terms of contracts, and their services may be terminated in accordance with legal requirements without exposing the group to pre-existing financial obligations. Documented terms of reference for the board are not required, since all of the directors have substantial business experience gained at a senior level.
The composition and size of the board as described above enable regular formal and informal interaction between directors to take place to ensure appropriate application of authority in the decision-making process. This ensures that resolutions cannot be passed without the agreement of at least one of the independent non-executive directors.
A key aspect of the group’s activities includes marketing and distribution. As a result the reputation of and relationships with its customers and all other stakeholders is assessed in all of the board’s actions, and not in isolation. Further insight into the group’s activities is provided to the Chairman at regularly convened Executive Committee meetings, which are attended by the executive directors and other senior members of management. The skills set required of executive directors of other group companies is determined by the Assore executive. Attendance by external advisers at meetings of the board and its various committees is arranged when considered necessary.
Group boardsThe subsidiary and joint-venture companies of the group have boards of directors that operate independently in relation to the affairs of these companies. The board of the holding company respects the fiduciary duties of the directors of these companies, and policies and procedures adopted by these companies are considered by the respective boards prior to their adoption, necessary alteration or rejection.
Audit and Risk CommitteeThe committee meets at least three times per annum on predetermined dates, with ad hoc meetings convened to consider significant risk and accounting issues when considered necessary. The committee met three times in the year under review and attendance at these meetings is tabled below:
Possibleattendance Attended
EM Southey (Chair) 3 3S Mhlarhi 3 3WF Urmson 3 3
The Chairman of the committee reports on its activities at each board meeting. Representatives of the internal and external auditors are invited to attend all meetings of the committee and, if necessary, have access in private to the Chairman of the committee throughout the year. The CEO, Group Accountant and representatives of the Company Secretary attend all meetings by invitation. Internal and external auditors meet with members of the committee at least once annually without members of management being present in order to discuss the quality of their relationship and evaluate the level of cooperation which they were afforded during the conduct of their audit work in the year under review. The committee recommended the approval of the integrated annual report for 2016 to the board on 19 October 2016.
Page 33
Assore integrated annual report 2016
Overview Strategy and risk Reviews and reports Financial statements

Corporate governance and risk management report continued
The terms of reference of the Audit and Risk Committee are documented, have been approved by the board, and are reviewed periodically to ensure they remain appropriate to the activities of the group. The prime objectives of the committee that emanate from its terms of reference and which were applied during the year under review, are to: – monitor the risk profile as compiled by internal audit and agreed to with management and make recommendations on the composition and classification of the risk profile for the group (refer “Risk management” on page 35);
– integrate the activities of assurance providers so that all risks are identified and appropriate mitigation steps are taken;
– provide a forum for management and representatives of the external and internal audit functions to resolve issues which arise from all external and internal audit activities;
– make recommendations to the board regarding the appointment of the external auditors;
– review the activities, services and performance of the external auditors, evaluate their independence and review their overall role and the appropriateness of fees charged;
– review and approve the annual financial statements, interim reports and related disclosures and other significant announcements made by the group, making the necessary recommendations to the board;
– consider the appropriateness of the group’s accounting policies;
– monitor and supervise the effectiveness of the internal audit function (refer “Internal audit and internal control” on page 35) to ensure that the roles of both internal and external audit are clear in order to provide an objective overview of the operational effectiveness of the group’s systems of internal control and reporting;
– receive and consider feedback on issues relevant to the committee raised at meetings of the Social and Ethics Committee (refer “Social and Ethics Committee” on page 36);
– obtain reports from management, and make the necessary enquiries from external and internal audit and of management, on any matters which are the subject of litigation, ensure compliance with material aspects of legislation and create awareness of pending changes to legislation (refer “Legal compliance” on page 36); and
– monitor the ethical tone of the group through discussion with its executives and senior staff (refer “Ethics” on page 36).
All the members of the committee, including the Chairman (who will make himself available to take questions at the AGM), are independent non-executive directors, who collectively possess the appropriate professional and business experience pertaining to legislative requirements, financial risks, financial and sustainability reporting, and internal controls applicable to the group.
Internal audit has adopted its terms of reference from the Audit and Risk Committee, and all internal audit work is undertaken based on the ongoing risk assessment process which is presented annually by internal audit to the Audit and Risk Committee, to ensure that the focus of the internal audit activities are optimised and integrated with the external audit function (refer “Risk management” and “Internal audit and internal control”). The internal audit function of Assore is outsourced, and the responsible senior executive on the engagement has direct access to the Chairman of the committee.
Independent meetings are conducted with external audit in order to exchange views on the risk environment to which the group is exposed, as well as on issues that
may have a bearing on the external audit process and internal audit objectives based on fieldwork performed by them. Internal audit provides assurance to the board and the committee on an annual basis that the internal and financial controls have not revealed any significant breakdown in internal controls or corporate governance principles or any issues that require the attention of the committee. The committee, having due regard to materiality and the nature of the business, is satisfied that the internal controls were effective, and operated as designed for the period under review. In addition, the committee, having reviewed the reports tabled by internal and external audit at its meetings, and having invited enquiries of the attendees at its meetings, is not aware of any breakdowns of internal controls or corporate governance that resulted in, or could lead to, material financial losses, fraud or material errors during the year under review.
The committee does not consider a formal audit review of the interim results necessary, as the interim results of Assmang, which generate the majority of the group’s earnings, are reviewed and reported on by its external auditors in terms of ISRE 2410 – Review of Interim Financial Information Performed by its Independent Auditor of the Entity, prior to the publication of the group’s interim results. Dependent on the contribution to the group’s earnings from Dwarsrivier Chrome Mine Proprietary Limited (Dwarsrivier), an audit review may be considered necessary. (Refer note 36 to the consolidated financial statements for details regarding the acquisition of Dwarsrivier subsequent to the end of the financial year.) The committee, after due enquiry of external and internal audit, has satisfied itself as to the appropriateness of the expertise, the adequacy of the finance function and the experience of the senior members of management responsible for the financial function.
Page 34
Assore integrated annual report 2016

Internal audit and internal controlThe board, through its Audit and Risk Committee, is responsible for ensuring the implementation of appropriate internal controls, which are reviewed regularly for efficiency and effectiveness, taking into account the risk profile of the group (refer pages 14 to 16). These controls are designed to manage the risk of failure of internal controls and provide reasonable assurance that there are adequate systems of internal control and appropriate corporate governance procedures in place. As with all management systems, the assurance which is provided is not absolute and the risk of failure cannot be eliminated entirely. Internal auditors monitor the operation of the internal control systems and governance processes and, after discussion with management, report findings and recommendations to the Audit and Risk Committee. Corrective action is taken to address control deficiencies as and when they are identified. Material issues of compliance are among standard items on the agenda of the Audit and Risk Committee, and minutes of these meetings are made available to internal audit. The group does not extend an invitation to the head of internal audit to attend Executive Committee meetings; however, access to the Chairman of the Audit and Risk Committee is available throughout the year. Nothing has come to the attention of the Audit and Risk Committee or the board to indicate that any material breakdown in the effective functioning of internal controls or corporate governance procedures has occurred during the year under review.
Representatives of the internal audit firms are invited to attend Audit and Risk Committee meetings and, where areas of new risk are identified, such as initiation of capital projects or new systems of internal control or IT systems implementation, separate independent investigations take place on an ad hoc basis in addition to the programmed reviews referred to above.
Risk managementThe board has delegated the assessment and management of the group’s risk profile, which is compiled by the internal audit function, to the Audit and Risk Committee, which advises the board of any unresolved risk management issues. Risk is an inherent feature of conducting business, and in the mining and smelting industries it is exacerbated by the remoteness of location of the operations, the physical danger inherent in the day-to-day activities of these operations and compliance with legislative requirements, particularly with regard to environmental management with which this industry has to comply. These risks are compounded by the volatility of exchange rates and international commodity prices to which the group is exposed on a daily basis and which are largely beyond the group’s control.
Management of group risk is critical to the sustainability of the group and is achieved through the identification and control by various risk management committees of all risks, including operational risks, which could adversely affect the achievements of the group’s business objectives. Risk assessments are ongoing, and risk registers for all significant operations in the joint-venture entity, Assmang, are prepared and updated quarterly by a dedicated risk management department, with assistance from specialist external consultants.
For larger business entities in the group, independent risk engineering consultants grade each operation against international risk standards for fire, security, engineering, commercial crime, contingency planning and mining, as well as environmental risk, to monitor whether current practices meet the set criteria and are being maintained. Input is obtained from various risk management committees comprising representatives from senior management. On completion and review of these processes, insurance cover is taken out on insurable risks where considered appropriate. In addition to these processes, other risks deemed relevant to the Assore
group are presented to the Audit and Risk Committee, which is given the opportunity to comment and provide input on the assessments which are tabled. The assets of the group are included in a comprehensive insurance programme, with an independent valuation of fixed assets occurring every three years.
The respective risk management committees are also responsible for ensuring that appropriate financial and insurance mechanisms are integrated into the risk plan and that the group is protected against catastrophic risk. Therefore, the group risk management process includes an ongoing review of compliance with relevant legislation and standards in the following areas (refer “Group sustainability performance” on page 42): – Environmental rehabilitation management.
– Health and safety management. – Human resource management. – Quality of products and management systems.
Details of the principal risks to which the group is exposed are included on pages 14 to 16 of this report.
Information technologyThe management of information technology (IT) falls within the remit of the CEO, who chairs regular meetings of the IT Steering Committee (IT Steerco). The IT Steerco consists of responsible IT staff as well as staff responsible for finance and major IT projects. The purpose of the IT Steerco is to address the appropriateness and relevance of the IT infrastructure, monitor and further the progress of major IT projects, information security, the design and maintenance of disaster recovery procedures and related staffing and administrative issues, and the IT Steerco seeks external advice when required. Matters of relevance to the business are communicated by the CEO to the Audit and Risk Committee or the board, where appropriate. Documented terms of
Page 35
Assore integrated annual report 2016
Overview Strategy and risk Reviews and reports Financial statements
Corporate governance and risk management report continued
reference for the IT Steerco are not considered necessary, given the degree of involvement by the CEO and senior management on an ongoing basis in these issues. In addition, the IT systems are subjected to a detailed annual external audit, the results of which are reported on to the Audit and Risk Committee for attention and action where necessary. Disaster recovery (DR) is catered for by means of daily back-ups of electronic information and media, which are physically housed in a building separate from where the IT hardware is located. The group has also replicated its hardware environment in a separately housed DR area.
Social and Ethics CommitteeIn accordance with its documented terms of reference approved by the board, the committee is required to meet at least twice per annum on predetermined dates. The committee met twice during the year and attendance at these meetings is tabled below:
Possibleattendance Attended
WF Urmson (Chair) 2 2RA Davies 2 2BH van Aswegen 2 2TN Mgoduso 2 2
The Social and Ethics Committee (SEC) reports to the board and provides feedback on issues raised at its meetings to the board and to the Audit and Risk Committee for consideration where relevant. The key aspects of its terms of reference include the monitoring of the group’s activities relating to any relevant legislation affecting the group’s activities, or prevailing codes of best practice with regard to matters relevant to: – its corporate strategy and any changes that may be necessary from time to time;
– the social and economic development of communities located in the areas surrounding its operations;
– the maintenance of good corporate citizenship credentials;
– environmental, health and public safety issues at all its operations, including the impact of the group’s activities and of its products or services on the environment;
– consumer relationships, including the group’s advertising, public relations and compliance with all legislation relating to the group’s activities; and
– labour and employment, including working conditions and employee development.
Legal complianceThe board has delegated the responsibility for oversight of legal compliance to the Social and Ethics Committee, from which management receives any guidance deemed necessary for the fields appropriate to its terms of reference. Suitably qualified consultants have been appointed to ensure that legal compliance is maintained in the business sectors in which the group operates. Accordingly, the CEO has not appointed an individual person responsible for the management of compliance. Due to the importance attached to compliance with competition law requirements, the group operates a competition law compliance programme and has ensured that all senior staff members are familiar with the requirements of the Competition Act. The Audit and Risk Committee ensures that matters containing significant levels of risk material to the group receive the appropriate attention, and that adequate provision and appropriate disclosure are made for known and determinable exposures.
Safety, health and environmental (SHE) legal compliance audits are conducted on an ongoing basis for all operations.
In addition, a high-level compliance review is conducted every second year for Assore’s subsidiary operations and reports are submitted to the SEC. Following the recent acquisition of Dwarsrivier, the extent of SHE legal compliance audits conducted at this operation is currently being reviewed (refer “Audit and Risk Committee” on page 34).
The size of the group, as well as the experience of the executive directors and senior management, afford management the opportunity to resolve disputes in these areas. External legal counsel is consulted when considered necessary to ensure the appropriateness of the methods adopted to resolve issues.
EthicsEthical issues are managed by way of executive involvement in day-to-day management processes of the group, and by senior management who interact with staff at all levels to ensure that high ethical standards commensurate with board expectations are maintained. Issues that cannot be resolved by line management are addressed by way of oversight by the SEC (refer page 36). The group is in the process of adopting a code of ethics, which, once approved by the SEC, will be applied across the group. Various channels to facilitate effective whistle-blowing procedures are in place at certain of the larger operations in the group to afford employees and other parties the opportunity to bring unethical practices to the attention of senior management on an anonymous basis. The board believes that management is sufficiently experienced to ensure that the requirements of the group in respect of laws, rules, codes and standards do not expose the group to material risks in this respect. In addition, senior management consults with external legal counsel in unfamiliar and complex areas.
Page 36
Assore integrated annual report 2016

Insider trading and closed periodsThe group declares a closed period applicable to all members of staff in relation to dealing in Assore shares prior to the publication of its interim and final results. During these periods directors, officers and staff are prohibited from dealing in the shares of the company. The closed period extends from the first day of the month following the end of a financial reporting period and expires on the day on which the interim or final results are published. Where appropriate, dealing is also restricted where a public announcement is imminent and includes information considered to be price sensitive.
All directors and staff are required to obtain the written approval of the CEO prior to dealing in the company’s shares at any time during the year. Any dealings by the CEO in Assore shares require the approval of the lead independent director. Due to the significance of the group’s involvement in Assmang, as well as Assmang’s bearing on the results of Assore’s joint-venture partner, African Rainbow Minerals Limited (ARM), senior staff members are also precluded from dealing in ARM’s shares in these closed periods.
Company SecretaryThe company has appointed a wholly owned subsidiary, African Mining and Trust Company Limited (AMT), as Company Secretary (refer page 31). The board and senior staff of that company, who are all appropriately qualified, ensure that all applicable provisions of the Companies Act are applied in the affairs and management of the group. The board of directors of AMT includes an adequate number of persons with professional qualifications to ensure that an appropriate level of independence is maintained and that its affairs are conducted on an arm’s length basis.
Page 37
Assore integrated annual report 2016
Overview Strategy and risk Reviews and reports Financial statements

Black economic empowerment status report
Assore strongly endorses the broad-based black economic imperatives contained in the Minerals and Petroleum Resources Development Act (the MPRD Act) and the Broad-based Socio-economic Empowerment Charter for the South African Mining Industry issued thereunder (the Mining Charter), and since their inception has embarked on a number of initiatives aimed at meeting these requirements at its mining operations, as set out below.
In terms of the MPRD Act, which came into effect on 1 May 2004, the state has assumed sovereignty and custodianship of all mineral rights in South Africa and grants prospecting rights and mining rights to applicants based on the merits of their applications (which are designated as new-order rights). A transitional period from that date to 1 May 2014 was provided for, during which holders of existing mineral and exploration rights (designated as old-order rights), upon meeting certain requirements, could convert such existing in-use old-order rights into new-order rights or, in the case of unused rights, could apply for new-order rights.
The Mining Charter is intended to facilitate the entry of historically disadvantaged South Africans (HDSAs) into the mining industry. The scorecard which the state issued pursuant to the Mining Charter required, inter alia, that mining companies should achieve 26% HDSA ownership of mining assets by 1 May 2014. The Mining Charter also requires, inter alia, that mining companies provide plans for achieving employment equity at management level, and procuring goods and services from black empowered organisations on a preferential basis, in accordance with the predetermined criteria set out in such plans. Since 2004, with a view to meeting the Charter’s requirements, Assore, through its various group companies, has achieved the following empowerment milestones: – Concluded an empowerment transaction with Mampa Investment Holdings (being the commercial arm of the Mankwe Development Foundation (Mampa)) in April 2004, pursuant to which new-order mining rights were obtained for the chrome operations in
Rustenburg Minerals Development Company Proprietary Limited (Rustenburg Minerals) on the farms Groenfontein, Zandspruit and Vogelstruisnek.
– Having met the requirements of the MPRD Act regarding conversion of old-order mining rights, Assmang has secured new-order mining rights for all its operations. The rights for the manganese deposits at Black Rock (comprising Assmang’s Nchwaning and Gloria mines) were registered in September 2015.
– Pursuant to the acquisition from ARM of its effective 50% share in Dwarsrivier Chrome Mine, Assore owns 100% of Dwarsrivier Chrome Mine Proprietary Limited (DCM) with effect from 1 July 2016. The new-order right was registered on 30 June 2016 (refer note 36 to the consolidated financial statements for more detail).
– Successful conversion and execution of old-order mining rights to new-order mining rights for pyrophyllite (Wonderstone).
– Implemented a preferential procurement policy at all its operations (refer “Preferential procurement”).
– Developed social and labour plans (SLPs) for each of its operations, as well as local economic development (LED) projects which support the integrated development plan of the relevant local authority. The plans, which have received the approval of the relevant departments, include the construction of schools and crèches, food security projects, and presentation of programmes on adult education, health and safety, and environmental awareness (refer “Sustainability report“, located on the group’s website under “Annual reports” in the “Investor centre”).
The extent of compliance with the Charter is reported on and monitored on a regular basis, both at Exco level and by the board, through the Social and Ethics Committee and specifically with regard to new-order mining rights, which are subject to audit by the DMR. To date, the DMR has not reported any significant non-compliance issues.
Following the introduction of the MPRD Act Assore has, specifically at a holding company level, entered into empowerment-related transactions, which have resulted in HDSAs holding 26,07% of Assore’s ordinary shares, as follows:
Shareholder%
shareholding
Boleng Trust 14,28Fricker Road Trust 11,79
Total 26,07
The Boleng and Fricker Road trustsThe Boleng and Fricker Road trusts (the trusts) have been established for the benefit of HDSAs and broad-based HDSA community groupings residing in the areas in which the Assore group’s mines and beneficiation plants are located. Since the objectives of the trusts are very similar and they have the same trustees, the Boleng Trust has been made a beneficiary of the Fricker Road Trust.
In terms of agreements between Assore and the trusts, the Fricker Road Trust qualified for dividends (after dividends tax) of R7,5 million (2015: R16,4 million) during the year, while the Boleng Trust is entitled to a flow-through payment of at least R2 million per annum, irrespective of the commitments to the Assore group with regard to the funding of the transaction provided by Assore. The boards of trustees of these trusts are as follows:Dr TG Sibiya (Chairman)*CJ Cory#
RN Lekgatle#
Ms K Makhaya*M Mtshali*Ms TPJ Ngxulelo*
* Independent trustee.# Founder trustee.
Assore has concluded agreements with the trusts in order to regulate the relationships between the respective parties to ensure the continued compliance by the trusts (as the Assore group’s BEE partners) with the direct ownership requirements of the Mining Charter and the appropriate restrictions on the transfer of Assore shares by the trusts.
Page 38
Assore integrated annual report 2016

During the 2016 financial year, and pursuant to the trust deeds, the trustees have approved expenditure on its major projects amounting to R13,8 million (2015: R9,6 million) and have committed themselves to spending a further R37,6 million on these and other projects, details of which are as follows:
Operation Description
Spendto date
R’000 Commitment
R’000Total
R’000
Wonderstone Tsholonang Children’s Disability Centre 4 289 4 461 8 750
Boleng Trust Bridging school, and related expenditure 2 988 9 934 12 922
Student boarding facility at Ottosdal 2 411 2 500 4 911
Support of various student requirements, including bursaries and transport
2 066 9 293 11 359
Rustenburg Minerals Imfundo Likusasalethu, primary educational intervention 1 999 962 2 961
Other projects 10 450 10 450
13 753 37 600 51 353
Further detail of the expenditure on these projects is included in the “Sustainability report” located on the group’s website under “Annual reports” in the “Investor centre”.
Boleng and Fricker Road trustsIndependent trustees
Dr TG Sibiya
PhD (IT&IS), Med (ISD), Pittsburgh, BSc (Information systems), Carnegie Mellon, USA
Chairman Independent trustee
K Makhaya
BusAdmin (Finance), Gonzaga University, Washington
Independent trustee
M Mtshali
BLaws, LLB, UCT
Independent trustee
TPJ Ngxulelo
Independent trustee
The Assore Employee TrustIndependent trustees of Assore Employee Trust
M Pillay
LLB LLM (Duke, USA)
Chairman Independent trustee
NP Mngomezulu
LLB
Independent trustee
I Phalane
Independent trustee
Page 39
Assore integrated annual report 2016
Overview Strategy and risk Reviews and reports Financial statements

Black economic empowerment status report continued
The Assore Employee Trust was established by Assore for the economic benefit of the non-managerial employees of the Assore group by facilitating their participation in the dividend income distributed by Assore (dividend rights) and also participation in the increase in the value of Assore’s ordinary shares listed on the JSE (equity rights). The beneficiaries of the Assore Employee Trust are full-time, permanent non-managerial employees of the Assore group who do not participate in pre-existing incentive schemes or performance bonus arrangements. Senior management and board members are precluded from participating in these benefits. The trust is overseen by a board of trustees, the majority of whom are HDSAs. The board of trustees is constituted as follows:
M Pillay‡* (Chairman)T Bizure‡^
Ms MC James‡#
GN Lavielle^
Ms NP Mngomezulu‡*Ms WT Mnisi‡^
I Phalane‡*
‡ HDSA trustee.
* Independent trustee.^ Employee representative trustee.# Founder trustee.
During the 2016 financial year, the trust made dividend rights distributions to employees totalling R6,2 million (2015: R10,7 million). The decrease in these distributions is due to lower dividends declared by Assore (2016 distribution: R5,00 per share; 2015 distribution: R7,50 per share). An independent valuation performed as at 30 June 2016 indicates that the fair value of equity rights granted to date to employees amounted to R9,6 million (2015: R2,0 million) (refer note 17, “Share-based payment liability”, to the consolidated financial statements). The increase in the fair value is due to the improvement in the Assore share price from R103,50 at 30 June 2015 to R180,01 at 30 June 2016.
Preferential procurementAssore is committed to bringing previously disadvantaged South Africans into the mainstream of the economy and specifically the mining industry by identifying and developing business opportunities and by making them available to broad-based black economic empowered (BBBEE) suppliers at all its operations. Without compromising on quality, Assore has adopted a policy of precluding vendors who do not have valid empowerment credentials from supplying goods and services to its operations. A summary of the percentage BBBEE procurement measured against total discretionary procurement is presented in the table below:
Total discretionary procurement#
R million
AggregateBBBEE
expenditure*R million
Aggregate % BBBEE†
2016Assmang^ 10 795,8 11 103,2 102,8Wonderstone 46,0 45,1 98,1Rustenburg Minerals 185,2 174,8 94,4Zeerust 18,3 16,6 90,8African Mining and Trust 58,5 66,1 112,8
2015Assmang 11 424,5 12 243,0 107,2Wonderstone 53,2 46,8 88,0Rustenburg Minerals 198,9 187,0 94,0Zeerust 79,9 71,2 89,1African Mining and Trust 72,5 77,9 107,4
^ Subsequent to year-end, Dwarsrivier which was a division of Assmang became a subsidiary company of the Assore Group.
# Total discretionary procurement is defined as total procurement less procurement effected through related entities (inter-company transactions).
* Aggregate BBBEE expenditure is recognised based on the respective recognition levels of the suppliers, in accordance with the codes published by the Department of Trade and Industry (dti).
† Expenditure of levels 1 to 3 suppliers is recognised at more than 100% in terms of the dti codes.
The decline in the percentage of BBBEE expenditure within Assmang is due mostly to a lower proportion of level 3 expenditure (decline of 11,93%), with corresponding increases in levels 2, 4, 6 and 8.
The recognition percentages for the group’s subsidiary companies continue to improve due to ongoing insistence by procurement staff to source from sufficiently empowered suppliers. The expenditure in Zeerust declined significantly, due to the mine being placed on care and maintenance, while the expenditure in Rustenburg, Wonderstone and African Mining and Trust declined due to declining commodity prices in 2016.
The amended dti Codes of Good Practice came into effect on 1 May 2015. These amended codes make provision for changes in the scoring methodology. All suppliers with a current verification certificate qualify as an empowering supplier for the validity period of the current certificate, resulting in the current results being maintained up to that date.
Page 40
Assore integrated annual report 2016

The new Nokuphile School, Midrand, a project of the Love Trust, funded by the group
Page 41
Assore integrated annual report 2016
Overview Strategy and risk Reviews and reports Financial statements

Group sustainability performance
Financial year 2016 2015
Indicator UnitAssmang
operationsAssore
operationsAssmang
operationsAssore
operations
HUMAN RESOURCES MANAGEMENTTotal number of employees as of 30 June Number 11 441 400 13 719 936*– Permanent Number 5 686 175 6 272 417*– Contract Number 5 755 225 7 447 519Production days lost to strike action Number – – – –Total new employee houses completed Number 1 536 – 1 460 –
SAFETY PERFORMANCEFatalities Number – – 2 –Lost-time injuries Number 25 14 32 18Lost-time injury frequency rate Per 200 000
hours 0,22 1,99 0,26 1,72Section 54 notices issued (Mine Health and Safety Act) Number 6 3 6 3Production shifts lost due to section 54 notices Number 11 1 23 33Prohibition notices issues (Occupational Health and Safety Act) Number 0 – 1 –
OCCUPATIONAL HEALTH AND WELLNESS MANAGEMENTMedicals performed Number 15 627 1 188 18 224 1 431Audiograms performed Number 14 718 1 191 18 579 1 431Noise-induced hearing loss cases referred for compensation Number 4 2 16 3 New tuberculosis (TB) cases reported during the year Number 17 4 8 7Pulmonary TB cases diagnosed to date Number 52 2 8 4 Multi-drug resistant TB cases diagnosed to date Number 2 2 6 3
ENVIRONMENTAL MANAGEMENTTotal greenhouse gas emissions Tonnes CO2e 1 231 686 16 589 1 627 380 28 133– Scope 1 emissions Tonnes CO2e 344 412# 7 617 533 014 13 019– Scope 2 emissions Tonnes CO2e 887 274# 8 972 1 094 366 15 114Diesel consumption ‘000 litres 54 137# 2 887 58 387 4 965Electricity consumption Mwh 887 383# 9 594 1 164 218 16 163Water consumption m3 11 513 727 438 849 10 830 348 488 112*Waste generation– Waste rock m3 57 459 229 2 031 194 56 985 457* 3 763 802– Tailings/slag/discard waste* Tonnes 4 822 087 67 629 4 468 777* 100 383Financial provision for rehabilitation and closure R million 723,9 26,0 700,2 21,0Number of environmental administrative penalties/fines Number – 4 – –
COMMUNITY ECONOMIC DEVELOPMENTCommunity and economic development expenditure R million 180,9 33,2 107,2 15,3
All figures for the Assmang operations are stated on a 100% basis.# Refer “Independent assurance report” in the complete sustainability report located on the group’s website.* Restated from previous year.
Page 42
Assore integrated annual report 2016

Iron ore product reclaimer at Khumani Iron Ore Mine
Page 43
Assore integrated annual report 2016
Overview Strategy and risk Reviews and reports Financial statements

Five-year summary of the consolidated financial statements
INCOME STATEMENTS2012
R’0002013
R’0002014
R’0002015
R’0002016
R’000
Revenue 1 699 861 1 964 409 2 894 596 3 357 297 2 941 047 Profit excluding profit on disposal of available-for-sale listed investments 378 268 480 603 698 053 76 792 400 303 Profit on disposal of available-for-sale listed investments 472 200 27 850 – – –Taxation (245 427) (171 227) (240 486) (102 293) (176 376)Share of profits and losses from joint-venture entity and foreign listed associate, after taxation (equity accounted) 3 441 994 3 092 476 3 572 155 1 315 941 1 273 714
Profit for the year 4 047 035 3 429 702 4 029 722 1 290 440 1 497 641
Attributable to:– Shareholders of the holding company 4 033 014 3 426 978 4 005 123 1 403 371 1 539 363 – Non-controlling shareholders 14 021 2 724 24 599 (112 931) (41 722)
As above 4 047 035 3 429 702 4 029 722 1 290 440 1 497 641
Other informationAttributable earnings as above (R’000) 4 033 014 3 426 978 4 005 123 1 403 371 1 539 363 Headline earnings (R’000) 3 707 763 3 533 823 4 229 890 1 976 351 1 744 176
Earnings per share (cents) 3 828 3 320 3 881 1 360 1 491 Headline earnings per share (cents) 3 519 3 424 4 098 1 915 1 690 Adjusted headline earnings per share (cents)* 2 706 2 581 3 080 1 465 1 473
Dividends declared during the year 698 036 767 839 1 116 856 1 186 660 698 035 Less: Dividends attributable to treasury shares (182 000) (200 200) (291 200) (309 400) (182 000)
516 036 567 639 825 656 877 260 516 035
Dividends relating to the activities of the group for the year under review (cents)– Interim declared and paid 250 250 450 300 200– Final (declared subsequent to year-end) 300 350 550 300 500
550 600 1 000 600 700
Weighted average number of shares for purposes of calculating earnings per shareOrdinary shares in issue 139 607 139 607 139 607 139 607 139 607 Treasury shares, in accordance with IFRS* (34 240) (36 400) (36 400) (36 400) (36 400)
Weighted average 105 367 103 207 103 207 103 207 103 207
Average exchange rates for the year:SA rand to US dollar 7,73 8,85 10,42 11,46 14,65 SA rand to euro 10,39 11,46 13,06 13,61 15,97
* Headline earnings per share including treasury shares in issue (this is a non-IFRS measure). Refer note 12 to the consolidated financial statements.
12 13 14 15 16
2 706
813
3 519
■ Enhancement to HEPS due to treatment of BEE controlled shares as treasury shares (refer note 12 to the consolidated �nancial statements)
■ Adjusted headline earnings per share – HEPS*
2 581
843
3 424
3 080
1 018
4 098
1 465
450
1 915
1 473
217
1 690
Headline earnings per share (HEPS) – cents
12 13 14 15 16
550 600 1 000 600 700
Total dividends per share relating to the activities of the group for the year under review – cents
Page 44
Assore integrated annual report 2016

STATEMENTS OF FINANCIAL POSITION2012
R’000 2013
R’000 2014
R’0002015
R’0002016
R’000
ASSETSNon-current assetsInvestment in joint-venture entity 11 353 539 12 946 015 14 768 170 14 585 308 15 094 529 Property, plant and equipment and intangible assets 487 380 510 577 552 191 256 504 178 609 Investments– available-for-sale listed investments 239 333 178 430 377 988 233 972 180 084 – foreign listed associate – – – 120 756 124 848 – available-for-sale unlisted investments 34 724 41 963 46 613 47 808 44 591 Pension fund surplus – 12 315 56 973 57 474 68 070 Deferred taxation – – – 4 964 17 421
12 114 976 13 689 300 15 801 935 15 306 786 15 708 152 Current assetsOther current assets 468 535 677 003 1 011 113 1 335 087 1 455 937 Cash resources (including restricted cash) 1 051 329 1 703 746 2 144 598 2 871 195 3 664 447
Total assets 13 634 840 16 070 049 18 957 646 19 513 068 20 828 536
EQUITY AND LIABILITIESShare capital and reservesEquity attributable to shareholders of the holding company 11 189 751 14 031 378 17 302 592 17 808 956 18 945 480 Non-controlling shareholders’ interests 126 858 128 910 150 271 15 765 (33 871)
Total equity 11 316 609 14 160 288 17 452 863 17 824 721 18 911 609 Non-current liabilitiesDeferred taxation 44 835 43 622 63 426 – –Long-term liabilities 1 645 564 870 782 373 234 367 181 28 918
13 007 008 15 074 692 17 889 523 18 191 902 18 940 527 Current liabilitiesNon-interest-bearing 435 813 645 933 529 535 360 300 892 235 Interest-bearing 192 019 349 424 538 588 960 866 995 774
Total equity and liabilities 13 634 840 16 070 049 18 957 646 19 513 068 20 828 536
Exchange rates at year-end SA rand to US dollar 8,31 9,96 10,58 12,27 14,86SA rand to euro 10,45 13,00 14,44 13,73 16,49
12 13 14 15 16
13,6 16,1 19,0 19,5 20,8
Total assets – R billion
12 13 14 15 16
10 880
4 478
41 729■ Non-BEE controlled
(as measured by Mining Charter requirements)
■ Market capitalisation of IFRS consolidated BEE controlled shares
■ Unpaid vendor �nancing
11 648
44 674
12 982
32 368
3 767
14 449
6 5524 484 4 442
4 463
4 596
25 131
Market capitalisation – analysis – R million
Page 45
Assore integrated annual report 2016
Overview Strategy and risk Reviews and reports Financial statements

Underground crusher load-out facility at Black Rock Manganese Mine
Assore integrated annual report 2016
Page 46

In this section:
Financial statements
Annual financial statements 48
Notice of Annual General Meeting 122
Form of proxy 127
Corporate information IBC
Assore integrated annual report 2016
Page 47

Annual financial statements
Approval of the consolidated financial statements 49
Company Secretary’s certificate 49
Independent auditors’ report to the shareholders of Assore Limited 50
Directors’ report 51
Consolidated financial statements
Consolidated statement of financial position 57
Consolidated income statement 58
Consolidated statement of comprehensive income 58
Consolidated statement of cash flow 59
Consolidated statement of changes in equity 60
Notes to the consolidated financial statements 61
Company financial statements
Company statement of financial position 88
Company income statement 89
Company statement of comprehensive income 89
Company statement of cash flow 90
Company statement of changes in equity 91
Notes to the company financial statements 92
Accounting policies 104
Page 48
Assore integrated annual report 2016

Approval of the consolidated annual financial statementsfor the year ended 30 June 2016
Company Secretary’s certificatefor the year ended 30 June 2016
The consolidated and separate financial statements of Assore Limited for the year ended 30 June 2016, as set out on pages 50 to 121, have been prepared under the supervision of Mr CJ Cory CA(SA), have been audited in accordance with section 30(2)(a) of the Companies Act and were approved by the board of directors in accordance with section 30(3)(c) of the Companies Act on 19 October 2016, and are signed on its behalf by:
Desmond Sacco CJ CoryChairman Chief Executive Officer
We certify that the requirements stated in section 88(2)(e) of the Companies Act have been met and that all returns and notices, as are required of a public company in terms of the aforementioned Act, have been submitted to the Companies and Intellectual Property Commission and that such returns and notices are true, correct and up to date.
African Mining and Trust Company Limited Secretaries per: CD Stemmett
19 October 2016
Page 49
Assore integrated annual report 2016
Overview Strategy and risk Reviews and reports Financial statements

Independent auditors’ report to the shareholders of Assore Limitedfor the year ended 30 June 2016
REPORT ON THE FINANCIAL STATEMENTSWe have audited the consolidated and separate financial statements of Assore Limited set out on pages 51 to 121, which comprise the statements of financial position as at 30 June 2016, the income statements and the statements of comprehensive income, statements of changes in equity and statements of cash flows for the year then ended, and the directors’ report and the notes, comprising a summary of significant accounting policies and other explanatory information.
DIRECTORS’ RESPONSIBILITY FOR THE FINANCIAL STATEMENTSThe company’s directors are responsible for the preparation and fair presentation of these financial statements in accordance with International Financial Reporting Standards and the requirements of the Companies Act of South Africa, and for such internal control as the directors determine is necessary to enable the preparation of financial statements that are free from material misstatement, whether due to fraud or error.
AUDITOR’S RESPONSIBILITYOur responsibility is to express an opinion on these financial statements based on our audit. We conducted our audit in accordance with International Standards on Auditing. Those standards require that we comply with ethical requirements and plan and perform the audit to obtain reasonable assurance about whether the financial statements are free from material misstatement.
An audit involves performing procedures to obtain audit evidence about the amounts and disclosures in the financial statements. The procedures selected depend on the auditor’s judgement, including the assessment of the risks of material misstatement of the financial statements, whether due to fraud or error. In making those risk assessments, the auditor considers internal control relevant to the entity’s preparation and fair presentation of the financial statements in order to design audit procedures that are appropriate in the circumstances, but not for the purpose of expressing an opinion on the effectiveness of the entity’s internal control. An audit also includes evaluating the appropriateness of accounting policies used and the reasonableness of accounting estimates made by management, as well as evaluating the overall presentation of thefinancial statements.
We believe that the audit evidence we have obtained is sufficient and appropriate to provide a basis for our audit opinion.
OPINIONIn our opinion, the consolidated and separate financial statements present fairly, in all material respects, the consolidated and separate financial position of Assore Limited as at 30 June 2016, and its financial performance and cash flows for the year then ended in accordance with International Financial Reporting Standards and the requirements of the Companies Act of South Africa.
OTHER REPORTS REQUIRED BY THE COMPANIES ACTAs part of our audit of the financial statements for the year ended 30 June 2016, we have read the Audit and Risk Committee report on pages 33 and 34, and the Company secretary’s certificate on page 49 for the purpose of identifying whether there are material inconsistencies between these reports and the audited financial statements. These reports are the responsibility of the respective preparers. Based on reading these reports we have not identified material inconsistencies between these reports and the audited financial statements. However, we have not audited these reports and accordingly do not express an opinion on these reports.
REPORT ON OTHER LEGAL AND REGULATORY REQUIREMENTSIn terms of the IRBA Rule published in Government Gazette Number 39475 dated 4 December 2015, we report that Ernst & Young Incorporated has been the auditor of Assore Limited for 27 years.
Ernst & Young Inc.Director: Dave Ian CathrallRegistered auditorChartered Accountant (SA)
102 Rivonia RoadSandtonJohannesburg
20 October 2016
Page 50
Assore integrated annual report 2016

Directors’ reportfor the year ended 30 June 2016
NATURE OF BUSINESSAssore Limited was incorporated in South Africa in 1950 and is a mining holding company engaged principally in ventures involving base minerals and metals. The company’s shares are listed on the JSE Limited (the JSE) under “Assore” in the general mining sector and its ultimate holding company is Oresteel Investments Proprietary Limited. Assore’s principal investment is a 50% (2015: 50%) interest in Assmang Proprietary Limited (Assmang), which it controls jointly with African Rainbow Minerals Limited (ARM), which is also listed on the JSE. Assmang mines iron and manganese ores, and produces manganese and chrome alloys. In addition, the group mines chrome ore at Dwarsrivier Chrome Mine (refer note 36 to the consolidated financial statements) located near Steelpoort in the Lydenburg district. It also mines Wonderstone (a type of pyrophyllite), a portion of which is beneficiated to produce high-precision components, and wear and acid-resistant tiles, which are installed in various mining and industrial applications. The group, through its wholly owned subsidiary, Ore & Metal Company Limited, is responsible for marketing all products produced by its joint venture and subsidiary companies, the bulk of which is exported and the remainder either used in the group’s beneficiation processes or sold locally. Details of the group’s activities are set out, by activity, in the operational review and commentary (refer pages 28 to 31).
FINANCIAL RESULTSThe financial results of the group for the year ended 30 June 2016 are summarised below:
Year ended 30 June
2016R’000
2015R’000
Turnover 2 027 813 2 526 096
Profit/(loss) before joint-venture entity and foreign listed associate 223 927 (25 501)Share of profit from joint-venture entity, after taxation 1 281 000 1 317 138 Share of loss in foreign listed associate (7 286) (1 197)Profit for the year 1 497 641 1 290 440Add back: Loss attributable to non-controlling shareholders 41 722 112 931Profit attributable to the shareholders of the holding company 1 539 363 1 403 371 Dividends relating to the group’s activities for the year under review (722 449) (619 242) Interim dividend No 118 of 200 cents (2015: 300 cents) per share – declared on 18 February 2016 279 214 418 821 Final dividend No 119 of 500 cents (2015: 300 cents) per share – declared on 6 September 2016 698 035 418 821 Less: Dividends attributable to treasury shares (254 800) (218 400)
Profit for the year after dividends 816 914 784 129
The attributable interest of the company in the aggregate net profit and losses after taxation of subsidiary companies was as follows:– Profits 405 361 401 219 – Losses (181 434) (426 720)
CONTROL OVER FINANCIAL REPORTINGThe directors of the company are responsible for the preparation and fair presentation of the financial statements and related financial information included in this report. The external auditors, Ernst & Young Inc., whose report is set out on page 50, are responsible for expressing an opinion on the financial statements based on their audit.
The financial statements included in this report are based on judgements and estimates which are intended to be both reasonable and prudent and have been prepared by management in accordance with International Financial Reporting Standards (IFRS). The accounting policies are consistent with those of the previous year.
The financial statements have been prepared on a going concern basis and the directors have no reason to believe that the group will not be a going concern in the year ahead. With regard to the valuation of assets, the directors are of the opinion that the carrying amount of all assets included in the statement of financial position are appropriately valued.
In order to discharge their responsibilities with regard to the financial statements, the directors ensure, through the group’s appointed Audit and Risk Committee, that management maintains adequate accounting records and systems of internal control which are developed and reviewed for effectiveness on an ongoing basis. The systems of internal control are established organisational structures, policies and procedures, including budgeting and forecasting disciplines and are managed and controlled by suitably trained personnel who are organised in structures with appropriate segregation of authorities and duties. While internal controls are intended to adequately safeguard the group’s assets and prevent and detect material misstatements and loss, these systems can only be expected to provide reasonable, and not absolute, assurance as to the reliability of the financial information included in this report. The internal financial controls were assessed by the group’s outsourced internal audit function and were found to be satisfactory.
Page 51
Assore integrated annual report 2016
Overview Strategy and risk Reviews and reports Financial statements

Directors’ report continuedfor the year ended 30 June 2016
JOINT-VENTURE ENTITYAssore holds a 50% interest in Assmang, which it controls jointly with ARM in terms of a long-standing shareholders’ agreement. In accordance with IFRS, Assmang is accounted for on the equity accounting basis, and Assore has disclosed its share of Assmang’s profit as “share of profit from joint-venture entity, after taxation”. Set out below are the financial statements of Assmang in abridged format, which combine its continuing and discontinued operations. The “Assets held for distribution” in Assmang refers to the sale of Dwarsrivier (refer “Acquisition of remaining 50% of Dwarsrivier” on the following page and note 36 to the consolidated financial statements).
ABRIDGED CONSOLIDATED COMPREHENSIVE INCOME STATEMENT OF ASSMANGYear ended 30 June
2016R’000
2015R’000
Turnover 20 654 063 21 121 497
Profit before taxation 3 649 115 3 703 280 Taxation (993 758) (1 044 057)
Earnings 2 655 357 2 659 223 Other comprehensive income 206 442 –Dividends declared during the year (1 750 000) (3 000 000)
Total comprehensive income/(loss) for the year after dividends paid 1 111 799 (340 777)
ABRIDGED CONSOLIDATED STATEMENT OF FINANCIAL POSITION OF ASSMANGAt 30 June
2016R’000
2015*R’000
AssetsNon-current assets 24 918 898 23 728 211 Current assetsInventories 3 712 093 4 448 860 Trade and other receivables 3 557 556 3 532 558 Financial assets 71 450 85 017 Cash resources 4 798 476 4 942 638Assets held-for-sale 1 843 269 1 585 709
Total assets 38 901 742 38 322 993
Equity and liabilitiesEquity 30 041 495 28 929 696 Non-current liabilities
Deferred taxation liability 5 097 914 5 035 202 Long-term provisions 802 695 959 828 Trade and other payables 96 381 92 344
Current liabilitiesTrade and other payables 1 320 541 1 857 782Short-term provisions 698 627 608 367 Taxation 213 125 369 778 Liabilities directly associated with the assets held-for-sale 630 964 469 996
Total liabilities 8 860 247 9 393 297
Total equity and liabilities 38 901 742 38 322 993
Capital expenditure 2 974 678 3 836 808 Capital commitments 3 521 805 5 035 856
* Comparative figures have been restated in accordance with the restatements adopted in Assmang’s financial statements for 2016.
Page 52
Assore integrated annual report 2016

ACQUISITION OF REMAINING 50% OF DWARSRIVIEROn 24 June 2015, the group announced the acquisition from ARM of its 50% indirect share of Dwarsrivier Chrome Mine (held in Assmang) for a consideration of R450 million, which was completed on 29 July 2016. The purchase consideration, inclusive of interest accrued of R34,9 million has been disclosed in the consolidated statement of financial position as at 30 June 2016 as “Restricted cash”. Refer notes 8 and 36 to the consolidated financial statements.
DIRECTORS’ EMOLUMENTS
Directors’fees
(refer note 1)R’000
SalariesR’000
Bonuses(refer note 2)
R’000
Contri-butions
to pensionscheme
R’000
Other fringe
benefits(refer
note 3)R’000
TotalR’000
2016ExecutiveDesmond Sacco (Chairman) 110 4 264 355 – 289 5 018 CJ Cory (Chief Executive Officer) 96 5 246 10 405 1 329 838 17 914 PE Sacco (Group Marketing Director – appointed 1 March 2016) 56 2 117 5 378 536 489 8 576 AD Stalker (resigned 29 February 2016) 67 1 848 6 742 444 5 868 14 969 BH van Aswegen (Group Operations and Growth Director) 96 2 674 7 098 677 604 11 149 Non-executiveEM Southey (Deputy Chairman and lead independent director) 650 650 TN Mgoduso 325 325 S Mhlarhi 350 350 IN Mkhari (resigned 26 May 2016) 226 226 WF Urmson 550 550
2 526 16 149 29 978 2 986 8 088 59 727
2015ExecutiveDesmond Sacco (Chairman) 110 4 264 355 – 274 5 003 CJ Cory (Chief Executive Officer) 96 4 950 14 225 1 249 368 20 888 AD Stalker (Group Marketing Director) 96 2 615 9 703 650 308 13 372 BH van Aswegen (Group Technical Director) 96 2 522 9 643 636 354 13 251 Non-executiveEM Southey (Deputy Chairman and lead independent director) 535 535 RJ Carpenter (resigned 15 June 2015) 205 205 TN Mgoduso (appointed 2 February 2015) 104 104 S Mhlarhi 295 295 IN Mkhari (appointed 2 February 2015) 104 104 WF Urmson 455 455 AlternatePE Sacco 36 1 862 7 213 470 267 9 848
2 132 16 213 41 139 3 005 1 571 64 060
Notes:1. Directors’ fees include fees received from Assmang.2. Due to the shareholding structure the company is unable to offer directors remuneration by way of share incentive or option
arrangements, and bonuses are determined based on the group’s results for the year and the achievement of its long-term objectives. Directors owning shares in the group do so in their own right and disclosure thereof is made in this report.
3. Other fringe benefits include medical aid contributions, car scheme allowances, life insurance contributions, group life contributions, use of assets and unemployment insurance fund contributions. In 2016, other fringe benefits paid to Mr Stalker included an ex gratia payment made on his retirement after 21 years of service in the group.
For more detail relating to the group’s remuneration policy and structure, refer “Remuneration” on page 19.
Page 53
Assore integrated annual report 2016
Overview Strategy and risk Reviews and reports Financial statements

Directors’ report continuedfor the year ended 30 June 2016
DIRECTORS’ INTERESTS IN SHARES OF THE COMPANYInterests of the directors in the ordinary shares of the company at 30 June 2016 were as follows:
Direct beneficial
number of shares
2016
Indirect beneficial
number of shares
2016
Direct beneficial
number of shares
2015
Indirect beneficial
number of shares
2015
Executive directorsDesmond Sacco 960 000 32 430 489 960 000 32 430 489 CJ Cory 50 000 – 50 000 –PE Sacco (2015: alternate director) 227 580 – 227 580 –AD Stalker (resigned 29 February 2016) – –BH van Aswegen 4 505 – 4 505 –Non-executive directorsEM Southey – – – –TN Mgoduso – – – –S Mhlarhi – – – –IN Mkhari (resigned 26 May 2016) – –WF Urmson – – – –
1 242 085 32 430 489 1 242 085 32 430 489
DIRECTORATE AND SECRETARYThe names of the directors, at the date of this report, and details of the Company Secretary, including its business and postal addresses, are set out on the inside back cover of this report.
Subsequent to the date of the previous integrated annual report and up to the date of this report the following changes were made to the Assore board: 29 February 2016 – AD Stalker resigned as Group Marketing Director1 March 2016 – PE Sacco was appointed as Group Marketing Director26 May 2016 – IN Mkhari resigned as a non-executive director
In terms of the Memorandum of Incorporation (MoI), Messrs TN Mgoduso and S Mhlarhi are required to retire by rotation at the forthcoming Annual General Meeting (AGM). The aforementioned directors, being eligible, offer themselves for re-election and a brief curriculum vitae for each of these directors is included in the notice of the AGM (refer page 126).
DIVIDENDS
2016 R’000
2015 R’000
Dividends declared during the yearFinal dividend No 117 of 300 cents (2015: 550 cents) per share – declared 26 August 2015 418 821 767 839
Interim dividend No 118 of 200 cents (2015: 300 cents) per share – declared on 18 February 2016 279 214 418 821
Less: Dividends attributable to treasury shares (182 000) (309 400)
516 035 877 260
Dividends relating to results of the group for the year under reviewInterim dividend No 118 of 200 cents (2015: 300 cents) per share – declared on 18 February 2016 279 214 418 821Final dividend No 119 of 500 cents (2015: 300 cents) per share – declared on 6 September 2016 698 035 418 821Less: Dividends attributable to treasury shares (254 800) (218 400)
722 449 619 242
Page 54
Assore integrated annual report 2016

ANALYSIS OF SHAREHOLDINGThe following analysis of shareholders, in accordance with the JSE Listings Requirements, has been established, based on an examination of the company’s share register at 30 June 2016. The directors are not aware of any material changes to this analysis between the year-end and the date of this report.
2016Number
of shares %
2015Number
of shares %
Shareholder spreadShares held by the public/non-publicNon-public*– Holders in excess of 10% of the share capital 105 021 450 75,23 105 021 450 75,23– Directors of the company (direct and beneficial) 1 242 085 0,89 1 242 085 0,89
106 263 535 76,12 106 263 535 76,12 Public shareholders 33 343 465 23,88 33 343 465 23,88
139 607 000 100,00 139 607 000 100,00
Major shareholdersOresteel Investments Proprietary Limited 73 190 000 52,43 73 190 000 52,43Main Street 460 Proprietary Limited (RF) (held 100% by Main Street 350 Proprietary Limited (RF) which is held 51% and 49% by the Boleng Trust and Assore Limited respectively)# 15 367 000 11,01 15 367 000 11,01Main Street 904 Proprietary Limited (RF) (held 51% and 49% by the Fricker Road Trust and The Assore Employee Trust respectively)# 16 464 450 11,79 16 464 450 11,79
105 021 450 75,23 105 021 450 75,23 Directors of the company 1 242 085 0,89 1 242 085 0,89 Others – less than 5% 33 343 465 23,88 33 343 465 23,88
139 607 000 100,00 139 607 000 100,00
* As defined by Rule 4.25 of the JSE Listings Requirements.# Refer “Black economic empowerment status report” on page 38.
SPECIAL RESOLUTIONSThe following special resolution was passed on 27 November 2015:
“That the board may authorise the company to directly or indirectly provide financial assistance to any present or future subsidiary or inter-related companies of Assore as contemplated in section 45 of the Companies Act, as amended.”
EVENTS AFTER THE REPORTING PERIOD
– On 29 July 2016, the group acquired the entire issued share capital of Dwarsrivier Chrome Mine Proprietary Limited from Assmang. Refer note 36 to the consolidated financial statements for more detail.
– On 6 September 2016, the board declared a final dividend of 500 cents per share, amounting to a R698,0 million, which was paid to shareholders on 3 October 2016.
Page 55
Assore integrated annual report 2016
Overview Strategy and risk Reviews and reports Financial statements

Page 56
Assore integrated annual report 2016

Consolidated statement of financial positionas at 30 June 2016
Note2016
R’000 2015
R’000
ASSETSNon-current assetsInvestment in joint-venture entity 1 15 094 529 14 585 308 Property, plant and equipment 2 176 942 230 342 Intangible assets 3 1 667 26 162 Investments – available-for-sale listed investments 4 180 084 233 972 – foreign listed associate 5 124 848 120 756 – available-for-sale unlisted investments 44 591 47 808 Pension fund surplus 35 68 070 57 474 Deferred taxation 15 17 421 4 964
15 708 152 15 306 786
Current assetsInventories 6 1 037 471 924 762 Trade and other receivables 7 418 466 410 325 Restricted cash 8 479 522 450 000Cash resources 9 3 184 925 2 421 195
5 120 384 4 206 282
Total assets 20 828 536 19 513 068
EQUITY AND LIABILITIESShare capital and reservesShare capital 10 698 698 Share premium 11 264 092 264 092 Treasury shares 12 (5 051 583) (5 051 583)Retained earnings 23 485 031 22 461 703 Other reserves 13 247 242 134 046
Equity attributable to shareholders of the holding company 18 945 480 17 808 956 Non-controlling shareholders’ (deficit)/interests (33 871) 15 765
Total equity 18 911 609 17 824 721
Non-current liabilitiesLong-term borrowings 14 – 346 100 Long-term provisions 16 22 775 18 433 Share-based payment liability 17 5 779 2 648
28 554 367 181
Current liabilitiesTrade and other payables 18 822 996 304 408 Taxation 39 348 27 428 Short-term provisions 19 30 255 28 464 Overdrafts 20 995 774 960 866
1 888 373 1 321 166
Total equity and liabilities 20 828 536 19 513 068
Page 57
Assore integrated annual report 2016
Overview Strategy and risk Reviews and reports Financial statements

Consolidated income statementfor the year ended 30 June 2016
Consolidated statement of comprehensive incomefor the year ended 30 June 2016
Note2016
R’0002015
R’000
Profit for the year (as above) 1 497 641 1 290 440 Items that may be reclassified into the income statement dependent on the outcome of a future event 121 607 (8 703)Loss on revaluation to market value of available-for-sale listed investments, after taxation (18 270) (24 209)Loss on revaluation to original cost of available-for-sale listed investments 4 (23 544) (29 758)Deferred capital gains taxation thereon 15 5 274 5 549 Exchange differences on translation of foreign operations 139 877 15 506 Items that may not be reclassified into the income statement dependent on the outcome of a future event
Actuarial gains/(losses) in pension fund, after taxation 3 760 (2 725)
Total comprehensive income for the year, net of taxation 1 623 008 1 279 012Add back: Comprehensive loss attributable to non-controlling shareholders 29 551 105 118
Attributable to shareholders of the holding company 1 652 559 1 384 130
Note2016
R’0002015
R’000
Revenue 21 2 941 047 3 357 297
Turnover 2 027 813 2 526 096 Cost of sales (1 918 242) (2 376 827)
Gross profit 109 571 149 269 Add: Other incomeCommissions on sales and technical fees 21 673 761 643 442 Foreign exchange gains 23 295 1 503 Investment income 21 218 119 176 821 Sundry 47 977 27 391 Less: Other expensesFinance costs 22 (38 576) (33 391)Foreign exchange losses 23 – (43)Mining royalty taxes (1 455) (1 173)Impairment of property, plant and equipment 2 (41 371) (365 073)Impairment of financial assets to below original cost 4 (30 344) (114 258)Impairment of goodwill 3 (24 315) –Loss on disposal of interest in subsidiary company 34.3 (21 382) –Provision for rehabilitation of mines placed on care and maintenance (34 000) (14 000)Staff remuneration and benefits (267 163) (264 418)*Sundry expenses (190 814) (129 278)
Profit before taxation 23 400 303 76 792
Taxation 24 (176 376) (102 293)
Profit/(loss) after taxation, before joint-venture entity and foreign listed associate 223 927 (25 501)Share of profit from joint-venture entity, after taxation 1 1 281 000 1 317 138
Share of loss in foreign listed associate 5 (7 286) (1 197)
Profit for the year 1 497 641 1 290 440
Attributable to:Shareholders of the holding company 1 539 363 1 403 371
Non-controlling shareholders’ share of losses in subsidiary companies (41 722) (112 931)
As above 1 497 641 1 290 440
Earnings per share (cents) (basic and diluted) 25 1 491 1 360
* Sundry expenses in the prior year have been restated in order to disclose the above rehabilitation of mines placed on care and maintenance.
Page 58
Assore integrated annual report 2016

Consolidated statement of cash flowfor the year ended 30 June 2016
Note2016
R’0002015
R’000
Cash generated from/(utilised in) operating activities 212 491 (962 774)Net cash generated from/(utilised in) operations 755 406 (25 922)Cash generated from operations 27.1 367 718 445 790 Dividend income 21 7 673 21 563 Movements in working capital 27.2 380 015 (493 275)Interest income 21 210 446 155 258 Finance costs 27.3 (36 079) (20 720)Taxation paid 27.4 (173 102) (165 925)Dividends paid to shareholders of the holding company 27.5 (697 863) (1 185 477)*Dividends attributable to treasury shares, utilised within the group 27.5 182 000 309 400*Dividends paid to non-controlling shareholders (28 317) (29 388)Cash retained from investing activities 862 431 817 093Proceeds from/(acquisition of) available-for-sale unlisted investments 3 217 (1 195)Acquisition of interest in foreign listed associate – (121 953)Additions to property, plant and equipment 2 (25 831) (114 557)Acquisition of remaining 50% of Dwarsrivier Chrome Mine 8 – (450 000)Dividend received from joint-venture entity 1 875 000 1 500 000 Proceeds on disposal of property, plant and equipment 10 045 4 798 Cash utilised financing activities (311 192) 422 278 Preference shares redeemed 14 (346 100) –Increase in overdrafts 20 34 908 422 278
Cash resources – increase for the year 763 730 276 597– at beginning of year 2 421 195 2 144 598
– at end of year 9 3 184 925 2 421 195
* Dividends paid to shareholders of the holding company in the prior year have been restated in order to disclose the above dividends attributable to treasury shares separately.
Page 59
Assore integrated annual report 2016
Overview Strategy and risk Reviews and reports Financial statements

Consolidated statement of changes in equityfor the year ended 30 June 2016
Note2016
R’0002015
R’000
Share capitalBalance at beginning and end of year 10 698 698
Share premiumBalance at beginning and end of year 11 264 092 264 092
Treasury sharesBalance at beginning and end of year 12 (5 051 583) (5 051 583)
Retained earningsBalance at beginning of year 22 461 703 21 935 592 Profit for the year 1 539 363 1 403 371 Ordinary dividends declared during the year 26 (516 035) (877 260)Final dividend No 117 of 300 cents (2015: 550 cents) per share – declared on 26 August 2015 (418 821) (767 839)Interim dividend No 118 of 200 cents (2015: 300 cents) per share – declared on 18 February 2016 (279 214) (418 821)Less: Dividends attributable to treasury shares 182 000 309 400
Balance at end of year 23 485 031 22 461 703
Other reservesBalance at beginning of year 134 046 153 793 Other comprehensive income/(loss) 109 436 (17 022)– loss after taxation arising on revaluation of available-for-sale listed investments to market value at year-end (18 270) (24 209)– foreign currency translation reserve arising on consolidation 127 706 7 187 Actuarial gains/(loss) on pension fund, after taxation 3 760 (2 725)
Balance at end of year 13 247 242 134 046
Equity attributable to shareholders of the holding company 18 945 480 17 808 956
Non-controlling shareholders’ (deficit)/interestsBalance at beginning of year 15 765 150 271 Share of total comprehensive loss (49 636) (134 506) Total comprehensive loss for the year, net of taxation (29 551) (105 118) – loss for the year (41 722) (112 931) – other comprehensive income for the year 12 171 7 813 Dividends paid to non-controlling shareholders (28 317) (29 388)Relief realised on derecognition of non-controlling deficit on disposal of subsidiary 34.3 8 232 –
Balance at end of year (33 871) 15 765
Total equity 18 911 609 17 824 721
Page 60
Assore integrated annual report 2016

Notes to the consolidated financial statementsfor the year ended 30 June 2016
1 INVESTMENT IN JOINT-VENTURE ENTITYThe group’s principal investment is a 50% (2015: 50%) interest in Assmang Proprietary Limited (Assmang), a South African company which it jointly controls with African Rainbow Minerals (ARM) which is also listed on the JSE. Assmang mines iron, manganese and chrome ores and produces manganese and chrome alloys. In accordance with IFRS, the results of Assmang are accounted for by Assore using the equity method. The financial information set out below has been extracted from the audited financial statements of Assmang and its subsidiary companies for the year ended 30 June 2016.
2016R’000
2015*R’000
Consolidated income statement of Assmang (accounting for Dwarsrivier as a discontinued operation)Turnover 18 927 093 19 512 919 Cost of sales (14 374 497) (14 369 081)Gross profit 4 552 596 5 143 838 Other operating income 796 369 656 844Other operating expenses (2 185 862) (2 754 964)Profit from operations 3 163 103 3 045 718(Loss)/income from joint-venture entity (17 741) 101 684 Income from investments 416 251 434 164 Finance costs (59 258) (55 157)Profit before taxation 3 502 355 3 526 409Taxation (950 181) (988 902)Profit for the year from continuing operations, net of taxation 2 552 174 2 537 507Discontinued operationsProfit after taxation for the year from discontinued operation (refer note 36) 103 183 121 716 Other comprehensive income 206 442 –Total comprehensive income for the year, net of taxation (group interest therein 50% (2015: 50%)) (refer “Equity accounting results for Assmang” below) 2 861 799 2 659 223 Dividends declared during the year 1 750 000 3 000 000 Abridged consolidated statement of financial position of AssmangTotal assetsNon-current assets 24 918 898 23 728 211 Current assetsInventories 3 712 093 4 448 860 Trade and other receivables 3 557 556 3 532 558 Financial assets 71 450 85 017 Cash resources 4 798 476 4 942 638Assets held-for-sale 1 843 269 1 585 709
38 901 742 38 322 993 Total liabilitiesNon-current liabilities
Deferred taxation liability 5 097 914 5 035 202 Long-term provisions 802 695 959 828 Trade and other payables 96 381 92 344
Current liabilitiesTrade and other payables 1 320 541 1 857 782 Short-term provisions 698 627 608 367 Taxation 213 125 369 778 Liabilities directly associated with the assets held-for-sale 630 964 469 996
8 860 247 9 393 297 Net assets 30 041 495 28 929 696 Proportion of the group’s ownership 50% 50%Carrying amount of investment Opening balance 14 585 308 14 768 170 Share of profit after taxation 1 281 000 1 317 138 Share of other comprehensive income, net of taxation 103 221 –Less: Dividends received (875 000) (1 500 000)Carrying amount of investment in statement of financial position 15 094 529 14 585 308 * Certain comparative figures have been restated in accordance with the restatements adopted in Assmang’s financial statements for 2016, which were
previously disclosed as follows (R’000): – other operating income 650 092 – other comprehensive income 6 752 – non-current assets 23 725 390 – deferred taxation 2 821 – cash resources 5 425 101 – assets held-for-sale 1 103 246 – trade and other payables 1 950 126
Page 61
Assore integrated annual report 2016
Overview Strategy and risk Reviews and reports Financial statements

1 INVESTMENT IN JOINT-VENTURE ENTITY (continued)
2016R’000
2015R’000
Carrying amount of investment (continued)Capital expenditure 2 974 678 3 836 808 Capital commitments 3 521 805 5 035 856 – contracted for 1 123 409 2 286 424 – not contracted for 2 398 396 2 749 432
Equity accounting results of AssmangTotal comprehensive income for the year, net of taxation 2 861 799 2 659 223
Less: Other comprehensive income from continuing and discontinued operations (206 442) –
2 655 357 2 659 223 Less: Depreciation not recorded in Assmang as assets held-for-sale (Dwarsrivier), effective 25 June 2015, required for group (68 410) –
Assmang profit after taxation accounting for Dwarsrivier as a continuing operation 2 586 947 2 659 223
50% thereon 1 293 474 1 329 612
Group consolidation adjustments (12 474) (12 474)
Share of profit from joint-venture entity after taxation per income statement 1 281 000 1 317 138
Impairment of assetsThe carrying values of the following assets were fully impaired at year-end, as no future economic benefits were expected to arise from these operations:– furnaces and associated assets at Cato Ridge Works 333 110 302 956 – mine properties and associated assets at Machadodorp Works 72 308 –– one ferromanganese furnace at Machadodorp Works and associated assets – 362 306 – the off-grade plant at Khumani Iron Ore Mine – 147 114
405 418 812 376
Cost2016
R’000
Accumulated depreciation
and impairment
charges2016
R’000
Carrying amount
2016R’000
Cost2015
R’000
Accumulated depreciation
and impairment
charges2015
R’000
Carrying amount
2015R’000
2 PROPERTY, PLANT AND EQUIPMENTAt year-end Land and buildings 159 346 (48 044) 111 302 150 579 (33 041) 117 538 Plant, machinery and equipment 314 411 (270 011) 44 400 316 606 (263 532) 53 074 Vehicles 32 830 (28 697) 4 133 33 235 (21 005) 12 230 Furniture, fittings and office equipment 110 448 (96 149) 14 299 97 709 (84 333) 13 376 Prospecting, exploration, mine development and decommissioning assets 332 957 (330 149) 2 808 304 373 (302 693) 1 680 Mineral and prospecting rights 3 037 (3 037) – 3 037 (3 037) –Capital work-in-progress – – – 32 444 – 32 444
953 029 (776 087) 176 942 937 983 (707 641) 230 342
Notes to the consolidated financial statements continuedfor the year ended 30 June 2016
Page 62
Assore integrated annual report 2016
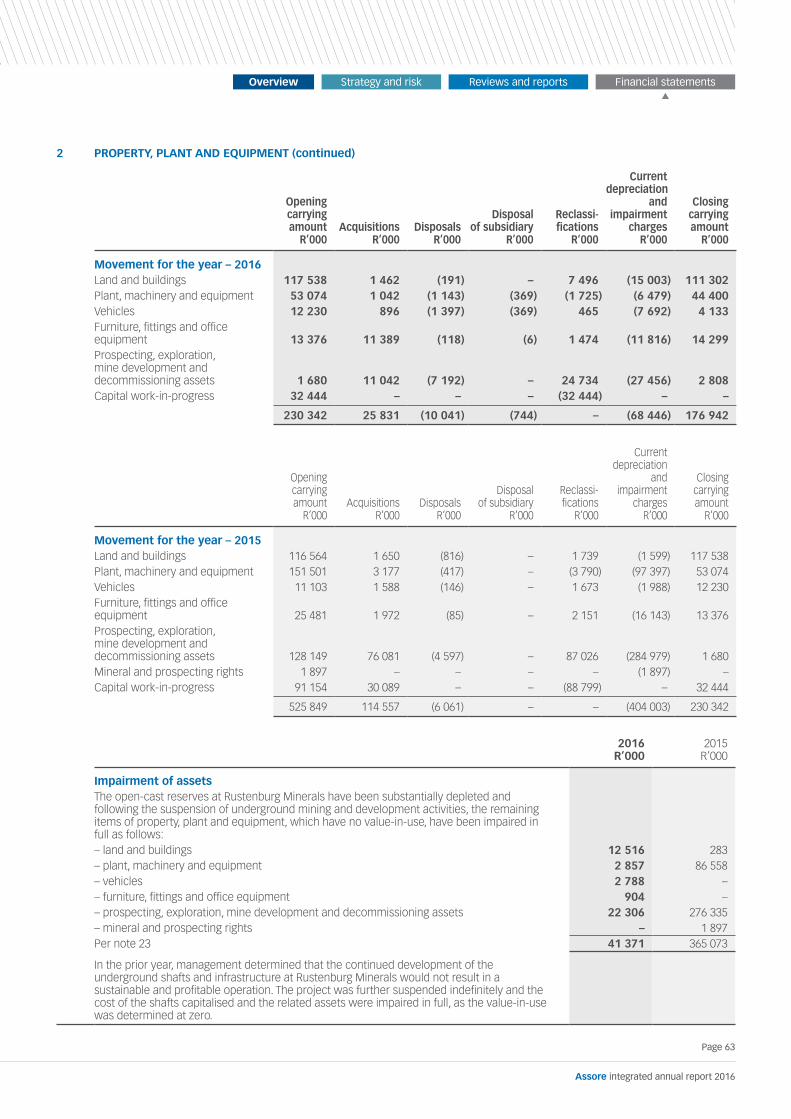
2 PROPERTY, PLANT AND EQUIPMENT (continued)
Opening carrying amount
R’000 Acquisitions
R’000 Disposals
R’000
Disposalof subsidiary
R’000
Reclassi- fications
R’000
Current depreciation
and impairment
charges R’000
Closing carrying amount
R’000
Movement for the year – 2016Land and buildings 117 538 1 462 (191) – 7 496 (15 003) 111 302Plant, machinery and equipment 53 074 1 042 (1 143) (369) (1 725) (6 479) 44 400Vehicles 12 230 896 (1 397) (369) 465 (7 692) 4 133Furniture, fittings and office equipment 13 376 11 389 (118) (6) 1 474 (11 816) 14 299Prospecting, exploration, mine development and decommissioning assets 1 680 11 042 (7 192) – 24 734 (27 456) 2 808Capital work-in-progress 32 444 – – – (32 444) – –
230 342 25 831 (10 041) (744) – (68 446) 176 942
Opening carrying amount
R’000 Acquisitions
R’000 Disposals
R’000
Disposalof subsidiary
R’000
Reclassi- fications
R’000
Current depreciation
and impairment
charges R’000
Closing carrying amount
R’000
Movement for the year – 2015Land and buildings 116 564 1 650 (816) – 1 739 (1 599) 117 538 Plant, machinery and equipment 151 501 3 177 (417) – (3 790) (97 397) 53 074 Vehicles 11 103 1 588 (146) – 1 673 (1 988) 12 230 Furniture, fittings and office equipment 25 481 1 972 (85) – 2 151 (16 143) 13 376 Prospecting, exploration, mine development and decommissioning assets 128 149 76 081 (4 597) – 87 026 (284 979) 1 680 Mineral and prospecting rights 1 897 – – – – (1 897) –Capital work-in-progress 91 154 30 089 – – (88 799) – 32 444
525 849 114 557 (6 061) – – (404 003) 230 342
2016R’000
2015R’000
Impairment of assetsThe open-cast reserves at Rustenburg Minerals have been substantially depleted and following the suspension of underground mining and development activities, the remaining items of property, plant and equipment, which have no value-in-use, have been impaired in full as follows:– land and buildings 12 516 283– plant, machinery and equipment 2 857 86 558– vehicles 2 788 –– furniture, fittings and office equipment 904 –– prospecting, exploration, mine development and decommissioning assets 22 306 276 335– mineral and prospecting rights – 1 897Per note 23 41 371 365 073
In the prior year, management determined that the continued development of the underground shafts and infrastructure at Rustenburg Minerals would not result in a sustainable and profitable operation. The project was further suspended indefinitely and the cost of the shafts capitalised and the related assets were impaired in full, as the value-in-use was determined at zero.
Page 63
Assore integrated annual report 2016
Overview Strategy and risk Reviews and reports Financial statements

Notes to the consolidated financial statements continuedfor the year ended 30 June 2016
2016R’000
2015R’000
3 INTANGIBLE ASSETSLicencesCarrying amount at beginning of year 429 609 Amortisation for the year (180) (180)
Carrying amount at end of year 249 429 GoodwillCarrying amount at beginning of year 25 733 25 733
Impairment of goodwill during the year (refer below) (24 315) –
Carrying amount at end of year 1 418 25 733
1 667 26 162
Goodwill arises on the acquisition of the following entities:Minerais U.S. LLC 1 418 1 418 Groupline Projects Proprietary Limited (Groupline) – 24 315
As above 1 418 25 733
Goodwill in the amount of R24 315 000, relating to the acquisition of Groupline, was impaired due to insufficient projected cash flows to substantiate the recoverable amount.
The directors are of the opinion that remaining goodwill recognised will be recovered in the form of future cash flows anticipated from Minerais U.S. LLC and is therefore not impaired.
4 AVAILABLE-FOR-SALE LISTED INVESTMENTS*Listed investments at cost 319 767 319 767 Cumulative impairment charges included in profit or loss (retained earnings) (170 929) (140 585)Opening balance (140 585) (26 327)Impairment of carrying value below cost disclosed in the income statement (30 344) (114 258)Cumulative fair value adjustment included in other comprehensive income 31 246 54 790 Opening balance 54 790 84 548 Fair value adjustment at year-end disclosed in other reserves (23 544) (29 758)
180 084 233 972
* Fair value adjustments have been restated to show impairment charges separately.
Page 64
Assore integrated annual report 2016
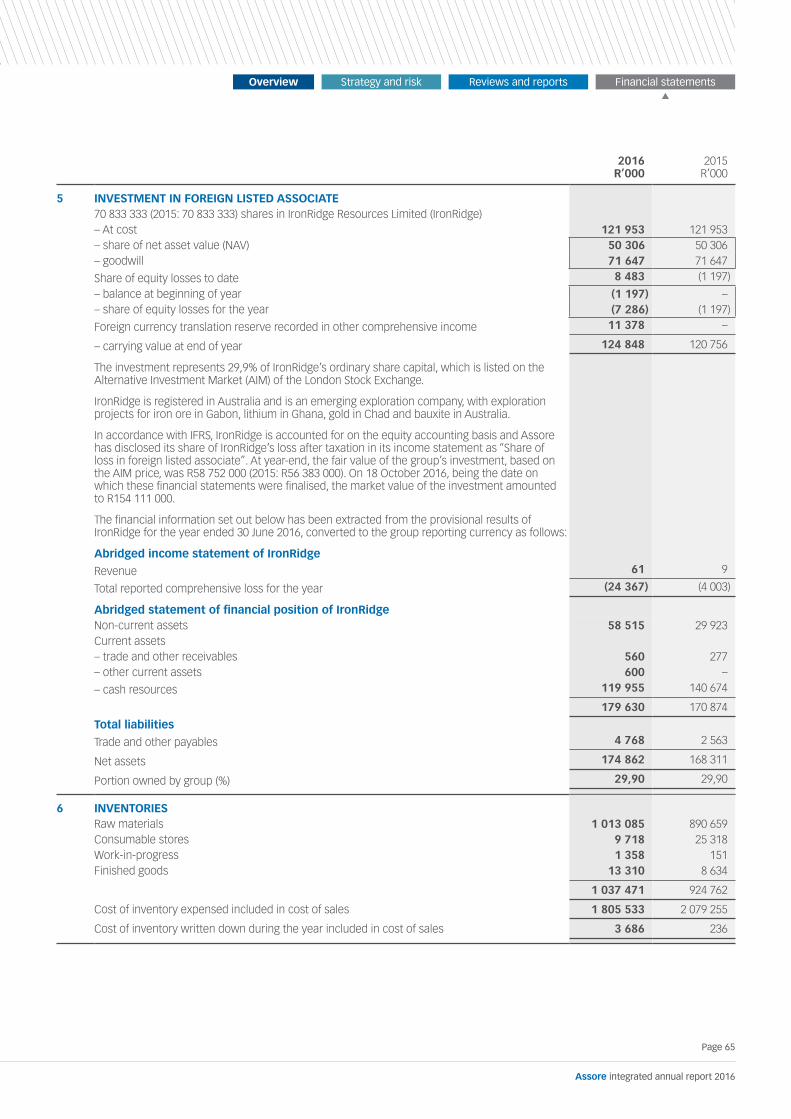
2016R’000
2015R’000
5 INVESTMENT IN FOREIGN LISTED ASSOCIATE70 833 333 (2015: 70 833 333) shares in IronRidge Resources Limited (IronRidge)– At cost 121 953 121 953 – share of net asset value (NAV) 50 306 50 306 – goodwill 71 647 71 647
Share of equity losses to date 8 483 (1 197)
– balance at beginning of year (1 197) –– share of equity losses for the year (7 286) (1 197)
Foreign currency translation reserve recorded in other comprehensive income 11 378 –
– carrying value at end of year 124 848 120 756
The investment represents 29,9% of IronRidge’s ordinary share capital, which is listed on the Alternative Investment Market (AIM) of the London Stock Exchange.
IronRidge is registered in Australia and is an emerging exploration company, with exploration projects for iron ore in Gabon, lithium in Ghana, gold in Chad and bauxite in Australia.
In accordance with IFRS, IronRidge is accounted for on the equity accounting basis and Assore has disclosed its share of IronRidge’s loss after taxation in its income statement as “Share of loss in foreign listed associate”. At year-end, the fair value of the group’s investment, based on the AIM price, was R58 752 000 (2015: R56 383 000). On 18 October 2016, being the date on which these financial statements were finalised, the market value of the investment amounted to R154 111 000.
The financial information set out below has been extracted from the provisional results of IronRidge for the year ended 30 June 2016, converted to the group reporting currency as follows:
Abridged income statement of IronRidge
Revenue 61 9
Total reported comprehensive loss for the year (24 367) (4 003)
Abridged statement of financial position of IronRidgeNon-current assets 58 515 29 923 Current assets– trade and other receivables 560 277 – other current assets 600 –
– cash resources 119 955 140 674
179 630 170 874
Total liabilities
Trade and other payables 4 768 2 563
Net assets 174 862 168 311
Portion owned by group (%) 29,90 29,90
6 INVENTORIESRaw materials 1 013 085 890 659 Consumable stores 9 718 25 318 Work-in-progress 1 358 151 Finished goods 13 310 8 634
1 037 471 924 762
Cost of inventory expensed included in cost of sales 1 805 533 2 079 255
Cost of inventory written down during the year included in cost of sales 3 686 236
Page 65
Assore integrated annual report 2016
Overview Strategy and risk Reviews and reports Financial statements

Notes to the consolidated financial statements continuedfor the year ended 30 June 2016
2016R’000
2015R’000
7 TRADE AND OTHER RECEIVABLESTrade 356 117 294 724 Other 62 349 115 601
418 466 410 325
Trade receivables are non-interest-bearing and the terms range between 30 and 90 days (for more information on credit risk refer note 28.1).
8 RESTRICTED CASHOn 25 June 2015, the group acquired ARM’s 50% share of Dwarsrivier Chrome Mine (Dwarsrivier), held by Assmang. The completion of the transaction was subject to certain conditions precedent (CPs), which at year-end had not all been fulfilled. Pursuant to the agreement concerned, an amount of R450 million was placed in an escrow account. Once all the CPs have been met, the balance (inclusive of accrued interest and certain contractual adjustments to accommodate the change in value of the asset since 1 July 2014 (effective date of acquisition)) will be released in favour of ARM. The transaction was completed on 29 July 2016 (refer note 36). Cash including interest received held in escrow at year-end 479 522 450 000
9 CASH RESOURCESCash on deposit 3 123 433 2 390 207*Current accounts 34 732 9 828Cash pledged in favour of bankers by a subsidiary company to secure environmental guarantees issued by them 26 760 21 160
3 184 925 2 421 195
* Cash on deposit in the prior year has been restated in order to separately disclose cash pledged in favour of bankers for environmental guarantees issued.
10 SHARE CAPITALAuthorised200 000 000 (2015: 200 000 000) ordinary shares of 0,5 cents each 1 000 1 000
IssuedBalance at beginning and end of year139 607 000 (2015: 139 607 000) ordinary shares of 0,5 cents each 698 698
11 SHARE PREMIUMBalance at beginning and end of year 264 092 264 092
12 TREASURY SHARES36 400 000 (2015: 36 400 000) ordinary shares in Assore Limited:Controlled and owned by Main Street 904 Proprietary Limited (RF) (MS 904) (2 692 555) (2 692 555)– 16 464 450 (11,79% of the issued share capital) acquired on 19 August 2011
at R163,00 per share (2 683 705) (2 683 705)– Securities transfer taxation thereon (8 850) (8 850)Controlled and owned by Main Street 350 Proprietary Limited (RF) (MS350) (2 359 028) (2 359 028)– 19 935 550 (14,28% of the issued share capital) acquired over the 2006 to 2010 financial
years at an average cost of R118,00 per share (2 352 354) (2 352 354)– Transaction and warehousing costs thereon (6 674) (6 674)
Balance at end of year (5 051 583) (5 051 583)
Page 66
Assore integrated annual report 2016

2016R’000
2015R’000
13 OTHER RESERVESForeign currency translation reserve arising on consolidation 164 431 36 725 Accumulated actuarial gains in Assore pension fund 55 996 52 236 – Balance at beginning of year 52 236 54 961 – Net actuarial gains/(losses) per statement of comprehensive income 3 760 (2 725) – Actuarial gains/(losses) for the year 5 223 (3 785)
Less: Deferred taxation thereon (refer note 15) (1 463) 1 060
After tax fair value adjustment arising on the revaluation of available-for-sale listed investments at year-end: 26 815 45 085 Gross fair value adjustment (refer note 4) 31 246 54 790 Less: Deferred capital gains taxation (4 431) (9 705)
247 242 134 046
14 LONG-TERM BORROWINGS3 461 (2015: 3 461) unsecured redeemable preference shares of R100 000 each issued to the Standard Bank of South Africa Limited (SBSA) with dividends payable half-yearly at 75% of the prime lending rate published by SBSA
Unredeemed at beginning of year 346 100 346 100 Voluntary redemption of 3 461 shares on 27 June 2016 (346 100) –
– 346 100
Dividends paid during the year were as follows:On 5 October 2015 (2015: 6 October 2014) 11 111 11 304 On 2 April 2016 (2015: 2 April 2015) 11 639 11 023 On 27 June 2016, upon voluntary redemption of the above 3 461 shares 6 265 –
29 015 22 327
15 DEFERRED TAXATIONAt year-endArising on temporary differences– accelerated capital allowances (249) (1 150)– provisions raised 5 679 6 222 – pension fund surplus (19 060) (16 093)– revaluation of available-for-sale listed investments 31 289 16 000 – prepaid expenditure (238) (15)
17 421 4 964
MovementsBalance at beginning of year 4 964 (63 426)Movements for the current year:Movements in income statementArising on temporary differences 11 865 61 781 – accelerated capital allowances 901 53 872 – provisions raised (543) (8 285)– valuation of inventories – (103)– income received in advance – (3 313)– pension fund surplus (1 505) (1 683)– revaluation of available-for-sale listed investments below original cost 13 235 21 308 – prepaid expenditure (223) (15)Arising on change in capital gains taxation rate (3 219) –Arising on temporary differences included in other comprehensive income– revaluation of available-for-sale listed investments at year-end 5 274 5 549 – actuarial (gains)/losses on pension fund (1 463) 1 060
As above 17 421 4 964
Page 67
Assore integrated annual report 2016
Overview Strategy and risk Reviews and reports Financial statements

Notes to the consolidated financial statements continuedfor the year ended 30 June 2016
2016R’000
2015R’000
16 LONG-TERM PROVISIONSEnvironmental obligationsProvision against cost of decommissioning assets 6 079 6 527 Balance at beginning of year 6 527 3 784 Provisions (utilised)/raised during the year (1 400) 2 260 Unwinding of discount on the provision 952 483
Provision for cost of environmental restoration 16 696 10 588 Balance at beginning of year 10 588 16 110 Provisions raised during the year 4 563 5 627 Transfer between long and short-term provisions – (11 973)Unwinding of discount on the provision 1 545 824
Leave pay – 1 318 Balance at beginning of year 1 318 3 488 Provisions (utilised)/raised during the year (1 318) 219 Transfer between long and short-term provisions – (2 389)
Balance at end of year 22 775 18 433
The inflation rates applied to estimate costs used in the discounted cash flow to determine the provision for environmental restoration vary between 8,79% and 10,75% (2015: 6,05% and 8,10%) and the nominal discount rates vary between 8,79% and 10,75% (2015: 6,05% and 8,10%).
17 SHARE-BASED PAYMENT LIABILITYCarrying amount of the liability relating to the equity participation rights (EPRs) expense arising from cash-settled share-based payment transactions during the year, using the Monte Carlo valuation technique 5 779 2 648
EPRs are granted to certain non-managerial employees of the group in terms of the Assore Employee Trust (AET) share-based payment scheme. The number of EPRs allocated in a particular year is based on 10% of the employee’s annual salary on the date of the allocation, relative to the Assore share price. The growth in the value of the EPRs and resultant cash payment is linked to the Assore share price on the date of the payment. This value is reduced by the outstanding balance of the notional debt allocated, which is calculated as the value of the Assore share price on the date that the EPRs were first allocated. The notional amount attracts interest at a rate linked to the prime rate, reduced by 22% of the value of the dividends declared on the Assore shares included in the EPR allocations. The EPRs vest after one year of service rendered by the employee and are settled after 10 years after the initial allocation date.
At 30 June 2016, the fair value of the EPRs, utilising the Monte Carlo valuation technique, amounted to R9 599 000 (2015: R1 985 000). The number of EPRs that have vested to date amount to 155 290 (2015: 108 858), and have a combined intrinsic value of R3 933 000 (2015: Rnil). The increased value is attributable to the increase in the Assore share price during the year, exceeding the accumulated notional debt on the allocations effected in 2016 and 2015.
The following assumptions were used in determining the fair value of the EPRs:– dividend yield, between 2,39% and 2,47% (2015: 3,59% and 3,72%)– expected volatility, between 44,95% and 47,18% (2015: 40,74% and 42,02%)– risk-free interest rate between 8,00% and 8,38% (2015: 5,50% and 9,00%)
Page 68
Assore integrated annual report 2016

2016R’000
2015R’000
18 TRADE AND OTHER PAYABLESTrade payables 746 420 231 823 Other payables 76 576 72 585
822 996 304 408
Trade and other payables are non-interest-bearing and terms vary between 30 and 90 days.
19 SHORT-TERM PROVISIONSBonuses 8 495 11 486Balance at beginning of year 11 486 16 194 Provisions raised during the year 8 090 7 155 Payments made during the year (11 081) (11 863)
Leave pay 12 291 12 573Balance at beginning of year 12 573 11 220 Provisions raised during the year 2 877 1 827 Payments made during the year (2 958) (2 863)Transfer between long and short-term provisions – 2 389 Relief realised on disposal of subsidiary company (201) –
Environmental compliance 9 469 4 405Balance at beginning of year 4 405 25 738 Provisions raised/(utilised) during the year 14 939 (19 780)Transfer between long and short-term provisions – 11 973 Payments made during the year (9 875) (13 526)
30 255 28 464
20 OVERDRAFTSOwing at end of year 995 774 960 866
Foreign subsidiary, Minerais U.S. LLC, maintains a US dollar denominated overdraft facility with a South African bank which provides it with the ability to borrow up to an aggregate of US$100 million (2015: US$100 million) to finance inventory and trade receivables all of which are insured against default. The facility is available on demand and has no expiry date. Interest on the facility accrues at a variable rate of 0,75% above LIBOR which at year-end was 0,40% (2015: 0,11%). The overdraft is guaranteed by the holding company.
21 REVENUERevenue comprises:Sales of mining and beneficiated products 2 033 298 2 513 216 Commissions on sales and technical fees 673 761 643 442 Investment income 218 119 176 821Interest received 210 446 155 258 Dividends received from available-for-sale investments 7 673 21 563 Other 15 869 23 818
2 941 047 3 357 297
Page 69
Assore integrated annual report 2016
Overview Strategy and risk Reviews and reports Financial statements

Notes to the consolidated financial statements continuedfor the year ended 30 June 2016
2016R’000
2015R’000
22 FINANCE COSTSPaid and accrued on:Preference shares (refer note 14) 29 015 22 327 Unwinding of discount on provisions (refer note 16) 2 497 1 307 Overdraft facilities 7 064 9 757
38 576 33 391
23 PROFIT BEFORE TAXATIONProfit before tax is stated after taking into account the following items of income and expenditure:
Income Foreign exchange gains 295 1 503 – realised 155 931 – unrealised 140 572 Relief realised on disposal of subsidiary (refer note 34.3) 8 578 –
ExpenditureAmortisation of intangible assets (refer note 3) 180 180Cost of inventories written down (refer note 6) 3 686 236 Depreciation and impairment charges of property, plant and equipment (refer note 2) 68 446 404 003 Depreciation 27 075 38 930 – land and buildings 2 487 1 316 – plant, machinery and equipment 3 622 10 839 – vehicles 4 904 1 988 – furniture, fittings and office equipment 10 912 16 143 – prospecting, exploration, mine development and decommissioning assets 5 150 8 644 Impairment arising at year-end on review of carrying values (refer note 2) 41 371 365 073 Impairment of goodwill 24 315 –Impairment of trade and other receivables (refer note 34.3) 21 382 –Foreign exchange losses – 43– realised – 25 – unrealised – 18 Loss on disposal of property, plant and equipment 5 1 264 Operating lease expenses 828 707Professional fees 21 552 22 687 Secretarial fees 445 569 Information technology costs 30 148 21 406 Staff costs– salaries and wages (including executive directors’ emoluments) 261 801 254 351 – pension fund costs (refer note 35) 29 934 28 562 – contributions to medical aid funds 5 362 4 898
Page 70
Assore integrated annual report 2016

2016R’000
2015R’000
24 TAXATIONSouth African normal taxation – current year 172 463 151 552 – under/(over) provision relating to prior years 5 644 (1 127)Deferred taxation – reversal of temporary differences in current year (refer note 15) (11 865) (61 781)– change in capital gains taxation rate (refer note 15) 3 219 –Securities transfer taxation on redemption of preference dividends 199 228 Dividend withholding tax, paid on treasury shares 3 513 5 368 Foreign taxation by foreign subsidiary– current year 3 203 8 053
176 376 102 293
Estimated losses available for the reduction of future taxable income arising in certain subsidiary companies, which are not on care and maintenance at year-end, for which no deferred taxation assets have been raised. These losses are current and have not expired. 61 764 139 862
Reconciliation of the taxation charge as a percentage of profit before taxation % %Statutory tax rate 28,00 28,00 Adjusted for:Under/(over) provision relating to prior years 1,41 (1,47)Securities transfer taxation on redemption of preference dividends 0,05 0,30 Dividend withholding tax, paid on treasury shares 0,88 6,99 Deferred taxation assets arising on impairment charges not recognised 8,21 147,77 Disallowable expenditure# 3,54 18,40 Exempt income (0,54) (16,71)Change in rate of trust taxation – 0,92 Change in capital gains taxation rate 0,80 –Other deferred taxation assets not recognised 1,71 (51,00)
Effective tax rate 44,06 133,20
# Disallowable expenditure relates to finance costs on preference shares, legal and professional fees and other expenses of a capital nature not qualifying for deductions.
Page 71
Assore integrated annual report 2016
Overview Strategy and risk Reviews and reports Financial statements

Notes to the consolidated financial statements continuedfor the year ended 30 June 2016
2016 2015
25 EARNINGS AND HEADLINE EARNINGS PER SHAREEarnings per share (cents) (basic and diluted) 1 491 1 360
Headline earnings per share (cents) (basic and diluted) 1 690 1 915
The above calculations were determined using the following information:
R’000 R’000
EarningsProfit attributable to shareholders of the holding company 1 539 363 1 403 371
Headline earningsEarnings as above 1 539 363 1 403 371 Adjusted for:Impairment of non-financial assets in joint-venture entity 145 950 292 455 – before taxation (refer note 1) 202 709 406 188 – taxation effect (56 759) (113 733)Impairment of non-financial assets in subsidiaries – attributable (refer note 2) 23 168 180 368 Impairment of non-financial assets in group (before non-controlling shareholder’s portion) 41 371 322 085 – before taxation 41 371 365 073 – taxation effect – (42 988)Less: Non-controlling shareholder’s portion (18 203) (141 717)Impairment of financial assets 23 547 92 951 – before taxation (refer note 4) 30 344 114 258 – taxation effect (6 797) (21 307)Impairment of goodwill (refer note 3) 24 315 –(Profit)/loss on disposal of property, plant and equipment in joint-venture entity (5 995) 6 296 – before taxation (8 326) 8 745 – taxation effect 2 331 (2 449)Relief realised on disposal of subsidiary (6 176) –– before taxation (refer note 34.3) (8 578) –– taxation effect 2 402 –Loss on disposal of property, plant and equipment in subsidiaries 4 910 – before taxation (refer note 23) 5 1 264 – taxation effect (1) (354)
1 744 176 1 976 351
Shares in issueWeighted number of ordinary shares in issue (‘000)Ordinary shares in issue 139 607 139 607 Treasury shares held in trust (refer note 12) (36 400) (36 400)
Weighted average number of shares in issue for the year 103 207 103 207
Page 72
Assore integrated annual report 2016

2016R’000
2015R’000
26 DIVIDENDS Dividends declared during the yearFinal dividend No 117 of 300 cents (2015: 550 cents) per share – declared on 26 August 2015 418 821 767 839 Interim dividend No 118 of 200 cents (2015: 300 cents) per share – declared on 18 February 2016 279 214 418 821
Total dividend for the year 698 035 1 186 660 Less: Dividends attributable to treasury shares (182 000) (309 400)
516 035 877 260
Per share (cents) 500 850
Dividends relating to the activities of the group for the year under review Interim dividend No 118 of 200 cents (2015: 300 cents) per share – declared on 18 February 2016 279 214 418 821 Final dividend No 119 of 500 cents (2015: 300 cents) per share – declared on 6 September 2016 698 035 418 821 Less: Dividends attributable to treasury shares (254 800) (218 400)
722 449 619 242
Per share (cents) 700 600
27 NOTES TO THE STATEMENT OF CASH FLOW27.1 Cash generated from operations
Profit before taxation 400 303 76 792 Adjusted for:– interest received (210 446) (155 258)– dividends received (7 673) (21 563)– loss on disposal of property, plant and equipment 5 1 264 – profit on disposal of subsidiary (8 578) – – net foreign exchange gains (295) (1 460)– cost of inventories written down 3 686 236 – depreciation of property, plant and equipment 27 075 38 930 – impairment of property, plant and equipment 41 371 365 073 – impairment of financial assets to below original cost 30 344 114 258 – impairment of goodwill 24 315 – – impairment of trade and other receivables 21 382 – – amortisation of intangibles 180 180 – finance costs 38 576 33 391 – movements in long-term provisions 4 342 (4 949)– cash-settled share-based payment charges 3 131 (1 104)
367 718 445 790
.
Page 73
Assore integrated annual report 2016
Overview Strategy and risk Reviews and reports Financial statements

Notes to the consolidated financial statements continuedfor the year ended 30 June 2016
2016R’000
2015R’000
27 NOTES TO THE STATEMENT OF CASH FLOW (continued)27.2 Movements in working capital
Movement in inventories (112 709) (297 572) Movement in foreign currency translation 6 191 1 647 Movement in trade and other receivables (8 141) (26 402) Movement in trade and other payables 518 588 (142 696) Payments against short-term provisions (23 914) (28 252)
380 015 (493 275)
27.3 Finance costs Finance costs per income statement 38 576 33 391 Unwinding of discount on environmental obligations (2 497) (1 307) Accrual raised for preference share dividend – (11 364)
36 079 20 720
27.4 Taxation paidUnpaid at beginning of year (27 428) (29 279)Charged to the income statement (176 376) (102 293)Movement in deferred taxation (refer note 15) (8 646) (61 781)Unpaid at end of year 39 348 27 428
(173 102) (165 925)
27.5 Dividends paid to shareholders of the holding companyUnpaid at beginning of year (2 451) (1 268)Declared during the year (refer note 26) (698 035) (1 186 660)Dividends attributable to treasury shares (refer note 26) 182 000 309 400 Unpaid at end of year included in other payables 2 623 2 451
(515 863) (876 077)
28 FINANCIAL RISK MANAGEMENTThe group is exposed to various financial risks due to the nature and diversity of its activities and the use of various financial instruments. These risks include:– credit risk– liquidity risk– market risk
Details of the group’s exposure to each of the above risks and its objectives, policies and processes for measuring and managing these risks are included specifically in this note and more generally throughout the consolidated financial statements together with information regarding management of capital.
The boards of the individual companies in the group (boards) have overall responsibility for the establishment and oversight of the risk management framework. These boards have delegated these responsibilities to the group’s Executive Committee, which is responsible for the development and monitoring of risk management within the group. The risk management policies are established to identify and analyse the risks faced by the group, to set appropriate risk limits and controls, and to monitor risks and adherence to limits. Risk management policies and systems are reviewed regularly to reflect changes in market conditions and the activities of the group.
The roles and responsibilities of the committees include:– approval of all counterparties;– approval of new instruments;– approval of the group’s foreign exchange transaction policy;– approval of the investment policy;– approval of treasury policy; and– approval of long-term funding requirements.
The internal auditors undertake regular and ad hoc reviews of risk management, controls and procedures, the results of which are monitored by the Assore Audit and Risk Committee.
Page 74
Assore integrated annual report 2016

28 FINANCIAL RISK MANAGEMENT (continued)28.1 Credit risk
Credit risk arises from possible defaults on payments by customers or, where letters of credit have been issued, by bank counterparties. The group minimises credit risk by the careful evaluation of the ongoing creditworthiness of customers and bank counterparties before transactions are concluded. Certain customers which have a well-established credit history are allowed to transact on open account. The group maintains credit insurance on certain accounts in South Africa and all accounts established in the United States.
Overdue amounts are individually assessed and if it is evident that an amount will not be recovered, it is impaired and legal action is instituted to recover the amounts involved.
Credit exposure and concentrations of credit riskThe carrying value of the financial assets represents the maximum credit exposure at the reporting date and the following table indicates various concentrations of credit risk for all financial assets held and recognised in the statement of financial position.
2016R’000
2015R’000
Restricted cash 479 522 450 000Cash resources 3 184 925 2 421 195Trade receivables 356 117 294 724 – local 75 453 24 168 – foreign 280 664 270 556 Other receivables 62 349 115 601
4 082 913 3 281 520
2016Carrying
amount of receivables
not impairedR’000
2015Carrying
amount of receivables
not impairedR’000
Trade receivables 356 117 294 724Not past due, not impaired 355 305 292 016Past due, not impaired as considered recoverable 812 2 708
Other receivablesNot past due, not impaired 62 349 115 601
418 466 410 325
28.2 Liquidity riskThe Executive Committee manages the liquidity structure of the group’s assets, liabilities and commitments so as to ensure that cash flows are sufficiently balanced within the group as a whole. Updated cash flow information and projections of future cash flows are received by the Executive Committee from the group companies on a regular basis depending on the type of funding required. Measures have been introduced to ensure that the cash flow information received is accurate and complete.
Surplus funds are deposited with large South African banks.
Undrawn credit facilitiesIn terms of the Memorandum of Incorporation (MoI) of the holding company, its borrowing powers are unlimited.
The holding company has facilities in place to issue letters of credit and bank guarantees where required and to ensure liquidity (refer note 32). Subsidiary company, Minerais U.S. LLC has a banking facility in place secured by a holding company guarantee, to finance its inventory and receivables, which bear interest at a rate linked to LIBOR. At year-end, the facility was US$100 million (2015: US$100 million), of which US$67 000 000 (2015: US$78 310 000) was utilised.
Page 75
Assore integrated annual report 2016
Overview Strategy and risk Reviews and reports Financial statements

Notes to the consolidated financial statements continuedfor the year ended 30 June 2016
28 FINANCIAL RISK MANAGEMENT (continued)28.2 Liquidity risk (continued)
Exposure to liquidity riskThe following table indicates the anticipated timing of cash flows for the group’s financial assets and liabilities, including guarantees at year-end as determined by contractual maturity date including interest receipts and payments.
Contracted maturity date
Carrying amount
R’000
Total expected
cash flows R’000
Less than 4 months
R’000
Between 4 and
12 months R’000
Between 1 and 5 years
R’000
More than 5 years
R’000
2016Financial assetsListed and unlisted investments# 224 675 224 675 224 675 Investment in foreign listed associate 124 848 124 848 – – – 124 848 Trade and other receivables 418 466 418 466 418 466 – – –Restricted cash 479 522 479 522 479 522 – – –Cash resources 3 184 925 3 184 925 3 184 925 – – –
4 432 436 4 432 436 4 082 913 – – 349 523 Financial liabilitiesTrade and other payables 822 996 822 996 822 996 – – –Overdrafts 995 774 995 774 995 774 – – –Guarantees 210 762 210 762 210 762 – – –
2 029 532 2 029 532 2 029 532 – – –2015Financial assetsListed and unlisted investments# 281 780 281 780 – – – 281 780 Investment in foreign listed associate 120 756 120 756 – – – 120 756 Trade and other receivables 410 325 410 325 410 325 – – –Restricted cash 450 000 450 000 450 000 – – –Cash resources 2 421 195 2 421 195 2 421 195 – – –
3 684 056 3 684 056 3 281 520 – – 402 536
Financial liabilitiesPreference shares issued 346 100 364 609 6 667 11 842 346 100 –Trade and other payables 304 408 304 408 304 408 – – –Overdrafts 960 866 960 866 960 866 – – –Guarantees 205 530 205 530 205 530 – – –
1 816 904 1 835 413 1 477 471 11 842 346 100 –# These investments do not have contractual maturities, but have been presented in the “more than five years” column as, at present, the group does not
intend to dispose of these investments within the next five years.
28.3 Market riskMarket risk is defined as the risk that movements in market factors, in particular US dollar commodity prices and the US dollar/SA rand exchange rate will affect the group’s revenue and operational costs as well as the value of its holdings of financial instruments. The objective of the group’s market risk management policy is to manage and control market risk exposures to minimise the impact of adverse market movements with respect to revenue protection and to optimise the funding of the business’s operations.
The group companies are responsible for the preparation and presentation of market risk information as it affects the relevant entity. Information is submitted to the Executive Committee where it is monitored and further analysed to be used in the decision-making process. The information submitted includes information on currency, interest rate and commodities and is used by the committee to determine the market risk strategy going forward. In addition, key market risk information is reported to members of the Executive Committee on a weekly basis, and forecasts against budget are prepared for the entire group on a monthly basis.
28.3.1 Interest rate riskInterest rate risk arises due to adverse movements in domestic and foreign interest rates. The group is primarily exposed to downward interest rate movements on floating investments purchased and to upward movements on overdrafts and other banking facilities. There is no fair value interest rate risk, as there are no fixed rate financial instruments.
The board determines the interest rate risk strategy based on economic expectations and recommendations received from members of the Executive Committee and senior executives of its offshore interests. Interest rates are monitored on an ongoing basis and the policy is to maintain short-term cash surpluses adequate to meet the group’s ongoing cash flow requirements at floating rates of interest.
Page 76
Assore integrated annual report 2016

28 FINANCIAL RISK MANAGEMENT (continued)28.3 Market risk (continued)28.3.1 Interest rate risk (continued)
At the reporting date, the interest rate profile of the group’s interest-bearing financial instruments was as follows:
2016R’000
2015R’000
Variable rate instrumentsLiabilitiesPreference shares (included in long-term borrowings (refer note 14)) – 346 100 Overdrafts (refer note 20) 995 774 960 866 AssetsCash resources (refer note 9) 3 184 925 2 421 195
Fair value sensitivity analysis for fixed rate instrumentsThe group does not account for any fixed rate financial assets and liabilities at fair value through profit and loss, therefore a change in interest rates at the reporting date would not affect profit or loss.
Cash flow sensitivity analysis for variable rate instrumentsAn increase of 50 basis points in interest rates applicable to variable rate instruments at the reporting date would have increased profit after taxation by R7 881 000 (2015: R4 011 000). This assumes that all other variables remain constant. There is no impact on the group’s equity. Net effect on profit or loss is equal but opposite for a 50 basis points decrease in interest rates on the variable instruments listed above.
28.3.2 Commodity price and currency riskCommodity price risk arises from the risk of an adverse effect on current or future earnings resulting from fluctuations in metal and mineral prices. The group also has transactional foreign exchange exposures, which arise from sales or purchases by the group in currencies other than the group’s functional currency. These markets are predominantly priced in US dollar and to a lesser extent in euros which exposes the group to the risk that fluctuations in the SA rand exchange rates may have a positive or negative impact on current or future earnings.
The group manages its commodity price risk, to which it is exposed through its investment in Assmang, by concluding supply contracts with certain customers for periods of up to three months. Contracts with other customers contain retrospective pricing arrangements which may impact the group either positively or negatively. With respect to its exposure to foreign currency fluctuations, the group constantly reviews the extent to which its foreign currency exposures are covered by forward exchange contracts, taking into account changes in operational forecasts and market conditions and the group’s hedging policy (refer “Forward exchange contracts and other commitments” below).
The group’s exposure to currency risk at year-end was as follows:
2016R’000
2015R’000
Foreign receivables included in trade receivables– US dollar denominated 280 664 275 312
Foreign overdraft (refer note 20)– US dollar denominated 995 774 960 866
Total exposure at year-end 1 276 438 1 236 178
Foreign currency sensitivity analysisA 5% strengthening of the rand against the US dollar would have decreased other comprehensive income for the year by R25 744 000 (2015: R44 502 000) as a result of revaluation of foreign denominated balances. A 5% weakening of the rand against the abovementioned currencies would have had an equal but opposite effect on other comprehensive income, on the basis that all other variables remained constant.
Page 77
Assore integrated annual report 2016
Overview Strategy and risk Reviews and reports Financial statements

Notes to the consolidated financial statements continuedfor the year ended 30 June 2016
28 FINANCIAL RISK MANAGEMENT (continued)28.3 Market risk (continued)
Forward exchange contracts and other commitmentsThe group undertakes economic hedging of receivables denominated in US dollar at times when the rand/US dollar exchange rate appears volatile. The level of exposure on these limited hedging activities did not exceed US$100 million (2015:US$100 million) at any stage during the year.
A foreign subsidiary had forward commitments with regard to its inventory of ores, alloys and metals, which for accounting purposes are regarded as executory contracts and are therefore not included in the statement of financial position, but can be summarised as follows:
2016 2015
Foreign currency amountUS$’000
Presentation currency notional amount
R’000
Foreign currency amountUS$’000
Presentation currency notional amount
R’000
Purchase contractsUS dollar 13 100 194 696 11 300 138 669
Sales contractsUS dollar 33 800 502 346 20 200 247 886
Equity price riskThe group’s listed and unlisted investments are susceptible to market price risk arising from uncertainties about future value of the investment. The group manages the equity price risk through monitoring developments in the mining and metal industries. The executive directors of the board review and approve all equity investment decisions.
At the reporting date, the exposure to listed investments at fair value was R180,0 million (2015: R234,0 million). A decrease of 1% on the relevant market index would have an impact of approximately R1,8 million (2015: R2,3 million) on other comprehensive income attributable to the group, depending on whether or not the decline is significant or prolonged. An increase of 1% in the value of the listed investments would only impact other comprehensive income, but would not have an effect on profit or loss unless the shares are sold or fall below cost.
29 CLASSIFICATION OF FINANCIAL ASSETS AND FINANCIAL LIABILITIESThe categorisation of each class of financial asset and liability in terms of IAS 39 Financial Instruments: Recognition and Measurement is included below:
Available-for-sale
investments R’000
Loans and receivables
R’000
Liabilities at amortised
cost R’000
Total carrying
value R’000
2016Financial assetsListed and unlisted investments 224 675 – – 224 675 Trade and other receivables – 418 466 – 418 466 Restricted cash – 506 282 – 506 282Cash resources – 3 158 165 – 3 158 165
224 675 4 082 913 – 4 307 588
Financial liabilitiesTrade and other payables – – 822 996 822 996 Overdrafts – – 995 774 995 774
– – 1 818 770 1 818 770
Page 78
Assore integrated annual report 2016
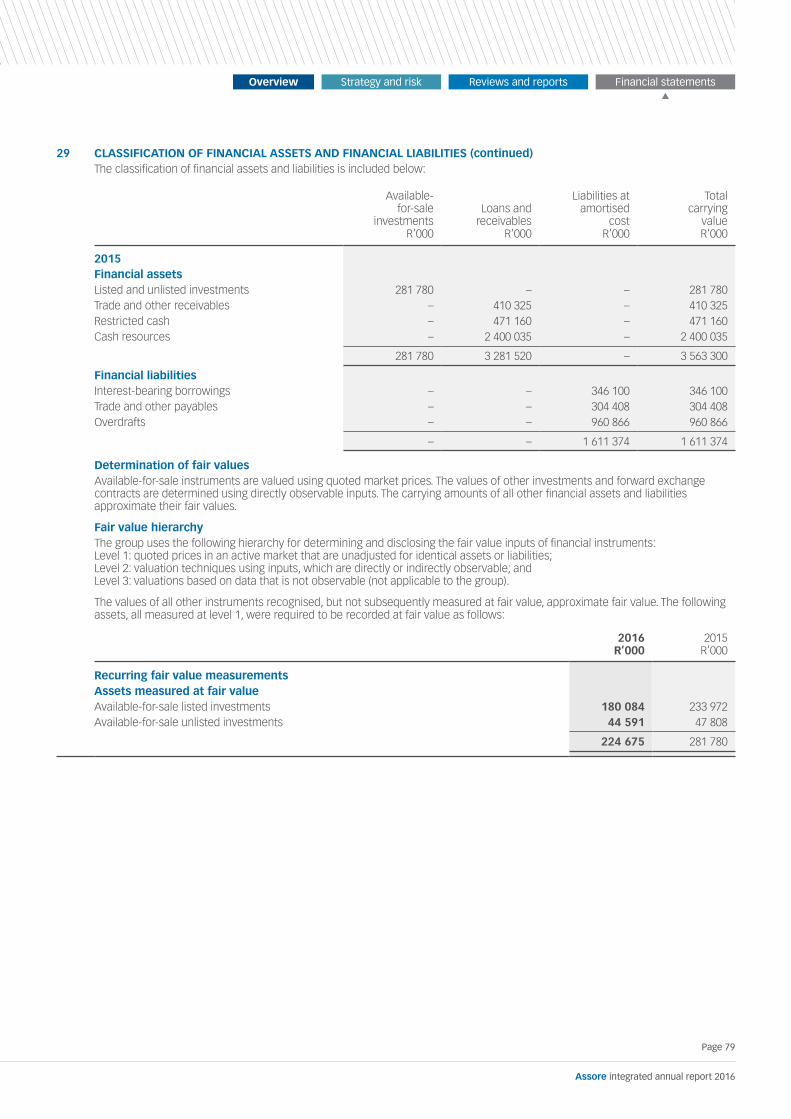
29 CLASSIFICATION OF FINANCIAL ASSETS AND FINANCIAL LIABILITIES (continued)The classification of financial assets and liabilities is included below:
Available-for-sale
investmentsR’000
Loans and receivables
R’000
Liabilities at amortised
costR’000
Total carrying
valueR’000
2015Financial assets Listed and unlisted investments 281 780 – – 281 780 Trade and other receivables – 410 325 – 410 325 Restricted cash – 471 160 – 471 160Cash resources – 2 400 035 – 2 400 035
281 780 3 281 520 – 3 563 300
Financial liabilities Interest-bearing borrowings – – 346 100 346 100 Trade and other payables – – 304 408 304 408 Overdrafts – – 960 866 960 866
– – 1 611 374 1 611 374
Determination of fair valuesAvailable-for-sale instruments are valued using quoted market prices. The values of other investments and forward exchange contracts are determined using directly observable inputs. The carrying amounts of all other financial assets and liabilities approximate their fair values.
Fair value hierarchyThe group uses the following hierarchy for determining and disclosing the fair value inputs of financial instruments:Level 1: quoted prices in an active market that are unadjusted for identical assets or liabilities;Level 2: valuation techniques using inputs, which are directly or indirectly observable; andLevel 3: valuations based on data that is not observable (not applicable to the group).
The values of all other instruments recognised, but not subsequently measured at fair value, approximate fair value. The following assets, all measured at level 1, were required to be recorded at fair value as follows:
2016R’000
2015R’000
Recurring fair value measurementsAssets measured at fair valueAvailable-for-sale listed investments 180 084 233 972 Available-for-sale unlisted investments 44 591 47 808
224 675 281 780
Page 79
Assore integrated annual report 2016
Overview Strategy and risk Reviews and reports Financial statements

Notes to the consolidated financial statements continuedfor the year ended 30 June 2016
30 CAPITAL MANAGEMENTThe board’s policy regarding capital management is to maintain a strong capital base so as to maintain stakeholder confidence and to sustain future development of the business. The group considers its capital to comprise total equity and borrowing facilities. The group manages its capital structure in light of changes in economic conditions and the board of directors monitors the capital adequacy, solvency and liquidity of the group on a continuous basis.
The group holds mineral rights over resources with remaining lives which fluctuate in accordance with current commodity prices. Decisions to exploit resources would be made at board level and only following the completion of a bankable feasibility study based on the current life of mine and estimated capital cost, operating cost and cost of finance, where required, to ensure that as far as possible the deposit can be mined on a sustainable basis to the end of its estimated life.
There were no changes in the group’s approach to capital management during the year.
31 COMMITMENTSAt year-end, the group had the following commitments:
2016R’000
2015R’000
Capital Expenditure authorised and contracted for 1 771 3 926 Expenditure authorised but not contracted for 1 945 27 562
3 716 31 488
Operating lease commitments Future minimum rentals payable under non-cancellable operating leases over premises and equipment which are payable as follows:Within one year 1 359 1 140 After one year but not more than five years 457 1 500
The group’s commitments will be met by future anticipated cash flows 1 816 2 640
32 CONTINGENT LIABILITIESHolding companyMaximum* amount in addition to the R450 million in restricted cash payable for the acquisition of the Dwarsrivier Chrome Mine (Dwarsrivier) (refer note 36) 55 313 800 000 Guarantees issued 210 762 205 530 – guarantees issued to bankers to secure short-term export facility# 180 000 180 000 – cash-covered guarantees issued to the Department of Mineral Resources for rehabilitation required on the group’s mines (refer note 9) 26 760 21 160
– performance guarantees issued to third parties by subsidiary companies 4 002 4 370
266 075 1 005 530
* In terms of the agreement with ARM to acquire its 50% of Dwarsrivier, Assore agreed to refund Assmang for Dwarsrivier’s capital expenditure and working capital requirements, effective from 1 July 2014, decreased by the profits after taxation (increased for losses after taxation) recorded by Dwarsrivier until the necessary conditions precedent were met in order for the transaction to be completed.
# The facility is primarily utilised for and on behalf of Assmang in which the group holds a 50% interest and which in turn has provided a back-to-back guarantee against any claims made by bankers in terms of this facility. The facility was unused at year-end.
Page 80
Assore integrated annual report 2016

33 SEGMENTAL INFORMATIONThe following segments are separately monitored by management and form the group’s reportable segments:
Joint venture mining and beneficiationAssore’s principal investment is its 50% share in Assmang Proprietary Limited (Assmang).
Assmang’s operations are managed by commodity mined and, where applicable, beneficiated at various works operations. Accordingly, this segment is further analysed as follows:– iron ore (Iron Ore division);– manganese ore and alloys (Manganese division); and– chrome ore and charge chrome (Chrome division).
For purposes of presenting segmental information, disclosure is made of the entire value of the information pertaining to Assmang, with the portion attributable to the other joint-venture partner (50%) shown as part of the consolidation adjustments.
Marketing and shippingIn terms of the joint-venture arrangement with Assmang, Assore and certain of its subsidiaries are responsible for the marketing and shipping of Assmang’s product. In addition, another subsidiary provides consulting and engineering expertise to Assmang and other group companies.
Other mining and beneficiationThis segment contains the chrome operations managed by Rustenburg Minerals Development Company Proprietary Limited and Zeerust Chrome Mines Limited, as well as the pyrophyllite and ceramic operations of Wonderstone Limited.
R’000
Iron Ore
divisionManganese
divisionChromedivision Sub-total
Marketing and
shipping
Other mining
and benefi-ciation
Adjust-ments
arising on con-
solidation Total
Year to 30 June 2016RevenuesThird party 12 532 603 6 666 055 1 893 709 21 092 367 2 650 817 290 230 (21 092 367) 2 941 047 Inter-segment – – – – 5 542 – (5 542) –
Total revenues 12 532 603 6 666 055 1 893 709 21 092 367 2 656 359 290 230 (21 097 909) 2 941 047
Contribution to profit/(loss) for the year 2 440 236 103 748 42 962 2 586 946 367 384 (143 457) (2 586 946) 223 927 Contribution to headline earnings* 2 429 137 394 758 42 965 2 866 860 377 106 (66 360) (1 433 430) 1 744 176Impairment of financial and non-financial assets – (405 418) – (405 418) – (117 412) 202 709 (320 121)
Statement of financial positionConsolidated total assets 25 982 501 11 044 725 1 576 180 38 603 406 1 217 940 308 893 (19 301 703) 20 828 536
Other informationFinance income 406 383 9 868 667 416 918 204 257 6 189 (416 918) 210 446Finance costs 25 173 34 084 3 219 62 476 32 324 6 252 (62 476) 38 576Depreciation and amortisation 1 517 071 472 161 105 764 2 094 996 9 492 17 603 (2 094 996) 27 255Taxation 917 170 30 823 23 273 971 266 170 467 5 909 (971 266) 176 376Capital expenditure 901 037 1 927 538 146 103 2 974 678 25 133 698 (2 974 678) 25 831
* Includes equity-accounted results of Assmang and IronRidge.
Joint venture mining and beneficiation
Page 81
Assore integrated annual report 2016
Overview Strategy and risk Reviews and reports Financial statements

Notes to the consolidated financial statements continuedfor the year ended 30 June 2016
33 SEGMENTAL INFORMATION (continued)Other mining and beneficiation (continued)
R’000 Iron Ore division
Manganesedivision
Chromedivision Sub-total
Marketing and
shipping
Other mining and
benefi-ciation
Adjust-ments
arising on con-
solidation Total
Year to 30 June 2015RevenuesThird party 12 622 422 7 152 284 1 798 712 21 573 418 3 007 156 350 141 (21 573 418) 3 357 297 Inter-segment – – – – 5 101 – (5 101) –
Total revenues 12 622 422 7 152 284 1 798 712 21 573 418 3 012 257 350 141 (21 578 519) 3 357 297
Contribution to profit/(loss) for the year 2 381 257 94 165 183 802 2 659 224 197 485 (222 986) (2 659 224) (25 501)Contribution to headline earnings* 2 495 430 577 496 183 802 3 256 728 290 436 57 551 (1 628 364) 1 976 351 Impairment of financial and non-financial assets (147 114) (665 262) – (812 376) – (479 331) 406 188 (885 519)
Statement of financial positionConsolidated total assets 25 563 489 11 274 011 1 344 122 38 181 622 4 806 946 384 887 (23 860 387) 19 513 068
Other informationFinance income 411 967 9 696 1 461 423 124 152 342 2 916 (423 124) 155 258 Finance costs 27 453 27 703 2 375 57 531 28 832 4 559 (57 531) 33 391 Depreciation and amortisation 1 421 457 421 506 91 414 1 934 377 16 683 22 427 (1 934 377) 39 110Taxation 939 881 27 503 79 298 1 046 682 135 737 (33 444) (1 046 682) 102 293 Capital expenditure 1 645 676 1 983 833 207 299 3 836 808 7 919 83 245 (3 836 808) 91 164
* Includes equity-accounted results of Assmang and IronRidge.
Geographical informationGeographical segment by location of customersAn analysis of the geographical locations to which product is supplied is set out below:
2016 2015
Assmang revenue
by segment R’000
Subsidiaries revenue
by segment R’000
Total R’000
Assmang revenue
by segment R’000
Subsidiaries revenue
by segment R’000
Total R’000
Customers by locationsFar East 12 476 319 21 613 12 497 932 11 467 272 10 744 11 478 016 Europe 2 306 454 2 629 2 309 083 3 635 509 3 889 3 639 398 USA 1 716 791 1 745 749 3 462 540 1 086 620 2 232 641 3 319 261 South Africa 2 969 603 1 170 155 4 139 758 3 386 259 1 109 557 4 495 816 Other – foreign 1 623 200 901 1 624 101 1 997 758 466 1 998 224
Total 21 092 367 2 941 047 24 033 414 21 573 418 3 357 297 24 930 715
Notes:1. Included in the sub-total of revenue for the year is revenue from one iron ore customer amounting to R2 607 million. In the
prior year, there were no individual customers whose contribution to revenue exceeded 10% of the total, as consolidated. 2. The revenue of Assmang (refer note 1) is excluded from the group’s reported revenue, in terms of the application of IFRS 11.
Joint venture mining and beneficiation
Page 82
Assore integrated annual report 2016

34 RELATED-PARTY TRANSACTIONS Transactions with related parties are concluded at arm’s length and under similar terms and conditions to third parties.The following entities were identified as related parties to the group:
2016 R’000
2015 R’000
African Mining and Trust Company Limited (AMT) Subsidiary company African Rainbow Minerals (ARM) Joint-venture partner Assmang Limited (Assmang) Joint-venture entity IronRidge Resources (IronRidge) Associate Minerais U.S. LLC (shareholding: 51% (2015: 51%) (Minerais)) Subsidiary company Ore & Metal Company Limited (Ore & Metal) Subsidiary company Oresteel Investments Proprietary Limited (Oresteel) Ultimate holding company Rustenburg Minerals Development Company Proprietary Limited (shareholding: 56% (2015: 56%) (Rustenburg Minerals)) Subsidiary company Sumitomo Corporation (Sumitomo) Investor in ultimate holding
company
34.1 Details of transactions with related partiesThe following significant related-party transactions occurred during the year:AMT Commissions received from
Assmang 299 675 291 573 Minerais U.S. LLC Commissions received from
Assmang 17 675 32 117 Ore & Metal Commissions received from
Assmang 374 087 351 869 Sumitomo Commissions paid by Ore & Metal 172 108 225 498 Key management personnel – holding company Directors’ fees 2 341 1 938 – subsidiary companies Remuneration (including executive
directors) 129 600 132 598 Post-employment benefits 9 941 8 932
Amounts payable to/receivable from related parties at end of the yearARM Amounts receivable from Ore
& Metal 3 670 13 556AMT Amounts receivable from Ore
& Metal 319 761 212 311Minerais Amounts payable to Ore & Metal 27 073 14 402Ore & Metal Amounts payable to Assmang 537 749 99 844 Sumitomo Amounts receivable from Ore
& Metal 178 006 125 419
Page 83
Assore integrated annual report 2016
Overview Strategy and risk Reviews and reports Financial statements

Notes to the consolidated financial statements continuedfor the year ended 30 June 2016
34 RELATED-PARTY TRANSACTIONS (continued)34.2 Subsidiary with a material non-controlling interest
Rustenburg Minerals Development Company Proprietary Limited (Rustenburg Minerals), the principal business of which is the mining and beneficiation of chrome ores in the vicinity of Rustenburg, is a subsidiary of AMT. The group holds a 56% (2015: 56%) interest in Rustenburg Minerals.
2016 R’000
2015 R’000
Abridged income statement of Rustenburg MineralsTurnover 173 413 158 689
Loss before taxation (114 156) (363 942) Taxation – 42 989
Total comprehensive loss (group interest therein 56% (2015: 56%)) (114 156) (320 953)
Abridged statement of financial position of Rustenburg MineralsNon-current assets – 39 777 Current assetsInventories 18 739 13 879 Trade and other receivables 12 251 6 770 Cash resources 456 791
31 446 61 217
Total liabilitiesNon-current liabilitiesLong-term provisions 14 436 18 072 Loans from group companies 178 590 129 792 Current liabilitiesShort-term provisions 7 280 7 680 Trade and other payables 62 107 22 483
262 413 178 027
Net (liabilities)/assets (230 967) (116 810)
Proportion of the group’s ownership (%) 56,0 56,0
Accumulated non-controlling interest (at 44%) (101 625) (51 396)
34.3 Disposal of subsidiaryThe group disposed of its 51% interest held in Icermax Proprietary Limited on 29 February 2016 (effective date), due to ongoing losses incurred on this investment.
The following assets and liabilities were disposed of as part of the above transaction:Property, plant and equipment 744Inventories 4 362Trade and other receivables 112Cash resources 47Loans from group companies (21 382)Short-term provisions (201)Trade and other payables (492)
Net liabilities disposed of (16 810)
49% non-controlling shareholder’s interest disposed of 8 232
Relief realised on disposal of subsidiary (8 578)
Page 84
Assore integrated annual report 2016

35 RETIREMENT BENEFIT INFORMATIONPensionsAssore Limited is a holding company which operates through its joint-venture entities and various subsidiary and associate companies and, as such, does not have any employees.
All subsidiary companies provide retirement benefits through either a defined contribution fund (termed “umbrella fund”) or a defined benefit fund.
Defined contribution fundThe group and employees contribute 10% and 5% of pensionable salary to the umbrella fund respectively. Contributions to the fund amounted to R4,7 million (2015: R4,9 million) and the value amounted to R16,8 million (2015: R26,2 million) at year-end. Decrease in the value of the fund is due to the retrenchments which occurred at Rustenburg Minerals during the year.
Defined benefit – Assore Pension FundIn terms of the Pension Funds Act, the Assore Pension Fund is actuarially valued every three years. The most recently completed statutory actuarial valuation was performed as at 1 July 2015 and revealed a 111,8% funding level. An interim check was performed for funding purposes as at 1 July 2016, which revealed a 114,1% funding level (2015: 112,9%). The financial position of the fund at the dates of the interim funding checks is set out below:
2016R’000
2015R’000
Change in defined benefit obligationBenefit obligation at beginning of year 476 302 428 273 Current service cost 36 490 34 813 Interest cost 41 165 39 010 Actuarial gain – experience – (1 381)Actuarial gain – assumptions (2 259) (14 067)Benefits paid (67 600) (10 346)
Benefit obligation at end of year 484 098 476 302
Change in plan assetsFair value of plan assets at beginning of year 533 776 485 246 Expected return on plan assets 47 721 45 261 Actuarial loss on plan assets – experience and assumptions (890) (19 233)Employer contributions 30 475 24 502 Employee contributions 8 686 8 346 Benefits paid (67 600) (10 346)
Fair value of plan assets at end of year 552 168 533 776
Net surplus at year-end per statement of financial position 68 070 57 474
Components of periodic expenseCurrent service cost 36 490 34 813 Interest cost 41 165 39 010 Expected return on plan assets (47 721) (45 261)
Net pension cost for the year 29 934 28 562
Plan assets invested as follows: % %
Equity securities 71 70 Debt securities 22 23 Property 1 1 Other (cash, cash awaiting investment, bank account) 6 6
100 100
Page 85
Assore integrated annual report 2016
Overview Strategy and risk Reviews and reports Financial statements

Notes to the consolidated financial statements continuedfor the year ended 30 June 2016
35 RETIREMENT BENEFIT INFORMATION (continued)35.1 Pensions (continued)
2016R’000
2015R’000*
The maturity profile of the benefit obligation at the end of the year is as follows:Due within one year 68 429 51 887Due within two years 20 286 58 724Due within three years 19 263 18 908Due within four years 20 027 17 600Due within five years 11 385 18 338Due between six and 10 years 126 230 82 333Due thereafter 218 478 228 512
484 098 476 302
Expected contribution next year 26 462 39 417
Actual return on assets for the year comprises: 46 831 26 028 – expected return on plan assets for the year 47 721 45 261 – actuarial gains on plan assets (890) (19 233)
* The maturity profile and the impact of changes to assumptions have been restated for the prior year to be actuarially consistent with the calculation methodology adopted in the current year. The figures previously reported were as follows (R’000): Due within one year 44 227 Due within two years 19 394 Due within three years 57 694 Due within four years 21 858 Due within five years 26 479 Due between six and 10 years 81 216 Due thereafter 225 434
Actuarial assumptionsThe above valuations are based on the following principal actuarial assumptions: % %
Expected return on plan assets 9,30 8,80 Post-retirement interest rate 3,60 3,60 Price inflation rate 7,40 6,90 Salary inflation rate 8,40 7,90 Pension increases 5,50 5,20
Other assumptionsMortality rate for members still in service assumed at zero.
Pension mortality PA (90) – ultimate table, adjusted for two years’ additional longevity since the previous year-end.
Merit salary increases per sliding scale depending on age starting at 5% per annum below age 25, and reducing to zero above age 50.
Spouse’s benefits for active members – on average, husbands are assumed to be two years older than their wives, and married at date of retirement.
For current pensioners, their actual marital status and, where applicable, the exact age of their spouse has been taken into account.
Page 86
Assore integrated annual report 2016

35 RETIREMENT BENEFIT INFORMATION (continued)35.1 Pensions (continued)
Other assumptions (continued)Set out below is a quantitative sensitivity analysis on the principal assumptions referred to above:
2016 Interest Post-retirement Price inflation Salary inflation Pension increases
Assumptions1%
increase1%
decrease1%
increase1%
decrease1%
increase1%
decrease1%
increase1%
decrease1%
increase1%
decrease
Impact on defined benefit obligation (42 217) 57 839 (31 444) 62 652 98 595 (57 089) 50 273 (36 778) 65 869 (32 193)
2015 Interest Post-retirement Price inflation Salary escalation Pension increases
Assumptions1%
increase1%
decrease1%
increase1%
decrease1%
increase1%
decrease1%
increase1%
decrease1%
increase1%
decrease
Impact on defined benefit obligation (43 629) 57 323 (32 899) 62 159 97 512 (61 703) 45 920 (38 136) 63 552 (34 477)
36 EVENT AFTER THE REPORTING PERIODOn 29 July 2016, the holding company acquired the entire issued share capital of Dwarsrivier Chrome Mine Proprietary Limited (DCM) from Assmang.
The acquisition of DCM results in an improved balance in the group’s product risk.
The fair value of assets acquired and liabilities assumed as part of this business combination, based on values as at 30 June 2016, was as follows:
R’000
Property, plant and equipment 1 136 980Other non-current financial assets 17 683Inventories 382 902Trade and other receivables 188 637Other current financial assets 12 384Cash resources 12 787Long-term provisions (63 322)Trade and other payables (277 918)Short-term provisions (119 695)
Net asset value acquired, at fair value 1 290 438 Deferred tax liability raised in respect of the fair value of assets acquired and liabilities assumed (210 617)Fair value of interest already held by the group (494 955)– purchase price for acquisition of 50% DCM “A” shares issued to ARM (225 000)– fair value of equity interest distributed by Assmang (269 955)Fair value of purchase consideration (540 207)Purchase price, agreed as at 1 July 2014 (cash consideration, refer note 8) (450 000) Amount refunded to Assmang for operating funds advanced between 1 July 2014 and 30 June 2016, net of profits realised in the same period (refer note 32) (55 313) Interest foregone on purchase consideration placed in escrow on 1 July 2015 and paid to seller on 29 July 2016 in terms of acquisition agreement (34 894)
Bargain purchase gain 44 659
The above bargain purchase gain results largely from the purchase price being agreed upon as at 1 July 2014 and the transaction being concluded on 29 July 2016, when all of the conditions precedent were met.
Had control been obtained by 1 July 2015, the following income statement disclosures for 2016 would have been adjusted as follows:
AuditedR’000
AdjustmentR’000
Pro formaadjusted
R’000
Profit for the year attributable to shareholders of the holding company 1 539 363 17 934 1 557 297 Revenue 2 941 047 1 667 301 4 608 348
Page 87
Assore integrated annual report 2016
Overview Strategy and risk Reviews and reports Financial statements

Company statement of financial positionas at 30 June 2016
Note2016
R’000 2015
R’000
ASSETSNon-current assetsInvestment in group companies 1 470 592 470 592 Available-for-sale investments 2 180 209 234 097 Investment in foreign listed associate 3 121 953 121 953 Loans to group companies 1 4 629 538 4 680 891 Deferred taxation 4 31 290 16 000
5 433 582 5 523 533
Current assetsOther receivables 498 597 312 404 Restricted cash 5 479 522 450 000 Cash resources 6 702 214 698 125
1 680 333 1 460 529
Total assets 7 113 915 6 984 062
EQUITY AND LIABILITIESShare capital and reservesShare capital 7 698 698 Share premium 8 264 092 264 092 Retained earnings 5 710 098 5 233 681 Other reserves 9 26 302 44 572
Total equity 6 001 190 5 543 043
Non-current liabilitiesLoans from group companies 1 1 079 305 1 078 041 Long-term borrowings 10 – 346 100
1 079 305 1 424 141
Current liabilitiesOther payables 31 931 15 923 Taxation 1 489 955
33 420 16 878
Total equity and liabilities 7 113 915 6 984 062
Page 88
Assore integrated annual report 2016

Company income statementfor the year ended 30 June 2016
Company statement of comprehensive incomefor the year ended 30 June 2016
Note2016
R’000 2015*
R’000
Revenue 11 1 240 941 1 845 328
Income from investments 1 240 941 1 845 328 – dividends received from joint-venture entity 875 000 1 500 000– preference dividends received from empowerment entities 295 079 267 340– dividends received from available-for-sale listed investments 5 972 18 746– dividends received from unlisted instruments 20 18– interest received 64 870 59 224Administrative expenses (5 282) (8 170)Impairment of financial assets to below original cost 2 (30 344) (114 258)Finance costs (22 750) (22 827)
Profit before taxation 12 1 182 565 1 700 073 Taxation (charge)/credit 13 (8 113) 7 608
Profit for the year 1 174 452 1 707 681
* Income from investments in the prior year has been restated to provide a more detailed breakdown.
Note2016
R’0002015
R’000
Profit for the year (as above) 1 174 452 1 707 681 Items that may be reclassified into the income statement dependent on the outcome of a future event (18 270) (24 209)Loss on revaluation to original cost of available-for-sale listed investments, before taxation 2 (23 544) (29 758)Deferred capital gains taxation thereon 4 5 274 5 549
Total comprehensive income for the year, net of taxation 1 156 182 1 683 472
Page 89
Assore integrated annual report 2016
Overview Strategy and risk Reviews and reports Financial statements

Company statement of cash flowfor the year ended 30 June 2016
Note2016
R’0002015
R’000
Cash generated from operating activities 297 572 511 760 Net cash generated from operating activities 970 910 1 677 864 Cash utilised in operations 15.1 (5 282) (8 170)Dividends received 15.2 1 176 071 1 786 104 Movements in working capital 15.3 (199 879) (100 070)Interest income 64 870 59 224 Finance costs (22 750) (22 827)Taxation paid 15.4 (17 595) (17 024)Dividends paid 15.5 (697 863) (1 185 477)Cash utilised in investing activities – (571 953)Acquisition of interest in foreign listed associate 3 – (121 953)Acquisition of remaining 50% of Dwarsrivier Chrome Mine subject to conditions precedent 5 – (450 000)Cash (utilised by)/generated by financing activities (293 483) 100 914 Preference shares redeemed 10 (346 100) –Repayment of loan accounts by subsidiary companies 52 617 100 914
Cash resources – increase for the year 4 089 40 721 – at beginning of year 698 125 657 404
– at end of year 6 702 214 698 125
Page 90
Assore integrated annual report 2016

Company statement of changes in equityfor the year ended 30 June 2016
Note2016
R’0002015
R’000
Share capitalBalance at beginning and end of year 7 698 698
Share premium Balance at beginning and end of year 8 264 092 264 092
Other reservesBalance at beginning of year 44 572 68 781 Other comprehensive loss for the year (18 270) (24 209)
Balance at end of year 9 26 302 44 572
Retained earningsBalance at beginning of year 5 233 681 4 712 660 Profit for the year 1 174 452 1 707 681 Ordinary dividends declared during the yearFinal dividend No 117 of 300 cents (2015: 550 cents) per share – declared on 26 August 2015 14 (418 821) (767 839)Interim dividend No 118 of 200 cents (2015: 300 cents) per share – declared on 18 February 2016 14 (279 214) (418 821)
Balance at end of year 5 710 098 5 233 681
Total equity 6 001 190 5 543 043
Page 91
Assore integrated annual report 2016
Overview Strategy and risk Reviews and reports Financial statements

Notes to the company financial statementsfor the year ended 30 June 2016
2016R’000
2015R’000
1 INVESTMENT IN GROUP COMPANIESJoint-venture entity (refer below) 468 153 468 153 Subsidiary companies (refer below) 2 439 2 439
470 592 470 592
Investment in joint-venture entity Assmang Proprietary Limited (Assmang)1 774 103 (2015: 1 774 103) ordinary shares at cost 468 153 468 153
Investment in subsidiary companies (refer note 16)Shares at cost 2 439 2 439
Amounts due by/(to) subsidiary companies (refer note 16)Loan accounts receivable 4 629 538 4 680 891 Loan accounts payable (1 079 305) (1 078 041)
Per note 16 3 550 233 3 602 850
Loan accounts receivable include cumulative redeemable preference shares in the amount of R4 034 million (2015: R4 087 million), issued to structured entities (SEs), recognised as subsidiary companies, with a coupon of 75% (2015: 75%) of the prime interest overdraft rate, published by the Standard Bank of South Africa Limited, and with no fixed terms of redemption. The remainder of the loan accounts receivable and all loan accounts payable are interest-free with no fixed terms of repayment. Loan accounts payable are not due within 12 months.
Accrued preference dividends from SEs (included as part of other receivables) 491 913 306 295
2 AVAILABLE-FOR-SALE LISTED INVESTMENTS*Listed investments at cost 319 767 319 767 Cumulative impairment charges included in profit or loss (retained earnings) (170 929) (140 585)Opening balance (140 585) (26 327)Impairment of carrying value below cost disclosed in the income statement (30 344) (114 258)Cumulative fair value adjustment included in other comprehensive income 31 371 54 915 Opening balance 54 790 84 548 Unlisted investments at cost 125 125Fair value adjustment at year-end disclosed in other reserves (23 544) (29 758)
180 209 234 097
* Fair value adjustments have been restated to show impairment charges separately.
3 INVESTMENT IN FOREIGN LISTED ASSOCIATE70 833 333 (2015: 70 833 333) shares in IronRidge Resources Limited (IronRidge) – at cost 121 953 121 953
The investment represents a 29,9% interest in the ordinary share capital of IronRidge, which is listed on the Alternative Investment Market (AIM) of the London Stock Exchange.
IronRidge is registered in Australia and is an emerging exploration company, with exploration projects for iron ore in Gabon, lithium in Ghana, gold in Chad and bauxite in Australia.
Page 92
Assore integrated annual report 2016

2016R’000
2015R’000
4 DEFERRED TAXATIONBalance at beginning of year 16 000 (10 857)Arising on reversal of temporary differences in the income statements– impairment of financial assets to below original cost 13 235 21 308 Arising from temporary differences included in other comprehensive income– revaluation of available-for-sale listed investments to market value at year-end 5 274 5 549 – change in capital gains taxation rate (3 219) –
Balance at end of year 31 290 16 000
5 RESTRICTED CASHOn 25 June 2015, the company acquired ARM’s 50% share of Dwarsrivier Chrome Mine (Dwarsrivier), held by Assmang. The completion of the transaction was subject to certain conditions precedent (CPs), which at year-end had not all been fulfilled. Pursuant to the agreement concerned, an amount of R450 million was placed in an escrow account. Once all the CPs have been met, the balance (inclusive of accrued interest and certain contractual adjustments to accommodate the change in value of the asset since 1 July 2014 (effective date of acquisition)) will be released in favour of ARM. The transaction was completed on 29 July 2016 (refer note 20).
Cash including interest received held in escrow at year-end 479 522 450 000
6 CASH RESOURCESCash on deposit 702 159 698 087 Current account 55 38
702 214 698 125
7 SHARE CAPITALAuthorised200 000 000 (2015: 200 000 000) ordinary shares of 0,5 cents each 1 000 1 000
IssuedBalance at beginning and end of year (139 607 000 (2015: 139 607 000) ordinary shares of 0,5 cents each) 698 698
8 SHARE PREMIUMBalance at beginning and end of year 264 092 264 092
9 OTHER RESERVESSurplus arising on the revaluation of available-for-sale listed investments to market value at year-end Gross fair value adjustment at year-end 31 246 54 790Less: Deferred capital gains taxation thereon (4 944) (10 218)
26 302 44 572
Page 93
Assore integrated annual report 2016
Overview Strategy and risk Reviews and reports Financial statements

2016R’000
2015R’000
10 LONG-TERM BORROWINGS3 461 (2015: 3 461) unsecured redeemable preference shares of R100 000 each issued to the SBSAUnredeemed at beginning of year 346 100 346 100 Voluntary redemption of 3 461 shares on 27 June 2016 (346 100) –
– 346 100
Dividends paid during the year were as follows:On 5 October 2015 (2015: 6 October 2014) 11 111 11 304 On 5 April 2016 (2015: 2 April 2015) 11 639 11 023 On 27 June 2016, upon voluntary redemption of the above 3 461 shares 6 265 –
29 015 22 327
11 REVENUERevenue comprises:Dividends received 1 176 071 1 786 104 Interest received 64 870 59 224
1 240 941 1 845 328
12 PROFIT BEFORE TAXATIONProfit before taxation is stated after taking into account the following items of income and expenditure:IncomeDividends received 1 176 071 1 786 104 Ordinary dividends– joint-venture entity 875 000 1 500 000 – available-for-sale investments
– listed 5 972 18 746 – unlisted 20 18
Preference dividends received from empowerment entities 295 079 267 340– Main Street 350 Proprietary Limited (RF) 54 791 55 706 – Main Street 904 Proprietary Limited (RF) 240 288 211 634
Interest received 64 870 59 224ExpenditureDirectors’ remuneration 59 542 63 866 – directors’ fees 2 341 1 938 – other services paid by subsidiary companies 57 201 61 928
Notes to the company financial statements continuedfor the year ended 30 June 2016
Page 94
Assore integrated annual report 2016

2016R’000
2015R’000
13 TAXATION CHARGE/(CREDIT)South African normal tax– current year 18 129 15 916 – overprovision relating to prior year – (2 216)Deferred taxation– reversal of temporary differences in current year (refer note 4) (13 235) (21 308)
– change in capital gains taxation rate 3 219 –
8 113 (7 608)
Reconciliation of the taxation charge/(credit) as a percentage of profit before taxation % %
Statutory tax rate 28,00 28,00 Adjusted for:Overprovision relating to prior year – (0,13)Dividend income (27,85) (29,42)Disallowable expenditure 0,53 1,10 Change in capital gains taxation rate 0,01 –
Effective tax rate 0,69 (0,45)
14 DIVIDENDS Dividends declared during the yearFinal dividend No 117 of 300 cents (2015: 550 cents) per share – declared on 26 August 2015 418 821 767 839 Interim dividend No 118 of 200 cents (2015: 300 cents) per share – declared on 18 February 2016 279 214 418 821
698 035 1 186 660
Per share (cents) 500 850
Dividends relating to the activities of the group for the year under review Interim dividend No 118 of 200 cents (2015: 300 cents) per share – declared on 18 February 2016 279 214 418 821 Final dividend No 119 of 500 cents (2015: 300 cents) per share – declared on 6 September 2016 698 035 418 821
977 249 837 642
Per share (cents) 700 600
Page 95
Assore integrated annual report 2016
Overview Strategy and risk Reviews and reports Financial statements

Notes to the company financial statements continuedfor the year ended 30 June 2016
2016R’000
2015R’000
15 NOTES TO THE STATEMENT OF CASH FLOW15.1 Cash utilised in operations
Profit before taxation 1 182 565 1 700 073 Adjusted for: (1 187 847) (1 708 243) – dividends received (1 176 071) (1 786 104) – interest received (64 870) (59 224) – impairment of available-for-sale listed investments 30 344 114 258 – finance costs 22 750 22 827
(5 282) (8 170)
15.2 Dividends receivedCredited to the income statement 1 176 071 1 786 104
15.3 Movements in working capitalMovement in other receivables (186 193) (97 768) Movement in other payables (excluding escrow investment interest accrual) (13 686) (2 302)
(199 879) (100 070)
15.4 Taxation paidUnpaid at beginning of year (955) (4 279) Charged to the income statement (8 113) 7 608 Movement in deferred taxation (10 016) (21 308) Unpaid at end of year 1 489 955
(17 595) (17 024)
15.5 Dividends paidUnpaid at beginning of year (2 451) (1 268) Declared during the year (refer note 14) (698 035) (1 186 660) Unpaid at end of year 2 623 2 451
(697 863) (1 185 477)
Page 96
Assore integrated annual report 2016

Issuedshare
capital 2016/2015
R
Direct interestin share
capital 2016/2015
%
Shares at cost#
2016 R’000
Shares at cost#
2015 R’000
Amounts due
from/(to) subsidiary
companies2016
R’000
Amounts due
from/(to) subsidiary
companies2015
R’000
16 INTEREST OF THE COMPANY IN ITS SUBSIDIARY COMPANIES Incorporated in South AfricaOrdinary shares held directlyAfrican Mining and TrustCompany Limited 1 000 000 100 1 200 1 200 (1 264) (1 436)Ceramox Proprietary Limited(D) 100 100 1 124 1 124 – – Erf 1263 Parkview Extension 1 Proprietary Limited 1 100 – – – – Erven 27 and 28 Illovo Proprietary Limited 100 100 – – – – Erven 40 and 41 Illovo Proprietary Limited 100 100 – – – – General Nominees Proprietary Limited(D) 4 100 – – – – Icermax Proprietary Limited* – 51 – – – –Ore & Metal Company Limited 100 000 100 105 105 (1 078 041) (1 078 041)Wonderstone Limited 10 000 100 10 10 – – Xertech Proprietary Limited 100 100 – – – –
2 439 2 439 (1 079 305) (1 079 477)
Ordinary shares held indirectlyGroupline Projects Proprietary Limited(D) 100 100 11 913 36 228 Minerais Holdings Proprietary Limited 100 100 10 887 10 887 42 42 Minerais U.S. LLC 17 756 100 51 11 418 11 418 – –Rustenburg Minerals Development CompanyProprietary Limited 232 143 56 232 143 232 143 – – Wonderstone 1937 Limited(D) 45 940 100 35 35 – –
266 396 290 711 42 42
Companies holding group treasury shares for empowerment entitiesMain Street 350 Proprietary Limited (RF) 99 49 – – 1 779 850 1 832 213 Main Street 460 Proprietary Limited (RF) – – – – 41 41 Main Street 904 Proprietary Limited (RF) 28 500 – – – 2 849 605 2 850 031 Companies provided againstZeerust Chrome Mines Limited 1 300 000 100 1 114 1 114 – – Incorporated in NamibiaKrantzberg Mines Limited 500 000 100 – – – –
Sub-total 1 114 1 114 4 629 496 4 682 285
269 949 294 264 3 550 233 3 602 850
Less – held indirectly (266 396) (290 711) – provided against (1 114) (1 114) – –
Per note 1 2 439 2 439 3 550 233 3 602 850 # Represents investments of less than R1 000(D) Dormant companies * Interest disposed of in the current year (refer note 34.3 to the consolidated financial statements)
Page 97
Assore integrated annual report 2016
Overview Strategy and risk Reviews and reports Financial statements

Notes to the company financial statements continuedfor the year ended 30 June 2016
17 FINANCIAL RISK MANAGEMENTThe company is exposed to various financial risks due to the nature and diversity of its activities and the use of various financial instruments. These risks include:– Credit risk– Liquidity risk– Market risk
Details of the company’s exposure to each of the above risks and its objectives, policies and processes for measuring and managing these risks are included specifically in this note and more generally throughout the company’s financial statements together with information regarding management of capital.
The board of directors has overall responsibility for the establishment and oversight of the company’s risk management framework. The board has delegated its responsibility to the Executive Committee, which is responsible for the development and monitoring of risk management policies within the company. The committee meets on an ad hoc basis and regularly reports to the board on its activities. The company’s risk management policies are established to identify and analyse the risks faced by the company, to set appropriate risk limits and controls, and to monitor risks and adherence to limits. Risk management policies and systems are reviewed regularly to reflect changes in market conditions and the company’s activities.
The roles and responsibilities of the committee include:– approval of all counterparties;– approval of new instruments;– approval of the group’s foreign exchange transaction policy;– approval of the investment policy;– approval of treasury policy; and– approval of long-term funding requirements.
The company also has an internal audit function, which undertakes regular and ad hoc reviews of risk management controls and procedures, the results of which are reported to the Audit and Risk Committee.
17.1 Credit riskCredit exposure and concentration of credit riskThe carrying value of financial assets represents the maximum credit exposure at the reporting date and the following table indicates various concentrations of credit risk for all non-derivative financial assets recognised in the statement of financial position:
2016R’000
2015R’000
Loans to group companies (refer note 1) 4 629 538 4 680 891 Other receivables – local 498 597 312 404 Restricted cash (refer note 5) 479 522 450 000 Cash resources (refer note 6) 702 214 698 125
17.2 Liquidity riskThe Executive Committee manages the liquidity structure of the company’s assets, liabilities and commitments so as to ensure that cash flows are sufficiently balanced within the company as a whole.
Surplus funds are deposited in liquid assets (ie negotiable certificates of deposits and call deposits).
The borrowing capacity of the company is determined by its Memorandum of Incorporation in terms of which there is no restriction imposed on the borrowing powers.
Page 98
Assore integrated annual report 2016

17 FINANCIAL RISK MANAGEMENT (continued)17.2 Liquidity risk (continued)
Exposure to liquidity riskThe following are the cash flows of the group’s financial assets, liabilities and guarantees at year-end as determined by contractual maturity date including interest receipts and payments but excluding the impact of any netting agreements with the third parties concerned.
Contractual maturity date
Carrying amount
R’000
Total cash flows
R’000
Less than 4 months
R’000
Between 4 and 12 months
R’000
Between 1 and 5
yearsR’000
More than 5 years
R’000
2016 Financial assets Investment in group companies# 470 592 470 592 – – – 470 592 Available-for-sale investments# 180 209 180 209 – – – 180 209 Investment in foreign listed associate# 121 953 121 953 – – – 121 953 Loans to group companies#* 4 629 538 4 629 538* 79 503 – – 4 550 035Other receivables 498 597 498 597 498 597 – – –Restricted cash 479 522 479 522 479 522 – – –Cash resources 702 214 702 214 702 214 – – –
7 082 625 7 082 625 1 759 836 – – 5 322 789
Financial liabilities Loans from group companies 1 079 305 1 079 305 – 1 079 305 – –Other payables 31 931 31 931 31 931 – – –Guarantees 1 486 230 1 486 230 1 486 230 – – –
2 597 466 2 597 466 1 518 161 1 079 305 – –
2015Financial assets Investment in group companies 470 592 470 592 – – – 470 592 Available-for-sale investments 234 097 234 097 – – – 234 097 Investment in foreign listed associate 121 953 121 953 – – – 121 953 Loans to group companies 4 680 891 6 481 360* 88 400 1 712 069 – 4 680 891 Other receivables 312 404 312 404 312 404 – – –Restricted cash 450 000 450 000 450 000 – – –Cash resources 698 125 698 125 698 125 – – –
6 968 062 8 768 531 1 548 929 1 712 069 – 5 507 533
Financial liabilities Loans from group companies 1 078 041 1 078 041 – 1 078 041 –Preference shares issued 346 100 364 609 6 667 11 842 346 100 –Other payables 15 921 15 921 15 921 – – –Guarantees 1 227 160 1 227 160 1 227 160 – – –
2 667 222 2 685 731 1 249 748 1 089 883 346 100 –# Investment in, and loans to, group companies and associates and available-for-sale investments do not have contractual maturity dates, but have been
presented in the “more than five years” column as the company does not intend disposing of these assets within the next five years.* Contracted cash flows for loans to group companies are determined by the ability of the company to declare dividends and therefore no projection is made
of the cash flows, except for those based on dividends already declared.
Page 99
Assore integrated annual report 2016
Overview Strategy and risk Reviews and reports Financial statements

Notes to the company financial statements continuedfor the year ended 30 June 2016
17 FINANCIAL RISK MANAGEMENT (continued)17.3 Market risk
Market risk is defined as the risk that movements in market risk factors will affect the company’s revenue and operational costs as well as the value of its holdings of financial instruments. The objective of the company’s market risk management policy is to manage and control market risk exposures to minimise the impact of adverse market movements with respect to revenue protection and to optimise the funding of the business operations.
Market risk information is prepared and submitted to the Executive Committee where it is monitored and further analysed to be used in the decision-making process. The information submitted includes information on currency and interest rates and is used by the committee to determine the market risk strategy going forward. In addition, key market risk information is reported to the Executive Committee on a weekly basis and forecasts against budget are prepared on a monthly basis.
Interest rate riskInterest rate risk arises due to adverse movements in domestic and foreign interest rates. The company is primarily exposed to downward interest rate movements on floating investments purchased and to upward movements on overdrafts and other borrowings. There is no other exposure to fair value interest rate risk as all fixed rate financial instruments are measured at amortised cost.
The board determines the interest rate risk strategy based on economic expectations and recommendations received from the Executive Committee. Interest rates are monitored on a regular basis and the policy is to maintain short-term cash surpluses at floating rates of interest.
At the reporting date, the interest rate profile of the company’s interest-bearing financial instruments was as follows:
2016R’000
2015R’000
Variable rate instrumentsLiabilitiesPreference shares (included in long-term borrowings, refer note 10) – 346 100 AssetsLoan accounts receivable (refer note 1) 4 629 538 4 680 891 Cash resources (refer note 6) 702 214 698 125
Fair value sensitivity analysis for fixed rate instrumentsThe company does not account for any fixed rate financial assets and liabilities at fair value through profit and loss, therefore a change in interest rates at the reporting date would not affect profit or loss.
Cash flow sensitivity analysis for variable rate instrumentsAn increase of 50 basis points in interest rates at the reporting date would have increased profit after taxation by R25,7 million (2015: R26,3 million). This assumes that all other variables remain constant. There is no impact on the company’s equity. Net effect on profit or loss after taxation is equal but opposite for a 50 basis point decrease on the financial instruments listed above.
Equity price riskThe group’s listed and unlisted investments are susceptible to market price risk arising from uncertainties about future value of the investment. The group manages the equity price risk through monitoring developments in the mining and metal industries. The executive directors of the board review and approve all equity investment decisions.
At the reporting date, the exposure to listed investments at fair value was R180,0 million (2015: R234,0 million). A decrease of 1% in the market value of the investments would have an impact of approximately R1,8 million (2015: R2,3 million) on profit or loss, or other comprehensive income depending on whether or not the valuation of the security concerned is stated at below original cost. An increase of 1% in the value of the listed investments would only impact other comprehensive income, and would not have an effect on profit or loss.
Page 100
Assore integrated annual report 2016

17 FINANCIAL RISK MANAGEMENT (continued)17.4 Classification of financial assets and liabilities
The categorisation of each class of financial asset and liability, including their fair values, are included below:
Available-for-sale
investmentsR’000
Loans and receivables
R’000
Liabilities at amortised
costR’000
Other assets and liabilities
R’000
Total carrying
valueR’000
2016 Financial assets Investment in group companies – – 470 592 470 592 Available-for-sale investments 180 209 – – 180 209 Loans to group companies – 4 629 538 – 4 629 538 Other receivables – 498 597 – 498 597 Restricted cash – 479 522 – 479 522 Cash resources – 702 214 – 702 214
180 209 6 309 871 470 592 6 960 672
Financial liabilities Loans from group companies – 1 079 305 1 079 305 Other payables – 31 931 31 931
– – 1 111 236 1 111 236
2015Financial assets Investment in group companies – – 470 592 470 592 Available-for-sale investments 234 097 – – 234 097 Loans to group companies 4 680 891 – 4 680 891 Other receivables 312 404 – 312 404 Restricted cash 450 000 – 450 000 Cash resources 698 125 – 698 125
234 097 6 141 420 470 592 6 846 109
Financial liabilities Loans from group companies 1 078 041 – 1 078 041 Preference shares issued 346 100 – 346 100 Other payables 15 923 – 15 923
– 1 440 064 – 1 440 064
Page 101
Assore integrated annual report 2016
Overview Strategy and risk Reviews and reports Financial statements

Notes to the company financial statements continuedfor the year ended 30 June 2016
18 FAIR VALUE OF FINANCIAL ASSETS AND LIABILITIESDetermination of fair valuesQuoted market prices at reporting date have been used to determine the fair value of available-for-sale investments, whereas market-related discount rates have been used to determine the fair value of loans and receivables and interest-bearing borrowings. Where quoted market prices are not available, a valuation technique, most commonly discounted cash flows, was used. For other receivables and payables, the fair value was determined using discounted cash flow method at market-related interest rate. Carrying amounts approximate fair value for all other financial assets and liabilities.
Fair value hierarchyThe company uses the following hierarchy for determining and disclosing the fair value of financial instruments by valuation technique:Level 1: quoted prices in an active market that are unadjusted for identical assets or liabilities;Level 2: valuation techniques using inputs, which are directly or indirectly observable; andLevel 3: valuations based on data that is not observable (not applicable to the group).
The values of all other instruments recognised, but not subsequently measured at fair value, approximate fair value.
The following assets and liabilities were measured at level 1:
2016R’000
2015R’000
Recurring fair value measurements, measured at level 1Assets measured at fair value, measure at level 1Available-for-sale investments 180 209 234 097 Assets and liabilities measured at amortised cost, measured at level 2Fair value of loans due to group companies 975 682 175 973*Fair value of loans due from group companies 628 309 762 486*
* Loans due to and from group companies were previously measured at level 1. However, as no quoted market inputs were used in calculating their respective fair values, these are now measured at level 2.
19 CAPITAL MANAGEMENTThe company holds interests in companies that own mineral rights over resources with remaining lives which vary in accordance with current prices (refer “Mineral Resources and Reserves”). Decisions to exploit resources would be made at board level and only following the completion of a bankable study based on the current life of mine and estimated capital cost, operating cost and cost of finance, where required, so that the deposit can be mined on a sustainable basis to the end of its estimated life.
The board’s policy is therefore to maintain a strong capital base so as to maintain stakeholder confidence and to sustain future development of the business. The company considers its capital to comprise total equity. The company may adjust its capital structure by way of issuing new shares and is dependent on its shareholders for additional capital as required. The company manages its capital structure in light of changes in economic conditions and the board of directors monitors the capital adequacy, solvency and liquidity of the company on a continuous basis.
There were no changes in the group’s approach to capital management during the year.
2016R’000
2015R’000
20 CONTINGENT LIABILITIESGuarantee of US dollar 100 million issued to bankers as security for facilities provided to a foreign subsidiary company 1 486 230 1 227 160
Maximum amount in addition to the R450 million in restricted cash payable for the acquisition of the Dwarsrivier Chrome Mine (Dwarsrivier) (refer note 5) 55 313 800 000
In terms of the agreement with ARM to acquire its 50% of Dwarsrivier, Assore has agreed to refund Assmang for Dwarsrivier’s capital expenditure and working capital requirements, effective from 1 July 2014. This amount will be decreased by the profits after taxation (increased for losses after taxation) recorded by Dwarsrivier until the necessary conditions precedent are met in order for the transaction to be completed (refer note 22).
The company holds a back-to-back guarantee of R180 million (2015: R180 million) issued by the joint-venture entity in respect of claims made in terms of the abovementioned guarantees.
Page 102
Assore integrated annual report 2016

2016R’000
2015R’000
21 RELATED-PARTY TRANSACTIONSTransactions with related parties are concluded at arm’s length and under similar terms and conditions to third parties.
The following significant related-party transactions occurred during the year:Dividends received from joint-venture entity 875 000 1 500 000 Preference dividends received from deemed to be subsidiary companies 295 079 267 340
Management fees paid to subsidiary company 148 137
22 EVENT AFTER THE REPORTING PERIODOn 29 July 2016, the company acquired the entire issued share capital of Dwarsrivier Chrome Mine Proprietary Limited from Assmang. (Refer note 36 to the consolidated financial statements for more detail.)
Page 103
Assore integrated annual report 2016
Overview Strategy and risk Reviews and reports Financial statements

Accounting policies
1 BASIS OF PREPARATION The financial statements of the group and company are prepared on the historical cost basis, except for financial instruments,
which are measured at fair value. Details of the accounting policies used in the preparation of the financial statements are set out below that are consistent with those applied in the previous year except as stated under the heading “Changes in accounting policies” below.
1.1 Statement of compliance The financial statements of the group and company have been prepared in accordance with International Financial Reporting
Standards (IFRS) and interpretations of those standards, as adopted by the International Accounting Standards Board (IASB), the South African Companies Act, 71 of 2008, as amended, the JSE Listings Requirements, and the SAICA Financial Reporting Guides as issued by the Accounting Practices Committee.
1.2 Changes in accounting policies
1.2.1 The following new standards and amendments to IFRS became effective during the year:
Standard Description
Effective for financial periods commencing Anticipated impact
IFRS 10, IFRS 12 and IAS 28
Investment Entities: Applying the Consolidation Exception (amendments)
January 2016 The amendments to IFRS 10 clarify that the exemption (in IFRS 10.4) from presenting consolidated financial statements applies to a parent entity that is a subsidiary of an investment entity, when the investment entity measures all of its subsidiaries at fair value. Furthermore, the amendments to IFRS 10 clarify that only a subsidiary of an investment entity that is not an investment entity itself and that provides support services to the investment entity is consolidated. All other subsidiaries of an investment entity are measured at fair value. The amendments to IAS 28 allow the investor, when applying the equity method, to retain the fair value measurement applied by the investment entity associate or joint venture to its interests in subsidiaries.
The amendment has not had a material impact on the results or disclosures of the group.
IFRS 11 Accounting for Acquisitions of Interests in Joint Operations (amendments)
January 2016 These amendments require an entity acquiring an interest in a joint operation in which the activity of the joint operation constitutes a business to apply, to the extent of its share, all of the principles in IFRS 3, and other IFRS, that do not conflict with the requirements of IFRS 11. Furthermore, entities are required to disclose the information required in those IFRS in relation to business combinations. The amendments also apply to an entity on the formation of a joint operation if, and only if, an existing business is contributed by the entity to the joint operation on its formation. Furthermore, the amendments clarify that for the acquisition of an additional interest in a joint operation in which the activity of the joint operation constitutes a business, previously held interests in a joint operation must not be remeasured if the joint operation retains joint control.
The amendment has not had a material impact on the results or disclosures of the group.
Page 104
Assore integrated annual report 2016

1 BASIS OF PREPARATION (continued)1.2 Changes in accounting policies (continued)
Standard Description
Effective for financial periods commencing Anticipated impact
IAS 1 Disclosure Initiative (amendments)
January 2016 The amendments clarify: – the materiality requirements in IAS 1; – the specific line items in the statement(s) of profit or loss and OCI and
the statement of financial position may be disaggregated; – that entities have flexibility as to the order in which they present the
notes to the financial statements; and – that the share of OCI of associates and joint ventures accounted for
using the equity method must be presented in aggregate as a single line item, and classified between those items that will or will not be subsequently reclassified to profit or loss.
Furthermore, the amendments clarify the requirements that apply when additional sub-totals are presented in the statement of financial position and the statement(s) of profit or loss and other comprehensive income.
The amendment has not had a material impact on the results or disclosures of the group.
IAS 16 and IAS 38
Clarification of Acceptable Methods of Depreciation and Amortisation (amendments)
January 2016 The amendments clarify the principle in IAS 16 and IAS 38 that revenue reflects a pattern of economic benefits that are generated from operating a business (of which the asset is part) rather than the economic benefits that are consumed through use of the asset. As a result, the ratio of revenue generated to total revenue expected to be generated cannot be used to depreciate property, plant and equipment and may only be used in very limited circumstances to amortise intangible assets.
The amendment has not had a material impact on the results or disclosures of the group.
IAS 27 Equity Method In Separate Financial Statements (amendments)
January 2016 The amendments allow an entity to use the equity method as described in IAS 28 to account for its investments in subsidiaries, joint ventures and associates in its separate financial statements. Therefore, an entity must account for these investments either: – at cost; – in accordance with IFRS 9 (or IAS 39); or – using the equity method.
The entity must apply the same accounting for each category of investments.
A consequential amendment was also made to IFRS 1 First-time Adoption of International Financial Reporting Standards. The amendment to IFRS 1 allows a first-time adopter accounting for investments in the separate financial statements using the equity method, to apply the IFRS 1 exemption for past business combinations to the acquisition of the Investment.
The amendment has not had a material impact on the results or disclosures of the group.
Page 105
Assore integrated annual report 2016
Overview Strategy and risk Reviews and reports Financial statements

1 BASIS OF PREPARATION (continued)1.3 IFRS and IFRIC interpretation not yet effective The group has not applied the following IFRS and IFRIC new, revised and amended standards and interpretations which have been
issued as they are not yet effective:
Standard Description
Effective for financial periods commencing Anticipated impact
IFRS 9 Financial Instruments (amendments)
January 2018 IFRS 9, as issued in July 2014, reflects the completion of all the phases of the IASB’s work on the replacement of IAS 39 and applies to the classification and measurement of financial assets and financial liabilities, impairment as well as hedge accounting.
Classification and measurement of financial instrumentsFinancial assetsAll financial assets are measured at fair value on initial recognition, adjusted for transaction costs if the instrument is not accounted for at fair value through profit or loss (FVTPL).
Debt instruments are subsequently measured at FVTPL, amortised cost or fair value though other comprehensive income (FVOCI), on the basis of their contractual cash flows and the business model under which debt instruments are held.
There is a fair value option (FVO) that allows financial assets on initial recognition to be designated as FVTPL if that eliminates or significantly reduces an accounting mismatch.
Equity instruments are generally measured at FVTPL. However, entities have an irrevocable option on an instrument-by-instrument basis to present changes in the fair value of non-trading instruments in other comprehensive income (OCI) (without subsequent reclassification to profit or loss).
Financial liabilitiesFor financial liabilities designated as FVTPL using the FVO, the amount of change in the fair value of such financial liabilities that is attributable to changes in credit risk must be presented in OCI. The remainder of the change in fair value is presented in profit or loss, unless presentation of the fair value change in respect of the liability’s credit risk in OCI would create or enlarge an accounting mismatch in profit or loss.
All other classification and measurement requirements in IAS 39 have been carried forward into IFRS 9.
Impairment of financial assetsThe expected credit loss model applies to debt instruments recorded at amortised cost or at fair value through OCI (such as loans, debt securities and trade receivables), lease receivables and most loan commitments and financial guarantee contracts.
Entities are required to recognise either 12-month or lifetime expected credit losses, depending on whether there has been a significant increase in credit risk since initial recognition.
The measurement of expected credit losses would reflect a probability weighted outcome, the time value of money and reasonable and supportable information.
Accounting policies continued
Page 106
Assore integrated annual report 2016

1 BASIS OF PREPARATION (continued)1.3 IFRS and IFRIC interpretation not yet effective (continued)
Standard Description
Effective for financial periods commencing Anticipated impact
IFRS 15 Revenue from Contracts with Customers
January 2018 The core principle of this standard is that an entity must apply to measure and recognise revenue. The core principle is that an entity will recognise revenue at an amount that reflects the consideration to which the entity expects to be entitled in exchange for transferring goods or services to a customer.
The principles in IFRS 15 will be applied using a five-step model:1. identify the contact(s) with a customer;2. identify the performance obligations in the contract;3. determine the transaction price;4. allocate the transaction price to the performance obligations in the
contract; and5. recognise revenue when (or as) the entity satisfies a performance
obligation.
The standard requires entities to exercise judgement, taking into consideration all of the relevant facts and circumstances when applying each step of the model to contracts with their customers. It also specifies how to account for the incremental costs of obtaining a contract and the costs directly related to fulfilling a contract.
The group is in the process of determining the impact of the interpretation on its results.
Page 107
Assore integrated annual report 2016
Overview Strategy and risk Reviews and reports Financial statements

Accounting policies continued
1 BASIS OF PREPARATION (continued)1.3 IFRS and IFRIC interpretation not yet effective (continued)
Standard Description
Effective for financial periods commencing Anticipated impact
IFRS 16 Leases January 2019 IFRS 16 requires lessees to account for all leases under a single on-balance sheet model in a similar way to finance leases under IAS 17. The standard includes two recognition exemptions for lessees:
1. leases of “low-value” assets (eg personal computers); and
2. short-term leases (ie leases with a lease term of 12 months or less).
At the commencement date of a lease, a lessee will recognise a liability to make lease payments (ie the lease liability) and an asset representing the right to use the underlying asset during the lease term (ie the right-of-use asset).
Lessees will be required to separately recognise the interest expense on the lease liability and the depreciation expense on the right-of-use asset. Lessees will be required to remeasure the lease liability upon the occurrence of certain events (eg a change in the lease term, a change in future lease payments resulting from a change in an index or rate used to determine those payments). The lessee will generally recognise the amount of the remeasurement of the lease liability as an adjustment to the right-of-use asset.
Lessor accounting is substantially unchanged from today’s accounting under IAS 17. Lessors will continue to classify all leases using the same classification principle as in IAS 17 and distinguish between two types of leases: operating and finance leases.
The group is in the process of determining the impact of the interpretation on its results.
IAS 7 Disclosure Initiative – amendments to IAS 7
January 2017 The amendments to IAS 7 Statement of Cash Flows are part of the IASB’s Disclosure Initiative and require an entity to provide disclosures that enable users of financial statements to evaluate changes arising from cash flows and non-cash changes.
The group is in the process of determining the impact of the interpretation on its results.
IAS 12 Recognition of Deferred Tax Assets for Unrealised Losses – amendments to IAS 12
January 2017 The amendments clarify that an entity needs to consider whether tax laws restrict the sources of taxable profits against which it may make deductions on the reversal of that deductible temporary difference. Furthermore, the amendments provide guidance on how an entity should determine future taxable profits and explain the circumstances in which taxable profit may include the recovery of some assets for more than their carrying amount.
The group is in the process of determining the impact of the interpretation on its results.
All other new standards and amendments issued not yet effective are not considered to have a material impact to the results or disclosures of the group.
Page 108
Assore integrated annual report 2016

2 SIGNIFICANT ACCOUNTING JUDGEMENTS AND ESTIMATES2.1 Judgements In applying the group’s accounting policies, management has made the following judgements, including those involving
estimations, which could have a significant effect on the amounts recognised in the financial statements:
Consolidation of special-purpose vehicles The Boleng Trust and Fricker Road Trust (the trusts) are broad-based community trusts which are for the benefit of historically
disadvantaged South Africans (HDSAs) as contemplated in the Mining Charter. The trusts are invested in special-purpose vehicles (SPVs), namely Main Street 350 Proprietary Limited (RF), Main Street 460 Proprietary Limited (RF) and Main Street 904 Proprietary Limited (RF). The group has considered the requirements of IFRS 10 in assessing whether or not it controls the trusts and the SPVs both which are considered to be structured entities (SEs) as defined in IFRS 10. Based on the contractual terms (namely those contained in the relationship agreements which govern the operation of SEs) the voting rights in the SEs are not considered to be the dominant factor in determining control. Factors such as design and purpose of the SEs, the fact that the SEs are indebted to the group, together with the restrictions placed on the Assore shares held by the SEs (either directly or indirectly) have resulted in the group’s management concluding that the SEs (the trusts and the SPVs) are controlled by the group and have therefore been consolidated in the group financial statements in order to comply with the requirements of IFRS 10. Similarly, since the Assore Employee Trust (also an SE), which is operated by the group and the SPV in which the trust is invested, is indebted to the group, has been consolidated in the group financial statements in accordance with IFRS 10. Accordingly, the Assore shares controlled by these SEs are accounted for as treasury shares (refer item 13).
Impairment of available-for-sale investments The group records impairment charges on available-for-sale equity investments when there has been a significant or prolonged
decline in fair value below their original cost. The determination of what is significant or prolonged requires judgement. In making this judgement, the group evaluates, among other factors, historical share price movements and the duration and extent to which the fair value of an investment is less than its original cost.
Refer note 4 for the impairment on the available-for-sale investments.
2.2 Estimation uncertainty The key assumptions concerning the future and other key sources of estimation uncertainty at the statement of financial position
date that have a significant risk of causing a material adjustment to the carrying amounts of assets and liabilities within the next financial year are listed below.
Project risk and exploration expenditure In evaluating whether expenditures meet the criteria to be capitalised, the group utilises several different sources of information,
including: – the degree of certainty over the mineralisation of the orebody; – commercial risks including, but not limited to, country risks; and – prior exploration knowledge available about the target orebody, which reduces the level of risk associated with the capitalisation of this expenditure to an acceptable level.
Production stripping costs The group incurs waste removal costs (stripping costs) during the development and production phases of its surface mining
operations. Furthermore, during the production phase, stripping costs are incurred in the production of inventory as well as in the creation of future benefits by improving access and mining flexibility in respect of the orebodies to be mined, the latter being referred to as a stripping activity asset. Judgement is required to distinguish between the development and production activities at the surface mining operations.
The group is required to identify the separately identifiable components of the orebodies for each of its surface mining operations. Judgement is required to identify and define these components, and also to determine the expected volumes (tonnes) of waste to be stripped and ore to be mined in each of these components. These assessments may vary between mines because the assessments are undertaken for each individual mine and are based on a combination of information available in the mine plans, specific characteristics of the orebody, the milestones relating to major capital investment decisions and the type and grade of minerals being mined.
Page 109
Assore integrated annual report 2016
Overview Strategy and risk Reviews and reports Financial statements

Accounting policies continued
2 SIGNIFICANT ACCOUNTING JUDGEMENTS AND ESTIMATES (continued)2.2 Estimation uncertainty (continued) Judgement is also required to identify a suitable production measure that can be applied in the calculation and allocation of
production stripping costs between inventory and the stripping activity asset. The group considers the ratio of expected volume of waste to be stripped for an expected volume of ore to be mined for a specific component of the orebody, compared to the current period ratio of actual volume of waste to the volume of ore to be the most suitable measure of production.
These judgements and estimates are used to calculate and allocate the production stripping costs to inventory and/or the stripping activity asset(s). Furthermore, judgements and estimates are also used to apply the units of production method in determining the depreciable lives of the stripping activity asset(s). Refer note 2 in the notes to the consolidated financial statements.
Provisions for environmental rehabilitation The group provides for the estimated costs of rehabilitation which include both restoration and decommissioning of associated
assets. An environmental liability assessment is conducted by an independent adviser on an annual basis to assess the adequacy of the environmental rehabilitation provisions. A risk of material adjustment exists due to the inherent uncertainty surrounding the future life of the mines, the forward-looking nature of the provisions and the uncertainty regarding the underlying assumptions. Refer note 16 in the notes to the consolidated financial statements.
Ore Reserve and Resource estimates Ore Reserves are estimates of the amount of ore that can be economically and legally extracted from the group’s mines, based on
Proven and Probable Ore Reserves. The group estimates its Ore Reserves and Mineral Resources based on information compiled by appropriately qualified persons, relating to the geological data on the size, depth and shape of the orebody, and require complex geological judgements to interpret the data. Changes in the Reserve or Resource estimates may impact the carrying value of exploration and mining assets in terms of depreciation charged and possible impairment. Refer note 2 in the notes to the consolidated financial statements.
Depreciation based on units of production Costs related to the development and infrastructure of the mine to the stage when economically accessible reserves are to
be extracted, are depreciated over the entire Proven and Probable Reserves for the relevant Mineral Resource. Subsequent development and infrastructure costs incurred in accessing Mineral Resources are depreciated over the expected Proven and Probable Reserves expected to be extracted for each phase of the planned mining activity, taking into account reasonably certain plans for ongoing economically feasible mining activity. Refer note 2 in the notes to the consolidated financial statements.
Impairment of non-financial assets The group assesses each cash-generating unit annually to determine whether any indications of impairment exist. Where an
indicator of impairment exists, a formal estimate of the recoverable amount is made, which is considered the higher of the fair value less cost to sell and value-in-use. These assessments require the use of estimates and assumptions such as commodity prices, discount rates, future capital requirements, exploration potential and operating performance. Fair value is determined as the price that would be received to sell an asset or paid to transfer a liability in an orderly transaction between market participants at the measurement date. Fair value for mineral assets is generally determined as the present value of estimated future cash flows arising from the continued use of the asset, which includes estimates such as the cost of future expansion plans and eventual disposal, using assumptions that an independent market participant may take into account. Cash flows are discounted at an appropriate discount rate to determine the net present value. For the purpose of calculating the impairment of any asset, management regards an individual mine or works site as a cash-generating unit. Refer note 2 in the notes to the consolidated financial statements.
3 BASIS OF CONSOLIDATION The consolidated financial statements comprise the financial statements of the company and its joint-venture and subsidiary
companies, which are prepared for the same reporting year as the holding company, using consistent accounting policies. All inter-company balances and transactions, including unrealised profits and losses arising from intra-group transactions, have been eliminated on consolidation.
Page 110
Assore integrated annual report 2016

3 BASIS OF CONSOLIDATION (continued)3.1 Subsidiary companies Investments in subsidiary companies are accounted for in the company at cost less impairments. Subsidiary companies are fully
consolidated from the date of acquisition, being the date on which the group obtains control, and continue to be consolidated until the date that such control ceases.
Non-controlling interests (NCI) represent the portion of profit or loss and equity not held by the group which are presented separately in the statement of comprehensive income and within equity in the consolidated statement of financial position. The NCI is allocated its share of the total comprehensive income/losses for the period, even if that results in a deficit balance.
3.2 Joint ventures A joint venture is a type of joint arrangement whereby the parties that have joint control of the arrangement have rights to the
net assets of the joint venture. The group’s investment in its joint venture is accounted for using the equity method.
Under the equity method, the investments in joint ventures are initially recognised at cost. Carrying amounts of the investment are adjusted to recognise changes in the group’s share of net assets of the joint venture since the acquisition date. Goodwill relating to joint ventures is included in the carrying amount of the investment and is not amortised nor individually tested for impairment. Investments in joint ventures are accounted for in the company at cost less impairments.
The income statement and statement of other comprehensive income (OCI) reflect the group’s share of the results of operations of joint ventures. Any change in OCI of that investee is presented as part of the group’s OCI. In addition, where changes have been recognised directly in the equity of the joint venture, the group recognises its share of any changes, when applicable, in its statement of changes in equity. Unrealised gains and losses resulting from transactions between the group and the joint venture are eliminated to the extent of the interest in the joint ventures.
The aggregate of the group’s share of profit or loss of joint ventures is separately shown in the income statement and represents the profit or loss after tax of the joint venture.
The financial statements of joint ventures are prepared for the same reporting period as the group. When necessary, adjustments are made to accounting policies to be consistent with those of the group.
At each reporting date, the group determines whether there is objective evidence that the investment in the joint venture is impaired. If there is such evidence, the group calculates the amount of impairment as the difference between the recoverable amount of the joint venture and its carrying value, then recognises the loss as “Share of profit of a joint venture” in the income statement.
The group’s share of losses in the joint venture that exceed its interest is not recognised unless the group has an obligation to fund such losses. Unrealised gains arising from transactions with joint ventures are eliminated against the investments to the extent of the group’s interest in the investments. Unrealised losses are eliminated in the same way, but only to the extent that there is no evidence of impairment.
On loss of joint control over a joint venture, the group measures and recognises any retained investment at its fair value. Any difference between the carrying amount of the joint venture upon loss of joint control and fair value of the retained investment and proceeds from disposal is recognised in the income statement.
Page 111
Assore integrated annual report 2016
Overview Strategy and risk Reviews and reports Financial statements

Accounting policies continued
3 BASIS OF CONSOLIDATION (continued)3.3 Associates Associates are investments over which the group has significant influence which is the power to participate in the financial and
operating policy decisions of the investee but without the ability to exercise control or joint control. The group’s investment in its associate is accounted for using the equity method. The group’s share of its profit or loss is based on the associate’s most recent audited financial statements or unaudited interim statements drawn up to the date of the group’s statement of financial position. Investments in associates are accounted for in the company at cost less impairments.
Investment in the associates are initially recognised at cost. The carrying value of the investment in associate is adjusted to recognise the group’s share of the net assets, including the carrying value of goodwill. The carrying value of the associate is reviewed on a regular basis and if there is objective evidence that an impairment in this amount has occurred as a result of one or more events during the year, the investment is impaired.
The income statement and statement of other comprehensive income (OCI) reflect the group’s share of the results of operations of associates. Any change in OCI of that investee is presented as part of the group’s OCI. In addition, where changes have been recognised directly in the equity of the associates, the group recognises its share of any changes, when applicable, in its statement of changes in equity. Unrealised gains and losses resulting from transactions between the group and the associates are eliminated to the extent of the interest in the associates.
The aggregate of the group’s share of profit or loss of associates is separately shown in the income statement and represents the profit or loss after tax of the associates. The financial statements of associates are prepared for the same reporting period as the group. When necessary, adjustments are made to accounting policies to be consistent with those of the group. At each reporting date, the group determines whether there is objective evidence that the investment in the associates is impaired. If there is such evidence, the group calculates the amount of impairment as the difference between the recoverable amount of the associates and its carrying value, then recognises the loss in the “Share of profit of an associate” in the income statement.
The group’s share of losses in the joint venture that exceed its interest is not recognised unless the group has an obligation to fund such losses. Unrealised gains arising from transactions with the joint venture are eliminated against the investments to the extent of the group’s interest in the investments. Unrealised losses are eliminated in the same way, but only to the extent that there is no evidence of impairment.
On loss of significant influence over an associate, the group measures and recognises any retained investment at its fair value. Any difference between the carrying amount of the associate upon loss of significant influence and fair value of the retained investment and proceeds from disposal is recognised in the income statement.
Page 112
Assore integrated annual report 2016

4 PROPERTY, PLANT AND EQUIPMENT AND DEPRECIATION4.1 General Property, plant and equipment is stated at cost, excluding the costs of day-to-day servicing, less accumulated depreciation and
accumulated impairment losses. Such cost includes the cost of replacing part of such plant and equipment when that cost is incurred if the recognition criteria are met. The carrying amounts of plant and equipment are reviewed for impairment when events or changes in circumstances indicate that the carrying amount may not be recoverable.
An item of property, plant and equipment is derecognised upon disposal or when future economic benefits are no longer expected from its use or disposal. Any gain or loss arising on derecognition of the asset (calculated as the difference between the net disposal proceeds and the carrying amount of the asset) is included in the income statement in the year the asset is derecognised.
The assets’ residual values, useful lives and depreciation methods are reviewed, and adjusted if appropriate, at each financial year-end. When an item of plant and equipment comprises a number of significant components each with different useful lives, these components are recorded and depreciated as separate items. Expenditure incurred to replace or modify a significant component of plant is capitalised and any remaining book value of the original component is expensed in the income statement.
The costs of adding to, replacing part of, or servicing an item, following a major inspection, are recognised in the carrying amount of the plant and equipment as a replacement if the recognition criteria are satisfied.
4.2 Production stripping costs The capitalisation of pre-production stripping costs as part of mine development and decommissioning assets ceases when the
mine is commissioned and ready for production.
Where the benefits of production stripping costs are realised in the form of inventory produced in the period, the production stripping costs are accounted for as part of the cost of producing those inventories. Where production stripping costs are incurred, resulting in the creation of mining flexibility and improved access to orebodies to be mined in the future, the costs are recognised as a non-current asset. These are referred to as stripping activity assets, if: – future economic benefits (being improved access to the orebody concerned) are probable; – the component of the orebody for which access will be improved can be accurately identified; and – the costs associated with the improved access can be reliably measured.
If these criteria are not met, the production stripping costs are charged to the income statement as operating costs.
The stripping activity asset is initially measured at cost, which consists of the accumulation of costs directly incurred to perform the stripping activity that improves access to the identified component of the orebody and an allocation of directly attributable overhead costs. If incidental operations are occurring at the same time as the production stripping activity, but are not necessary for the production stripping activity to continue as planned, these costs are not included in the cost of the stripping activity asset. In the event that the costs of the stripping activity asset and the inventory produced are not separately identifiable, a relevant production measure is used to allocate the production stripping costs between the inventory produced and the stripping activity asset.
The stripping activity asset is subsequently depreciated over the life of the identified component of the orebody that became more accessible as a result of the stripping activity. Based on Proven and Probable Reserves, the units-of-production method is used to determine the expected useful life of the identified component of the orebody that became more accessible.
4.3 Prospecting, exploration, mine development and decommissioning assets Costs related to property acquisitions and mineral and surface rights related to exploration are capitalised and depreciated over
a maximum period of 25 years. All exploration expenditures are expensed until they result in projects that are evaluated as being technically and commercially feasible and from which a future economic benefit stream is highly probable.
Exploration expenditure incurred on greenfield sites where the company does not have any mineral deposits which are already being mined or developed, is expensed as incurred until a bankable feasibility study has been completed after which the expenditure is capitalised.
Exploration expenditure incurred on brownfield sites, adjacent to any mineral deposits which are already being mined or developed, is expensed as incurred until the company has obtained sufficient information from all available sources to ameliorate the identified project risk areas and which indicates by means of a pre-feasibility study that the future economic benefits are highly probable.
Exploration expenditure relating to extensions of mineral deposits which are already being mined or developed, including expenditure on the definition of mineralisation of such mineral deposits, is capitalised and depreciated on a straight-line basis over a maximum period of 25 years.
Page 113
Assore integrated annual report 2016
Overview Strategy and risk Reviews and reports Financial statements

Accounting policies continued
4 PROPERTY, PLANT AND EQUIPMENT AND DEPRECIATION (continued)4.3 Prospecting, exploration, mine development and decommissioning assets (continued) Activities in relation to evaluating the technical feasibility and commercial viability of Mineral Resources are treated as forming part
of exploration expenditures.
Refer item 12.1 for the decommissioning assets accounting policy.
Underground mine development includes all directly attributable development costs, including those incurred prior to the commencement of stoping, are capitalised when incurred.
4.4 Depreciation Depreciation of the various types of assets is determined on the following bases:
Mineral and prospecting rights Mineral Reserves, which are being depleted, are amortised over their estimated useful lives using the units-of-production method
based on Proven and Probable Ore Reserves. Where the reserves are not determinable, due to their scattered nature, the straight-line method is applied. The maximum rate of depletion of any mineral right is 25 years. Mineral rights which are not being depleted are not amortised. Mineral rights which have no commercial value are written off in full.
Land and buildings Land is not depreciated. Owner-occupied properties, which are designed for a specific use, are only depreciated if carrying value
exceeds estimated residual value, in which case they are depreciated to estimated residual value on a straight-line basis over their estimated useful lives. The annual depreciation rates used vary up to a maximum of a period of 25 years.
Mine and industrial properties are depreciated to estimated residual values at the lesser of life-of-mine and expected useful life of the asset on the straight-line basis.
Plant, machinery and equipment Mining plant, machinery and equipment is depreciated over the lesser of its estimated useful life, estimated at between five and
25 years (being the remaining life of the mine), and the units-of-production method based on estimated Proven and Probable Ore Reserves. Where Ore Reserves are not determinable, due to their scattered nature, the straight-line method of depreciation is applied.
Industrial plant, machinery and equipment is depreciated on the straight-line basis, over its useful life, up to a maximum of 25 years.
Vehicles Vehicles are depreciated on the straight-line basis. The annual depreciation rates used vary between five and nine years.
Furniture and fittings Furniture and fittings are depreciated on the straight-line basis. The annual depreciation rates used vary between three and
10 years.
Office equipment Office equipment is depreciated on the straight-line basis. The annual depreciation rates used vary between two and 11 years.
Computer hardware Computer hardware is depreciated on the straight-line basis. The annual depreciation rates used vary between two and 11 years.
Computer software Computer software is depreciated on the straight-line basis. The annual depreciation rates used vary between three and five years.
Capital work-in-progress Capital work-in-progress is not depreciated and is transferred to the category to which it pertains when the asset is available for
use as intended.
Mining development assets Mining development assets are depreciated using the units-of-production method based on Proven and Probable Ore Reserves.
The tonnes used to determine depreciation include all the Proven and Probable Ore Reserves that management expects to access within the respective phase. The Proven and Probable Ore Reserves of other phases are adjusted to include those reserves that management determines will be extracted from these areas that are to be developed (refer item “2.2 Depreciation based on units of production”) once it has been determined that these other phases of mining will be undertaken.
Page 114
Assore integrated annual report 2016

5 INTANGIBLE ASSETS5.1 Goodwill Goodwill is initially measured at cost being the excess of the consideration paid over the fair value of the identifiable assets
acquired net of the liabilities assumed of the acquired entity. Following initial recognition, goodwill is measured at cost less any accumulated impairment charges. Goodwill is allocated to the cash-generating unit (CGU) to which it relates and is reviewed for impairment annually or more frequently if changes in circumstances indicate that the carrying value may be impaired based on future income streams of the CGU. Where goodwill has been allocated to a CGU and part of the operation in that unit is disposed of, the goodwill associated with the disposed part of the operation is included in its carrying amount when determining the gain or loss on disposal. Goodwill disposed in these circumstances is measured based on the relative value of the disposed part of the operation and the portion of the CGU retained.
5.2 Intangible assets other than goodwill Intangible assets represent proprietary technical information. Intangible assets acquired separately are measured at cost on initial
recognition. The cost of intangible assets acquired in a business combination is fair valued as at the date of acquisition. Following initial recognition, intangible assets are carried at cost less any accumulated amortisation and any accumulated impairment losses. Intangible assets with indefinite useful lives are not amortised.
The useful lives of intangible assets are assessed to be either finite or indefinite. Intangible assets with finite lives are amortised over their useful life on a straight-line basis and assessed for impairment whenever there is an indication that the intangible asset may be impaired. The amortisation period varies between three and five years. The amortisation expense on intangible assets with finite lives is recognised in the income statement in the expense category consistent with the function of the intangible asset. Intangible assets with indefinite useful lives are not amortised and are subjected to annual impairment reviews.
Gains or losses arising from derecognition of an intangible asset are measured as the difference between the net disposal proceeds and the carrying amount of the asset and are recognised in the income statement when the asset is derecognised.
Internally generated intangible assets are not capitalised and expenditure is reflected in the income statement in the year in which the expenditure is incurred.
6 BUSINESS COMBINATIONS Business combinations are accounted for using the acquisition method. The cost of the acquisition is measured as the aggregate
of the consideration transferred, measured at acquisition date fair value and the amount of any non-controlling interest in the acquiree. For each business combination, the group elects whether it measures the non-controlling interest in the acquiree at either fair value or at the proportionate share of the acquiree’s identifiable net assets. Acquisition costs incurred are expensed and included in administrative expenses.
When the group acquires a business, it assesses the financial assets acquired and liabilities assumed for appropriate classification and designation in accordance with the contractual terms, economic circumstances and pertinent conditions as at the acquisition date.
Any contingent consideration to be transferred by the acquirer will be recognised at fair value at the acquisition date. Subsequent changes to the fair value of the contingent consideration that is deemed to be an asset or liability will be recognised in accordance with IAS 39 as a change to profit and loss. If the consideration is classified as equity, it will not be remeasured. Subsequent settlement is accounted for within equity. In instances where the contingent consideration does not fall within the scope of IAS 39, it is measured in accordance with the appropriate accounting standard per IFRS.
7 IMPAIRMENT OF NON-FINANCIAL ASSETS The group assesses at each reporting date whether there is an indication that the carrying value of an asset or a CGU may be
impaired. If any such indication exists, or when annual impairment testing for an asset is required, the group makes an estimate of the asset’s recoverable amount. Where the carrying amount of an asset exceeds its recoverable amount, the asset/CGU is considered impaired and is written down to its recoverable amount. In assessing value-in-use, the estimated future cash flows are discounted to their present value using a pre-tax discount rate that reflects current market assessments of the time value of money and the risks specific to the asset. Impairment losses of continuing operations are recognised in the income statement in those expense categories consistent with the function of the impaired asset/CGU.
An assessment is made at each reporting date as to whether there is any indication that previously recognised impairment losses may no longer exist or may have decreased. If such indication exists, the recoverable amount is re-estimated. A previously recognised impairment loss is reversed only if there has been a change in the assumptions used to determine the asset’s/CGU’s recoverable amount since the last impairment loss was recognised, in which case the carrying amount of the asset/CGU is increased to its recoverable amount. That increased amount cannot exceed the carrying amount that would have been determined, net of depreciation, had no impairment loss been recognised for the asset/CGU in prior years. Such reversal is recognised in profit or loss, and the depreciation charge is adjusted in future periods to allocate the asset’s revised carrying amount, less any residual value, on a systematic basis over its remaining useful life.
Page 115
Assore integrated annual report 2016
Overview Strategy and risk Reviews and reports Financial statements

Accounting policies continued
8 CAPITALISATION OF BORROWING COSTS Borrowing costs that are directly attributable to the acquisition, construction or development of major capital projects, which
require a substantial period of time to be prepared for its intended use, are capitalised. Capitalisation of borrowing costs as part of the cost of a qualifying asset commences when: – expenditures for the asset are being incurred; – borrowing costs are being incurred; and – activities that are necessary to prepare the asset for its intended use or sale are in progress.
Capitalisation is suspended when the active development is interrupted and ceases when the activities necessary to prepare the asset for its use are completed.
Other borrowing costs are charged to finance costs in the income statement as incurred.
9 FINANCIAL INSTRUMENTS9.1 Recognition and measurement The recognition and measurement of financial instruments depend on their classification as described below:
Available-for-sale investments All investments are initially recognised at fair value, including acquisition charges associated with the investment. After initial
recognition, investments, other than investments in jointly controlled entities and subsidiary companies, are classified as available-for-sale investments and are measured at fair value, which equates to market value.
Gains and losses on subsequent measurement of available-for-sale investments are recognised in other comprehensive income until the investment is disposed of, or its original cost is considered to be impaired, at which time the cumulative gain previously reported in other comprehensive income and the impairment below the cost, where considered significant or prolonged, is recognised in the income statement.
The fair value of available-for-sale investments that are actively traded in organised financial markets is determined by reference to quoted market bid prices at the close of business on the statement of financial position date. For investments where there is no active market, fair value is determined using valuation techniques such as discounted cash flow analysis.
Trade and other receivables Trade receivables are initially recognised at fair value and subsequently at amortised cost and are classified as loans and
receivables. An impairment charge is recognised when there is evidence that an entity will not be able to collect all amounts due in accordance with the original terms of the receivables. The impairment charge is the difference between the asset’s carrying amount and the present value of estimated future cash flows, discounted at the original effective interest rates. The impairment amount is charged to the income statement when it arises.
Cash and cash equivalents Cash and cash equivalents comprise cash at banks and on hand and short-term deposits with an original maturity of three months
or less, but exclude any restricted cash that is not available for use by the group and therefore is not considered highly liquid.
Cash and cash equivalents are initially recognised at fair value and subsequently stated at amortised cost.
Preference shares, trade and other payables Preference shares, trade and other payables are initially recognised at fair value, including any transaction costs directly associated
with the borrowing, and subsequently stated at amortised cost, being the initial recognised obligation less any repayments made and any other adjustments plus interest accrued.
Interest-bearing loans and borrowings All loans and borrowings are initially recognised at their fair value, being the consideration received, net of issue costs associated
with the borrowing. After initial recognition, interest-bearing loans and borrowings are subsequently measured at amortised cost using the effective interest rate method. Amortised cost is calculated by taking into account any issue costs, and any discount or premium on settlement.
Gains and losses are recognised in profit or loss when the liabilities are derecognised, as well as through the amortisation process.
Page 116
Assore integrated annual report 2016

9 FINANCIAL INSTRUMENTS (continued)9.2 Derivative financial instruments and hedging In the event that the group uses derivative financial instruments, such as forward currency contracts, to hedge its risks associated
with foreign currency fluctuations, such derivative financial instruments are initially recognised at fair value on the date on which a derivative contract is entered into and are subsequently remeasured at fair value. Derivative financial instruments are carried as assets when the fair value is positive and as liabilities when the fair value is negative.
The group does not apply hedge accounting and any gains or losses arising from changes in fair value on derivatives are recognised directly in the income statement.
The fair value of forward currency contracts is calculated by reference to current forward exchange rates for contracts with similar maturity profiles.
9.3 Derecognition of financial assets and liabilities Financial assets A financial asset is derecognised when the right to receive cash flows from the asset has expired or the group has transferred its
rights to receive cash and either has transferred substantially all the risks and rewards of the asset, or has neither transferred nor retained substantially all the risks and rewards of the asset, but has transferred control of the asset. On derecognition of a financial asset, the difference between the proceeds received or receivable and the carrying amount of the asset is included in the income statement.
Financial liabilities A financial liability is derecognised when the obligation under the liability is discharged or cancelled or expired. On derecognition of
a financial liability, the difference between the carrying amount of the liability extinguished or transferred to another party and the amount paid is included in the income statement. When an existing financial liability is replaced by another from the same lender on substantially different terms, or the terms of an existing liability are substantially modified, such an exchange or modification is treated as a derecognition of the original liability and the recognition of a new liability.
9.4 Offsetting of financial instruments Financial assets and financial liabilities are offset and the net amount reported in the consolidated statement of financial position if,
and only if, there is a currently enforceable legal right to offset the recognised amounts and there is an intention to settle on a net basis, or to realise the assets and settle the liabilities simultaneously.
9.5 Impairment of financial assets The group assesses at each statement of financial position date whether a financial asset or group of financial assets is impaired,
which is determined on the following bases:
Assets carried at amortised cost If there is objective evidence that an impairment loss has been incurred in respect of a financial asset, the amount of the loss is
measured as the difference between the asset’s carrying amount and the present value of estimated future cash flows (excluding future credit losses that have not been incurred) discounted at the financial asset’s original effective interest rate (ie the effective interest rate computed at initial recognition). The carrying amount of the asset is reduced and the amount of the loss is recognised in the income statement.
The group first assesses whether objective evidence of impairment exists individually for financial assets that are individually significant, and individually or collectively for financial assets that are not individually significant. If it is determined that no objective evidence of impairment exists for an individually assessed financial asset, whether significant or not, the asset is included in a group of financial assets with similar credit risk characteristics and that group of financial assets is collectively assessed for impairment. Assets that are individually assessed for impairment and for which an impairment loss is, or continues to be, recognised, are not included in a collective assessment of impairment.
If, in a subsequent period, the amount of the impairment loss decreases and the decrease can be related objectively to an event occurring after the impairment was recognised, the previously recognised impairment loss is reversed through other comprehensive income.
Available-for-sale investments Decreases, which in the opinion of management, are significant and prolonged, in the fair value of available-for-sale investments,
which are below their original cost are recorded in the income statement. Management’s opinion of decreases that are significant and prolonged is dependent on the relative materiality of these fluctuations in relation to the market values of these investments. Impairments recorded against available-for-sale equity instruments in the income statement are not reversed, but rather subsequent increases in fair value are recorded in other comprehensive income.
Page 117
Assore integrated annual report 2016
Overview Strategy and risk Reviews and reports Financial statements

Accounting policies continued
10 INVENTORIES Inventories are valued at the lower of cost and estimated net realisable value with due allowance being made for obsolescence
and slow-moving items. The cost of inventories, which is determined on a weighted average cost basis, comprises all costs of purchase, costs of conversion and other costs incurred in bringing the inventories to their present location and condition.
Net realisable value is the estimated selling price in the ordinary course of business, less estimated costs of completion and the estimated costs necessary to make the sale.
11 FOREIGN CURRENCY TRANSLATION The consolidated financial statements are presented in South African currency (rand), which is the group’s functional and
presentation currency. Transactions in other currencies are dealt with as follows:
11.1 Foreign currency balances Transactions in foreign currencies are converted to South African currency at the spot rate at the date of transactions first qualifies
for recognition. Monetary assets and liabilities denominated in a foreign currency at the end of the financial year are translated to South African currency at the functional currency spot rates of exchange at the reporting date. Non-monetary items carried at fair value that are denominated in foreign currencies are translated using functional currency spot rates on the date when the fair value was determined.
Foreign exchange gains or losses arising from foreign exchange transactions, whether realised or unrealised, are included in the
determination of profit or loss. Exchange differences arising on the translation of non-monetary items carried at fair value are included in the income statement for the year. However, where fair value adjustments of non-monetary items are recognised in other comprehensive income, exchange differences arising on the translation of these non-monetary items are also recognised in other comprehensive income.
11.2 Foreign entities The assets and liabilities of subsidiaries with a different functional currency are translated at the rate of exchange ruling at the
statement of financial position date. The income statements of these subsidiaries are translated at weighted average exchange rates for the year. The exchange differences arising on the retranslation are recognised in other comprehensive income. On disposal of a foreign entity, accumulated exchange differences are reclassified in the income statement as a component of the gain or loss on disposal. Goodwill and fair value adjustments arising on the acquisition of a foreign entity after 1 January 2005 are treated as assets and liabilities of the acquired entity and are recorded at the exchange rate at the date of the transaction and are remeasured at the closing rate at each reporting date.
12 ENVIRONMENTAL REHABILITATION EXPENDITURE The estimated cost of final rehabilitation, comprising the liability for decommissioning of assets and restoration, is based on current
legal requirements and existing technology and is reassessed annually and disclosed as follows:
12.1 Decommissioning costs The present value of estimated future decommissioning obligations at the end of the operating life of a mine is included in
long-term provisions. The related decommissioning asset is recognised in property, plant and equipment when the decommissioning provision gives access to future economic benefits. The unwinding of the obligation is included in the income statement as finance costs.
The estimated cost of decommissioning obligations is reviewed annually and adjusted for legal, technological and environmental circumstances that affect the present value of the obligation for decommissioning. The related decommissioning asset is amortised using the lesser of the related asset’s estimated useful life or units-of-production method based on estimated Proven and Probable Ore Reserves.
12.2 Restoration costs The estimated cost of restoration at the end of the operating life of a mine is included in long-term provisions and is charged to the
income statement based on the units of production mined during the current year, as a proportion of the estimated total units which will be produced over the life of the mine. Cost estimates are not reduced by the potential proceeds from the sale of assets.
12.3 Ongoing rehabilitation costs Expenditure on ongoing rehabilitation is charged to the income statement as incurred.
Any subsequent changes to assumptions in estimating an obligation are added or deducted from the asset to which it relates. Reductions over and above the remaining carrying value of the asset are recognised in the income statement.
13 TREASURY SHARES Own equity instruments acquired are regarded as treasury shares and are accounted for as a reduction in equity. No gain or loss
is recognised in the income statement on the purchase, sale, issue or cancellation of treasury shares, as these transactions are recognised directly in equity.
Page 118
Assore integrated annual report 2016

14 TAXATION14.1 Current taxation Tax assets and liabilities for the current and prior periods are measured at the amount expected to be recovered from or paid
to the taxation authorities. The tax rates and tax laws used to compute the amount are those that are enacted or substantively enacted at the statement of financial position date. Income tax relating to items recognised directly in other comprehensive income is recognised in the statement of other comprehensive income and not in the income statement.
14.2 Deferred taxation Deferred tax is provided, using the balance sheet liability method, on all temporary differences at the date of the statement of
financial position, between the tax bases of assets and liabilities and their carrying amounts for financial reporting purposes.
Deferred tax liabilities are recognised for all taxable temporary differences except: – where the deferred tax liability arises from the initial recognition of goodwill or the initial recognition of an asset or liability in a transaction that is not a business combination and, at the time of the transaction, affects neither the accounting profit nor taxable profit or loss; and
– in respect of taxable temporary differences associated with investments in subsidiaries and interests in joint ventures, where the timing of the reversal of the temporary differences can be controlled and it is probable that the temporary differences will not reverse in the foreseeable future.
Deferred tax assets are recognised for all deductible temporary differences, and unused tax assets and unused tax losses carried forward to the extent that it is probable that taxable profit will be available against which the deductible temporary differences and the unused tax assets and unused tax losses carried forward can be utilised except: – where the deferred tax asset relating to the deductible temporary difference arises from the initial recognition of an asset or liability in a transaction that is not a business combination and, at the time of the transaction, affects neither the accounting profit nor taxable profit or loss; and
– in respect of deductible temporary differences associated with investments in subsidiaries and interests in joint ventures, deferred tax assets are only recognised to the extent that it is probable that the temporary differences will reverse in the foreseeable future and taxable profit will be available against which the temporary differences can be utilised.
The carrying amount of deferred tax assets is reviewed at each statement of financial position date and reduced to the extent that it is no longer probable that sufficient taxable profit will be available to allow all or part of the deferred tax asset to be utilised.
Deferred tax assets and liabilities are measured at the tax rates that are expected to apply to the year when the asset is realised or the liability is settled, based on tax rates (and tax laws) that have been enacted or substantively enacted at the statement of financial position date.
Income tax relating to items recognised directly in other comprehensive income is recognised in the statement of other comprehensive income and not in the income statement.
Deferred tax assets and deferred tax liabilities are offset if a legally enforceable right exists to set off current tax assets against current tax liabilities and the deferred taxes relate to the same taxable entity and the same taxation authority.
14.3 Value added taxation (VAT) Revenues, expenses and assets are recognised net of the amount of VAT except:
– where the VAT incurred on a purchase of goods and services is not recoverable from the taxation authority, in which case the VAT is recognised as part of the cost of acquisition of the asset or as part of the expense item as applicable; and
– where receivables and payables are stated with the amount of VAT included.
The net amount of VAT recoverable from, or payable to, the taxation authority is included as part of receivables or payables in the statement of financial position.
Page 119
Assore integrated annual report 2016
Overview Strategy and risk Reviews and reports Financial statements

Accounting policies continued
14 TAXATION (continued)14.4 Mining royalty taxation Provision for mining royalties is made with reference to the condition specified as contained in the Mining and Petroleum
Resources Royalty Act, for the transfer of refined and unrefined mined resources, upon the date such transfer is effected. These costs are included in other expenses.
14.5 Dividend withholding tax On 1 April 2012, STC was replaced with a dividend withholding tax. Dividend withholding tax is payable at a rate of 15% on
dividends distributed to shareholders. Dividends paid to companies, certain other institutions and certain individuals are not subject to this withholding tax. This tax is not attributable to the company paying the dividend but is collected by the company and paid to the tax authorities on behalf of the shareholder.
On receipt of a dividend, the company includes the dividend withholding tax on this dividend in its computation of the income tax expense in the period of such receipt.
15 PROVISIONS Provisions are recognised when:
– a present legal or constructive obligation exists as a result of past events where it is probable that a transfer of economic benefits will be required to settle the obligation; and
– a reasonable estimate of the obligation can be made.
A present obligation is considered to exist when it is probable that an outflow of economic benefits will occur. The amount recognised as a provision is the best estimate at the statement of financial position date of the expenditure required to settle the obligation. Only expenditure related to the purpose for which the provision was raised is charged to the provision. If the effect of the time value of money is material, provisions are determined by discounting the expected future cash flows at a pre-tax rate that reflects current market assessments of the time value of money and, where appropriate, the risks specific to the liability. Where discounting is used, the increase in the provision due to the passage of time is recognised as finance costs.
16 REVENUE Revenue is recognised to the extent that it is probable that the economic benefits will flow to the group and the revenue can be
reliably measured. The following specific recognition criteria must also be met before revenue is recognised:
Sale of mining and beneficiated products Sale of mining and beneficiated products represents the free on board (FOB) or cost, insurance and freight (CIF) sales value of ores
and alloys exported and the free on rail (FOR) sales value of ores and alloys sold locally. Sales of mining and beneficiated products are recognised when the significant risks and rewards of ownership of the goods have passed to the buyer.
Technical fees and commissions on sales Revenue from technical fees and commissions on sales is recognised on the date when the risk passes in the underlying
transaction.
Interest received Interest received is recognised using the effective interest rate method, ie the rate that exactly discounts estimated future cash
receipts through the expected life of the financial instrument to the net carrying amount of the financial asset.
Dividends received Dividends received are recognised when the shareholders’ right to receive the payment is established.
Rental income Rental income arising on investment properties is accounted for on a straight-line basis over the lease term of ongoing leases.
17 SHARE-BASED PAYMENT TRANSACTIONS Certain employees of the group are granted share appreciation rights, which are settled in cash (cash-settled transactions).
The cost of cash-settled transactions is measured initially at fair value at the grant date using a binomial model. The fair value is expensed over the period until the vesting date with the recognition of a corresponding liability. The liability is remeasured to fair value at each reporting date up to and including the settlement date, with changes in fair value recognised in employee benefits expense.
Page 120
Assore integrated annual report 2016

18 POST-EMPLOYMENT BENEFITS Retirement benefit plans operated by the group are of both the defined benefit and defined contribution types. The cost of
providing benefits under defined benefit plans is determined using the projected unit credit actuarial valuation method. Actuarial gains and losses are recognised through other comprehensive income in the period in which they occur. Remeasurements are not reclassified to profit or loss in subsequent periods.
Past-service costs are recognised in the income statement on the earlier of: – the date of the plan amendment or curtailment; or – the date that the group recognises restructuring-related costs.
The net interest cost is calculated by applying the discount rate to the net defined benefit liability or asset. The group recognises the following changes in the net defined benefit obligation in the income statements: – Service costs comprising current service costs, past service costs, gains and losses on curtailments and non-routine settlements.
– Net interest cost.
The defined benefit asset or liability comprises the present value of the defined benefit obligation less the fair value of plan assets out of which the obligations are to be settled. The value of any defined benefit asset recognised is limited to the present value of any economic benefits available in the form of refunds from the plan or reductions in the future contributions to the plan.
The rate at which contributions are made to defined contribution funds is fixed and is recognised as an expense when employees have rendered services in exchange for those contributions. No liabilities are raised in respect of the defined contribution fund, as there is no legal or constructive obligation to pay further contributions should the fund not hold sufficient assets to pay all employee benefits relating to employee service in the current and prior periods.
Contributions to all defined contribution funds are expensed in profit and loss when incurred.
19 CONTINGENT LIABILITIES A contingent liability is a possible obligation that arises from past events, the existence of which will be confirmed only by the
occurrence or non-occurrence of one or more uncertain future events not wholly within the control of the group, or a present obligation that arises from past events but is not recognised because it is not probable that an outflow of resources embodying economic benefits will be required to settle the obligation, or the amount of the obligation cannot be measured with sufficient reliability. Contingent liabilities are not recognised as liabilities in the statement of financial position but disclosed in the notes to the financial statements.
20 DEFINITIONS Earnings and headline earnings per share The calculation of earnings per share is based on net income after taxation and after adjusting for non-controlling interests divided
by the weighted number of shares outstanding during the period.
Headline earnings comprise earnings for the year, adjusted for profits and losses on items of a capital nature. Headline earnings have been calculated in accordance with Circular 2/2013 issued by the South African Institute of Chartered Accountants. Adjustments against earnings are made after taking into account attributable taxation and non-controlling interests. The adjusted earnings figure is divided by the weighted average number of shares in issue to arrive at headline earnings per share.
Cash resources The cash resources disclosed in the cash flow statement comprise cash on hand, deposits held on call with banks and highly liquid
investments that are readily convertible to known amounts of cash and are subject to insignificant changes in value. Bank overdrafts have been separately disclosed in the statement of financial position.
Cost of sales All costs directly related to the production of products are included in cost of sales. Costs that cannot be directly linked are
included separately or under other operating expenses. When inventories are sold, the carrying amount is recognised in cost of sales.
Dividends per share Dividends declared during the year divided by the weighted number of ordinary shares in issue.
Cash restricted for use Cash which is subject to restrictions on its use is stated separately at the carrying value in the notes.
Page 121
Assore integrated annual report 2016
Overview Strategy and risk Reviews and reports Financial statements

Notice of Annual General Meeting
Notice is hereby given to the shareholders of Assore Limited (Assore or the company) recorded in the securities register of the company
on 14 October 2016 (being the record date for receiving this notice as determined by the board of directors of Assore (the board)), that the
sixty-sixth Annual General Meeting (AGM) of the shareholders of Assore will be held at Assore House, 15 Fricker Road, Illovo Boulevard,
Johannesburg, on Friday, 25 November 2016 at 10:30, during which meeting the following business will be transacted:
1 To present the audited annual financial statements of Assore and its group for the financial year ended 30 June 2016.
2 To re-elect the following independent non-executive directors who retire by rotation in accordance with the provisions of the
company’s Memorandum of Incorporation (MoI), both of whom are eligible and offer themselves for re-election to the board:
2.1 Ms TN Mgoduso; and
2.2 Mr S Mhlarhi.
A short curriculum vitae of each of the directors concerned is included on page 126.
3 To re-elect Messrs EM Southey, S Mhlarhi and WF Urmson (all being independent non-executive directors), to constitute the Audit
and Risk Committee.
A short curriculum vitae of each of the directors concerned is included on page 27.
4 To consider and, if deemed fit, to pass with or without modification the ordinary and special resolutions set out below.
5 To transact any other business that may be transacted at an annual general meeting of the company.
MEETING RECORD DATE
In accordance with section 59(1) of the Companies Act, No 71 of 2008, as amended (Companies Act), the board has determined that
the record date for the purposes of establishing which shareholders are entitled to participate in and vote at the AGM will be
18 November 2016.
PRESENTATION OF ANNUAL FINANCIAL STATEMENTS
The audited annual financial statements of Assore and its group (as approved by the board), including the directors’ report, the
independent auditor’s report, the Audit and Risk Committee’s report and the Social and Ethics Committee’s report for the financial year
ended 30 June 2016, have been distributed to shareholders as required by section 30(3)(d) of the Companies Act.
The annual financial statements referred to above are set out on pages 48 to 121 of the company’s integrated annual report and are also
available electronically at www.assore.com.
Page 122
Assore integrated annual report 2016

AUTOMATIC REAPPOINTMENT OF THE COMPANY’S AUDITOR
In accordance with the provisions of section 90(6) of the Companies Act, Ernst & Young Inc. shall automatically be reappointed at the AGM
as the auditor of Assore for the forthcoming financial year.
Note: The company’s Audit and Risk Committee has determined that Ernst & Young Inc. continues to be independent of the company, as
required in terms of section 90(2)(c) of the Companies Act.
REPORT OF THE SOCIAL AND ETHICS COMMITTEE
In accordance with Regulation 43(5)(c) of the Companies Regulations, 2011 issued in terms of section 223 of the Companies Act, the
Chairman of the Social and Ethics Committee will table the report of the Social and Ethics Committee as set out on page 36 of the
integrated annual report at the AGM.
ORDINARY RESOLUTIONS
The ordinary resolutions set out below are required to be passed by a simple majority of ordinary shareholders, representing more than
50% of the exercisable voting rights, present in person or by proxy and voting at the AGM. Where resolutions involve the election of
directors, a short curriculum vitae of the director concerned is included on page 126.
Ordinary resolution number 1 (re-election of Ms TN Mgoduso as a director)
RESOLVED THAT Ms TN Mgoduso, who retires by rotation in terms of the MoI and who is eligible and available for re-election, is re-elected
as a director of Assore.
Ordinary resolution number 2 (re-election of Mr S Mhlarhi as a director)
RESOLVED THAT Mr S Mhlarhi, who retires by rotation in terms of the MoI and who is eligible and available for re-election, is re-elected
as a director of Assore.
Ordinary resolution number 3 (election of Audit and Risk Committee)
RESOLVED THAT, in terms of section 94(2) of the Companies Act, Messrs EM Southey, S Mhlarhi* and WF Urmson are re-elected to
constitute the Audit and Risk Committee.
* The reappointment of Mr S Mhlarhi to the Audit and Risk Committee is subject to ordinary resolution number 2 being approved.
Page 123
Assore integrated annual report 2016
Overview Strategy and risk Reviews and reports Financial statements

Notice of Annual General Meeting continued
ADVISORY ENDORSEMENT OF THE REMUNERATION POLICY
To endorse, through a non-binding advisory vote, the company’s remuneration policy and the implementation plan in respect thereof
(excluding the fees paid to the non-executive directors for their services), as set out on page 19 of the integrated annual report.
In terms of the King Code on Corporate Governance in South Africa, an advisory vote should be obtained annually from the shareholders
with regard to the company’s annual remuneration policy. The vote allows shareholders to express their views on the remuneration policy
adopted and the implementation thereof, but will not be binding on the company.
SPECIAL RESOLUTIONS
The following special resolutions are required to be passed by ordinary shareholders holding at least 75% of the exercisable voting rights,
present in person or by proxy and voting at the AGM.
Special resolution number 1 (directors’ remuneration)
RESOLVED THAT, in terms of section 66(9) of the Companies Act, the annual remuneration payable to non-executive directors for their
services as directors be increased, with effect from 1 January 2017, as follows:
Deputy Chairman and lead independent non-executive director R550 000Non-executive directors (excluding Deputy Chairman) R300 000Members of each of the Audit and Risk Committee, Remuneration Committee or Social and Ethics Committee (unchanged from previous year) R100 000
Special resolution number 2
RESOLVED THAT, in terms of section 66(9) of the Companies Act, the annual remuneration payable to an executive director for services
as a director remain at R60 000 per annum.
Special resolution number 3 (general authority to provide financial assistance)
RESOLVED THAT, the board may, subject to compliance with the requirements of the MoI, the Companies Act and the Listings
Requirements of the JSE Limited, each as presently constituted and as amended from time to time, authorise the company to provide
direct or indirect financial assistance (as such term is defined in the Companies Act) to any present or future subsidiary or inter-related
companies of Assore as contemplated in section 45 of the Companies Act.
Special resolution number 4 (amendment to the MoI in compliance with paragraph 18(1)(o) of Schedule 18 to the Listings
Requirements of the JSE Limited)
RESOLVED THAT the MoI be amended by the insertion of the following as a new clause 3.7:
“3.7 Fractional entitlements
If, as a result of a corporate action, fractions of shares become attributable to shareholders, all allocations of shares will be rounded down
to the nearest whole number and a cash payment will be made to the shareholder in respect of the fraction. The variable weighted
average traded price for the last day to trade (LDT) + 1 less 10% shall be used as the cash value. The company will release an
announcement on LDT + 2 in respect of the cash value so determined.”
Page 124
Assore integrated annual report 2016
VOTING
Only Assore shareholders registered in the company’s securities register on 18 November 2016 will be entitled to attend the AGM and to
vote on the resolutions set out above. On a show of hands, every ordinary shareholder who is present in person or represented by proxy
at the AGM, will have 1 (one) vote (irrespective of the number of ordinary shares held by such shareholder), and, on a poll, every ordinary
shareholder will have 1 (one) vote for every ordinary share held or represented by such shareholder. Whether voting takes place by a show
of hands
or on a poll will be at the discretion of the Chairman.
PROXIES AND IDENTIFICATION
Shareholders holding certificated shares and shareholders who have dematerialised their shares and have elected “own name”
registration in the sub-register maintained by their Central Securities Depository Participant (CSDP), may attend, speak and vote at the
AGM or may appoint one or more natural persons to act as proxies (who need not be shareholders of the company) to attend, speak and
vote on behalf of such shareholder at the AGM. A form of proxy is attached to this notice of AGM. Duly completed forms of proxy must be
detached and lodged with or posted to either the transfer secretaries of Assore (being Singular Systems Proprietary Limited, 28 Fort Street,
Birnam, Johannesburg, 2196 (PO Box 785261, Sandton, 2146)) or the registered office of Assore, Assore House, 15 Fricker Road, Illovo
Boulevard, Johannesburg, 2196 (Private Bag X03, Northlands, 2116). Shareholders are requested to submit their proxies to be received by
no later than 10:30 on Wednesday, 23 November 2016.
The appointment of a proxy will not preclude the shareholder who appointed that proxy from attending the AGM and participating and
voting in person thereat, to the exclusion of any such proxy.
Shareholders who have dematerialised their shares through a CSDP or broker and who have not elected “own name” registration in the
sub-register maintained by a CSDP and who wish to attend the AGM, should instruct their CSDP or broker to issue them with the
necessary authority or letter of representation to attend. If such shareholders do not wish to attend the AGM but wish to be represented
thereat, they may provide their CSDP or broker with their voting instructions in terms of the custody agreement entered into between such
shareholders and their CSDP or broker.
Kindly note that, in terms of section 63(1) of the Companies Act, all meeting participants (including proxies) are required to provide
acceptable identification before being entitled to attend or participate at the AGM. Forms of identification considered acceptable include
original valid identity documents, driver’s licences or passports.
By order of the boardAfrican Mining and Trust Company Limited
Secretaries
Johannesburg
26 October 2016
Page 125
Assore integrated annual report 2016
Overview Strategy and risk Reviews and reports Financial statements

Notice of Annual General Meeting continued
Curricula vitae of directors retiring in terms of the MoI and available for re-election and of independent non-executive
directors recommended for re-election as members of the Audit and Risk Committee
TN Mgoduso
Independent non-executive director
BA, MA (Clinical Psychology)
Thandeka is a clinical psychologist and obtained her qualifications at the universities of Fort Hare and the Witwatersrand. While in
commerce, she held various leadership positions in operations, as well as in human resources, including a non-executive directorship of
the South African Reserve Bank, and currently consults in strategy and human resources. She chairs her company, Jojose Investments, and
is a non-executive director on the board of Tongaat Hulett. She was appointed to the board with effect from 2 February 2015 and serves on
the Social and Ethics Committee.
S Mhlarhi
Independent non-executive director
BCom, BAcc, CA(SA)
Sydney qualified as a chartered accountant in 1998 following the completion of his articles at Ernst & Young in 1997. He co-founded Tamela
Holdings Proprietary Limited (Tamela) in 2008, which holds investments in various industries. Sydney has held various senior positions in
the investment banking sector, including those of divisional director at Standard Bank and Chief Investment Officer of Makalani Holdings
Limited, a mezzanine financier which listed on the JSE in 2005. Sydney was appointed to the board on 15 October 2012 and serves on the
group’s Audit and Risk Committee.
EM Southey
Deputy Chairman and lead independent non-executive director
BA, LLB
Ed was admitted as an attorney, notary and conveyancer in 1967 and practiced as a partner of Webber Wentzel until his retirement as
senior partner of that firm in 2006. He remains an executive consultant to the firm. He is a former president of the Law Society of the
Northern Province and of the Law Society of South Africa and is a director of a number of companies. He joined the Assore board as a
non-executive director in January 2009, and was appointed as Deputy Chairman and lead independent director in November 2010.
He is the Chairman of the group’s Audit and Risk and Remuneration Committees.
WF Urmson
Independent non-executive director
CA(SA)
Bill was appointed as an independent non-executive director in October 2010 and chairs the group’s Social and Ethics Committee. He also
serves on the group’s Audit and Risk and Remuneration Committees. He is a former Deputy Chairman of Ernst & Young and has served
the accounting profession as Chairman of the Accounting Practices and Ethics committees of the South African Institute of Chartered
Accountants. He is a former Director: Surveillance of the JSE and consulted to the exchange on a part-time basis until December 2013.
Page 126
Assore integrated annual report 2016

Form of proxy
Assore Limited(Incorporated in the Republic of South Africa)(Registration number: 1950/037394/06)Share code: ASR ISIN: ZAE000146932(Assore or the company)
For use only by shareholders holding certificated shares and shareholders who have dematerialised their shares and have elected “own name” registration in the sub-register maintained by the Central Securities Depository Participant (CSDP), attending the Annual General Meeting (AGM) of Assore ordinary shareholders to be held at 10:30, on Friday, 25 November 2016 at the registered office of Assore, located at Assore House, 15 Fricker Road, Illovo Boulevard, Johannesburg.
Shareholders who have dematerialised their shares through a CSDP or broker and have not elected “own name” registration in the sub-register maintained by the CSDP must not complete this form of proxy, but should instruct their CSDP or broker to issue them with the necessary letter of representation to attend the AGM or, if they do not wish to attend the AGM, but wish to be represented thereat, they may provide their CSDP or broker with their voting instructions in terms of the custody agreement entered into between such ordinary shareholders and their CSDP or broker.
Form of proxy for the AGM of Assore ordinary shareholders (refer notes on completion attached)
I/We
(Names in block letters)
of
(Address)
being the holder/s of ordinary shares
in the company, hereby appoint/s (see note 1)
1.
of or failing him/her
2.
of or failing him/her
3. the Chairman of Assore, or failing him, the Chairman of the AGM as my/our proxy to vote for me/us on my/our behalf at the AGM of Assore to be held at Assore House, 15 Fricker Road, Illovo Boulevard, Johannesburg on Friday, 25 November 2016 at 10:30 or at any adjournment thereof.
I/We desire to vote as follows (see note 2 below):
For Against AbstainOrdinary resolution number 1 Re-election of Ms TN Mgoduso as a director of the companyOrdinary resolution number 2 Re-election of Mr S Mhlarhi as a director of the companyOrdinary resolution number 3 Re-election of Messrs EM Southey, S Mhlarhi and WF Urmson to constitute the Audit and Risk Committee of the companyAdvisory endorsement of the remuneration policy Advisory endorsement of the remuneration policySpecial resolution number 1 Approval of non-executive directors’ remunerationSpecial resolution number 2 Approval of executive directors’ remunerationSpecial resolution number 3 General authorisation to Assore directors to provide financial assistance to subsidiary and inter-related companies of AssoreSpecial resolution number 4 Amendment to Assore’s Memorandum of Incorporation in compliance with paragraph 18(1)(o) of Schedule 18 to the Listings Requirements of the JSE Limited
Unless otherwise instructed, my/our proxy may vote or abstain from voting as he/she thinks fit.
Signed at on 2016
Signature
Assisted by me (where applicable)Please see notes overleaf
Page 127
Assore integrated annual report 2016
Overview Strategy and risk Reviews and reports Financial statements

Notes to the form of proxy
1. A shareholder is entitled to appoint one or more proxies (none of whom need be a shareholder of the company) to attend, speak and vote in the place of that shareholder at the AGM. A shareholder may therefore insert the name of a proxy or the names of two alternative proxies of the shareholder’s choice in the space provided, with or without deleting “the Chairman of Assore, or failing him, the Chairman of the AGM”. The person whose name stands first on the form of proxy and who is present at the AGM will be entitled to act as proxy to the exclusion of those whose names follow.
2. A shareholder’s instructions to the proxy must be indicated by the insertion of an “X” in the appropriate box alongside the resolution concerned. Failure to comply with the above will be deemed to authorise the Chairman of the AGM, if he is the authorised proxy, to vote in favour of the resolutions at the AGM, or any other proxy to vote or abstain from voting at the AGM as he/she deems fit, in respect of the shareholder’s total holding.
3. The completion and lodging of this form of proxy will not preclude the relevant shareholder from attending the AGM and speaking and voting in person thereat to the exclusion of any proxy appointed in terms hereof, should such shareholder wish to do so.
4. Every shareholder present in person or by proxy and entitled to vote shall, on a show of hands, have only one vote and, upon a poll, every shareholder shall have one vote for every ordinary share held.
5. In the case of joint holders, the vote of the senior joint holder who tenders a vote, whether in person or by proxy, will be accepted to the exclusion of the votes of the other joint holders for which purpose seniority will be determined by the order in which the names stand in the register of shareholders in respect of joint holding(s).
6. Documentary evidence establishing the authority of the person signing this form of proxy in a representative capacity (eg for a company, close corporation, trust, pension fund, deceased estate, etc) must be attached to this form of proxy unless previously recorded by the transfer secretaries of Assore or waived by the Chairman of the AGM.
7. The Chairman of the AGM may accept or reject any form of proxy not completed and/or received in accordance with these notes or with the Memorandum of Incorporation of Assore.
8. Completed forms of proxy and the authority under which they are signed (if any) must be lodged with or posted to either Assore’s registered office, Assore House, 15 Fricker Road, Illovo Boulevard, Johannesburg, 2196 (Private Bag X03, Northlands, 2116) or its transfer secretaries being Singular Systems Proprietary Limited, 28 Fort Street, Birnam, Johannesburg, 2196 (PO Box 785261, Sandton, 2146). Shareholders are requested to submit their proxy forms to be received by no later than 10:30 on Wednesday, 23 November 2016.
Page 128
Assore integrated annual report 2016

Corporate information
EXECUTIVE DIRECTORSDesmond Sacco (Chairman)#
CJ Cory (Chief Executive Officer)PE Sacco (Group Marketing Director)BH van Aswegen (Group Operations and Growth Director)o
NON-EXECUTIVE DIRECTORSEM Southey (Deputy Chairman and lead independent director)†*#
TN Mgoduso†o
S Mhlarhi†*WF Urmson†*o#
# Member of the Remuneration Committeeo Member of the Social and Ethics Committee† Independent* Member of the Audit and Risk Committee
SECRETARY AND REGISTERED OFFICEAfrican Mining and Trust Company LimitedAssore House15 Fricker RoadIllovo BoulevardJohannesburg, 2196
Postal addressPrivate Bag X03Northlands, 2116Email: [email protected]
TRANSFER SECRETARIES AND SHARE TRANSFER OFFICEComputershare InvestorServices Proprietary Limited#
70 Marshall StreetJohannesburg, 2001
# With effect until 31 October 2016
Singular SystemsProprietary Limitedo
28 Fort StreetBirnamJohannesburg, 2001
o With effect from 1 November 2016
BASTION GRAPHICS
AUDITORSErnst & Young Inc.102 Rivonia RoadSandtonJohannesburg, 2196
ATTORNEYSWebber Wentzel90 Rivonia RoadSandtonJohannesburg, 2196
Norton Rose Fullbright15 Alice LaneSandton, 2196
BANKERSThe Standard Bank of South Africa Limited30 Baker StreetRosebank, Johannesburg, 2196
CORPORATE INFORMATIONAssore LimitedIncorporated in the Republic of South AfricaCompany registration number: 1950/037394/06Share code: ASRISIN: ZAE000146932
Overview Strategy and risk Reviews and reports Financial statements

Assore House, 15 Fricker Road, Illovo Boulevard, Johannesburg, 2196
www.assore.com
AS
SO
RE
INT
EG
RA
TE
D A
NN
UA
L R
EP
OR
T 2
01
6