2016 institutional profile - rcgc.edu · 2016 annual institutional profile preface sponsored by the...
TRANSCRIPT

2016 Annual Institutional Profile
2016 Institutional Profile
1400 Tanyard Road, Sewell, NJ 08080
RCGC.edu

2016 Annual Institutional Profile

2016 Annual Institutional Profile
Preface Sponsored by the residents of Gloucester County through the Board of Chosen Freeholders, Rowan
College at Gloucester County is a comprehensive, co-educational, two-year institution of higher education. Rowan College at Gloucester County (RCGC) seeks to assist each person in developing a career, while also enhancing humanistic values and encouraging personal enrichment. The College is dedicated to its community and accepts the responsibility of providing post-secondary educational opportunities to those that seek them.
RCGC is an excellent place to discover your passion or to concentrate on a straightforward academic plan. New programs, outstanding faculty and innovative, cost-saving options like Rowan Choice and the 3+1 Program with Rowan University, make RCGC a popular starting point. As the premier partner of a highly-respected research university, programs easily align for transfer towards a Rowan University bachelor’s degree while considerably reducing the cost of tuition during the first two years of study. The option to attend Rowan University, or to take advantage of agreements with our other academic partners and transfer to your school of choice, makes this community college a valuable resource for all students.
Thanks to the New Jersey Higher Education Bond and the Gloucester County Board of Chosen Freeholders, $24 million in capital investment construction upgrades have dramatically enriched the landscape of RCGC. Projects include the newly constructed, state-of-the-art Nursing and Allied Health Center and Adult Center for Transition (ACT), a building renovation to create the Business and Corporate Center, as well as additions to the Student Services building and the Law and Justice Education Center. The college community is also looking forward to breaking ground for a new 18,500 square-foot facility, which will house RCGC and Rowan University degree initiatives.
With increasing program selections, a premier partnership with Rowan University, affordable tuition, numerous transfer routes and a rapidly expanding campus, RCGC has created a different and unique model for community colleges. The 2016 Institutional Profile Report highlights many of our fiscal year 2016 statistics on enrollment and student outcomes. The report also serves to recognize the many accomplishments, successes and contributions to our community. RCGC provides this report annually to the New Jersey Office of the Secretary of Higher Education, as well as to our public communities with the hope that this information will be educational and valuable.
_______________________________________
Frederick Keating, Ed.D.
President, Rowan College at Gloucester County
i

2016 Annual Institutional Profile
N.J.S.A. 18A:3B-35 requires that each of New Jersey’s 31 public institutions of higher education prepare and make available to the public an annual report on the condition of the institution. The form and content of the annual report is established by New Jersey Higher Education.
All information supplied in the Institutional Profile Report submitted by Rowan College at Gloucester County is accurate and complete. Rowan College at Gloucester County reserves the right to change, add or delete information contained in this document.
For additional information related to the material contained in this report, please contact:
Karen A. Durkin, M.A. Dean, Institutional Research Rowan College at Gloucester County 1400 Tanyard Road Sewell, NJ 08080 Email: [email protected] Phone: 856-415-2284

2016 Annual Institutional Profile
PART I. TABLE OF CONTENTS Preface i
Mission, Core Values and Strategic Goals ii
Executive Summary iii
PART II. DATA BY CATEGORY
Institutional Accreditation Status 1
Number of Students Served 2
By Attendance Status 3
Noncredit Students Served 5
Customized Training 6
Total Enrollment for Academic Year 7
Characteristics of Undergraduate Students
Remediation Enrollment 8
Student Demographics 9
By Race/Ethnicity 9
By Gender 9
By Age 10
State and County Residency 11
Federally– and State–Funded Financial Assistance 12
Student Outcomes
Graduation Rates 13
Graduation and Transfer-Out Rates (Combined) 14
Third-Semester (Fall-to-Fall) Retention Rates 15
Faculty Characteristics
Full-Time Faculty by Race/Ethnicity, Gender, Academic Rank and Tenure Status 17
Percentage of Course Sections Taught by Full-Time Faculty 18
Ratio of Full-Time to Part-Time Faculty 18
Characteristics of Board of Trustees
Race/Ethnicity and Gender 19
List of Trustees with Titles and Affiliations 19
Profile of the Institution
Degree and Certificate Programs 20
Fall Enrollment Trends by Program Division 21
Degrees and Certificates Awarded by Program Division 24
Financials 26
Major Capital Projects Underway in Fiscal Year 2016 27
PART III. OTHER INSTITUTIONAL DATA
Athletic Program Recognitions and Awards 28
APPENDIX. DATA NOTES 29

2016 Annual Institutional Profile
Mission
Rowan College at Gloucester County is a center for learning that strives for academic excellence, supports the economic development of the community and seeks to enhance the community’s quality of life through affordable, accessible programs and services in a safe and caring environment.
Core Values
Rowan College at Gloucester County respects the diversity of its student body and recognizes the worth and potential of each student. Therefore, the College affirms the following values:
Commitment to Students. Belief in the priority of providing the highest levels of learning, resources and support services to enhance the intellectual, personal growth and professional development of students.
Commitment to Excellence in Education. Belief in providing educational programs and student support services that combine academic rigor, up-to-date information, incorporation of the most effective strategies and close assessment of learning outcomes to achieve excellence in learning.
Contribution to Community. Recognition of the importance of enhancing the economic vitality and quality of life for all citizens of the community.
Commitment to Access and Diversity. Belief that the College will actively seek to create the highest levels of access to programs and services for all students who may benefit and that the College’s employees and students represent diversity of the community.
Quality Campus Environment. Recognition of the importance of providing a work and learning environment that is characterized by integrity, clear communications, open exchange of ideas, involvement in decision making and respect for individuals.
Strategic Goals 2014-2019
Institutional Stewardship. Sustain and enhance Rowan College at Gloucester County as a premier educational option for each individual seeking entrance to higher education.
Academics/Assessment and Benchmarks. Create an educational environment that promotes and fosters student success from initial contact to achievement of desired educational goals.
Student Services/Partnerships. Create an enrollment management model to guide students to enter, complete and achieve their educational and career goals.
Operations/Infrastructure and Physical Plant. Provide a safe and secure, environmentally –friendly atmosphere to support student success designed with a sustainability model.
ii

2016 Annual Institutional Profile
Executive Summary
The 2016 Annual Institutional Profile reflects data submitted in mandated state and federal reports during the 2015-2016 academic year. Highlights include:
Fall enrollment in 2015 totaled 6,836 student enrolled in 72,002 credit hours. Enrollment trends mirrored the sector-wide decline of 4 percent between 2014 and 2015. Long-term trends show a steady incline in enrollment since 2000.
Continuing Education Noncredit enrollment accounted for 7,984 registrations in fiscal year 2015. Approximately three-quarters (71.9 percent) of registrations were dedicated to career courses; 89.0 percent of registrations target the general adult population.
Customized Training served 24 business clients in fiscal year 2015 with 11,872 registrations representing a total full-time equivalent of 115 students.
Annual credit enrollment for academic year 2015 totaled 9,830 students and 159,582 credit hours for a full-time equivalent of 5,319 students (unaudited).
Remediation enrollment for incoming full-time freshman was 43.2 percent. The highest remediation enrollment area among freshman was Reading (26.4 percent), followed by Computation (16.7 percent) and Algebra (10.3 percent).
Student demographic profile reflects a 26.1 percent minority student population; 79.0 percent of students are under 25 years of age. Fifty-six percent of the study body is female; 44.0 percent are male. The majority of students are New Jersey residents; three-quarters (74.8 percent) reside in Gloucester County.
Financial Aid awards totaled $19.6m in academic year 2014-15, with 89.3 percent in federal aid programs, 10.1 percent in state aid programs and 0.6 percent in institutional aid programs.
Student outcomes of the 1,632 first-time, full-time degree seeking students entering Rowan College in fall 2012, 41.0 percent graduated or transferred on to another institution of higher learning within three-years. The combined rate the 3-year graduation rate of 22.7 percent and a 18.3 percent transfer out-rate. The two-year graduation rate is 12.3 percent
Fall-to-Fall retention rate for all first-time students was 59.7 percent; the retention rate of full-time students was 62.9 percent, compared to the part-time rate of 46.8 percent.
Full-time faculty represent 25.2 percent of the total faculty; of those, 67.1 percent are tenured. The ratio of full-time to adjunct faculty is 1:3; 42.0 percent of credit classes are taught by full-time faculty.
Degrees and Certificates awarded totaled 1,159 in academic year 2015-16.
RCGC’s Athletic Program received numerous recognitions and awards, including the program’s eleventh consecutive Collegiate Athletics Administrator’s of New Jersey Cup Award for the most outstanding overall two-year college athletic program.
iii

2016 Annual Institutional Profile
Institutional accreditation
Rowan College at Gloucester County is licensed by the State of New Jersey. It is accredited by the Middle States Association of Colleges and Schools Commission on Higher Education. Initially accredited in 1973, accreditation was reaffirmed in 1977, 1987, 1998 and 2008. The next accreditation self-study is scheduled for 2017-2018.
The College is a member of the New Jersey Association of Colleges and Universities and the American Association of Community Colleges.
The following academic programs are individually accredited:
Program Accrediting Agency Automotive Technology National Automotive Technicians Education Foundation Diagnostic Medical Commission on Accreditation of Allied Health Educational Sonography Programs (CAAHEP), in collaboration with Joint Review
Committee on Education and Diagnostic Medical Sonography (JRC-DMS)
Nuclear Medicine Joint Review Committee on Educational Programs in Nuclear
Technology Medicine Technology New Jersey Department of Environmental Protection Agency Bureau
of X-Ray Compliance Commission on Accreditation of Allied Health Educational Programs
(CAAHEP) Nursing Accreditation Commission for Education in Nursing, Inc. (ACEN)
New Jersey Board of Nursing Paralegal American Bar Association—ABA Standing Committee on
Legal Assistants Respiratory Therapy Committee on Accreditation for Respiratory Care (CoARC)
1

2016 Annual Institutional Profile
2
Long-Term Fall Enrollment Trends: 1968 to 2015 (Selected Y ears)
1968 1975 1980 1985 1990 1995 2000 2005 2010 2015
634 2,553 3,068 3,394 4,373 5,047 4,659 6,022 6,609 6,836
Source: IPEDS Fall Enrollment Survey, Census Day Enrollment Files
Number of students served
RCGC enrolled 6,836 students in fall 2015. Long-term enrollment trends illustrate the College’s steady enrollment growth. The first fall enrollment record in 1968 reported 634 students enrolled. RCGC has had record breaking enrollments since 2005. (Figure 1)
Figure 1

2016 Annual Institutional Profile
3
Fall Enrollment by Attendance Status (2011-2015)
2011 2012 2013 2014 2015 1YR
Change 4YR
Change
Total Students 6,829 6,762 6,720 7,130 6,836 -4.1% +0.1%
– Full-Time 3,995 3,943 4,030 4,009 3,807 -5.0% -4.7%
– Part-Time 2,834 2,819 2,690 3,121 3,029 -2.9% +6.9%
Percent Distribution
– Full-Time 58.5% 58.3% 60.0% 56.2% 55.7%
– Part-Time 41.5% 41.7% 40.0% 43.8% 44.3%
Required Table II-B.1 | Source: IPEDS Fall Enrollment Survey
Number of students served
Of the 6,836 students enrolled in fall 2015, full-time students (enrolled in twelve or more credit hours) account for more than half of the student body (55.7 percent). Part-time students increased 6.9 percent over the past four years with 44.3 percent of the fall student body enrolled part-time. This increase is attributed to the inclusion of high school dual enrollment students in census day enrollment totals. (Figure 2)
Figure 2
3,9
95
3,9
43
4,0
30
4,0
09
3,8
07
2,8
34
2,8
19
2,6
90 3,1
21
3,0
29
0
1,000
2,000
3,000
4,000
5,000
2 0 1 1 2 0 1 2 2 0 1 3 2 0 1 4 2 0 1 5
Fal l En r ol l me n t by At t e n dan c e S t atu s , 2 0 1 1 - 20 15
Full-Time Part-Time

2016 Annual Institutional Profile
Fall Enrollment by Student Type and Attendance Status: 2011-2015
Fall 2011 Fall 2012 Fall 2013 Fall 2014 Fall 2015
All Students Total 6,829 6,762 6,720 7,130 6,836
- Full-Time 3,995 3,943 4,030 4,009 3,807
- Part-Time 2,834 2,819 2,690 3,121 3,029
First-Time, New Total 2,428 2,399 2,217 2,644 2,397
- Full-Time 1,670 1,637 1,593 1,837 1,775
- Part-Time 758 762 624 807 622
Continuing Total 3,693 3,681 4,031 3,640 3,763
- Full-Time 1,991 1,982 2,234 1,963 1,956
- Part-Time 1,702 1,699 1,797 1,677 1,807
Transfer Total 647 538 308 310 53
- Full-Time 316 273 131 153 16
- Part-Time 331 265 177 157 37
Returning Total 61 144 164 107 33
- Full-Time 18 51 72 49 5
- Part-Time 43 93 92 58 28
Special Total - - - 429 590
- Full-Time 7 55
- Part-Time 422 535
Source: NJ SURE Fall Enrollment [See Data Note 1]
4
Number of students served
On average, approximately one-third of the fall student body are new, first-time RCGC students. In fall 2015, 35.1 percent were first-time (new) students, of those 74.1 percent enrolled full-time. Continuing students represent more than half of the total enrollment in fall 2015 (55 percent). Special students, defined as high school students enrolled in credit courses, accounted for 8.6 percent of enrollment; less than 1 percent were classified as transfer or returning students.
2016 Annual Institutional Profile
Noncredit Enrollment Fiscal Years 2011 to 2015
Total Registrations
Unduplicated Headcount
Total Clock Hours
Full-Time Equivalent
FY2015 7,984 5,528 273,413 608
FY2014 8,211 6,029 352,217 783
FY2013 7,400 6,570 225,811 502
FY2012 7,511 5,788 240,793 535
FY2011 9,646 7,403 560,781 1,246
Required Table II-B.3 | Source: Non-credit Open Enrollment File [See Data Note 2]
Noncredit Enrollment by Course Content and Target Audience Fiscal Year 2015
Total Registrations
Total Clock Hours
Full-Time Equivalent
Number Percent Number Percent Number Percent
All Courses 7,984 100.0% 273,413 100.0% 608 100.0%
By Course Content
– Avocational 2,246 28.1% 13,371 4.9% 30 4.9%
– Career 5,738 71.9% 260,042 95.1% 578 95.1%
By Target Audience
– General Adult 7,103 89.0% 269,997 98.8% 600 98.7%
– Senior Citizen 881 11.0% 3,416 1.2% 8 1.3%
Source: Noncredit Open Enrollment File [See Data Note 2]
5
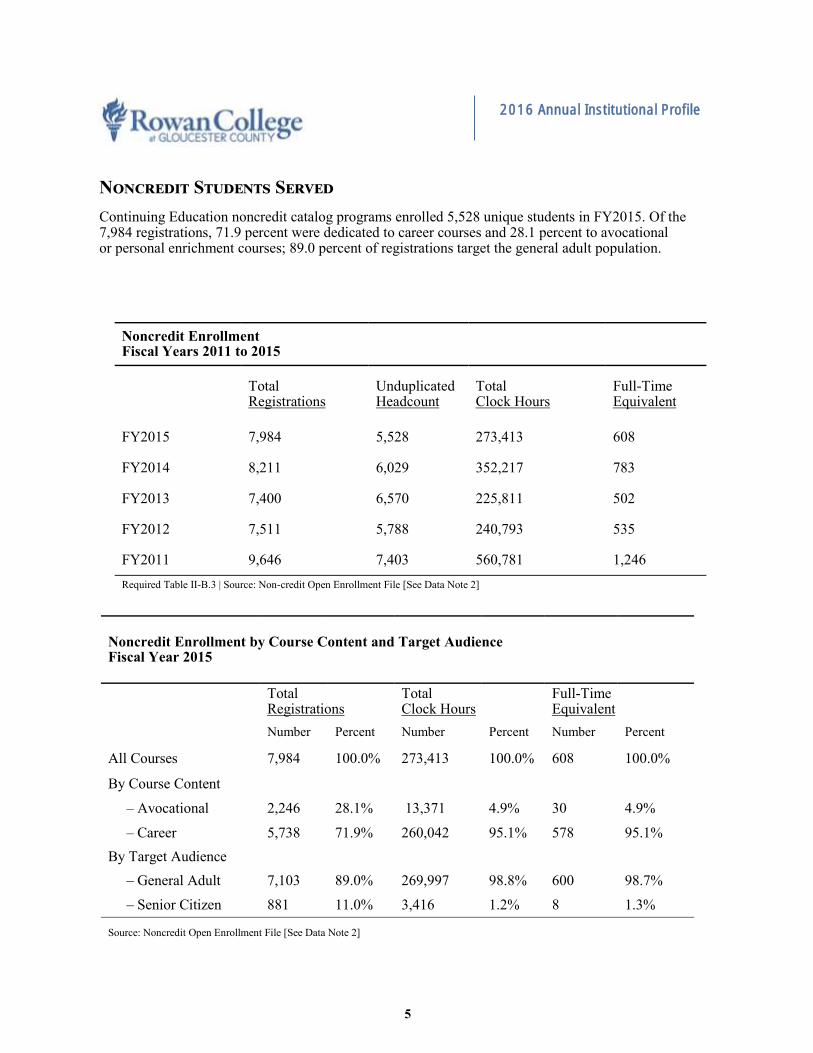
Noncredit Students Served
Continuing Education noncredit catalog programs enrolled 5,528 unique students in FY2015. Of the 7,984 registrations, 71.9 percent were dedicated to career courses and 28.1 percent to avocational or personal enrichment courses; 89.0 percent of registrations target the general adult population.

2016 Annual Institutional Profile
6
Customized Training Enrollment Fiscal Years 2011 to 2015
Total Registrations
Total Clock Hours
Clock Hours/ Registration
Full-Time Equivalent
Course Sections Offered
Registrations/Course Sections
FY2015 11,872 51,859 4 115 981 12
FY2014 7,104 35,961 5 80 434 16
FY2013 10,049 36,731 4 82 768 13
FY2012 8,419 25,887 3 58 593 14
FY2011 13,285 43,535 3 97 730 18
Required Table II.B.3 | Source: NJ IPEDS Form #31, Customized Training
Customized Training, Businesses Served Fiscal Years 2011 to 2015
Number of Business Clients
FTE per Company
FY2015 24 5.0
FY2014 17 5.0
FY2013 13 6.0
FY2012 14 4.0
FY2011 27 4.0
Source: NJ IPEDS Form #31, Customized Training
Customized Training
Continuing Education Customized Training served 24 business clients in fiscal year 2015, with 11,872 registrations representing a total full-time equivalent (FTE) of 115 students.

2016 Annual Institutional Profile
7
Unduplicated Enrollment for Academic (Fiscal) Year Fiscal Years 2011 to 2015
Total Enrollment
Credit Hours
Full-Time Equivalent
FY2015 9,830 159,582 5,319
FY2014 9,914 159,246 5,308
FY2013 10,953 164,699 5,490
FY2012 10,782 160,451 5,348
FY2011 10,152 157,093 5,236
Required Table II.B.4 | Source: IPEDS 12-Month Enrollment Survey [See Data Note 3]
academic year enrollment
Enrollment for academic (fiscal) year 2015 totaled 9,830 students and 159,582 credit hours for a full-time equivalent of 5,319 students (unaudited).
2016 Annual Institutional Profile
8
Enrollment in Remediation Courses Fall 2015
Total Number Students
Number Enrolled in One or More Remedial Course
Percent Enrolled in Remedial Course
All Students 6,836 1,478 21.6%
First-Time, Full-Time 1,770 764 43.2%
By Subject Area
- Writing - -
- Reading 467 26.4%
- Computation 296 16.7%
- Algebra 183 10.3%
Required Table II.C.2 | Source: SURE Fall Enrollment File
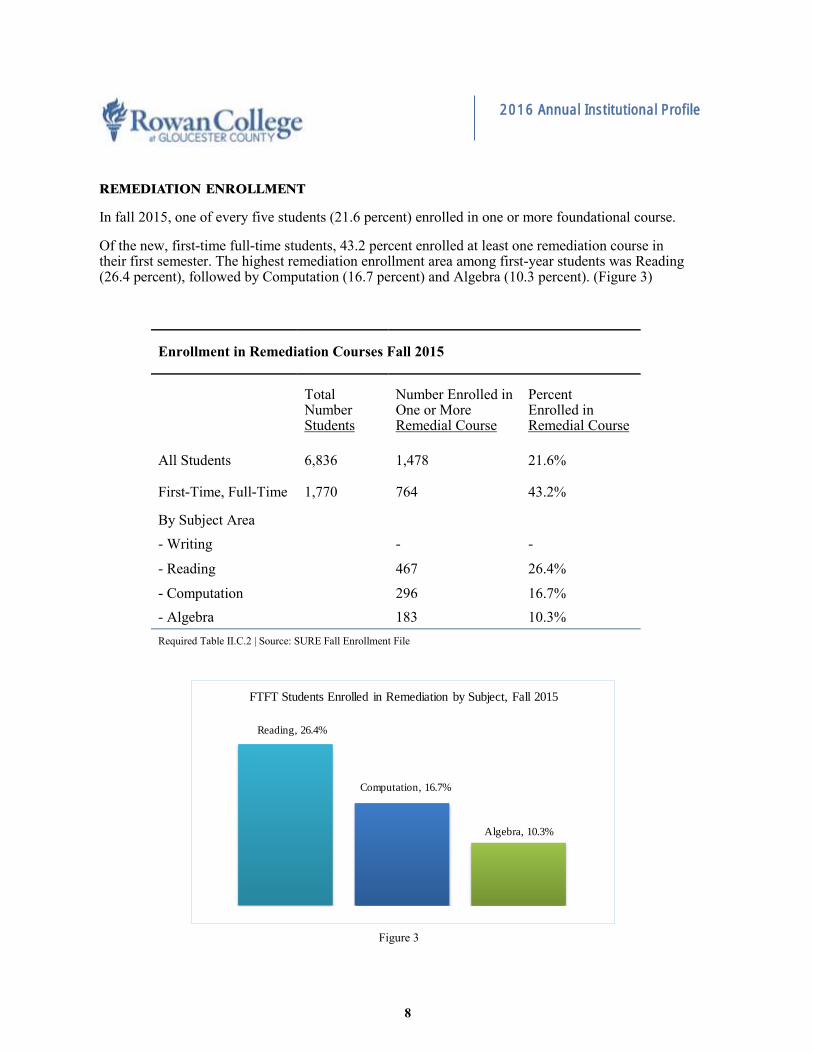
remediation enrollment
In fall 2015, one of every five students (21.6 percent) enrolled in one or more foundational course.
Of the new, first-time full-time students, 43.2 percent enrolled at least one remediation course in their first semester. The highest remediation enrollment area among first-year students was Reading (26.4 percent), followed by Computation (16.7 percent) and Algebra (10.3 percent). (Figure 3)
Figure 3
Reading, 26.4%
Computation, 16.7%
Algebra, 10.3%
FTFT Students Enrolled in Remediation by Subject, Fall 2015

2016 Annual Institutional Profile
Enrollment by Race/Ethnicity and Attendance Status Fall 2015
All Students
Full-Time Students
Part-Time Students
Number Percent Number Percent Number Percent
Total 6,836 3,807 3,029
by Race/Ethnicity
– White 4,720 73.9% 2,629 73.6% 2,091 74.4%
– Black 779 12.2% 407 11.4% 372 13.2%
– Hispanic 459 7.2% 301 8.4% 158 5.6%
– Asian 162 2.5% 73 2.0% 89 3.2%
– American Indian 23 0.4% 16 0.4% 7 0.3%
– Native Hawaiian 15 0.2% 9 0.3% 6 0.2%
– Two or More Races 226 3.5% 138 3.9% 88 3.1%
Subtotal Known Race/Ethnicity 6,384 100% 3,573 100% 2,811 100%
Nonresident Alien 25 17 8
Unknown Race/Ethnicity 427 217 210
Required Table II-C.3.a | Source: IPEDS Fall Enrollment Survey [See Data Note 4]
Enrollment by Gender and Attendance Status Fall 2015
All Students
Full-Time Students
Part-Time Students
Number Percent Number Percent Number Percent
Total 6,836 3,807 3,029
by Gender
– Female 3,827 56.0% 2,012 52.9% 1,815 59.9%
– Male 3,009 44.0% 1,795 47.1% 1,214 40.1%
Required Table II-C.3.b | Source: IPEDS Fall Enrollment Survey
9
Student demographics
RCGC student body reflects a 26.1 percent minority student population. More than half of the student body is female (56.0 percent). A higher proportion of male students enrolled full-time compared to female students; of the 3,827 female students enrolled, 52.6 percent enrolled full-time. Of the 3,009 male students enrolled, 59.7 percent enrolled full-time.

2016 Annual Institutional Profile
10
Enrollment by Age and Attendance Status Fall 2015
All Students Full-Time Students Part-Time Students
N Pct. Cum. Pct.
N Pct. Cum. Pct.
N Pct. Cum. Pct.
Total Enrollment 6,836 3,807 3,029
Age Category
– Under 18 510 7.5% 7.5% 48 1.3% 1.3% 462 15.3% 15.3%
– 18 to 19 2,443 35.7% 43.2% 2,024 53.2% 54.5% 419 13.8% 29.1%
– 20 to 21 1,603 23.5% 66.7% 1,054 27.7% 82.2% 549 18.1% 47.2%
– 22 to 24 844 12.3% 79.0% 316 8.3% 90.5% 528 17.4% 64.6%
– 25 to 29 613 9.0% 88.0% 197 5.2% 95.7% 416 13.7% 78.3%
– 30 to 34 312 4.6% 92.6% 77 2.0% 97.7% 235 7.8% 86.1%
– 35 to 39 166 2.4% 95.0% 31 0.8% 98.5% 135 4.5% 90.6%
– 40 to 49 222 3.2% 98.2% 43 1.1% 99.6% 179 5.9% 96.5%
– 50 to 64 105 1.5% 99.7% 14 0.4% 99.9% 91 3.0% 99.5%
– 65 and Over 15 0.2% 99.9% 1 <0.1% 99.9% 14 0.5% 99.9%
Not Reported 3 <0.1% 100.% 2 0.1% 100.0% 1 <0.1% 100.0%
Required Table II-C.3.c | Source: IPEDS Fall Enrollment Survey
Student demographics
Over three-quarters (79.0 percent) of RCGC’s student body is traditional age (under 25 years of age). The proportion of traditional age students is higher among full-time students (90.5 percent) versus part-time students (64.6 percent). The average age of the RCGC student is 23.
2016 Annual Institutional Profile
11
Fall 2015 Enrollment by Student Residency
All Students
First-Time, Full-Time Students
N Pct. N Pct.
Total Enrollment 6,836 2,326
New Jersey Resident 6,799 99.5% 2,312 99.4%
Gloucester County Resident 5,112 74.8% 1,539 66.2%
Other NJ County Resident 1,687 24.7% 773 33.2%
Out-of-State Resident 27 0.4% 9 0.4%
Residency Unknown 10 0.1% 5 0.2%
Required Table II-C.5 | Sources: IPEDS Fall Enrollment Survey, Part C; RCGC Census Day Enrollment File
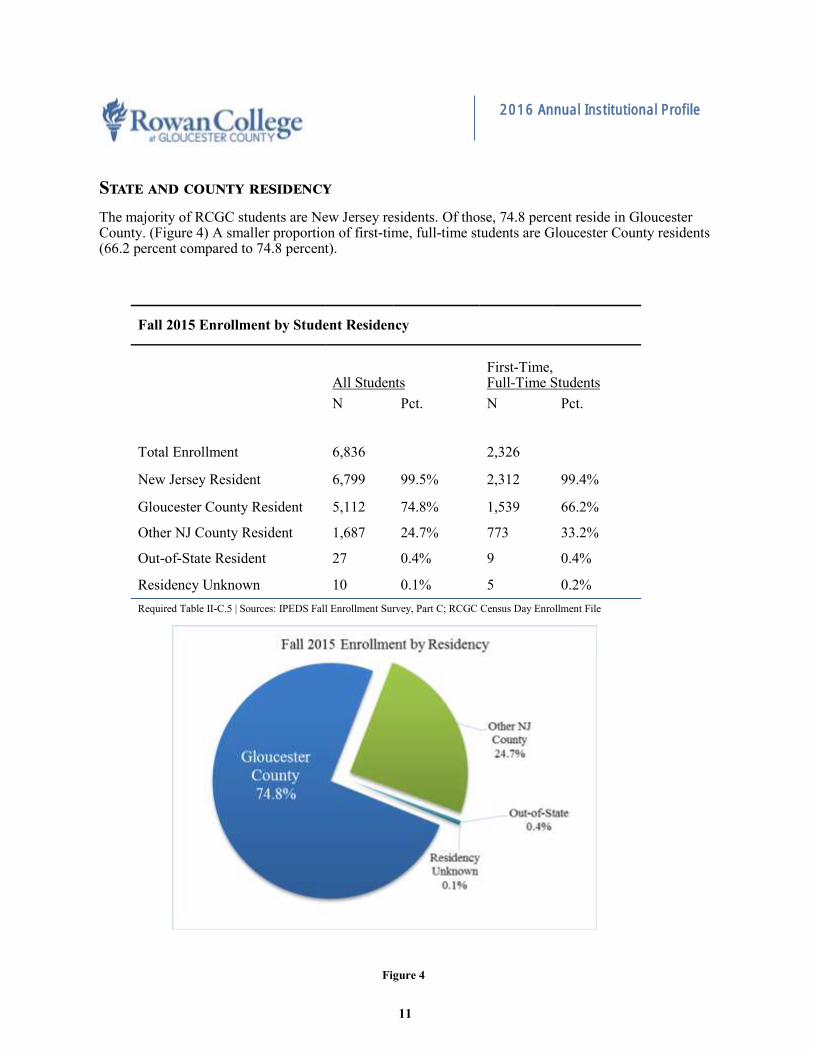
State and county residency
The majority of RCGC students are New Jersey residents. Of those, 74.8 percent reside in Gloucester County. (Figure 4) A smaller proportion of first-time, full-time students are Gloucester County residents (66.2 percent compared to 74.8 percent).
Figure 4
2016 Annual Institutional Profile
12
Number of Students Receiving Financial Assistance by Aid Program Academic Year 2014–2015
Recipients Dollars ($) $/Recipient
Federal Programs
Pell Grants 3,083 9,860,000 3,198.18
College Work Study 38 34,000 894.74
Perkins Loans 0 0 –
SEOG 163 99,000 607.36
PLUS Loans 20 84,000 4,200.00
Stafford Loans (Subsidized) 1,261 3,222,000 2,555.11
Stafford Loans (Unsubsidized) 1,481 4,228,000 2,854.83
SMART & ACG or other 0 0 –
State-Funded Programs
Tuition Aid Grants (TAG) 1,146 1,444,000 1,260.03
Education Opportunity Fund (EOF) 180 166,000 922.22
Other State Programs 0 0 –
Bloustein Distinguished Scholars 0 0 –
Urban Scholars 0 0 –
NJ STARS 156 352,000 2,256.41
NJCLASS Loans 10 27,000 2,700.00
Institutional Programs
Grants/Scholarships 87 113,000 1,298.85
Loans 0 0 –
Required Table II-C.4 | Source: NJIPEDS Form #41 Student Financial Aid Report ; IPEDS Student Financial Aid (SFA) Survey
Financial Aid
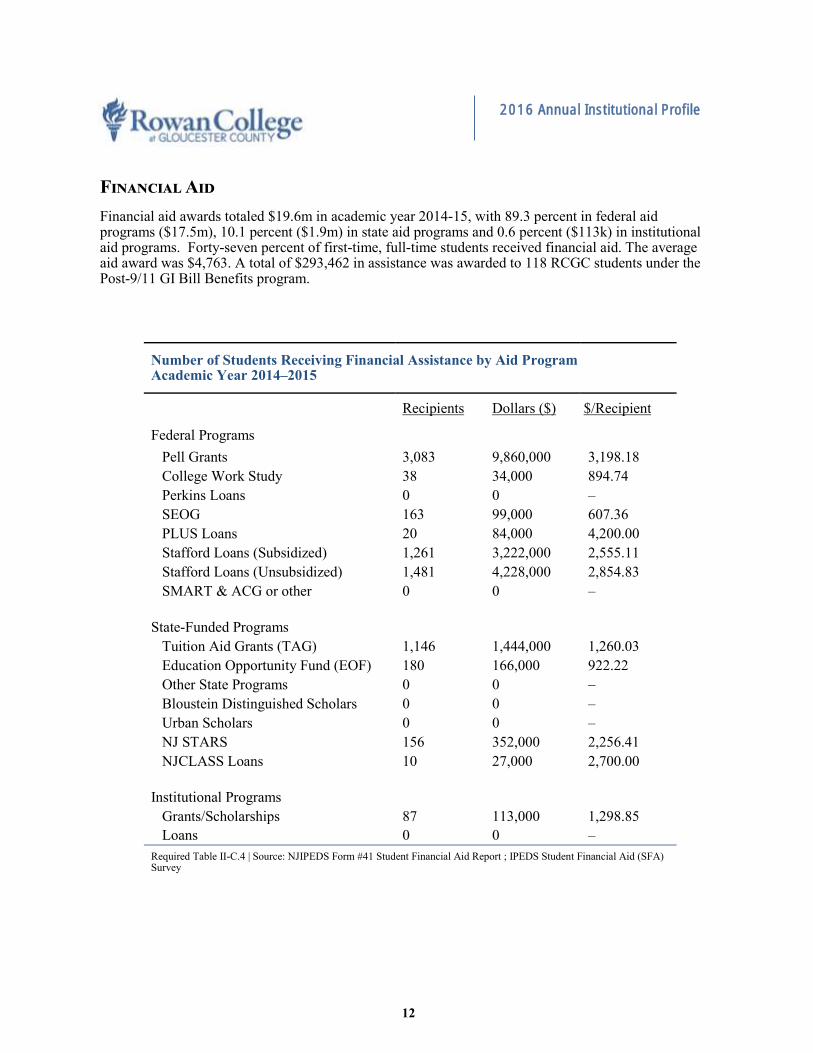
Financial aid awards totaled $19.6m in academic year 2014-15, with 89.3 percent in federal aid programs ($17.5m), 10.1 percent ($1.9m) in state aid programs and 0.6 percent ($113k) in institutional aid programs. Forty-seven percent of first-time, full-time students received financial aid. The average aid award was $4,763. A total of $293,462 in assistance was awarded to 118 RCGC students under the Post-9/11 GI Bill Benefits program.
2016 Annual Institutional Profile
13
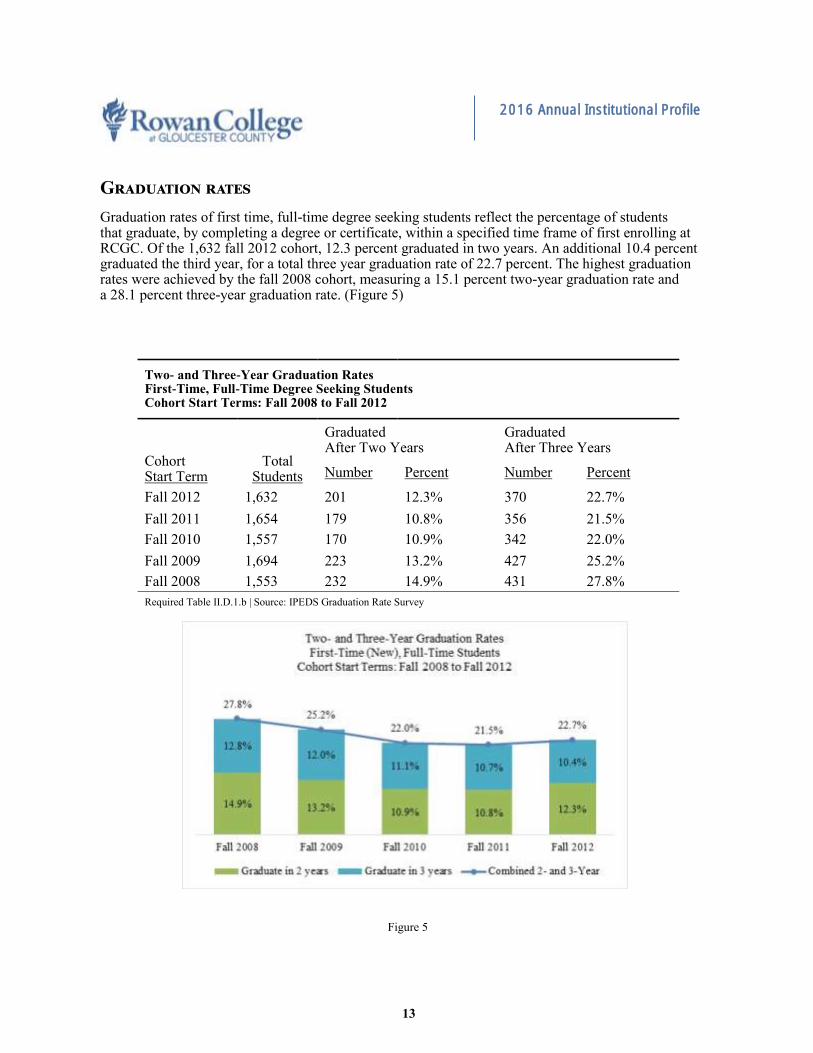
Two- and Three-Year Graduation Rates First-Time, Full-Time Degree Seeking Students Cohort Start Terms: Fall 2008 to Fall 2012
Cohort Start Term
Graduated After Two Years
Graduated After Three Years
Total Students Number Percent Number Percent
Fall 2012 1,632 201 12.3% 370 22.7%
Fall 2011 1,654 179 10.8% 356 21.5%
Fall 2010 1,557 170 10.9% 342 22.0%
Fall 2009 1,694 223 13.2% 427 25.2%
Fall 2008 1,553 232 14.9% 431 27.8%
Required Table II.D.1.b | Source: IPEDS Graduation Rate Survey
Graduation rates
Graduation rates of first time, full-time degree seeking students reflect the percentage of students that graduate, by completing a degree or certificate, within a specified time frame of first enrolling at RCGC. Of the 1,632 fall 2012 cohort, 12.3 percent graduated in two years. An additional 10.4 percent graduated the third year, for a total three year graduation rate of 22.7 percent. The highest graduation rates were achieved by the fall 2008 cohort, measuring a 15.1 percent two-year graduation rate and a 28.1 percent three-year graduation rate. (Figure 5)
Figure 5

2016 Annual Institutional Profile
14
Three-Year Graduation and Transfer-Out Rates First-Time, Full-Time Degree Seeking Students Cohorts Fall 2008 to Fall 2012
Cohort Start Term
Total Students
Graduate After 3-Years
Transfer-Out After 3-Years
Combined Graduate/Transfer-Out
Number Percent Number Percent Number Percent
Fall 2012 1,632 370 22.7% 299 18.3% 669 41.0%
Fall 2011 1,654 359 21.7% 369 22.3% 728 44.0%
Fall 2010 1,557 342 22.0% 315 20.2% 657 42.2%
Fall 2009 1,694 429 25.3% 316 18.7% 745 44.0%
Fall 2008 1,533 431 28.1% 303 19.8% 734 47.9%
Required Table II.D.1.2 | Source: IPEDS Graduation Survey
Three-Year Graduation and Transfer-Out Rates First-Time, Full-Time Degree Seeking Students By Race/Ethnicity Fall 2012 Cohort
Total Students
Graduate After 3-Years
Transfer-Out After 3-Years
Combined Graduate/Transfer-Out
Number Percent Number Percent Number Percent
Fall 2012 Cohort 1,632 370 22.7% 299 18.3% 669 41.0%
By Race/Ethnicity
– White 1,131 297 26.3% 207 18.3% 504 44.6%
– Black 226 26 11.5% 35 15.5% 61 27.0%
– Hispanic 89 16 18.0% 14 15.7% 30 33.7%
– Asian 24 6 25.0% 6 25.0% 12 50.0%
– Nonresident Alien 19 6 31.6% 9 47.4% 15 79.0%
– Other 143 19 13.3% 28 19.6% 47 32.9%
Required Table II.D.1.2 | Source: IPEDS Graduation Survey
Graduation and transfer-out rates
Combined graduation and transfer-out rates reflect the percentage of students that either graduate or transfer to another college or university within three years of first enrolling at RCGC. The combined graduation and transfer-out rate for the fall 2012 cohort was 41 percent with 22.7 percent graduating and 18.3 percent transferring out before earning an award from RCGC.

2016 Annual Institutional Profile
15
Third Semester Retention Rates of First-Time Students by Attendance Status Fall 2010-2011 to Fall 2014-2015
All First-Time Students First-Time, Full-Time First-Time, Part-Time
Total
Total Retained
Pct. Retained Total
Total Retained
Pct. Retained Total
Total Retained
Pct. Retained
Fall 2014 to Fall 2015 2,238 1,337 59.7% 1,804 1,134 62.9% 434 203 46.8%
Fall 2013 to Fall 2014 1,918 1,196 62.4% 1,579 1,040 65.9% 339 156 46.0%
Fall 2012 to Fall 2013 2,101 1,238 58.9% 1,632 1,040 63.7% 469 198 42.2%
Fall 2011 to Fall 2012 2,104 1,205 57.3% 1,654 1,019 61.6% 450 186 41.3%
Fall 2010 to Fall 2011 1,892 1,095 57.9% 1,557 962 61.8% 335 133 39.7%
Required Table II.D.2. | Source: IPEDS Fall Enrollment Survey, Part E
Retention rates
Third semester (fall-to-fall) retention rates of first-time students have remained relatively stable over the last five years. In fall 2015, the retention rate of all first-time students was 59.7 percent compared to 57.9 percent in fall 2011. Retention rates of part-time students is the most improved; increasing to 46.8 percent in 2015 from 39.7 percent in 2011. (Figure 6)
Figure 6
2016 Annual Institutional Profile
16
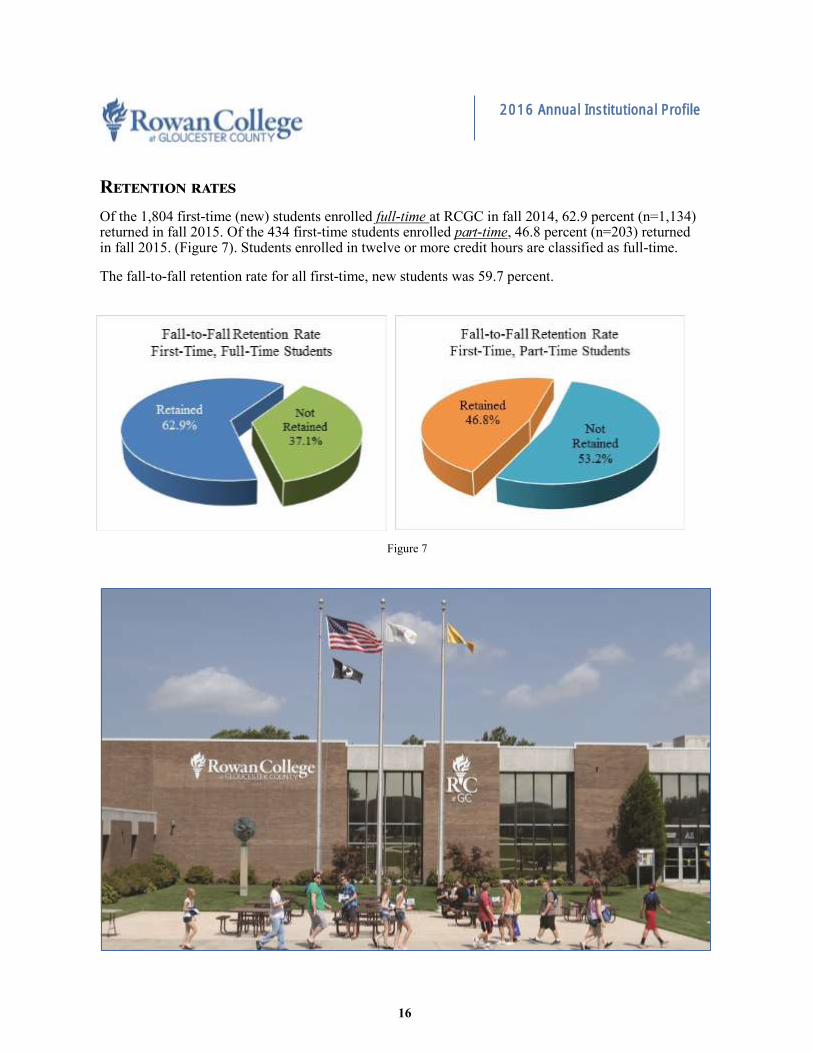
Retention rates
Of the 1,804 first-time (new) students enrolled full-time at RCGC in fall 2014, 62.9 percent (n=1,134) returned in fall 2015. Of the 434 first-time students enrolled part-time, 46.8 percent (n=203) returned in fall 2015. (Figure 7). Students enrolled in twelve or more credit hours are classified as full-time.
The fall-to-fall retention rate for all first-time, new students was 59.7 percent.
Figure 7
2016 Annual Institutional Profile
17
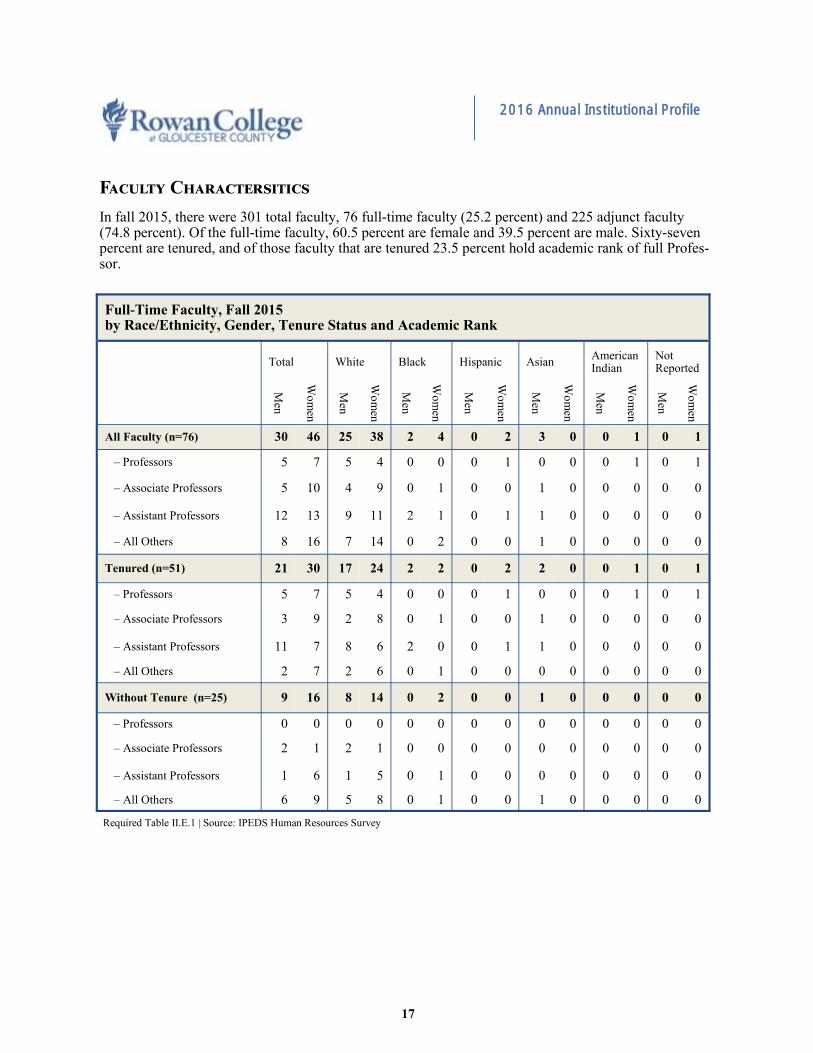
Full-Time Faculty, Fall 2015 by Race/Ethnicity, Gender, Tenure Status and Academic Rank
Total White Black Hispanic Asian American Indian
Not Reported
Men
Wo
men
Men
Wo
men
Men
Wo
men
Men
Wo
men
Men
Wo
men
Men
Wo
men
Men
Wo
men
All Faculty (n=76) 30 46 25 38 2 4 0 2 3 0 0 1 0 1
– Professors 5 7 5 4 0 0 0 1 0 0 0 1 0 1
– Associate Professors 5 10 4 9 0 1 0 0 1 0 0 0 0 0
– Assistant Professors 12 13 9 11 2 1 0 1 1 0 0 0 0 0
– All Others 8 16 7 14 0 2 0 0 1 0 0 0 0 0
Tenured (n=51) 21 30 17 24 2 2 0 2 2 0 0 1 0 1
– Professors 5 7 5 4 0 0 0 1 0 0 0 1 0 1
– Associate Professors 3 9 2 8 0 1 0 0 1 0 0 0 0 0
– Assistant Professors 11 7 8 6 2 0 0 1 1 0 0 0 0 0
– All Others 2 7 2 6 0 1 0 0 0 0 0 0 0 0
Without Tenure (n=25) 9 16 8 14 0 2 0 0 1 0 0 0 0 0
– Professors 0 0 0 0 0 0 0 0 0 0 0 0 0 0
– Associate Professors 2 1 2 1 0 0 0 0 0 0 0 0 0 0
– Assistant Professors 1 6 1 5 0 1 0 0 0 0 0 0 0 0
– All Others 6 9 5 8 0 1 0 0 1 0 0 0 0 0
Required Table II.E.1 | Source: IPEDS Human Resources Survey
Faculty Charactersitics
In fall 2015, there were 301 total faculty, 76 full-time faculty (25.2 percent) and 225 adjunct faculty (74.8 percent). Of the full-time faculty, 60.5 percent are female and 39.5 percent are male. Sixty-seven percent are tenured, and of those faculty that are tenured 23.5 percent hold academic rank of full Profes-sor.

2016 Annual Institutional Profile
18
Percentage of Course Sections Taught by Full-Time Faculty Fall 2011 to Fall 2015
Total Sections
Taught by Full-Time Faculty
Taught by Adjunct Faculty
Taught by Other Faculty
Fall 2015 976 410 499 67
42.0% 51.1% 6.9%
Fall 2014 925 362 500 63
39.1% 54.1% 6.8%
Fall 2013 941 372 496 73
39.5% 52.7% 7.8%
Fall 2012 950 377 512 61
39.7% 53.9% 6.4%
969 381 536 52 Fall 2011
39.3% 55.3% 5.4%
Required Table II.E.2 | Source: RCGC Census Day Enrollment
Ratio of Full-Time to Part-Time (Adjunct) Faculty Fall 2011 to Fall 2015
Total Faculty
Full-Time Faculty
Part-Time Faculty
FT/PT FTE Faculty
Fall 2015 301 76 225 1:3 151
25.2% 74.8%
Fall 2014 350 72 278 1:4 165
20.6% 79.4%
Fall 2013 334 71 263 1:3 159
21.3% 78.7%
Fall 2012 342 70 272 1:4 161
20.5% 79.5%
311 70 241 1:3 150 Fall 2011
22.5% 77.5%
Required Table II-E.3 | Source: IPEDS Human Resources Survey
Faculty Charactersitics
RCGC offered 976 classes in fall 2015, 42.0 percent were taught by full-time faculty, 51.1 percent by adjunct faculty and 6.9 percent by other staff. Fall 2015 marks the highest proportion of classes taught by the full-time faculty in the last five years.

2016 Annual Institutional Profile
19
2016 Board of Trustee Demographics
Total Female Male
All Trustees 10 4 6
by Race/Ethnicity
– White 8 2 6
– Black 2 2 0
Required Table II-F.1 | Source: See Data Note 5
Rowan College at Gloucester County Board of Trustees
Name Affiliation Title
Gene J. Concordia, Chair Moldamatic, LLC General Manager
Yolette C. Ross, Vice Chair New Jersey State Parole Board
Douglas J. Willis, Esq., Treasurer Chubb & Sons, Div. of Fed. Ins. Co. Assistant Vice President and Senior Surety Claims Counsel
Jean L. DuBois, Secretary Retired
Avé Altersitz New Jersey Department of Education Executive County Superintendent of Schools
Len E. Daws Lockheed Martin/GE/RCA Senior Engineer Manager and Chief Engineer
Benjamin T. Griffith Retired
Dr. James J. Lavender Kingsway Regional School District Superintendent
Ruby Love Penn Center for Rehab & Care UPHS Assistant Administrator
Dr. George J. Scott Rowan University, School of Osteopathic Medicine
Assistant Dean for Clinical Education
Vacancy
URL Link to Trustee Information —https://www.rcgc.edu/People/Pages/Board.aspx
Required Tables II-F.2 and II-F.3 | Source: See Data Note 5
Board of trustees
Rowan College at Gloucester County is sponsored by the Gloucester County Board of Chosen Freeholders through the College Board of Trustees. The College comes under general regulatory supervision of the New Jersey Commission on Higher Education.
The eleven member governing board includes eight members appointed by the Gloucester County Board of Chosen Freeholders, the Executive County Superintendent, and two members appointed by the Governor. The President serves as an ex-officio member of the Board of Trustees.
2016 Annual Institutional Profile
20
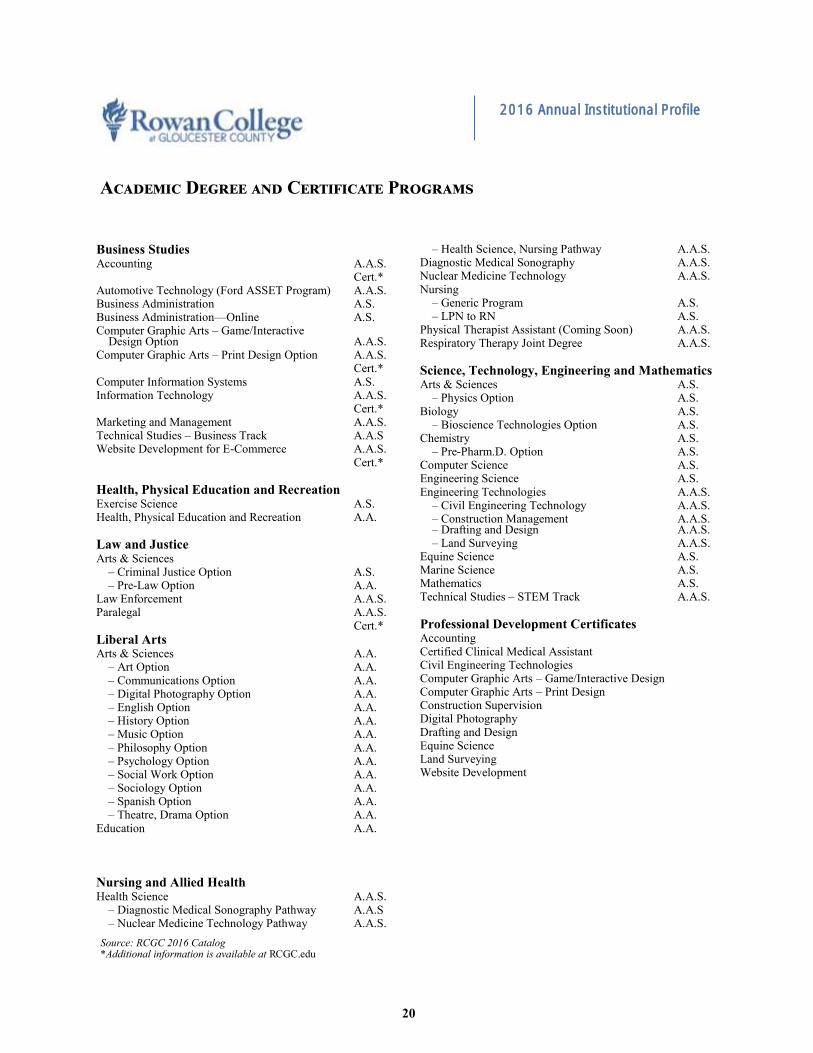
Business Studies Accounting A.A.S. Cert.* Automotive Technology (Ford ASSET Program) A.A.S. Business Administration A.S. Business Administration—Online A.S. Computer Graphic Arts – Game/Interactive Design Option A.A.S. Computer Graphic Arts – Print Design Option A.A.S. Cert.* Computer Information Systems A.S. Information Technology A.A.S. Cert.* Marketing and Management A.A.S. Technical Studies – Business Track A.A.S Website Development for E-Commerce A.A.S. Cert.*
Health, Physical Education and Recreation Exercise Science A.S. Health, Physical Education and Recreation A.A.
Law and Justice Arts & Sciences – Criminal Justice Option A.S. – Pre-Law Option A.A. Law Enforcement A.A.S. Paralegal A.A.S. Cert.*
Liberal Arts Arts & Sciences A.A. – Art Option A.A. – Communications Option A.A. – Digital Photography Option A.A. – English Option A.A. – History Option A.A. – Music Option A.A. – Philosophy Option A.A. – Psychology Option A.A. – Social Work Option A.A. – Sociology Option A.A. – Spanish Option A.A. – Theatre, Drama Option A.A. Education A.A.
Nursing and Allied Health Health Science A.A.S. – Diagnostic Medical Sonography Pathway A.A.S – Nuclear Medicine Technology Pathway A.A.S.
– Health Science, Nursing Pathway A.A.S. Diagnostic Medical Sonography A.A.S. Nuclear Medicine Technology A.A.S. Nursing – Generic Program A.S. – LPN to RN A.S. Physical Therapist Assistant (Coming Soon) A.A.S. Respiratory Therapy Joint Degree A.A.S.
Science, Technology, Engineering and Mathematics Arts & Sciences A.S. – Physics Option A.S. Biology A.S. – Bioscience Technologies Option A.S. Chemistry A.S. – Pre-Pharm.D. Option A.S. Computer Science A.S. Engineering Science A.S. Engineering Technologies A.A.S. – Civil Engineering Technology A.A.S. – Construction Management A.A.S. – Drafting and Design A.A.S. – Land Surveying A.A.S. Equine Science A.S. Marine Science A.S. Mathematics A.S. Technical Studies – STEM Track A.A.S.
Professional Development Certificates Accounting Certified Clinical Medical Assistant Civil Engineering Technologies Computer Graphic Arts – Game/Interactive Design Computer Graphic Arts – Print Design Construction Supervision Digital Photography Drafting and Design Equine Science Land Surveying Website Development
Source: RCGC 2016 Catalog *Additional information is available at RCGC.edu
Academic Degree and Certificate Programs
2016 Annual Institutional Profile
Program Fall 2011 Fall 2012 Fall 2013 Fall 2014 Fall 2015
Total Enrollment 6,829 6,762 6,720 7,130 6,836
Business Studies 1,179 1,050 1,042 1,071 1,029
Accounting (AAS) 66 65 47 52 46
Accounting (CERT) 10 11 10 6 9
Accounting (PDC) 1 1 4 1 1
Automotive Technology (AAS) 48 43 41 38 43
-Pre-Automotive Technology (AAS) 13 16 21 16 4
Business Administration (AS) 639 584 606 690 690
Computer Graphic Arts (AAS) 48 44 48 35 36
Computer Graphic Arts (CERT) 3 7 2 3 2
Computer Graphic Arts (PDC) 1 2 3 2 2
Computer Graphic Arts: Game/Interactive Media (AAS) 86 62 71 65 46
Computer Graphic Arts: Game/Interactive Media (CERT) 2
Computer Information Systems (AS) 41 49 62 68 51
Computer Information Technology (AAS) 32 32 24 19 15
Computer Information Technology (CERT) 3 4 2 5 3
Computerized Office Administration (AAS) 32 21 11 8 4
Computer Office Administration (CERT) 5 2 1 2 0
Computer Office Administration (PDC) 3 1 0 0 0
Marketing & Management (AAS) 82 73 64 45 49
Network Management (AAS) 37 12 11 4 3
Network Management (CERT) 6 2 0 0 0
Network Management (PDC) 4 0 0 0 0
Real Estate (CERT) 2 3 1 - -
Technical Studies (AAS) 6 2 2 1 4
Website Development (AAS) 15 10 9 10 14
Website Development (CERT) 1 4 3 2 3
Website Development (PDC) 1 2 1 0 2
Health, Physical Education & Recreation 183 193 190 195 192
Exercise Science (AS) 119 145 128 128 124
Health, Physical Education & Recreation (AA) 64 48 62 67 68
Law & Justice 630 604 565 627 569
Arts & Science, Criminal Justice (AS) 369 358 359 467 433
Arts & Science, Pre-Law (AA) 26 37 33 33 35
Law Enforcement (AAS) 146 123 97 66 44
Paralegal (AAS) 67 64 59 47 43
Paralegal (CERT) 22 22 17 14 14
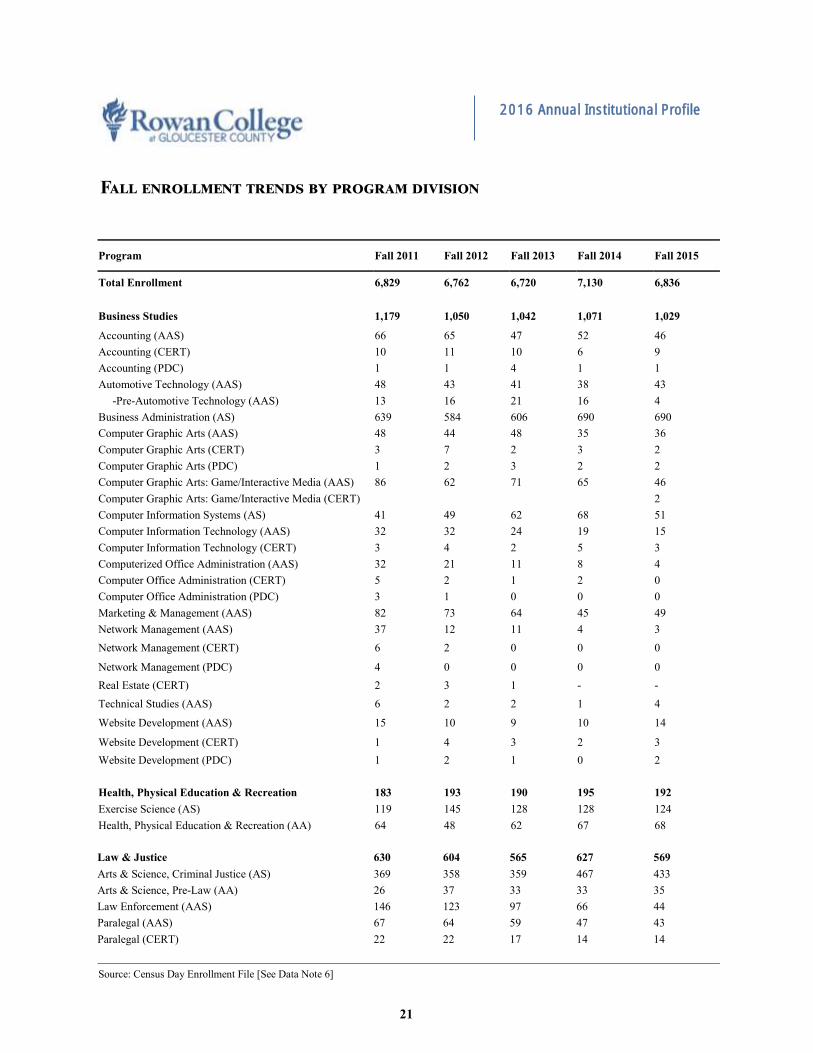
Source: Census Day Enrollment File [See Data Note 6]
21
Fall enrollment trends by program division
2016 Annual Institutional Profile
Program Fall 2011 Fall 2012 Fall 2013 Fall 2014 Fall 2015
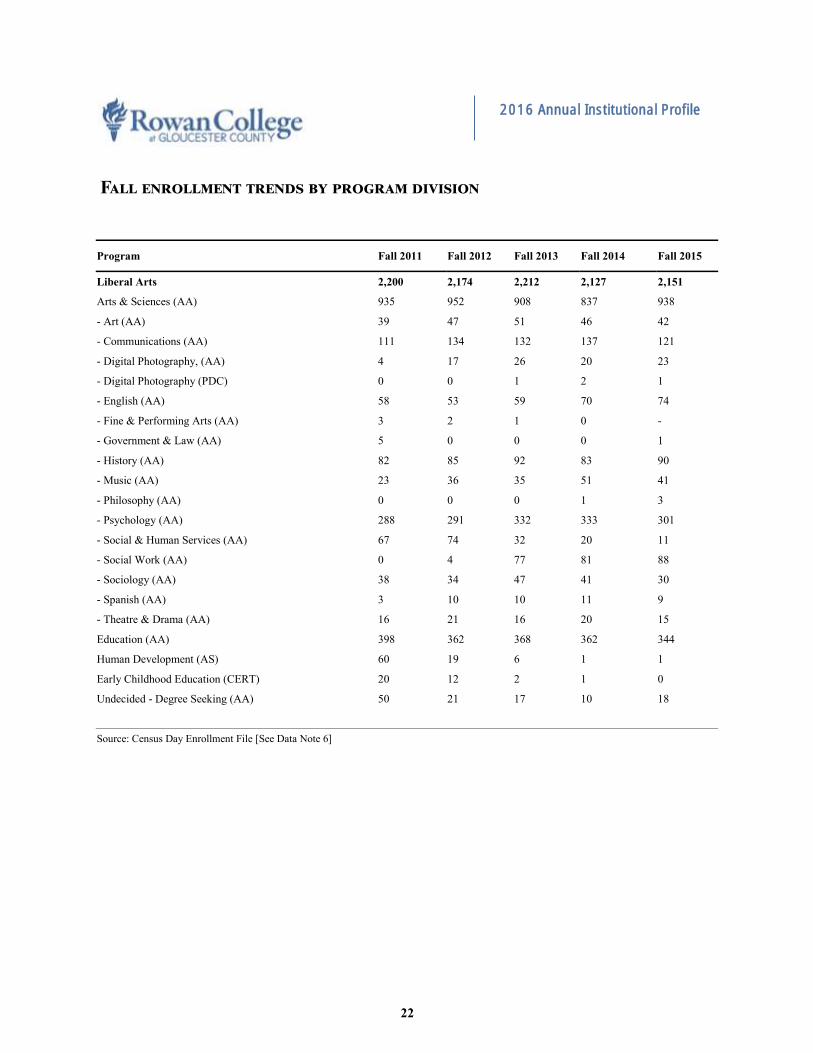
Liberal Arts 2,200 2,174 2,212 2,127 2,151
Arts & Sciences (AA) 935 952 908 837 938
- Art (AA) 39 47 51 46 42
- Communications (AA) 111 134 132 137 121
- Digital Photography, (AA) 4 17 26 20 23
- Digital Photography (PDC) 0 0 1 2 1
- English (AA) 58 53 59 70 74
- Fine & Performing Arts (AA) 3 2 1 0 -
- Government & Law (AA) 5 0 0 0 1
- History (AA) 82 85 92 83 90
- Music (AA) 23 36 35 51 41
- Philosophy (AA) 0 0 0 1 3
- Psychology (AA) 288 291 332 333 301
- Social & Human Services (AA) 67 74 32 20 11
- Social Work (AA) 0 4 77 81 88
- Sociology (AA) 38 34 47 41 30
- Spanish (AA) 3 10 10 11 9
- Theatre & Drama (AA) 16 21 16 20 15
Education (AA) 398 362 368 362 344
Human Development (AS) 60 19 6 1 1
Early Childhood Education (CERT) 20 12 2 1 0
Undecided - Degree Seeking (AA) 50 21 17 10 18
Source: Census Day Enrollment File [See Data Note 6]
22
Fall enrollment trends by program division
2016 Annual Institutional Profile
23
Program Fall 2011 Fall 2012 Fall 2013 Fall 2014 Fall 2015
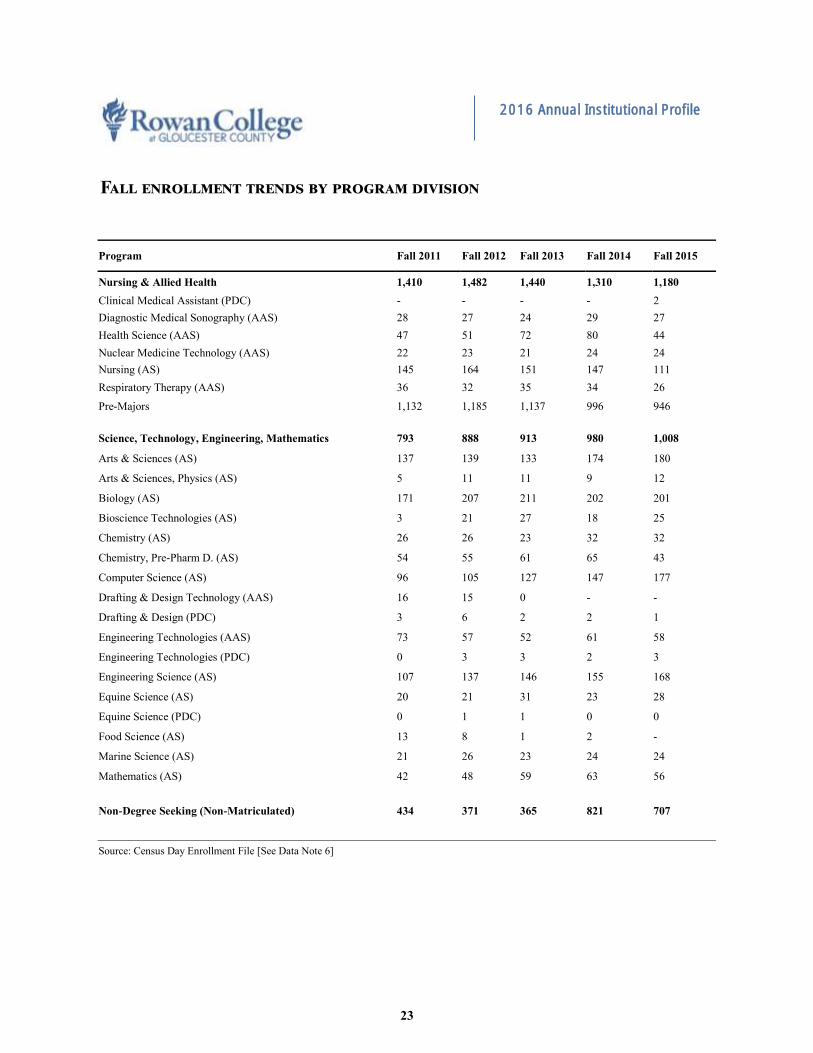
Nursing & Allied Health 1,410 1,482 1,440 1,310 1,180
Clinical Medical Assistant (PDC) - - - - 2
Diagnostic Medical Sonography (AAS) 28 27 24 29 27
Health Science (AAS) 47 51 72 80 44
Nuclear Medicine Technology (AAS) 22 23 21 24 24
Nursing (AS) 145 164 151 147 111
Respiratory Therapy (AAS) 36 32 35 34 26
Pre-Majors 1,132 1,185 1,137 996 946
Science, Technology, Engineering, Mathematics 793 888 913 980 1,008
Arts & Sciences (AS) 137 139 133 174 180
Arts & Sciences, Physics (AS) 5 11 11 9 12
Biology (AS) 171 207 211 202 201
Bioscience Technologies (AS) 3 21 27 18 25
Chemistry (AS) 26 26 23 32 32
Chemistry, Pre-Pharm D. (AS) 54 55 61 65 43
Computer Science (AS) 96 105 127 147 177
Drafting & Design Technology (AAS) 16 15 0 - -
Drafting & Design (PDC) 3 6 2 2 1
Engineering Technologies (AAS) 73 57 52 61 58
Engineering Technologies (PDC) 0 3 3 2 3
Engineering Science (AS) 107 137 146 155 168
Equine Science (AS) 20 21 31 23 28
Equine Science (PDC) 0 1 1 0 0
Food Science (AS) 13 8 1 2 -
Marine Science (AS) 21 26 23 24 24
Mathematics (AS) 42 48 59 63 56
Non-Degree Seeking (Non-Matriculated) 434 371 365 821 707
Source: Census Day Enrollment File [See Data Note 6]
Fall enrollment trends by program division

2016 Annual Institutional Profile
24
2011-12 2012-13 2013-14 2014-15 2015-16
Total Awards 910 871 963 930 1,159
Business Studies 218 190 189 194 211
Accounting (AAS) 8 7 4 11 10
Accounting (CERT) 2 3 1 2 2
Accounting (PDC) 1 2 4 9 12
Automotive Technology (AAS) 17 14 19 13 15
Business Administration (AS) 96 98 103 90 122
Computer Graphics Arts (AAS) 20 19 25 18 16
Computer Graphics Arts (CERT) 0 1 0 1 1
Computer Graphics Arts (PDC) 0 0 0 10 6
Computer Information Systems (AS) 12 4 6 10 6
Information Technology (AAS) 6 8 4 3 2
Information Technology (CERT) 1 0 0 2 0
Computerized Office Admin (AAS) 7 10 3 2 2
Computerized Office Admin (PDC) 5 0 0 0 0
Marketing and Management (AAS) 11 8 11 15 5
Technical Studies (AAS) 1 1 2 3 2
Website Development-E Commerce (AAS) 8 1 2 2 6
Website Development-E Commerce (CERT) 2 0 0 0 2
Website Development-E Commerce (PDC) 0 6 1 2 1
Network Management (AAS) 13 7 4 1 0
Network Management (CERT) 8 1 0 0 0
Network Management (PDC) 0 0 0 0 1
Health, Physical Education & Recreation 19 37 26 23 31
Exercise Science (AS) 14 33 21 19 23
Health, Physical Education & Recreation (AA) 5 4 5 4 8
Law and Justice 106 105 106 83 140
Arts & Sciences, Criminal Justice (AS) 65 67 59 55 105
Arts & Sciences, Pre-Law (AS) 1 2 2 4 6
Law Enforcement (AAS) 21 17 16 8 5
Paralegal (AAS) 12 12 20 11 13
Paralegal (CERT) 7 7 9 5 11
Source: NJ SURE Completions File [See Data Note 6]
Degree and Certificates awarded by program division
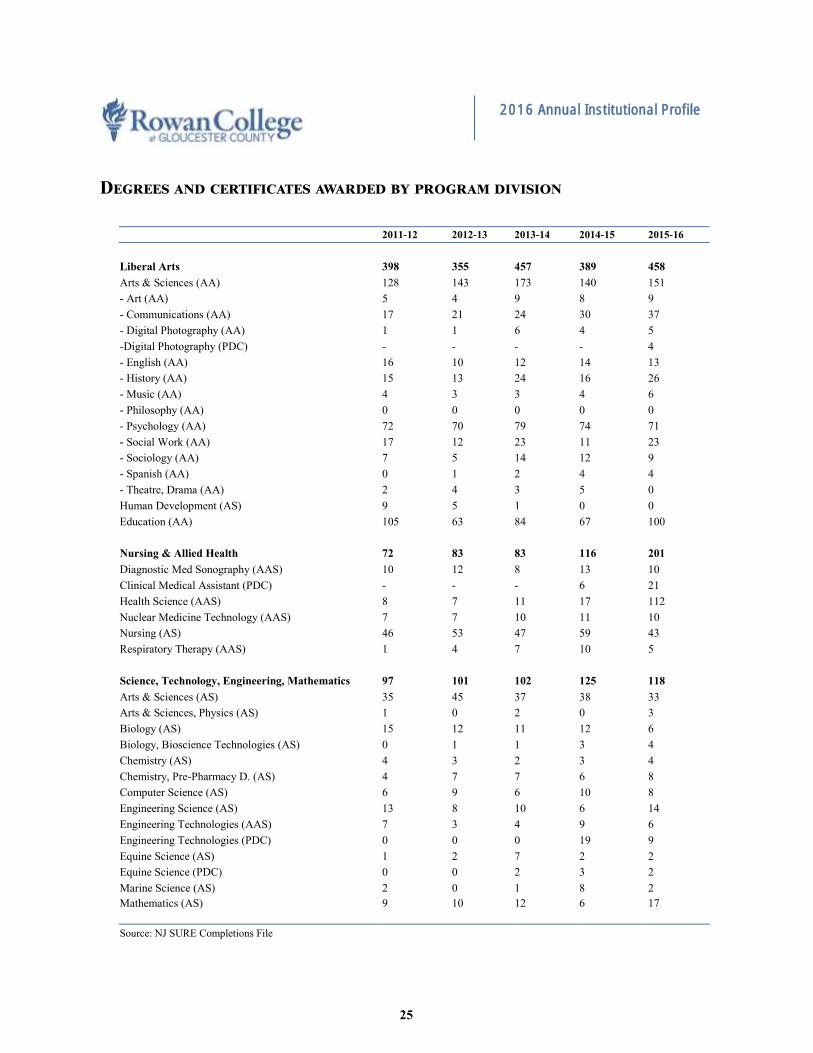
2016 Annual Institutional Profile
2011-12 2012-13 2013-14 2014-15 2015-16
Liberal Arts 398 355 457 389 458
Arts & Sciences (AA) 128 143 173 140 151
- Art (AA) 5 4 9 8 9
- Communications (AA) 17 21 24 30 37
- Digital Photography (AA) 1 1 6 4 5
-Digital Photography (PDC) - - - - 4
- English (AA) 16 10 12 14 13
- History (AA) 15 13 24 16 26
- Music (AA) 4 3 3 4 6
- Philosophy (AA) 0 0 0 0 0
- Psychology (AA) 72 70 79 74 71
- Social Work (AA) 17 12 23 11 23
- Sociology (AA) 7 5 14 12 9
- Spanish (AA) 0 1 2 4 4
- Theatre, Drama (AA) 2 4 3 5 0
Human Development (AS) 9 5 1 0 0
Education (AA) 105 63 84 67 100
Nursing & Allied Health 72 83 83 116 201
Diagnostic Med Sonography (AAS) 10 12 8 13 10
Clinical Medical Assistant (PDC) - - - 6 21
Health Science (AAS) 8 7 11 17 112
Nuclear Medicine Technology (AAS) 7 7 10 11 10
Nursing (AS) 46 53 47 59 43
Respiratory Therapy (AAS) 1 4 7 10 5
Science, Technology, Engineering, Mathematics 97 101 102 125 118
Arts & Sciences (AS) 35 45 37 38 33
Arts & Sciences, Physics (AS) 1 0 2 0 3
Biology (AS) 15 12 11 12 6
Biology, Bioscience Technologies (AS) 0 1 1 3 4
Chemistry (AS) 4 3 2 3 4
Chemistry, Pre-Pharmacy D. (AS) 4 7 7 6 8
Computer Science (AS) 6 9 6 10 8
Engineering Science (AS) 13 8 10 6 14
Engineering Technologies (AAS) 7 3 4 9 6
Engineering Technologies (PDC) 0 0 0 19 9
Equine Science (AS) 1 2 7 2 2
Equine Science (PDC) 0 0 2 3 2
Marine Science (AS) 2 0 1 8 2
Mathematics (AS) 9 10 12 6 17
Source: NJ SURE Completions File
25
Degrees and certificates awarded by program division

2016 Annual Institutional Profile
financials
Core Revenues and Expenses: Fiscal Years 2011-2015
2011 2012 2013 2014 2015
Total Core Revenues ($) $44,912,038 $47,474,435 $51,037,804 $49,731,366 $65,794,344
Core Revenues per FTE Enrollment $8,578 $8,877 $9,297 $9,369 $12,370
% Tuition and Fees 36% 38% 38% 36% 29%
% State Appropriations 11% 11% 10% 11% 8%
% Local Appropriations 17% 18% 15% 15% 12%
% Government Grants | Contracts 27% 25% 26% 28% 21%
% Other Core Revenues 9% 10% 15% 10% 30%
Total Core Expenses ($) $43,667,763 $45,197,379 $46,537,712 $47,827,303 $48,517,901
Core Expenses per FTE Enrollment $8340 $8,451 $8,477 $9,010 $9,122
% Instruction 48% 50% 48% 48% 48%
% Public Service 2% 2% 2% 2% 1%
% Academic Support 10% 8% 8% 8% 8%
% Institutional Support 13% 12% 14% 14% 15%
% Student Services 16% 16% 17% 17% 18%
% Other Core Expenses 11% 12% 11% 11% 10%
Source: IPEDS Finance Survey [See Data Note 7]
26

2016 Annual Institutional Profile
Thanks to the New Jersey Higher Education Bond and the Gloucester County Board of Chosen Freeholders, capital investment construction upgrades are dramatically enriching the landscape of the campus.
Major capital projects underway in fiscal year 2016 include:
Corporate and Business Center Budget - $1,900,000 Funding Sources – Building Our Future Bond Act, Chapter 12 Project Completion Date – May 2016
Facilities Department New Building Budget - $575,000 Funding Sources – Chapter 12 Project Start Date – March 2016 Project Completion Date – August 2016
Major capital projects
27
Business and Corporate Center opens for students September 2016.

2016 Annual Institutional Profile
The Rowan College Athletic Department is a Comprehensive 14-Sport Program for men and women. As a member of the National Junior College Athletic Association (NJCAA), RCGC competes in Region XIX and the Garden State Athletic Conference against other two-year colleges from New Jersey, New York, Pennsylvania, Delaware and Maryland.
Rowan College’s athletic program has received national awards for performances both on the field and in the classroom.
Athletics Awards in 2015-16 include:
RCGC won their 11th Collegiate Athletics Administrators of New Jersey Cup Award for the most outstanding overall two-year college athletic program in NJ
Eighteen RCGC Athletes received NJCAA Division III Academic Awards – One Pinnacle Award for Academic Excellence (4.0 GPA), five for Superior Academic Achievement (3.80-3.99 GPA), twelve for Exemplary Academic Achievement (3.60-3.79 GPA)
Five NJCAA Individual National Champions
NJCAA Region XIX Champions – Men’s Cross Country, Women’s Soccer, Baseball, Softball
Garden State Athletic Conference Champions – Wrestling, Baseball, Men’s Tennis
athletic program recognitions and awards
28

2016 Annual Institutional Profile
1. Enrollment totals include both degree seeking and non-degree seeking students and will not include the GRS cohort which exclude non-degree seeking students. The Registration Type best describes the category the student is assigned in the enrollment roster during the reporting period. Values include:
New, first-time: A student who has not been previously enrolled at the institution at this degree level and who has not earned college credits. Students that enrolled in the fall term who attended college for the first time in the prior summer term are classified as new. Note, non-degree seeking students are included in this category. As such, totals will be different than those reported in the Student Outcomes tables (graduation rates and retention rates).
Transfer: A student who has not been previously enrolled at the college, and brings or seeks to bring college credits from another institution.
Stop-out / Readmit: A student who previously attended the college, but stopped attending for one or more semesters and returns to resume studies, and may or may not have gone through a formal admissions process again.
Continuing: A student who was enrolled in courses during the previous regular semester.
Special: A high student enrolled in courses on the basis of an alternative admissions criterion (e.g. High School Option Program (HSOP) or dual enrollment).
2. Noncredit open enrollment includes all registrations in any course that started on July 1, 2014 through June 30, 2015. FTEs were computed by converting clock hours to credit hours (dividing by 15), then converting credit hours to FTE (dividing by 30).
3. Unduplicated enrollment for an entire academic year represents unaudited credit hours and full-time equivalent (FTE). Annual FTE is calculated based on the total credit hours divided by 30.
4. Percent distributions are calculated upon the subtotal of known student Race/Ethnicity. Using the adjusted total provides for appropriate comparison to U.S. Census population data. Percentage totals may not equal one-hundred due to rounding.
5. Race/Ethnicity and Gender of the Board of Trustees is self-reported. Title and Affiliation is reported on Financial Disclosure Statement, Local Government Ethics Law, State of New Jersey, Department of Community Affairs, Division of Local Government Services and Local Finance Board.
6. Program enrollment and degrees/awards totals represent the combined total for all program track options, where applicable. Level of award denoted as — AA: Associate in Arts; AS: Associate in Science, AAS: Associate in Applied Science; CERT: Certificate; PDC: Professional Development Certificate. The sum of awards may not equal division subtotals in prior years due to redaction of data to reflect the current academic profile.
7. Other core revenues include federal appropriations, sales and services of educational activities, other operating and non-operating sources and other revenues and additions (e.g., capital appropriations, capital grants and gifts, etc.). Core revenues exclude revenues from auxiliary enterprises (e.g., bookstores, dormitories), hospitals and independent operations.
Core expenses include expenses for instruction, research, public service, academic support, institutional support, student services, operation and maintenance of plant, depreciation, scholarships and fellowships expenses, other expenses and non-operating expenses.
29
Data notes

2016 Annual Institutional Profile