2016 graduation survey report - careers.umd.edu graduation... · 2016 graduation survey report ......
TRANSCRIPT

2016 Graduation Survey Report Bachelor’s Level Graduates
Compiled by the University Career Center & The President’s Promise SURVEY ADMINISTRATION AND STATISTICAL ANALYSIS
Kelley Bishop University Career Center & The President’s Promise Merlin Levine University Career Center & The President’s Promise Cody O’Brien University Career Center & The President’s Promise
COLLEGE SURVEY COORDINATION
Kathy Angeletti College of Education Christina Farmer College of Agriculture and Natural Resources Shannon Felice School of Public Health Kate Juhl College of Arts and Humanities Ashlee Kerkhoff Robert H. Smith School of Business Linda LeNoir School of Architecture, Planning and Preservation Olive Reid Philip Merrill College of Journalism Heidi Sauber A. James Clark School of Engineering Crystal Sehlke College of Behavioral and Social Sciences Rachel Wobrak College of Computer, Mathematical, and Natural
Sciences
CONSULTATION AND DATA COLLECTION ASSISTANCE Sharon LaVoy Institutional Research, Planning & Assessment Frank Rojas Institutional Research, Planning & Assessment
EDITORIAL ASSISTANCE
Becky Weir University Career Center & The President’s Promise QUESTIONS OR REQUESTS FOR ADDITIONAL DATA
Kelley Bishop [email protected] 301.314.7236

1
2016 Graduation Survey Report Bachelor’s Level Graduates The Graduation Survey is administered by the University Career Center & The President’s Promise (the Center). The survey captures career-related outcomes of bachelor’s degree level graduates, as well as data on participation in co-curricular and extracurricular activities during the graduate’s tenure at the University of Maryland, College Park. This year’s report captures outcomes of bachelor’s level graduates within the 2015-2016 academic year including August 2015, December 2015 and May 2016 graduations. Methodology The 2016 Graduation Survey followed the same process and incorporated the same survey items as the 2014 and 2015 surveys, which were based on standards established by the National Association of Colleges and Employers (NACE). Survey data collection was conducted via the web through an instrument created in Qualtrics. In addition to responses on the survey, data were also collected via other channels including social media profiles (especially LinkedIn), information from college/department staff, reports from employers and data from the National Student Clearinghouse. Survey Pool Initial survey invitations were sent prior to each graduation to a list of students who had applied for graduation in that semester (list obtained from the University of Maryland Data Warehouse). The Office of the Registrar completed degree clearances and conferred degrees approximately one month after graduation, at which point the survey pool was limited to only those students that had in fact earned a degree in the 2015-2016 academic year. Time Frame Based on the NACE standards, data collection was conducted within a window following each graduation and ending six months after the last graduation in the cycle (May 2016), rolled out in three phases:
PHASE ONE Initial emails were sent to students intending to graduate approximately three weeks before commencement. Graduates continued to receive weekly reminders until a few weeks after graduation. After that point, additional reminders were sent on a bi-weekly basis. PHASE TWO At the three-month post-graduation mark, requests to complete the survey were again emailed to graduates that had not yet responded. Students that responded in PHASE ONE and reported an unplaced status were resurveyed and asked to update their outcome. PHASE THREE Toward the end of the survey window (mid-November through December) the Center shared with colleges/departments lists of their graduates that had not yet completed the survey or had reported an unplaced status. Colleges/departments were asked to supply any additional
2
student outcome information of which they had knowledge (e.g., a department administrative assistant that received a personal email from a graduate related to a recently landed job). Additional outcome data were sourced from searches on LinkedIn and other social media sites, conducted either by the colleges/departments or by Center staff. The Center also obtained information about enrollment in graduate-level programs from the National Student Clearinghouse via assistance from the Office of Institutional Research, Planning and Assessment. Data received from channels other than the survey were coded to identify the source and help insure that information was legitimate and verifiable.
Definitions While graduates could report one of nine statuses, for the purpose of this report outcomes are generally divided into the following categories:
PLACED includes employment (either full or part-time), continuing education (of any type – graduate school, second bachelor’s degree, certificate programs, etc.), starting a business/organization, participating in a service or volunteer program (such as the Peace Corps) or military service. UNPLACED includes graduates that reported actively seeking employment as well as graduates that reported an intention to pursue a graduate degree, but had not yet been accepted or admitted. UNRESOLVED includes students that responded to the survey during PHASE ONE and reported an UNPLACED status, but for whom no additional information could be collected in subsequent phases—neither through eventual response to the survey, lookups on social media sites, reports from employers, information from schools/colleges, nor the National Student Clearinghouse. In other words, the only information available was the intent of the student to commence a job search or graduate school application process, but not about the conclusion; hence the term, “unresolved.” NOT SEEKING includes students that reported they were not seeking employment or continuing education. These students were omitted from the calculation of placement rates.
Other Clarifications Some assumptions were inherent in interpreting data collected from sources other than the official Graduation Survey instrument.
EMPLOYMENT For outcome data collected from social media sites, graduate profiles indicating post-graduate employment were considered to be employed full-time unless information about part-time status was explicitly provided or available.
COLLEGE AND DEPARTMENT SURVEYS The Center received data from some colleges/departments that conducted internal surveys containing career outcome questions. Of note, in some cases these surveys were conducted significantly prior to the Graduation Survey data collection timeframe initiated at graduation. When appropriate, data were integrated into the official reporting database during PHASE
3
THREE data collection efforts. However, responders to pre-graduation college/department surveys that reported an unplaced status were still classified as non-responders unless they also responded to the official Graduation Survey. VOLUNTEER/SERVICE Students that reported a status of EMPLOYED but indicated their employer as Teach For America, Peace Corps, AmeriCorps, City Year or one of many well-known volunteer/service programs were recoded in the VOLUNTEER/SERVICE category for purposes of this report.
EMPLOYMENT VS. CONTINUING EDUCATION Some PHASE THREE data collection efforts overlapped each other. There were instances where report of a graduate’s employment was obtained from one source, but simultaneously a report of continuing education was obtained from the National Student Clearinghouse. Reports regarding employment were given precedence over continuing education information received from the Clearinghouse, with the assumption that the graduate would be attending the continuing education program part-time.
CLEARINGHOUSE VS. OTHER REPORTS In the cases where report of a graduate pursuing continuing education was obtained from both the National Student Clearinghouse and another source, but details about that enrollment were in conflict (program, school, etc.), the Clearinghouse data were considered the most accurate.
SOCIAL MEDIA PROFILES When conducting research on graduates via social media sites, staff were instructed to identify how recently the profile appeared to have been updated.
Students were recorded as UNPLACED if their profile summary or headline referenced their
recent graduation and that they were actively seeking employment.
For EMPLOYMENT, any work-related position reported in the profile with a start date after the individual’s graduation date was considered post-graduate employment.
If a position listed on the profile indicated a start date prior to graduation but contained clear evidence that the profile had been updated since graduation, the position was recorded as post-graduate employment. If there was no evidence that the profile had been updated, the employment was not recorded.
Staff were asked to record URLs of student profiles for later review and verification.
Tabulations Each graduate was counted only once in the University-wide report section. Graduates with double majors and/or double degrees were counted in their respective college reports; however, if the second degree occurred within the same college, the graduate was only counted once in the college-specific report. Graduates that participated in the Honors College or College Park Scholars programs were included in those reports in addition to being included in specific college report(s) as appropriate. In addition, although Letters & Sciences students ultimately select majors and are counted in the varioU.S. college reports, a separate report was generated to include graduates who at any point in their University of Maryland tenure were Letters & Sciences students.
4
In some cases percentages do not sum to 100%. For questions where graduates could “check all that apply,” denominators are based on total number of graduates completing that question, not on total number of checks reported for all categories in that question. A student checking three (3) response categories would count only once toward the denominator, not three times. For other questions, the difference between the sum and 100% should be small (+/- 1%) and is attributable to rounding error. All rounding was done on final calculations/results. Most values in the report were calculated via Microsoft Excel and full decimal places were retained in intermediate steps. The order of college reports that follows is based on how the colleges appear in the University of Maryland Data Warehouse reports.


7
University of Maryland - OVERALL
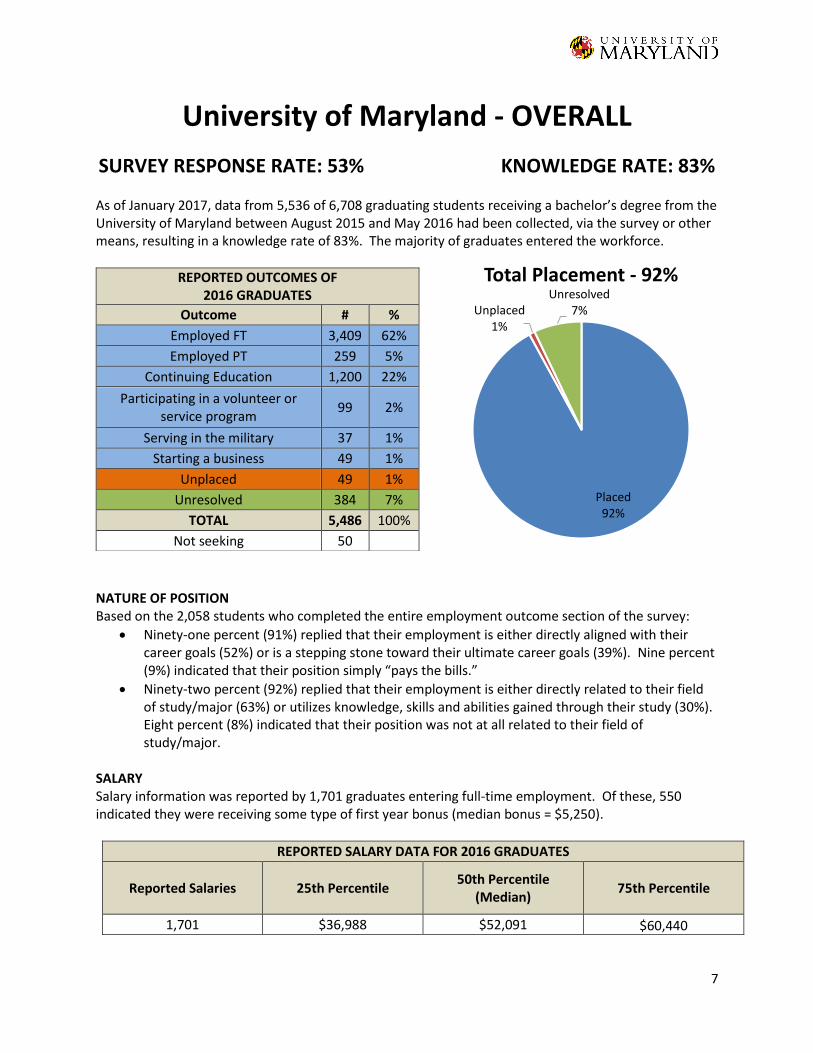
SURVEY RESPONSE RATE: 53% KNOWLEDGE RATE: 83%
As of January 2017, data from 5,536 of 6,708 graduating students receiving a bachelor’s degree from the University of Maryland between August 2015 and May 2016 had been collected, via the survey or other means, resulting in a knowledge rate of 83%. The majority of graduates entered the workforce.
NATURE OF POSITION Based on the 2,058 students who completed the entire employment outcome section of the survey:
Ninety-one percent (91%) replied that their employment is either directly aligned with their career goals (52%) or is a stepping stone toward their ultimate career goals (39%). Nine percent (9%) indicated that their position simply “pays the bills.”
Ninety-two percent (92%) replied that their employment is either directly related to their field of study/major (63%) or utilizes knowledge, skills and abilities gained through their study (30%). Eight percent (8%) indicated that their position was not at all related to their field of study/major.
SALARY Salary information was reported by 1,701 graduates entering full-time employment. Of these, 550 indicated they were receiving some type of first year bonus (median bonus = $5,250).
REPORTED SALARY DATA FOR 2016 GRADUATES
Reported Salaries 25th Percentile 50th Percentile
(Median) 75th Percentile
1,701 $36,988 $52,091 $60,440
REPORTED OUTCOMES OF 2016 GRADUATES
Outcome # %
Employed FT 3,409 62%
Employed PT 259 5%
Continuing Education 1,200 22%
Participating in a volunteer or service program
99 2%
Serving in the military 37 1%
Starting a business 49 1%
Unplaced 49 1%
Unresolved 384 7%
TOTAL 5,486 100%
Not seeking 50
Placed92%
Unplaced1%
Unresolved7%
Total Placement - 92%
8
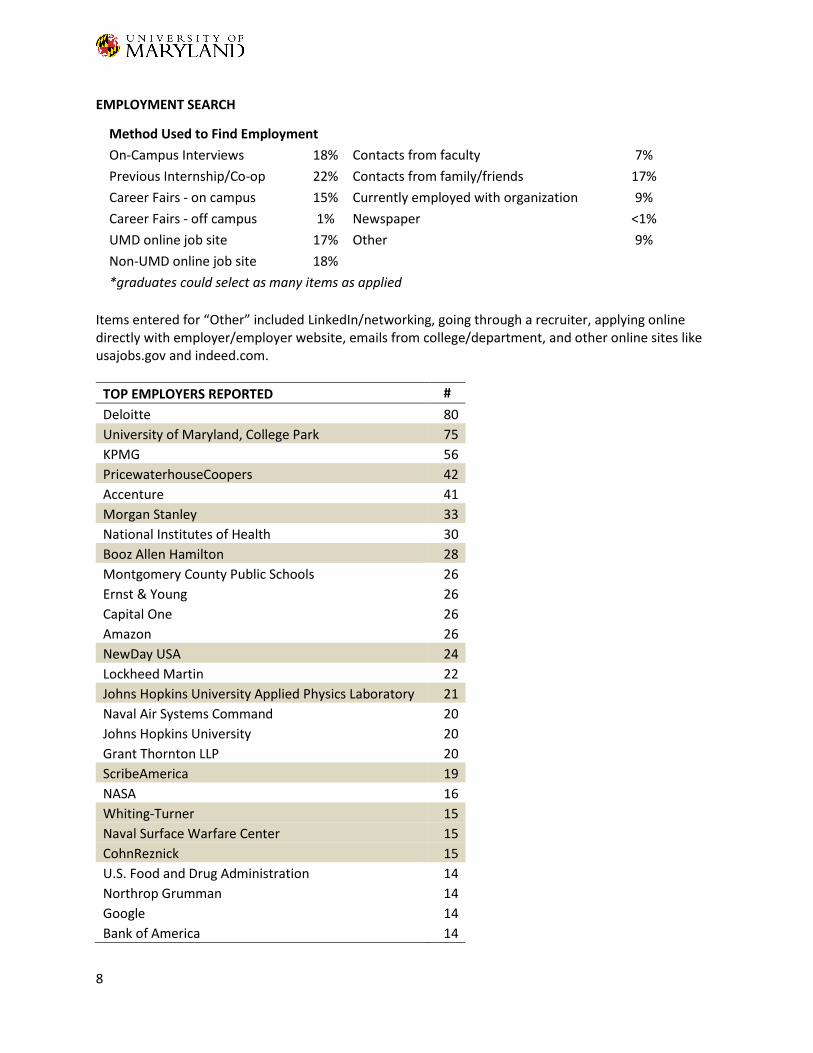
EMPLOYMENT SEARCH
Method Used to Find Employment
On-Campus Interviews 18% Contacts from faculty 7%
Previous Internship/Co-op 22% Contacts from family/friends 17%
Career Fairs - on campus 15% Currently employed with organization 9%
Career Fairs - off campus 1% Newspaper <1%
UMD online job site 17% Other 9%
Non-UMD online job site 18% *graduates could select as many items as applied
Items entered for “Other” included LinkedIn/networking, going through a recruiter, applying online directly with employer/employer website, emails from college/department, and other online sites like usajobs.gov and indeed.com.
TOP EMPLOYERS REPORTED #
Deloitte 80
University of Maryland, College Park 75
KPMG 56
PricewaterhouseCoopers 42
Accenture 41
Morgan Stanley 33
National Institutes of Health 30
Booz Allen Hamilton 28
Montgomery County Public Schools 26
Ernst & Young 26
Capital One 26
Amazon 26
NewDay USA 24
Lockheed Martin 22
Johns Hopkins University Applied Physics Laboratory 21
Naval Air Systems Command 20
Johns Hopkins University 20
Grant Thornton LLP 20
ScribeAmerica 19
NASA 16
Whiting-Turner 15
Naval Surface Warfare Center 15
CohnReznick 15
U.S. Food and Drug Administration 14
Northrop Grumman 14
Google 14
Bank of America 14
9
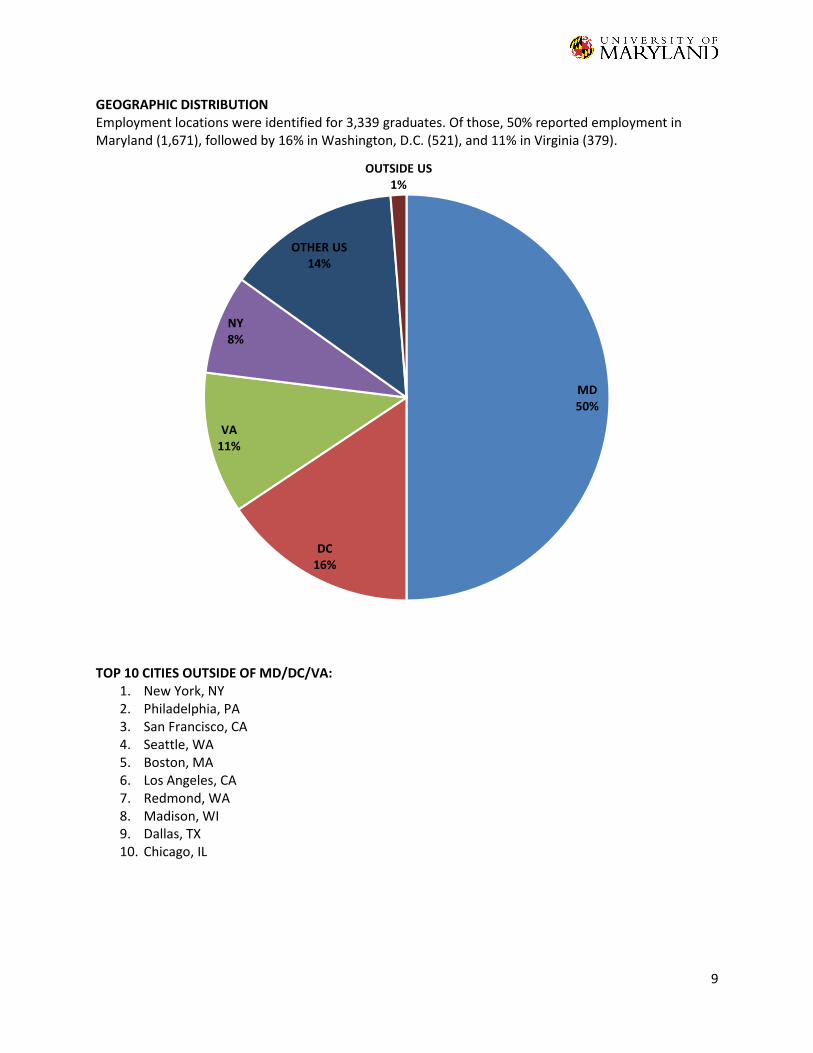
GEOGRAPHIC DISTRIBUTION Employment locations were identified for 3,339 graduates. Of those, 50% reported employment in Maryland (1,671), followed by 16% in Washington, D.C. (521), and 11% in Virginia (379).
TOP 10 CITIES OUTSIDE OF MD/DC/VA:
1. New York, NY 2. Philadelphia, PA 3. San Francisco, CA 4. Seattle, WA 5. Boston, MA 6. Los Angeles, CA 7. Redmond, WA 8. Madison, WI 9. Dallas, TX 10. Chicago, IL
MD50%
DC16%
VA11%
NY8%
OTHER US14%
OUTSIDE US1%
10
STARTING A BUSINESS/ORGANIZATION Forty-nine (49) graduates reported that they started their own business or organization, including:
Caddie Crate, a company that delivers golf supplies, apparel and equipment monthly to customers’ residences.
CardBuddy, a company that sells thin wallets that stick to the back of a phone or phone case.
DC Music and Video, LLC, a media services company for creative professionals.
Economy Landscaping, a landscaping company with competitive pricing.
ExeQut, a consulting company that is a vendor for enterprise apps and portals.
ICOW, a building technology company that democratizes access to higher education for international students.
K. Sultana, LLC, a company that produces breathable, functional scarves with sales supporting women’s economic empowerment initiatives.
Limo Prime, LLC, a company that delivers luxury transportation services to the Washington, D.C. area.
Mercango, a grocery delivery application.
Phlogiston Games, a video game company.
Prestige Landscape & Tree Care, LLC, a landscape and tree care service provider in the Washington, D.C. metropolitan area.
Primerica, a company that helps middle-income families build a strong financial base.
Queer Theatre Company, a theatre company that creates a space for queer performers and audiences.
Study Buddie, a website that provides tools that help students with their education.
TapTimeTV, a small local business that provides low-cost, high-exposure solutions for advertising.
Taylor Cummings Lacrosse, LLC, a company focused on teaching and mastering the fundamentals of lacrosse.
The Woman Studios, a production company that aims to provide a new paradigm to the cinematic genres of science fiction and science fantasy.
Together Today, a company that boosts social and intellectual development of students in underserved school systems by providing access to technology and college-student mentorship.
Townhome Landscapes, LLC, a landscaping company that provides affordable services in high population density communities.
Uscan, a company that provides document transcription services to the merchant cash advance industry.
VentureStorm, LLC, a web application to help connect entrepreneurs to student developers. SERVICE/VOLUNTEER PROGRAMS Ninety-nine (99) graduates reported plans to participate in a service or volunteer program after graduation. Programs reported include: Teach For America (21), AmeriCorps (19), Peace Corps (8) and City Year (7).
11
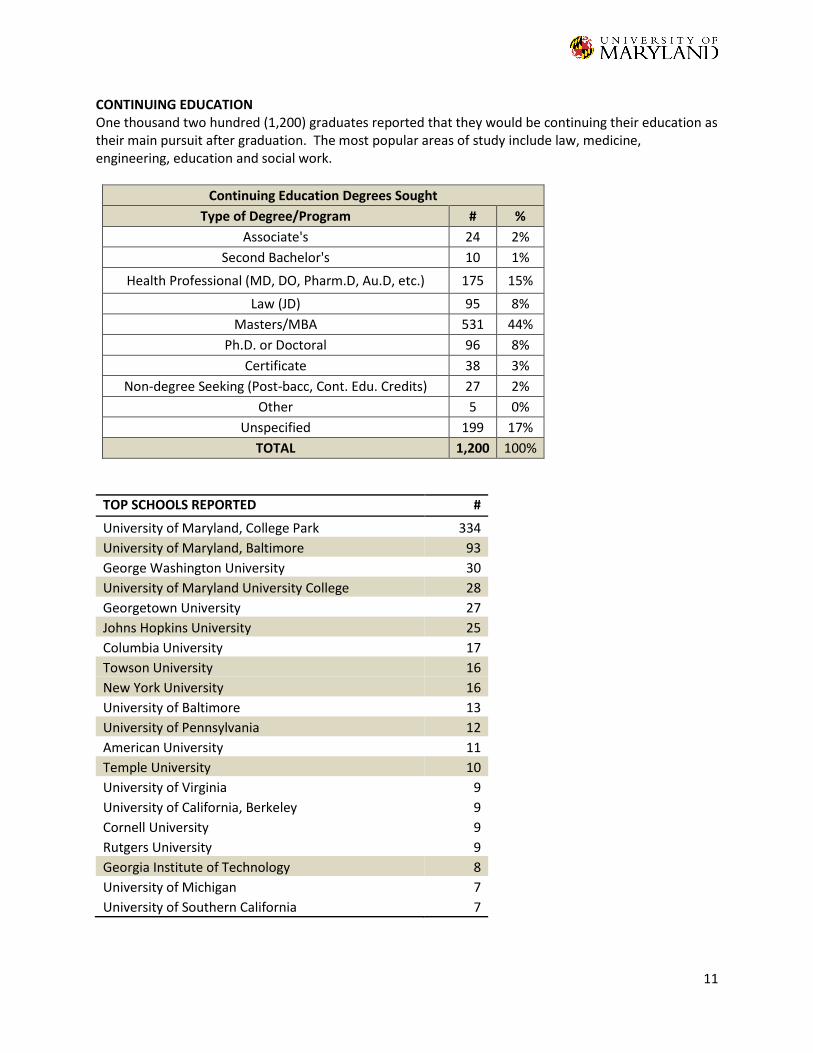
CONTINUING EDUCATION One thousand two hundred (1,200) graduates reported that they would be continuing their education as their main pursuit after graduation. The most popular areas of study include law, medicine, engineering, education and social work.
Continuing Education Degrees Sought
Type of Degree/Program # %
Associate's 24 2%
Second Bachelor's 10 1%
Health Professional (MD, DO, Pharm.D, Au.D, etc.) 175 15%
Law (JD) 95 8%
Masters/MBA 531 44%
Ph.D. or Doctoral 96 8%
Certificate 38 3%
Non-degree Seeking (Post-bacc, Cont. Edu. Credits) 27 2%
Other 5 0%
Unspecified 199 17%
TOTAL 1,200 100%
TOP SCHOOLS REPORTED #
University of Maryland, College Park 334
University of Maryland, Baltimore 93
George Washington University 30
University of Maryland University College 28
Georgetown University 27
Johns Hopkins University 25
Columbia University 17
Towson University 16
New York University 16
University of Baltimore 13
University of Pennsylvania 12
American University 11
Temple University 10
University of Virginia 9
University of California, Berkeley 9
Cornell University 9
Rutgers University 9
Georgia Institute of Technology 8
University of Michigan 7
University of Southern California 7
12
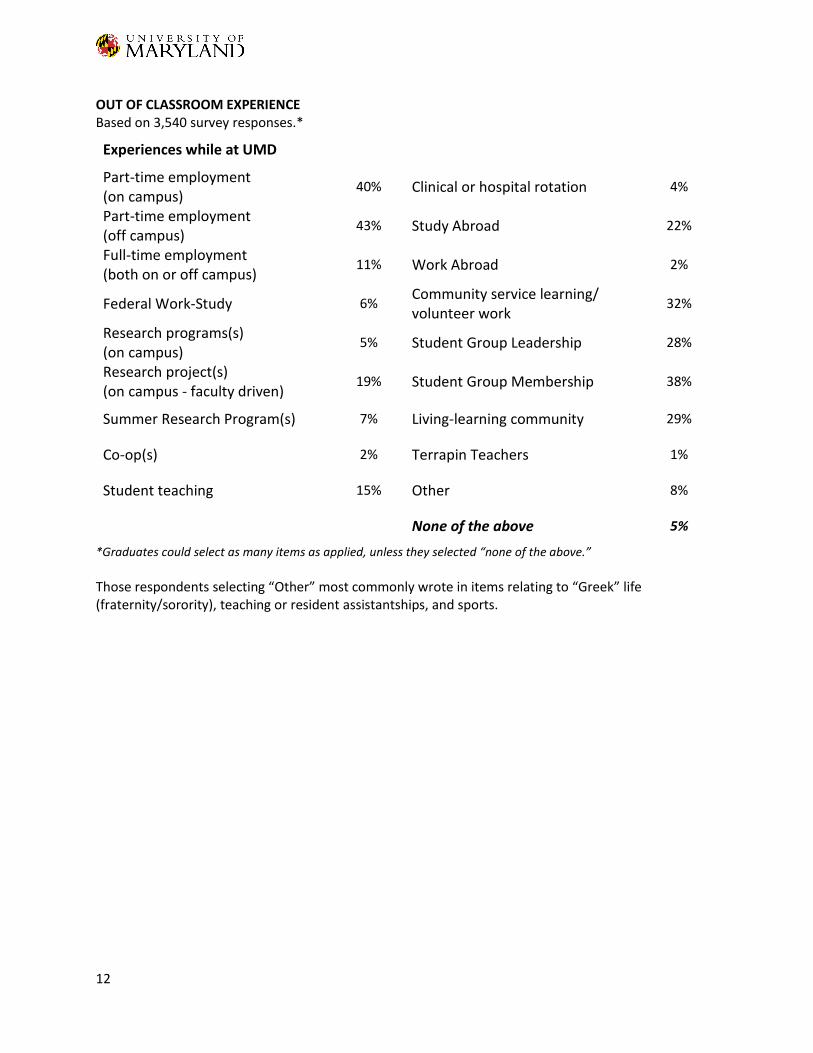
OUT OF CLASSROOM EXPERIENCE Based on 3,540 survey responses.*
Experiences while at UMD
Part-time employment (on campus)
40% Clinical or hospital rotation 4%
Part-time employment (off campus)
43% Study Abroad 22%
Full-time employment (both on or off campus)
11% Work Abroad 2%
Federal Work-Study 6% Community service learning/ volunteer work
32%
Research programs(s) (on campus)
5% Student Group Leadership 28%
Research project(s) (on campus - faculty driven)
19% Student Group Membership 38%
Summer Research Program(s) 7% Living-learning community 29%
Co-op(s) 2% Terrapin Teachers 1%
Student teaching 15% Other 8%
None of the above 5%
*Graduates could select as many items as applied, unless they selected “none of the above.”
Those respondents selecting “Other” most commonly wrote in items relating to “Greek” life (fraternity/sorority), teaching or resident assistantships, and sports.
13
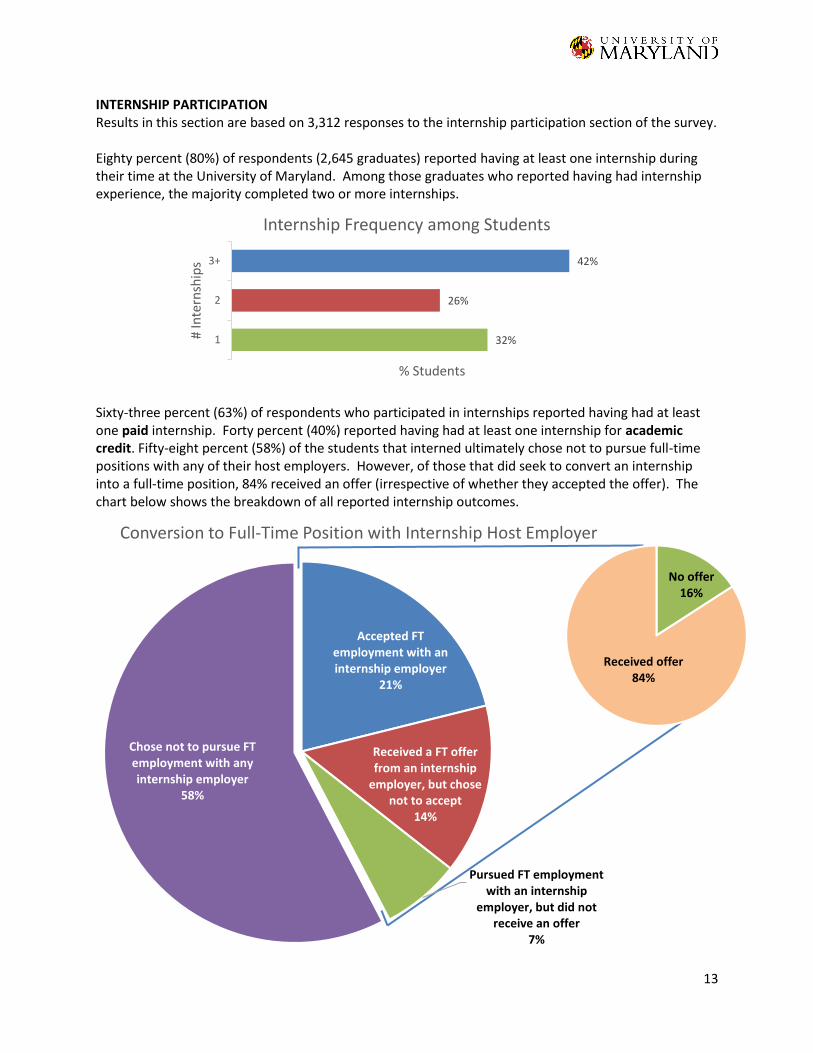
INTERNSHIP PARTICIPATION Results in this section are based on 3,312 responses to the internship participation section of the survey. Eighty percent (80%) of respondents (2,645 graduates) reported having at least one internship during their time at the University of Maryland. Among those graduates who reported having had internship experience, the majority completed two or more internships.
Sixty-three percent (63%) of respondents who participated in internships reported having had at least one paid internship. Forty percent (40%) reported having had at least one internship for academic credit. Fifty-eight percent (58%) of the students that interned ultimately chose not to pursue full-time positions with any of their host employers. However, of those that did seek to convert an internship into a full-time position, 84% received an offer (irrespective of whether they accepted the offer). The chart below shows the breakdown of all reported internship outcomes.
32%
26%
42%
1
2
3+
% Students
# In
tern
ship
s
Internship Frequency among Students
Accepted FT employment with an internship employer
21%
Received a FT offer from an internship
employer, but chose not to accept
14%
Pursued FT employment with an internship
employer, but did not receive an offer
7%
Chose not to pursue FT employment with any internship employer
58%
Conversion to Full-Time Position with Internship Host Employer
No offer16%
Received offer84%
14
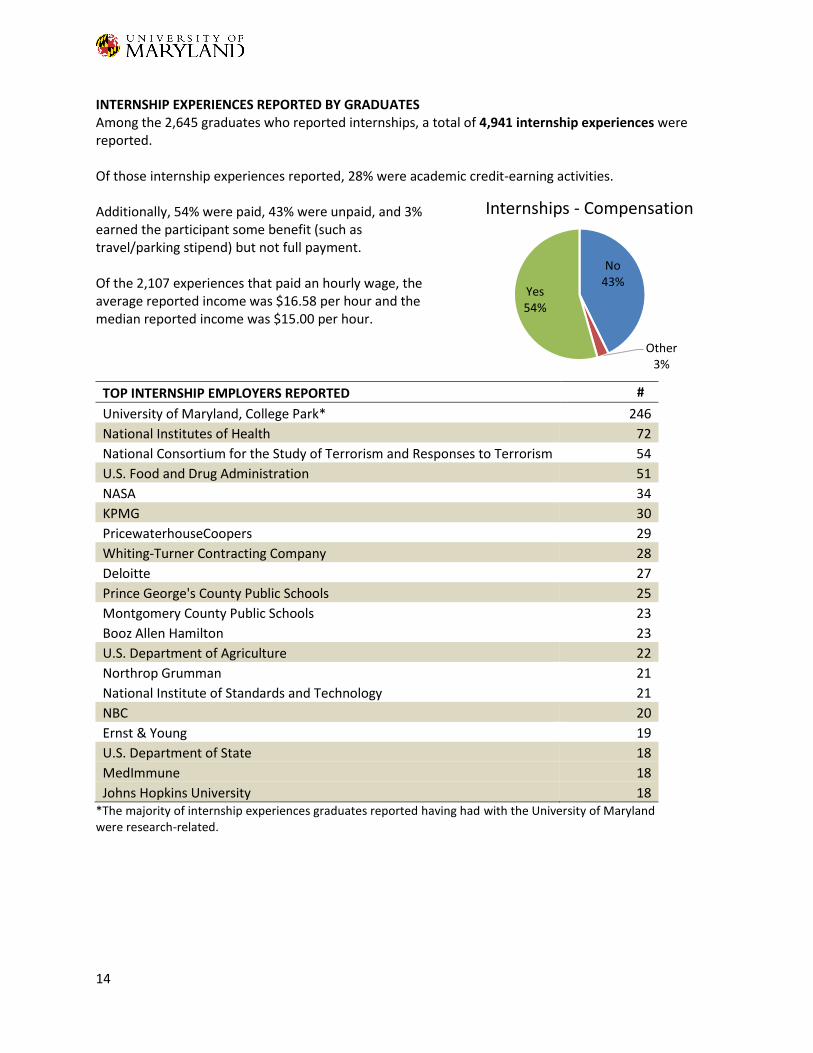
INTERNSHIP EXPERIENCES REPORTED BY GRADUATES Among the 2,645 graduates who reported internships, a total of 4,941 internship experiences were reported. Of those internship experiences reported, 28% were academic credit-earning activities. Additionally, 54% were paid, 43% were unpaid, and 3% earned the participant some benefit (such as travel/parking stipend) but not full payment. Of the 2,107 experiences that paid an hourly wage, the average reported income was $16.58 per hour and the median reported income was $15.00 per hour.
TOP INTERNSHIP EMPLOYERS REPORTED #
University of Maryland, College Park* 246
National Institutes of Health 72
National Consortium for the Study of Terrorism and Responses to Terrorism 54
U.S. Food and Drug Administration 51
NASA 34
KPMG 30
PricewaterhouseCoopers 29
Whiting-Turner Contracting Company 28
Deloitte 27
Prince George's County Public Schools 25
Montgomery County Public Schools 23
Booz Allen Hamilton 23
U.S. Department of Agriculture 22
Northrop Grumman 21
National Institute of Standards and Technology 21
NBC 20
Ernst & Young 19
U.S. Department of State 18
MedImmune 18
Johns Hopkins University 18 *The majority of internship experiences graduates reported having had with the University of Maryland were research-related.
No43%
Other3%
Yes54%
Internships - Compensation

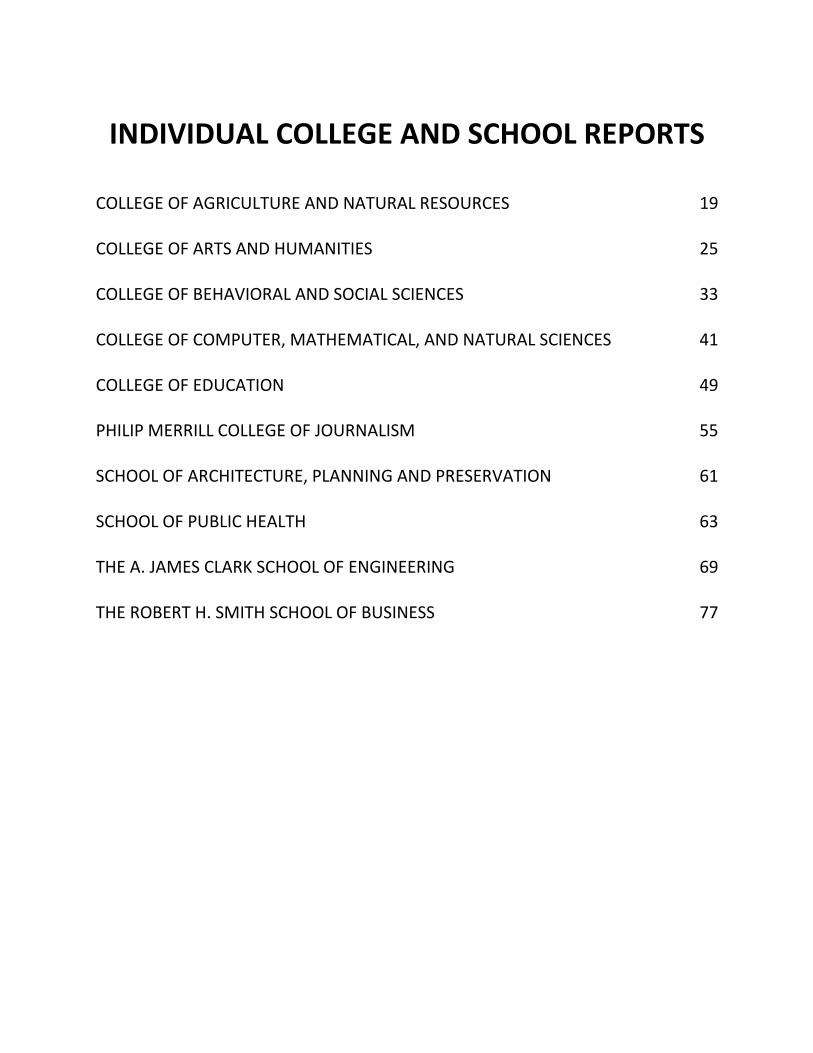
INDIVIDUAL COLLEGE AND SCHOOL REPORTS
COLLEGE OF AGRICULTURE AND NATURAL RESOURCES 19 COLLEGE OF ARTS AND HUMANITIES 25 COLLEGE OF BEHAVIORAL AND SOCIAL SCIENCES 33 COLLEGE OF COMPUTER, MATHEMATICAL, AND NATURAL SCIENCES 41 COLLEGE OF EDUCATION 49 PHILIP MERRILL COLLEGE OF JOURNALISM 55 SCHOOL OF ARCHITECTURE, PLANNING AND PRESERVATION 61 SCHOOL OF PUBLIC HEALTH 63 THE A. JAMES CLARK SCHOOL OF ENGINEERING 69 THE ROBERT H. SMITH SCHOOL OF BUSINESS 77

19
COLLEGE OF AGRICULTURE AND NATURAL RESOURCES
SURVEY RESPONSE RATE: 53% KNOWLEDGE RATE: 78%
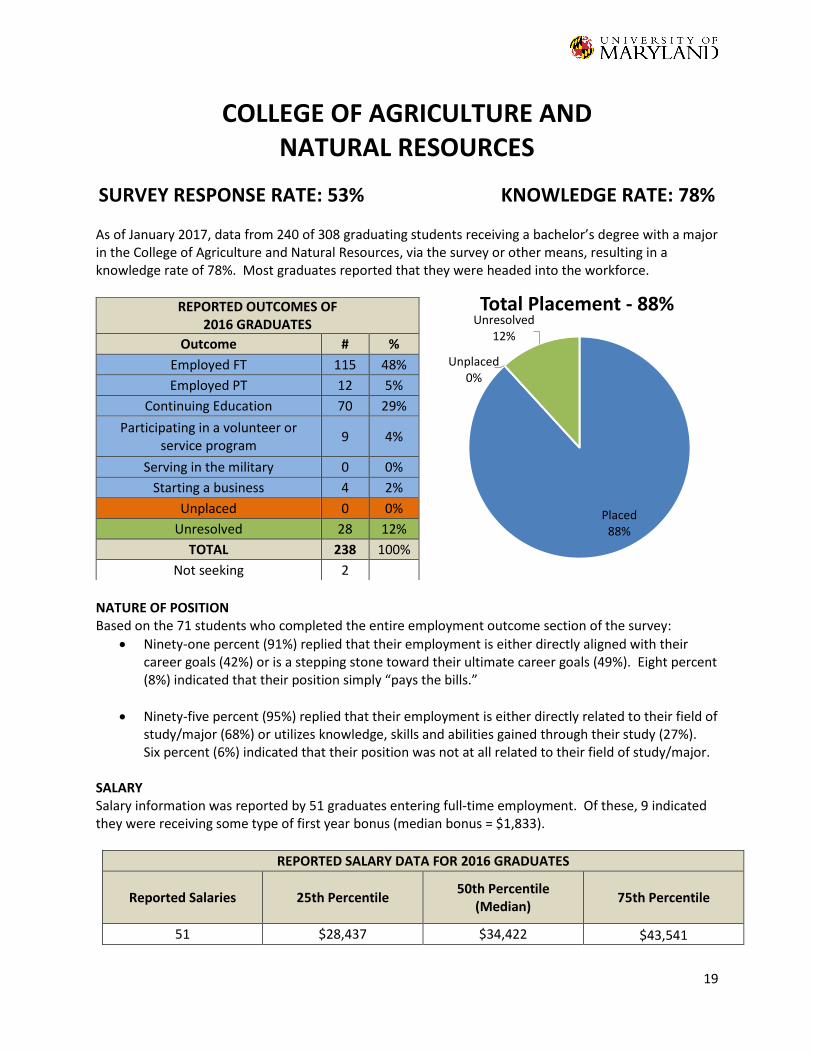
As of January 2017, data from 240 of 308 graduating students receiving a bachelor’s degree with a major in the College of Agriculture and Natural Resources, via the survey or other means, resulting in a knowledge rate of 78%. Most graduates reported that they were headed into the workforce.
NATURE OF POSITION Based on the 71 students who completed the entire employment outcome section of the survey:
Ninety-one percent (91%) replied that their employment is either directly aligned with their career goals (42%) or is a stepping stone toward their ultimate career goals (49%). Eight percent (8%) indicated that their position simply “pays the bills.”
Ninety-five percent (95%) replied that their employment is either directly related to their field of study/major (68%) or utilizes knowledge, skills and abilities gained through their study (27%). Six percent (6%) indicated that their position was not at all related to their field of study/major.
SALARY Salary information was reported by 51 graduates entering full-time employment. Of these, 9 indicated they were receiving some type of first year bonus (median bonus = $1,833).
REPORTED SALARY DATA FOR 2016 GRADUATES
Reported Salaries 25th Percentile 50th Percentile
(Median) 75th Percentile
51 $28,437 $34,422 $43,541
REPORTED OUTCOMES OF 2016 GRADUATES
Outcome # %
Employed FT 115 48%
Employed PT 12 5%
Continuing Education 70 29%
Participating in a volunteer or service program
9 4%
Serving in the military 0 0%
Starting a business 4 2%
Unplaced 0 0%
Unresolved 28 12%
TOTAL 238 100%
Not seeking 2
Placed88%
Unplaced0%
Unresolved12%
Total Placement - 88%
20
EMPLOYMENT SEARCH
Method Used to Find Employment
On-Campus Interviews 1% Contacts from faculty 17%
Previous Internship/Co-op 17% Contacts from family/friends 18%
Career Fairs - on campus 0% Currently employed with organization 17%
Career Fairs - off campus 1% Newspaper 1%
UMD online job site 3% Other 10%
Non-UMD online job site 28% *graduates could select as many items as applied
Items entered for “Other” included applying online directly with employer/employer website, networking/contacts from internships or part-time employment, and using an agency. SAMPLE OF EMPLOYERS AND POSITIONS REPORTEDAramark
Dietetic Intern ATC Associates
Environmental Scientist Blue Dog Boarding and Daycare
Kennel Technician CALIBRE Systems
Senior Program Analyst Charles River Laboratories, Inc.
Corporate Response Team Chesapeake Bay Trust
Chesapeake Conservation Corps Member Clark Construction Group
Engineer Delaware Division of Fish and Wildlife – Bat Program
Research Assistant Energy Efficiency
Research Assistant Environmental Consulting, Inc.
Environmental Scientist Flywheel Digital
Digital Marketing Analyst Friends Provident International
Data Specialist Geo-Technology Associates
Engineering Technician greeNEWit
Energy Analyst Itaberco, Inc.
Food Scientist
Johns Hopkins University Dietetic Technician
Layhill Animal Hospital Veterinary Assistant
Martinelli Winery Harvest Cellar Intern
Maryland Department of the Environment Environmental Compliance Specialist
Maryland-National Capital Park and Planning Commission
Lead Gardener, Brookside Gardens Morgan Stanley
Consultant National Institutes of Health
Post-Baccalaureate IRTA National Security Agency
Office Manager ParkerRodriguez, Inc.
Landscape Architect Landscape Designer
Quince Orchard Veterinary Hospital Veterinary Technician
ScribeAmerica Hospitalist Scribe
SoBran, Inc. Animal Caretaker
Southern Maryland Agricultural Development Commission
Intern The Henry M. Jackson Foundation for the Advancement of Military Medicine
Research Assistant
21
The Neighborhood Design Center Landscape Architecture Intern
The RAM Professional Group Entry level Landscape Architect
TIC Gums Technical Service Representative
University of Maryland, College Park Agricultural Technician Researcher/Lab Technician
U.S. Department of Agriculture Biological Science Technician Soil Conservationist
U.S. Department of the Interior Physical Scientist Contractor
Wallace, Montgomery & Associates, LLP Environmental Scientist
Weill Cornell Cancer Center Lab Technician
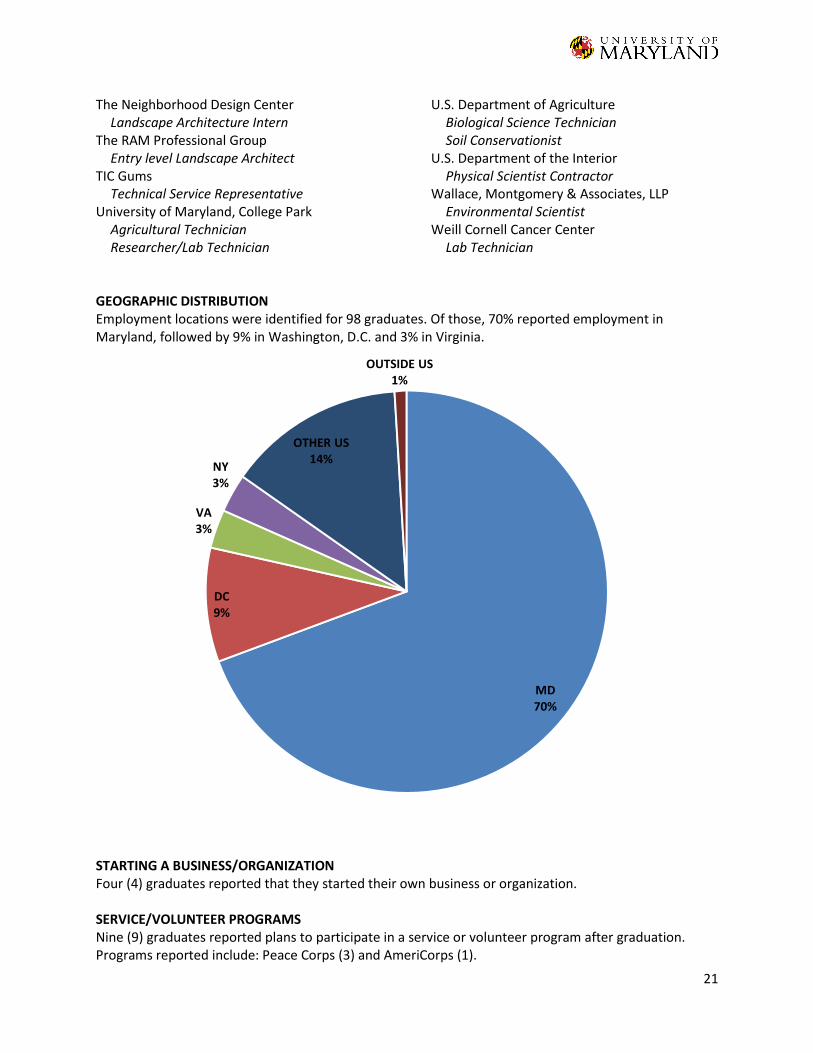
GEOGRAPHIC DISTRIBUTION Employment locations were identified for 98 graduates. Of those, 70% reported employment in Maryland, followed by 9% in Washington, D.C. and 3% in Virginia.
STARTING A BUSINESS/ORGANIZATION Four (4) graduates reported that they started their own business or organization. SERVICE/VOLUNTEER PROGRAMS Nine (9) graduates reported plans to participate in a service or volunteer program after graduation. Programs reported include: Peace Corps (3) and AmeriCorps (1).
MD70%
DC9%
VA3%
NY3%
OTHER US14%
OUTSIDE US1%
22
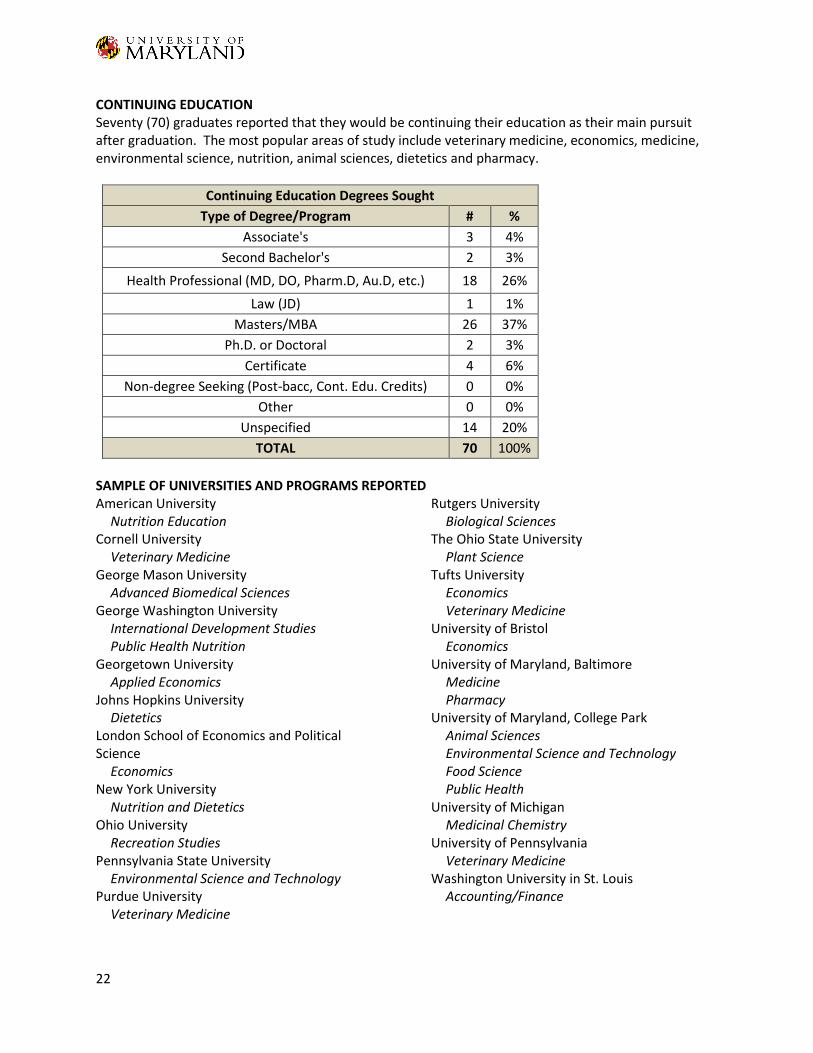
CONTINUING EDUCATION Seventy (70) graduates reported that they would be continuing their education as their main pursuit after graduation. The most popular areas of study include veterinary medicine, economics, medicine, environmental science, nutrition, animal sciences, dietetics and pharmacy.
Continuing Education Degrees Sought
Type of Degree/Program # %
Associate's 3 4%
Second Bachelor's 2 3%
Health Professional (MD, DO, Pharm.D, Au.D, etc.) 18 26%
Law (JD) 1 1%
Masters/MBA 26 37%
Ph.D. or Doctoral 2 3%
Certificate 4 6%
Non-degree Seeking (Post-bacc, Cont. Edu. Credits) 0 0%
Other 0 0%
Unspecified 14 20%
TOTAL 70 100%
SAMPLE OF UNIVERSITIES AND PROGRAMS REPORTED American University
Nutrition Education Cornell University
Veterinary Medicine George Mason University
Advanced Biomedical Sciences George Washington University
International Development Studies Public Health Nutrition
Georgetown University Applied Economics
Johns Hopkins University Dietetics
London School of Economics and Political Science
Economics New York University
Nutrition and Dietetics Ohio University
Recreation Studies Pennsylvania State University
Environmental Science and Technology Purdue University
Veterinary Medicine
Rutgers University Biological Sciences
The Ohio State University Plant Science
Tufts University Economics Veterinary Medicine
University of Bristol Economics
University of Maryland, Baltimore Medicine Pharmacy
University of Maryland, College Park Animal Sciences Environmental Science and Technology Food Science Public Health
University of Michigan Medicinal Chemistry
University of Pennsylvania Veterinary Medicine
Washington University in St. Louis Accounting/Finance
23
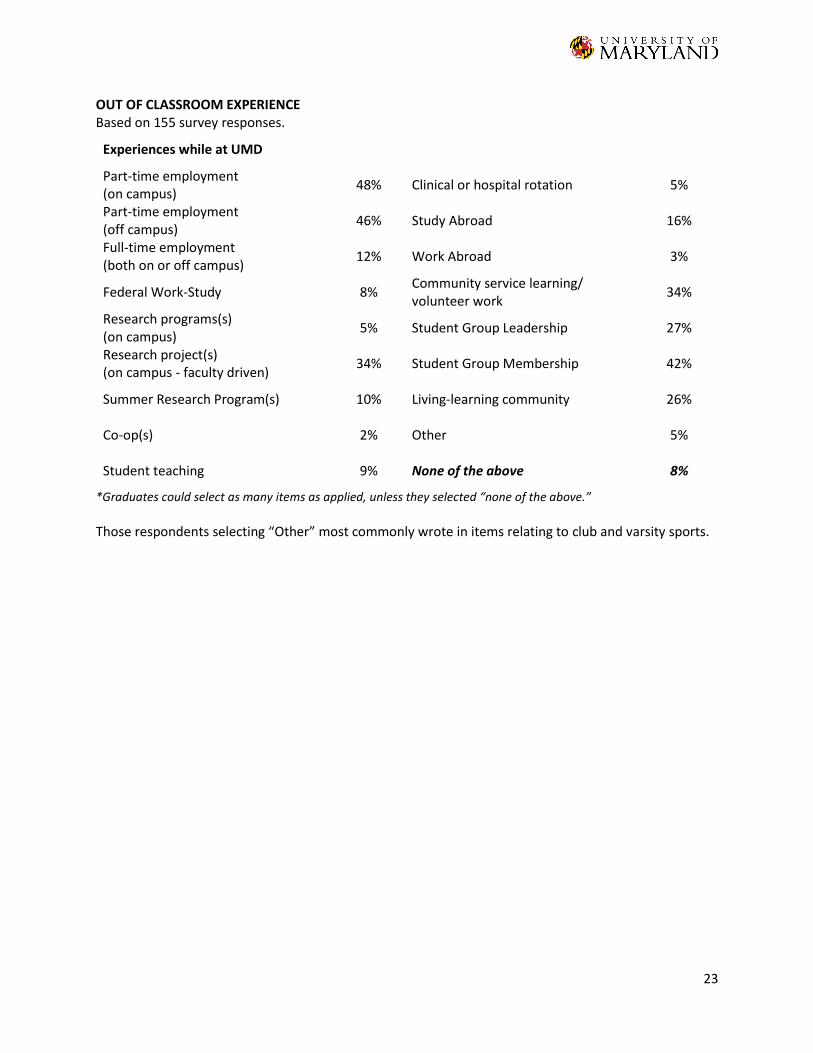
OUT OF CLASSROOM EXPERIENCE Based on 155 survey responses.
Experiences while at UMD
Part-time employment (on campus)
48% Clinical or hospital rotation 5%
Part-time employment (off campus)
46% Study Abroad 16%
Full-time employment (both on or off campus)
12% Work Abroad 3%
Federal Work-Study 8% Community service learning/ volunteer work
34%
Research programs(s) (on campus)
5% Student Group Leadership 27%
Research project(s) (on campus - faculty driven)
34% Student Group Membership 42%
Summer Research Program(s) 10% Living-learning community 26%
Co-op(s) 2% Other 5%
Student teaching 9% None of the above 8%
*Graduates could select as many items as applied, unless they selected “none of the above.”
Those respondents selecting “Other” most commonly wrote in items relating to club and varsity sports.
24
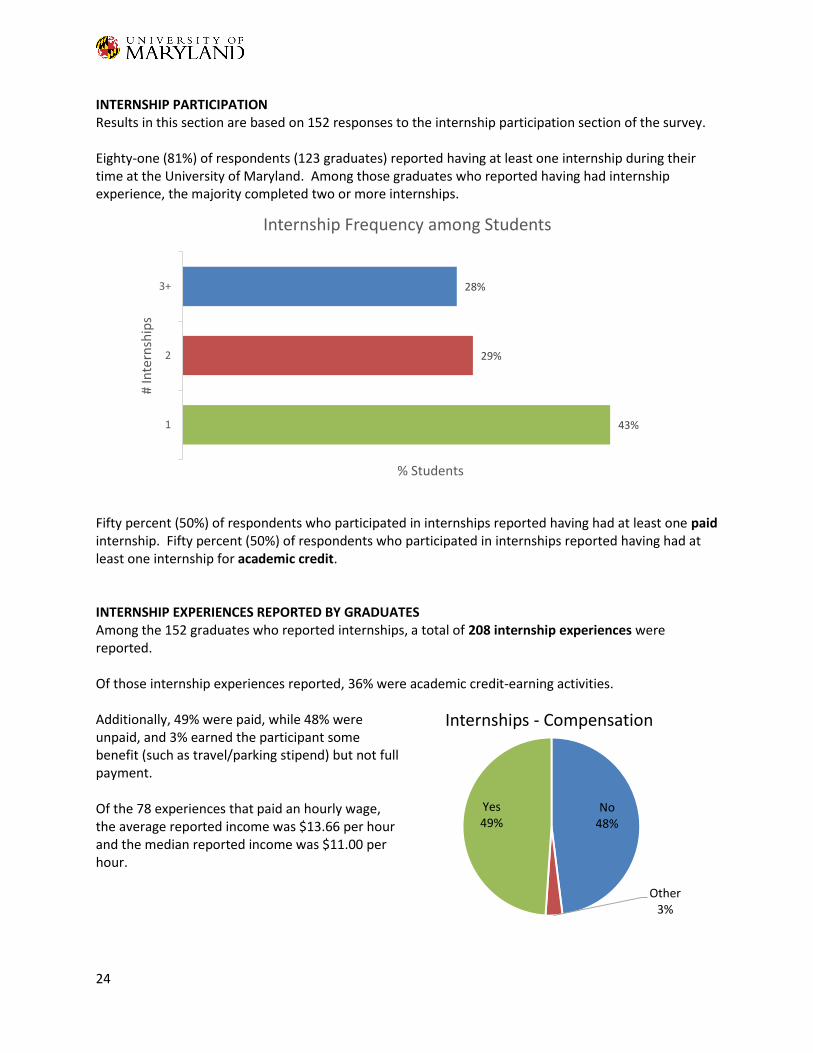
INTERNSHIP PARTICIPATION Results in this section are based on 152 responses to the internship participation section of the survey. Eighty-one (81%) of respondents (123 graduates) reported having at least one internship during their time at the University of Maryland. Among those graduates who reported having had internship experience, the majority completed two or more internships.
Fifty percent (50%) of respondents who participated in internships reported having had at least one paid internship. Fifty percent (50%) of respondents who participated in internships reported having had at least one internship for academic credit. INTERNSHIP EXPERIENCES REPORTED BY GRADUATES Among the 152 graduates who reported internships, a total of 208 internship experiences were reported. Of those internship experiences reported, 36% were academic credit-earning activities. Additionally, 49% were paid, while 48% were unpaid, and 3% earned the participant some benefit (such as travel/parking stipend) but not full payment. Of the 78 experiences that paid an hourly wage, the average reported income was $13.66 per hour and the median reported income was $11.00 per hour.
43%
29%
28%
1
2
3+
% Students
# In
tern
ship
s
Internship Frequency among Students
No48%
Other3%
Yes49%
Internships - Compensation
25
COLLEGE OF ARTS AND HUMANITIES
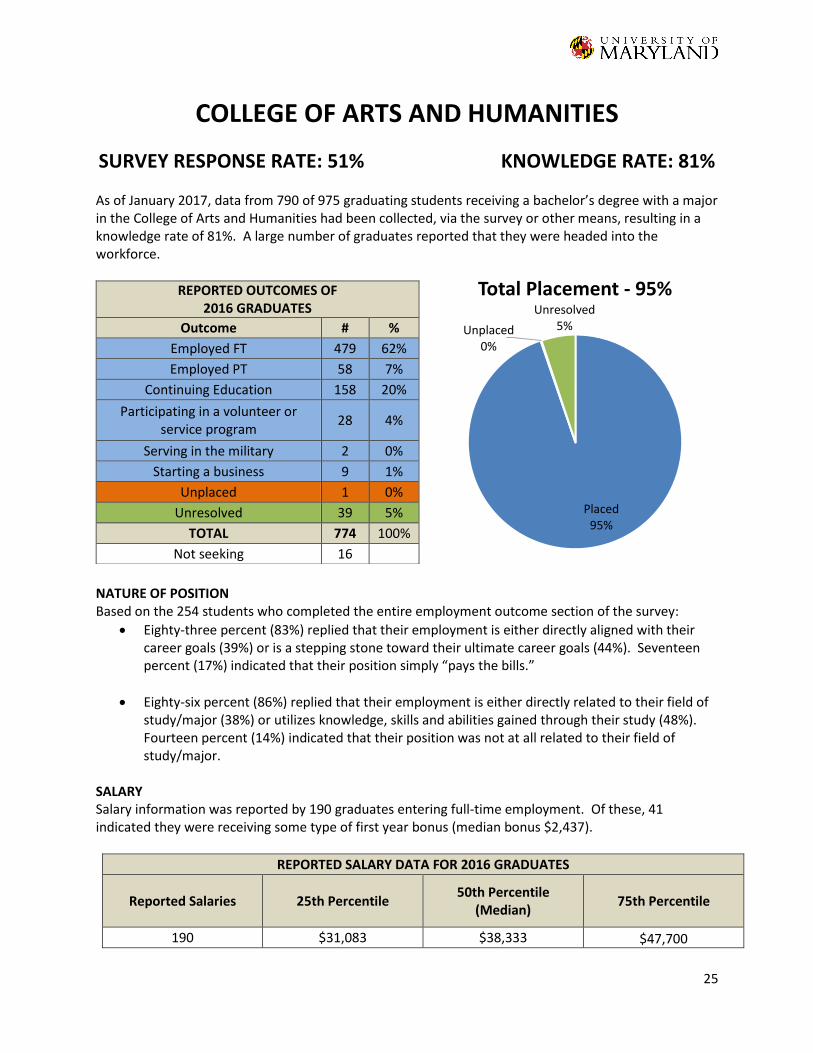
SURVEY RESPONSE RATE: 51% KNOWLEDGE RATE: 81%
As of January 2017, data from 790 of 975 graduating students receiving a bachelor’s degree with a major in the College of Arts and Humanities had been collected, via the survey or other means, resulting in a knowledge rate of 81%. A large number of graduates reported that they were headed into the workforce.
NATURE OF POSITION Based on the 254 students who completed the entire employment outcome section of the survey:
Eighty-three percent (83%) replied that their employment is either directly aligned with their career goals (39%) or is a stepping stone toward their ultimate career goals (44%). Seventeen percent (17%) indicated that their position simply “pays the bills.”
Eighty-six percent (86%) replied that their employment is either directly related to their field of study/major (38%) or utilizes knowledge, skills and abilities gained through their study (48%). Fourteen percent (14%) indicated that their position was not at all related to their field of study/major.
SALARY Salary information was reported by 190 graduates entering full-time employment. Of these, 41 indicated they were receiving some type of first year bonus (median bonus $2,437).
REPORTED SALARY DATA FOR 2016 GRADUATES
Reported Salaries 25th Percentile 50th Percentile
(Median) 75th Percentile
190 $31,083 $38,333 $47,700
REPORTED OUTCOMES OF 2016 GRADUATES
Outcome # %
Employed FT 479 62%
Employed PT 58 7%
Continuing Education 158 20%
Participating in a volunteer or service program
28 4%
Serving in the military 2 0%
Starting a business 9 1%
Unplaced 1 0%
Unresolved 39 5%
TOTAL 774 100%
Not seeking 16
Placed95%
Unplaced0%
Unresolved5%
Total Placement - 95%
26
EMPLOYMENT SEARCH
Method Used to Find Employment
On-Campus Interviews 7% Contacts from faculty 13%
Previous Internship/Co-op 16% Contacts from family/friends 22%
Career Fairs - on campus 7% Currently employed with organization 9%
Career Fairs - off campus 1% Newspaper 0%
UMD online job site 6% Other 11%
Non-UMD online job site 22% *graduates could select as many items as applied
Items entered for “Other” included access to alumni, LinkedIn, applying directly to employer websites, and networking/contacts from internships or previous employment. SAMPLE OF EMPLOYERS AND POSITIONS REPORTED 2U
Talent Acquisition Specialists 3E Public Relations
Account Coordinator Access Intelligence
Media Associate Amazon
RSP Area Manager Appian Corporation
Business Development Representative Apple
Product Zone Specialist Atlantic Media
Member Development Associate, National Journal Bain & Company
Associate Consultant Bethesda Magazine
Intern Booz Allen Hamilton
Consultant CBS Corporation
Account Executive Digital Revenue Planner
CEB Global Business Development Associate
Children's National Medical Center Intern
Comcast Corporation Production Assistant
Cosmopolitan Magazine Advertising Sales Assistant
Cystic Fibrosis Foundation Management Operations Coordinator
Public Access Corporation of the District of Columbia
Video Editor Deloitte
Audit Associate Discovery Communications
Digital Ad Sales Assistant Executive Marketing Assistant
ELLE Magazine Advertising Sales Assistant
Epic Systems Software Developer
Federal Housing Finance Agency Economist
Fulbright Teaching Program English Teaching Assistant
Harvard University Staff Assistant
Horizon Media Assistant Media Buyer Assistant Social Strategist Junior Analyst
IBM Consultant
Japan Exchange and Teaching Program Assistant Language Teacher
Johns Hopkins University Research Assistant
JPMorgan Chase & Co. Financial Analyst
27
KPMG Credit Risk Associate Federal Advisory Associate Federal Audit Associate
Macy's Account Representative
Marriott International Catering Sales Administrative Assistant Digital Content Producer
Morgan Stanley Business Analyst
National Archives and Records Administration Research Assistant
National Institutes of Health Post Baccalaureate IRTA
National Science Foundation Multimedia Intern
NewDay USA Account Executive Credit Analyst
Octagon Digital Trainee
Penguin Random House Digital Operations Assistant
Signature Theatre Production Assistant
Smithsonian Institution Program Assistant
Sol Systems Marketing and Community Coordinator
TEKsystems Technical Recruiter
Tesla Associate Executive Assistant
Textron Systems Systems Analyst
The Advisory Board Company Sales and Marketing Associate Strategy and Operations Associate
The New York Times Advertising Sales Representative
The Walt Disney Company Merchandising
Uber Account Manager Marketing and Sales Representative Restaurant Partnership Representative
Under Armour Human Resources, Business Professional
University of Maryland, College Park Communication Assistant IT Systems Programmer Operations Assistant Video Intern
University of Pennsylvania Research Specialist
U.S. Department of Education Research Assistant
U.S. Department of Justice Document Management Specialist Operation Support Technician
U.S. Department of State Case Assistant
U.S. House of Representatives Design and Multimedia Producer Press Assistant
Walt Disney World Resort Disney College Program Cast Member
Whole Foods Market, Inc. Graphic Artist
Wolf Trap Stitcher
Yelp Account Executive
28
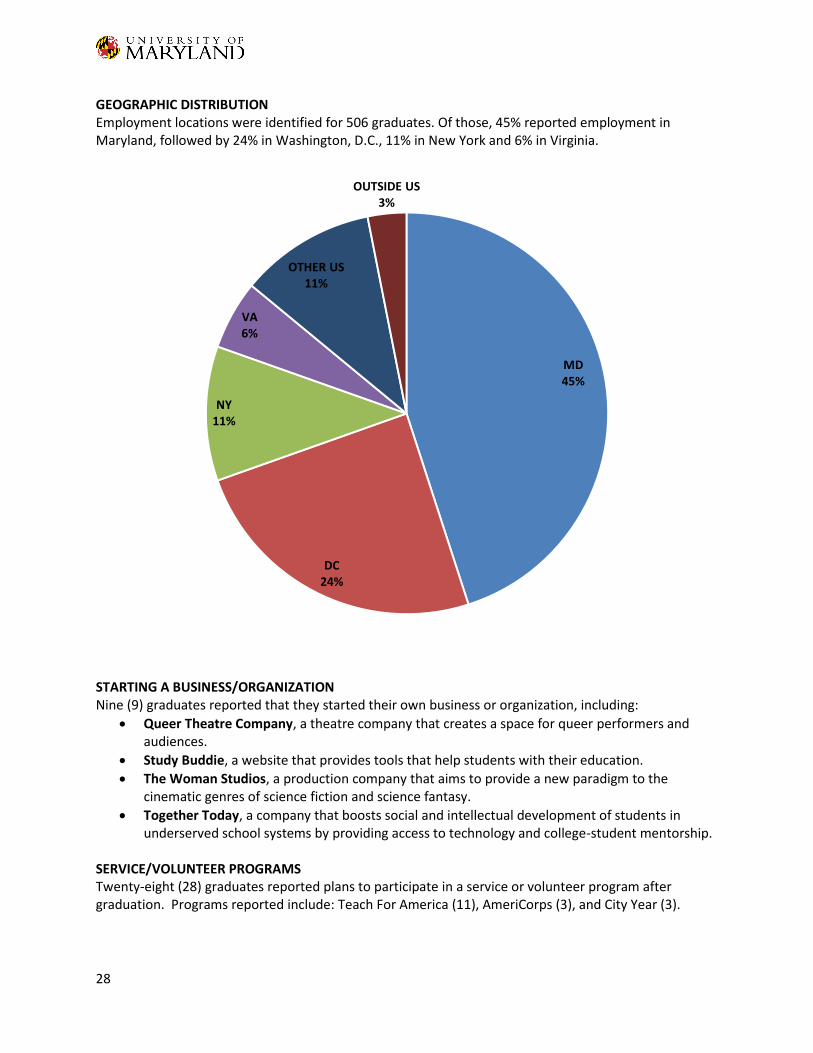
GEOGRAPHIC DISTRIBUTION Employment locations were identified for 506 graduates. Of those, 45% reported employment in Maryland, followed by 24% in Washington, D.C., 11% in New York and 6% in Virginia.
STARTING A BUSINESS/ORGANIZATION Nine (9) graduates reported that they started their own business or organization, including:
Queer Theatre Company, a theatre company that creates a space for queer performers and audiences.
Study Buddie, a website that provides tools that help students with their education.
The Woman Studios, a production company that aims to provide a new paradigm to the cinematic genres of science fiction and science fantasy.
Together Today, a company that boosts social and intellectual development of students in underserved school systems by providing access to technology and college-student mentorship.
SERVICE/VOLUNTEER PROGRAMS Twenty-eight (28) graduates reported plans to participate in a service or volunteer program after graduation. Programs reported include: Teach For America (11), AmeriCorps (3), and City Year (3).
MD45%
DC24%
NY11%
VA6%
OTHER US11%
OUTSIDE US3%
29
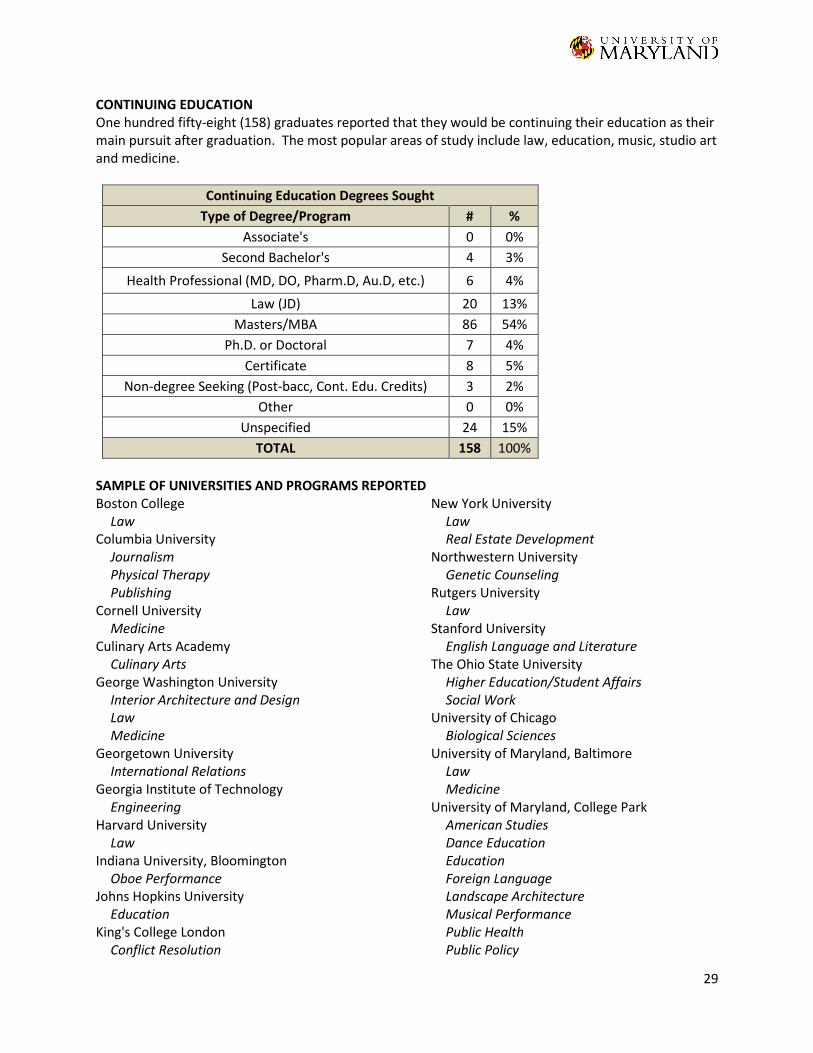
CONTINUING EDUCATION One hundred fifty-eight (158) graduates reported that they would be continuing their education as their main pursuit after graduation. The most popular areas of study include law, education, music, studio art and medicine.
Continuing Education Degrees Sought
Type of Degree/Program # %
Associate's 0 0%
Second Bachelor's 4 3%
Health Professional (MD, DO, Pharm.D, Au.D, etc.) 6 4%
Law (JD) 20 13%
Masters/MBA 86 54%
Ph.D. or Doctoral 7 4%
Certificate 8 5%
Non-degree Seeking (Post-bacc, Cont. Edu. Credits) 3 2%
Other 0 0%
Unspecified 24 15%
TOTAL 158 100%
SAMPLE OF UNIVERSITIES AND PROGRAMS REPORTEDBoston College
Law Columbia University
Journalism Physical Therapy Publishing
Cornell University Medicine
Culinary Arts Academy Culinary Arts
George Washington University Interior Architecture and Design Law Medicine
Georgetown University International Relations
Georgia Institute of Technology Engineering
Harvard University Law
Indiana University, Bloomington Oboe Performance
Johns Hopkins University Education
King's College London Conflict Resolution
New York University Law Real Estate Development
Northwestern University Genetic Counseling
Rutgers University Law
Stanford University English Language and Literature
The Ohio State University Higher Education/Student Affairs Social Work
University of Chicago Biological Sciences
University of Maryland, Baltimore Law Medicine
University of Maryland, College Park American Studies Dance Education Education Foreign Language Landscape Architecture Musical Performance Public Health Public Policy
30
University of Miami Law
University of Rochester Music
University of Southern California International Relations
University of Texas at Austin Physics
University of Virginia English Language and Literature Law
Wake Forest University Management
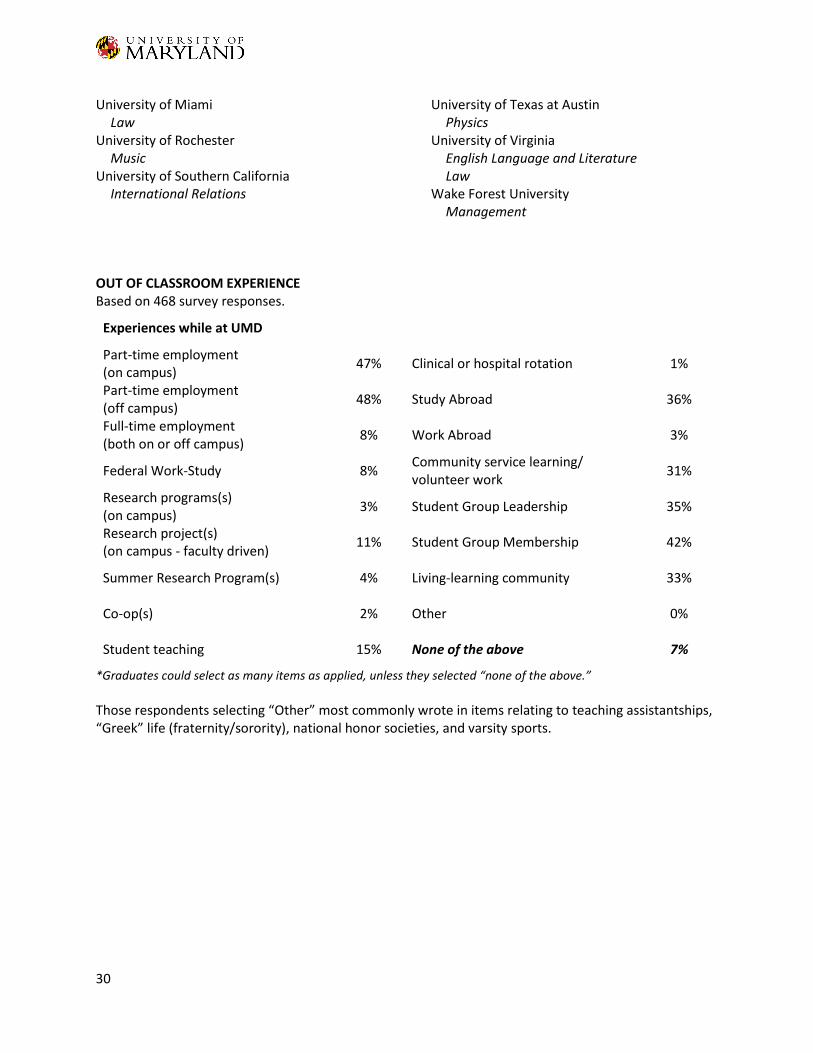
OUT OF CLASSROOM EXPERIENCE Based on 468 survey responses.
Experiences while at UMD
Part-time employment (on campus)
47% Clinical or hospital rotation 1%
Part-time employment (off campus)
48% Study Abroad 36%
Full-time employment (both on or off campus)
8% Work Abroad 3%
Federal Work-Study 8% Community service learning/ volunteer work
31%
Research programs(s) (on campus)
3% Student Group Leadership 35%
Research project(s) (on campus - faculty driven)
11% Student Group Membership 42%
Summer Research Program(s) 4% Living-learning community 33%
Co-op(s) 2% Other 0%
Student teaching 15% None of the above 7%
*Graduates could select as many items as applied, unless they selected “none of the above.”
Those respondents selecting “Other” most commonly wrote in items relating to teaching assistantships, “Greek” life (fraternity/sorority), national honor societies, and varsity sports.
31
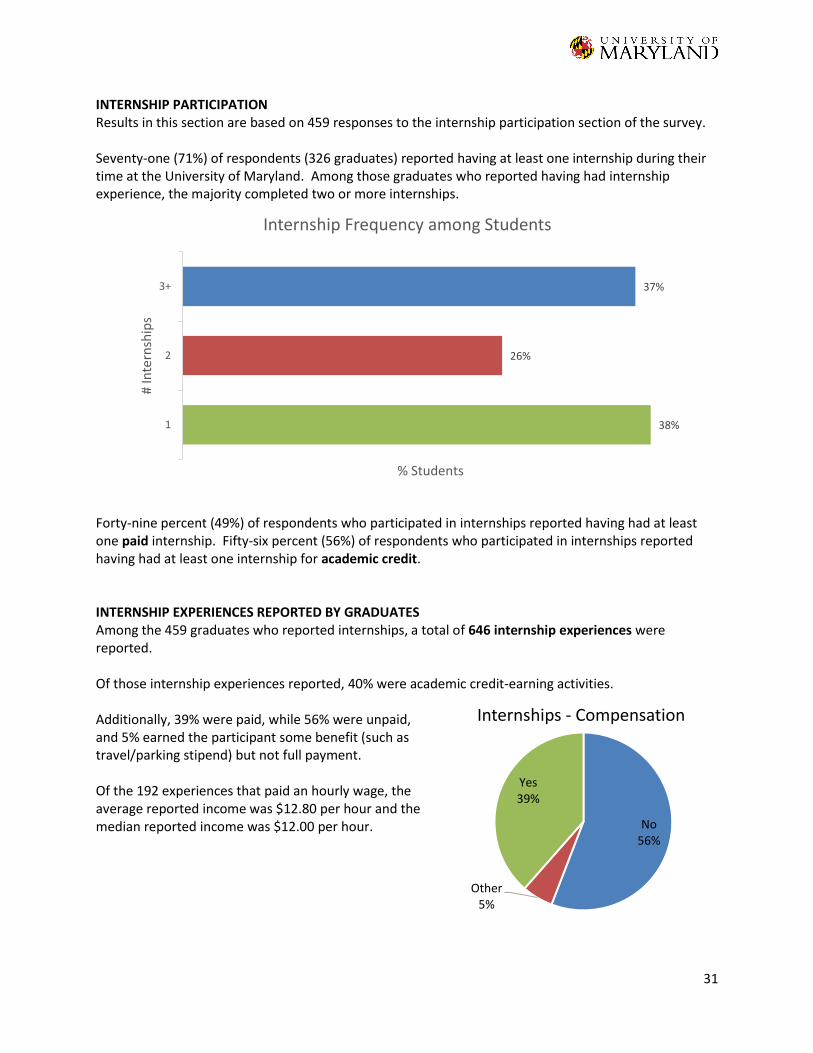
INTERNSHIP PARTICIPATION Results in this section are based on 459 responses to the internship participation section of the survey. Seventy-one (71%) of respondents (326 graduates) reported having at least one internship during their time at the University of Maryland. Among those graduates who reported having had internship experience, the majority completed two or more internships.
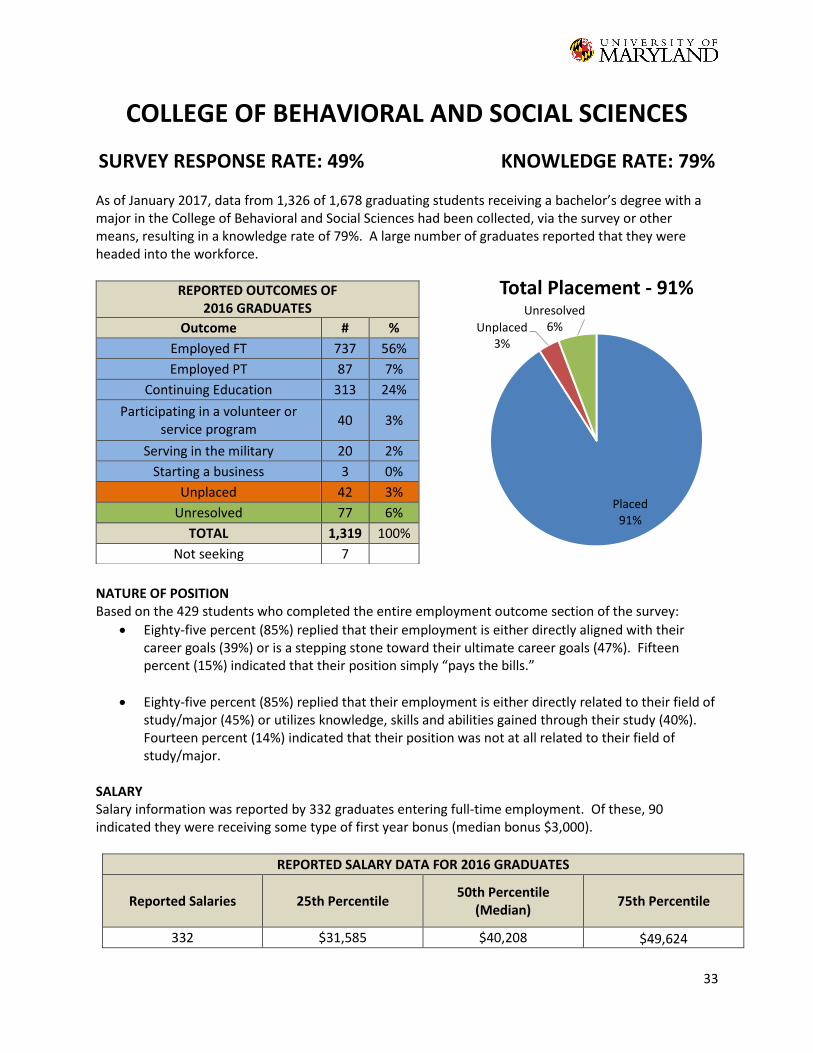
Forty-nine percent (49%) of respondents who participated in internships reported having had at least one paid internship. Fifty-six percent (56%) of respondents who participated in internships reported having had at least one internship for academic credit. INTERNSHIP EXPERIENCES REPORTED BY GRADUATES Among the 459 graduates who reported internships, a total of 646 internship experiences were reported. Of those internship experiences reported, 40% were academic credit-earning activities. Additionally, 39% were paid, while 56% were unpaid, and 5% earned the participant some benefit (such as travel/parking stipend) but not full payment. Of the 192 experiences that paid an hourly wage, the average reported income was $12.80 per hour and the median reported income was $12.00 per hour.
38%
26%
37%
1
2
3+
% Students
# In
tern
ship
s
Internship Frequency among Students
No56%
Other5%
Yes39%
Internships - Compensation

33
COLLEGE OF BEHAVIORAL AND SOCIAL SCIENCES
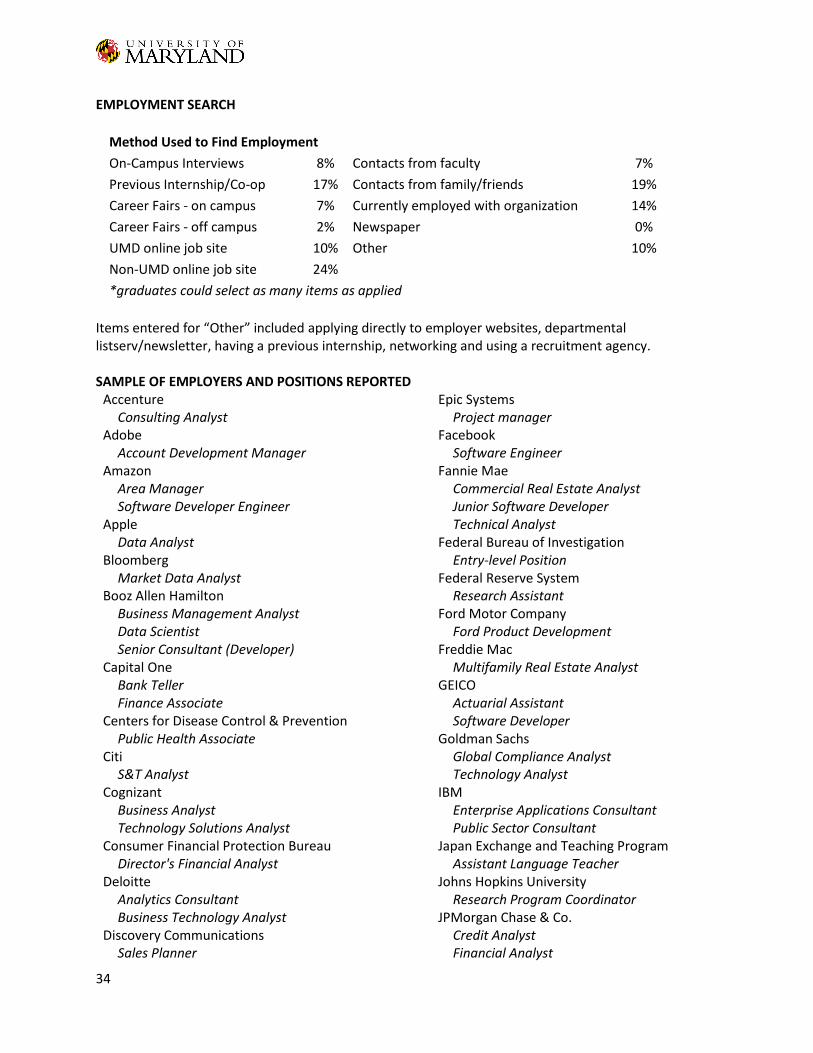
SURVEY RESPONSE RATE: 49% KNOWLEDGE RATE: 79%
As of January 2017, data from 1,326 of 1,678 graduating students receiving a bachelor’s degree with a major in the College of Behavioral and Social Sciences had been collected, via the survey or other means, resulting in a knowledge rate of 79%. A large number of graduates reported that they were headed into the workforce.
NATURE OF POSITION Based on the 429 students who completed the entire employment outcome section of the survey:
Eighty-five percent (85%) replied that their employment is either directly aligned with their career goals (39%) or is a stepping stone toward their ultimate career goals (47%). Fifteen percent (15%) indicated that their position simply “pays the bills.”
Eighty-five percent (85%) replied that their employment is either directly related to their field of study/major (45%) or utilizes knowledge, skills and abilities gained through their study (40%). Fourteen percent (14%) indicated that their position was not at all related to their field of study/major.
SALARY Salary information was reported by 332 graduates entering full-time employment. Of these, 90 indicated they were receiving some type of first year bonus (median bonus $3,000).
REPORTED SALARY DATA FOR 2016 GRADUATES
Reported Salaries 25th Percentile 50th Percentile
(Median) 75th Percentile
332 $31,585 $40,208 $49,624
REPORTED OUTCOMES OF 2016 GRADUATES
Outcome # %
Employed FT 737 56%
Employed PT 87 7%
Continuing Education 313 24%
Participating in a volunteer or service program
40 3%
Serving in the military 20 2%
Starting a business 3 0%
Unplaced 42 3%
Unresolved 77 6%
TOTAL 1,319 100%
Not seeking 7
Placed91%
Unplaced3%
Unresolved6%
Total Placement - 91%
34
EMPLOYMENT SEARCH
Method Used to Find Employment
On-Campus Interviews 8% Contacts from faculty 7%
Previous Internship/Co-op 17% Contacts from family/friends 19%
Career Fairs - on campus 7% Currently employed with organization 14%
Career Fairs - off campus 2% Newspaper 0%
UMD online job site 10% Other 10%
Non-UMD online job site 24% *graduates could select as many items as applied
Items entered for “Other” included applying directly to employer websites, departmental listserv/newsletter, having a previous internship, networking and using a recruitment agency. SAMPLE OF EMPLOYERS AND POSITIONS REPORTED
Accenture Consulting Analyst
Adobe Account Development Manager
Amazon Area Manager Software Developer Engineer
Apple Data Analyst
Bloomberg Market Data Analyst
Booz Allen Hamilton Business Management Analyst Data Scientist Senior Consultant (Developer)
Capital One Bank Teller Finance Associate
Centers for Disease Control & Prevention Public Health Associate
Citi S&T Analyst
Cognizant Business Analyst Technology Solutions Analyst
Consumer Financial Protection Bureau Director's Financial Analyst
Deloitte Analytics Consultant Business Technology Analyst
Discovery Communications Sales Planner
Epic Systems Project manager
Facebook Software Engineer
Fannie Mae Commercial Real Estate Analyst Junior Software Developer Technical Analyst
Federal Bureau of Investigation Entry-level Position
Federal Reserve System Research Assistant
Ford Motor Company Ford Product Development
Freddie Mac Multifamily Real Estate Analyst
GEICO Actuarial Assistant Software Developer
Goldman Sachs Global Compliance Analyst Technology Analyst
IBM Enterprise Applications Consultant Public Sector Consultant
Japan Exchange and Teaching Program Assistant Language Teacher
Johns Hopkins University Research Program Coordinator
JPMorgan Chase & Co. Credit Analyst Financial Analyst
35
Kennedy Krieger Institute Behavioral Data Specialist
KPMG Credit Risk Associate Federal Audit Associate
Lockheed Martin Employee Benefits Rep. Associate Financial Analyst Software Engineering Associate
Marriott International Claims Representative Recruiting Coordinator
Maryland General Assembly Community Liaison for Delegate Alonzo Washington - Legislative Director
Microsoft Corporation Program Manager
Morgan Stanley Business Analyst Financial Analyst Operations Analyst
National Institute of Standards and Technology Management and Program Analyst
National Institutes of Health Post Baccalaureate IRTA Research Lab Technician Intermediate
National Oceanic & Atmospheric Administration
Cartographer National Security Agency
Budget Analyst Intelligence Analyst Developmental Program
PepsiCo Sales Associate
PricewaterhouseCoopers Assurance Associate Public Sector Management Consulting Associate Transfer Pricing Associate
Prudential Financial Business Analyst Financial Advisor Preschool Teacher
T. Rowe Price Associate Investment Fellowship Program Purchasing Specialist
Tesla Associate Executive Assistant
The World Bank Group Short Term Temporary
Under Armour Human Resources, Business Professional
University of Maryland, College Park Faculty Research Assistant Multi Media Assistant
U.S. Census Bureau GIS Technician Survey Statistician
U.S. Department of Defense Research Assistant
U.S. Department of Education Research Assistant
U.S. Department of Homeland Security Customs & Border Protection Officer
U.S. Department of Justice Case Operator Intern Legal Assistant Operational Support Technician Paralegal Specialist Trainee
U.S. Department of Labor Economist Workforce Analyst
U.S. Department of State Contracting Specialist
U.S. Environmental Protection Agency Innovation Team Support Specialist
U.S. Federal Government Development Program
U.S. Food and Drug Administration CFSAN ORISE Fellow Financial Crimes Specialist
U.S. House of Representatives Constituent Liaison Legislative Correspondent Special Events and Protocol Staff Assistant
Walter Reed Army Institute of Research Research Assistant
Wells Fargo Financial Advisor Securities Analyst
36
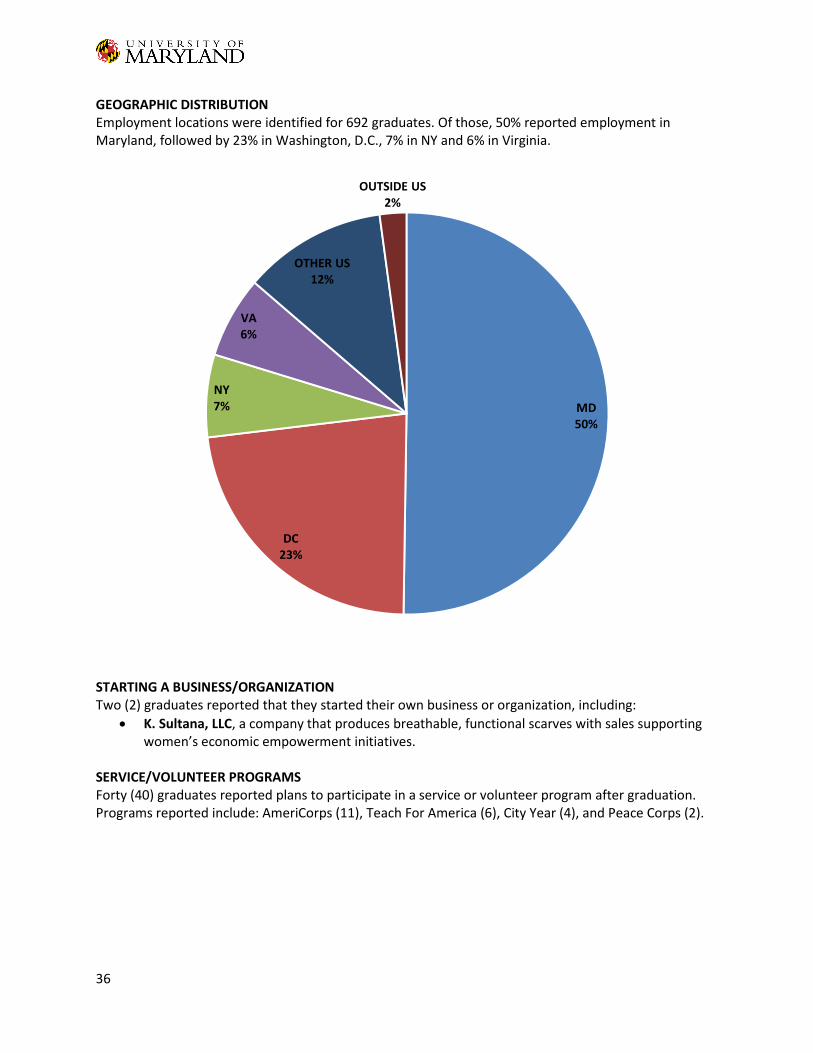
GEOGRAPHIC DISTRIBUTION Employment locations were identified for 692 graduates. Of those, 50% reported employment in Maryland, followed by 23% in Washington, D.C., 7% in NY and 6% in Virginia.
STARTING A BUSINESS/ORGANIZATION Two (2) graduates reported that they started their own business or organization, including:
K. Sultana, LLC, a company that produces breathable, functional scarves with sales supporting women’s economic empowerment initiatives.
SERVICE/VOLUNTEER PROGRAMS Forty (40) graduates reported plans to participate in a service or volunteer program after graduation. Programs reported include: AmeriCorps (11), Teach For America (6), City Year (4), and Peace Corps (2).
MD50%
DC23%
NY7%
VA6%
OTHER US12%
OUTSIDE US2%
37
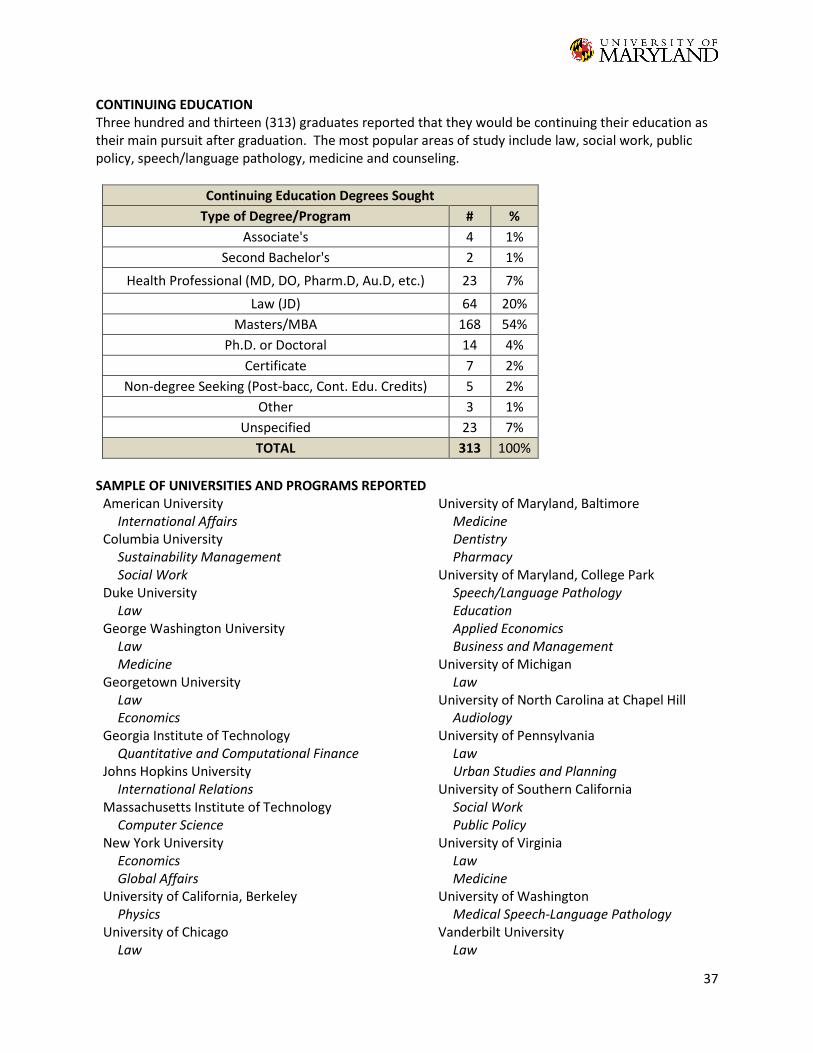
CONTINUING EDUCATION Three hundred and thirteen (313) graduates reported that they would be continuing their education as their main pursuit after graduation. The most popular areas of study include law, social work, public policy, speech/language pathology, medicine and counseling.
Continuing Education Degrees Sought
Type of Degree/Program # %
Associate's 4 1%
Second Bachelor's 2 1%
Health Professional (MD, DO, Pharm.D, Au.D, etc.) 23 7%
Law (JD) 64 20%
Masters/MBA 168 54%
Ph.D. or Doctoral 14 4%
Certificate 7 2%
Non-degree Seeking (Post-bacc, Cont. Edu. Credits) 5 2%
Other 3 1%
Unspecified 23 7%
TOTAL 313 100%
SAMPLE OF UNIVERSITIES AND PROGRAMS REPORTED
American University International Affairs
Columbia University Sustainability Management Social Work
Duke University Law
George Washington University Law Medicine
Georgetown University Law Economics
Georgia Institute of Technology Quantitative and Computational Finance
Johns Hopkins University International Relations
Massachusetts Institute of Technology Computer Science
New York University Economics Global Affairs
University of California, Berkeley Physics
University of Chicago Law
University of Maryland, Baltimore Medicine Dentistry Pharmacy
University of Maryland, College Park Speech/Language Pathology Education Applied Economics Business and Management
University of Michigan Law
University of North Carolina at Chapel Hill Audiology
University of Pennsylvania Law Urban Studies and Planning
University of Southern California Social Work Public Policy
University of Virginia Law Medicine
University of Washington Medical Speech-Language Pathology
Vanderbilt University Law
38
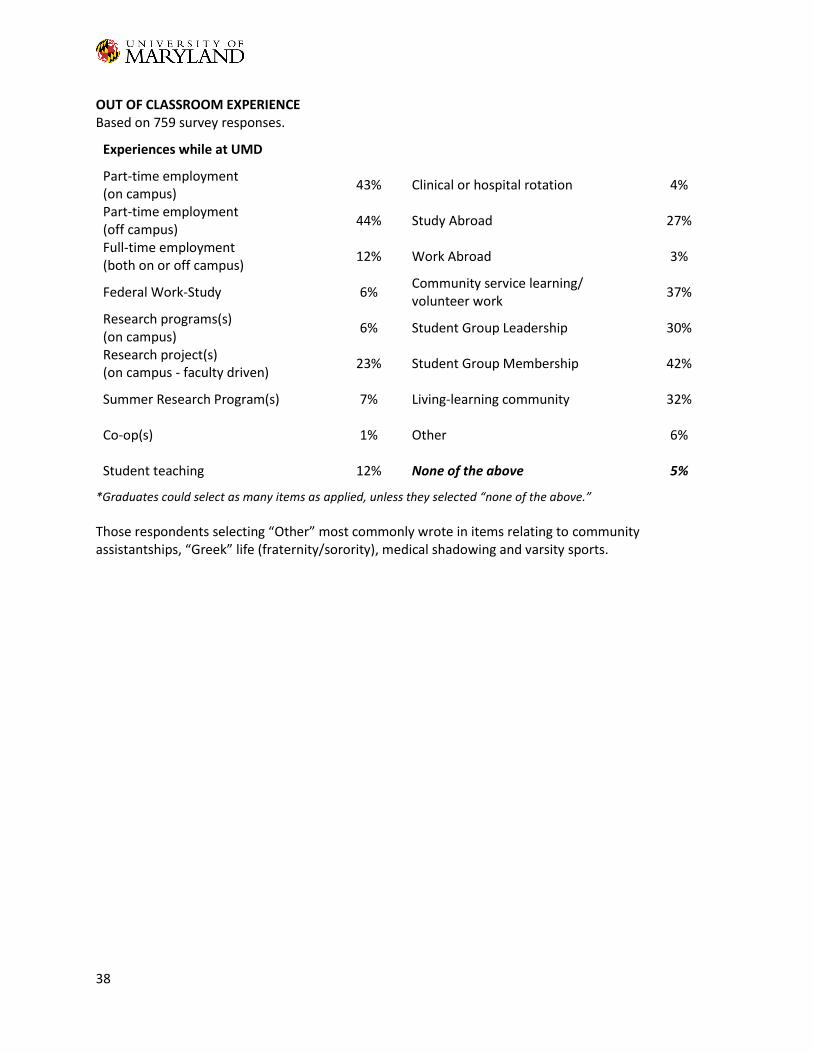
OUT OF CLASSROOM EXPERIENCE Based on 759 survey responses.
Experiences while at UMD
Part-time employment (on campus) 43% Clinical or hospital rotation 4%
Part-time employment (off campus)
44% Study Abroad 27%
Full-time employment (both on or off campus)
12% Work Abroad 3%
Federal Work-Study 6% Community service learning/ volunteer work
37%
Research programs(s) (on campus)
6% Student Group Leadership 30%
Research project(s) (on campus - faculty driven)
23% Student Group Membership 42%
Summer Research Program(s) 7% Living-learning community 32%
Co-op(s) 1% Other 6%
Student teaching 12% None of the above 5%
*Graduates could select as many items as applied, unless they selected “none of the above.”
Those respondents selecting “Other” most commonly wrote in items relating to community assistantships, “Greek” life (fraternity/sorority), medical shadowing and varsity sports.
39
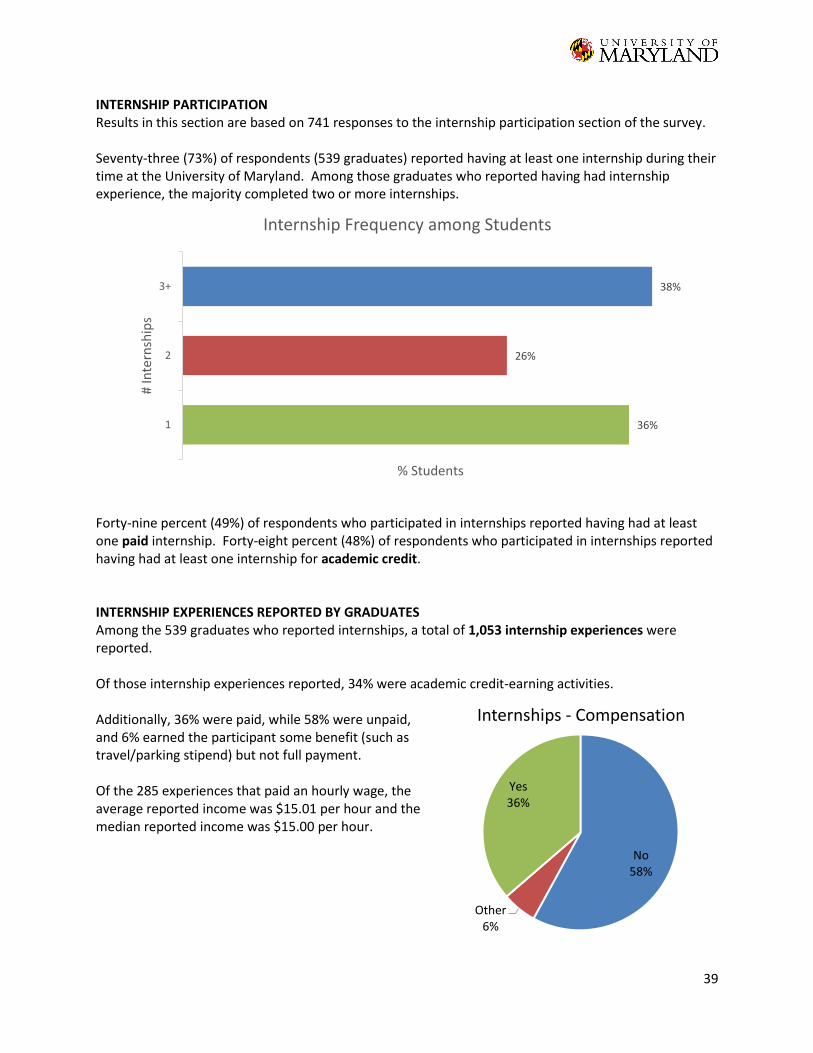
INTERNSHIP PARTICIPATION Results in this section are based on 741 responses to the internship participation section of the survey. Seventy-three (73%) of respondents (539 graduates) reported having at least one internship during their time at the University of Maryland. Among those graduates who reported having had internship experience, the majority completed two or more internships.
Forty-nine percent (49%) of respondents who participated in internships reported having had at least one paid internship. Forty-eight percent (48%) of respondents who participated in internships reported having had at least one internship for academic credit. INTERNSHIP EXPERIENCES REPORTED BY GRADUATES Among the 539 graduates who reported internships, a total of 1,053 internship experiences were reported. Of those internship experiences reported, 34% were academic credit-earning activities. Additionally, 36% were paid, while 58% were unpaid, and 6% earned the participant some benefit (such as travel/parking stipend) but not full payment. Of the 285 experiences that paid an hourly wage, the average reported income was $15.01 per hour and the median reported income was $15.00 per hour.
36%
26%
38%
1
2
3+
% Students
# In
tern
ship
s
Internship Frequency among Students
No58%
Other6%
Yes36%
Internships - Compensation

41
COLLEGE OF COMPUTER, MATHEMATICAL, AND NATURAL SCIENCES
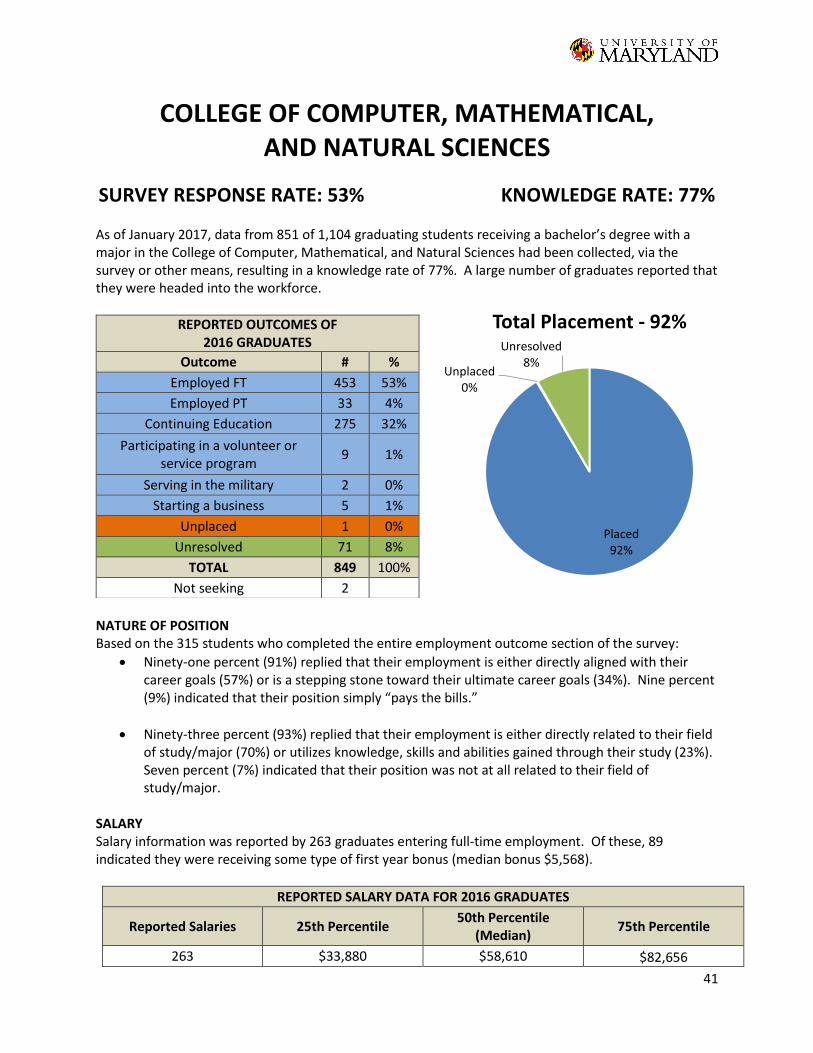
SURVEY RESPONSE RATE: 53% KNOWLEDGE RATE: 77%
As of January 2017, data from 851 of 1,104 graduating students receiving a bachelor’s degree with a major in the College of Computer, Mathematical, and Natural Sciences had been collected, via the survey or other means, resulting in a knowledge rate of 77%. A large number of graduates reported that they were headed into the workforce.
NATURE OF POSITION Based on the 315 students who completed the entire employment outcome section of the survey:
Ninety-one percent (91%) replied that their employment is either directly aligned with their career goals (57%) or is a stepping stone toward their ultimate career goals (34%). Nine percent (9%) indicated that their position simply “pays the bills.”
Ninety-three percent (93%) replied that their employment is either directly related to their field of study/major (70%) or utilizes knowledge, skills and abilities gained through their study (23%). Seven percent (7%) indicated that their position was not at all related to their field of study/major.
SALARY Salary information was reported by 263 graduates entering full-time employment. Of these, 89 indicated they were receiving some type of first year bonus (median bonus $5,568).
REPORTED SALARY DATA FOR 2016 GRADUATES
Reported Salaries 25th Percentile 50th Percentile
(Median) 75th Percentile
263 $33,880 $58,610 $82,656
REPORTED OUTCOMES OF 2016 GRADUATES
Outcome # %
Employed FT 453 53%
Employed PT 33 4%
Continuing Education 275 32%
Participating in a volunteer or service program
9 1%
Serving in the military 2 0%
Starting a business 5 1%
Unplaced 1 0%
Unresolved 71 8%
TOTAL 849 100%
Not seeking 2
Placed92%
Unplaced0%
Unresolved8%
Total Placement - 92%
42
EMPLOYMENT SEARCH
Method Used to Find Employment
On-Campus Interviews 17% Contacts from faculty 5%
Previous Internship/Co-op 23% Contacts from family/friends 18%
Career Fairs - on campus 21% Currently employed with organization 9%
Career Fairs - off campus 1% Newspaper 1%
UMD online job site 10% Other 10%
Non-UMD online job site 19% *graduates could select as many items as applied
Items entered for “Other” included applying directly to employer websites, departmental listserv/newsletter, LinkedIn, using a recruitment agency and email contact. SAMPLE OF EMPLOYERS AND POSITIONS REPORTED 3M
Java Software Engineer A Wider Circle
Management Associate Accenture
Management Consulting Analyst Software Engineer Technology Engineer Analyst
Adobe Associate Web Consultant
Amazon Software Development Engineer
American Institutes for Research Quality Controller Research Assistant
Appian Corporation Software Engineer
Applied Predictive Technologies Software Engineer
AT&T Junior Programmer
BAE Systems Applications Developer
Bank of America Software Developer Technology Analyst
Bloomberg Software Engineer
Booz Allen Hamilton Data Scientist Software Engineer Staff Scientist
Capital Cardiac Care Medical Assistant
Capital One Associate Software Engineer Cyber Security Engineer
Center for American Progress Environment and Energy Intern
CosmosID Bioinformatics Analyst
Easy Dynamics Corporation Consultant
Epic Systems Software Developer
Exelon Analyst IT
ExxonMobil Chemist
Facebook Software Engineer
Fannie Mae Operations and Technology Associate
Federal Reserve System Research Assistant
GE Healthcare Clinical Education Specialist
GEICO Actuarial Assistant Software Developer
GeneDx Accession Tech DNA Extraction Technician
43
Georgetown University Research Assistant
Goldman Sachs Commodities Strategist Technology Analyst
Google Software Engineer
Howard Hughes Medical Institute Research Technician
Huntington Learning Center Academic Tutor
IBM Enterprise Applications Consultant
Information Management Services Analyst Programmer Software Developer
Johns Hopkins University Laboratory Assistant Software Engineer
Johns Hopkins University Applied Physics Laboratory
Analyst Software Developer
JPMorgan Chase & Co. Software Developer
KPMG Consultant
Leidos Software Engineer
Lockheed Martin Software Engineer
Los Alamos National Laboratory Post-Baccalaureate Research Assistant
Maryland Solar Solutions, Inc Solar Consultant
MedStar Health Research Assistant Simulation Specialist
Microsoft Corporation Program Manager Software Development Engineer
MicroStrategy Associate Software Engineer
Montgomery County Public Schools Math Teacher
NASA Aerospace Engineer Flight Software Engineer
National Aquarium Guest Engagement Interpretative Aide
National Institutes of Health Post-Baccalaureate Research Fellow
National Security Agency Software Developer
Northrop Grumman Software Engineer
Northwestern Mutual Financial Representative
Oil Price and Information Service Software Engineer
Palantir Technologies Forward Deployed Software Engineer
Patient First Medical Assistant
PayPal Software Engineer
Physicians Eye Care Center Ophthalmic Technician
Pivot Physical Therapy Physical Therapy Technician
Redfin Software Development Engineer
Royal Bank of Canada - Capital Markets Technology Analyst
ScribeAmerica Medical Scribe
T. Rowe Price Investment Fellowship Program
The Henry M. Jackson Foundation for the Advancement of Military Medicine
Laboratory Manager Research Assistant
The Washington Post Web Developer
Thermo Fisher Scientific Protein Expression Scientist
Trillium Trading Equity Trader
Twitch Software Developer
University of Maryland, College Park Faculty Research Assistant Lab Manager Magnetic Systems Lead Pharmacy Technician Software Engineer
44
U.S. Army ORISE Research Participant
U.S. Census Bureau Mathematical Statistician
U.S. Department of Agriculture Biological Science Technician Research Assistant
U.S. Department of Defense Operations Research Analyst
U.S. Department of Justice Paralegal
U.S. Food and Drug Administration
ORISE Research Fellow U.S. Navy
Computer Scientist U.S. News & World Report
Software Developer Walter Reed Army Institute of Research
ORISE Fellow Wayfair
Software Engineer
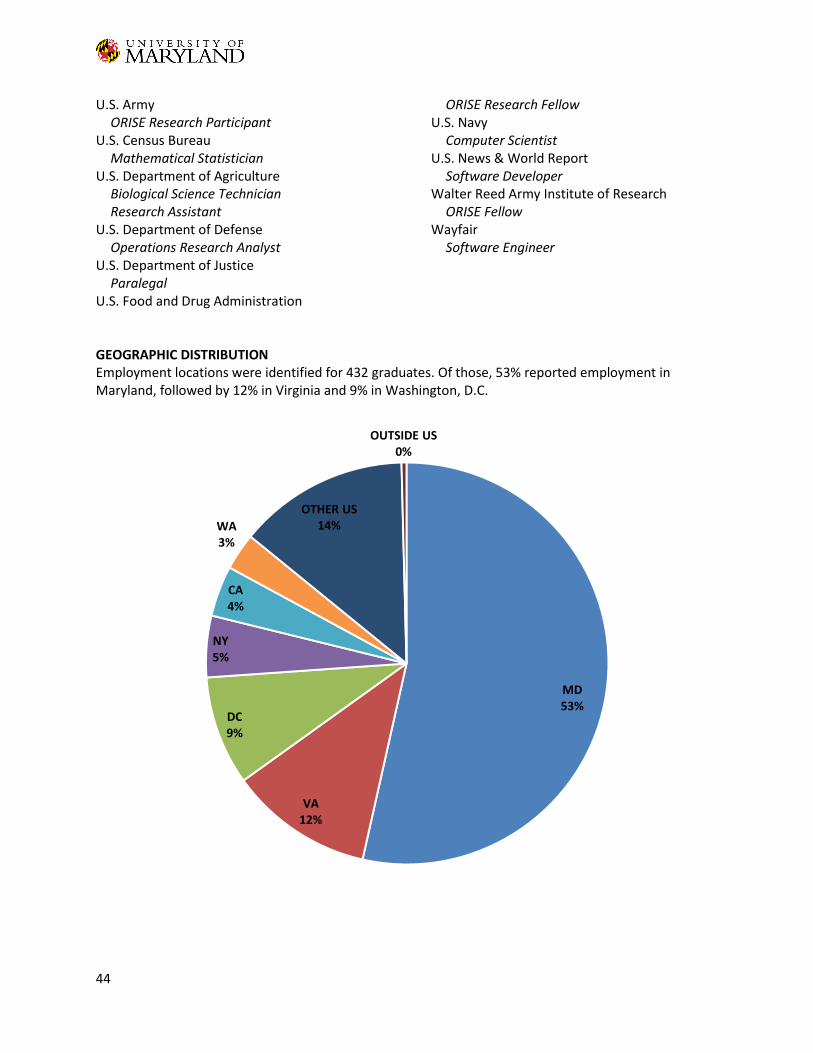
GEOGRAPHIC DISTRIBUTION Employment locations were identified for 432 graduates. Of those, 53% reported employment in Maryland, followed by 12% in Virginia and 9% in Washington, D.C.
MD53%
VA12%
DC9%
NY5%
CA4%
WA3%
OTHER US14%
OUTSIDE US0%
45
STARTING A BUSINESS/ORGANIZATION Five (5) graduates reported that they started their own business or organization, including:
CardBuddy, a company that sells thin wallets that stick to the back of a phone or phone case.
K. Sultana, LLC, a company that produces breathable, functional scarves with sales supporting women’s economic empowerment initiatives.
Limo Prime, LLC, a company that delivers luxury transportation services to the Washington, D.C. area.
Phlogiston Games, a video game company.
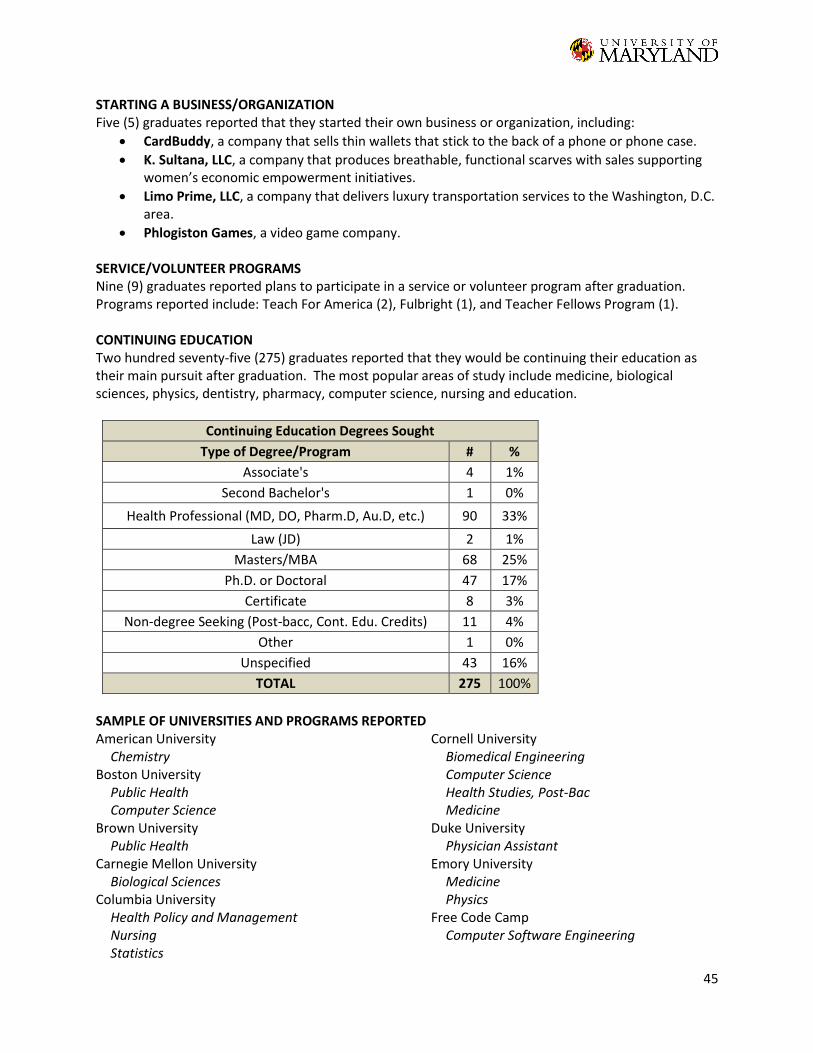
SERVICE/VOLUNTEER PROGRAMS Nine (9) graduates reported plans to participate in a service or volunteer program after graduation. Programs reported include: Teach For America (2), Fulbright (1), and Teacher Fellows Program (1). CONTINUING EDUCATION Two hundred seventy-five (275) graduates reported that they would be continuing their education as their main pursuit after graduation. The most popular areas of study include medicine, biological sciences, physics, dentistry, pharmacy, computer science, nursing and education.
Continuing Education Degrees Sought
Type of Degree/Program # %
Associate's 4 1%
Second Bachelor's 1 0%
Health Professional (MD, DO, Pharm.D, Au.D, etc.) 90 33%
Law (JD) 2 1%
Masters/MBA 68 25%
Ph.D. or Doctoral 47 17%
Certificate 8 3%
Non-degree Seeking (Post-bacc, Cont. Edu. Credits) 11 4%
Other 1 0%
Unspecified 43 16%
TOTAL 275 100%
SAMPLE OF UNIVERSITIES AND PROGRAMS REPORTEDAmerican University
Chemistry Boston University
Public Health Computer Science
Brown University Public Health
Carnegie Mellon University Biological Sciences
Columbia University Health Policy and Management Nursing Statistics
Cornell University Biomedical Engineering Computer Science Health Studies, Post-Bac Medicine
Duke University Physician Assistant
Emory University Medicine Physics
Free Code Camp Computer Software Engineering
46
George Washington University Anatomical and Translational Sciences Medicine
Georgetown University Biological Sciences Medicine Physiology and Biophysics
Georgia Institute of Technology Computer Science Engineering Quantitative and Computational Finance
Harvard University Dentistry
Howard University Pharmacy
Johns Hopkins University Chemistry Biological Sciences Medicine Pathobiology
London School of Economics and Political Science
Financial Mathematics Massachusetts Institute of Technology
Computer Science Mayo Clinic College of Medicine
Medicine New York University
Dentistry Medicine Music
Northwestern University Education Genetic Counseling
Stanford University Biological Sciences
Tulane University Neuroscience
University College London Neurological Science
University of California, Berkeley Computer Science Physics
University of California, San Francisco Medicine
University of Chicago Biological Sciences
University of Illinois at Urbana-Champaign Physics
University of Maryland, Baltimore Law Medicine Nursing Pharmacy Physical Therapy
University of Maryland, College Park Atmospheric and Oceanic Science Biochemistry Biological Sciences Chemistry Computer Science Cybersecurity Education Engineering Environmental Science and Technology Mathematics
University of North Carolina at Chapel Hill Medicine Pharmacy
University of Pennsylvania Dentistry Engineering Medicine
University of Pittsburgh Dentistry
University of Southern California Chemistry
University of Texas at Austin Physics
University of Virginia Medicine
University of Wisconsin-Madison Biological Sciences
Vanderbilt University Law Physics
Virginia Polytechnic Institute and State University
Biological Sciences Washington University in St. Louis
Physics Yale University
Engineering Medicine Physics
47
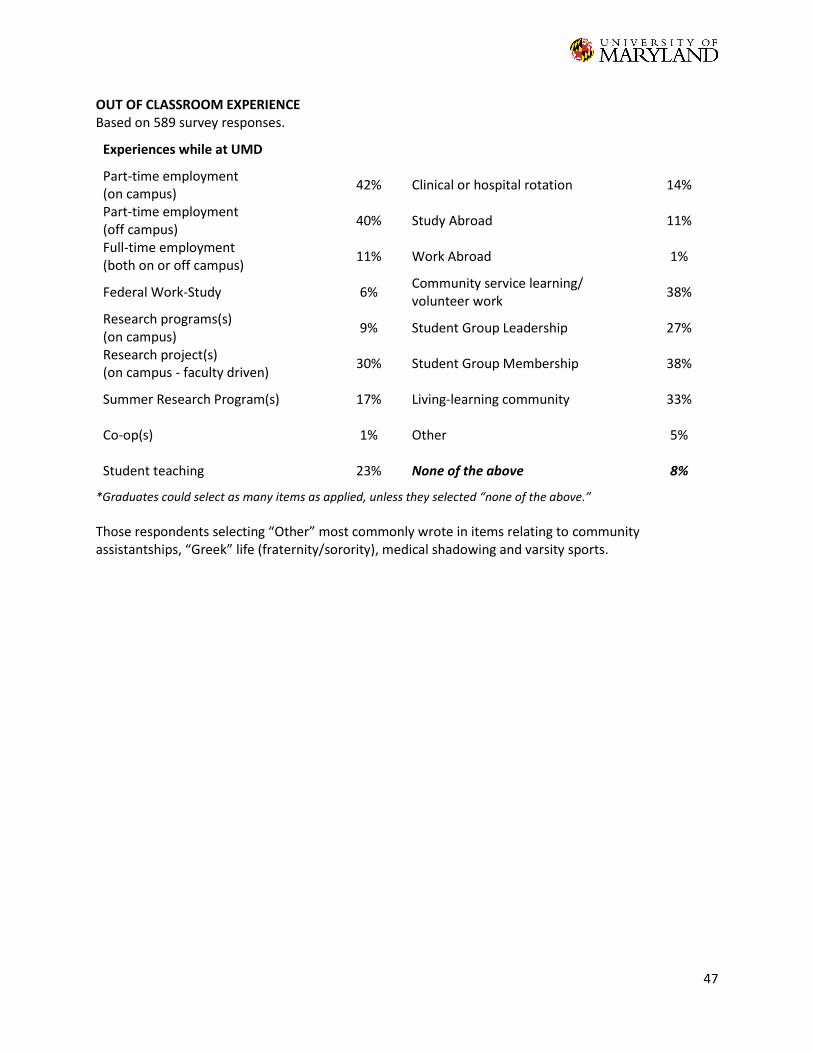
OUT OF CLASSROOM EXPERIENCE Based on 589 survey responses.
Experiences while at UMD
Part-time employment (on campus)
42% Clinical or hospital rotation 14%
Part-time employment (off campus)
40% Study Abroad 11%
Full-time employment (both on or off campus)
11% Work Abroad 1%
Federal Work-Study 6% Community service learning/ volunteer work
38%
Research programs(s) (on campus)
9% Student Group Leadership 27%
Research project(s) (on campus - faculty driven)
30% Student Group Membership 38%
Summer Research Program(s) 17% Living-learning community 33%
Co-op(s) 1% Other 5%
Student teaching 23% None of the above 8%
*Graduates could select as many items as applied, unless they selected “none of the above.”
Those respondents selecting “Other” most commonly wrote in items relating to community assistantships, “Greek” life (fraternity/sorority), medical shadowing and varsity sports.
48
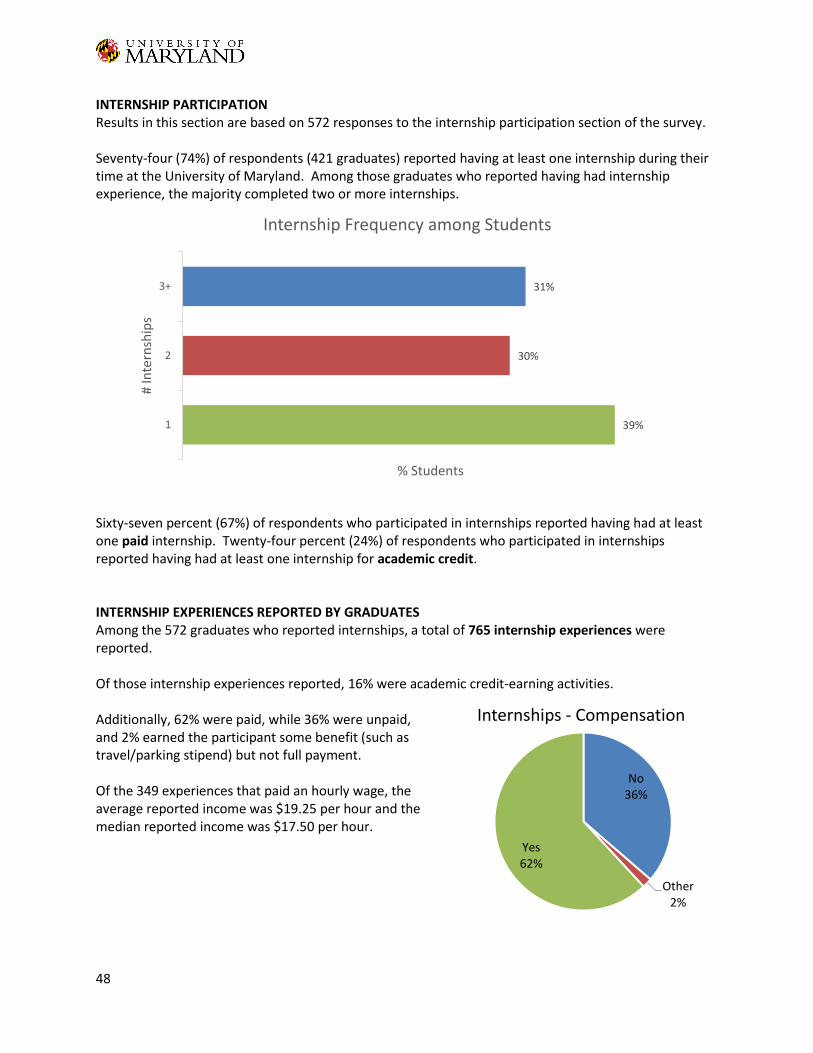
INTERNSHIP PARTICIPATION Results in this section are based on 572 responses to the internship participation section of the survey. Seventy-four (74%) of respondents (421 graduates) reported having at least one internship during their time at the University of Maryland. Among those graduates who reported having had internship experience, the majority completed two or more internships.
Sixty-seven percent (67%) of respondents who participated in internships reported having had at least one paid internship. Twenty-four percent (24%) of respondents who participated in internships reported having had at least one internship for academic credit. INTERNSHIP EXPERIENCES REPORTED BY GRADUATES Among the 572 graduates who reported internships, a total of 765 internship experiences were reported. Of those internship experiences reported, 16% were academic credit-earning activities. Additionally, 62% were paid, while 36% were unpaid, and 2% earned the participant some benefit (such as travel/parking stipend) but not full payment. Of the 349 experiences that paid an hourly wage, the average reported income was $19.25 per hour and the median reported income was $17.50 per hour.
39%
30%
31%
1
2
3+
% Students
# In
tern
ship
s
Internship Frequency among Students
No36%
Other2%
Yes62%
Internships - Compensation
49
COLLEGE OF EDUCATION
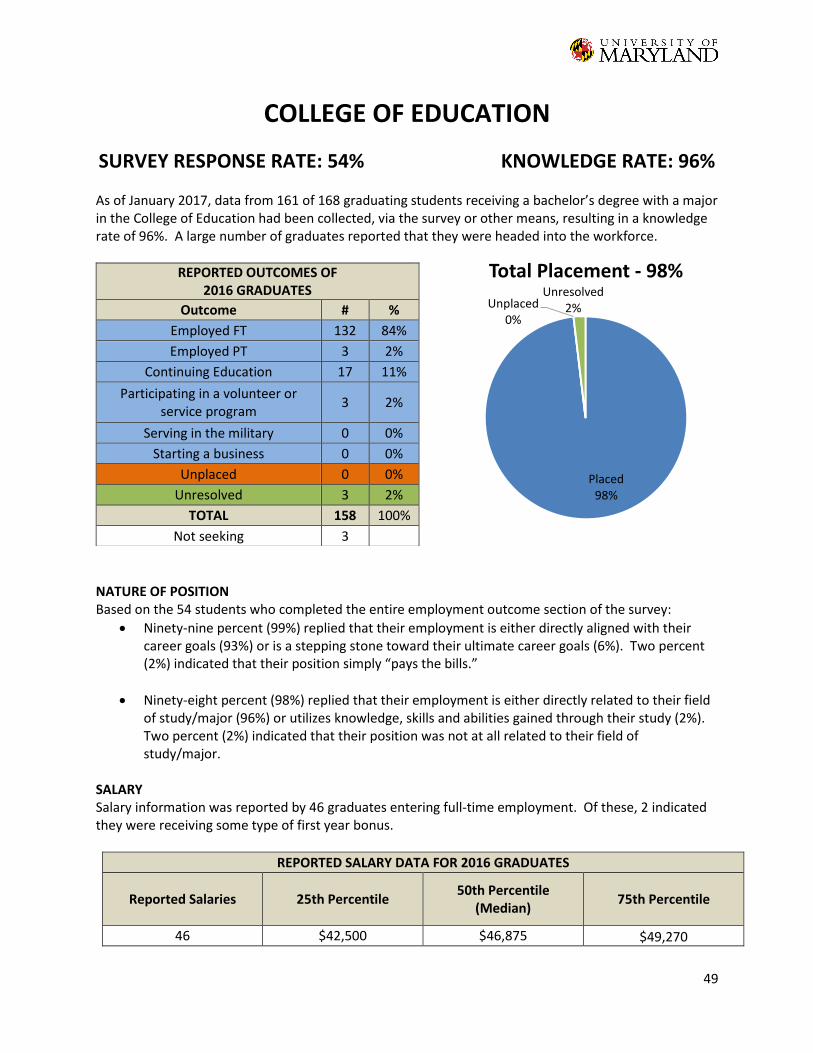
SURVEY RESPONSE RATE: 54% KNOWLEDGE RATE: 96%
As of January 2017, data from 161 of 168 graduating students receiving a bachelor’s degree with a major in the College of Education had been collected, via the survey or other means, resulting in a knowledge rate of 96%. A large number of graduates reported that they were headed into the workforce.
NATURE OF POSITION Based on the 54 students who completed the entire employment outcome section of the survey:
Ninety-nine percent (99%) replied that their employment is either directly aligned with their career goals (93%) or is a stepping stone toward their ultimate career goals (6%). Two percent (2%) indicated that their position simply “pays the bills.”
Ninety-eight percent (98%) replied that their employment is either directly related to their field of study/major (96%) or utilizes knowledge, skills and abilities gained through their study (2%). Two percent (2%) indicated that their position was not at all related to their field of study/major.
SALARY Salary information was reported by 46 graduates entering full-time employment. Of these, 2 indicated they were receiving some type of first year bonus.
REPORTED SALARY DATA FOR 2016 GRADUATES
Reported Salaries 25th Percentile 50th Percentile
(Median) 75th Percentile
46 $42,500 $46,875 $49,270
REPORTED OUTCOMES OF 2016 GRADUATES
Outcome # %
Employed FT 132 84%
Employed PT 3 2%
Continuing Education 17 11%
Participating in a volunteer or service program
3 2%
Serving in the military 0 0%
Starting a business 0 0%
Unplaced 0 0%
Unresolved 3 2%
TOTAL 158 100%
Not seeking 3
Placed98%
Unplaced0%
Unresolved2%
Total Placement - 98%
50
EMPLOYMENT SEARCH
Method Used to Find Employment
On-Campus Interviews 7% Contacts from faculty 13%
Previous Internship/Co-op 30% Contacts from family/friends 13%
Career Fairs - on campus 22% Currently employed with organization 9%
Career Fairs - off campus 9% Newspaper 0%
UMD online job site 6% Other 4%
Non-UMD online job site 19% *graduates could select as many items as applied
Items entered for “Other” included student teaching connections. SAMPLE OF EMPLOYERS AND POSITIONS REPORTED Alexandria City Public Schools
Teacher Anne Arundel County Public Schools
English Teacher High School English Teacher Spanish and Performance and Math Teacher
Baltimore County Public Schools Elementary Education Teacher-5th Grade
Cassaday & Company, Inc. Client Services Associate
Charles County Public Schools Special Education Teacher
Chavez School for Public Policy Elementary Education Teacher-6th Grade
District of Columbia Public Schools Kindergarten Teacher
Explorations Academy Mathematics Teacher
Fairfax County Public Schools Secondary Math Teacher
Frederick County Public Schools Secondary Education Science Teacher
Harford County Public Schools Middle School Math Teacher
HW Wheatley Early Childhood Center Special Education Teacher
James Hubert Blake High School High School Math Teacher
Japan Exchange and Teaching Programme English Teacher
Kids on Campus Lead Teacher
Montgomery County Public Schools Elementary Education Teacher Elementary Special Education Teacher English Teacher Kindergarten Teacher Long Term Substitute Teacher Math Teacher Special Education Teacher
Prince George's County Public Schools Elementary Education Teacher Special Education Teacher
Success Academy Charter School Associate Teacher
TASK English Academy K-6 English Teacher
The Goddard School Lead Teacher Pre-K Teacher
Theodore Roosevelt High School Special Education - Math
U.S. Department of Education Science Teacher
Union Springs Academy English/Bible/Health Teacher
University of Maryland, College Park Operations Assistant - Athletic Department
Wicomico County Public Schools Secondary Mathematics Teacher
Windsor Public Schools Elementary Education Teacher-2nd Grade
51
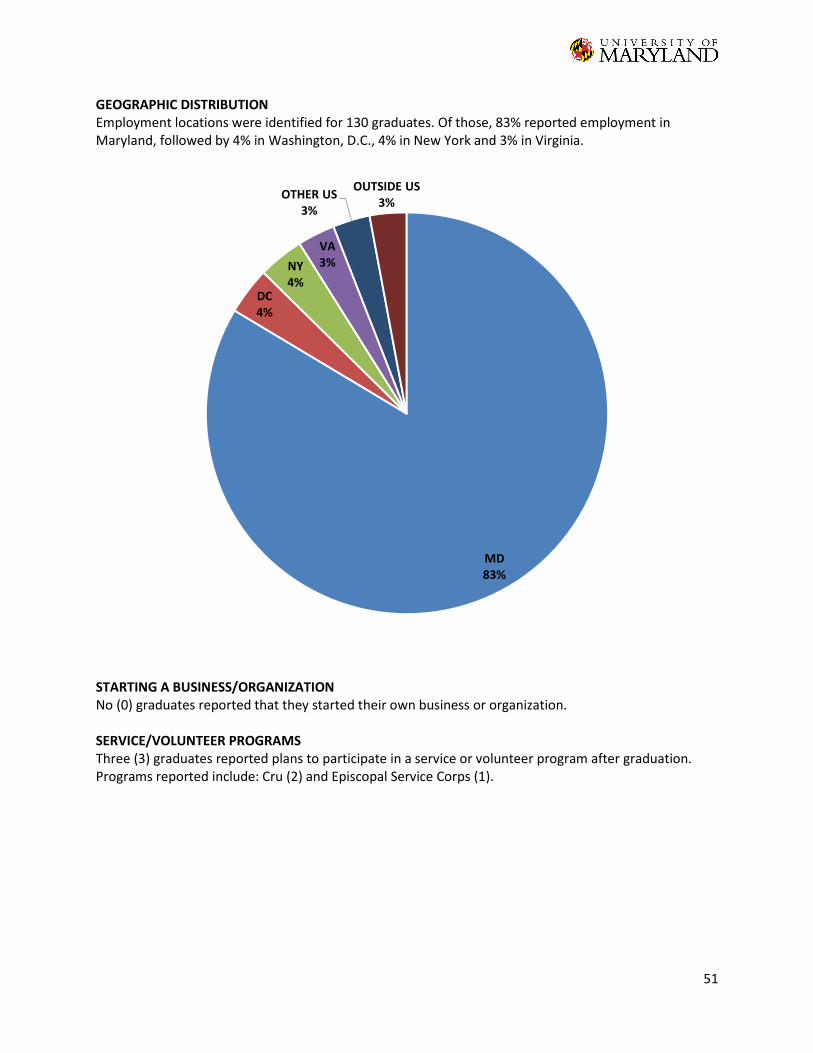
GEOGRAPHIC DISTRIBUTION Employment locations were identified for 130 graduates. Of those, 83% reported employment in Maryland, followed by 4% in Washington, D.C., 4% in New York and 3% in Virginia.
STARTING A BUSINESS/ORGANIZATION No (0) graduates reported that they started their own business or organization. SERVICE/VOLUNTEER PROGRAMS Three (3) graduates reported plans to participate in a service or volunteer program after graduation. Programs reported include: Cru (2) and Episcopal Service Corps (1).
MD83%
DC4%
NY4%
VA3%
OTHER US3%
OUTSIDE US3%
52
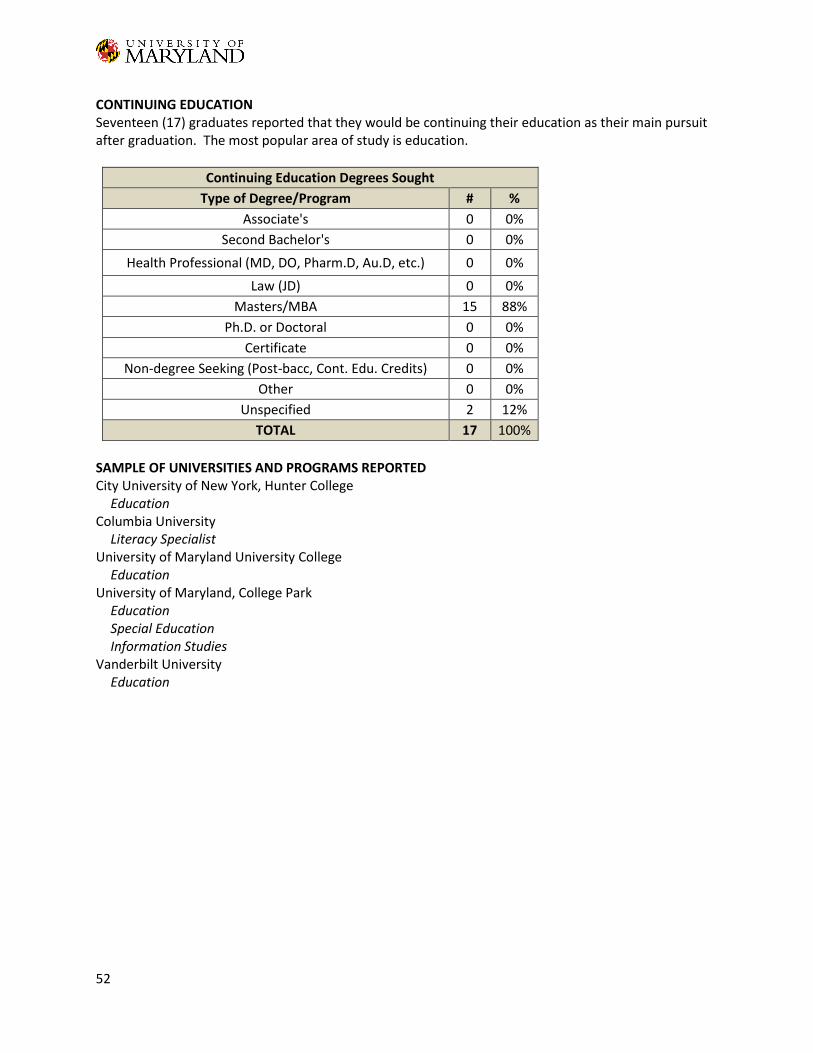
CONTINUING EDUCATION Seventeen (17) graduates reported that they would be continuing their education as their main pursuit after graduation. The most popular area of study is education.
Continuing Education Degrees Sought
Type of Degree/Program # %
Associate's 0 0%
Second Bachelor's 0 0%
Health Professional (MD, DO, Pharm.D, Au.D, etc.) 0 0%
Law (JD) 0 0%
Masters/MBA 15 88%
Ph.D. or Doctoral 0 0%
Certificate 0 0%
Non-degree Seeking (Post-bacc, Cont. Edu. Credits) 0 0%
Other 0 0%
Unspecified 2 12%
TOTAL 17 100%
SAMPLE OF UNIVERSITIES AND PROGRAMS REPORTEDCity University of New York, Hunter College
Education Columbia University
Literacy Specialist University of Maryland University College
Education University of Maryland, College Park
Education Special Education Information Studies
Vanderbilt University Education
53
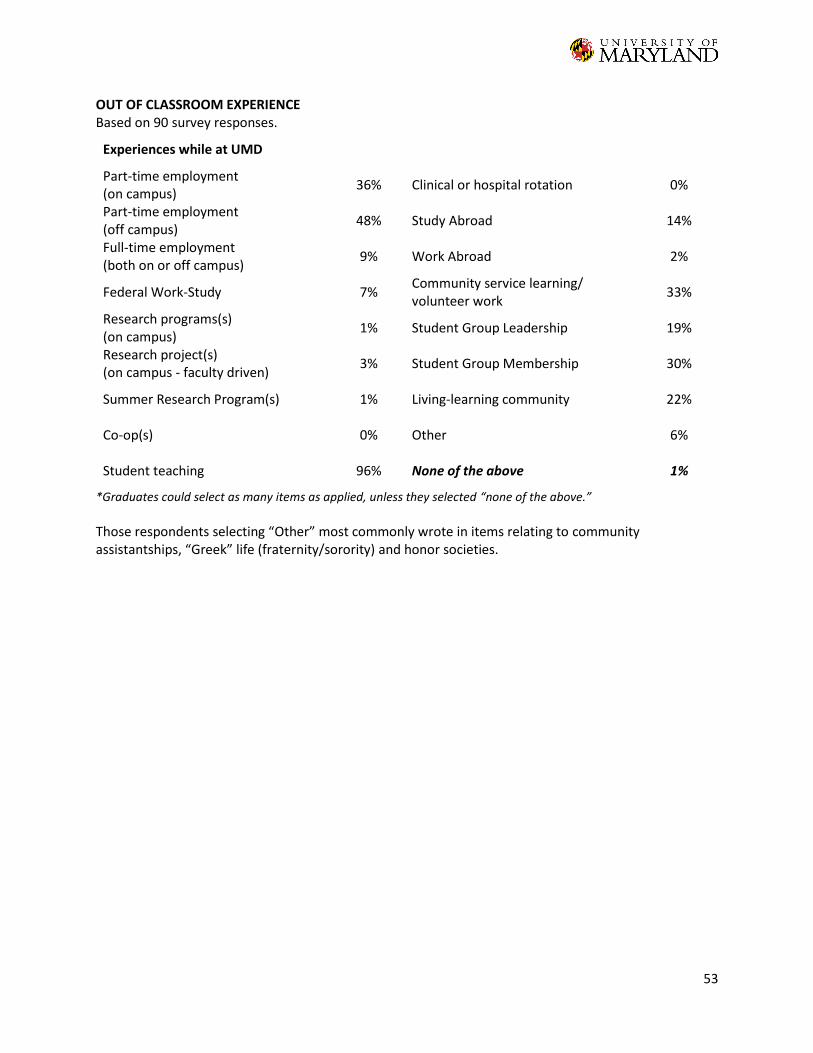
OUT OF CLASSROOM EXPERIENCE Based on 90 survey responses.
Experiences while at UMD
Part-time employment (on campus)
36% Clinical or hospital rotation 0%
Part-time employment (off campus)
48% Study Abroad 14%
Full-time employment (both on or off campus)
9% Work Abroad 2%
Federal Work-Study 7% Community service learning/ volunteer work
33%
Research programs(s) (on campus)
1% Student Group Leadership 19%
Research project(s) (on campus - faculty driven)
3% Student Group Membership 30%
Summer Research Program(s) 1% Living-learning community 22%
Co-op(s) 0% Other 6%
Student teaching 96% None of the above 1%
*Graduates could select as many items as applied, unless they selected “none of the above.”
Those respondents selecting “Other” most commonly wrote in items relating to community assistantships, “Greek” life (fraternity/sorority) and honor societies.
54
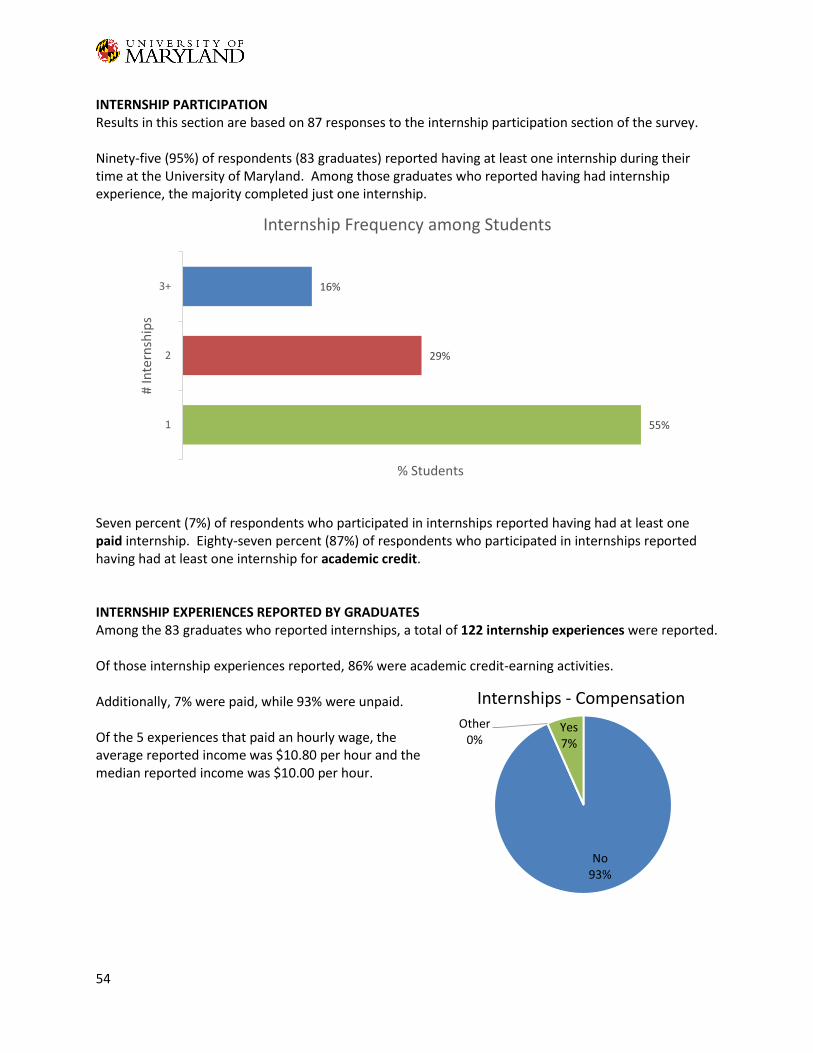
INTERNSHIP PARTICIPATION Results in this section are based on 87 responses to the internship participation section of the survey. Ninety-five (95%) of respondents (83 graduates) reported having at least one internship during their time at the University of Maryland. Among those graduates who reported having had internship experience, the majority completed just one internship.
Seven percent (7%) of respondents who participated in internships reported having had at least one paid internship. Eighty-seven percent (87%) of respondents who participated in internships reported having had at least one internship for academic credit. INTERNSHIP EXPERIENCES REPORTED BY GRADUATES Among the 83 graduates who reported internships, a total of 122 internship experiences were reported. Of those internship experiences reported, 86% were academic credit-earning activities. Additionally, 7% were paid, while 93% were unpaid. Of the 5 experiences that paid an hourly wage, the average reported income was $10.80 per hour and the median reported income was $10.00 per hour.
55%
29%
16%
1
2
3+
% Students
# In
tern
ship
s
Internship Frequency among Students
No93%
Other0%
Yes7%
Internships - Compensation
55
PHILIP MERRILL COLLEGE OF JOURNALISM
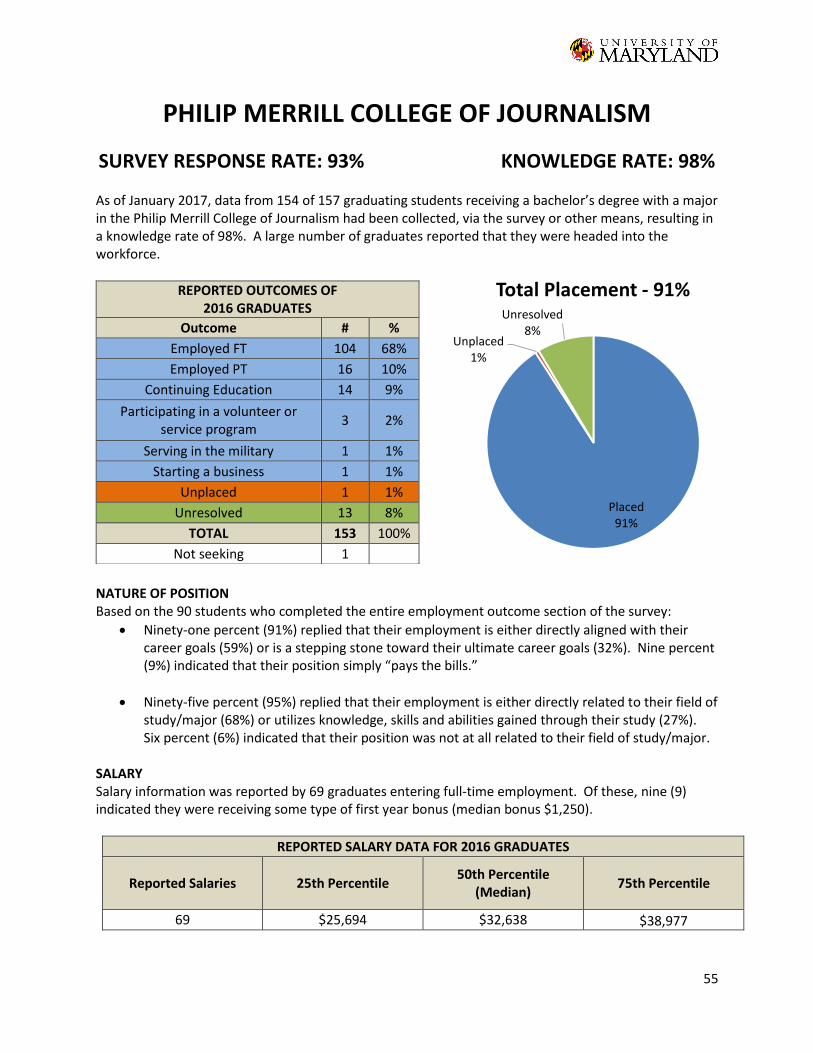
SURVEY RESPONSE RATE: 93% KNOWLEDGE RATE: 98%
As of January 2017, data from 154 of 157 graduating students receiving a bachelor’s degree with a major in the Philip Merrill College of Journalism had been collected, via the survey or other means, resulting in a knowledge rate of 98%. A large number of graduates reported that they were headed into the workforce.
NATURE OF POSITION Based on the 90 students who completed the entire employment outcome section of the survey:
Ninety-one percent (91%) replied that their employment is either directly aligned with their career goals (59%) or is a stepping stone toward their ultimate career goals (32%). Nine percent (9%) indicated that their position simply “pays the bills.”
Ninety-five percent (95%) replied that their employment is either directly related to their field of study/major (68%) or utilizes knowledge, skills and abilities gained through their study (27%). Six percent (6%) indicated that their position was not at all related to their field of study/major.
SALARY Salary information was reported by 69 graduates entering full-time employment. Of these, nine (9) indicated they were receiving some type of first year bonus (median bonus $1,250).
REPORTED SALARY DATA FOR 2016 GRADUATES
Reported Salaries 25th Percentile 50th Percentile
(Median) 75th Percentile
69 $25,694 $32,638 $38,977
REPORTED OUTCOMES OF 2016 GRADUATES
Outcome # %
Employed FT 104 68%
Employed PT 16 10%
Continuing Education 14 9%
Participating in a volunteer or service program
3 2%
Serving in the military 1 1%
Starting a business 1 1%
Unplaced 1 1%
Unresolved 13 8%
TOTAL 153 100%
Not seeking 1
Placed91%
Unplaced1%
Unresolved8%
Total Placement - 91%
56
EMPLOYMENT SEARCH
Method Used to Find Employment
On-Campus Interviews 4% Contacts from faculty 12%
Previous Internship/Co-op 32% Contacts from family/friends 17%
Career Fairs - on campus 1% Currently employed with organization 14%
Career Fairs - off campus 0% Newspaper 0%
UMD online job site 2% Other 12%
Non-UMD online job site 26% *graduates could select as many items as applied
Items entered for “Other” included applying directly to employer websites and departmental listserv/newsletter. SAMPLE OF EMPLOYERS AND POSITIONS REPORTED ABC News
Production Associate Associated Press
State Politics Reporting Intern Baltimore Business Journal
Reporter Baltimore Sun Media Group
Copy Desk Intern Multimedia Producer
Bleacher Report Breaking News Writer
Business Insider Commerce Intern
Capital Gazette Communications Reporter
CBS Corporation Sales Intern
CNN News Associate
Comcast Corporation Corporate Communications Coordinator Production Assistant
C-SPAN Marketing Intern
CTS Capital Advisors, LLC Valuation Analyst
Discovery Communications Production Assistant
Entertainment Weekly Paid Intern
Epic Systems Implementation Services
ESPN Post Graduate Production Intern
Fox News Production Assistant
Good Morning America Production Associate Human Resources
HMA Public Relations Account Coordinator
Kiplinger.com Editorial Intern
Maryland General Assembly Legislative Assistant
McClatchy Washington Bureau Visual Journalist Intern
Merritt Group Account Coordinator
MLB.com Associate reporter
National Public Radio Intern
NBC Universal Assistant Sports Producer/News Production Assistant Desk Assistant Production Assistant
NES Associates, LLC Technical Writer
NY Bar Assoc. - City Bar Justice Center Project Coordinator
NY1 Time Warner Cable News News Photographer
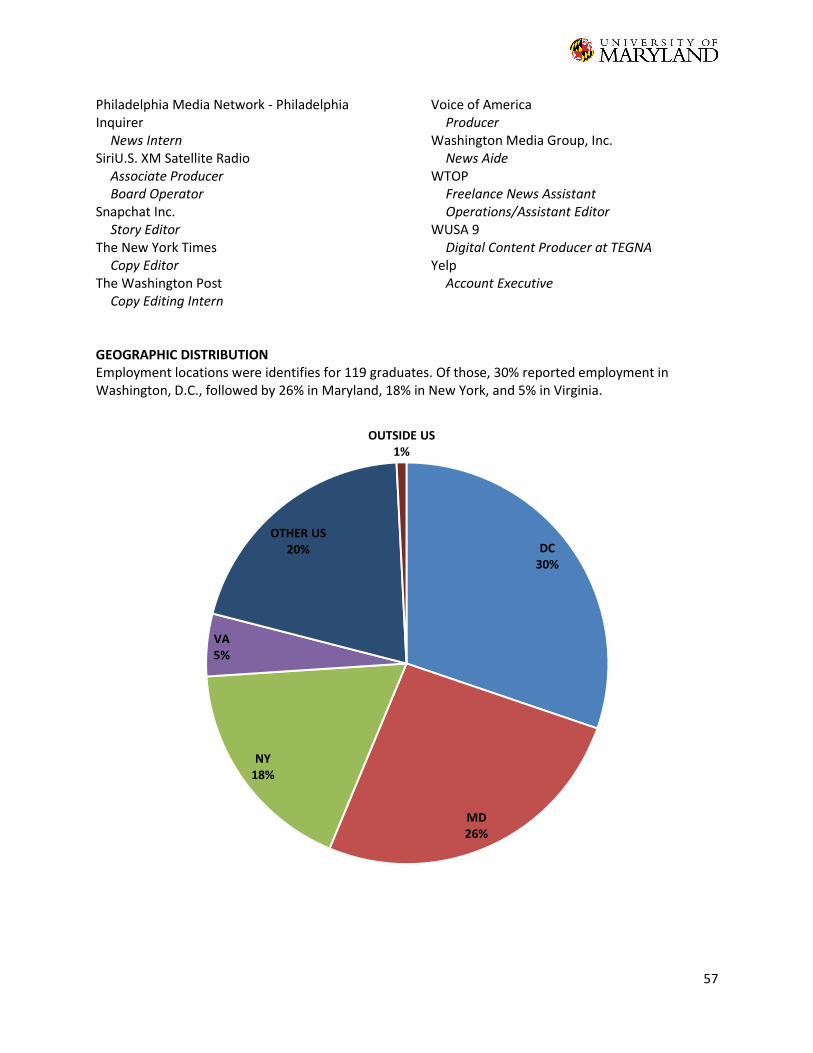
57
Philadelphia Media Network - Philadelphia Inquirer
News Intern SiriU.S. XM Satellite Radio
Associate Producer Board Operator
Snapchat Inc. Story Editor
The New York Times Copy Editor
The Washington Post Copy Editing Intern
Voice of America Producer
Washington Media Group, Inc. News Aide
WTOP Freelance News Assistant Operations/Assistant Editor
WUSA 9 Digital Content Producer at TEGNA
Yelp Account Executive
GEOGRAPHIC DISTRIBUTION Employment locations were identifies for 119 graduates. Of those, 30% reported employment in Washington, D.C., followed by 26% in Maryland, 18% in New York, and 5% in Virginia.
DC30%
MD26%
NY18%
VA5%
OTHER US20%
OUTSIDE US1%
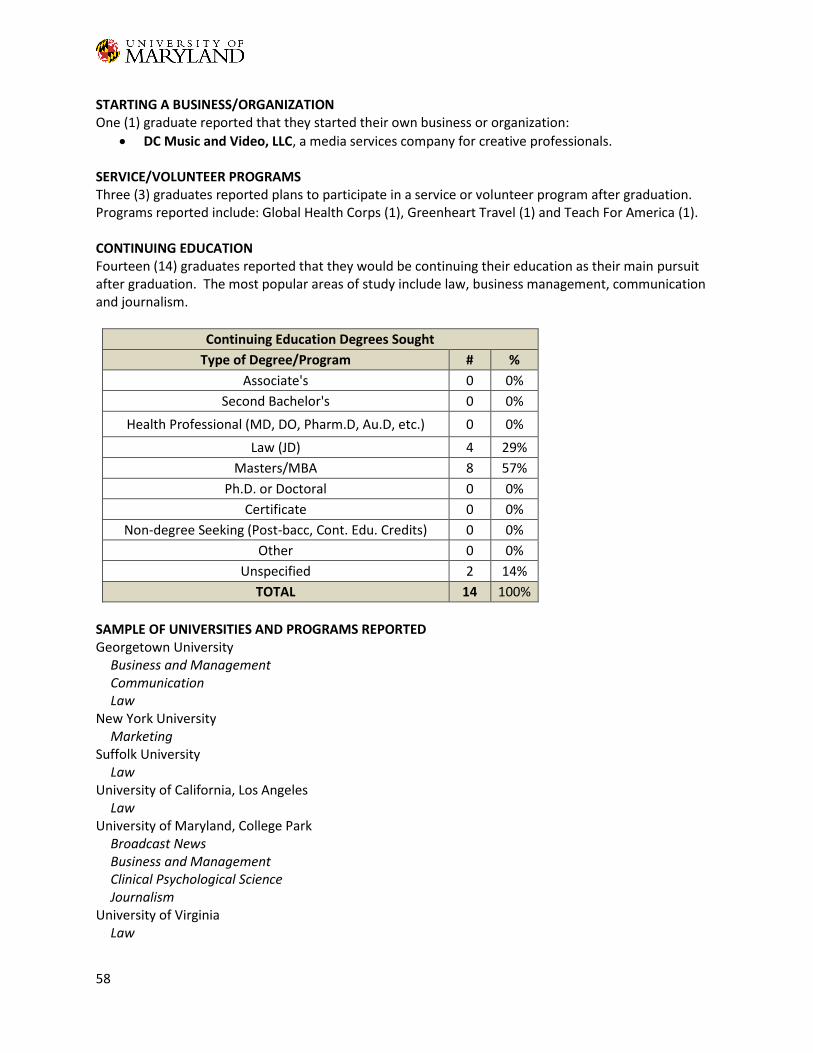
58
STARTING A BUSINESS/ORGANIZATION One (1) graduate reported that they started their own business or organization:
DC Music and Video, LLC, a media services company for creative professionals. SERVICE/VOLUNTEER PROGRAMS Three (3) graduates reported plans to participate in a service or volunteer program after graduation. Programs reported include: Global Health Corps (1), Greenheart Travel (1) and Teach For America (1). CONTINUING EDUCATION Fourteen (14) graduates reported that they would be continuing their education as their main pursuit after graduation. The most popular areas of study include law, business management, communication and journalism.
Continuing Education Degrees Sought
Type of Degree/Program # %
Associate's 0 0%
Second Bachelor's 0 0%
Health Professional (MD, DO, Pharm.D, Au.D, etc.) 0 0%
Law (JD) 4 29%
Masters/MBA 8 57%
Ph.D. or Doctoral 0 0%
Certificate 0 0%
Non-degree Seeking (Post-bacc, Cont. Edu. Credits) 0 0%
Other 0 0%
Unspecified 2 14%
TOTAL 14 100%
SAMPLE OF UNIVERSITIES AND PROGRAMS REPORTEDGeorgetown University
Business and Management Communication Law
New York University Marketing
Suffolk University Law
University of California, Los Angeles Law
University of Maryland, College Park Broadcast News Business and Management Clinical Psychological Science Journalism
University of Virginia Law
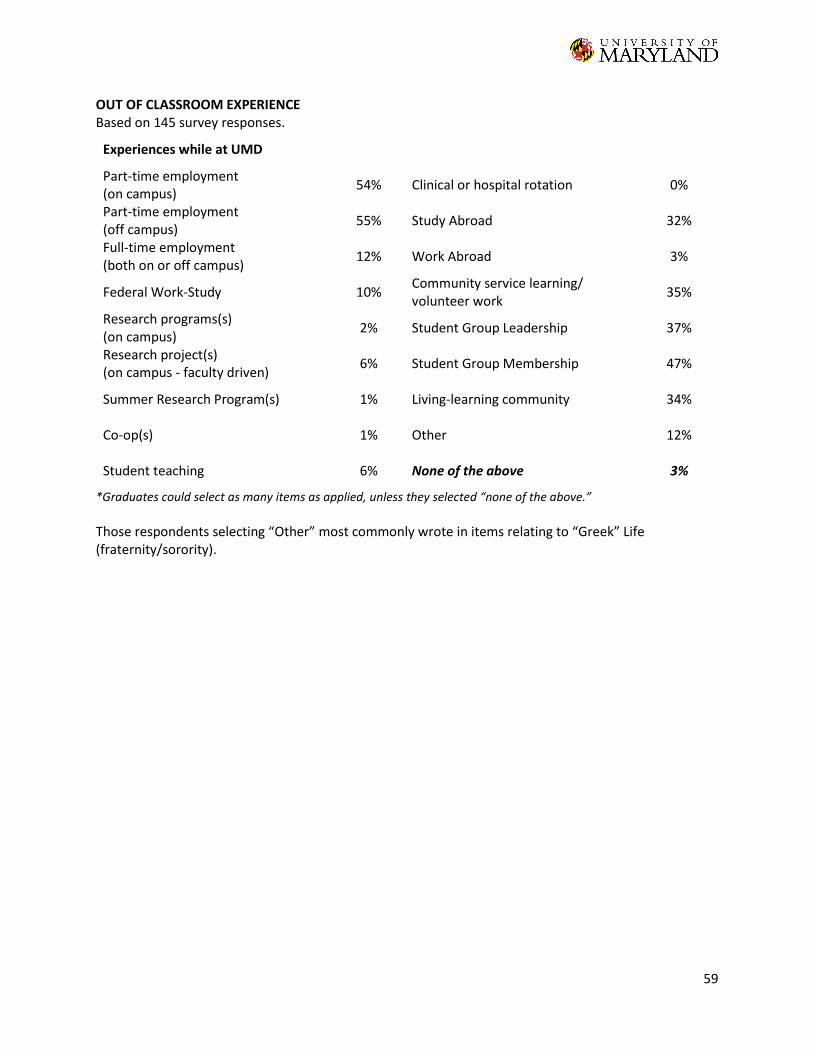
59
OUT OF CLASSROOM EXPERIENCE Based on 145 survey responses.
Experiences while at UMD
Part-time employment (on campus) 54% Clinical or hospital rotation 0%
Part-time employment (off campus)
55% Study Abroad 32%
Full-time employment (both on or off campus)
12% Work Abroad 3%
Federal Work-Study 10% Community service learning/ volunteer work
35%
Research programs(s) (on campus)
2% Student Group Leadership 37%
Research project(s) (on campus - faculty driven)
6% Student Group Membership 47%
Summer Research Program(s) 1% Living-learning community 34%
Co-op(s) 1% Other 12%
Student teaching 6% None of the above 3%
*Graduates could select as many items as applied, unless they selected “none of the above.”
Those respondents selecting “Other” most commonly wrote in items relating to “Greek” Life (fraternity/sorority).
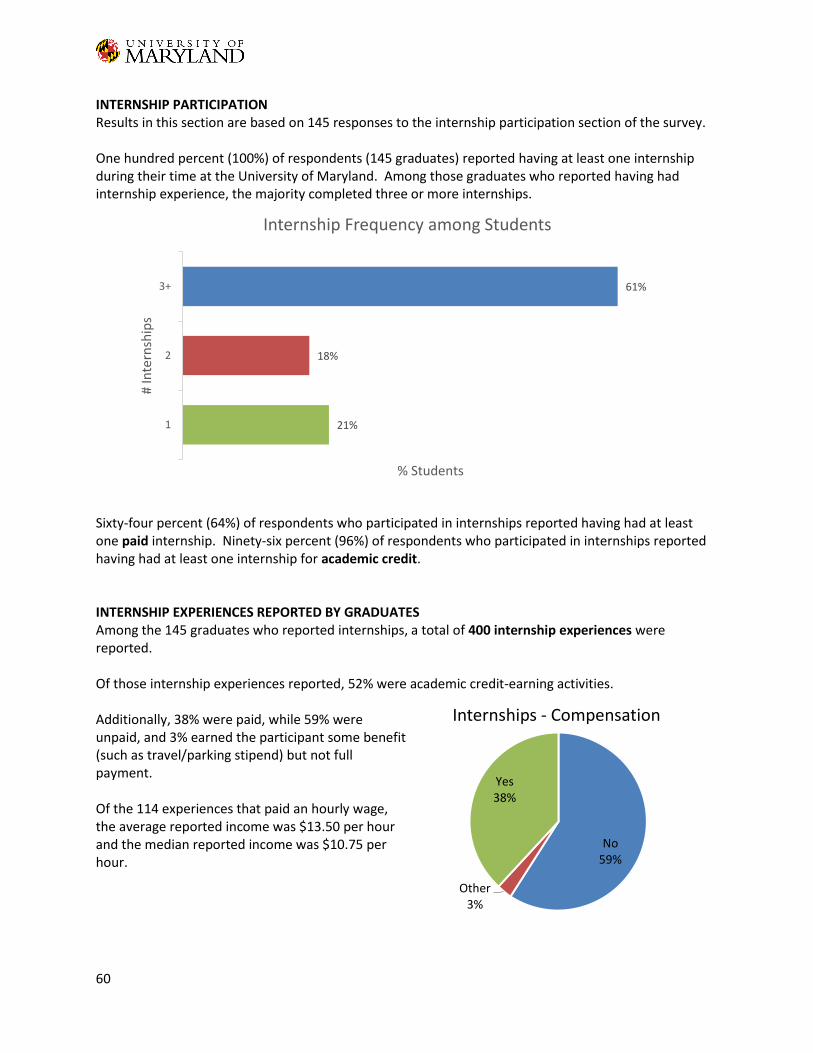
60
INTERNSHIP PARTICIPATION Results in this section are based on 145 responses to the internship participation section of the survey. One hundred percent (100%) of respondents (145 graduates) reported having at least one internship during their time at the University of Maryland. Among those graduates who reported having had internship experience, the majority completed three or more internships.
Sixty-four percent (64%) of respondents who participated in internships reported having had at least one paid internship. Ninety-six percent (96%) of respondents who participated in internships reported having had at least one internship for academic credit. INTERNSHIP EXPERIENCES REPORTED BY GRADUATES Among the 145 graduates who reported internships, a total of 400 internship experiences were reported. Of those internship experiences reported, 52% were academic credit-earning activities. Additionally, 38% were paid, while 59% were unpaid, and 3% earned the participant some benefit (such as travel/parking stipend) but not full payment. Of the 114 experiences that paid an hourly wage, the average reported income was $13.50 per hour and the median reported income was $10.75 per hour.
21%
18%
61%
1
2
3+
% Students
# In
tern
ship
s
Internship Frequency among Students
No59%
Other3%
Yes38%
Internships - Compensation
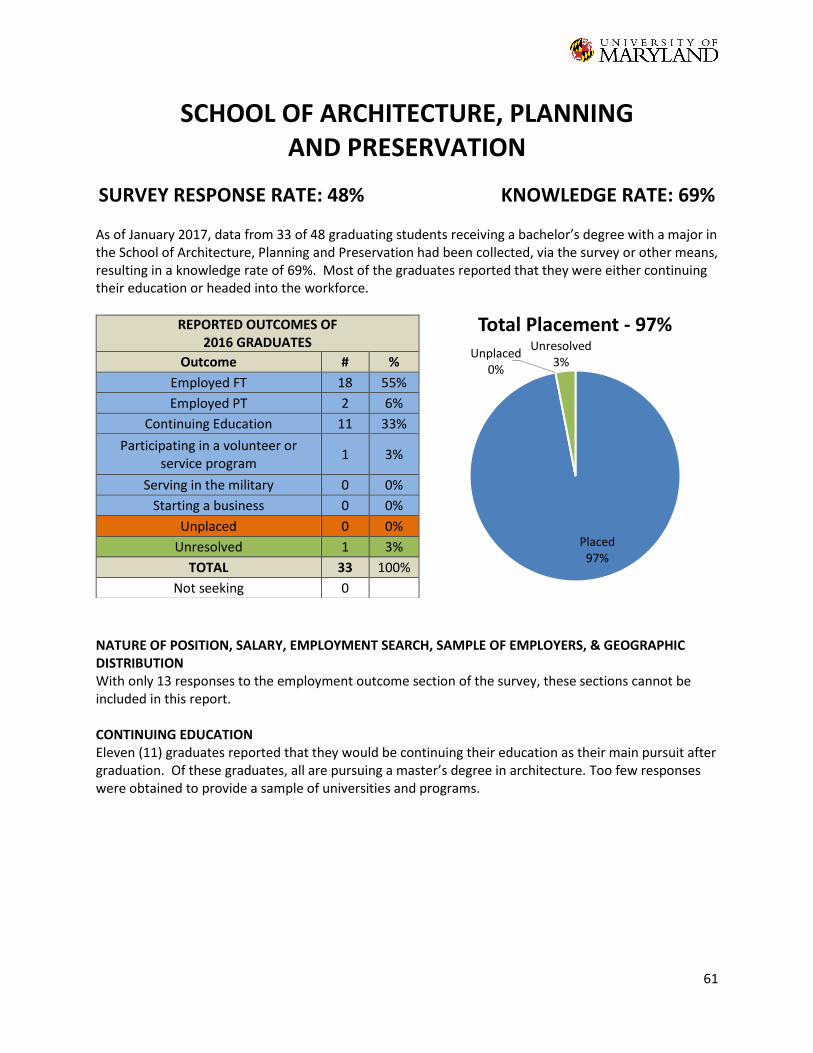
61
SCHOOL OF ARCHITECTURE, PLANNING AND PRESERVATION
SURVEY RESPONSE RATE: 48% KNOWLEDGE RATE: 69%
As of January 2017, data from 33 of 48 graduating students receiving a bachelor’s degree with a major in the School of Architecture, Planning and Preservation had been collected, via the survey or other means, resulting in a knowledge rate of 69%. Most of the graduates reported that they were either continuing their education or headed into the workforce.
NATURE OF POSITION, SALARY, EMPLOYMENT SEARCH, SAMPLE OF EMPLOYERS, & GEOGRAPHIC DISTRIBUTION With only 13 responses to the employment outcome section of the survey, these sections cannot be included in this report. CONTINUING EDUCATION Eleven (11) graduates reported that they would be continuing their education as their main pursuit after graduation. Of these graduates, all are pursuing a master’s degree in architecture. Too few responses were obtained to provide a sample of universities and programs.
REPORTED OUTCOMES OF 2016 GRADUATES
Outcome # %
Employed FT 18 55%
Employed PT 2 6%
Continuing Education 11 33%
Participating in a volunteer or service program
1 3%
Serving in the military 0 0%
Starting a business 0 0%
Unplaced 0 0%
Unresolved 1 3%
TOTAL 33 100%
Not seeking 0
Placed97%
Unplaced0%
Unresolved3%
Total Placement - 97%
62
OUT OF CLASSROOM EXPERIENCE Based on 21 survey responses.
Experiences while at UMD
Part-time employment (on campus)
29% Clinical or hospital rotation 0%
Part-time employment (off campus)
52% Study Abroad 52%
Full-time employment (both on or off campus)
19% Work Abroad 5%
Federal Work-Study 10% Community service learning/ volunteer work
43%
Research programs(s) (on campus)
0% Student Group Leadership 48%
Research project(s) (on campus - faculty driven)
0% Student Group Membership 62%
Summer Research Program(s) 5% Living-learning community 38%
Co-op(s) 0% Other 0%
Student teaching 10% None of the above 0%
*Graduates could select as many items as applied, unless they selected “none of the above.”
Those respondents selecting “Other” most commonly wrote in items relating to “Greek” life (fraternity/sorority). INTERNSHIP PARTICIPATION There were an insufficient number of survey responses from the School of Architecture, Planning and Preservation to develop an internship participation section.
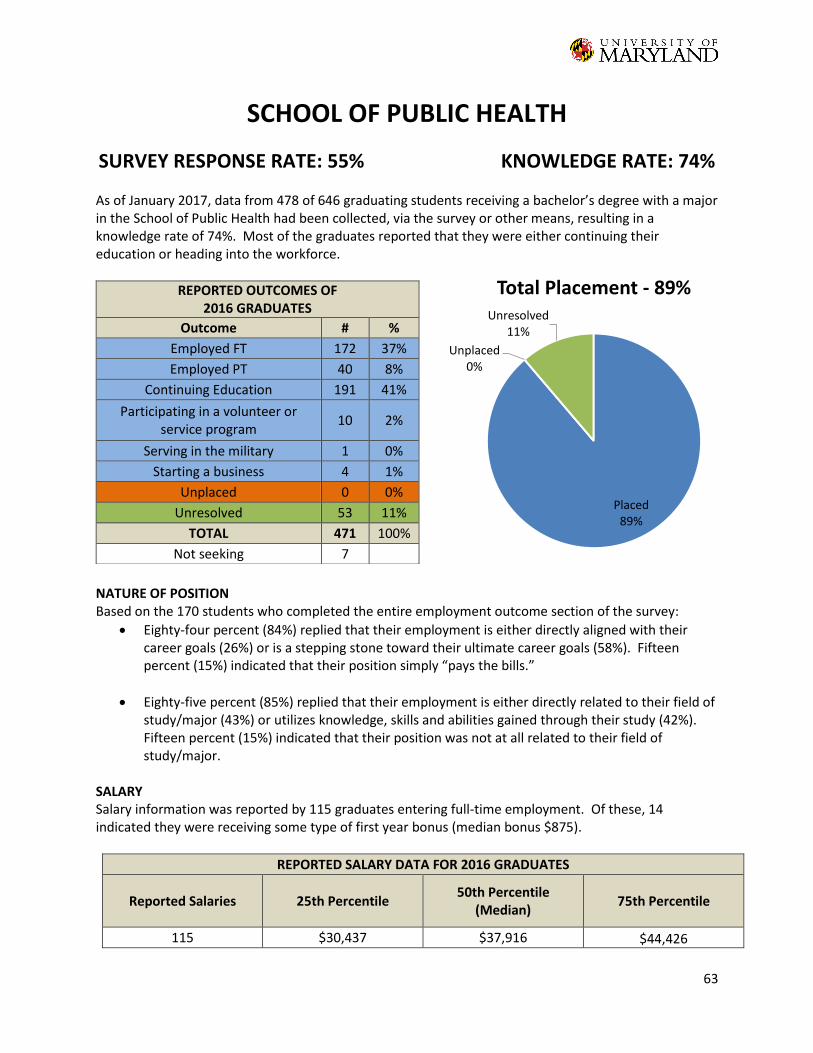
63
SCHOOL OF PUBLIC HEALTH
SURVEY RESPONSE RATE: 55% KNOWLEDGE RATE: 74%
As of January 2017, data from 478 of 646 graduating students receiving a bachelor’s degree with a major in the School of Public Health had been collected, via the survey or other means, resulting in a knowledge rate of 74%. Most of the graduates reported that they were either continuing their education or heading into the workforce.
NATURE OF POSITION Based on the 170 students who completed the entire employment outcome section of the survey:
Eighty-four percent (84%) replied that their employment is either directly aligned with their career goals (26%) or is a stepping stone toward their ultimate career goals (58%). Fifteen percent (15%) indicated that their position simply “pays the bills.”
Eighty-five percent (85%) replied that their employment is either directly related to their field of study/major (43%) or utilizes knowledge, skills and abilities gained through their study (42%). Fifteen percent (15%) indicated that their position was not at all related to their field of study/major.
SALARY Salary information was reported by 115 graduates entering full-time employment. Of these, 14 indicated they were receiving some type of first year bonus (median bonus $875).
REPORTED SALARY DATA FOR 2016 GRADUATES
Reported Salaries 25th Percentile 50th Percentile
(Median) 75th Percentile
115 $30,437 $37,916 $44,426
REPORTED OUTCOMES OF 2016 GRADUATES
Outcome # %
Employed FT 172 37%
Employed PT 40 8%
Continuing Education 191 41%
Participating in a volunteer or service program
10 2%
Serving in the military 1 0%
Starting a business 4 1%
Unplaced 0 0%
Unresolved 53 11%
TOTAL 471 100%
Not seeking 7
Placed89%
Unplaced0%
Unresolved11%
Total Placement - 89%
64
EMPLOYMENT SEARCH
Method Used to Find Employment
On-Campus Interviews 2% Contacts from faculty 5%
Previous Internship/Co-op 19% Contacts from family/friends 19%
Career Fairs - on campus 1% Currently employed with organization 15%
Career Fairs - off campus 1% Newspaper 0%
UMD online job site 6% Other 16%
Non-UMD online job site 28% *graduates could select as many items as applied
Items entered for “Other” included applying directly to employer websites, research, departmental listserv/newsletter, LinkedIn and using a recruitment agency. SAMPLE OF EMPLOYERS AND POSITIONS REPORTED 2U
Executive Assistant Adventist HealthCare
Community Health Worker Booz Allen Hamilton
Consultant Junior Healthcare Analyst
Children's National Medical Center Administrative Assistant Child Psychiatry Specialist
Equinox Personal Trainer
Family Services Data Operations Assistant
Fannie Mae Junior Software Developer
George Washington University Medical Assistant Research Assistant
Health Resources & Services Administration Public Health Analyst
Healthcare Consultancy Group Junior Account Manager
Interactive Health, Inc. Associate Account Manager
Johns Hopkins University Research Program Coordinator Resident Assistant
MAD Fitness Studio Owner and Personal Trainer
Maryland Pediatric Group Medical Assistant
MedStar Health Clinical Assistant Outreach Coordinator Rehabilitation Occupational Therapy Aide
Memorial Sloan-Kettering Cancer Center Research Study Assistant
National Institutes of Health Health Communication Specialist
New York University Project Associate
Skill and Will Fitness Health and Wellness Coach
Sport & Health Clubs LLC Personal Trainer
U.S. Department of Agriculture Lead Teacher
U.S. Department of Health & Human Services Grants Technical Assistant Management Analyst ORISE Fellow
U.S. Food and Drug Administration Program System Specialist
University of Maryland St. Joseph Medical Center
Physical Therapy Technician University of Maryland, College Park
Faculty Research Assistant Program Coordinator
Yelp Account Executive
YMCA Family Case Manager
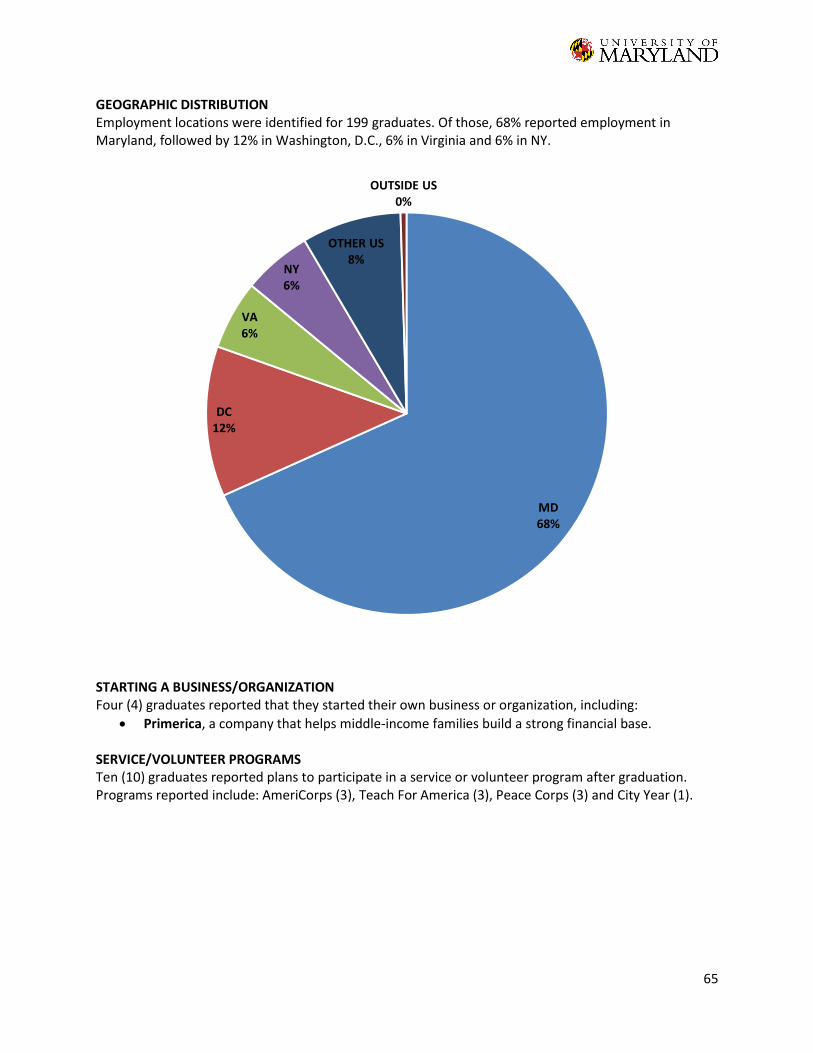
65
GEOGRAPHIC DISTRIBUTION Employment locations were identified for 199 graduates. Of those, 68% reported employment in Maryland, followed by 12% in Washington, D.C., 6% in Virginia and 6% in NY.
STARTING A BUSINESS/ORGANIZATION Four (4) graduates reported that they started their own business or organization, including:
Primerica, a company that helps middle-income families build a strong financial base.
SERVICE/VOLUNTEER PROGRAMS Ten (10) graduates reported plans to participate in a service or volunteer program after graduation. Programs reported include: AmeriCorps (3), Teach For America (3), Peace Corps (3) and City Year (1).
MD68%
DC12%
VA6%
NY6%
OTHER US8%
OUTSIDE US0%
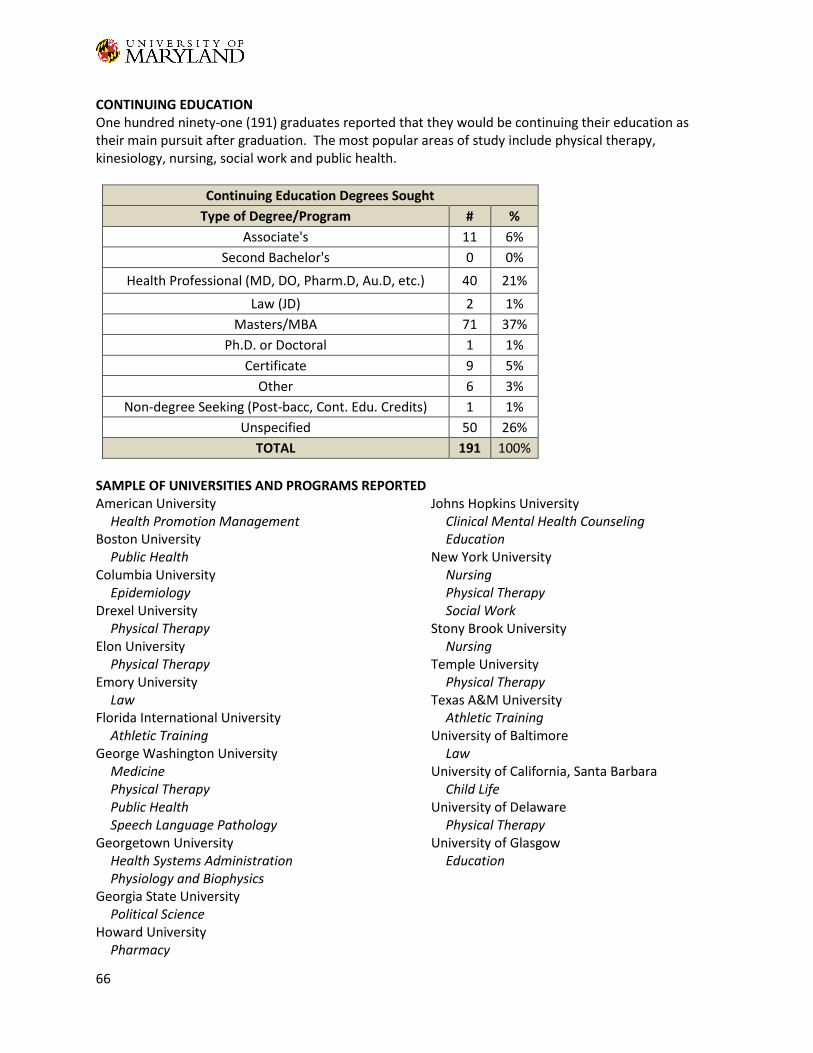
66
CONTINUING EDUCATION One hundred ninety-one (191) graduates reported that they would be continuing their education as their main pursuit after graduation. The most popular areas of study include physical therapy, kinesiology, nursing, social work and public health.
Continuing Education Degrees Sought
Type of Degree/Program # %
Associate's 11 6%
Second Bachelor's 0 0%
Health Professional (MD, DO, Pharm.D, Au.D, etc.) 40 21%
Law (JD) 2 1%
Masters/MBA 71 37%
Ph.D. or Doctoral 1 1%
Certificate 9 5%
Other 6 3%
Non-degree Seeking (Post-bacc, Cont. Edu. Credits) 1 1%
Unspecified 50 26%
TOTAL 191 100%
SAMPLE OF UNIVERSITIES AND PROGRAMS REPORTEDAmerican University
Health Promotion Management Boston University
Public Health Columbia University
Epidemiology Drexel University
Physical Therapy Elon University
Physical Therapy Emory University
Law Florida International University
Athletic Training George Washington University
Medicine Physical Therapy Public Health Speech Language Pathology
Georgetown University Health Systems Administration Physiology and Biophysics
Georgia State University Political Science
Howard University Pharmacy
Johns Hopkins University Clinical Mental Health Counseling Education
New York University Nursing Physical Therapy Social Work
Stony Brook University Nursing
Temple University Physical Therapy
Texas A&M University Athletic Training
University of Baltimore Law
University of California, Santa Barbara Child Life
University of Delaware Physical Therapy
University of Glasgow Education
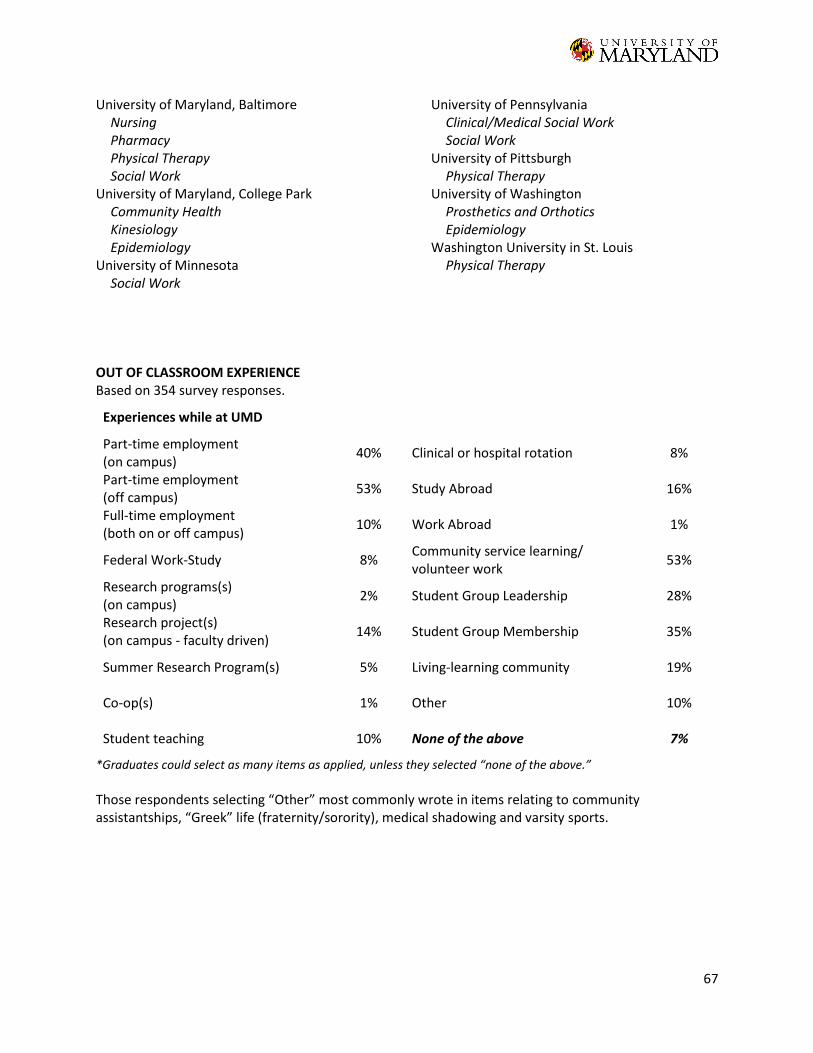
67
University of Maryland, Baltimore Nursing Pharmacy Physical Therapy Social Work
University of Maryland, College Park Community Health Kinesiology Epidemiology
University of Minnesota Social Work
University of Pennsylvania Clinical/Medical Social Work Social Work
University of Pittsburgh Physical Therapy
University of Washington Prosthetics and Orthotics Epidemiology
Washington University in St. Louis Physical Therapy
OUT OF CLASSROOM EXPERIENCE Based on 354 survey responses.
Experiences while at UMD
Part-time employment (on campus)
40% Clinical or hospital rotation 8%
Part-time employment (off campus)
53% Study Abroad 16%
Full-time employment (both on or off campus)
10% Work Abroad 1%
Federal Work-Study 8% Community service learning/ volunteer work
53%
Research programs(s) (on campus)
2% Student Group Leadership 28%
Research project(s) (on campus - faculty driven)
14% Student Group Membership 35%
Summer Research Program(s) 5% Living-learning community 19%
Co-op(s) 1% Other 10%
Student teaching 10% None of the above 7%
*Graduates could select as many items as applied, unless they selected “none of the above.”
Those respondents selecting “Other” most commonly wrote in items relating to community assistantships, “Greek” life (fraternity/sorority), medical shadowing and varsity sports.
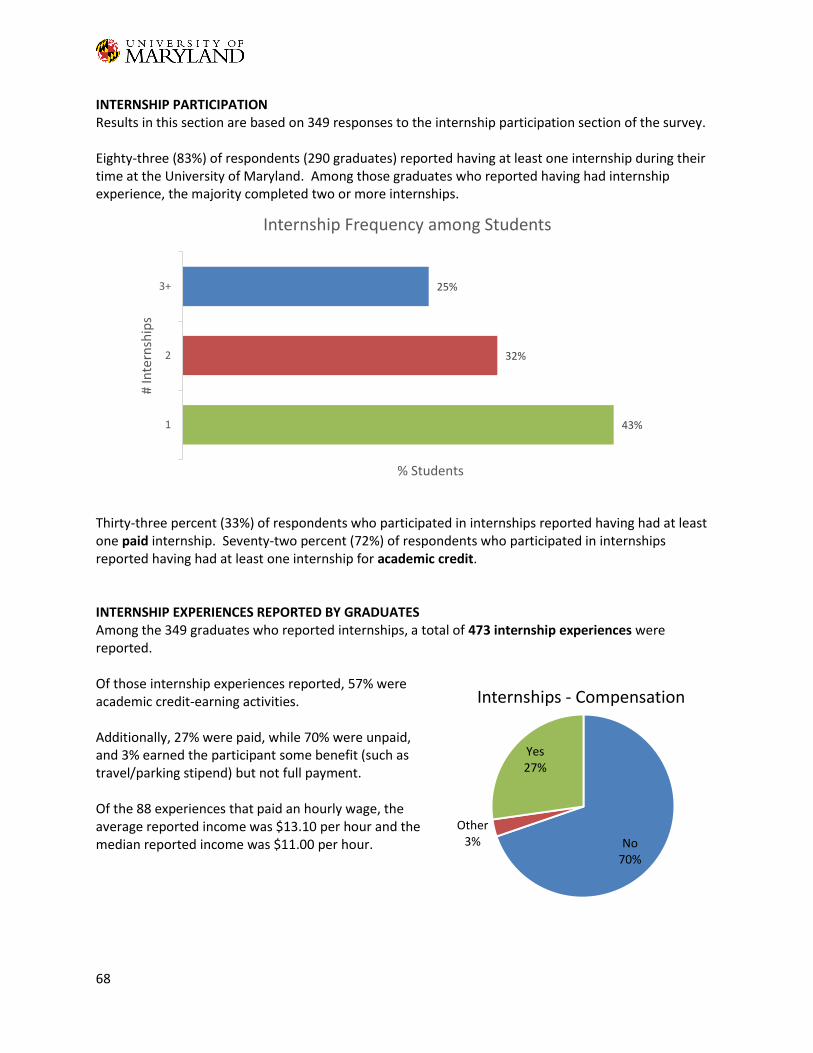
68
INTERNSHIP PARTICIPATION Results in this section are based on 349 responses to the internship participation section of the survey. Eighty-three (83%) of respondents (290 graduates) reported having at least one internship during their time at the University of Maryland. Among those graduates who reported having had internship experience, the majority completed two or more internships.
Thirty-three percent (33%) of respondents who participated in internships reported having had at least one paid internship. Seventy-two percent (72%) of respondents who participated in internships reported having had at least one internship for academic credit. INTERNSHIP EXPERIENCES REPORTED BY GRADUATES Among the 349 graduates who reported internships, a total of 473 internship experiences were reported. Of those internship experiences reported, 57% were academic credit-earning activities. Additionally, 27% were paid, while 70% were unpaid, and 3% earned the participant some benefit (such as travel/parking stipend) but not full payment. Of the 88 experiences that paid an hourly wage, the average reported income was $13.10 per hour and the median reported income was $11.00 per hour.
43%
32%
25%
1
2
3+
% Students
# In
tern
ship
s
Internship Frequency among Students
No70%
Other3%
Yes27%
Internships - Compensation
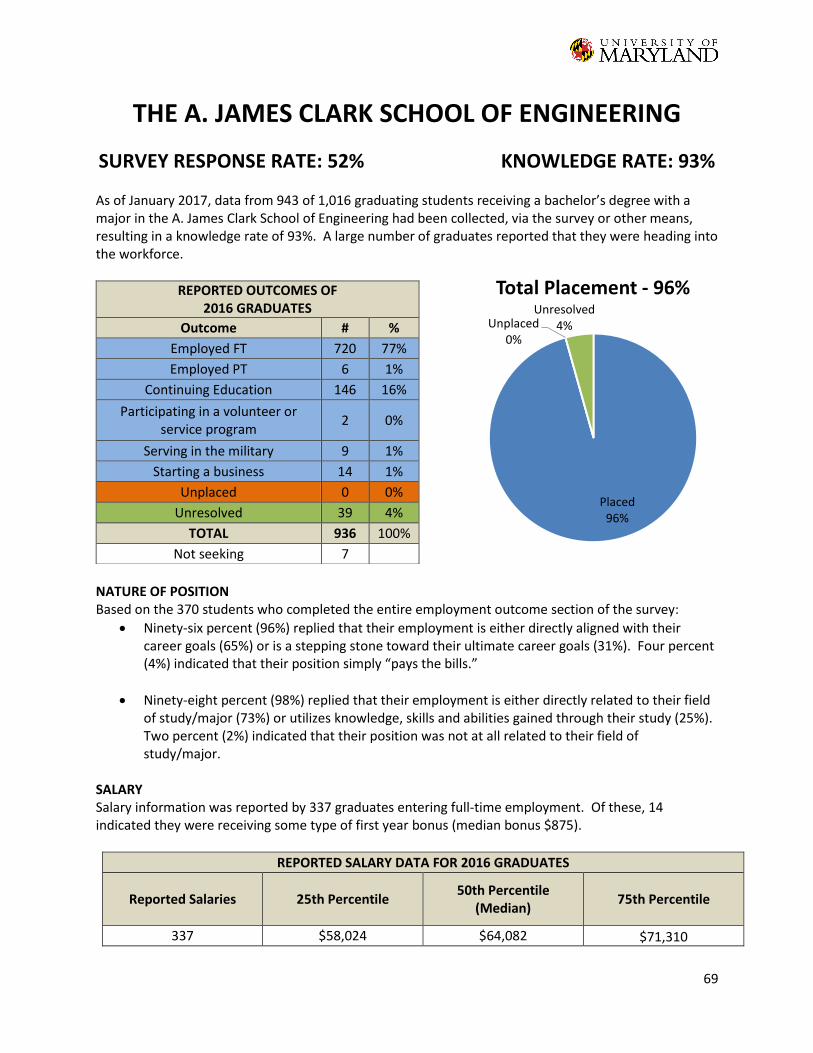
69
THE A. JAMES CLARK SCHOOL OF ENGINEERING
SURVEY RESPONSE RATE: 52% KNOWLEDGE RATE: 93%
As of January 2017, data from 943 of 1,016 graduating students receiving a bachelor’s degree with a major in the A. James Clark School of Engineering had been collected, via the survey or other means, resulting in a knowledge rate of 93%. A large number of graduates reported that they were heading into the workforce.
NATURE OF POSITION Based on the 370 students who completed the entire employment outcome section of the survey:
Ninety-six percent (96%) replied that their employment is either directly aligned with their career goals (65%) or is a stepping stone toward their ultimate career goals (31%). Four percent (4%) indicated that their position simply “pays the bills.”
Ninety-eight percent (98%) replied that their employment is either directly related to their field of study/major (73%) or utilizes knowledge, skills and abilities gained through their study (25%). Two percent (2%) indicated that their position was not at all related to their field of study/major.
SALARY Salary information was reported by 337 graduates entering full-time employment. Of these, 14 indicated they were receiving some type of first year bonus (median bonus $875).
REPORTED SALARY DATA FOR 2016 GRADUATES
Reported Salaries 25th Percentile 50th Percentile
(Median) 75th Percentile
337 $58,024 $64,082 $71,310
REPORTED OUTCOMES OF 2016 GRADUATES
Outcome # %
Employed FT 720 77%
Employed PT 6 1%
Continuing Education 146 16%
Participating in a volunteer or service program
2 0%
Serving in the military 9 1%
Starting a business 14 1%
Unplaced 0 0%
Unresolved 39 4%
TOTAL 936 100%
Not seeking 7
Placed96%
Unplaced0%
Unresolved4%
Total Placement - 96%
70
EMPLOYMENT SEARCH
Method Used to Find Employment
On-Campus Interviews 26% Contacts from faculty 6%
Previous Internship/Co-op 27% Contacts from family/friends 13%
Career Fairs - on campus 27% Currently employed with organization 4%
Career Fairs - off campus 2% Newspaper 0%
UMD online job site 24% Other 5%
Non-UMD online job site 12% *graduates could select as many items as applied
Items entered for “Other” included referral from a friend, on campus info session, applying directly to employer websites, departmental listserv/newsletter, LinkedIn and using a recruitment agency. SAMPLE OF EMPLOYERS AND POSITIONS REPORTED AAI Corporation
Manufacturing Engineer Mechanical Engineer Quality Engineer Software Engineer
Accenture Engineering Analyst Federal Technology Consultant Software Engineering Analyst System Developer Analyst
AECOM Design Engineer Fire Protection Engineer
Amazon Operations Area Manager Software Development Engineer
Appian Corporation Associate Consultant Software Engineer
Architecture Technology Corporation Systems Engineer
AT&T Associate Business Management Network Specialist
BAE Systems Mechanical Engineer I
Bechtel Corporation Controls Systems Engineer Electrical Engineer Fire Protection Engineer Project Controls-Cost Engineer
Booz Allen Hamilton
Software Engineer California Institute of Technology
Systems Engineer Capital One
Infrastructure Engineer Software Engineer
CareFirst BlueCross BlueShield Data Informatics Application Technician Systems Engineer
CAS Engineering Project Engineer
Cisco Systems, Inc. Software Engineer Research Engineer
Clark Construction Group Engineer Office Engineer
Cognizant Engineering and Manufacturing Solutions
Analyst Quality Engineering and Assurance Analyst Technology Solutions Analyst
Deloitte Business Technology Analyst
Epic Systems Software Developer
ExxonMobil Chemist Process Engineer
Facebook Software Engineer
Fannie Mae
71
DevOp Engineering Federal Aviation Administration
General Engineer Mechanical Engineer
Ford Motor Company Ford College Graduate - Product Development
General Dynamics Software Engineer Welding Engineer
General Electric Renewable Energy Development Program
Georgetown University Electrical Engineer
GlaxoSmithKline Associate Scientist (Cell Culture and Fermentation)
Goldman Sachs Analyst
Google Software Engineer
Johns Hopkins University Applied Physics Laboratory
Associate Professional Staff Flight Control Engineer Mechanical Engineer Systems Engineer
JPMorgan Chase & Co. Technology Analyst
Leidos Software Engineer Systems Engineer Associate
LinkedIn Software Engineer
Lockheed Martin Aeronautical Engineering Associate Electrical Engineer Mechanical Engineer Associate Research Engineer Associate Systems Engineer
Maryland Department of the Environment Regulatory/Compliance Engineer I
Microsoft Corporation Software Engineer
NASA Operations Engineer Quality Assurance Engineer Systems Engineer
National Institutes of Health
Post Baccalaureate IRTA Research Associate
Naval Air Systems Command Aerospace Engineer Electrical Engineer
Naval Surface Warfare Center Aerospace Engineer Materials Engineer Mechanical Engineer Naval Architect and Engineer
Nestlé Operations Management Trainee
Northrop Grumman Electronics and Hardware Engineer Mechanical Engineer Software Engineer
Pepco Engineer
Procter & Gamble Process Engineer
Raytheon Company Software Engineer
Siemens Engineer in Training Service specialist
Sikorsky Aircraft Corporation Associate Systems Engineer
SpaceX Engineer
Square Software Engineer
Stanley Black & Decker Compliance Engineer Electro-Mechanical Engineer
Technology Service Corporation Software Engineer
Texas Instruments Applications Engineer
Textron Systems Engineering Leadership Development
Program Supplier Quality Engineer Systems Engineer
The Boeing Company Design Engineer Mechanical Engineer Software Engineer Test Instrumentation Engineer
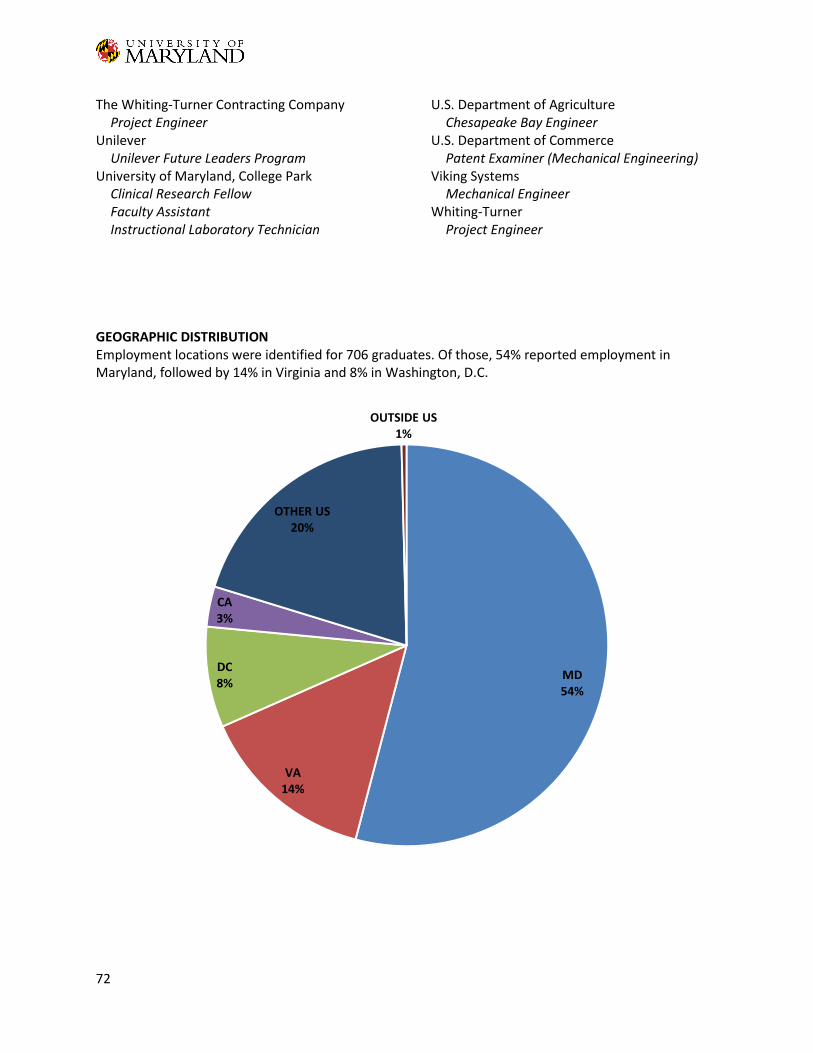
72
The Whiting-Turner Contracting Company Project Engineer
Unilever Unilever Future Leaders Program
University of Maryland, College Park Clinical Research Fellow Faculty Assistant Instructional Laboratory Technician
U.S. Department of Agriculture Chesapeake Bay Engineer
U.S. Department of Commerce Patent Examiner (Mechanical Engineering)
Viking Systems Mechanical Engineer
Whiting-Turner Project Engineer
GEOGRAPHIC DISTRIBUTION Employment locations were identified for 706 graduates. Of those, 54% reported employment in Maryland, followed by 14% in Virginia and 8% in Washington, D.C.
MD54%
VA14%
DC8%
CA3%
OTHER US20%
OUTSIDE US1%
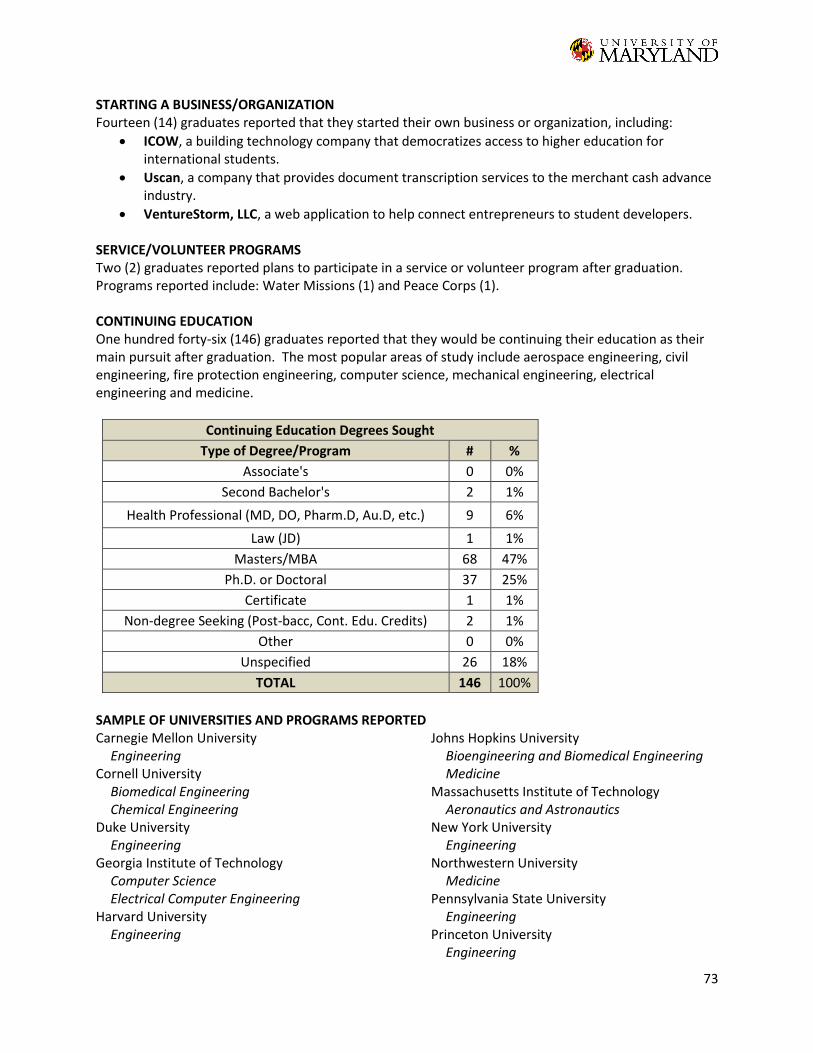
73
STARTING A BUSINESS/ORGANIZATION Fourteen (14) graduates reported that they started their own business or organization, including:
ICOW, a building technology company that democratizes access to higher education for international students.
Uscan, a company that provides document transcription services to the merchant cash advance industry.
VentureStorm, LLC, a web application to help connect entrepreneurs to student developers. SERVICE/VOLUNTEER PROGRAMS Two (2) graduates reported plans to participate in a service or volunteer program after graduation. Programs reported include: Water Missions (1) and Peace Corps (1). CONTINUING EDUCATION One hundred forty-six (146) graduates reported that they would be continuing their education as their main pursuit after graduation. The most popular areas of study include aerospace engineering, civil engineering, fire protection engineering, computer science, mechanical engineering, electrical engineering and medicine.
Continuing Education Degrees Sought
Type of Degree/Program # %
Associate's 0 0%
Second Bachelor's 2 1%
Health Professional (MD, DO, Pharm.D, Au.D, etc.) 9 6%
Law (JD) 1 1%
Masters/MBA 68 47%
Ph.D. or Doctoral 37 25%
Certificate 1 1%
Non-degree Seeking (Post-bacc, Cont. Edu. Credits) 2 1%
Other 0 0%
Unspecified 26 18%
TOTAL 146 100%
SAMPLE OF UNIVERSITIES AND PROGRAMS REPORTEDCarnegie Mellon University
Engineering Cornell University
Biomedical Engineering Chemical Engineering
Duke University Engineering
Georgia Institute of Technology Computer Science Electrical Computer Engineering
Harvard University Engineering
Johns Hopkins University Bioengineering and Biomedical Engineering Medicine
Massachusetts Institute of Technology Aeronautics and Astronautics
New York University Engineering
Northwestern University Medicine
Pennsylvania State University Engineering
Princeton University Engineering
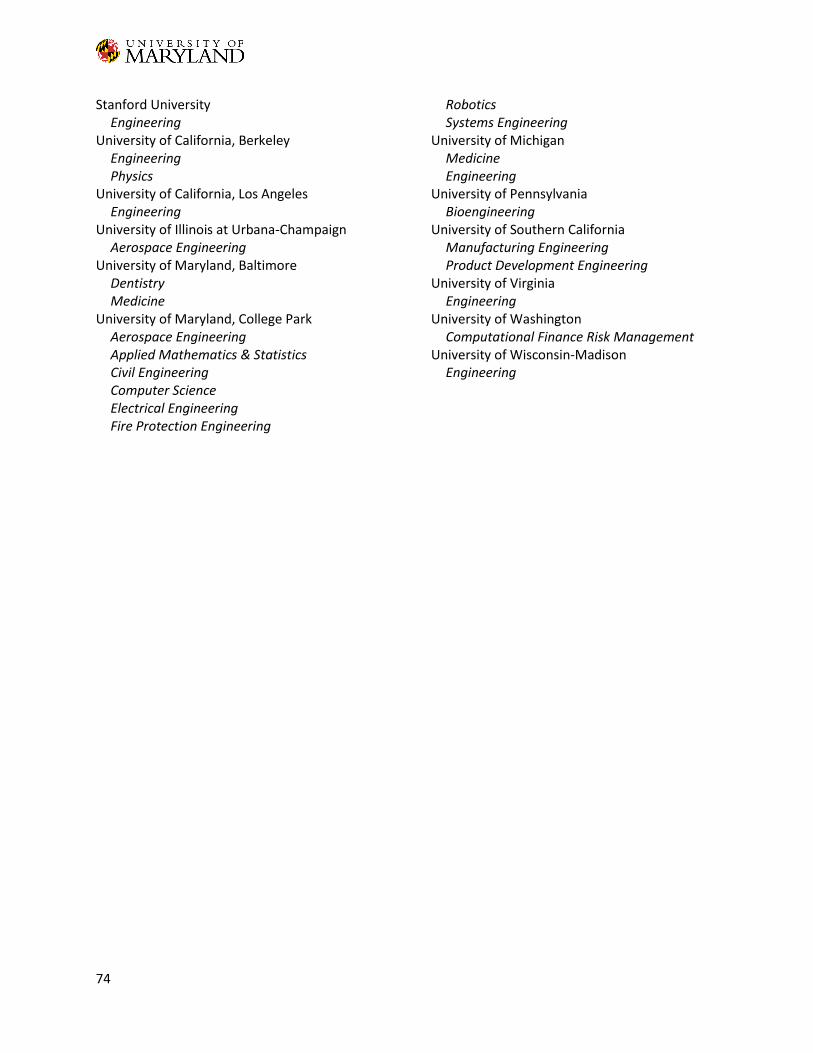
74
Stanford University Engineering
University of California, Berkeley Engineering Physics
University of California, Los Angeles Engineering
University of Illinois at Urbana-Champaign Aerospace Engineering
University of Maryland, Baltimore Dentistry Medicine
University of Maryland, College Park Aerospace Engineering Applied Mathematics & Statistics Civil Engineering Computer Science Electrical Engineering Fire Protection Engineering
Robotics Systems Engineering
University of Michigan Medicine Engineering
University of Pennsylvania Bioengineering
University of Southern California Manufacturing Engineering Product Development Engineering
University of Virginia Engineering
University of Washington Computational Finance Risk Management
University of Wisconsin-Madison Engineering
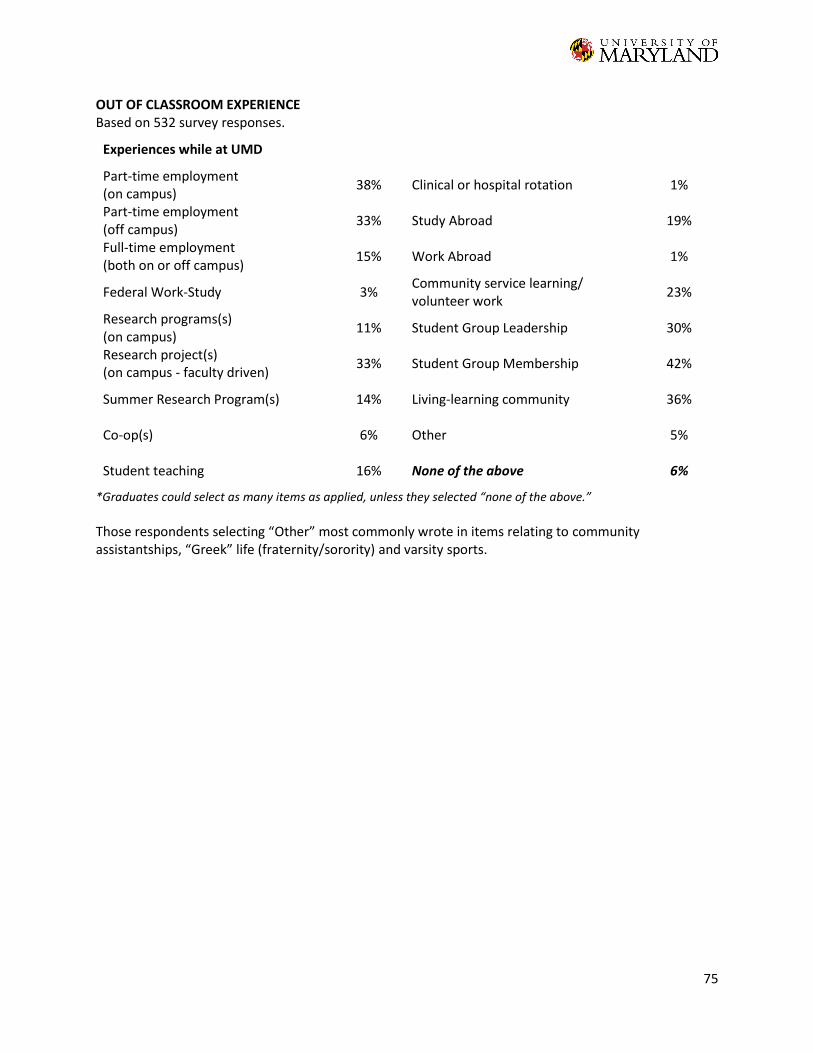
75
OUT OF CLASSROOM EXPERIENCE Based on 532 survey responses.
Experiences while at UMD
Part-time employment (on campus) 38% Clinical or hospital rotation 1%
Part-time employment (off campus)
33% Study Abroad 19%
Full-time employment (both on or off campus)
15% Work Abroad 1%
Federal Work-Study 3% Community service learning/ volunteer work
23%
Research programs(s) (on campus)
11% Student Group Leadership 30%
Research project(s) (on campus - faculty driven)
33% Student Group Membership 42%
Summer Research Program(s) 14% Living-learning community 36%
Co-op(s) 6% Other 5%
Student teaching 16% None of the above 6%
*Graduates could select as many items as applied, unless they selected “none of the above.”
Those respondents selecting “Other” most commonly wrote in items relating to community assistantships, “Greek” life (fraternity/sorority) and varsity sports.
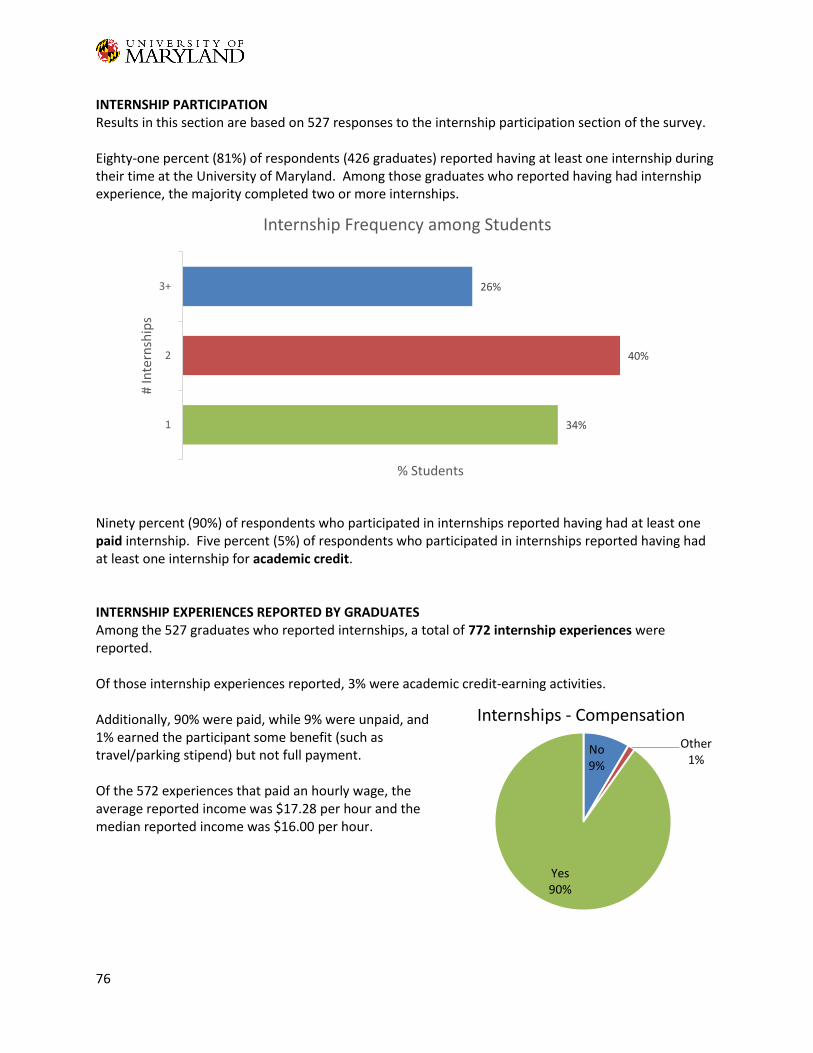
76
INTERNSHIP PARTICIPATION Results in this section are based on 527 responses to the internship participation section of the survey. Eighty-one percent (81%) of respondents (426 graduates) reported having at least one internship during their time at the University of Maryland. Among those graduates who reported having had internship experience, the majority completed two or more internships.
Ninety percent (90%) of respondents who participated in internships reported having had at least one paid internship. Five percent (5%) of respondents who participated in internships reported having had at least one internship for academic credit. INTERNSHIP EXPERIENCES REPORTED BY GRADUATES Among the 527 graduates who reported internships, a total of 772 internship experiences were reported. Of those internship experiences reported, 3% were academic credit-earning activities. Additionally, 90% were paid, while 9% were unpaid, and 1% earned the participant some benefit (such as travel/parking stipend) but not full payment. Of the 572 experiences that paid an hourly wage, the average reported income was $17.28 per hour and the median reported income was $16.00 per hour.
34%
40%
26%
1
2
3+
% Students
# In
tern
ship
s
Internship Frequency among Students
No9%
Other1%
Yes90%
Internships - Compensation
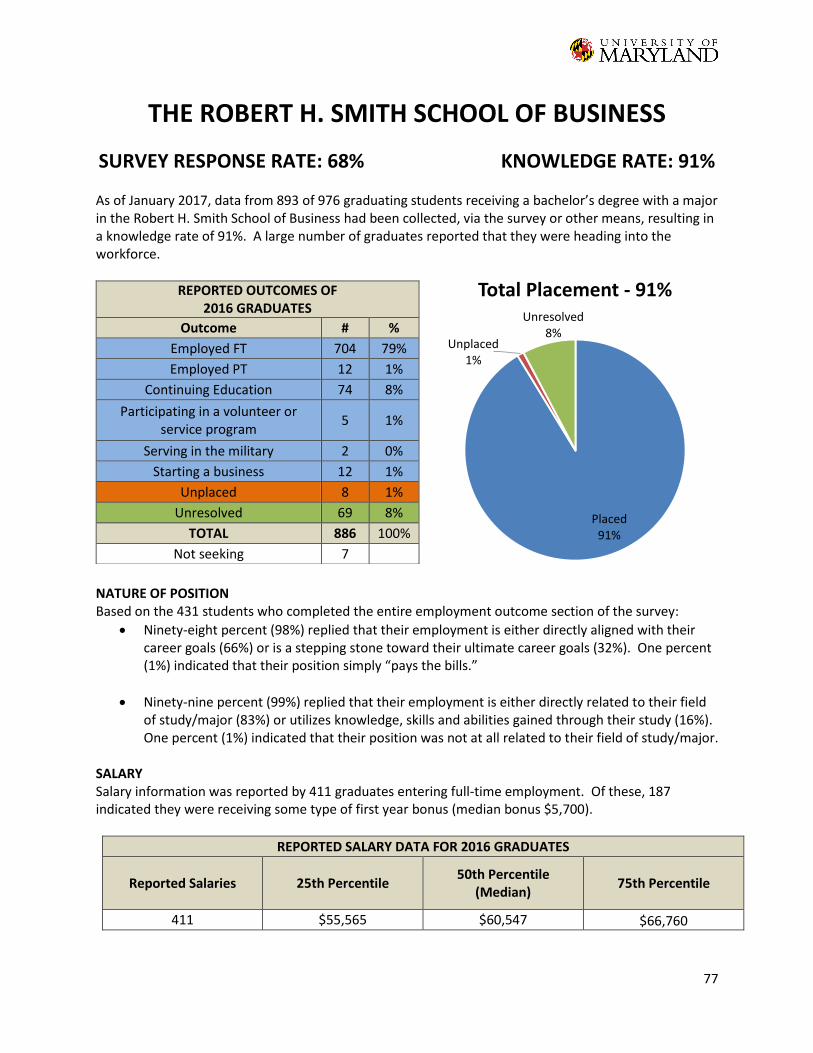
77
THE ROBERT H. SMITH SCHOOL OF BUSINESS
SURVEY RESPONSE RATE: 68% KNOWLEDGE RATE: 91%
As of January 2017, data from 893 of 976 graduating students receiving a bachelor’s degree with a major in the Robert H. Smith School of Business had been collected, via the survey or other means, resulting in a knowledge rate of 91%. A large number of graduates reported that they were heading into the workforce.
NATURE OF POSITION Based on the 431 students who completed the entire employment outcome section of the survey:
Ninety-eight percent (98%) replied that their employment is either directly aligned with their career goals (66%) or is a stepping stone toward their ultimate career goals (32%). One percent (1%) indicated that their position simply “pays the bills.”
Ninety-nine percent (99%) replied that their employment is either directly related to their field of study/major (83%) or utilizes knowledge, skills and abilities gained through their study (16%). One percent (1%) indicated that their position was not at all related to their field of study/major.
SALARY Salary information was reported by 411 graduates entering full-time employment. Of these, 187 indicated they were receiving some type of first year bonus (median bonus $5,700).
REPORTED SALARY DATA FOR 2016 GRADUATES
Reported Salaries 25th Percentile 50th Percentile
(Median) 75th Percentile
411 $55,565 $60,547 $66,760
REPORTED OUTCOMES OF 2016 GRADUATES
Outcome # %
Employed FT 704 79%
Employed PT 12 1%
Continuing Education 74 8%
Participating in a volunteer or service program
5 1%
Serving in the military 2 0%
Starting a business 12 1%
Unplaced 8 1%
Unresolved 69 8%
TOTAL 886 100%
Not seeking 7
Placed91%
Unplaced1%
Unresolved8%
Total Placement - 91%
78
EMPLOYMENT SEARCH
Method Used to Find Employment
On-Campus Interviews 45% Contacts from faculty 3%
Previous Internship/Co-op 25% Contacts from family/friends 12%
Career Fairs - on campus 21% Currently employed with organization 1%
Career Fairs - off campus 0% Newspaper 0%
UMD online job site 44% Other 4%
Non-UMD online job site 6% *graduates could select as many items as applied
Items entered for “Other” included business school club and Wall Street Resume Book. SAMPLE OF EMPLOYERS AND POSITIONS REPORTED Accenture
Accounting Advisory Analyst Business Analyst Financial Management Analyst
Adobe Account Development Manager
Amazon Area Manager Operations Finance Rotational Program
Appian Corporation Associate Consultant
Avendra LLC Contract Administration, Planning, and Support Analyst
Bain Capital Hedge Fund Analyst
Baker Tilly Government Contracting Staff Consultant Staff Accountant Tax & Assurance Associate
Baltimore Orioles Corporate Partnership Marketing Assistant
Bank of America Corporate Auditor Credit Analyst Financial Advisor Investment Banking Analyst
Bloomberg Account Analyst Data Analyst Market Data Analyst
Capital One Credit Analyst Finance Associate
Citi S&T Analyst
Cognizant Business Analyst
CohnReznick Assurance Associate Audit Associate Staff Accountant Staff Auditor Tax Associate
Consumer Financial Protection Bureau Director's Financial Analyst
Dell Account Manager
Deloitte Advisory Consultant Business Analyst Marketing and Communications Specialist Staff Auditor Strategy & Operations Business Analyst Tax Associate
Deutsche Bank Investment Banking Analyst
Ernst & Young Assurance Associate Business Advisor Tax Staff Accountant Technology Advisor
79
Fannie Mae Financial Analyst Internal Auditor
General Electric Financial Management Program
Goldman Sachs Analyst Securities Division Investment Management Analyst
Grant Thornton LLP Audit Associate Business Advisory Associate Tax Associate
IBM Cognitive Computing Solution Sales Specialist Enterprise Applications Consultant Federal Consultant
Jet.com Product Catalog Operations Analyst
JPMorgan Chase & Co. Credit Analyst Financial Analyst Operations Analyst
Kaiser Permanente Innovation Analyst
KPMG Audit Associate Credit Risk Advisory Associate Economic & Valuation Services Associate Federal Advisory Associate Tax Associate
Leidos Business Development
Lockheed Martin Financial Analyst
Macy's Executive Development Program
Morgan Stanley Financial Analyst Operations Analyst
National Security Agency Budget Analyst Intelligence Analyst Developmental Program
Nestlé Supply Chain Trainee
NewDay USA Account Executive Credit Analyst Employee Programs Coordinator
Nike, Inc. Global Procurement Analyst
Northrop Grumman Supply Chain Analyst
PepsiCo Integrated Supply Chain Analyst Sales Associate
PricewaterhouseCoopers Assurance Associate Audit Associate Financial Markets Associate Real Estate Tax Associate Risk Advisory Associate
Procter & Gamble Purchasing Manager
Scottrade Investment Consultant
Stanley Black & Decker Financial Analyst
T. Rowe Price Investment Operations
Tesla Product Specialist
Time Inc. Assistant Brand Manager
Twitter Account Coordinator
Under Armour Brand Coordinator Sourcing Operations Analyst Supply Planner Auto Replenishment
Unilever Supply Chain Analyst Unilever Future Leader Program
U.S. Department of the Treasury Assistant National Bank Examiner
WeddingWire Sales Associate
Wells Fargo Investment Banking Analyst Securities Analyst
Yelp Account Executive
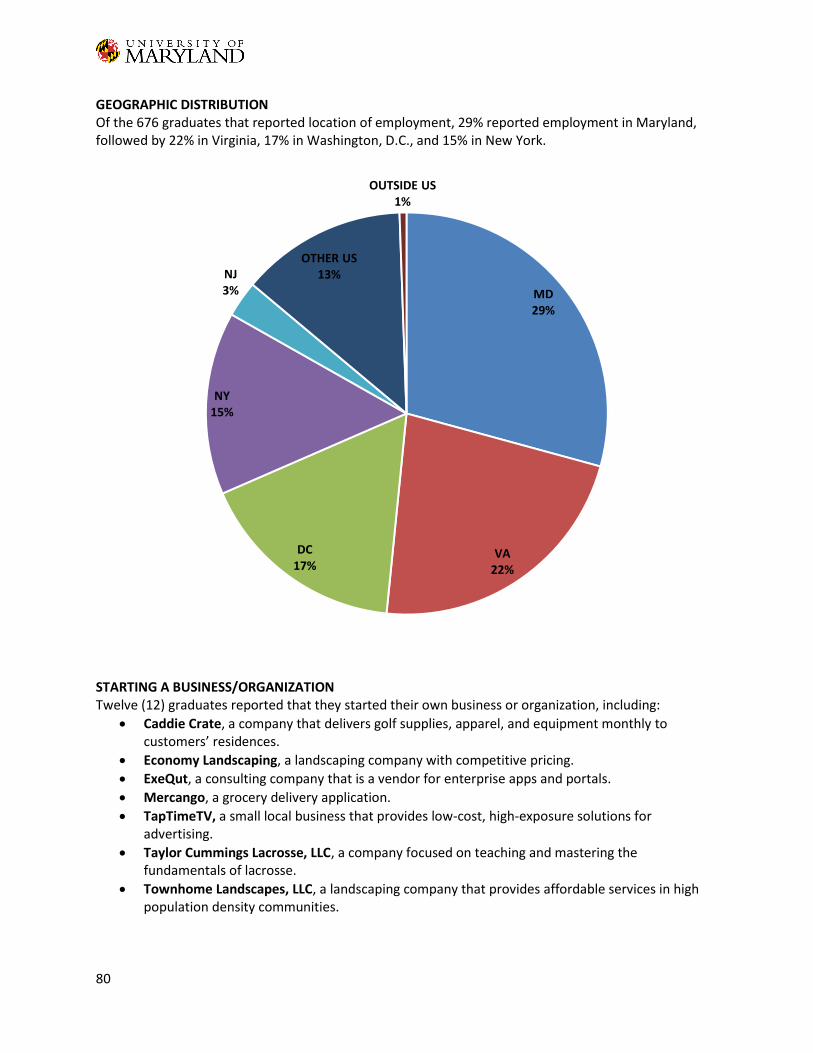
80
GEOGRAPHIC DISTRIBUTION Of the 676 graduates that reported location of employment, 29% reported employment in Maryland, followed by 22% in Virginia, 17% in Washington, D.C., and 15% in New York.
STARTING A BUSINESS/ORGANIZATION Twelve (12) graduates reported that they started their own business or organization, including:
Caddie Crate, a company that delivers golf supplies, apparel, and equipment monthly to customers’ residences.
Economy Landscaping, a landscaping company with competitive pricing.
ExeQut, a consulting company that is a vendor for enterprise apps and portals.
Mercango, a grocery delivery application.
TapTimeTV, a small local business that provides low-cost, high-exposure solutions for advertising.
Taylor Cummings Lacrosse, LLC, a company focused on teaching and mastering the fundamentals of lacrosse.
Townhome Landscapes, LLC, a landscaping company that provides affordable services in high population density communities.
MD29%
VA22%
DC17%
NY15%
NJ3%
OTHER US13%
OUTSIDE US1%
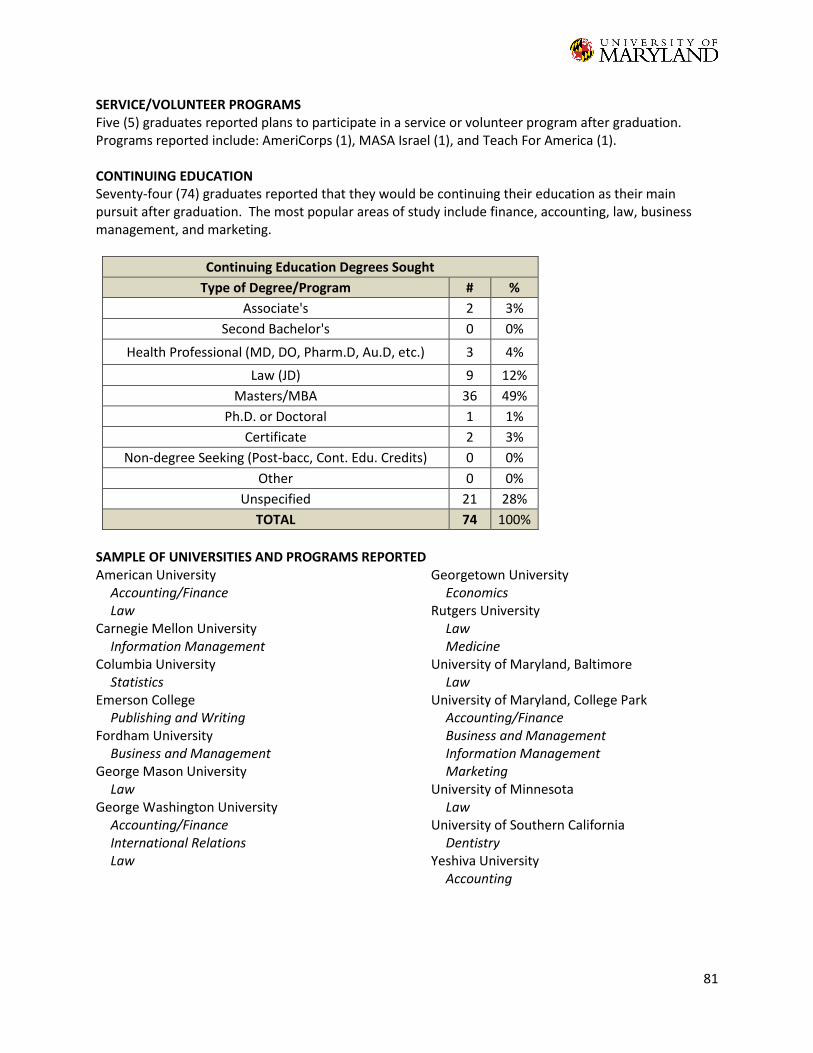
81
SERVICE/VOLUNTEER PROGRAMS Five (5) graduates reported plans to participate in a service or volunteer program after graduation. Programs reported include: AmeriCorps (1), MASA Israel (1), and Teach For America (1). CONTINUING EDUCATION Seventy-four (74) graduates reported that they would be continuing their education as their main pursuit after graduation. The most popular areas of study include finance, accounting, law, business management, and marketing.
Continuing Education Degrees Sought
Type of Degree/Program # %
Associate's 2 3%
Second Bachelor's 0 0%
Health Professional (MD, DO, Pharm.D, Au.D, etc.) 3 4%
Law (JD) 9 12%
Masters/MBA 36 49%
Ph.D. or Doctoral 1 1%
Certificate 2 3%
Non-degree Seeking (Post-bacc, Cont. Edu. Credits) 0 0%
Other 0 0%
Unspecified 21 28%
TOTAL 74 100%
SAMPLE OF UNIVERSITIES AND PROGRAMS REPORTEDAmerican University
Accounting/Finance Law
Carnegie Mellon University Information Management
Columbia University Statistics
Emerson College Publishing and Writing
Fordham University Business and Management
George Mason University Law
George Washington University Accounting/Finance International Relations Law
Georgetown University Economics
Rutgers University Law Medicine
University of Maryland, Baltimore Law
University of Maryland, College Park Accounting/Finance Business and Management Information Management Marketing
University of Minnesota Law
University of Southern California Dentistry
Yeshiva University Accounting

82
OUT OF CLASSROOM EXPERIENCE Based on 667 survey responses.
Experiences while at UMD
Part-time employment (on campus) 33% Clinical or hospital rotation 0%
Part-time employment (off campus)
36% Study Abroad 26%
Full-time employment (both on or off campus)
7% Work Abroad 3%
Federal Work-Study 4% Community service learning/ volunteer work
19%
Research programs(s) (on campus)
2% Student Group Leadership 26%
Research project(s) (on campus - faculty driven)
2% Student Group Membership 31%
Summer Research Program(s) 1% Living-learning community 25%
Co-op(s) 1% Other 14%
Student teaching 8% None of the above 0%
*Graduates could select as many items as applied, unless they selected “none of the above.”
Those respondents selecting “Other” most commonly wrote in items relating to community assistantships, “Greek” life (fraternity/sorority), varsity sports and fellowships.
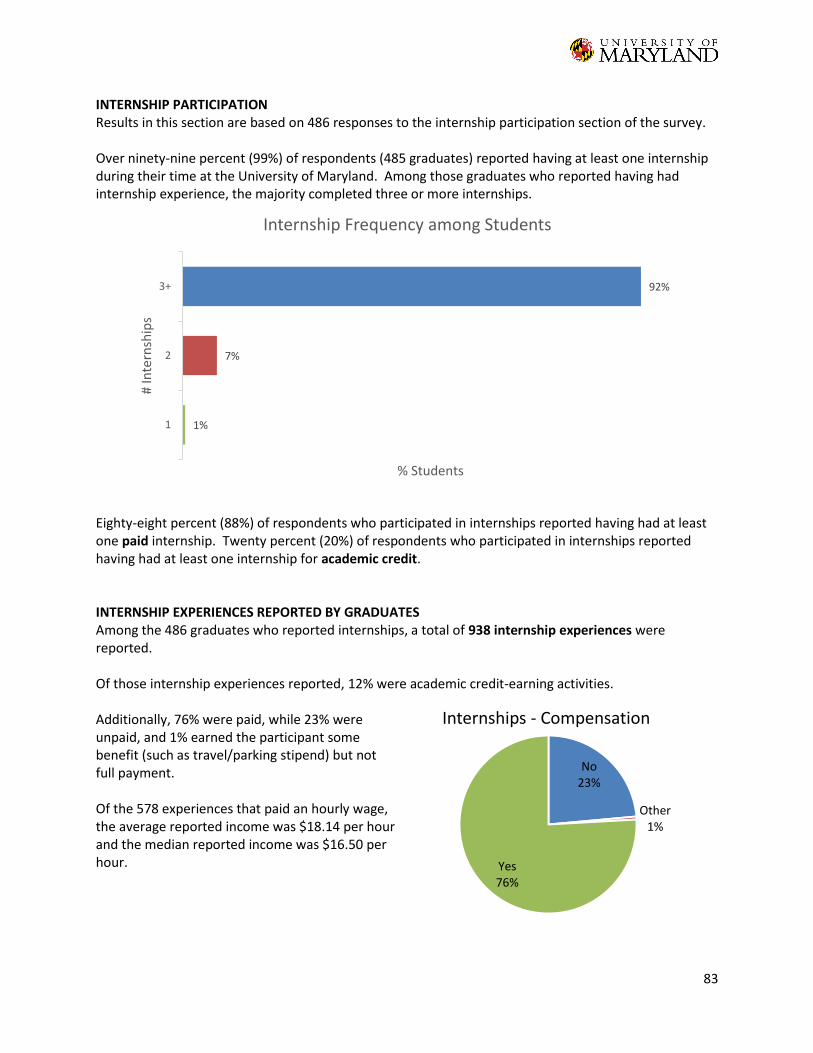
83
INTERNSHIP PARTICIPATION Results in this section are based on 486 responses to the internship participation section of the survey. Over ninety-nine percent (99%) of respondents (485 graduates) reported having at least one internship during their time at the University of Maryland. Among those graduates who reported having had internship experience, the majority completed three or more internships.
Eighty-eight percent (88%) of respondents who participated in internships reported having had at least one paid internship. Twenty percent (20%) of respondents who participated in internships reported having had at least one internship for academic credit. INTERNSHIP EXPERIENCES REPORTED BY GRADUATES Among the 486 graduates who reported internships, a total of 938 internship experiences were reported. Of those internship experiences reported, 12% were academic credit-earning activities. Additionally, 76% were paid, while 23% were unpaid, and 1% earned the participant some benefit (such as travel/parking stipend) but not full payment. Of the 578 experiences that paid an hourly wage, the average reported income was $18.14 per hour and the median reported income was $16.50 per hour.
1%
7%
92%
1
2
3+
% Students
# In
tern
ship
s
Internship Frequency among Students
No23%
Other1%
Yes76%
Internships - Compensation

ADDITIONAL REPORTS
COLLEGE PARK SCHOLARS 87 HONORS COLLEGE 95 LETTERS & SCIENCES 103

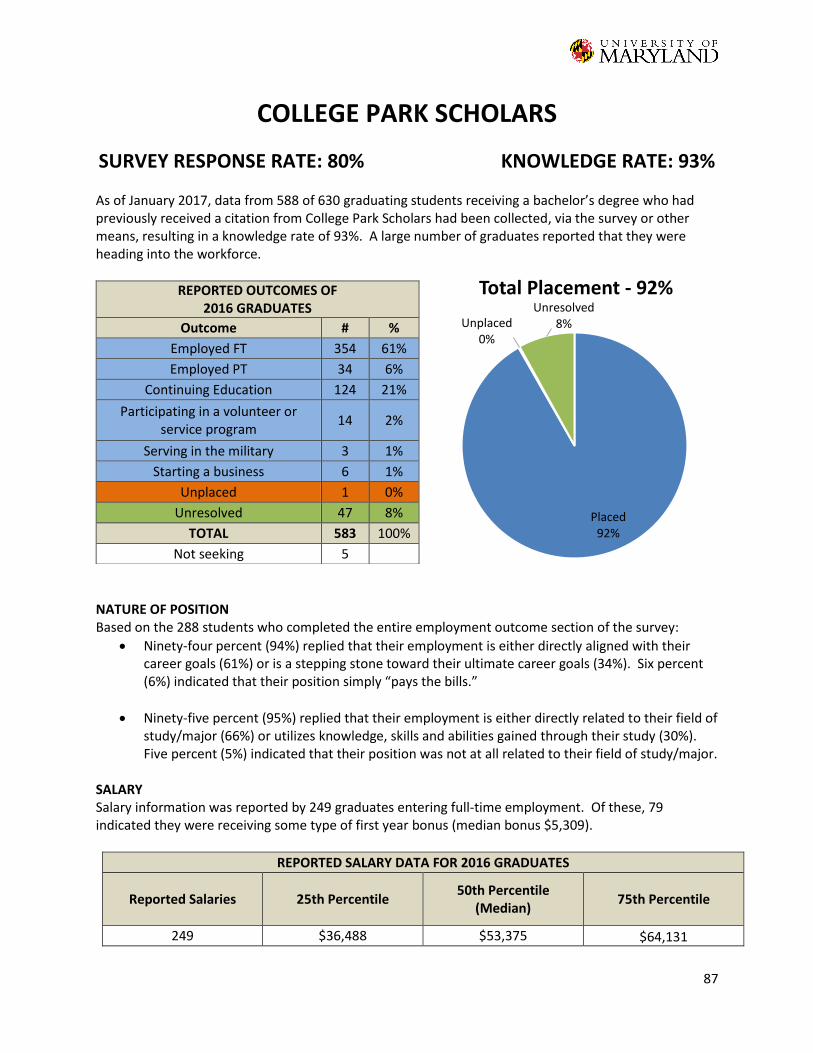
87
COLLEGE PARK SCHOLARS
SURVEY RESPONSE RATE: 80% KNOWLEDGE RATE: 93%
As of January 2017, data from 588 of 630 graduating students receiving a bachelor’s degree who had previously received a citation from College Park Scholars had been collected, via the survey or other means, resulting in a knowledge rate of 93%. A large number of graduates reported that they were heading into the workforce.
NATURE OF POSITION Based on the 288 students who completed the entire employment outcome section of the survey:
Ninety-four percent (94%) replied that their employment is either directly aligned with their career goals (61%) or is a stepping stone toward their ultimate career goals (34%). Six percent (6%) indicated that their position simply “pays the bills.”
Ninety-five percent (95%) replied that their employment is either directly related to their field of study/major (66%) or utilizes knowledge, skills and abilities gained through their study (30%). Five percent (5%) indicated that their position was not at all related to their field of study/major.
SALARY Salary information was reported by 249 graduates entering full-time employment. Of these, 79 indicated they were receiving some type of first year bonus (median bonus $5,309).
REPORTED SALARY DATA FOR 2016 GRADUATES
Reported Salaries 25th Percentile 50th Percentile
(Median) 75th Percentile
249 $36,488 $53,375 $64,131
REPORTED OUTCOMES OF 2016 GRADUATES
Outcome # %
Employed FT 354 61%
Employed PT 34 6%
Continuing Education 124 21%
Participating in a volunteer or service program
14 2%
Serving in the military 3 1%
Starting a business 6 1%
Unplaced 1 0%
Unresolved 47 8%
TOTAL 583 100%
Not seeking 5
Placed92%
Unplaced0%
Unresolved8%
Total Placement - 92%
88
EMPLOYMENT SEARCH
Method Used to Find Employment
On-Campus Interviews 20% Contacts from faculty 8%
Previous Internship/Co-op 27% Contacts from family/friends 14%
Career Fairs - on campus 11% Currently employed with organization 9%
Career Fairs - off campus 1% Newspaper 1%
UMD online job site 18% Other 7%
Non-UMD online job site 15% *graduates could select as many items as applied
Items entered for “Other” included on campus info session, applying directly to employer websites and departmental listserv/newsletter. SAMPLE OF EMPLOYERS AND POSITIONS REPORTED Accenture
Business and Technology Analyst Management Consulting Analyst Software Engineering Analyst
Adobe Account Development Manager Associate Web Consultant
Advisory Board Company Sales/Marketing Associate
Amazon Area Manager Operations Finance Rotational Program Operations Team Leader
American Psychological Association Minority Fellowship Intern
Anne Arundel County Public Schools English Teacher
Appian Corporation Associate Cloud Engineer Software Engineer
Baltimore Business Journal Reporter
Bank of America Investment Banking Analyst Wholesale Credit Analyst
Bloomberg Data Analyst Software Engineer
Booz Allen Hamilton Consultant Junior Healthcare Analyst
Capital One Credit Analyst Finance Rotation Program Associate
CareFirst BlueCross BlueShield Systems Engineer
Clark Construction Group Office Engineer
Cognizant Business Analyst Technology Solutions Analyst
Comcast Corporation CORE Finance Associate
Deloitte Advisory Consultant Audit Staff Business Technology Analyst
Discovery Communications Production Assistant Sales Planner
Epic Systems Implementation Services Technical Services
Ernst & Young Assurance Associate Risk Assurance Consultant
Facebook Product Designer
Federal Aviation Administration General Engineer
Ford Motor Company Product Development Engineer
89
Google Software Engineer
Grant Thornton LLP Business Advisory Associate Tax Associate
Japan Exchange and Teaching Program English Teacher
Jet.com Product Catalog Operations Analyst
Johns Hopkins University Laboratory Technician Ophthalmology Technician Research Assistant
Johns Hopkins University Applied Physics Laboratory
Associate Professional Staff Flight Control Engineer
JPMorgan Chase & Co. Corporate Analyst Development Program Operations Analyst
KPMG Audit Associate Credit Risk Advisory Associate
Kraft Foods Group, Inc. Operations Management Trainee
Leidos Systems Engineer Associate
LinkedIn Software Engineer
Lockheed Martin Systems Engineer
Macy's Product Assistant
Maryland General Assembly Legislative Director
Microsoft Corporation Software Development Engineer
Montgomery County Public Schools Instrumental Music Teacher Teacher
Morgan Stanley Operations Analyst
National Institute of Standards and Technology Guest Researcher
National Institutes of Health Post Baccalaureate IRTA
National Security Agency Office Manager
Naval Surface Warfare Center Mechanical Engineer Reliability Engineer
Nestlé Supply Chain Trainee
Nike Global Procurement Analyst
Northrop Grumman Software Engineer Supply Chain Cohort
Paypal Software Engineer
PepsiCo Sales Associate
PricewaterhouseCoopers Assurance Associate Audit Associate Management Consulting Associate
Procter & Gamble Process Engineer
ScribeAmerica Medical Scribe
Sikorsky Aircraft Corporation Associates Systems Engineer
Sinclair Broadcast Group Multimedia Journalist
Snapchat Inc. Story Editor
TEKsystems Technical Recruiter
Texas Instruments Application Rotations Engineer
Tiffany & Co. HR Coordinator
Total Wine & More Senior Specialist, Supply Chain Management
Under Armour Sourcing Operations Analyst
Unilever Unilever Future Leaders Program
University of Maryland, College Park Admissions Counselor Faculty Research Assistant Researcher/Lab Technician Software Engineer
U.S. Department of Justice Paralegal Specialist Trainee
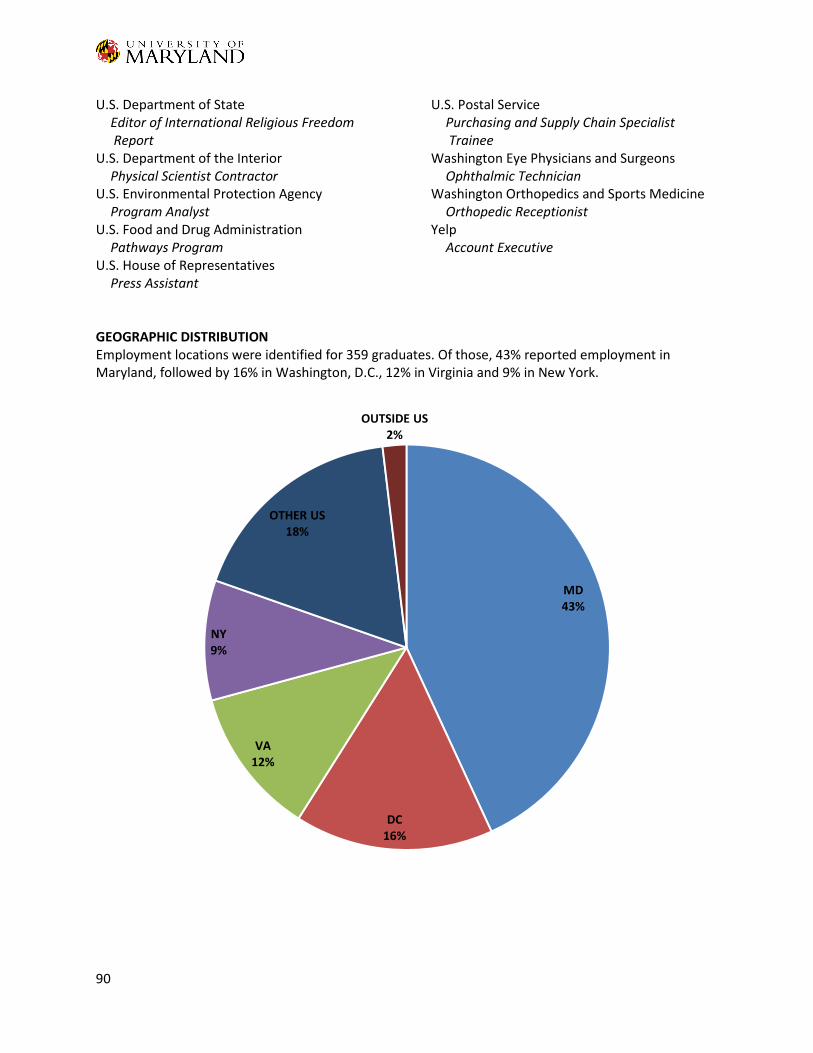
90
U.S. Department of State Editor of International Religious Freedom Report
U.S. Department of the Interior Physical Scientist Contractor
U.S. Environmental Protection Agency Program Analyst
U.S. Food and Drug Administration Pathways Program
U.S. House of Representatives Press Assistant
U.S. Postal Service Purchasing and Supply Chain Specialist Trainee
Washington Eye Physicians and Surgeons Ophthalmic Technician
Washington Orthopedics and Sports Medicine Orthopedic Receptionist
Yelp Account Executive
GEOGRAPHIC DISTRIBUTION Employment locations were identified for 359 graduates. Of those, 43% reported employment in Maryland, followed by 16% in Washington, D.C., 12% in Virginia and 9% in New York.
MD43%
DC16%
VA12%
NY9%
OTHER US18%
OUTSIDE US2%
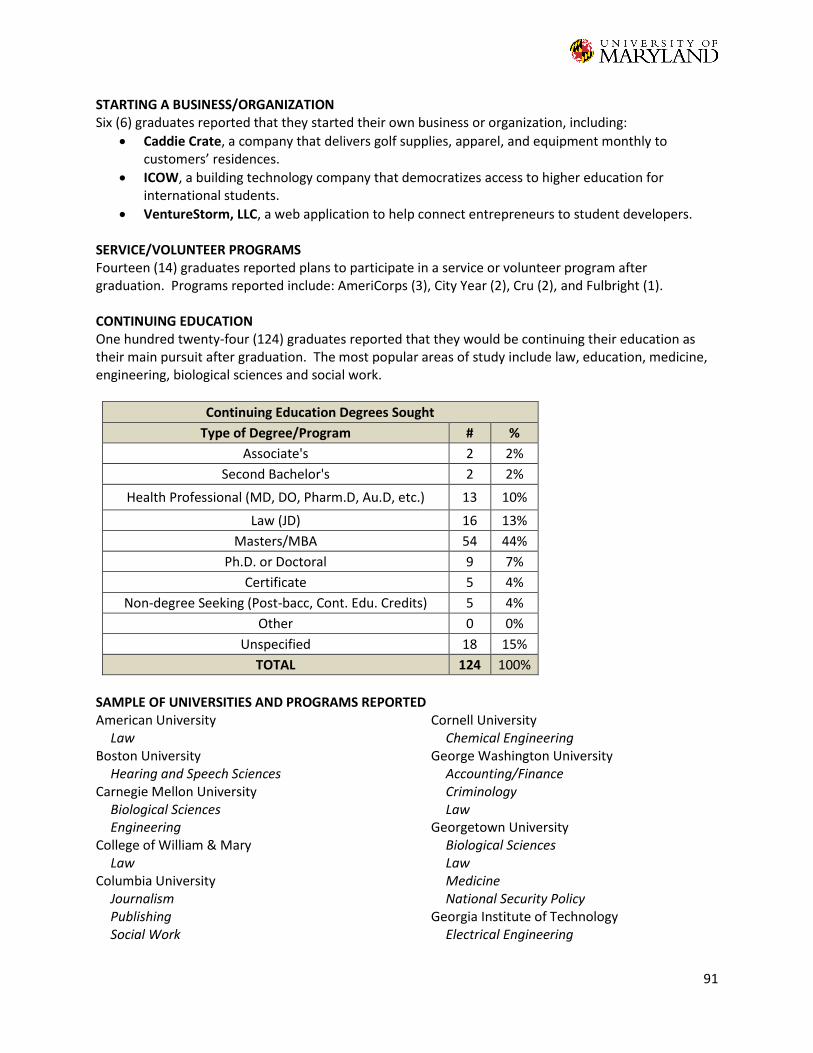
91
STARTING A BUSINESS/ORGANIZATION Six (6) graduates reported that they started their own business or organization, including:
Caddie Crate, a company that delivers golf supplies, apparel, and equipment monthly to customers’ residences.
ICOW, a building technology company that democratizes access to higher education for international students.
VentureStorm, LLC, a web application to help connect entrepreneurs to student developers. SERVICE/VOLUNTEER PROGRAMS Fourteen (14) graduates reported plans to participate in a service or volunteer program after graduation. Programs reported include: AmeriCorps (3), City Year (2), Cru (2), and Fulbright (1). CONTINUING EDUCATION One hundred twenty-four (124) graduates reported that they would be continuing their education as their main pursuit after graduation. The most popular areas of study include law, education, medicine, engineering, biological sciences and social work.
Continuing Education Degrees Sought
Type of Degree/Program # %
Associate's 2 2%
Second Bachelor's 2 2%
Health Professional (MD, DO, Pharm.D, Au.D, etc.) 13 10%
Law (JD) 16 13%
Masters/MBA 54 44%
Ph.D. or Doctoral 9 7%
Certificate 5 4%
Non-degree Seeking (Post-bacc, Cont. Edu. Credits) 5 4%
Other 0 0%
Unspecified 18 15%
TOTAL 124 100%
SAMPLE OF UNIVERSITIES AND PROGRAMS REPORTEDAmerican University
Law Boston University
Hearing and Speech Sciences Carnegie Mellon University
Biological Sciences Engineering
College of William & Mary Law
Columbia University Journalism Publishing Social Work
Cornell University Chemical Engineering
George Washington University Accounting/Finance Criminology Law
Georgetown University Biological Sciences Law Medicine National Security Policy
Georgia Institute of Technology Electrical Engineering
92
Johns Hopkins University Dietetics Education
King's College London Conflict Resolution
New York University Law
Pennsylvania State University Engineering
Rutgers University Biological Sciences Law
The Ohio State University Higher Education/Student Affairs Law
University of California, Berkeley Physics
University of California, Los Angeles Engineering Law
University of Chicago Biological Sciences
University of Glasgow Education
University of Maryland, Baltimore Dentistry Law Medicine Nursing Pharmacy Physical Therapy
University of Maryland, College Park Architecture Computer Science Education Engineering Hearing and Speech Sciences Music Public Health Public Policy Robotics Urban Studies and Planning
University of Michigan Law
University of Pennsylvania Social Work Urban Studies and Planning
University of Virginia Law
Vanderbilt University Education
Virginia–Maryland College of Veterinary Medicine
Veterinary Medicine
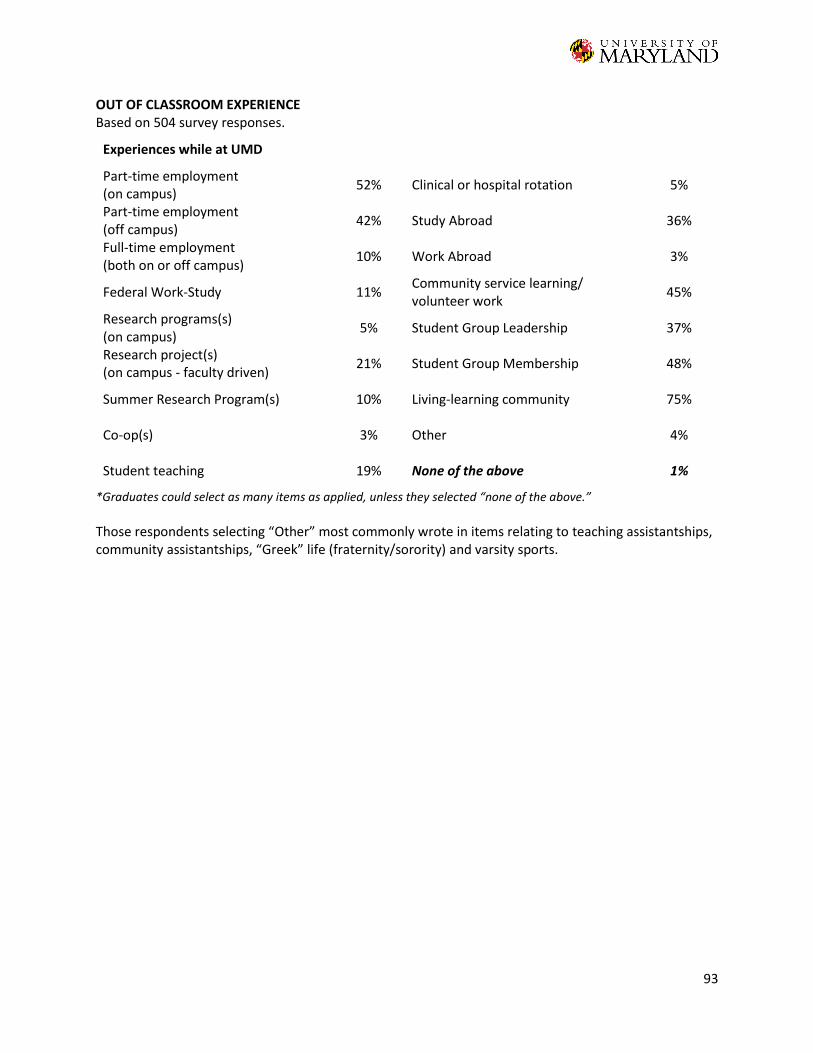
93
OUT OF CLASSROOM EXPERIENCE Based on 504 survey responses.
Experiences while at UMD
Part-time employment (on campus) 52% Clinical or hospital rotation 5%
Part-time employment (off campus)
42% Study Abroad 36%
Full-time employment (both on or off campus)
10% Work Abroad 3%
Federal Work-Study 11% Community service learning/ volunteer work
45%
Research programs(s) (on campus)
5% Student Group Leadership 37%
Research project(s) (on campus - faculty driven)
21% Student Group Membership 48%
Summer Research Program(s) 10% Living-learning community 75%
Co-op(s) 3% Other 4%
Student teaching 19% None of the above 1%
*Graduates could select as many items as applied, unless they selected “none of the above.”
Those respondents selecting “Other” most commonly wrote in items relating to teaching assistantships, community assistantships, “Greek” life (fraternity/sorority) and varsity sports.
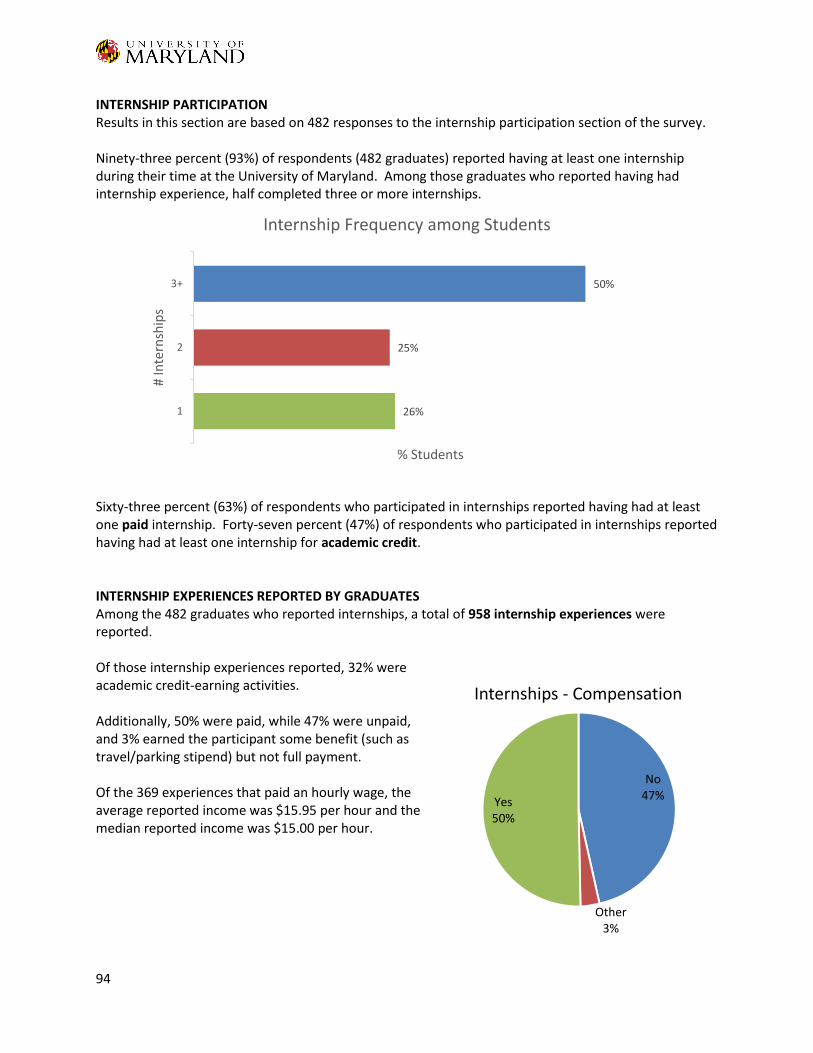
94
INTERNSHIP PARTICIPATION Results in this section are based on 482 responses to the internship participation section of the survey. Ninety-three percent (93%) of respondents (482 graduates) reported having at least one internship during their time at the University of Maryland. Among those graduates who reported having had internship experience, half completed three or more internships.
Sixty-three percent (63%) of respondents who participated in internships reported having had at least one paid internship. Forty-seven percent (47%) of respondents who participated in internships reported having had at least one internship for academic credit. INTERNSHIP EXPERIENCES REPORTED BY GRADUATES Among the 482 graduates who reported internships, a total of 958 internship experiences were reported. Of those internship experiences reported, 32% were academic credit-earning activities. Additionally, 50% were paid, while 47% were unpaid, and 3% earned the participant some benefit (such as travel/parking stipend) but not full payment. Of the 369 experiences that paid an hourly wage, the average reported income was $15.95 per hour and the median reported income was $15.00 per hour.
26%
25%
50%
1
2
3+
% Students
# In
tern
ship
s
Internship Frequency among Students
No47%
Other3%
Yes50%
Internships - Compensation
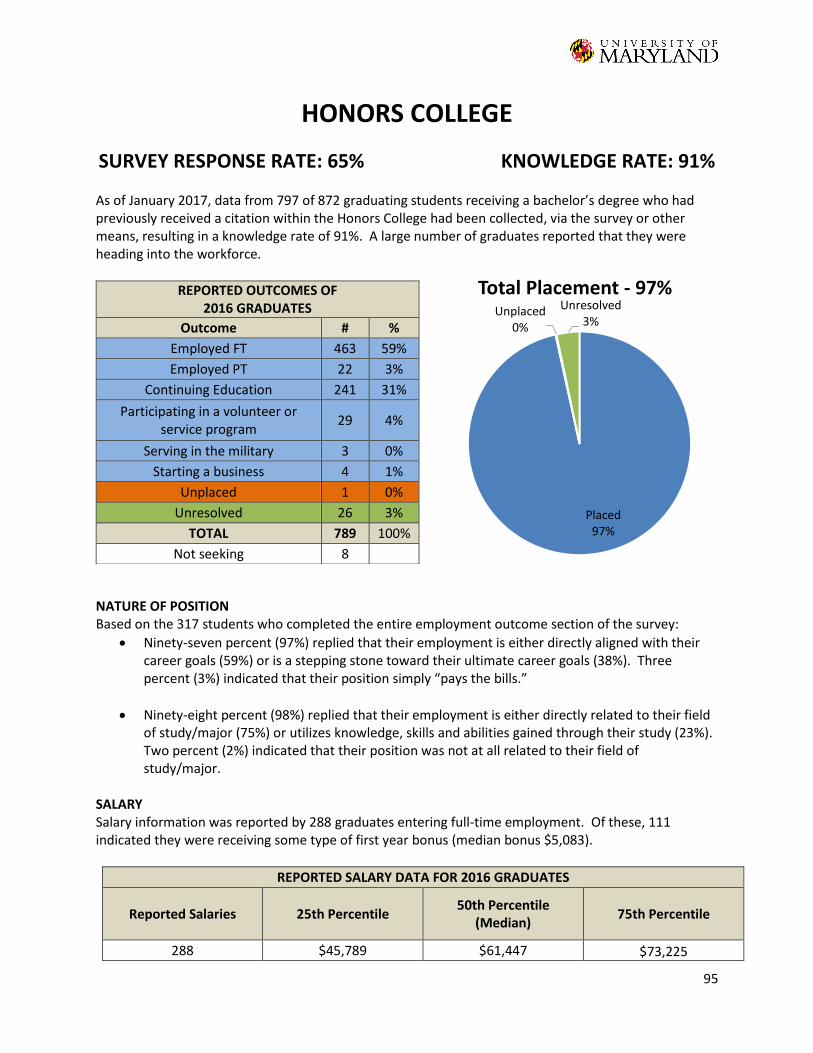
95
HONORS COLLEGE
SURVEY RESPONSE RATE: 65% KNOWLEDGE RATE: 91%
As of January 2017, data from 797 of 872 graduating students receiving a bachelor’s degree who had previously received a citation within the Honors College had been collected, via the survey or other means, resulting in a knowledge rate of 91%. A large number of graduates reported that they were heading into the workforce.
NATURE OF POSITION Based on the 317 students who completed the entire employment outcome section of the survey:
Ninety-seven percent (97%) replied that their employment is either directly aligned with their career goals (59%) or is a stepping stone toward their ultimate career goals (38%). Three percent (3%) indicated that their position simply “pays the bills.”
Ninety-eight percent (98%) replied that their employment is either directly related to their field of study/major (75%) or utilizes knowledge, skills and abilities gained through their study (23%). Two percent (2%) indicated that their position was not at all related to their field of study/major.
SALARY Salary information was reported by 288 graduates entering full-time employment. Of these, 111 indicated they were receiving some type of first year bonus (median bonus $5,083).
REPORTED SALARY DATA FOR 2016 GRADUATES
Reported Salaries 25th Percentile 50th Percentile
(Median) 75th Percentile
288 $45,789 $61,447 $73,225
REPORTED OUTCOMES OF 2016 GRADUATES
Outcome # %
Employed FT 463 59%
Employed PT 22 3%
Continuing Education 241 31%
Participating in a volunteer or service program
29 4%
Serving in the military 3 0%
Starting a business 4 1%
Unplaced 1 0%
Unresolved 26 3%
TOTAL 789 100%
Not seeking 8
Placed97%
Unplaced0%
Unresolved3%
Total Placement - 97%
96
EMPLOYMENT SEARCH
Method Used to Find Employment
On-Campus Interviews 29% Contacts from faculty 9%
Previous Internship/Co-op 24% Contacts from family/friends 15%
Career Fairs - on campus 22% Currently employed with organization 6%
Career Fairs - off campus 0% Newspaper 0%
UMD online job site 24% Other 8%
Non-UMD online job site 16% *graduates could select as many items as applied
Items entered for “Other” included personal research, applying directly to employer websites, off-campus interviews and departmental listserv/newsletter. SAMPLE OF EMPLOYERS AND POSITIONS REPORTED Accenture
Business Analyst Management Consulting Analyst Software Engineer
Amazon Data Associate Software Development Engineer
Appian Corporation Associate Consultant Software Engineer
Architecture Technology Corporation Systems Engineer
AT&T Associate Business Management - Business
Analyst Network Specialist
Bank of America Financial Advisor
Bethesda Magazine Intern
Bloomberg Market Data Analyst
Booz Allen Hamilton Junior Software Engineer Software Engineer Technologist
Capital One Cyber Security Engineer Data Engineer Software Engineer
Centers for Disease Control & Prevention Public Health Associate
Cincinnati Children's Hospital Medical Center Clinical Research Coordinator
Cisco Systems, Inc. Associate Sales Representative Research Engineer
Consumer Financial Protection Bureau Director's Financial Analyst
Cystic Fibrosis Foundation Management Operations Coordinator
Deloitte Audit Associate Business Technology Analyst Marketing and Communication Specialist Strategy and Operations Consulting Analyst
Deutsche Bank Investment Banking Analyst
Epic Systems Project Manager Software Developer Technical Problem Solver
Ernst & Young Risk Assurance Staff Tax Staff Accountant
ExxonMobil Chemist Process Engineer
Facebook Software Engineer
Fannie Mae Financial Analyst
Federal Reserve System Research Assistant

97
Ford Motor Company Product Development
Fulbright Teaching Program English Teaching Assistant
GEICO Actuarial Assistant
GeneDx DNA Extraction Technician
General Electric Renewable Energy Development Program
George Washington University Research Assistant
Goldman Sachs Investment Management Analyst Technology Analyst
Google Software Engineer
IBM Enterprise Applications Consultant
Johns Hopkins University Applied Physics Laboratory
Software Developer Systems Engineer
JPMorgan Chase & Co. Financial Analyst Technology Analyst
KPMG Advisory Associate Audit and Assurance Associate State and Local Tax Associate
Leidos Software Engineer
Marriott International Claims Representative
Microsoft Corporation Software Development Engineer
Morgan Stanley Finance Analyst
National Aeronautics and Space Administration Astronomical and Optical Sciences Intern Flight Software Engineer Operations Engineer/Sequencing Engineer
National Institutes of Health Post Baccalaureate IRTA
National Security Agency Intelligence Analyst Developmental Program
Naval Surface Warfare Center Materials Engineer Mechanical Engineer
PepsiCo Integrated Supply Chain Analyst
PricewaterhouseCoopers Assurance Associate Core Assurance Associate Financial Markets Associate Public Sector Advisory Associate
Procter & Gamble Purchasing Manager
Redfin Software Development Engineer
ScribeAmerica Medical scribe
Stanley Black & Decker Compliance Engineer
T. Rowe Price Investment Fellowship Program
The Boeing Company Design Engineer Mechanical Engineer Test Instrumentation Engineer
The Washington Post Copy Editing Intern
Time Inc. Assistant Brand Manager
Twitch Software Developer
Twitter Account Coordinator
Unilever Unilever Future Leaders Program Management Trainee
University of Maryland, College Park Academic Program Specialist Faculty Research Assistant Lab Manager
U.S. Department of Agriculture Chesapeake Bay Engineer
U.S. Food and Drug Administration ORISE Research Fellow
WeddingWire Sales Associate
Whiting-Turner Project Engineer
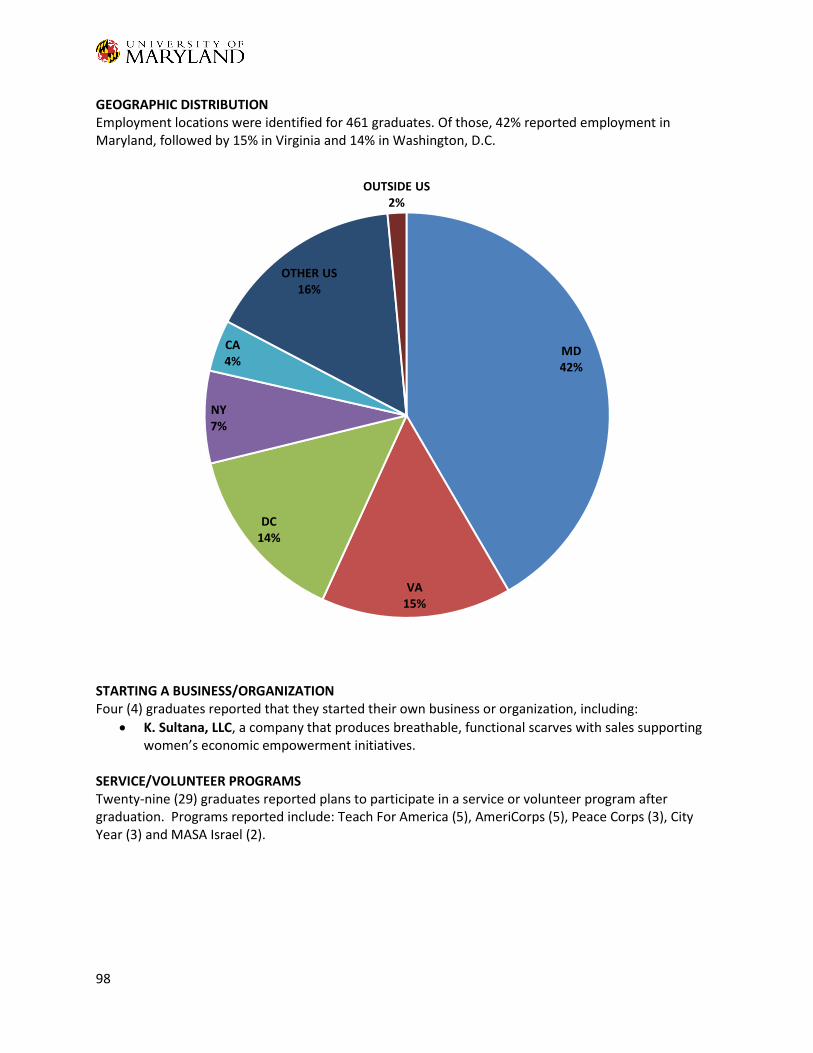
98
GEOGRAPHIC DISTRIBUTION Employment locations were identified for 461 graduates. Of those, 42% reported employment in Maryland, followed by 15% in Virginia and 14% in Washington, D.C.
STARTING A BUSINESS/ORGANIZATION Four (4) graduates reported that they started their own business or organization, including:
K. Sultana, LLC, a company that produces breathable, functional scarves with sales supporting women’s economic empowerment initiatives.
SERVICE/VOLUNTEER PROGRAMS Twenty-nine (29) graduates reported plans to participate in a service or volunteer program after graduation. Programs reported include: Teach For America (5), AmeriCorps (5), Peace Corps (3), City Year (3) and MASA Israel (2).
MD42%
VA15%
DC14%
NY7%
CA4%
OTHER US16%
OUTSIDE US2%
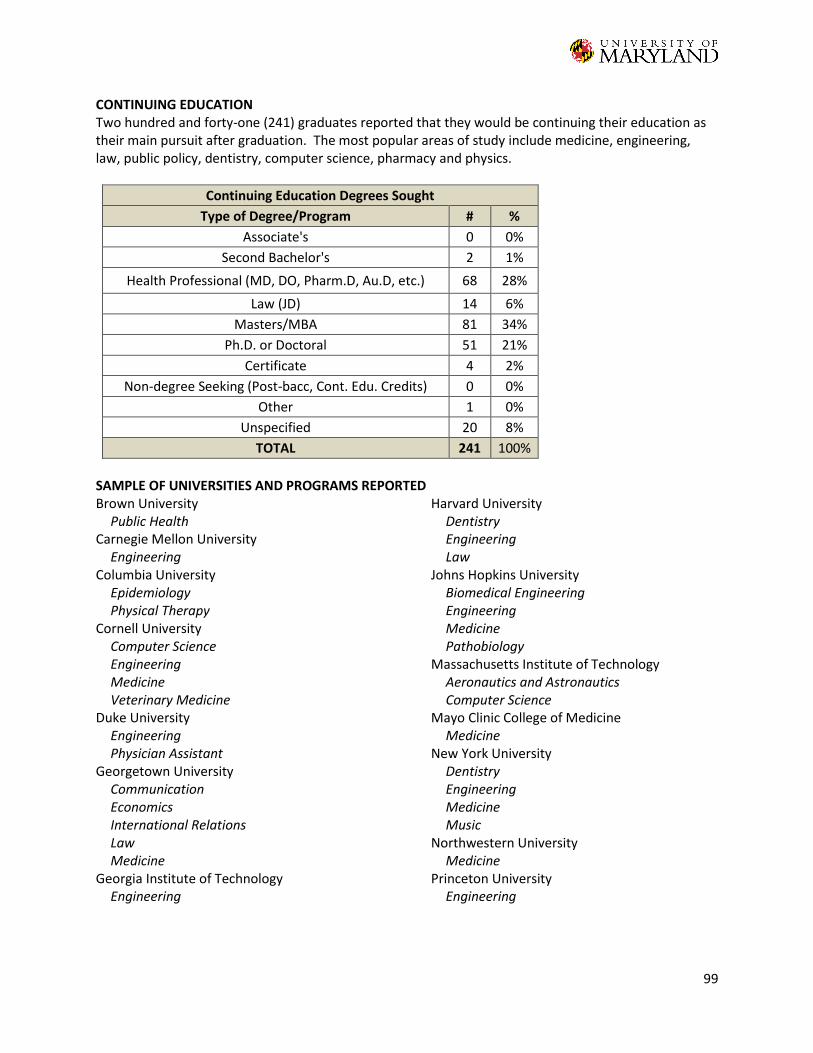
99
CONTINUING EDUCATION Two hundred and forty-one (241) graduates reported that they would be continuing their education as their main pursuit after graduation. The most popular areas of study include medicine, engineering, law, public policy, dentistry, computer science, pharmacy and physics.
Continuing Education Degrees Sought
Type of Degree/Program # %
Associate's 0 0%
Second Bachelor's 2 1%
Health Professional (MD, DO, Pharm.D, Au.D, etc.) 68 28%
Law (JD) 14 6%
Masters/MBA 81 34%
Ph.D. or Doctoral 51 21%
Certificate 4 2%
Non-degree Seeking (Post-bacc, Cont. Edu. Credits) 0 0%
Other 1 0%
Unspecified 20 8%
TOTAL 241 100%
SAMPLE OF UNIVERSITIES AND PROGRAMS REPORTEDBrown University
Public Health Carnegie Mellon University
Engineering Columbia University
Epidemiology Physical Therapy
Cornell University Computer Science Engineering Medicine Veterinary Medicine
Duke University Engineering Physician Assistant
Georgetown University Communication Economics International Relations Law Medicine
Georgia Institute of Technology Engineering
Harvard University Dentistry Engineering Law
Johns Hopkins University Biomedical Engineering Engineering Medicine Pathobiology
Massachusetts Institute of Technology Aeronautics and Astronautics Computer Science
Mayo Clinic College of Medicine Medicine
New York University Dentistry Engineering Medicine Music
Northwestern University Medicine
Princeton University Engineering
100
Stanford University Biological Sciences Engineering English Language and Literature
University of California, Berkeley Computer Science Engineering Physics
University of Chicago Law
University of Illinois at Urbana-Champaign Aerospace Engineering
University of Maryland, Baltimore Dentistry Law Medicine Nursing Pharmacy Physical Therapy
University of Maryland, College Park Computer Science Economics Engineering Mathematics Public Health Public Policy Real Estate Development Speech/Language Pathology
University of Michigan Engineering Medicine
University of North Carolina at Chapel Hill Medicine Pharmacy
University of Pennsylvania Dentistry Engineering Law
University of Texas at Austin Physics
University of Virginia Law Medicine
University of Washington Medical Speech-Language Pathology
Vanderbilt University Law
Yale University Medicine Physics
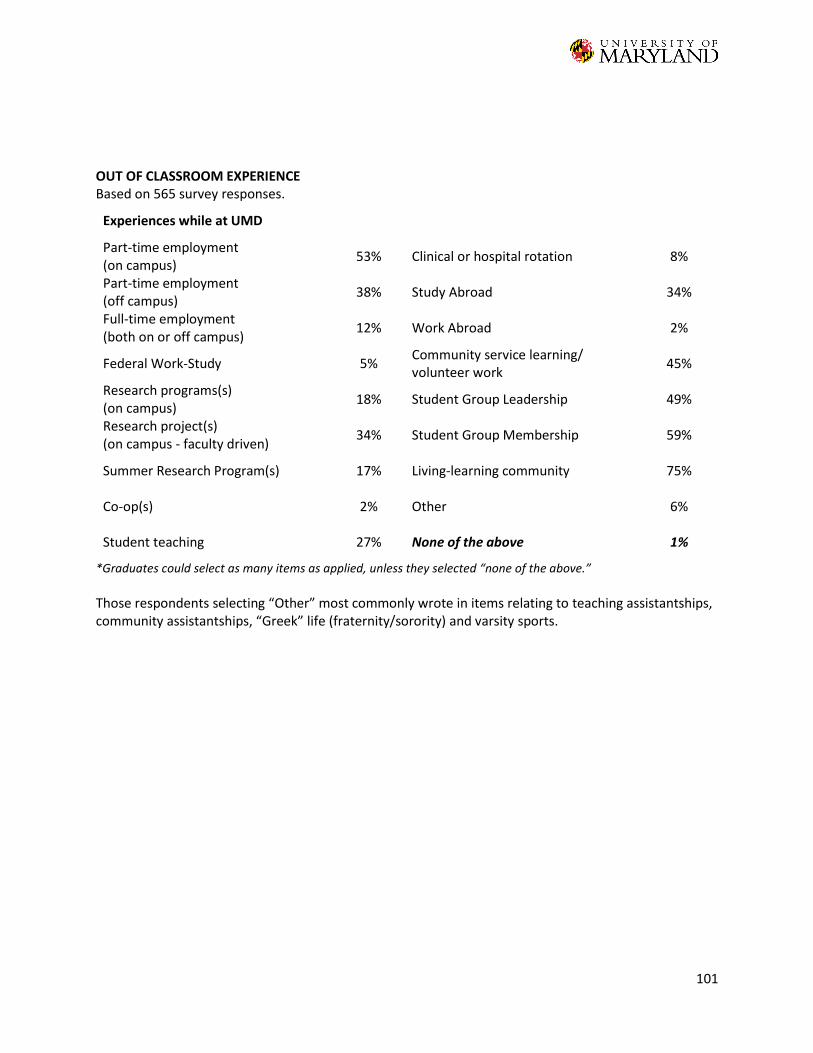
101
OUT OF CLASSROOM EXPERIENCE Based on 565 survey responses.
Experiences while at UMD
Part-time employment (on campus) 53% Clinical or hospital rotation 8%
Part-time employment (off campus)
38% Study Abroad 34%
Full-time employment (both on or off campus)
12% Work Abroad 2%
Federal Work-Study 5% Community service learning/ volunteer work
45%
Research programs(s) (on campus)
18% Student Group Leadership 49%
Research project(s) (on campus - faculty driven)
34% Student Group Membership 59%
Summer Research Program(s) 17% Living-learning community 75%
Co-op(s) 2% Other 6%
Student teaching 27% None of the above 1%
*Graduates could select as many items as applied, unless they selected “none of the above.”
Those respondents selecting “Other” most commonly wrote in items relating to teaching assistantships, community assistantships, “Greek” life (fraternity/sorority) and varsity sports.
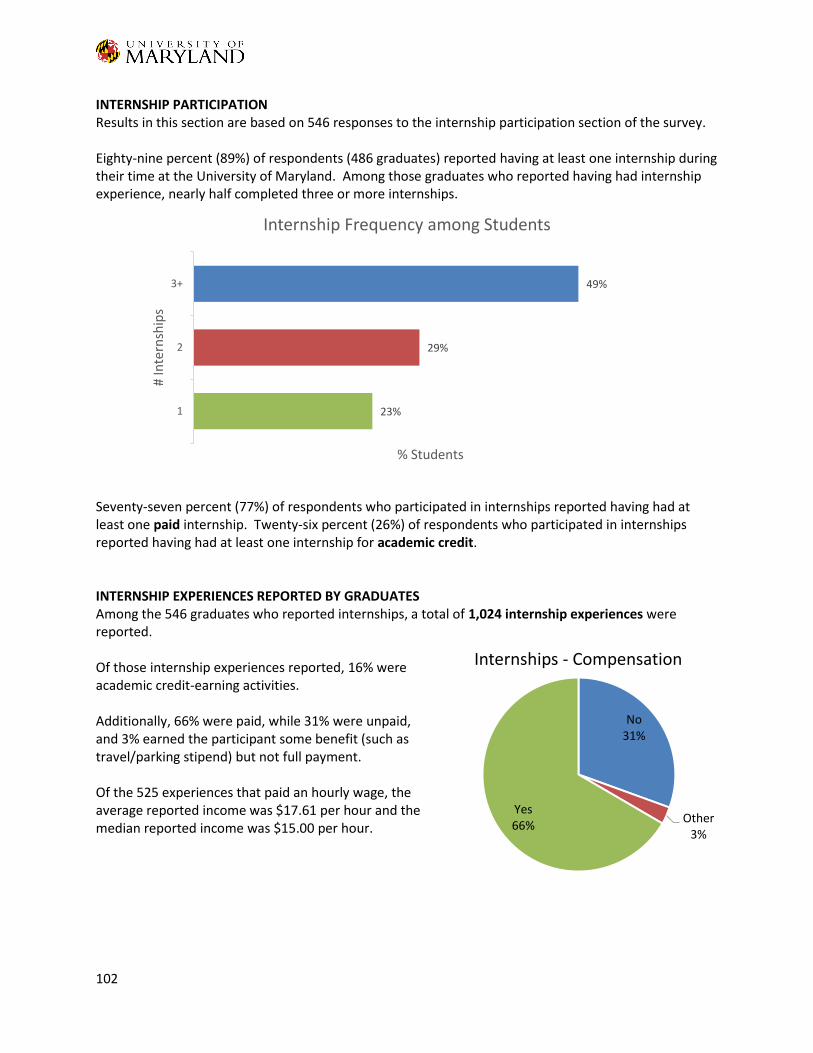
102
INTERNSHIP PARTICIPATION Results in this section are based on 546 responses to the internship participation section of the survey. Eighty-nine percent (89%) of respondents (486 graduates) reported having at least one internship during their time at the University of Maryland. Among those graduates who reported having had internship experience, nearly half completed three or more internships.
Seventy-seven percent (77%) of respondents who participated in internships reported having had at least one paid internship. Twenty-six percent (26%) of respondents who participated in internships reported having had at least one internship for academic credit. INTERNSHIP EXPERIENCES REPORTED BY GRADUATES Among the 546 graduates who reported internships, a total of 1,024 internship experiences were reported. Of those internship experiences reported, 16% were academic credit-earning activities. Additionally, 66% were paid, while 31% were unpaid, and 3% earned the participant some benefit (such as travel/parking stipend) but not full payment. Of the 525 experiences that paid an hourly wage, the average reported income was $17.61 per hour and the median reported income was $15.00 per hour.
23%
29%
49%
1
2
3+
% Students
# In
tern
ship
s
Internship Frequency among Students
No31%
Other3%
Yes66%
Internships - Compensation
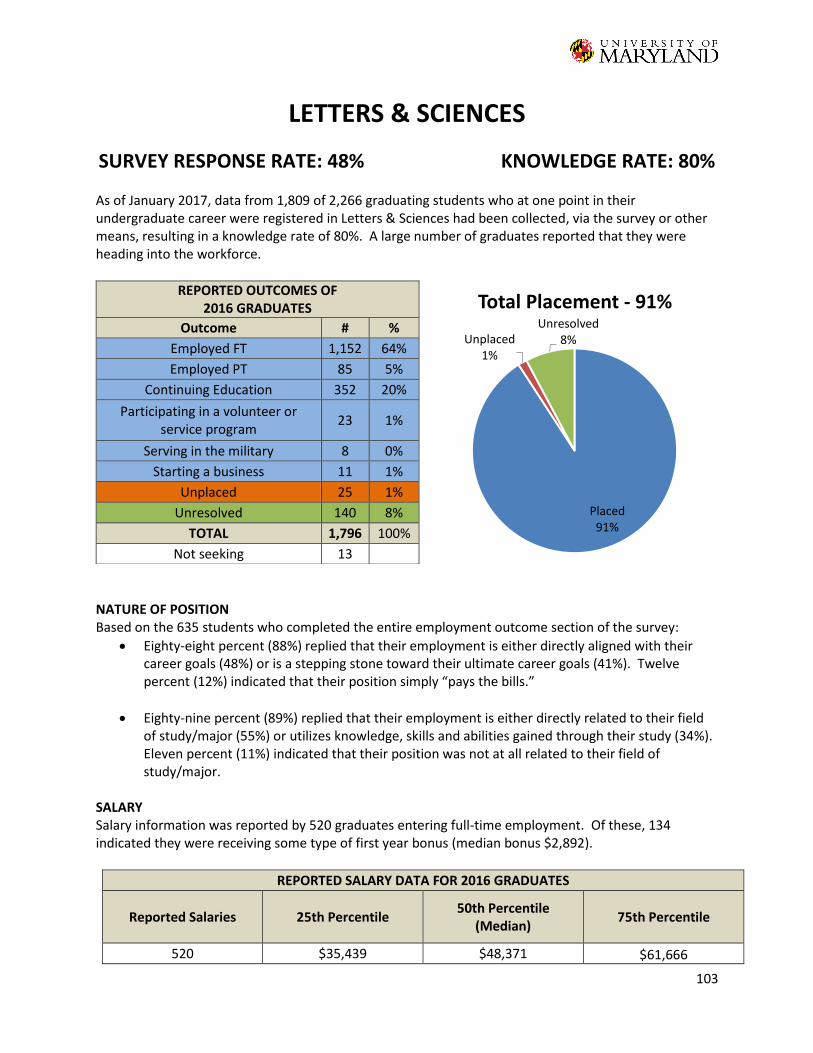
103
LETTERS & SCIENCES
SURVEY RESPONSE RATE: 48% KNOWLEDGE RATE: 80%
As of January 2017, data from 1,809 of 2,266 graduating students who at one point in their undergraduate career were registered in Letters & Sciences had been collected, via the survey or other means, resulting in a knowledge rate of 80%. A large number of graduates reported that they were heading into the workforce.
NATURE OF POSITION Based on the 635 students who completed the entire employment outcome section of the survey:
Eighty-eight percent (88%) replied that their employment is either directly aligned with their career goals (48%) or is a stepping stone toward their ultimate career goals (41%). Twelve percent (12%) indicated that their position simply “pays the bills.”
Eighty-nine percent (89%) replied that their employment is either directly related to their field of study/major (55%) or utilizes knowledge, skills and abilities gained through their study (34%). Eleven percent (11%) indicated that their position was not at all related to their field of study/major.
SALARY Salary information was reported by 520 graduates entering full-time employment. Of these, 134 indicated they were receiving some type of first year bonus (median bonus $2,892).
REPORTED SALARY DATA FOR 2016 GRADUATES
Reported Salaries 25th Percentile 50th Percentile
(Median) 75th Percentile
520 $35,439 $48,371 $61,666
REPORTED OUTCOMES OF 2016 GRADUATES
Outcome # %
Employed FT 1,152 64%
Employed PT 85 5%
Continuing Education 352 20%
Participating in a volunteer or service program
23 1%
Serving in the military 8 0%
Starting a business 11 1%
Unplaced 25 1%
Unresolved 140 8%
TOTAL 1,796 100%
Not seeking 13
Placed91%
Unplaced1%
Unresolved8%
Total Placement - 91%
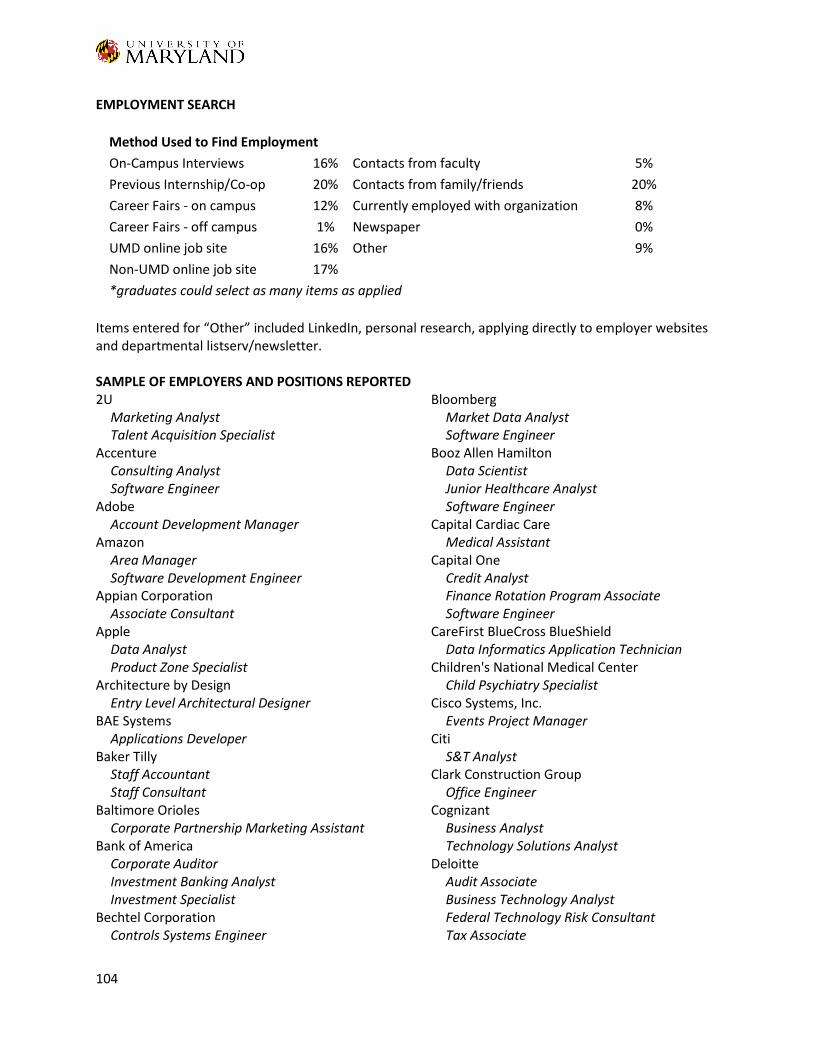
104
EMPLOYMENT SEARCH
Method Used to Find Employment
On-Campus Interviews 16% Contacts from faculty 5%
Previous Internship/Co-op 20% Contacts from family/friends 20%
Career Fairs - on campus 12% Currently employed with organization 8%
Career Fairs - off campus 1% Newspaper 0%
UMD online job site 16% Other 9%
Non-UMD online job site 17% *graduates could select as many items as applied
Items entered for “Other” included LinkedIn, personal research, applying directly to employer websites and departmental listserv/newsletter. SAMPLE OF EMPLOYERS AND POSITIONS REPORTED 2U
Marketing Analyst Talent Acquisition Specialist
Accenture Consulting Analyst Software Engineer
Adobe Account Development Manager
Amazon Area Manager Software Development Engineer
Appian Corporation Associate Consultant
Apple Data Analyst Product Zone Specialist
Architecture by Design Entry Level Architectural Designer
BAE Systems Applications Developer
Baker Tilly Staff Accountant Staff Consultant
Baltimore Orioles Corporate Partnership Marketing Assistant
Bank of America Corporate Auditor Investment Banking Analyst Investment Specialist
Bechtel Corporation Controls Systems Engineer
Bloomberg Market Data Analyst Software Engineer
Booz Allen Hamilton Data Scientist Junior Healthcare Analyst Software Engineer
Capital Cardiac Care Medical Assistant
Capital One Credit Analyst Finance Rotation Program Associate Software Engineer
CareFirst BlueCross BlueShield Data Informatics Application Technician
Children's National Medical Center Child Psychiatry Specialist
Cisco Systems, Inc. Events Project Manager
Citi S&T Analyst
Clark Construction Group Office Engineer
Cognizant Business Analyst Technology Solutions Analyst
Deloitte Audit Associate Business Technology Analyst Federal Technology Risk Consultant Tax Associate
105
Environmental Consulting, Inc. Environmental Scientist
Ernst & Young Staff Auditor Tax Staff Associate
ESPN Post Graduate Production Intern
ExxonMobil Electrical Engineering
Facebook Product Designer
Fannie Mae Financial Analyst Technical Analyst
Freddie Mac Multifamily Real Estate Analyst
General Electric Financial Management Program
Georgetown University Academic Program Coordinator Research Assistant
Goldman Sachs Analyst Securities Division Technology Analyst
Google Software Engineer
IBM Solution Sales Representative
Johns Hopkins University Project Coordinator Rehab Therapist Resident Assistant
JPMorgan Chase & Co. Chase Leadership Development Program
KPMG Associate
Leidos Software Engineer
Lockheed Martin Financial Analyst Software Engineer
Macy's Account Representative Executive Development Program
Marriott International Marketing Program Specialist
Maryland Department of the Environment Regulatory/Compliance Engineer
MedStar Health Clinical Assistant Simulation Specialist
Microsoft Corporation Program Manager Software Engineer
MicroStrategy Associate Software Engineer
Morgan Stanley Analyst
NASA Quality Assurance Engineer Systems Engineer
National Institutes of Health Post Baccalaureate IRTA
National Security Agency Budget Analyst Office Manager
Naval Air Systems Command Aerospace Engineer
Nestlé Operations Management Trainee Supply Chain Trainee
PepsiCo Supply Chain Associate Sales Management Associate
PricewaterhouseCoopers Associate
Siemens Engineer
Stanley Black & Decker Electro Mechanical Engineer Financial Analyst Reliability Engineer
T. Rowe Price Associate
The Boeing Company Software Engineer
The New York Times Copy Editor
The Walt Disney Company Merchandising
The White House Advance Associate
The Whiting-Turner Contracting Company Project Engineer
Thermo Fisher Scientific Protein Expression Scientist
106
Uber Account Manager Marketing and Sales Representative
Under Armour Brand Coordinator Supply Planner
Unilever Supply Chain Analyst Unilever Future Leaders Program
University of Maryland, College Park Faculty Research Assistant IT Systems Programmer Laboratory Technician
U.S. Army ORISE Research Participant
U.S. Census Bureau GIS Technician Statistician
U.S. Department of Agriculture Biological Science Technician IT Specialist
U.S. Department of Justice Case Operator Intern Legal Assistant
U.S. Department of the Interior Physical Scientist Contractor
U.S. Environmental Protection Agency Program Analyst
U.S. Food and Drug Administration ORISE Fellow
U.S. House of Representatives Constituent Liaison
Wayfair Software Engineer
Wells Fargo Financial Advisor Investment Banking Analyst
Yelp Account Executive
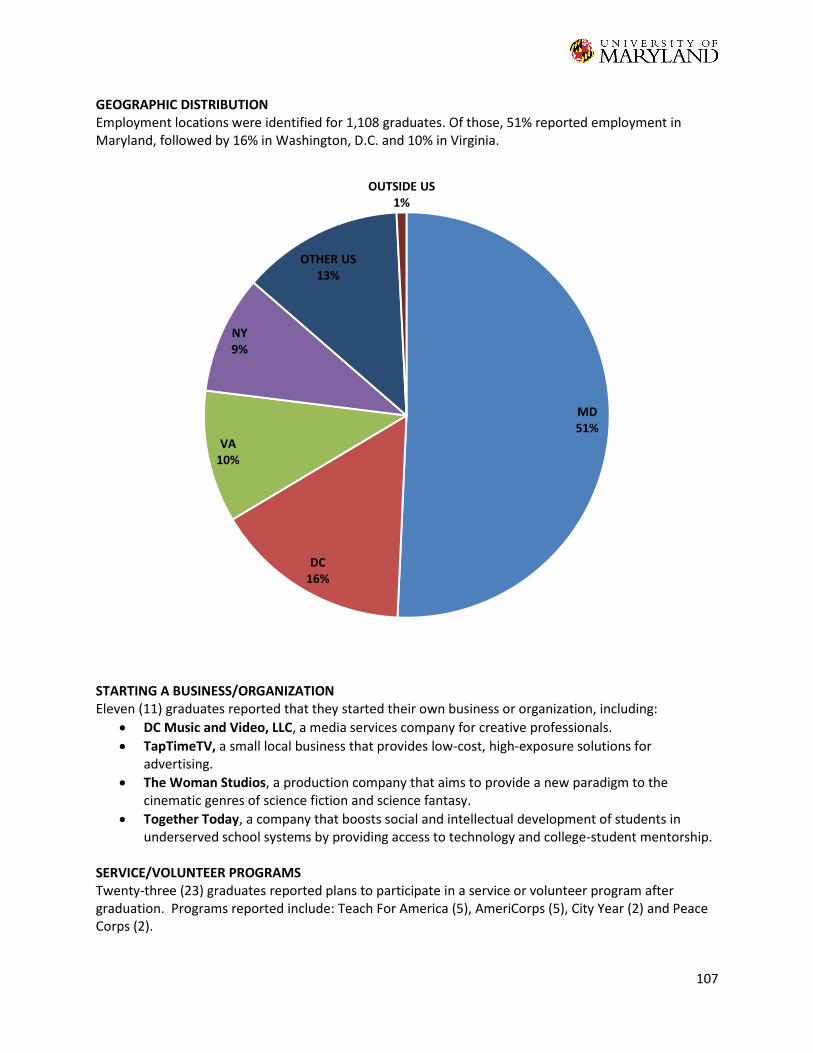
107
GEOGRAPHIC DISTRIBUTION Employment locations were identified for 1,108 graduates. Of those, 51% reported employment in Maryland, followed by 16% in Washington, D.C. and 10% in Virginia.
STARTING A BUSINESS/ORGANIZATION Eleven (11) graduates reported that they started their own business or organization, including:
DC Music and Video, LLC, a media services company for creative professionals.
TapTimeTV, a small local business that provides low-cost, high-exposure solutions for advertising.
The Woman Studios, a production company that aims to provide a new paradigm to the cinematic genres of science fiction and science fantasy.
Together Today, a company that boosts social and intellectual development of students in underserved school systems by providing access to technology and college-student mentorship.
SERVICE/VOLUNTEER PROGRAMS Twenty-three (23) graduates reported plans to participate in a service or volunteer program after graduation. Programs reported include: Teach For America (5), AmeriCorps (5), City Year (2) and Peace Corps (2).
MD51%
DC16%
VA10%
NY9%
OTHER US13%
OUTSIDE US1%
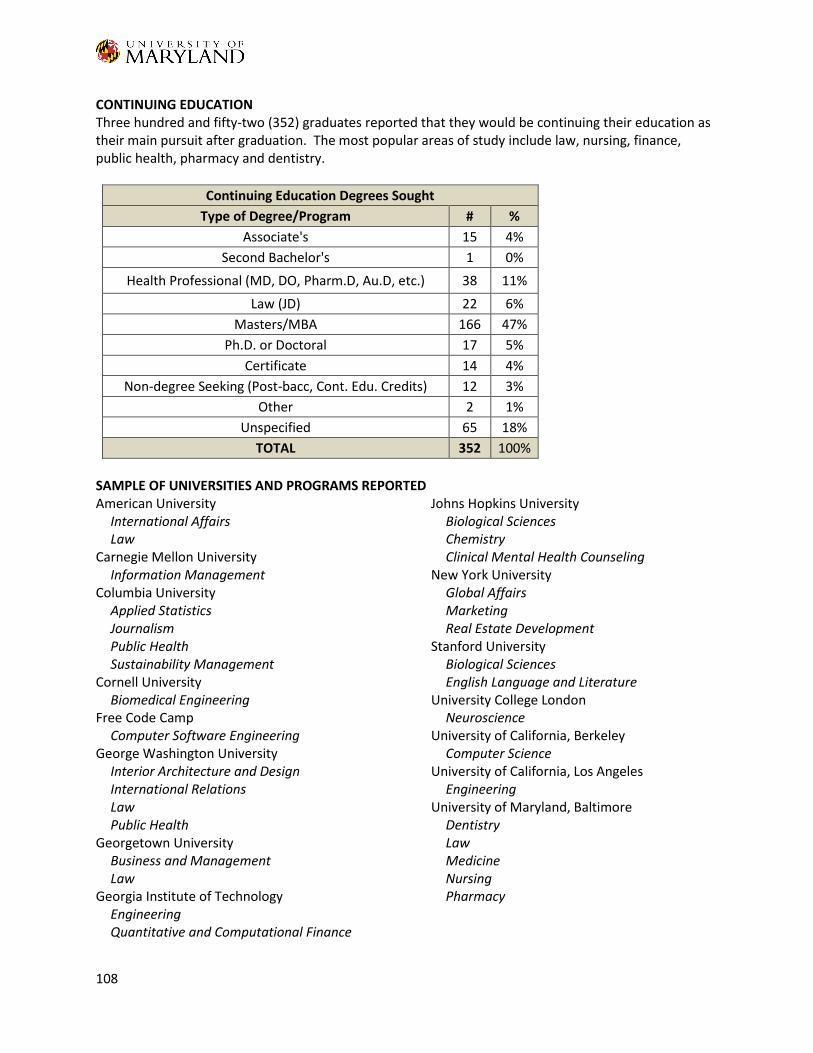
108
CONTINUING EDUCATION Three hundred and fifty-two (352) graduates reported that they would be continuing their education as their main pursuit after graduation. The most popular areas of study include law, nursing, finance, public health, pharmacy and dentistry.
Continuing Education Degrees Sought
Type of Degree/Program # %
Associate's 15 4%
Second Bachelor's 1 0%
Health Professional (MD, DO, Pharm.D, Au.D, etc.) 38 11%
Law (JD) 22 6%
Masters/MBA 166 47%
Ph.D. or Doctoral 17 5%
Certificate 14 4%
Non-degree Seeking (Post-bacc, Cont. Edu. Credits) 12 3%
Other 2 1%
Unspecified 65 18%
TOTAL 352 100%
SAMPLE OF UNIVERSITIES AND PROGRAMS REPORTEDAmerican University
International Affairs Law
Carnegie Mellon University Information Management
Columbia University Applied Statistics Journalism Public Health Sustainability Management
Cornell University Biomedical Engineering
Free Code Camp Computer Software Engineering
George Washington University Interior Architecture and Design International Relations Law Public Health
Georgetown University Business and Management Law
Georgia Institute of Technology Engineering Quantitative and Computational Finance
Johns Hopkins University Biological Sciences Chemistry Clinical Mental Health Counseling
New York University Global Affairs Marketing Real Estate Development
Stanford University Biological Sciences English Language and Literature
University College London Neuroscience
University of California, Berkeley Computer Science
University of California, Los Angeles Engineering
University of Maryland, Baltimore Dentistry Law Medicine Nursing Pharmacy
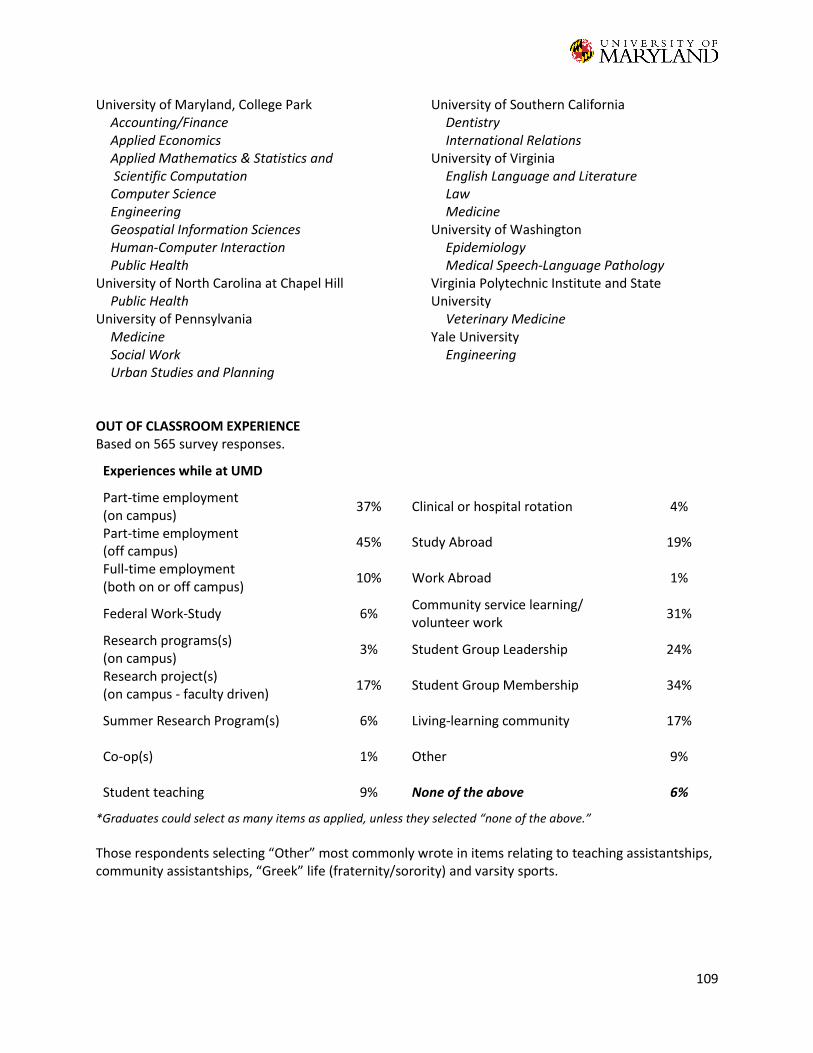
109
University of Maryland, College Park Accounting/Finance Applied Economics Applied Mathematics & Statistics and Scientific Computation Computer Science Engineering Geospatial Information Sciences Human-Computer Interaction Public Health
University of North Carolina at Chapel Hill Public Health
University of Pennsylvania Medicine Social Work Urban Studies and Planning
University of Southern California Dentistry International Relations
University of Virginia English Language and Literature Law Medicine
University of Washington Epidemiology Medical Speech-Language Pathology
Virginia Polytechnic Institute and State University
Veterinary Medicine Yale University
Engineering
OUT OF CLASSROOM EXPERIENCE Based on 565 survey responses.
Experiences while at UMD
Part-time employment (on campus) 37% Clinical or hospital rotation 4%
Part-time employment (off campus)
45% Study Abroad 19%
Full-time employment (both on or off campus)
10% Work Abroad 1%
Federal Work-Study 6% Community service learning/ volunteer work
31%
Research programs(s) (on campus)
3% Student Group Leadership 24%
Research project(s) (on campus - faculty driven)
17% Student Group Membership 34%
Summer Research Program(s) 6% Living-learning community 17%
Co-op(s) 1% Other 9%
Student teaching 9% None of the above 6%
*Graduates could select as many items as applied, unless they selected “none of the above.”
Those respondents selecting “Other” most commonly wrote in items relating to teaching assistantships, community assistantships, “Greek” life (fraternity/sorority) and varsity sports.
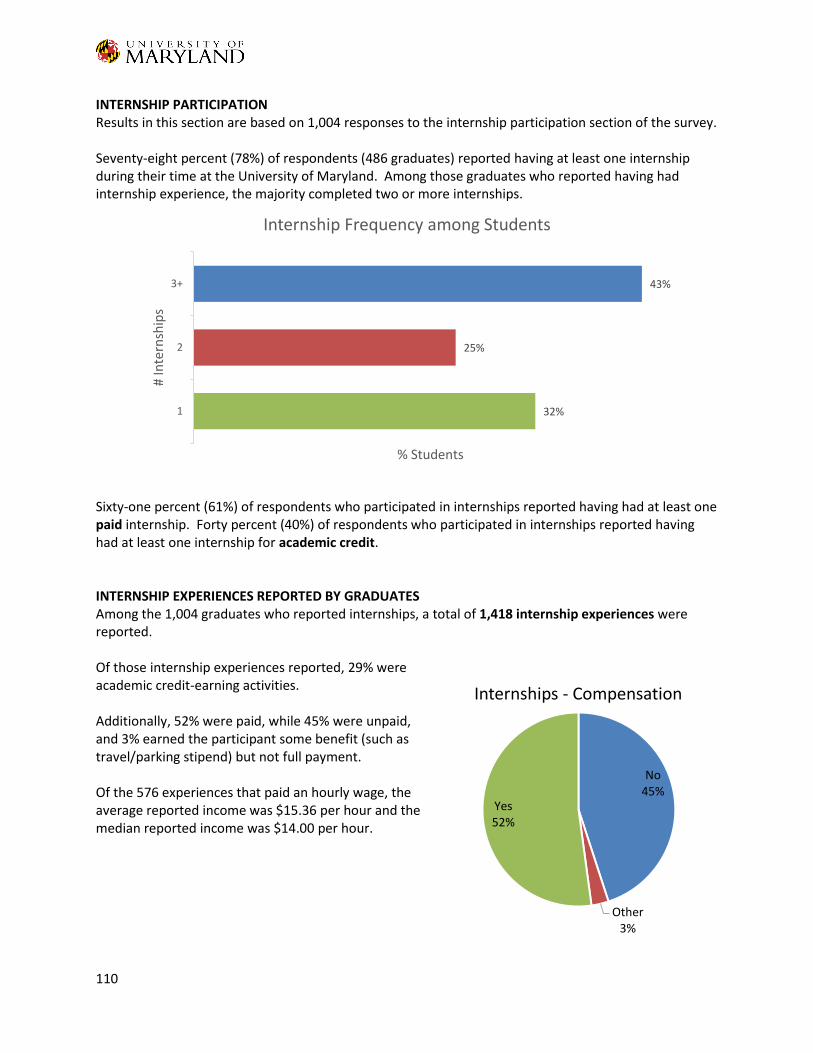
110
INTERNSHIP PARTICIPATION Results in this section are based on 1,004 responses to the internship participation section of the survey. Seventy-eight percent (78%) of respondents (486 graduates) reported having at least one internship during their time at the University of Maryland. Among those graduates who reported having had internship experience, the majority completed two or more internships.
Sixty-one percent (61%) of respondents who participated in internships reported having had at least one paid internship. Forty percent (40%) of respondents who participated in internships reported having had at least one internship for academic credit. INTERNSHIP EXPERIENCES REPORTED BY GRADUATES Among the 1,004 graduates who reported internships, a total of 1,418 internship experiences were reported. Of those internship experiences reported, 29% were academic credit-earning activities. Additionally, 52% were paid, while 45% were unpaid, and 3% earned the participant some benefit (such as travel/parking stipend) but not full payment. Of the 576 experiences that paid an hourly wage, the average reported income was $15.36 per hour and the median reported income was $14.00 per hour.
32%
25%
43%
1
2
3+
% Students
# In
tern
ship
s
Internship Frequency among Students
No45%
Other3%
Yes52%
Internships - Compensation
APPENDIX
GRADUATION SURVEY QUESTIONNAIRE
2015-2016 VERSION

113
Graduation Survey 2015-2016 Questionnaire
The University Career Center & The President’s Promise will use Qualtrics and load information about graduating students as a panel for the survey. University identification numbers will link responses to records.
Post-Graduation Information: 1. Which of the following best describes your status AFTER graduation?
(Choose the one option that BEST describes your status) a) Employed full time (on average 30 hours or more per week) (GO TO EMPLOYMENT)
b) Employed part time (on average less than 30 hours per week) (GO TO EMPLOYMENT)
c) Starting my own business/organization (GO TO ENTREPRENEUR)
d) Participating in a volunteer or service program (e.g., Peace Corps) (GO TO VOLUNTEER)
e) Serving in the U.S. Armed Forces (any branch) (GO TO MILITARY)
f) Accepted into a program of continuing education (e.g., Graduate School) (GO TO STUDY)
g) Actively seeking employment or starting job search (GO TO EXPERIENCES)
h) Applied to graduate school/continuing education but not yet accepted (GO TO EXPERIENCES)
i) Not seeking employment or continuing education at this time (GO TO NOT SEEKING)
IF PLACED (a, b, c, d, e or f from above): When did you accept/confirm your post-graduation plans?
a) Before graduation b) Within one month after graduation c) Within three months after graduation d) Later than three months after graduation
2. What is your post-graduation email address? <<EMAIL INPUT>>
Employment After Graduation: (EMPLOYMENT) 3. Which of the following categories BEST describes your employment:
a) Employed on a Full time or Part time basis as an employee of a company/organization
b) Employed in a temporary work assignment
c) Employed on a freelance basis
d) Employed in a postgraduate internship or fellowship
4. Which of the following BEST describes the nature of your employment:
a) Employed in a position that is directly aligned with my career goals
b) Employed in a position that is a stepping stone toward my ultimate career goals
c) Employed in a position that just “pays the bills”
114
5. How is your employment related to your field of study/major?
a) Directly related to my field of study/major
b) Utilizes knowledge, skills and abilities gained through my study at UMD, but not directly related
c) Not at all related
6. Name of Employing Organization
<< PICKLIST – EMPLOYING ORGANIZATION>> OR: other: <<TEXT BOX>> 7. Position Title: <<TEXT BOX>> 8. Position Location – city, state, and country <<PICKLIST - LOCATIONS>> 9. Annual Base Salary amount in U.S. Dollars - not including bonuses, commission, or overtime: <<PICKLIST – SALARY RANGES>> 10. Guaranteed first-year bonus amount in U.S. Dollars, if you are receiving one (e.g., sign-on and/or
year end): <<PICKLIST – RANGE OF AMOUNT>> 11. How did you obtain your post-graduate employment? (Select ALL that apply)
a) On-Campus Interviews
b) Previous Internship/Co-op
c) Career Fairs – on campus
d) Career Fairs – off campus
e) UMD online job site (e.g. Careers4Terps, HireSmith)
f) Non-UMD online job site
g) Contacts from faculty member
h) Contacts from family/friends
i) Currently employed with organization
j) Newspaper
k) Other: <<WRITE IN>>
12. How many job offers did you receive? <<NUMERICAL INPUT>> END OF SECTION – GO TO EXPERIENCES
115
Starting Own Business/Organization: (ENTREPRENEUR) 13. Name of your business/organization: <<TEXT BOX>> 14. Which industry is your business/organization in? <<PICKLIST - INDUSTRY>> 15. Location of your business/organization: <<PICKLIST - LOCATIONS>> 16. Describe the purpose/goals of your business/organization: <<TEXT AREA – 140 CHARACTERS>> 17. Did you participate in or utilize any of the following entrepreneurship-related academic programs, events, or university resources while at UMD? (Select all that apply)
a) ACC Clean Energy Challenge
b) Be the Solution Business Plan
Competition
c) Bitcamp
d) China Business Plan Competition
e) Cupid’s Cup
f) Dingman Center for Entrepreneurship
g) Dingman Jumpstart
h) Do Good Challenge
i) EnTERPreneurship Academy
j) HCiL Mobility Contest
k) Heal the Turtle
l) Hillman Entrepreneurs
m) Hinman CEOs
n) Honors: Entrepreneurship and
Innovation (EIP) Program
o) Innovate 4 Healthcare
p) Innovation Office Hours
q) Maryland Intellectual Property Legal
Resource Center
r) Minor in Technology Entrepreneurship
through Mtech
s) Mtech TERP Startup Lab
t) Mtech Venture Accelerator
u) No Limits Social Impact Pitch
Competition
v) Office of Technology Commercialization
w) Pitch Dingman
x) Smith Entrepreneurship Fellows
Program
y) Social Enterprise Symposium
z) Social Innovation Fellows Program
aa) Technology Advancement Program
bb) Terp Marketplace
cc) UM Ventures
dd) UMD Startup Boot Camp
ee) University of Maryland Business Model
Challenge
18. Can we contact you in the future for more information about your business/organization?
<<YES/NO>> If yes -> Please provide the following contact information: Name: Title: Email Address: Phone Number: END OF SECTION – GO TO EXPERIENCES
116
Volunteer/Service Programs: (VOLUNTEER) 19. Name of Organization
a) AmeriCorps
b) Boys Hope Girls Hope
c) Christian Appalachian Project
d) CitizenCorps
e) City Year
f) Coro Foundation
g) EarthCorps
h) EarthWatch Institute
i) Global Citizens Network
j) Green Corps
k) Habitat for Humanity
l) Jesuit Volunteer Corps
m) Jewish Service Corps
n) MatchCorps
o) Mercy Volunteer Corps
p) Peace Corps
q) Service Civil International
r) Service for Peace
s) Teach For America
t) Teacher Fellows Programs
u) The Catholic Volunteer Network
v) The Student Conservation Association
w) United Planet
x) Volunteers for Peace
y) World Teach
z) YouthBuild U.S.A.
aa) other: <<WRITE IN>>
20. Assignment Location – city, state, and country <<PICKLIST - LOCATIONS>> 21. Role or Title: <<TEXT BOX>> 22. How did you obtain this opportunity? (Select ONE option that BEST fits)
a) On-Campus Interviews
b) Previous Internship/Co-op
c) UMD Career Fairs
d) Non-UMD Career Fairs
e) UMD online job site (e.g. Careers4Terps, HireSmith)
f) Non-UMD online job site
g) Contacts from faculty member
h) Contacts from family/friends
i) Currently employed with organization
j) Newspaper
k) Other: <<WRITE IN>>
23. What pay, stipend, and/or benefits are you receiving for participation in this volunteer/service
program? <<TEXT AREA>> END OF SECTION – GO TO EXPERIENCES
117
U.S. Military Service (MILITARY) 24. Service Branch
a) Army
b) Marine Corps
c) Navy
d) Air Force
e) Coast Guard
25. Rank <<PICKLIST – MILITARY RANKS>> END OF SECTION – GO TO EXPERIENCES
Continuing Education (STUDY) 26. Name of institution:
<<PICKLIST - INSTITUTIONS>> OR: other: <<WRITE IN>> 27. Are you participating in an online or distance education program? <<YES/NO>>
If no -> 27b. Location of Institution: <<PICKLIST - LOCATIONS>> 28. Program of study:
<<PICKLIST - PROGRAM OF STUDY>> OR: other: <<WRITE IN>> 29. Type of degree you are pursuing:
a) Certificate/Certification
b) Associate’s Degree
c) Second Bachelor’s Degree
d) Master’s Degree
i. Master of Arts (M.A.)
ii. Master of Science (M.S.)
iii. Master of Business Administration (M.B.A.)
iv. Master of Education (M.Ed.)
v. Master of Fine Arts (M.F.A.)
vi. Master of Information Management (M.I.M.)
vii. Master of Library Science (M.L.S.)
viii. Master of Public Administration (M.P.A.)
ix. Master of Public Health (M.P.H.)
x. Master of Social Work (M.S.W.)
xi. Other Master’s Degree: <<WRITE IN>>
118
e) Doctoral Degree
i. Doctor of Philosophy (Ph.D.)
ii. Doctor of Education (Ed.D.)
iii. Doctor of Business Management (D.B.A.)
iv. Doctor of Public Administration (D.P.A.)
v. Doctor of Computer Science (D.Comp.Sci)
vi. Doctor of Theology (D.Th.)
vii. Other Doctoral Degree: <<WRITE IN>>
f) Juris Doctorate (J.D.)
g) Nursing Degree
i. Associate’s Degree
ii. Bachelor of Science in Nursing (BSN)
iii. Master of Science in Nursing (MSN)
iv. Doctor of Nursing Practice (DNP)
h) Medical Degree
i. Doctor of Medicine (M.D.)
ii. Doctor of Osteopathic Medicine (D.O.)
iii. Doctor of Dental Surgery (D.D.S.)
iv. Doctor of Dental Medicine (D.M.D.)
v. Doctor of Veterinary Medicine (D.V.M.)
vi. Doctor of Audiology (Au.D.)
vii. Other Medical Degree: <<WRITE IN>>
i) Other: <<WRITE IN>>
END OF SECTION – GO TO EXPERIENCES
Not Seeking Employment or Continuing Education at this time
(NOT SEEKING) 30. If you will not be working, seeking employment, or pursuing further education, why?
a) Caring for children/family members
b) Taking time for my own health
c) Working on a personal project (e.g. book, artistic endeavor)
d) Engaging in service or unpaid work
e) Traveling or taking time off
f) Other: <<WRITE IN>>
END OF SECTION – GO TO EXPERIENCES
119
Experiences while at UMD (EXPERIENCES) 31. How many internships did you have while at UMD? <<NUMERICAL INPUT>> 32. Which of the following experiences did you participate in while enrolled at UMD?
(Mark ALL that apply) a) Part-time employment – on campus
b) Part-time employment – off campus
c) Full-time employment – both on or off
campus
d) Federal work-study
e) Research program(s) – on campus (e.g.,
GEMSTONE, FIRE)
f) Research project(s) – on campus
(faculty driven)
g) Summer research program(s)
h) Co-op(s)
i) Student teaching
j) Clinical or hospital rotation
k) Study abroad
l) Work abroad
m) Community service learning/volunteer
work
n) Student group leadership
o) Student group membership
p) Living-learning community (e.g. Honors,
Scholars, Beyond the Classroom,
Language House)
q) Terrapin Teachers
r) Other: <<WRITE IN>>
s) None of the above
If respondent selects options (a), (b), (c), or (d) in question 31, display question 33: 33. How many hours, on average, did you work per week? <<PICKLIST – HOUR RANGES>>
If respondent selects option (p) “None of the above” in question 32, display question 34: 34. What prevented you from participating in any of those experiences while enrolled at UMD?
(Choose all that apply) a) Was not interested
b) Academic workload
c) Financial constraints
d) Not sure how/where to find information
e) Did not have reliable transportation
f) Commuter/distance to campus
g) Family responsibilities
h) Other: <<WRITE IN>>
120
Internships while at UMD (INTERNSHIPS) This section is displayed if the respondent indicates a number of internships in Question 31 that is greater than zero. The section (questions 35 through 41) is repeated for each internship up to a total of 10.
You indicated that you participated in [fill # internships] internship(s) while at UMD.
We will ask questions about each internship in turn.
Please answer the questions on this page about your [fill ordinal number] internship. 35. For your [fill ordinal number] internship, what was the name of the business or organization you worked for? <<TEXT BOX>> 36. What was your title or job function? <<TEXT BOX>> 37. Was your [fill ordinal number] internship paid?
NOTE: Other refers to internships that did not provide a salary, hourly wage, or monetary stipend, but did provide benefits such as housing, travel, etc.
a) yes
b) no
c) other
If respondent selects “yes” in question 37, display question 38: 38. How much were you paid for this internship? (please indicate hourly wage, salary, or stipend amount) <<TEXT BOX>> 39. Did you receive academic credit for this internship? <<YES/NO>> 40. In what semester did you participate in this internship? <<PICKLIST – SEMESTER AND YEAR>> (if the internship continued throughout more than one semester, list the last semester you participated in this internship)
41. As a result of THIS internship:
a) I accepted full-time employment with this organization.
b) I received an offer for full-time employement with this organization but did not accept it.
c) I applied for full-time employment with this organization but did not receive an offer.
d) I did not apply for full-time employment with this organization.
END OF SURVEY