2016 full year results - bodycote full year results 28 february 2017 . stephen harris ... *like -for...
TRANSCRIPT

2016 Full Year Results
28 February 2017

Stephen Harris
Group Chief Executive
Introduction
2

Agenda
3
Overview
Financial review
Business review
Summary & Outlook
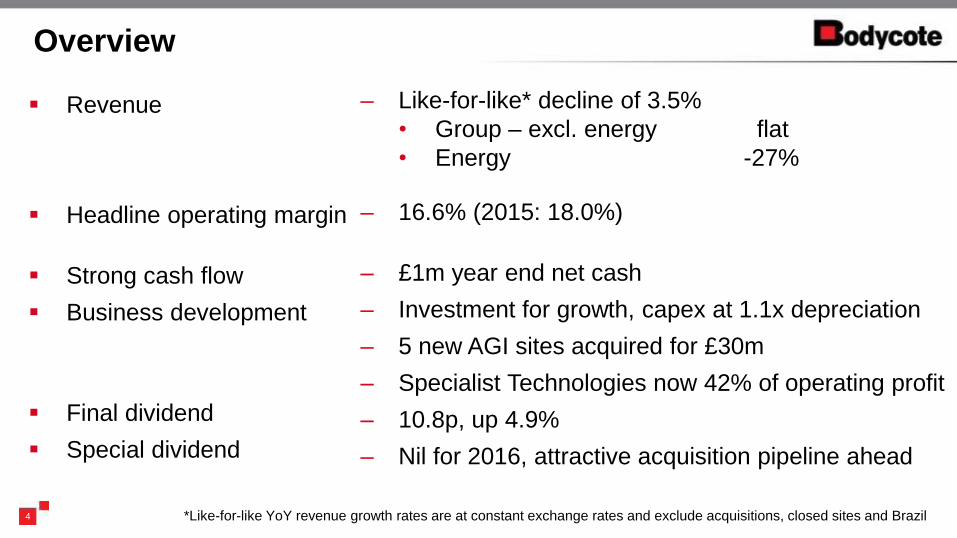
– Like-for-like* decline of 3.5%
• Group – excl. energy flat
• Energy -27%
– 16.6% (2015: 18.0%)
– £1m year end net cash
– Investment for growth, capex at 1.1x depreciation
– 5 new AGI sites acquired for £30m
– Specialist Technologies now 42% of operating profit
– 10.8p, up 4.9%
– Nil for 2016, attractive acquisition pipeline ahead
4
Overview
Revenue
Headline operating margin
Strong cash flow
Business development
Final dividend
Special dividend
*Like-for-like YoY revenue growth rates are at constant exchange rates and exclude acquisitions, closed sites and Brazil

Financial review
5
Dominique Yates
Chief Financial Officer

6
2016 Results summary
*
*Like-for-like YoY revenue excluding acquisitions, closed sites and Brazil decreased 3.5%
2016 2015 Currency
Revenue 600.6 567.2 (26.7) -5% 60.1 33.4 6%
Headline: Operating profit 99.6 102.1 (13.7) -13% 11.2 (2.5) -2%
Margin 16.6% 18.0%
Profit before tax 97.0 99.2 (13.4) -14% 11.2 (2.2) -2%
Restructuring charge - (20.0)
Headline tax rate 27.5% 24.4%
Net cash 1.1 12.3
Headline EPS 37.0p 39.5p -6%
Return on Capital Employed 17.1% 19.0%
Dividend
Ordinary 15.8p 15.1p 5%
Special - 10.0p
£mConstant
exchange ratesTotal change
*

7
Divisional summary ADE
Constant currency revenue decline entirely due to >40% oil & gas decline
Cost discipline mitigated margin reduction
Headline operating margins reduced to 22%
£m 2016 2015 Currency
Revenue 250.9 243.5 (16.4) -7% 23.8 7.4 3%
Headline operating profit 55.6 59.2 (9.0) -15% 5.4 (3.6) -6%
Margin 22.2% 24.3%
Constant
exchange ratesTotal change

8
Divisional summary AGI
Business mix continues to improve; tight cost control
Headline margin up 20bps to 16.7%
Like-for-like* revenues declined only 1.8%
£m 2016 2015 Currency
Revenue 349.7 323.7 (10.3) -3% 36.3 26.0 8%
Headline operating profit 58.5 53.4 (1.2) -2% 6.3 5.1 10%
Margin 16.7% 16.5%
Constant
exchange ratesTotal change
*Like-for-like YoY revenue growth rates are at constant exchange rates and exclude acquisitions, closed sites and Brazil

Headline operating profit bridge
9
88.4
99.6 102.1 1.6 -12.0
-1.5 -1.3 -1.4
11.2
2015 Price minuscost
increases
Sales volumeand mix
Acquisitions Start-ups Share-basedpayments
Centralcosts
2016Constantcurrency
Foreignexchangetranslation
2016
0.9
£m

Headline Operating
Profit
Capex
0
20
40
60
80
100
120
140
160
Sources of cash Uses of cash
Restructuring
Tax, Interest & Other
10
Cash flow
Headline Operating
Profit
Capex
Sources of cash Uses of cash
2016
2015
£47m
free
cash
£61m
free
cash
Depreciation Depreciation
Working Capital
Tax, Interest
& Other
Restructuring
See slide 31 for detailed cash flow disclosure
Working Capital

11
2016 Sales and operating profit
by currency
Every US dollar cent worth c.£0.3m
Every Euro cent worth c.£0.4m
2016 operating profit benefited by
£11.2m translation gain, mainly part
year effect of post-referendum sterling
depreciation
Translating the 2016 results at year
end rates would have added a
further £6m and enhanced margin
by 0.1%
Revenue Headline operating profit
USD 39%
EUR 49%
Other 13%
GBP -1%
*
USD 36%
EUR 38%
Other 18%
GBP 8%
-20%
0%
20%
40%
60%
80%
100%
120%
*GBP profits negative due to central costs

12
A newcomer’s perspective
5 key attractions:
Returns
Cash flow
Uniqueness
Technology
The cycle
‒ The Group’s strong margins support compelling returns on capital
‒ Intrinsic high cash generation
‒ The only big player in an enduring industry where scale has clear
benefits
‒ “Specialist Technologies” – clever stuff that requires significant
expertise, with clear benefits for customers, and great margins
‒ Resilient in the downturn, positive prospects in the upturn

Business review
13
Stephen Harris
Group Chief Executive

14
Aerospace & defence
Revenue: £151m Like-for-like* growth: 1.0%
Revenue, £m At actual rates
Strong growth in UK aerospace, particularly in H2
Continued robust growth in France
North America mixed
Like-for-like* growth: 1.6%
0
10
20
30
40
50
60
70
80
H1 2015 H2 2015 H1 2016 H2 2016
Revenue, £m At constant rates
0
10
20
30
40
50
60
70
80
H1 2015 H2 2015 H1 2016 H2 2016
*Like-for-like YoY revenue growth rates are at constant exchange rates and exclude acquisitions, closed sites and Brazil

15
Energy
Revenue: £52m Like-for-like* decline: -26.8%
Oil & gas decline stabilising
Other energy sectors flat
Energy business still achieving single-digit margins
Revenue, £m At actual rates
0
10
20
30
40
50
60
H12014
H22014
H12015
H22015
H12016
H22016
Other Energy
Oil & gas
Revenue, £m At constant rates
0
10
20
30
40
50
60
H12014
H22014
H12015
H22015
H12016
H22016
Other Energy
Oil & gas
*Like-for-like YoY revenue growth rates are at constant exchange rates and exclude acquisitions, closed sites and Brazil

16
Automotive
Revenue: £172m Like-for-like* growth: 1.6%
Drive for fuel efficiency continues to grow revenues above background production rates
Car and light truck H1 growth* of 3% accelerated to 6% in H2
Specialist Technologies contributing to revenue growth
Reduced activity in heavy trucks
*Like-for-like YoY revenue growth rates are at constant exchange rates and exclude acquisitions, closed sites and Brazil
Revenue, £m At actual rates
0
10
20
30
40
50
60
70
80
90
H1 2015 H2 2015 H1 2016 H2 2016
Revenue, £m At constant rates
0
10
20
30
40
50
60
70
80
90
H1 2015 H2 2015 H1 2016 H2 2016

17
General industrial
Revenue: £226m Like-for-like* decline: -3.3%
*Like-for-like YoY revenue growth rates are at constant exchange rates and exclude acquisitions, closed sites and Brazil
Cyclical decline in general industrial abating
Less downward pressure from feed-through effect of oil & gas and other resource sectors
-5% in H1 revenue moderated to -1% in H2
Revenue, £m At actual rates
0
20
40
60
80
100
120
H1 2015 H2 2015 H1 2016 H2 2016
Revenue, £m At constant rates
0
20
40
60
80
100
120
H1 2015 H2 2015 H1 2016 H2 2016

2016 Revenue & headline operating profit
18
Classical Heat
Treatment
58% (2015: 61%)
Specialist
Technologies
42% (2015: 39%)
Specialist Technologies headline operating profit now 42% of Group
Excluding oil & gas, Specialist Technologies constant currency revenues grew 8%
Classical Heat
Treatment
76% (2015: 75%)
Specialist
Technologies
24% (2015: 25%)
Headline operating profit Revenue

19
Improving revenue trend through 2016
YoY like-for-like* revenue growth
-8%
-7%
-6%
-5%
-4%
-3%
-2%
-1%
0%
1%
2%
3%
Like-for-like excluding Energy
Total like-for-like
Q1 Q2 Q3 Q4
___
___
*Like-for-like YoY revenue growth rates are at constant exchange rates and exclude acquisitions, closed sites and Brazil
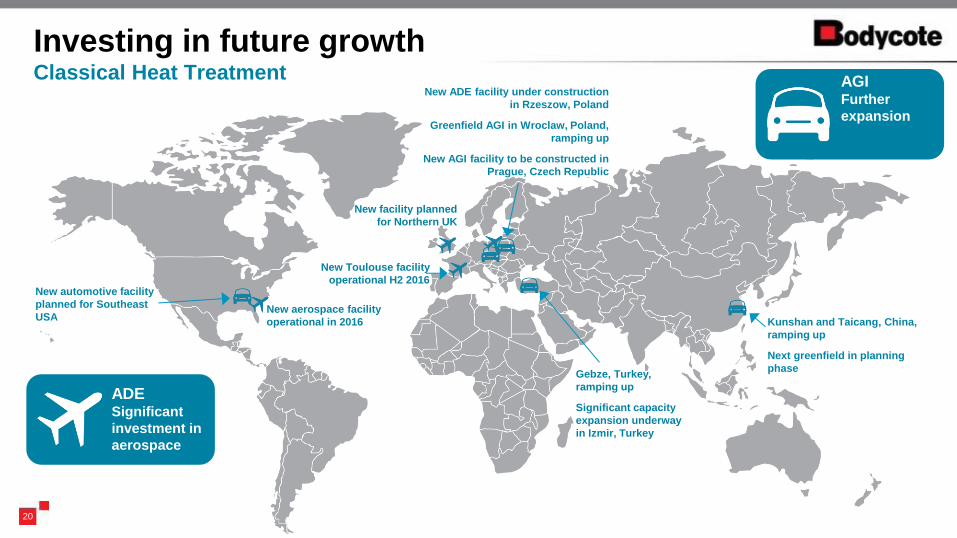
20
Investing in future growth Classical Heat Treatment
New aerospace facility
operational in 2016
New facility planned
for Northern UK
New Toulouse facility
operational H2 2016
New ADE facility under construction
in Rzeszow, Poland
Greenfield AGI in Wroclaw, Poland,
ramping up
New AGI facility to be constructed in
Prague, Czech Republic
Kunshan and Taicang, China,
ramping up
Next greenfield in planning
phase Gebze, Turkey,
ramping up
Significant capacity
expansion underway
in Izmir, Turkey
ADE Significant
investment in
aerospace
AGI Further
expansion
New automotive facility
planned for Southeast
USA

21
Investing in future growth Specialist Technologies
HIP PF: New facility
to be constructed
HIP: New high pressure
capacity operational
S3P: New facility under
construction in North Carolina
S3P: New facility
operational in France
S3P: New facility
in Germany
operational H2
2016
LPC: New facility in
Mexico ramping up
LPC: Capacity expanded
in Poland and the
Netherlands
New facility
planned / under
construction
New facility now
operational
Investment in
expansion /
additional capacity
LPC: Capacity
expansion in France
CiD: New facility
planned for Czech
Republic
HIP: New aerospace
capacity on line
S3P: New capacity
added in Ohio
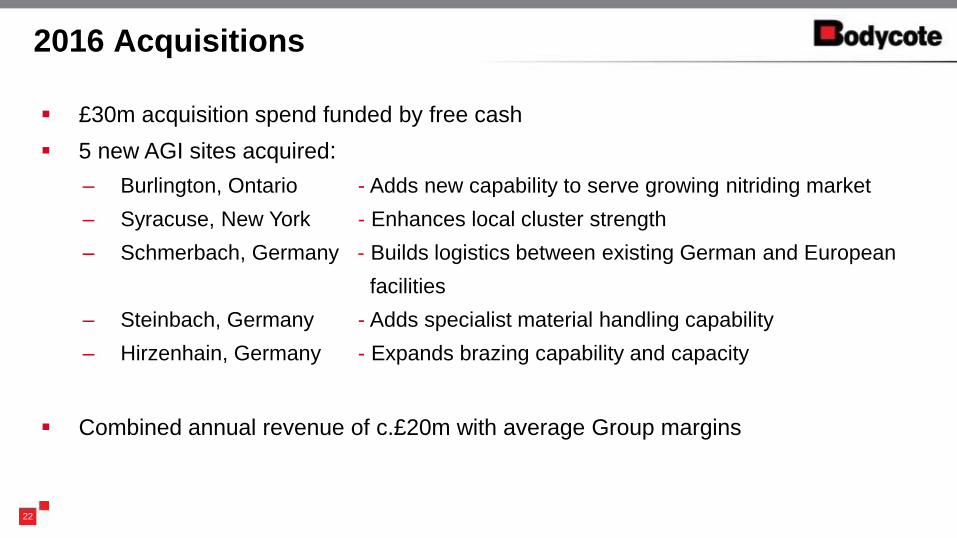
£30m acquisition spend funded by free cash
5 new AGI sites acquired:
– Burlington, Ontario - Adds new capability to serve growing nitriding market
– Syracuse, New York - Enhances local cluster strength
– Schmerbach, Germany - Builds logistics between existing German and European
facilities
– Steinbach, Germany - Adds specialist material handling capability
– Hirzenhain, Germany - Expands brazing capability and capacity
Combined annual revenue of c.£20m with average Group margins
22
2016 Acquisitions

23
Managing through the cycle
Margins have been resilient during the current cyclical downturn
Managing headcount; labour force flexibility is key
10.4
15.0 16.6 17.3
18.2 18.0 16.6
2010 2011 2012 2013 2014 2015 2016
Headline margin, % (at reported rates)
5,603 5,533
5,735 5,808 5,836
5,669
5,367
2010 2011 2012 2013 2014 2015 2016
Average headcount
498 569
613 634 657 630 601
2010 2011 2012 2013 2014 2015 2016
Sales, £m (at 2016 rates)
55
89
108 113
123 115
100
2010 2011 2012 2013 2014 2015 2016
Headline operating profit, £m (at 2016 rates)

24
2016 Cash flow and capital allocation
No 2016 special dividend – encouraging acquisition pipeline
Opening
cash
£124m
Free
cash flow
before
capex
£12m
Dividend
Maintenance
capex
Expansion
capex
M&A
2015 Special
dividend
Closing
cash
£1m
24

25
Summary
Growth - Momentum built as the year progressed
- Oil & gas headwind now abating
- Part year sterling depreciation gain in 2016
- Translating 2016 result at closing rates* would have added £6m to
headline profit
Development - Investment in expansion capital continues
- Specialist Technologies now 42% of Group operating profit
Acquisitions - 5 new AGI sites acquired for £30m
- Combined annual revenue c.£20m with average Group margins
Cash flow - Strong £61m free cash generation
*See slide 35

Outlook
The Group delivered a robust performance in 2016 despite significant headwinds in some key
business sectors. The speed and effectiveness of management’s actions, in addition to the
continued focus on improved mix, resulted in resilient margins.
While our business, by its nature, has limited forward visibility, we continue to demonstrate
that we are capable of adapting with great agility to changes in market conditions. Our outlook
is positive and we remain optimistic that we are well placed to take advantage of an upturn in
our markets.
The Board is confident that management’s continued focus on business improvements and
execution of the Group strategy will generate good returns through the cycle.
26


Definitions
28
Term Definition
Headline Operating Profit Operating profit before exceptional costs and amortisation of acquired intangibles
Headline Profit Before Tax Profit before tax, exceptional costs and amortisation of acquired intangibles
Headline Operating Cash Flow Cash generated by operations, less net capital expenditure and before cash flow relating to
exceptional items
Headline EBITDA Earnings before interest, tax, depreciation, amortisation, impairment of fixed assets, profit or
loss on disposal of property, plant and equipment, cash flow relating to restructuring,
acquisition costs and share-based payments
Headline EPS Earnings per share excluding exceptional costs and tax on exceptional costs
Headline Operating Cash Conversion Headline operating cash flow divided by headline operating profit
ROCE Headline operating profit divided by the average of opening and closing capital employed as
adjusted for certain items of goodwill written off
Capital Employed Net assets adjusted for net cash/(debt)

2016 Statutory income statement
29
£m 2016 2015
Revenue 600.6 567.2
Headline operating profit 99.6 102.1
Amortisation of acquired intangible fixed assets (4.5) (4.2)
Acquisition costs (0.6) -
Reorganisation costs - (20.0)
Operating profit 94.5 77.9
Net finance costs (2.6) (2.9)
Profit before tax 91.9 75.0
Headline earnings per share (pence) 2016 2015
Basic 37.0p 39.5p

30
2016 Cash flow £m 2016 2015
Headline operating profit 99.6 102.1
Add back: Depreciation and amortisation 55.2 49.6
Impairment of fixed assets 5.1 -
Share-based payments 0.5 (0.4)
Profit on disposal of fixed assets (4.5) (2.1)
Headline EBITDA 155.9 149.2
Net capital expenditure (63.1) (61.3)
Net working capital movement (1.4) (6.3)
Headline operating cash flow 91.4 81.6
Restructuring (7.6) (8.4)
Acquisition expenses (0.6) -
Operating cash flow 83.2 73.2
Financing costs (2.3) (2.6)
Tax (20.4) (23.2)
Free cash flow 60.5 47.4
Acquisition spend (23.7) -
Disposals 2.2 1.6
Dividends (48.1) (66.0)
Other 0.2 (6.4)
Reduction in net cash (8.9) (23.4)
Net capex to depreciation
ratio 1.1 times
Includes payment of 2015
Special Dividend (£19m)

31
Specialist Technologies What are they?
Application of high temperature and pressure to densify cast material
Removal of porosity defects improves strength, toughness and machinability
Can eliminate internal voids created by additive manufacturing methods
Method of manufacturing components by HIP technology using powder or solid
Can create parts with the complexity of a casting but the strength of a forging
Can be used to produce materials that can’t be manufactured by any other means
A family of proprietary technologies for the treatment of stainless steel
Unique solution for improving the strength, hardness and wear resistance of stainless steels
Does not affect the inherent corrosion-resistant properties of stainless steel
Comprises thermally sprayed ceramic and metallic coatings, and chemically-formed ceramics
Prolongs component life by protecting from corrosion, abrasion and temperature
Leads to reduced environmental impact by eliminating chrome
A ‘clean’ heat treatment process carried out under vacuum
Provides a hardened surface and tough core – improves wear resistance and fatigue life
Environmentally friendly
Proprietary heat treatment process for improving corrosion resistance and wear properties
Successful alternative to hard chromium
Leads to reduced environmental impact by eliminating chrome
Surface treatment using macro scale ion beams
Ideal for manipulating the material properties of temperature sensitive substrates such as thin metal parts and polymers
Ion Implantation
Processes
Specialty Stainless
Steel Processes
HIP Services
Surface Technology
Low Pressure
Carburising
Corr-I-Dur®
HIP
Product Fabrication

Net finance charge/facilities
32
Committed facility headroom of £225m at 31 December 2016, £5m drawn
The remaining life of the £230m committed facility is 2.5 years
Closing net cash of £1.1m
£m 2016 2015
Net interest payable 0.2 0.3
Financing and bank charges 2.1 2.3
Pension finance charge 0.3 0.3
Net finance charge 2.6 2.9

Pension analysis - balance sheet
33
£m 2016 2015
UK Funded 3.6 2.7
Other Western Europe Funded 1.9 2.0
Other Western Europe Unfunded 15.5 12.6
Western Europe Total 21.0 17.3
North America Funded 0.4 0.5
Emerging Markets Unfunded 0.1 0.1
Total retirement benefit obligations 21.5 17.9
£m 2016 2015
Western Europe Unfunded:
Italy 0.8 0.6
France 10.5 8.6
Germany 4.2 3.4
15.5 12.6

Financial information
34
2016 2015
Weighted average 190.2m 190.0m
2016 2015
EUR Average (P&L) 1.23 1.38
Closing (B/S) 1.17 1.36
USD Average (P&L) 1.35 1.53
Closing (B/S) 1.24 1.47
SEK Average (P&L) 11.59 12.89
Closing (B/S) 11.23 12.43
Analysis by currency, 2016:
Sales
Operating
profit
EUR 38% 49%
USD 36% 39%
SEK 6% 3%
Shares in issue
Exchange rates
2016 2015
Net Debt : Headline EBITDA net cash net cash
Headline EBITDA Interest Cover 759x 498x
Gearing (Net Debt:Total Equity) net cash net cash
Financial ratios

Divisional summary – 2016 H1 v H2
35
ADE Divisions H1 H2 Total
Revenue 121.9 129.0 250.9
Headline operating profit 27.4 28.2 55.6
Margin 22.5% 21.9% 22.2%
AGI Divisions H1 H2 Total
Revenue 169.1 180.6 349.7
Headline operating profit 27.9 30.6 58.5
Margin 16.5% 16.9% 16.7%