2016 fta technology conference and exhibition - … nys plus...2016 fta technology conference and...
TRANSCRIPT

2016 FTA Technology Conference and Exhibition
New York’s Approach to Electronic Tax Collections and the Millennials
Andrew D. Morris Director of Tax Processing New York State Department of Taxation and Finance

Goals and Objectives
§ A taxpayer-friendly, electronic payment solution with a single contractor accessible on multiple devices
§ Support ACH Debit, ACH Credit, Fed Wire, and Credit Card Payments
§ 22 tax programs, including five high-value PrompTax programs
§ Support 10.4 million annual electronic payments totaling $84.6 billion in annual revenue
2

Goals and Objectives
§ All electronic payment processing and taxpayer services (e.g., help desk, interactive voice response, taxpayer view, and payment cancellation) and data transmission
§ Integration with the Tax Department’s secure Online Services and legacy systems
§ Real time and batch processes
§ Future expansion to additional tax programs and customers
3

Project Timeline Overlapping implementation approach because multiple tax programs were affected:
• accommodated various tax programs and payment methods; and • allowed for design, coding, and testing to occur simultaneously for
different tax applications.
4
Dates Activity January 2014 – August 2014 Joint design sessions to gather requirements and
make design decisions February 2014 – November 2015 Design documentation and coding December 2014 – December 2015 Customer acceptance testing
June 2015 – January 2016 Phased production implementation

Project Timeline
January 2014 January 2015 January 2016
Joint design sessions January 2014 to August 2014
Design documentation and coding February 2014 to November 2015
Customer acceptance testing December 2014 to December 2015
Implementation June 2015 to January 2016
5

Electronic Payments
$0.1 B
$2.3 B
$22.3 B
$0.4 B
$13.7 B
$30.2 B
0 10 20 30 40
E-pay - Credit Card
E-pay - ACH Credit
E-pay - ACH Debit
PrompTax - Fedwire
PrompTax - ACH Debit
PrompTax - ACH Credit
6
Payments from implementation through June 2016 ($69 billion total)
PrompTax payments $44.3 billion
(from October 2015)
E-pay payments $24.7 billion
(Phased in from June 2015 through January 2016)

Taxpayer Experience § Responsive to all devices
§ Single sign on with authentication through the Tax Department’s secure Online Services
§ Seamless navigation to the vendor site created by evoking a web service leveraging Security Assertion Markup Language (SAML) technology to transmit taxpayer-specific information to complete the payment transaction
§ Consistent design that mirrors the Tax Department’s website
§ Ease of use, secure, and 100% electronic, debit or credit payment
7

New York’s Experience § Positioned for the millennials immersed in the mobile e-world
§ More than 100 data exchanges using one common record layout
§ Consolidated services decreased contractor dependency by:
• streamlining credit card process (from 4 contractors to 1) • storing all credit card information on one contractor’s site • making contractor subject to Payment Card Industry (PCI)
compliance and data security regulations; and • insourcing enrollment application.
§ Ability to expand credit cards to additional tax programs
8

Communication Efforts
§ Targeted taxpayer outreach – ACH Credit / Debit Changes • 1.5 million taxpayer notices (one million electronic and 500,000
paper) • Manual outreach to taxpayers and payroll service providers after
implementation on 65,000 misdirected payments § Form instructions and publications § 30 public web pages § Online informational messages § Staff training tutorials § 43 staff e-News messages
9

Post-Implementation Experience § January – June 2016 successfully processed:
• 6.3 million transactions; and • $46.4 billion in revenue
§ Transitioned from a large project staff to now a small number of subject matter experts for systems monitoring and issue resolution
§ Minimal number of help desk tickets
§ Weekly and monthly meetings
10

Electronic Payment Tax Programs
11
PrompTaxProgramsWithholding MetropolitanCommuterTransporta5on
MobilityTax(MCTMT)SalesTaxPrepaidSalesTaxforMotorFuel PetroleumBusinessTax
BatchTaxProgramsAssessmentsReceivable HighwayUseTruckMileageTax
Corpora5onTax HighwayUseRegistra5onsandRenewalsCigareHeTax MCTMT
BeverageContainerTax UnemploymentInsuranceTaxPreparerRegistra5onFee Withholding
PersonalIncomeTax Interna5onalFuelTaxAgreementFuelTaxWasteTire Interna5onalFuelTaxAgreementRenewalTaxicab PetroleumBusinessTaxSalesTax

NYS Tax on Social Media
NYSTaxDept @NYSTaxDept NYSTaxDepartment
12

Contact Information
Processing Division Director
Office of Processing and Taxpayer Services
(518) 591-1944
13

14 14
The Millennials are coming?
Source: First Data Corporation, There’s No Slowing Down Millennials, A First Data White Paper (2015)
1981 - 2005
80 million
2020
34
46%

15 15
Emerging no more…
Silents
3.2
Boomers
44.6 Gen Xers
52.7
Millennials
53.5
0
10
20
30
40
50
60
70
1995 2000 2005 2010 2015
Silents Boomers Gen Xers Millennials
U.S. Labor Force by Generation, 1995-2015 In Millions
Note: Annual averages plotted 1995-2014. For 2015 the first quarter average of 2015 is shown. Due to data limitations, Silent Generation is overestimated from 2008-2015. Source: Pew Research Center
16 16
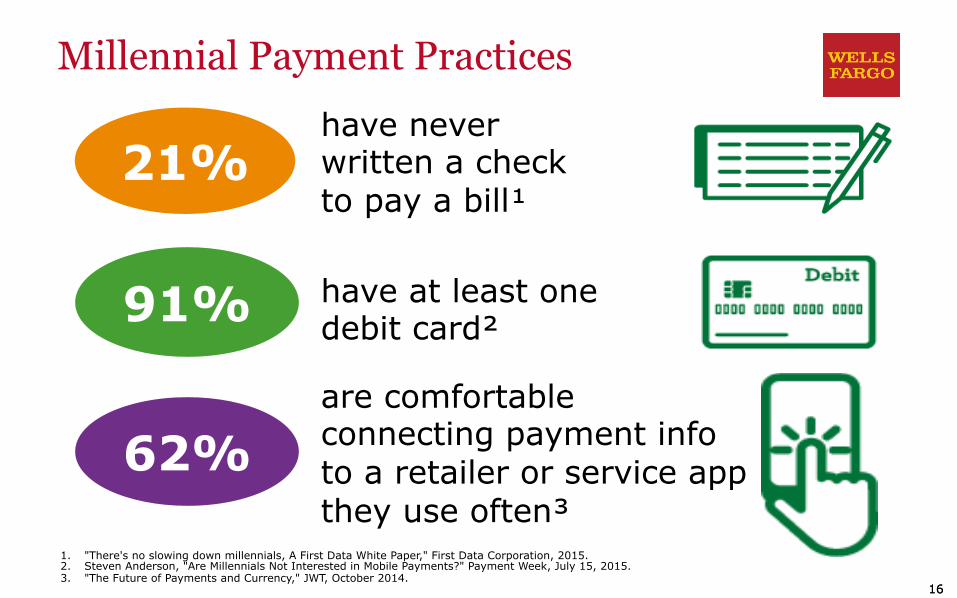
Millennial Payment Practices
1. "There's no slowing down millennials, A First Data White Paper," First Data Corporation, 2015. 2. Steven Anderson, "Are Millennials Not Interested in Mobile Payments?" Payment Week, July 15, 2015. 3. "The Future of Payments and Currency," JWT, October 2014.
have never written a check to pay a bill¹
have at least one debit card²
are comfortable connecting payment info to a retailer or service app they use often³
21%
91%
62%

17 17
Millennials and Mobile
4. “The Modern Wallet: Mobile Payments Are Making Life Easier,”Nielsen’s Mobile Wallet Report, July 10, 2014. 5. Cleveland Brown Payscout, “Millennials Lead The Charge On Mobile Payment Adoption,” Payments Journal, April 5, 2016. 6. “The Future of Payments and Currency,” JWT, October 2014. 7. “2015 North America Consumer Digital Payments Survey,” Accenture

Mobile is Setting the Stage for App Usage - significant room for mobile uptake & adoption
2.5B 50%
2.0B
3.0B
3.5B
4.0B
4.5B
60% 5.0B
2008 2009 2010 2011 2012 2013 2014 2015 2016 2017 2018 2019 2020
The global mobile subscriber base increased by ~5% in 2014 Penetration now at HALFWAY point1
48%
52%
54%
56%
58%
2014 2020
Mobile devices leading the way to spend time online
1 0
2
4 3
5
6
2008 2009 2014 2015 YTD 2010 2011 Other connected devices
2012 Desktop/Laptop
2013 Mobile
51% of total 12% of total
Source: 1) The Mobile Economy, GSMA, March 2015, 2) “Internet Trends 2015 – Code Conference”, KPCB, May 27, 2015. © 2016 First Data Corporation. All Rights Reserved.
0
5,000
10,000
15,000
20,000
25,000
30,000
2014 2020
Mobile data traffic will explode Petabytes per month
Unique mobile subscribers globally 1
1 Hours per day per adult user with digital media, USA 2
By 2020, around three-fifths of
the global population will have a
mobile subscription
Data traffic is forecasted to grow at
a 57% CAGR to 2019

Mobile (continued) Ample potential as mobile remains a small slice of the commerce pie
Source: 1) Department of Commerce, 2) “McKinsey on Payments”, McKinsey, October 2015, 3) “NRF Forecasts Retail Sales to Grow 3.1% in 2016”, NRF, February 10, 2016, 4)
$0B
$2,000B $1,000B
$3,000B
$4,000B
$5,000B
Massive
US Retail Sales1 US eCommerce Sales1 2US Mobile Commerce Sales
Penetration Potential
2016 Growth: 3% 2016 Growth: 10%+ 2016 Growth: ~40%+ 3 4 2
Shopping cart abandonment rates are still in the 60-70% range
© 2016 First Data Corporation. All Rights Reserved. “Forrester Research eCommerce Forecast”, Forrester, April 22, 2015, 5) “33 Cart Abandonment Rate Statistics”, Baymard Institute, January 24, 2016.

Mobile and the On-Demand Economy …Driving a shift from cash and plastic to mobile payments
Logistics
Sector Sample On-Demand Players Payments Implications
• Growth in mobile and in-app payments, as on-demand players offer an integrated and seamless payments experience
• Rise of developer-friendly payments API
• Card issuers will continue
seeking integration in mobile wallets to capitalize on shift to mobile payments
Transportation
Hospitality
Food & Beverage
Financial Services
Home & Personal Services
Events
Services
Other (e.g., Massage, Dog Sitting, Tutoring, Therapy)
© 2016 First Data Corporation. All Rights Reserved.
Healthcare Professional

eCommerce Access and Payment Methods Are Expanding eCommerce over a Broader Array of Connected Devices
Methods of Payments Are Evolving
Computers Mobile Internet of Things (IOT)
via web browsers • Desktops • Laptops • Notebooks
via web browsers or apps • Smartphones • Tablets
Diverse range of devices (e.g., cars, wearables, gaming consoles, vending machines) that use embedded technology to communicate and interact with the external environment via the Internet
Traditional Payment Cards Alternative Payments • Credentials key-entered at
checkout • Credentials stored as “card
on file”
Non card and non bank payment methods Consumer selects funding method from preregistered account
Charges added to wireless bill, typically small amounts
Short-term transactional credit financing
Consumer tenders virtual crypto-currency at checkout Consumer remits cash payment at local c-store to complete order
eWALLETS
CARRIER BILLING
DEFERRED BILLING
VIRTUAL CURRENCY
CASH

22 22
Where are you?
§ Your constituents are changing, are you?
§ How will you meet the Millennials focus on technology and client experience?
§ Where is your organization placing it’s spending bets?
§ How are you monitoring your user experience?

23 23

New York Department of Tax and Finance (DTF) Example
• Fed Wire and ACH Credit Transmissions received by Wells Fargo • ACH Debit and Credit Card Transactions received by First Data • NACHA file created and submitted to Wells Fargo • Fed Wire and ACH Credit transactions imported into First Data • Reporting, research, and administration available to NY DTF • Payment history and registration info available for taxpayers • *Deposit of funds to NY DTF
*Same day ACH funding project in 2016
Business Flow • Users can save their payment data for ACH Debit • Users can view their payment history via Online Services Application • Users can cancel a payment • 4 Electronic Payment Options • Project took 18 Months • SAML – single sign on standards • Responsive HTML Design • Web Services
Project Information and Technology Used
Administer 37 state and 9 local taxes Collecting ~69.1 billion in taxes
The growing Millennial population segment, to conduct virtually all of their tax business online
Mobile/Secure/Available/Easy

25 25
Contact Information
Division Manager
Government & Education Treasury Management
704.410.0727
Vice President
Government Solutions
727.215.4078