2016 final performance report - ed
TRANSCRIPT
2016 FINAL PERFORMANCE REPORT
Race to the Top – Early Learning Challenge Final Performance Report
CFDA Number: 84.412
Minnesota, 2016
Due: 3/31/2017
U.S. Department of Education Washington, DC 20202
2
Instructions
Overview:
This Final Performance Report (FPR) should be completed with several audiences in mind: your project
officers at the U.S. Departments of Education and Health and Human Services (the Departments);
Congress; and the general public. The Departments will use this FPR as a way to measure the progress
of your grant, apprise the field of your work, and inform monitoring and technical assistance for the
remaining cohorts of Race to the Top Early Learning Challenge (RTT‐ELC) grantees. All FPR are due on or
before March 31, 2017.
The FPR should explain clearly the progress you made against your State Plan during the No‐Cost
Extension period and across all five‐years of the grant. It should also explain any challenges faced in the
reporting years, such as delays in implementation or spending, and how those challenges are being
addressed.
Because this report will be public, remember to clearly define terms and spell out acronyms that might
not be commonly understood.
Submission expectations and timelines:
This FPR is due in electronic form to your project officers on or before March 31, 2017.
Please address any questions in writing to your project officers.
FPRs will be posted on the ED.gov RTT‐ELC program website.
The FPR Form:
This FPR includes the following types of request for information:
2. Checklists – ‘yes,’ ‘no,’ and, in some cases, ‘check all that apply,’ followed by narrative explanations. If you do not check some of the boxes, please note the reason.
3. Narrative boxes – describe progress made during the reporting period. 4. Tables – provide updated data on performance measure tables (tables based on subcriteria in
your RTT‐ELC approved application: (B)(2)(c); (B)(4)(c)(1); (B)(4)(c)(2); (C)(3)(d); (D)(2)(d)(1); (D)(2)(d)(2)). For all areas where performance measure targets have not been met, describe strategies used to ensure measurable progress was made by the end of the four‐year grant and the No‐Cost Extension period.
Instructions on Specific Sections:
Cover Sheet –
PR/Award #: as per grant award document
Grantee Name: as per grant award document
Grantee address: as per grant award document

3
Project Director Name, Title, phone, fax, email: as per grant award document
Reporting period: 01/01/2016 to 12/31/2016
Indirect Cost Information: provide information about Indirect Cost Rate Agreement(s) as applicable
Certification: check boxes for MIECHV, section 619 parts B and C, CCDF.
Authorized Representative: the Governor or the person authorized by the Governor to sign grant documents must sign this form.
Executive Summary –
In about ten pages, provide a summary of the progress made towards your State Plan (the plan you set forth in your approved application and in the Scope of Work you developed) during the four‐year grant and No‐Cost Extension period. This should function as a stand‐alone document that provides a high‐level overview of the status of early learning in your State.
Narrative Boxes –
There are no word limits to the narrative sections; however, we suggest you limit yourself to 1,000 words or less.
We ask that you be specific, clear, and concise. You may use bullets for the narrative. Graphics should not be included.
Illustrate the progress made during the year and over the course of the grant with specific examples and data. Describe special initiatives that may be unique to your State. Include challenges as well as successes, and describe how challenges were resolved.
Performance Measures (Tables (B)(2)(c); (B)(4)(c)(1); (B)(4)(c)(2); (C)(3)(d); (D)(2)(d)(1); and
(D)(2)(d)(2)) ‐‐
Do not reformat tables.
Do not revise your approved performance measure targets and baseline data without prior approval from your project officer.
Use the completed tables in your previous APR to provide previous years’ data.
Enter zero when the number is actually zero, not to indicate missing data. Provide best estimate or leave the space blank if data is unavailable.
When completing a row labeled “Other” or “Specify”, add explanatory text.
Each Performance Measure is followed by a Data Notes section. In the Data Notes sections, provide descriptive information that will help the reader understand your data. For example, provide explanations for these types of occurrences in the data:
o You are unable to report data, or have zero counts or low numbers. o Increases and decreases in your numbers, especially when the total
number of programs or children in the State decline or increase, or you report a decrease in actuals compared to the prior year.
4
o The source of the data or methodology used to collect it, including any error or data quality information.
o Methods used to calculate data that will not be apparent to the reader. o What numerator and denominator were used to calculate percentages? o If baseline data are actual or estimated. o Any definitions you used that are not defined in the notice.
Budget and Expenditure Tables ‐‐
These tables request budget and expenditure information for the final reporting year. Expenditures should be reported based on your State’s definition of “expenditures” (for example, funds that have been obligated but not yet drawn down from G5). Please indicate how your State defines this term.
Project officers will expect explanations for any significant discrepancies between your approved budget and your expenditures for the final reporting year. You should explain the reasons for the discrepancy (for example, a delay in making a contract award).

5
Performance Report: Cover Sheet
General Information
1. PR/Award #: S412A120019
2. Grantee Name (Block 1 of the Grant Award Notification.): Office of the Governor, State of Minnesota
3. Grantee Address 130 State Capitol, 75 Rev Dr. Martin Luther King Jr. Blvd.; Saint Paul, Minnesota
55155
4. Project Director Name: Bobbie Burnham Title: Director of Early Learning Services
Ph #: (651) 582‐8414 Ext: (extension) Fax #: (651) 797‐1610
Email Address: [email protected]
Reporting Period Information
5. Reporting Period: From: 01/ 01/2012 To: 12/31/2016
Indirect Cost Information
6. Indirect Costs
a. Are you claiming indirect costs under this grant? ☒Yes ☐No
b. If yes, do you have an Indirect Cost Rate Agreement(s) approved by the Federal Government?
☒Yes ☐No
c. If yes, provide the following information:
Period Covered by the Indirect Cost Rate Agreement(s):
From: Click here to enter a date. To: Click here to enter a date. (mm/dd/yyyy)
Approving Federal agency: ☒ED ☒HHS ☐Other: please specify.
(Attach current indirect cost rate agreement to this report.)
Certification
7. The Grantee certifies that the state is currently participating in:
The Maternal, Infant, and Early Childhood Home Visiting program (see section 511 of Title V of the Social Security Act, as added by section 2951 of the Affordable Care Act of 2010 (P.L. 111‐148));
☐Yes
☐No

6
Programs authorized under section 619 of part B and part C of the Individuals with Disabilities Education Act (IDEA);
☐Yes
☐No
The Child Care and Development Fund (CCDF) program
☐Yes
☐No
To the best of my knowledge and belief, all data in this performance report are true and correct and the
report fully discloses all known weaknesses concerning the accuracy, reliability, and completeness of the
data.
Name of Authorized Representative: Click here to enter text.
Title: Click here to enter text.
Date: Click here to enter a date.
Signature

7
Executive Summary
The Executive Summary is the State’s opportunity to tell the story of its Race to the Top—Early Learning Challenge (RTT‐ELC) Grant. Reflect on your State’s accomplishments over the grant period and, in a couple of pages, share (1) the vision for RTT‐ELC in your State (2) What has changed in the State and in early learning programs as a result of RTT‐ELC (3) the lessons learned in implementing a comprehensive reform agenda. You may also want to share planned next steps for this work. The Executive Summary should be no more than ten pages in length.
8
Minnesota’s vision for our Race to the Top – Early Learning Challenge (RTT‐ELC) work was based in
years of research showing the impact of high quality early childhood programs on children’s school
readiness and success in life. Minnesota’s State plan was to increase access to high quality early
learning development programs for children across the state and in four specific high needs areas of
the state. Our first strategy was to improve the quality of programs through a tiered quality
improvement rating system, revision of our early learning standards, and supports for the workforce.
The second strategy was to increase children’s access to high quality early childhood programs
through early learning scholarships to families and grants to incentivize the expansion of high quality
programs. Our final strategy sought to enhance our assessment and data systems in order to improve
our ability to measure our progress and support children’s learning and development throughout all
early childhood experiences.
Our state plan focused on statewide improvement of quality, access to quality and our ability to make
evidence‐based policy decisions. Our strategies included investing in the communities where children
with high needs live, improving the quality of where they learn, empowering their families to make
choices, focusing on evidence‐based professional development for the adults who care for them and
providing meaningful data to inform decision‐making for local programs and state policymakers.
Our plan focused on enhancing the early childhood system from both a child perspective and a
systems perspective and met in the middle to create a singular coherent system. Closest to the
children’s day‐to‐day lives, we made strategic investments in quality improvements and access to
quality in each of our four Transformation Zones. Transformation Zones were selected across
Minnesota for the embodiment of tough challenges like concentrated urban poverty and sparsely
populated rural areas with high poverty rates, they are: the Northside Achievement Zone (NAZ) in
Minneapolis, the Saint Paul Promise Neighborhood (SPPN) in Saint Paul, Itasca County, and White
Earth Nation. Systematically, we strengthened our governance structure and enhanced and expanded
our statewide infrastructure such that it could address the unique needs, cultures and strengths of
families and local communities while supporting progress towards school readiness for children with
high needs.
Building Quality and Ensuring Access to Quality
At the time Minnesota applied for RTT‐ELC, the drive to quality had been coalescing in Minnesota for
several years. Our state plan relied on a multi‐layered approach for improving program quality with a
focus on improving school readiness. To do this, Minnesota relied on our Tiered Quality Rating and
Improvement System, Parent Aware, and efforts to develop a great workforce.
Parent Aware was one of our largest strategies for improving learning outcomes for children. Parent
Aware provides systematic incentives and supports to improve the quality of early learning and
development experiences for children. It also empowers parents with information to distinguish
quality between programs of all types in order to make a confident decision about the best program
for their children.

9
Parent Aware, throughout the course of the grant, has expanded from nine counties in 2011 to
statewide availability in 2015. In each year, an increased number and percentage of early learning and
development programs participated in Parent Aware. The total number of rated programs has
increased each year of statewide implementation from 2012 to 2016: 529, 1,322, 1,892, 2,434 and
2,635 programs were rated each year, respectively. Minnesota made strong progress in maintaining
and increasing the number of children with high needs enrolled in highly rated early learning and
development programs.
In the rollout of Parent Aware statewide, Minnesota learned that it was important to use a variety of
strategies to reach providers across the state and target different efforts depending on the type of
provider and where they are located. The strong increase in Parent Aware rated programs is partially
attributed to the presence of recruiters working in local communities to strategically disseminate
information on Parent Aware to early learning and development programs. Recruiters continue to use
community organizing principles and receive ongoing training on how to reach “hard to reach”
communities and use Nation Builder (web‐based data system) to track their communications with
programs.
With both federal Child Care Development Block Grant and State General Fund appropriations now
committed to Parent Aware, this key initiative of Minnesota’s Race to the Top – Early Learning
Challenge grant is well positioned to continue into the future. This state and federal investment
ensures that all Minnesota children can continue to access quality early learning opportunities.
In addition to direct program supports, our plan built on human capital by investing in early childhood
educators who make direct and important contributions to improving child outcomes. Over the grant
period, workforce training substantially increased the number of early childhood educators who have
attained credentials aligned with our improved Workforce Knowledge and Competency Framework.
Quality was also buttressed by the implementation of a comprehensive assessment system that
supports providers and programs in choosing, using and interpreting appropriate child assessments
and related results to ensure they can support and guide each child’s individual growth and
development.
The revision of the Workforce Knowledge and Competency Framework sought to combine what an
early care and education provider needs to know about research and theory, with the skills and
abilities needed to work effectively in the early childhood field. The revised framework now aligns
with the Board of Teaching Standards and shows a progression of skill development at three levels:
Explores, Implements, and Designs and Leads, with each level building on the competencies of the
level before it. The Knowledge and Competency Framework facilitates pathways for learning, and
assists early care and education providers in planning for continued professional growth.
Throughout the course of the grant, work was completed to align training and supports for the early
childhood community to the Workforce Knowledge and Competency Framework. By July 1, 2016, all
courses in Develop, Minnesota's online quality improvement and registry tool, were categorized

10
according to the content areas outlined in the Workforce Knowledge and Competency Framework.
Additionally, by the end of the grant, general acceptance of the framework in Minnesota’s institutes
of higher education to ensure courses are aligned to and supporting educators to progress through
the framework.
In addition to improving the Knowledge and Competency Framework and aligning training to it,
Minnesota strove to increase training available to educators. Minnesota was dedicated to improving
the effectiveness and retention of Early Childhood Educators who work with children with high needs.
Minnesota had two key strategies to support Early Childhood Educator development and
advancement. First, Minnesota developed new and revised existing credentials and training.
Secondly, Minnesota provided increased supports to educators to access training and education
aligned with Minnesota's Knowledge and Competency Framework and Parent Aware.
Improving quality was critical to our state plan, but in order to achieve our outcomes, Minnesota
knew families needed to be engaged and equipped with knowledge of what their children need for
strong, healthy development and they must have the means to access these quality services and
programs. Minnesota addressed these needs through two main strategies in Transformation Zones,
early learning scholarships and Title I Pre‐K Incentives. Early learning scholarships were provided to
families to financially support access to programs holding a higher Parent Aware rating. Title I Pre‐K
Incentive grants were provided to school districts who contribute Title I funds to support high‐quality
early childhood programming.
To test access strategies, a goal of the state’s plan was to learn from pilot programs in each
Transformation Zone to inform a statewide program that could accommodate local challenges and
meet individual needs of families. Transformation Zones implemented early learning scholarships in
each community as determined by locally designed plans. External evaluator SRI International
completed and delivered a final implementation evaluation of Early Learning Scholarships showing
that children receiving scholarships attending Parent Aware Rated programs showed growth through
the pre‐kindergarten year. The report also found that awarded children attending higher quality
programs made gains that moderately exceeded a similar group of children in lower rated programs
as evaluated in a range of school readiness domains.
Minnesota also strived to increase access to high‐quality programs through the use of grants to school
districts to incentivize the expansion and creation of high‐quality early education programs that meet
the requirements of the Title I guidance. Participating districts reported positive outcomes from the
grant, including improved coordination between early childhood and K‐12, and improved
relationships not only within the school district but also between the district and families and
community partners. Sustainability will continue to be a challenge due to budget pressures. As early
childhood funding from other sources increased over the past three years, almost half of the districts
using Title I funds to support pre‐K have shifted their Title I funds back to K‐12.
11
Establishing Governance and Accountability
Leadership and vision drives systems. Governor Dayton had set a vision for the early childhood system
in Minnesota at the time we were applying for RTT‐ELC. Minnesota’s vision was set forth in our state
plan and charted a course for joint‐agency coordination to focus on shared goals. The grant was a
vehicle for focused and regular communication about the progress of our state plan and create a
feedback loop with state level leadership and local communities. Leadership and governance created
over the grant period has made a real and ongoing impact on the early childhood system. This cross‐
agency leadership team is committed to continue the governance structure developed under the
grant and expand the scope of our coordination to other areas of the early childhood system like
home visiting and mental health.
The vision we outlined in our plan was a standards‐based system by which we could measure
progress. The standards‐based system starts with what children should be able to know and do at
different stages between birth and kindergarten entrance. Our early learning standards provide a
common set of developmentally appropriate and research‐based expectations for families, early
learning and development programs and the system. Minnesota had been measuring progress
toward improving outcomes for children with high needs since 2000. Our state plan sought to ensure
our expectations for children were reflective of current research and practice and aligned with
current kindergarten standards. Minnesota needed to improve our kindergarten entry assessment to
ensure it was measuring children’s progress against our early learning standards and build on
assessment supports such as training and measurement selection. A comprehensive assessment
system structure was critical to alignment between ages and early learning and development
initiatives. Assessments help Minnesota appropriately measure the impact of our strategies to
increase access to high‐quality programs. We strove to ensure the measure was valid, reliable and
appropriate for the diversity of Minnesota’s young children while providing local programs and the
state information that could improve day‐to‐day interactions with children and state‐level decisions
impacting programs.
Our ability to measure our success during the grant and beyond has been dependent on the
development of our Early Childhood Longitudinal Services (ECLDS). The ECLDS allows the state to
identify public services a child receives in their early years and associate that combination of services
with the status of the child at different points in time later in life. This linked data will provide
Minnesota with actionable information that will specifically relate to early learning services and later
outcomes for children.
Conclusion
Our state plan had two focal points: 1) build quality and increase access to quality; and 2) establish
governance and accountability. More information about Minnesota’s progress and lessons learned
for the first point are included in Section B (High‐Quality, Accountable Programs) and complemented
by investments in our Great Workforce (D1 and D2) and Comprehensive Assessment System (C2).

12
Minnesota was fortunate to receive Race to the Top – Early Learning Challenge grant funding to meet
critical state needs. The funds accelerated the expansion of Parent Aware, investments in access to
high quality through scholarships and Title I incentives, supported our workforce, and set standards in
learning, workforce competencies and assessment. The final component for raising program quality
was an investment in a Comprehensive Assessment System that provided ELD programs with the
necessary tools for monitoring and supporting children’s development. These initiatives were
supported through our second focal point which ensured leadership from a strengthened governance
structure and informed by an expanded infrastructure for learning from our system and for use of
evidence to make decisions at a variety of levels (E1 and E2).
The challenge and opportunity provided to Minnesota through our RTT‐ELC grant was to wisely use
these resources to make sustainable improvements to Minnesota’s state system that coordinate with
support and accelerate work on the existing framework. Minnesota’s plan built on our strengths by
leveraging strong state and local systems to develop, test initiatives and learn from the evidence they
produce. After the grant, Minnesota is in an even better place to continue the work we started with a
stronger infrastructure to optimize new state investments in early childhood programs that exceed
over $100 million annually.
Core Areas
A. Successful State Systems Aligning and coordinating early learning and development across the State (Section A(3) of Application)
Overall Accomplishments
Reflect and relate your accomplishments during the four‐year grant and No‐Cost Extension
period in aligning and coordinating early learning and development across the State.
Please report on your progress against all applicable goals, targets, and projects in the State’s
application. Provide an overall assessment of your grant implementation (you may want to
explain the major accomplishments in the projects you outlined in your RTT‐ELC Project Plan,
identify strategies used, and how identified challenges and lessons learned will inform future
work). Discuss how RTT‐ELC funds contributed to project goals and outcomes. Include evidence
and data to support your discussion (e.g., tools created, student outcomes, survey results,
changes in instructional practice).

13
Race to the Top – Early Learning Challenge provided the impetus for Minnesota to align and
coordinate early learning and development across the state. Through Race to the Top, the state plan
changed the inputs of the system with the increase in quality Parent Aware Programs, a new
Knowledge and Competency Framework for Early Childhood Professionals and revised Early
Childhood Indicators of Programs; changed alignment within the system through the Early Childhood
Longitudinal Data System, improvements in health and developmental screening, and comprehensive
assessment systems; and, most importantly, changed the outputs of our system – child outcomes.
In Minnesota’s Transformation Zones, the state emphasized initial effort and resources to implement
the quality, access and data projects in these communities, to see if taking them to scale in specific
high‐need communities would yield results. Transformation Zones provided strong feedback to the
state regarding the impacts of the Race to the Top efforts in each of the diverse communities on
increasing access to high‐quality early childhood programs.
Below will highlight progress, overall assessment of grant implementation, how RTT‐ELC funds
contributed to project goals and outcomes, and data to support evidence. Elements will be shared in
the following sections: High‐Quality, Accountable Programs; Increased Access to High Quality; Early
Learning and Development Outcomes for Children; Great Early Childhood Workforce; and Measuring
Outcomes and Progress.
High‐Quality, Accountable Programs
High‐quality programs was the single greatest investment in Race to the Top funding and the state’s
premier strategy for improving learning outcomes for children. Since the inception of the grant,
Parent Aware has the dual role of program rating and improvement, and also empowering parents
with information on program quality. Throughout the course of the grant, Parent Aware expanded
the number of rated programs from 529 in 2012 to 2,635 in 2016.
A critical strategy for Parent Aware growth were recruiters working in local communities using
community organizing principles. These positions continue to allow quality coaches to specialize in
engaging with programs to improve their quality. In addition, the continued growth in use of
www.parentaware.org, Minnesota’s consumer‐friendly online search tool for parents, provides quick
access to Parent Aware Rating information and market pressure on early learning and development
programs to participate in Parent Aware. Since launching in August 2014, the number of website hits
has increased each year, totaling more than 380,000 sessions and 221,000 new and returning visitors.
Infrastructure to support the implementation of Parent Aware was significantly improved throughout
the duration of the grant. Parent Aware Rating Tool’s Standards and Indicators underwent an
intensive review and revision to simplify some aspects of our quality measures as well as further
strengthen and add measures that make the biggest difference for children. Develop is the data
system that plays the dual role of supporting administration of Parent Aware ratings as well as our
Professional Development Registry. During the grant period, Develop underwent significant
14
enhancements to make it user friendly, increase efficiencies and align it with the Knowledge and
Competencies Framework.
Three small‐scale, yet impactful targeted initiatives worked towards improvements in high‐quality,
accountable programs which are in harder‐to‐reach populations: rural communities, New American
child care providers and supporting family, friend and neighbor care. These efforts helped meet the
needs of a decreasing supply of child care options in greater Minnesota, recognizing the significant
role of culture and linguistics in New American child care, and the unique and vast role of family,
friend and neighbor care.
The Minnesota Department of Human Services partnered with First Children’s Finance to successfully
assist rural communities to create public‐private partnerships to address the specific issues
surrounding child care in their area. A key strategy included the replicable convening in five areas of
the state with private business leaders, elected representatives, economic development leaders, local
decision‐makers, and community members to learn more about how to support and expand the
supply of high‐quality child care in rural areas. Recommendations from this project have prompted
the department to commit continued funding from the Child Care Development Block Grant for
public‐private partnership support in rural communities to build the supply of child care, especially
care for infants and toddlers.
The Department of Human Services partnered with a community partner to support the work of the
New American Child Care Provider’s Network. The network aims to connect New American child care
providers from various backgrounds to build their skills and create a learning community. Many New
American providers have benefited from the network in the areas of peer learning, mentoring and
sharing of experiences based on best practices. Support has helped New Americans become licensed
child care providers and provide quality early learning services, which ultimately will lead to economic
self‐sufficiency and integration into their new country. Six Somali, three Hmong and two Latino
members are enrolled in Parent Aware and continue to recruit and enroll more New Americans. An
eight‐hour health and safety training has been developed, and will be offered to legal non‐licensed
providers serving children receiving child care assistance statewide in 2017.
Transformation Zones implemented local plans to connect family, friend and neighbor providers with
parent education experiences and resources. Minnesota Department of Education staff created a
toolkit of over 300 existing early childhood resources to be used to guide and support providers. The
toolkit provides resources that align with the requirements of the Child Care Development Block
Grant Act of 2014. Resources include topics such as home safety, health and school readiness. Effort
was made to include translated materials in Spanish, Somali and Hmong. In 2015, MDE branded this
as the Early Childhood Resource Directory and partnered with the Department of Human Services and
Child Care Aware of Minnesota to make the directory available online
(http://statewide.mnchildcare.or; Username: ECStakeholderMN and Password: EarlyChildhoodMN).

15
With both federal Child Care Development Block Grant and state General Fund appropriations now
committed to Parent Aware, this key initiative will continue to ensure that all Minnesota children
continue to access quality early learning opportunities. The Child Care Development Block Grant will
continue to be used to build the supply of child care in the state, particularly in rural areas.
Increased Access to High Quality
The state’s premier investment for Race to the Top funding was in program quality. Key strategies to
leverage that investment include increasing access to high‐quality early childhood education and care
programs for children with high needs: early learning scholarships and Title I Pre‐K Incentives. Early
learning scholarships were provided to families to financially support access to programs holding a
higher Parent Aware rating. Title I Pre‐K Incentive grants were provided to school districts that
contribute Title I funds to support high‐quality early childhood programming.
In an effort to form Transformation Zone pilot programs, zones implemented early learning
scholarships as determined by locally designed plans. External evaluator SRI International found that
Transformation Zones reported benefits that include: greater continuity of care, increased hours for
children previous in care, and more children transitioning to higher quality care. Based on the use of
child level assessments beginning in the fall of 2014 with 4‐year‐olds receiving scholarships, and a
follow‐up assessment in the spring of 2015, the report finds that children receiving scholarships
attending Parent Aware Rated programs showed growth through the pre‐kindergarten year. The
report also found that awarded children attending higher quality programs made gains that
moderately exceeded a similar group of children in lower rated programs as evaluated in a range of
school readiness domains. Transformation Zone staff worked with local scholarship administrators to
ensure any children funded by Race to the Top grant dollars were transitioned to state‐funded
scholarships as the grant ended. State funding for Early Learning Scholarships increased significantly
during the Race to the Top grant period, providing state funds to sustain and expand the Early
Learning Scholarship program.
Minnesota also supported access to high‐quality programs through grants to school districts to
incentivize the expansion and creation of programs that meet the requirements of the Title I
guidance. Twenty‐seven school districts, including two charter schools, utilized Title I funds and Title I
Pre‐K Incentives. Districts reported positive outcomes from the grant, in coordination between early
childhood and K‐12, and improved relationships internally and also with families and community
partners. Over the course of the grant, districts became more strategic about use of Title 1 funds,
increasingly dedicating those resources to improve program quality. To support districts, Minnesota
developed a webpage for grant recipients with resources and strategies. A budget tool was also
developed to help districts with program planning and blending and braiding funds. Minnesota
targeted Title I Pre‐K Incentive grant schools for the Pre‐K Through Third Grade Principal Leadership
Series focused on building principals' competencies to effectively lead pre‐K through third grade
efforts. Sustainability of redirecting funding to early childhood is a challenge and nearly half of
16
districts have shifted their Title I funds back to K‐12, however the resources to support districts
continue to be a valuable asset.
Early Learning and Development Outcomes for Children
The ultimate goal of Race to the Top – Early Learning Challenge funding is to improve outcomes for
children throughout the state. The investments made throughout the grant build on Minnesota’s
work and set up a system to better support children and assess child outcomes. Minnesota supports
early learning and development outcomes for children by first defining what children are expected to
know and do across multiple domains and at different stages of development, then working to have a
structure in place to screen and assess individual children and their environments and programs.
Minnesota worked on this vision through the revision of the Early Childhood Indicators of Progress:
Minnesota's Early Learning Standards (ECIPs); the Comprehensive Assessment System; and Early
Childhood Screening.
The preschool version of the ECIPs was initially developed in 2000, and revised in 2005; the infant and
toddler version was developed in 2007. The documents were revised and expanded into a single
continuum of expectations as a part of the Race to the Top – Early Learning Challenge grant. The
revision was completed in several phases by domain: language, literacy and communication, and
social and emotional (2014), science and math standards (2015), and creativity and the arts,
approaches to learning, social systems and physical development (2016). The revision process of the
ECIPs used committees composed of professionals from school districts, Head Start and child care
programs, including diverse content specialists, teachers, providers, coaches, faculty, trainers and
administrators, who convened to address specific domains. Proposed indicators were reviewed by
additional content experts. Finally, the standards were reviewed for plain language to ensure the
standards were as clear as possible. The ECIPs were promoted through a training of trainers
developed by the Center for Early Education and Development at the University of Minnesota and
further integrated into training available to early learning and development programs.
The ECIPs tells us what children are expected to know and do, and Race to the Top funds were used to
develop a comprehensive system for helping early childhood education and care teachers assess
individual children’s progress toward those goals. Minnesota’s comprehensive assessment system
works to support an early childhood system of measurement with decision‐making across settings
and points in time. Minnesota's efforts around the development of a comprehensive assessment
system include helping early childhood programs understand the “why,” “what” and “how” of
assessment and ensuring they have the tools to implement assessments appropriately and use the
data in order to adapt their instruction and improve outcomes for children. Throughout the course of
Race to the Top – Early Learning Challenge, Minnesota implemented multiple online resources,
supports for training and coaching and expansion of the system in grades K‐3. Minnesota finalized
uniform review criteria by which all early learning assessments for the kindergarten entry assessment,
early childhood special education (ECSE) and comprehensive assessments are examined.

17
Assessments must be supported through training. Minnesota completed an online tool finder to assist
early learning programs with choosing an appropriate assessment tool, including Parent Aware‐ and
Kindergarten Entry Profile (KEP)‐approved tools. The tool also helps programs find trained trainers
throughout the state to provide publisher‐approved trainings on assessment tools at a lower rate
than offered by publishers. This tool has saved programs thousands of dollars in professional
development costs. In addition, through a partnership with the University of Minnesota, the state
completed work on a series of hybrid learning modules that focus on authentic assessment for special
topics: embedding authentic assessment into everyday practice, involving families in the assessment
process, support for administrators and more. As a result, teachers and providers will have immediate
access to authentic assessment learning modules in order to help programs meet training and
professional development requirements for Parent Aware.
Another component of Minnesota’s vision for monitoring children's progress is ensuring they receive
developmental and social‐emotional screening in order to flag developmental concerns early and
refer children to appropriate services. Minnesota actively piloted electronic Ages & Stages screening
instruments. Nine community‐level pilot sites have fully implemented electronic screening access for
the families they serve in settings such as family home visiting, WIC clinics, school districts, primary
care clinics and Early Head Start/Head Start. Sites have shared success with the pilot, including
increases in the number of children screened, increased efficiency, and families report the system is
easy to use and helps them understand their child’s growth and development. The state will continue
to work through identified challenges in access for multiple languages and technology limitations.
Lessons learned will impact the statewide implementation of the National Help Me Grow model.
An initiative led by the Minnesota Department of Health, the Assuring Better Child Health
Development (ABCD) Family Medicine Project, improved screening, referral, and feedback processes
for children ages birth to 5 with suspected developmental or social‐emotional delays. Clinic teams led
by medical providers worked with local schools and public health staff to set system‐wide screening
schedules with standardized, state‐recommended tools, and to increase communication regarding
hard‐to‐reach families. The project resulted in 19,859 well child visits with 16,832 children who
completed screens and 513 children who were referred for early intervention services. Key
accomplishments including implementing a standards referral to Help Me Grow in the Bemidji
Hospital, building stakeholder teams to address barriers specific to North Minneapolis Hmong
families, educating providers on referring children to Help Me Grow, and utilizing a public health
nurse to follow up with families visiting in Cass Lake Indian Health Board emergency room.
Deliverables include an updated ABCD Toolkit, Chart Review Report and Executive Summary.
Great Early Childhood Workforce
Well‐prepared and highly skilled personnel create high‐quality early learning and development
settings. Prior to Race to the Top – Early Learning Challenge Grant funding, Minnesota experienced a
shortage of early childhood staff statewide demonstrating a need for recruitment and retention.
There are multiple pathways to enter the early childhood field and the Workforce Knowledge and
Competency Framework crosses sectors and is a foundation for teacher preparation and in‐service
18
training. It provides an opportunity to align all professional development and creates the foundation
for articulation agreements and career pathways.
Minnesota's Workforce Knowledge and Competency Framework for Early Childhood Professionals
was released in 2014. The framework includes three versions: pre‐school children in center and
school programs; infants and toddlers; and children in family care home settings. The Minnesota
Association for Early Childhood Teacher Educators has endorsed the use of the framework in their
coursework. Grants were made to two‐ and four‐year institutes of higher education to embed the
framework into their coursework with great success in scaffolding of learning for students,
discovering multiple applications, and creating articulation agreements. In partnership with these
efforts, DHS worked to align training and supports for the early childhood community in Develop.
After the 2014 revision of the Minnesota Child Care Credential, Minnesota saw a large increase in
interest in the revised credential and thus a significant increase in completion rates in 2015 compared
to previous years. Additionally, development of the Minnesota Infant/Toddler Credential (MNITC) has
been completed and English and Spanish cohorts are in progress. Overall, we are proud of our
continued progress to meet or exceed our targets to support early childhood educators in progressing
to higher levels of credentials and degrees.
These combined efforts, carried out in coordination with other state initiatives, continue progress
toward ensuring our youngest learners are in high‐quality environments with highly skilled adults who
teach and care for them. Workforce Knowledge and Competencies Framework are sustained through
the embedment within Develop and institutes of higher education as well as support through state
legislation and an investment from the National Academy of Sciences.
Measuring Outcomes and Progress
A critical component to improving childhood outcomes is measuring childhood outcomes. Race to the
Top provided funding to create the Early Childhood Longitudinal Data System (ECLDS) and revise the
kindergarten entrance assessment. The ECLDS now offers a platform for multiple state agencies to
connect and analyze data on young children in Minnesota to help our state answer questions about
young children and their development and learning. Minnesota’s kindergarten entry assessment is
one assessment to analyze kindergarten readiness annually and over time. ECLDS and the
kindergarten entrance assessment enhanced the state's ability to understand children's early
experiences and answer broad and meaningful questions about demographics, program participation,
and outcomes for Minnesota's youngest children.
The new ECLDS website (eclds.mn.gov) launched January 2016 as a new and evolving tool. ECLDS
experienced challenges similar to many states: delays in hiring initial teams and relationship‐building
between departments in navigating the construction of data‐sharing agreements and governance
structures. Analytics currently offered to users include early care and education program participation
and outcome measures for children at K‐3 entry such as early grade attendance and third‐grade test
scores. Initial mapping functionality was also implemented in early 2017. Funding received under a

19
new SLDS‐IES grant is ensuring ongoing enhancements to the site including pop‐up feedback
windows, a download feature, user tutorial videos and the integration of two new major data sources
(National Help Me Grow and Head Start). A future integration with the Statewide Longitudinal Data
System is anticipated between 2019 and 2021 to provide full integration from birth to workforce.
To improve alignment between assessment and early learning standards and improve measurement
validity and reliability, Minnesota completed a revision of its kindergarten entry assessment, now
referred to as the Kindergarten Entry Profile (KEP). The KEP is designed as a tool to measure children's
status on the state early learning standards at kindergarten entry based on what children know and
are expected to do as defined by state learning standards. Race to the Top allowed the state to
complete a two‐phase kindergarten entrance assessment pilot in which a menu of tools from which
districts can choose underwent a substantial amount of rigorous alignment and validity testing,
paying close attention to the domain coverage of the standards. Minnesota has adopted the following
tools which any district can implement with support from MDE: Desired Results Developmental
Profile – Kindergarten; Formative Assessment System for Teachers; Teaching Strategies Gold; and
Work Sampling System – Minnesota Adapted Version. A process has been established to pilot new
assessment tools as they are nominated to be a part of the KEP menu.
Conclusion
Race to the Top – Early Learning Challenge funds were used to build and expand on a state early
learning systems infrastructure. The state of Minnesota is committed to ensuring that all children get
the great start they need to succeed in school and life. The state has actively leveraged Race to the
Top – Early Learning Challenge grant funds, along with public and private local investments, to expand
and support programs and initiatives; build and maintain quality early care and learning
environments; and ensure access through robust outreach efforts and supports to families with high
needs. Through coordinated efforts among our three core agencies: Education, Health, and Human
Services and bipartisan support from leadership across sectors, Minnesota will benefit from these
investments for years to come. Sustainability of efforts in Minnesota will continue through state
appropriations, additional federal grants and integrating improvements within existing systems and
funding streams.
Governance Structure
Please provide any relevant information and updates related to the governance structure for
the RTT‐ELC State Plan (include information on the organizational structure for managing the
grant, and the governance‐related roles and responsibilities of the Lead Agency, State Advisory
Council, and Participating State Agencies).

20
Minnesota's governance structure has consisted of three levels: the State Advisory Council on Early
Childhood Education and Care (Early Learning Council), the Children's Cabinet, and the cross‐agency
leadership team. The Early Learning Council and the cross‐agency leadership team have a focus on
children from birth to grade three, and the Children's Cabinet focus includes birth to workforce entry.
The Early Learning Council and the Children’s Cabinet were implemented under the direction of
Governor Mark Dayton, who has demonstrated a strong commitment to the early learning and
development of children.
The Minnesota Children's Cabinet is designated as the cross‐agency leadership team for programs
serving children and youth, and includes the three commissioners of the Departments of Education,
Health, and Human Services. This cabinet, led by the Director of the Children's Cabinet, coordinates
goals, makes strategic decisions, and coordinates state services, programs, and funds in an efficient
manner for children of all ages, building strong connections between systems and programs that
focus on children birth to 8 and the K‐12 system.
The Early Learning Council was established in 2011 by Governor Mark Dayton. The goal of the council
is to ensure that all children are school‐ready by 2020. Members of the council make
recommendations to the governor and Legislature on issues that effectively create a high‐quality early
childhood system in Minnesota that will help improve educational outcomes for all children.
Members of the council are appointed by the governor and include a spectrum of legislators, parents
and those working in early education and care.
The Early Learning Council and the Children's Cabinet are important points of stakeholder input and
cabinet level decision making, but the day‐to‐day coordination and alignment of Minnesota's early
childhood system falls under the cross‐agency leadership team consisting of upper management from
the departments of Education, Health and Human Services.
The governor designated the Department of Education to lead the coordination of the state RTT‐ELC
Plan, through the division of Early Learning Services. Commissioners from the three state agencies
comprising the Children's Cabinet each signed Memoranda of Understanding (MOU), delineating roles
and responsibilities under the State Plan.
The cross‐agency leadership team includes the director of the Children's Cabinet and agency directors
and supervisors who oversee programs currently housed in the departments of Education, Human
Services, and Health. The leadership team collectively responsibility for making recommendations to
their respective commissioners regarding policy, budgeting, and rulemaking across the scope of
programs currently housed in all three agencies to reduce fragmentation and improve services for
young children and their families. The leadership team is currently reviewing and refocusing the
purpose, goals and strategies of the group in order to determine how we can support our work and
continue to collaborate and coordinate components of the early childhood system beyond the Race
to the Top grant.
21
The Minnesota’s Race to the Top State Plan was monitored and coordinated by the RTT‐ELC project
manager guided by the RTT‐ELC Leadership Implementation Team. The team included the cross‐
agency leadership team and supervisors from each of the three agencies. The team met on a monthly
basis to review progress, ensure coordination across agencies and projects, assess potential risks, and
provide direction on the overall State Plan.
Stakeholder Involvement
Describe State progress in involving representatives from Participating Programs, Early
Childhood Educators or their representatives, parents and families, including parents and
families of Children with High Needs, and other key stakeholders in the implementation of the
activities carried out under the four‐year grant and No‐Cost Extension period .
22
Implementation of the Race to the Top – Early Learning Challenge grant has strengthened stakeholder
involvement and relationships statewide. Collaboration across stakeholders has ensured that the
products and initiatives from the grant are useful and sustainable for the audiences served.
Minnesota's state plan was developed to incorporate multiple feedback loops from participating
programs, early childhood educators, funders, and other key stakeholders in the implementation of
activities under the grant. All major initiatives in the grant include a cross‐sector and cross‐agency
approach to solicit feedback, including: Parent Aware (Minnesota's TQRIS), Early Childhood Screening,
Early Learning Scholarships, Early Learning Standards, Early Childhood Longitudinal Data System,
Workforce Development, Comprehensive Assessment System and Kindergarten Entry Assessment.
Parent Aware continues to be guided by a governance structure, begun under the Race to the Top‐
Early Learning Grant, which includes an advisory group made up of representatives from participating
programs, the early childhood educator workforce, implementation partners, the Early Learning
Council and leaders from each of the four Transformation Zones. The Early Childhood Comprehensive
Assessment workgroup includes representatives from early childhood, K‐12 and English learners. The
Early Childhood Longitudinal Data System's governing body includes stakeholders from organizations
that collect data included in the system, including cross membership with the Statewide Longitudinal
Data System.
Each Transformation Zone has a leadership body that helps to determine policy decisions for
initiatives affecting the Transformation Zone and is actively engaged with implementation decisions
regarding many RTT‐ELC activities. Minnesota held quarterly meetings with the Transformation Zones
to communicate progress on grant activities, receive feedback on implementation, and work
collaboratively to resolve challenges across Transformation Zones and within a specific
Transformation Zone.
Stakeholders are also involved with supporting and carrying out some of the activities included in the
Statement of Work. The nonprofit organization Parent Aware for School Readiness (PASR), which
sunset in 2016, was involved in the communication and promotion of Parent Aware and funded a
portion of the Parent Aware Evaluation in conjunction with the Greater Twin Cities United Way.
Regional and local Child Care Aware of Minnesota agencies, Minnesota's child care resource and
referral system, have contract responsibilities to support Parent Aware. The work includes: recruiting
and supporting licensed child care programs in Parent Aware, providing consumer information to
parents, supporting trainers and delivering training and coaching aligned with the Knowledge and
Competency Framework and meeting Parent Aware training requirements to Minnesota's child care
providers. Representatives from Child Care Aware of Minnesota also serve on the Comprehensive
Assessment System advisory group.
Minnesota also sought feedback on Minnesota’s plans and activities from stakeholders in rural
communities throughout Minnesota. The Minnesota Initiative Foundation leaders have been partners
in conversations regarding continuous improvements in Parent Aware, Early Learning Scholarships,

23
Pre‐K Through Third Grade Leadership series, Title I Pre‐K Incentives, Great Workforce Initiatives and
the Comprehensive Assessment System.
In November 2015, the Minnesota Departments of Education, Health and Human Services, along with
the governor's Children's Cabinet partnered with the Minnesota Initiative Foundations and
Minnesota's Future to host regional community listening sessions to learn how our state can be more
effective in linking policies, programs and practices to ensure every child in Minnesota has a high‐
quality early education. Over 600 people attended these sessions. In December 2015, a survey was
sent out covering the same topics, which received over 2,000 responses. Kathy Thornburg from the
federal Race to the Top – Early Learning Challenge technical assistance team facilitated the sessions
and consolidated input.
The Greater Twin Cities United Way and the McKnight Foundation sponsored efforts throughout the
grant period to promote coordination and collaboration with initiatives occurring in the state,
including: the federal Promise Neighborhood and Investing in Innovation Fund (I3) grants, the Social
Innovation Fund grant, the local STRIVE Initiative, and the Accreditation Facilitation Project. The Learn
Together Minnesota website was created for stakeholders to learn more about and follow the
progress of each of these grants. The McKnight Foundation has continued to partner with the
Minnesota Department of Education and Minnesota Elementary School Principals’ Association to
support a statewide Pre‐K Through Third Grade Leadership series. Spring 2017 will mark the third
cohort of leadership teams throughout the state participating in the five‐session series. To date, 95
school districts have participated in the initiative. In addition, MDE hosted a pre‐K through third grade
online course cohort and will soon offer a second cohort following Coherence by Michael Fullan and
Joanne Quinn.
Greater Twin Cities United Way and The McKnight Foundation also created the LearnTogetherMN
project. LearnTogetherMN was an effort to ensure statewide community early learning stakeholders
could track progress against the RTT‐ELC grant objectives, and more importantly, benefit from the
learnings and outcomes of the grant, as well as the Promise Neighborhood and Investing in
Innovation Fund (I3) grants. The project included a website, email updates, and quarterly meetings of
leaders from the RTT‐ELC grant and other grant leaders. In addition, as each of the grants wrapped
up, there were public forums to share learnings, as well as a series of explainer videos that highlighted
key products from the RTT‐ELC grant, including Develop, online screening and the Kindergarten Entry
Profile.
The partnerships that were strengthened through Race to the Top will continue to support early learning and care initiatives throughout Minnesota.

24
Proposed Legislation, Policies, or Executive Orders
Describe any changes or proposed changes to state legislation, budgets, policies, executive
orders and the like that had an impact on or was the result of the RTT‐ELC grant. Describe the
expected impact.

25
Minnesota experienced modest gains in early childhood funding prior to 2013. From 2007 to 2011 the
total state contribution to early childhood rose from $304,268,969 to $354,144,426. Race to the Top
provided an increased focus on early childhood programs and helped target new investments. Over
the course of the RTT‐ELC grant, Minnesota has increased state investments in early childhood
programs and services significantly, though the need is still not met.
In 2013, the Minnesota Legislature increased spending for early childhood programs and services by
approximately $59.4 million dollars over the biennium. Additionally, the 2013 legislative session
included $301.2 million per biennium of state funding to support full‐day kindergarten. As a result,
99.6 percent of school districts throughout the state provide full‐day kindergarten.
The 2014 Minnesota legislative session continued investment in young children with a supplementary
budget increase of $20.76 million a year, inclusive of $19.4 million towards higher reimbursement
rates for Three‐ and Four‐Star Parent Aware Rated programs, supporting teen parents to finish their
education, increasing continuity of care by allowing a 30‐day reinstatement period for families served
by Basic Sliding Fee, and increases to rates for some providers.
The 2015 Minnesota Legislature added $95.5 million in new investments for early childhood programs
and services for the 2016‐2017 biennium. The Parent Aware Quality Rating and Improvement System
received the program’s first appropriation of funding. Parent Aware was appropriated $1.2 million for
fiscal year 2016, $2.3 million for fiscal year 2017 and $1.75 million in base funding for future years.
These new funds support Parent Aware along with an ongoing commitment in federal Child Care
Development Block Grant funding through DHS. To support increased access to early care and
education, the 2015 Legislature appropriated an additional $30.8 million for School Readiness,
Minnesota's state‐funded preschool program for three‐ and four‐ year olds and a $48.3 million
increase for the Early Learning Scholarship program. State funding for Head Start increased from $20
million to $25 million a year.
Increases in funding from 2013 to 2015 have totaled approximately $100 million annually in new
funding for early childhood programs and services.
During our no cost extension in 2016, the Legislature created the Voluntary Pre‐kindergarten program
for four‐ year olds and appropriated $27 million for fiscal year 2017, $27.2 million for fiscal year 2018,
and $26.4 million for fiscal year 2019 and later. It also increased the allocation of a one‐time
additional appropriation of $2 million to Parent Aware in fiscal year 2017 for additional efforts to
provide training to providers in underserved or low‐income neighborhoods.
Finally, beginning July 1, 2017, the start of fiscal year 2018, the Department of Human Services will
increase the amount of federal Child Care Development Block Grant (CCDBG) funds to support Parent
Aware. The CCDBG law, reauthorized in 2014, requires states to direct a greater percentage of funds
for quality activities like quality rating and improvement systems. This increase in CCDBG funds for
Parent Aware offsets some reductions in other funding sources, including the end of federal Race to
the Top – Early Learning Challenge grant funds.
26
The momentum of Race to the Top and the system improvements we were able to make under the
grant have contributed to the ongoing support of early childhood education and care initiatives
throughout the state.
Participating State Agencies
Describe any changes in participation and commitment by any of the Participating State
Agencies in the State Plan during the four‐year grant and No‐Cost Extension period.
Participation and commitment of participating state agencies did not change throughout the duration of the Race to the Top grant. Minnesota’s Race to the Top – Early Learning Challenge Grant was implemented by the departments of Education, Health and Human Services with support from the Governor’s office. The Minnesota Department of Education was responsible for fiscal oversight of the grant, fiscal and program reports, and management of grant activities listed within memorandum of understanding. The departments of Health and Human Services each were responsible for oversight and management of grant activities listed within memorandum of understanding. The Governor’s Office provides recommendations to the Minnesota Legislature on early learning policy and finance proposals. The commissioners of each agency participate as members of the Early Learning Council and Children’s Cabinet.
B. High‐Quality, Accountable Programs
Overall Accomplishments
Reflect and relate your accomplishments during the four‐year grant and No‐Cost Extension
period in the area of improving quality in early learning programs in your State, including
development and use of a Tiered Quality Rating and Improvement System (TQRIS).
Please report on your progress against all applicable goals, targets, and projects in the State’s
application. Provide an overall assessment of your grant implementation (you may want to
explain the major accomplishments in the projects you outlined in your RTT‐ELC Project Plan,
identify strategies used, and how identified challenges and lessons learned will inform future
work). Discuss how RTT‐ELC funds contributed to project goals and outcomes. Include evidence
and data to support your discussion (e.g., tools created, student outcomes, survey results,
changes in instructional practice).
27
The Race to the Top – Early Learning Challenge grant provided the impetus for the successful
statewide expansion of Parent Aware, Minnesota’s TQRIS. Grant funds, along with other public
funding, helped leverage the investment of significant private business and philanthropic funding to
compliment state and federal investments. This mix of funding helped us achieve the Parent Aware
mission of: 1) helping families find quality child care and education, 2) helping programs improve their
practices, and 3) helping children benefit from care and education that will prepare them for school
and life.
From the Parent Aware Validation Study conducted by our external evaluator, Child Trends, we
learned that Parent Aware is a key strategy in addressing Minnesota’s persistent achievement gap.
Specifically,
Children in Parent Aware‐rated programs are acquiring skills they need to be ready for school.
Children from families with lower incomes, in Parent Aware‐rated programs, improved at a faster rate than children from families with higher incomes, in the areas of early math skills, language and literacy, executive function, social competence and persistence.
Results of analyses on observed program quality and children’s development provide positive support for the validity of the Parent Aware ratings in supporting meaningful quality differences that are related to children’s development in expected ways.
Today, over 82,000 Minnesota children, age birth to 5, are served in Parent Aware‐rated programs,
including many children with high needs attending highly rated programs. This impact is made more
powerful because of the policy and program linkages fostered by this grant to increase access to
quality early learning experiences through the Early Learning Scholarship program and higher child
care subsidy rates for higher quality care as defined by a Three‐ or Four‐Star Parent Aware Rating.
Almost all children served in state‐funded preschool, Early Head Start and Head Start, and programs
funded under Title I of the ESEA are in programs rated in the top tier of Parent Aware. In addition,
substantial progress has been made in increasing the percentage of children receiving child care
subsidies who are served in programs with a Three‐ or Four‐Star Rating, increasing from 20 percent
prior to the start of the grant to 44 percent in December 2016.
This significant accomplishment is due to the increased participation of early learning programs in
Parent Aware and easy access for parents to information on how to find quality early care and
education and to help programs improve practices, as well as state policy providing enhanced child
care subsidies to eligible children attending higher quality‐rated programs. Approximately 2,800
programs, or 25 percent of all eligible programs, are rated or scheduled to be rated. This milestone
has been reached through intensive recruitment and supports targeted to the specific needs of many
early learning and development programs. For example, to earn a Parent Aware rating, specific
training is required and child care providers speaking languages other than English encountered
barriers to completing this training. In 2016, Parent Aware training was offered in many languages,
28
including approximately 200 trainings offered in Spanish, Somali, Oromo, Arabic, Karen, Bhutanese
and Amharic.
Parents now also find easy‐to‐understand information on most early learning programs on
www.parentaware.org, an online search tool that displays information on ratings as well as a range of
other resources for finding programs to meet the needs of their child and family. ParentAware.org
has more than 9,000 visitors per month and will soon meet the consumer education requirements of
the Child Care Development Block Grant Act of 2014 to provide a single, consumer‐friendly website
for parents. This website was developed through a public‐private partnership created as part of the
RTT‐ELC plan.
In addition to the important findings from the 2016 Parent Aware Validation Study, other ongoing and
periodic data analysis provide information about program participation rates that continue to shape
Minnesota’s strategies to maintain and further enhance efforts to recruit programs into Parent Aware
and support them through the rating process. We see that program participation rates vary by type of
program, including:
Very high participation by school‐based preschool programs and Head Starts (over 90 percent).
High participation among accredited child care (over 65 percent).
Non‐accredited child care centers participated at a greater rate (20 percent) than family child care (12%), although family child care participation continues to grow steadily.
From yearly surveys conducted by Child Trends of currently‐rated programs, we have learned that
reasons for joining Parent Aware vary by program type. Head Start, school‐based preschool and
accredited child care rank access to Early Learning Scholarships as the most important reason for
seeking a Parent Aware rating. Non‐accredited child care programs seek Parent Aware ratings for
different reasons, ranking professional development and professionalism as the most important
motivations for participating. Indeed, 90 percent of these child care programs have an overall positive
impression of Parent Aware.
Additional key accomplishments during the grant period and our no‐cost extension year include major
final enhancements to our data system, Develop, that plays the dual role of supporting administration
of Parent Aware Ratings as well as our Professional Development Registry and completing an
intensive review and revision of the Parent Aware Rating Tool’s Standards and Indicators to both
simplify some aspects of our quality measures as well as further strengthen and add measures that
make the biggest difference for children.
Informed by surveys, data analysis and cross‐sector partnerships, Minnesota has and will continue to
refine messaging, incentives, and recruitment strategies to continue to grow Parent Aware program
participation, strengthen program best practices and increase access for children to early learning
programs into the future.

29
Developing and adopting a common, statewide Tiered Quality Rating and Improvement System (TQRIS) (Section B(1) of Application).
Please check all that apply – The State’s TQRIS is based on a statewide set of tiered Program Standards that address or are aligned with:
☒Early learning and development standards
☒A comprehensive assessment system
☒Early childhood educator qualifications
☒Family engagement strategies
☒Health promotion practices
☒Effective data practices
Describe progress made during the reporting year and across all five years of grant
implementation in developing or revising a TQRIS that is based on a statewide set of tiered
Program Standards.
Minnesota completed the work of revising its TQRIS standards in 2016. As described in past Race to
the Top – Early Learning Challenge Grant Annual Performance reports, the revision process was
informed by the 2016 Parent Aware Validation Study, public input, a crosswalk of standards across
program types, and input from content experts.
A cross‐agency Indicator Review Team, representing staff from the Departments of Human Services,
Education, and Health, continued meeting throughout 2016 to finalize changes to the TQRIS
standards. An announcement of changes was sent to Parent Aware‐rated programs in October 2016,
and the updated standards were released in December 2016. The revised standards and indicators
place a stronger emphasis on best practices we know make the biggest difference for children and
improve how participating programs demonstrate they are using these best practices, including
making some processes for documenting program quality more flexible. In addition, the revised
standards and indicators better articulate Parent Aware’s goals and the reasons these best practices
can have an impact on outcomes for Minnesota’s children.
Race to the Top supported an indicator revision process that will be used going forward based on a
shared commitment to continuously improve the Parent Aware Rating System, standards and
indicators. The final set of revised TQRIS standards can be found on the Department of Human
Services website. Link to standards: https://edocs.dhs.state.mn.us/lfserver/Public/DHS‐6346B‐ENG

30
Promoting Participation in the TQRIS (Section B(2) of Application)
Describe progress made during the reporting year and across all five years of grant
implementation in promoting participation in the TQRIS. Please describe the State's strategies
to ensure that measurable progress was made in this area by the end of the four‐year grant
period and the No‐Cost Extension period.
31
Minnesota made significant progress in increasing the market penetration of TQRIS during the
reporting year and across all five years of the grant. After a pilot in nine counties from 2007 to 2011,
Parent Aware began a statewide rollout in 2012. From the beginning, all Head Start programs, public
school readiness programs, and accredited child care programs were eligible to participate in the
Accelerated Pathway to Rating (APR), regardless of location. For child care programs participating
through the full rating process, eligibility was rolled out gradually starting with counties with the
highest concentrations of children with high needs. Rollout started with eight counties in 2012.
Another 14 counties were added in 2013, and another 23 counties were added in 2014. For the
remaining 42 counties, the earliest date that a non‐accredited child care program could receive a
rating was June 30, 2015. Parent Aware has been available statewide for two years. Data show that
participation rates in Parent Aware are directly correlated with the number of years the programs
have had access to it. Time is an important variable in ensuring measurable progress.
Recruitment of licensed child care programs, both accredited and non‐accredited, is a contract
responsibility of Child Care Aware, Minnesota's child care resource and referral system. This system is
charged with collaborating with a variety of partners to prioritize the recruitment of programs that
serve children receiving child care assistance and coordinate unified messaging to programs on the
benefits of participating in Parent Aware. Five Parent Aware recruiters are now embedded as part of
the implementation model for Parent Aware, using federal CCDBG quality funds.
The Minnesota Department of Education (MDE) is responsible for recruiting state‐funded preschool
programs, Early Head Start and Head Start Programs, Programs funded by IDEA, Part C and Part B,
section 619, and charter schools. Recruitment activities include presentations to programs at
statewide conferences, visits to local school districts and Head Start programs, inclusion of Parent
Aware rating information with other communications to school districts and Head Starts and one‐on‐
one follow‐up. The Department of Education is also responsible for providing technical assistance to
these programs during the rating process. Across all five years of the grant, programs funded by IDEA,
Part C and Part B, section 619 lagged. These programs will no longer be eligible to participate in
Parent Aware beginning July 1, 2017. Services for children with special needs are integrated into
school based preschool programs and rating for these programs will be part of the existing public
school rating.
The private non‐profit Parent Aware for School Readiness (PASR) collaborated with DHS and MDE on
the parentaware.org website, which connects parents to a database of more than 12,000 programs.
Since launching in August 2014, ParentAware.org has seen incredible growth. Examining website user
analytics from September 2014 through September 2016, Minnesota has seen:
The number of visitor sessions increase each year, totaling more than 380,000 sessions and 221,000 new and returning visitors.
Visitors digging into their searches, with 73 percent of all page views relating to search and users averaging more than five minutes per visit.
The website as a reliable resource, with 42 percent of visitors returning.
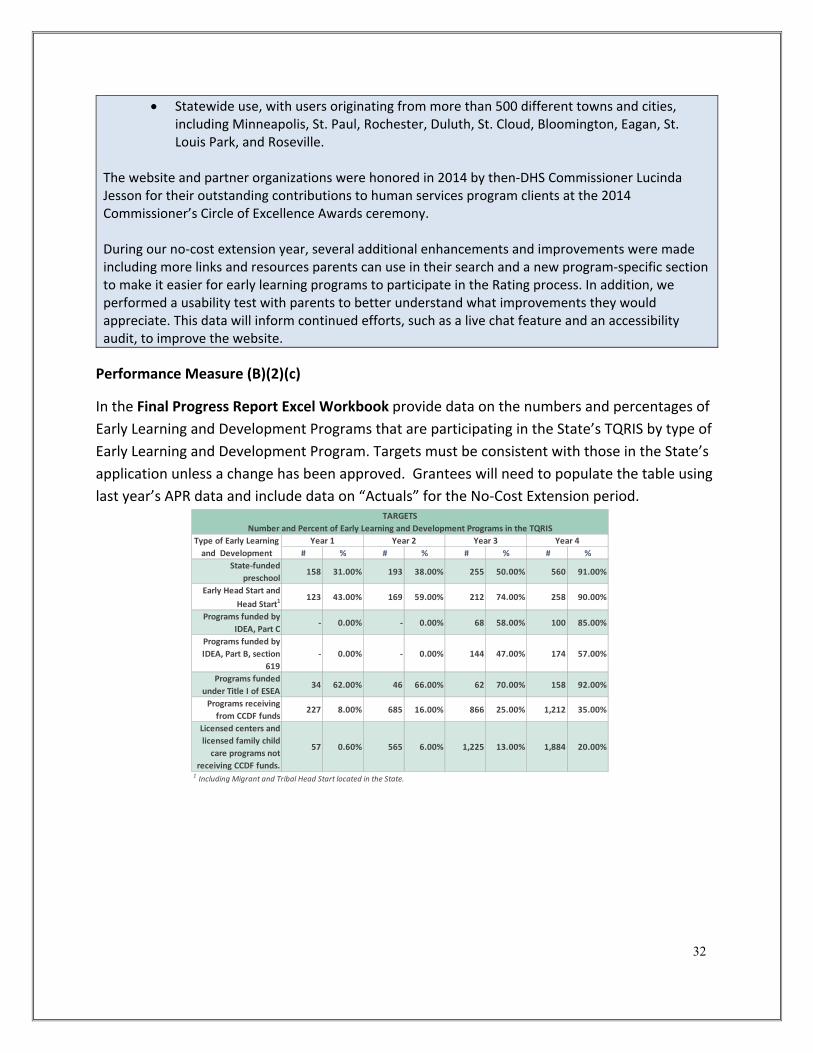
32
Statewide use, with users originating from more than 500 different towns and cities, including Minneapolis, St. Paul, Rochester, Duluth, St. Cloud, Bloomington, Eagan, St. Louis Park, and Roseville.
The website and partner organizations were honored in 2014 by then‐DHS Commissioner Lucinda Jesson for their outstanding contributions to human services program clients at the 2014 Commissioner’s Circle of Excellence Awards ceremony. During our no‐cost extension year, several additional enhancements and improvements were made including more links and resources parents can use in their search and a new program‐specific section to make it easier for early learning programs to participate in the Rating process. In addition, we performed a usability test with parents to better understand what improvements they would appreciate. This data will inform continued efforts, such as a live chat feature and an accessibility audit, to improve the website.
Performance Measure (B)(2)(c)
In the Final Progress Report Excel Workbook provide data on the numbers and percentages of
Early Learning and Development Programs that are participating in the State’s TQRIS by type of
Early Learning and Development Program. Targets must be consistent with those in the State’s
application unless a change has been approved. Grantees will need to populate the table using
last year’s APR data and include data on “Actuals” for the No‐Cost Extension period.
# % # % # % # %
State‐funded
preschool 158 31.00% 193 38.00% 255 50.00% 560 91.00%
Early Head Start and
Head Start1 123 43.00% 169 59.00% 212 74.00% 258 90.00%
Programs funded by
IDEA, Part C ‐ 0.00% ‐ 0.00% 68 58.00% 100 85.00%
Programs funded by
IDEA, Part B, section
619
‐ 0.00% ‐ 0.00% 144 47.00% 174 57.00%
Programs funded
under Title I of ESEA 34 62.00% 46 66.00% 62 70.00% 158 92.00%
Programs receiving
from CCDF funds 227 8.00% 685 16.00% 866 25.00% 1,212 35.00%
Licensed centers and
licensed family child
care programs not
receiving CCDF funds.
57 0.60% 565 6.00% 1,225 13.00% 1,884 20.00%
1 Including Migrant and Tribal Head Start located in the State.
Type of Early Learning
and Development
Year 2 Year 3Year 1
TARGETS
Number and Percent of Early Learning and Development Programs in the TQRIS
Year 4
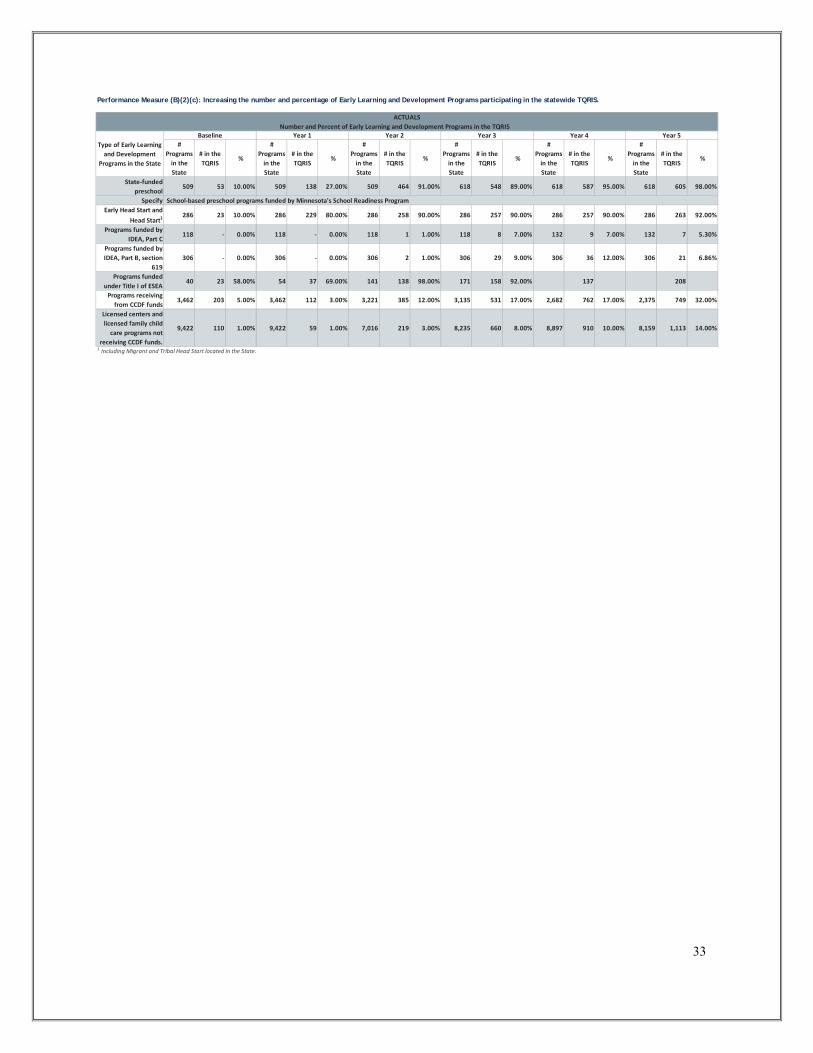
33
Performance Measure (B)(2)(c): Increasing the number and percentage of Early Learning and Development Programs participating in the statewide TQRIS.
Number and Percent of Early Learning and Development Programs in the TQRIS
#
Programs
in the
State
# in the
TQRIS%
#
Programs
in the
State
# in the
TQRIS%
#
Programs
in the
State
# in the
TQRIS%
#
Programs
in the
State
# in the
TQRIS%
#
Programs
in the
State
# in the
TQRIS%
#
Programs
in the
State
# in the
TQRIS%
State‐funded
preschool 509 53 10.00% 509 138 27.00% 509 464 91.00% 618 548 89.00% 618 587 95.00% 618 605 98.00%
Specify
Early Head Start and
Head Start1 286 23 10.00% 286 229 80.00% 286 258 90.00% 286 257 90.00% 286 257 90.00% 286 263 92.00%
Programs funded by
IDEA, Part C 118 ‐ 0.00% 118 ‐ 0.00% 118 1 1.00% 118 8 7.00% 132 9 7.00% 132 7 5.30%
Programs funded by
IDEA, Part B, section
619
306 ‐ 0.00% 306 ‐ 0.00% 306 2 1.00% 306 29 9.00% 306 36 12.00% 306 21 6.86%
Programs funded
under Title I of ESEA 40 23 58.00% 54 37 69.00% 141 138 98.00% 171 158 92.00% 137 208
Programs receiving
from CCDF funds 3,462 203 5.00% 3,462 112 3.00% 3,221 385 12.00% 3,135 531 17.00% 2,682 762 17.00% 2,375 749 32.00%
Licensed centers and
licensed family child
care programs not
receiving CCDF funds.
9,422 110 1.00% 9,422 59 1.00% 7,016 219 3.00% 8,235 660 8.00% 8,897 910 10.00% 8,159 1,113 14.00%
1 Including Migrant and Tribal Head Start located in the State.
Year 5
ACTUALS
Type of Early Learning
and Development
Programs in the State
Baseline Year 1 Year 2 Year 3 Year 4
School‐based preschool programs funded by Minnesota's School Readiness Program
34
(B)(2)(c) Data Notes State‐funded preschool: The 2016 numbers are the number of School Readiness‐funded school‐based preschool sites rated as of December 31, 2016, as verified by both the Develop Database and the records at the Department of Education. In Minnesota, there are 43 additional school‐based pre‐K programs operating without state School Readiness funding, which includes 20 charter school‐based pre‐K programs. These programs are eligible for ratings if they are meeting School Readiness standards. These programs are not included in this count because they do not meet the state definition of “state‐funded preschool” as defined in the grant application and in previous Annual Performance Reports. Head Start and Early Head Start: The 2016 numbers are based on the number of Head Start/Early Head Start sites rated as of December 31, 2016, as verified by both the Develop Database and the records at the Department of Education. Programs funded by IDEA Parts B and C: For programs funded by IDEA Parts B and C, the total number of programs in the state was pulled from the Minnesota Department of Education’s ORG data system, which tracks Part C and preschool special education programs that have signed Statements of Assurances for FFY2014. That list of programs was then compared to the list of programs rated in the TQRIS as of December 31, 2016. Unlike all other program types, Early Childhood Special Education programs are rated at the district level rather than at the site level. Sixteen Districts are Part B only; five Districts are B and C; two Districts are Part C only. Programs funded under Title I of ESEA: The 2016 numbers are based on the number of ELD sites in school districts identified through agency financial reporting systems as using Title I funds for preschool in SFY2016, and that were also in the TQRIS as of December 31, 2016. Programs receiving from CCDF Funds: The count of programs receiving CCDF funds were pulled from Minnesota’s administrative data system (MEC2) for programs paid for service in the month of October 2016. Reporting October service data allows most provider bills to be submitted and paid by the time the counts are pulled for February reporting. The count represents the number of Minnesota and tribally licensed family and center‐based child care providers paid for caring for at least one child aged 0‐5 and not yet in kindergarten. The count of programs participating in Parent Aware includes the sub‐set of those programs that were rated in Parent Aware (as of December 31, 2016). Other (Licensed child care centers and family child care providers not receiving CCDF funds): There are 10,534 licensed child care programs in the state of Minnesota as of January 10, 2017. Of those, 2,375 receive CCDF funding and 8,159 do not. Of the 8,159 licensed child care programs that do not receive CCDF funds, 1,113 were rated in the TQRIS as of December 31, 2016.
Rating and monitoring Early Learning and Development Programs (Section B(3) of Application).
Describe the State’s progress made in developing and enhancing a system for rating and
monitoring the quality of Early Learning and Development Programs that participate in the
TQRIS during the reporting year and across all five years of grant.
35
Parent Aware for School Readiness (PASR) collaborated with DHS and MDE on the parentaware.org website, which connects parents to a database of more than 12,000 programs. Search results feature programs with Parent Aware ratings, helping families easily identify those that are using research‐based best practices in school readiness. The online search tool enables parents to search for programs by location, schedule, education quality and types of care. Looking ahead, the site will meet the consumer education requirements of the Child Care Development Block Grant Act of 2014 to provide families with a single, searchable, consumer‐friendly website containing information on program quality and health and safety standards. By having parents seeking early childhood education and care programs through the website and providing them with information about program quality, we leverage market pressure to encourage programs to volunteer for Parent Aware rating. Ongoing enhancements to the parentaware.org website have led to improving the Parent Aware system implementation. During our no‐cost extension year, several additional enhancements and improvements were made including more links and resources parents can use in their search and a new program‐specific section to make it easier for early learning programs to participate in the rating process. In addition, we performed a usability test with parents to better understand what improvements they would appreciate. This data will inform continued efforts, such as a live chat feature and an accessibility audit, to improve the website. Another key element to enhancing Parent Aware is monitoring. Minnesota has made considerable progress in embedding inter‐rater reliability practices in the standard work of monitoring the quality of Early Learning and Development programs. During the reporting period and across all five grant years, Minnesota has engaged in continuous quality improvement processes that included rigorous and on‐going training of monitors resulting in accurate and streamlined inter‐rater reliability processes that are built into the workflow features of Develop, the data system that administers Parent Aware ratings. It has made the process efficient, standardized and fair, and allowed for the establishment of inter‐rater reliability for programs applying for an accelerated rating. Inter‐rater reliability was also built between CLASS Observers whose CLASS score was part of the rating. Over the past five years, Minnesota has continued to meet or exceed the 85 percent benchmark for inter‐rater reliability in Parent Aware Ratings and CLASS observations. In 2016, inter‐reliability was 91 percent and 100 percent, respectively. We will continue to monitor our progress every six months and require contractors to provide tailored training to ensure the benchmark is met.
Promoting access to High‐Quality Early Learning and Development Programs for Children with High Needs (Section B(4) of Application).
Please check all that apply – The State has made progress in improving the quality of the Early
Learning and Development Programs that are participating in your State TQRIS through the
following policies and practices:
☒ Program and provider training
☒ and provider technical assistance
36
☒ Financial rewards or incentives
☒ Higher, tiered child care subsidy reimbursement rates
☐Increased compensation
Describe the progress made improving the quality of the Early Learning and Development Programs that are participating in your State TQRIS during the reporting year and across all five years of grant implementation based on the policies and practices above.

37
Overall, Minnesota has made progress improving the quality of programs participating in the TQRIS
throughout the duration of the grant. The state has also created increased participation through
financial incentives such as increased Child Care Assistance Program reimbursement rates and Early
Learning Scholarships.
The state has grown participation in a voluntary system from 529 in 2012 to 2,635 at the end of 2016.
With the conclusion of the Race to the Top – Early Learning Challenge grant, the Department of
Human Services intends to continue to offer free or low‐cost training, free coaching and technical
assistance and financial incentives. Additionally, tiered reimbursement of the Child Care Assistance
Program subsidy will continue 15 percent above the base rate for Three Star programs and 20 percent
for a Four Star programs.
Another financial incentive for Parent Aware participation are Early Learning Scholarships provided to
families to financially support access to programs holding a higher Parent Aware rating. The goal of
the state’s plan in Race to the Top was to learn from pilot programs in each Transformation Zone to
inform a statewide program that could accommodate local challenges and meet individual needs of
families. Transformation Zones implemented Early Learning Scholarships in each community as
determined by locally designed plans.
External evaluator SRI International completed and delivered a final implementation evaluation of
Early Learning Scholarships. Transformation Zones reported benefits that include: greater continuity
of care, increased hours for children previous in care, and more children transitioning to higher
quality care. Based on the use of child level assessments beginning in the fall of 2014 with 4‐year‐olds
receiving scholarships, and a follow‐up assessment in the spring of 2015, the report finds that children
receiving scholarships attending Parent Aware Rated programs showed growth through the pre‐
kindergarten year. The report also found that awarded children attending higher quality programs
made gains that moderately exceeded a similar group of children in lower rated programs as
evaluated in a range of school readiness domains. Transformation Zone staff worked with local
scholarship administrators to ensure any children funded by Race to the Top grant dollars were
transitioned to state‐funded scholarships as the grant ended. State funding for Early Learning
Scholarships increased significantly during the RTT grant period to approximately $58 million in the
current biennium, providing state funds to sustain and expand the Early Learning Scholarship
Program.
During this reporting year, the Minnesota Legislature allocated 2 million dollars in one‐time funding to
support the free and low‐cost training for Parent Aware and to continue financial supports for rated
and participating programs. This funding will help sustain the TQRIS implementation model initially
funded with Race to the Top – Early Learning Challenge grant funding. Additionally, the law directing
the implementation of Early Learning Scholarships changed to allow families to use their scholarship
only at a Three‐ or Four‐Star Rated program.

38
For additional information on progress made on program and provider training to support programs
getting ready for or participating in Parent Aware, see progress described in the Great Early Childhood
Workforce section.
Performance Measures (B)(4)(c)(1) and (2)
In the Final Progress Report Excel Workbook, provide data on the number of Early Learning and Development Programs in the top tiers of the TQRIS. Targets must be consistent with those in the State’s application unless a change has been approved.
In the Final Progress Report Excel Workbook, provide data on the number and percentage of children with high needs who are enrolled in Early Learning and Development Programs in the top tiers of the TQRIS. Targets must be consistent with those in the State’s application unless a change has been approved.
Year 1 Year 2 Year 3 Year 4 Baseline Year 1 Year 2 Year 3 Year 4 Year 5
654 1,491 2,610 3,700 393 529 1,322 1,892 2,434 2,663
Number of Programs
in Tier 1 40 150 300 450 4 30 68 227 415 268
Number of Programs
in Tier 2 70 250 500 750 24 16 135 268 366 397
Number of Programs
in Tier 3 90 350 700 1,050 64 5 26 72 146 289
Number of Programs
in Tier 4 454 741 1,110 1,450 301 478 1,093 1,325 1,507 1,709
Total Number of
Programs Enrolled in
the TQRIS
TARGETS ACTUALS
Performance Measure (B)(4)(c)(1): Increasing the number of Early Learning and Development Programs in the top tiers of the TQRIS.

39
# % # % # % # %
State‐funded
preschool 7,228 31.00% 8,860 38.00% 11,658 50.00% 25,189 96.00%
Early Head Start and
Head Start1 6,997 50.00% 8,797 62.00% 10,297 73.00% 11,890 95.00%
Programs funded by
IDEA, Part C ‐ 0.00% ‐ 0.00% 1,253 25.00% 2,507 50.00%
Programs funded by
IDEA, Part B, section
619
‐ 0.00% ‐ 0.00% 2,754 25.00% 4,958 45.00%
Programs funded
under Title I of ESEA 1,854 57.00% 2,579 61.00% 3,488 66.00% 4,690 71.00%
Programs receiving
from CCDF funds 4,261 21.00% 4,870 24.00% 6,088 30.00% 8,117 40.00%
1 Including Migrant and Tribal Head Start located in the State.
Number and percentage of Children with High Needs in programs in top tiers of the TQRIS
Type of Early Learning
and Development
Program in the State
Year 2 Year 3 Year 4
Performance Measure (B)(4)(c)(2): Increasing the number and percentage of Children with High Needs who are enrolled in Early Learning and Development Programs that are in the top tiers of the TQRIS.
Year 1
TARGETS
# Children
with High
Needs
served by
programs
in the
State
# in the
TQRIS%
# Children
with High
Needs
served by
programs
in the
State
# in the
TQRIS%
# Children
with High
Needs
served by
programs
in the
State
# in the
TQRIS%
# Children
with High
Needs
served by
programs
in the
State
# in the
TQRIS%
# Children
with High
Needs
served by
programs
in the
State
# in the
TQRIS%
# Children
with High
Needs
served by
programs
in the
State
# in the
TQRIS%
State‐funded
preschool 23,317 2,857 12.00% 23,317 7,401 32.00% 26,108 21,489 82.00% 26,238 24,818 95.00% 27,886 26,748 96.00% 29,642 28,875 97.00%
Specify
Early Head Start and
Head Start1 14,096 3,397 24.00% 14,096 11,163 79.00% 12,435 11,747 94.00% 12,435 11,743 94.00% 12,435 12,017 97.00% 12,435 11,873 95.00%
Programs funded by
IDEA, Part C 5,013 ‐ 0.00% 5,027 ‐ 0.00% 5,162 ‐ 0.00% 5,449 386 7.00% 5,524 433 8.00% 5,736 241 4.20%
Programs funded by
IDEA, Part B, section
619
11,017 ‐ 0.00% 11,102 ‐ 0.00% 10,865 14 0.00% 11,076 967 9.00% 11,399 1,144 10.00% 11,875 791 6.60%
Programs funded
under Title I of ESEA 2,246 1,182 53.00% 3,252 1,812 56.00% 4,989 4,936 99.00% 10,956 10,150 93.00% 6,457 5,900 91.00% 7,876 7,836 99.49%
Programs receiving
from CCDF funds 20,292 4,049 20.00% 20,292 2,395 12.00% 18,152 5,150 28.00% 17,233 5,261 31.00% 16,504 6,001 36.00% 16,323 7,231 44.00%
1 Including Migrant and Tribal Head Start located in the State.
Year 5
ACTUALS
Year 2 Year 3 Year 4
Performance Measure (B)(4)(c)(2): Increasing the number and percentage of Children with High Needs who are enrolled in Early Learning and Development Programs that are in the top tiers of the TQRIS.
School‐based preschool programs funded by Minnesota's School Readiness Program
Number and percentage of Children with High Needs in programs in top tiers of the TQRIS
Type of Early Learning
and Development
Programs in the State
Baseline Year 1
40
Data Notes For purposes of Performance Measure (B)(4)(c)(2), highest tiers are those programs that receive a
Three‐ or Four‐Star Rating.
(B)(4)(c )(1) Minnesota’s TQRIS was rolled out statewide over the course of the Race to the Top – Early Learning Challenge grant. All licensed child care programs were first eligible to participate in 2015. In 2016, there were 11,746 ELD programs (sites) in the state eligible to participate in Minnesota's TQRIS. This total includes 8,825 licensed family child care providers, 1,503 licensed child care centers (excluding licensed Head Start/Early Head Start sites/School based sites), 286 Head Start/Early Head Start sites, 118 districts funded by IDEA Part C, 306 districts funded by IDEA Part B, and 754 state‐funded preschool sites. In addition, but not included in the total, the TQRIS is available to an unknown number of school‐based preschool sites that are funded with alternative (non‐state) funds, and an unknown number of tribally licensed child care providers. Data on licensed child care providers comes from Minnesota's Licensing Lookup database as of January 10, 2017. The data sources for Head Start/Early Head Start sites, programs funded by IDEA Part C, programs funded by IDEA Part B, and state‐funded preschool are explained in the notes for Table B2c. The 2016 count of rated programs comes from Develop, Minnesota’s Quality Improvement and Registry Tool, and includes all programs with an active rating as of December 31, 2016. The total number of Parent Aware rated programs as of December 31, 2016, was 2,663. In other words, Minnesota reached 72 percent of its target of 3,700 rated programs. While the distribution of ratings is not as predicted, participation is continuing to increase by about 300 programs per year. (B)(4)(c )(2) For state‐funded preschool, the total number of children with high needs served comes from the Minnesota Department of Education's School Readiness Annual Report 2015‐2016 and includes only those children receiving more than 30 hours of service/involvement annually. The number of children who are served in programs/sites that are rated by Parent Aware as of December 31, 2016, is the same pool of children, but includes only those who were served in programs/sites that were rated by Parent Aware as of December 31, 2016. Since state‐funded preschool programs are eligible only for Four‐Star ratings, all rated programs are in the top tiers. In Minnesota, there are additional school‐based pre‐K programs operating without School Readiness funding. These programs are eligible for ratings if they are meeting School Readiness standards. We rated 43 such programs (sites) in 2016. We are not including children served in those programs in this count because we do not have data on whether those children meet the definition of children with high needs. For Early Head Start and Head Start, The total number of children with high needs served comes from data pulled from the Minnesota Head Start Funded Enrollment report for SFY2016 as reported to the Minnesota Department of Education by programs receiving Head Start funds. The count includes only children served in the following settings: center‐based, combination sites, family child care, and child care centers. It does not include home‐based settings. Since Head Start programs are eligible only for Four‐Star ratings, all rated programs are in the top tiers. For programs funded by IDEA Parts B and C, data comes from the Minnesota Department of Education.
41
For programs funded under Title I of ESEA, The total number of children served per Title I program in SFY2016 was collected from school districts via the same survey used in previous years and follow‐up phone calls. Numbers reflect the children being served by rated Title I programs that are also receiving Title I pre‐K Incentives. For programs receiving CCDF funds, the count of children receiving CCDF funds were pulled from Minnesota’s administrative data system (MEC2) for the children receiving service in the month of October 2015. Reporting October service data allows most provider bills to be submitted and paid by the time the counts are pulled for February reporting. The count represents the number of children aged 0‐5 and not yet in kindergarten, on whose behalf CCDF funds were paid to licensed child care programs that were rated in the top tiers of the TQRIS as of December 31, 2016.
Validating the effectiveness of the State TQRIS (Section B(5) of Application).
Describe progress made during the reporting year, and across all five years of grant
implementation, in validating the effectiveness of the TQRIS during the reporting year and
across all five years of grant implementation, including the State’s strategies for determining
whether TQRIS tiers accurately reflect differential levels of program quality and assessing the
extent to which changes in ratings are related to progress in children’s learning, development,
and school readiness. Describe the State’s strategies to ensure that measurable progress was
made by the end of the four‐year grant and No‐Cost Extension period.

42
As a part of Minnesota’s investment in building high‐quality, accountable programs, Minnesota
planned and completed a series of evaluation studies to validate the effectiveness of Parent Aware
during the grant period. These evaluation efforts focused on four goals: assess the effectiveness of
the Parent Aware indicators, determine whether quality is differentiated between star levels, explore
the linkage between star levels and child outcomes, and determine the effectiveness of quality
improvement supports for Parent Aware‐participating programs. All evaluation studies were carried
out by Child Trends, an external evaluator, and addressed six specific evaluation questions.
Evaluation Question 1: How is implementation proceeding?
Child Trends reviewed the implementation of Parent Aware across multiple years of the grant,
including exploring marketing activities, quality improvement supports for programs, recruitment and
retention of programs and the rating process. Perceptions of how Parent Aware is working for
participating programs and families were collected through surveys and interviews.
The use of the online search tool was evaluated each year of the grant. The website has seen growth
in usage from 16,526 unique visitors in its first year to 221,000 unique visitors in 2016.
Key findings from an initial survey of participating programs included coaching as a key initial support,
as well as a support needed during the rating process. Quality improvement grant funds were a
support, but grant guidelines were perceived as too restrictive. Low cost trainings supported reaching
the required training indicators. Many programs felt they needed a longer time to meet Parent Aware
requirements before becoming rated.
Key findings from the second year of implementation found that the coaching model needed to be
more prescriptive in how time was used and that some struggling programs may need additional
coaching supports.
Evaluation Question 2: Is quality improving in Parent Aware‐Rated programs?
The evaluator conducted observations measuring the quality of the environment and teacher‐child
interactions in rated programs to understand how program quality changed over time and whether
these changes aligned with improvements in Parent Aware ratings.
Key findings from the third year of implementation showed that the majority of programs were able
to increase their Star‐Level Rating (over 70 percent) if not already in the top rating level. During the
second rating period, family child care providers earned the most points in Assessment of Child
Progress category.
In grant year four, Child Trends examined programs rated via the full‐rating process, reviewing the distribution of ratings and the change in Star‐Levels over time. The findings included:
The proportion of child care centers and family child care providers receiving One‐ or Two‐Star Ratings decreased as they received their second or third rating. The number of programs receiving Three‐ or Four‐Star Ratings increased.
Over 70 percent of programs were able to increase their Star‐Level Rating over time.
43
60 percent of family child care providers increased their rating by one Star level. 41 percent of child care centers increased their rating by one Star level, and eleven
percent increased their rating by two Star levels.
Providers increased their points scored in the Parent Aware Rating Tool most often in the following areas: Teaching and relationships Assessment of child progress Teacher training and education
Evaluation Question 3: How is children’s development related to Parent Aware Ratings?
Child Trends released a final Parent Aware Validation Report in February 2016. The study collected
data on the observed quality of programs (using the ECERS‐R, FCCERS‐R, CLASS, and ECERS‐E) and also
collected assessments from children in the fall and spring of their pre‐kindergarten year (using the
TOPEL, IGDIs, Woodcock Johnson Applied Problems, Peg Tap, Preschool Learning Behavior Scales,
Body Mass Index, Social Competence and Behavior Evaluation 30, and the Bracken School Readiness
Composite). The validation study shows that programs with higher ratings score better on some
measures of observed quality than do lower‐rated programs. Similarly, children served in higher‐rated
programs show greater growth on some measures of child development than do children served in
lower‐rated programs.
Evaluation Question 4: How effective are the quality indicators and rating structure used in Parent
Aware Ratings?
Child Trends conducted a validation of the Parent Aware indicators and rating structure to assess the
extent to whether Parent Aware is capturing program quality accurately and reliably.
In grant year two, program perceptions of the Environmental Self‐Assessment, one of the Rating Tool
indicators, were collected. Child Trends reported that both teachers and providers had a higher level
of comfort with more basic, developmentally appropriate practices and environmental practices
compared to more complex practices. Family child care provider perceptions correlated directly with
the Star‐Level received.
Evaluation results included key findings related to required training indicators and based on provider
perceptions about barriers to meeting these indicators. These barriers included lack of access to
training on assessment tools/curricula, time off for staff or reimbursement of staff time, lack of access
to required training in rural communities, understanding the alignment of trainings to Parent Aware
Indicators, and need for training offered in additional languages.
A follow‐up from the Year 2 Implementation Report: Initial Analysis of Parent Aware Indicators found
that, among Two‐Star Rated programs, the majority of family child care providers and child care
centers met all indicators. Both child care centers and family child care providers struggled with
sharing observation summaries with families. Family child care providers also had difficulty meeting
44
indicators about using lesson plans and using daily schedules. Child care centers had difficulty
meeting indicators related to family supports.
Among Three‐ and Four‐Star Rated programs, the majority of family child care providers and child
care centers were able to receive points for most indicators. Most common unmet/undocumented
indicators were:
Family child care providers:
Communicating in home languages.
Providing child assessment outcomes.
Using child assessment outcomes to develop lesson plans and individualized goals.
Child care centers:
Director’s credential.
Conducting assessments with an approved tool.
Using child assessment data to develop lesson plans and individualize goals.
A lead education staff with minimally 24 credits in Early Childhood Education/Child Development.
CLASS Instructional Support scores are a requirement of Three‐ and Four‐Star Rated programs. For a
Three‐Star Rating, centers must achieve at least a 2.0 in the CLASS Instructional Support domain. The
Year Three implementation report found that those applying for a Three‐Star Rating had an
achievement rate of 94 percent. For a Four‐Star Rating, centers must achieve at least 2.5 in the CLASS
Instructional Support domain. Those applying for a Four‐Star Rating had an achievement rate of 82
percent.
In grant year three, the evaluator reviewed patterns of scoring for child care programs going through
the Full Rating Process. Key findings included:
88 percent of programs achieved or exceeded their selected Star‐Level goal.
Child assessment indicators were the most difficult for providers and teachers to achieve.
The number of indicators missed or not documented was correlated with provider type – family child care provider vs child care center.
Overall, while most indicators were found to be effectively measuring quality, weaknesses in the
Rating Tool were identified. In response, the way the indicators are weighted was adjusted, and some
stronger indicators were added. The update to the Parent Aware Standards and Indicators has been
released and will be implemented in July 2017. Additionally, the rating process for Head Start
programs will be updated to provide an automatic rating option for this program type. This decision
was based on findings from the validation study and a review of the rigorous monitoring process used
by the federal Office of Head Start. The changes in the rating process for Head Start will also go into
effect in July 2017.

45
Evaluation Question 5: What are parents’ perceptions of Parent Aware Ratings?
Child Trends surveyed parents with children in Parent Aware‐Rated programs to assess their
experiences with Parent Aware and found the following key results:
The parents who completed the interview are largely White/Caucasian (78 percent) and more than
half (57 percent) have a Bachelor’s degree or higher. This makes their education level as a group
higher than the Minnesota adult population in general (33 percent). Prior to the launch of the new
ParentAware.org website, most parents (71 percent) reported knowing about a website where they
can find a list of child care providers, but fewer (41 percent) knew of a website that provides
information about child care quality.
Parents most commonly heard of their child’s care arrangement through a friend/family member or
neighbor (30 percent) and the internet (12 percent).
A program’s quality was the top reason that parents (34 percent) selected their child’s care
arrangement, followed by its proximity to their home (11 percent). These were the top reasons during
the Parent Aware pilot parent interview (25 percent and 16 percent, respectively), but during the
focus groups held at a later date, more parents’ list quality as their top reason.
Evaluation Question 6: How is Parent Aware contributing to Minnesota’s early care and education
system?
The evaluation addressed the role of Parent Aware and the Race to the Top – Early Learning Challenge
grant in supporting Minnesota’s early care and education system within each of the annual evaluation
reports. Key findings include:
Parent Aware has increased quality of child care and early education in Minnesota and created a
family friendly process to identify quality early learning programs through the Parent Aware website.
Parent Aware participation has continued to grow over time. Starting with 668 programs in 2012,
adding almost 2,000 more by the end of 2016.
Minnesota has used Parent Aware Star‐Level Ratings to determine whether or not a program qualifies
for Early Learning Scholarships and a higher rate for quality through the Child Care Assistance
Programs (CCAP).
The Parent Aware website use has continued to grow, indicating that more people are using this to
search for quality child care and early education programs.
46
Focused Investment Areas ‐‐ Sections (C), (D), and (E)
Grantee needs to complete only those sections that correspond with the focused investment areas outlined in the grantee’s RTT‐ELC application and State Plan.
Focused Investment Areas
C. Promoting Early Learning Outcomes
Early Learning and Development Standards (Section C(1) of Application)
Describe the progress made in the reporting year and across all five years of grant implementation, including supports that are in place to promote the understanding of and commitment to the Early Learning and Development Standards across Early Learning and Development Programs. Please describe the State’s strategies to ensure that measurable progress was made in these areas by the end of the four‐year grant and the No‐Cost Extension period.
Minnesota had two sets of early learning standards when entering Race to the Top; one for birth to 3 and one for preschool (3‐5). Each set had one set of indicators designed for those exiting those age ranges. The Early Childhood Indicators of Progress (ECIPs): Minnesota’s Early Learning Standards were last revised in 2007 for the infant and toddler standards and 2005 for the preschool standards.
As part of the RTT‐ELC grant, Minnesota tried a new strategy which has worked very well. The state
revised the standards by domain. Domains include: approaches to learning; the arts; language,
literacy and communication; physical and movement; social emotional; and the cognitive domain was
broken into three domains: mathematics – cognitive; science thinking – cognitive; social systems –
cognitive. There was a separate committee for each domain and the eight committees functioned
Check the Focused Investment Areas addressed in your RTT‐ELC State Plan:
☒(C)(1) Developing and using statewide, high‐quality Early Learning and Development Standards.
☒(C)(2) Supporting effective uses of Comprehensive Assessment Systems.
☐(C)(3) Identifying and addressing the health, behavioral, and developmental needs of Children
with High Needs to improve school readiness.
☐(C)(4) Engaging and supporting families.
☒(D)(1) Developing a Workforce Knowledge and Competency Framework and a progression of
credentials.
☒(D)(2) Supporting Early Childhood Educators in improving their knowledge, skills, and abilities.
☒(E)(1) Understanding the status of children’s learning and development at kindergarten entry.
☒(E)(2) Building or enhancing an early learning data system to improve instruction, practices,
services, and policies.

47
over 3.5 years and included over 100 teachers, coaches, trainers, and administrators from school
districts, child care and Head Start. Higher education faculty and staff, content experts and national
reviewers have all been included on the committees and as researchers. Post‐doctoral students from
the University of Minnesota also contributed research to the work. All early childhood systems were
visible in the development of the standards and a variety of expertise and experts were included,
debated and incorporated. Involving this number and scope of participants has yielded a cadre of
professionals with an investment in seeing the standards used throughout the early childhood system
and in providers’ daily practice. For a review process, the ECIPs will now be revised on the same cycle
as the K‐12 content standards. This will ensure continued alignment, which supports consistent usage.
http://education.state.mn.us/MDE/dse/early/ind/
Our plan for a revised structure for the ECIPs began with the goal of improving usage. Minnesota now
has indicators of progress by annual age span, from birth to kindergarten entrance. This supports
teachers in understanding individual child development across domains and understanding that
child’s trajectory. It supports planning for that child by helping teachers think about the strengths the
child currently possesses and how to support the child to build on their already high‐level skills to
obtain additional skill or knowledge development. The aligned Kindergarten Academic Standards are
also in the core document for the appropriate domains, which increases the ability of pre‐K and
kindergarten teachers using the standards as a basis for meeting and planning child transitions.
The primary audience for the Minnesota ECIPs was defined as teachers, providers and all early
childhood staff. This encourages teachers to identify the standards as a professional document
developed specifically for them and the children they teach. Teachers also realize they are the
primary sharer of the standards with parents, community members and possibly policy makers.
http://education.state.mn.us/MDE/dse/early/ind/
When creating support documents and training for the ECIPs, Minnesota kept in mind the previous
promise – to increase usage. The state created a series of 13 briefs designed to help teachers
understand the opportunities they have for using standards. The topics of the briefs include using the
ECIPs: to support the intentional teaching cycle; with diverse communities; with dual language
learners; mixed age groupings; in lesson planning; in play and with parents. These are designed to also
be used by trainers. The six training modules the state developed is an introductory training for each
domain, using videos to encourage teachers and providers to explore the standards in that domain.
The trainings are designed to be delivered in‐person and support initial exploration of the standards.
They can also be adapted for online learning. These are being shared across agencies, so that schools,
Head Start and child care programs are being introduced to them in similar fashion. In addition, the
state has developed a tool for teachers to search the standards by domain, component,
subcomponent, and age range. Teachers can use this tool to familiarize themselves with the
standards, so they can easily explore an age range in a development area. For instance, a teacher
could sort the language and literacy standards for oral language for children ages 2‐5 and 3‐4.

48
We are working across systems to share the standards. The roll out work includes early childhood
conferences, state school district coordinator conference, school district trainings, early childhood
special education conferences, principal leadership institute, service cooperatives and other
opportunities. The departments of Education and Human Services are also working together to
incorporate the new standards in existing communications and trainings as well as the next revision of
the Parent Aware indicators.
Comprehensive Assessment Systems (Section C(2) of Application)
Describe the progress made during the reporting year and across all five years of grant implementation. Please describe the State’s strategies to ensure that measurable progress was made in these areas by the end of the four‐year grant and the No‐Cost Extension period.
Prior to Race to the Top, Minnesota had a variety of options to assess and improve programs and to
help parents and programs build on the best possible early learning and development experience for
children. Our charge through the grant was to tailor this system to best meet the needs of children
and improve system components to ensure greater coordination between the various existing
assessments.
Throughout the grant, Minnesota made considerable progress on the early childhood comprehensive
assessment system from a holistic standpoint driven from the ECIPs. From the context of measuring
what children are supposed to know and do, the state then created supports to ensure data drives
practices and children receive what they need to thrive. The state was also driven by cross‐agency
work to align assessment across initiatives. Minnesota implemented multiple online resources,
supports for training and coaching, and assisting schools and programs in building local capacity to
align developmentally appropriate assessments across the pre‐K through third grade continuum.
One prong of the comprehensive assessment system is improving early childhood developmental
screening which supports children's readiness for kindergarten and promotes health and
development. With Race to the Top funding, Minnesota piloted electronic access to the Ages & Stages
screening instruments in settings such as family home visiting, WIC clinics, early childhood screening,
primary care clinics and Early Head Start/Head Start. All pilot sites experienced a significant increase
in the number of children screened using the electronic system. The lessons learned from this
initiative will assist state and local agencies as we align these efforts with other state‐led early
identification initiatives, including the implementation of our expanded Help Me Grow system.
Another prong of the comprehensive assessment system is reviewing practices with learning
assessments identifying challenges and providing holistic solutions. Minnesota finalized a uniform
review criteria by which all early learning assessments for the kindergarten entry assessment,
voluntary pre‐kindergarten, early childhood special education (ECSE) and comprehensive assessments

49
will be examined. Components of this review include evidence of each tool's validity and reliability as
well as design elements and accommodations for specific populations.
Minnesota also completed an online tool finder to assist early learning programs with choosing an
appropriate assessment tool. This finder is designed to match respondents with assessments based
on their responses to an online algorithm. The tool finder currently includes all Parent Aware‐
approved tools and kindergarten entry assessments. You can find the tool on the MDE website.
As a result of these two initiatives, MDE is now in process of delivering communications and technical
assistance to districts selecting and implementing a comprehensive assessment from the approved
menu of tools. The Minnesota Department of Education has developed several support documents to
help programs identify goals regarding assessment, observational strategies for teachers and using
assessment data to inform program planning and instructional practice.
The Minnesota Department of Education also finalized assessment crosswalks for approved tools on
the Kindergarten Entry Profile menu. The purpose of the crosswalks is for districts and early learning
programs to explore the alignment among a menu of appropriate early learning assessments in
multiple ways. The crosswalks include alignment between the tools and the Minnesota Early Learning
and Kindergarten standards as well as how items on each tool relate to each other.
The Minnesota Department of Education partnered with the University of Minnesota to complete a
series of hybrid learning modules that focus on authentic assessment for special topics. Early learning
programs can access in‐depth face‐to‐face training or view online overviews of content across the
following topic areas: (1) primer on authentic assessment, (2) embedding authentic assessment into
everyday practice, (3) involving families in the assessment process, (4) assessment, standards and
curricula, (5) support for administrators, (6) using assessment to inform instruction and (7)
assessment for special populations. You can find the online modules on the University of Minnesota's
website. The Minnesota Department of Education is in the final stages of uploading the completed
learning modules using the Canvas Catalog interface, which allows early child educators to access self‐
paced learning modules based on their individual and program needs and self‐evaluate their learning
experience based on the completed courses. As a result, teachers and providers will have immediate
access to authentic assessment learning modules in order to help programs meet training and
professional development requirements for Parent Aware, Minnesota’s quality rating and
improvement system.
Additional trainers were trained as part of the comprehensive assessment system in 2016, increasing
the number of certified assessment trainers to over 70. Train‐the‐trainer courses were offered across
various comprehensive assessments tools including the Classroom Assessment Scoring System
(CLASS), Teaching Strategies GOLD, and the Formative Assessment System for Teachers.

50
Lastly, MDE partnered with the Minnesota Association for Family and Early Education (MNAFEE) to
provide workshops in reflective practice, developmental parenting and quality interactions to parent
educators and early childhood teachers alike. As a result, six trainings occurred across the state with
over 200 total participants.
Minnesota met our goal with the help of Race to the Top funding to tailor a system and improve
system components. The approach was to create efficiencies, such as in piloting electronic screening,
and to approach assessment holistically while honoring local choice. Minnesota was able to provide a
consistent process to review and select quality learning assessments and then support programs in
conducting assessment through access to local trainers, on‐demand online training, and more.
Health Promotion (Section C(3) of Application)
Describe the progress made during the reporting year and across all five years of grant implementation. Please describe the State’s strategies to ensure that measurable progress was made in this area by the end of the four‐year grant and the No‐Cost Extension period.
Minnesota did not pursue this section
51
Engaging and Supporting Families (Section C(4) of Application)
Describe the progress made during the reporting year and across the five years of grant implementation. Please describe the State’s strategies to ensure that measurable progress was made in this area by the end of the four‐year grant and No‐Cost Extension period.
Minnesota did not pursue this section.
D. Early Childhood Education Workforce
Workforce Knowledge and Competency Framework and progression of credentials. (Section D(1) of Application)
Describe the progress made during the reporting year and across all five years of grant implementation, including progress in engaging postsecondary institutions and other professional development providers in aligning professional development opportunities with the State Workforce Knowledge and Competency Framework. Please describe the State’s strategies to ensure that measurable progress was made in this area by the end of the four‐year grant and the No‐Cost Extension period.
Early childhood educators are one of the most impactful elements to supporting each child’s learning
and development. The first edition of the Minnesota Core Competencies for Early Childhood
Practitioners (Core Competencies) was released in 2004, and in 2010, recommendations were made
for revision. Race to the Top provided the support to revise the Core Competencies and promote their
ongoing use. The Race to the Top funding institutionalizes continuous improvement of the Core
Competencies and increased alignment to institutes of higher education and Minnesota Board of
Teaching Standards. The Knowledge and Competency Framework (KCF), released in December 2014,
includes three versions: Pre‐school children in center and school programs; Infants and toddlers; and
children in family child care home settings.
KCF combines what an early care and education provider needs to know about research and theory,
with the skills and abilities needed to work effectively in the field. KCF articulates knowledge and skills
needed in the early childhood field. It aligns with the Board of Teaching Standards and shows a
progression of skill development at three levels: Explores, Implements, and Designs and Leads, with
each level building on the competencies of the level before it. KCF facilitates pathways for learning,
and assists early care and education providers in planning for continued professional growth.
The competencies address eight broad content areas:
Child Development and Learning.
Developmentally Appropriate Learning Experiences.
Assessment, Evaluation and Individualization.
Relationships with Families.
Health, Safety and Nutrition.
Historical and Contemporary Development of Early Childhood Education.
52
Professionalism.
Application through Clinical Experience.
Companion guides to accompany the Family Child Care and Preschool versions were completed in
2015 and posted on the MDE website. They are based on the previously developed Infant and Toddler
Companion Guide created in 2010, by the Center for Early Education and Development. These are
written in “plain language” and include strategies and examples. The companion guides have been
translated into Hmong, Spanish, Somali and Vietnamese.
Progress is being made toward Minnesota's goal of general acceptance of the KCF by the early
childhood community and faculty of institutions of higher education (IHEs). In 2015, Minnesota's
Association for Early Childhood Teacher Educators endorsed the use of the KCF in their coursework.
To assist IHEs in deeply and meaningfully embedding the KCF in coursework, an RFP was published in
the fall of 2015. The grant was awarded to and supported three pairs of two‐ and four‐year programs
as they work to integrate the KCF, identify the few and powerful competencies and ensure scaffolding
of learning for students as they move from one program to another.
In the last year, grantees completed their work to embed the KCF in meaningful ways into the
identified course work. Faculty described the greatest benefits of working on the grant as the
relationships and trust that was built, increasing awareness of the various systems for which each
institution was accountable, and discovering multiple applications (including assessments) for the
KCF. An unexpected benefit was the foundation the work that had been done to scaffold learning
through these grants became a foundation for work to create legislatively mandated articulation
agreements known as Transfer Pathways.
Relationships are also being developed with secondary teachers of Family and Consumer Science
classes. They are currently developing a teacher cadet program and are interested in using the KCF as
a basis for study.
Examples of evidence of competence were created by bringing together groups of early childhood
providers throughout regions of the state. Over 230 people worked to identify what selected
competencies would look like at each of the three levels when implemented in their setting. These
examples will be compiled and used in trainings and in work with coaches, mentors, and supervisors
as they train, observe or offer feedback on performance.
The membership groups of two‐ and four‐year faculty met to identify barriers, create solutions and
determine action steps for improving teacher preparation programs. Many of these will be
incorporated into Minnesota’s implementation plan for the work being done with the National
Academy of Sciences to operationalize several of the recommendations in the report “Transforming
the Workforce for Children Birth Through Age 8: A Unifying Foundation.”
In partnership with these efforts, DHS worked to align training and supports for the early childhood
community. Beginning July 1, 2016, all courses in Develop, Minnesota's online Quality Improvement

53
and Registry Tool, were categorized according to the content areas outlined in the KCF. Additionally,
DHS strengthened and aligned Parent Aware Categories and Standards with the KCF. Parent Aware
training indicators have also been streamlined into one set of indicators that align with the KCF.
As a part of Minnesota's no‐cost extension, the Individual Training Needs Assessment (ITNA) self‐
assessment has been revised to align with the framework to help early care and education providers
plan their professional development. Additionally, DHS developed KCF training for both trainers and
early care and education providers. Both trainings are approved by the Minnesota Center for
Professional Development (MNCPD) and listed in Develop. By the end of Minnesota's no‐cost
extension, the KCF for early care and education providers will be delivered through the Child Care
Aware training delivery system. The KCF training for Trainers will be offered by Child Care Aware of
Minnesota ‐ Coordinating Office.
Supporting Early Childhood Educators in improving their knowledge, skills, and abilities. (Section D(2) of Application)
Describe the progress made during the reporting year and across all five years of grant implementation. Please describe the State’s strategies to ensure that measurable progress was made in this area by the end of the four‐year grant and the No‐Cost Extension period.
To build on professional development system elements such as the Core Competencies, Minnesota
had a demonstrated need to promote access to effective professional development supporting
professional progression, and bolstering the ability for the state to track and monitor workforce
outcomes. This investment in professional development strives to create a system where early
childhood professionals across settings can learn what they need to know to support the children
they serve in getting ready for kindergarten, as defined by the ECIPs.
During the five‐year period of the grant, Minnesota has made progress on many strategies to support
early childhood educators in improving their knowledge, skills and abilities. These include curriculum
development, expansion of training and relationship‐based professional development, and improving
our Professional Development Registry in order to collect more comprehensive workforce data.
In 2016, a total of 20 new courses were released that met training indicators for Parent Aware. These
courses were written at Level 2 and Level 3 of the Minnesota Knowledge and Competency Framework
in an effort to provide more advanced non‐credit training for those individuals not seeking a two‐ or
four‐year degree, or already having a degree in a related field. The courses are offered in both face‐
to‐face and online training formats. During the five year grant period, Minnesota developed 162
hours of additional training to support child care providers in meeting Parent Aware training
requirements.
Also in 2016, the Minnesota Infant/Toddler Credential was released and classes were offered
statewide in both face‐to‐face and online training formats. This 30‐hour curriculum provides a
54
foundation in best practices for the care of infants and toddlers. There has been considerable interest
with over 200 providers participating in this training statewide.
Minnesota has also begun revising the Minnesota Child Care Credential, which is a 120‐hour
curriculum that meets all the training requirements for the Child Development Associate Credential
(CDA). Revisions will be completed in 2017 with the support of additional state and federal funding in
addition to the Race to the Top – Early Learning Challenge Grant funds committed for this purpose.
During the life of the grant, Minnesota has delivered all of the above‐mentioned training for free or a
very low cost (under $5 per hour) with support of the Race to the Top – Early Learning Challenge
Grant funds.
Over the past five years, Parent Aware Quality Coaches and CLASS Coaches provided coaching and
technical assistance to programs participating in Parent Aware. They have honed their skills to meet
the provider’s needs by participating in monthly CLASS online learning communities and reflective
practice sessions. They also received Practice‐Based Coaching training and mentorships with CLASS
coaches working in Head Start programs.
Minnesota has also increased the types of approved Relationship‐Based Professional Development
(RBPD) Specialists that work with early childhood educators. They include: Accreditation Coaches and
Consultants, Business Consultants, CLASS Coaches, Inclusion Coaches, Mental Health Consultants,
Quality Mentors, Parent Aware Quality Coaches, Pathways to Quality Coaches and Professional
Development Advisors. Child care providers who access these services can use them to meet specific
licensing training and Parent Aware training requirements. To assist both new and experienced RBPD
Specialists in strengthening their skills, Minnesota identified RBPD competencies and created a 45‐
hour RBPD Credential.
Like many states, Minnesota has seen an increase in the overall number of New Americans, or the
state's immigrant and refugee communities. Through the Race to the Top – Early Learning Challenge
Grant, we aimed to increase support for New American child care providers by supporting the
professional development of trainers statewide from typically underrepresented communities. We
significantly increased the number of trainers from these communities so providers could receive
training in their native language.
At the start of the project in 2013, baseline data was established with existing bilingual/bicultural
trainers registered with the Minnesota Center for Professional Development. In analyzing the baseline
data, it was noted that bilingual/bicultural trainers were approved in training in only a few content
areas and not fully utilized by the early education system.
With effective recruitment and active collaborations with local cultural and community organizations,
the number of bilingual/bicultural trainers increased by 70 percent to 38 well‐qualified trainers. The
trainers represent eight growing cultural and linguistic communities in Minnesota including: Somali,
Arabic, Spanish, Oromo, Hmong, Karen, Bhutanese and Amharic. Trainers received training,

55
mentoring and technical assistance throughout the program and these supports are now a permanent
fixture in the services provided to the field.
In July 2016, a professional development systems integration project was completed that brought
together three data systems into Develop, Minnesota’s Quality Improvement and Registry Tool. Early
childhood educators can now search, register, and pay for professional development events in one
system. Develop is now truly a one‐stop shop for professionals looking for training and professional
development opportunities.
Despite exponential growth in the volume of membership applications received, the Minnesota
Center for Professional Development (MNCPD) processed applications through Develop within the
allotted six‐week timeframe. This supports the continued growth of a state workforce data set, sorted
by formal credentials and degrees.
The Minnesota Center for Professional Development also modified the CDA Learning Record per
specifications from the Council for Professional Recognition, the organization that administers the
national CDA certification. CDA candidates in Minnesota are now able to use their CDA Learning
Record as a single source of documentation to verify they have completed all training required to
earn their CDA.
In addition, a tool for early childhood educators to determine the type of training needed to advance
their career, the Individual Training Needs Assessment (ITNA), underwent a full revision to align with
the Minnesota Knowledge and Competency Framework. The ITNA is now an online, interactive self‐
assessment tool that can help providers identify areas for continued professional growth.
Finally, the electronic Trainer and Training Evaluation Tool (TTET) was developed to provide
quantifiable data from training participants to support continuous quality improvement of both adult
educators and course curriculum.
Performance Measures (D)(2)(d)(1) and (2):
In the Final Progress Report Excel Workbook, indicate State progress toward meeting ambitious yet achievable targets for:
(1) Increasing the number of postsecondary institutions and professional development providers with programs that are aligned to the Workforce Knowledge and Competency Framework and the number of Early Childhood Educators who receive credentials from postsecondary institutions and professional development providers that are aligned to the Workforce Knowledge and Competency Framework; and
(2) Increasing the number and percentage of Early Childhood Educators who are progressing to higher levels of credentials that align with the Workforce Knowledge and Competency Framework.
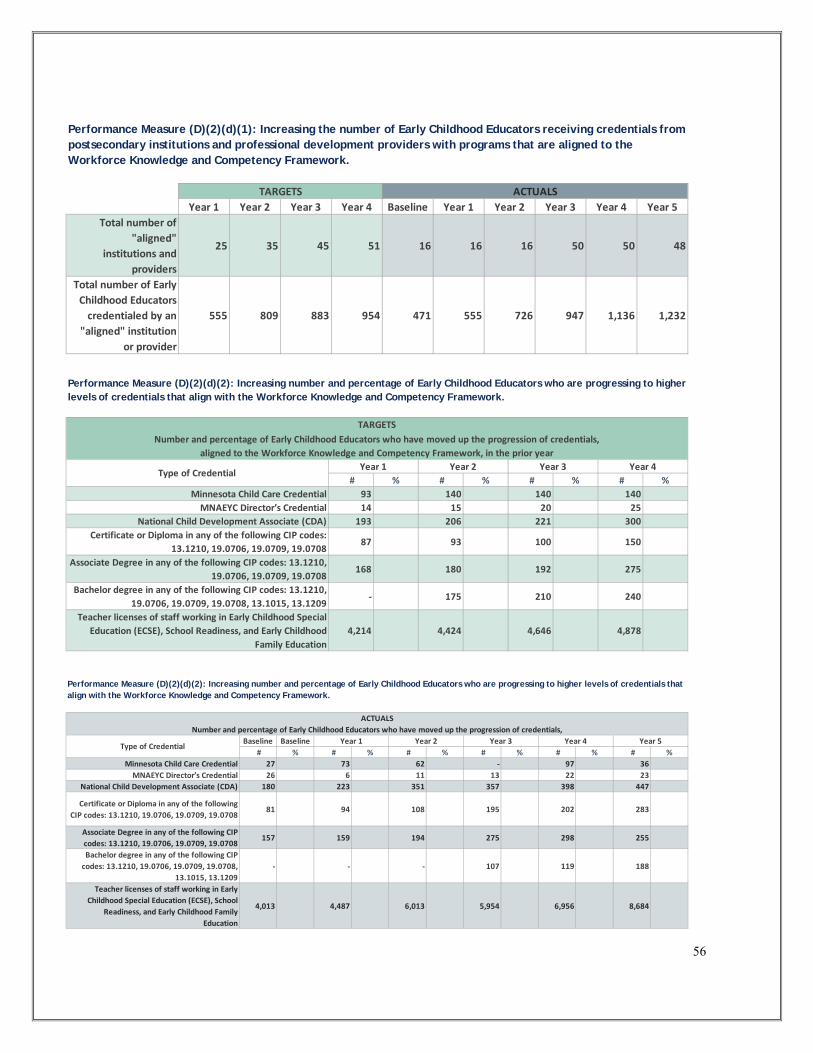
56
Year 1 Year 2 Year 3 Year 4 Baseline Year 1 Year 2 Year 3 Year 4 Year 5
Total number of
"aligned"
institutions and
providers
25 35 45 51 16 16 16 50 50 48
Total number of Early
Childhood Educators
credentialed by an
"aligned" institution
or provider
555 809 883 954 471 555 726 947 1,136 1,232
ACTUALSTARGETS
Performance Measure (D)(2)(d)(1): Increasing the number of Early Childhood Educators receiving credentials from postsecondary institutions and professional development providers with programs that are aligned to the Workforce Knowledge and Competency Framework.
# % # % # % # %
Minnesota Child Care Credential 93 140 140 140
MNAEYC Director’s Credential 14 15 20 25
National Child Development Associate (CDA) 193 206 221 300
Certificate or Diploma in any of the following CIP codes:
13.1210, 19.0706, 19.0709, 19.0708 87 93 100 150
Associate Degree in any of the following CIP codes: 13.1210,
19.0706, 19.0709, 19.0708 168 180 192 275
Bachelor degree in any of the following CIP codes: 13.1210,
19.0706, 19.0709, 19.0708, 13.1015, 13.1209 ‐ 175 210 240
Teacher licenses of staff working in Early Childhood Special
Education (ECSE), School Readiness, and Early Childhood
Family Education
4,214 4,424 4,646 4,878
Type of CredentialYear 2 Year 3Year 1 Year 4
Performance Measure (D)(2)(d)(2): Increasing number and percentage of Early Childhood Educators who are progressing to higher levels of credentials that align with the Workforce Knowledge and Competency Framework.
TARGETS
Number and percentage of Early Childhood Educators who have moved up the progression of credentials,
aligned to the Workforce Knowledge and Competency Framework, in the prior year
Baseline Baseline
# % # % # % # % # % # %
Minnesota Child Care Credential 27 73 62 ‐ 97 36
MNAEYC Director’s Credential 26 6 11 13 22 23
National Child Development Associate (CDA) 180 223 351 357 398 447
Certificate or Diploma in any of the following
CIP codes: 13.1210, 19.0706, 19.0709, 19.0708 81 94 108 195 202 283
Associate Degree in any of the following CIP
codes: 13.1210, 19.0706, 19.0709, 19.0708 157 159 194 275 298 255
Bachelor degree in any of the following CIP
codes: 13.1210, 19.0706, 19.0709, 19.0708,
13.1015, 13.1209
‐ ‐ ‐ 107 119 188
Teacher licenses of staff working in Early
Childhood Special Education (ECSE), School
Readiness, and Early Childhood Family
Education
4,013 4,487 6,013 5,954 6,956 8,684
ACTUALS
Number and percentage of Early Childhood Educators who have moved up the progression of credentials,
Type of CredentialYear 2Year 1 Year 3 Year 4 Year 5
Performance Measure (D)(2)(d)(2): Increasing number and percentage of Early Childhood Educators who are progressing to higher levels of credentials that align with the Workforce Knowledge and Competency Framework.
57
(D)(2)(d) Data Notes (D)(2)(d)(1) Total number of “aligned” institutions and providers: See Table (A)(1)‐11 in the application. It shows
16 aligned institutions – MNCPD, MNAEYC, National Council for Professional Recognition, and 13
technical/community colleges. Now that the Knowledge and Competency Framework has been
aligned with the Board of Teaching standards, we can conclude that any institution or provider that
uses the Board of Teaching standards is aligned with the Knowledge and Competency Framework.
While all IHEs are expected to align their coursework with the Board of Teaching standards, we are
aware that this may not be happening consistently. A survey of institutes of higher education showed
that 94 percent of higher education institutions reported using the Board of Teaching standards to
develop learning objectives for their courses.
Total number of Early Childhood Educators credentialed by an “aligned” institution or provider: The
2016 total reflects the sum of the actual numbers in the 2016 column of Table D2d2 for Credential
Types 1 through 6.
(D)(2)(d)(2) Percentages are left blank because Minnesota does not have an accurate count of the number of
early childhood educators in the state. The 2011 Child Care Workforce Study estimates the size of the
workforce in Minnesota at 31,000 (including all family child care providers and all directors, teachers,
assistant teachers, and aides working in non‐school‐age child care centers). This number does not
include Head Start staff and may not fully reflect those working in school‐based pre‐K programs.
Cumulative Numbers vs. Yearly Gains: To achieve consistency and clarity, Minnesota reports only on
Yearly Gains rather than on the total number of early childhood educators in the state that hold the
credential. All reported are from the timeframe: 1/1/16 – 12/31/16. Credential Types (1, 2, 3) are all
aligned with the Minnesota’s Workforce Knowledge and Competency Framework.
Notes on Credential Type 1: Data comes from Develop, Minnesota’s Quality Improvement and
Registry Tool, and was pulled on January 18, 2017. The drop in the completed credentials may be
attributed to a saturation of the current market and the need for additional trainers in order to offer
it in more rural areas of the state. A new recruitment of trainers will occur when the curriculum
revisions are completed in 2017.
Notes on Credential Type 2: Data comes from MnAEYC administrative records from 1/1/16 through
12/31/16. These are including only those who received the credential.
Notes on Credential Type 3: Data on CDAs awarded to Minnesota practitioners comes from the
National Council for Professional Recognition during the specified timeline. Continued growth in
58
CDA’s can be attributed to the development of curriculum that applies toward a CDA and financial
supports for CDA training, assessment and renewal.
Notes on Credential Types 4, 5, and 6: Data on certificates and diplomas earned at Minnesota
institutions was pulled from the 2014‐15 IPEDS Completion Survey Data. Minnesota counts
certificates, diplomas, and degrees in any of the following CIP codes: 13.1209
(Kindergarten/Preschool Education and Teaching), 13.1210 (Early Childhood Education and Teaching),
13.1015 (Early Childhood Special Education Programs), 19.0706 (Child Development), 19.0709 (Child
Care Provider/Assistant), 19.0708 (Child Care and Support Services Management). To determine
which institutions offer degrees and credentials that are aligned with the Workforce Knowledge and
Competency Framework, a survey was administered to institutes of higher education that offer such
degrees and credentials. Because the response rate to the survey was low, we are unable to say with
certainty which institutes of higher education are aligned. Because the survey found that 94 percent
of higher education institutions reported using the Board of Teaching standards to develop learning
objectives for their courses, we estimated that 94 percent of degrees and credentials awarded are
awarded by institutions that are aligned with the Workforce Knowledge and Competency Framework.
Minnesota has invested substantial RTT funds into T.E.A.C.H. early childhood scholarships to support
the attainment of certificates and degrees.
Notes on Credential Type 7: Data was pulled from STAR (Minnesota Department of Education's data
system for teacher licensure and employment) and captures the Count of Active 2015‐16 Licensed
Staff for License Codes 180150 (formerly 180102), 190500, and 180401 (formerly180402).

59
E. Measuring Outcomes and Progress
Understanding the Status of Children’s Learning and Development at Kindergarten Entry (Section E(1) of Application)
Describe the domain coverage of the State’s Kindergarten Entry Assessment, validity and
reliability efforts regarding the Kindergarten Entry Assessment, and timing of the
administration of the Kindergarten Entry Assessment.
Prior to Race to the Top, Minnesota implemented its kindergarten entry assessment beginning in
2002 with a local version of the Work Sampling System with a targeted 10 percent sample statewide.
Over the years, programs throughout the state began using other assessment tools more broadly,
participation in study became less representative to statewide populations. Race to the Top funds
supported the revision of Minnesota’s Kindergarten Entry Assessment, called the Kindergarten Entry
Profile (KEP). The purpose of the KEP is to provide teachers with a menu of valid, reliable
measurement tools that will assist them in observing, documenting and reflecting on the learning
progress of their students. KEP supports school administrators, educational leaders, and kindergarten
teachers in measuring what children know and are able to do at the beginning of kindergarten in
order to inform their practice and programming. Teachers implement the measurement tool of their
choice within the first eight weeks of the kindergarten year and data collection is centered on the
administration guidelines to ensure fidelity to the administration.
The KEP includes a menu of comprehensive assessment tools from which districts may choose. All
tools on the KEP list provide real‐time online data to schools in order to help guide instructional
planning and teaching practices based on the learning needs of kindergarten students. Additionally,
all of the measures are aligned to Minnesota’s early learning standards called the Early Childhood
Indicators of Progress (ECIPs) and the Minnesota Kindergarten Academic Standards. The tools on the
KEP list in 2016 include:
Desired Results Developmental Profile ‐ Kindergarten (DRDP).
Teaching Strategies GOLD.
Work Sampling System – Minnesota Version (WSS).
Formative Assessment System for Teachers (FAST).
The list of tools was selected based on recommendations from Minnesota teachers and
administrators in the field, federal guidance in the Race to the Top – Early Learning Challenge grant,
the National Research Council report, Early Childhood Assessment: Why, What and How, and in
consultation with a statewide multi‐sector comprehensive assessment system workgroup. Each tool
incorporates Language, Literacy, and Communication, Social Emotional, and Mathematics domains.
Considerable attention was paid to each tool's evidence of validity and reliability in the KEP pilot. The
KEP piloting process was completed in two phases: (1) validity of each tool's alignment to the ECIP
and (2) concurrent calibration of tools to ensure alignment to one another.

60
The Minnesota KEP continues to be a voluntary program in which districts and schools may opt to
participate. This is due to the limited amount of annual funding provided in state general funds
($281,000). The Minnesota Department of Education estimates a full statewide implementation using
the menu of tools would be $1.7M per year. The Minnesota Department of Education staff has a goal
to leverage the efficiencies created in the pilot to increase the sample size from the historic 10
percent voluntary sample to a 20 percent voluntary sample and focus efforts on professional
development and marketing supported by the existing state appropriation. Data from the KEP will
now be collected in the Early Learning Data System for greater public availability and to see how
kindergarten readiness aligns with other early childhood initiatives and outcomes.
Early Learning Data Systems (Section E(2) of Application)
Describe the progress made during the reporting year and across all five years of grant
implementation, including the State’s progress in building or enhancing a separate early
learning data system that aligns with and is interoperable with the Statewide Longitudinal Data
System. Describe the State’s strategies to ensure that measurable progress was made in this
area by the end of the four‐year grant and the No‐Cost Extension period.
Prior to Race to the Top, Minnesota had a P‐20 Longitudinal Data System tracking kindergarten to
workforce data, but did not link ample early childhood data elements. Without this system,
Minnesota’s early learning and development data existed in silos missing the potential to link data to
inform practice and policy. Minnesota’s ECLDS (ECIDS) was launched in early 2016 and the state is
currently completing the third round of analytics. It can be viewed at eclds.mn.gov. Analytics currently
offered to users include early care and education program participation and status measures for
children in K‐3 such as early grade attendance and third‐grade test scores. Mapping functionality is
also being planned and should be implemented in phases in the first half of 2017. Funding received
under a new SLDS‐IES grant is ensuring ongoing enhancements to the site including pop‐up feedback
windows, a download feature, user tutorial videos and the integration of two new major data sources
(national Help Me Grow and Head Start). Maintenance funding for the ECLDS is still being pursued
through various avenues.
The architecture and information technology supports for ECLDS are shared with our state's
Statewide Longitudinal Data System, or SLEDS. While each system has its own warehouse and public‐
facing website, they share other structures that will make an eventual full integration to preschool to
workforce possible in a relatively seamless fashion when the participating state agencies are ready. It
is anticipated that this integration could occur sometime between 2019 and 2021 when new data‐
sharing agreements are negotiated between all involved agencies.
To build and monitor use, we have a number of initiatives and mechanisms in place. We are
partnering with our local Children's Defense Fund Annie E. Casey KIDS Count agency under a new
grant they have received to promote data use for early childhood. They are promoting the ECLDS in

61
their report and their data coffee talks that they will convene across the state this coming year. We
are gathering user feedback from our download pop‐up feature as well as our site feedback email
box. We have also convened a Data User's Group to inform activities under our new grant and with
our technical assistance project we are promoting ECLDS use with local programs. Invitations to
demonstrate the site to groups such as the Head Start community and school‐based program groups
are increasing in frequency.
The presence of the ECLDS has influenced the early childhood community by providing an information
tool that has been needed and wanted for decades by those who serve families with young children
and create and implement relevant public policy. We now have the ability to view information in a
way that reflects how children are served: through multiple programs and funding streams and often
simultaneously. This increases the likelihood that programs serving the same children and families can
do so in a more collaborative manner. It also helps us identify gaps in service and identifying children
who should be benefitting from services, but may not be accessing them. Finally, we are creating the
ability to see how children are faring over time in relation to their known early care and education
experiences. This is something that is of high value to our state's early childhood policy and service
communities.
Attach the following final documents:
Final Validation Study
Kindergarten Entry Assessment Summary
62
Future State plans
Thank you for filling out the Race to the Top—Early Learning Challenge grant Final Progress
Report. Please provide the Departments with a description of your State’s future early learning
plans.
Minnesota will work off the momentum of Race to the Top to sustain several initiatives with the ultimate goal of improving access to high‐quality early learning and development programs for children with high needs. Sustainability of initiatives will be completed by expansions in state resources, federal funding and leveraging existing funding. Parent Aware continues to be a foundation of early child care and education in the state, providing a framework of shared quality standards critical to aligning program improvement efforts, supporting parents in searching for quality early learning options and ensuring that Early Learning Scholarships and Child Care Assistance Program tiered reimbursement rates can function as intended. Beginning July 1, 2017, the start of Fiscal Year 2018, the Department of Human Services will increase the amount of Federal Child Care Development Block Grant funds to support Parent Aware. The CCDBG law, reauthorized in 2014, requires states to direct a greater percentage of funds for quality activities like quality rating and improvement systems. This increase in CCDBG funds for Parent Aware offsets some reductions in other funding sources, including the end of federal Race to the Top – Early Learning Challenge Grant funds and a small reduction in the state base General Fund appropriation to support Parent Aware. Thus, combined federal and state resources will, at minimum, sustain and support growth of Parent Aware through continuation of:
The rating process.
Child Care Aware Quality Coaches.
Provider recruitment, including Child Care Aware recruiter staff.
Quality Improvement Grants for providers. Early Learning Scholarships provide a funding support to help children access high‐quality Three‐ or Four‐Star Parent Aware Rated programs. Race to the Top was an accelerator for using early learning scholarships as driven by Transformation Zone locally developed plans, some of which implemented scholarships for birth through kindergarten entrance. Governor Dayton is pushing for an expansion of scholarships to ages zero through kindergarten entry in his fiscal year 2018 and 2019 budget proposal. The proposal includes expanded work with two of the Race to the Top – Early Learning Challenge Grant‐identified Transformation Zones, emphasizing local collaboration and solutions focused on academic achievement and youth development. Combined, the Northside Achievement Zone, St. Paul Promise Neighborhood, Jones Family Foundation, Independent School District 742 and the Northfield Healthy Community Initiative currently serve over 24,000 children. $1 million over the biennium will allow these entities to continue to support and increase the number of children and families served. Processes developed through Race to the Top created sustainable solutions to the continuous improvement and review of the Early Childhood Indicators of Progress, Minnesota’s Comprehensive

63
Assessment System, and the Knowledge and Competency Framework. The federal SLDS‐IES grant awarded to the Minnesota Department of Education will ensure the continuation of implementation and outreach for the Early Learning Longitudinal Data System. Additionally, with Child Care Development Block Grant funds, the Department of Human Services intends to continue to support an array of early childhood workforce supports launched or enhanced with Race to the Top – Early Learning grant funds. These include offering new credentials and training courses developed over the past five years; ensuring the Develop online data system continues to meet the needs of a wide range of users; ensuring the Minnesota Center for Professional Development continues to provide timely verification of training and education credentials and helpful career guidance resources to Minnesota early childhood workforce; and enabling a new Trainer and RBPD Specialist grantee to support these professionals in providing high‐quality training, coaching and mentoring services to child care providers. The Minnesota legislature is considering a number or proposals to increase the capacity of the early childhood workforce. Proposals focus on additional grants for underserved populations and working to increase the diversity of the early childhood workforce. Minnesota will continue to sustain workforce supports the Pre‐K Through Third Grade Leadership series with public and private dollars.
Investments in early childhood go beyond Race to the Top initiatives. In his proposal, the governor is also pushing for an expansion of Voluntary Pre‐kindergarten by $175 million over the biennium to serve an additional 13,500 students. This is over tripling the current funding of Voluntary Pre‐kindergarten. Minnesota is working toward a National Help Me Grow model, and $3 million is in the governor’s proposal over the biennium to expand the current Help Me Grow system to develop a comprehensive statewide, coordinated system of early identification, referral and follow‐up for up to 630,000 children prenatal to age 8 and their families. Minnesota is dedicated to ensuring that lessons learned and investments in early childhood through Race to the Top create sustainable solutions to support children is access to high‐quality early education and care programs.
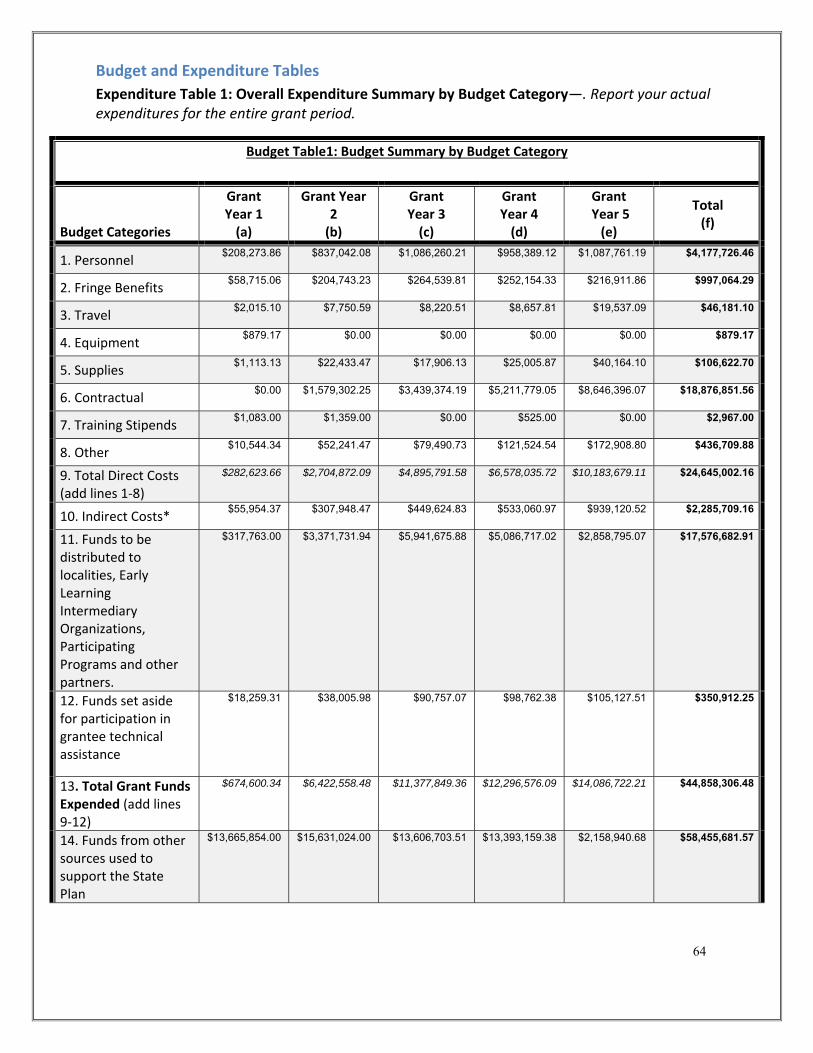
64
Budget and Expenditure Tables
Expenditure Table 1: Overall Expenditure Summary by Budget Category—. Report your actual expenditures for the entire grant period.
Budget Table1: Budget Summary by Budget Category
Budget Categories
Grant Year 1 (a)
Grant Year 2 (b)
Grant Year 3 (c)
Grant Year 4 (d)
Grant Year 5 (e)
Total (f)
1. Personnel $208,273.86 $837,042.08 $1,086,260.21 $958,389.12 $1,087,761.19 $4,177,726.46
2. Fringe Benefits $58,715.06 $204,743.23 $264,539.81 $252,154.33 $216,911.86 $997,064.29
3. Travel $2,015.10 $7,750.59 $8,220.51 $8,657.81 $19,537.09 $46,181.10
4. Equipment $879.17 $0.00 $0.00 $0.00 $0.00 $879.17
5. Supplies $1,113.13 $22,433.47 $17,906.13 $25,005.87 $40,164.10 $106,622.70
6. Contractual $0.00 $1,579,302.25 $3,439,374.19 $5,211,779.05 $8,646,396.07 $18,876,851.56
7. Training Stipends $1,083.00 $1,359.00 $0.00 $525.00 $0.00 $2,967.00
8. Other $10,544.34 $52,241.47 $79,490.73 $121,524.54 $172,908.80 $436,709.88
9. Total Direct Costs (add lines 1‐8)
$282,623.66 $2,704,872.09 $4,895,791.58 $6,578,035.72 $10,183,679.11 $24,645,002.16
10. Indirect Costs* $55,954.37 $307,948.47 $449,624.83 $533,060.97 $939,120.52 $2,285,709.16
11. Funds to be distributed to localities, Early Learning Intermediary Organizations, Participating Programs and other partners.
$317,763.00 $3,371,731.94 $5,941,675.88 $5,086,717.02 $2,858,795.07 $17,576,682.91
12. Funds set aside for participation in grantee technical assistance
$18,259.31 $38,005.98 $90,757.07 $98,762.38 $105,127.51 $350,912.25
13. Total Grant Funds Expended (add lines 9‐12)
$674,600.34 $6,422,558.48 $11,377,849.36 $12,296,576.09 $14,086,722.21 $44,858,306.48
14. Funds from other sources used to support the State Plan
$13,665,854.00 $15,631,024.00 $13,606,703.51 $13,393,159.38 $2,158,940.68
$58,455,681.57

65
15. Total Statewide Expenditures (add lines 13‐14)
$14,340,454.34 $22,053,582.48 $24,984,552.87 $25,689,735.47 $16,245,662.89 $103,319,988.05
Columns (a) through (e): For each grant year for which funding is requested, show the total amount expended for each applicable budget category. Column (f): Show the total amount expended for all grant years. Line 6: Show the amount of funds allocated through contracts with vendors for products to be acquired and/or professional services to be provided. A State may apply its indirect cost rate only against the first $25,000 of each contract included in line 6. Line 10: If the State plans to request reimbursement for indirect costs, complete the Indirect Cost Information form at the end of this Budget section. Note that indirect costs are not allocated to line 11. Line 11: Show the amount of funds distributed to localities, Early Learning Intermediary Organizations, Participating Programs, and other partners through MOUs, interagency agreements, contracts, or other mechanisms authorized by State procurement laws. States are not required to provide budgets for how the localities, Early Learning Intermediary Organizations, Participating Programs, and other partners will use these funds. However, the Departments expect that, as part of the administration and oversight of the grant, States will monitor and track all expenditures to ensure that localities, Early Learning Intermediary Organizations, Participating Programs, and other partners spend these funds in accordance with the State Plan. Line 12: The State was expected to set aside $400,000 from its grant funds for the purpose of participating in RTT–ELC grantee technical assistance activities facilitated by ED or HHS. The State could request to amend this amount if needed. Line 13: This is the total funding expended under this grant. Line 14: Show total funding from other sources (including Federal, State, private, or local) used to support the State Plan and describe these funding sources in the budget narrative.
Please provide a brief explanation of any discrepancies between the State’s approved budget and its total expenditures for the reporting period.
The state of Minnesota monitored its expenditures each month over the last year to ensure all grant funding was optimized and spent down in a timely manner. A majority of salaries and benefits were reported near the budgeted amount except where turnover in staff occurred. Additionally, there were a few grants and contracts that came in under budget. These savings were redirected towards other activities that had increased costs like additional enhancements to the state’s ECLDS and the data feeding into the warehouse and offering additional training and supports to the early childhood workforce. These increased costs are reflected in contract and indirect amounts in other projects.
Please provide the Departments with an estimated total of grant funds to be returned to the U.S. Treasury.
The Minnesota Department of Education does not expect to return any grant funds to the U.S. Treasury.

66
Budget and Expenditure Tables by Project ‐‐ Report your actual budget expenditures for the entire previous grant period. Copy the table and questions below for each project.
Budget Table 2: Parent Aware
Budget Categories
Grant Year 1 (a)
Grant Year 2 (b)
Grant Year 3 (c)
Grant Year 4 (d)
Grant Year 5 (e)
Total (f)
1. Personnel $29,216.00 $251,075.00 $434,072.26 $301,098.03 $366,714.00 $1,382,175.29
2. Fringe Benefits $6,039.00 $59,518.00 $99,045.84 $89,283.50 $44,194.20 $298,080.54
3. Travel $0.00 $2,210.00 $3,268.61 $7,153.12 $1,273.82 $13,905.55
4. Equipment $0.00 $0.00 $0.00 $0.00 $0.00 $0.00
5. Supplies $0.00 $18,669.00 $10,960.98 $14,256.90 $21.49 $43,908.37
6. Contractual $0.00 $277,694.00 $1,413,472.64 $2,130,450.31 $2,343,803.05 $6,165,420.00
7. Training Stipends $0.00 $0.00 $0.00 $525.00 $0.00 $525.00
8. Other $0.00 $524.00 $9,289.52 $25,125.00 $5,458.89 $40,397.41
9. Total Direct Costs (add lines 1‐8)
$35,255.00 $609,690.00 $1,970,109.85 $2,567,891.86 $2,761,465.45 $7,944,412.16
10. Indirect Costs* $8,391.00 $92,431.00 $151,814.73 $145,250.27 $122,831.33 $520,718.33
11. Funds to be distributed to localities, Early Learning Intermediary Organizations, Participating Programs and other partners.
$0.00 $8,807.00 $61,113.72 $38,136.33 $71,900.83 $179,957.88
12. Funds set aside for participation in grantee technical assistance
$0.00 $0.00 $0.00 $0.00 $0.00 $0.00
13. Total Grant Funds Expended (add lines 9‐12)
$43,646.00 $710,928.00 $2,183,038.30 $2,751,278.46 $2,956,197.61 $8,645,088.37
14. Funds from other sources used to support the State Plan
$4,369,924.00 $4,631,862.00 $4,054,865.00 $4,150,000.00 $0.00 $17,206,651.00
15. Total Statewide Expenditures (add lines 13‐14)
$4,413,570.00 $5,342,790.00 $6,237,903.30 $6,901,278.46 $2,956,197.61 $25,851,739.37

67
Columns (a) through (e): For each grant year for which funding is requested, show the total amount expended for each applicable budget category. Column (f): Show the total amount expended for all grant years. Line 6: Show the amount of funds allocated through contracts with vendors for products to be acquired and/or professional services to be provided. A State may apply its indirect cost rate only against the first $25,000 of each contract included in line 6. Line 10: If the State plans to request reimbursement for indirect costs, complete the Indirect Cost Information form at the end of this Budget section. Note that indirect costs are not allocated to line 11. Line 11: Show the amount of funds distributed to localities, Early Learning Intermediary Organizations, Participating Programs, and other partners through MOUs, interagency agreements, contracts, or other mechanisms authorized by State procurement laws. States are not required to provide budgets for how the localities, Early Learning Intermediary Organizations, Participating Programs, and other partners will use these funds. However, the Departments expect that, as part of the administration and oversight of the grant, States will monitor and track all expenditures to ensure that localities, Early Learning Intermediary Organizations, Participating Programs, and other partners spend these funds in accordance with the State Plan. Line 12: The State was expected to set aside $400,000 from its grant funds for the purpose of participating in RTT–ELC grantee technical assistance activities facilitated by ED or HHS. The State could request to amend this amount if needed. Line 13: This is the total funding expended under this grant. Line 14: Show total funding from other sources (including Federal, State, private, or local) used to support the State Plan and describe these funding sources in the budget narrative.
For each project, please provide an explanation of any discrepancies between the State’s approved budget and expenditures for the reporting period.
Overall expenditures for the Parent Aware project aligned fairly well with budgets throughout the grant. The Child Care Health Consultant work had some trouble contracting out services and instead hired staff to fulfill the work. This resulted in a slight increase in salary and decrease in contracted amounts.

68
Budget and Expenditure Tables by Project ‐‐ Report your actual budget expenditures for the entire previous grant period. Copy the table and questions below for each project.
Budget Table 3: Scholarships
Budget Categories
Grant Year 1 (a)
Grant Year 2 (b)
Grant Year 3 (c)
Grant Year 4 (d)
Grant Year 5 (e)
Total (f)
1. Personnel $31,585.00 $57,415.00 $35,212.25 $52,383.77 $48,793.18 $225,389.20
2. Fringe Benefits $7,166.00 $17,940.00 $14,769.33 $16,222.67 $16,560.26 $72,658.26
3. Travel $358.00 $689.00 $35.39 $71.58 $886.99 $2,040.96
4. Equipment $0.00 $0.00 $0.00 $0.00 $0.00 $0.00
5. Supplies $0.00 $791.00 $0.00 $0.00 $0.00 $791.00
6. Contractual $0.00 $0.00 $0.00 $0.00 $341,861.50 $341,861.50
7. Training Stipends $0.00 $0.00 $0.00 $0.00 $0.00 $0.00
8. Other $2,903.00 $7,031.00 $5,358.43 $6,496.89 $13,488.93 $35,278.25
9. Total Direct Costs (add lines 1‐8)
$42,012.00 $83,866.00 $55,375.40 $75,174.91 $421,590.86 $678,019.17
10. Indirect Costs* $8,193.00 $17,990.00 $11,518.07 $15,116.33 $81,106.73 $133,924.13
11. Funds to be distributed to localities, Early Learning Intermediary Organizations, Participating Programs and other partners.
$269,669.00 $2,752,053.00 $4,347,686.40 $2,780,169.19 $251,117.97 $10,400,695.56
12. Funds set aside for participation in grantee technical assistance
$0.00 $0.00 $0.00 $0.00 $0.00 $0.00
13. Total Grant Funds Expended (add lines 9‐12)
$319,874.00 $2,853,909.00 $4,414,579.87 $2,870,460.43 $753,815.56 $11,212,638.86
14. Funds from other sources used to support the State Plan
$470,000.00 $470,000.00 $470,000.00 $0.00 $0.00 $1,410,000.00
15. Total Statewide Expenditures (add lines 13‐14)
$789,874.00 $3,323,909.00 $4,884,579.87 $2,870,460.43 $753,815.56 $12,622,638.86

69
Columns (a) through (e): For each grant year for which funding is requested, show the total amount expended for each applicable budget category. Column (f): Show the total amount expended for all grant years. Line 6: Show the amount of funds allocated through contracts with vendors for products to be acquired and/or professional services to be provided. A State may apply its indirect cost rate only against the first $25,000 of each contract included in line 6. Line 10: If the State plans to request reimbursement for indirect costs, complete the Indirect Cost Information form at the end of this Budget section. Note that indirect costs are not allocated to line 11. Line 11: Show the amount of funds distributed to localities, Early Learning Intermediary Organizations, Participating Programs, and other partners through MOUs, interagency agreements, contracts, or other mechanisms authorized by State procurement laws. States are not required to provide budgets for how the localities, Early Learning Intermediary Organizations, Participating Programs, and other partners will use these funds. However, the Departments expect that, as part of the administration and oversight of the grant, States will monitor and track all expenditures to ensure that localities, Early Learning Intermediary Organizations, Participating Programs, and other partners spend these funds in accordance with the State Plan. Line 12: The State was expected to set aside $400,000 from its grant funds for the purpose of participating in RTT–ELC grantee technical assistance activities facilitated by ED or HHS. The State could request to amend this amount if needed. Line 13: This is the total funding expended under this grant. Line 14: Show total funding from other sources (including Federal, State, private, or local) used to support the State Plan and describe these funding sources in the budget narrative.
For each project, please provide an explanation of any discrepancies between the State’s approved budget and expenditures for the reporting period.
The Early Learning Scholarship project also aligned closely to original budgets. This project is one project that used some savings in salary and grants to enhance the data on Early Learning Scholarship recipients to improve the administration of the Early Learning Scholarship program and the data available for the ECLDS.
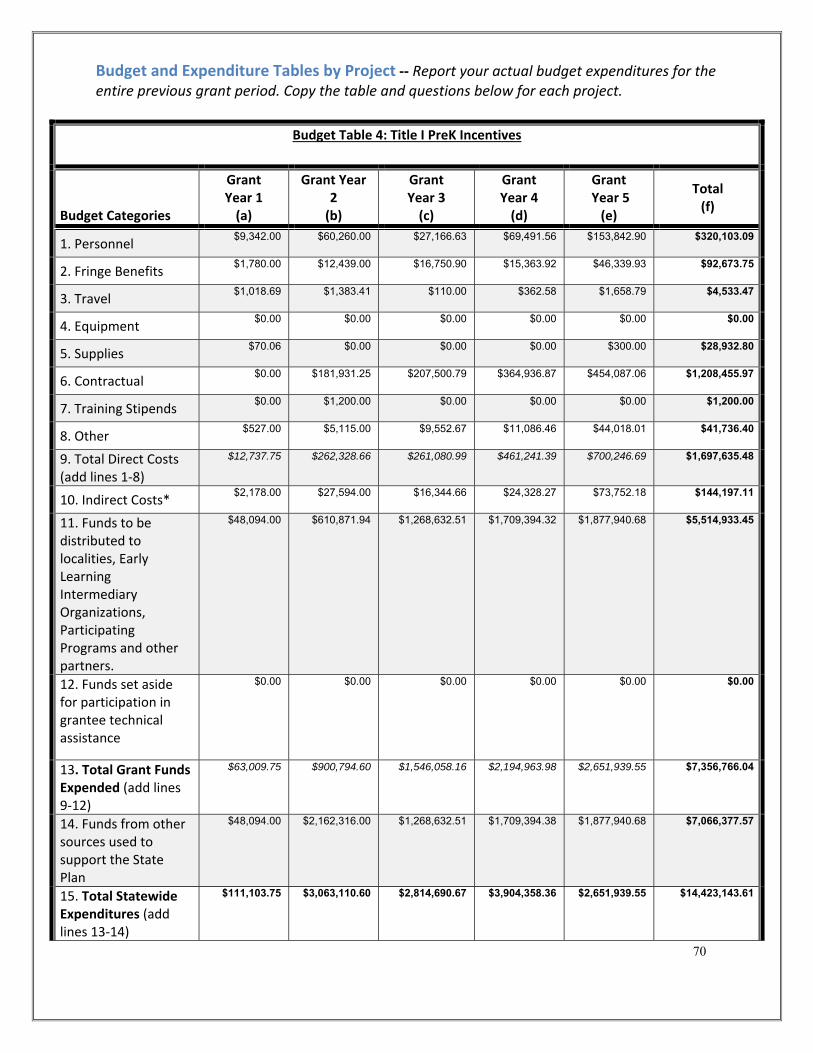
70
Budget and Expenditure Tables by Project ‐‐ Report your actual budget expenditures for the entire previous grant period. Copy the table and questions below for each project.
Budget Table 4: Title I PreK Incentives
Budget Categories
Grant Year 1 (a)
Grant Year 2 (b)
Grant Year 3 (c)
Grant Year 4 (d)
Grant Year 5 (e)
Total (f)
1. Personnel $9,342.00 $60,260.00 $27,166.63 $69,491.56 $153,842.90 $320,103.09
2. Fringe Benefits $1,780.00 $12,439.00 $16,750.90 $15,363.92 $46,339.93 $92,673.75
3. Travel $1,018.69 $1,383.41 $110.00 $362.58 $1,658.79 $4,533.47
4. Equipment $0.00 $0.00 $0.00 $0.00 $0.00 $0.00
5. Supplies $70.06 $0.00 $0.00 $0.00 $300.00 $28,932.80
6. Contractual $0.00 $181,931.25 $207,500.79 $364,936.87 $454,087.06 $1,208,455.97
7. Training Stipends $0.00 $1,200.00 $0.00 $0.00 $0.00 $1,200.00
8. Other $527.00 $5,115.00 $9,552.67 $11,086.46 $44,018.01 $41,736.40
9. Total Direct Costs (add lines 1‐8)
$12,737.75 $262,328.66 $261,080.99 $461,241.39 $700,246.69 $1,697,635.48
10. Indirect Costs* $2,178.00 $27,594.00 $16,344.66 $24,328.27 $73,752.18 $144,197.11
11. Funds to be distributed to localities, Early Learning Intermediary Organizations, Participating Programs and other partners.
$48,094.00 $610,871.94 $1,268,632.51 $1,709,394.32 $1,877,940.68 $5,514,933.45
12. Funds set aside for participation in grantee technical assistance
$0.00 $0.00 $0.00 $0.00 $0.00 $0.00
13. Total Grant Funds Expended (add lines 9‐12)
$63,009.75 $900,794.60 $1,546,058.16 $2,194,963.98 $2,651,939.55 $7,356,766.04
14. Funds from other sources used to support the State Plan
$48,094.00 $2,162,316.00 $1,268,632.51 $1,709,394.38 $1,877,940.68 $7,066,377.57
15. Total Statewide Expenditures (add lines 13‐14)
$111,103.75 $3,063,110.60 $2,814,690.67 $3,904,358.36 $2,651,939.55 $14,423,143.61

71
Columns (a) through (e): For each grant year for which funding is requested, show the total amount expended for each applicable budget category. Column (f): Show the total amount expended for all grant years. Line 6: Show the amount of funds allocated through contracts with vendors for products to be acquired and/or professional services to be provided. A State may apply its indirect cost rate only against the first $25,000 of each contract included in line 6. Line 10: If the State plans to request reimbursement for indirect costs, complete the Indirect Cost Information form at the end of this Budget section. Note that indirect costs are not allocated to line 11. Line 11: Show the amount of funds distributed to localities, Early Learning Intermediary Organizations, Participating Programs, and other partners through MOUs, interagency agreements, contracts, or other mechanisms authorized by State procurement laws. States are not required to provide budgets for how the localities, Early Learning Intermediary Organizations, Participating Programs, and other partners will use these funds. However, the Departments expect that, as part of the administration and oversight of the grant, States will monitor and track all expenditures to ensure that localities, Early Learning Intermediary Organizations, Participating Programs, and other partners spend these funds in accordance with the State Plan. Line 12: The State was expected to set aside $400,000 from its grant funds for the purpose of participating in RTT–ELC grantee technical assistance activities facilitated by ED or HHS. The State could request to amend this amount if needed. Line 13: This is the total funding expended under this grant. Line 14: Show total funding from other sources (including Federal, State, private, or local) used to support the State Plan and describe these funding sources in the budget narrative.
For each project, please provide an explanation of any discrepancies between the State’s approved budget and expenditures for the reporting period.
The Title I PreK Incentives expenditures observed little variance from budget. The travel came in slightly under budget and the “other” expense code came in slightly over budget. Actual travel was less than budget due to online meetings and other mechanisms of assisting PreK‐3 Leadership Series attendees. Additionally, the “other” expenditures were higher than budgeted due to the purchase of materials for the PreK‐3 Leadership Series that were purchased separately instead of through a contract. The expenditures for the project were approximately $45,000 under budget which mostly came from grants to school districts.
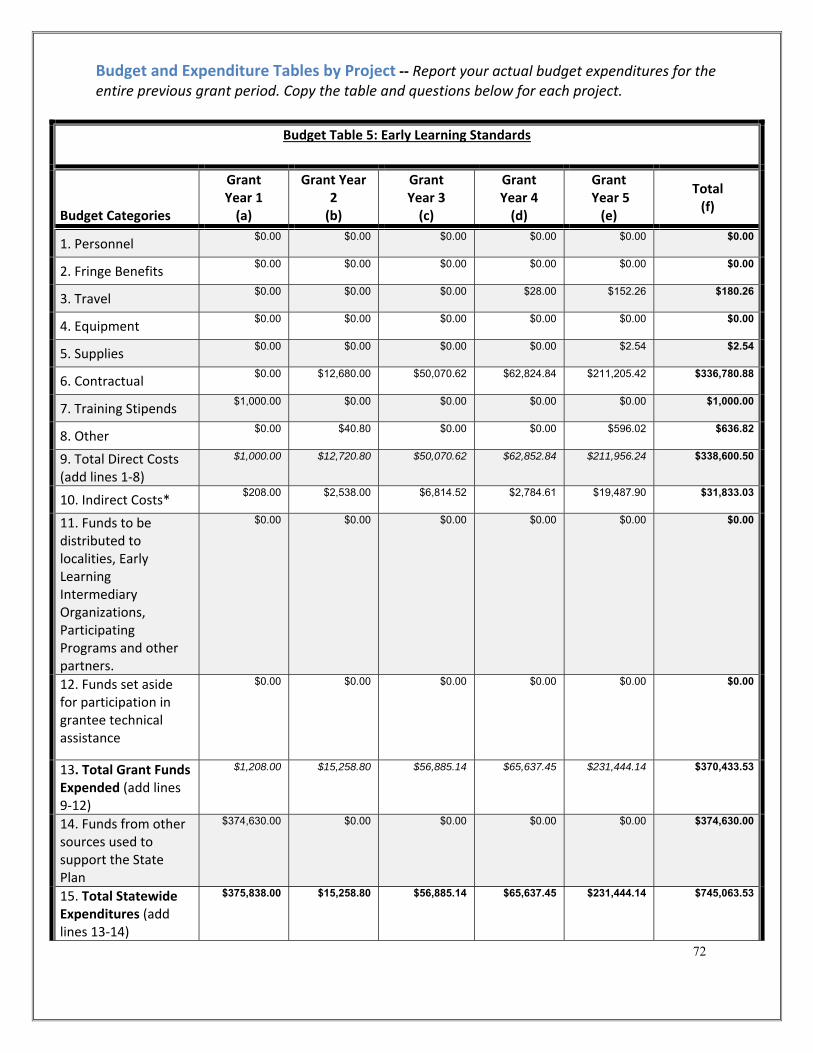
72
Budget and Expenditure Tables by Project ‐‐ Report your actual budget expenditures for the entire previous grant period. Copy the table and questions below for each project.
Budget Table 5: Early Learning Standards
Budget Categories
Grant Year 1 (a)
Grant Year 2 (b)
Grant Year 3 (c)
Grant Year 4 (d)
Grant Year 5 (e)
Total (f)
1. Personnel $0.00 $0.00 $0.00 $0.00 $0.00 $0.00
2. Fringe Benefits $0.00 $0.00 $0.00 $0.00 $0.00 $0.00
3. Travel $0.00 $0.00 $0.00 $28.00 $152.26 $180.26
4. Equipment $0.00 $0.00 $0.00 $0.00 $0.00 $0.00
5. Supplies $0.00 $0.00 $0.00 $0.00 $2.54 $2.54
6. Contractual $0.00 $12,680.00 $50,070.62 $62,824.84 $211,205.42 $336,780.88
7. Training Stipends $1,000.00 $0.00 $0.00 $0.00 $0.00 $1,000.00
8. Other $0.00 $40.80 $0.00 $0.00 $596.02 $636.82
9. Total Direct Costs (add lines 1‐8)
$1,000.00 $12,720.80 $50,070.62 $62,852.84 $211,956.24 $338,600.50
10. Indirect Costs* $208.00 $2,538.00 $6,814.52 $2,784.61 $19,487.90 $31,833.03
11. Funds to be distributed to localities, Early Learning Intermediary Organizations, Participating Programs and other partners.
$0.00 $0.00 $0.00 $0.00 $0.00 $0.00
12. Funds set aside for participation in grantee technical assistance
$0.00 $0.00 $0.00 $0.00 $0.00 $0.00
13. Total Grant Funds Expended (add lines 9‐12)
$1,208.00 $15,258.80 $56,885.14 $65,637.45 $231,444.14 $370,433.53
14. Funds from other sources used to support the State Plan
$374,630.00 $0.00 $0.00 $0.00 $0.00 $374,630.00
15. Total Statewide Expenditures (add lines 13‐14)
$375,838.00 $15,258.80 $56,885.14 $65,637.45 $231,444.14 $745,063.53

73
Columns (a) through (e): For each grant year for which funding is requested, show the total amount expended for each applicable budget category. Column (f): Show the total amount expended for all grant years. Line 6: Show the amount of funds allocated through contracts with vendors for products to be acquired and/or professional services to be provided. A State may apply its indirect cost rate only against the first $25,000 of each contract included in line 6. Line 10: If the State plans to request reimbursement for indirect costs, complete the Indirect Cost Information form at the end of this Budget section. Note that indirect costs are not allocated to line 11. Line 11: Show the amount of funds distributed to localities, Early Learning Intermediary Organizations, Participating Programs, and other partners through MOUs, interagency agreements, contracts, or other mechanisms authorized by State procurement laws. States are not required to provide budgets for how the localities, Early Learning Intermediary Organizations, Participating Programs, and other partners will use these funds. However, the Departments expect that, as part of the administration and oversight of the grant, States will monitor and track all expenditures to ensure that localities, Early Learning Intermediary Organizations, Participating Programs, and other partners spend these funds in accordance with the State Plan. Line 12: The State was expected to set aside $400,000 from its grant funds for the purpose of participating in RTT–ELC grantee technical assistance activities facilitated by ED or HHS. The State could request to amend this amount if needed. Line 13: This is the total funding expended under this grant. Line 14: Show total funding from other sources (including Federal, State, private, or local) used to support the State Plan and describe these funding sources in the budget narrative.
For each project, please provide an explanation of any discrepancies between the State’s approved budget and expenditures for the reporting period.
The Early Learning Standards expenditures were also very close to budget. There was unanticipated small mileage cost for a state employee traveling to a meeting on the Standards and additional supply charge for the same employee. Other than those minor expenses, actual indirect cost was less than anticipated.
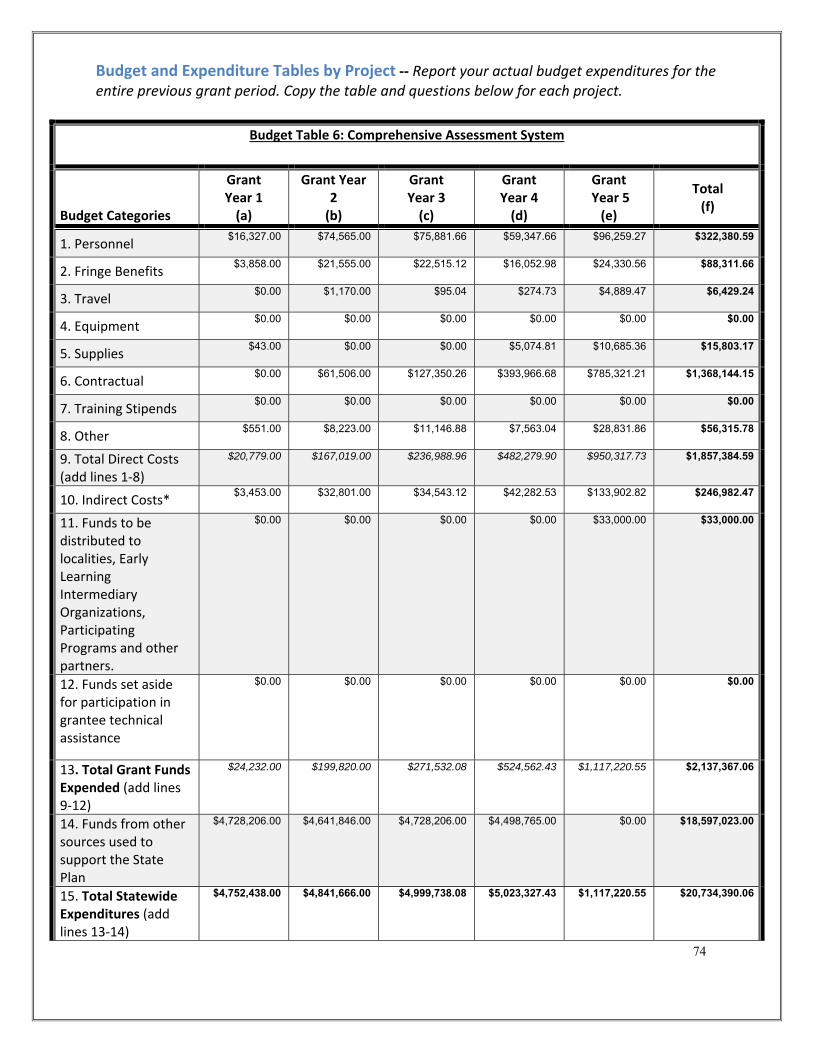
74
Budget and Expenditure Tables by Project ‐‐ Report your actual budget expenditures for the entire previous grant period. Copy the table and questions below for each project.
Budget Table 6: Comprehensive Assessment System
Budget Categories
Grant Year 1 (a)
Grant Year 2 (b)
Grant Year 3 (c)
Grant Year 4 (d)
Grant Year 5 (e)
Total (f)
1. Personnel $16,327.00 $74,565.00 $75,881.66 $59,347.66 $96,259.27 $322,380.59
2. Fringe Benefits $3,858.00 $21,555.00 $22,515.12 $16,052.98 $24,330.56 $88,311.66
3. Travel $0.00 $1,170.00 $95.04 $274.73 $4,889.47 $6,429.24
4. Equipment $0.00 $0.00 $0.00 $0.00 $0.00 $0.00
5. Supplies $43.00 $0.00 $0.00 $5,074.81 $10,685.36 $15,803.17
6. Contractual $0.00 $61,506.00 $127,350.26 $393,966.68 $785,321.21 $1,368,144.15
7. Training Stipends $0.00 $0.00 $0.00 $0.00 $0.00 $0.00
8. Other $551.00 $8,223.00 $11,146.88 $7,563.04 $28,831.86 $56,315.78
9. Total Direct Costs (add lines 1‐8)
$20,779.00 $167,019.00 $236,988.96 $482,279.90 $950,317.73 $1,857,384.59
10. Indirect Costs* $3,453.00 $32,801.00 $34,543.12 $42,282.53 $133,902.82 $246,982.47
11. Funds to be distributed to localities, Early Learning Intermediary Organizations, Participating Programs and other partners.
$0.00 $0.00 $0.00 $0.00 $33,000.00 $33,000.00
12. Funds set aside for participation in grantee technical assistance
$0.00 $0.00 $0.00 $0.00 $0.00 $0.00
13. Total Grant Funds Expended (add lines 9‐12)
$24,232.00 $199,820.00 $271,532.08 $524,562.43 $1,117,220.55 $2,137,367.06
14. Funds from other sources used to support the State Plan
$4,728,206.00 $4,641,846.00 $4,728,206.00 $4,498,765.00 $0.00 $18,597,023.00
15. Total Statewide Expenditures (add lines 13‐14)
$4,752,438.00 $4,841,666.00 $4,999,738.08 $5,023,327.43 $1,117,220.55 $20,734,390.06

75
Columns (a) through (e): For each grant year for which funding is requested, show the total amount expended for each applicable budget category. Column (f): Show the total amount expended for all grant years. Line 6: Show the amount of funds allocated through contracts with vendors for products to be acquired and/or professional services to be provided. A State may apply its indirect cost rate only against the first $25,000 of each contract included in line 6. Line 10: If the State plans to request reimbursement for indirect costs, complete the Indirect Cost Information form at the end of this Budget section. Note that indirect costs are not allocated to line 11. Line 11: Show the amount of funds distributed to localities, Early Learning Intermediary Organizations, Participating Programs, and other partners through MOUs, interagency agreements, contracts, or other mechanisms authorized by State procurement laws. States are not required to provide budgets for how the localities, Early Learning Intermediary Organizations, Participating Programs, and other partners will use these funds. However, the Departments expect that, as part of the administration and oversight of the grant, States will monitor and track all expenditures to ensure that localities, Early Learning Intermediary Organizations, Participating Programs, and other partners spend these funds in accordance with the State Plan. Line 12: The State was expected to set aside $400,000 from its grant funds for the purpose of participating in RTT–ELC grantee technical assistance activities facilitated by ED or HHS. The State could request to amend this amount if needed. Line 13: This is the total funding expended under this grant. Line 14: Show total funding from other sources (including Federal, State, private, or local) used to support the State Plan and describe these funding sources in the budget narrative.
For each project, please provide an explanation of any discrepancies between the State’s approved budget and expenditures for the reporting period.
The Comprehensive Assessment System experienced the loss of a funded staff position towards the end of the grant period and does have salary and fringe expenditures lower than budgeted amount. Some of this is offset by higher expenditures in contracts to complete the necessary work under the grant. Expenditures for grants was also lower than budgeted due to a low response rate to a grant opportunity for school districts to optimize the use of assessment data. To achieve a similar outcome, Minnesota Department of Education used these savings to improve current data collection system for child assessment to create reports for teachers to use to improve instruction. This change also resulted in higher expenditures under contracts.
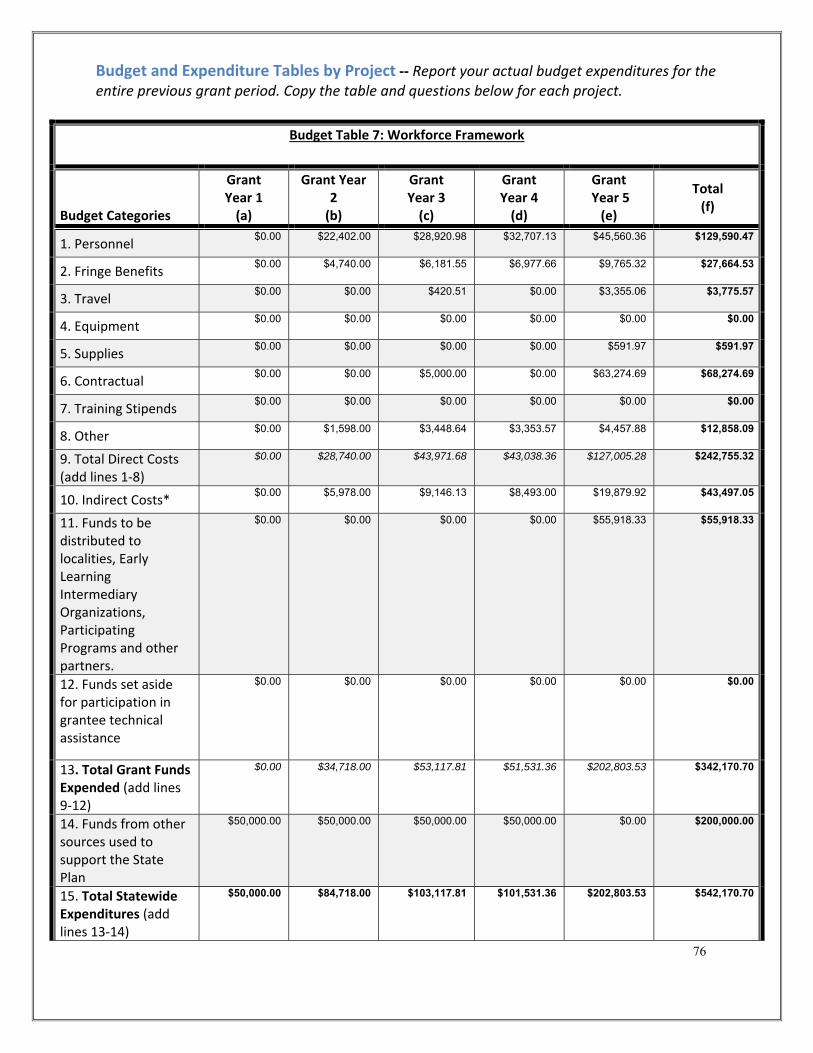
76
Budget and Expenditure Tables by Project ‐‐ Report your actual budget expenditures for the entire previous grant period. Copy the table and questions below for each project.
Budget Table 7: Workforce Framework
Budget Categories
Grant Year 1 (a)
Grant Year 2 (b)
Grant Year 3 (c)
Grant Year 4 (d)
Grant Year 5 (e)
Total (f)
1. Personnel $0.00 $22,402.00 $28,920.98 $32,707.13 $45,560.36 $129,590.47
2. Fringe Benefits $0.00 $4,740.00 $6,181.55 $6,977.66 $9,765.32 $27,664.53
3. Travel $0.00 $0.00 $420.51 $0.00 $3,355.06 $3,775.57
4. Equipment $0.00 $0.00 $0.00 $0.00 $0.00 $0.00
5. Supplies $0.00 $0.00 $0.00 $0.00 $591.97 $591.97
6. Contractual $0.00 $0.00 $5,000.00 $0.00 $63,274.69 $68,274.69
7. Training Stipends $0.00 $0.00 $0.00 $0.00 $0.00 $0.00
8. Other $0.00 $1,598.00 $3,448.64 $3,353.57 $4,457.88 $12,858.09
9. Total Direct Costs (add lines 1‐8)
$0.00 $28,740.00 $43,971.68 $43,038.36 $127,005.28 $242,755.32
10. Indirect Costs* $0.00 $5,978.00 $9,146.13 $8,493.00 $19,879.92 $43,497.05
11. Funds to be distributed to localities, Early Learning Intermediary Organizations, Participating Programs and other partners.
$0.00 $0.00 $0.00 $0.00 $55,918.33 $55,918.33
12. Funds set aside for participation in grantee technical assistance
$0.00 $0.00 $0.00 $0.00 $0.00 $0.00
13. Total Grant Funds Expended (add lines 9‐12)
$0.00 $34,718.00 $53,117.81 $51,531.36 $202,803.53 $342,170.70
14. Funds from other sources used to support the State Plan
$50,000.00 $50,000.00 $50,000.00 $50,000.00 $0.00 $200,000.00
15. Total Statewide Expenditures (add lines 13‐14)
$50,000.00 $84,718.00 $103,117.81 $101,531.36 $202,803.53 $542,170.70
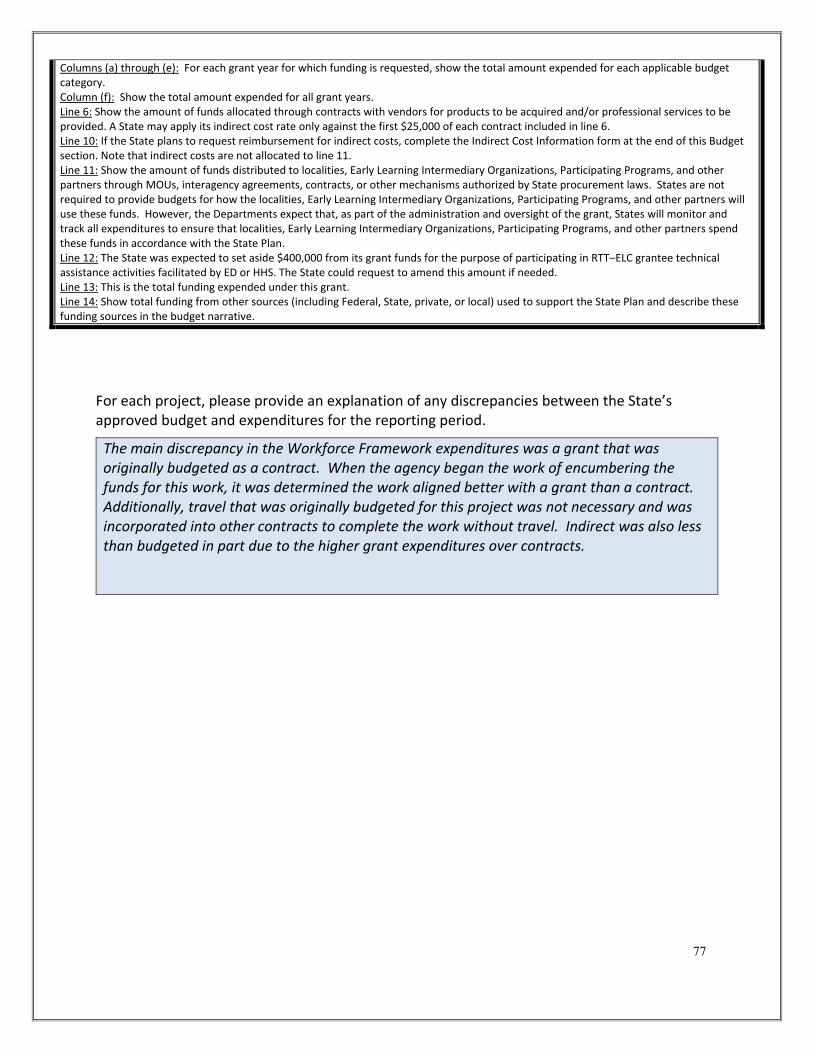
77
Columns (a) through (e): For each grant year for which funding is requested, show the total amount expended for each applicable budget category. Column (f): Show the total amount expended for all grant years. Line 6: Show the amount of funds allocated through contracts with vendors for products to be acquired and/or professional services to be provided. A State may apply its indirect cost rate only against the first $25,000 of each contract included in line 6. Line 10: If the State plans to request reimbursement for indirect costs, complete the Indirect Cost Information form at the end of this Budget section. Note that indirect costs are not allocated to line 11. Line 11: Show the amount of funds distributed to localities, Early Learning Intermediary Organizations, Participating Programs, and other partners through MOUs, interagency agreements, contracts, or other mechanisms authorized by State procurement laws. States are not required to provide budgets for how the localities, Early Learning Intermediary Organizations, Participating Programs, and other partners will use these funds. However, the Departments expect that, as part of the administration and oversight of the grant, States will monitor and track all expenditures to ensure that localities, Early Learning Intermediary Organizations, Participating Programs, and other partners spend these funds in accordance with the State Plan. Line 12: The State was expected to set aside $400,000 from its grant funds for the purpose of participating in RTT–ELC grantee technical assistance activities facilitated by ED or HHS. The State could request to amend this amount if needed. Line 13: This is the total funding expended under this grant. Line 14: Show total funding from other sources (including Federal, State, private, or local) used to support the State Plan and describe these funding sources in the budget narrative.
For each project, please provide an explanation of any discrepancies between the State’s approved budget and expenditures for the reporting period.
The main discrepancy in the Workforce Framework expenditures was a grant that was originally budgeted as a contract. When the agency began the work of encumbering the funds for this work, it was determined the work aligned better with a grant than a contract. Additionally, travel that was originally budgeted for this project was not necessary and was incorporated into other contracts to complete the work without travel. Indirect was also less than budgeted in part due to the higher grant expenditures over contracts.

78
Budget and Expenditure Tables by Project ‐‐ Report your actual budget expenditures for the entire previous grant period. Copy the table and questions below for each project.
Budget Table 8: Workforce Support
Budget Categories
Grant Year 1 (a)
Grant Year 2 (b)
Grant Year 3 (c)
Grant Year 4 (d)
Grant Year 5 (e)
Total (f)
1. Personnel $0.00 $0.00 $11,798.79 $8,848.00 $0.00 $20,646.79
2. Fringe Benefits $0.00 $0.00 $2,652.21 $1,908.28 $0.00 $4,560.49
3. Travel $0.00 $0.00 $42.33 $0.00 $0.00 $42.33
4. Equipment $0.00 $0.00 $0.00 $0.00 $0.00 $0.00
5. Supplies $0.00 $0.00 $0.00 $0.00 $0.00 $0.00
6. Contractual $0.00 $832,786.00 $1,138,309.41 $1,421,434.73 $2,236,469.86 $5,629,000.00
7. Training Stipends $0.00 $0.00 $0.00 $0.00 $0.00 $0.00
8. Other $0.00 $0.00 $827.17 $1,074.86 $0.00 $1,902.03
9. Total Direct Costs (add lines 1‐8)
$0.00 $832,786.00 $1,153,629.91 $1,433,265.87 $2,236,469.86 $5,656,151.64
10. Indirect Costs* $0.00 $0.00 $3,186.69 $2,458.54 $0.00 $5,645.23
11. Funds to be distributed to localities, Early Learning Intermediary Organizations, Participating Programs and other partners.
$0.00 $0.00 $0.00 $0.00 $0.00 $0.00
12. Funds set aside for participation in grantee technical assistance
$0.00 $0.00 $0.00 $0.00 $0.00 $0.00
13. Total Grant Funds Expended (add lines 9‐12)
$0.00 $832,786.00 $1,156,816.60 $1,435,724.41 $2,236,469.86 $5,661,796.87
14. Funds from other sources used to support the State Plan
$3,195,000.00 $3,195,000.00 $2,655,000.00 $2,655,000.00 $0.00 $11,700,000.00
15. Total Statewide Expenditures (add lines 13‐14)
$3,195,000.00 $4,027,786.00 $3,811,816.60 $4,090,724.41 $2,236,469.86 $17,361,796.87

79
Columns (a) through (e): For each grant year for which funding is requested, show the total amount expended for each applicable budget category. Column (f): Show the total amount expended for all grant years. Line 6: Show the amount of funds allocated through contracts with vendors for products to be acquired and/or professional services to be provided. A State may apply its indirect cost rate only against the first $25,000 of each contract included in line 6. Line 10: If the State plans to request reimbursement for indirect costs, complete the Indirect Cost Information form at the end of this Budget section. Note that indirect costs are not allocated to line 11. Line 11: Show the amount of funds distributed to localities, Early Learning Intermediary Organizations, Participating Programs, and other partners through MOUs, interagency agreements, contracts, or other mechanisms authorized by State procurement laws. States are not required to provide budgets for how the localities, Early Learning Intermediary Organizations, Participating Programs, and other partners will use these funds. However, the Departments expect that, as part of the administration and oversight of the grant, States will monitor and track all expenditures to ensure that localities, Early Learning Intermediary Organizations, Participating Programs, and other partners spend these funds in accordance with the State Plan. Line 12: The State was expected to set aside $400,000 from its grant funds for the purpose of participating in RTT–ELC grantee technical assistance activities facilitated by ED or HHS. The State could request to amend this amount if needed. Line 13: This is the total funding expended under this grant. Line 14: Show total funding from other sources (including Federal, State, private, or local) used to support the State Plan and describe these funding sources in the budget narrative.
For each project, please provide an explanation of any discrepancies between the State’s approved budget and expenditures for the reporting period.
Expenditures for the Workforce Support project were higher in the contract amount than originally budgeted in order to provide additional training and supports to the early childhood workforce in the final year of the grant. Salary and fringe were slightly below budget due to completion of staff work earlier than expected.

80
Budget and Expenditure Tables by Project ‐‐ Report your actual budget expenditures for the entire previous grant period. Copy the table and questions below for each project.
Budget Table 9: K Entry Assessment
Budget Categories
Grant Year 1 (a)
Grant Year 2 (b)
Grant Year 3 (c)
Grant Year 4 (d)
Grant Year 5 (e)
Total (f)
1. Personnel $0.00 $12,871.02 $24,562.35 $23,441.73 $33,801.58 $94,676.68
2. Fringe Benefits $0.00 $3,106.94 $5,418.05 $4,867.47 $7,375.03 $20,767.49
3. Travel $0.00 ($232.31) $77.52 $0.00 $2.04 ($152.75)
4. Equipment $0.00 $0.00 $0.00 $0.00 $0.00 $0.00
5. Supplies $0.00 $0.00 $4,318.20 $0.00 $0.00 $4,318.20
6. Contractual $0.00 $0.00 $87,023.67 $13,800.00 $0.00 $100,823.67
7. Training Stipends $0.00 $0.00 $0.00 $0.00 $0.00 $0.00
8. Other $0.00 $1,332.83 $4,295.45 $3,003.87 $3,740.61 $12,372.76
9. Total Direct Costs (add lines 1‐8)
$0.00 $17,078.48 $125,695.24 $45,113.07 $44,919.26 $232,806.05
10. Indirect Costs* $0.00 $3,552.35 $20,098.04 $9,027.76 $8,552.53 $41,230.68
11. Funds to be distributed to localities, Early Learning Intermediary Organizations, Participating Programs and other partners.
$0.00 $0.00 $0.00 $0.00 $0.00 $0.00
12. Funds set aside for participation in grantee technical assistance
$0.00 $0.00 $0.00 $0.00 $0.00 $0.00
13. Total Grant Funds Expended (add lines 9‐12)
$0.00 $20,630.83 $145,793.28 $54,140.83 $53,471.79 $274,036.73
14. Funds from other sources used to support the State Plan
$281,000.00 $281,000.00 $281,000.00 $281,000.00 $281,000.00 $1,405,000.00
15. Total Statewide Expenditures (add lines 13‐14)
$281,000.00 $301,630.83 $426,793.28 $335,140.83 $334,471.79 $1,679,036.73

81
Columns (a) through (e): For each grant year for which funding is requested, show the total amount expended for each applicable budget category. Column (f): Show the total amount expended for all grant years. Line 6: Show the amount of funds allocated through contracts with vendors for products to be acquired and/or professional services to be provided. A State may apply its indirect cost rate only against the first $25,000 of each contract included in line 6. Line 10: If the State plans to request reimbursement for indirect costs, complete the Indirect Cost Information form at the end of this Budget section. Note that indirect costs are not allocated to line 11. Line 11: Show the amount of funds distributed to localities, Early Learning Intermediary Organizations, Participating Programs, and other partners through MOUs, interagency agreements, contracts, or other mechanisms authorized by State procurement laws. States are not required to provide budgets for how the localities, Early Learning Intermediary Organizations, Participating Programs, and other partners will use these funds. However, the Departments expect that, as part of the administration and oversight of the grant, States will monitor and track all expenditures to ensure that localities, Early Learning Intermediary Organizations, Participating Programs, and other partners spend these funds in accordance with the State Plan. Line 12: The State was expected to set aside $400,000 from its grant funds for the purpose of participating in RTT–ELC grantee technical assistance activities facilitated by ED or HHS. The State could request to amend this amount if needed. Line 13: This is the total funding expended under this grant. Line 14: Show total funding from other sources (including Federal, State, private, or local) used to support the State Plan and describe these funding sources in the budget narrative.
For each project, please provide an explanation of any discrepancies between the State’s approved budget and expenditures for the reporting period.
Like the Comprehensive Assessment System expenditures, the expenditures for the K Entry Assessment are slightly lower than budgeted for salary and fringe due to staff leaving towards the end of the grant period. Some of these savings are made up through increased contract expenditures in an effort to maintain the work through the end of the grant.
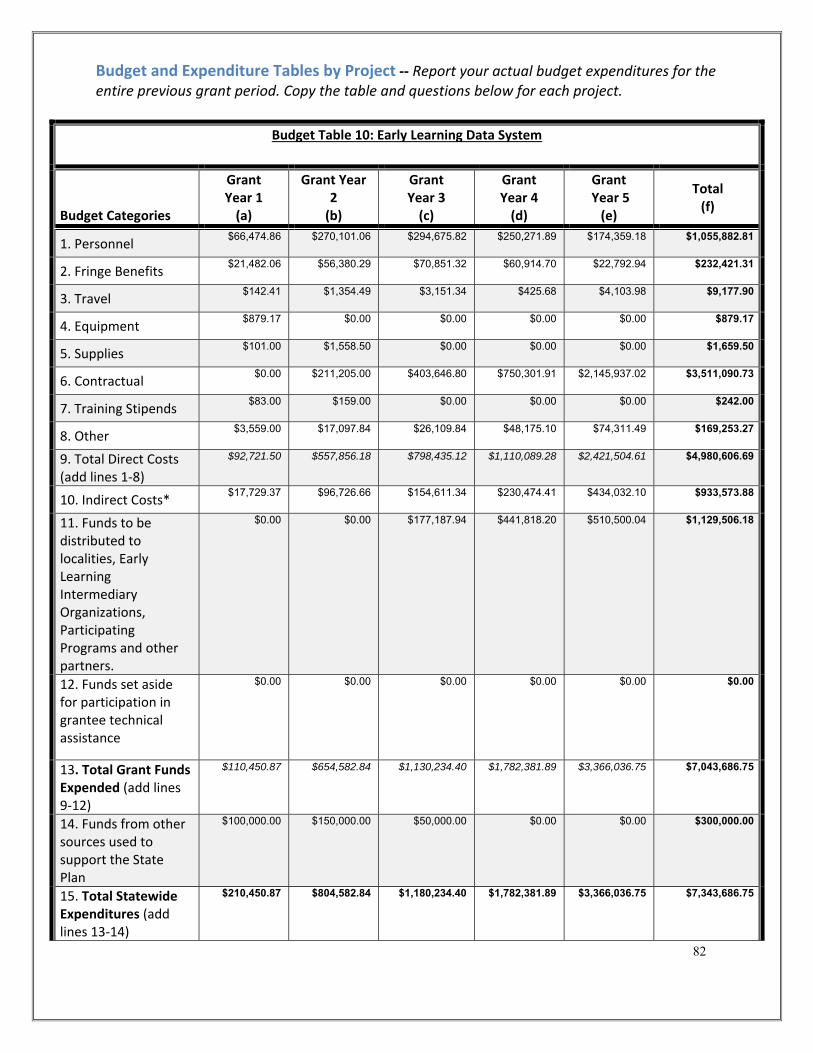
82
Budget and Expenditure Tables by Project ‐‐ Report your actual budget expenditures for the entire previous grant period. Copy the table and questions below for each project.
Budget Table 10: Early Learning Data System
Budget Categories
Grant Year 1 (a)
Grant Year 2 (b)
Grant Year 3 (c)
Grant Year 4 (d)
Grant Year 5 (e)
Total (f)
1. Personnel $66,474.86 $270,101.06 $294,675.82 $250,271.89 $174,359.18 $1,055,882.81
2. Fringe Benefits $21,482.06 $56,380.29 $70,851.32 $60,914.70 $22,792.94 $232,421.31
3. Travel $142.41 $1,354.49 $3,151.34 $425.68 $4,103.98 $9,177.90
4. Equipment $879.17 $0.00 $0.00 $0.00 $0.00 $879.17
5. Supplies $101.00 $1,558.50 $0.00 $0.00 $0.00 $1,659.50
6. Contractual $0.00 $211,205.00 $403,646.80 $750,301.91 $2,145,937.02 $3,511,090.73
7. Training Stipends $83.00 $159.00 $0.00 $0.00 $0.00 $242.00
8. Other $3,559.00 $17,097.84 $26,109.84 $48,175.10 $74,311.49 $169,253.27
9. Total Direct Costs (add lines 1‐8)
$92,721.50 $557,856.18 $798,435.12 $1,110,089.28 $2,421,504.61 $4,980,606.69
10. Indirect Costs* $17,729.37 $96,726.66 $154,611.34 $230,474.41 $434,032.10 $933,573.88
11. Funds to be distributed to localities, Early Learning Intermediary Organizations, Participating Programs and other partners.
$0.00 $0.00 $177,187.94 $441,818.20 $510,500.04 $1,129,506.18
12. Funds set aside for participation in grantee technical assistance
$0.00 $0.00 $0.00 $0.00 $0.00 $0.00
13. Total Grant Funds Expended (add lines 9‐12)
$110,450.87 $654,582.84 $1,130,234.40 $1,782,381.89 $3,366,036.75 $7,043,686.75
14. Funds from other sources used to support the State Plan
$100,000.00 $150,000.00 $50,000.00 $0.00 $0.00 $300,000.00
15. Total Statewide Expenditures (add lines 13‐14)
$210,450.87 $804,582.84 $1,180,234.40 $1,782,381.89 $3,366,036.75 $7,343,686.75
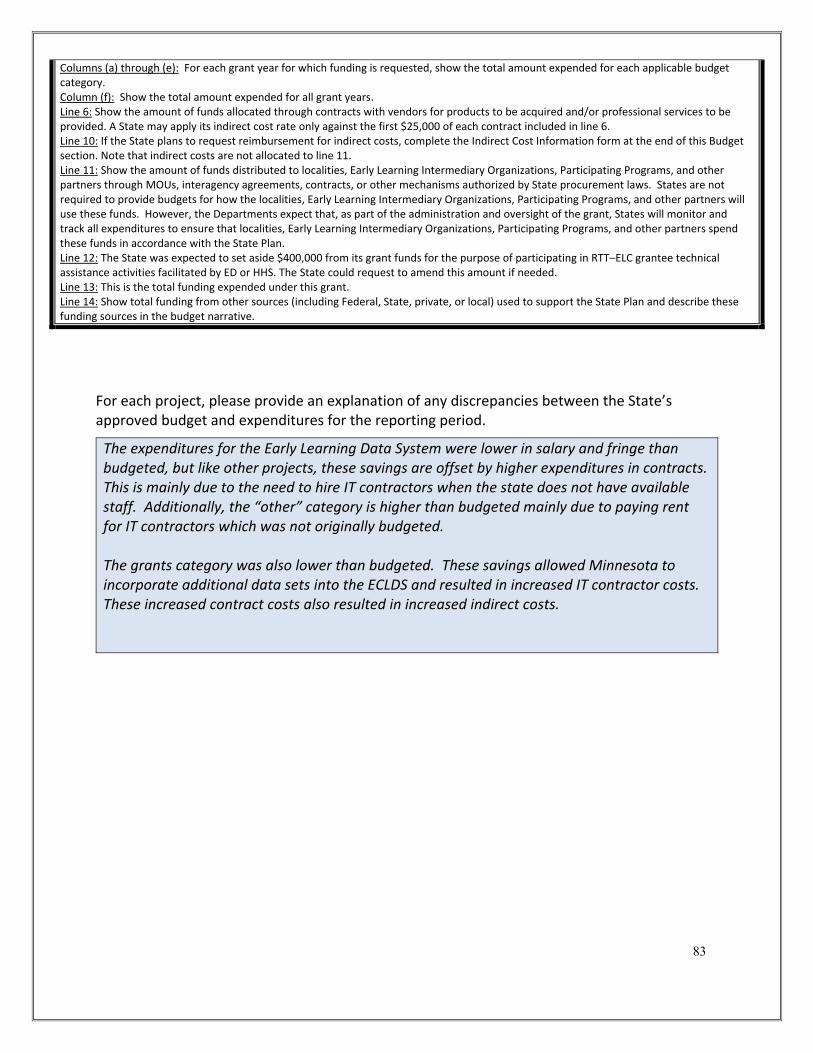
83
Columns (a) through (e): For each grant year for which funding is requested, show the total amount expended for each applicable budget category. Column (f): Show the total amount expended for all grant years. Line 6: Show the amount of funds allocated through contracts with vendors for products to be acquired and/or professional services to be provided. A State may apply its indirect cost rate only against the first $25,000 of each contract included in line 6. Line 10: If the State plans to request reimbursement for indirect costs, complete the Indirect Cost Information form at the end of this Budget section. Note that indirect costs are not allocated to line 11. Line 11: Show the amount of funds distributed to localities, Early Learning Intermediary Organizations, Participating Programs, and other partners through MOUs, interagency agreements, contracts, or other mechanisms authorized by State procurement laws. States are not required to provide budgets for how the localities, Early Learning Intermediary Organizations, Participating Programs, and other partners will use these funds. However, the Departments expect that, as part of the administration and oversight of the grant, States will monitor and track all expenditures to ensure that localities, Early Learning Intermediary Organizations, Participating Programs, and other partners spend these funds in accordance with the State Plan. Line 12: The State was expected to set aside $400,000 from its grant funds for the purpose of participating in RTT–ELC grantee technical assistance activities facilitated by ED or HHS. The State could request to amend this amount if needed. Line 13: This is the total funding expended under this grant. Line 14: Show total funding from other sources (including Federal, State, private, or local) used to support the State Plan and describe these funding sources in the budget narrative.
For each project, please provide an explanation of any discrepancies between the State’s approved budget and expenditures for the reporting period.
The expenditures for the Early Learning Data System were lower in salary and fringe than budgeted, but like other projects, these savings are offset by higher expenditures in contracts. This is mainly due to the need to hire IT contractors when the state does not have available staff. Additionally, the “other” category is higher than budgeted mainly due to paying rent for IT contractors which was not originally budgeted. The grants category was also lower than budgeted. These savings allowed Minnesota to incorporate additional data sets into the ECLDS and resulted in increased IT contractor costs. These increased contract costs also resulted in increased indirect costs.

84
Budget and Expenditure Tables by Project ‐‐ Report your actual budget expenditures for the entire previous grant period. Copy the table and questions below for each project.
Budget Table 11: Family Friend and Neighbor (FFN)
Budget Categories
Grant Year 1 (a)
Grant Year 2 (b)
Grant Year 3 (c)
Grant Year 4 (d)
Grant Year 5 (e)
Total (f)
1. Personnel $0.00 $0.00 $0.00 $0.00 $0.00 $0.00
2. Fringe Benefits $0.00 $0.00 $0.00 $0.00 $0.00 $0.00
3. Travel $0.00 $0.00 $0.00 $0.00 $0.00 $0.00
4. Equipment $0.00 $0.00 $0.00 $0.00 $0.00 $0.00
5. Supplies $150.00 $1,034.97 $754.16 $2,956.63 $0.00 $4,895.76
6. Contractual $0.00 $1,500.00 $7,000.00 $38,000.00 $0.00 $46,500.00
7. Training Stipends $0.00 $0.00 $0.00 $0.00 $0.00 $0.00
8. Other $0.00 $0.00 $0.00 $0.00 $0.00 $0.00
9. Total Direct Costs (add lines 1‐8)
$150.00 $2,534.97 $7,754.16 $40,956.63 $0.00 $51,395.76
10. Indirect Costs* $0.00 $558.46 $1,612.86 $7,924.98 $0.00 $10,096.30
11. Funds to be distributed to localities, Early Learning Intermediary Organizations, Participating Programs and other partners.
$0.00 $0.00 $0.00 $0.00 $0.00 $0.00
12. Funds set aside for participation in grantee technical assistance
$0.00 $0.00 $0.00 $0.00 $0.00 $0.00
13. Total Grant Funds Expended (add lines 9‐12)
$150.00 $3,093.43 $9,367.02 $48,881.61 $0.00 $61,492.06
14. Funds from other sources used to support the State Plan
$49,000.00 $49,000.00 $49,000.00 $49,000.00 $0.00 $196,000.00
15. Total Statewide Expenditures (add lines 13‐14)
$49,150.00 $52,093.43 $58,367.02 $97,881.61 $0.00 $257,492.06

85
Columns (a) through (e): For each grant year for which funding is requested, show the total amount expended for each applicable budget category. Column (f): Show the total amount expended for all grant years. Line 6: Show the amount of funds allocated through contracts with vendors for products to be acquired and/or professional services to be provided. A State may apply its indirect cost rate only against the first $25,000 of each contract included in line 6. Line 10: If the State plans to request reimbursement for indirect costs, complete the Indirect Cost Information form at the end of this Budget section. Note that indirect costs are not allocated to line 11. Line 11: Show the amount of funds distributed to localities, Early Learning Intermediary Organizations, Participating Programs, and other partners through MOUs, interagency agreements, contracts, or other mechanisms authorized by State procurement laws. States are not required to provide budgets for how the localities, Early Learning Intermediary Organizations, Participating Programs, and other partners will use these funds. However, the Departments expect that, as part of the administration and oversight of the grant, States will monitor and track all expenditures to ensure that localities, Early Learning Intermediary Organizations, Participating Programs, and other partners spend these funds in accordance with the State Plan. Line 12: The State was expected to set aside $400,000 from its grant funds for the purpose of participating in RTT–ELC grantee technical assistance activities facilitated by ED or HHS. The State could request to amend this amount if needed. Line 13: This is the total funding expended under this grant. Line 14: Show total funding from other sources (including Federal, State, private, or local) used to support the State Plan and describe these funding sources in the budget narrative.
For each project, please provide an explanation of any discrepancies between the State’s approved budget and expenditures for the reporting period.
This project was closed out at the end of the fourth year of the grant and there are no discrepancies between expenditures and budget.

86
Budget and Expenditure Tables by Project ‐‐ Report your actual budget expenditures for the entire previous grant period. Copy the table and questions below for each project.
Budget Table 12: Public Private Partnership
Budget Categories
Grant Year 1 (a)
Grant Year 2 (b)
Grant Year 3 (c)
Grant Year 4 (d)
Grant Year 5 (e)
Total (f)
1. Personnel $0.00 $0.00 $0.00 $0.00 $0.00 $0.00
2. Fringe Benefits $0.00 $0.00 $0.00 $0.00 $0.00 $0.00
3. Travel $0.00 $0.00 $0.00 $0.00 $0.00 $0.00
4. Equipment $0.00 $0.00 $0.00 $0.00 $0.00 $0.00
5. Supplies $0.00 $0.00 $0.00 $0.00 $0.00 $0.00
6. Contractual $0.00 $0.00 $0.00 $35,563.71 $64,436.26 $99,999.97
7. Training Stipends $0.00 $0.00 $0.00 $0.00 $0.00 $0.00
8. Other $0.00 $0.00 $0.00 $0.00 $0.00 $0.00
9. Total Direct Costs (add lines 1‐8)
$0.00 $0.00 $0.00 $35,563.71 $64,436.26 $99,999.97
10. Indirect Costs* $0.00 $0.00 $0.00 $0.00 $0.00 $0.00
11. Funds to be distributed to localities, Early Learning Intermediary Organizations, Participating Programs and other partners.
$0.00 $0.00 $0.00 $0.00 $0.00 $0.00
12. Funds set aside for participation in grantee technical assistance
$0.00 $0.00 $0.00 $0.00 $0.00 $0.00
13. Total Grant Funds Expended (add lines 9‐12)
$0.00 $0.00 $0.00 $35,563.71 $64,436.26 $99,999.97
14. Funds from other sources used to support the State Plan
$0.00 $0.00 $0.00 $0.00 $0.00 $0.00
15. Total Statewide Expenditures (add lines 13‐14)
$0.00 $0.00 $0.00 $35,563.71 $64,436.26 $99,999.97
87
Columns (a) through (e): For each grant year for which funding is requested, show the total amount expended for each applicable budget category. Column (f): Show the total amount expended for all grant years. Line 6: Show the amount of funds allocated through contracts with vendors for products to be acquired and/or professional services to be provided. A State may apply its indirect cost rate only against the first $25,000 of each contract included in line 6. Line 10: If the State plans to request reimbursement for indirect costs, complete the Indirect Cost Information form at the end of this Budget section. Note that indirect costs are not allocated to line 11. Line 11: Show the amount of funds distributed to localities, Early Learning Intermediary Organizations, Participating Programs, and other partners through MOUs, interagency agreements, contracts, or other mechanisms authorized by State procurement laws. States are not required to provide budgets for how the localities, Early Learning Intermediary Organizations, Participating Programs, and other partners will use these funds. However, the Departments expect that, as part of the administration and oversight of the grant, States will monitor and track all expenditures to ensure that localities, Early Learning Intermediary Organizations, Participating Programs, and other partners spend these funds in accordance with the State Plan. Line 12: The State was expected to set aside $400,000 from its grant funds for the purpose of participating in RTT–ELC grantee technical assistance activities facilitated by ED or HHS. The State could request to amend this amount if needed. Line 13: This is the total funding expended under this grant. Line 14: Show total funding from other sources (including Federal, State, private, or local) used to support the State Plan and describe these funding sources in the budget narrative.
For each project, please provide an explanation of any discrepancies between the State’s approved budget and expenditures for the reporting period.
The Private Public Partnership was a contract to an individual organization and came in right on budget.
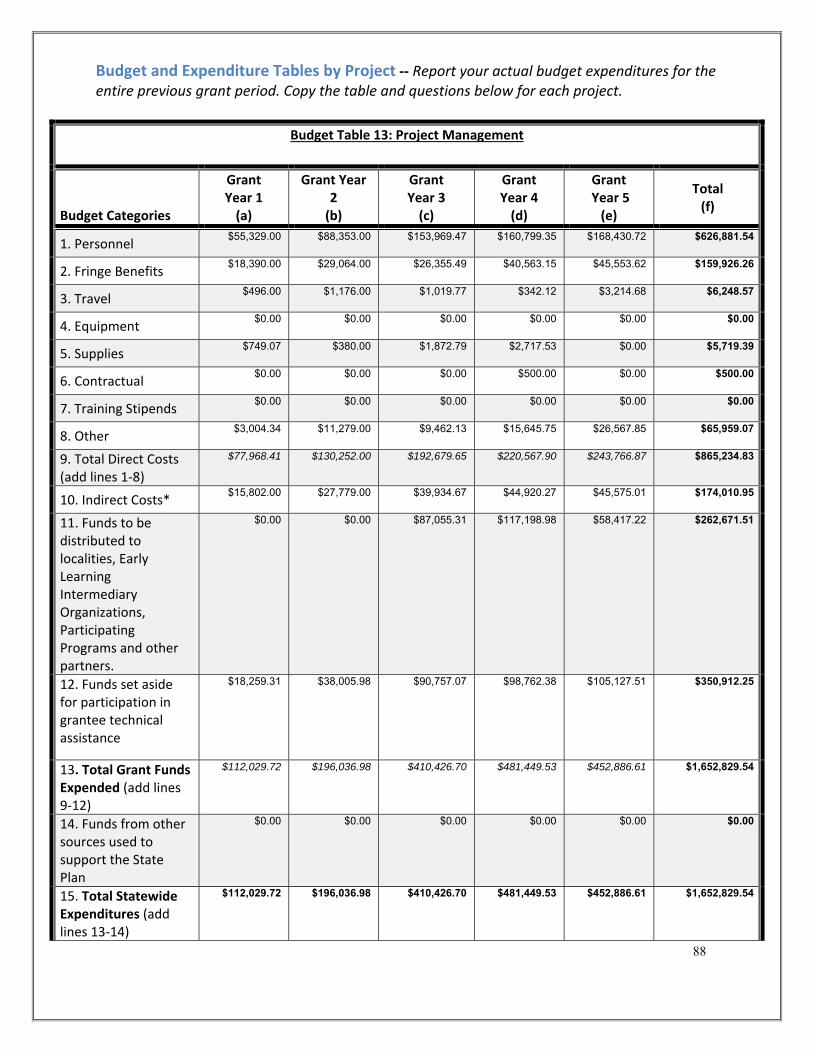
88
Budget and Expenditure Tables by Project ‐‐ Report your actual budget expenditures for the entire previous grant period. Copy the table and questions below for each project.
Budget Table 13: Project Management
Budget Categories
Grant Year 1 (a)
Grant Year 2 (b)
Grant Year 3 (c)
Grant Year 4 (d)
Grant Year 5 (e)
Total (f)
1. Personnel $55,329.00 $88,353.00 $153,969.47 $160,799.35 $168,430.72 $626,881.54
2. Fringe Benefits $18,390.00 $29,064.00 $26,355.49 $40,563.15 $45,553.62 $159,926.26
3. Travel $496.00 $1,176.00 $1,019.77 $342.12 $3,214.68 $6,248.57
4. Equipment $0.00 $0.00 $0.00 $0.00 $0.00 $0.00
5. Supplies $749.07 $380.00 $1,872.79 $2,717.53 $0.00 $5,719.39
6. Contractual $0.00 $0.00 $0.00 $500.00 $0.00 $500.00
7. Training Stipends $0.00 $0.00 $0.00 $0.00 $0.00 $0.00
8. Other $3,004.34 $11,279.00 $9,462.13 $15,645.75 $26,567.85 $65,959.07
9. Total Direct Costs (add lines 1‐8)
$77,968.41 $130,252.00 $192,679.65 $220,567.90 $243,766.87 $865,234.83
10. Indirect Costs* $15,802.00 $27,779.00 $39,934.67 $44,920.27 $45,575.01 $174,010.95
11. Funds to be distributed to localities, Early Learning Intermediary Organizations, Participating Programs and other partners.
$0.00 $0.00 $87,055.31 $117,198.98 $58,417.22 $262,671.51
12. Funds set aside for participation in grantee technical assistance
$18,259.31 $38,005.98 $90,757.07 $98,762.38 $105,127.51 $350,912.25
13. Total Grant Funds Expended (add lines 9‐12)
$112,029.72 $196,036.98 $410,426.70 $481,449.53 $452,886.61 $1,652,829.54
14. Funds from other sources used to support the State Plan
$0.00 $0.00 $0.00 $0.00 $0.00 $0.00
15. Total Statewide Expenditures (add lines 13‐14)
$112,029.72 $196,036.98 $410,426.70 $481,449.53 $452,886.61 $1,652,829.54

89
Columns (a) through (e): For each grant year for which funding is requested, show the total amount expended for each applicable budget category. Column (f): Show the total amount expended for all grant years. Line 6: Show the amount of funds allocated through contracts with vendors for products to be acquired and/or professional services to be provided. A State may apply its indirect cost rate only against the first $25,000 of each contract included in line 6. Line 10: If the State plans to request reimbursement for indirect costs, complete the Indirect Cost Information form at the end of this Budget section. Note that indirect costs are not allocated to line 11. Line 11: Show the amount of funds distributed to localities, Early Learning Intermediary Organizations, Participating Programs, and other partners through MOUs, interagency agreements, contracts, or other mechanisms authorized by State procurement laws. States are not required to provide budgets for how the localities, Early Learning Intermediary Organizations, Participating Programs, and other partners will use these funds. However, the Departments expect that, as part of the administration and oversight of the grant, States will monitor and track all expenditures to ensure that localities, Early Learning Intermediary Organizations, Participating Programs, and other partners spend these funds in accordance with the State Plan. Line 12: The State was expected to set aside $400,000 from its grant funds for the purpose of participating in RTT–ELC grantee technical assistance activities facilitated by ED or HHS. The State could request to amend this amount if needed. Line 13: This is the total funding expended under this grant. Line 14: Show total funding from other sources (including Federal, State, private, or local) used to support the State Plan and describe these funding sources in the budget narrative.
For each project, please provide an explanation of any discrepancies between the State’s approved budget and expenditures for the reporting period.
The Project Management project had increased expenditures in salary and fringe due to a change in the Minnesota Department of Education’s indirect cost rate towards the end of the grant. The change resulted in the direct charge of agency finance staff time instead of using indirect to cover their costs like was originally budgeted. Additionally, expenditures for grants are slightly lower and budgeted due to a grantee completing work under budget. The travel expenditures were also higher than budgeted in order to allow Minnesota to attend the Federal RTT‐ELC meeting in November 2016.