2016 environmental, health & safety annual …€¦ · for 2016, edwards received no serious or...
TRANSCRIPT

Edwards Lifesciences LLC One Edwards Way Irvine, CA USA 92614
Phone: 949.250.2500 Fax: 949.250.2525 www.edwards.com (Unaudited Report. For General Internal Use Only)
2016ENVIRONMENTAL, HEALTH & SAFETY
ANNUAL PERFORMANCE REPORT
Covering the period from January 1, 2016 to December 31, 2016
EDWARDS LIFESCIENCES’ EHS POLICY
Edwards will provide a safe and healthy workplace, promote environmental excellence in our operations and communities and
participate in the EHS programs of our customers and stakeholders. Edwards will comply with relevant government
regulations, medical device industry standards and other requirements to which the company subscribes.
We the employees of Edwards Lifesciences are pleased to present the Edwards’ 2017 Environmental Health & Safety (EHS) Annual Report reflecting our progress for the calendar year 2016. As Edwards continues to grow in operations, real estate, employee headcount and overall revenue, we have successfully maintained an EHS program consistent with recognized leaders in our medical device industry. For 2016, Edwards received no serious or willful violations from EHS-related government agencies, sustained no catastrophic injuries or casualties and prevented any significant release of hazardous substances to our environment. We have also continued our vision of obtaining ISO 14001 Environmental Management Systems (EMS) accreditation at all of our manufacturing locations as 66% of our sites maintained their certifications. Our overall EHS vision at Edwards is very simple as expressed in our EHS Policy.
1. We will obey all applicable EHS regulations and follow industry standards 2. We will work to prevent occupational injuries and illnesses 3. We will strive to reduce our environmental footprint 4. We will continuously improve on these three core elements of our EHS program 5. We will publicly report results as appropriate to our interested stakeholders
Our EHS Annual report is organized to meet EHS related Global Reporting Initiative (GRI), CDP Climate Change and Water Conservation reporting and applicable elements of the Dow Jones Sustainability Index (DJSI).
1Version 2017-06-08 1

Edwards Lifesciences LLC One Edwards Way Irvine, CA USA 92614
Phone: 949.250.2500 Fax: 949.250.2525 www.edwards.com (Unaudited Report. For General Internal Use Only)
2017 EHS Annual Performance Report Table of Contents
Section Topic Reference Page
1.0 Management Approach GRI 103; DJSI 2.1, 2.2 3 2.0 EHS Compliance GRI 307; DJSI 2.2 10 3.0 Occupational Health & Safety GRI 403; DJSI 3.7 12 4.0 Energy GRI 302, CDP 20 5.0 Water GRI 303; DJSI 2.3.4, CDP 36 6.0 Biodiversity GRI 304 43 7.0 Emissions GRI 305; DJSI 2.3, 2.4, CDP 52 8.0 Effluents & Waste GRI 306 67 9.0 Indirect Suppliers GRI 308 80
10.0 Edwards’ Europe Environmental Report NA 84 Appendix ISO & OHSAS Certifications 87
Additional Information and References
Edwards Global Sustainability Report and other public reporting:
• For Edwards entire Sustainability Report and Aspirations please refer to http://www.edwards.com/sustainability/?r=home
• For Materials (GRI 301) programs please refer to Edwards’ Sustainability Report
http://www.edwards.com/sustainability/products/chemical-and-materials-stewardship/
• For Direct Supplier (GRI 308) programs please refer to Edwards Sustainability Report http://www.edwards.com/sustainability/products/supply-chain-management/
• Additional public reporting information with regards to Climate Change and Water
Conservation may be found on the CDP public reporting website www.cdp.net.
2Version 2017-06-08 2

Section 1.0 EHS MANAGEMENT APPROACH
(GRI 103) Edwards Lifesciences’ Global EHS Management System (EHS-MS) and its performance and results are an integral part of Edwards’ Global Sustainability Program. The EHS program aligns with relevant economic, social and environmental factors of the Global Reporting Initiative (GRI) Standards, CDP, Dow Jones Sustainability Index (DJSI), ISO 14001 Environmental Standards, OHSAS 18001 Occupational Health & Safety Standards and other relevant public reporting, certification and accountability programs. Edwards’ management approach to implementing its global EHS program is designed to ensure that the Corporate EHS function remains an impartial and objective overseer to Edwards’ Operating Business Units as well as an effective partner with Edwards’ external stakeholders, including government authorities, customers, investor groups, local communities and professional affiliations.
Our overall management approach focuses on our EHS philosophy of Employee Ownership and Supervisor Accountability with regards to EHS compliance and addressing those significant environmental aspects and occupational health and safety hazards which we have determined to be material or significant to the success of our program.
Materiality (GRI 103-1)
Although Edwards’ EHS-MS encompasses a variety of topics, it focuses on those elements which are determined to be most important, or material, to our internal and external stakeholders. We implement two levels of materiality based on Corporate and Operations Levels strategic planning timeframes and EHS risks and opportunities.
At the corporate level, our EHS materiality assessment process includes a continuous analysis of EHS compliance, periodic benchmarking of our medical industry peers, annual review of past performance and incorporation of EHS topics into Edwards’ overall Global Sustainability materiality assessment, including engaging with 42 internal and 20 external stakeholders to identify the most important topics related to maintaining EHS success.
Note: More information regarding Edwards’ Sustainability Materiality Assessment can be found at http://www.edwards.com/sustainability/our-approach/materiality-and-stakeholder-engagement/.
At the operations level, each manufacturing location is responsible for implementing processes consistent with ISO 14001 and OHSAS 18001 EHS management systems for determining its own significant environmental aspects and occupational health and safety hazards as they align with our Corporate EHS material topics, objectives and targets.
Version 2017-06-08 3

Results of Our EHS Materiality Assessment Based on our EHS materiality assessment, the following EHS aspects and hazards were determined be the most important to our stakeholders and are addressed in subsequent sections of this report.
Topic Stakeholder Priority
Boundary of Impact Description/Explanation
Energy High All six global manufacturing and 65 nonmanufacturing locations. Direct energy includes natural gas for space heating and water processes, diesel fuel for emergency generators, propane for auxiliary fuel purposes and gasoline for company driven vehicles. Indirect energy includes only electricity for manufacturing and office related activities and equipment. Approximately 88% of energy usage is from manufacturing locations and 12% from nonmanufacturing Rest of World locations. Other energy is also used for employee business travel and personal commuting to and from work.
Edwards’ has 100% control of energy usage at its manufacturing locations and one owned and operated office location in Nyon, Switzerland. We have less control of our smaller nonmanufacturing office locations throughout the world as these are located in shared office complexes and primarily under the control of the landlords. We have very little control over energy use for employee business travel and personal commuting. Energy use at Edwards contributes to increased air emissions and drives higher costs.
Emissions High Emissions, such as greenhouse gases, SOx and NOx, are directly related to Energy usage (see above), but also include fugitive volatile organic compounds (VOC or ROG) from our manufacturing cleanroom environments. Total emissions primarily occur from manufacturing operations and employee commuting, but also include, to a smaller extent, emissions from natural gas at our nonmanufacturing locations. For greenhouse gas emissions, approximately 50% occur from manufacturing and nonmanufacturing ROW locations and 50% occur from employee business and personal commuting.
Although Edwards’ has control of total energy usage, primarily at our manufacturing locations, we have less control of the energy mix supplied by our utility providers. For example, the amount of fossil fuel vs. non-fossil fuel mix is primarily under the control of our electricity provider, such as the mix of oil, coal, hydro, biomass, wind or solar power. Emissions result from energy consumption and manufacturing processes. Energy consumption contributes to emissions of greenhouse gases; manufacturing processes contribute to the emission of air contaminants.
Waste Medium Waste disposal almost entirely occurs at Edwards’ six manufacturing locations and nonmanufacturing waste generation is not considered to be material at our corporate reporting level.
Nonhazardous waste generation contributes to impact at local landfills. Hazardous waste generation contributes to on-site risks and increased regulatory requirements. Both contribute to our overall environmental footprint and drive higher costs.
Version 2017-06-08 4

Water Medium Water consumption almost entirely occurs at Edwards’ six manufacturing locations. Water consumption at our nonmanufacturing ROW locations is not considered to be material to our corporate reporting level.
Water consumption is important to manufacturing operations located in areas which experience droughts or have water infrastructure concerns. Reducing water consumption at Edwards helps contribute to local efforts to conserve water.
Workplace Health & Safety
Medium Edwards’ occupational health and safety program primarily focuses on our six manufacturing locations and, more specifically in ergonomic prevention programs whereby over 50% of our occupational injuries and illnesses are related to ergonomics.
Although rated as a medium concern by our stakeholders, we consider the safety of our employees to be one of the highest priorities at Edwards. Programs which focus on employee health and safety also help contribute to higher employee satisfaction, higher productivity and lower turnover rates.
Compliance Low Regulatory compliance and adherence to industry standards primarily focuses on Edwards’ six manufacturing locations, and includes such areas as hazardous waste disposal, air emissions, stormwater, wastewater and accidental release prevention.
Although rated as a low concern by our stakeholders, we consider EHS compliance as the minimum requirement for Edwards to operate in the locations in which we perform business.
Elements of our EHS Program (GRI 103-2)
The elements of our global EHS Management System (EHS-MS) include the following, as discussed further in this section of our EHS Annual Report.
• Global Scope of our EHS Program • Roles & Responsibilities • Governance & Accountability • Employee Performance & Compensation • EHS Grievance Structure • Edwards’ EHS Five-Year Plan, 2016-2020 • EHS Objectives & Targets
Global Scope of our EHS Program
Edwards EHS-MS includes all global manufacturing locations, owned and leased real estate and employee business and personal commuting. Topics related to materials and direct supply chain may be found at www.edwards.com/sustainability/.
Manufacturing Locations (6 locations)
Non-Manufacturing Regions (65 locations)
Añasco, Puerto Rico Asia Pacific (APAC) Draper, Utah Europe, Middle East, Africa, Canada (EMEAC)
Haina, Dominican Republic Japan Horw, Switzerland Latin America Irvine, California North America
Singapore Note: Except for the reporting of occupational injuries (GRI 403) the scope of Edwards’ 2016 EHS Reporting Program does not include the acquisition of ValTech Cardio Ltd. or start-up operations in Costa Rica.
Version 2017-06-08 5

Roles & Responsibilities The roles and responsibilities of Edwards’ EHS-MS are assigned in order to facilitate the most effective deployment and achievement of results by adopting a philosophy of Employee Ownership and Supervisor Accountability. It is our belief that when it comes to managing EHS aspects and hazards, the individual employees and their supervisors or managers are best equipped to find and implement the most successful solutions in order to obtain the best results for Edwards and our stakeholders.
As such, Edwards adopts a hands-on strategy whereby the EHS-MS responsibilities are assigned closest to the sources of concern by the Corporate EHS function and individual Operating Units.
Corporate EHS (CEHS) Edwards’ CEHS program primarily focuses on compliance, risks and opportunities, EHS due diligence, prevention of pollution and reduction of injuries for both manufacturing and nonmanufacturing entities. The Corporate EHS program reports through the Vice President of Corporate Services. Corporate EHS is separated from the operating units in order to ensure objectivity and transparency when auditing operating units for regulatory compliance and when reporting to management and stakeholders the results of audits, injuries and environmental impacts.
Operating Units EHS and Management
Deployment of the EHS Management System at Edwards belongs to the individual operating units, including manufacturing sites and regional offices, who, in turn, are directly accountable to their corresponding Business Units or corporate divisions. Each operating unit reports through its corresponding Vice President or corporate executive, who is directly accountable to the Corporate Vice President of Global Supply Chain, and, in turn, who is accountable to Edwards’ Chairman and CEO.
Version 2017-06-08 6

Governance & Accountability Both Corporate and Operating Unit EHS programs are governed as separate entities and are accountable to different corporate leadership executives of Edwards. The purpose of separating the functions is to ensure transparency and objectivity when evaluating such areas as regulatory compliance and monitoring and reporting of relevant EHS data to internal and external stakeholders. The Corporate EHS function develops policies and procedures appropriate to Edwards as a global entity, such as global policies on EHS risk management, reducing accidents and preventing pollution. Each Operation Unit EHS function develops its own specific policies and procedures appropriate to its activities and location, such as with regards to local regulations or cultural attributes. In order to promote accountability, the Corporate EHS function monitors and reports EHS performance, including compliance, reduction of injuries and prevention of pollution, on an ongoing basis to site and corporate management teams of each Operating Unit. The Operating Unit management team is responsible for assessing and providing resources needed as appropriate to facilitate EHS performance, including areas such as EHS headcount, EHS employee development, ongoing expenses and capital funds for larger projects aimed at reducing injuries and preventing pollution.
EHS Organizational Reporting Structure
Employee Performance & Compensation In order to ensure EHS considerations are addressed in our business activities, when appropriate, recognition, rewards and compensation are linked to EHS performance of teams and individuals. For example, operating units may assign annual Performance Management Objectives to facilities and engineering employees, either as individuals or as teams, to successfully replace and validate more energy efficient air compressors, chillers and air handling units. Other employees who demonstrate commitment to Edwards’ values may be recognized by a peer or manager through our HEART Award employee recognition program. Award levels range from $25 to $500 and are granted to employees for their efforts in reducing injuries and preventing pollution. At the corporate executive level, Edwards’ Chairman and CEO is evaluated annually for his role in achieving our strategic long term Aspirations. EHS performance is incorporated into these Aspirations as an integral part of Edwards’ commitment to excel as a Trusted Partner with our stakeholders and community.
Note: More information regarding Edwards’ Aspirations can be found at http://www.edwards.com/sustainability/our-approach/#aspirations.
Version 2017-06-08 7

EHS Grievance Structure As part of EHS governance, our Environmental, Health & Safety policy and performance commitments are included in Edwards’ Titanium Book of Global Business Practice Standards, which is provided in multiple languages to all worldwide employees. Any employee may also present a grievance related to EHS practices anonymously through Edwards’ Speak-Up program and Integrity Hotline. Finally, external persons may submit EHS related grievances or concerns through Edwards’ Global Integrity Program, available at www.edwards.com. All grievances are reported through Edwards’ Chief Responsibility Officer. In 2016 there were no internal or external grievances related to EHS reported to Edwards.
Edwards’ EHS Five-Year Plan, 2016-2020
Edwards’ EHS Five-Year Plan reconfirms our Environmental Health & Safety Policy and commitment to maintain compliance with EHS regulations and standards, reducing injuries and preventing pollution.
2016 marks the first year of Edwards’ 2016-2020 EHS Five-Year Plan. This is our fourth strategic planning cycle of implementing five-year plans from 2000-2005, 2006-2010 and 2010-2015. Each planning cycle starts with an assessment of materiality and significance based on EHS compliance, environmental aspects and safety hazards. The assessment is conducted primarily by analyzing past performance and benchmarking EHS leaders in the medical device industry. At the Operating Unit level, materiality is further refined by assessing EHS opportunities based on frequency, impact, compliance, risk management and various internal and external stakeholder requirements.
Implementation of our EHS Five-Year Plan is consistent with both ISO 14001 and OHSAS 18001 Management Systems, including the following stages: a) EHS Policy, b) Planning, c) Implementation & Deployment, d) Monitoring & Checking and e) Management Review.
Version 2017-06-08 8

EHS Objectives and Targets Our EHS Five-Year Plan, 2016-2020, includes specific performance targets for EHS compliance, reducing injuries and preventing pollution and is aligned with our material and significant environmental aspects and occupational health and safety hazards.
Topic Objective / Target 2016 Results Compliance No willful or serious EHS related violations.
There were no willful or serious EHS related violations.
Safety Beat medical industry benchmark safety statistics by 25% for workplace accidents and injuries with regard to: • Injury Recordable Rate (IRR) • Lost Time Injury Rate (LTIR)
Year-over-year results demonstrate achievement of maintaining injury statistics 25% below industry benchmarks. • Global IRR = 0.33 cases per 100
employees; 34% below industry benchmark of 0.50.
• Global LTIR = 1.22 cases per 100
employees; 42% below industry benchmark of 2.10.
Environmental Continue to prevent pollution as compared to
medical industry benchmark statistics, from 2016 to 2020, normalized by annual revenue; baseline 2015. • Energy Consumption (0% change) • Water Usage (15% reduction) • Hazardous Waste Disposal (20% reduction) • Solid Waste Disposal (20% reduction) • Greenhouse Gases (0% change)
Year-over-year results demonstrate progress toward meeting our 2020 objectives. • Energy: Decreased 3% • Water: No Change• Hazardous Waste: Decreased 4% • Solid Waste: No Change • Greenhouse Gases: Decreased 3%
Evaluating our Management Approach (GRI 103-3)
Our EHS management approach and performance is evaluated continuously through the auditing of operating units and continuous reporting of EHS results to management. EHS performance for each location related to compliance, injuries and pollution is consolidated monthly for management reporting. Also, each manufacturing location is audited or evaluated by CEHS or a third party auditor on an annual basis. All results are reported to management; unfavorable results are addressed and corrected in an effective and expedient manner. Annually, our EHS management approach and performance is evaluated at the beginning of each year as we complete our public reporting and disclosure obligations. It is at this time that a fair evaluation of the EHS-MS and its effectiveness in meeting intended results is objectively evaluated and communicated transparently to our management and executive teams.
Version 2017-06-08 9
Edwards Lifesciences LLC One Edwards Way Irvine, CA USA 92614
Phone: 949.250.2500 Fax: 949.250.2525 www.edwards.com (Unaudited Report. For General Internal Use Only)
Section 2.0 EHS COMPLIANCE
(GRI 307)
Pursuant to our EHS Policy, we will comply with all relevant government regulations, medical device industry standards and other requirements to which we subscribe.
Key Compliance Items for 2016 • There were no EHS-related serious, willful or significant violations or fines issued by any EHS
government agency. • There were no significant off-site hazardous materials spills or releases. • There were no employee, stakeholder or public grievances regarding Edwards’ environmental
impacts or health and safety considerations. • There were no significant EHS due diligence concerns for expansions, acquisitions and divestitures.
ISO 14001 & OHSAS 18001 Certifications
Edwards’ corporate Aspiration to excel as a Trusted Partner with our stakeholders and communities includes a commitment to achieve ISO 14001 accreditation at all of our manufacturing locations by the end of 2018. Copies of Certificates are included at the end of this report.
Location ISO 14001 1st Certification Year
OHSAS 18001 1st Certification Year
Anasco, PR 2015 2014 Draper, UT 2015 2015 Haina, DR 2015 2015 Singapore 2015 2015
Management Approach
Our approach to comply with applicable EHS regulations and standards is consistent with the description of the management approach described for our overall global EHS program (Section 1.0, GRI 103). In brief, the Corporate EHS function serves to monitor and audit compliance of the different operating units, such as manufacturing plants and regional offices, in order to ensure objectivity and transparency when internally assessing our state of compliance. Our commitment to compliance is implemented through a five-tier approach, as follows: 1. Government Inspections: Government agency inspections indicate if our operating units are meeting
their compliance obligations. Typically, our manufacturing locations are inspected for compliance requirements to air emissions, hazardous waste, medical waste, stormwater, wastewater and overall chemical storage and handling. The outcome of government inspections is reported to Corporate EHS and Business Unit management and monitored and tracked for the effective closure if necessary.
Version 2017-06-08 10

Edwards Lifesciences LLC One Edwards Way Irvine, CA USA 92614
Phone: 949.250.2500 Fax: 949.250.2525 www.edwards.com (Unaudited Report. For General Internal Use Only)
2. Third-Party Audits: Every three years, or as determined by risk, each manufacturing location is audited by a third party EHS professional to assess compliance to regulations, corporate standards and overall management of higher risks. Audit reports are provided by Corporate EHS, reported to corporate management and monitored and tracked for effective closure of findings.
3. Corporate EHS Audits: Annually, or as determined by risk, each location is assessed by CEHS for conformance to Corporate EHS standards and management of higher EHS risks. Assessment reports are provided to management and monitored and tracked for effective closure of findings.
4. Internal EHS Inspections: Each Operating Unit is responsible for conducting its own EHS self-
assessments based on internal audit protocols applicable to the location. 5. Facility Due Diligence: Edwards implements a corporate due diligence process for evaluating EHS
risks and requirements for business acquisitions, divestitures and property transactions.
Results of Government Inspections (GRI 307-1)
There were a total of 31 EHS related government inspections conducted at Edwards’ locations in 2016. In 2016, Edwards had no monetary fines and no cases were brought through any dispute resolution mechanisms. Categories of inspections included wastewater discharge, stormwater, hazardous waste, air emissions, explosive materials, employee health, fire protection and local county business practices.
There were no serious violations or fines issued by any regulatory agency. There were five minor EHS violations which were corrected in a timely manner to the satisfaction of the local agency.
Irvine – minor violations • Health Department (2 total) • Fire Department • Healthcare Agency – HazWaste • Air Quality Management District
Minor Violations Recorded, All Closed
Version 2017-06-08 11

Edwards Lifesciences LLC One Edwards Way Irvine, CA USA 92614
Phone: 949.250.2500 Fax: 949.250.2525 www.edwards.com (Unaudited Report. For General Internal Use Only)
Section 3.0 OCCUPATIONAL HEALTH & SAFETY (OH&S)
(GRI 403)
As stated in our EHS Policy Edwards will provide a safe and healthy workplace for our employees, contractors and visitors. We realize that safe and healthy employees are more satisfied with their jobs, have the opportunity to lead healthier and productive lives, help enhance our reputation in the industry and add higher overall value to our internal and external stakeholders. The following topics are discussed in this Section:
Topic Reference
• Management Approach GRI 103 • Foundations for Preventing Workplace Injuries and Illnesses • Health & Safety Committees
NA 403-1
• Occupational Injuries and Illnesses 403-2 • Injuries with High Incidence 403-3 • Trade Unions 403-4 • DJSI Health and Safety Criteria DJSI 3.7
Management Approach
Edwards’ management approach to OH&S is the same approach we use to manage all of our material and significant EHS topics and requirements. We believe the success of our OH&S program relies on our EHS philosophy of Employee Ownership and Supervisor Accountability. In short, all employees are responsible for their own safety and for speaking up if they sense a concern, and supervisors are accountable for providing safe work spaces, proper equipment and effective training for their employees. Supervisors are accountable for OH&S performance to their leadership teams and Business Units. Each year we review and prioritize our OH&S hazards. From this review, goals are established to measure our progress towards a positive impact in reducing the risk of injuries. Results of our activities to meet these goals are monitored and communicated to management throughout the year. Edwards also has a robust auditing program to ensure compliance to regulations, industry standard practices and Edwards’ EHS policies and procedures. Our auditing program consists of third party audit typically every three years; corporate audit annually, and site inspections more frequently. Results of our auditing program and EHS aspects and hazard assessments drive our EHS strategy and help develop core objectives which are communicated to, and adopted by, appropriate management throughout Edwards.
Version 2017-06-08 12

Edwards Lifesciences LLC One Edwards Way Irvine, CA USA 92614
Phone: 949.250.2500 Fax: 949.250.2525 www.edwards.com (Unaudited Report. For General Internal Use Only)
Edwards’ Foundations for Preventing Workplace Injuries and Illnesses Our injury and illness prevention strategy begins with the identification of risks and measures to control or eliminate these risks. Some of the controls which have been implemented are:
• Health and Safety is incorporated into our research and development phase to engineer out potential risks before they reach the manufacturing floor.
• Equipment is reviewed for EHS compliance before operation and routinely after installation. • Employees are trained on the hazards specific to their job prior to exposure. • Department inspections are conducted routinely for early identification and correction of
hazards. • Formal accident investigation and review is actively implemented. • Ergonomic assessments, stretching and proper workstation set-up are examples of some of the
programs implemented to address ergonomic considerations. • Each manufacturing site is staffed with EHS professionals appropriate to the risk levels at the site.
Ergonomic Injury Prevention
Employees Stretching at Edwards’ Añasco, Puerto Rico Location
Each manufacturing site has an active first aid program with trained personnel. Four of our six manufacturing sites have occupational health nurses, with some sites staffed with occupational health physicians and physical therapists. Their focus is on providing quality care and ensuring each employee recovers from any work related occurrence as quickly as possible with minimal short and long term effects. All sites have health centers or first aid rooms fully equipped, including AEDs throughout the facilities.
Version 2017-06-08 13

Edwards Lifesciences LLC One Edwards Way Irvine, CA USA 92614
Phone: 949.250.2500 Fax: 949.250.2525 www.edwards.com (Unaudited Report. For General Internal Use Only)
Workers’ Representation on Workplace Health & Safety Committees (GRI 403-1)
Due to local cultures and differing regulations governing safety committees, each of Edwards’ manufacturing locations employs a different strategy toward encouraging management-employee interface with regards to workplace health and safety. For example, both our Haina and Singapore locations are required by regulation to establish safety committees comprised of both management and production employees, conduct periodic meetings, maintain minutes of discussions, conduct joint investigations of accidents and near misses and report their status to the local government safety authorities. In Irvine, we take a train-the-trainer approach to the deployment of safety committees and employee representation with management. Approximately 50 key supervisors are identified to attend EHS trainings and discussions each month with the Irvine EHS team. These supervisors, in turn, communicate with their own departments and discuss EHS topics with their own individual employees. Each supervisor is thus able to customize the safety topics and discussions to fit his or her individual department’s risks and opportunities. Overall, our employee mix for this deployment strategy is about 20% management and 80% employee interface. In Añasco, our safety committees are typically 63% employees and 37% management. Safety meetings are held weekly unless they conflict with other all-employee events or scheduled training. The agenda is well structured, published and always starts with a Safety Minute covered by a volunteer sharing a personal life-safety event which happened at home. Many times the at home safety experience is related to working conditions as well. Safety Minutes are also shared at all employee meetings hosted by the General Manager or other members of the leadership team. As the safety programs are implemented at the local levels, information about specific worker-management representation and topics of discussion in the manufacturing locations is not tracked at the Corporate EHS level in all cases. However, higher risks or opportunities, such as those directly related to employee injuries, accidents or significant near misses, are reported to and tracked by Corporate EHS.
Occupational Injuries and Illnesses (GRI 403-2)
Edwards tracks and reports all global injuries and illnesses from both manufacturing and regional nonmanufacturing activities. A formal global reporting standard, blending OSHA recordkeeping requirements and ASTM Standard Guide for Recording Occupational Injuries and Illnesses, has been established and applied for consistent reporting. Our incident rates are based on actual hours worked in order to adjust based on overtime hours and holiday breaks. The rates reflect injuries and illnesses that occur to Edwards’ employees and temporary or contract employees under Edwards’ direct supervision. We do not separate between an injury or illness and employee or non-employee. The data is not verified by a third party, although Edwards is subject to regulatory inspections and verification by local occupational safety agencies.
Version 2017-06-08 14

Edwards Lifesciences LLC One Edwards Way Irvine, CA USA 92614
Phone: 949.250.2500 Fax: 949.250.2525 www.edwards.com (Unaudited Report. For General Internal Use Only)
Injury & Illness Rates Includes all global manufacturing and nonmanufacturing employees
Global Injury/Illness Recordable Incident Rate (RIR): 2020 Target: Achieve RIR 25% better than industry peers, or 1.58 injuries per 100 employees. 2016 Results: Achieved RIR of 1.22. Long Term RIR has decreased 2% from 1.25 in 2010 to 1.22 in 2016 cases per 100 employees.
Recordable cases include all work-related injuries or illnesses that require medical treatment beyond first aid.
Global Lost Time Incident Rate (LTIR): 2020 Target: Achieve LTIR 25% better than industry peers, or 0.38 lost time injuries per 100 employees. 2016 Results: Achieved LTIR of 0.34. Long term LITIR decreased 13% from 0.38 in 2010 to 0.34 in 2016 cases per 100 employees.
Lost time cases include all work-related injuries or illnesses which were severe enough to cause the injured employee to lose at least one full day of work.
For clarification, the following definitions are used in our Injury/Illness reporting standard: • First Aid incidents are not reported at the corporate level and excluded from the scope of this
EHS Annual Report. • Injury is an occurrence of physical or mental harm as a result of a single or instantaneous event. • Illness is an occurrence of physical or mental harm or disease that develops over time in the
course of work. • Recordable injury or illness requires medical treatment beyond first aid as described in the
United States OSHA recordkeeping standard. • Lost time is any full day away from work including all calendar days and begins the first day after
the last day worked, including weekends and holidays. For example, if an injury occurs on Monday, the first lost time day is Tuesday.
• Cumulative trauma is a work related illness that affects the musculoskeletal system, also known as musculoskeletal disorder.
• Absentee Rate is not reported by Edwards at the corporate level due to inconsistencies in reporting based on the accepted definition of absenteeism in the different countries from which we operate.
Version 2017-06-08 15

Edwards Lifesciences LLC One Edwards Way Irvine, CA USA 92614
Phone: 949.250.2500 Fax: 949.250.2525 www.edwards.com (Unaudited Report. For General Internal Use Only)
For GRI reporting purposes, injury and disease (illness) rates have been calculated based on Edwards employees and Non-Edwards temporary workers using the same definition as in our reporting standard. For employee privacy concerns, we do not publicly report injuries or illnesses by gender, race, religion, age, tenure or region.
Edwards has not experienced a work related fatality by either employees or on-site contractors since it began operating in 2000. Although still maintaining and injury rate 40% below, and thus more favorable, than our medical device industry peers, Edwards recognizes that most of our workplace injuries are attributed to ergonomic factors in the workplace as depicted in the charts below.
Includes all Global Manufacturing and Nonmanufacturing Employees
and Temporary Employees Under Edwards’ Direct Supervision
Version 2017-06-08 16

Edwards Lifesciences LLC One Edwards Way Irvine, CA USA 92614
Phone: 949.250.2500 Fax: 949.250.2525 www.edwards.com (Unaudited Report. For General Internal Use Only)
Higher Risk Injuries and Illnesses (GRI 403-3)
Occupational illnesses due to ergonomic conditions represent approximately 50% of all global injuries and predominately occur in our United States and Singapore manufacturing locations. Even though Edwards cannot control the physical attributes which may make an individual employee more susceptible to an ergonomic injury, we have established a global ergonomic program that starts with prevention and continues through good injury case management for the best outcome. The program has objectives that target the identified risks and yearly leading indicators that measure our progress in implementing the program. Edwards has implemented aggressive prevention strategies which focus on three contributing factors: employee, task and workplace. Employee awareness of ergonomics, proper posture, workstation setup, physical warning signs and early reporting of injuries is ongoing via training, posters, meetings and videos. High risk ergonomic tasks are identified through ergonomic assessments and evaluated to determine control measures to eliminate or reduce the risk. Workstations are ergonomically designed to promote neutral postures with ergonomic chairs, adjustable equipment and ergonomic tools when available. Specific ergonomic illness prevention programs which have been implemented include:
• Customized stretching programs, designed by physical therapists and fitness staff to specifically target areas of concern for the employees and work tasks of the department.
• Personalized Ergonomic Intervention is implemented on the floor while the employees are working. An ergonomist works with the individual at the workstation to improve posture, adjust workstation and provide training specific to the employee and before an injury occurs.
• Physical Demand Job Descriptions are used for proper placement prior to exposure and for proper return-to-work in case an injury or illness should occur.
• LEAN engineering projects have standardize tools and workplace to allow for less wasteful motions, including eliminating reaching, lifting, bending and awkward postures.
• Detailed analysis of each step in heart valve manufacturing was completed in order to determine force, awkward posture and contact stress conditions which can be corrected with ergonomic strategies.
Edwards’ Perfect Posture Demonstration
Version 2017-06-08 17

Edwards Lifesciences LLC One Edwards Way Irvine, CA USA 92614
Phone: 949.250.2500 Fax: 949.250.2525 www.edwards.com (Unaudited Report. For General Internal Use Only)
Cumulative Trauma, Muscle Fatigue Training hosted by EHS Staff, Añasco, Puerto Rico, Q1 2016
Trade Unions (GRI 403-4)
Edwards’ employment relationships meet all government, industry and local occupational health and safety standards and practices and are not typically covered by trade unions. The requirements of employee-trade union relations as not considered to be material to Edwards.
Dow Jones Sustainability Index Employee Health, Safety & Well-Being
(DJSI 3.7.1) In addition to Edwards’ Occupational Health and Safety (OH&S) performance already discussed in this Section, the following information is provided to complete DJSI reporting requirements.
Information regarding Edwards’ employees’ personal health and safety can be found at http://www.edwards.com/sustainability/workforce/workplace-health-and-safety/.
OH&S Risk Factor
Edwards’ Approach
Ergonomics See section GRI 403-3.
Illumination
All lighting is designed to meet local and maximum manufacturing design specifications for employee comfort and productivity.
Noise
All potential noise exposures above 80 decibels are evaluated to ensure proper engineering and administrative controls are implemented to prevent any employee overexposure to noise. Employees are provided with hearing protection, training and annual monitoring for any exposures over occupational allowable limits.
Humidity Humidity considerations are not determined to be a material or significant OH&S concern in Edwards’ operations.
Version 2017-06-08 18

Edwards Lifesciences LLC One Edwards Way Irvine, CA USA 92614
Phone: 949.250.2500 Fax: 949.250.2525 www.edwards.com (Unaudited Report. For General Internal Use Only)
Temperature Temperature considerations are not determined to be a material or significant OH&S concern in Edwards’ operations. In some instances whereby facilities employees may be working outside during hot weather, ample water, shade and frequent rests are provided.
Absentee Rate (AR)
The term Absentee Rate is not universally accepted globally in all locations in which Edwards does business. We do not globally track absenteeism from work because of incapacity of any kind. However, we do track and report absenteeism due to workplace injuries and illnesses as indicated in our OH&S statistics provided in GRI 403-2.
Dow Jones Sustainability Index Injury and Illness Reporting Criteria
(DJSI 3.7.3-3.7.6) Fatalities
Fatalities FY 2013 FY 2014 2015 FY 2016 Employees 0 0 0 0 Contractors 0 0 0 0
Lost Time Injury Frequency Rate (LTIFR)
• Employees LTIFR LTFIR Unit FY 2013 FY 2014 FY 2015 FY 2016
Employees n/million hours worked
1.79 1.60 1.65 1.34
% of employees
94 94 93 93
• Contractor and Temporary Worker LTIFR
LTFIR Unit FY 2013 FY 2014 FY 2015 FY 2016 Contractors n/million
hours worked 8.89 2.55 5.11 6.76
% of employees
6 6 7 7
Occupational Illness Frequency Rate (OIFR)
LTFIR Unit FY 2013 FY 2014 FY 2015 FY 2016 Employees n/million
hours worked 3.81 3.62 3.84 3.52
% of employees
94 94 93 93
Version 2017-06-08 19

Edwards Lifesciences LLC One Edwards Way Irvine, CA USA 92614
Phone: 949.250.2500 Fax: 949.250.2525 www.edwards.com (Unaudited Report. For General Internal Use Only)
Section 4.0ENERGY (GRI 302)
The following topics are included in this Section:
Topic Reference
Management Approach GRI 103
Methodology of Reporting Energy Consumption
Energy Consumption within Edwards o Renewable and Non‐Renewable Energy Mix o Energy Use by Category
GRI 302‐1
Energy Consumption Outside of Edwards o Employee Business Commuting o Employee Personal Commuting to/from Work
GRI 302‐2
Energy Intensity o Energy Usage in Edwards’ Manufacturing Operations
GRI 302‐3
Reduction in Energy Consumption GRI 302‐4
Reductions in Energy from Products and Services GRI 302‐5
Dow Jones Sustainability Index Energy Consumption DJSI 2.3.3
Management Approach (GRI 103, See Section 1.0)
Edwards’ approach to the management of global energy usage is based on three criteria: industry benchmarking, existing energy challenges and opportunities and over 15 years of tracking and evaluating Edwards’ energy needs. Energy is also considered a material environmental aspect as determined by internal and external stakeholder engagement interviews as discussed in Edwards’ Sustainability Report, edwards.com/sustainability. In fact, Energy and Emissions were ranked the highest EHS concerns among external stakeholders, including customers, investment groups and professional affiliations. The scope of Edwards’ energy management and reporting program includes all owned and leased operating locations across the globe, including both Edwards’ primary six manufacturing locations and 65 nonmanufacturing regional and administrative offices in 36 countries. With regards to the management of energy, our governance, responsibilities, goal setting, deployment and communication processes are consistent with the overall EHS Management System approach discussed in Section 1 of this report, EHS Management Approach GRI 103.
Manufacturing Locations (6 locations)
Non-Manufacturing Regions (65 locations)
Añasco, Puerto Rico Asia Pacific (APAC)
Draper, Utah Europe, Middle East, Africa, Canada (EMEAC) Haina, Dominican Republic Japan
Horw, Switzerland Latin America Irvine, California North America
Singapore
Version 2017-06-08 20
Edwards Lifesciences LLC One Edwards Way Irvine, CA USA 92614
Phone: 949.250.2500 Fax: 949.250.2525 www.edwards.com (Unaudited Report. For General Internal Use Only)
Methodology of Reporting Energy Consumption Energy consumption is reported to Corporate EHS on a monthly basis from each manufacturing location whereby the data is verified through utility provider invoices, purchase records, on‐site logs and/or monitoring equipment. Energy consumption at each nonmanufacturing location is estimated based on the size of each location multiplied by US Environmental Protection Agency or other industry related conversion factors. Although 100% of global locations use electricity for energy, only an estimated 60% of nonmanufacturing locations use natural gas for space heating and water heating needs.
Energy Source Manufacturing Nonmanufacturing Electricity Utility Provider Invoices Square Footage Estimates
61 Million Joules / SF Office
Natural Gas Utility Provider Invoices Square Footage Estimates
1.05 Million Joules / CF Office
Diesel Purchase Records & Logs NA
Propane Purchase Records NA
Gasoline Purchase Records NA
Energy Consumption within Edwards
(GRI 302‐1)
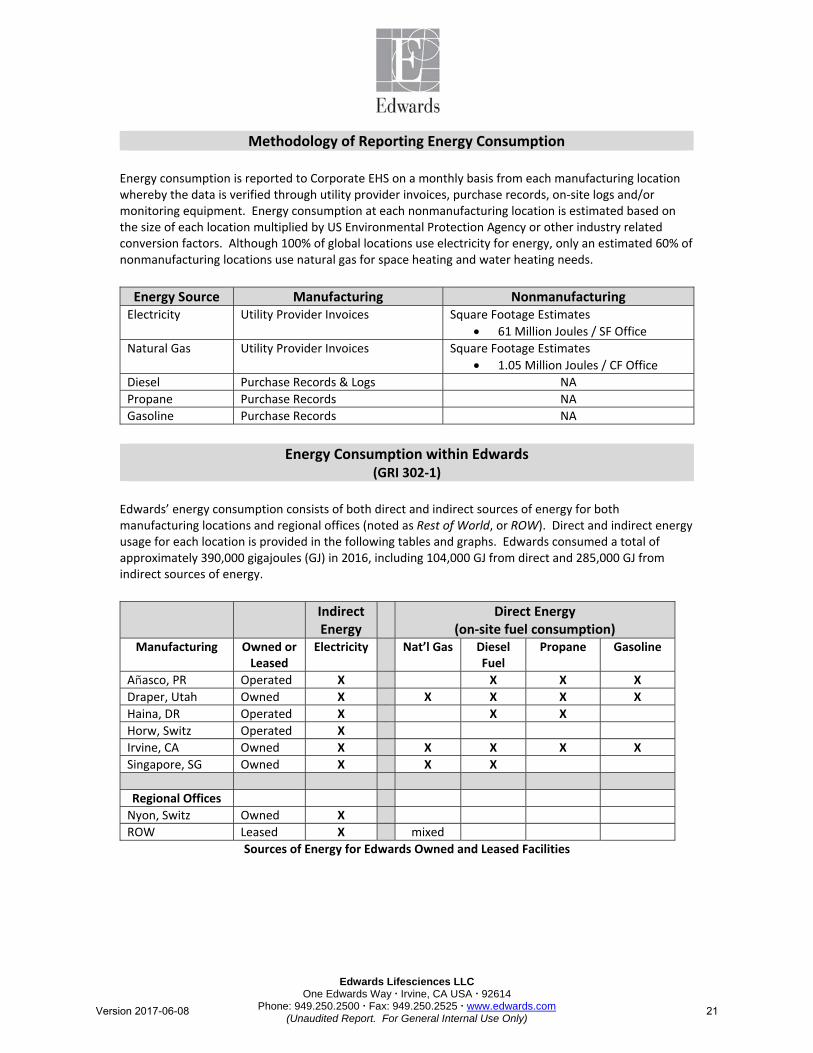
Edwards’ energy consumption consists of both direct and indirect sources of energy for both manufacturing locations and regional offices (noted as Rest of World, or ROW). Direct and indirect energy usage for each location is provided in the following tables and graphs. Edwards consumed a total of approximately 390,000 gigajoules (GJ) in 2016, including 104,000 GJ from direct and 285,000 GJ from indirect sources of energy.
Indirect
Energy Direct Energy
(on‐site fuel consumption) Manufacturing Owned or
Leased Electricity Nat’l Gas Diesel
Fuel Propane Gasoline
Añasco, PR Operated X X X X
Draper, Utah Owned X X X X X
Haina, DR Operated X X X
Horw, Switz Operated X
Irvine, CA Owned X X X X X
Singapore, SG Owned X X X
Regional Offices
Nyon, Switz Owned X
ROW Leased X mixed
Sources of Energy for Edwards Owned and Leased Facilities
Version 2017-06-08 21
Edwards Lifesciences LLC One Edwards Way Irvine, CA USA 92614
Phone: 949.250.2500 Fax: 949.250.2525 www.edwards.com (Unaudited Report. For General Internal Use Only)
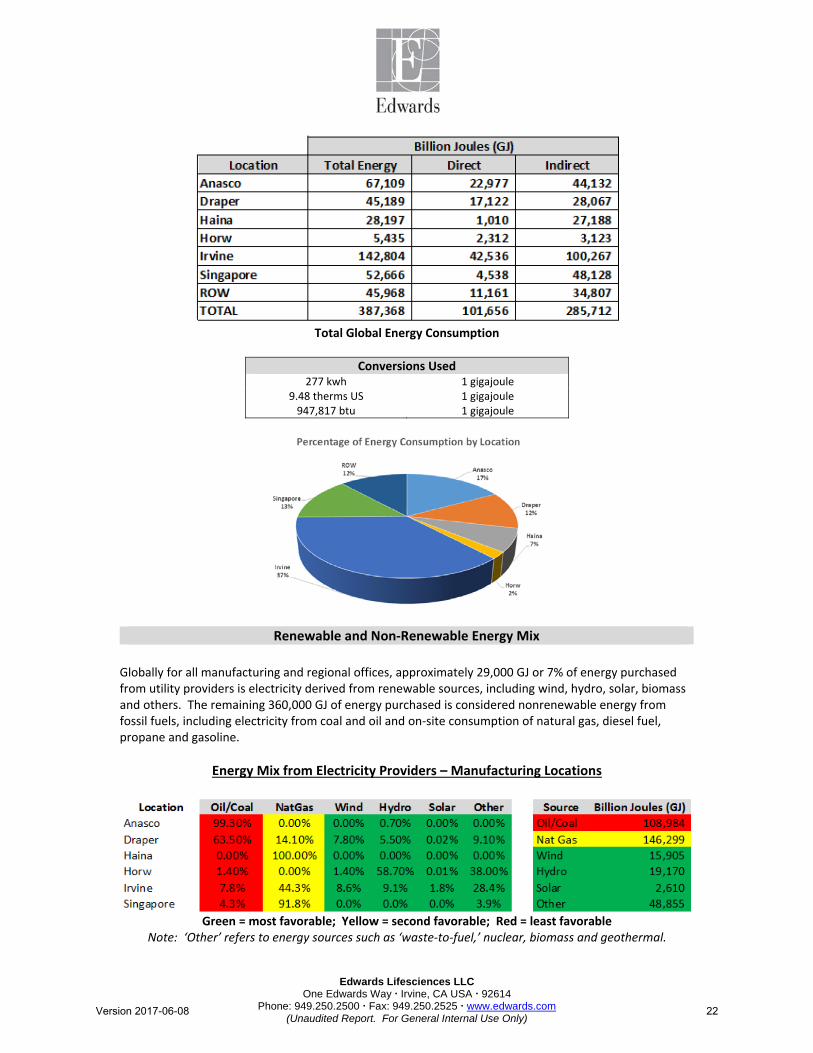
Total Global Energy Consumption
Conversions Used277 kwh 1 gigajoule
9.48 therms US 1 gigajoule 947,817 btu 1 gigajoule
Renewable and Non‐Renewable Energy Mix
Globally for all manufacturing and regional offices, approximately 29,000 GJ or 7% of energy purchased from utility providers is electricity derived from renewable sources, including wind, hydro, solar, biomass and others. The remaining 360,000 GJ of energy purchased is considered nonrenewable energy from fossil fuels, including electricity from coal and oil and on‐site consumption of natural gas, diesel fuel, propane and gasoline.
Energy Mix from Electricity Providers – Manufacturing Locations
Green = most favorable; Yellow = second favorable; Red = least favorable
Note: ‘Other’ refers to energy sources such as ‘waste‐to‐fuel,’ nuclear, biomass and geothermal.
Version 2017-06-08 22

Edwards Lifesciences LLC One Edwards Way Irvine, CA USA 92614
Phone: 949.250.2500 Fax: 949.250.2525 www.edwards.com (Unaudited Report. For General Internal Use Only)
At our Irvine, California, campus we also generate approximately 85,000 kwh per month from a rooftop solar energy generation system. In 2017, we will complete the installation of an additional 1,800 square meters of solar panels in order to double our generation capacity. All solar energy is provided directly back to the public utility grid. For simplicity in reporting, we do not offset our total usage by the solar energy generated in Irvine.
Solar Photovoltaic Panel Electricity System, Top of Parking Structures, Irvine, CA
Energy Mix Estimates for All Global Direct and Indirect Sources from Utility Providers
Renewable Sources of Energy: 87,000 Billion Joules
Non‐renewable Sources of Energy: 300,000 Billion Joules Total Energy Consumption: 387,000 Billion Joules
Energy Usage by Category & Purpose
Edwards uses energy primarily for the purposes of cooling, heating, steam, lighting and operating emergency generators, vehicles, manufacturing and office equipment. Total energy consumed in 2016 for each purpose is included below for Edwards’ six global manufacturing locations and Rest of World (ROW) regional and administrative offices.
Energy Consumption Purpose Energy Usage in Billion Joules Units Mfg ROW Total
Electricity Consumption cooling, lighting and operating equipment
250,905 34,807 285,712
Heating and Steam Consumption natural gas mixed uses for space heating, hot water and manufacturing required steam
62,934 11,161 76,966
Diesel Fuel emergency generators
26,557 0 26,557
Propane forklifts and cafeteria fuel
706 0 706
Gasoline company operated vehicles
298 0 298
Total Global Energy Consumption 341,400 45,968 387,368
Version 2017-06-08 23

Edwards Lifesciences LLC One Edwards Way Irvine, CA USA 92614
Phone: 949.250.2500 Fax: 949.250.2525 www.edwards.com (Unaudited Report. For General Internal Use Only)
Energy Generated On‐Site Irvine, California Solar Energy sold back to utility provider
Approx. 2,000 Billion Joules (GJ) per year
Energy Consumption Outside of Edwards (GRI 302‐2)
Edwards tracks and reports energy consumption outside of Edwards for business travel and employee commuting. Energy consumption associated with leased office locations is reported as within Edwards (GRI 302‐1). Energy consumption for other Upstream and Downstream categories, such as supply chain and energy from product use, is outside the scope of this report.
Although actual energy consumption is included in this section, the environmental impact from consumption, such as greenhouse gas emissions, is discussed in Section 7.0, GRI 305, Emissions.
Edwards reports employee commuting for both business travel and commuting to and from work. Our Travel Management Partner provides detailed reports for almost all of our employee based air and rail travel around the world. Information regarding employee personal commuting is obtained through surveys, human resources records and general observations and assumptions.
Activity Description Billion Joules (GJ) Business Travel Air Travel
Train/Rail Travel 297,355
3,241
Employee Commuting Personal commuting to/from work, including car, bus, train, motorcycle and salesforce vehicles
233,894
Total Energy Consumed for Employee Commuting 534,490
Version 2017-06-08 24

Edwards Lifesciences LLC One Edwards Way Irvine, CA USA 92614
Phone: 949.250.2500 Fax: 949.250.2525 www.edwards.com (Unaudited Report. For General Internal Use Only)
Employee Business Commuting Business Travel includes employees traveling for work purposes by air or train. Vehicles from salesforce employees and field based clinicians, even though for commuting for work purposes, is included under Employee Personal Commuting to and from Work.
Percentage of Energy Consumed by Region for Business Travel
Version 2017-06-08 25

Edwards Lifesciences LLC One Edwards Way Irvine, CA USA 92614
Phone: 949.250.2500 Fax: 949.250.2525 www.edwards.com (Unaudited Report. For General Internal Use Only)
Employee Personal Commuting to/from Work Employee commuting includes how individual Edwards’ employees come to and from work. It is estimated through employee surveys and available human resources information that in 2016 our employees commuted over 2.3 million kilometers to and from Edwards for work purposes. Of approximately 10,000 average employees for 2016, not including contractors and temporary work agency employees, approximately 60% drive their own vehicles and 40% take alternate means of transportation according to the following employee commuting mix.
Mode of Transportation kms traveled
2016 (est) Efficiency Factor Billion Joules (GJ)
Total Energy Billion Joules (GJ)
Individual Vehicles 60,430,740 0.002319 140,139
Bus 25,310,977 0.002781 70,390
Train 255,227 0.001843 470
Motorcycle 609,288 0.001610 980
Sales Force 9,450,000 0.002319 21,915
Totals 96,056,233 NA 233,894
Percentage of Amount of Energy Consumed per Mode of Transportation
In Singapore, Edwards provides coach service for 1,990 employees, or 95% of its local workforce
Version 2017-06-08 26

Edwards Lifesciences LLC One Edwards Way Irvine, CA USA 92614
Phone: 949.250.2500 Fax: 949.250.2525 www.edwards.com (Unaudited Report. For General Internal Use Only)
Energy Intensity (GRI 302‐3)
Edwards tracks and reports both absolute and normalized energy consumption from its operations within the organization, as opposed to also reporting operations outside the organization, such as upstream supply chain and downstream customer activities. However, for setting of goals and objectives, similar to our medical device industry peers, we focus on energy consumption intensity and normalize energy usage by annual revenue. We have chosen revenue as our intensity factor primarily since Edwards’ is a fast‐growing company and is continuously evolving its facilities, product mixes and manufacturing infrastructure, so it becomes unfeasible and irrelevant to compare year‐over‐year results from manufacturing activities to accommodate these rapid changes.
Edwards’ 2020 Energy Objective 2015‐2020 Target: 0% increase Normalized by Annual Revenue 2015‐2016 Actual: 3% decrease 2010‐2016 Trend: 31% decrease
Global Manufacturing and Nonmanufacturing Energy Usage – Normalized by Annual Revenue
Direct and Indirect Energy
Scope Type of Fuel or Energy Source Measure of Intensity Scope 1: Direct Energy Natural Gas, Diesel, Propane, Gasoline Scope 2: Indirect Energy
Electricity
Scope 3: Not Included in Edwards’ Energy Objective
Employee business and personal commuting
105% revenue growth over six years
Version 2017-06-08 27

Edwards Lifesciences LLC One Edwards Way Irvine, CA USA 92614
Phone: 949.250.2500 Fax: 949.250.2525 www.edwards.com (Unaudited Report. For General Internal Use Only)
Energy Usage in Edwards’ Manufacturing Operations
Edwards’ six manufacturing locations make up over 85% of all global direct and indirect energy usage, not including employee commuting, and are therefore the primary focus of Edwards’ energy reduction initiatives.
2010‐2016 Trend in Total Energy Usage from Manufacturing Locations
2010‐2016 Trend in Total Energy Cost from Manufacturing Locations
Although total energy from manufacturing operations has increased 42% from 2010 to 2016, Edwards has grown nearly 105% during this same time period. In addition, cost has increased only 25%, resulting in lowering our average cost per billion joules (GJ) from $33.35 to $29.25, or 12%. Edwards has been able to successfully maintain a low rate of energy increases when compared to company growth primarily by utilizing existing manufacturing space more effectively and investing in energy efficient air handlers, chillers, air conditioning equipment and lighting controls. Refer to GRI 302‐4 for energy reduction initiatives.
Version 2017-06-08 28

Edwards Lifesciences LLC One Edwards Way Irvine, CA USA 92614
Phone: 949.250.2500 Fax: 949.250.2525 www.edwards.com (Unaudited Report. For General Internal Use Only)
Due to its size and number of employees, Edwards’ Irvine location uses almost 40% of the total global energy usage from our manufacturing locations. In 2016, several satellite manufacturing and warehouse operations were merged into the Irvine EHS program, thus increasing the amount of energy attributed to the site year‐over‐year.
Total Energy Usage for Global Manufacturing Locations
Total Energy Cost for Global Manufacturing Locations
Overall, about 60‐70% of all energy consumed is dedicated to maintaining air circulation, temperature and humidity control in order to preserve the integrity of our cleanroom manufacturing environments. A manufacturing cleanroom typically uses about eight times as much energy as an office area. Edwards’ strives to maintain a balance between energy usage and maintaining high quality standards for the manufacturing of our medical devices.
Version 2017-06-08 29

Edwards Lifesciences LLC One Edwards Way Irvine, CA USA 92614
Phone: 949.250.2500 Fax: 949.250.2525 www.edwards.com (Unaudited Report. For General Internal Use Only)
Reduction in Energy Consumption (GRI 302‐4)
For both manufacturing and nonmanufacturing locations, Edwards implements both administrative and engineering strategies to reduce energy consumption, primarily from electricity which represents over 70% of all energy consumed. As indicated prior, Energy Intensity GRI 302‐3, we have successfully reduced our energy consumption 31% since 2010 as normalized by revenue to reflect the growth of our company.
At the corporate level we do not track and report the energy reduction results of individual energy conservation projects for each location, however, we are pleased to discuss some examples of various projects completed at our manufacturing operations in the past few years.
Irvine, California Due to its size, complexity, and number of employees, our Irvine, California, location is the largest energy user of all of the Edwards’ manufacturing locations, primarily because the site shares its environmental responsibilities with Edwards’ main research and development and corporate offices. In Irvine, we continuously implement numerous small and large energy savings projects throughout the campus, such as operating a Solar Photovoltaic Panel generation system, providing 18 electric vehicle charging stations for over 50 employees, installing motion sensors as a common practice in office areas, running central HVAC control systems, replacing inefficient lighting and upgrading to more efficient natural gas boilers. In spring of 2016, we held a ribbon cutting ceremony for our new LEED Gold Certified state of the art headquarters, the Life is Now Center (LINC).
Edwards’ LEED Gold Certified Headquarters Building, Irvine, CA
Version 2017-06-08 30

Edwards Lifesciences LLC One Edwards Way Irvine, CA USA 92614
Phone: 949.250.2500 Fax: 949.250.2525 www.edwards.com (Unaudited Report. For General Internal Use Only)
Leadership in Energy and Environmental Design (LEED) is a rating system devised by the United States Green Building Council (USGBC) to evaluate the environmental performance of a building and encourage market transformation towards sustainable design. Edwards’ LINC building became certified in 2016. Environmental benefits provide energy reductions as well as many other environmental benefits, including:
100% Net Zero Energy for two years through enhanced efficiency measures and green power purchases
40% reduction in water usage through efficient fixtures
20% reduction in light power through use of LED and enhanced controls
100% new Energy Star certified equipment and appliances
Green Cleaning janitorial services using less potentially hazardous substances
Over 80% of construction and demolition materials diverted from landfill
20% recycled content in construction materials and furniture
27% regional materials in construction materials and furniture
Low emitting paints, coatings and flooring systems used throughout
GreenGuard certified furniture used throughout to reduce potential indoor contaminants which may be odorous, irritating or harmful to the comfort and well‐being of installers and occupants
Urea‐Formaldehyde Free composite woods used throughout
Version 2017-06-08 31
Edwards Lifesciences LLC One Edwards Way Irvine, CA USA 92614
Phone: 949.250.2500 Fax: 949.250.2525 www.edwards.com (Unaudited Report. For General Internal Use Only)
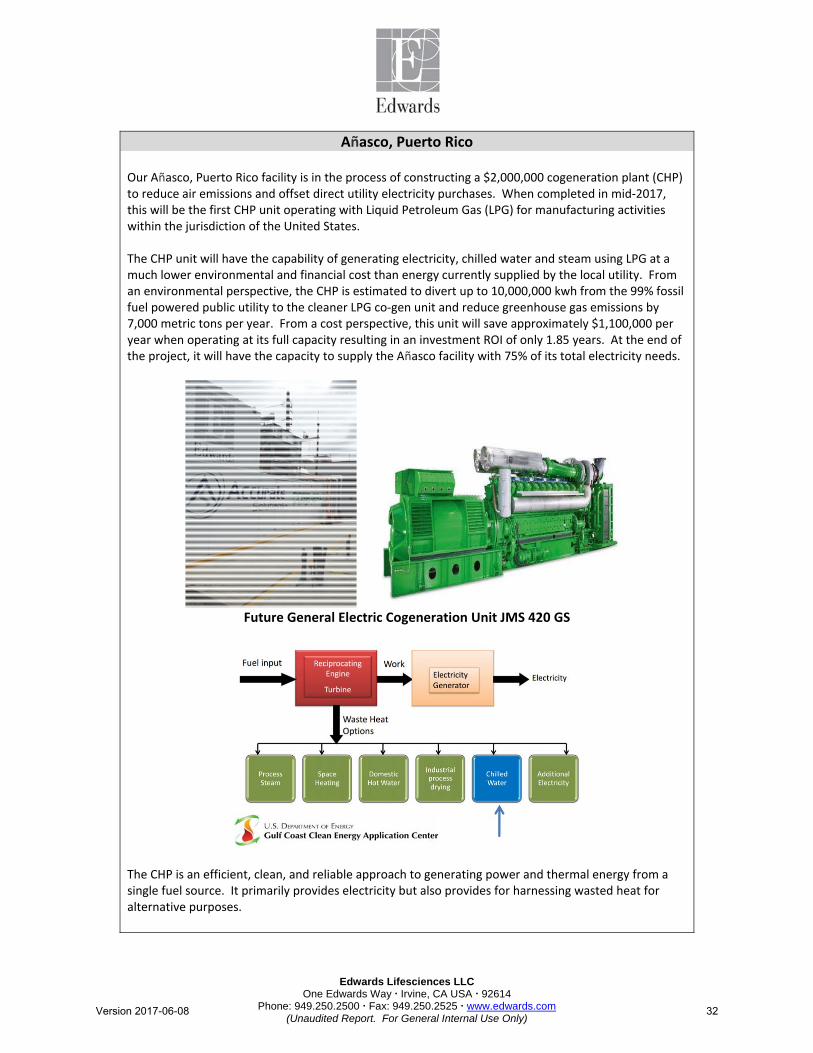
Añasco, Puerto Rico Our Añasco, Puerto Rico facility is in the process of constructing a $2,000,000 cogeneration plant (CHP) to reduce air emissions and offset direct utility electricity purchases. When completed in mid‐2017, this will be the first CHP unit operating with Liquid Petroleum Gas (LPG) for manufacturing activities within the jurisdiction of the United States. The CHP unit will have the capability of generating electricity, chilled water and steam using LPG at a much lower environmental and financial cost than energy currently supplied by the local utility. From an environmental perspective, the CHP is estimated to divert up to 10,000,000 kwh from the 99% fossil fuel powered public utility to the cleaner LPG co‐gen unit and reduce greenhouse gas emissions by 7,000 metric tons per year. From a cost perspective, this unit will save approximately $1,100,000 per year when operating at its full capacity resulting in an investment ROI of only 1.85 years. At the end of the project, it will have the capacity to supply the Añasco facility with 75% of its total electricity needs.
Future General Electric Cogeneration Unit JMS 420 GS
The CHP is an efficient, clean, and reliable approach to generating power and thermal energy from a single fuel source. It primarily provides electricity but also provides for harnessing wasted heat for alternative purposes.
Version 2017-06-08 32

Edwards Lifesciences LLC One Edwards Way Irvine, CA USA 92614
Phone: 949.250.2500 Fax: 949.250.2525 www.edwards.com (Unaudited Report. For General Internal Use Only)
Draper, Utah At our Draper, Utah facility, during the last few planning years, we have installed more efficient air compressors with energy saving variable frequency drives (VFD), upgraded to a higher efficiency HVAC for the manufacturing cleanroom and converted approximately 40,000 square feet of warehouse, hallways, laboratory, cleanroom and parking lot lighting with more efficient light emitting diode (LED) bulbs to replace standard fluorescent light fixtures. We also installed electric vehicle charging stations for use by six of our employees with electric and hybrid vehicles.
LED Lighting Upgrade Project
Version 2017-06-08 33

Edwards Lifesciences LLC One Edwards Way Irvine, CA USA 92614
Phone: 949.250.2500 Fax: 949.250.2525 www.edwards.com (Unaudited Report. For General Internal Use Only)
Haina, Dominican Republic For the past several years, our Haina, DR facility has been implementing its Green Belt Energy Reduction Program focusing on identifying opportunities to reduce energy, including the installation of energy meters for chillers, air compressors, air handlers and vacuum pumps; replacing inefficient fluorescent lighting; installing motion sensors in office areas; installing high efficiency air compressors; and installing new water chillers with high efficiency technologies.
New Chiller System increases efficiency from 60% to 80%
and reduces energy consumption by 60%
Reductions in Energy from Products and Services
(GRI 302‐5)
Energy consumption from the use of Edwards’ medical devices and professional services provided to our customers and stakeholders is considered very minimal and is not material to Edwards’ overall environmental footprint.
Version 2017-06-08 34

Edwards Lifesciences LLC One Edwards Way Irvine, CA USA 92614
Phone: 949.250.2500 Fax: 949.250.2525 www.edwards.com (Unaudited Report. For General Internal Use Only)
Dow Jones Sustainability Index Energy Reporting
(DJSI 2.3.3)
The following information is provided pursuant to our commitment to reporting to DJSI standards. Total Energy includes direct and indirect energy for Edwards’ global manufacturing and nonmanufacturing locations. It does not include energy used outside of Edwards, such as for employee commuting, product services or supply chain.
Manufacturing and Nonmanufacturing Locations
Version 2017-06-08 35

Edwards Lifesciences LLC One Edwards Way Irvine, CA USA 92614
Phone: 949.250.2500 Fax: 949.250.2525 www.edwards.com (Unaudited Report. For General Internal Use Only)
Section 5.0 WATER CONSUMPTION
(GRI 303) The following topics are included in this Section.
Topic
Reference
• Management Approach GRI 103 • Methodology of Reporting Water Consumption NA • Edwards Internal Reporting NA • Water Withdrawal by Source GRI 303-1 • Water Sources Significantly Affected by Withdrawal of Water GRI 303-2 • Water Recycled and Reused GRI 303-3 • Dow Jones Sustainability Index Water Consumption DJSI 2.3.4
Management Approach
Edwards’ approach to the management of global water consumption is based on three criteria: industry benchmarking, existing water resource challenges and opportunities and over 15 years of tracking and evaluating Edwards’ water needs. Water consumption is considered a material environmental aspect determined by internal and external stakeholder engagement interviews as discussed in Edwards’ Sustainability Report, http://www.edwards.com/sustainability/our-approach/materiality-and-stakeholder-engagement/. Water considerations are also publicly reported to www.cdp.net as part of our water conservation and public disclosure efforts. The scope of Edwards’ water management and reporting program includes all owned and leased operating locations across the globe, including Edwards’ six manufacturing locations and 65 nonmanufacturing regional offices in 36 countries. With regards to the management of water resources, our governance, responsibilities, goal setting, deployment and communication processes are consistent with our overall EHS Management System approach discussed in Section 1 of this report, EHS Management Approach, GRI 103.
Methodology of Reporting Water Consumption Water consumption is reported to Corporate EHS on a monthly basis from each manufacturing location and is verified through utility provider invoices, purchase records, on-site logs and/or monitoring equipment. Water consumption at each nonmanufacturing location is estimated based on headcount and the assumption each employee uses about 56 liters per day for personal hygiene and consumption. For tracking and reporting purposes, we assume that all water withdrawal and consumption are equivalent.
Operation Methodology Manufacturing Utility provider invoices and purchase records Nonmanufacturing Estimate of employees’ personal consumption
Version 2017-06-08 36

Edwards Lifesciences LLC One Edwards Way Irvine, CA USA 92614
Phone: 949.250.2500 Fax: 949.250.2525 www.edwards.com (Unaudited Report. For General Internal Use Only)
Edwards Internal Reporting For our manufacturing and nonmanufacturing locations, Edwards tracks and reports water consumption as part of our environmental footprint. This Section provides information which is not otherwise discussed in other GRI and DJSI reporting requirements. For our water conservation target, we focus on water consumption intensity and normalize water consumption by annual revenue.
Edwards’ 2020 Water Target Normalized by Annual Revenue 2015-2020 Target: 15% decrease 2015-2016 Actual: No change 2010-2016 Trend: No change
Metric: liters/$1,000 sales Edwards Results: 146 Benchmark Average: 160
Global Water Consumption, Normalized by Annual Revenue, 2010-2016,No Change
Edwards’ Annual Revenue and Measure of Intensity
105% growth over six years
Version 2017-06-08 37

Edwards Lifesciences LLC One Edwards Way Irvine, CA USA 92614
Phone: 949.250.2500 Fax: 949.250.2525 www.edwards.com (Unaudited Report. For General Internal Use Only)
Although total water consumption has increased 105% since 2010, Edwards has also grown 105% in the same time period. Hence, as a normalized rate, there has been no net change in consumption. At the same time, our cost per liter has increased from $1.69 to $1.84 per 1,000 liters primarily due to inflation and local pricing. Edwards’ facilities are considered dry in nature and do not require major sources of water for manufacturing. On the average, Edwards manufacturing locations use approximately 140 liters per day per employee. Our primary uses of water include cleanroom process water, employee hand cleaning form cleanroom hygiene, landscaping, employee restrooms and facilities related equipment, such as chiller units.
Global Water Consumption Absolute Trend, 2010-2016, 105% Increase
2010-2016 Trend in Total Water Usage Costs
Version 2017-06-08 38
Edwards Lifesciences LLC One Edwards Way Irvine, CA USA 92614
Phone: 949.250.2500 Fax: 949.250.2525 www.edwards.com (Unaudited Report. For General Internal Use Only)
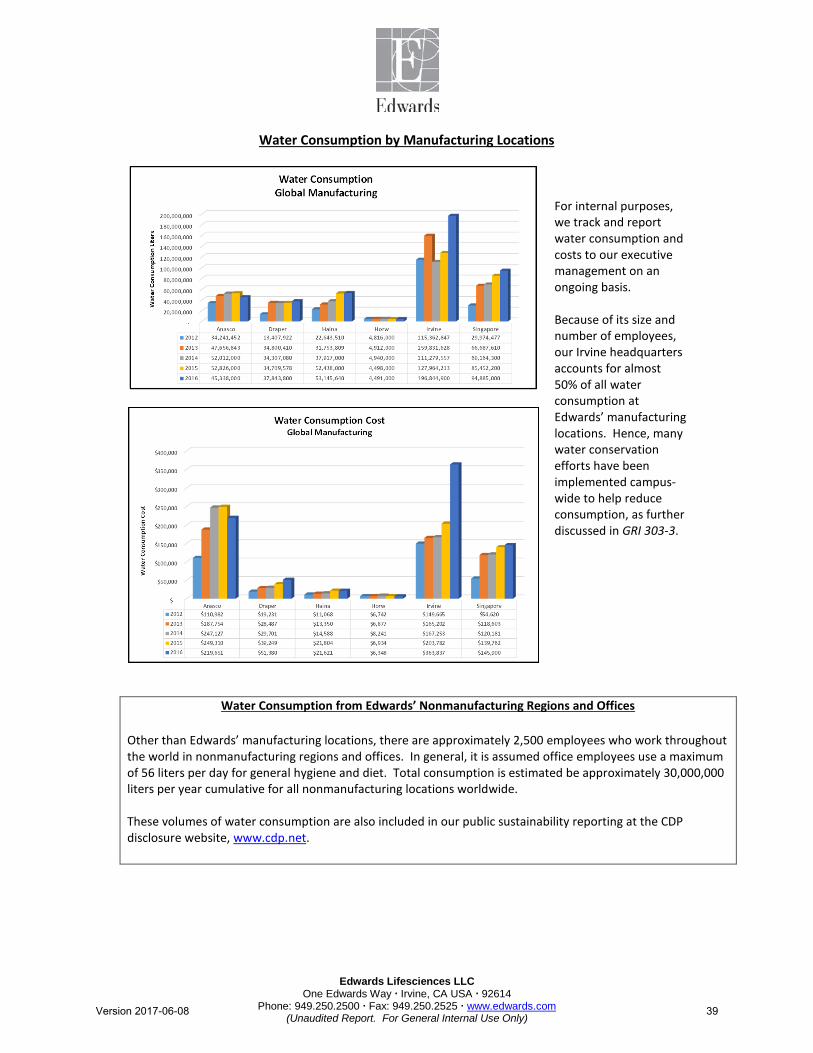
Water Consumption by Manufacturing Locations
For internal purposes, we track and report water consumption and costs to our executive management on an ongoing basis. Because of its size and number of employees, our Irvine headquarters accounts for almost 50% of all water consumption at Edwards’ manufacturing locations. Hence, many water conservation efforts have been implemented campus-wide to help reduce consumption, as further discussed in GRI 303-3.
Water Consumption from Edwards’ Nonmanufacturing Regions and Offices Other than Edwards’ manufacturing locations, there are approximately 2,500 employees who work throughout the world in nonmanufacturing regions and offices. In general, it is assumed office employees use a maximum of 56 liters per day for general hygiene and diet. Total consumption is estimated be approximately 30,000,000 liters per year cumulative for all nonmanufacturing locations worldwide. These volumes of water consumption are also included in our public sustainability reporting at the CDP disclosure website, www.cdp.net.
Version 2017-06-08 39

Edwards Lifesciences LLC One Edwards Way Irvine, CA USA 92614
Phone: 949.250.2500 Fax: 949.250.2525 www.edwards.com (Unaudited Report. For General Internal Use Only)
Water Withdrawal by Source (GRI 303-1)
Edwards’ primary source of water withdrawal comes from public utility providers, although in some locations we also extract water from ground water wells and purchase reclaimed water from the public utilities. In addition, we harvest stormwater in Irvine, California, for reuse on landscaping.
Water Withdrawal Sources
Mfg Location Public Utility “New”/Reclaimed Well Stormwater
Anasco 100% 0% 0% 0% Draper 86% 0% 14% 0% Haina 100% 0% 0% 0% Horw 100% 0% 0% 0% Irvine 99.8% 0% 0% 0.2%
Singapore 66% 34% 0% 0% ROW 100% 0% 0% 0%
Percentage of Water Withdrawal Sources for Each Location, 2016
Percentage of Water Withdrawal by Source, 2016
Public Utility “New”/Reclaimed Well Stormwater Harvesting 435,977,384 32,260,900 781,606 1,528,450
Total Liters of Water Withdrawal by Source, 2016
Version 2017-06-08 40
Edwards Lifesciences LLC One Edwards Way Irvine, CA USA 92614
Phone: 949.250.2500 Fax: 949.250.2525 www.edwards.com (Unaudited Report. For General Internal Use Only)
Water Sources Significantly Affected by Withdrawal of Water (GRI 303-2)
Based on the sources from which Edwards withdraws water, either from utility providers, groundwater wells or stormwater harvesting tanks, we have determined that there are no adverse significant impacts to sources or bodies of water caused by Edwards’ operations and activities. Edwards does not knowingly draw water from any national or international protected area or from locations whereby water withdrawals could harm the biodiversity value of the area. Therefore, this topic is not considered material for our reporting purposes.
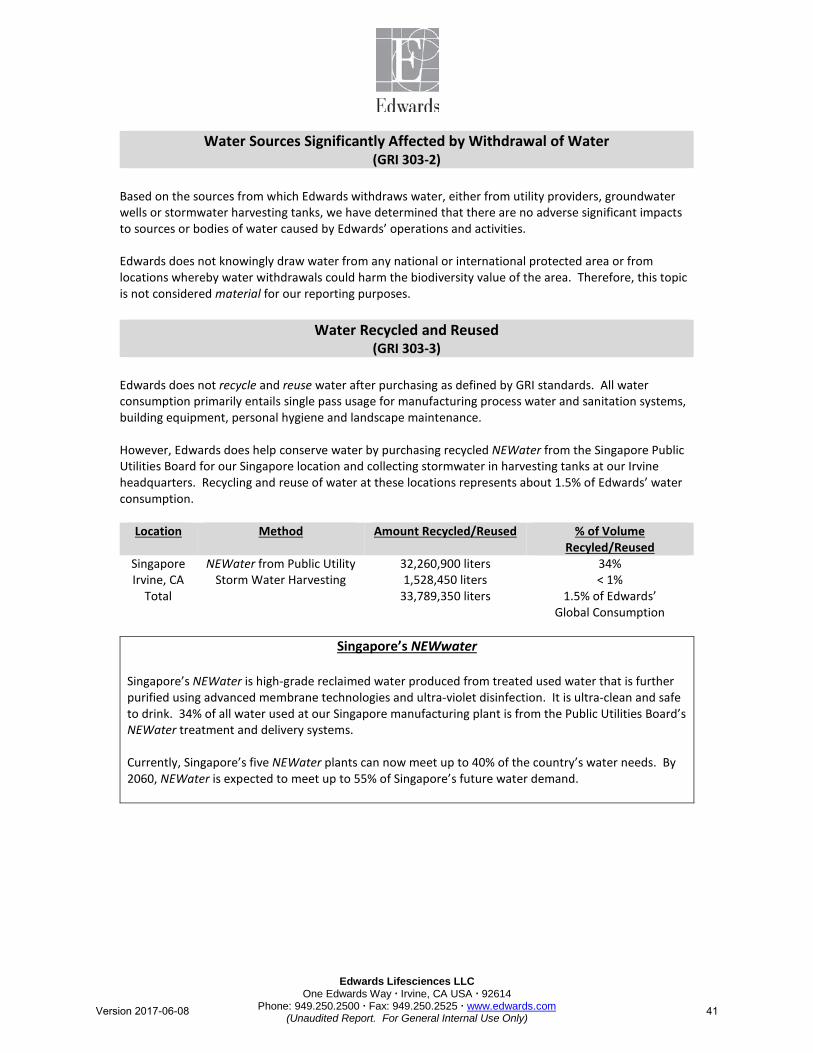
Water Recycled and Reused (GRI 303-3)
Edwards does not recycle and reuse water after purchasing as defined by GRI standards. All water consumption primarily entails single pass usage for manufacturing process water and sanitation systems, building equipment, personal hygiene and landscape maintenance. However, Edwards does help conserve water by purchasing recycled NEWater from the Singapore Public Utilities Board for our Singapore location and collecting stormwater in harvesting tanks at our Irvine headquarters. Recycling and reuse of water at these locations represents about 1.5% of Edwards’ water consumption.
Location Method Amount Recycled/Reused % of Volume Recyled/Reused
Singapore NEWater from Public Utility 32,260,900 liters 34% Irvine, CA Storm Water Harvesting 1,528,450 liters < 1%
Total 33,789,350 liters 1.5% of Edwards’ Global Consumption
Singapore’s NEWwater
Singapore’s NEWater is high-grade reclaimed water produced from treated used water that is further purified using advanced membrane technologies and ultra-violet disinfection. It is ultra-clean and safe to drink. 34% of all water used at our Singapore manufacturing plant is from the Public Utilities Board’s NEWater treatment and delivery systems. Currently, Singapore’s five NEWater plants can now meet up to 40% of the country’s water needs. By 2060, NEWater is expected to meet up to 55% of Singapore’s future water demand.
Version 2017-06-08 41

Edwards Lifesciences LLC One Edwards Way Irvine, CA USA 92614
Phone: 949.250.2500 Fax: 949.250.2525 www.edwards.com (Unaudited Report. For General Internal Use Only)
Irvine’s Storm Water Harvesting Tanks In order to protect potentially contaminated storm water run-off and to help conserve water, in Irvine we have installed two 30,000 gallon underground water harvesting tanks on our campus’ Central Park. The tanks are calculated to collect about 32,000 gallons per inch of rainfall. In CY 2016, 12.48” of rainfall was measured, allowing us to collect about 1,500,000 liters of water. The water is reused on our own landscaping.
View of Central Park, Irvine, Campus
Two 30,000 gallon underground storm water harvesting tanks in Irvine’s Central Park
For more information regarding Edwards’ Water Conservation programs, please review our CDP public Water report found at www.cdp.net.
Dow Jones Sustainability Index
Water Reporting (DJSI 2.3.4)
Version 2017-06-08 42

Edwards Lifesciences LLC One Edwards Way Irvine, CA USA 92614
Phone: 949.250.2500 Fax: 949.250.2525 www.edwards.com (Unaudited Report. For General Internal Use Only)
Section 6.0 BIODIVERSITY
(GRI 304)
Edwards’ Employees of Haina, Dominican Republic
“Jornada de Reforestacion” 2016
The following topics are included in this Section:
Topic Reference • Management Approach GRI 103 • Protected Areas & Areas of High Biodiversity GRI 304-1 • Significant Impacts of Activities, Products and Services on Biodiversity GRI 304-2 • Habitats Protected or Restored GRI 304-3 • IUCN Red List Species and National Conservation List Species GRI 304-4
Although biodiversity is not considered a material aspect or concern to Edwards’ stakeholders, we still actively implement emergency preparedness and pollution prevention programs to reduce effluents and emissions, threats, risks and other potentially adverse impacts to local habitats. Types of pollution prevention programs and their results are discussed for water usage and conservation (Section 5, GRI 303), air emissions (Section 7.0, GRI 305) and effluents and waste (Section 8.0, GRI 306). In addition, employees volunteer to participate in environmental outreach programs to help improve their local communities. In 2015, employees from Edwards’ manufacturing location in Haina, Dominican Republic, held its third annual Beach Clean-Up and in 2016, held its first local reforestation project, Jornada de Reforestacion (pictured above).
Version 2017-06-08 43

Edwards Lifesciences LLC One Edwards Way Irvine, CA USA 92614
Phone: 949.250.2500 Fax: 949.250.2525 www.edwards.com (Unaudited Report. For General Internal Use Only)
Management Approach Even though our Corporate sustainability materiality assessment did not indicate biodiversity is considered an aspect of significant concern to either internal or external stakeholders, nonetheless, we approach the husbandry of our local environment with respect and care. Instead of implementing biodiversity at our corporate level, we believe it is best approached at the local manufacturing locations whereby our EHS teams are best able to prevent potential adverse effects of our effluents, air emissions and wastes on the environment. Of all our identified environmental aspects, Edwards has identified the effects of the release of uncontrolled or contaminated stormwater and run-off to have the most significant potential impact on our local habitats and communities. As such, each location is required to maintain spill prevention and preparedness programs and stormwater runoff control processes; some required by regulation and some through the implementation of stormwater Best Management Practices. Risk of releases and prevention plans are evaluated at each location during periodic Corporate EHS audits.
Protected Areas & Areas of High Biodiversity (GRI 304-1)
Of Edwards’ six manufacturing locations and over 65 regional offices throughout the world, both owned and leased, none of them are known to be situated on any environmentally protected area, area of high biodiversity or other concern for adverse impacts to flora and fauna of the region. The following discussion provides an overview of the risks and activities associated with each of our manufacturing locations:
Añasco, Puerto Rico Draper, Utah
Haina, Dominican Republic Horw, Switzerland Irvine, California
Singapore
Version 2017-06-08 44

Edwards Lifesciences LLC One Edwards Way Irvine, CA USA 92614
Phone: 949.250.2500 Fax: 949.250.2525 www.edwards.com (Unaudited Report. For General Internal Use Only)
Añasco, Puerto Rico
Rio Grande de Añasco, Puerto Rico
Stormwater from Edwards’ Añasco manufacturing facility feeds into the Rio Grande de Añasco, which originates approximately 40 miles to the west, flows by Añasco and empties into the Mona Passage adjacent to the city of Mayagüez. The Rio Grande occupies over 180 square miles of stormwater collection and diversion. Industrial discharges from businesses and residences are highly regulated, especially with regards to contaminants which may be released to the stormwater system. The Rio Grande not only hosts many endangered species of birds, including rails, petrels and pelicans, but also hosts many rare and endangered plants, mammals, amphibians and fish. With a population of only 13 individuals in 1975, the Puerto Rican Amazon Parrot almost became nonexistent, and, without conservation efforts, they would not have been saved from extinction. It has since recovered, but is still recognized as one of the ten most critically endangered birds in the world. The Edwards’ Añasco facility is very diligent at ensuring engineering and procedural controls are in place to reduce the risk of accidental discharges or releases to the environment. Industrial equipment and tanks are protected from rain water and, if necessary, maintained in self-containment units. The facility also implements Best Management Practices (BMP), Spill Prevention Control and Countermeasure Plans (SPCC) and Stormwater Pollution Prevention Plans (SWPPP). There are no industrial discharges of contaminated stormwater to any subsurface or surface waters, including the Rio Grande de Añasco from our Añasco industrial operations.
Version 2017-06-08 45

Edwards Lifesciences LLC One Edwards Way Irvine, CA USA 92614
Phone: 949.250.2500 Fax: 949.250.2525 www.edwards.com (Unaudited Report. For General Internal Use Only)
Draper, Utah
Natural Area-Wildlife Habitat
East Jordan River Corridor
Jordan River
Stormwater runoff from Edwards’ Draper facility finds its way through the Jordan and Salt Lake City Canal System, eventually feeding into the Jordan River. Within the City of Draper, approximately 16 inches of annual precipitation distributed among 30 square miles of surface area runoff is channeled to the Jordan River each year. The Jordan River connects the Great Salt Lake and Utah Lake ecosystems, serves as an inherent component of the internationally recognized Pacific Flyway and provides a critical habitat for both resident and migratory bird species, including four species listed under the Federal Endangered Species Act of 1973 and twenty-two species listed specifically in Utah as species of concern. Most commonly recognized are bald eagles who spend their winters along the Jordan River. With regards to our Draper manufacturing location, Edwards’ operations present very little environmental risk to the local stormwater runoff concerns in the community. The site operates under the City of Draper’s Stormwater Management Plan, has obtained approval of its stormwater No Exposure Certification from the State of Utah and implements a comprehensive Spill Prevention, Control and Countermeasure Plan (SPCC) to protect the environment from any accidental fuel or oil spills or leaks. Essentially, Edwards’ Draper has no adverse water discharge or runoff from its industrial operations and minimal impact to the environment.
Version 2017-06-08 46
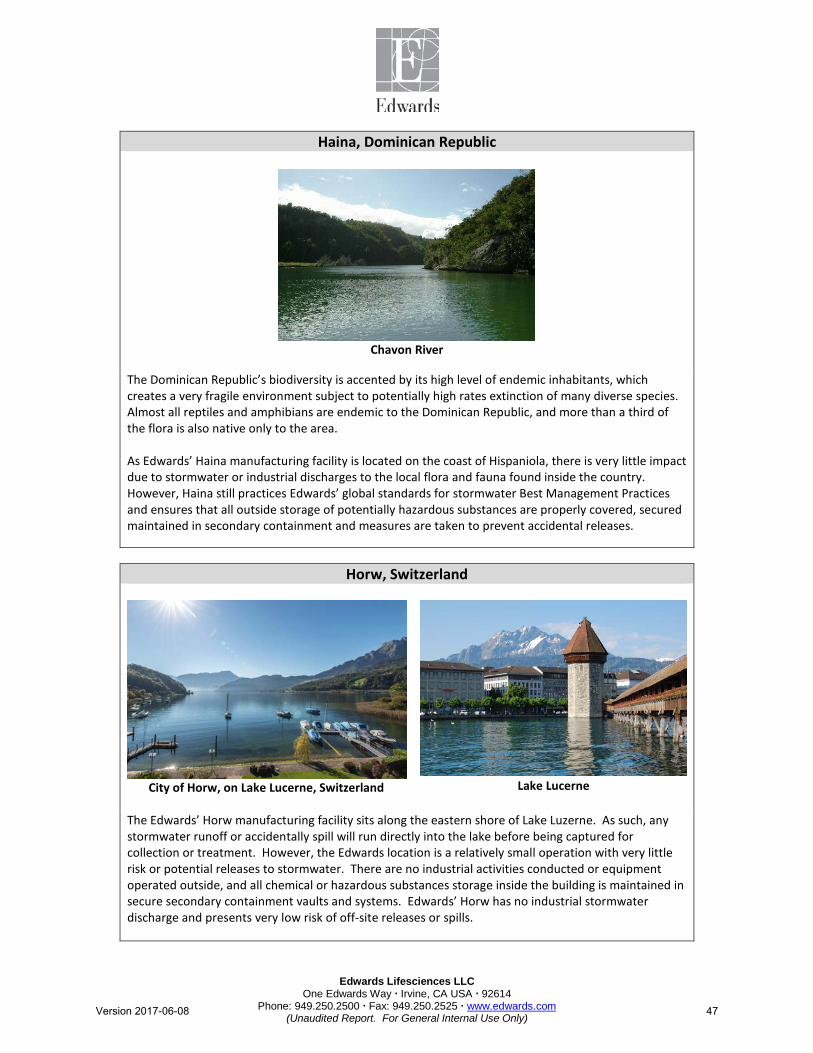
Edwards Lifesciences LLC One Edwards Way Irvine, CA USA 92614
Phone: 949.250.2500 Fax: 949.250.2525 www.edwards.com (Unaudited Report. For General Internal Use Only)
Haina, Dominican Republic
Chavon River
The Dominican Republic’s biodiversity is accented by its high level of endemic inhabitants, which creates a very fragile environment subject to potentially high rates extinction of many diverse species. Almost all reptiles and amphibians are endemic to the Dominican Republic, and more than a third of the flora is also native only to the area. As Edwards’ Haina manufacturing facility is located on the coast of Hispaniola, there is very little impact due to stormwater or industrial discharges to the local flora and fauna found inside the country. However, Haina still practices Edwards’ global standards for stormwater Best Management Practices and ensures that all outside storage of potentially hazardous substances are properly covered, secured maintained in secondary containment and measures are taken to prevent accidental releases.
Horw, Switzerland
City of Horw, on Lake Lucerne, Switzerland
Lake Lucerne
The Edwards’ Horw manufacturing facility sits along the eastern shore of Lake Luzerne. As such, any stormwater runoff or accidentally spill will run directly into the lake before being captured for collection or treatment. However, the Edwards location is a relatively small operation with very little risk or potential releases to stormwater. There are no industrial activities conducted or equipment operated outside, and all chemical or hazardous substances storage inside the building is maintained in secure secondary containment vaults and systems. Edwards’ Horw has no industrial stormwater discharge and presents very low risk of off-site releases or spills.
Version 2017-06-08 47

Edwards Lifesciences LLC One Edwards Way Irvine, CA USA 92614
Phone: 949.250.2500 Fax: 949.250.2525 www.edwards.com (Unaudited Report. For General Internal Use Only)
Irvine, California
Newport Back Bay Inland Delta
Aliso Creek, Laguna Beach, California
The County of Orange, of which Irvine resides, implements a county wide National Pollutant Discharge Emissions Systems (NPDES) permit under the authority of the local Water Quality Control Board. Under the program, Edwards is required to implement various Best Management Practices (BMP), accidental release programs and spill control processes in order to reduce the risk of adverse discharges of contaminants to the environment. Stormwater runoff from Irvine eventually travels to the 752 acre Newport Back Bay inland delta and neighboring Aliso Beach. Newport Back Bay is protected by the State of California through its bay and estuary policies and serves as a nature reserve for many bird and animal species. The bay hosts over 200 species of birds, including three endangered species; the Light Footed Clapper Rail, California Least Tern and Least Bell’s Vireo. With regards to Edwards’ Irvine manufacturing operations, the site hosts over 3,000 employees for both manufacturing and administrative functions. Not only do we implement required stormwater Best Management Practices, but we have installed stormwater filtration and bioswale treatment systems for approximately 80% of the potential runoff from the campus. We have also installed a rainwater harvesting system to collect rainwater and reuse it on the grass and landscaping. Essentially, the Irvine manufacturing location has no adverse water discharges or runoff from its industrial operations.
Version 2017-06-08 48

Edwards Lifesciences LLC One Edwards Way Irvine, CA USA 92614
Phone: 949.250.2500 Fax: 949.250.2525 www.edwards.com (Unaudited Report. For General Internal Use Only)
Singapore
MacRitchie Reservoir, Singapore
Singapore has 32 rivers and 8,000 kilometers of drains, rivers and canals. In accordance with the Sewerage and Drainage Act, the Singapore Public Utilities Board has established a Code of Practice on Surface Water Draining and Active, Beautiful and Clean Waters Design and Engineering. Not only do these standards help manage the excessive runoff from a continuing growing urban population, but also to ensure the quality of runoff is not contaminated and appropriate for reservoir collection and treatment for drinking water supply. Singapore is one of the few countries in the world to harvest urban stormwater on a large scale for its personal water supply. Cleanliness of runoff also impacts the local habitat and wildlife. There are many different varieties or animals and species considered to be endangered or of other concern. The brown-crested jungle flycatcher one of Singapore’s endangered species. The Edwards’ Singapore facility is committed to preventing contaminated runoff from its operations. All industrial equipment is covered by shelter or maintained indoors. All hazardous substances are stored in secondary containment to prevent overflow or spilling into to the environment. Finally, the majority of employees are provided employee paid bus service which helps eliminate potential contaminated runoff from employees’ personal vehicles. Essentially, Edwards Singapore has very little risk or concern for contaminated stormwater runoff or adverse impact to the local environment.
Version 2017-06-08 49

Edwards Lifesciences LLC One Edwards Way Irvine, CA USA 92614
Phone: 949.250.2500 Fax: 949.250.2525 www.edwards.com (Unaudited Report. For General Internal Use Only)
Significant Impacts of Activities, Products and Services (GRI 304-2)
The scope of our EHS Annual Report focuses on Edwards’ activities which affect or have the potential to affect the environment or health and safety of people, most particularly with relation to manufacturing operations. Environmental impacts related to products and services are not considered significant nor material towards risks or impacts to the environment. We have identified Edwards’ primary potential impacts to the environment as indicated in the table below. These topics are further discussed throughout this report.
Manufacturing Nonmanufacturing Aspect Refer to Section:
Aspect Refer to Section:
Energy 4.0, GRI 302 Energy 4.0, GRI 302 Air Emissions 7.0, GRI 305 Water 5.0, GRI 303 Water Usage 5.0, GRI 303 Employee Commuting 7.0, GRI 305 Hazardous Waste 8.0, GRI 306 Supplier Partnerships 9.0, GRI 308 Nonhazardous Waste 8.0, GRI 306 Recycling 8.0, GRI 306 Wastewater 8.0, GRI 306 Stormwater 8.0, GRI 306 Employee Commuting 7.0, GRI 305
Overall, Edwards’ activities, products and services do not significantly nor materially adversely affect the biodiversity of the local environmental under normal operating conditions. Also, in order to prevent incidents or accidents from occurring which could potentially harm the environment, Edwards implements strict requirements for the storage, processing, control and disposal of hazardous materials and contaminants which could potentially be released during a spill, fire, hurricane, flood or other event. In 2016, Edwards did not have any unpermitted and significant adverse event or public complaint with regards to its direct or indirect impacts on the environment and biodiversity.
Habitats Protected or Restored (GRI 304-3)
Edwards’ manufacturing and nonmanufacturing locations do not operate in areas which are considered to be protected or restored. However, Edwards does operate in areas by which an off-site release of a hazardous material or contaminant could potentially have an adverse effect to the environment and wildlife downstream of Edwards’ operations. As such, at all locations, we implement robust accident prevention and emergency response plans in order to reduce risks and prevent occurrences, but also prepared to respond effectively in case an event should occur.
Version 2017-06-08 50

Edwards Lifesciences LLC One Edwards Way Irvine, CA USA 92614
Phone: 949.250.2500 Fax: 949.250.2525 www.edwards.com (Unaudited Report. For General Internal Use Only)
Endangered Species (GRI 304-4)
Edwards Lifesciences operates six manufacturing facilities in five different countries across the globe. As with its medical device peers, Edwards has very little impact with regards to its effluents, wastes and emissions which have the potential to adversely affect the habitats of plant and animal species. However, even though the impact is minimal, we continue to reduce our environmental footprint and focus on emergency or catastrophic events which may create releases or spills to the environment. Using websites from both the International Union for Conservation of Nature (IUCN), www.iucnredlist.org, and Earth’s Endangered Species (EES), earthsendangered.com, we have identified plant and animal species of most concern in the locations in which we operate. We have determined that our operations have very little and insignificant adverse impact on these flora and fauna. We have identified over 250 different plants, birds, mammals, invertebrates, arthropods, amphibians and other animals which potentially live on or around our global manufacturing locations and are found on IUCN and EES lists ranging from species of Least Concern to species Critically Endangered. We have determined, however, that our business related activities do not impact these species to any manner that could adversely affect their survival and proliferation. Our local protected species include some of the following of nature’s creatures:
DRAPER, UTAH
Bald Eagle
(Haliaeetus leucocephalus)
IRVINE, CALIFORNIA
California Least Tern
(Sterna antillarum browni)
ANASCO, PUERTO RICO
Puerto Rican Amazon Parrot
(Amazona vittata)
SINGAPORE
Brown-Crested Jungle Flycatcher
(Rhinomyias brunneatus)
HAINA, DOM. REP.
Eastern Crested Toad
(Bufo fractus)
HORW, SWITZERLAND
Northern Lapwing (Vanellus vanellus)
Version 2017-06-08 51

Edwards Lifesciences LLC One Edwards Way Irvine, CA USA 92614
Phone: 949.250.2500 Fax: 949.250.2525 www.edwards.com (Unaudited Report. For General Internal Use Only)
Section 7.0 AIR EMISSIONS
(GRI 305)
Air Emissions are directly linked to global energy consumption as discussed in Section 4.0 of this report. However, in addition to emissions due to the burning of fossil fuels, Edwards’ manufacturing operations also have emissions of volatile organic compounds (VOCs) and other regulated air emissions substances. The following section discusses air emissions for both equipment and fugitive emissions as they occur from our operations. The following topics are included in this Section:
Topic
Reference
• Management Approach Methodology of Reporting Air Emissions Global Greenhouse Gas Factors
GRI 103
• Direct Energy (Scope 1) GHG Emissions GRI 305-1 • Indirect Energy (Scope 2) GHG Emissions GRI 305-2 • Other Indirect Energy (Scope 3) GHG Emissions GRI 305-3 • GHG Emissions Intensity GRI 305-4 • Reduction of GHG Emissions GRI 305-5 • Emissions of Ozone-Depleting Substances GRI 305-6 • Nitrogen Oxides (NOx), Sulfur Oxides (SOx) and other emissions GRI 305-7
Management Approach
Edwards’ approach to the management of air emissions is based on four criteria: regulatory compliance, industry benchmarking, stakeholder feedback and local community considerations. Similar to Energy (GRI 304), Air Emissions are also considered a significant material environmental aspect as determined by our external stakeholder engagement interviews. We also report greenhouse gas emissions and climate change impacts through the CDP public sustainability reporting website www.cdp.net. The scope of our air emissions reporting is based on operational control and includes emissions from our owned, leased and/or operated six manufacturing and 65 regional offices in 36 countries. Four categories of reported emissions include; a) Scope 1: GHG Emissions from Direct Energy, b) Scope 2: GHG Emissions from Indirect Energy, c) Scope 3: GHG Emissions from Employee Business and Personal Commuting and d) Manufacturing Location emissions of air toxics and regulated substances. With regards to the management of air emissions, our governance, responsibilities, goal setting, deployment and communication process is consistent with our overall EHS Program approach discussed in Section 1, EHS Management Approach, GRI 103.
Version 2017-06-08 52

Edwards Lifesciences LLC One Edwards Way Irvine, CA USA 92614
Phone: 949.250.2500 Fax: 949.250.2525 www.edwards.com (Unaudited Report. For General Internal Use Only)
Methodology of Reporting Air Emissions Air emissions are divided into two sections with regards Edwards EHS management and reporting programs.
• Air Emissions related to Greenhouse Gases (GHG) o Direct Energy Scope 1 Emissions (GRI 305-1) o Indirect Energy Scope 2 Emissions (GRI 305-2) o Other Indirect Energy Scope 3 Emissions (GRI 305-3) o GHG Emissions Intensity (GRI 305-4) o Reduction of GHG Emissions (GRI 305-5)
• Air Emissions from manufacturing processes and facilities equipment
o Emissions of ozone depleting substances (GRI 305-6) o Nitrogen oxides (NOx), sulfur oxides (SOx), other Significant Air Emissions (GRI 305-7)
Greenhouse gas emissions are verified by converting energy usage (GRI 304) information obtained from utility providers and monitoring processes into greenhouse gases or carbon dioxide equivalents (CO2e). Edwards does not utilize GHG offsets to reduce the reporting of its GHG emissions. These programs are discussed in GRI 305-5. Air emissions from manufacturing and facilities equipment include nitrogen oxides (NOx), sulfur oxides (SOx), volatile organic compounds (VOCs or ROGs) and air toxics. Edwards does not emit ozone depleting substances (ODS) from manufacturing. Typically, air emissions are reported annually to government agencies and may alternate between calendar years and July-June reporting years, depending on the local government requirements. Total emissions are verified during periodic Corporate CEHS Audits.
Global GHG Emission Factors In determining GHG Emission Factors, Edwards utilizes the following GHG conversion sources, in order of priority: Utility Provider, local emission studies, US EPA and DEFRA. Although we recognize that different countries within a region may have different emission factors, for simplicity and consistency in annual reporting, we group office locations from neighboring countries into the regions. This grouping may create some variations and error factors, but is determined to have only a small impact for Edwards’ total GHG reporting. Edwards reports Metric Tons of Carbon Dioxide Equivalents (MT CO2e) comprised of the total of all GHGs, including CO2, CH4, N2O, HFCs, PFCs, SF6, NF3 and others. We also do not report or adjust emission volumes by global warming potential of specific molecules. However, as our air emission reporting program evolves, we will consider reporting specific GHGs in subsequent reports.
Version 2017-06-08 53

Edwards Lifesciences LLC One Edwards Way Irvine, CA USA 92614
Phone: 949.250.2500 Fax: 949.250.2525 www.edwards.com (Unaudited Report. For General Internal Use Only)
The following GHG Scope 1 Emission factors are utilized in reporting GHG emissions, GRI 305-1.
The following GHG Scope 2 Emission factors are utilized in reporting GHG emissions, GRI 305-2.
The following GHG Scope 3 Emission factors are utilized in reporting GHG emissions, GRI 305-3.
Version 2017-06-08 54

Edwards Lifesciences LLC One Edwards Way Irvine, CA USA 92614
Phone: 949.250.2500 Fax: 949.250.2525 www.edwards.com (Unaudited Report. For General Internal Use Only)
Direct Energy (Scope 1) GHG Emissions (GRI 305-1)
Edwards’ includes in its Scope 1 Direct Energy GHG emissions from its six global manufacturing locations and 65 owned and leased administrative regional office locations located in 36 countries. Scope 1 GHG emissions are derived from fossil fuel sources which are combusted on-site to create energy, including natural gas, diesel, propane and gasoline. Although Edwards has been reporting its GHG emissions for several years, we have selected a new base year of 2015 in order to align with our Environmental 2020 plan, in which we have established environmental goals for our 5-year planning cycle 2016-2020. Targets and objectives are also normalized by annual revenue to reflect growth and changes in the company as discussed in GRI 305-4 and GRI 305-5.
Gross Direct (Scope 1) GHG Emissions MT CO2e
2015 2016 Manufacturing Locations 4,485 5,071 Regions and Offices (estimates) 2,325 2,347 Total GHGs 6,810 7,418
Global Indirect Energy Greenhouse Gas Emissions 2010-2016
Greenhouse gas emissions from direct energy from Edwards manufacturing and nonmanufacturing locations is attributed to the combustion of natural gas, diesel fuel, propane and gasoline. Emissions from our administrative Rest of World Regions office locations is estimated based on square meters of owned and leased office space and the assumption that 60% of our office locations utilize natural gas for heating.
Version 2017-06-08 55

Edwards Lifesciences LLC One Edwards Way Irvine, CA USA 92614
Phone: 949.250.2500 Fax: 949.250.2525 www.edwards.com (Unaudited Report. For General Internal Use Only)
In 2016, Scope 1 GHG emissions were generated from the following fuels and processes globally for Edwards manufacturing and regional office operations.
Fuel Process Emissions MT CO2e
Natural Gas Heating, Steam and Hot Water, Process Water, Sanitization
5,719
Diesel Emergency Generators 1,644 Propane Cafeteria, Forklifts 35 Gasoline On-Site Vehicles 20 Total GHGs Scope 1 Processes 7,418
Scope 1 GHG Emissions from Global Manufacturing and Nonmanufacturing 2016
Indirect Energy (Scope 2) GHG Emissions
(GRI 305-2) Edwards’ includes in its Scope 2 Indirect Energy GHG emissions from its six global manufacturing locations and 65 owned and leased administrative regional office locations located in 36 countries. Scope 2 GHG emissions are derived solely from the purchase of electricity from public and private utility providers. As with our Scope 1 Direct Energy GHG emissions, we selected a new base year of 2015 to reflect our 2016-2020 EHS 5-year planning cycle. Targets and objectives are also normalized to reflect growth and changes in the company as discussed in GRI 305-4 and GRI 305-5.
Gross Indirect (Scope 2) GHG Emissions MT CO2e
2015 2016 Manufacturing Locations 29,171 34,352 Regions and Offices (estimates) 4,600 4,664 Total GHGs 33,771 39,016
Version 2017-06-08 56

Edwards Lifesciences LLC One Edwards Way Irvine, CA USA 92614
Phone: 949.250.2500 Fax: 949.250.2525 www.edwards.com (Unaudited Report. For General Internal Use Only)
Global Indirect Energy Greenhouse Gas Emissions 2010-2016
Greenhouse gas emissions from indirect energy from Edwards manufacturing and nonmanufacturing locations is directly correlated to electricity purchased from public and private utility providers. Emissions from Irvine and Singapore manufacturing locations has increased in direct proportion to increased headcount and manufacturing activities. Emissions from our administrative Rest of World Regions office locations is estimated for years prior to 2016. We normalize our GHG emissions based on annual revenue which is further discussed in this report in Section 305-4, Emissions Intensity.
Version 2017-06-08 57

Edwards Lifesciences LLC One Edwards Way Irvine, CA USA 92614
Phone: 949.250.2500 Fax: 949.250.2525 www.edwards.com (Unaudited Report. For General Internal Use Only)
Other Indirect Energy (Scope 3) GHG Emissions (GRI 305-3)
Edwards’ also reports Scope 3 Other Indirect Energy GHG emissions from both employees’ business and personal commuting. Business commuting consists of travel by salesforce employees and air and rail by all Edwards’ global employees. Personal commuting includes employees’ round trip commute from home and work, excluding salesforce employees’ vehicles. Like GHG Scope 1 and Scope 2 emissions, we have selected a new base year of 2015 in order to align with our 2016-2020 planning cycle. Targets and objectives are normalized by annual revenue to reflect the impact of our company’s growth.
Gross Indirect (Scope 3) GHG Emissions MT CO2e
2015 2016 Personal Commuting 13,914 15,340 Business Commuting 25,823 26,045 Total GHGs 39,737 41,312
Employee Personal Commuting to/from Work
Employee Business Commuting
Version 2017-06-08 58

Edwards Lifesciences LLC One Edwards Way Irvine, CA USA 92614
Phone: 949.250.2500 Fax: 949.250.2525 www.edwards.com (Unaudited Report. For General Internal Use Only)
GHG Emissions Intensity (GRI 305-4)
2016-2020 Target: 0% Change from 2015 baseline Normalized by Annual Revenue 2015-2016 Actual: 3% Decrease 2010-2016 Trend: 30% Decrease
Combined Direct (Scope 1) & Indirect (Scope 2) Emissions – Normalized by Annual Revenue
Carbon Dioxide Equivalent (CO2e) Emissions
GHG Emissions by Source of Energy
Approximately 84% of all GHG emissions are
attributed to Scope 2 Electricity Usage
Version 2017-06-08 59

Edwards Lifesciences LLC One Edwards Way Irvine, CA USA 92614
Phone: 949.250.2500 Fax: 949.250.2525 www.edwards.com (Unaudited Report. For General Internal Use Only)
Indirect Energy Scope 1 Emissions – Normalized by Annual Revenue
Indirect Energy Scope 2 GHG Emissions – Normalized by Annual Revenue
Version 2017-06-08 60

Edwards Lifesciences LLC One Edwards Way Irvine, CA USA 92614
Phone: 949.250.2500 Fax: 949.250.2525 www.edwards.com (Unaudited Report. For General Internal Use Only)
Reduction of GHG Emissions (GRI 305-5)
As normalized for Edwards’ growth over the past several years, since 2010 we have reduced our normalized GHG greenhouse gas emissions (Metric Tons CO2e) 30% primarily by implementing more efficient measures to utilize and save on energy usage. For our short and long term targets, we focus on total energy reduction strategies which, in turn, translate directly into GHG emission reductions. Our 2016 to 2020 target is to achieve 0% change in energy consumption, baseline 2015, normalized by annual revenue as our company continues to expand and grow. At Edwards, 47% of our GHG emissions derive from employee commuting activities (Scope 3), 44% from electricity (Scope 2) usage and only 9% from other fuel source (Scope 1) consumption. Hence, our primary energy reduction strategies have focused on employee commuting and electricity usage.
Total Scope 1, 2 & 3 GHG Emissions
Manufacturing and Non-Manufacturing Locations
Version 2017-06-08 61

Edwards Lifesciences LLC One Edwards Way Irvine, CA USA 92614
Phone: 949.250.2500 Fax: 949.250.2525 www.edwards.com (Unaudited Report. For General Internal Use Only)
Because Edwards’ delegates its EHS program directly to the individual operating units and manufacturing locations, we do not necessarily track and report at the Corporate EHS level on all individual energy reduction initiatives at each location. However, the following are examples of some of our most notable GHG reduction activities.
Employee Commuting Initiatives Over 50% of GHG emissions derive from employee commuting activities, both for business travel and personal commuting. In fact, over 15,000 metric tons of GHG (CO2e) emissions occur from employees personally traveling to and from work each year. In recognition of this concern, we have implemented different strategies to help reduce employee commuting and have maintained that almost 40% of our global employees enjoy alternate transportation coming to and from work. Employee Bus Services: Our two largest manufacturing locations, Singapore and Haina, Dominican Republic, provide employee bus services for our employees. This amounts to approximately 3,000 employees each day and a reduction of approximately 25,000,000 kilometers driven or 5,000 metric tons of GHG emissions per year. Electric Vehicle Charging: At our Irvine, California, and Draper, Utah, locations we provide electric vehicle charging stations for Edwards’ employees. With approximately 140 registered EV drivers traveling over 1,400,000 kilometers per year, we are helping reduce GHG emissions 300 metric tons CO2e per year.
Draper, Utah, Electric Vehicle Charging Stations
Employee Vanpool Programs: At our Irvine, California, location we provide fully subsidized vanpools for six or more employees who want to ride together to work. Currently we have 74 employees sharing 11 vanpools throughout southern California. Our vanpools help reduce over 1,200,000 kilometers per year of driving and help reduce GHG emissions by 250 metric tons per year.
Irvine, California, Employee Vanpool Program
Version 2017-06-08 62

Edwards Lifesciences LLC One Edwards Way Irvine, CA USA 92614
Phone: 949.250.2500 Fax: 949.250.2525 www.edwards.com (Unaudited Report. For General Internal Use Only)
Emissions of Ozone-Depleting Substances (ODS) (GRI 305-6)
Edwards has eliminated all Ozone-Depleting Substances (ODS) from our manufacturing operations, including Freon previously used for cleaning and degreasing of products. Although we still use ODS in some of our air conditioning systems, including R-22, R-134A and R-410A, processes are in place to leak test each unit, recover any spent ODS during maintenance and report emissions to our local air quality management agencies. Because our global emissions of ODS are minimal they are not considered material nor significant to our air emissions reduction program. It is estimated that no more than 50 pounds of ODS is emitted annually from all of our locations worldwide. As Edwards’ leases most of its nonmanufacturing locations, we are not able to control the ODS considerations for air handling equipment from the office buildings.
Nitrogen Oxides, Sulfur Oxides and Other Significant Air Emissions (GRI 305-7)
Nitrogen Oxides (NOx), Sulfur Oxides (SOx), Volatile Organic Compounds (VOC or ROG) and Particulate Matter (PM) are emissions due to the consumption of fuels at our manufacturing locations, primarily including natural gas and diesel. Emissions from propane and gasoline for company vehicles is not considered to be a material contributor to total emissions. Although our operations also emit Volatile Organic Compounds (VOC) and some Hazardous Air Pollutants (HAP), these specific emissions are not included in our corporate reporting program at this time. However, we will be including them in subsequent reporting years.
Global Manufacturing Air Emissions 2016
SOx NOx ROG/VOC PM
86 kgs 3,001 kgs 799 kgs 1,086 kgs
Kilograms of Air Emissions from Natural Gas and Diesel Fuel Sources, 2016 Emission Factors are sourced from California’s South Coast Air Quality Management District
Version 2017-06-08 63

Edwards Lifesciences LLC One Edwards Way Irvine, CA USA 92614
Phone: 949.250.2500 Fax: 949.250.2525 www.edwards.com (Unaudited Report. For General Internal Use Only)
Scope 1 Direct Energy Air Emissions by Manufacturing Location, 2016
Dow Jones Sustainability Index
Volatile Organic Compounds (VOC) Emissions (DJSI 2.3.8)
Except for greenhouse gases, Edwards only reports air emissions at the corporate level for the consumption of fossil fuels by our global manufacturing locations (Refer to GRI 307). VOCs and specific air toxics emitted from manufacturing operations are reported locally for each location pursuant to their own air quality regulatory requirements. However, we will be including these figures in subsequent EHS Annual Reporting.
Version 2017-06-08 64

Edwards Lifesciences LLC One Edwards Way Irvine, CA USA 92614
Phone: 949.250.2500 Fax: 949.250.2525 www.edwards.com (Unaudited Report. For General Internal Use Only)
Dow Jones Sustainability Index Climate Strategy
(DJSI 2.4) The following information is to provide responses to questions associated with DJSI reporting for Climate Change Management. More details on Edwards’ commitment to reducing energy consumption and impacting greenhouse gases can be found on the public disclosure for climate change and throughout this report. 2.4.1 CDP Climate Change: Edwards publicly reports climate change information annually to
www.cdp.net 2.4.2 Management Incentives: Incentives for reducing pollution are included in individual employee
performance objectives and other employee recognition programs. Specifically with regards to greenhouse gases, we have adopted targets maintain 0% change in energy consumption and greenhouse gas emissions during our 2016-2020 EHS Plan as our company continues to expand and grow its operations. From 2015 to 2016, both energy usage and greenhouse gas emissions decreased 1%. • Our executives are held accountable each year for achieving our Corporate Sustainability
Aspirations, which includes specific targets aimed toward Strengthening our Communities. Reducing our environmental footprint is a critical element defining success of this community based aspirational commitment.
• More information regarding our Aspirations and commitments can be found at
http://www.edwards.com/sustainability/our-approach/#aspirations 2.4.3 Risk Management: The risk of potential effects of changes in the climate are included two key
areas of our Environmental and Risk Management processes at our manufacturing locations.
• First, as part our commitment to become ISO 14001 certified, each manufacturing location is required to complete a significant environmental aspects analysis of their activities and operations. Among many other criteria, the impact of changing weather patterns, such as hurricanes and droughts, are evaluated to determine if the potential risks to the business or environment is significant. Depending on the level of significance, steps are taken to help prevent and/or respond to any foreseeable emergencies or adverse outcomes.
• Second, through our loss prevention provider, we complete risk modeling for all of our
manufacturing locations which matches frequency and magnitude of various scenarios. For example, in our Caribbean locations, the risk of hurricanes or weather events has been determined to be significant, therefore, we have made substantial improvements in our roofing structures, windows and outside equipment in order to help prevent or lessen potential damage.
2.4.4 Financial Risks: Through our risk modeling exercises with our loss prevention provider, we have
identified financial risks associated with our manufacturing operations and business continuity strategies. Where feasible, investments are made to lessen the financial risks and business impacts or, at a minimum, provide us to be prepared in case of an adverse occurrence which would disrupt our operations. Although this information is available, due to business sensitivities it may not be disclosed to the public.
Version 2017-06-08 65
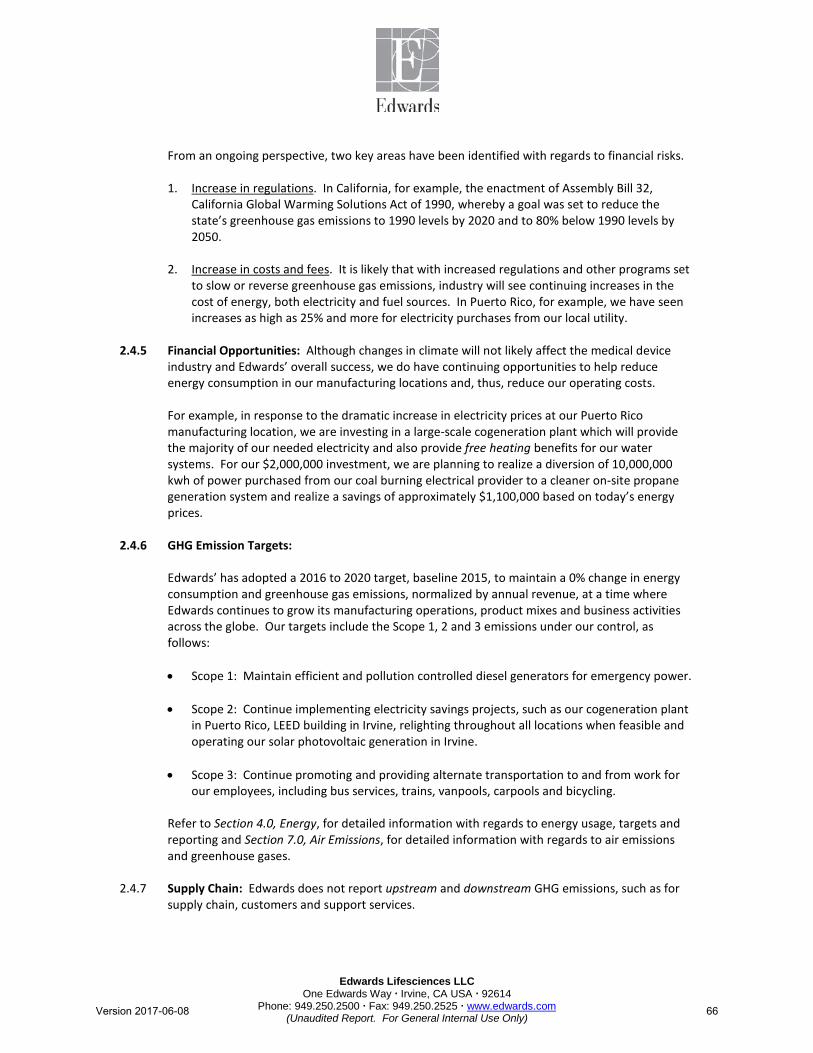
Edwards Lifesciences LLC One Edwards Way Irvine, CA USA 92614
Phone: 949.250.2500 Fax: 949.250.2525 www.edwards.com (Unaudited Report. For General Internal Use Only)
From an ongoing perspective, two key areas have been identified with regards to financial risks. 1. Increase in regulations. In California, for example, the enactment of Assembly Bill 32,
California Global Warming Solutions Act of 1990, whereby a goal was set to reduce the state’s greenhouse gas emissions to 1990 levels by 2020 and to 80% below 1990 levels by 2050.
2. Increase in costs and fees. It is likely that with increased regulations and other programs set
to slow or reverse greenhouse gas emissions, industry will see continuing increases in the cost of energy, both electricity and fuel sources. In Puerto Rico, for example, we have seen increases as high as 25% and more for electricity purchases from our local utility.
2.4.5 Financial Opportunities: Although changes in climate will not likely affect the medical device
industry and Edwards’ overall success, we do have continuing opportunities to help reduce energy consumption in our manufacturing locations and, thus, reduce our operating costs.
For example, in response to the dramatic increase in electricity prices at our Puerto Rico manufacturing location, we are investing in a large-scale cogeneration plant which will provide the majority of our needed electricity and also provide free heating benefits for our water systems. For our $2,000,000 investment, we are planning to realize a diversion of 10,000,000 kwh of power purchased from our coal burning electrical provider to a cleaner on-site propane generation system and realize a savings of approximately $1,100,000 based on today’s energy prices.
2.4.6 GHG Emission Targets:
Edwards’ has adopted a 2016 to 2020 target, baseline 2015, to maintain a 0% change in energy consumption and greenhouse gas emissions, normalized by annual revenue, at a time where Edwards continues to grow its manufacturing operations, product mixes and business activities across the globe. Our targets include the Scope 1, 2 and 3 emissions under our control, as follows: • Scope 1: Maintain efficient and pollution controlled diesel generators for emergency power.
• Scope 2: Continue implementing electricity savings projects, such as our cogeneration plant
in Puerto Rico, LEED building in Irvine, relighting throughout all locations when feasible and operating our solar photovoltaic generation in Irvine.
• Scope 3: Continue promoting and providing alternate transportation to and from work for
our employees, including bus services, trains, vanpools, carpools and bicycling.
Refer to Section 4.0, Energy, for detailed information with regards to energy usage, targets and reporting and Section 7.0, Air Emissions, for detailed information with regards to air emissions and greenhouse gases.
2.4.7 Supply Chain: Edwards does not report upstream and downstream GHG emissions, such as for
supply chain, customers and support services.
Version 2017-06-08 66

Edwards Lifesciences LLC One Edwards Way Irvine, CA USA 92614
Phone: 949.250.2500 Fax: 949.250.2525 www.edwards.com (Unaudited Report. For General Internal Use Only)
Section 8.0 EFFLUENTS AND WASTE
(GRI 306)
The most significant and material of Edwards’ environmental risks, opportunities and impacts are related to the effluents and wastes generated from our global manufacturing operations. Specifically, our overall environmental footprint is primarily impacted by varying levels of air emissions, hazardous waste, nonhazardous waste, recycling, wastewater discharge and stormwater runoff. Air emissions are discussed in Section 7.0, Air Emissions, GRI 305, of this report. The following topics are included in this Section:
Topic
Reference
• Management Approach GRI 103 • Wastewater Discharge
Dow Jones Sustainability Index – BOD GRI 306-1 DJSI 2.3.6
• Hazardous Waste Dow Jones Sustainability Index – Hazardous Waste
GRI 306-2 DJSI 2.3.7
• Nonhazardous Waste Dow Jones Sustainability Index - Waste
GRI 306-2 DJSI 2.3.5
• Recycling GRI 306-2 • Significant Spills GRI 306-3 • Transportation GRI 306-4 • Surface Water Discharges & Stormwater Runoff GRI 306-5
Management Approach Edwards’ management approach towards managing our environmental footprint, reducing risks and preventing pollution is discussed in Section 1.0, Management Approach, GRI 103. Essentially, Corporate Environmental Health and Safety (CEHS) identifies long term objectives and targets based on industry benchmarking and stakeholder requirements, while the individual Operating Units and manufacturing locations adopt short term goals which are aligned with the corporate sustainability vision. The Operating Units incorporate objectives into their annual planning, budgeting and decision making cycles. The following sections discuss each of the topics which contribute to Edwards’ environmental footprint, except for Air Emissions, which is discussed in Section 7.0, Air Emissions, GRI 305.
Version 2017-06-08 67

Edwards Lifesciences LLC One Edwards Way Irvine, CA USA 92614
Phone: 949.250.2500 Fax: 949.250.2525 www.edwards.com (Unaudited Report. For General Internal Use Only)
Wastewater Discharge (GRI 306-1)
Edwards discharges approximately 350 million liters of water to publicly owned treatment works (POTW) or government permitted wastewater treatment systems from its six global manufacturing locations (Refer to GRI 303 for volumes of water purchased by each location, which is nearly equivalent to the same amounts discharged, except for landscaping water and some evaporation from facilities related equipment). Edwards does not release industrial wastewater to surface or subsurface waters, such as through injection wells, direct discharges to lakes or streams or other dispersions. Discharges from administrative or office buildings consist only of personal hygiene and breakrooms and are not material to Edwards’ overall discharges. Landscaping and stormwater runoff is addressed under GRI 306-5, Surface Water Discharges. For industrial wastewater, all discharges are approved and permitted by local government agencies, typically through Wastewater Discharge Permits or Facility Wide Operating Permits. Regulatory and permit conditions are governed at the local level and include discharge limits and monitoring parameters for temperature, pH, BOD, COD, Organics, Inorganics, Suspended Solids, Metals and certain specific chemicals of concern. Discharge limits for these potential contaminants differ at each location based on the local treatment agency’s technologies and capabilities. In Edwards’ Singapore and Añasco locations, in-line monitoring devices record discharges, control gate valves and signal alarms in case of any excursions or discrepancies. Government agencies randomly inspect our facilities to regulate compliance. Although most wastewater is treated by the public owned treatment works and discharged to the environment, wastewater in Singapore is collected, processed and returned to consumers as NEWater. Hence, the discharge parameters for the Singapore operations are much more stringent than in other places of the world. Levels of BOD, COD, pH and other potential wastewater contaminants are not reported and tracked by Edwards’ Corporate EHS. However, wastewater discharge and permit requirements are evaluated during periodic CEHS audits and all government inspections are reported to CEHS pursuant to internal reporting policies. In 2016, there were four wastewater inspections conducted at Edwards manufacturing locations from regulatory agencies. No citations or violations were received. (Refer to Section 2.0, EHS Compliance, GRI 307).
Añasco, Puerto Rico
Wastewater Treatment System
Singapore
Wastewater Monitoring System
Version 2017-06-08 68

Edwards Lifesciences LLC One Edwards Way Irvine, CA USA 92614
Phone: 949.250.2500 Fax: 949.250.2525 www.edwards.com (Unaudited Report. For General Internal Use Only)
Hazardous Waste (GRI 306-2)
Edwards’ defines “hazardous waste” as any chemical or otherwise hazardous material which is regulated by the government for the purpose of disposal, including toxic, flammable, corrosive or reactive chemicals, biohazardous materials and special wastes, such as asbestos construction waste, batteries, fluorescent light fixtures and mercury containing switches. Edwards disposed of approximately 900,000 kilograms of hazardous waste from its six global manufacturing locations in 2016. The volumes of hazardous waste disposal from administrative and office buildings represents only a small portion of Edwards’ total waste generation and is not considered material to Edwards’ EHS program and overall environmental footprint. However, electronic wastes such as fluorescent lights and batteries are still managed according to local requirements and best management practices. In order to minimize liability risks and reduce long term impacts to the environment, Edwards requires each manufacturing plant to prioritize its disposal options along the following hierarchy, starting with most preferred:
• Beneficial Reuse, such as donation or fuels blending • Recycle • Destruction, such as incineration • Treatment, such as neutralization • Landfill, including solidification of liquids
Edwards’ Corporate EHS establishes long term objectives and targets for the reduction of hazardous waste based on industry benchmarking and stakeholder requirements, while each location implements its own Hazardous Waste Source Reduction Program. The individual programs are consistent with local regulatory requirements and industry practices and focus on source reduction and recycling as the preferred methods to reduce hazardous waste generation and disposal. Hazardous waste disposal volumes are documented on government required hazardous waste manifests, or equivalent documents, and indicate the name of the waste, volumes, disposal locations and disposal methods. Documentation is verified during Corporate EHS audits of each location. The volumes of hazardous waste disposed by each location are reported to Corporate EHS on a monthly basis and verified during Corporate EHS audits. In addition, periodic audits of each location examine hazardous waste permits, generation volumes and handling, storage and disposal practices to evaluate conformance to regulatory and company standards.
Version 2017-06-08 69

Edwards Lifesciences LLC One Edwards Way Irvine, CA USA 92614
Phone: 949.250.2500 Fax: 949.250.2525 www.edwards.com (Unaudited Report. For General Internal Use Only)
Hazardous Waste Results Hazardous Waste Disposal Normalized by Annual Revenue Metric: kgs/$1,000 sales 2016-2020 Target: 0% Change 2015-2016 Result: 4% Decrease 2010-2016 Trend: 2% Increase Edwards Results: 0.306 Benchmark Average: 0.884
Hazardous waste includes chemical, biological and special wastes according to regulatory requirements and industry standards. When normalized for company revenue growth, volumes of hazardous waste have remained constant since 2010 and decreased 4% year-over-year 2015 to 2016. Volumes of waste generated remain less than 50% of volumes generated by benchmarked medical device industry companies.
Although absolute volumes of hazardous waste increased 108% from 2010 to 2016, volumes normalized by annual revenue increased only 2%. The increase in hazardous waste volume is primarily attributed to the success of Edwards Heart Valve Therapy technologies and growth in Singapore and Utah manufacturing operations. Hazardous Waste disposal costs increased only 31% at the same time the volume of waste increased 108%. Effectively, waste disposal costs decreased from $1.64 to $1.03 per kilogram due to improvements in chemical handling, upgrades of on-site equipment and process changes with waste contractors. Another large component driving cost reduction is Edwards’ ability to dispose of bulk production wastes to be used for beneficial reuse in fuels blending.
Version 2017-06-08 70

Edwards Lifesciences LLC One Edwards Way Irvine, CA USA 92614
Phone: 949.250.2500 Fax: 949.250.2525 www.edwards.com (Unaudited Report. For General Internal Use Only)
Approximately 33% of hazardous waste is recycled, primarily through the energy recovery of high btu rated wastes, including manufacturing solvents. Another 64% is completely incinerated in order to reduce future liabilities and risks to the community. The remaining 3% is managed pursuant to risks, best practices and local regulatory requirements.
Methods of Hazardous Waste Disposal by Percentage
Waste Disposal Methods by Weight (kgs)
Bio/Medical Incineration Landfill Recycle/Fuel Other Anasco 4,029 6,939 3,134 3,805 4,701 Draper 24,076 10,318 Haina 16,775 Horw 141,200 Irvine 3,737 35,501 147,610
Singapore
10,080 493,935
Total 17,847 577,226 3,134 302,934 4,701
Methods of Disposal by Weight (kgs) for Calendar Year 2016
Dow Jones Sustainability Index Hazardous Waste
(DJSI 2.3.7)
Version 2017-06-08 71

Edwards Lifesciences LLC One Edwards Way Irvine, CA USA 92614
Phone: 949.250.2500 Fax: 949.250.2525 www.edwards.com (Unaudited Report. For General Internal Use Only)
Hazardous Waste Disposal by Location Edwards’ Haina facility successfully reduced hazardous waste disposal volume 47% from 2010 through 2016, thus, eliminating 14 metric tons of waste through source reduction practices. Approximately 75% of Edwards’ global hazardous waste generation is associated with a single waste stream generated in manufacturing operations in Irvine, Singapore and Horw. Due to the different regulatory requirements in each country, the method and costs for disposal differ greatly. However, over 30% of the wastes are reused as fuel at cement kilns and energy plants or for use in water treatment plants. The Horw facility receives a rebate each year for Volatile Organic Compound (VOC) reductions and energy generation from the beneficial waste-to-energy method of disposing its combustible hazardous waste.
HazWaste Disposal – Volume
Hazardous waste volumes in Singapore have increased consistently with growth in manufacturing capacity. Local regulations and infrastructure do not allow Singapore to recycle its combustible wastes, which amounts to approximately 50% of Edwards’ total hazardous waste.
HazWaste Disposal - Cost
Version 2017-06-08 72

Edwards Lifesciences LLC One Edwards Way Irvine, CA USA 92614
Phone: 949.250.2500 Fax: 949.250.2525 www.edwards.com (Unaudited Report. For General Internal Use Only)
Solid / Nonhazardous Waste (GRI 306)
Edwards’ defines “solid / nonhazardous waste” as any waste which is not managed as a “hazardous waste.” It primarily includes all wastes which are allowed to be disposed in local landfills, but also may include wastes which are otherwise required to be recycled by local governments. Edwards disposed of approximately 1,500,000 kilograms of nonhazardous waste from its six global manufacturing locations. The volumes of nonhazardous waste disposal from administrative and office buildings represents only a small portion of Edwards’ total waste and is not considered material to our environmental footprint. With regard to the method of disposal, locations are expected to prioritize disposal options along the following hierarchy, starting with the most preferred option:
• Reuse or Donation • Recycle • Energy Recovery, such as waste-to-energy burning • Landfill
Edwards’ Corporate EHS establishes long term objectives and targets for the reduction of nonhazardous waste based on industry benchmarking and stakeholder requirements, while each location customizes its own reduction and recycling programs. Most individual programs rely on the local infrastructure and technologies to recycle certain commodities. For most locations, volumes and weights of nonhazardous waste disposal are documented on shipping papers or invoice documents provided by our waste collector. For smaller containers, such as typical four-yard open top bins, volumes are estimated assuming one cubic meter of waste weighs about 500 kilograms. The volumes of nonhazardous waste disposed by each location are reported to Corporate EHS on a monthly basis and verified through supplier invoices, tracking and other documentation. In addition, Corporate EHS audits of each location to review nonhazardous generation, handling, storage and disposal practices in order to evaluate conformance to regulatory and company standards.
Version 2017-06-08 73

Edwards Lifesciences LLC One Edwards Way Irvine, CA USA 92614
Phone: 949.250.2500 Fax: 949.250.2525 www.edwards.com (Unaudited Report. For General Internal Use Only)
Solid / Nonhazardous Waste Results
Solid Waste Disposal Normalized by Annual Revenue Metric: kgs/$1,000 sales 2016-2020 Target: 0% Change 2015-2016 Result: 0% Change 2010-2016 Trend: 33% Decrease Edwards Results: 0.506 Benchmark Average: 1.047
Nonhazardous waste includes production, warehouse, office and cafeteria related wastes generated in Edwards’ manufacturing locations. Recyclables, such as cardboard, paper, pallets, and plastic are reported separately in the next section of this report, Recycling (GRI 306). When normalized for company revenue growth, volumes of nonhazardous waste have decreased 33% from 2010 to 2016 and remained constant year-over-year 2015 to 2016. Volumes of waste generated remain about 50% of volumes of benchmarked medical device industry companies.
Solid waste includes nonhazardous wastes which are disposed by landfill or incineration, but do not have any recycling or reuse benefit Although Edwards’ business grew over 105% from 2010 to 2016, absolute volumes of solid waste increased only 36% from 1,100,000 to 1,500,000 kilograms. From 2010 to 2016, total solid waste disposal costs increased only 50%. In 2015, Edwards began recycling product and packaging wastes for waste-to-energy fuels burning instead of direct incineration with no environmental benefit. Previously, these items were discarded to landfill or incineration without energy recovery.
Version 2017-06-08 74

Edwards Lifesciences LLC One Edwards Way Irvine, CA USA 92614
Phone: 949.250.2500 Fax: 949.250.2525 www.edwards.com (Unaudited Report. For General Internal Use Only)
Dow Jones Sustainability Index Nonhazardous Waste
(DJSI 2.3.5)
Nonhazardous Waste by Location
Edwards’ Critical Care manufacturing locations in Añasco, Puerto Rico, and Haina, Dominican Republic, successfully reduced their nonhazardous was disposal by 47% and 68%, respectively, from 2010 to 2016. This has resulted in over 1,200 metric tons of waste being eliminated from local landfills. Solid waste generated at our Horw, Switzerland, location is almost 100% incinerated by the local municipality as waste-to-energy fuel, thus keeping waste out of landfills while providing a community benefit. However, in Edwards’ year-to-year environmental accounting, cost for this effort is now included in Nonhazardous Waste reporting for 2015 and 2016. As Horw represents less than 5% of Edwards’ total waste stream, the change in tracking and accounting is incidental.
Nonhazardous Waste Disposal - Volume
Nonhazardous Waste Disposal - Cost
Version 2017-06-08 75

Edwards Lifesciences LLC One Edwards Way Irvine, CA USA 92614
Phone: 949.250.2500 Fax: 949.250.2525 www.edwards.com (Unaudited Report. For General Internal Use Only)
Recycling (GRI 306)
Edwards’ defines “recycling” as any successful effort to divert hazardous or nonhazardous waste from landfills or to provide some type of beneficial reuse. Recycled waste typically includes the following:
Nonhazardous Waste Hazardous Waste
Paper Plastics
Cardboard Wooden Pallets
Metals and Scrap Consumer Cans and Bottles Cafeteria and Food Wastes
Electronics Styrofoam
Landscape Waste Construction Debris
Used Furniture and Equipment
Solvents for Fuels Blending Biocides for Water Treatment
Medical Plastics to Form Waste-to-Energy Pellets Fluorescent Lamps
Batteries
In 2016, we recycled approximately 925,000 kilograms of nonhazardous and 300,000 kilograms of hazardous wastes from Edwards’ six global manufacturing locations. Although recycling is also practiced at Edwards’ administrative and regional offices, the amounts are not considered material to the total volumes of waste recycled globally. Edwards’ promotes the following hierarchy of recycling, starting with the most preferred:
• Reuse or Donation • Recycle • Waste-to-Energy Recovery, such as fuels burning • Landfill
Edwards’ Corporate EHS establishes long term objectives and targets for recycling based on industry benchmarks and stakeholder requirements, while each location implements its own reduction and recycling programs. Most individual programs rely on the local infrastructure and capabilities to recycle certain commodities. The volumes of waste recycled by each location are reported to Corporate EHS on a monthly basis and verified through supplier invoices, tracking and other documentation. When recycled materials are not physically weighed, volumes are estimated by Edwards’ recycling contractors. In addition, Corporate EHS audits of each location examine handling, storage and recycling practices to evaluate for conformance company standards.
Version 2017-06-08 76

Edwards Lifesciences LLC One Edwards Way Irvine, CA USA 92614
Phone: 949.250.2500 Fax: 949.250.2525 www.edwards.com (Unaudited Report. For General Internal Use Only)
Recycling Results
Recycling Rate Based on Gross Weight, Not Normalized Target: Strive to Achieve 60% Diversion Rate 2016 Total Recycling / Total Waste = 38% (Does not include diversion of construction wastes)
Edwards consistently recycles, reuses or incinerates (waste-to-energy) about 40% of its solid wastes from manufacturing locations. We have established a target to recycle or divert at least 60% of our waste from landfills by the year 2020.
Construction Wastes
For the past several years, the Irvine campus has undergone numerous changes with the demolition of older buildings and construction of newer buildings and community spaces. During the construction of Edwards’ newest research building, over 1,200 metric tons of demolition materials were recycled to achieve a 99.64% landfill diversion rate. Edwards does not include one-time special project construction waste in its annual reporting for the purpose of tracking against baselines and reduction targets.
Recycling Totals by Commodities
Version 2017-06-08 77

Edwards Lifesciences LLC One Edwards Way Irvine, CA USA 92614
Phone: 949.250.2500 Fax: 949.250.2525 www.edwards.com (Unaudited Report. For General Internal Use Only)
Nonhazardous Waste Recycling Totals Edwards recycled 1,300 metric tons of nonhazardous waste in 2016 from its six global manufacturing locations. Corrugated packaging encompassed 42% and plastic, wooden pallets and paper made up an additional 32%. Landscaping, metals and electronics included 26%.
Note: Does not include 300 metric tons of recycled waste-to-energy hazardous waste
Significant Spills or Releases
(GRI 306-3) Each of Edwards’ manufacturing facilities has written emergency response procedures which address such risks as fires, chemical spills, airborne releases, stormwater discharges, security considerations, hurricanes and other related hazardous materials and environmental risks. Typically, local regulations also require specific emergency response and preparedness plans for businesses. Emergency response plans and preparedness activities are evaluated during Corporate EHS audits. There were no significant spills or releases at any Edwards’ locations worldwide in 2016.
Transport of Hazardous Materials (GRI 306-4)
Edwards does not directly transport hazardous materials off of its owned and operated properties. Instead, Edwards contracts with different suppliers as appropriate for the hazardous material being shipped, such as either hazardous waste contractors or third party logistic companies. These contractors ensure that all hazardous materials shipments are safely prepared and appropriate documentation is provided for each transport for both national and international shipments. There were no reported transport of hazardous materials incidents or concerns reported in 2016.
Version 2017-06-08 78

Edwards Lifesciences LLC One Edwards Way Irvine, CA USA 92614
Phone: 949.250.2500 Fax: 949.250.2525 www.edwards.com (Unaudited Report. For General Internal Use Only)
Surface Water Discharges & Stormwater Runoff (GRI 306-5)
One of the largest environmental risks at Edwards’ manufacturing locations is the potential for hazardous contaminants being released off our property and into the local habitats and waterways. Although Edwards does not significantly affect any bodies of water or related habitats under the course of normal business activities, there are two scenarios which have been identified which could lead to an accidental release. Both are sufficiently managed with engineering and administrative controls to prevent unwanted occurrences.
First is the risk of hazardous materials being spilled and released into storm drains or other water systems. To prevent such releases, Edwards’ Corporate EHS requires that all hazardous materials or potential contaminants stored outside are maintained in protected secondary containment systems large enough to contain the largest potential spills. The primary risks are associated with diesel fuel which could potentially leak from fuel tanks and emergency generators. Fuel tanks are maintained in secondary containment vaults and emergency generators typically have catch basins built into the units. In addition, locations in the United States prepare Spill Prevention, Control and Countermeasure Plans (SPCC) and non-United States locations prepare similar emergency preparedness and prevention plans.
Second is the risk of contaminants or debris being washed into the stormwater channels and drains during a rain event. To limit concerns, Edwards requires that all potentially contaminated, oil containing or other industrial-type equipment which could be a stormwater pollutant be maintained indoors or under eaves and coverings to prevent stormwater contact. Edwards’ United States locations file EPA No Exposure Certifications for stormwater pollution and all Edwards’ locations globally practice Stormwater Best Management Practices to control contaminated runoff. As necessary, manufacturing locations also prepare Stormwater Pollution Prevention Plans (SWPPP) or similar procedures to prevent releases or respond effectively if one should occur. In Añasco, Puerto Rico, technicians periodically sample stormwater through National Pollution Discharge Emission Systems (NPDES) requirements.
At Edwards’ Irvine facility, stormwater management is regarded a very high concern with regulatory authorities and the local community. As such, we have taken special precautions to ensure that stormwater runoff from this facility is managed to the highest extent feasible. Two examples of stormwater controls implemented at our Irvine campus include:
Natural Bioswales for Filtration
Filter Systems inside Storm Drains
Version 2017-06-08 79

Edwards Lifesciences LLC One Edwards Way Irvine, CA USA 92614
Phone: 949.250.2500 Fax: 949.250.2525 www.edwards.com (Unaudited Report. For General Internal Use Only)
Section 9.0 SUPPLIER ENVIRONMENTAL PROGRAMS
(GRI 308) Edwards’ Direct Supplier sustainability initiatives and programs can be found on Edwards’ Sustainability website at http://www.edwards.com/sustainability/products/supply-chain-management/. Although Edwards’ Indirect Supplier sustainability programs are still in their infancy, there are currently plans to implement a more comprehensive supplier due diligence screening process in the near future. However, even without a more formal program, we already embrace environmental initiatives with several of our major global suppliers in order to track, report and reduce pollution in the supply chain. The scope of this report addresses environmental considerations in Edwards’ Indirect Supply Chain, meaning those materials and services purchased which are typically auxiliary to our manufacturing operations. The following are some examples of our supplier environmental partnerships.
GreenScaping our Common Areas Edwards has partnered with our landscaping design and maintenance provider to provide both a very aesthetic landscape and environmentally responsible campus. Not only do the common areas at our Irvine headquarters have stormwater harvesting and treatment systems (refer to GRI 306), drought tolerant plant selection and one of North America’s largest Living Walls, but our landscape partner removes all of our greenwaste from grass cuttings and plant trimmings to a local composting facility. Once materials are composted, they are mixed accordingly and returned back to Edwards to be reused with further maintenance and beautification of the campus. In 2016, approximately 2,100 metric tons of landscaping waste was collected at Edwards’ Irvine and composted for reuse.
Edwards’ Headquarters’ Central Park and Living Wall, Irvine, California
Version 2017-06-08 80

Edwards Lifesciences LLC One Edwards Way Irvine, CA USA 92614
Phone: 949.250.2500 Fax: 949.250.2525 www.edwards.com (Unaudited Report. For General Internal Use Only)
Environmentally Friendly Office Supply Purchasing For several years, Edwards has partnered with our office materials supplier to provide more environmentally friendly office equipment and supplies to all of Edwards’ operations and sales force employees throughout the United States. Selected products included some of the following examples and levels of Eco-Features found in preferred product selections:
Paper Products Environmentally preferred paper, legal pads, notebooks, filing, envelopes, boxes, paper towels, tissue and many more products
Any Eco-Features Preference for recycled or remanufactured content, numerous environmental certifications or standards and other environmental design criteria, such as refillable, bio-based content and metals-free materials
Basic Eco-Features Preference for products which contain less than 30% post-consumer content, meet less comprehensive certifications or features, such as SFI, AP nontoxic, Indoor Advantage certified or Greenguard certified, or have other design features, such as refillable pens and solar powered calculators
Advanced Eco-Features Preference for recycled, remanufactured, contain greater than 30% bio-based plastics, certified in one or more of the following leading standards: Forest Stewardship Council®, Green Seal™, EPA Design for the Environment, ENERGY STAR®, EPEAT, BPI compostable, USDA Organic, Rainforest Alliance Certified™, Fair Trade Certified™, level®, or Cradle to Cradle™
Environmental Office Supply Purchasing Results for 2016
• 30% of Edwards top ten product categories by dollar-spend were categorized as either Basic or Advanced Eco-Feature design, including janitorial paper, printer cartridges, computer accessories, telephones and desktop computers.
• 48% of all paper products purchased, such as paper and envelopes, were Eco-Feature friendly. Average post-consumer percentage by weight of all paper was 17%.
• 25% of office related products, such as staplers and pens, were Eco-Feature friendly
Corporate Cafeteria – Sourcing Locally and Responsibly In 2015 Edwards opened its new corporate cafeteria to serve breakfast, lunch and, recently, dinner to 3,500 employees working at the Irvine, California, campus. Along with our food services partner, we have implemented recognized environmental practices such as limiting disposables, recycling cardboard and metals from packaging and promoting consumer recycling solutions. Our cafeteria services has also installed a state of the art food-waste dehydrator which reduces actual waste volumes and allows for more effective and efficient composting. As committed by our food services partner: Food service for a sustainable future means flavorful food that’s healthy and economically viable for all, produced through practices that respect farmers, workers, and animals; nourish the community; and replenish our shared natural resources for future generations. Our food services partner is also committed to fighting food waste according to the EPA Food Recovery Hierarchy through Low Carbon Lifestyle waste initiatives. Chefs are active in preventing waste at the source, donating leftovers to local hunger relief organizations and diverting waste from landfills.
Version 2017-06-08 81

Edwards Lifesciences LLC One Edwards Way Irvine, CA USA 92614
Phone: 949.250.2500 Fax: 949.250.2525 www.edwards.com (Unaudited Report. For General Internal Use Only)
Our cafeteria food services partner has implemented or committed to the following sustainability programs:
• Farm to Fork – supporting local agriculture since 1999. Chefs are required to buy at least 20% of their ingredients locally, thereby promoting local economies, providing fresh ingredients and reducing pollution generated in the supply chain.
• Fish to Fork - Defining “local and sustainable” for seafood sourcing. • Reducing Food Waste - Decreasing what is sent to landfill decreases the release of greenhouse
gas emissions from transportation fuels. These efforts result in a weekly reduction of 40 to 50 metric tons of carbon dioxide equivalent GHGs. Currently, the teams at the cafés divert more than 40 percent (by weight) of what remains of their food waste from landfills.
• Low Carbon (GHG) Diet - Tackling climate change through food choices. In 2012, Edwards’ food services partner reached its company’s five-year commitment to reduce the company’s carbon footprint in the highest impact areas by 25%. The efforts have reduced GHG emissions approximately 5 million pounds GHG emissions each month.
• Responsible Disposables - Applying innovation to reduce, reuse and recycle. • Crate-Free Pork, Cage-Free Eggs, Humane Ground Beef, FAD-Free Tuna - A commitment to
humane animal treatment. • Fighting Antibiotics Abuse - Sourcing animals raised without antibiotics. • rBGH Free - Milk and yogurt come from cows not treated with artificial bovine growth hormones. • Imperfectly Delicious Produce - A cutting-edge program to rescue flavorful but cosmetically
imperfect produce from going to waste on farms and during distribution.
Climate Change and Business Commuting Edwards partners with its global travel management company to track and report greenhouse gas emissions globally from employee business commuting, including both air and rail transactions worldwide. Carbon dioxide equivalents, CO2e, are reported to Edwards on a monthly basis for its four global regions, APAC, EMEA, NORAM and LATAM, and represent almost all of the global business travel of Edwards’ employees. This information allows Edwards to track its GHG emissions and to provide more accurate and complete annual reporting through the CDP Climate Change reporting forum (Refer to Section 7.0, GRI 305-3, Emissions).
Version 2017-06-08 82

Edwards Lifesciences LLC One Edwards Way Irvine, CA USA 92614
Phone: 949.250.2500 Fax: 949.250.2525 www.edwards.com (Unaudited Report. For General Internal Use Only)
One-Stop Shop Paper Shredding and Recycling Launched at Edwards’ Irvine headquarters in 2016 and being expanded globally, Edwards has partnered with its document management and shredding services supplier to provide a single source, one-stop shop to paper shredding and recycling. In essence, instead of segregating paper for recycling, employees are encouraged to dispose all paper into confidential bins, which is then shredded for security purposes and recycled as waste paper. In 2016, through this program, Edwards recycled approximately 60 metric tons of mixed paper, envelopes, office packaging and related paper materials, reducing our carbon footprint and saving landfill space, trees, water and energy.
2016 Year End Savings at Edwards Irvine from Recycling of Shredded Paper
Version 2017-06-08 83

Edwards Lifesciences LLC One Edwards Way Irvine, CA USA 92614
Phone: 949.250.2500 Fax: 949.250.2525 www.edwards.com (Unaudited Report. For General Internal Use Only)
Section 10.0 EUROPE ENVIRONMENTAL PROGRAM
In response to customer and stakeholder requests, our Edwards European region headquartered in Nyon, Switzerland, began implementing their dedicated Environmental Management System with the objective to become accredited in ISO 14001:2015 by the end of 2017. The scope of the Europe ISO 14001 program includes only selected nonmanufacturing locations of the region.
Edwards Europe Environmental Policy
Version 2017-06-08 84

Edwards Lifesciences LLC One Edwards Way Irvine, CA USA 92614
Phone: 949.250.2500 Fax: 949.250.2525 www.edwards.com (Unaudited Report. For General Internal Use Only)
Scope Although additional locations will be added as our program matures, only the following locations are within the scope of our current Europe EMS plan for 2017.
Scope of Edwards Europe EMS, 2017 Planning Year
Materiality
Through internal discussions and external benchmarking, the Europe EMS team leaders determined the following environmental aspects to be the most material and significant to their combined impact to the environment.
Material Environmental Aspects Electricity Usage Waste Disposal Business Commuting Water Consumption Paper Usage Personal Commuting to/from work Toner/Cartidge Usage IT Hardware/Electronics Waste
As our Europe environmental program is still in its infancy, baseline amounts and volumes of material aspects were determined in 2016, using 2015 as our baseline year. Processes to improve reporting are being implemented for 2017, along with steps to help reduce our environmental footprint in Europe.
Version 2017-06-08 85

Edwards Lifesciences LLC One Edwards Way Irvine, CA USA 92614
Phone: 949.250.2500 Fax: 949.250.2525 www.edwards.com (Unaudited Report. For General Internal Use Only)
Baseline Environmental Aspects, 2015
The above environmental impacts are already incorporated into other sections of our Edwards’ 2017 Environmental, Health & Safety Annual Performance Report but are broken out for Europe to show our commitment to reducing the environmental impacts determined to be material to our European activities and stakeholders. Based on our 2015 Baseline for the above material aspects, we will continue to improve our reporting programs and focus on reducing pollution in the areas where we can be most effective.
Version 2017-06-08 86

Edwards Lifesciences LLC One Edwards Way Irvine, CA USA 92614
Phone: 949.250.2500 Fax: 949.250.2525 www.edwards.com (Unaudited Report. For General Internal Use Only)
Appendix
ISO 14001 and OHSAS 18001 Certifications
ISO 14001 OHSAS 18001
Anasco, Puerto Rico Anasco, Puerto Rico Haina, Dominican Republic Haina, Dominican Republic
Draper, Utah Singapore
Version 2017-06-08 87
Edwards Lifesciences LLC One Edwards Way Irvine, CA USA 92614
Phone: 949.250.2500 Fax: 949.250.2525 www.edwards.com (Unaudited Report. For General Internal Use Only)
Version 2017-06-08 88

Edwards Lifesciences LLC One Edwards Way Irvine, CA USA 92614
Phone: 949.250.2500 Fax: 949.250.2525 www.edwards.com (Unaudited Report. For General Internal Use Only)
Version 2017-06-08 89

Edwards Lifesciences LLC One Edwards Way Irvine, CA USA 92614
Phone: 949.250.2500 Fax: 949.250.2525 www.edwards.com (Unaudited Report. For General Internal Use Only)
Version 2017-06-08 90

Edwards Lifesciences LLC One Edwards Way Irvine, CA USA 92614
Phone: 949.250.2500 Fax: 949.250.2525 www.edwards.com (Unaudited Report. For General Internal Use Only)
Version 2017-06-08 91
Edwards Lifesciences LLC One Edwards Way Irvine, CA USA 92614
Phone: 949.250.2500 Fax: 949.250.2525 www.edwards.com (Unaudited Report. For General Internal Use Only)
Version 2017-06-08 92
Edwards Lifesciences LLC One Edwards Way Irvine, CA USA 92614
Phone: 949.250.2500 Fax: 949.250.2525 www.edwards.com (Unaudited Report. For General Internal Use Only)
Version 2017-06-08 93